Article

A Mesoscopic Study on the Constraint Mechanism of Existing Pavement Rutting on the Mechanical Behavior of Sealcoat Based on Highways in China

1
Chongqing Yuqian Expressway Co., Ltd., Chongqing 401136, China
2
State Key Laboratory of Safety and Resilience of Civil Engineering in Mountain Area, School of Civil Engineering, Chongqing University, Chongqing 400045, China
3
China Merchants Chongqing Communications Technology Research & Design Institute Co., Ltd., Chongqing 400067, China
*
Author to whom correspondence should be addressed.
Appl. Sci. 2026, 16(9), 4126; https://doi.org/10.3390/app16094126
Submission received: 21 March 2026 / Revised: 20 April 2026 / Accepted: 21 April 2026 / Published: 23 April 2026
(This article belongs to the Special Issue New Trends in Road Materials and Pavement Design)

Abstract

Conventional maintenance models often neglect the impact of pre-existing rutting on sealcoat performance, particularly in high-temperature regions like Chongqing in China, where rut-related failures are common. Existing ruts impose geometric constraints that significantly alter stress redistribution within the new sealcoat layer, yet this constraint mechanism remains poorly understood due to limitations in laboratory observation. This study developed a mesoscopic AC16 + MS3 composite discrete element model to simulate the mechanical behavior of a sealcoat applied over a rutted pavement. To replicate real-world conditions, a constant pressure of 0.7 MPa, representing the standard tire ground pressure in JTG E20-2011, was applied at a temperature of 70 °C, reflecting extreme high-temperature stability limits. Virtual rutting tests and contact force chain analyses were conducted across varying existing pavement rut depths, including 0 mm, 3 mm, 6 mm, and 10 mm. The results indicate that existing ruts redirect stress transfer paths, causing vertical compressive force chains to densify within the rutted zone and tensile stress to concentrate at rut edges. Mastic-mastic contacts transmit over 65% of the load, identifying asphalt mortar as the primary load-transfer phase. Notably, a 10 mm existing rut depth induces a tensile vacuum zone at depths of 15–40 mm, disrupting the standard U-shaped stress distribution. These findings clarify how pre-existing geometries govern structural degradation, suggesting that maintenance in high-temperature regions must prioritize asphalt mortar performance to mitigate edge cracking and deformation.

1. Introduction

Highway maintenance and repair (M&R) decision models often incorporate mean rut depth (RD) within multi-objective frameworks [1,2,3]. However, these models frequently overlook the mechanistic impact of pre-existing rutting on sealcoat failure, particularly in high-temperature regions where rutting-induced damage is common, like in Chongqing, China. Although safety thresholds for rut-induced risks such as hydroplaning are well-established [4,5,6,7,8], the geometric constraints imposed by existing rutting significantly influence stress re-distribution within sealcoats. A primary limitation is that conventional discrete element modeling often assumes an idealized flat substrate, overlooking the rutted base-overlay composite structure. Such simplification neglects the lateral geometric constraints provided by ruts, thereby hindering a precise understanding of how existing surface morphology dictates the internal stress evolution and subsequent damage of sealcoats.
Traditional investigation of rutting primarily relies on laboratory testing, such as the wheel tracking test, which has been instrumental in evaluating the high-temperature anti-rutting performance of various modified asphalt binders and innovative mixture designs [9,10,11,12,13,14]. These empirical studies provide valuable data for material selection and mix proportion optimization. However, the experimental approach struggles to non-destructively capture the meso-scale mechanical mechanisms within the mixture, such as the evolution of force chains, distribution of contact forces, and particle migration. Lab-scale rutting tests often exhibit significant discrepancies from real conditions, primarily due to scaling effects and limitations in accurately replicating the full scope of rutting phenomena [15]. Laboratory tests for composite surface treatment structures are commonly employed to investigate damage to the structural layers or the degradation of interlayer bonding properties [16,17]. Furthermore, laboratory testing is often costly, time-consuming, and unable to accurately replicate and control the stress state of a composite structure where the “base course contains a predefined rut geometry”.
The Discrete Element Method (DEM) simulates the macroscopic mechanical response of materials by modeling the motion and interactive contacts of individual particles. While the Finite Element Method (FEM) is a powerful tool for continuum mechanics, DEM provides distinct advantages for the study of asphalt mixtures, which consist of aggregate, asphalt mortar, and air voids [17,18,19,20,21,22,23,24,25,26]. Specifically, DEM captures the discontinuous deformation and skeleton reorganization that are difficult to represent in FEM due to potential numerical instability during large aggregate movements.
Numerous scholars have achieved significant results using DEM to elucidate the mesoscopic mechanisms of rutting. Wu [20] systematically analyzed the evolution of coordination number, the proportion of strong force chains, and force chain intensity under cyclic loading for mixtures with nine distinct aggregate gradations, revealing anisotropic characteristics in contact force distribution. Xia [27] simulated the rutting development of recycled asphalt mixtures containing both virgin and aged SBS modifiers, demonstrating that stress diffusion paths are governed by aggregate arrangement. Ji et al. [22] identified the displacement of fine aggregates (0.6–2.36 mm) as a primary driver of rutting and proposed using direct coal liquefaction residue to replace fine aggregates, thereby enhancing mortar adhesion, optimizing force chain distribution, and reducing stress concentration. Liu et al. [23,24] successfully simulated the rutting deformation of porous asphalt mixtures using a three-dimensional DEM model coupled with a cyclic rolling loading algorithm. These studies collectively demonstrate that macroscopic rutting originates from the combined effect of aggregate skeleton contact failure and the viscous-plastic flow of asphalt mortar, with stress redistribution and the attenuation of contact number being core meso-indices of rutting development. The heterogeneous structure of porous aggregate (PA) mixture causes significant stress or strain concentrations in the mixture, especially between two aggregate particles, which makes it difficult to precisely predict the mechanical response of PA pavements [26]. Dhundup et al. [28] found that both two-dimensional and three-dimensional discrete element simulations can effectively replicate the volume fraction characteristics and mechanical behavior properties of asphalt mixtures. While the 3D model offers higher accuracy, it requires significantly greater computational time, memory consumption, and data complexity.
A sealcoat or ultra-thin overlay forms a composite structural system with the underlying pavement, whose performance is not solely a function of the overlay material but is determined by interlayer synergy. Recent research has begun to focus on the mesoscale mechanical behavior of such composite systems. Du et al. [29] utilized DEM to investigate the microscopic damage mechanism of ultra-thin overlays, finding that reducing the overlay thickness significantly increased the maximum and mean values of contact forces between aggregates, making them more prone to tensile or shear damage. The study also concluded that a thin layer (e.g., 1 cm) has a higher probability of experiencing large contact forces and possesses a weaker load dispersion capacity. This study addresses a critical knowledge gap in the micromechanical behavior of preventive maintenance treatments by specifically investigating the interlayer synergy between the sealcoat and a pre-damaged substrate. Unlike previous research that focuses solely on the maintenance material itself, this work elucidates how the complex boundary conditions of existing distresses govern the internal stress evolution of the composite system. Xie et al. [26] confirmed that quadrilateral grooves (≥6 cm deep, 60 cm wide, with a height-to-width ratio < 15) are the optimal geometry for treating severe transverse cracks through DEM numerical tests and orthogonal optimization. However, these models involve a significant simplification by assuming an idealized flat and homogeneous underlying pavement. Such assumptions fail to account for the geometric constraints and the internal structural heterogeneity induced by long-term traffic loading. In reality, the pre-existing rutting creates a non-planar profile that fundamentally redirects load transfer paths and alters the displacement field within the overlay. Furthermore, the underlying pavement exhibits significant heterogeneity in void distribution and aggregate skeleton structure across both lateral and vertical dimensions. By utilizing CT-based reconstruction, this study explicitly incorporates these mesoscopic spatial gradients into the DEM framework, providing a representation of the composite structure that is more consistent with actual engineering conditions than conventional homogeneous models.

2. Materials and Methods

2.1. Raw Materials and Gradiation Design

Styrene–butadiene–styrene (SBS) modified asphalt was selected for the preparation of AC16 hot-mix asphalt mixtures, serving as the primary structural layer. Conversely, the modified emulsified asphalt was specifically utilized for the MS3. The physical properties of the modified emulsified asphalt were evaluated according to the standard test methods [30], and the technical indices for both binders are summarized in Table 1 and Table 2, respectively. While both tables list similar physical properties, the testing protocols and material states differ significantly. Table 1 presents the performance of SBS modified asphalt used for the hot-mix AC16 mixture, where tests were conducted on the binder at high temperatures. In contrast, Table 2 details the properties of SBS modified emulsified asphalt used for the MS3 mixture, which is applicable at ambient temperatures. For the emulsified asphalt, specific metrics such as Engler viscosity and storage stability are included to ensure handling performance, and core indicators (penetration and softening point) were measured specifically on the evaporation residues to simulate binder state after moisture loss on the pavement. All test results comply with the relevant technical specifications. The mineral components consisted of coarse aggregate, fine aggregate, and mineral filler. Basalt was selected as the coarse aggregate, while limestone was used for both the fine aggregate and the mineral filler.
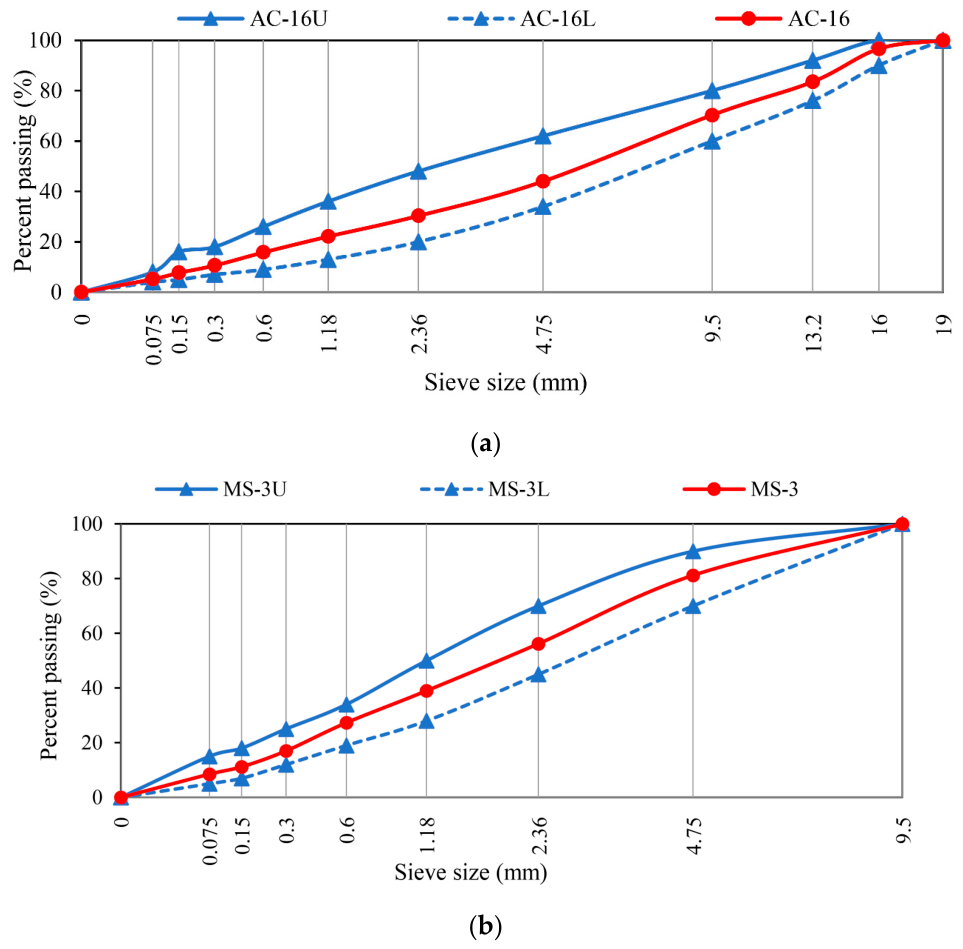
The DEM model of the “AC16 + MS3” composite was constructed to investigate the effect of different existing pavement RDs on the mechanical responses. The optimum asphalt aggregate ratios of AC16 and MS3 were determined to be 4.6% and 8.0%, respectively. The grading curves of different asphalt mixtures are shown in Figure 1, where U represents the upper limit and L represents the lower limit.

2.2. Discrete Element Modeling

A two-dimensional (2D) model was selected because the impact of pre-existing rutting is primarily manifested as lateral geometric irregularity. The non-uniform mechanical response across the cross-section is more critical to analyze than that along the longitudinal driving direction. Furthermore, the 2D approach enables a higher particle resolution within the thin sealcoat layer, allowing for a more precise characterization of the contact force evolution and lateral displacement fields.

2.2.1. Two-Dimensional Irregular Aggregate Generation

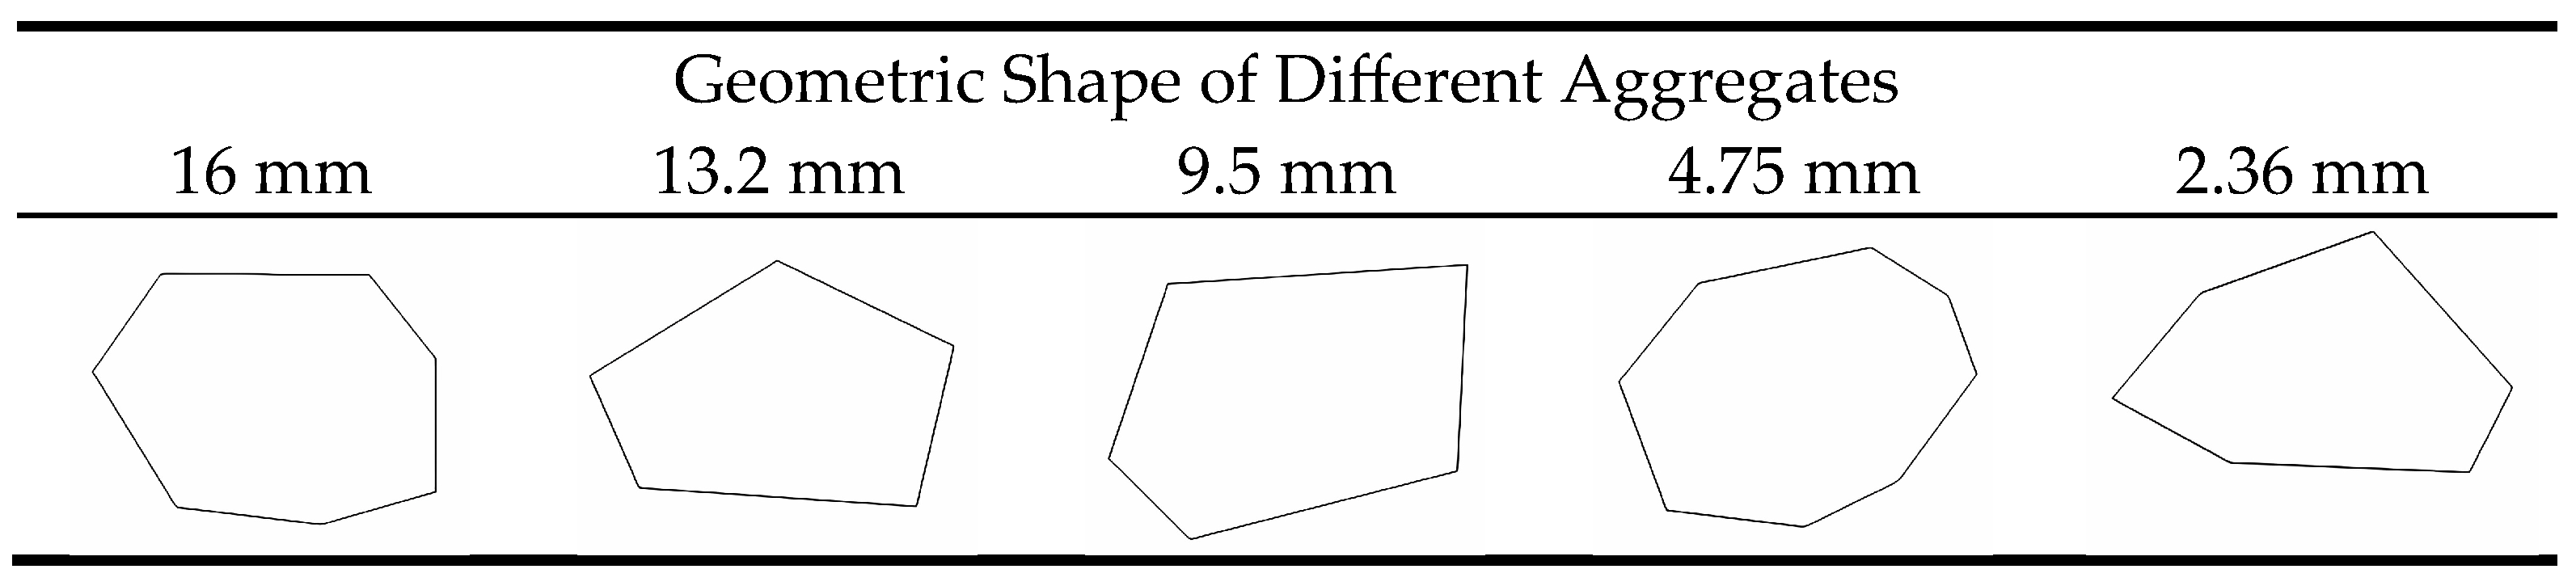
Based on the data obtained from CT scanning, five representative stones with different shapes were selected from each grade to construct the virtual aggregates, as shown in Figure 2. To ensure statistical representativeness, these templates were randomly rotated and scaled during the assembly process in PFC. This stochastic approach allows the limited set of templates to generate a heterogeneous and realistic mesostructure that replicates the random interlocking and spatial distribution of aggregates in real asphalt mixtures. Furthermore, aggregates smaller than 2.36 mm were replaced by 2.0 mm spherical particles to improve computing efficiency, with the Bubble Pack algorithm utilized to transform geometric shapes into dynamic virtual aggregate clumps.
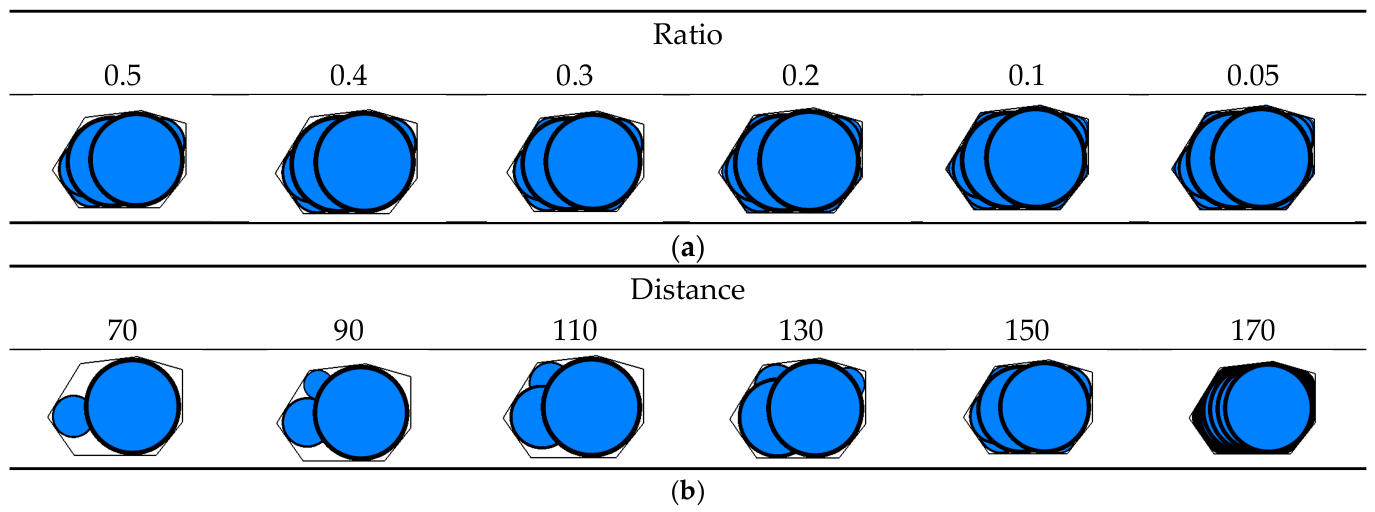
The simulation accuracy of irregular granular entities is paramount for characterizing their morphological features. In the Bubble Pack algorithm, clump fidelity is primarily governed by two dimensionless control parameters: Ratio (r) and Distance (D). The Ratio (r) represents the threshold for the smallest filled sphere’s radius relative to the largest, where 0 < r < 1. As illustrated in Figure 3a, a smaller r value leads to sharper and more defined clump edges by allowing finer pebbles to fill the geometric envelope. The Distance (D) defines the maximum allowable overlap angle between pebbles, ranging from 0 to 180. As shown in Figure 3b, the clump surface becomes progressively smoother as D = 180. While higher accuracy better replicates real aggregate geometry, it exponentially increases the number of pebbles per clump, leading to excessive computational costs.
To achieve an optimal balance between morphological fidelity and calculation efficiency, this study determined a Ratio of 0.3 and a Distance of 150 through multiple trial simulations.

2.2.2. Gradation Area Calculation

Four existing pavement RDs (0 mm, 3 mm, 6 mm, 10 mm) were selected, and the DEM model of the asphalt mixture had a size of 300 mm × 300 mm, with a thickness of 85 mm for AC16 and a thickness of 15 mm for sealcoat, simulating the rutted slab specimens molded by the indoor downscaling experiment.
The mass of each aggregate gradation can be determined by estimating the individual particle’s area and density, thereby defining both the aggregate area distribution and gradation in the asphalt mixture. The specific conversion formulas are shown in Equations (1)–(4).
M = V ρ   m a x = ρ m a x π D 2 4 h
m = M V S = ρ m a x V V D h = D h ρ m a x
m i = m p i k = k D h ρ m a x p i
S i = m i ρ i = k D h p i ρ i ρ m a x
where M is the total mass of the specimen, V is the specimen volume, D is the specimen diameter, h is the specimen height, ρmax is the maximum dry density, m is the planar mass of the specimen, S is the planar projected area, mi is the planar mass of the i-th gradation aggregate, Pi is the percentage proportion of the i-th gradation aggregate, Si is the planar projected area of the i-th gradation aggregate, ρi is the density of the i-th gradation aggregate.

2.3. Numerical Simulation Settings and Quantification Indicators

2.3.1. Configuration of the Virtual Rutting Test

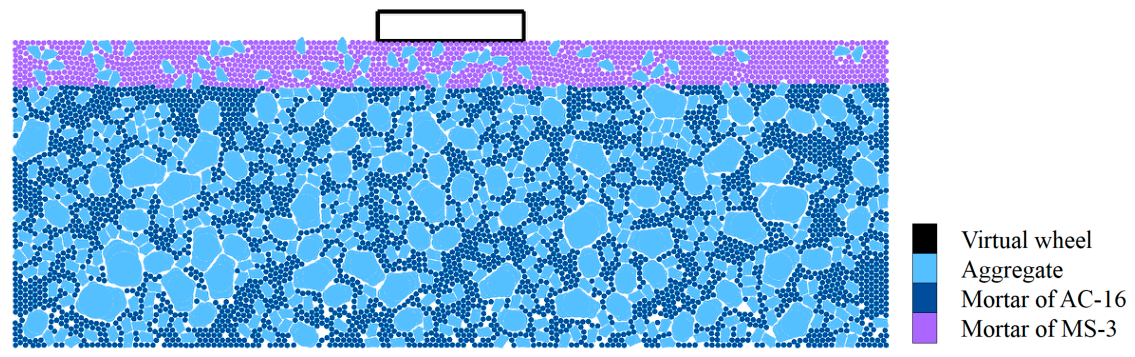
Virtual rutting tests (VRT) were conducted to evaluate how existing rut depth affects the mechanical response of the sealcoat. To obtain a stable data curve, the virtual test wheel was replaced by a rectangular plate clump to directly apply force without a servo system [18]. Therefore, a virtual load-bearing plate with a length of 50 mm was developed to simulate a rubber tire. The tests were conducted based on Chinese Standard Test Methods of Bitumen and Bituminous Mixtures for Highway Engineering (JTG E20-2011) [30]. To simulate the high-temperature performance of the mixtures, a constant test temperature of 70 °C was maintained throughout the simulation. A constant pressure of 0.7 MPa was applied as the plate moved downward. The simulation was terminated once the plate displacement reached 10 mm. The VRT is illustrated in Figure 4.

2.3.2. Contact Model Selection and Microparameter Calibration

While classical viscoelastic or viscoplastic models, such as the Burgers model, offer high physical fidelity in characterizing the small-strain rheological behavior of asphalt mortar [18,19,20], their application may face challenges when characterizing the transition from stable states to structural failure. This study specifically targets large-deformation processes and structural failure mechanisms that extend significantly beyond the linear viscoelastic creep regime. At these stages, microfracture within the asphalt mortar and debonding at the aggregate–mortar interface are often considered dominant failure mechanisms. The Parallel Bond Model (PBM) was therefore selected for its capacity to simulate fracture in cemented materials and the reorganization of the granular skeleton. Unlike traditional rheological models, PBM appears more effective in capturing the damage-induced instability, making it suitable for exploring the impact of pre-existing ruts on the integrity of composite structures.
The objective of this research is not to accurately reproduce the entire creep curve of asphalt concrete, but rather to explore how the internal structure of the mixture transitions from a stable state to instability and failure under extremely high temperatures. Although the PBM simplifies the material’s viscous behavior in the early deformation stages, it is highly effective in capturing: (1) Damage initiation and propagation: bond fracture intuitively reflects stress concentration and microcrack growth. (2) Skeleton restructuring process: after bond breakage, particle rearrangement through friction directly simulates the microscopic mechanisms of “compaction” and “flow” within ruts. (3) Strength parameter sensitivity.
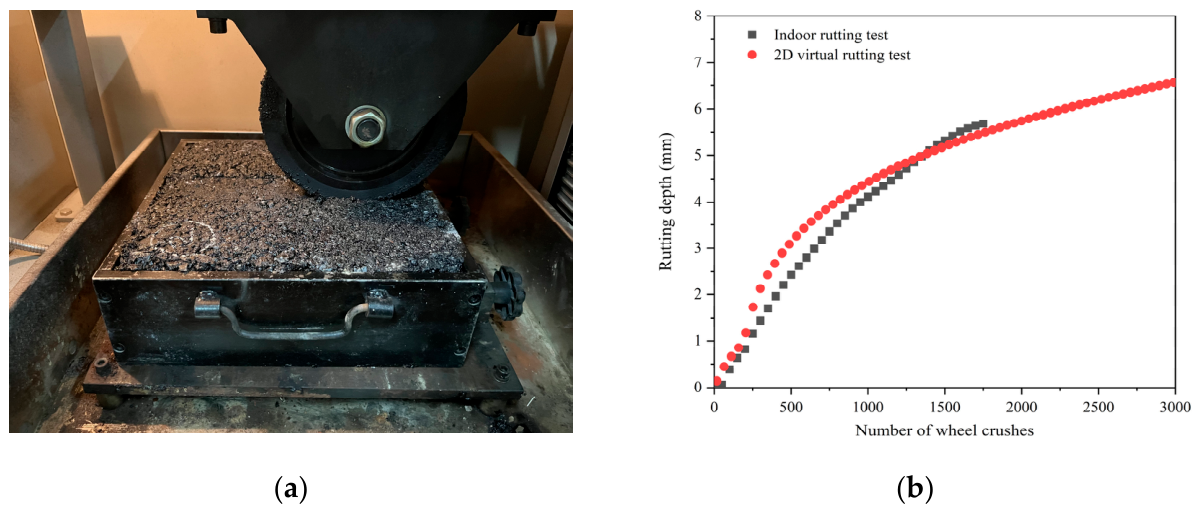
While rheological tests provide precise viscoelastic parameters, this study focuses on the structural instability and large deformation failure under extreme conditions. Therefore, to ensure the physical rationality of the PBM, its parameters were calibrated against macroscopic laboratory wheel tracking results conducted at a test temperature of 70 °C, rather than purely rheological data. This approach ensures the model captures the correct failure modes and remains consistent with real-world material responses. After multiple trial simulations, suitable microcontact parameters for AC16 were determined, as summarized in Table 3. A comparative analysis between the 2D virtual rutting test and laboratory rutting test results is presented in Figure 5. The comparison indicates that the DEM model captures the macroscopic deformation characteristics with high fidelity. Specifically, the relative error in the final rut depth between the simulated and experimental results across all test cases is consistently within 10%.
For the parameterization of the sealcoat, a correction strategy based on calibrated parameters of the underlayment structure was adopted, as validated in the literature [25]. Considering that emulsifiers in emulsified asphalt may weaken the polymer cross-linking effect, particularly after moisture evaporation at high temperatures, residual emulsifiers can act as weak points within the material. To account for this, the contact parameters of the underlayment structure at high temperatures were reduced by a factor of 0.8.

2.3.3. Void Structure Reconstruction and Composite Specimen Assembly

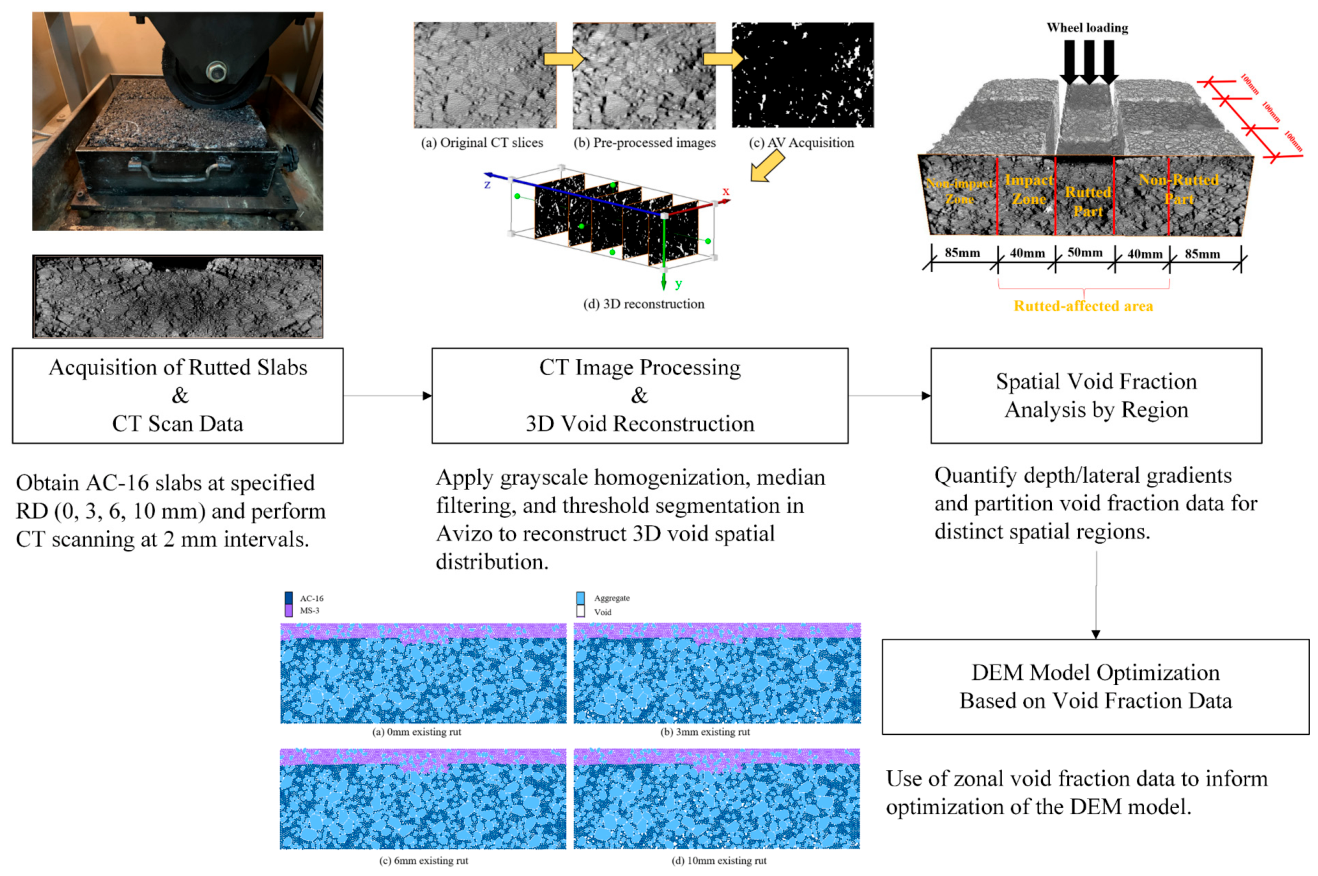
To accurately characterize heterogeneous void distributions induced by rutting damage, a cross-scale modelling framework integrating X-ray CT (Computed Tomography) and DEM was developed. The process commenced with CT-based void reconstruction, where AC16 rutted slabs (300 mm × 300 mm × 85 mm) at depths of 0, 3, 6, and 10 mm were scanned at an interval of 2 mm. The acquired images underwent grayscale homogenization, median filtering, and threshold segmentation in Avizo 2019.1 to reconstruct 3D void spatial distributions and quantify depth/lateral gradients, which provided the geometric basis for subsequent DEM void generation. The framework of this process is shown in Figure 6. For DEM validation, the void ratio was calculated using Equation (5), where the depth-averaged 3D void volume from CT reconstruction was converted to a 2D equivalent value.
V o = A o A a × 100 %
where Vo is the void ratio, Ao is the total area of the voids in the test area, Aa is the total area of the calculated area.
This methodology has been thoroughly validated in our previous work [15], which provides a standardized framework for the multi-scale characterization of asphalt mixtures.
Proceeding to DEM modeling, the asphalt mixture was simplified into a three-phase system comprising coarse aggregates generated per gradation specifications (generated according to gradation specifications), homogenized asphalt mortar particles of uniform size, and voids created through targeted particle deletion.
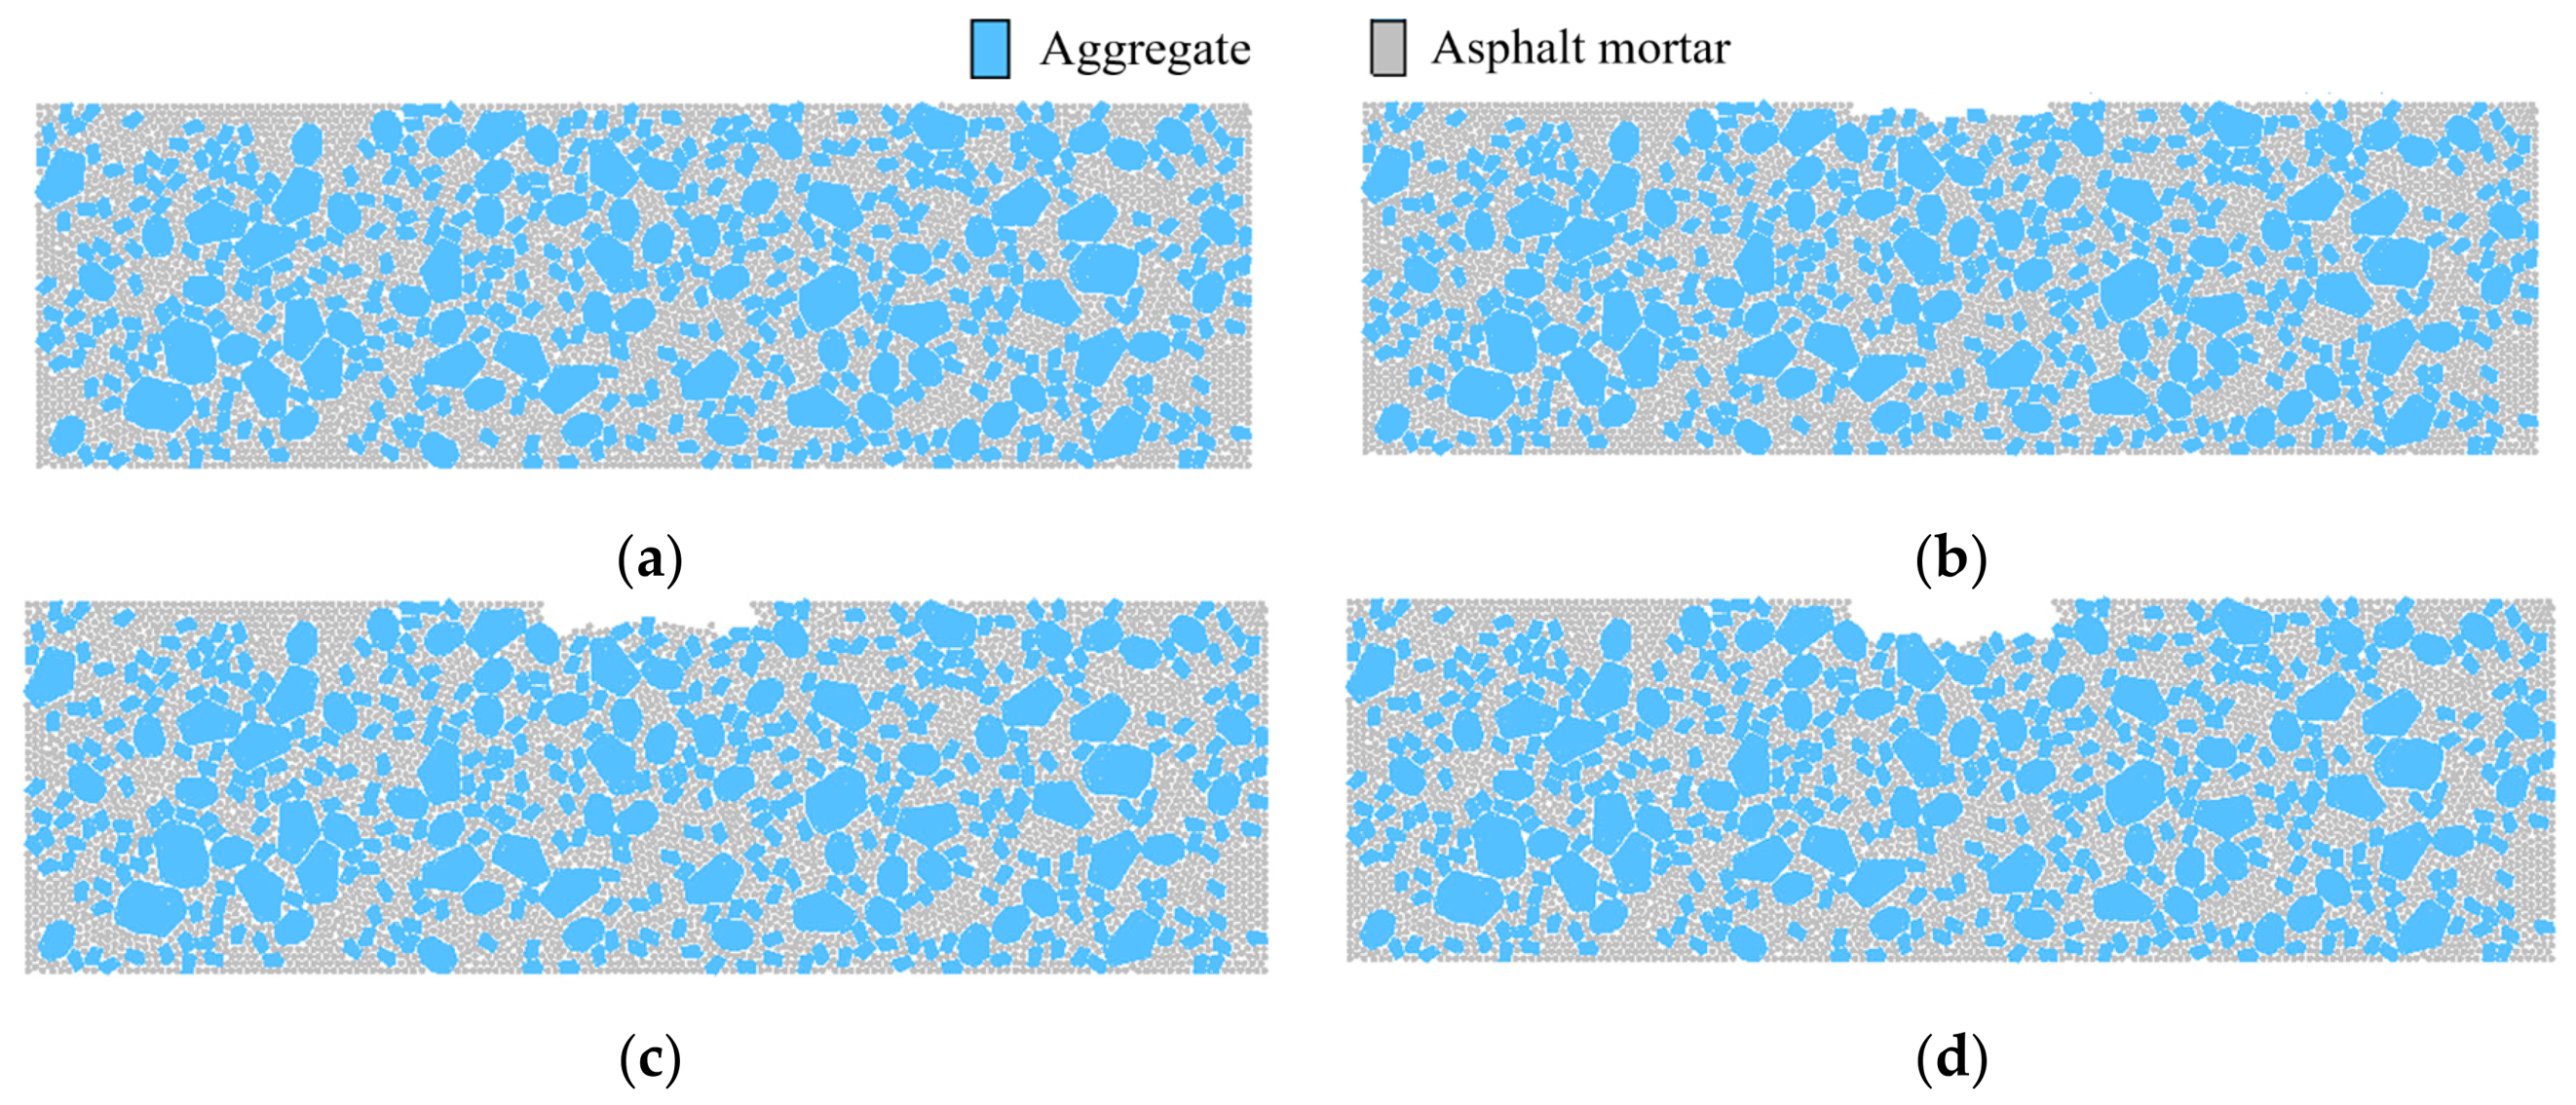
The composite model assembly is initiated with the substrate generation. The “ball distribute” command was used to generate the dense skeleton of the existing pavement layer specimen (AC16). This was combined with dynamic relaxation to eliminate initial particle overlaps and achieve a controlled-gradation initial structure. As shown in Figure 7a, the blue particles are aggregates, and the gray particles are asphalt mortar. The porosity of the entire model is 6%.
To accurately replicate the rutted surface profiles observed in laboratory tests, a series of base course models were developed with varying rut depths. As illustrated in Figure 7b–d, a specific region in the center of the model was designated for particle deletion. The deletion width was fixed at 50 mm, consistent with the scaled tire width used in standard [30], while the depths were set at 3 mm, 6 mm, and 10 mm to simulate different levels of pavement deterioration.
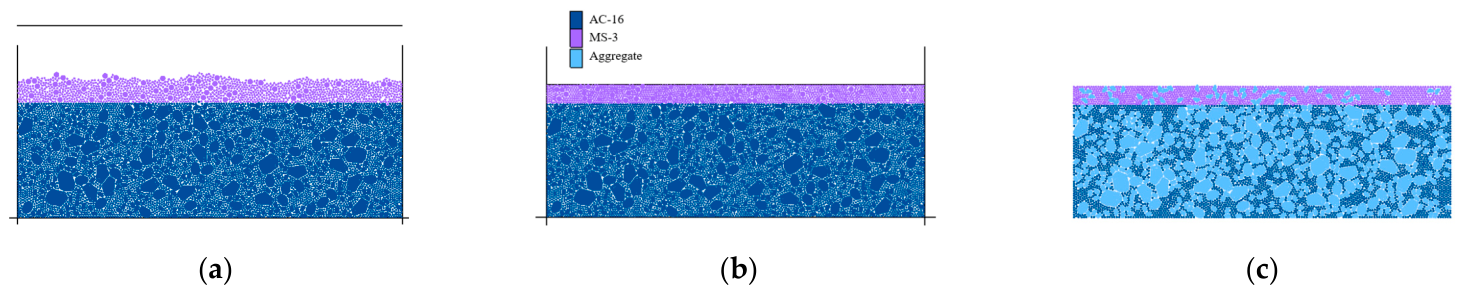
To simulate the microsurfacing sealcoat (MS3), the “ball generate” command was employed, with specific velocity boundaries applied to the walls to replicate the actual construction sequence. This process is visually captured in Figure 8. Figure 8a illustrates the free-spreading (paving) of MS3 particles, while Figure 8b demonstrates the subsequent leveling process. By integrating the dynamic migration mechanism of particles, this modeling approach effectively reproduces the flow behavior of the sealcoat material, culminating in the final AC16 + MS3 composite model shown in Figure 8c.
To simulate rutting-induced heterogeneous void structures in mixtures, a stochastic particle deletion algorithm was implemented using CT-derived spatial void gradients (Table 4). The regions are defined and measured according to the previous research [15].
The procedure follows these steps:
(1) Throughout the cycling process, traverse all balls within the intersection of the relative height and specified region using the PFC command ball.list.
(2) Define a random variable “rand_val”, sampled from a uniform distribution in the range [0, 1]. This variable will be used for comparison with the void in the next step.
(3) During each cycle, if “rand_val” is (1—local target void ratio), the particle is deleted (contributing to void space); otherwise, it remains as an asphalt mortar particle.
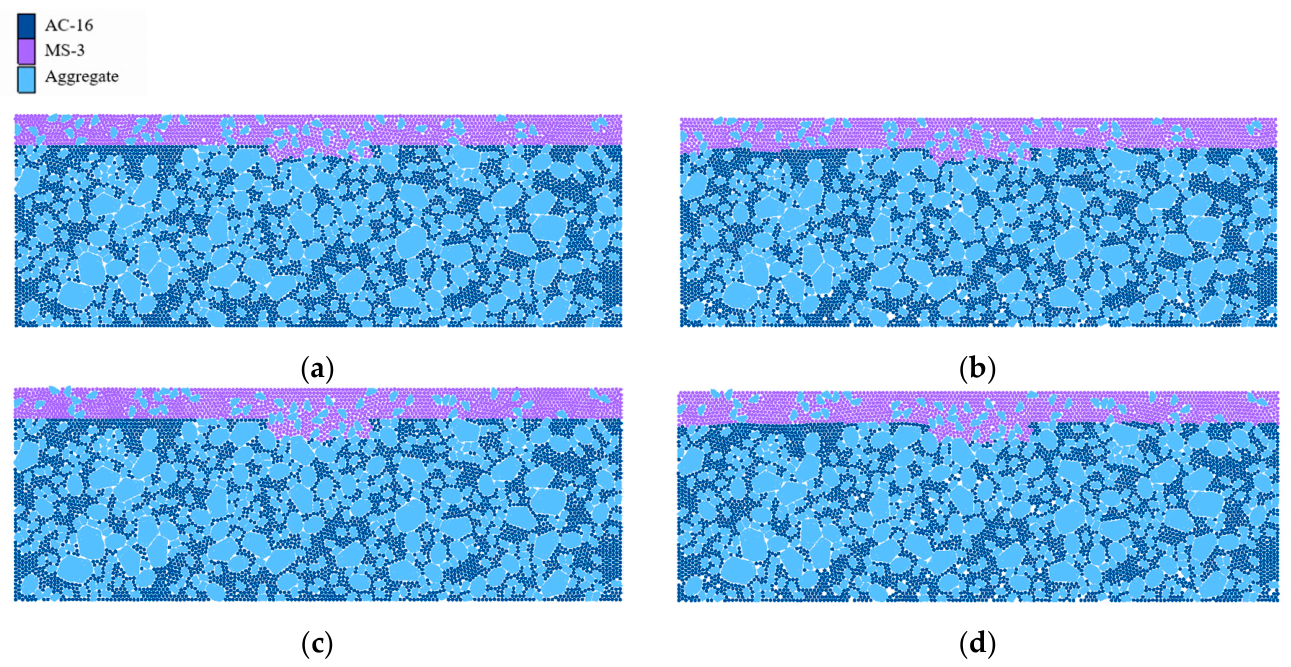
The spatial distribution of voids is refined through a stochastic optimization process as illustrated in Figure 9. Figure 9a,c represents the initial states with existing rut depths of 6 mm and 10 mm before the application of the void optimization algorithm. In contrast, Figure 9b,d demonstrates the successful generation of spatially correlated voids. The additional void spaces, which appear as white regions, are clearly visible in the middle and bottom sections of these specimens. This specific distribution pattern is designed to match the heterogeneity observed in CT scans. By incorporating these localized voids, the virtual AC16 specimens can quantitatively replicate the complex internal damage and non-uniform air void gradients found in rutted pavements.

2.3.4. Evaluating Indicators

To further clarify the distribution of contact force chain magnitudes within asphalt mixtures under rutting conditions, the size distribution was quantitatively characterized using the probability distribution P(f) of contact force chain magnitudes. P(f) is calculated according to Equation (6). A force chain is defined as a strong force chain if its contact force exceeds the average contact force, and as a weak one otherwise.
P f = N [ ] k / N
where P(f) is the probability distribution of the contact force chain; f is the ratio of contact force to average contact force;  N [ ] k  is the number of contact force chains in the specified interval, k is the number of intervals, the interval is 0.1; N is the total number of contact force chains.
Building upon the statistical distribution of force chains, the evolution of specific internal parameters, including the specimen porosity and the average contact force, was further investigated. The average contact force  F a v g  reflects the overall intensification of the particle contact network under external loading, which is calculated as Equation (7).
F a v g = i = 1 N c F i N c
where  N c  is the total number of ball–ball contacts and  F i  is the magnitude of the  i -th contact force. By tracking these indicators, the transition from an initial loose state to a stable skeleton under rutting conditions can be clearly delineated.
Furthermore, the specimen porosity  V 0 m  is used to quantify the macroscale densification and the reduction of air voids within the model, which is calculated according to Equation (8).
V 0 m = A v A v + A s × 100 %
where  A v  is the total area of voids in the model and  A s  is the total area of particles.

3. Results and Discussion

3.1. Effect of Existing Pavement Rutting on the Displacement Field

3.1.1. Evolution of the Displacement Field

Table 5 illustrates the evolution of the displacement field in sealcoat composite specimens with different existing pavement RDs under sustained loading.
From the cross-section in Table 5, it can be seen that distinct displacement patterns emerge across different regions as the total deformation of the sealcoat composite structure increases. Particles directly beneath the load exhibit predominantly vertical downward displacement. Particles within the central section of the specimen demonstrate a tendency to disperse laterally towards both sides, with the zone of significant displacement progressively expanding from the center towards the specimen edges. Particles distributed laterally adjacent to the load display displacement characterized by upward and outward diffusion, a trend particularly pronounced among particles within the sealcoat layer. For particles sharing the same x-coordinate, those positioned higher (larger y-coordinate) experience greater displacement magnitudes. Overall, particle displacement increases continuously with the progression of the total deformation. Notably, significant particle upheaval was observed within the load boundary region. During later loading stages, this upheaval intensified due to diminished inter-particle cohesion and loss of lateral confinement, ultimately resulting in a bulge of approximately 3 mm.
It can be seen from the vertical section in Table 5 that significant differences emerge in particle displacement distribution when the total deformation of the composite structure exceeds 8 mm. Higher existing pavement RD leads to a concentration of particle displacement within the sealcoat, manifested by a contraction of the zone containing particles displaced by more than 8 mm toward the load application area. This indicates that a lower existing pavement RD facilitates the transmission of greater displacement into the underlying layer when the sealcoat reaches the same total deformation. It may mean that the underlying AC16 structure layer is more involved in resisting deformation when the existing pavement RD is lower. Concurrently, the loading time required to attain the same total deformation increases significantly as the existing pavement RD decreases.
Comprehensive analysis shows that the existing pavement rutting exerts a significant influence on the displacement field within the composite structure. When the existing pavement RD is large, the deformation is mainly concentrated within the sealcoat layer, and the displacement distribution shrinks towards the loaded area. Conversely, a lower RD in the existing pavement facilitates improved load dispersion, thereby delaying structural damage progression.

3.1.2. Evolution of Horizontal and Vertical Displacements in the Sealcoat Layer

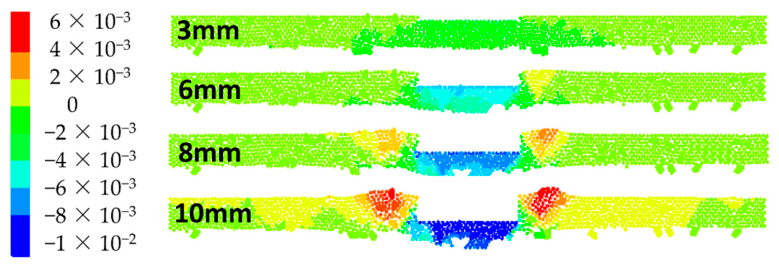
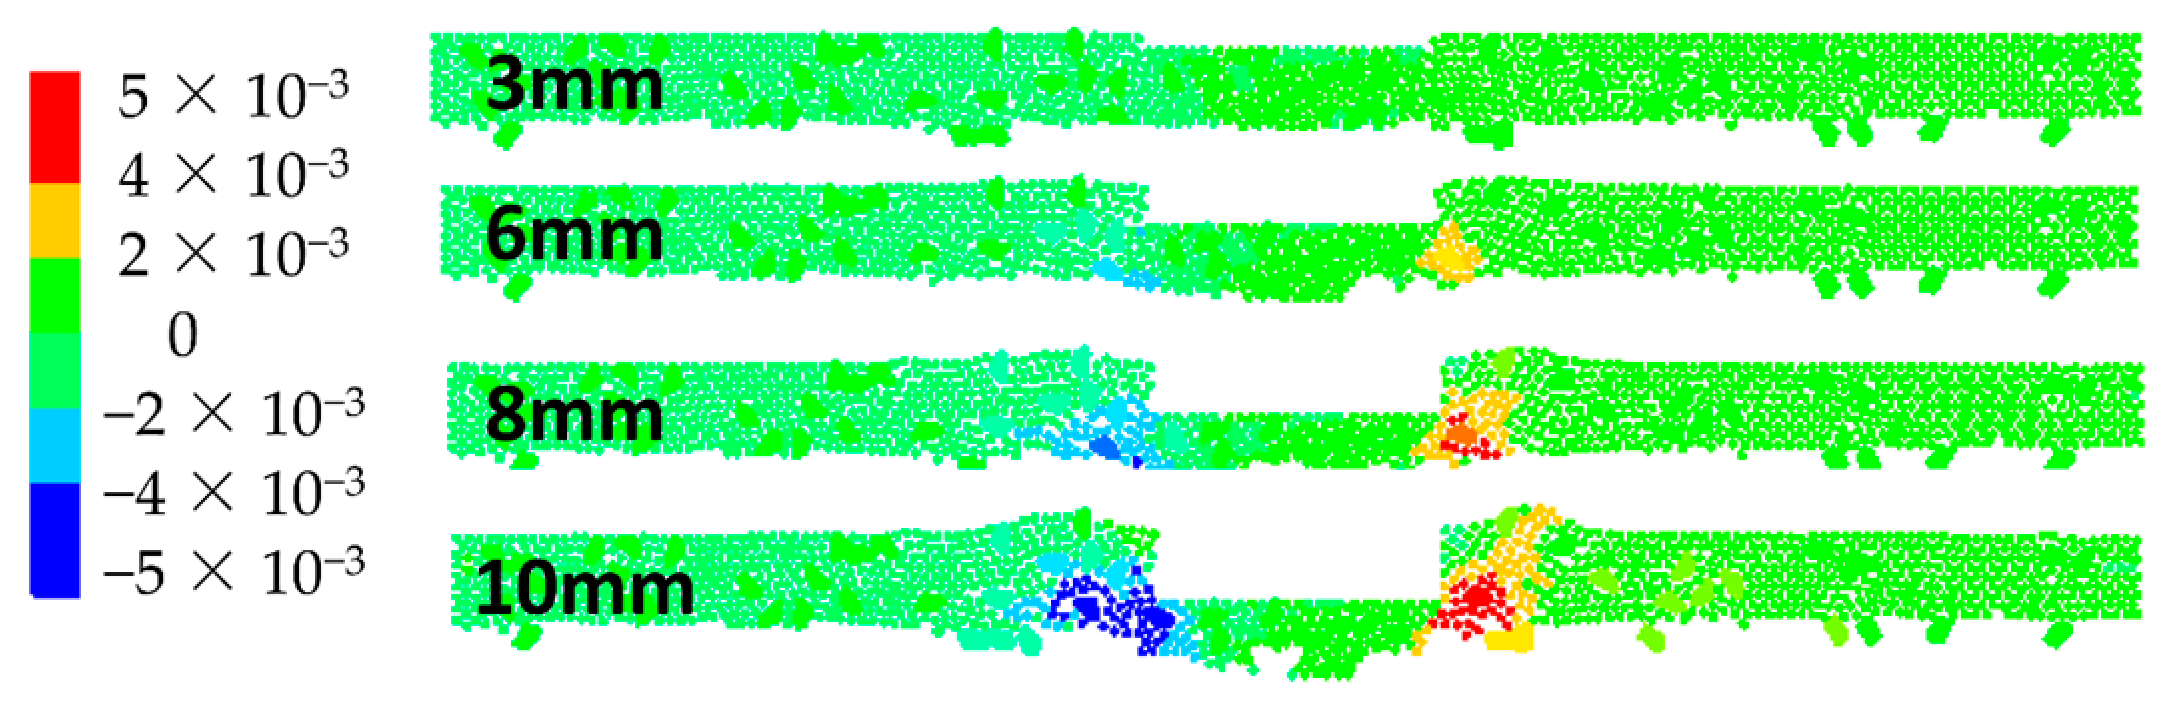
To isolate the intrinsic sealcoat response, Figure 10 and Figure 11 illustrate horizontal and vertical displacements progressively at 3, 6, 8, and 10 mm deformation levels under leveled existing pavement (RD = 0 mm).
The particle movement in the vertical direction (Figure 10) shows a clear U-shaped compression zone directly beneath the tire and a triangular bulge zone at the periphery. This U-shaped distribution is consistent with the pressure transfer characteristics predicted by elastic continuum theory, where vertical stress radiates downwards and outwards from the loading area. The simulation results replicate this macroscale behavior, showing a consistent axisymmetric pressure transfer. Meanwhile, the bulge zone with a 5 mm offset corresponds to the shear-induced dilatancy and lateral expansion, reflecting the symmetric boundary condition of lateral stress release. Both zones show a gradual increase in the absolute value of displacement; however, the compression zone develops progressively from top to bottom to match the downward propagation of energy in a continuous medium, while the bulge zone originates from the interior of the seal, highlighting the influence of the discrete aggregate skeleton.
Horizontal particle movement (Figure 11) occurs mainly at the bottom of the seal-coat layer, gradually developing upwards and forming an inverted triangular displacement concentration zone. The horizontal displacement at the bottom may result from the interfacial effects of interlayer shear confinement, while the upward path suggests that the energy transfer is modulated by the discrete nature of the aggregate skeleton. The particle movement in the lateral direction is more random and more clearly influenced by the characteristics of the aggregate distribution.

3.2. Effect of Existing Pavement Rutting on Contact Force Distribution

3.2.1. Contact Force Distribution Comparison

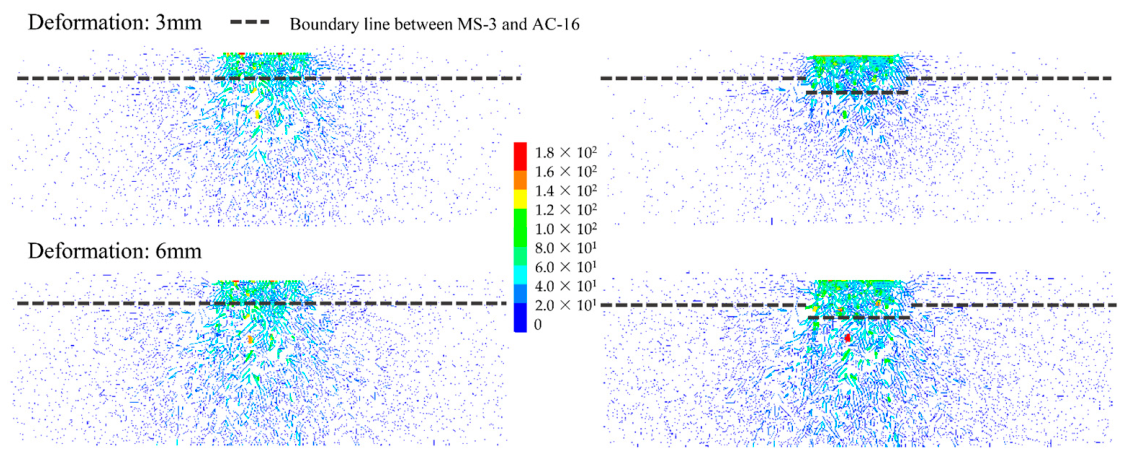
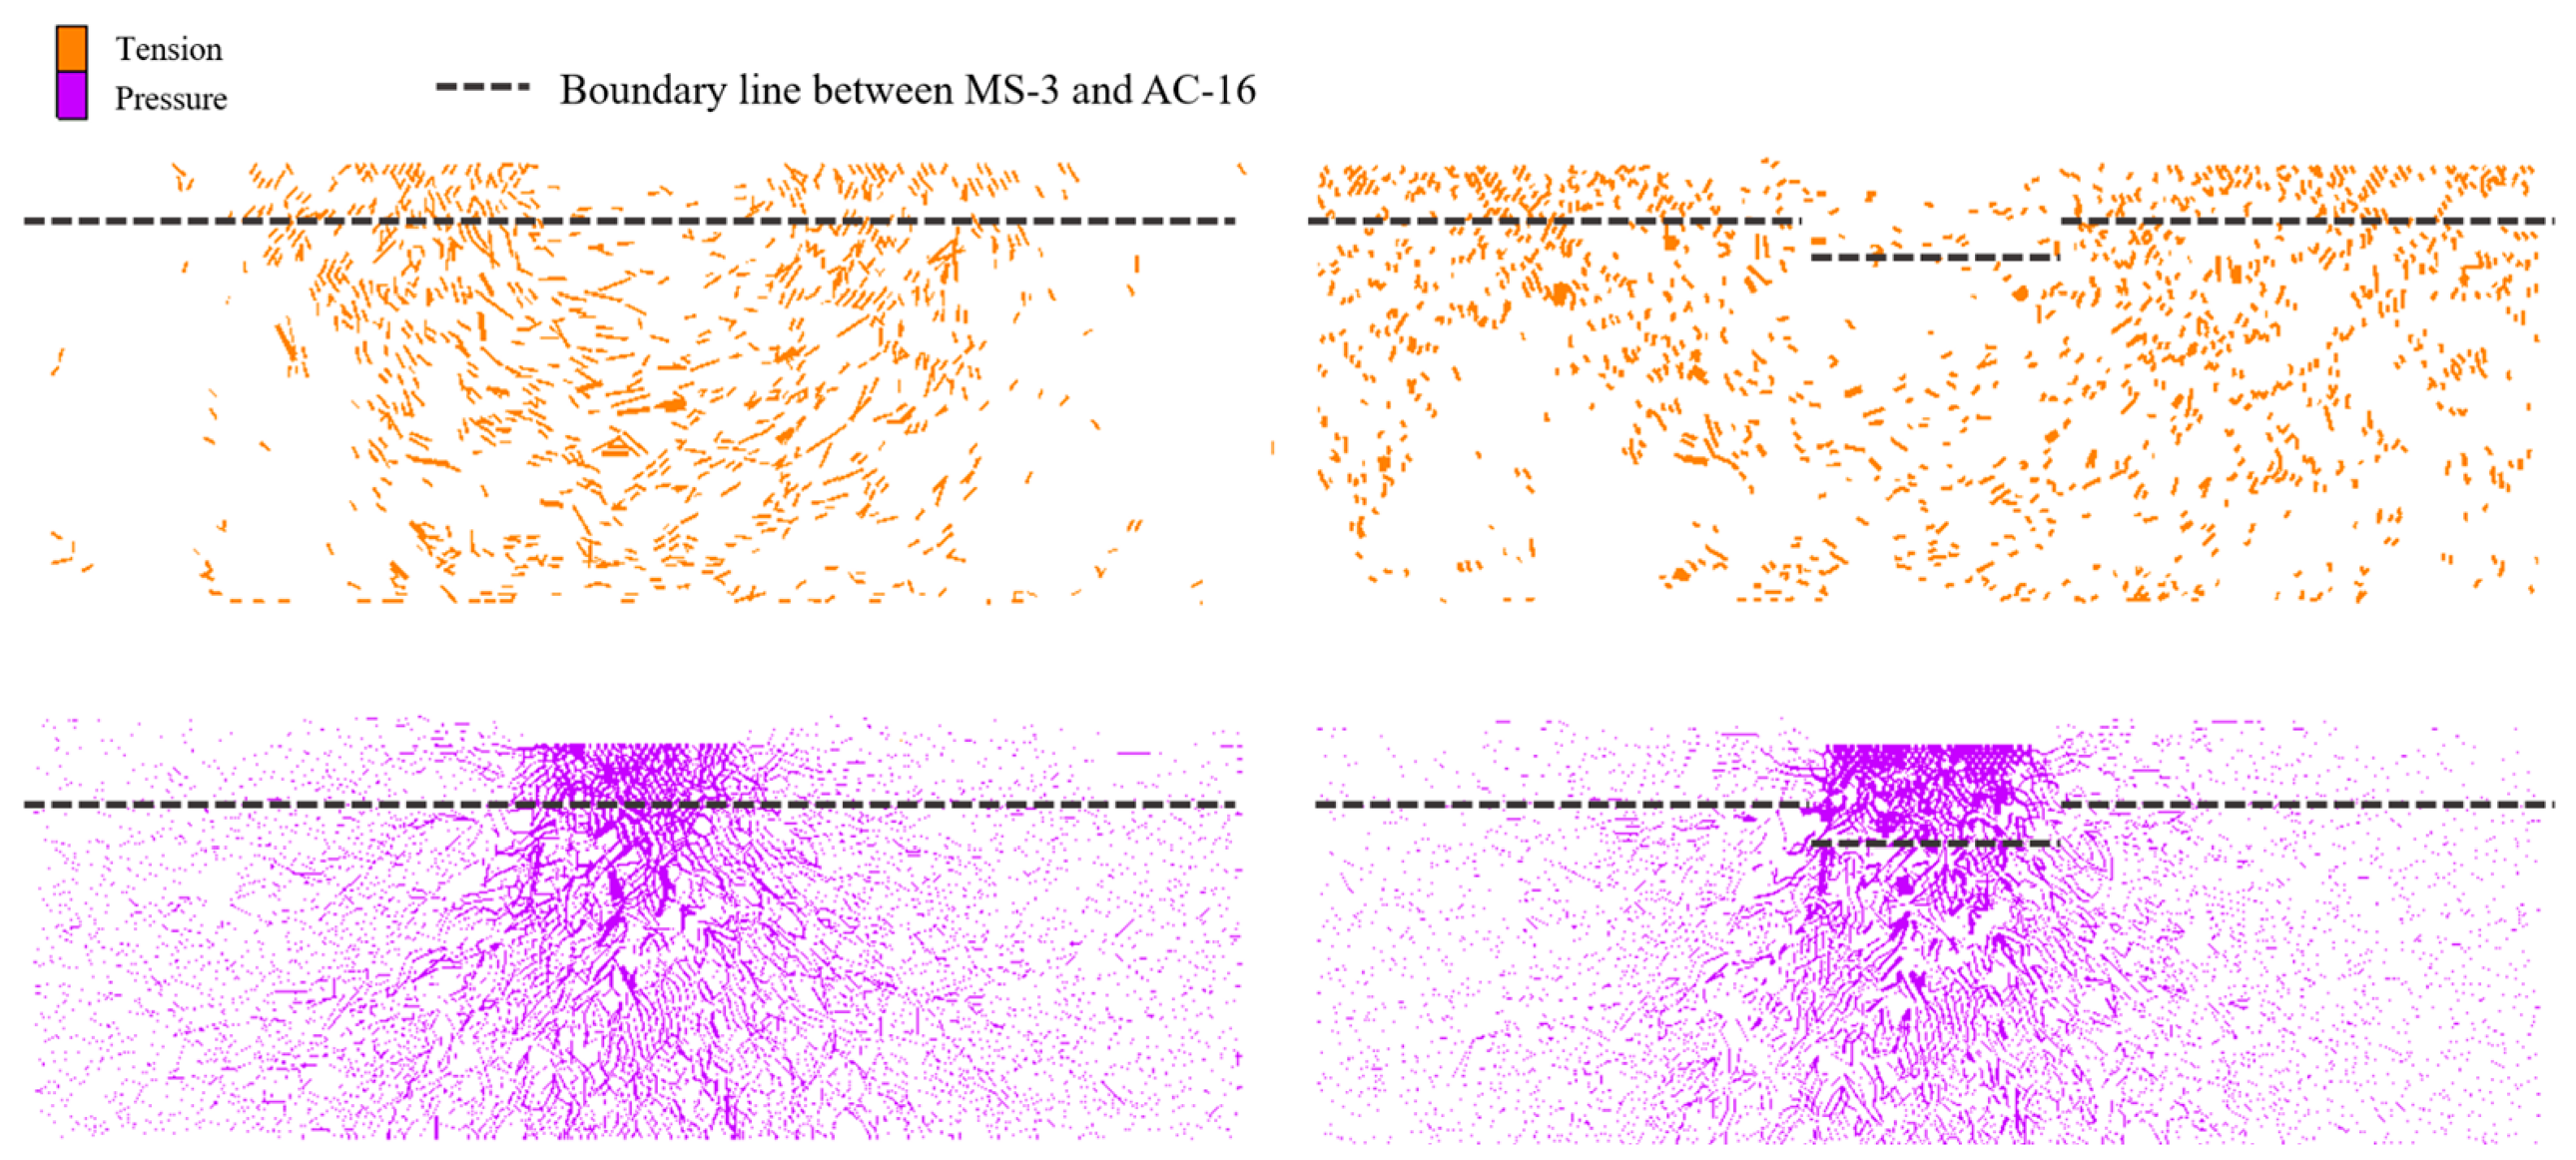
Extending the displacement field analysis (Figure 10 and Figure 11), Figure 12 compares contact force distributions for 0 mm vs. 10 mm existing pavement RDs, which represent ideal benchmark and maintenance intervention threshold conditions, respectively. This extreme-case contrast reveals force chain heterogeneity driving displacement asymmetry, and RD-dependent mechanisms governing structural degradation. Figure 13 contrasts compression and tension force chain distributions between 0 mm and 10 mm existing pavement RDs, revealing rut depth-dependent stress transmission mechanisms.
Figure 12 demonstrates a non-uniform distribution of contact force magnitudes that intensifies near the load application zone and escalates progressively with sustained wheel loading. Comparative analysis reveals critical distinctions between 0 mm and 10 mm existing pavement RDs. Under 10 mm RD, vertical force chains densify significantly within the wheel-loaded sealcoat region, while interfacial contact forces at the sealcoat–base course junction exhibit a substantial increase compared to 0 mm RD. This amplification stems from geometric constraints imposed by deep ruts, which confine particle migration paths and concentrate stress within the loading zone. Consequently, altered force transfer mechanisms redirect energy toward the sealcoat (aligning with displacement anomalies in Figure 12 and Figure 13), elevating local contact forces and exacerbating shear-induced cracking risk. These patterns confirm that existing pavement RD fundamentally governs stress distribution efficiency in composite structures with severe ruts compromising load dispersion capacity and accelerating sealcoat degradation.
Figure 13 illustrates the dominance of compressive stress chains within asphalt mixtures under wheel loading. Directly beneath the load, vertically aligned chains indicate pure vertical compression. Near the load periphery, chains adopt oblique orientations, reflecting combined vertical–lateral compression. Distal regions exhibit horizontally trending chains, signifying predominant lateral compression. In contrast, tensile stress chains concentrate primarily around the periphery of the loaded region, especially at wheel-track edges, suggesting susceptibility to crack initiation. Boundary constraints from the test apparatus, combined with the lateral and upward expansion of densely compacted aggregates, cause central specimen regions to display upward-arching tensile patterns.
Comparative analysis of 0 mm versus 10 mm existing rut depths (RDs) reveals critical stress redistribution. Under 10 mm RD, tensile chains fragment within rutted zones, despite the densification of compressive chains, while non-rutted regions develop hyper-concentrated chain networks. This occurs because rut-induced depressions vertically constrain particle migration, weakening tensile connections and dispersing tension chains. Simultaneously, discontinuities at rut edges generate lateral stress concentrations.
The 10 mm existing pavement rutting diverts tensile stress within the seal layer laterally toward its edges and prevents seal material filling the rut from effectively transferring tensile stress downward, which creates a zone of reduced tensile stress (“tensile stress vacuum”) at depths of approximately 15–40 mm beneath the tire. Consequently, the tensile stress transfer path within the AC16 structural layer becomes disrupted. In contrast, smooth pavement conditions promote a well-defined U-shaped tensile stress distribution pattern in the AC16 layer.

3.2.2. Composition of the Internal Contact Forces

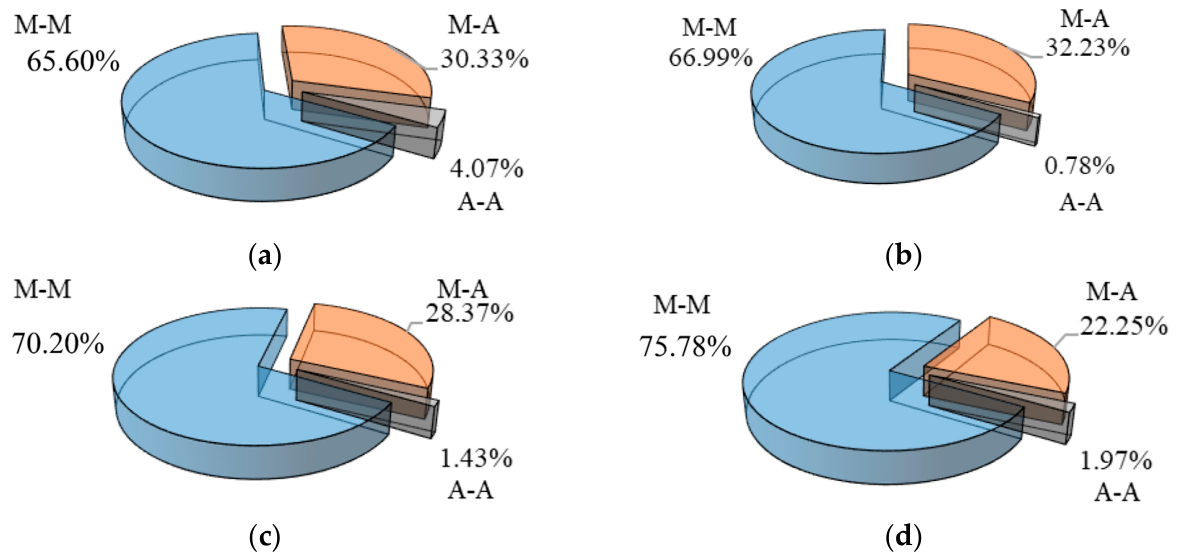
Figure 14 illustrates the composition of the internal contact forces when the material is under rutting loads at 10 mm rut depth for different existing pavement conditions, where M-M refers to contacts between asphalt mortar units, M-A to contacts between aggregate and asphalt mortar, and A-A to contacts between aggregates. This microstructural analysis reveals how RD evolution alters force transmission pathways, with complete datasets for other deformation conditions (0/3/6 mm) provided in Table 6 due to visualization constraints.
Figure 14 shows that more than 65% of contact forces within the sealcoat are sustained by asphalt mortar (M-M), confirming its role as the primary load-transfer phase. This stress distribution pattern arises when existing pavement RD increases, which may be because of two reasons: (1) dense mortar matrix enables rapid stress dispersion; (2) small-sized, low-proportion aggregates fail to form effective skeletal embedding.
As the RD of the existing pavement increased from 0 mm to 10 mm, the percentage of contact types was systematically reconstructed. The M-M contact percentage jumps from 65.61% to 75.79% (+10.18%), reflecting the enhanced mortar interaction under rutting constraints; the M-A contact percentage decreases from 30.33% to 22.25% (−8.08%), indicating deterioration in the integrity of the aggregate–mortar interface; and the A-A contact percentage stays stable at about 4%, confirming that the contribution of the aggregate skeleton to load transfer is negligible and not affected by rutting depth. This redistribution reveals that the established RD exacerbates the susceptibility of the sealer to high-temperature deformation by strengthening the dominant behavior of the mortar and breaking the M-A bond.
The following conclusions can be drawn by comparing the data in Table 6.
  • At low existing RDs (0 mm or 3 mm), the M-M ratio declines significantly (average reduction ~9.1%) with increasing virtual deformation depth. However, at high existing rut depths (6 mm or 10 mm), it decreases then increases (average reduction ~4.5%), suggesting recovery of the asphalt mortar’s internal contribution after large deformations in highly damaged pavements.
  • At low existing RDs (0 mm or 3 mm), the M-A ratio increases with greater virtual deformation depth (average rise ~8.0%). However, at high existing rut depths (6 mm or 10 mm), the M-A ratio rises and then declines (average increase ~3.8%), indicating reduced M-A involvement in later deformation stages for highly damaged pavements.
  • A-A ratio generally increases or fluctuates (average increase ~1.1%), with notable rises at low existing rut depths. Nevertheless, proportions remain consistently low, exerting limited overall influence.
  • The data reflect the viscoelastic-plastic behavior of the asphalt mix. Initial damage (existing RD) alters the material’s microstructure. Under high RD, mortar dominates deformation; during new loading (virtual deformation), low-damage pavements shift from M-M to M-A (aggregate-mediated deformation), while high-damage pavements revert to M-M dominance at large deformations (“healing” via mortar flow). For rutted pavements with high existing RD, maintenance should focus on optimizing asphalt mortar performance (e.g., bitumen content) to mitigate further deformation.

3.3. Effect of Existing Pavement Rutting on Contact Force Evolution

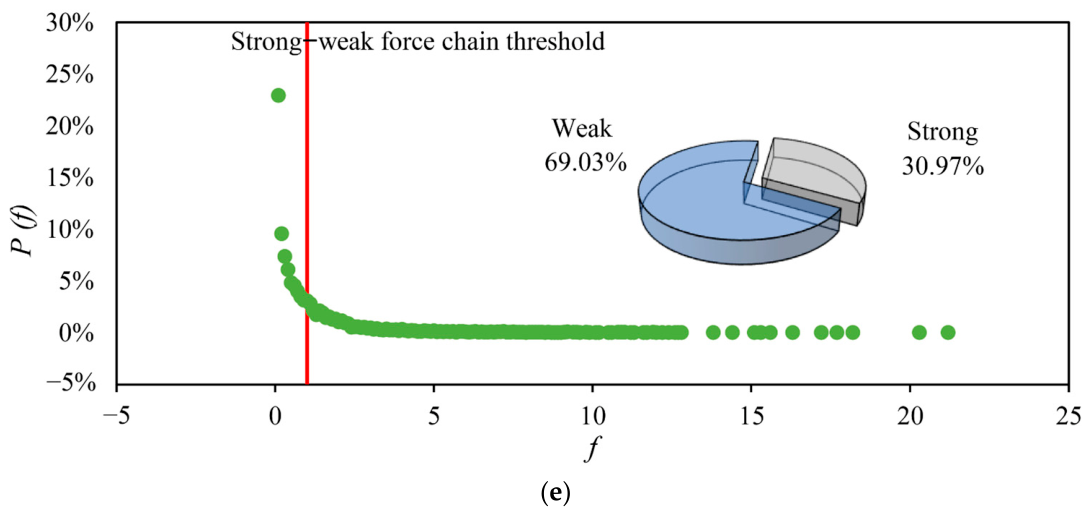
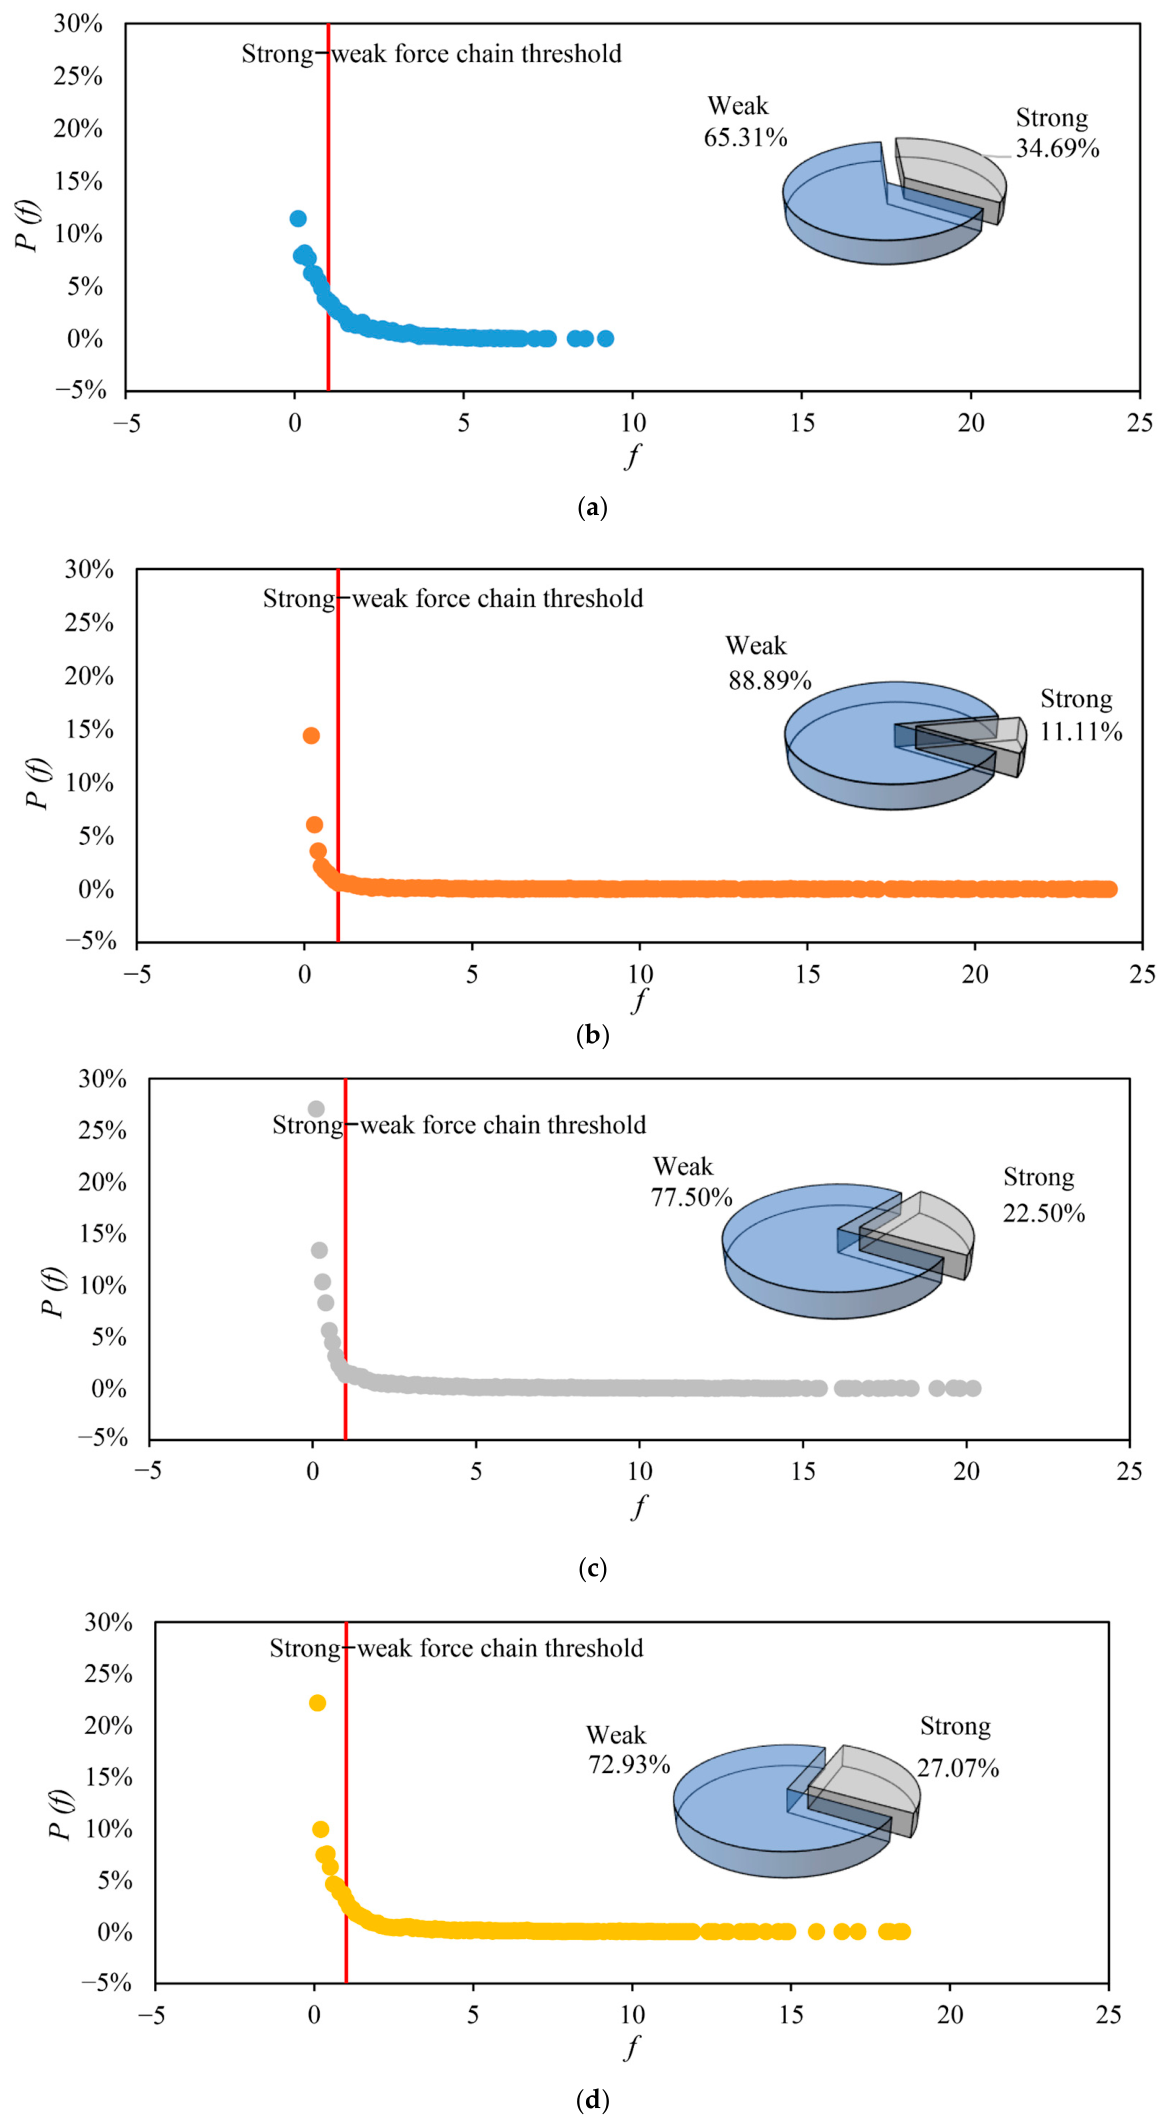
The predominance of asphalt mortar (M-M) in contact force distribution confirms its governing role in the sealcoat’s mechanical behavior. Consequently, evolutionary analysis of contact force chain magnitudes focuses exclusively on M-M interactions. Table 7 quantifies the proportions of high-magnitude M-M chains across existing pavement conditions. Given the variation in these proportions among conditions, Figure 15 subsequently analyzes contact force chain distributions using the 0 mm existing pavement RD as the reference baseline, and f represents the maximum force chain magnitude.
Table 7 demonstrates that the proportion of strong force chains in asphalt mixtures during VRT exhibits an initial decrease followed by a subsequent increase with progressive deformation development. This trend is fundamentally driven by the microstructural evolution and particle rearrangement within the sealcoat layer. During the initial loading phase (0–3 mm rut depth), the initial loading stage decreased from 34.69% to 11.11%. This reduction is attributed to the initial instability of the loose aggregate skeleton. Under early tire penetration, the original contact network undergoes rapid reconfiguration; many initial contact points between particles are lost as they slide or rotate to accommodate the external load, leading to a temporary softening or dilution of the strong force chain network.
Subsequently, under sustained wheel loading, stress diffusion, particle rearrangement, and pore compression collectively facilitated new contact point formation, ultimately increasing the strong force chain proportion to 30.97% at 10 mm RD. This recovery results from a densification-driven stabilization mechanism. As particles complete their rearrangement, they find more optimal positions to interlock, leading to an increase in the coordination number and the formation of a new, more robust load-bearing skeleton. This process transforms the discrete particles into a more integrated structure, effectively enhancing the global load-transfer efficiency.
The probability distribution of force chain size in Figure 15 always conforms to the inverse function characteristics (more weak force chains and fewer strong force chains). Notably, the maximum force chain magnitude (f) peaked at 23 during the early loading stage (3 mm). Later, in the mid-loading stage (6–8 mm), it decreased to 18. Finally, in the final loading stage (10 mm), it rebounded to 23. The higher f value in the early stage originated from localized stress concentration near the rutted plate. The decrease in f during the mid-stage corresponded to stress redistribution. This involved particle rearrangement, alleviating extreme force chains. The increase in f at the final stage reflected the material forming a new stable structure. Extreme force chains reappeared but were more uniformly distributed and better integrated into the overall network.

3.4. Evolution of Inter-Particle Contact Force and Porosity

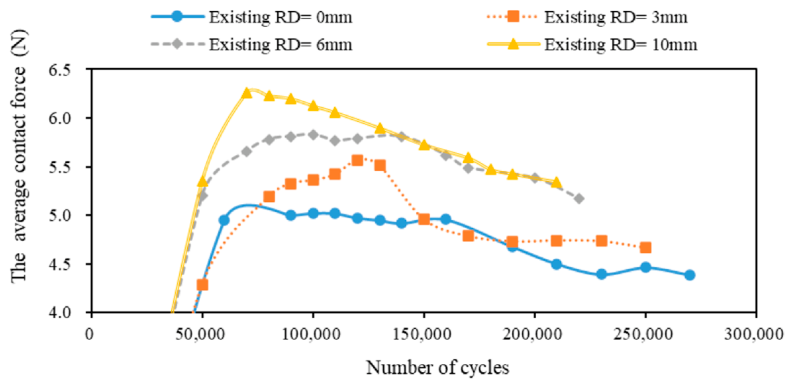
The variation of average contact force with loading time is shown in Figure 16.
The contact force evolution in Figure 16 shows a characteristic three-stage pattern: rapid rise, peak maintenance, and gradual attenuation. Initially, the contact force rapidly increases to 5.0 N as the MS3 undergoes densification under loading, forming an intact force transmission network without visible cracking. During the peak stability phase, internal force paths become saturated, reaching the ultimate bearing capacity while microcracks initiate and propagate. In the final stage, abrupt force reductions occur as microcracks disrupt the transmission paths, accelerating structural deterioration.
The appearance of the contact force peak marks the transition of rutting deformation from the compaction-dominated stage to the damage accumulation-dominated stage. Specifically, the decrease in average contact force may be caused by the formation of microcracks inside the mortar. This disrupts certain ball–ball contact pairs, fractures original force transmission paths, and concentrates loads on remaining effective paths, leading to localized stress exceeding the limit and accelerating crack propagation.
In comparison, the 0 mm existing pavement exhibits the lowest peak force with gradual attenuation, whereas higher initial RDs produce stronger peaks, indicating more severe stress concentration. The existing pavement with 10 mm RD reaches a peak force of 6.26 N with the most rapid attenuation. In contrast, existing pavements with 3 mm and 6 mm RD display brief force fluctuations before attenuation, likely caused by local aggregate rearrangement.
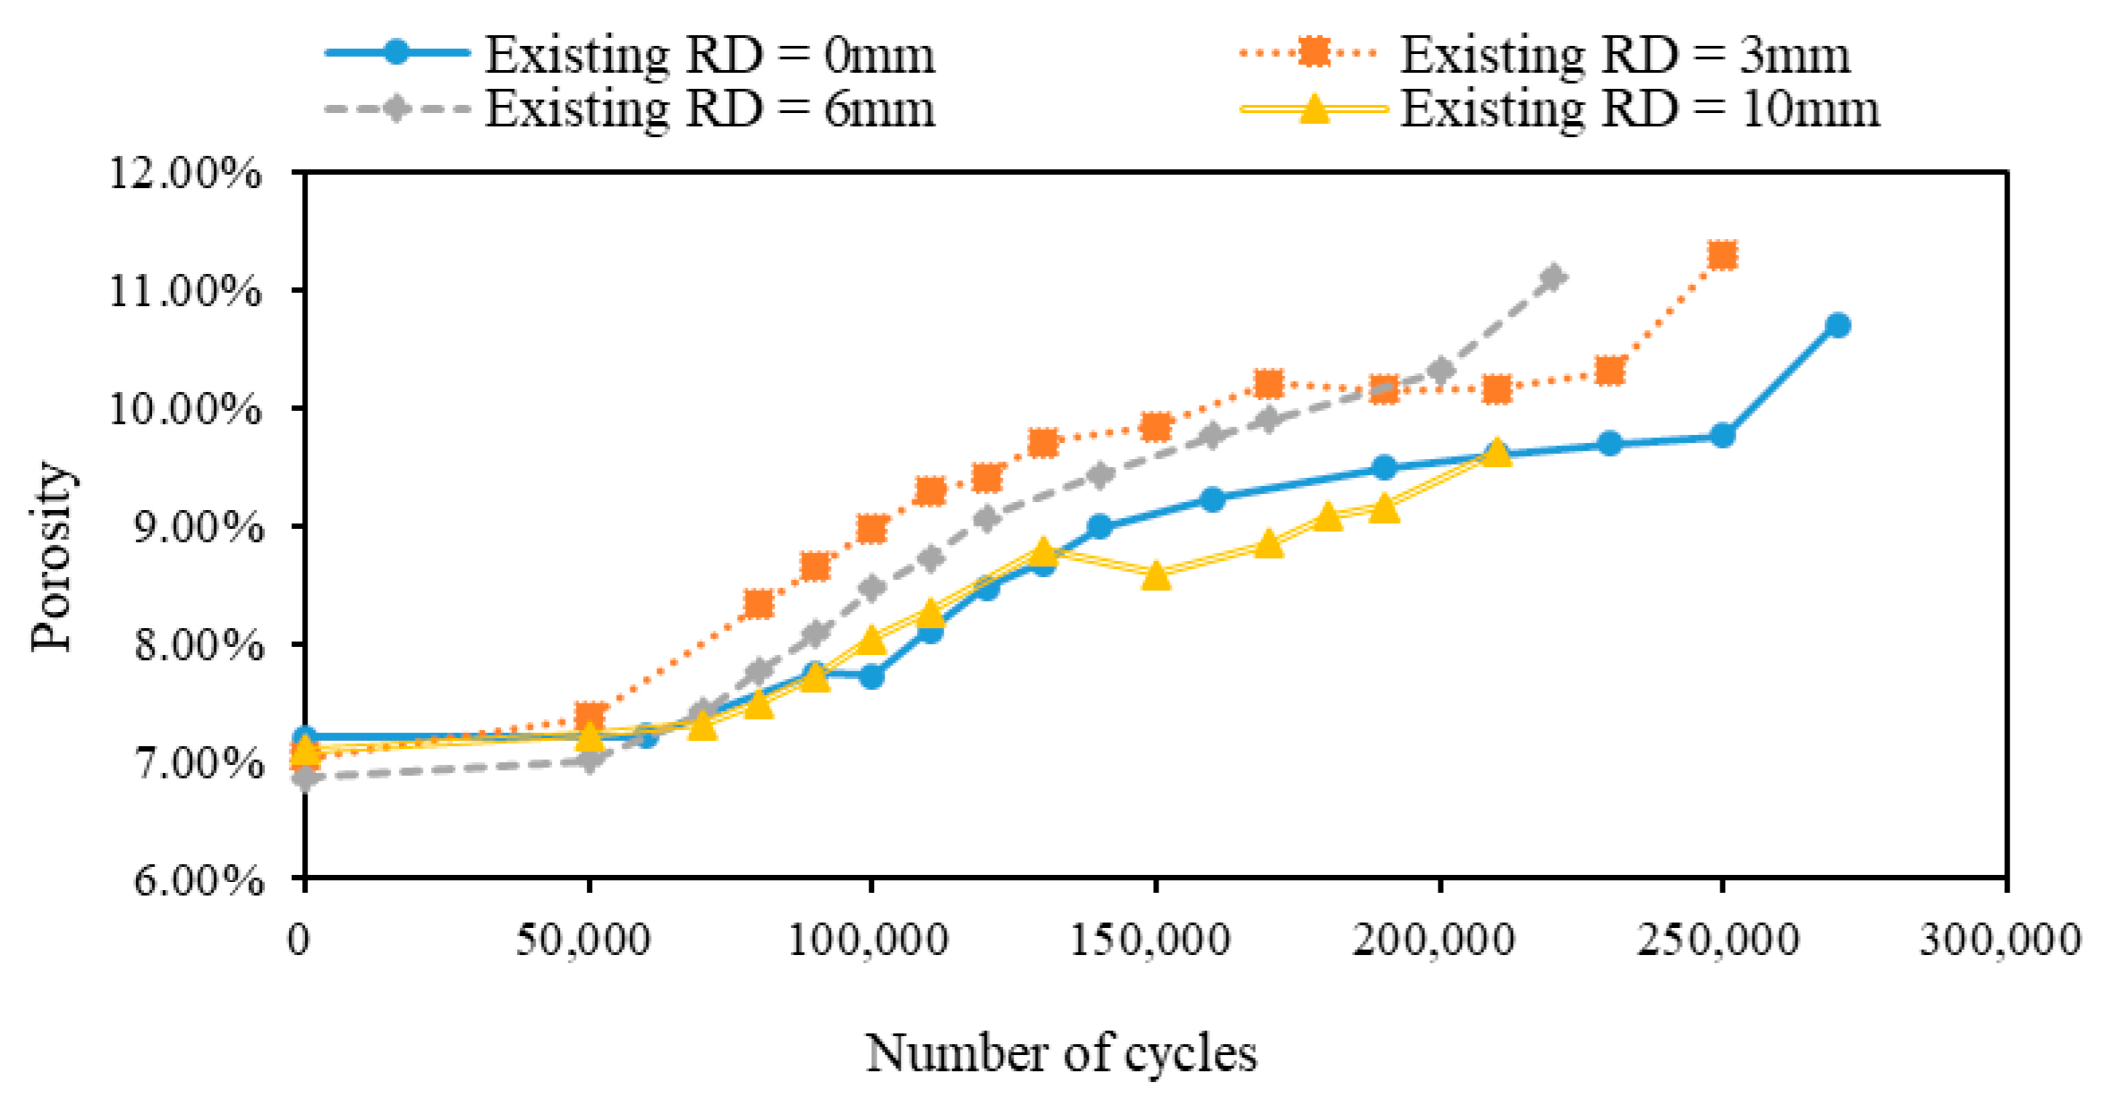
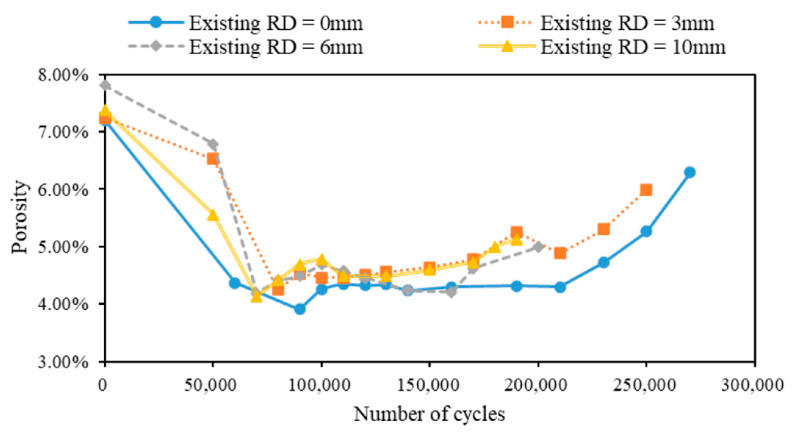
Figure 17 and Figure 18 show the changes in porosity in the rutted area and the non-rutted area, respectively.
Figure 17 shows that the porosity in the non-rutted area increases monotonically with continuous loading, indicating a gradual loosening of the material’s overall structure. In Figure 18, the porosity in the rutted area follows a “decreasing–increasing” trend. During the initial loading stage, porosity decreases due to compaction; as damage accumulates, it rebounds significantly in the later stage. The porosity rebound inflection points occur earlier (150,000 cycles) for existing pavements with 6 mm and 10 mm RD, compared to those (210,000 cycles) for pavements with 0 mm and 3 mm initial RD. Although non-rutted damage cannot be ignored, its magnitude is significantly smaller than the porosity rebound in the rutting area, confirming that rutting is the core failure zone in sealcoats.
The sharp porosity fluctuations occur in the rutted area. This is in stark contrast to the gradual changes in the non-rutting area. Such contrast suggests that rutting failure results from localized structural instability and material deformation. It does not result from overall material deterioration.
By comparing Figure 16 and Figure 18, it is found that the attenuation of contact force and the rebound of porosity are highly synchronized in time and space. This correlation reveals a critical damage mechanism. First, crack formation progressively disrupts ball–ball contacts, reducing effective force transmission paths. Consequently, stress concentrates on the remaining paths, further accelerating crack propagation. This process establishes a self-reinforcing cycle: damage aggravation leads to decreased load-bearing capacity, which in turn exacerbates damage. Simultaneously, the observed porosity increase in non-rutted areas in Figure 16 demonstrates how cracks propagate outward from rutted zones. This expansion can lead to material debonding and structural loosening within the sealcoats, with these internal damages eventually becoming visible as surface cracking and localized spalling failures.

4. Conclusions

This study systematically investigated the effects of pre-existing pavement rut depth (RD: 0, 3, 6, and 10 mm) on force chain transmission and displacement evolution in microsurfacing sealcoats using the DEM. Based on the mesoscopic mechanical response observed in the simulations, the main conclusions are as follows.
  • In cases with a 10 mm existing RD, geometric confinement at a depth of 15–40 mm restricts particle migration, triggering localized shifts in tensile stress transfer.
  • Existing ruts redirect stress paths through geometric discontinuities, densifying vertical compressive force chains within rutted zones. Simultaneously, stress concentration at rut edges increases horizontal tensile force chain density, significantly elevating the risk of edge cracking.
  • Across all scenarios, mastic-mastic (M-M) contacts transmitted over 65% of the load, while aggregate-aggregate (A-A) transfer contributed less than 5%. This confirms that load transfer in the sealcoat primarily relies on the continuous asphalt mortar phase rather than the aggregate skeleton.
  • The strong force chain ratio followed a consistent macrostatistical trend of “initial decrease followed by an increase”, reflecting the microstructural transition from initial contact reconfiguration to stable skeleton formation. The initial decline was driven by particle sliding and rotation under localized stress, while the subsequent recovery to around 30% resulted from increased particle interlocking and coordination numbers during densification. Existing RD modulates local stress intensity but does not alter this fundamental evolutionary pattern.
  • The evolution of inter-particle contact forces and porosity reveals a distinct three-stage damage mechanism. The synchronization of the contact force peak (reaching 5.0 N–6.26 N) and the porosity rebound inflection point (150,000–210,000 cycles) marks the transition from structural compaction to accelerated damage. In rutted areas, the “decreasing–increasing” porosity trend, coupled with abrupt force attenuation, confirms that microcrack propagation disrupts the ball–ball transmission paths, triggering a self-reinforcing cycle of localized instability and structural failure.
Building on these findings, further research on the failure mechanisms of seal composite structures is recommended in the following areas: (1) developing a full-size DEM model incorporating temperature-dependent binder rheology to simulate seasonal rutting evolution; (2) obtaining internal void characteristics and damage trends in the structure of CT data for a more detailed validation study; (3) investigating non-conventional materials under extreme exposure conditions, such as thermal aging.

Author Contributions

Conceptualization, W.F. and H.W.; methodology, W.F. and Z.Z.; software, W.F.; validation, W.F., Y.Z. and Z.X.; formal analysis, W.F. and Z.Z.; investigation, W.F.; resources, H.W.; data curation, W.F., Y.Z. and Z.X.; writing—original draft preparation, W.F.; writing—review and editing, H.W. and Z.Z.; supervision, H.W. All authors have read and agreed to the published version of the manuscript.

Funding

This research received no external funding.

Institutional Review Board Statement

Not applicable.

Informed Consent Statement

Not applicable.

Data Availability Statement

The original contributions presented in this study are included in the article. Further inquiries can be directed to the corresponding author.

Acknowledgments

During the preparation of this manuscript/study, the author(s) used Gemini 1.5 Flash for the purposes of language translation and grammatical polishing. The authors have reviewed and edited the output and take full responsibility for the content of this publication.

Conflicts of Interest

Author Zhanwei Zhao was employed by the company Chongqing YuqianExpressway Co., Ltd. Author You Zhou and Zhoucong Xu were employedby company China Merchants Chongqing Communications TechnologyResearch & Design Institute Co., Ltd. The remaining authorsdeclare that the research was conducted in the absence of anycommercial or financial relationships that could be construed as apotential conflict of interest.

Abbreviations

The following abbreviations are used in this manuscript:
ACAsphalt Concrete
MSMicro Surfacing
RDRut Depth
DEMDiscrete Element Method
SBSStyrene–butadiene–styrene
PFCParticle Flow Code

References

  1. Jia, Y.; Dai, X.; Wang, S.; Zhou, W. Evaluation of long-term effectiveness of preventive maintenance treatments using LTPP SPS-3 experiment data. Constr. Build. Mater. 2020, 247, 118585. [Google Scholar] [CrossRef]
  2. Jia, Y.S.; Wang, S.Q.; Huang, A.Q.; Gao, Y.; Wang, J.S.; Zhou, W. A comparative long-term effectiveness assessment of preventive maintenance treatments under various environmental conditions. Constr. Build. Mater. 2021, 273, 121717. [Google Scholar] [CrossRef]
  3. Li, J.; Zhang, Z.; Wang, X.; Yan, W.X. Intelligent decision-making model in preventive maintenance of asphalt pavement based on PSO-GRU neural network. Adv. Eng. Inform. 2022, 51, 101525. [Google Scholar] [CrossRef]
  4. Salleh, S.; Muhamad, R.; Abdillah, H.M.; Shahimi, A.F. Performance of pavement preservation with Ralumac Micro surfacing at LATAR highway. IOP Conf. Ser. Mater. Sci. Eng. 2019, 512, 012049. [Google Scholar] [CrossRef]
  5. Jia, Y.S.; Wang, S.Q.; Peng, J.; Gao, Y.; Hu, D.L. Evaluation of pavement rutting based on driving safety of vehicles. Int. J. Pavement Res. Technol. 2022, 15, 457–469. [Google Scholar] [CrossRef]
  6. Hossein, T.M.; Seyed, H.A.; Leila, N.H. Investigating the effect of using recycled waste concrete powder (RWCP) on the performance of thin layer surface treatment: Microsurfacing. Constr. Build. Mater. 2023, 400, 132734. [Google Scholar] [CrossRef]
  7. Aleksandrov, A.; Semenova, T. The Limiting Rut Depth by Conditions Safety of Traffic. In Networked Control Systems for Connected and Automated Vehicles; Guda, A., Ed.; Springer: Cham, Switzerland, 2022; Volume 510, pp. 883–892. [Google Scholar] [CrossRef]
  8. Pittenger, D.M.; Gransberg, D.D. Life cycle cost analysis of Portland cement slurry seal and micro surfacing to correct rutting. J. Struct. Integr. Maint. 2020, 5, 1–7. [Google Scholar] [CrossRef]
  9. Guirguis, M.; Buss, A. Performance Evaluation of Emulsion and Hot Asphalt Cement Chip Seal Pavements. J. Mater. Civ. Eng. 2017, 29, 04017202. [Google Scholar] [CrossRef]
  10. Yassir, A.A.; Shakir, A. Permanent deformation characteristics of modified thin overlay bitumen mixtures comprising waste polymers. Mater. Today Proc. 2021, 42, 2717–2724. [Google Scholar] [CrossRef]
  11. Mostafa, P.; Hesami, S. Performance evaluation of microsurfacing mixture containing reclaimed asphalt pavement. Int. J. Pavement Eng. 2020, 21, 1491–1504. [Google Scholar] [CrossRef]
  12. Hong, B.; Lu, G.; Gao, J.L.; Dong, S.; Wang, D.W. Green tunnel pavement. Polyurethane ultra-thin friction course and its performance characterization. J. Clean. Prod. 2021, 289, 125131. [Google Scholar] [CrossRef]
  13. Gazder, Q.A.; Choudhary, K.N. Statistical analysis for comparing and predicting rutting resistance of asphalt pavements with rigid and flexible geogrid layers. Constr. Build. Mater. 2021, 302, 124136. [Google Scholar] [CrossRef]
  14. Sassani, A.; Lawal, A.; Smadi, O. Guidebook for Application of Polymer-Modified Asphalt Overlays: From Decision-Making to Implementation; Iowa State University Report 22-793; Institute for Transportation: Ames, IA, USA, 2021. [Google Scholar]
  15. Xu, Z.; Fan, W.; Wang, H. An Investigation of Three-Dimensional Void Changes and Top-Down Microcrack Formation of AC-16 in Rutted and Non-Rutted Zones Under Extremely High Temperature and Heavy Load. Appl. Sci. 2025, 15, 9464. [Google Scholar] [CrossRef]
  16. Rodrigo, M.; Adriana, M.; Félix, P.J.; Fernando, M.N.; Miguel, D.S.; María, D.C. Analysis of different testing techniques for evaluating the adhesion of asphalt ultra-thin layers (AUTL). Int. J. Pavement Eng. 2023, 24, 2241108. [Google Scholar] [CrossRef]
  17. Nguyen, N.; Liu, Y.; Qiu, J.; Bawono, A.A.; He, S.; Lechner, B.; Yang, E. Strain-hardening cementitious composites ultra-thin whitetopping (SHCC-PUTW) for rapid asphalt pavement rehabilitation. Constr. Build. Mater. 2024, 412, 134252. [Google Scholar] [CrossRef]
  18. Gong, F.Y.; Deng, R.; Wang, Q.H.; Bai, J.; Cheng, X. Influence of aggregate motion related to rutting depth of asphalt mixture based on intelligent aggregate and DEM. J. Mater. Civ. Eng. 2024, 36, 04024056. [Google Scholar] [CrossRef]
  19. Loay, A.K.; Anupam, K.; Erkens, S.; Scarpas, T. Micromechanical simulation of porous asphalt mixture compaction using discrete element method (DEM). Constr. Build. Mater. 2021, 301, 124305. [Google Scholar] [CrossRef]
  20. Wu, S.S. Research on Rutting Flow Deformation of Asphalt Mixture Microstructures Based on Discrete Element Method. Master’s Thesis, Guilin University of Electronic Technology, Guilin, China, 2023. (In Chinese) [Google Scholar]
  21. Xue, B.; Xu, J.; Pei, J.Z.; Zhang, J.P.; Li, R. Investigation on the micromechanical response of asphalt mixture during permanent deformation based on 3D virtual wheel tracking test. Constr. Build. Mater. 2020, 267, 121031. [Google Scholar] [CrossRef]
  22. Ji, J.; Liu, H.; Yao, H.; You, Z.P. Influence of direct coal liquefaction residue (DCLR) on the rutting behavior of asphalt mixture with the discrete element method. Constr. Build. Mater. 2024, 453, 139028. [Google Scholar] [CrossRef]
  23. Liu, Y.P.; Xie, J.G.; Wei, D.B.; Tan, Y.W. Research on the permanent deformation mechanism and dynamic meso-mechanical response of porous asphalt mixture composite structure using the discrete element method. Constr. Build. Mater. 2023, 407, 133531. [Google Scholar] [CrossRef]
  24. Liu, Y.P.; Xie, J.G.; Zhang, Y.; Zhang, Y.; Wei, D.B.; Li, K.; Song, J.; Dai, Z.X. Study on the micromechanical response during permanent deformation of asphalt mixtures by discrete element modeling with real aggregate morphology. Constr. Build. Mater. 2023, 392, 131778. [Google Scholar] [CrossRef]
  25. Du, X.B.; Gao, L.; Rao, F.; Lin, H.W.; Zhang, H.C.; Sun, M.; Xu, X.C. Damage Mechanism of Ultra-thin Asphalt Overlay(UTAO)based on Discrete Element Method. J. Wuhan Univ. Technol. (Mater. Sci.) 2024, 39, 473–486. [Google Scholar] [CrossRef]
  26. Xie, S.; Yi, J.; Wang, H.; Yang, S.; Xu, M.; Feng, D.C. Mechanical response analysis of transverse crack treatment of asphalt pavement based on DEM. Int. J. Pavement Eng. 2020, 23, 2206–2226. [Google Scholar] [CrossRef]
  27. Xia, Q.; Gao, J.; Zhang, Q.; Xu, B.; Sun, Q.; Sun, K.; Yuan, Z.D. Study of Decay Mechanisms and Rules of Recycled Asphalt Pavement via a Full-Scale Experiment. Coatings 2023, 13, 1955. [Google Scholar] [CrossRef]
  28. Dhundup, G.; Zhou, J.; Bekoe, M.; Sun, L.J.; Mao, S.; Yan, Y. Integrating a mortar model into discrete element simulation for enhanced understanding of asphalt mixture cracking. Comput.-Aided Civ. Infrastruct. Eng. 2025, 40, 3279–3294. [Google Scholar] [CrossRef]
  29. Du, C.; Lu, G.; Wang, H.; Sun, Y.R.; Liu, P.F.; Wang, D.W.; Sabine, L.; Oeser, M. Effect of filler on performance of porous asphalt pavement using multiscale finite element method. Int. J. Pavement Eng. 2022, 23, 3244–3254. [Google Scholar] [CrossRef]
  30. JTG E20-2011; Standard Test Methods of Bitumen and Bituminous mixtures for Highway Engineering. Ministry of Transport of the People’s Republic of China: Beijing, China, 2011. (In Chinese)
Figure 1. Aggregate grading curves for different asphalt mixtures: (a) AC16; (b) MS3.
Applsci 16 04126 g001
Figure 2. Geometric shapes of 4.75–16 mm aggregates.
Applsci 16 04126 g002
Figure 3. Control parameters for virtual aggregate particle shape: (a) Ratio; (b) Distance.
Applsci 16 04126 g003
Figure 4. Virtual rutting test.
Applsci 16 04126 g004
Figure 5. VRT verification based on wheel rutting test for AC16: (a) Rutting test; (b) Comparison of 2D virtual and laboratory rutting tests.
Applsci 16 04126 g005
Figure 6. The framework for CT-based void reconstruction and DEM generation.
Applsci 16 04126 g006
Figure 7. AC16 modeling for different existing RDs: (a) RD = 0 mm; (b) RD = 3 mm; (c) RD = 6 mm; (d) RD = 10 mm.
Applsci 16 04126 g007
Figure 8. MS3 sealcoat mouding process: (a) Simulation of dispersion; (b) Simulation of leveling; (c) Final molding.
Applsci 16 04126 g008
Figure 9. Specimen models (a) before void optimization (existing RD = 6 mm); (b) after void optimization (existing RD = 6 mm); (c) before void optimization (existing RD = 10 mm); (d) after void optimization (existing RD = 10 mm).
Applsci 16 04126 g009
Figure 10. Vertical displacement of sealcoat.
Applsci 16 04126 g010
Figure 11. Horizontal displacement of sealcoat.
Applsci 16 04126 g011
Figure 12. Contact force chain. Left: leveled existing pavement; right: existing pavement RD = 10 mm.
Applsci 16 04126 g012
Figure 13. Distribution of pression and tension force chains with a total deformation of 6 mm. Left: leveled pavement; right: existing pavement RD = 10 mm.
Applsci 16 04126 g013
Figure 14. Contributions of aggregates and mortar during VRT (deformation = 10 mm): (a) existing RD = 0 mm; (b) existing RD = 3 mm; (c) existing RD = 4 mm; (d) existing RD = 10 mm.
Applsci 16 04126 g014
Figure 15. Evolution of the distribution of strong and weak force chains: (a) Total deformation of 0 mm; (b) Total deformation of 3 mm; (c) Total deformation of 6 mm; (d) Total deformation of 8 mm; (e) Total deformation of 10 mm.
Applsci 16 04126 g015aApplsci 16 04126 g015b
Figure 16. The contact force evolution of different existing pavement conditions.
Applsci 16 04126 g016
Figure 17. The porosity evolution of different existing pavement conditions in non-rutted areas.
Applsci 16 04126 g017
Figure 18. The porosity evolution of different existing pavement conditions in rutted areas.
Applsci 16 04126 g018
Table 1. SBS Modified Asphalt Technical Performance Indicators.
Test MetricsValueTest Methods
Penetration (25 °C, 5 s, 100 g) (0.1 mm)69T0604-2011
Penetration index−0.53T0604-2011
Ductility (5 °C) (cm)42T0605-2011
Soft point (°C)51.6T0606-2011
Rotating thin film oven test (RTFOT)Mass loss (%)0.5T0610-2011
Penetration ratio (%)60.2T0610-2011
Ductility (10 °C) (cm)27.1T0605-2011
Table 2. SBS Modified Emulsified Asphalt Performance Indicators.
Test MetricsValueTest Methods
Residues on sieve (%)0.04T0652-2011
Engler viscosity E2510T0622-2011
Evaporation residuesSolid content (°C)64T0651-2011
Ductility (5 °C) (cm)23T0605-2011
Penetration (0.1 mm)45T0604-2011
Softening point (°C)87T0606-2011
Solubility (%)99.5T0607-2011
Storage stability1d (%)0.01T0655-2011
5d (%)0.02T0655-2011
Table 3. DEM model parameters for AC16.
ModelParameterDescriptionValue
Contact model parametersfricCoefficient of friction0.7
dp_nratioDamping coefficient0.7
pb_tenParallel bond normal strength (Pa)2.02 × 10⁴
pb_cohParallel bond cohesion (Pa)4.04 × 10⁴
pb_faAngle of friction (°)35
Linear groupemodEffective modulus5 × 105
kratioRatio of normal to tangential stiffness3
Parallel bond contact grouppb_emodEffective modulus6 × 105
pb_ KratioRatio of normal to tangential stiffness0.95
Table 4. Void ratio distribution targets for AC16.
RD (mm)RegionsRelative HeightInitial Void RatioVoid Ratio Goal
0–10Rut and non-rut0.8~16%10%
6Rut0.3~0.66%8%
10Rut0.3~0.66%9%
Rut affected area0.2~0.57%
Table 5. Evolution of the displacement field in sealcoat composite specimens during VRT.
Existing Pavement RD (mm)Total Deformation of the Seal-Coat Composite Structure (mm)
36810
0Applsci 16 04126 i001Applsci 16 04126 i002Applsci 16 04126 i003Applsci 16 04126 i004Applsci 16 04126 i005
9019 cycles *43,951 cycles113,730 cycles269,610 cycles
3Applsci 16 04126 i006Applsci 16 04126 i007Applsci 16 04126 i008Applsci 16 04126 i009
8251 cycles37,905 cycles99,919 cycles242,563 cycles
6Applsci 16 04126 i010Applsci 16 04126 i011Applsci 16 04126 i012Applsci 16 04126 i013Applsci 16 04126 i014
7999 cycles35,677 cycles92,210 cycles220,000 cycles
10Applsci 16 04126 i015Applsci 16 04126 i016Applsci 16 04126 i017Applsci 16 04126 i018
7847 cycles30,639 cycles81,475 cycles205,727 cycles
* The number of cycles represents the duration of the load application.
Table 6. Level of the contribution of aggregates and mortar to resist external loads (%).
Deformation in VRTTypeExisting Pavement RD
0 mm3 mm6 mm10 mm
0 mmM-M75.8974.9476.0578.97
M-A22.9023.6822.8620.15
A-A1.211.381.090.88
3 mmM-M62.5268.8566.8671.71
M-A33.6230.3031.7125.94
A-A3.870.851.422.35
6 mmM-M67.4369.0567.4074.05
M-A29.0529.9531.1123.63
A-A3.511.001.492.33
10 mmM-M65.6166.9970.1975.79
M-A30.3332.2328.3722.25
A-A4.070.781.431.97
Table 7. Results of strong chain share for different existing pavement conditions (%).
Existing Pavement RDTotal Deformation of the Sealcoat Composite Structure
0 mm3 mm6 mm8 mm10 mm
0 mm34.6911.1122.5027.0730.97
3 mm34.6815.6321.9826.4431.27
6 mm34.6215.0921.2125.2229.20
10 mm34.1413.4520.8124.2229.27
Disclaimer/Publisher’s Note: The statements, opinions and data contained in all publications are solely those of the individual author(s) and contributor(s) and not of MDPI and/or the editor(s). MDPI and/or the editor(s) disclaim responsibility for any injury to people or property resulting from any ideas, methods, instructions or products referred to in the content.