Article

Porosity and Pore-Network Controls on Elastic Properties and Permeability in Porous Ignimbrites

1
Posgrado en Ciencias de la Tierra, Escuela Nacional de Estudios Superiores—Unidad Morelia, Universidad Nacional Autónoma de México, 04510 Morelia, Michoacán, Mexico
2
Escuela Nacional de Estudios Superiores—Unidad Morelia, Universidad Nacional Autónoma de México, 04510 Morelia, Michoacán, Mexico
*
Author to whom correspondence should be addressed.
Appl. Sci. 2026, 16(8), 4031; https://doi.org/10.3390/app16084031
Submission received: 24 March 2026 / Revised: 10 April 2026 / Accepted: 18 April 2026 / Published: 21 April 2026

Abstract

In porous ignimbrites, porosity defines the first-order control on elastic trend, but rocks with similar porosity can still behave differently because their pore networks are arranged differently. We analyzed 50 specimens from seven ignimbrite units in Mexico using density and porosity measurements, permeability tests, mercury intrusion porosimetry, image-based pore descriptors, and ultrasonic P- and S-wave velocities. At the unit scale averages, total porosity ranges from 31.4% in Tl to 42.9%, but elastic properties and permeability vary widely, showing that porosity alone does not define a unique physical state. Two end-member pore-network tendencies can be recognized: crack-linked, throat-restricted systems and more equant or intergranular systems. At similar porosity, crack-dominated networks are generally less stiff and less permeable, whereas more equant networks show higher permeability and stiffer behavior under dry conditions. Effective-medium models indicate that most samples are consistent with KT aspect ratios of 0.15–0.20 and a critical-porosity range of 40–60%. Overall, porosity defines the first-order elastic trend, whereas pore-network architecture explains much of the remaining hydraulic variability and part of the residual elastic spread.

1. Introduction

Ignimbrites are volcanic deposits produced by explosive eruptions and emplaced by pyroclastic density currents. Their internal texture and pore system begin to develop during deposition and cooling and may later be modified by processes such as welding, devitrification, alteration, and subsequent fracturing or weathering [1,2,3,4]. This origin produces a wide range of pore structures and makes ignimbrites important in geothermal, hydrogeological, and engineering settings, where the arrangement of voids helps control fluid flow and the mechanical response of the load-bearing solid phase [5,6,7,8]. In porous rocks, this mechanical response can be described through the bulk modulus (K), which expresses resistance to volumetric compression [9]. Ultrasonic P- and S-wave velocities (Vp and Vs) are especially useful for investigating these relations because wave propagation is sensitive to porosity, pore geometry, connectivity, microtexture, mineralogy, and stress state [10,11,12].
In volcanic rocks, porosity commonly exerts a first-order control on physical properties, but porosity alone does not uniquely predict elastic or transport behavior because it measures pore volume, not how the pore space is connected and arranged. Rocks with similar porosity may therefore show contrasting Vp, Vs, K, and intrinsic permeability (k) when their pore systems differ in shape, throat size, connectivity, and spatial arrangement [10,13,14,15]. This point is especially important in ignimbrites. Although emplacement and welding are commonly associated with densification and porosity reduction, ignimbrites with comparable total porosity (ϕt) do not necessarily develop the same pore architecture or the same physical response [1,16,17]. Similar porosity values may therefore correspond to different elastic and hydraulic behavior because of differences in pore-scale heterogeneity and network arrangement [15,18,19,20]. Studies of pyroclastic deposits further show that permeability and stiffness can diverge strongly at comparable porosity when pore size distribution, fractures, and connected throat geometry vary across lithofacies [21].
Previous studies have shown that wave velocities, elastic moduli, and intrinsic permeability are strongly influenced by microtexture, fracture density, pore topology, and alteration [10,13,14,22]. Permeability is also controlled by pore structure because fluid transport depends primarily on the size and connectivity of the narrowest flow paths rather than on pore volume alone; fracture-related pathways can further modify transport behavior [15,23,24,25]. Integrated characterization that combines pore-throat distributions, image-based pore descriptors, intrinsic permeability (k), and ultrasonic properties provides a suitable framework for evaluating how physical variability is partitioned between total porosity and pore-network architecture. Recent multi-method studies further indicate that combining porosimetry with complementary microstructural observations helps separate the effect of pore volume from that of connected flow geometry in volcanic rocks [21,26,27]. Laboratory measurements acquired under conditions that minimize pore-fluid effects are particularly useful for this purpose because they allow the response of the rock framework to be evaluated more directly [22].
Rock-physics modeling provides a useful framework for organizing this variability. In effective-medium approaches, the heterogeneous rock is treated as an equivalent continuum whose bulk elastic response depends on the properties of the solid phase, the amount of porosity, and the geometry of the pore space [9,28,29,30,31,32]. Rather than yielding a unique solution for a given porosity, these models define physically admissible bounds or trajectories within which elastic behavior can be evaluated. In this framework, critical porosity (ϕc), the porosity at which the solid phase approaches the loss of effective load-bearing continuity, provides a useful mechanical scale for modifying and interpreting these bounds [33,34,35,36]. Pore geometry is also important because pores with different shapes do not weaken the rock to the same degree at equal porosity. In effective-medium formulations, this influence can be represented through an effective aspect-ratio parameter that captures the average elastic effect of pore shape without implying a unique microstructural solution [9,37,38]. These models are therefore useful not as literal descriptions of the pore space, but as operational tools for testing whether the observed scatter in Vp, Vs, and K can be organized within a restricted elastic domain.
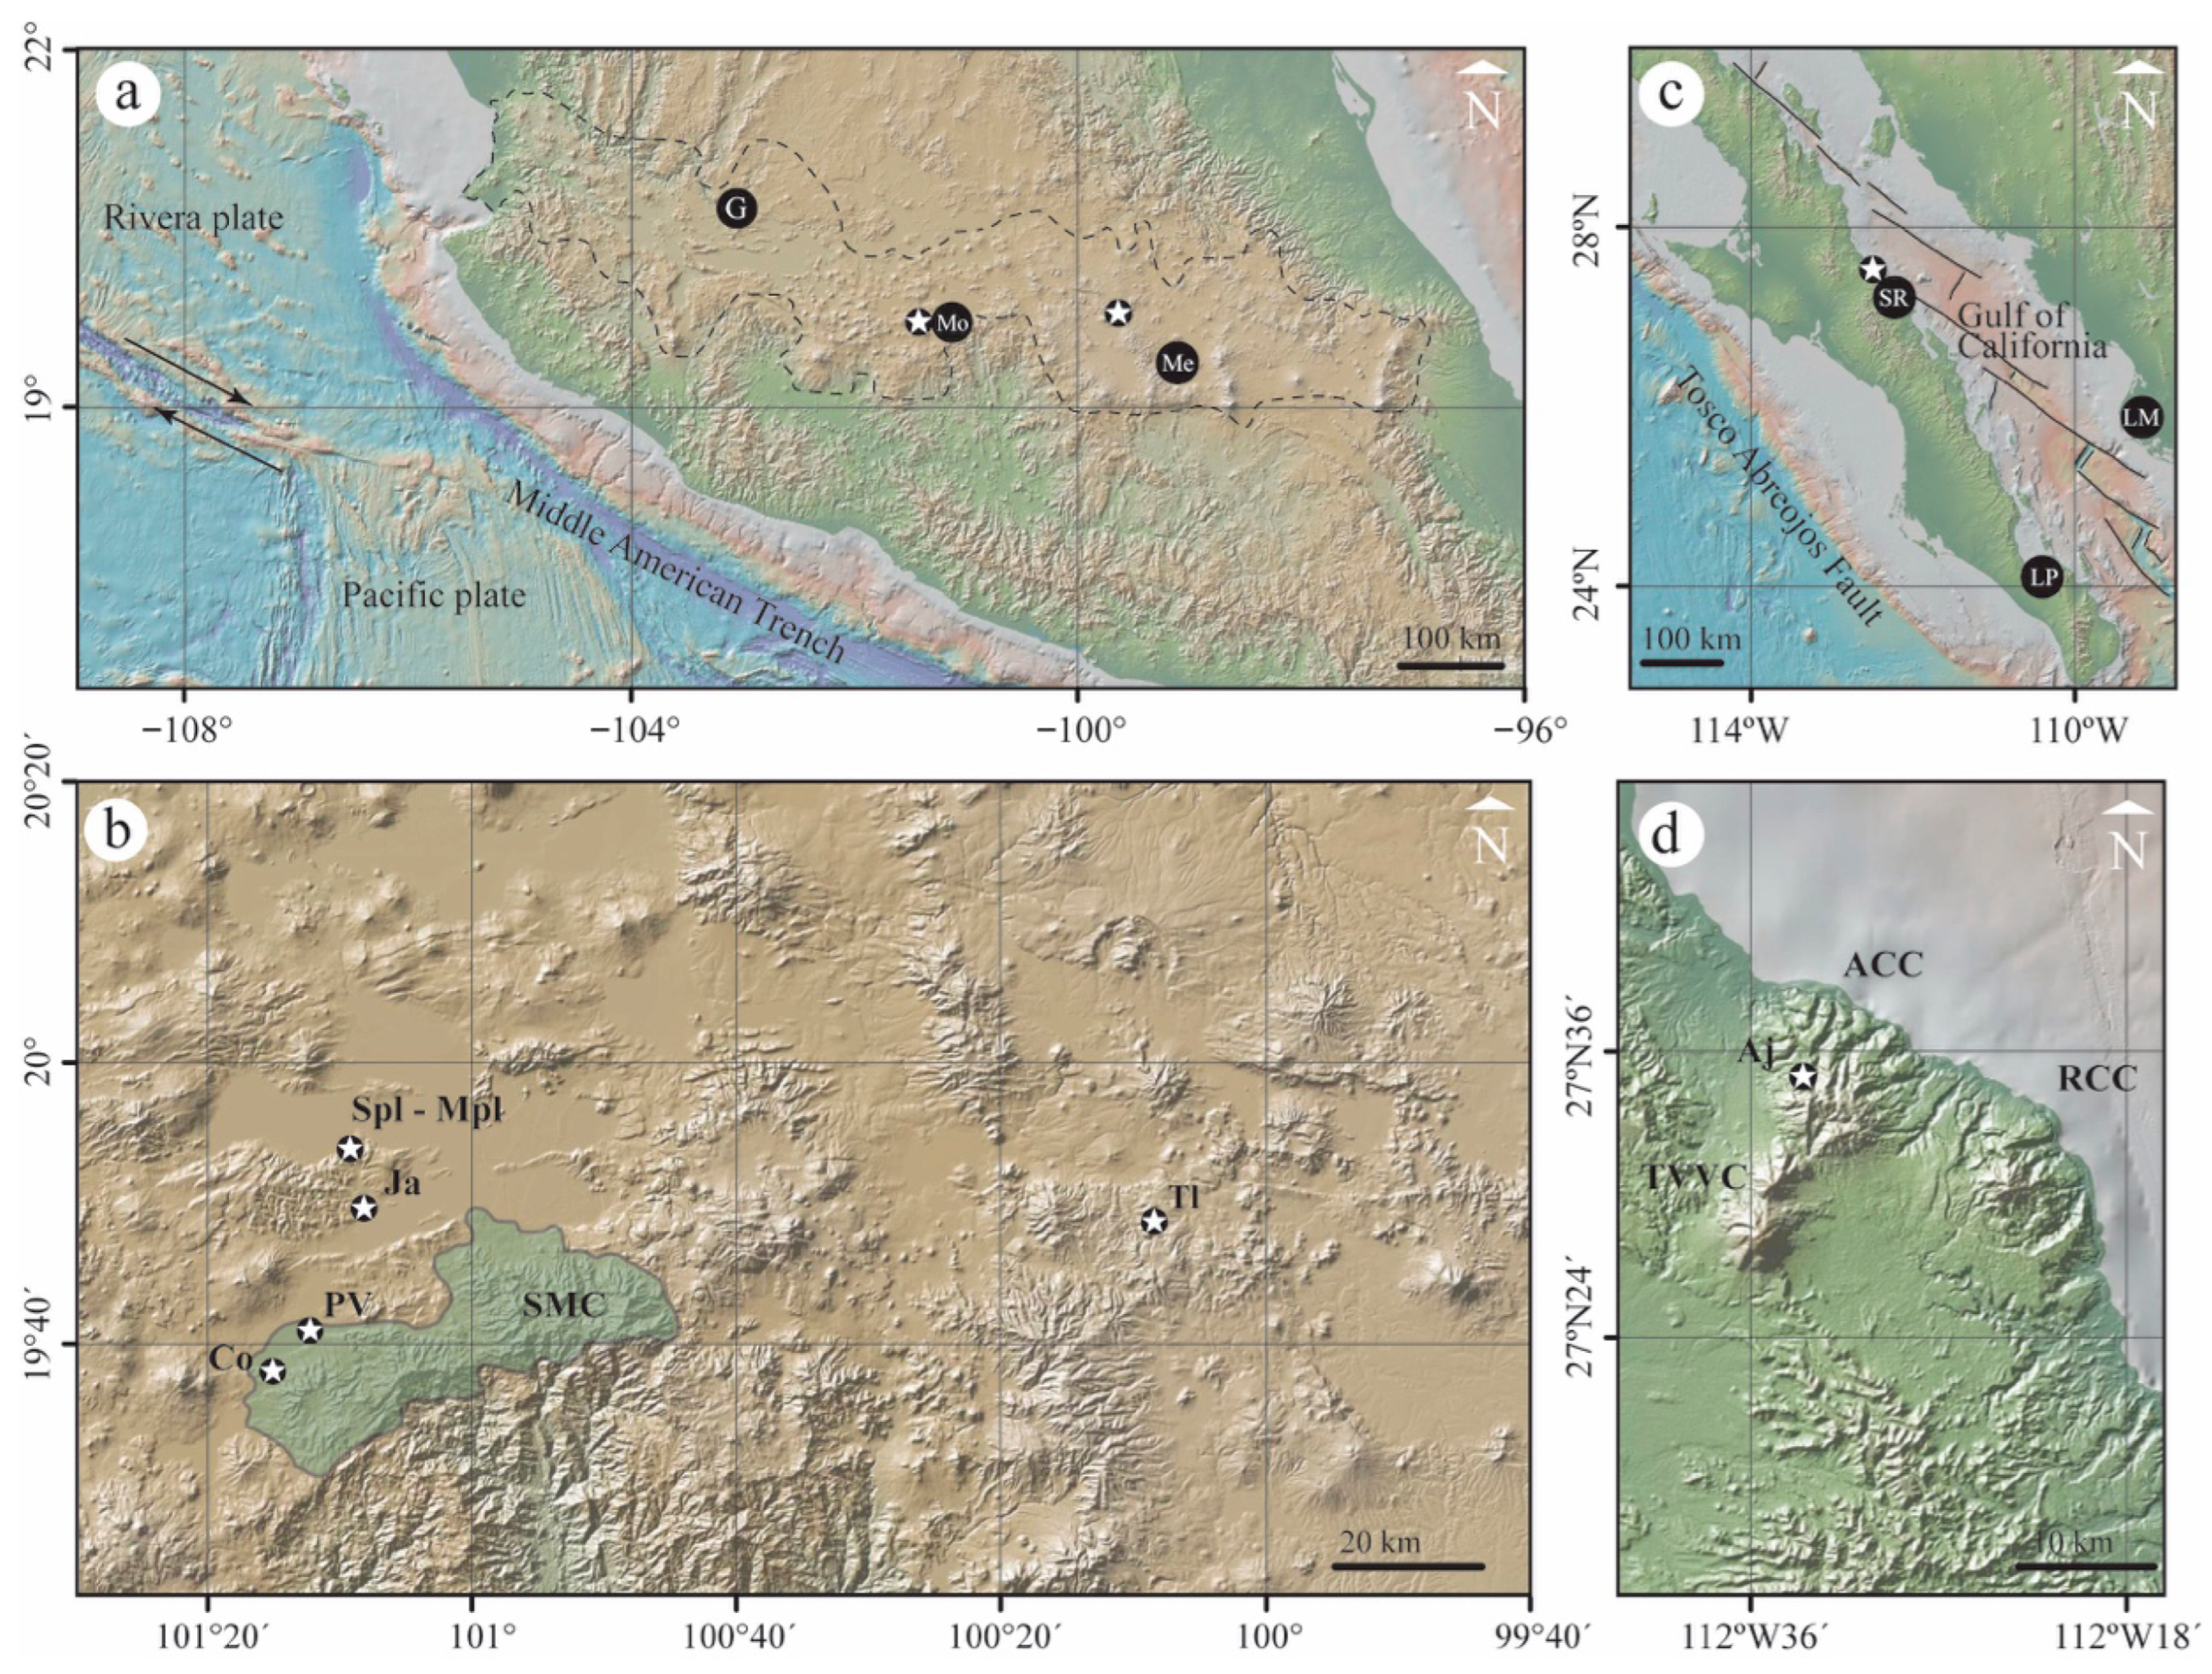
In this study, we investigate seven porous ignimbrite units from Mexico, including deposits from Sierra de Mil Cumbres and the La Escalera, Atécuaro, and Tlalpujahua calderas in Michoacán, central-western Mexico (Figure 1a,b), and the Aguajito area in Baja California Sur, northwestern Mexico (Figure 1c,d) [17,39,40,41,42,43]. All samples (ϕt > 25%) were characterized using grain and bulk density (ρg, ρb), open and total porosity (ϕo, ϕt), intrinsic permeability (k), mercury intrusion porosimetry, image-based pore descriptors, and 1 MHz ultrasonic P- and S-wave velocities (Vp and Vs). The dataset is interpreted using Hashin–Shtrikman bounds and Kuster–Toksöz trajectories, with critical porosity treated as an operational modeling parameter and permeability used as complementary evidence of connectivity and throat restriction. Our aim is to determine whether total porosity defines the main elastic trend in porous ignimbrites and whether the remaining spread in acoustic velocities, bulk modulus, and permeability can be organized within effective-medium constraints as a function of pore-network architecture.

2. Materials and Methods

This section describes the experimental procedures and effective-medium scheme used in this study. The workflow includes physical characterization, mineralogical analysis, ultrasonic testing, and rock-physics modeling. Laboratory tests followed ASTM and ISRM standards. All cylindrical rock specimens were cored while preserving the original orientation of the samples in outcrop, such that the top and base of each specimen matched the original upper and lower sides of the rock as observed in the field. They were prepared according to ASTM D4543-19 [44], with a diameter of 25.4 mm and a length of 50.8 mm, resulting in a length-to-diameter ratio of 2, and were verified using standardized tools, such as the Specimen Flatness Gauge. This standardized geometry allows comparison between units while preserving the original field orientation of each specimen. All laboratory tests were performed on dry specimens, allowing comparison of the structural response of the rock skeleton under a common reference state. Drying was carried out in a conventional oven at 60 °C for 48 h. To ensure complete drying, the specimens were reweighed until successive mass measurements differed by no more than 0.1%. This low-temperature protocol is not expected to cause major changes in the crystal structure of common clay minerals, as more substantial transformations occur at higher temperatures, and hydration–dehydration is largely reversible below ~100 °C [45,46]. Comparable drying conditions are commonly used in petrophysical studies of volcanic rocks [4,47].
To evaluate whether the principal petrophysical variables differed across ignimbrite units, inter-unit differences were screened using Kruskal–Wallis omnibus tests. Statistical significance was evaluated at p < 0.05. Test statistics are reported in Supplementary Information.

2.1. Physical Properties, Pore Structure, and Intrinsic Permeability

Textural characteristics at the sample scale were analyzed from 2D images acquired with a commercial flatbed scanner (HP Scanjet 300) at 600 dpi on flat cut surfaces prepared from representative rock blocks. Image analysis was carried out in ImageJ V.1.0 (https://imagej.net) to segment lithic fragments and extract geometric descriptors, including projected area, circularity, and Feret diameter (Df). A coefficient of uniformity (Cu) was also calculated from the Feret-diameter data to describe the spread of lithic-size distributions. This method is limited by image resolution and therefore only resolves fragments larger than 0.1 mm.
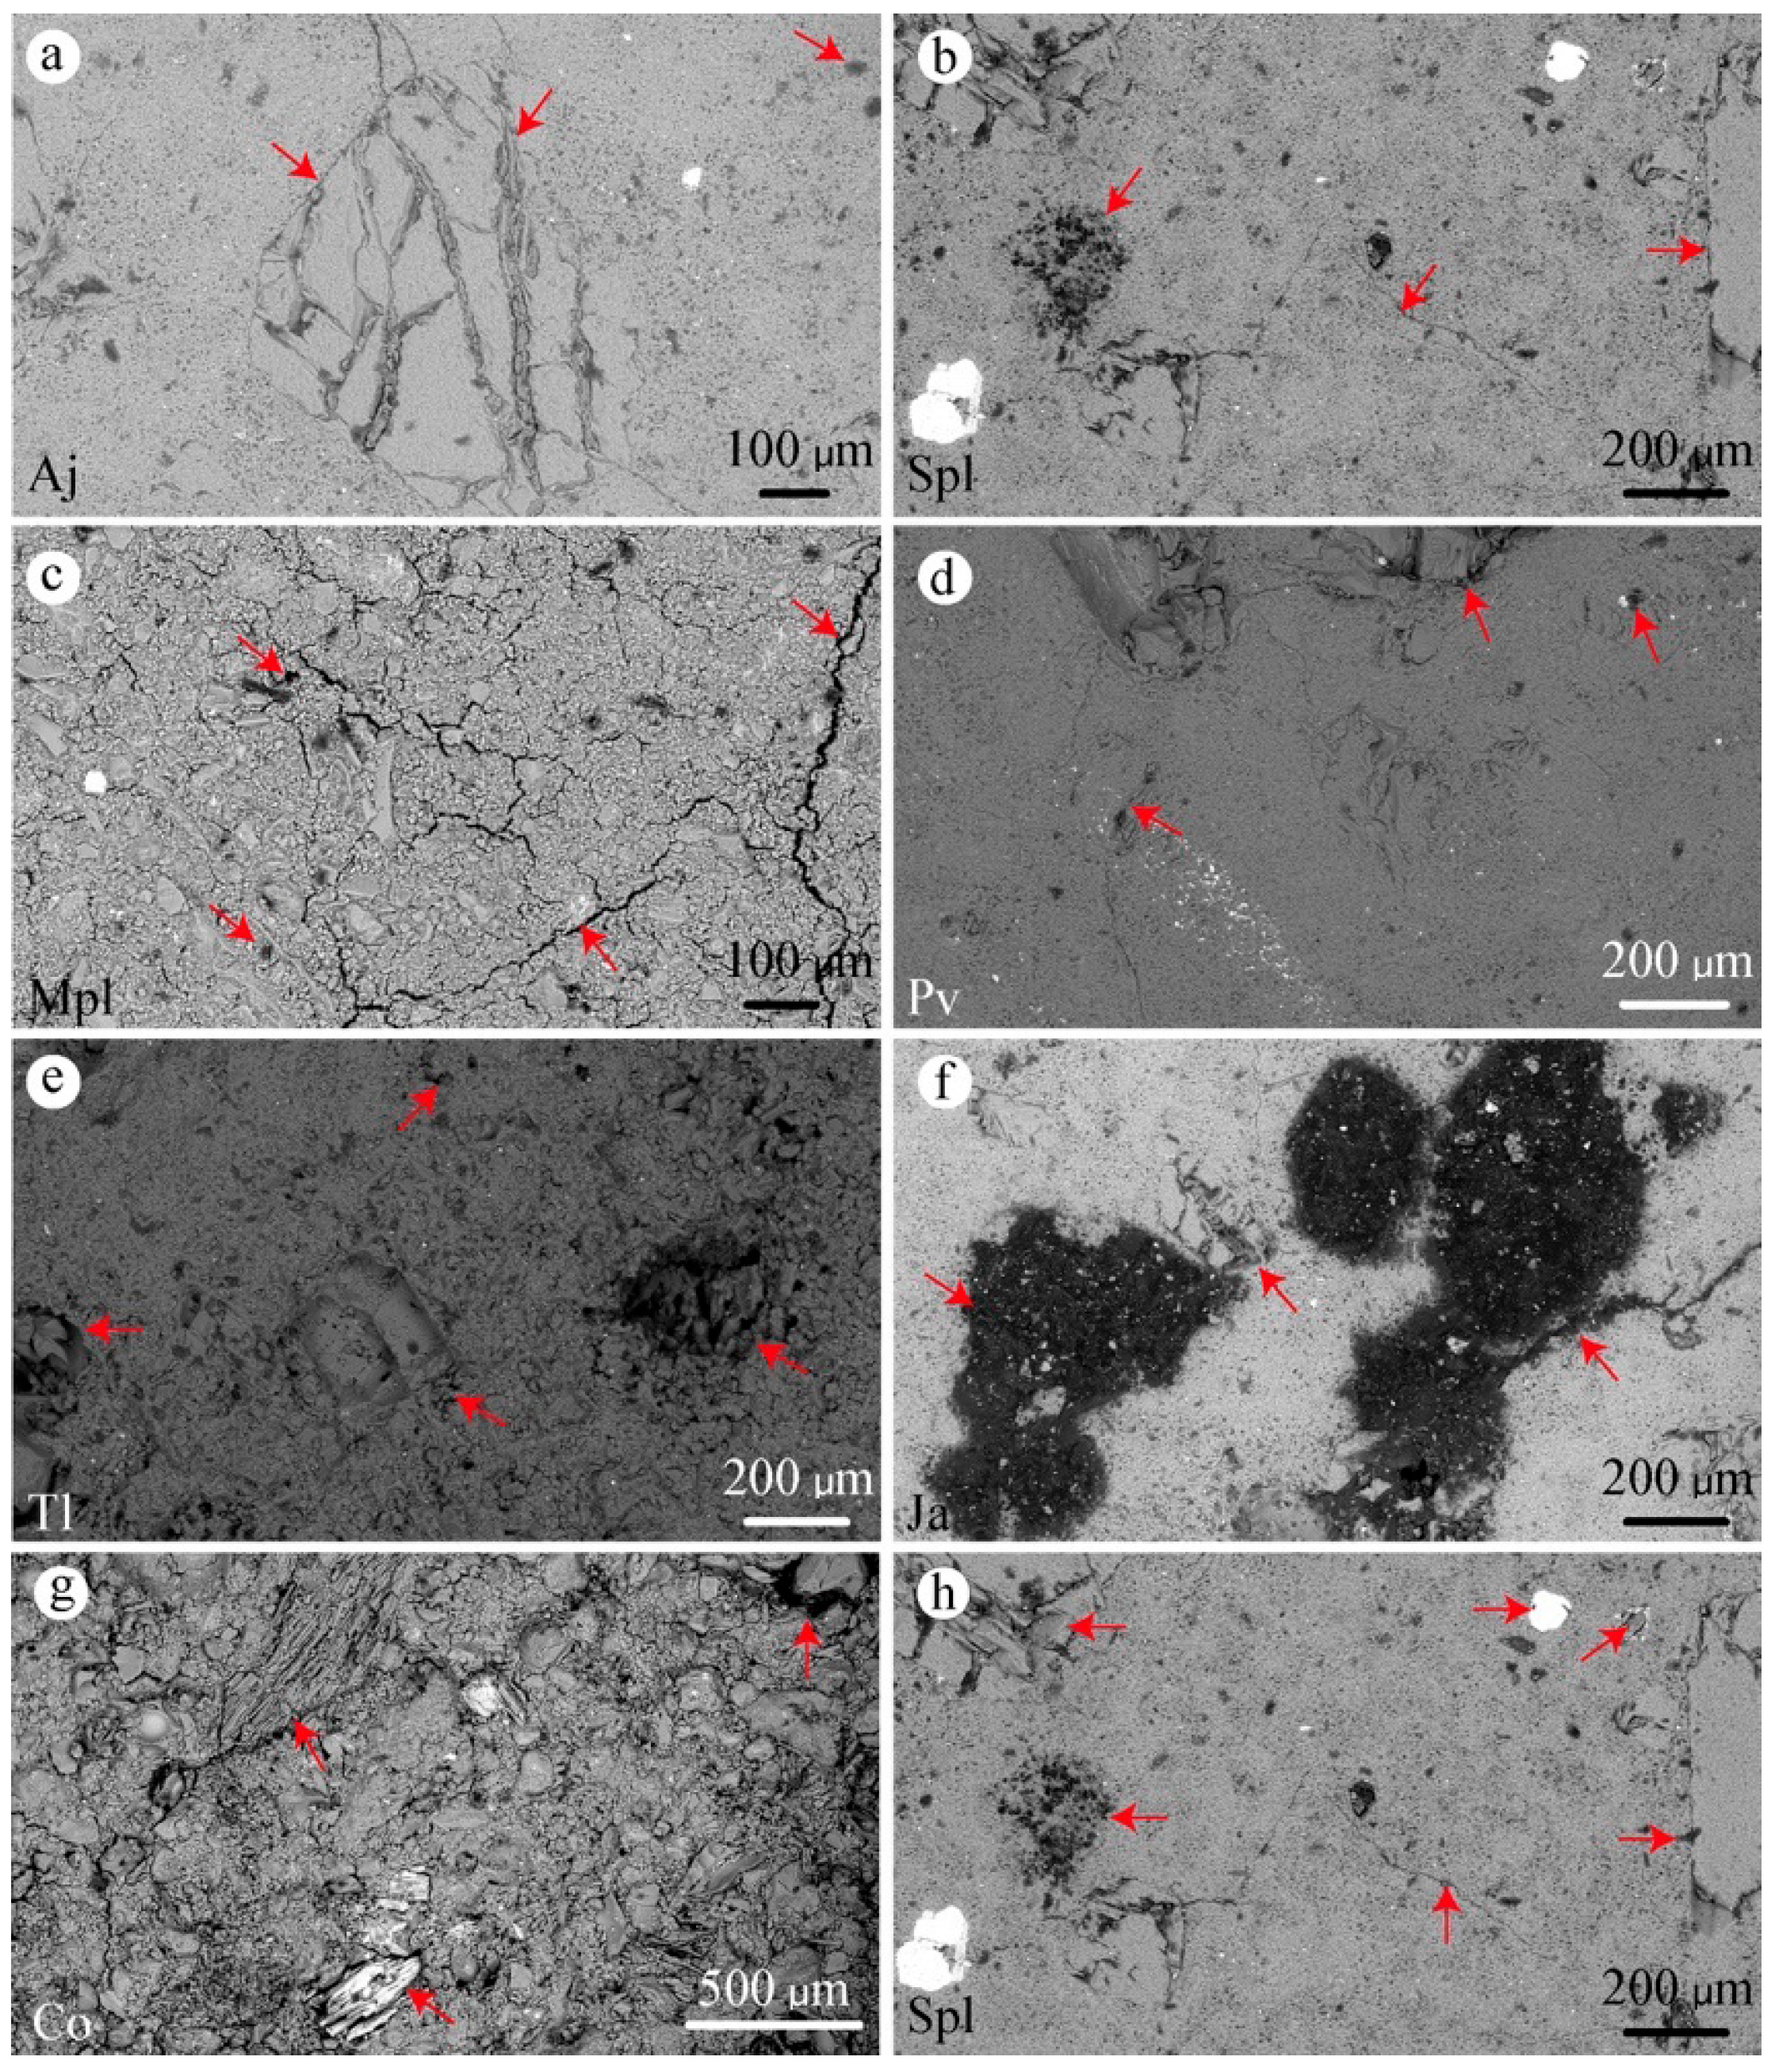
Microtextural observations were performed on the upper and lower end faces of the cylindrical specimens and complemented with petrographic images. Back-scattered electron (BSE) images were acquired in high vacuum using a JSM-IT300, JEOL Ltd., Akishima, Tokyo, Japan, scanning electron microscope operated at 20 kV and a working distance of 10 mm–12 mm. No conductive coating was applied; charging was minimized by adjusting beam current and working distance. Images were adjusted only for brightness and contrast, and all scale bars were calibrated. SEM observations were used to identify pore–matrix relationships and the occurrence of crack-like pore connectivity.
Pore morphology was examined from SEM and petrographic images acquired at 100×–500× using ImageJ. The image set was acquired to document representative microtextures rather than to generate pore-population statistics. Pore morphology is described only in terms of apparent pore habit in section (equant, elongated, or crack-like) and pore continuity across shard and lithic boundaries. These observations are used as qualitative descriptors of representative microtextures and not as quantitative pore-shape parameters.
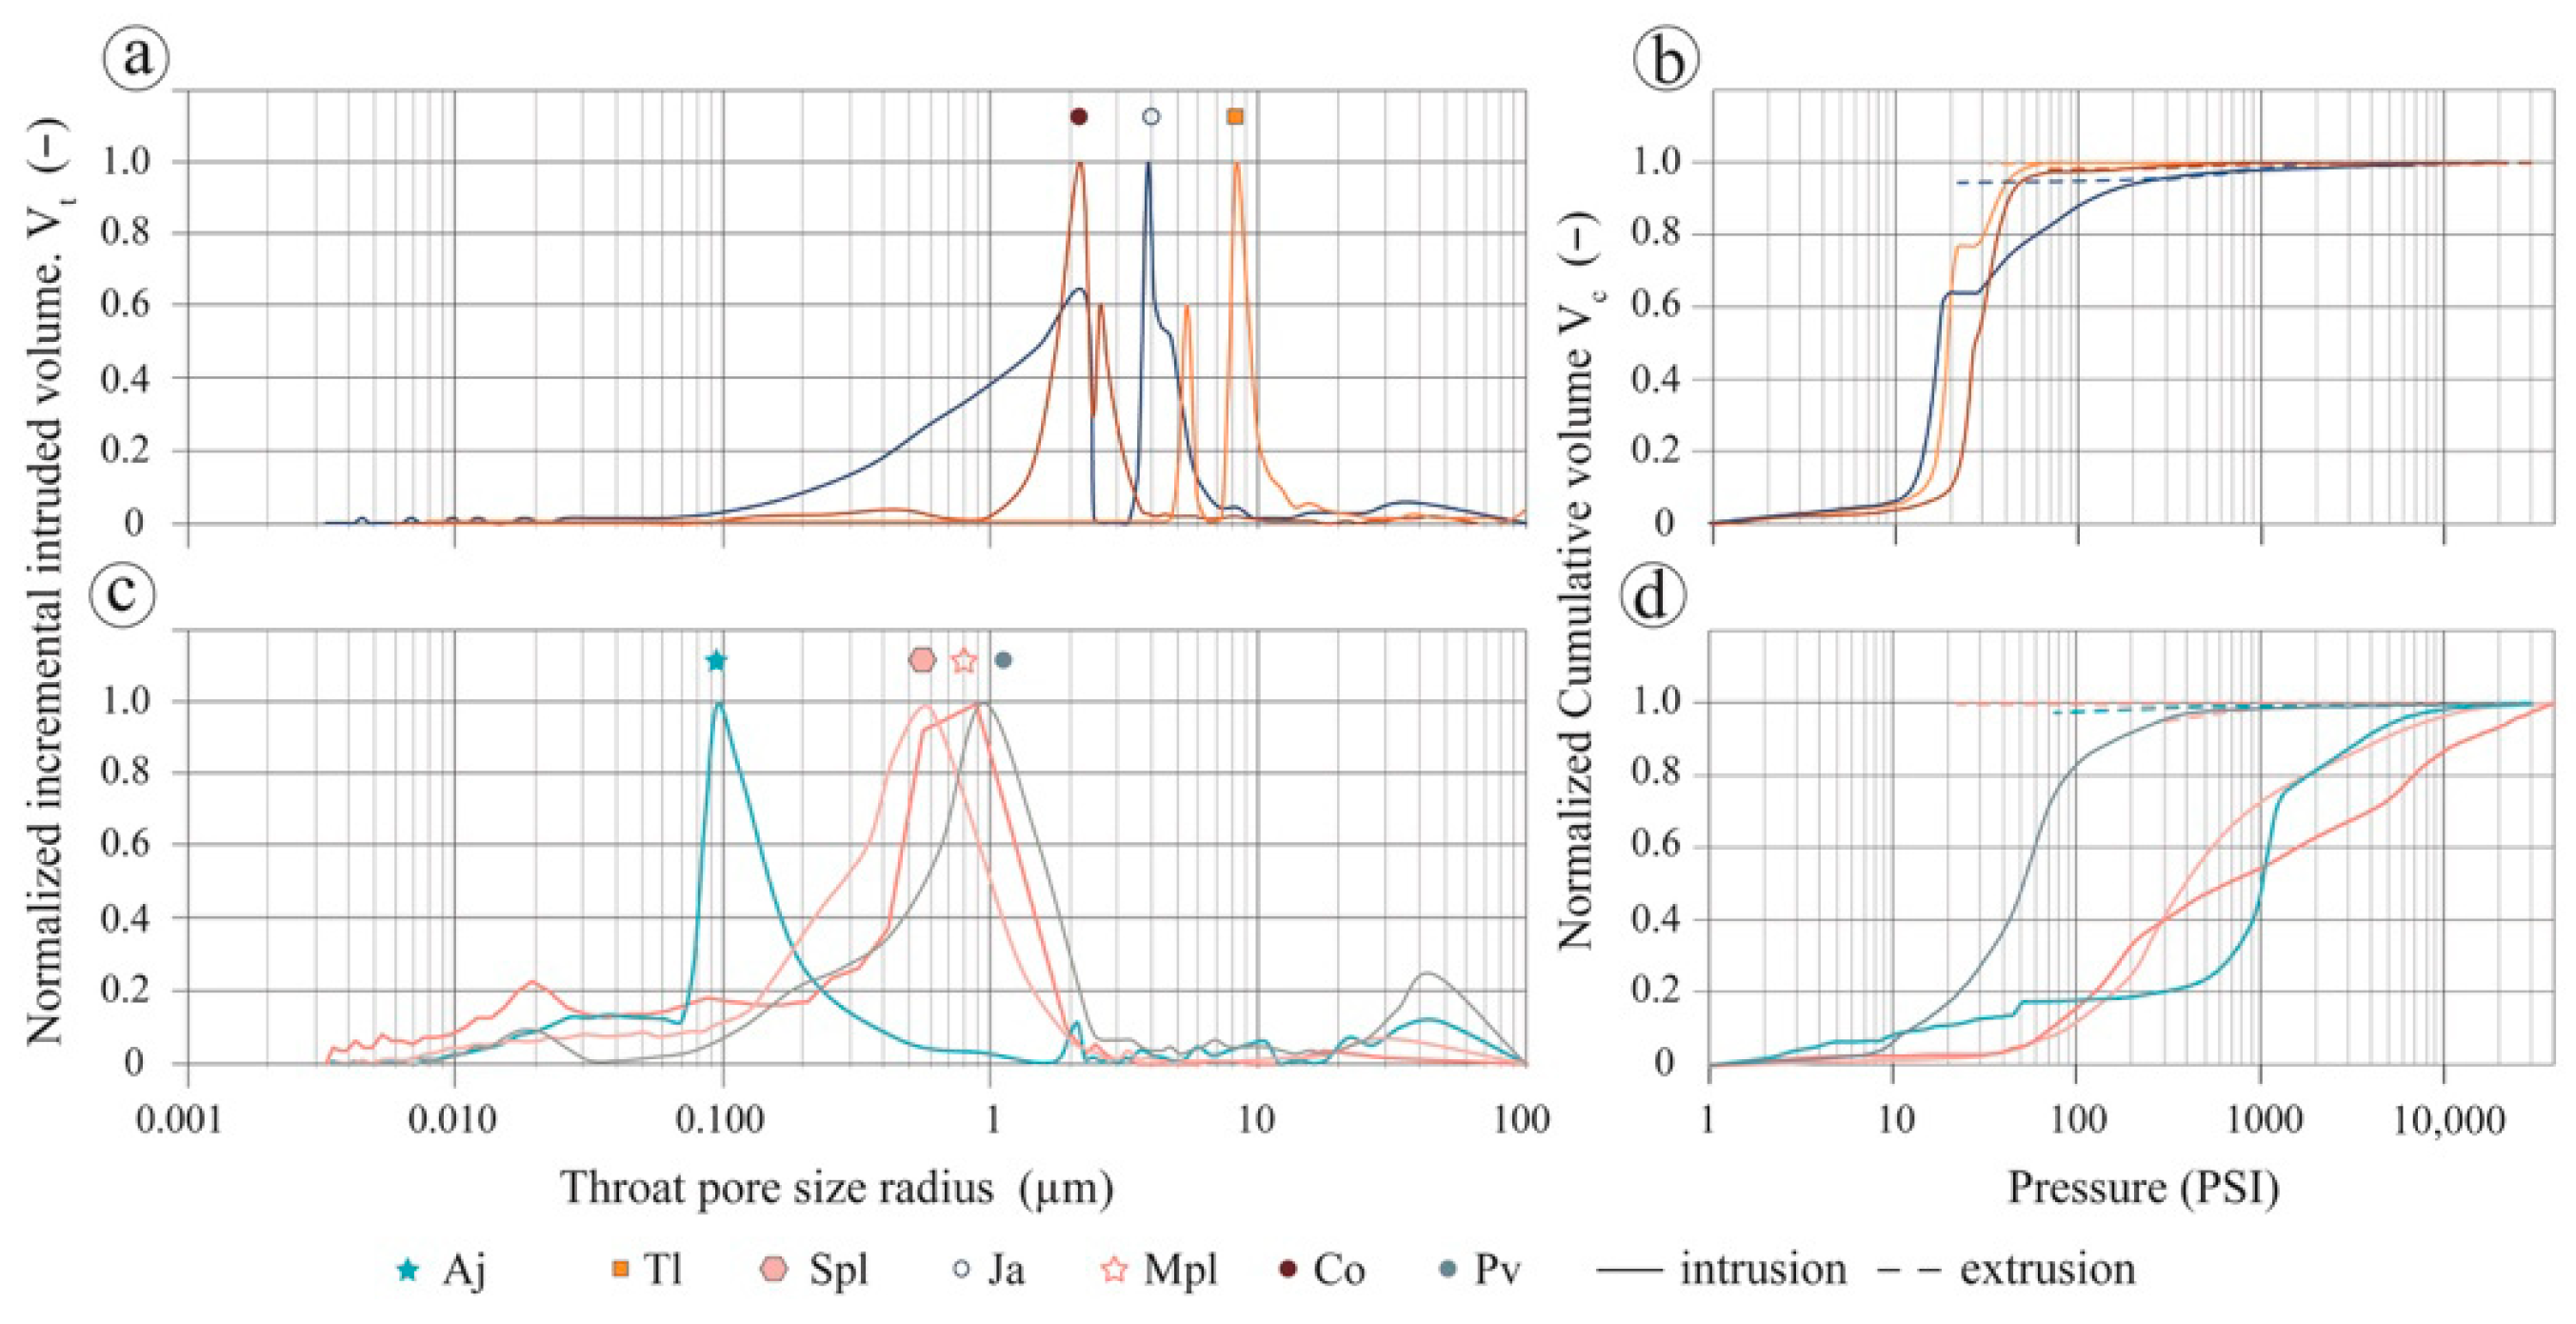
Mercury intrusion porosimetry (MIP) was used to determine the pore throat diameter distribution of the samples. In this experiment, the intrusion pressure on the equipment was gradually increased, and the corresponding volume of mercury injected into the pores of the sample was recorded. Each increase in volume and pressure was associated with a particular pore throat diameter, based on the model of parallel cylindrical pores. The mercury porosimeter Pore Master 33, Quantachrome Instruments, Boynton Beach, FL, USA, was used, covering a pore throat diameter range of 0.0032 μm to 100 μm. Throughout this study, rthroat refers to the mean equivalent pore-throat radius derived from the intrusion data.
To quantify the breadth of the mercury intrusion distribution, the intrusion width index (W) was calculated based on the normalized cumulative mercury intrusion curve. This index was obtained from the logarithmic pressure interval between the 16th and 84th percentiles of the cumulative intrusion, thereby capturing the central dispersion of the intrusion process while reducing sensitivity to the extremes of the curve. Lower values of W indicate narrower and more uniform access throat distributions, while higher values of W indicate a broader and more heterogeneous intrusion behavior. This descriptor is consistent with the classical lognormal treatment of mercury porosimetry data [48,49]. The mercury intrusion-extrusion curves, particularly the hysteresis, which could be related to pore shape (spheres, plates, needles, and rods) [50], were analyzed based on network models in which both the ink-bottle model and percolation effects were considered. Specifically, the ink-bottle model states that intrusion is controlled by the size and shape of the throat and extrusion by the size of the pore [51]. These measurements provide comparative constraints on access-throat structure, although MIP is an invasive technique and the derived throat-size descriptors should not be interpreted as exact pore sizes.
Grain density (ρg) was measured with a helium (ultra-high purity) pycnometer. Due to the heterogeneity of the rock samples, 1 kg of sample was pulverized (<4 mm) and a representative sample was obtained using the quartering method. The sample was uniformly spread and divided into four equal parts. Two diagonally opposite quarters were discarded, and the remaining fractions were recombined and homogenized. This procedure was repeated until the target sample mass was reached, allowing volume reduction while preserving the original grain-size distribution and material characteristics. The solid volume was determined using the principle of fluid displacement, followed by the application of gas expansion, as described by Boyle’s Law, under the standard ASTM D5550-14 [52].
Bulk density (ρb) was determined following ASTM D7263-21 [53] from the mass and bulk volume of each specimen, the latter obtained by Archimedes weighing in distilled water at 25 °C after vacuum saturation, thus corresponding to bulk density. In addition, dimensions and mass were independently measured to verify that no significant variation was introduced by the procedure.
Open porosity (ϕo) and total porosity (ϕt) were measured by vacuum water saturation following the recommended ISRM procedure [54]. ϕo, corresponding to the fluid-accessible pore volume, was calculated from the saturated weight, dry weight, and submerged weight of each specimen. ϕt was calculated from grain density (ρg) and bulk density (ρb) as the ratio between void volume and bulk volume. Connectivity was estimated as the ratio of open to total porosity (ϕot).
Intrinsic permeability (k) was determined along the specimen axis using a Vinci Technologies GasPerm Prod AP-123 VINCI Technologies, Nanterre, France, nitrogen permeameter following ASTM D4525-13 [55]. Measurements were performed under steady-state conditions by injecting nitrogen through confined cylindrical specimens at an effective confining pressure of 2.4 MPa. Apparent gas permeability (kg) was measured at five imposed differential pressures (ΔP) to assess possible gas-slippage (Klinkenberg) effects from the relationship between kg and reciprocal mean pore pressure (1/Pm). k was automatically calculated by the instrument software and independently verified by plotting kg against 1/Pm and checking the extrapolated intercept at infinite mean pore pressure. Where a linear dependence was observed, k was obtained from this intercept; otherwise, measured kg values were taken as representative of k. Low pressure differences (ΔP < 41.3 kPa) were used to maintain Darcy-flow conditions. All measurements were within the Darcy-flow range indicated by the instrument software, and this was independently confirmed by evaluating the relationship between 1/kg and volumetric flow rate and by verifying that kg remained invariant with ΔP. Therefore, no Forchheimer correction was applied. These measurements are interpreted here as reference values at low effective confining pressure and are not treated as direct proxies for in situ permeability.
Exploratory linear regressions were used as comparative tests. Porosity models were fitted for K and Vp as a function of ϕt and for log10(k) as a function of ϕo. An augmented permeability model additionally included the intrusion width index W. Model coefficients were estimated by ordinary least squares. Robustness was assessed using leave-one-unit-out (LOUO) cross-validation, in which one ignimbrite unit was omitted in each iteration, the model was fitted to the remaining units, and the pooled predictions for the omitted units were used to calculate the LOUO RMSE and LOUO R2.

2.2. Mineralogical Composition

X-ray diffraction (XRD) was used to identify the crystalline mineral phases and to obtain semi-quantitative phase proportions. For each sample, a powdered subsample was prepared and analyzed with a Shimadzu XRD-6000, Shimadzu Corporation, Kyoto, Japan, automatic diffractometer equipped with a vertical goniometer, a Cu radiation tube, and a Ni filter. Diffractograms were collected over a 2θ range of 5–70°, using a step size of 0.02°. The resulting patterns were processed with Match! Software V. 1.53 [56], and phase identification was based on peak-position matching and overall pattern agreement with reference entries in the diffraction database. The semi-quantitative phase proportions derived represent the crystalline fraction of each sample and were used as baseline mineralogical constraints for subsequent interpretation steps.

2.3. Ultrasonic Velocity Measurements and Signal Processing

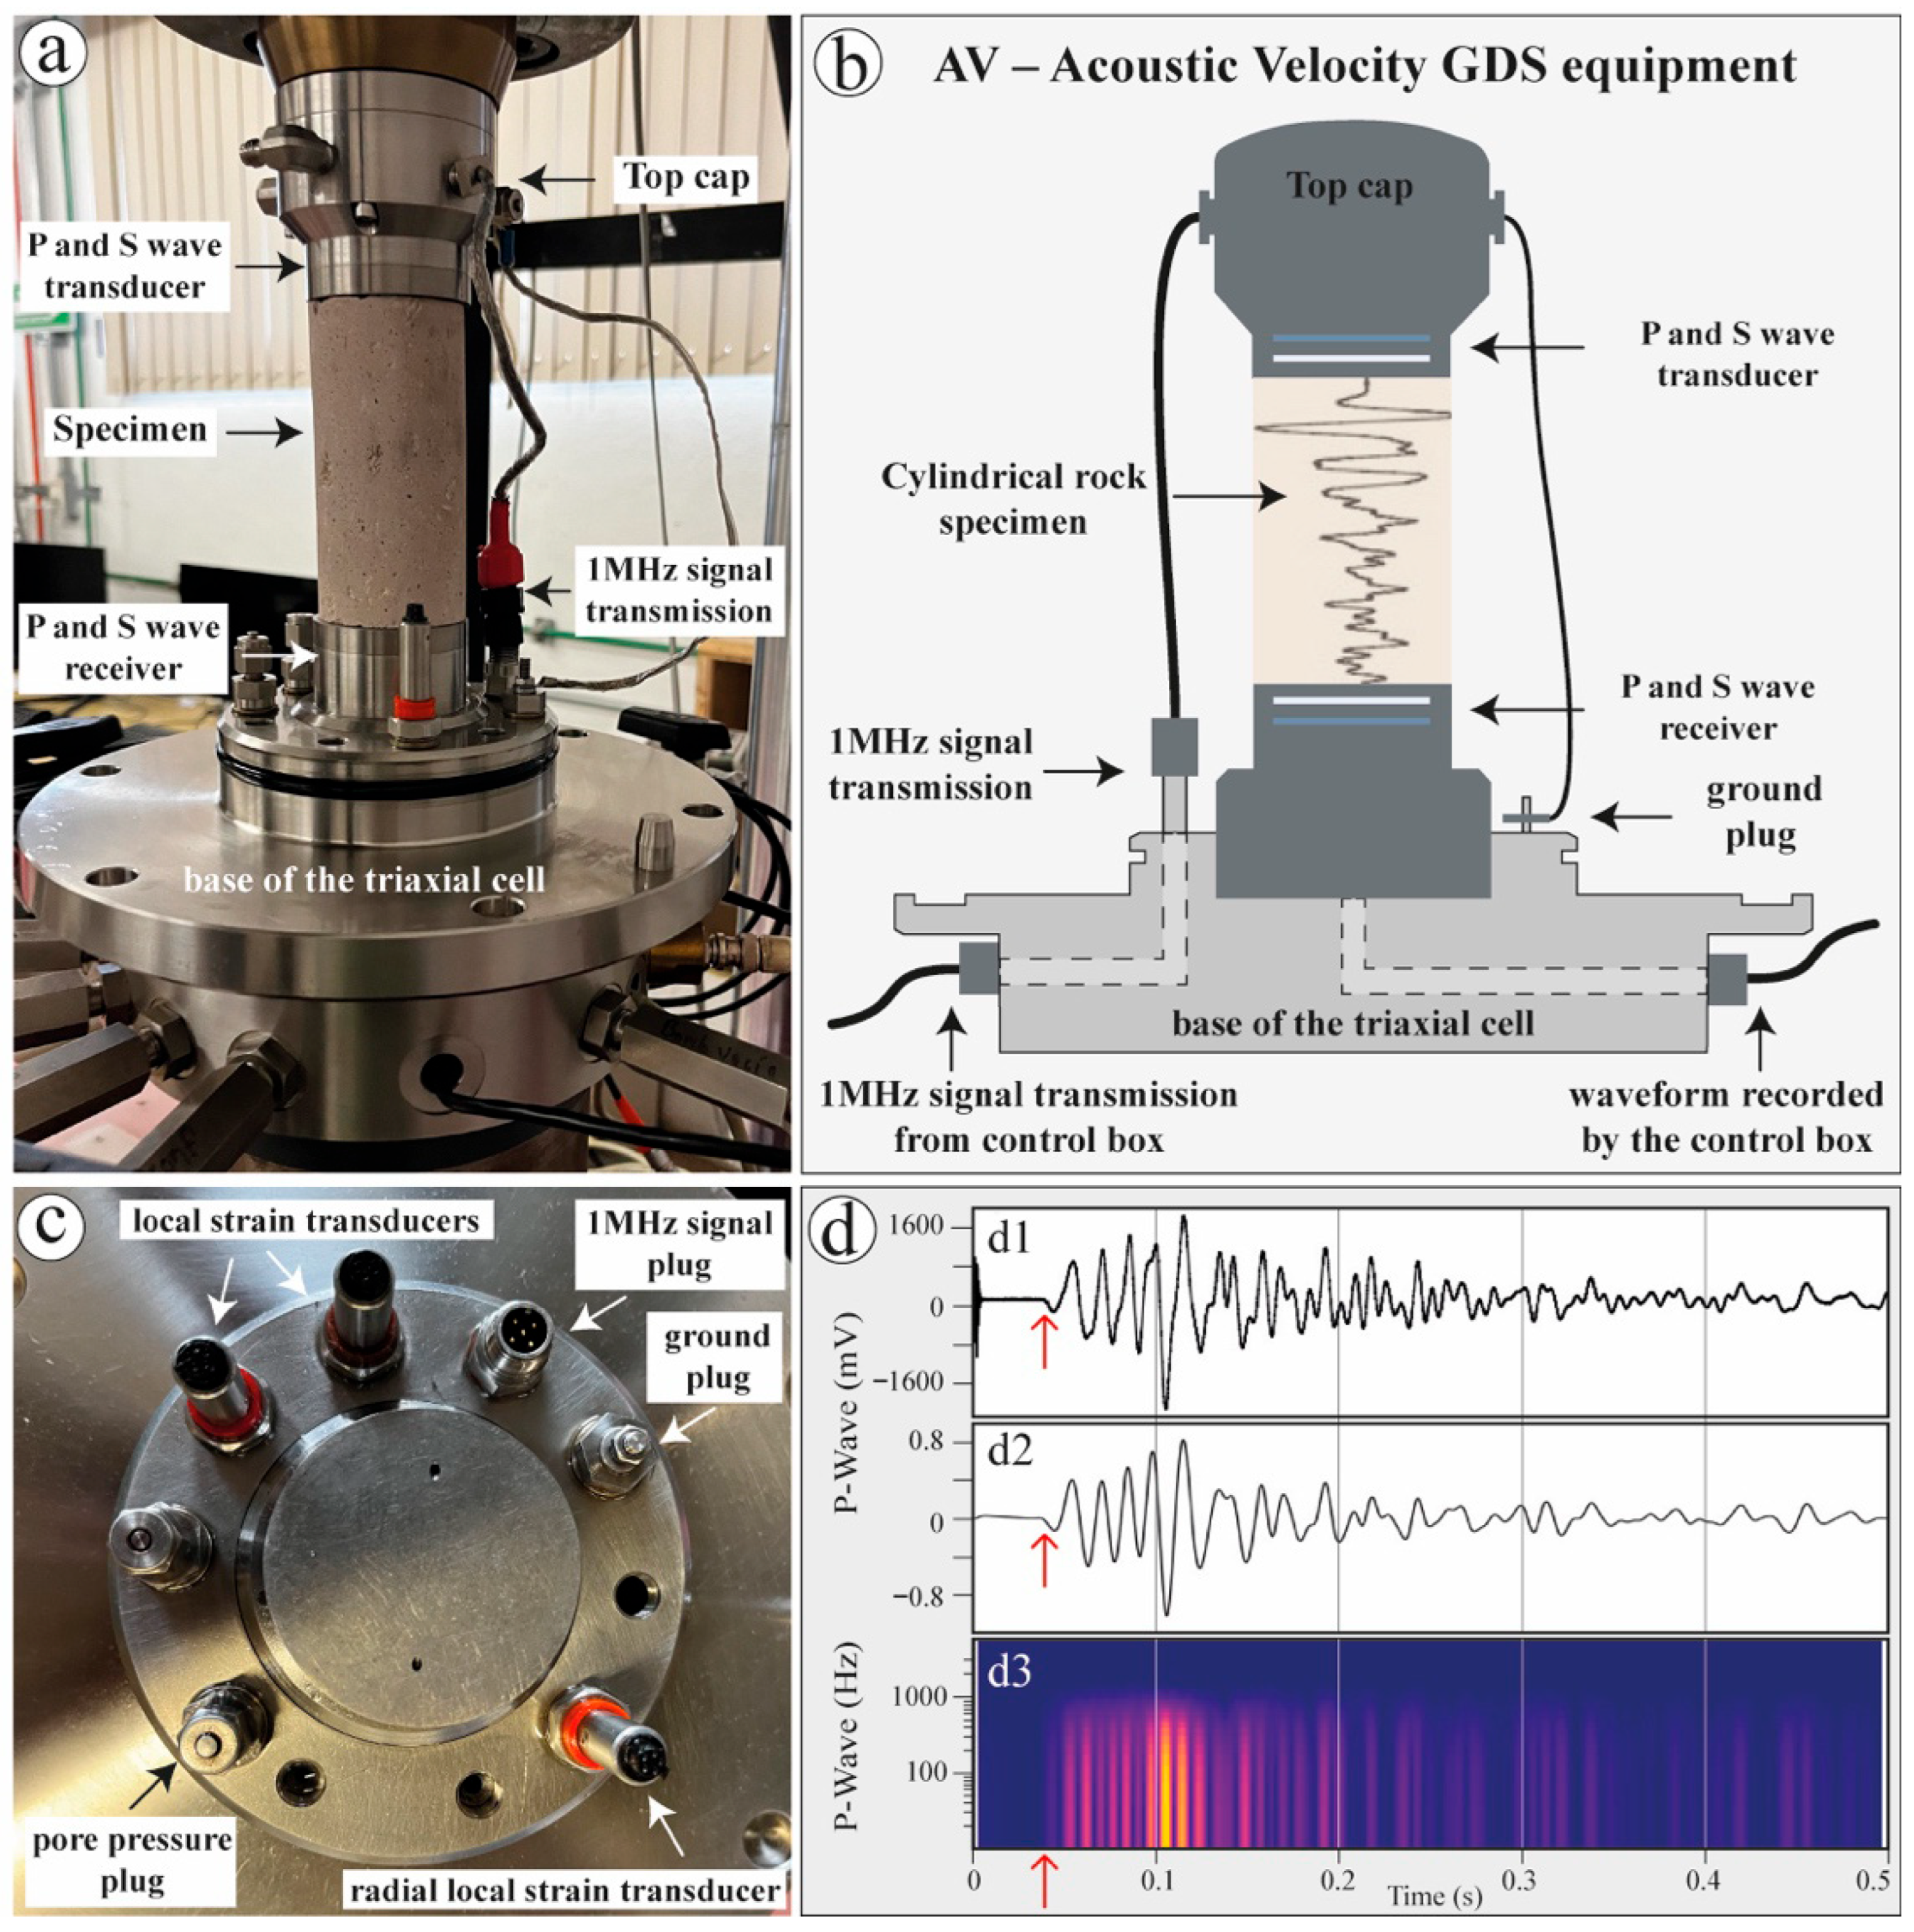
Compression (Vp) and shear (Vs) wave velocities were measured using an AV–Ultrasonic Velocity system mounted on a GDS 250 kN infinite-stiffness load frame to ensure mechanical stability during testing (Figure 2). A pulse with a nominal center frequency of 1 MHz was transmitted along the specimen axis using transducers embedded in the top cap and pedestal (Figure 2a–c). The excitation pulse was generated by the control unit at 250 V, and waveforms were recorded with 16-bit digitization. Measured travel times were corrected for (i) delays introduced by the emission and acquisition system and cabling, and (ii) small timing effects related to the mechanical compliance of the top cap and pedestal. Ten repeated measurements were collected for each specimen to verify waveform repeatability and stable transducer–specimen coupling. Measurements were performed under a very small seating load (0.1 kN), applied only to maintain stable contact between the transducers and the specimen and not to impose meaningful mechanical loading on the sample. System calibration was carried out in two stages. First, the transducers were aligned tip-to-tip under the same minimal contact load used during testing to stabilize coupling conditions. Second, repeated measurements were performed on cylindrical aluminum standards of known geometry to verify the timing corrections and overall system response. This procedure reduced errors related to signal transmission and transducer–specimen coupling.
First-arrival picking was performed semi-automatically using a Python (V. 3.14.4) script (Figure 2(d1)–(d3)). The workflow included three main steps. (1) Data import and trimming. The AV system exported each waveform using a 1.5 s acquisition window. This long record length reflects the software acquisition window. For processing and plotting, traces were trimmed to a fixed 0.5 s window to shorten the record, improve visualization of the early part of the waveform, and retain enough post-arrival signal for inspection. The actual first arrivals occurred within the first few tens of microseconds of the trace (~15–30 μs). (2) Filtering and normalization. Traces were band-pass filtered (10–1000 kHz) to remove low-frequency instrument noise and retain the dominant frequency content of the recorded waveforms and were then amplitude-normalized to improve comparison among tests. The same filter parameters were applied to all specimens, and all picks were checked by visual inspection to confirm that filtering did not shift the first-arrival time. (3) Time-frequency analysis and arrival identification. Spectrograms were computed to track the temporal distribution of signal energy (Figure 2(d3)). The first arrival was picked from the onset of the main energy concentration relative to the pre-arrival baseline, providing a reproducible criterion for scattered and attenuated signals.
After the first-arrival times were identified, Vp and Vs were calculated using Equations (1) and (2). An isotropic-equivalent dynamic bulk modulus (K) was calculated from the axial ultrasonic velocities using Equation (3). Dynamic shear modulus (G) and dynamic Poisson’s ratio (ν) were calculated using Equations (4) and (5), respectively. Under this approximation, K is used here as a specimen-scale comparative descriptor. For brevity, it is referred to hereafter as bulk modulus.
V p = L T p
where Vp, P-wave velocity; Tp, corrected P-wave travel time (measured time minus correction); and L, specimen length.
V s = L T s
where Vs, S-wave velocity; Ts, corrected S-wave-travel time (measured time minus correction); and L, specimen length.
K = ρ b ( V p 2 4 3 V s 2 )
where K, bulk modulus; ρb, bulk density; Vp, P-wave velocity; and Vs, S-wave Velocity.
G = ρ b V s 2
where G, shear modulus; ρb, bulk density; and Vs, S-wave velocity.
ν = V p 2 2 V s 2 2 ( V p 2 V s 2 )
where ν, dynamic Poisson’s ratio; Vp, P-wave velocity; and Vs, S-wave Velocity.

2.4. Effective-Medium Modeling

To interpret the frame elastic behavior of the ignimbrites, we applied a rock-physics workflow based on effective-medium theory. Here, the Kuster–Toksöz (KT) model and porosity rescaling by critical porosity (ϕc) are used as bounding and heuristic approaches to constrain the admissible range of frame elastic behavior, rather than to recover a unique pore geometry. All analyses were performed under dry conditions to isolate the mechanical contribution of the solid skeleton and pore geometry, minimizing fluid-related effects that may obscure stiffness transitions, particularly near ϕc [22]. Accordingly, the effective-medium analysis is used here as a comparative dry-frame framework, not as a direct proxy for fluid-saturated in situ behavior.

2.4.1. Effective Solid-Reference Properties

Semi-quantitative XRD phase proportions were used to define the effective properties of the solid reference employed in the rock-physics calculations. Because density is a volumetrically additive property, the solid-reference density (ρm) was calculated as a linear volume-fraction average and compared with the measured grain density (ρg) as an internal check on the phase-proportion estimates. In contrast, the bulk and shear moduli of the solid reference were calculated using the Voigt and Reuss bounds (Equations (6) and (7)), and the Voigt–Reuss–Hill (VRH) average was adopted as the central reference for the main model trajectories (Equation (8)). For each identified mineral phase i, grain density (ρi), bulk modulus (Ki), and shear modulus (μi) were assigned using published tabulations [9]. Because the XRD analysis constrains only the crystalline fraction and does not explicitly quantify the amorphous or glassy component, the resulting ρm, Km, and μm values are treated here as effective solid-reference properties. These values were used as input for the subsequent effective-medium calculations. Because the amorphous/glassy component was not quantified explicitly, sensitivity tests using alternative effective-solid scenarios are reported in the Supplementary Information.
M V = i = 1 N f i M i
where MV is the Voigt average of the mineral mixture, fi is the volume fraction of phase i obtained from XRD analyses, and Mi denotes the density or elastic modulus of phase i taken from published tabulations [9].
1 M R = i = 1 N f i M i
where MR is the Reuss average of the mineral mixture, fi is the volume fraction of phase i obtained from XRD analyses, and Mi denotes the density or elastic modulus of phase i taken from published tabulations [9].

2.4.2. Effective-Medium Bounds Analysis

Using the solid matrix properties (ρm, Km, μm), a single reference matrix was defined as the arithmetic mean of the specimen-specific matrix properties obtained with the density-calibrated mixing scheme described above. In this context, the Voigt and Reuss schemes were further employed to define the upper and lower bounds of the elastic response of the porous composite medium. The Voigt–Reuss–Hill bound (Equation (8)) was then obtained as the arithmetic average of these two limits [9,14].
M V R H = M V + M R 2
where MVRH is the Voigt–Reuss–Hill bound, MV is the Voigt bound, and MR is the Reuss bound.
Hashin–Shtrikman (HS±) bounds were subsequently computed to define theoretical upper (HS+) and lower (HS) limits for the effective bulk modulus of a two-phase composite medium (solid matrix and pores) (Equation (9)) [9,28]. These bounds account for phase distribution effects and provide physically constrained envelopes for the elastic response of porous materials.
K H S ± = K 1 + f 2 ( K 2 K 1 ) 1 + f 1 ( K 1 4 3   μ 1 ) 1  
where KHS± is the bulk modulus calculated with Hashin–Shtrikman, K1 is the bulk modulus of material one, K2 is the bulk modulus of material two, f1 is the volume fraction of material one, f2 is the volume fraction of material two, and μ1 is the shear modulus of material one.

2.4.3. Pore-Geometry Modeling

To explicitly evaluate the influence of pore geometry on elastic behavior, the Kuster–Toksöz (KT) effective-medium formulation was applied (Equation (10)) [29,30,57]. In this model, pores are represented as spheroidal inclusions embedded in an elastic background medium, and pore shape is parameterized through an effective aspect ratio (ARKT). ARKT was varied parametrically to evaluate the sensitivity of the model to pore-geometry assumptions and to generate predicted bulk modulus–porosity relationships (K–ϕt curves). These KT trajectories were compared with the experimental dataset and interpreted together with the observed pore-network characteristics. ARKT is therefore used here as an effective modeling parameter, not as a direct geometrical descriptor of individual pores. Its sensitivity to alternative effective solid scenarios is reported in Supplementary Information.
( K K T * K m ) ( K m + 4 3 μ m K K T * + 4 3 μ m ) = i = 1 N x i ( K i K m ) P m i
where K*KT is the effective bulk modulus of the rock, Km is the bulk modulus of the rock matrix, Ki is the bulk modulus of the ith inclusion, and Pmi is a coefficient which describes the effect of including material i in the background medium m. It is emphasized that separate terms are required in the sum for inclusions consisting of different materials or shapes, where xi denotes the volume concentration for different inclusions [9,58].

2.4.4. Critical-Porosity Parameterization

ϕc was defined as the ϕ threshold at which the load-bearing solid framework loses mechanical continuity and elastic behavior transitions from a solid-dominated to a pore-dominated regime [33]. In this study, ϕc was evaluated using Hashin–Shtrikman (HS) bounds [28,35,36]: ϕ was rescaled relative to ϕc by defining a normalized porosity factor (f = ϕ/ϕc). This formulation recalibrates the ϕ axis parameter so that the critical mechanical state corresponds to f = 1. In this context, ϕc controls the ϕ at which the bulk modulus (K) transitions from a gradual decrease to a much steeper drop. Here, ϕc is not treated as a directly measured property, but as a model parameter evaluated from model–data consistency. This approach avoids assuming a single a priori threshold and reports ϕc as an operational range supported by the observed elastic trends. To quantify how well different ϕc values reproduce the data, we evaluate the misfit using RMSE between measured data and model predictions. Parameter stability was further evaluated by bootstrap resampling under the baseline matrix reference, as reported in the Supplementary Information.

3. Results

This section presents the integrated physical, textural, and acoustic characterization of fifty cylindrical specimens from seven porous ignimbrites (ϕt > 25%). Results are organized first by porosity and density, then by pore-network style, ultrasonic response, and bulk modulus, and finally by comparison with effective-medium bounds. This structure highlights two complementary descriptors of the dataset: total porosity and pore-network architecture. Inter-unit heterogeneity is evident at the specimen level. Kruskal–Wallis omnibus tests indicate significant overall differences in the main petrophysical variables considered here (all p < 0.05; Supplementary Table S1).

3.1. Sample Description and Petrography

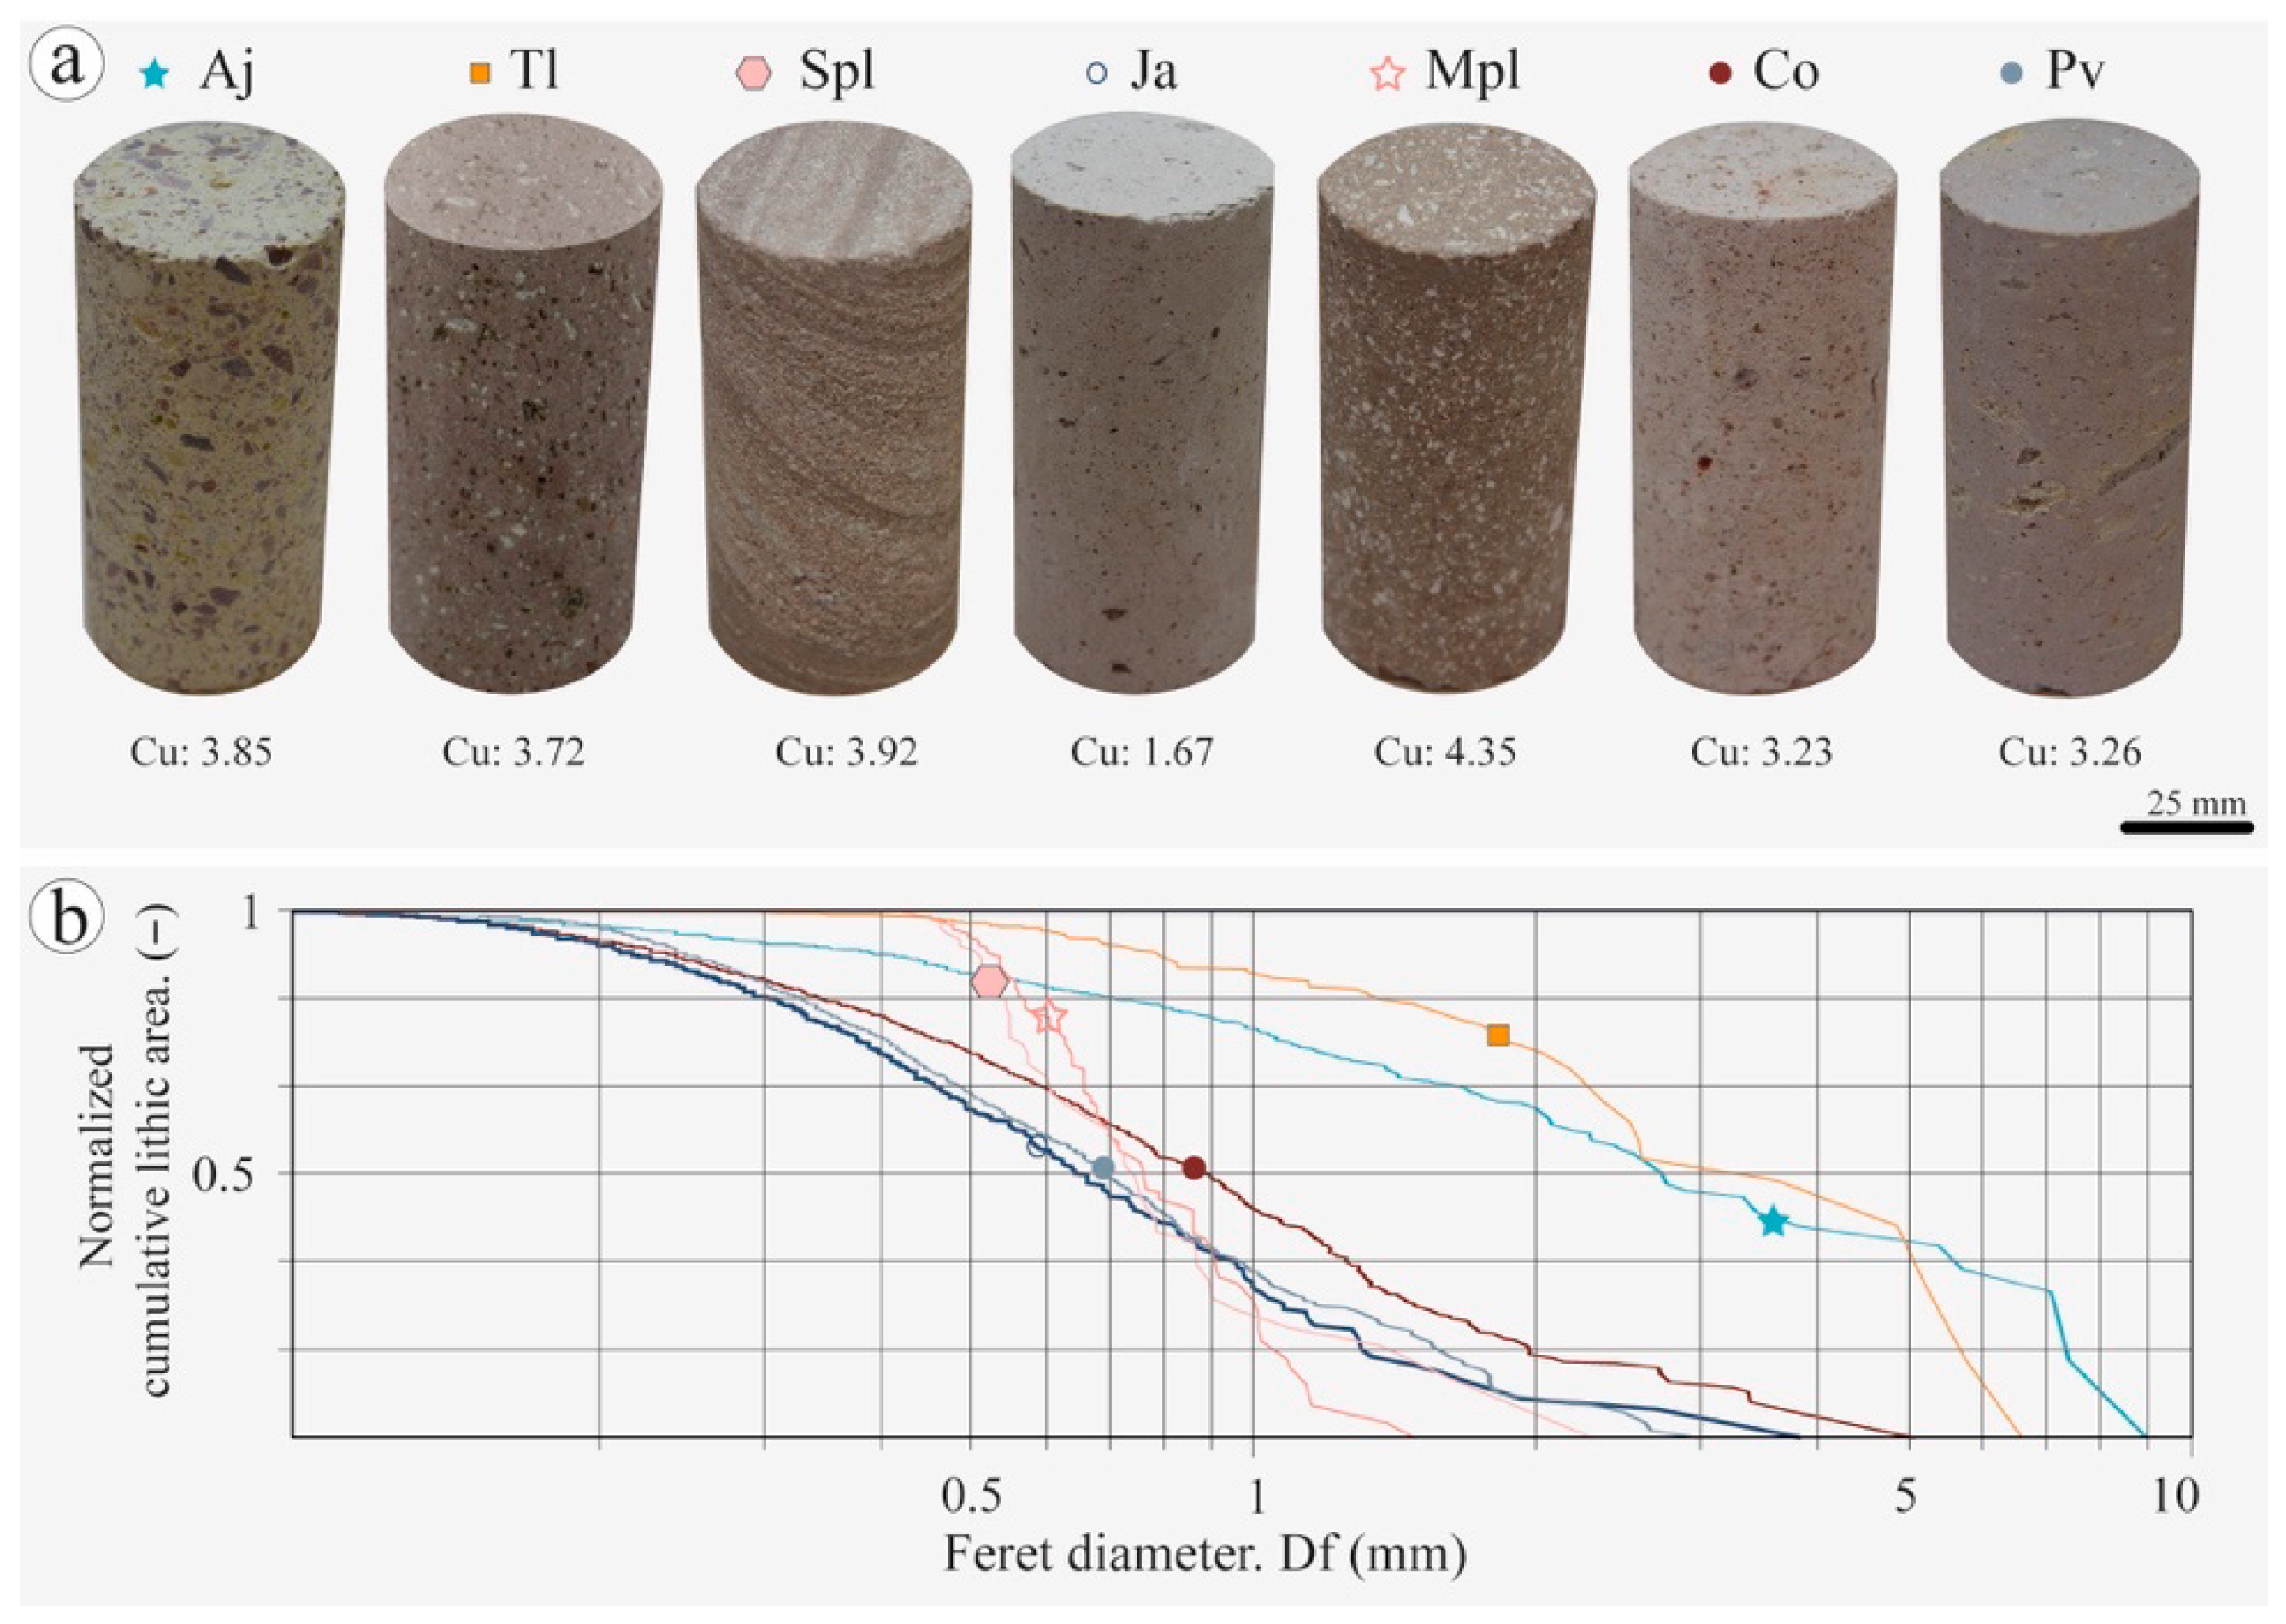
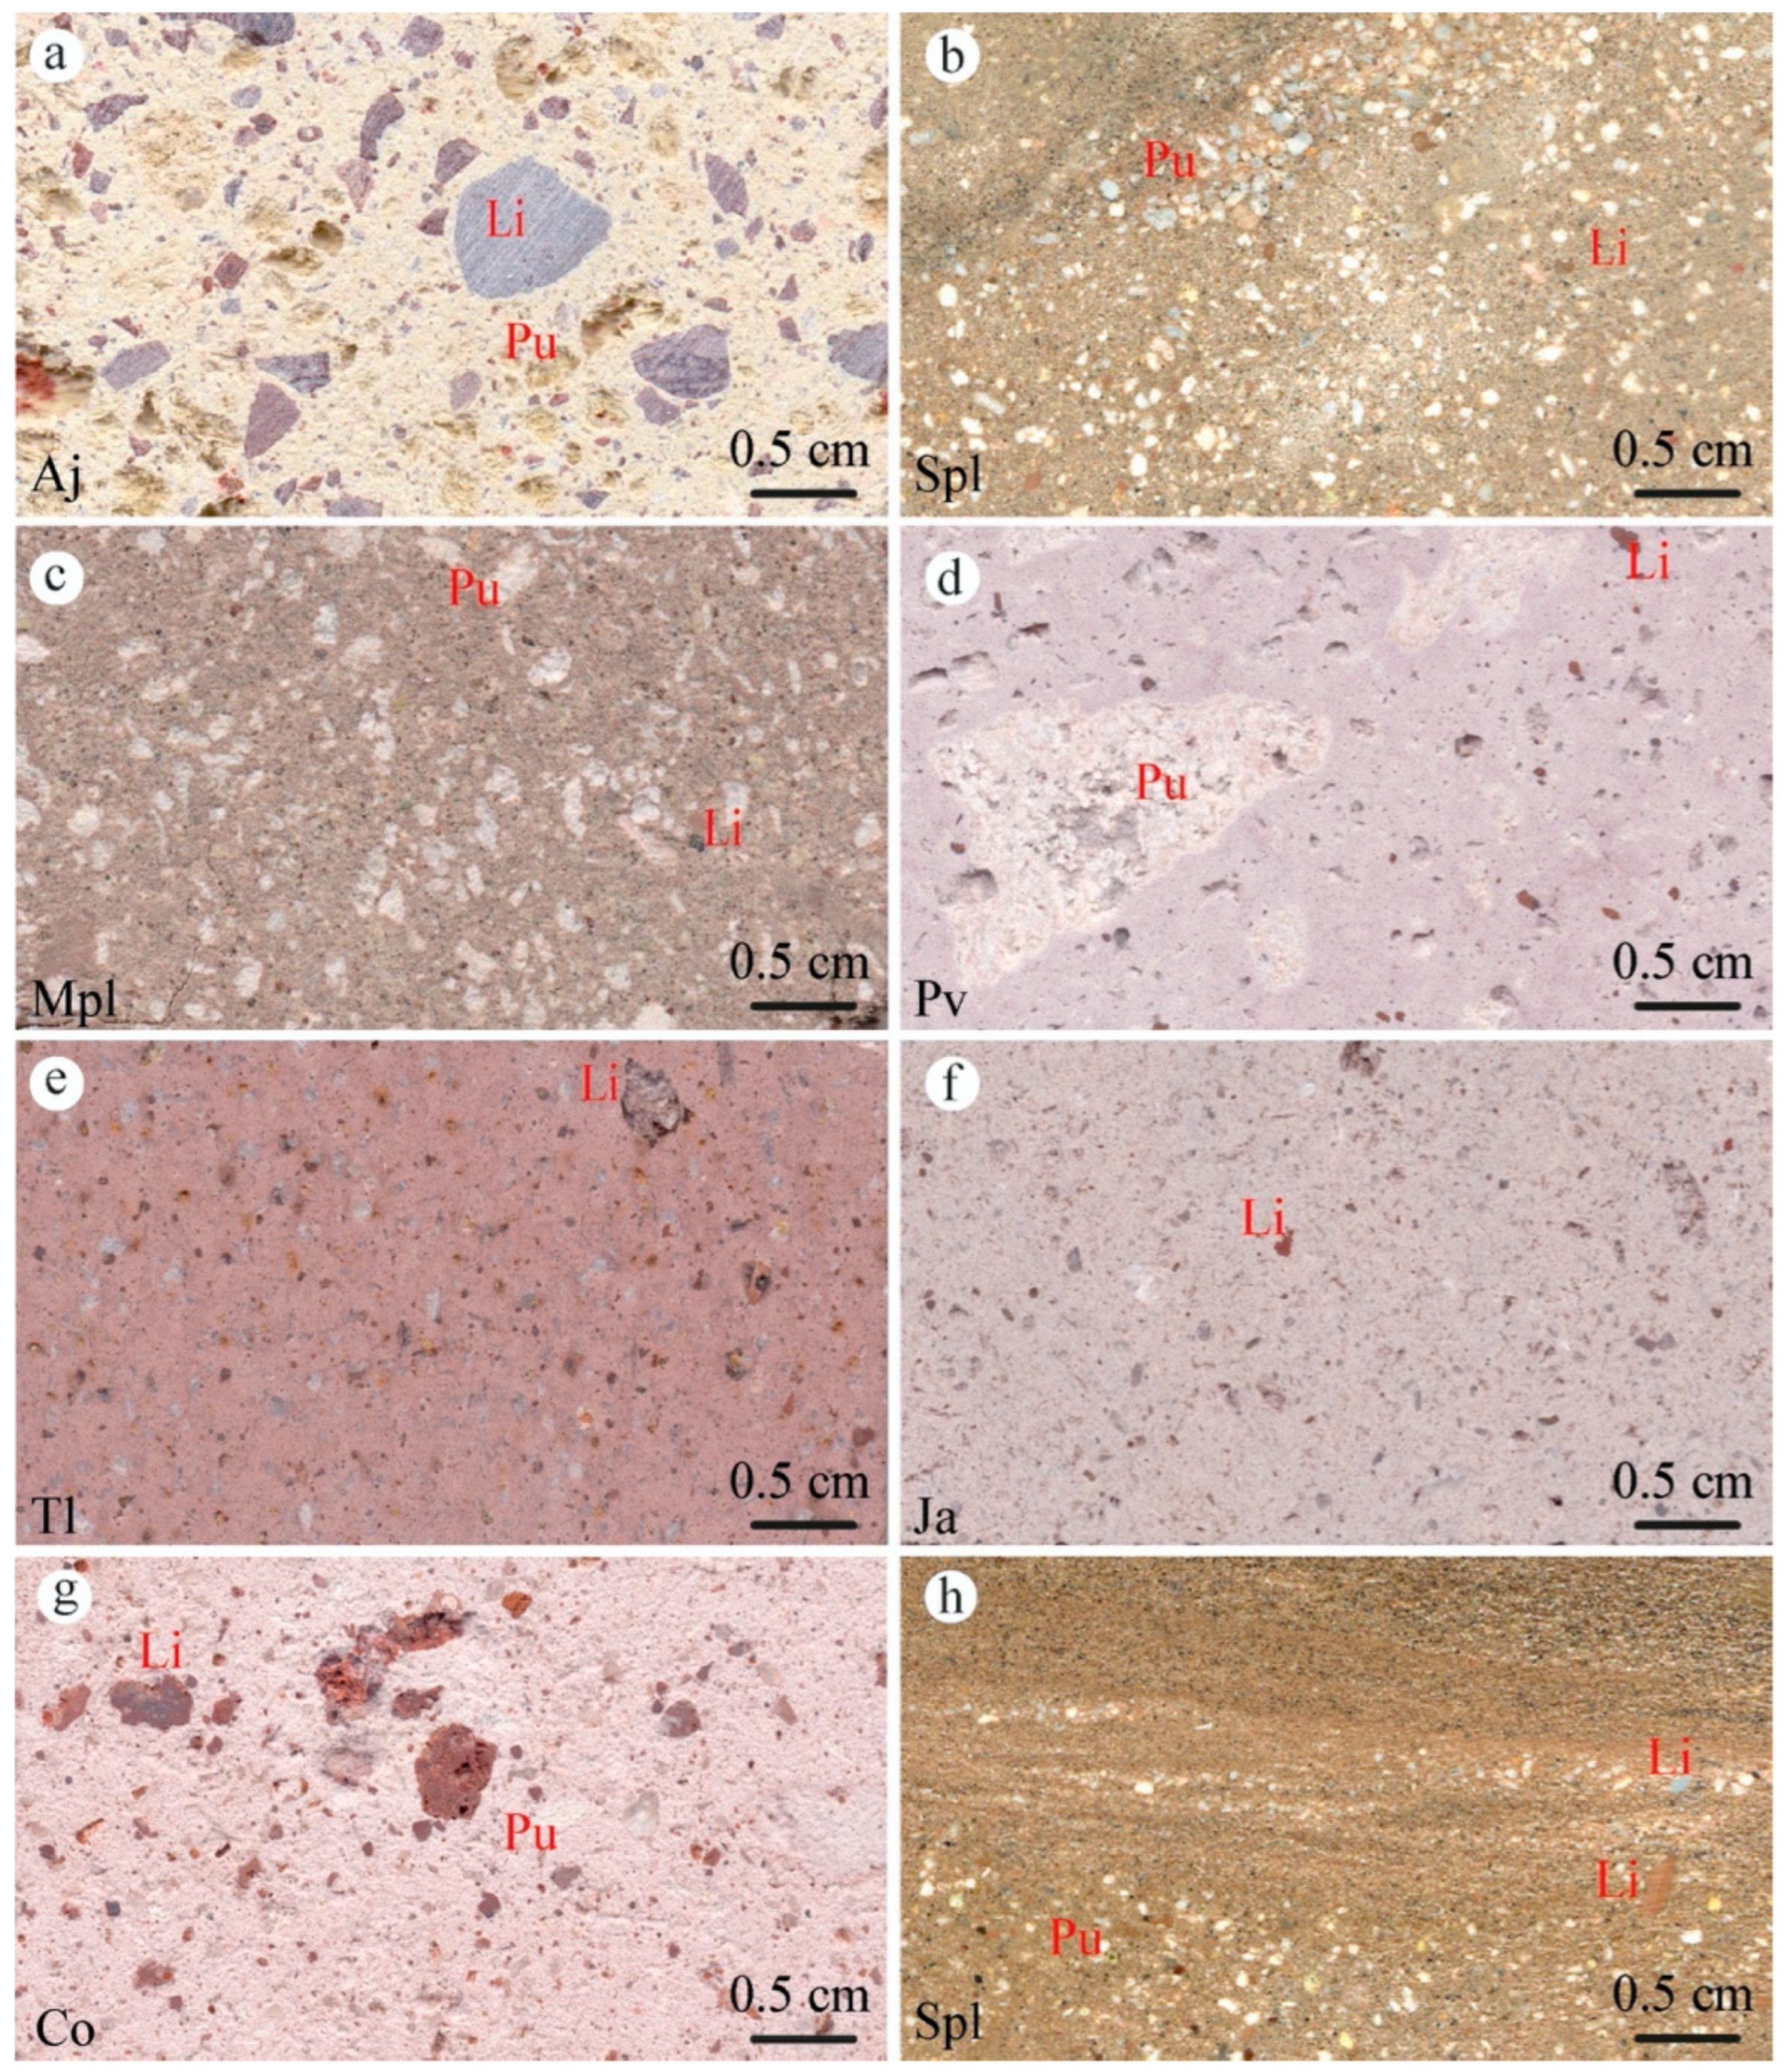
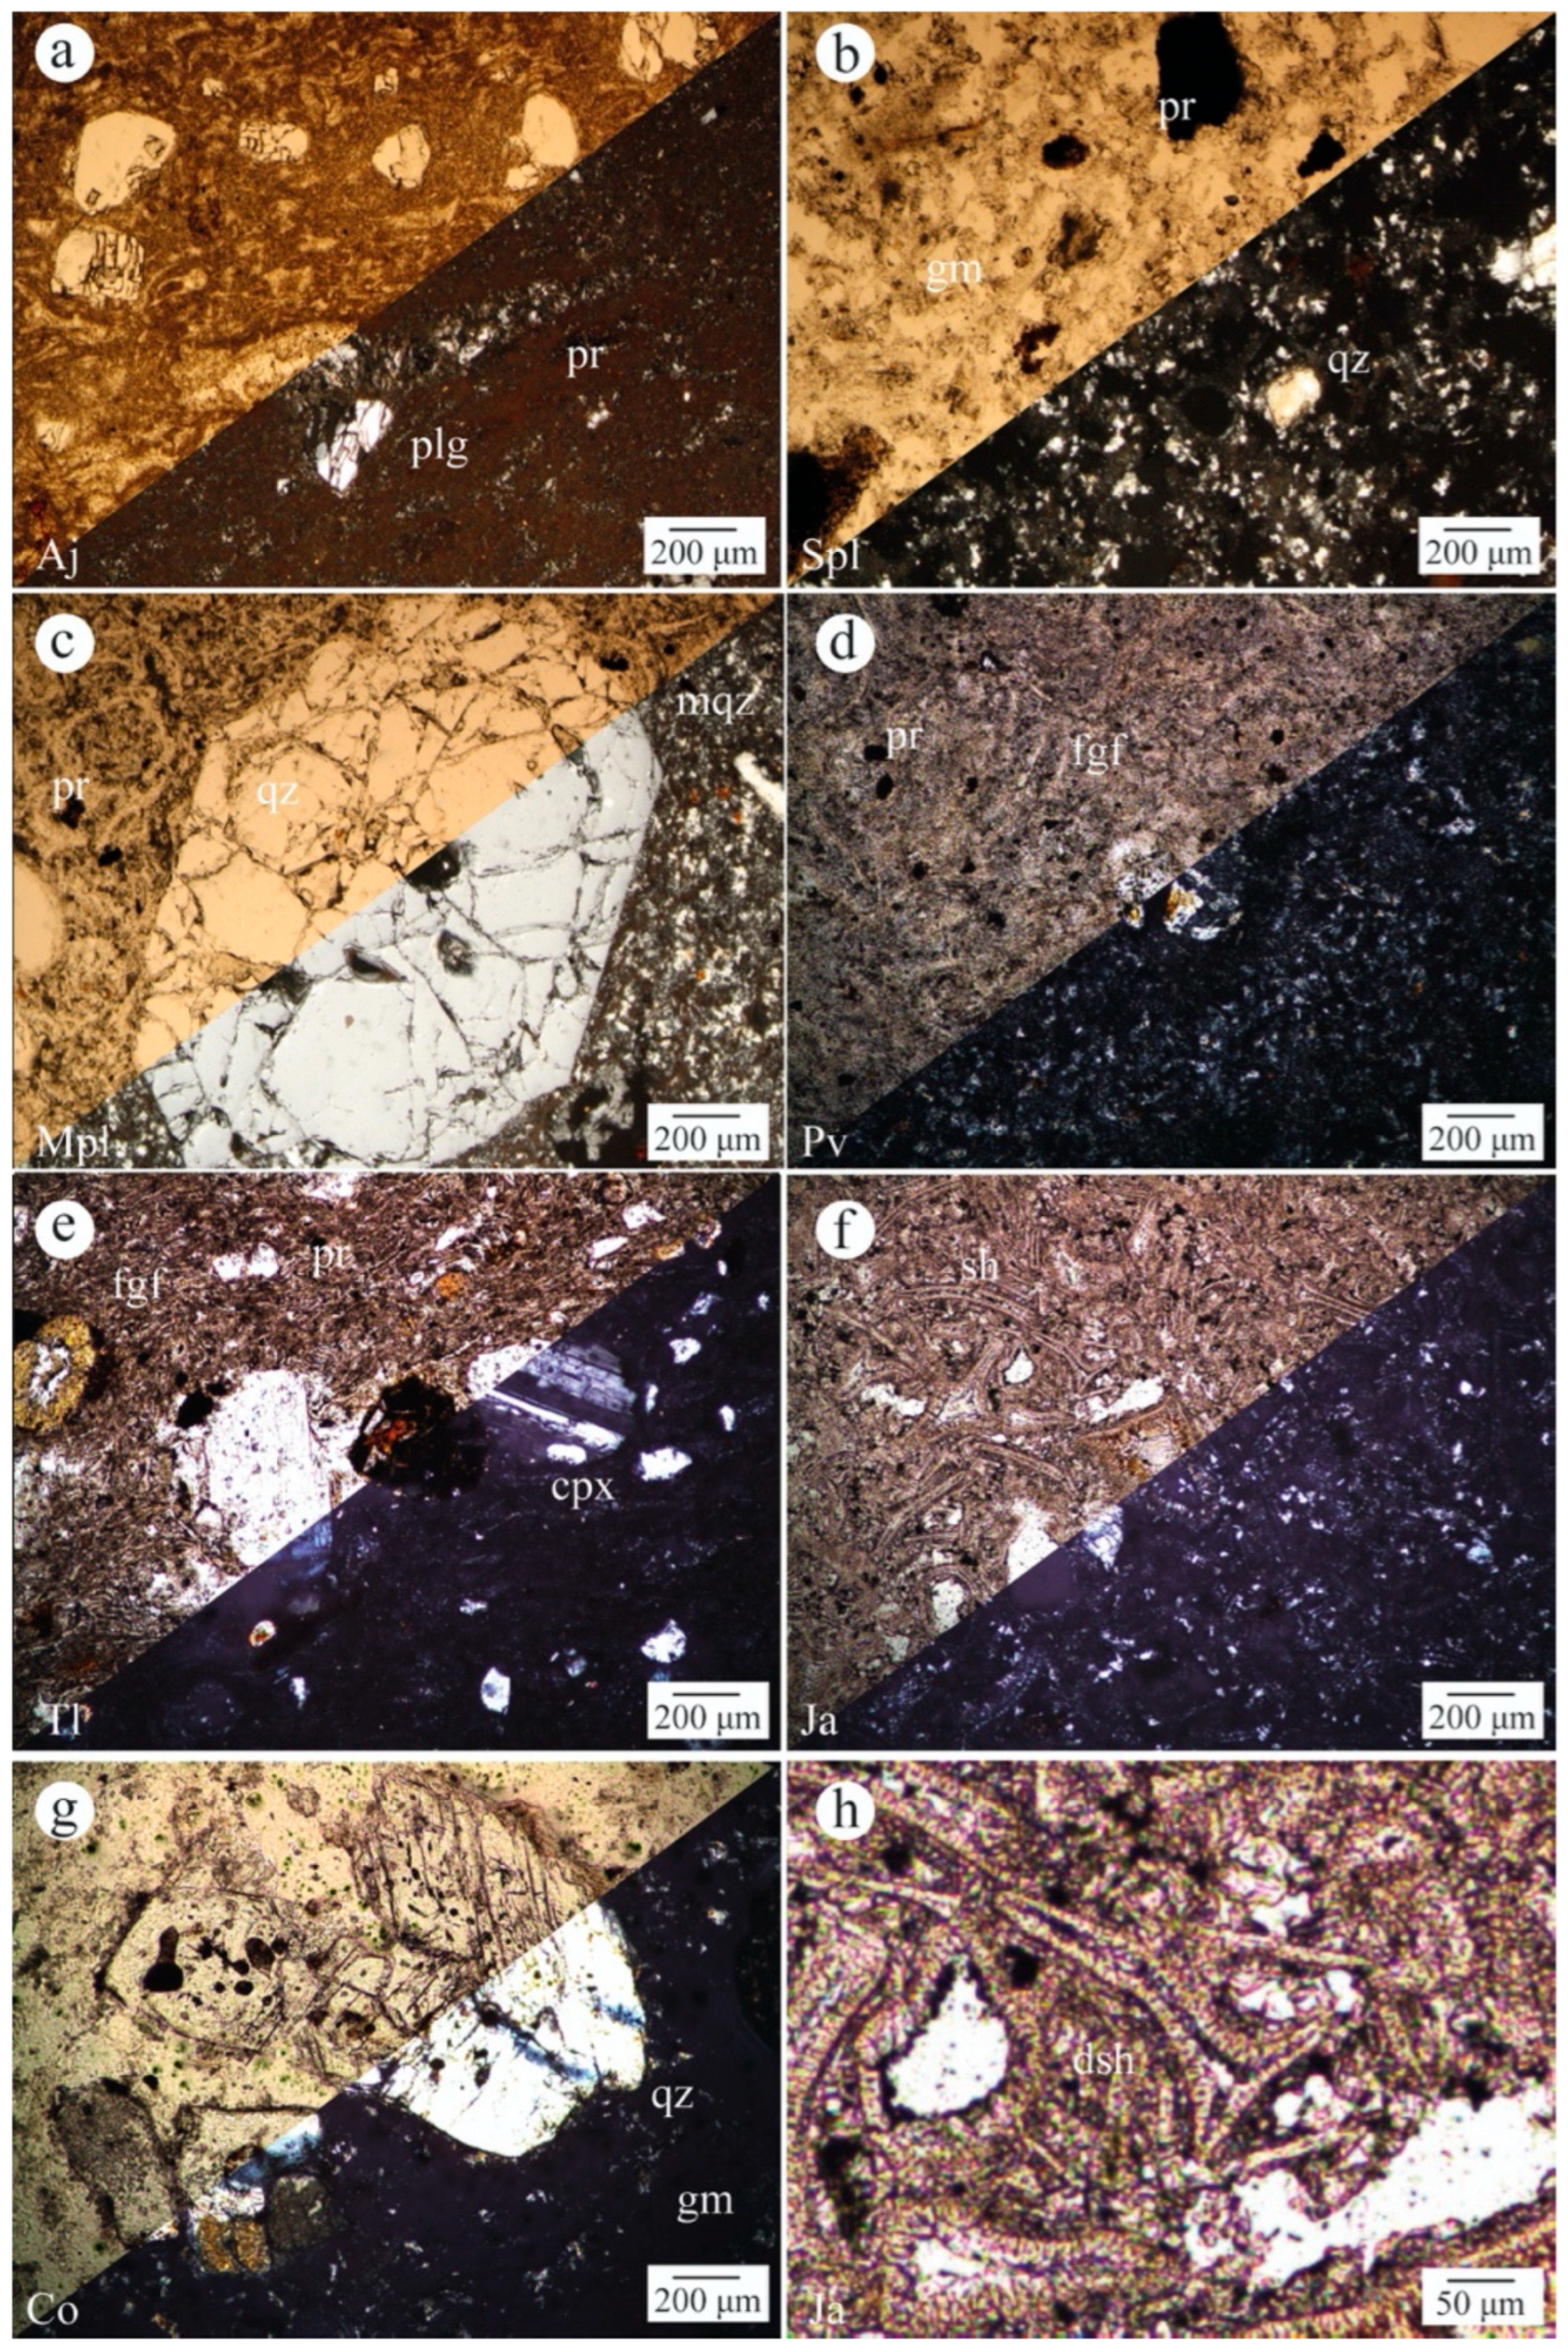
All studied rocks contain typical ignimbrite components, including juvenile pumice and glass fragments, lithic clasts, and crystal fragments set in vitric to devitrified matrices (Figure 3a, Figure 4 and Figure 5). Most samples display a broadly heterogeneous but locally random fabric. Spl is the main exception, showing weak compositional layering defined by pumice-rich and lithic-bearing bands; their oblique appearance in the cylindrical specimens reflects the tilted attitude of the lithofacies (Figure 4b,h). Flattened pumice fragments (fiammes) and eutaxitic textures occur in several samples, indicating variable degrees of welding and matrix compaction. Although all samples share the same general ignimbrite components, they differ mainly in matrix consolidation, clast deformation, and internal organization.
Aj, from the Aguajito Caldera Complex ([41,42]; Figure 1c,d), contains angular red lithics and friable, slightly flattened pumice fragments in a highly consolidated yellowish matrix (Figure 3a and Figure 4a). Petrographically, it shows flattened glass and porous pumice fragments with eutaxitic texture, together with quartz and fractured plagioclase phenocrysts (Figure 5a). Spl and Mpl, from the Cuitzeo ignimbrites in Michoacán, central Mexico ([39,43]; Figure 1a,b), differ mainly in internal organization and matrix support. Spl consists of weakly consolidated, devitrified layers with alternating pumice-rich and lithic-bearing bands, whereas Mpl contains subrounded white pumices and small lithic fragments in a slightly consolidated brownish matrix (Figure 4b,c). Both contain quartz- and feldspar-bearing crystalline phases, with quartz microlites particularly evident in Spl (Figure 5b,c).
Pv and Co, from the Atécuaro Caldera in the Sierra de Mil Cumbres ([40]; Figure 1a,b), both contain large pumice and lithic fragments, but differ in matrix cohesion and clast morphology. Pv is characterized by deformed centimetric pumices and large black-to-red lithics in a highly consolidated vitric matrix, whereas Co contains slightly deformed pumice and rounded red lithics in a moderately consolidated pink matrix (Figure 4d,g and Figure 5d,g). Tl, from the Tlalpujahua Caldera, Michoacán ([40]; Figure 1a,b), is distinguished by strongly deformed black fiammes and gray lithics in a very consolidated red vitric matrix (Figure 4e and Figure 5e). Ja, from the Cuitzeo ignimbrites ([40]; Figure 1a,b), contains fibrous pumice and subrounded lava lithics in a moderately consolidated gray, glass-rich matrix, together with quartz and feldspar phenocrysts and local devitrified glass-shard textures (Figure 4f and Figure 5f). These contrasts suggest that the main variability across the dataset is textural rather than compositional, particularly in terms of matrix support, welding-related deformation, and lithic organization.
Figure 3 summarizes lithic-fragment size distributions in terms of Feret diameter (Df) and the coefficient of uniformity (Cu). Aj displays the coarsest population and the widest size range, whereas Spl and Mpl are shifted toward smaller Df values. Ja, Co, and Pv occupy an intermediate field, with submillimetric to near-millimetric fragment sizes. Here, higher Cu values indicate broader and more heterogeneous lithic-size distributions, whereas lower values reflect narrower and more uniform populations. Mpl shows the highest Cu (4.35), whereas Ja has the lowest (1.67).
Table 1 summarizes the semi-quantitative XRD data. The crystalline fraction is dominated by quartz and alkali feldspar phases (perthite and sanidine), with minor magnetite, pyroxene, and clay minerals. This crystalline assemblage is consistent with the petrographic observations in Figure 4 and Figure 5, including the abundance of quartz- and feldspar-bearing phases in Aj, Spl, Pv, Ja, and Co, the perthite-rich character of Mpl, and the more mixed feldspar–quartz assemblage with higher pyroxene and clay contents in Tl. Overall, the XRD data support the felsic character of the studied ignimbrites and are consistent with mineral associations reported for comparable volcaniclastic and ignimbritic rocks in previous studies [14].

3.2. Physical Properties and Pore Structure

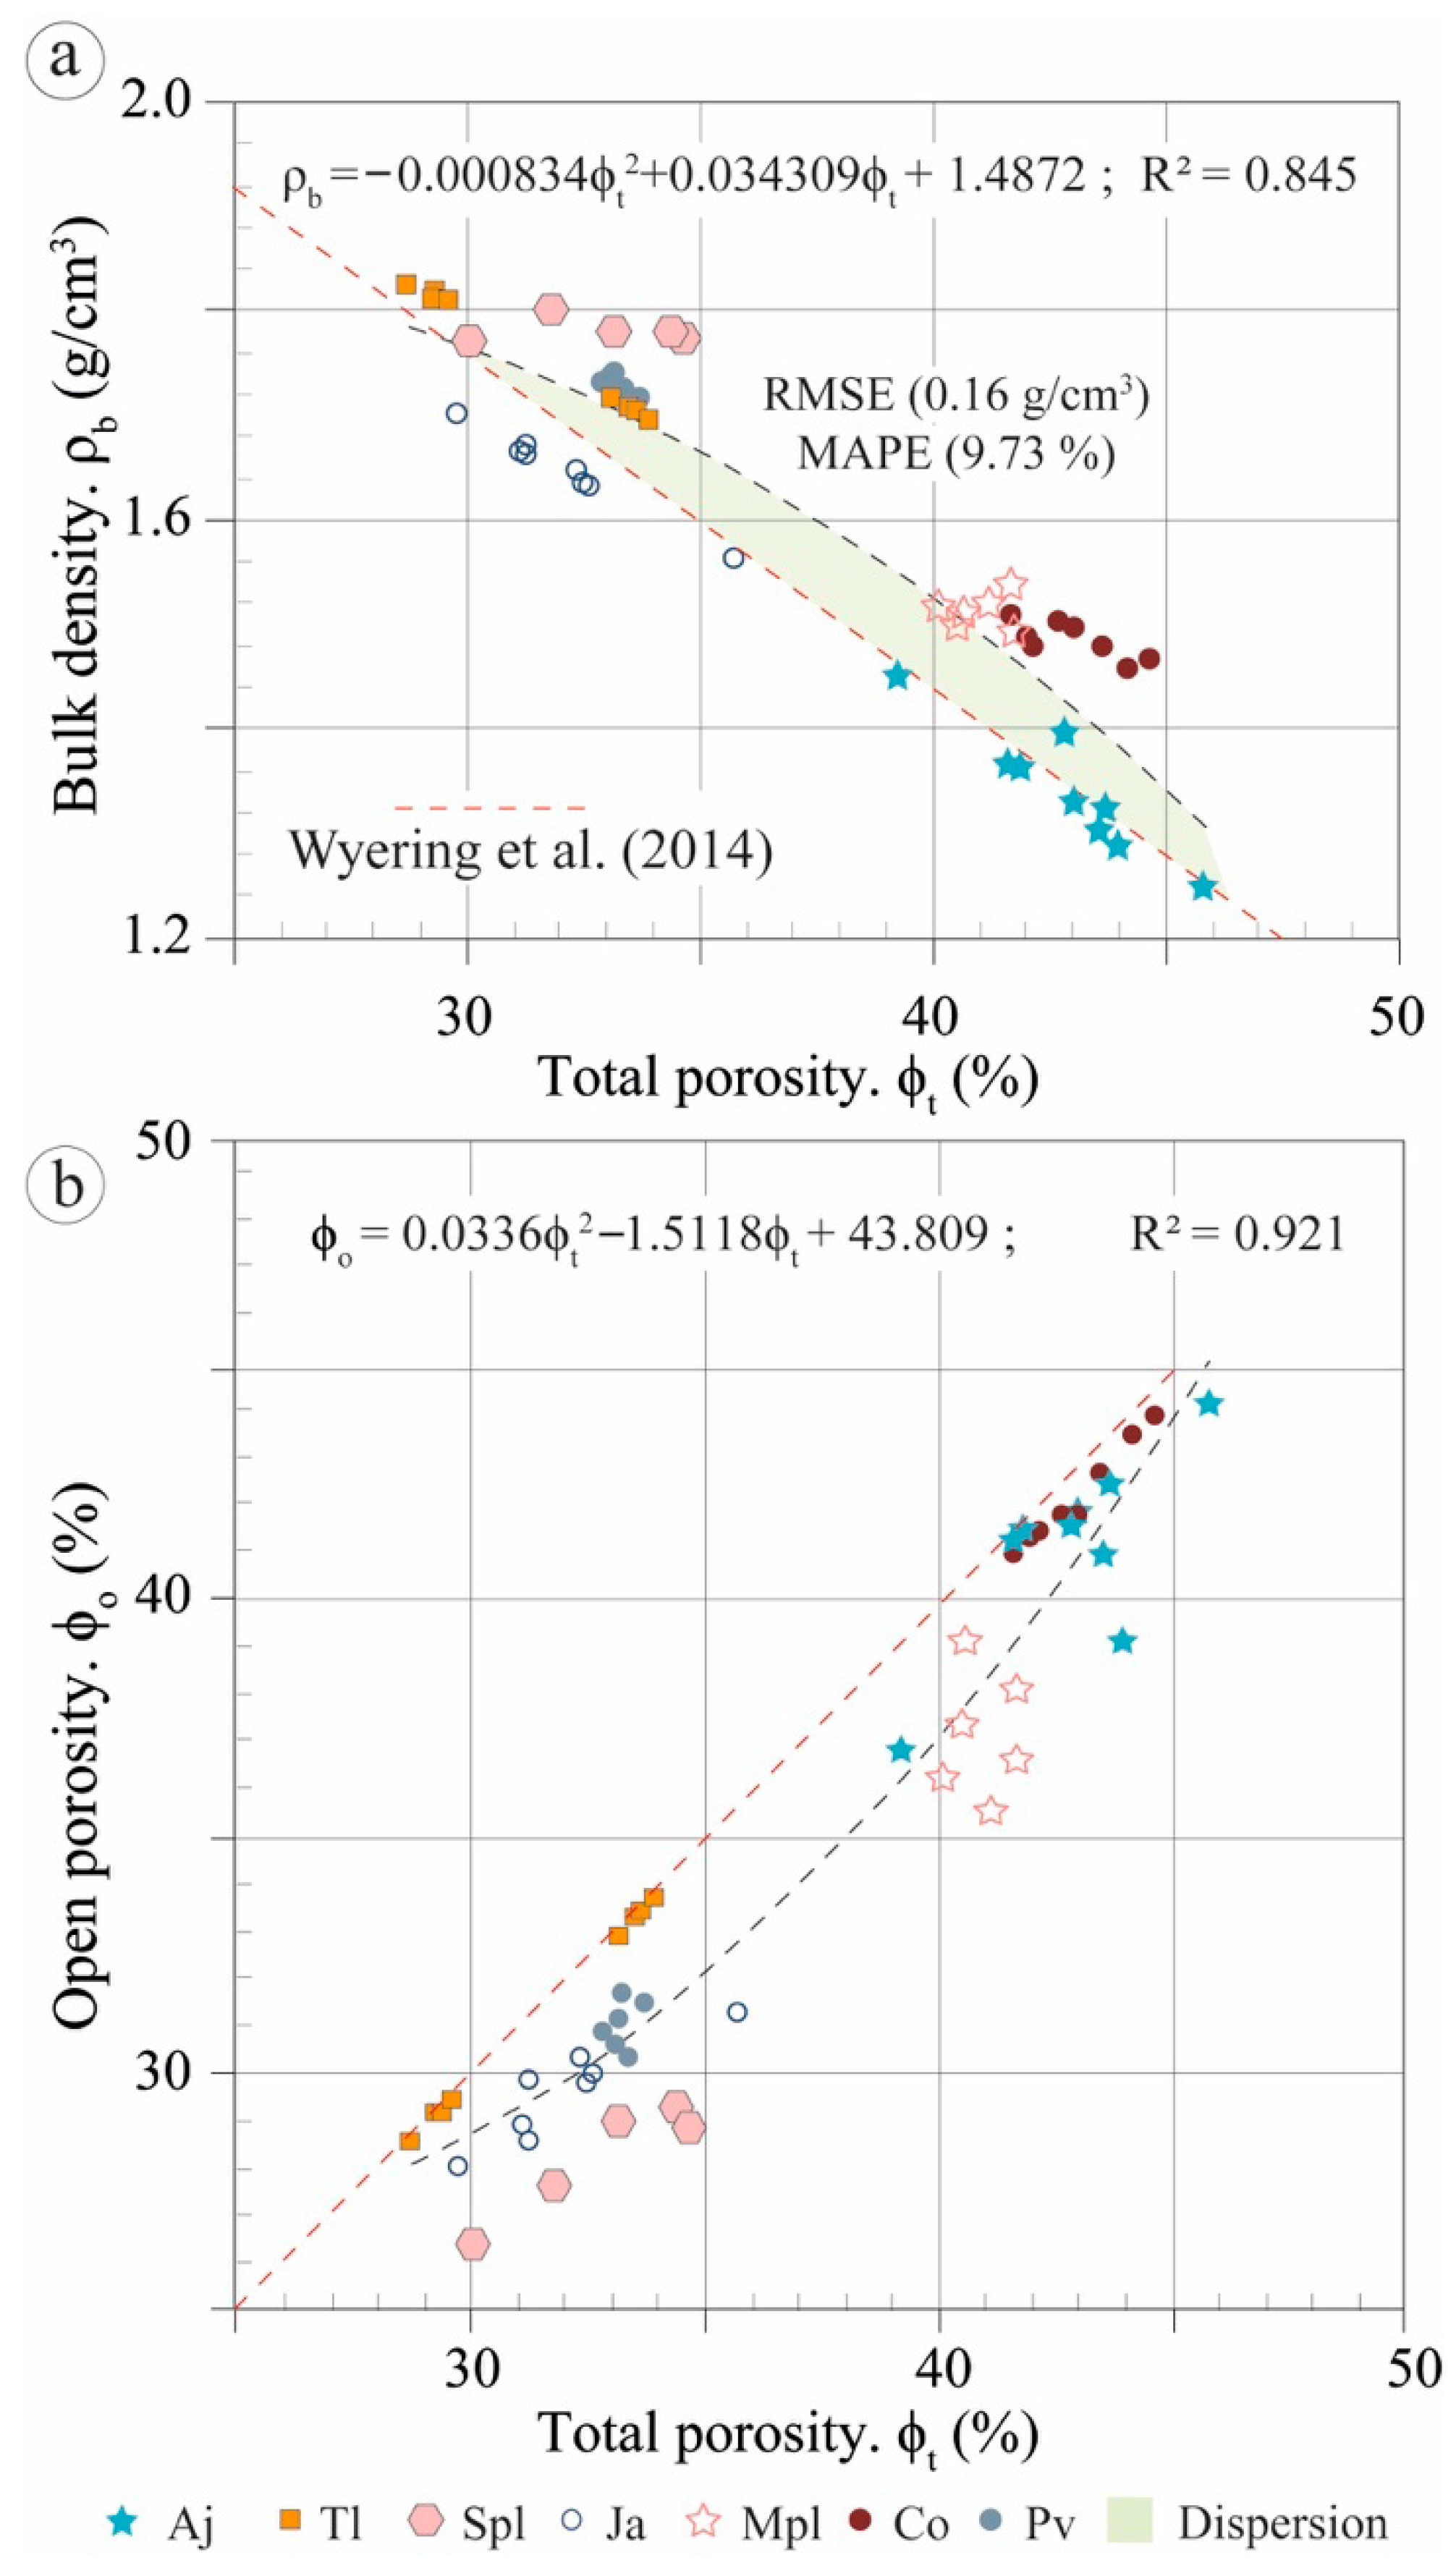
As summarized in Table 2, all ignimbrites are highly porous (ϕt = 31.39–42.87%), and more than 85% of that porosity is connected to the exterior (ϕot > 85%). Grain density ranges from 2.43 g/cm3 in Spl to 2.62 g/cm3 in Co, consistent with published values for silicic ignimbrites [59,60]. Total porosity defines two descriptive domains: Spl, Pv, Tl, and Ja cluster at ϕt ≲ 35%, whereas Aj, Mpl, and Co cluster at ϕt ≳ 40%. These are used here only as internal subdivisions of the dataset. The higher-porosity units also show the largest within-unit variability in ρb, consistent with their more heterogeneous fabrics (Table 2; Figure 3a and Figure 4). The same organization appears in Figure 6; bulk density decreases systematically with increasing ϕt, closely following published relationships for comparable volcanic rocks ([39,61], red dashed line; R2 = 0.845; RMSE = 0.16 g/cm3; MAPE = 9.73%). In Figure 6b, most samples plot close to the 1:1 line between ϕo and ϕt, indicating limited isolated porosity; Spl and Mpl show the largest offsets.
A second level of organization emerges from MIP and SEM observations (Figure 7 and Figure 8; Table 2 and Table 3). Aj, Spl, and Mpl share smaller characteristic throats, broader to multimodal intrusion distributions, and pore systems dominated by crack-like to elongated matrix-hosted voids, locally linked by microfractures. Tl, Ja, and Co show larger rthroat, narrower and mostly unimodal intrusion distributions, and more equant to slightly elongated intergranular pores. Pv is transitional: SEM images show crack-like microporosity similar to Aj–Spl–Mpl, whereas its intrusion pattern is narrower and closer to Tl–Ja–Co, consistent with its intermediate W value. The intrusion width index quantifies this contrast: Aj, Spl, and Mpl define the broader-intrusion group (W = 1.70–1.94), Tl, Ja, and Co the narrower-intrusion group (W = 0.22–0.76), and Pv lies between them (W = 1.33). Notably, pore-network style does not map directly onto the two porosity domains: Spl belongs to the lower-porosity group but clusters with Aj and Mpl in pore-network style, whereas Co belongs to the higher-porosity group but groups with Tl and Ja.
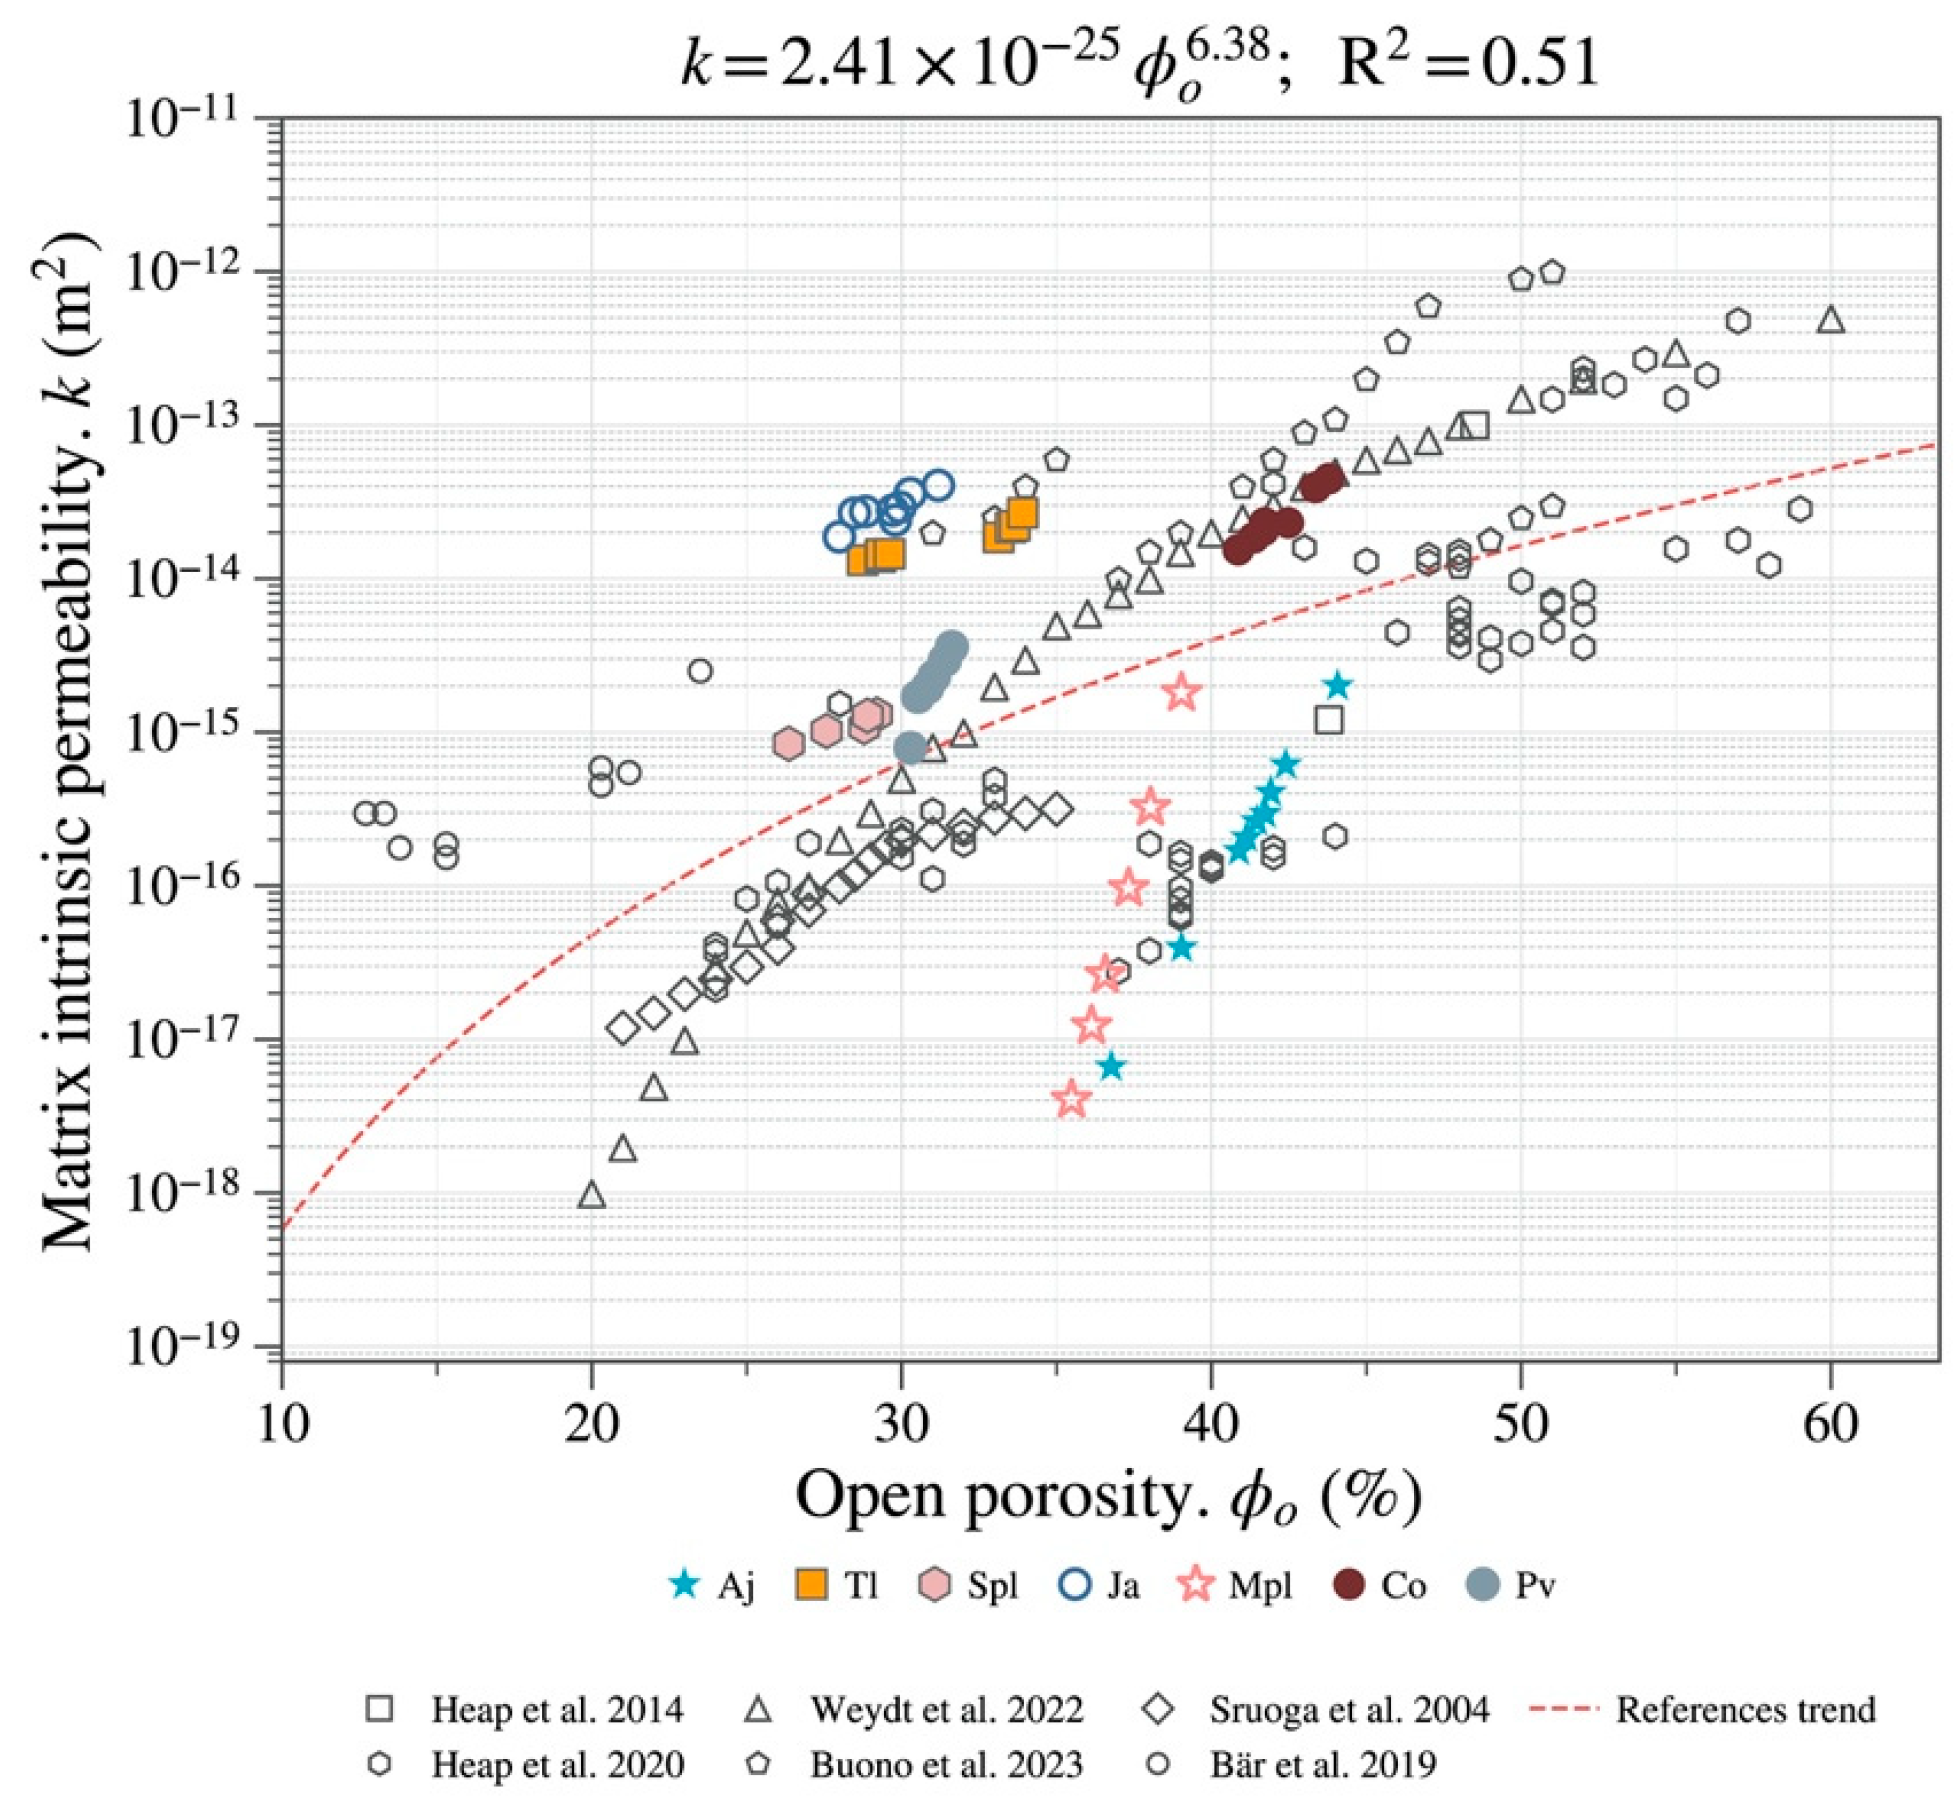
This separation is clearest in permeability (k) (Figure 9). Tl, Ja, and Co define a higher-permeability field (10−14 to 10−13 m2), whereas Aj, Spl, Mpl, and Pv occupy a lower-permeability field (10−18 to 10−15 m2). Although k increases overall with ϕo, several samples fall below the empirical fit compiled from published ignimbrite data, and the separation broadly follows the throat-size and intrusion-pattern differences described above. The measured values remain within, or close to, the range reported for ignimbrites in the literature [13,15,62]. Together, these results show that the dataset is organized by two complementary descriptors: total porosity and pore-network tendency.

3.3. Ultrasonic Velocities and Elastic Properties

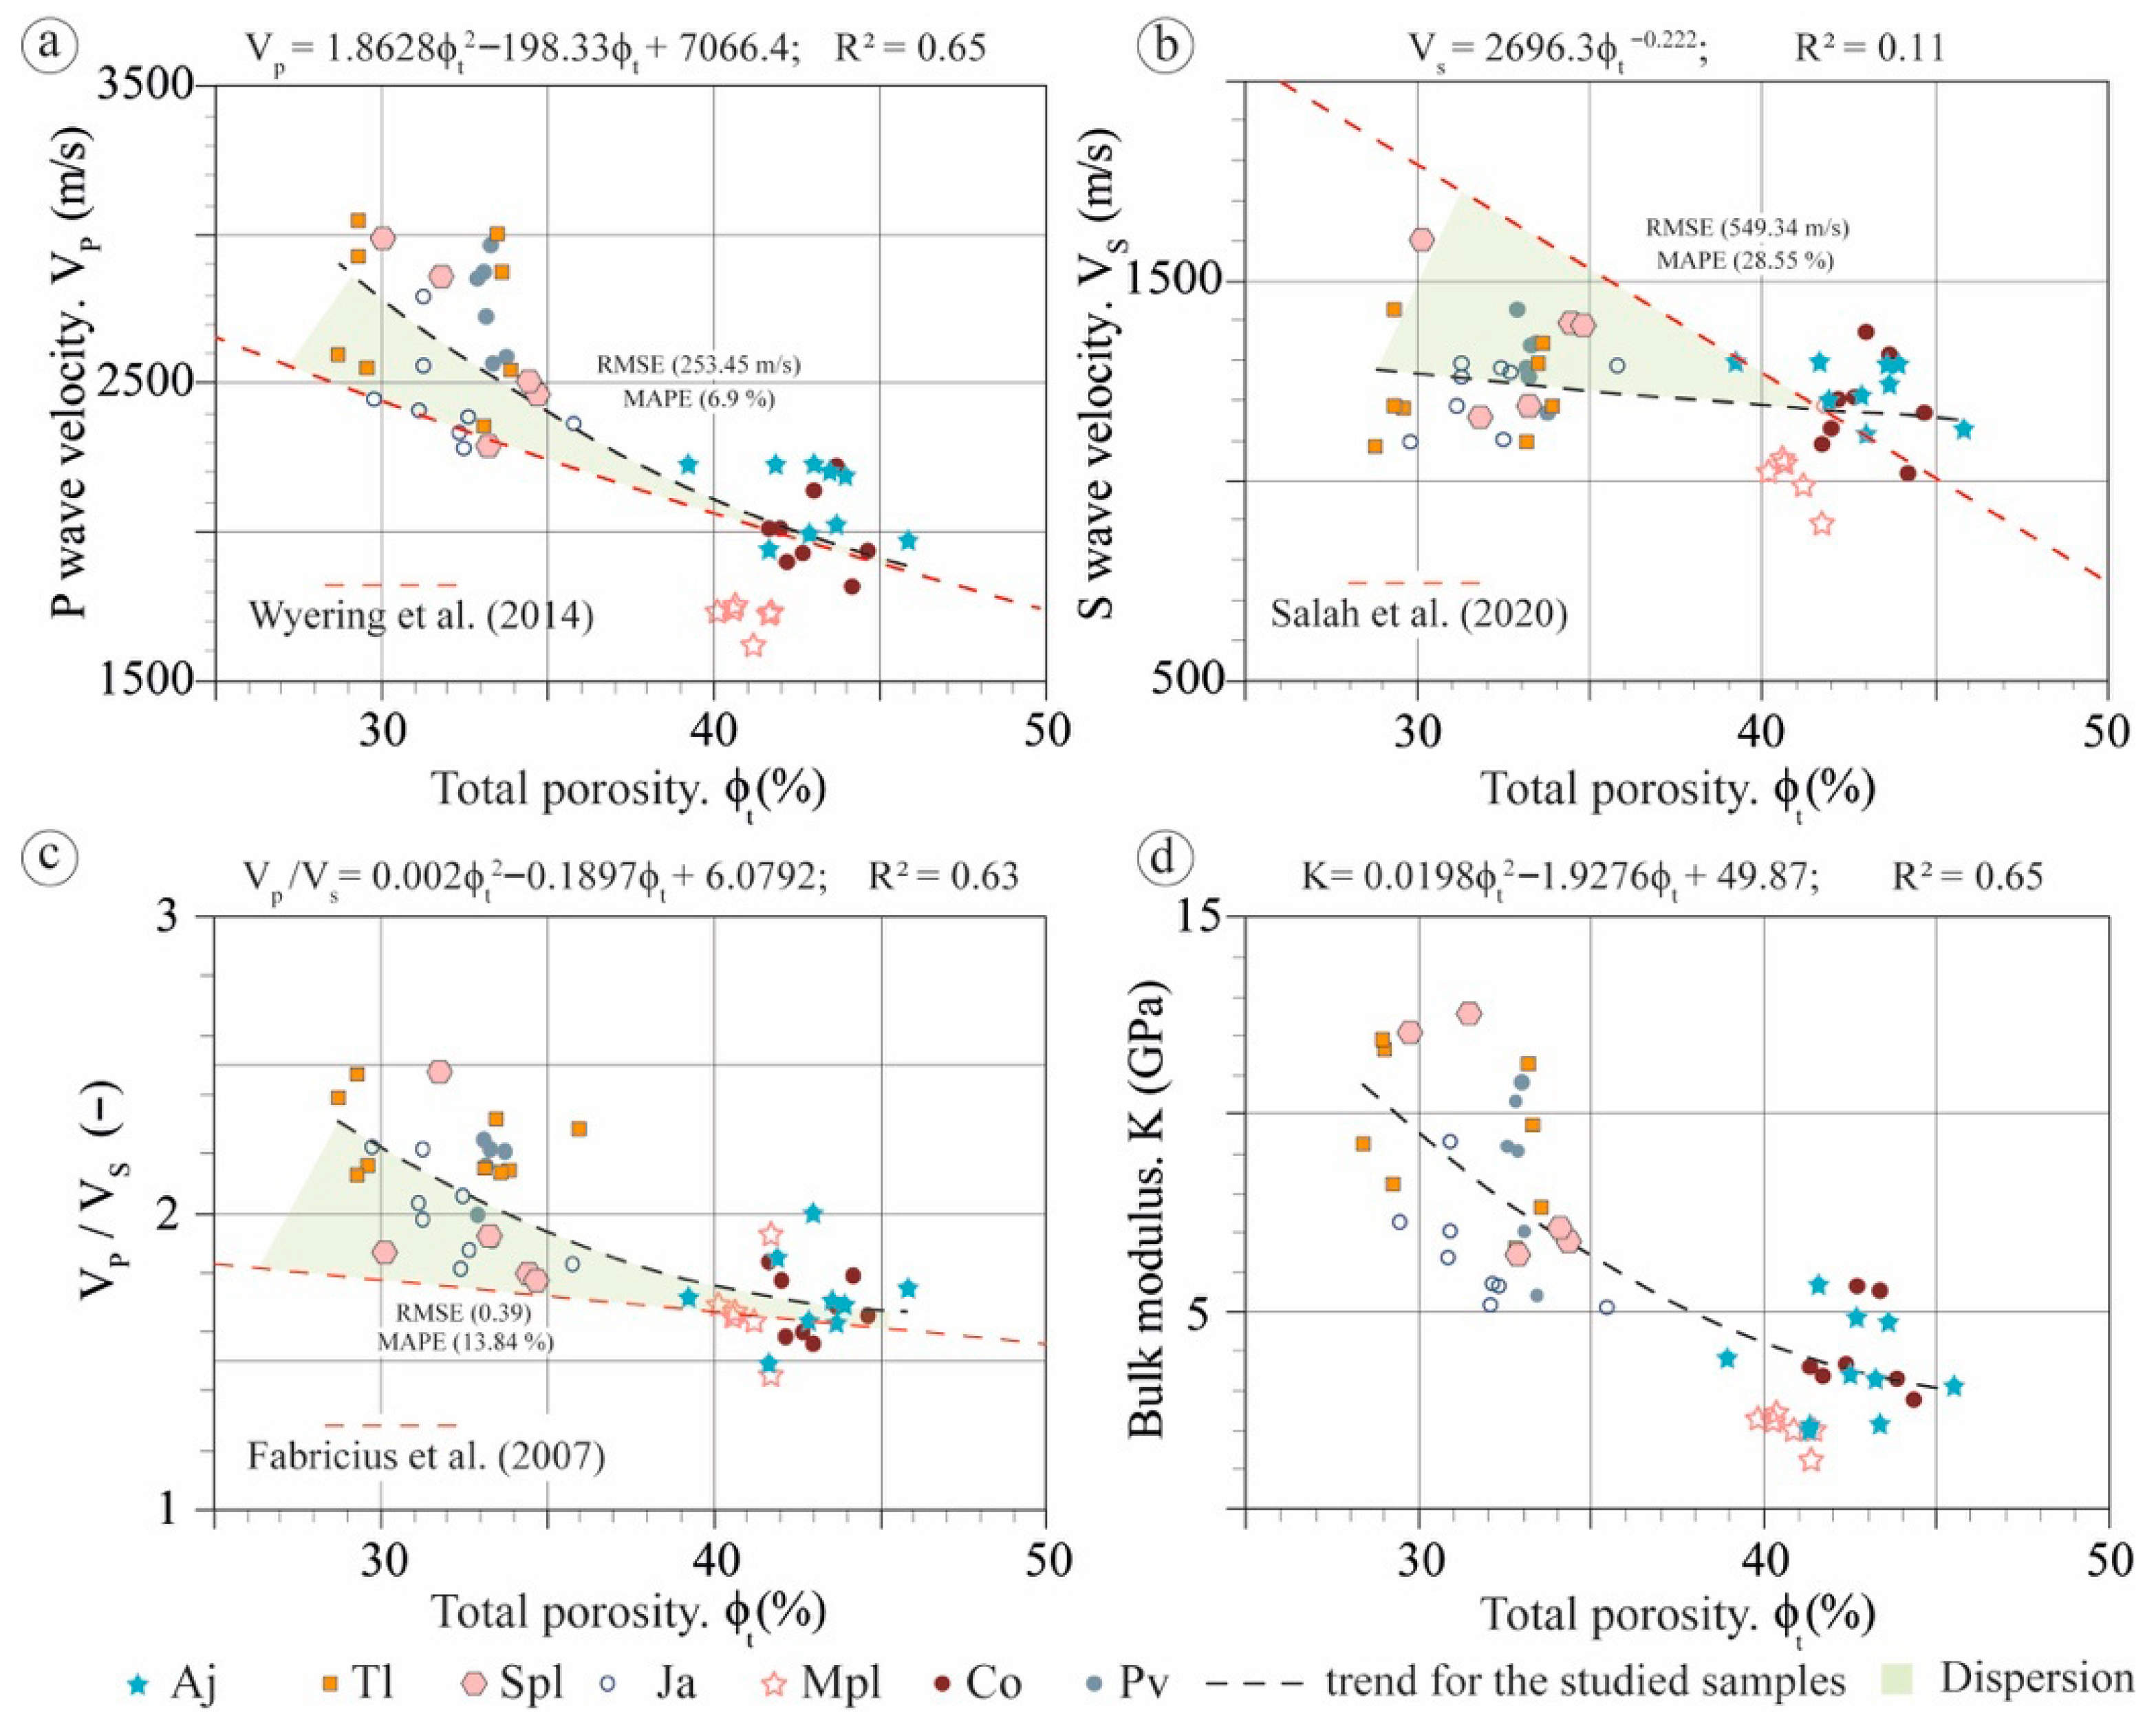
As shown in Table 4 and Figure 10, Vp ranges from 1722 to 2766 m/s and Vs from 1035 to 1347 m/s. The highest Vp values occur in Pv and Tl, whereas Mpl shows the lowest Vp and Vs. Across the porosity range studied, Vp decreases more systematically with increasing ϕt than Vs (Figure 10a,b). Vs varies over a narrower interval and shows a weaker relation with porosity. The Vp/Vs ratio ranges from 1.47 in Mpl to 2.24 in Tl, and K from 2.09 to 9.60 GPa, with the highest K values in Tl, followed by Spl and Pv, and the lowest in Mpl, Aj, and Co. Dynamic shear modulus (G) ranges from 1.63 to 3.28 GPa, with the highest values in Spl, and the lowest in Mpl. Poisson’s ratio (ν) ranges from 0.21 to 0.37, with the highest values in Tl and the lowest in Mpl (Table 4; Figure 10c,d). Thus, Vs is the least variable elastic parameter, whereas K provides clearer separation among units that overlap in porosity; Vp/Vs shows additional structure, but with substantial overlap among units.
Figure 10 also compares the dataset with previously published empirical relationships. The Vp–ϕt trend is close to the volcanic-rock relationship of [61], with RMSE = 253.45 m/s and MAPE = 6.9% (Figure 10a). The relations of [65,66] are used here only as external empirical references (Figure 10b,c). These comparisons yield RMSE = 549.34 m/s and MAPE = 28.55% for Vs, and RMSE = 0.39 and MAPE = 13.84% for Vp/Vs. In Figure 10d, K decreases nonlinearly with increasing ϕt (R2 = 0.65), but the spread around this trend shows that similar porosity values do not correspond to a single elastic response.

3.4. Effective-Medium Bounds

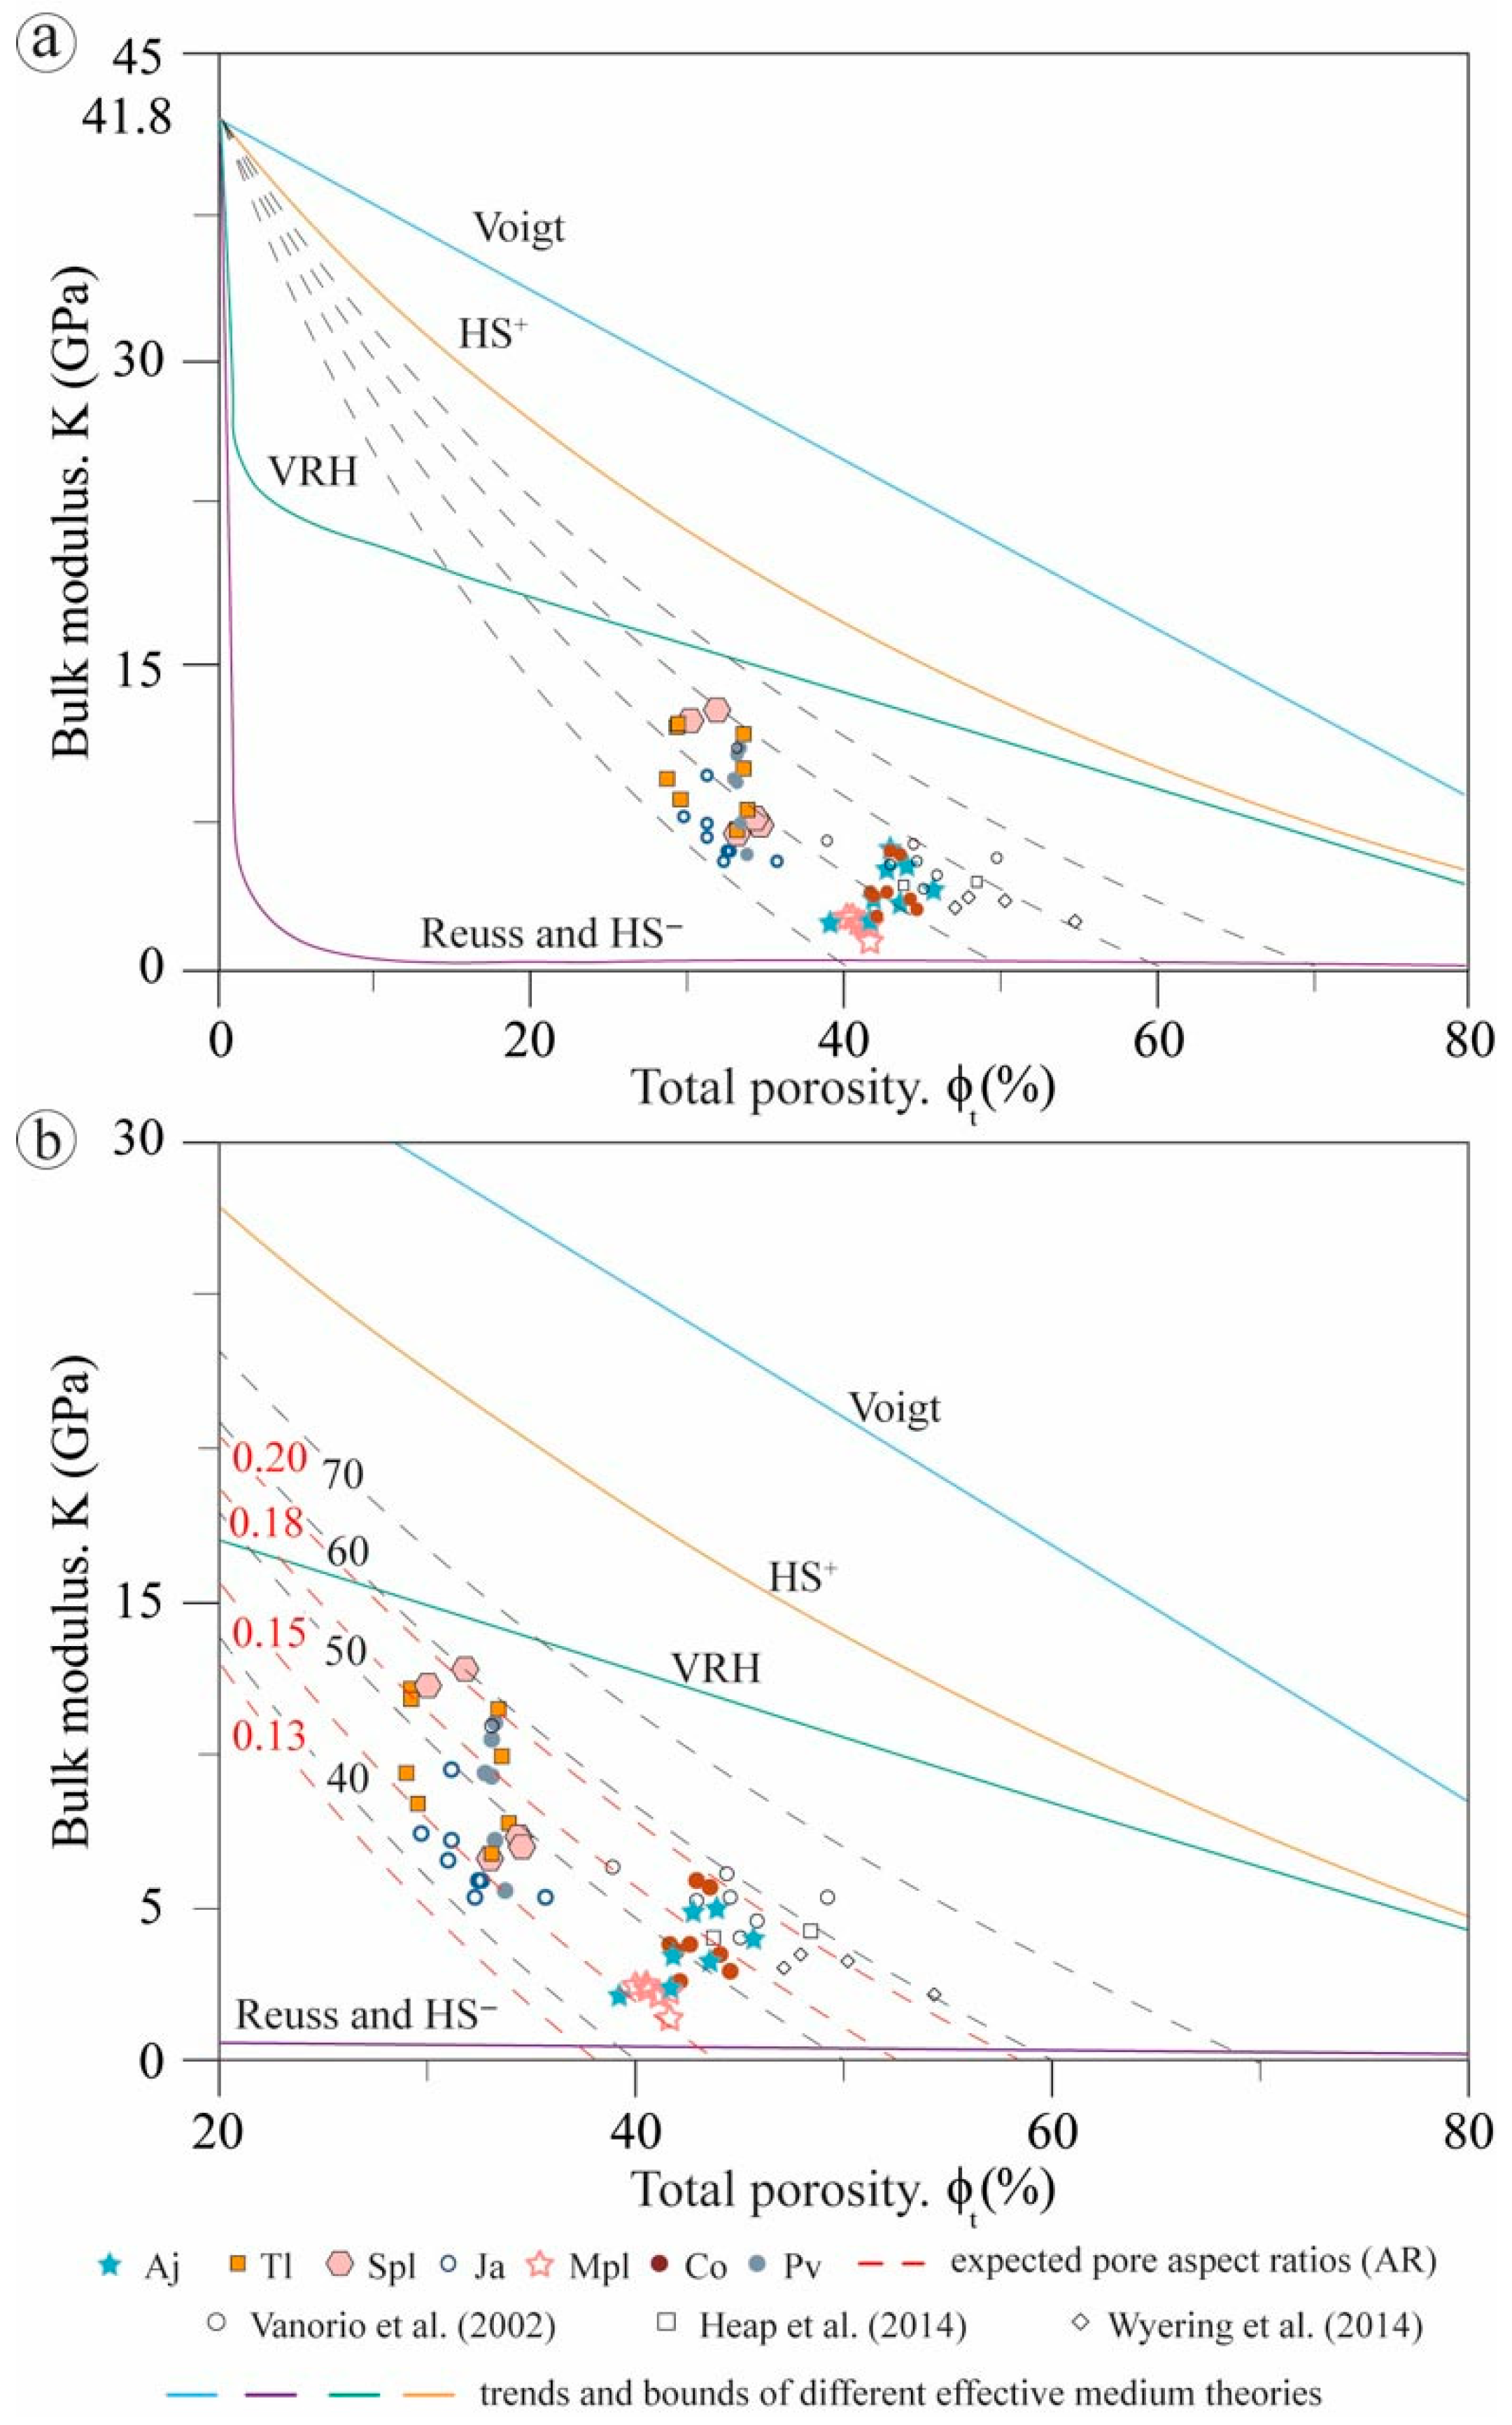
Effective-medium analysis was used to test whether the measured K–ϕt distribution falls within a mechanically plausible range defined by standard elastic bounds. Table 5 summarizes the solid reference properties derived from semi-quantitative XRD (ρm = 2.61 g/cm3, Km = 41.80 GPa, and μm = 30.65 GPa). Density is used only as a consistency check on phase proportions. The trajectories shown in Figure 11 use the central VRH solid reference, whereas Voigt and Reuss estimates are retained as end-member sensitivities.
In Figure 11a, all measured K–ϕt values fall between the HS− lower bound and the Voigt–HS+ upper domain. The dataset, therefore, occupies a restricted subset of the broader admissible elastic space, and the VRH curve follows its central tendency. Within this distribution, the lower-porosity group (Spl, Pv, Tl, and Ja; ϕt ≲ 35%) occupies the higher-K portion (~6–13 GPa), whereas Aj, Mpl, and Co (ϕt ≳ 40%) cluster at lower K (~1–6 GPa). Figure 11b shows that most samples are broadly bracketed by KT trajectories with ARKT = 0.15–0.20. Pv, Tl, and Ja tend toward the higher-ARKT side of this corridor and the upper part of the data cloud, whereas Aj, Mpl, and Spl lie closer to the lower-ARKT side. When literature data are added [10,13,61], much of the combined distribution remains compatible with the same corridor. RMSE is lowest at ARKT = 0.15 (2.1 GPa), increases slightly at ARKT = 0.18 (2.5 GPa), and is larger at ARKT = 0.20 and 0.13 (4.3 and 4.5 GPa), indicating that ARKT ≈ 0.15–0.18 provides the closest overall bracketing among the tested trajectories.
Modified Hashin–Shtrikman curves computed for different ϕc values show a similar pattern (Figure 11b). The ϕc = 40% curve acts as a practical lower reference for the combined distribution, whereas the ϕc = 70% curve lies above the full data cloud. Intermediate curves with ϕc ≈ 40–60% bracket most observed K–ϕt values, including both porosity domains.
RMSE decreases from 4.5 GPa at ϕc = 40% to a minimum of 1.9 GPa at ϕc = 50% and then increases to 4.4 GPa at ϕc = 60% and 7.2 GPa at ϕc = 70%. Under the baseline matrix reference, ϕc = 50% gives the lowest misfit among the tested values, whereas ϕc ≈ 40–60% provides a broader visual bracketing interval.

4. Discussion

Porosity defines the main elastic trend of the studied ignimbrites, whereas pore-network architecture explains much of the residual variability in permeability and helps place the elastic data within effective-medium bounds.

4.1. Porosity as a First-Order Control on the Elastic Trend

In the studied ignimbrites, porosity and density define the main physical trend of the dataset. Bulk density (ρb) decreases systematically as ϕt increases, and ϕo remains the dominant fraction of the pore system in all samples (Figure 6a,b). The elastic data follow the same general trend: K and Vp decrease with increasing ϕt, whereas Vs shows a weaker and more scattered response (Figure 10). This weaker sensitivity of Vs is physically expected because Vp depends on both bulk and shear stiffness, whereas Vs depends only on shear stiffness; crack-like pores and weak grain contacts therefore reduce volumetric stiffness more efficiently than shear rigidity, so their influence is expressed more strongly in Vp and K than in Vs and G [9,67]. Even so, porosity does not uniquely predict rock behavior. Over a narrow ϕt interval (~30–40%), the ignimbrites still span 2.09–9.60 GPa in K, 1.47–2.24 in Vp/Vs, and about five orders of magnitude in k (~10−18 to ~10−13 m2). Aj, Mpl, and Co have similar ϕt values, yet differ strongly in K and especially in k; the same occurs in the lower-porosity group, where Spl, Pv, Tl, and Ja overlap in porosity but not in Vp/Vs or permeability. Porosity, therefore, defines the broader elastic–hydraulic field, but not the exact position of each rock within it.
This interpretation is consistent with previous studies showing that porosity alone does not uniquely control the physical properties of felsic ignimbrites. Permeability and elastic moduli can differ significantly even within similar porosity ranges, highlighting the importance of pore-system geometry [13]. Likewise, Vp and Vs are influenced not only by porosity but also by fractures, pore shape, and mineral alteration [14]. Ultrasonic velocities also correlate strongly with microtexture, underscoring the role of pore organization beyond total porosity [10]. More recently, pore-space topology has been identified as a major control on ultrasonic-wave propagation in dry volcanic rocks, regardless of ϕt [68]. The same interpretation is supported here because the studied samples are broadly comparable in mineralogical and petrographic terms (Figure 5; Table 1), making it unlikely that major compositional differences alone account for the observed spread.
The permeability data make the same point from a transport perspective (Figure 9). Although k generally increases with ϕo, several samples depart strongly from the empirical trend defined by published ignimbrite datasets, showing that connected pore volume alone does not determine flow efficiency. Instead, k depends on how the connected pore space is organized along the flow path, especially at the scale of pore throats and local constrictions. This agrees with previous volcanic-rock studies showing that permeability depends strongly on pore structure and microporosity [24,69]. Different pore attributes, therefore, govern different responses: K reflects the compliance of the load-bearing solid phase, whereas k is more sensitive to the efficiency of connected pathways and throat restriction. Porosity remains the first-order control on the elastic trend, but it is not sufficient on its own to explain permeability, which requires additional pore-network descriptors.

4.2. Pore-Network Effects at Similar Porosity

At similar porosity, much of the remaining variability is better explained by differences in pore-network architecture (Figure 7 and Figure 8). These tendencies are defined mainly from MIP descriptors (characteristic rthroat, intrusion-curve shape, cumulative intrusion behavior, and W) and then compared with representative SEM and petrographic observations (Table 3). By this scheme, Aj, Spl, and Mpl tend toward crack-linked, throat-restricted pore systems, whereas Tl, Ja, and Co form more equant and less constricted networks; Pv lies between both tendencies. Representative SEM/petrographic observations summarized in Table 3 are used only as qualitative descriptors of apparent pore habit in the section and pore continuity. In contrast, the intrusion width index (W) provides a quantitative constraint: higher W values indicate broader and more heterogeneous access-throat distributions, whereas lower W values indicate narrower and more uniform ones. Aj, Spl, and Mpl define the higher-W group (1.70–1.94), Tl, Ja, and Co the lower-W group (0.22–0.76), and Pv remains intermediate (1.33), consistent with its interpretation as a transitional unit rather than a clear end member. Importantly, these pore-network tendencies do not coincide with the two porosity domains. Spl belongs to the lower-porosity group but shares a crack-linked, throat-restricted signature with Aj and Mpl, whereas Co belongs to the higher-porosity group but shows a more equant and less restricted pore system than the other high-porosity samples. Similar pore volume, therefore, does not imply similar pore topology or similar access-throat distribution.
In this context, regression models were compared as compact robustness checks of the roles of porosity and pore-network descriptors (Table 6). K and Vp are both described reasonably well by porosity-only relations (Adj. R2 ≈ 0.63), indicating that porosity captures much of the first-order elastic trend. By contrast, ϕo alone is a very poor predictor of permeability, whereas the fit improves markedly when W is included. Leave-one-unit-out (LOUO) cross-validation shows that this improvement is retained across held-out ignimbrite units. Because W is available at the unit scale, the augmented permeability model is interpreted as comparative statistical support consistent with the proposed pore-network tendencies.
This quantitative contrast is also evident when the individual ignimbrite units are compared. Aj and Mpl combine low K and very low k, consistent with relatively compliant rock structures and strong throat restriction. Tl and Ja show the opposite tendency, with higher K and higher k, consistent with less restricted and more equant networks. Vp/Vs broadly follows some of these contrasts, but with substantial overlap among units and should therefore be treated only as a secondary descriptor. Co provides a useful contrast: although it plots in the high-porosity, low-K field, its k is much higher than that of Aj and Mpl (Table 2 and Table 4), showing that permeability can remain relatively high even after stiffness has decreased, provided that connected pathways are not strongly restricted. Spl shows the opposite decoupling. Although its MIP behavior and low k place it close to Aj and Mpl from a transport perspective, its K is comparatively high for the dataset, indicating that a throat-restricted pore system does not necessarily produce the most compliant structure. Pv again behaves as an intermediate unit: its W and intrusion pattern fall between the two main tendencies, but its k remains low, showing that an intermediate intrusion width does not guarantee efficient flow when accessible throats are still small. The intrusion–extrusion behavior of Aj, Spl, and Mpl is also consistent with stronger ink-bottle-type constrictions, although hysteresis alone is not uniquely diagnostic of pore shape or network type [51,70]. Overall, the pore-network signal is clearest in k; its effect on K is present but less direct, whereas Vp/Vs provides only a secondary indication and Vs alone is the least diagnostic parameter.
This pattern is consistent with previous studies on volcanic rocks. On the elastic side, recent studies show that Vp/Vs is sensitive to the relative contribution of microcracks and vesicles and that welding, fractures, and microstructure commonly weaken simple porosity–property correlations in ignimbrites [67,71]. On the transport side, permeability can diverge strongly at similar porosity because it depends on pore-system organization, including pore size, geometry, spatial distribution, and fracture intensity [72,73]. At smaller scales, abundant micrometer- to submicrometer-sized pores do not necessarily produce a proportional increase in k, because transport is governed by the narrowest connected flow pathways [47,74]. In the present ignimbrites, k responds most directly to rthroat and access restriction, whereas K and Vp/Vs reflect both porosity and overall compliance. The pore-network styles identified above are therefore best treated as end-member tendencies rather than strict categories. Their main value is explanatory: they link the residual contrasts observed at similar porosity to differences in throat restriction, pore arrangement, and pore geometry. The remaining question is whether the spread in K reflects only heterogeneity or whether it still falls within physically reasonable elastic limits.

4.3. Effective-Medium Bounds and Modeled Pore-Geometry Effects

The effective-medium analysis is not used here to infer a unique pore geometry, but to test whether the observed K–ϕt variability can be bracketed within plausible elastic responses. In this sense, ARKT and ϕc are treated as model-supported intervals conditioned by the adopted solid matrix properties (e.g., Km, μm). Recent work on igneous rocks likewise shows that mineralogical composition can be used to estimate the elastic properties of the solid fraction before pore effects are introduced through effective-medium models [75]. Because mineralogical differences among the studied units are modest relative to the observed reduction in K, matrix composition alone is unlikely to explain the main spread in the K–ϕt data. Under this interpretation, sensitivity tests using alternative effective-solid scenarios show only modest shifts in the best-fit parameters (ARKT = 0.162–0.182; ϕc = 0.474–0.518; Supplementary Table S2), indicating that the main elastic interpretation is stable to plausible matrix uncertainty.
Using this common solid reference, all measured K–ϕt values lie within the broader elastic region bounded by the Hashin–Shtrikman lower limit and the Voigt–HS+ upper domain, while the VRH curve follows the central tendency of the dataset (Figure 11a). This shows that the studied ignimbrites, despite textural heterogeneity, still occupy a physically admissible elastic space. The two porosity groups remain distinguishable within that space, confirming that ϕt controls the decrease in K. At the same time, samples with similar porosity do not occupy the same position. This additional spread is compatible with differences in effective pore compliance and, secondarily, with sample-scale textural heterogeneity, as also suggested by the broader lithic-fragment size distributions observed in some units (Figure 3b). The pore-network tendencies described in Section 4.2 therefore do not define separate elastic classes, but they do help explain part of the scatter within the admissible domain. Accordingly, similar pore volumes can produce different K values because they do not impose the same effective compliance on the load-bearing structure. A comparable spread has been reported in ignimbrites, where elastic moduli vary within similar porosity ranges because of differences in microstructure and pore compressibility [13].
The KT trajectories refine this interpretation by showing that much of the residual spread falls within a relatively narrow interval of effective pore compliance (Figure 11b). Here, ARKT is used explicitly as an effective modeling parameter, not as a directly measured pore descriptor. Its role is to summarize the elastic effect of mixed pore systems at the specimen scale. Under the baseline matrix reference, the low-misfit core lies at ARKT = 0.161–0.175, and sensitivity tests using alternative effective-solid scenarios show that the best-fit value varies only from 0.162 to 0.182 (Supplementary Table S2). Because the low-misfit cores across all matrix scenarios collectively span about 0.156–0.191, the broader interval 0.15–0.20 is retained only as a rounded bracketing range for the full KT corridor shown in Figure 11b. Together, these results suggest that the stiffness reduction can be represented, at the specimen scale, by a limited range of equivalent pore compliances even though the observed pore systems are texturally diverse. This also helps explain why units that differ strongly in permeability do not separate by the same magnitude in K: permeability depends on the narrowest connected flow paths, whereas bulk modulus reflects a more spatially averaged response of the load-bearing structure. Within this range, the more crack-like and throat-restricted systems commonly plot toward the more compliant side, whereas the less restricted and more equant systems more commonly occupy the stiffer side. However, the overlap among units remains substantial, and cases such as Spl show that elastic behavior cannot be assigned uniquely to a single textural class. This interpretation agrees with recent studies showing that a limited range of effective aspect ratios can account, to first order, for the elastic behavior of rocks with complex and mixed pore systems [38,76,77].
The critical-porosity (ϕc) formulation provides a second, complementary constraint. In rock physics, ϕc defines an elastic scale for the transition from a clearly load-bearing framework to a much more compliant state as porosity increases toward a suspension-like limit [9,33]. For the ignimbrites studied here, the tested trajectories indicate that the dataset remains in a subcritical domain, but one in which K is already highly sensitive to pore compliance. Under the baseline matrix reference, the lowest-misfit value lies near ϕc = 0.49. Bootstrap resampling yields a percentile-based 95% interval of 0.477–0.503 (Supplementary Table S3), and sensitivity tests across alternative effective-solid scenarios shift the best-fit value only from 0.474 to 0.518. The broader interval ϕc ≈ 40–60% is therefore retained only as a bracketing range for the dataset, not as an interval or unique optimum. This range is slightly higher than the ~40% critical-porosity reference commonly cited for clean sandstones [34], which is reasonable for pore systems that are more heterogeneous and texturally mixed than those of clastic rocks.
Taken together, the HS and KT results are best used to bound the elastic behavior of the studied ignimbrites, not to infer a unique pore-scale geometry. When the exact pore structure is unknown, effective-medium models are most useful for restricting the elastic responses compatible with a given porosity scale and a limited range of effective pore compliance [36,38,78,79,80]. Texturally different pore systems may therefore converge toward similar bulk elastic responses if, at the specimen scale, they impose comparable effective compliance on the load-bearing structure [32,81]. Under this interpretation, ARKT ≈ 0.15–0.20 and ϕc ≈ 40–60% are best understood as model-supported bounds for the present dataset, rather than as fixed properties of ignimbrites or universal thresholds for stiffness loss.

4.4. Engineering Implications for Porous Ignimbrite Characterization

For engineering characterization and reservoir-analog studies, the main practical implication is that porous ignimbrites within a similar porosity interval should not be assumed to represent the same mechanical or hydraulic state. Published case studies already illustrate a wide operational range: in central Italy, matrix porosity varies from 14 to 19% in a more welded ignimbrite to 41–50% in a less welded one [72], whereas laboratory measurements on Campanian Ignimbrite tuff yielded an average total porosity of 51% and an intrinsic permeability (k) of 4.70 × 10⁻¹³ m2 [15]. At Campi Flegrei, water permeability can differ by about 1.5 orders of magnitude between two ignimbrites [13]. Within this broader published spectrum, the present dataset (ϕt > 25%) represents an intermediate-to-high porosity range. Accordingly, porosity is useful for placing an ignimbrite within a broad stiffness field, but it is not sufficient on its own to rank frame rigidity or flow efficiency. That ranking requires additional descriptors linked to pore-space organization, particularly Vp/Vs, throat restriction, and pore-network architecture.
From a modeling perspective, the interval ϕc ≈ 40–60% identified here is best treated as an operational porosity window in which porosity-only predictions become least robust, because frame stiffness becomes especially sensitive to pore geometry. In practical terms, porosity can be used to position the rock within a general elastic field, whereas Vp/Vs may provide only a secondary screening parameter when interpreted jointly with porosity, throat restriction, and pore-network descriptors [67]. SEM and MIP-based descriptors, considered together with effective-medium bounds, can then be used to assess whether transport properties are likely to diverge from the stiffness trend. This distinction is important because permeability in volcanic rocks depends strongly on the narrowest connected flow paths [47]. More broadly, review-scale syntheses and geothermal case studies show that hydrothermal alteration, fracture inheritance, and rock type can weaken simple property correlations under subsurface conditions [71,73]. The workflow proposed here should therefore be used as a screening framework to bracket likely elastic behavior and to identify cases in which transport properties may diverge from stiffness, rather than as a direct predictor of in situ reservoir performance.
A limitation of this study is that both ultrasonic velocities and permeability were measured on dry specimens. This design is suitable for isolating effects related to the structure and pore network under standard laboratory conditions, but it does not replicate in situ fluid saturation and stress-dependent behavior. In volcanic rocks, both fluid type and effective pressure can modify transport and elastic properties; gas permeability measured at low pressure may therefore differ substantially from liquid permeability under subsurface conditions [22,47]. The absolute values reported here should therefore be interpreted as laboratory reference values used to compare how porosity and pore-network architecture organize relative elastic and transport characteristics among ignimbrites. Because the analysis is based on laboratory measurements and specimen-scale modeling, the proposed workflow is best treated as a screening tool. Future work should test how these relations change under fluid saturation, effective stress, temperature, and directional measurements, and should incorporate 3D imaging approaches such as micro-CT to better constrain pore topology and its relation to effective pore compliance.

5. Conclusions

This study shows that highly porous ignimbrites cannot be described by porosity alone: rocks with similar pore volume can still display different elastic and hydraulic behavior when their pore networks differ.
  • Porous ignimbrites with similar total porosity (ϕt) can occupy different elastic and hydraulic states when their pore networks differ. Across this dataset, bulk modulus and Vp decrease with increasing porosity, but the spread at similar porosity is too large to be explained by pore volume alone.
  • The clearest additional control is expressed in permeability (k). Crack-linked, throat-restricted networks tend to be less permeable and commonly more compliant, whereas more equant or intergranular networks tend to sustain higher permeability and, in many cases, higher stiffness. This partial decoupling shows that stiffness and flow are not governed by the same pore attributes.
  • Effective-medium analysis is most useful here as a bounding tool. The measured K–ϕt data fall within a physically admissible dry-frame domain, and most samples are compatible with KT aspect ratios (ARKT) of 0.15–0.20. Under the baseline matrix reference, the lowest-misfit critical porosity (ϕc) is near 0.49, while 40–60% is better regarded as a bracketing interval for this dataset.
  • From an applied perspective, the combined use of porosity, pore-network descriptors, permeability, and effective-medium bounds provides a practical framework for identifying cases in which transport behavior may diverge from stiffness. Because the analysis is based on dry laboratory measurements and specimen-scale modeling, this workflow should be viewed as a screening method rather than a direct indicator of the reservoir’s in situ behavior.

Supplementary Materials

The following supporting information can be downloaded at: https://www.mdpi.com/article/10.3390/app16084031/s1, Table S1: Kruskal–Wallis omnibus tests for the principal specimen-scale petrophysical variables discussed in the manuscript; Table S2: Sensitivity of effective pore aspect ratio and critical porosity to alternative effective-solid scenarios; Table S3: Bootstrap stability of effective aspect ratio and critical porosity.

Author Contributions

H.S.: Conceptualization, Investigation, Methodology, Laboratory analysis, Programming, Writing—original draft, Writing—review and editing. A.P.: Conceptualization, Investigation, Methodology, Project administration, Resources, Supervision, Writing—original draft, Writing—review and editing. All authors have read and agreed to the published version of the manuscript.

Funding

This research received no external funding.

Institutional Review Board Statement

Not applicable.

Informed Consent Statement

Not applicable.

Data Availability Statement

The original data presented in the study are openly available in Zenodo at https://doi.org/10.5281/zenodo.19223501.

Acknowledgments

H. Sereno gratefully acknowledges the SECIHTI PhD Mexican Scholarship Program (scholarship No. 898707) and the Posgrado en Ciencias de la Tierra, Universidad Nacional Autónoma de México (UNAM). Laboratory tests were carried out at the Petrophysics Laboratory of ENES Morelia, UNAM. The ultrasonic equipment used in this study was acquired with resources from the PAPIIT project IN102325.

Conflicts of Interest

The authors declare no conflicts of interest.

References

  1. Quane, S.L.; Russell, J.K. Ranking welding intensity in pyroclastic deposits. Bull. Volcanol. 2005, 67, 129–143. [Google Scholar] [CrossRef] [Scilit]
  2. Sulpizio, R.; Dellino, P.; Doronzo, D.M.; Sarocchi, D. Pyroclastic density currents: State of the art and perspectives. J. Volcanol. Geotherm. Res. 2014, 283, 36–65. [Google Scholar] [CrossRef] [Scilit]
  3. Giordano, G.; Cas, R.A.F. Classification of ignimbrites and their eruptions. Earth-Sci. Rev. 2021, 220, 103697. [Google Scholar] [CrossRef] [Scilit]
  4. Weydt, L.M.; Lucci, F.; Laćinska, A.; Scheuvens, D.; Carrasco-Núñez, G.; Giordano, G.; Rochelle, C.A.; Schmidt, S.; Bär, K.; Sass, I. The impact of hydrothermal alteration on the physiochemical characteristics of reservoir rocks: The case of the Los Humeros geothermal field (Mexico). Geotherm. Energy 2022, 10, 20. [Google Scholar] [CrossRef] [Scilit]
  5. Korkanç, M.; Solak, B. Estimation of engineering properties of selected tuffs by using grain/matrix ratio. J. Afr. Earth Sci. 2016, 120, 160–172. [Google Scholar] [CrossRef] [Scilit]
  6. Asniar, N.; Purwana, Y.M.; Surjandari, N.S. Tuff as rock and soil: Review of the literature on tuff geotechnical, chemical, and mineralogical properties around the world and in Indonesia. AIP Conf. Proc. 2019, 2114, 050022. [Google Scholar] [CrossRef] [Scilit]
  7. Tomac, I.; Sauter, M. A review on challenges in the assessment of geomechanical rock performance for deep geothermal reservoir development. Renew. Sustain. Energy Rev. 2018, 82, 3972–3980. [Google Scholar] [CrossRef] [Scilit]
  8. Thiele, S.T.; Kereszturi, G.; Heap, M.J.; de Lima Ribeiro, A.; Kamath, A.V.; Kidd, M.; Tramontini, M.; Rosas-Carbajal, M.; Gloaguen, R. Hyperspectral mapping of density, porosity, stiffness, and strength in hydrothermally altered volcanic rocks. Solid Earth 2025, 16, 1249–1267. [Google Scholar] [CrossRef] [Scilit]
  9. Mavko, G.; Mukerji, T.; Dvorkin, J. The Rock Physics Handbook: Tools for Seismic Analysis of Porous Media, 2nd ed.; Cambridge University Press: Cambridge, UK, 2009. [Google Scholar] [CrossRef] [Scilit]
  10. Vanorio, T.; Prasad, M.; Patella, D.; Nur, A. Ultrasonic velocity measurements in volcanic rocks: Correlation with microtexture. Geophys. J. Int. 2002, 149, 22–36. [Google Scholar] [CrossRef] [Scilit]
  11. Omovie, S.J.; Myers, M.; Castagna, J.P. Acoustic dispersion in low permeability unconventional reservoir rocks and shales at in situ stress conditions. Minerals 2022, 12, 1180. [Google Scholar] [CrossRef] [Scilit]
  12. Zhang, J.; Yin, X.Y.; Gu, Y.P.; Zhou, Y.Q. Sandstone reservoir rock physics modeling and time-lapse seismic analysis. J. Appl. Geophys. 2024, 222, 105318. [Google Scholar] [CrossRef] [Scilit]
  13. Heap, M.J.; Baud, P.; Meredith, P.G.; Vinciguerra, S.; Reuschlé, T. The permeability and elastic moduli of tuff from Campi Flegrei, Italy: Implications for ground deformation modelling. Solid Earth 2014, 5, 25–44. [Google Scholar] [CrossRef] [Scilit]
  14. Durán, E.L.; Adam, L.; Wallis, I.C.; Barnhoorn, A. Mineral alteration and fracture influence on the elastic properties of volcaniclastic rocks. J. Geophys. Res. Solid Earth 2019, 124, 4576–4600. [Google Scholar] [CrossRef] [Scilit]
  15. Buono, G.; Caliro, S.; Macedonio, G.; Allocca, V.; Gamba, F.; Pappalardo, L. Exploring microstructure and petrophysical properties of microporous volcanic rocks through 3D multiscale and super-resolution imaging. Sci. Rep. 2023, 13, 6651. [Google Scholar] [CrossRef] [Scilit]
  16. Cavazos-Álvarez, J.A.; Carrasco-Núñez, G.; Dávila-Harris, P.; Peña, D.; Jáquez, A.; Arteaga, D. Facies variations and permeability of ignimbrites in active geothermal systems: Case study of the Xáltipan ignimbrite at Los Humeros Volcanic Complex. J. S. Am. Earth Sci. 2020, 104, 102810. [Google Scholar] [CrossRef] [Scilit]
  17. Castro-Colín, A.; Pola, A.; Sereno, H.; Pérez-Orozco, J.D.; Gómez-Vasconcelos, M.G.; Alonso-Guzmán, E.M. Welding degree assessment of the Escalera Ignimbrite in Central Mexico: Insights from physical and mechanical properties. J. Volcanol. Geotherm. Res. 2025, 468, 108473. [Google Scholar] [CrossRef] [Scilit]
  18. Moon, V.G. Microstructural controls on the geomechanical of ignimbrite. Eng. Geol. 1993, 35, 19–31. [Google Scholar] [CrossRef] [Scilit]
  19. Markov, M.; Kazatchenko, E.; Mousatov, A.; Pervago, E. Novel approach for simulating the elastic properties of porous rocks including the critical porosity phenomena. Geophysics 2013, 78, L37–L44. [Google Scholar] [CrossRef] [Scilit]
  20. Cheng, W.; Ba, J.; Fu, L.Y.; Lebedev, M. Wave-velocity dispersion and rock microstructure. J. Pet. Sci. Eng. 2019, 183, 106466. [Google Scholar] [CrossRef] [Scilit]
  21. Heap, M.J.; Geyer, A.; Dibben, J.; Hickey, J.; Gisbert, G.; Vilanova-Pagès, O.; Ibañez-Insa, J.; Polo-Sánchez, A.; Giralt, S.; Moulin, M.; et al. Petrophysical properties of hydrothermally-altered pyroclastic deposits from Deception Island (Bransfield Strait, Antarctica). J. Volcanol. Geotherm. Res. 2025, 466, 108399. [Google Scholar] [CrossRef] [Scilit]
  22. Clarke, J.; Adam, L.; van Wijk, K.; Sarout, J. The influence of fluid type on elastic wave velocity and attenuation in volcanic rocks. J. Volcanol. Geotherm. Res. 2020, 403, 107004. [Google Scholar] [CrossRef] [Scilit]
  23. Flint, L.E.; Selker, J.S. Use of porosity to estimate hydraulic properties of volcanic tuffs. Adv. Water Resour. 2003, 26, 561–571. [Google Scholar] [CrossRef] [Scilit]
  24. Cid, H.E.; Carrasco-Núñez, G.; Manea, V.C.; Vega, S.; Castaño, V. The role of microporosity on the permeability of volcanic-hosted geothermal reservoirs: A case study from Los Humeros, Mexico. Geothermics 2021, 90, 102020. [Google Scholar] [CrossRef] [Scilit]
  25. Cai, C.; Li, J.; Zhai, C.; Wang, B.; Xue, J.; Dong, Z.; Zhu, Z. Crack propagation characteristics in shale under cyclic in situ methane detonation impact fracturing. Energy Fuels 2026, 40, 6064–6082. [Google Scholar] [CrossRef] [Scilit]
  26. Pereira, M.L.; Pappalardo, L.; Buono, G.; Cueto, N.; Vázquez-Calvo, C.; Fort, R.; Costa e Silva, M.; Fernandes, I.; Zanon, V.; Amaral, P. A multi-method approach in the physical and mechanical assessment of lava rocks with distinct microstructure. Eng. Geol. 2025, 346, 107907. [Google Scholar] [CrossRef] [Scilit]
  27. Akamatsu, Y.; Suzuki, T.; Tada, N.; Sawayama, K.; Ichihara, H.; Katayama, I.; Sakamoto, G.; Yamamoto, Y.; Maeno, F.; Yoshida, K. Variations in pore structure in subaerial lava flows at Nishinoshima, Japan, inferred from physical properties. J. Volcanol. Geotherm. Res. 2025, 458, 108262. [Google Scholar] [CrossRef] [Scilit]
  28. Hashin, Z.; Shtrikman, S. A variational approach to the theory of the elastic behaviour of multiphase materials. J. Mech. Phys. Solids 1963, 11, 127–140. [Google Scholar] [CrossRef] [Scilit]
  29. Kuster, G.T.; Toksöz, M.N. Velocity and attenuation of seismic waves in two-phase media: Part I, Theoretical formulations. Geophysics 1974, 39, 587–618. [Google Scholar] [CrossRef] [Scilit]
  30. Kuster, G.T.; Toksöz, M.N. Velocity and attenuation of seismic waves in two-phase media: Part II. Experimental results. Geophysics 1974, 39, 607–618. [Google Scholar] [CrossRef] [Scilit]
  31. Berryman, J.G. Long-wavelength propagation in composite elastic media I. Spherical inclusions. J. Acoust. Soc. Am. 1980, 68, 1809–1819. [Google Scholar] [CrossRef] [Scilit]
  32. Berryman, J.G. Evaluating bounds and estimators for constants of random polycrystals composed of orthotropic elastic materials. Int. J. Eng. Sci. 2012, 58, 11–20. [Google Scholar] [CrossRef] [Scilit]
  33. Nur, A.; Mavko, G.; Dvorkin, J.; Gal, D. Critical porosity: The key to relating physical properties to porosity in rocks. In Proceedings of the 1995 SEG Annual Meeting, Houston, TX, USA, 1 January 1995; pp. 878–881. [Google Scholar] [CrossRef] [Scilit]
  34. Mavko, G.; Mukerji, T. Comparison of the Krief and critical porosity models for prediction of porosity and VP/VS. Geophysics 1998, 63, 925–927. [Google Scholar] [CrossRef] [Scilit]
  35. Fournier, F.; Borgomano, J. Critical porosity and elastic properties of microporous mixed carbonate-siliciclastic rocks. Geophysics 2009, 74, E93–E109. [Google Scholar] [CrossRef] [Scilit]
  36. Ceia, M.; Misságia, R.; Neto, I.L. Pressure effects in Nur’s critical porosity model estimates for carbonate rocks. J. Appl. Geophys. 2022, 196, 104498. [Google Scholar] [CrossRef] [Scilit]
  37. Falahat, R.; Farrokhnia, F. Rock physics modelling of the carbonate reservoirs: A log-based algorithm to determine the pore aspect ratio. J. Appl. Geophys. 2020, 173, 103930. [Google Scholar] [CrossRef] [Scilit]
  38. Queiroz, L.E.; Grana, D.; Fernandes, C.P.; Mukerji, T.; de Figueiredo, L.P.; Mantovani, I.F. Estimation of equivalent pore aspect ratio in rock physics models and validation using digital rocks. Geosciences 2025, 15, 67. [Google Scholar] [CrossRef] [Scilit]
  39. Pola, A.; Macías, J.L.; Martínez-Martínez, J.; Crosta, G.; Fusi, N.; Garduño-Monroy, V.H.; Núñez-Hurtado, J.A. Geomechanical characterization of the Miocene Cuitzeo ignimbrites, Michoacán, Central Mexico. Eng. Geol. 2016, 214, 79–93. [Google Scholar] [CrossRef] [Scilit]
  40. Martínez-Martínez, J.; Pola, A.; García-Sánchez, L.; Reyes-Agustin, G.; Osorio-Ocampo, L.S.; Macías Vázquez, J.L.; Robles-Camacho, J. Building stones used in the architectural heritage of Morelia (México): Quarries location, rock durability and stone compatibility in the monument. Environ. Earth Sci. 2018, 77, 167. [Google Scholar] [CrossRef] [Scilit]
  41. García-Sánchez, L.; Macías, J.L.; Sulpizio, R.; Osorio-Ocampo, L.S.; Pellicioli, C.; Pola, A.; Avellán, D.; Cisneros, G.; García, F.; Ocampo-Díaz, Y.Z.E.; et al. Geology of La Reforma caldera complex, Baja California, Mexico. J. Maps 2019, 15, 487–498. [Google Scholar] [CrossRef] [Scilit]
  42. Osorio-Ocampo, L.S.; García-Sánchez, L.; Lira-Beltrán, R.M.; Macías, J.L.; Pola, A.; Avellán, D.; Ernesto-Ocampo, Y.Z.; Groppelli, G.; Sulpizio, R.; García, F.; et al. Volcanic and marine stratigraphy along the El Álamo Canyon, Santa Rosalía Basin, Baja California Sur. Geol. Soc. Am. Fieldtrip Guide 2019, 55, 187–208. [Google Scholar] [CrossRef] [Scilit]
  43. Trujillo-Hernández, N.; Garduño-Monroy, V.H.; Jiménez-Haro, A.; Gómez-Álvarez, F.; Nájera-Blas, S.M.; Israde-Alcántara, I.; Layer, P. Estratigrafía volcánica de la porción suroeste del Lago de Cuitzeo y su relación con la formación de la caldera tipo graben de Chucándiro. Rev. Mex. Cienc. Geol. 2022, 39, 100–115. [Google Scholar] [CrossRef] [Scilit]
  44. ASTM D4543-19; Standard Practices for Preparing Rock Core Specimens and Determining Dimensional and Shape Tolerances. ASTM International: West Conshohocken, PA, USA, 2019. [CrossRef] [Scilit]
  45. Derkowski, A.; Kuligiewicz, A. Thermal Analysis and Thermal Reactions of Smectites: A Review of Methodology, Mechanisms, and Kinetics. Clays Clay Miner. 2022, 70, 946–972. [Google Scholar] [CrossRef] [Scilit]
  46. Gasparini, E.; Tarantino, S.C.; Ghigna, P.; Riccardi, M.P.; Cedillo-González, E.I.; Siligardi, C.; Zema, M. Thermal dehydroxylation of kaolinite under isothermal conditions. Appl. Clay Sci 2013, 80–81, 417–425. [Google Scholar] [CrossRef] [Scilit]
  47. Heap, M.J.; Reuschlé, T.; Farquharson, J.I.; Baud, P. Permeability of volcanic rocks to gas and water. J. Volcanol. Geotherm. Res. 2018, 354, 29–38. [Google Scholar] [CrossRef] [Scilit]
  48. Diamond, S.; Dolch, W.L. Generalized log-normal distribution of pore sizes in hydrated cement paste. J. Colloid. Interface Sci. 1972, 38, 234–244. [Google Scholar] [CrossRef] [Scilit]
  49. Rahimpour-Bonab, H.; Aliakbardoust, E. Pore facies analysis: Incorporation of rock properties into pore geometry based classes in a Permo-Triassic carbonate reservoir in the Persian Gulf. J. Geophys. Eng. 2014, 11, 035008. [Google Scholar] [CrossRef] [Scilit]
  50. Thommes, M.; Kaneko, K.; Neimark, A.V.; Olivier, J.P.; Rodriguez-Reinoso, F.; Rouquerol, J.; Sing, K.S.W. Physisorption of gases, with special reference to the evaluation of surface area and pore size distribution (IUPAC Technical Report). Pure Appl. Chem. 2015, 87, 1051–1069. [Google Scholar] [CrossRef] [Scilit]
  51. Giesche, H. Mercury porosimetry: A general (practical) overview. Part. Part. Syst. Charact. 2006, 23, 9–19. [Google Scholar] [CrossRef] [Scilit]
  52. ASTM D5550-14; Standard Test Method for Specific Gravity of Soil Solids by Gas Pycnometer. ASTM International: West Conshohocken, PA, USA, 2014. [CrossRef] [Scilit]
  53. ASTM D7263-21; Standard Test Methods for Laboratory Determination of Density (Unit Weight) of Soil Specimens. ASTM International: West Conshohocken, PA, USA, 2021. [CrossRef] [Scilit]
  54. International Society on Rock Mechanics. The Complete ISRM Suggested Methods for Rock Characterization, Testing and Monitoring; Ulusay, R., Hudson, J.A., Eds.; ISRM: Lisbon, Portugal, 2007; 628p. [Google Scholar] [CrossRef] [Scilit]
  55. ASTM D4525-13; Standard Test Method for Permeability of Rocks by Flowing Air. ASTM International: West Conshohocken, PA, USA, 2018. [CrossRef] [Scilit]
  56. Putz, H.; Brandenburg, K. Match!: Phase Analysis Using Powder Diffraction, version 3.15; Crystal Impact: Bonn, Germany, 2003; Available online: https://www.crystalimpact.de/match (accessed on 2 September 2025).
  57. Berryman, J.G. Mixture theories for rock properties. In Rock Physics and Phase Relations: A Handbook of Physical Constants; Ahrens, T.J., Ed.; American Geophysical Union: Washington, DC, USA, 1995; pp. 205–228. [Google Scholar] [CrossRef] [Scilit]
  58. Liu, Z.; Sun, S.Z. The differential Kuster-Toksöz rock physics model for predicting S-wave velocity. J. Geophys. Eng. 2015, 12, 839–848. [Google Scholar] [CrossRef] [Scilit]
  59. Chigira, M.; Nakamoto, M.; Nakata, E. Weathering mechanisms and their effects on the landsliding of ignimbrite subject to vapor-phase crystallization in the Shirakawa pyroclastic flow, northern Japan. Eng. Geol. 2002, 66, 111–125. [Google Scholar] [CrossRef] [Scilit]
  60. Columbu, S.; Mulas, M.; Mundula, F.; Cioni, R. Strategies for helium pycnometry density measurements of welded ignimbritic rocks. Measurement 2021, 173, 108640. [Google Scholar] [CrossRef] [Scilit]
  61. Wyering, L.D.; Villeneuve, M.C.; Wallis, I.C.; Siratovich, P.A.; Kennedy, B.M.; Gravley, D.M.; Cant, J.L. Mechanical and physical properties of hydrothermally altered rocks, Taupo Volcanic Zone, New Zealand. J. Volcanol. Geotherm. Res. 2014, 288, 76–93. [Google Scholar] [CrossRef] [Scilit]
  62. Heap, M.J.; Gravley, D.M.; Kennedy, B.M.; Gilg, H.A.; Bertoletti, E.; Barker, S.L.L. Quantifying the role of hydrothermal alteration in creating geothermal and epithermal mineral resources: The Ohakuri ignimbrite (Taupō Volcanic Zone, New Zealand). J. Volcanol. Geotherm. Res. 2020, 399, 106703. [Google Scholar] [CrossRef] [Scilit]
  63. Sruoga, P.; Rubinstein, N.; Hinterwimmer, G. Porosity and permeability in volcanic rocks: A case study on the Serie Tobífera, South Patagonia, Argentina. J. Volcanol. Geotherm. Res. 2004, 132, 31–43. [Google Scholar] [CrossRef] [Scilit]
  64. Bär, K.; Reinsch, T.; Bott, J. P3: PetroPhysical Property Database [Data Set]. GFZ Data Services. 2019. Available online: https://dataservices.gfz-potsdam.de/panmetaworks/showshort.php?id=escidoc:2263895 (accessed on 17 April 2026).
  65. Salah, M.K.; Alqudah, M.; David, C. Acoustics and petrophysical investigations on upper cretaceous carbonate rocks from northern Lebanon. J. Afr. Earth Sci. 2020, 172, 103955. [Google Scholar] [CrossRef] [Scilit]
  66. Fabricius, I.L.; Baechle, G.; Eberli, G.P.; Weger, R. Estimating permeability of carbonate rocks from porosity and Vp/Vs. Geophysics 2007, 72, E185–E191. [Google Scholar] [CrossRef] [Scilit]
  67. Aguilera-Bustos, J.P.; Adam, L. Experimental insights into factors influencing Vp/Vs ratios at the Nevado del Ruiz Volcano, Colombia. Volcanica 2023, 6, 283–299. [Google Scholar] [CrossRef] [Scilit]
  68. Di Martino, M.D.P.; De Siena, L.; Tisato, N. Pore space topology controls ultrasonic waveforms in dry volcanic rocks. Geophys. Res. Lett. 2022, 49, e2022GL100310. [Google Scholar] [CrossRef] [Scilit]
  69. Wright, H.M.N.; Cashman, K.V.; Gottesfeld, E.H.; Roberts, J.J. Pore structure of volcanic clasts: Measurements of permeability and electrical conductivity. Earth Planet. Sci. Lett. 2009, 280, 93–104. [Google Scholar] [CrossRef] [Scilit]
  70. Gu, Z.; Goulet, R.; Levitz, P.; Ihiawakrim, D.; Ersen, O.; Bazant, M.Z. Mercury cyclic porosimetry: Measuring pore-size distributions corrected for both pore-space accessivity and contact-angle hysteresis. J. Colloid. Interface Sci. 2021, 599, 255–261. [Google Scholar] [CrossRef] [Scilit]
  71. Pereira, M.L.; Zanon, V.; Fernandes, I.; Pappalardo, L.; Viveiros, F. Hydrothermal alteration and physical and mechanical properties of rocks in a volcanic environment: A review. Earth-Sci. Rev. 2024, 252, 104754. [Google Scholar] [CrossRef] [Scilit]
  72. Allocca, V.; Colantuono, P.; Colella, A.; Piacentini, S.M.; Piscopo, V. Hydraulic properties of ignimbrites: Matrix and fracture permeabilities in two pyroclastic flow deposits from Cimino-Vico volcanoes (Italy). Bull. Eng. Geol. Environ. 2022, 81, 221. [Google Scholar] [CrossRef] [Scilit]
  73. Ramírez-Guzmán, Á.; Pola, A.; Macías, J.L.; Soto-Herrera, A.M.; Avellán, D.R.; Pacheco-Valdovinos, P.M.; Martínez-Martínez, J. The influence of alteration and fractures on gas permeability and mechanical properties of the sedimentary and volcanic rocks of the Acoculco Caldera Complex (México). Bull. Eng. Geol. Environ. 2024, 83, 41. [Google Scholar] [CrossRef] [Scilit]
  74. Zheng, H.; Sun, X.; Zhu, D.; Tian, J.; Wang, P.; Zhang, X. Characteristics and factors controlling reservoir space in the Cretaceous volcanic rocks of the Hailar Basin, NE China. Mar. Pet. Geol. 2018, 91, 749–763. [Google Scholar] [CrossRef] [Scilit]
  75. Aligholi, S.; Khandelwal, M. Computing elastic moduli of igneous rocks using modal composition and effective medium theory. Geosciences 2022, 12, 413. [Google Scholar] [CrossRef] [Scilit]
  76. Fournier, F.; Pellerin, M.; Villeneuve, Q.; Teillet, T.; Hong, F.; Poli, E.; Borgomano, J.; Léonide, P.; Hairabian, A. The equivalent pore aspect ratio as a tool for pore type prediction in carbonate reservoirs. Am. Assoc. Pet. Geol. Bull. 2018, 102, 1343–1377. [Google Scholar] [CrossRef] [Scilit]
  77. Cilli, P.A.; Chapman, M. The power-law relation between inclusion aspect ratio and porosity: Implications for electrical and elastic modeling. J. Geophys. Res. Solid Earth 2020, 125, e2020JB019187. [Google Scholar] [CrossRef] [Scilit]
  78. Zhang, J.; Yin, Y.; Zhang, G. Rock physics modelling of porous rocks with multiple pore types: A multiple-porosity variable critical porosity model. Geophys. Prospect. 2020, 68, 955–967. [Google Scholar] [CrossRef] [Scilit]
  79. Spires, K.L.; Castagna, J.P.; Omovie, S.J. Empirical determination of the effective solid modulus in organic-rich shales. Sci. Rep. 2023, 13, 18343. [Google Scholar] [CrossRef] [Scilit]
  80. Quadros, P.S.M.; de Figueiredo, J.J.S.; Serra, V.F.H.; Aum, P.T.P.; da Rocha, H.O.; Brelaz, L.C.; Lucas, C.R.D.S. Integrative rock physics and computer vision analysis of elastic properties and pore aspect ratios in Brazilian pre-salt carbonates. Sci. Rep. 2025, 15, 33467. [Google Scholar] [CrossRef] [Scilit]
  81. Wang, Z.; Zhang, Q.; Liu, J.; Fu, L.Y. Effective moduli of rocks predicted by the Kuster-Toksöz and Mori-Tanaka models. J. Geophys. Eng. 2021, 18, 539–557. [Google Scholar] [CrossRef] [Scilit]
Figure 1. Location map of rock samples collected. (a) illustrative map of the central part of Mexico, including the trace of the Trans-Mexican Volcanic Belt (TMVB) (black dashed line), the most representative cities (black circles), as well as the site where samples were collected (white star). (b) regional map showing where Spl, Mpl, Tl, Ja, Co, and Pv samples were collected. (c) illustrative map of the Baja California Peninsula, including some structural guidelines, the most representative cities, and the location where the samples were collected. (d) Regional map showing where Aj sample was collected. Abbreviations: Guadalajara (G), Morelia (Mo), Mexico City (Me), Santa Rosalía (SR), Los Mochis (LM), La Paz (LP), Sierra de Mil Cumbres (SMC), Aguajito Caldera Complex (ACC), La Reforma Caldera Complex (RCC), Tres Virgenes Volcanic Complex (TVVC).
Applsci 16 04031 g001
Figure 2. AV—Ultrasonic Velocity equipment mounted on a GDS 250 kN infinite-stiffness load frame. (a) Panoramic view of the equipment. (b) Schematic view of the equipment. (c) Base of the GDS triaxial cell, where P and S-wave receivers are mounted. (d) Representative signal-processing workflow used for first-arrival picking: (d1) raw waveform trimmed to the analysis window, (d2) filtered and normalized waveform, and (d3) time–frequency representation used to identify the first arrival.
Applsci 16 04031 g002
Figure 3. Representative images of the studied samples. (a) Lithic fragments, juvenile glass, crystal fragments, and flattened pumice clasts (fiammes) embedded in a vitreous matrix are observed in each specimen. (b) The normalized lithic fragment area as a function of Feret diameter (Df). The average sizes of the lithic fragments of each sample are represented by the symbol and color assigned to that sample. The uniformity coefficient (Cu) is also included, which reflects the dispersion of lithic particle sizes (the higher the values, the greater the variability).
Applsci 16 04031 g003
Figure 4. Optical scans of representative samples. (a) Subrounded lithics and fibrous pumice. (b) Lithic and pumice in layers. (c) Pumices. (d) Vitric pumices > 1 cm. (e,f) Dense lithics and broken phenocrystals. (g) Dense and porous lithics. (h) Detailed view of layers. Abbreviations: Pumice (Pu), Lithic (Li).
Applsci 16 04031 g004
Figure 5. Photomicrographs of parallel nicols at the top and crossed nicols at the bottom. (a) Quartz and plagioclase in a glassy matrix. (b) Quartz in a partially devitrified matrix. (c) quartz in a devitrified matrix. (d) Quartz in a glassy matrix and pores. (e) Quartz, feldspar, clinopyroxene, and flattened pumices. (f) Quartz and devitrified shards. (g) Quartz and pumices. (h) Deformed shards and devitrified rims. Abbreviations: plg (plagioclase), qz (quartz), gm (glassy matrix), mqz (quartz microlites), pr (pores), fgf (flattened glass fragments), cpx (clinopyroxene), sh (shards), dsh (deformed shards).
Applsci 16 04031 g005
Figure 6. Correlations between porosity-related properties: (a) bulk density (ρb) as a function of total porosity (ϕt) where the red dashed line shows the trend reported for previously published ignimbrite datasets and the black dashed line shows the fitted trend for the samples analyzed here [61]; (b) open porosity (ϕo) versus total porosity (ϕt) where the red dashed line represents the identity line (1:1) and the black dashed line shows the fitted trend for the studied samples. The green polygon marks the dispersion between trends, and RMSE and MAPE values are indicated.
Applsci 16 04031 g006
Figure 7. Scanning electron microscope (SEM) images. (a) Large matrix–lithic contact. (b) Devitrified matrix and pores aligned along the edges of glass fragments; dense and porous microdomains are visible. (c) Microfractures connecting pores; needle-like, elongated channels are visible. (d) Fine-pore network in a high-density matrix dominated by closed pores. (e) Elongated pores; bottleneck-shaped pores at the mesoporous scale. (f) Pores are mostly equant to slightly elongated; quartz microlites are visible. (g) Intergranular pores between crystals and lithics; triple-junction pores of granular-packing type. (h) Microporosity associated with devitrification and a poorly consolidated matrix; pores aligned along the edges of glass fragments and quartz microliths (channel-type connections).
Applsci 16 04031 g007
Figure 8. Pore distribution from mercury intrusion porosimetry (MIP). (a,c) Normalized incremental intruded volume as a function of pore-throat radius for samples Tl, Ja, Co, and Pv and samples Aj, Spl, and Mpl, respectively. (b,d) Normalized cumulative volume as a function of pressure for samples Tl, Ja, Co, and Pv and samples Aj, Spl, and Mpl, respectively.
Applsci 16 04031 g008
Figure 9. Intrinsic permeability (k), as a function of ϕo. The literature data for similar volcanic rocks are also shown for comparison. The dashed red curve and its corresponding equation represent the reference trend fitted exclusively to the published dataset [4,13,15,62,63,64].
Applsci 16 04031 g009
Figure 10. Property correlations. (a) P-wave velocity (Vp) as a function of total porosity (ϕt) [61]. (b) S-wave velocity (Vs) as a function of total porosity (ϕt) [65]. (c) Vp/Vs ratio as a function of total porosity (ϕt) [66]. (d) Bulk modulus (K) as a function of total porosity (ϕt). Red and black dashed lines show the trends defined by previously reported ignimbrite datasets and by the samples studied here, respectively. The dispersion of the data between the two trends is represented by the green polygon and the values of the RMSE (Root Mean Square Error) and MAPE (Mean Absolute Percentage Error).
Applsci 16 04031 g010
Figure 11. Effective-medium bounds. (a) bulk modulus (K) as a function of total porosity (ϕt). (b) close-up view. Abbreviations: HS+ (Hashin–Shtrikman upper bound), HS (Hashin–Shtrikman lower bound), VRH (Voigt-Reuss-Hill). Red dashed lines indicate representative KT trajectories corresponding to selected effective inclusion aspect ratios (ARKT values shown in red). Black dashed lines represent trajectories generated using the modified Hashin–Shtrikman (HS) parameterization. The black numbers associated with these curves indicate the critical porosity values (ϕc) used to generate each trajectory. Experimental data from previous studies are shown for comparison [10,13,61].
Applsci 16 04031 g011
Table 1. Summary of semi-quantitative XRD mineralogy of the studied ignimbrites. All values are reported as percentages of the crystalline fraction. Abbreviations: quartz (Qz), perthite (Perth), sanidine (San), magnetite (Mag), clay minerals (Cl), pyroxene (Px), and goodness of fit (GOF).
IDQz (%)Perth (%)San (%)Mag (%)Cl (%)Px (%)GOF
Aj44.220.726.11530.81
Spl51.327.9170.830.78
Mpl9.377.71030.83
Pv47.82612.81.4750.77
Tl13.436.530.7210.470.72
Ja42.52419.56530.84
Co58.318.715.50.570.86
Table 2. Summary of physical properties of the studied ignimbrites. Specimen-based properties are reported as unit means ± standard deviation, whereas the descriptors rthroat and W are reported as unit-scale values. Abbreviations: number of specimens for each unit (n), grain density (ρg), bulk density (ρb), total porosity (ϕt), open porosity (ϕo), open to total porosity ratio (ϕot), mean pore throat radius (rthroat), intrinsic permeability (k), intrusion width index (W).
IDnρg (g/cm3)ρb (g/cm3)ϕt (%)ϕo (%)ϕot (%)rthroat (µm)k (m2)W (−)
Aj92.59 ± 0.0051.34 ± 0.1242.87 ± 1.8341.04 ± 2.0795.76 ± 3.130.104.46 ± 6.14 ×10−161.70
Spl52.43 ± 0.0011.59 ± 0.0932.85 ± 1.9128.16 ± 1.2885.78 ± 1.680.711.11 ± 0.19 ×10−151.94
Mpl62.51 ± 0.0021.51 ± 0.1041.01 ± 0.6537.09 ± 1.3090.48 ± 3.181.063.78 ± 7.10 ×10−161.76
Pv62.59 ± 0.0011.73 ± 0.0333.28 ± 0.2831.39 ± 2.3292.98 ± 1.350.932.22 ± 0.98 ×10−151.33
Tl82.57 ± 0.0071.76 ± 0.0231.39 ± 2.3230.24 ± 2.1596.27 ± 1.849.031.81 ± 0.50 ×10−140.23
Ja82.43 ± 0.0061.64 ± 0.0532.10 ± 1.7031.60 ± 1.2592.07 ± 2.943.832.88 ± 0.68 ×10−140.76
Co82.63 ± 0.0031.49 ± 0.1542.02 ± 1.0841.12 ± 0.9797.73 ± 0.422.162.64 ± 1.11 ×10⁻¹⁴ 0.22
Avg.-2.50 ± 0.10
Table 3. Pore-system descriptors from mercury intrusion porosimetry (MIP) and representative SEM/petrographic observations.
IDPore Family Description (MIP)Apparent Pore Habit and Continuity
AjMicroporous, non-uniform distribution; needle-type throatsPredominantly crack-shaped micropores with locally coalescent elongated voids, consistent with a crack-based microstructure.
SplMicroporous, non-uniform distribution; needle-type throatsMicroporous framework mixing equant pores and short microcracks, reflecting mild crack connectivity within fine shards.
MplMesoporous, non-uniform distribution; needle-type throatsCrack-linked pores embedded in a compact shard-rich matrix, indicating elongated pores constrained by welded glass fragments.
PvMicroporous; non-uniform distribution with small bottleneck throats.Transitional pore system with crack-like micropores and short, elongated voids, locally mixed with sub-equant pores. Consistent with mixed crack-like to sub-equant pore geometries.
TlMesoporous, uniform; bottleneck throats; largest rthroat in the setUniform mesopore distribution with sub-equant to moderately rounded voids, reflecting larger throat sizes and low crack influence.
JaMesoporous, uniform; bottleneckMesopores with restricted crack linkage and smoother pore walls, suggesting more equant pore shapes and mild anisotropy.
CoMesoporous, uniform; bottleneckMixed pore system with equant cavities modified by lithic-boundary cracks, balancing crack-shaped and equant components.
Table 4. Summary of experimental wave velocities and elastic properties obtained from ultrasonic wave transmission. All values correspond to unit-based averages of each parameter with their corresponding standard deviations. Abbreviations: P-wave velocity (Vp), S-wave velocity (Vs), Vp/Vs ratio, dynamic bulk modulus (K), dynamic shear modulus (G), and Poisson’s ratio (ν).
IDVp (m/s)Vs (m/s)Vp/Vs (−)K (GPa)G (GPa) ν (−)
Aj2128 ± 1241233 ± 682.11 ± 0.383.74 ± 1.172.05 ± 0.280.23 ± 0.07
Spl2627 ± 2911347 ± 1611.97 ± 0.299.07 ± 2.713.28 ± 0.870.31 ± 0.05
Mpl1722 ± 481035 ± 871.47 ± 0.022.09 ± 0.371.63 ± 0.290.21 ± 0.08
Pv2766 ± 1601305 ± 792.13 ± 0.148.88 ± 1.702.96 ± 0.390.35 ± 0.03
Tl2742 ± 2551227 ± 1122.24 ± 0.139.60 ± 1.842.68 ± 0.540.37 ± 0.02
Ja2450 ± 1631222 ± 772.01 ± 0.166.51 ± 1.302.48 ± 0.310.33 ± 0.04
Co2000 ± 1311190 ± 1081.91 ± 0.223.82 ± 1.112.13 ± 0.420.22 ± 0.05
Table 5. Effective solid-reference properties derived from semi-quantitative XRD and used in the effective-medium analysis. Density is reported as a linear mixture estimate and used only as a consistency check against measured grain density (ρg). Elastic moduli are given as Voigt, Reuss, and VRH values using mineral constants from [9]. Abbreviations: grain density by Voigt (ρV), absolute difference relative to measured grain density for Voigt (ΔρV), and XRD-derived solid matrix density (ρm), bulk modulus (Km), and shear modulus (μm).
IDρV (g/cm3)ΔρV (g/cm3)ρm (g/cm3)Km (GPa)μm (GPa)
Aj2.610.022.6140.3231.15
Spl2.600.172.6039.7232.49
Mpl2.530.022.5343.5223.99
Pv2.610.032.6141.7033.66
Tl2.590.022.5943.4925.56
Ja2.740.312.7446.8334.76
Co2.560.062.5637.0332.95
Average2.60 ± 0.090.12 ± 0.112.6141.8030.65
Table 6. Regression tests for porosity and pore-throat effects. Abbreviations: bulk modulus (K), P-wave velocity (Vp), intrinsic permeability (k), total porosity (ϕt), open porosity (ϕo), intrusion width index (W), adjusted coefficient of determination (Adj. R2), root mean square error (RMSE), leave-one-unit-out root mean square error (LOUO RMSE), and leave-one-unit-out coefficient of determination (LOUO R2).
PropertyEquationAdj. R2RMSELOUO RMSELOUO R2
K (GPa)K = 23.51 − 0.472·ϕt0.631.8832.2040.508
Vp (m/s)Vp = 4544.14 − 59.81·ϕt0.63238.4285.8360.484
log10(k [m2])log10(k) = −13.11 − 0.0428·ϕo0.031.0611.442−0.761
log10(k [m2])log10(k) = −11.77 − 0.0409·ϕo − 1.301·W0.680.6030.7730.494
Disclaimer/Publisher’s Note: The statements, opinions and data contained in all publications are solely those of the individual author(s) and contributor(s) and not of MDPI and/or the editor(s). MDPI and/or the editor(s) disclaim responsibility for any injury to people or property resulting from any ideas, methods, instructions or products referred to in the content.