Article

Mine Pressure Manifestation Under the Coupled Disturbance of Mining Movement and Impact in Close-Range Coal Seams


1
School of Safety Engineering, Heilongjiang University of Science and Technology, Harbin 150022, China
2
College of Mining Engineering, Heilongjiang University of Science and Technology, Harbin 150022, China
3
Ningxia Hongdunzi Coal Industry Co., Ltd., Yinchuan 750002, China
*
Author to whom correspondence should be addressed.
Appl. Sci. 2026, 16(8), 3839; https://doi.org/10.3390/app16083839
Submission received: 22 January 2026 / Revised: 27 March 2026 / Accepted: 8 April 2026 / Published: 15 April 2026
(This article belongs to the Special Issue Advanced Technologies in Rock Mechanics and Mining Science)

Abstract

To address severe mine pressure disasters induced by the coupling of mining-induced dynamic stress and impact disturbance during close-distance coal seam mining, this paper takes the No. 8 and No. 9 close-distance coal seams in the 119 mining area of a coal mine in Ningxia, China, as the engineering background. Theoretical analysis and FLAC3D numerical simulation methods were adopted to systematically study the evolution of overburden structure, the manifestation law of mine pressure caused by mining disturbance, and the dynamic response mechanism of roadway surrounding rock under impact load. The findings demonstrate: ① Based on key block theory and elasticity mechanics theory, the stress transfer mechanism of the complete bearing type overburden rock in close-range coal seams was clarified. The calculation model of floor plastic zone depth and additional stress was derived, and the influence mechanism of the bearing state of interlayer rock strata on the stability of underlying coal seam roadways was revealed. ② Comparative numerical simulations of mining schemes revealed that both schemes formed a “goaf pressure relief-workface-coal pillar” load-bearing configuration with “upward subsidence and downward bulging” basin-shaped settlement. Scheme A exhibited significantly increased stress peaks and interlayer plastic zones due to repeated mining-induced stress, substantially elevating the risk of strong mine pressure manifestation and surrounding rock instability. ③ Under 8 MPa cosine impact load with a vibration frequency of 50 Hz (peak particle vibration velocity of 9.57 m/s), compared with the unsupported roadway, the bolt–cable collaborative support system reduced the peak displacement of surrounding rock by over 35% and decreased the shock wave propagation velocity by more than 40%, effectively suppressing the expansion of plastic zones and the transfer of impact energy, while significantly enhancing the impact resistance of the roadway. This study not only provides a systematic theoretical basis for close-distance coal seam mining and rock burst prevention but also offers scientific guidance and technical reference for surrounding rock control and dynamic disaster prevention of roadways in similar close-distance coal seam mining projects, which is of important engineering value for ensuring the safe and efficient mining of underground coal resources.

1. Introduction

Impact ground pressure, a sudden failure of coal-bearing strata, poses a serious threat to underground mining operations and safety [1,2,3]. In mines affected by this phenomenon, high-energy impact vibrations typically occur during roadway excavation and face mining, often preceded by frequent low-energy shocks [4,5]. With the widespread adoption of micro-seismic and ground sound monitoring systems in such mines, researchers have increasingly recognized that impact stress waves are a primary cause of impact ground pressure disasters [6,7,8]. However, not all impact stress waves trigger full-scale accidents; some merely induce noticeable vibrations in roadways. The occurrence of roadway impact ground pressure is closely related to both the energy of the impact stress waves and the impact resistance of the roadway support structures.

Literature Review

Numerous scholars worldwide have conducted extensive and in-depth research on the dynamic response of roadway surrounding rock under dynamic load disturbances and mine pressure behavior in close-distance coal seam mining. In terms of the dynamic response of surrounding rock, Cai et al. [9] systematically studied the dynamic failure mechanism of roadway surrounding rock under coupled dynamic–static loading through true triaxial tests, and revealed the energy evolution law of rock mass under impact disturbance. Milewski et al. [10] investigated the stress transfer mechanism of overburden in multi-seam mining through field monitoring and numerical simulation and established a prediction model for mining-induced stress in lower coal seams. Iannacchione et al. [11] analyzed the influence of upper coal seam mining on the stability of underlying roadways and proposed a quantitative evaluation method for interlayer disturbance. Wagner [12] systematically elaborated the mechanism of rock burst induced by dynamic–static load superposition, which has become a classic theoretical basis for international rock burst prevention and control. Liu et al. [13] found through experimental simulations that dynamic load-induced impacts involve four stages: crack initiation, propagation, debris detachment, and large-scale roadway failure. Chen et al. [14] concluded that surrounding rock fractures under dynamic load disturbances reduce lateral constraints, forming high-stress concentration zones in coal bodies and increasing the impact risk of roadway surrounding rock. In laboratory experiments, Liu et al. [15] independently developed a three-dimensional roadway impact instability simulation system, using explosive blasting to simulate dynamic load disturbances and study impact failure characteristics. Tan et al. [16] developed a deep roadway dynamic–static loading test system, conducting physical simulation experiments through pendulum and drop hammer devices to apply dynamic loads. However, laboratory experiments face limitations such as inadequate monitoring methods, complex simulation processes, difficulties in monitoring surrounding rock failure and energy evolution, poor repeatability of dynamic load disturbances, and relatively high experimental costs.
The dynamic characteristics exhibited by the coal seam floor under dynamic loading differ significantly from the mechanical properties and failure patterns observed under static loading. Jiang et al. [17], using typical impact pressure accidents as case studies, identified that massive thick conglomerate and thrust faults controlling instantaneous large-scale coal slip are primary causes of impact pressure in ultra-thick coal seams. Wang et al. [18] demonstrated that isolated coal bodies prone to overall instability when subjected to stress exceeding compressive strength may induce impact pressure. He [19] revealed the structural evolution patterns of overburden and impact pressure mechanisms through comprehensive analysis of fully mechanized mining face roof structures. Hou et al. [20] clarifies the law and instability precursors of sandstone unloading failure, providing a key basis for deep mine pressure research and rock mass numerical simulation. Li et al. [21] identified that horizontal stress on isolated coal bodies increases progressively with face advancement, revealing the mechanism of impact pressure induced during backfilling of interlayer coal pillars in one-side mining spaces. Wang et al. [22] demonstrated impact pressure occurrence in rapid mining faces under roof drainage zones, elucidating the mechanism of such pressure manifestation. He [23] analyzed overburden fracture movement, revealing that static stress distribution and dynamic disturbance characteristics caused by surrounding rock under its influence are key factors contributing to impact pressure in nearly vertical coal seams. Li et al. [24] investigated impact pressure mechanisms in nearly vertical coal seams, finding that frequent strong rock-fault earthquakes in roof and pillar formations create stress concentrations, leading to impact pressure in two longitudinal roadways. He et al. [25] studied impact pressure mechanisms in group pressure lever-type systems in nearly vertical coal seams, identifying asymmetric roof–floor and rock mass pressure lever manifestations as characteristic features. Li et al. [26] employed structural dynamics theory to investigate the mechanism of far-field low-frequency seismic waves on impact ground pressure, elucidating the causes of impact ground pressure induced by far-field seismic sources. Li et al. [27] analyzed the stress levels and evolution processes of coal bodies during mining operations, discovering that the superposition of mining-induced stresses formed highly concentrated stress zones, reaching the critical conditions for impact ground pressure manifestation. Kohler et al. [28] investigated the effect of plastic compressibility on compressible granular flow impact pressure via a 3D Material Point Method (MPM)-based large-strain elastoplastic model through systematic numerical simulations, revealed the relevant impact dynamic mechanism, and advanced the risk assessment for related natural hazards. To address the limitations of laboratory experiments, researchers conducted numerical simulation studies. Wen et al. [29] developed FLAC2D numerical models for mining roadways with varying coal hardness layers, analyzing the influence of coal hardness on the dynamic response of surrounding rock. Zhu et al. [30] utilized RFPA6.0 numerical simulation software to study the dynamic mechanical response characteristics of circular roadways, finding that the amplitude and duration of dynamic load disturbance stress waves significantly affect surrounding rock stability. Xie et al. [31] analyzed the impact patterns of roadway lateral pressure coefficients under dynamic load disturbances on floor horizontal stress and impact failure. Cao et al. [32] investigated the effects of dynamic load disturbances on stress fields and deformation fields of surrounding rock in both normal working face and semi-island working face roadways.
Song et al. [33] studied high-strength polyester flexible protection mesh for deep tunnel rock burst protection, verified its numerical model via drop weight impact simulations, and revealed its dynamic response and optimal protective parameters through multi-condition numerical tests. Guo et al. [34] studied a novel flexible energy-dissipating NPR anchor for blasting vibration mitigation, verified its performance and energy dissipation mechanism via FLAC numerical simulation and field blasting tests, and confirmed its superiority in rock engineering. Jiang et al. [35] revealed the multi-stage energy release mechanism of thermobaric explosives through LiF surrogate experiments combined with numerical simulations, clarified the distinct roles of anaerobic and aerobic combustion, and established a theoretical framework for thermo-pressure coupling in confined blasts.
This study takes the 119 mining area of a coal mine in Ningxia, China, as a typical engineering verification case, and adopts theoretical analysis and FLAC3D numerical simulation to investigate the impact failure characteristics of roadway surrounding rock under the coupled disturbance of close-range coal seam mining and impact loading [36,37,38]. The core research objective is to reveal the general mechanical behavior law, overburden structure evolution mechanism, and roadway anti-impact support mechanism of close-range coal seams under mining and impact coupling disturbance, which is a common engineering and scientific problem faced by underground coal mining worldwide. The research findings not only elucidate the causal relationship between dynamic load disturbances and impact pressure disasters in coal mines, but also provide a universal theoretical basis and technical reference for deep coal mining operations in close-range coal seams around the world.

2. Data and Methods

2.1. Engineering Geological Data

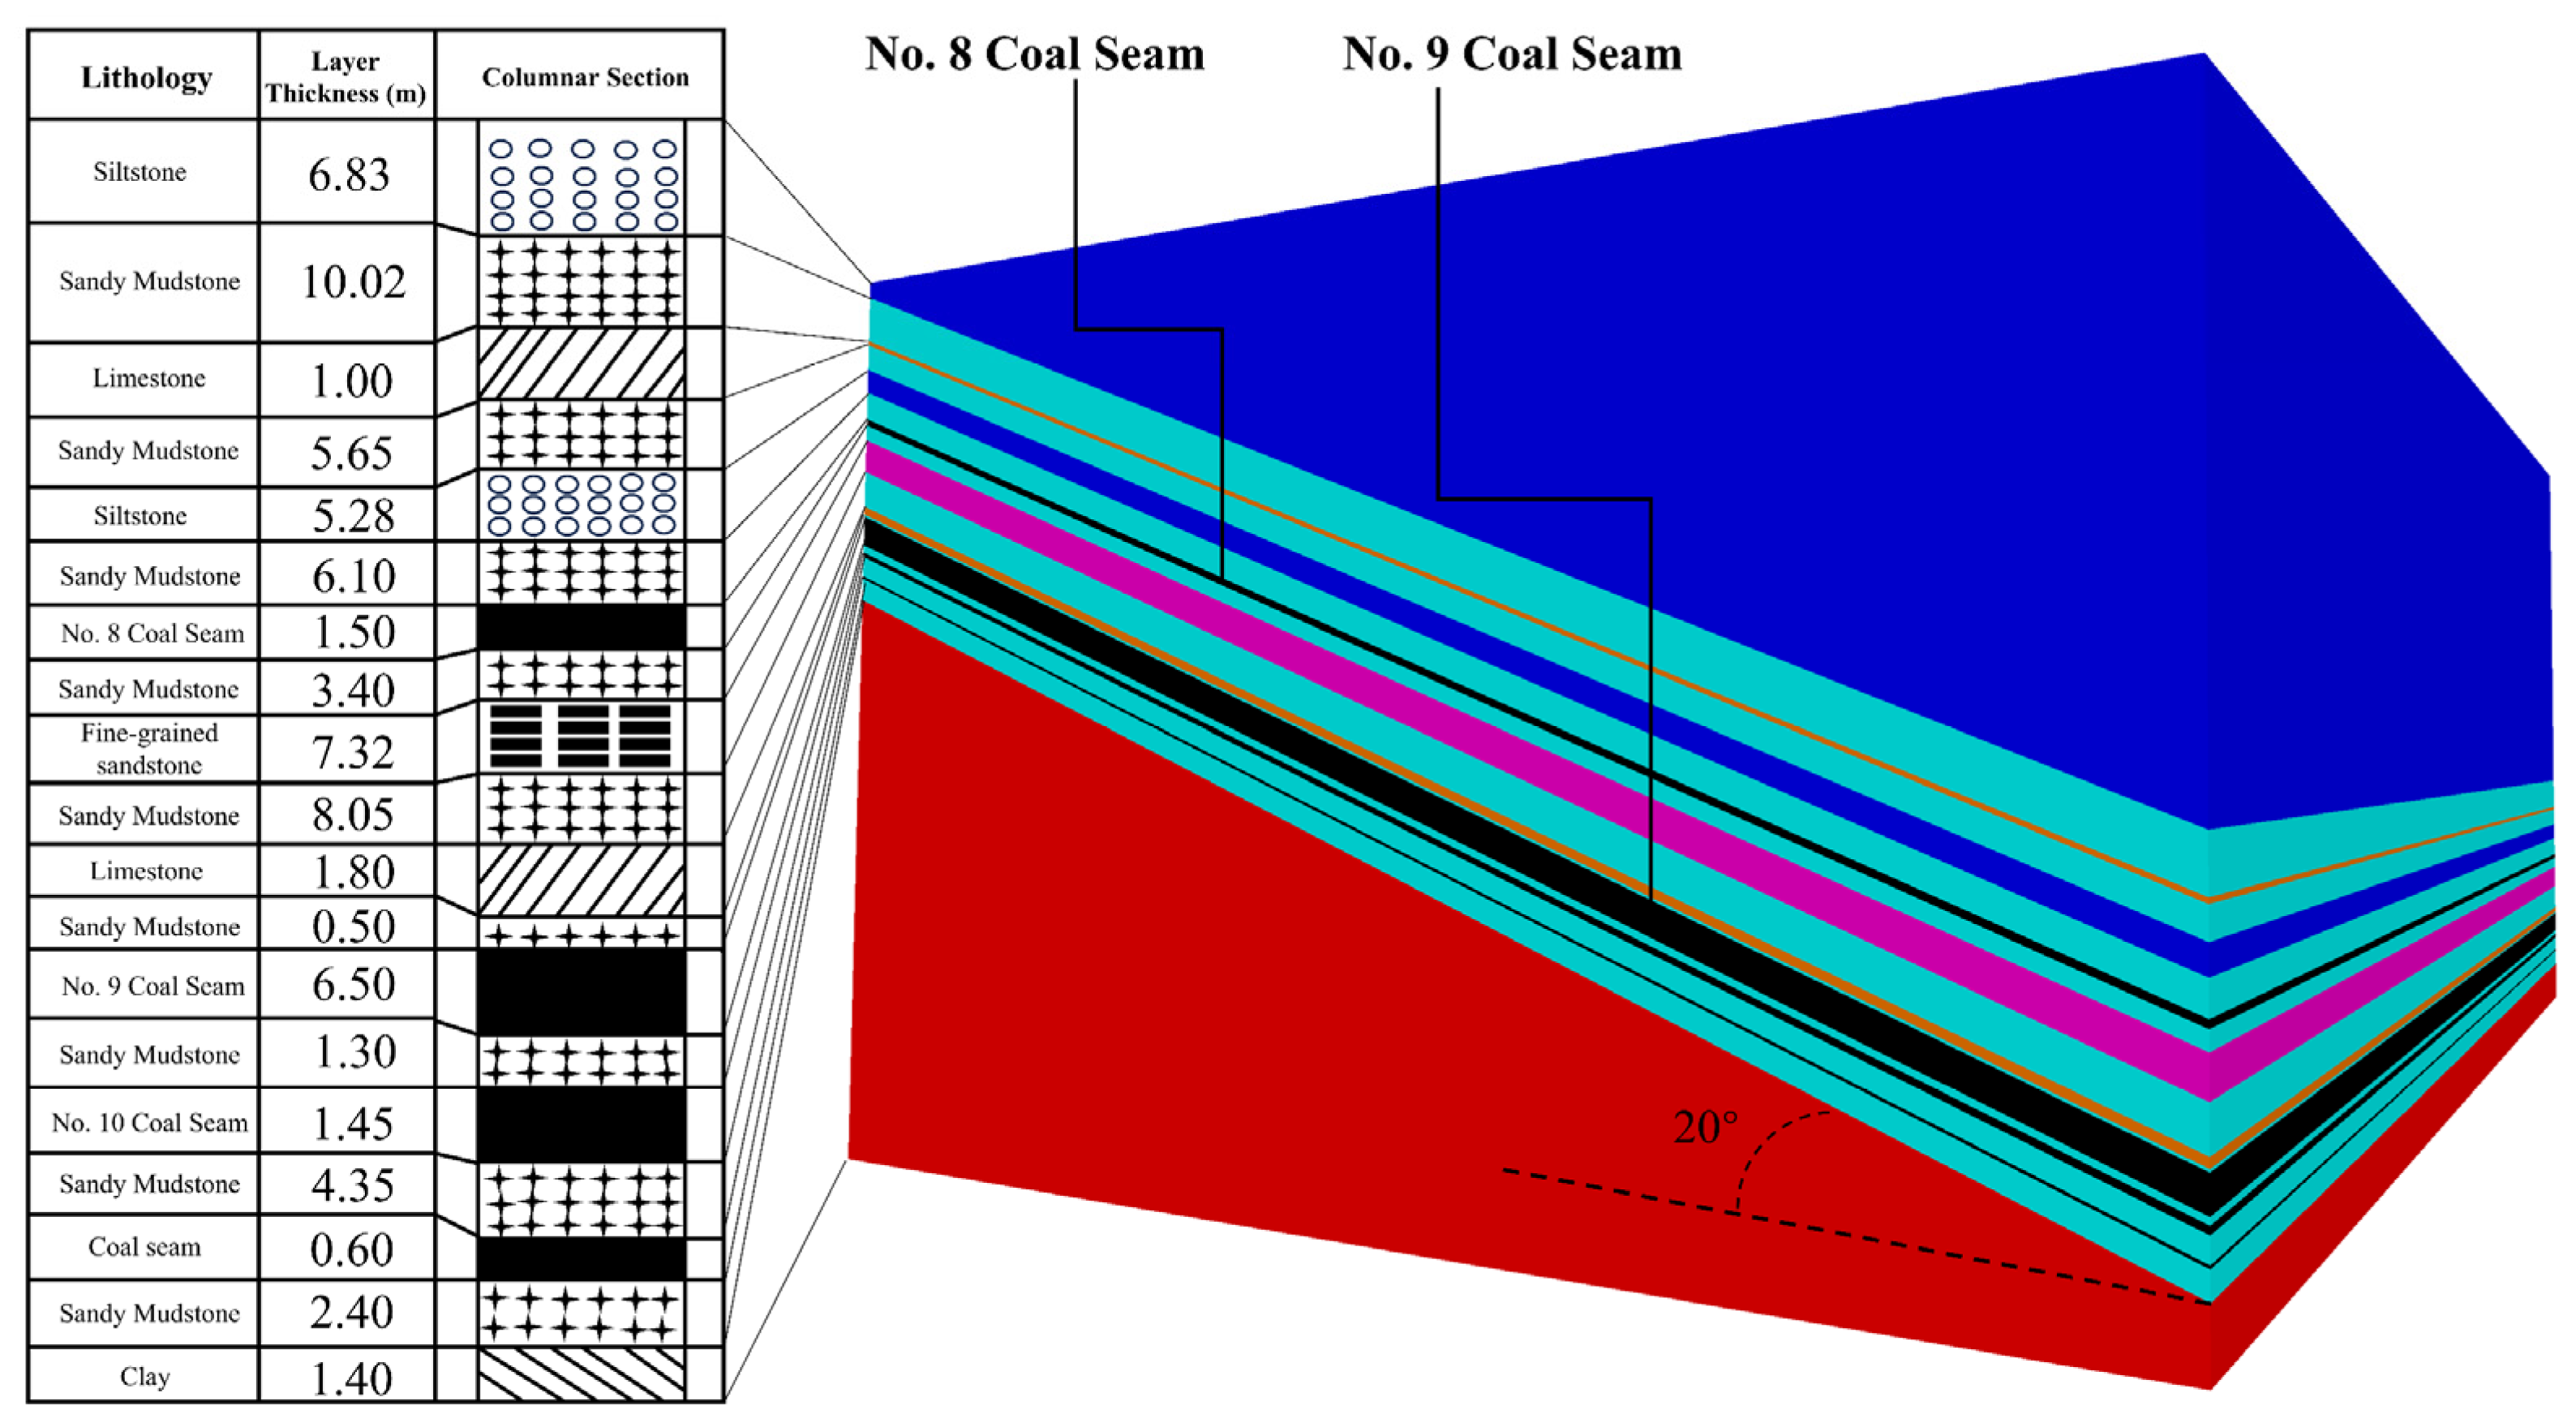
The 119 working face of a mining operation is located in a +450 m horizontal mining area with an average burial depth of 600 m. The working face features a monoclinic structure, primarily mining the No. 8 and No. 9 coal seams. The coal seams have an average dip angle of 21°, with the No. 8 coal averaging 1.34 m in thickness and the No. 9 coal averaging 6.5 m. The roof of the No. 8 coal seam is predominantly composed of siltstone and fine sandstone, with localized mudstone interbedded with coal seams forming a pseudo-roof. The floor is mainly fine sandstone and siltstone, characterized by relatively dense and hard rock with minimal fissuring. The roof of the No. 9 coal seam consists of stable limestone, mudstone, siltstone, fine sandstone, or coarse sandstone, while the floor is primarily siltstone and fine sandstone, occasionally containing coarse sandstone or coal seams. As shown in the borehole columnar diagram below, the No. 8 and No. 9 coal seams are separated by 21.07 m, indicating a close proximity between them.

2.1.1. Sample Collection and Mechanical Parameters Testing

The coal and rock mechanical parameters used in this study were obtained through on-site coring and laboratory mechanical tests. Coring operation was conducted in the 119 mining roadway, with a total of 9 groups of standard rock samples and 3 groups of standard coal samples collected for each lithology (limestone, siltstone, fine sandstone, clay, coal, sandstone) involved in the study, with a total of 72 valid standard samples. The samples were processed into standard cylindrical specimens with a size of Φ50 mm × 100 mm according to specification requirements, and specimens with obvious cracks, weathering or structural damage were eliminated to ensure test validity.
All mechanical tests were carried out in the Rock Mechanics Laboratory of Heilongjiang University of Science and Technology, in strict compliance with the International Society for Rock Mechanics (ISRM) Suggested Methods for Rock Mechanical Testing and the Chinese national standard GB/T 23561-2009 [39] Methods for Determining the Physical and Mechanical Properties of Coal and Rock. Test items included a density test, a Brazilian splitting test (for tensile strength), and a uniaxial compression test (for cohesive strength, internal friction angle, bulk modulus and shear modulus). For each lithology, the mechanical parameters of all valid samples were statistically analyzed; the mean value of the parameters was adopted as the model input parameter, and the standard deviation of each parameter was supplemented to reflect the dispersion of test results. The complete statistical results of mechanical parameters are shown in the revised Table 1.
The stratigraphic column (Figure 1) was drawn based on the actual geological borehole data of the 119 mining area, which was obtained from the mine’s geological exploration report and on-site borehole logging results, reflecting the actual stratigraphic combination and thickness characteristics of the study area.

2.1.2. Statement of Rock Mass Homogeneity Assumption

In this study, the rock mass of each lithology is assumed to be homogeneous and isotropic in the numerical simulation, and the strata are assumed to have continuous distribution and stable average thickness. This is a widely accepted basic assumption in numerical simulation studies of mining-induced overburden movement and mine pressure behavior, and the rationality of this assumption in this study is based on the following actual geological conditions:
  • The rock mass in the study area has relatively complete lithology, with no large-scale structural planes, faults, or well-developed fractures in the target mining horizon;
  • According to the 12 groups of geological borehole data in the 119 mining area, the thickness variation rate of each target stratum (coal seam and roof/floor rock strata) is less than 5% within the simulation range, with no stratum pinch-out or significant discontinuity, so the average thickness of the stratum can represent the actual stratum distribution characteristics;
  • The mean value of the mechanical parameters obtained from laboratory tests of field coring samples can reflect the overall mechanical properties of the rock mass in the study area.
Meanwhile, we clearly state the corresponding limitations of this assumption: The actual underground rock mass has natural heterogeneity, fracture development, structural plane characteristics, and local stratum thickness variation. These factors will introduce nonlinearity to the stress propagation process and lead to uneven rock mass response, which are reasonably simplified in this study.
For engineering application of the research results, the following revision methods are proposed for different geological conditions:
  • For mining areas with well-developed fractures, large structural planes, or strongly heterogeneous rock masses, the rock mass mechanical parameters should be revised based on field in situ monitoring data (such as borehole stress monitoring and roadway deformation monitoring), and the simulation results should be corrected accordingly;
  • For mining areas with significant stratum thickness variation or discontinuity, a refined numerical model considering actual stratum distribution should be established, and discrete element numerical methods can be further used to simulate the influence of fracture development on rock mass mechanical behavior.

2.2. Theoretical Analysis Method

2.2.1. Analysis of the Bearing Structure of Overburden Rock After Upper Coal Seam Mining

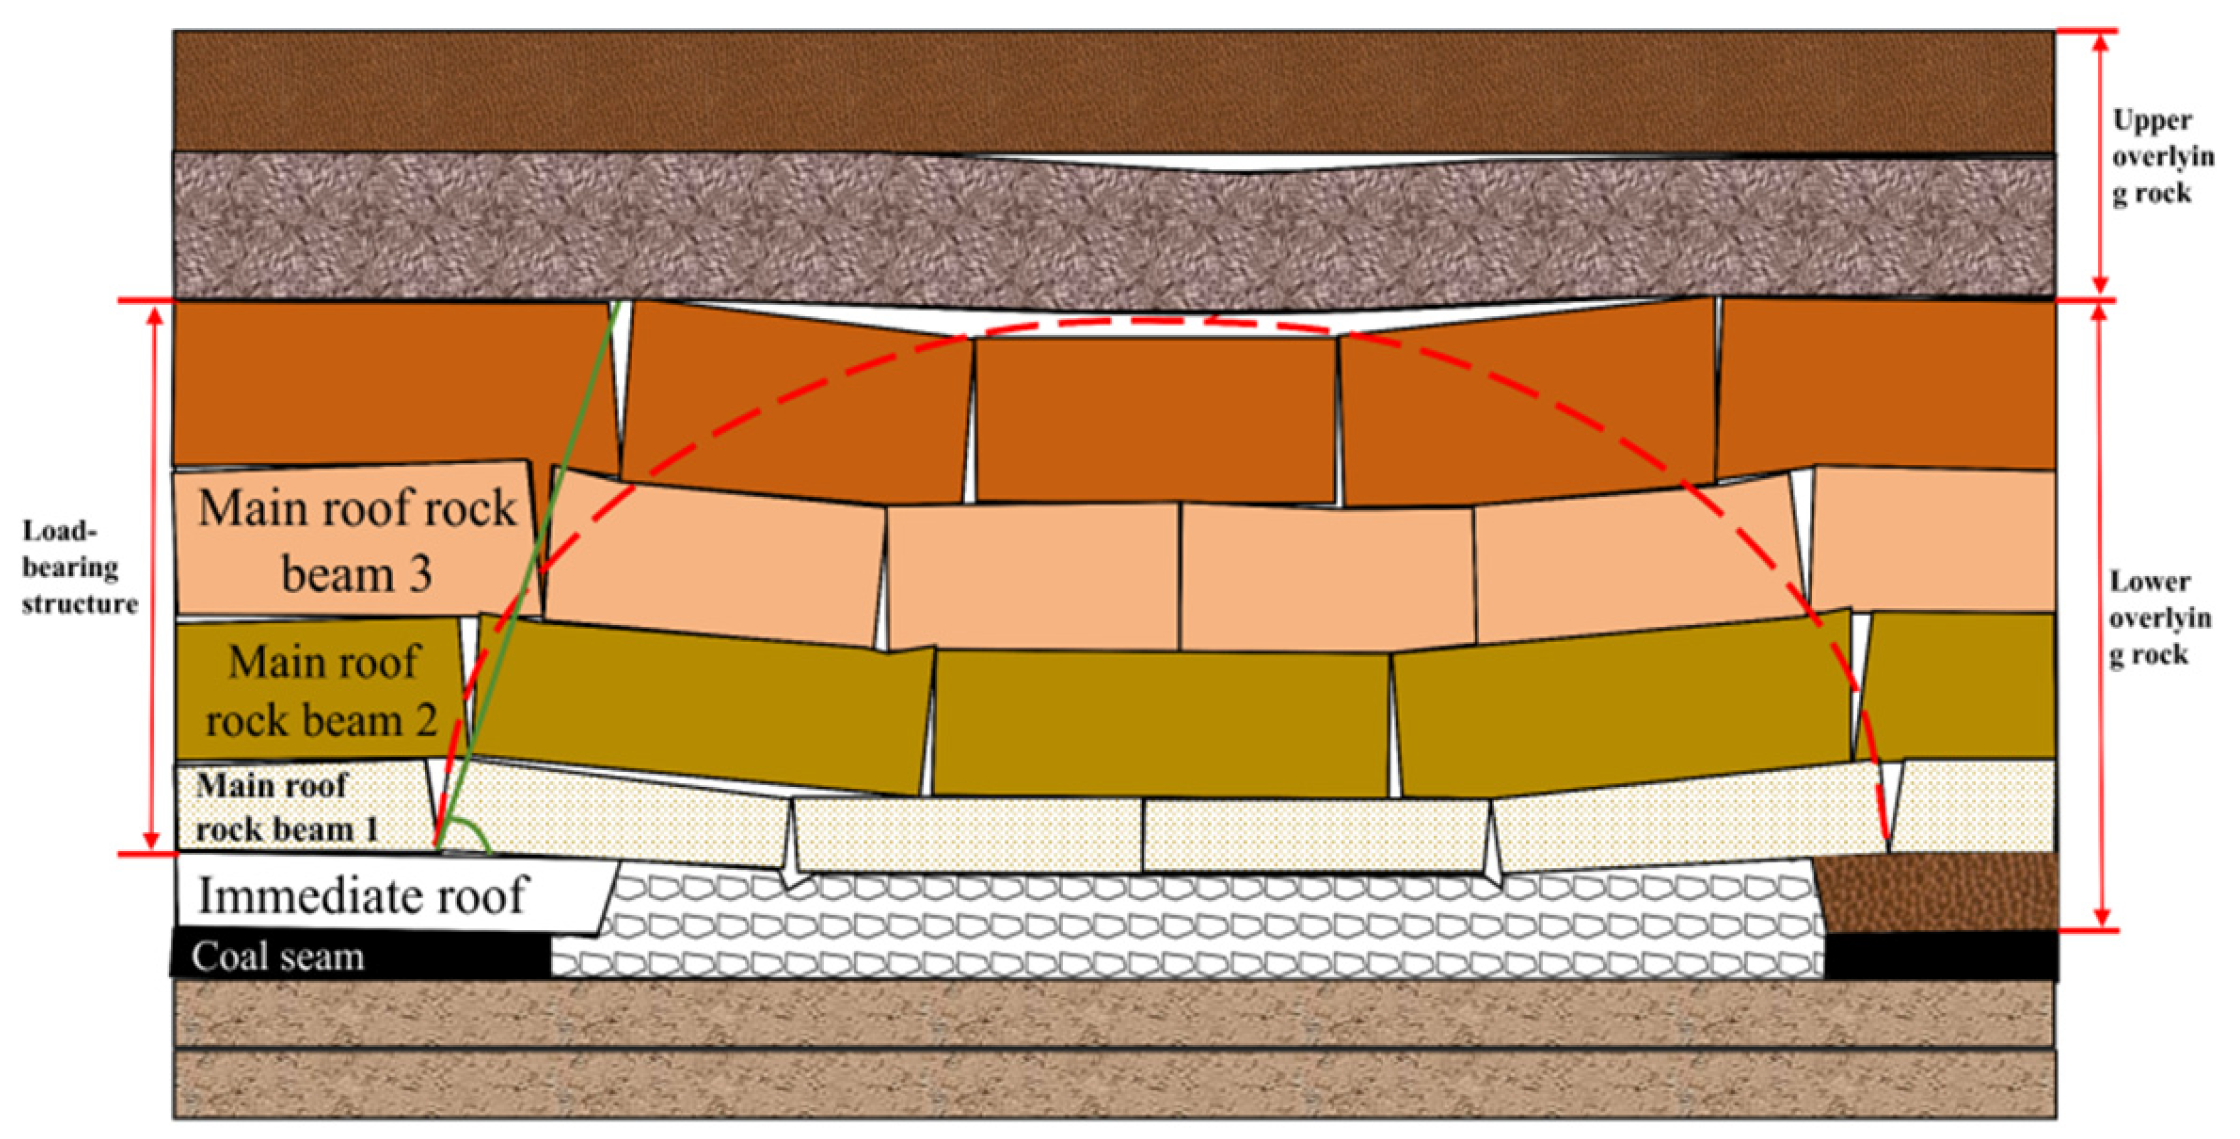
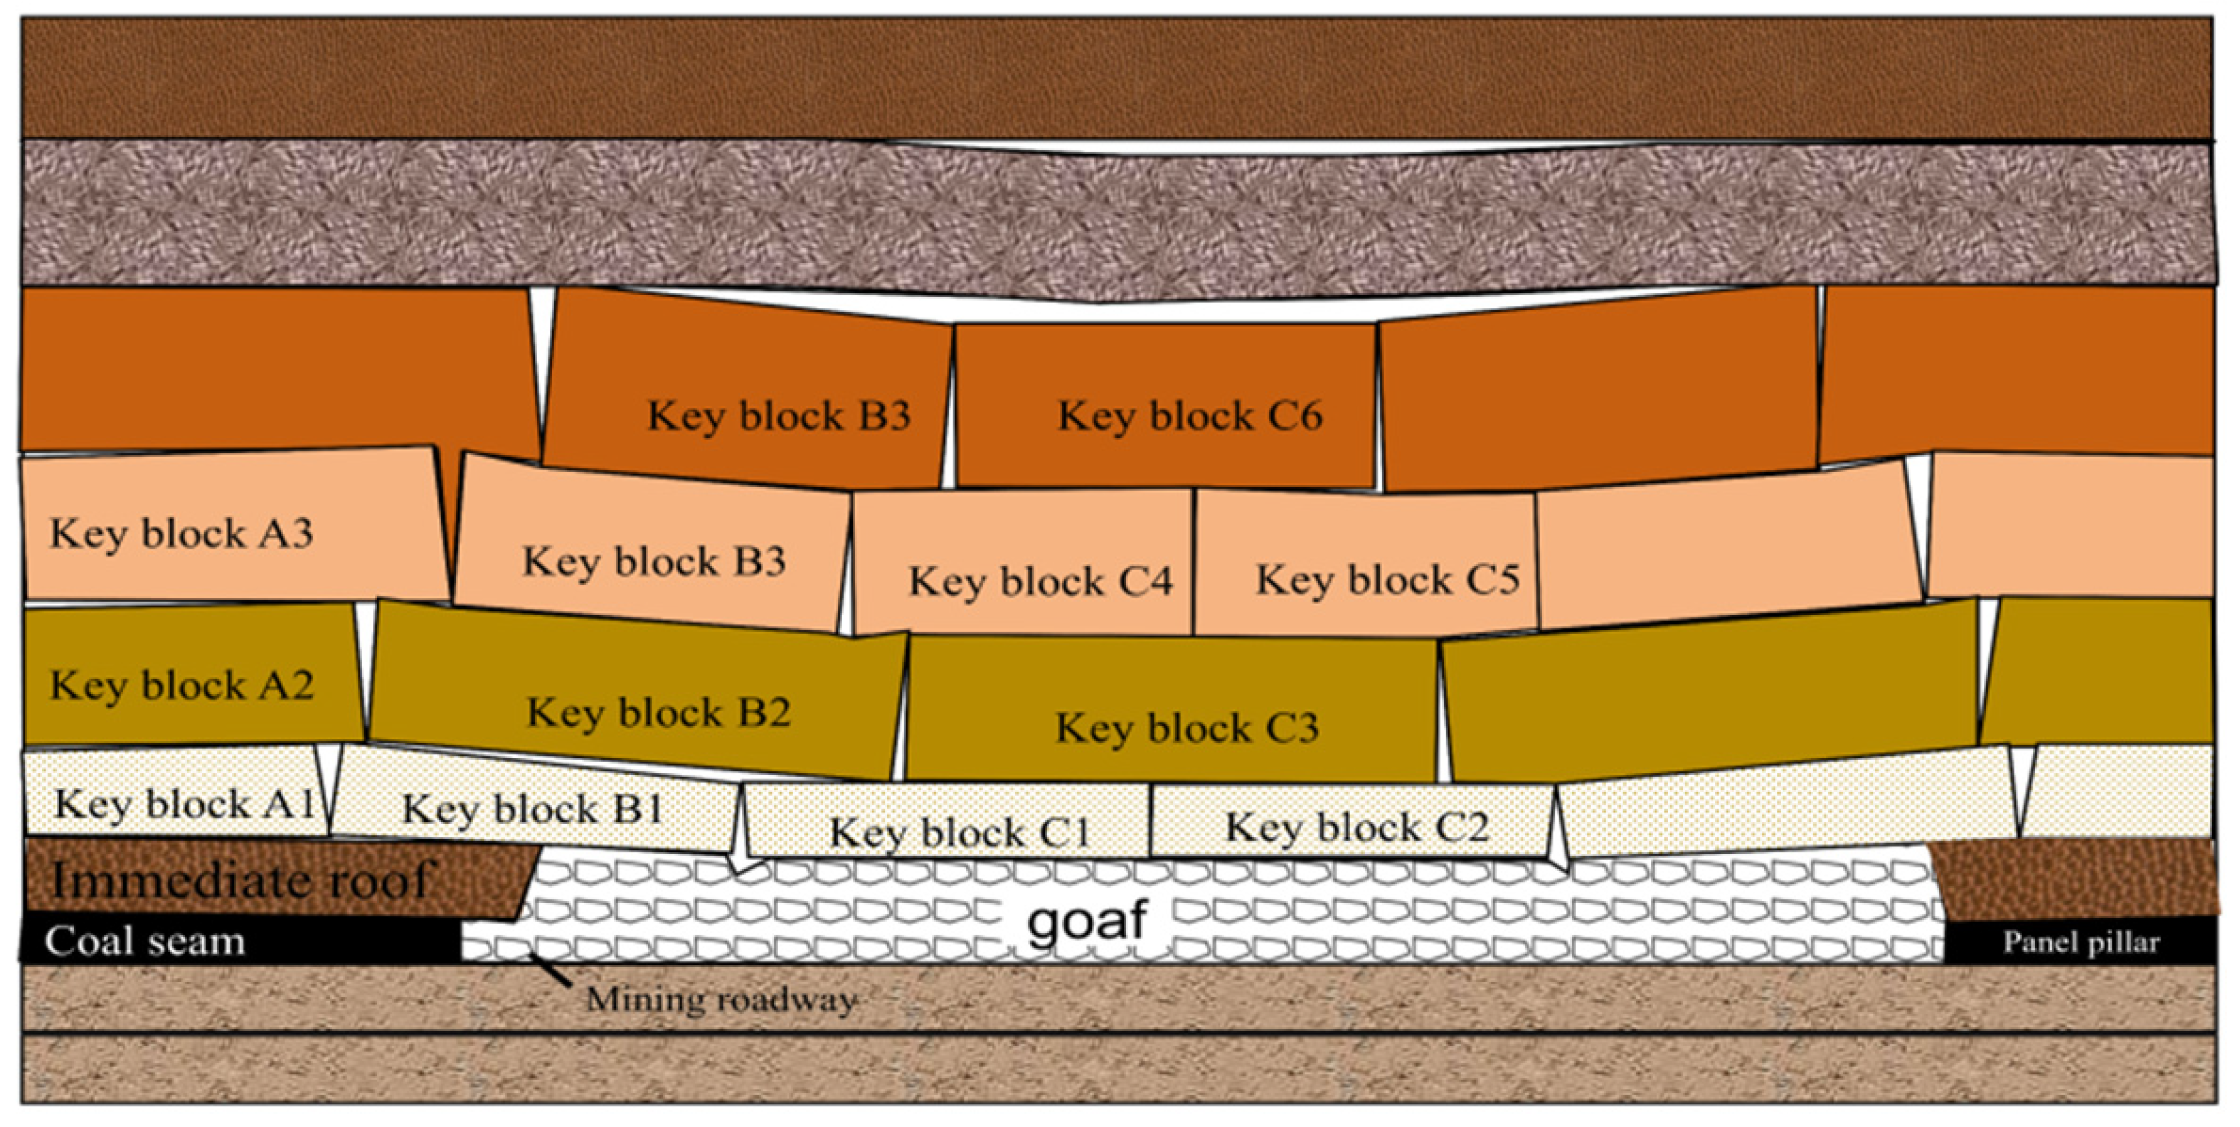
After coal mining, the overlying strata on the working face undergo irregular collapse, periodic fractures, and bending subsidence due to gravitational forces and mining disturbances. Considering the varying modes of interaction and impact on the working face and roadway, the overlying strata can be divided into two parts: the upper overburden and the lower overburden. The lower overburden is further classified into athree categories based on rock hardness: hard rock, moderately hard rock, and soft rock. Among these, some hard rock layers maintain horizontal force transfer connections even after coal mining, forming stable hinge structures. These structures effectively bear and transfer loads from the overlying strata, directly influencing the working face and roadway, and are collectively referred to as “bearing structures.” Assuming that fracture lines on both sides of the working face penetrate the coal body, we establish a structural model of the mining face overburden after single-layer coal mining, as shown in Figure 2. The bearing structure forms a “fracture arch” longitudinally, where α represents the extension angle at the arch base. Under this overburden structure, during coal mining, the bearing structure of the upper coal seam may undergo movement due to repeated mining activities. This significantly alters the stress environment of the lower coal seam, leading to distinct structural evolution patterns during initial and periodic pressure events compared to single-layer mining. Consequently, the deformation patterns of surrounding rock in the lower coal seam roadway become more complex.
At this stage, the mining face structure no longer merely manifests as an overall arch-shaped load-bearing feature along the working face’s longitudinal direction. It also exhibits new load transfer paths along the dip direction, resulting from interlayer dislocations and block rotation, forming lateral overburden structures. As illustrated in the diagram, the initial and periodic pressure step distances are respectively represented. For coal seam group mining, the lateral overburden structure and the mining face overburden structure are spatially interconnected and mechanically interdependent. The mining face overburden structure determines the overall load-bearing form of the overburden, while the lateral overburden structure reflects the load transfer pattern of this system along the working face’s dip direction. Together, they serve as a critical bridge for understanding the instability mechanisms and control principles of surrounding rock in coal seam mining tunnels.
Current studies predominantly utilize the extent of floor failure to characterize the impact of upper coal seam mining on lower coal seam mining activities. The most commonly adopted method for calculating this extent is the expression for the depth (hd) and length (Ld) of the floor’s plastic zone, derived from the slip line theory in plastic mechanics [33], as illustrated in Equation (1).
h d = 0.015 H cos φ 2 cos ( π 4 + φ 2 ) exp [ ( π 4 + φ 2 ) tan φ ] L d = 0.015 H sin φ 2 cos ( π 4 + φ 2 ) exp [ ( π 4 + φ 2 ) tan φ ]
In the formula, H denotes the burial depth in meters, while φ represents the internal friction angle in degrees.
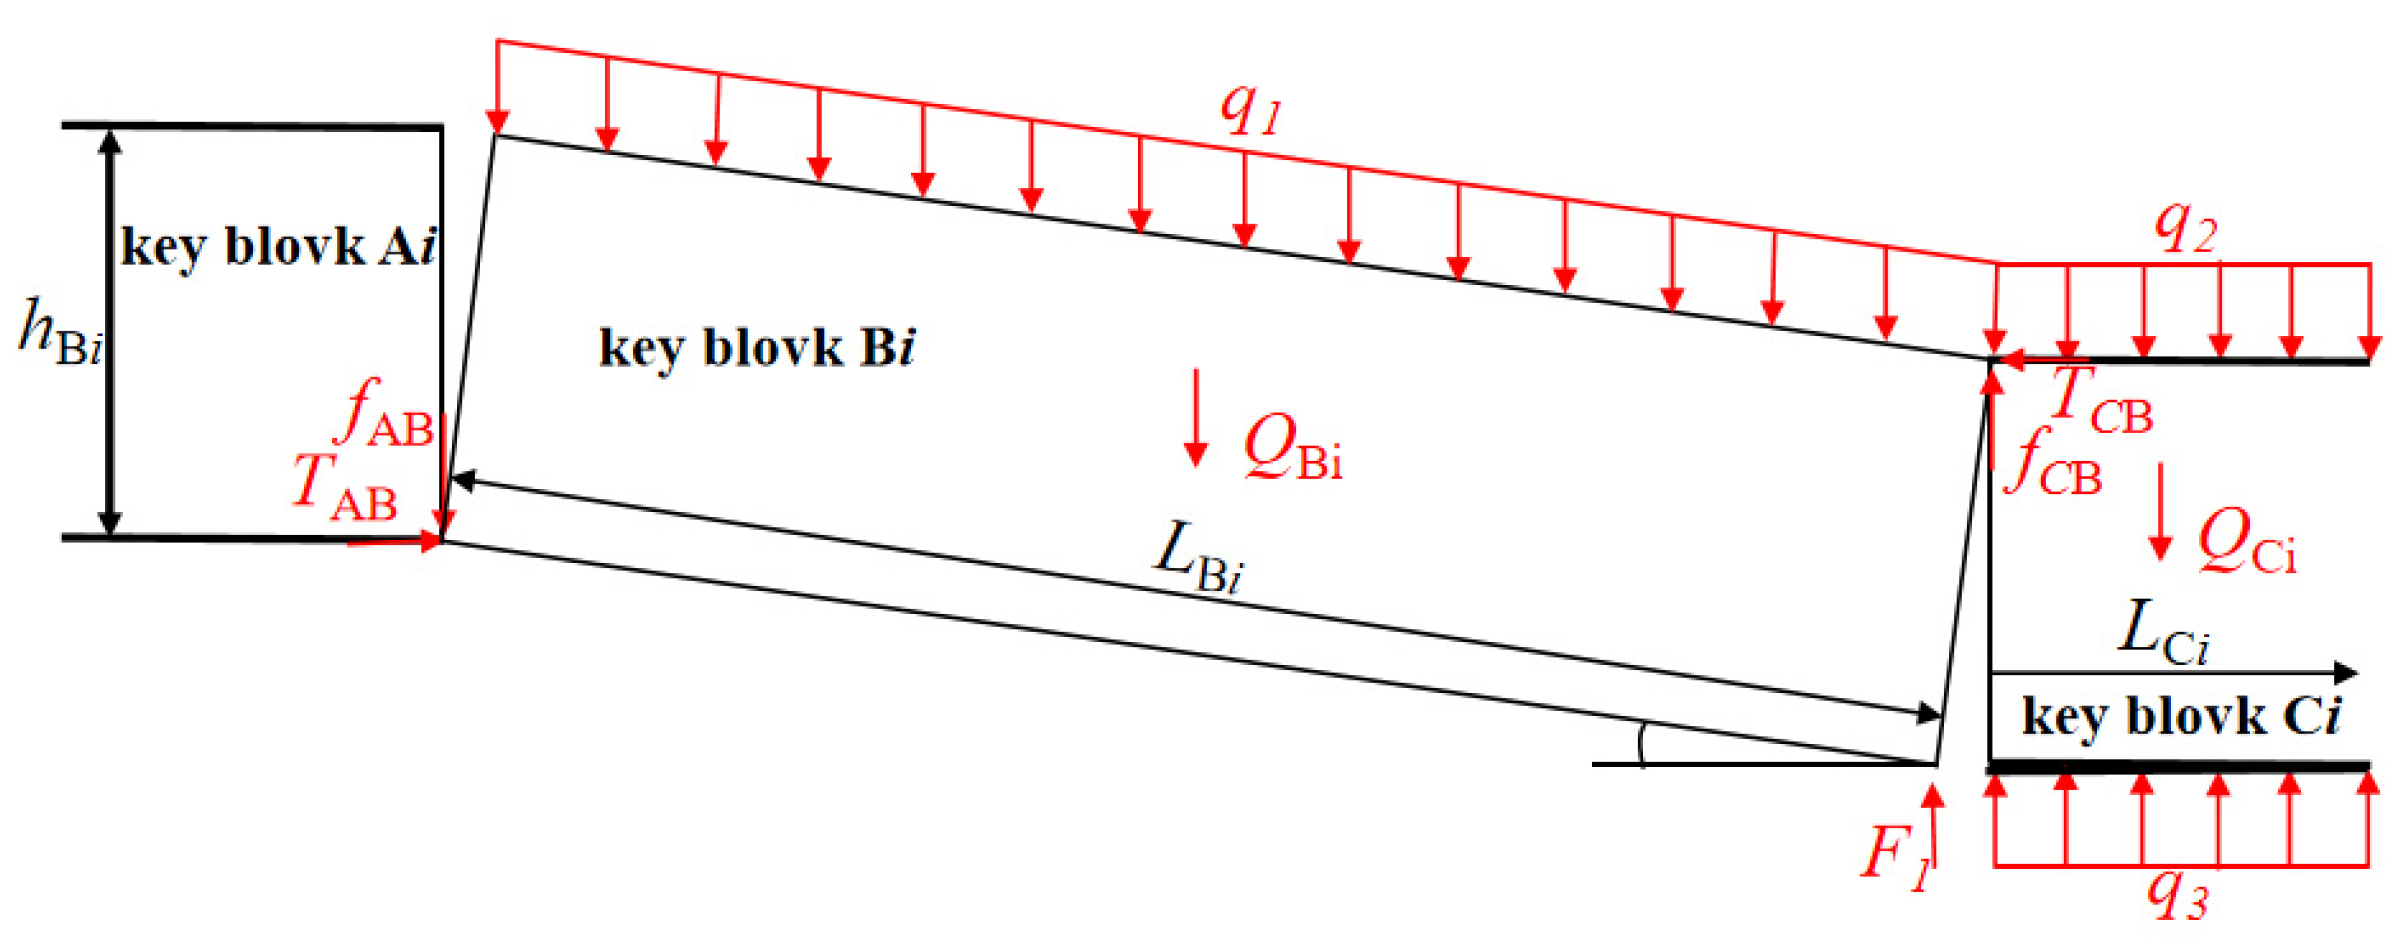
In addition to the depth of floor failure, the stress distribution of the floor is also a critical factor affecting the mining of the lower coal seam, which is closely related to the rotational subsidence of key blocks in the upper articulated structure. For lateral overburden structures, multiple groups of key blocks may exist due to factors such as overburden conditions and mining height, as shown in Figure 3. The key blocks located above the coal body are designated as Ai, the inclined key blocks undergoing rotational subsidence are labeled Bi, and the horizontal key blocks above the goaf are named Ci (i = 1, 2, …). The inclined key block Bi generates concentrated load F1 at the contact point with the goaf waste rock due to rotational subsidence. For analytical convenience, key blocks Ai, Bi, and Ci can be treated as individual units, forming a mechanical model, as illustrated in Figure 4. In the diagram, q1 and q2 represent the loads applied by the overburden layer to key blocks Bi and Ci (in kN/m), q3 denotes the load from the goaf waste rock on key block Ci (in kN/m), QBi and QCi are the self-weight of key blocks Bi and Ci (in kN), LBi and LCi are their lengths (in m), θ is the rotational angle of key block Bi (in °), hBi is its thickness (in m) (assuming uniform thickness for all key blocks), TAB and TCB are the horizontal compressive forces exerted by key blocks Ai and Ci on Bi (in kN), while fAB and fCB represent the frictional forces between key blocks Ai and Ci and Bi (in kN).
Through the mechanical analysis of the key block structure, we can get:
F 1 = ( q 3 L C i q 2 L C i Q C i ) [ ( h B i + L B i ) sin θ cos θ L B i ] L B i cos θ ( sin θ cos θ ) + Q B i sin θ ( 1 cos θ ) sin θ cos θ q 1 L B i sin θ cos 2 θ T CB = q 1 L B i 2 + Q B i h B i cos θ 2 f CB L B i cos θ 2 F l L B i cos 3 θ 2 cos 2 θ ( h B i L B i sin θ ) f CB = Q C i + q 2 L C i q 3 L C i
Under the action of the above rock structure, the source of force σm1 on the upper coal seam floor mainly includes the concentrated load F1 produced by the rotary subsidence of key block Bi, force F2 exerted by horizontal key block Ci above the goaf gangue on the goaf gangue, and self-weight Gc of the collapsed goaf gangue in the upper coal seam.
σ m 1 = F 1 + F 2 + G c F 2 = q 3 L x
In the formula, Lx denotes the contact length (in meters) of horizontal key block Ci above the goaf waste rock, where Lx = nLci with n being an integer. By applying elastic mechanics principles to calculate stress components at any point within the lower half-plane under concentrated or uniformly distributed loads, the stress distribution of the coal seam floor can be determined [34]. This methodology further enables the calculation of additional stresses induced in the lower coal seam’s mining support system and roadway surrounding rock after the upper coal seam is mined.

2.2.2. Structural Types of Overburden and Their Mechanical Analysis

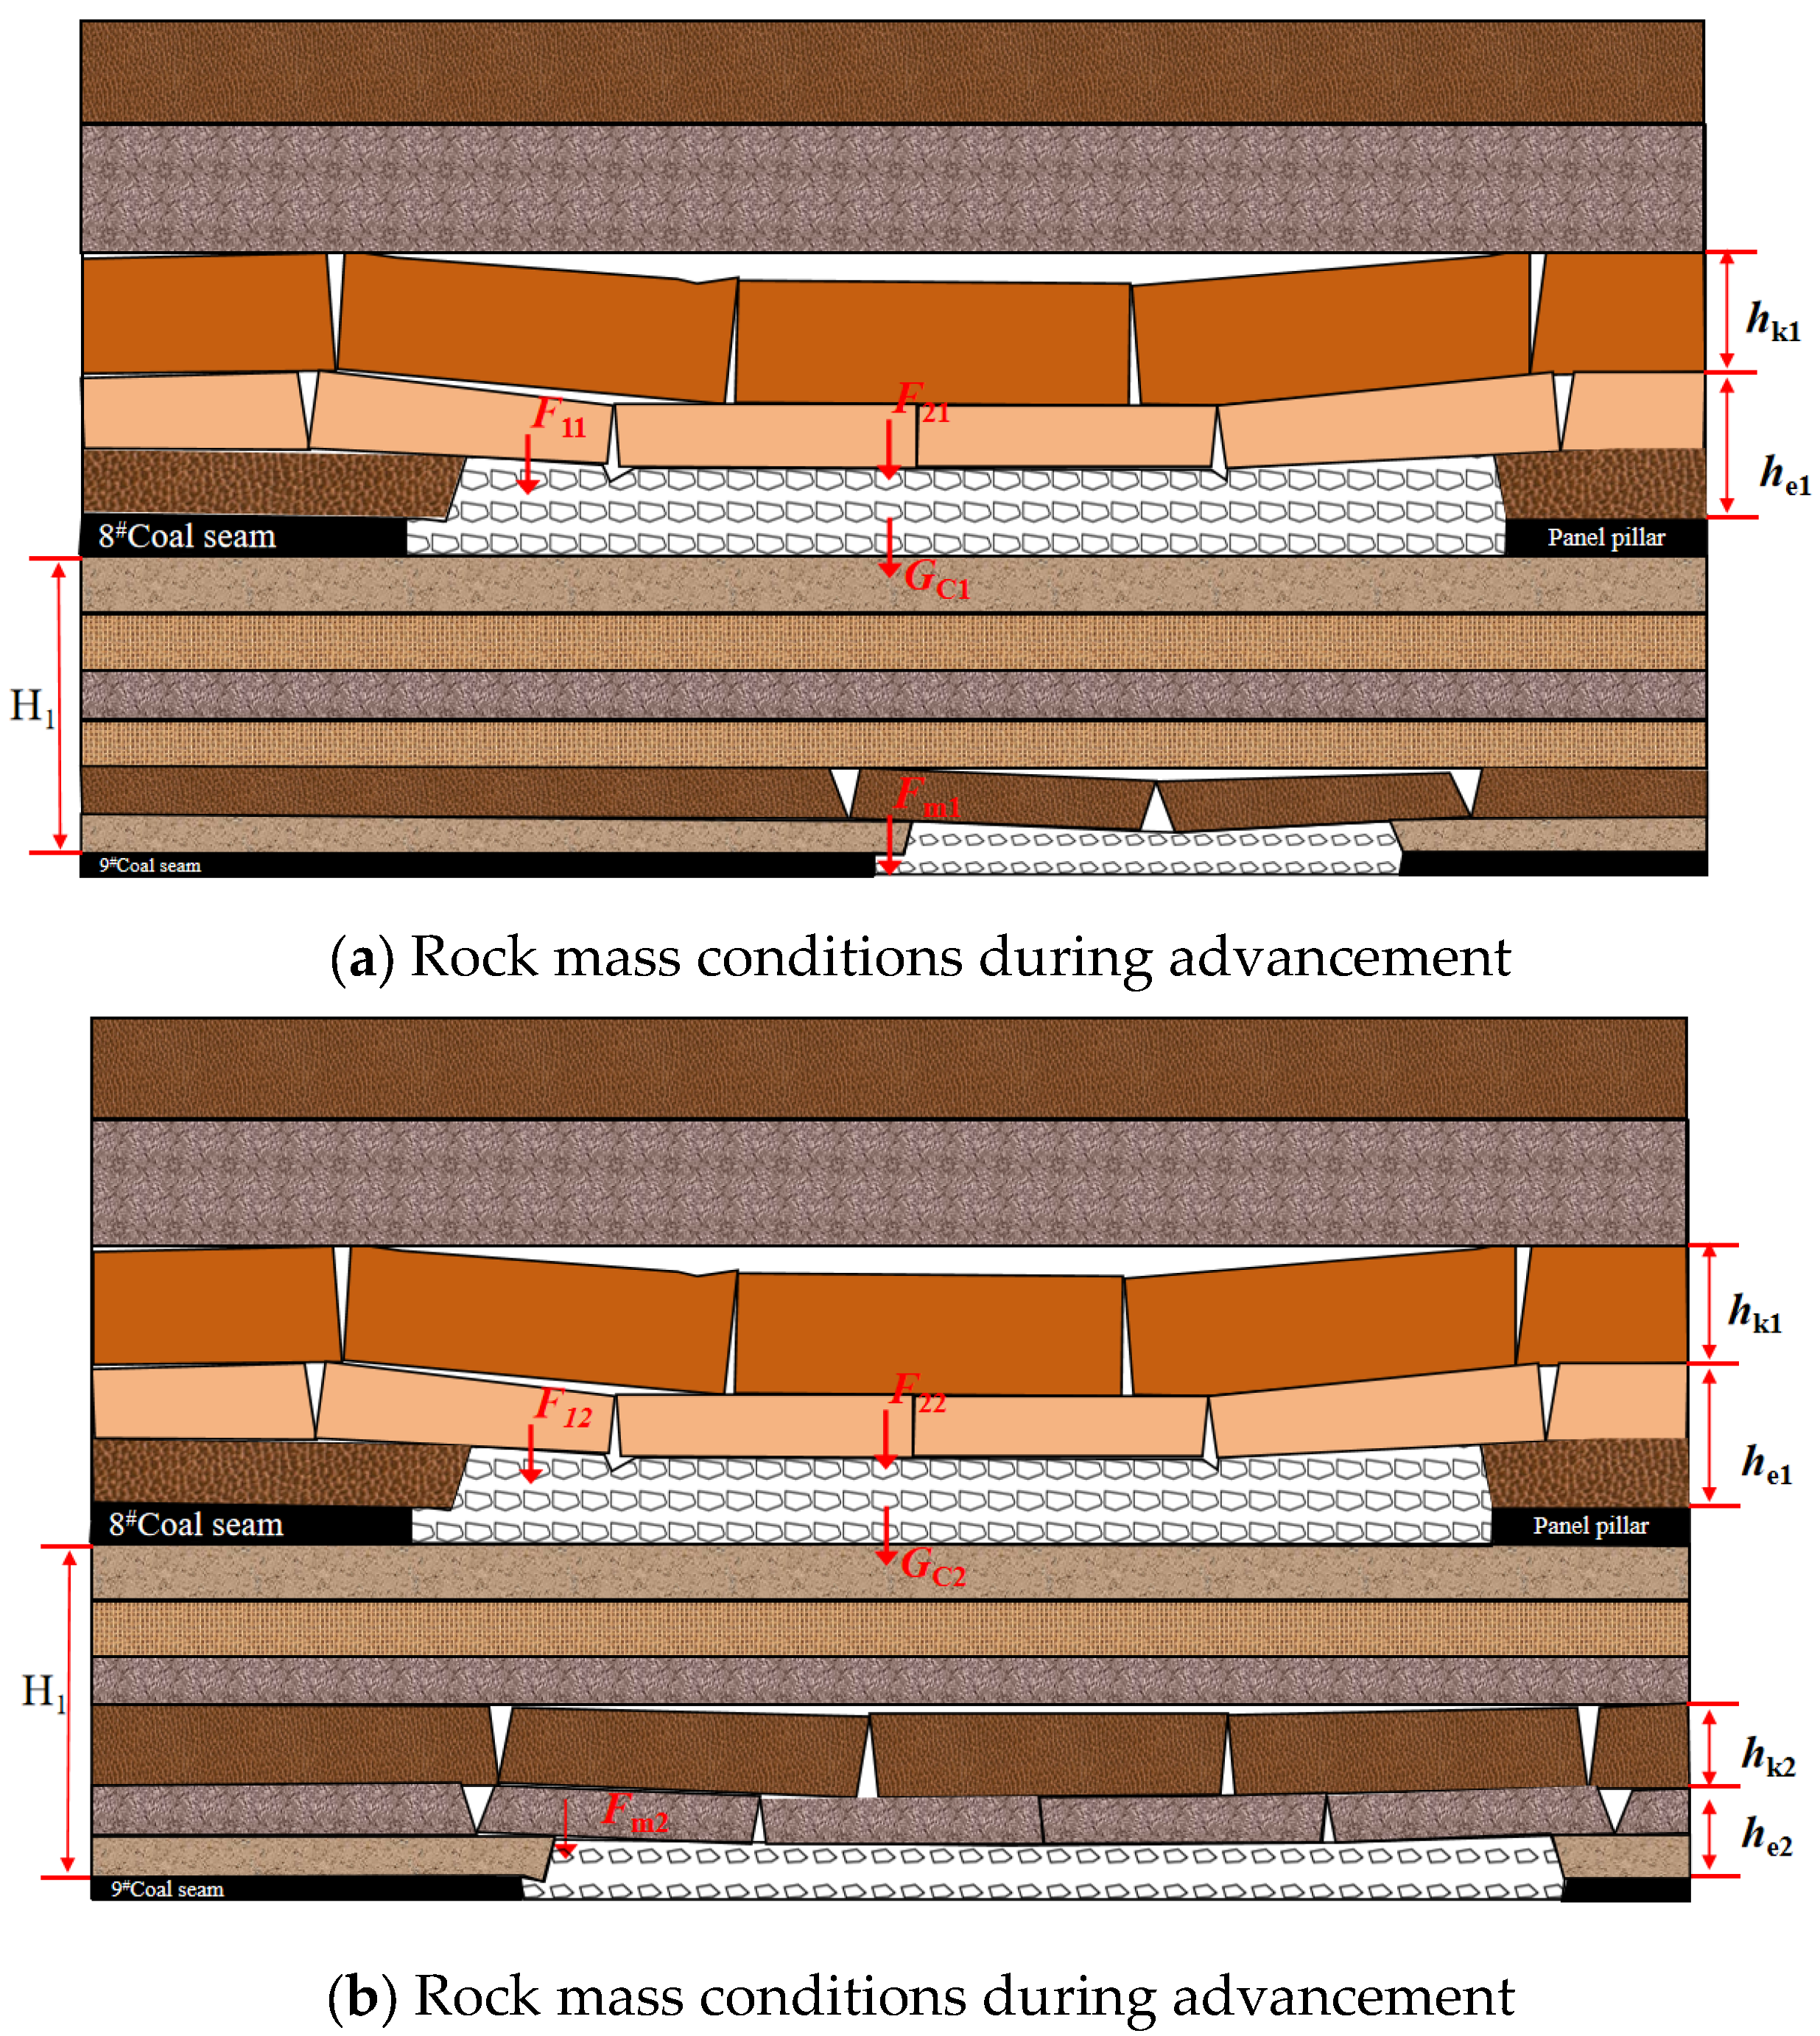
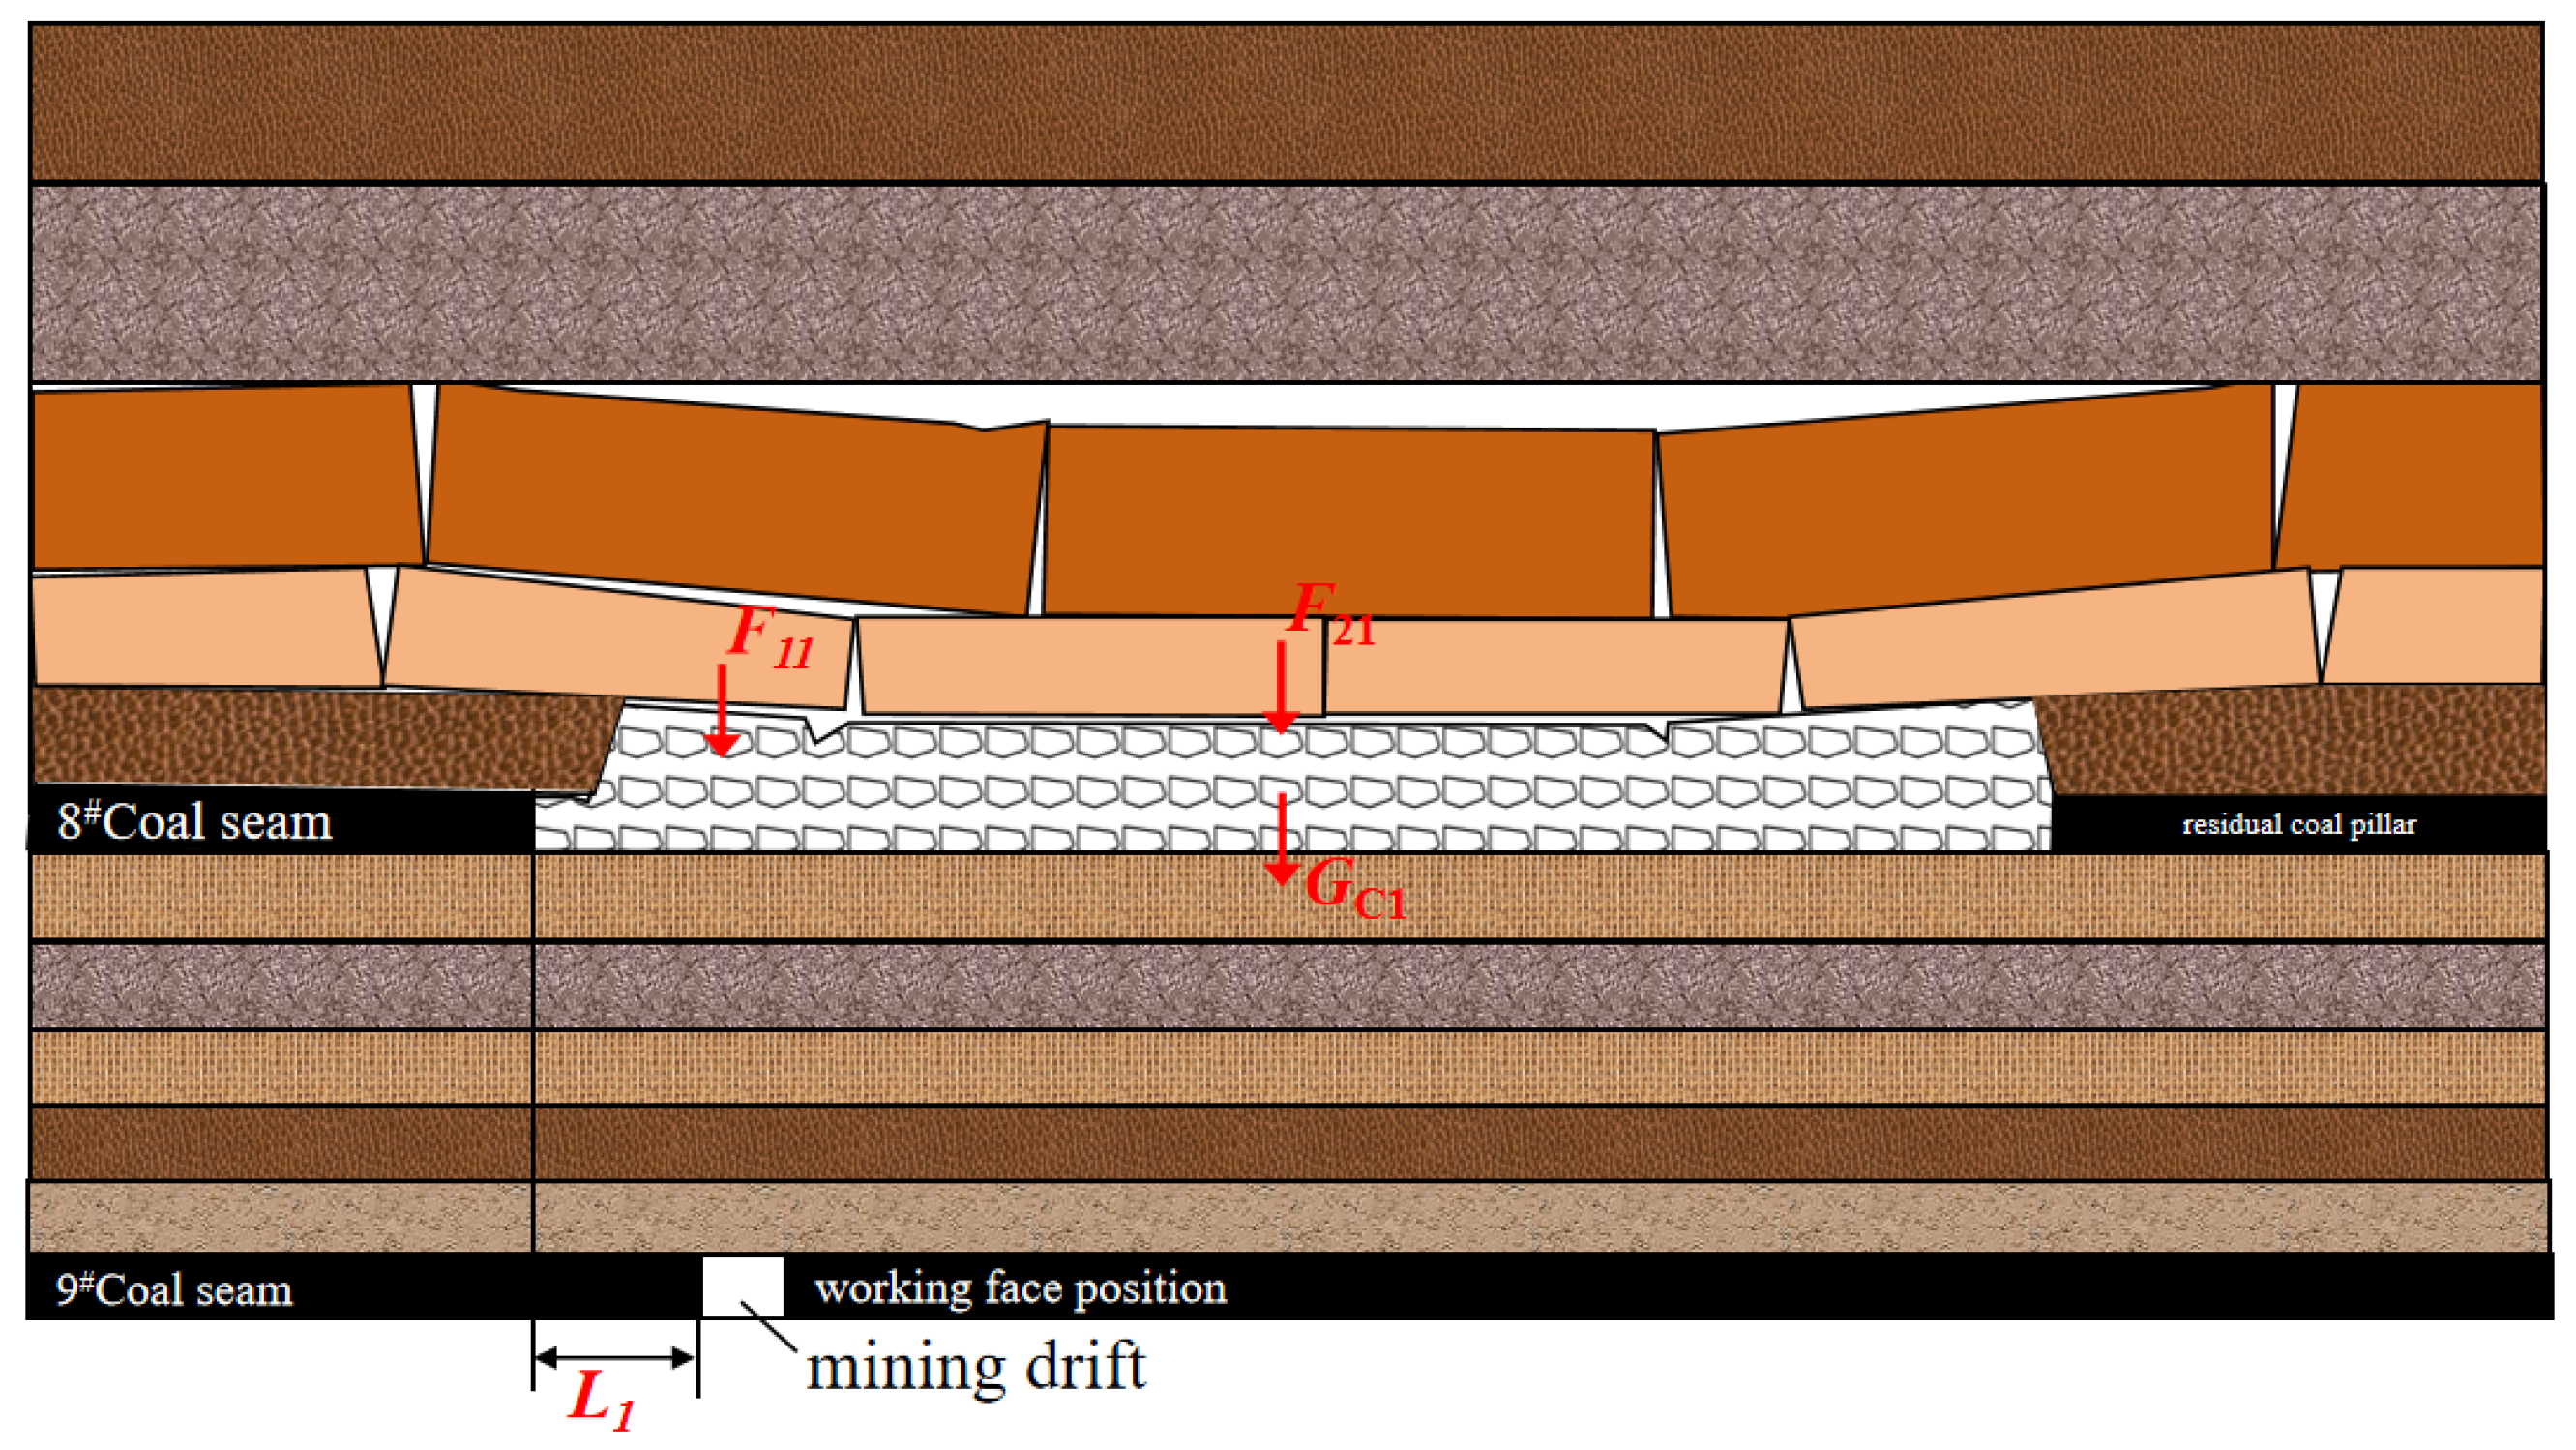
The overburden structure formed after coal mining determines the overall load-bearing configuration of the overburden, while the lateral overburden structure directly reflects the load transfer path of the lower coal seam’s mining-induced roadway under the upper coal seam. Taking a double-layer coal seam (comprising 8# and 9# coal seams from top to bottom) as an example, correlation analysis is conducted under downward mining conditions. Assuming the 8# and 9# coal seams have an offset distance of L1 with adjacent working faces both exhibiting internal offset, and disregarding the impact of working face length, stable load-bearing structures can form above each coal seam when at least one group of hard rock layers with effective load-bearing capacity exists between them. The key inter-blocks can maintain effective horizontal force transfer, defining this structure as a complete load-bearing type (as shown in Figure 5). In the diagram, F11 and F12 represent the concentrated loads generated by the rotational subsidence of key block Bi above the 8# and 9# coal seams, respectively. F21 and F22 denote the horizontal forces exerted by key block Ci above the goaf gangue of the 8# and 9# coal seams on the goaf gangue, while GC1 and GC2 represent the self-weight of the collapsed goaf gangue in the 8# and 9# coal seams. Fm1 and Fm2 indicate the sum of the direct roof self-weight above the supports during initial mining and the pressure generated by the rotational failure of the basic roof during periodic roof caving in the 9# coal seam working face. Under these conditions, it is essential to ensure that the failure of the upper coal seam floor does not compromise the load-bearing structure of the lower coal seam, while also preventing the lower coal seam from destabilizing the load-bearing structure during mining. Assuming the maximum floor failure depth after upper coal seam mining is hd, for any two adjacent coal seams, there exists.
h d H i h e , i + 1 h k , i + 1
In the formula, Hi denotes the vertical distance between the upper and lower coal seams (in meters), he, i + 1 represents the distance between the coal seam and the dominant rock layer above it in the supporting structure (in meters), and hk, i + 1 indicates the thickness of the dominant rock layer in the supporting structure above the coal seam (in meters).
When the damage depth of the upper coal seam floor meets Equation (4), the load-bearing structure of the lower coal seam will not be affected by the mining of the upper coal seam. Meanwhile, to ensure that the load-bearing structure above remains in an effective bearing state during the mining of the lower coal seam, based on the “S-R” theory proposed by Academician Qian Minggao, a sufficient condition for maintaining the effective bearing state of each load-bearing structure under the mining of coal seam groups is:
H i m i + 1 K p 1
In the formula, mi+1 denotes the thickness of the i + 1 layer of coal, m; and Kp represents the average caving coefficient of overburden. In fully supported mining faces, the overburden structures of coal seam 8 and coal seam 9 have reached a stable equilibrium state, exerting minimal influence on the upper overburden support system. The evolution of intermediate overburden structures aligns with single-seam mining conditions, featuring relatively low working face pressure intensity that poses limited impact on safe mining operations. During initial pressure stages, the support load in the coal seam 9 mining face primarily consists of: (1) the sum of the direct roof weight above supports and pressure generated by the collapse and rotation of coal seam 9′s basic roof structure (Fm1); and (2) additional stresses induced on the floor by overlying coal seam 8 and 9 mining activities. These additional stresses originate from: concentrated loads F11 and F12 caused by the collapse and rotation of key block Bi in overlying coal seam 8 and 9; forces F21 and F22 exerted by horizontal key block Ci above gob areas in overlying coal seam 8 and 9; and self-weight Gc1 and Gc2 of collapsed gob in overlying coal seam 8 and 9. During cyclic pressure stages, the support load mainly comprises: (1) the sum of the direct roof weight above supports and pressure from the collapse and rotation of coal seam 9′s basic roof structure (Fm2); and (2) additional stresses on the floor from overlying coal seam 8 and 9 mining activities. As the overburden structure remains largely unchanged during both initial and cyclic pressure stages, the calculation method for additional stresses on the floor remains consistent. On this basis, in order to reveal the influencing characteristics of the upper bearing structure on the lower coal seam mining roadway, the lateral overburden structural model of the coal seam group under a complete bearing condition is obtained (Figure 5).
As the load-bearing structure of the upper coal seam remains intact and stable, the additional stress field transmitted to the floor should exhibit uniform spatial distribution. For Figure 6, the calculation method for additional stresses induced by mining the 8# and 9# coal seams on the floor aligns with that used for mining support loads. This involves separately calculating the post-mining stresses in the floor caused by the 8# and 9# seams, then summing them up. By applying elastic mechanics principles, the resulting floor stress distribution can be determined. In this scenario, the lower coal seam’s mining roadway experiences minimal repeated mining effects. The surrounding rock deformation primarily stems from stress redistribution due to excavation and the substantially constant static load transferred from the stable overlying structure. Consequently, the roadway surrounding rock typically demonstrates low convergence, slow deformation rates, and a tendency toward stabilization. The roof subsides uniformly, with controllable side wall displacement and negligible floor bulging. Conventional support control measures effectively ensure the stability of the roadway surrounding rock, maintaining an extremely low overall instability risk.

2.3. Numerical Simulation Method

2.3.1. Establishment of Numerical Model

The simulation was modeled based on the actual geological conditions of a specific mine, with a mean dip angle of 20°. Numerical calculations were performed using the FLAC3D 6.0 software.
The Mohr–Coulomb constitutive model is adopted in this simulation. The selection of this model is based on the following reasons: this study focuses on the static stress evolution, plastic zone development and large deformation characteristics of surrounding rock during close-range coal seam mining. The Mohr–Coulomb model can accurately describe the shear yield and tensile failure mechanical behavior of coal and rock mass under in situ geostress, which is fully consistent with the static failure characteristics of coal and rock materials in this study. Meanwhile, this model has been widely used and verified in numerical simulation research of underground coal mining, with mature application experience and high calculation reliability for mining-induced stress and overburden deformation analysis.
The model dimensions were set as 500 m × 310 m × 200 m. Grid division was conducted using FLAC3D’s built-in meshing function. To eliminate the influence of grid size on the accuracy of numerical calculation results, grid independence verification was carried out before formal simulation. Three groups of numerical models with different grid densities were designed for comparative analysis: coarse grid model (element size of 3–5 m, with a total of 152,896 elements), reference grid model (element size of 1.5–3 m, with a total of 300,075 elements and 304,416 nodes), and fine grid model (element size of 0.8–1.5 m, with a total of 587,624 elements). The peak vertical stress of the working face leading abutment pressure and the maximum roof subsidence of the goaf were selected as the verification indicators. The results show that the calculation error of the reference grid model and the fine grid model is less than 5% for both key indicators, which meets the accuracy requirements of numerical calculation. Meanwhile, the reference grid model can effectively balance the calculation accuracy and calculation efficiency, so the reference grid scheme was finally adopted for the formal simulation.
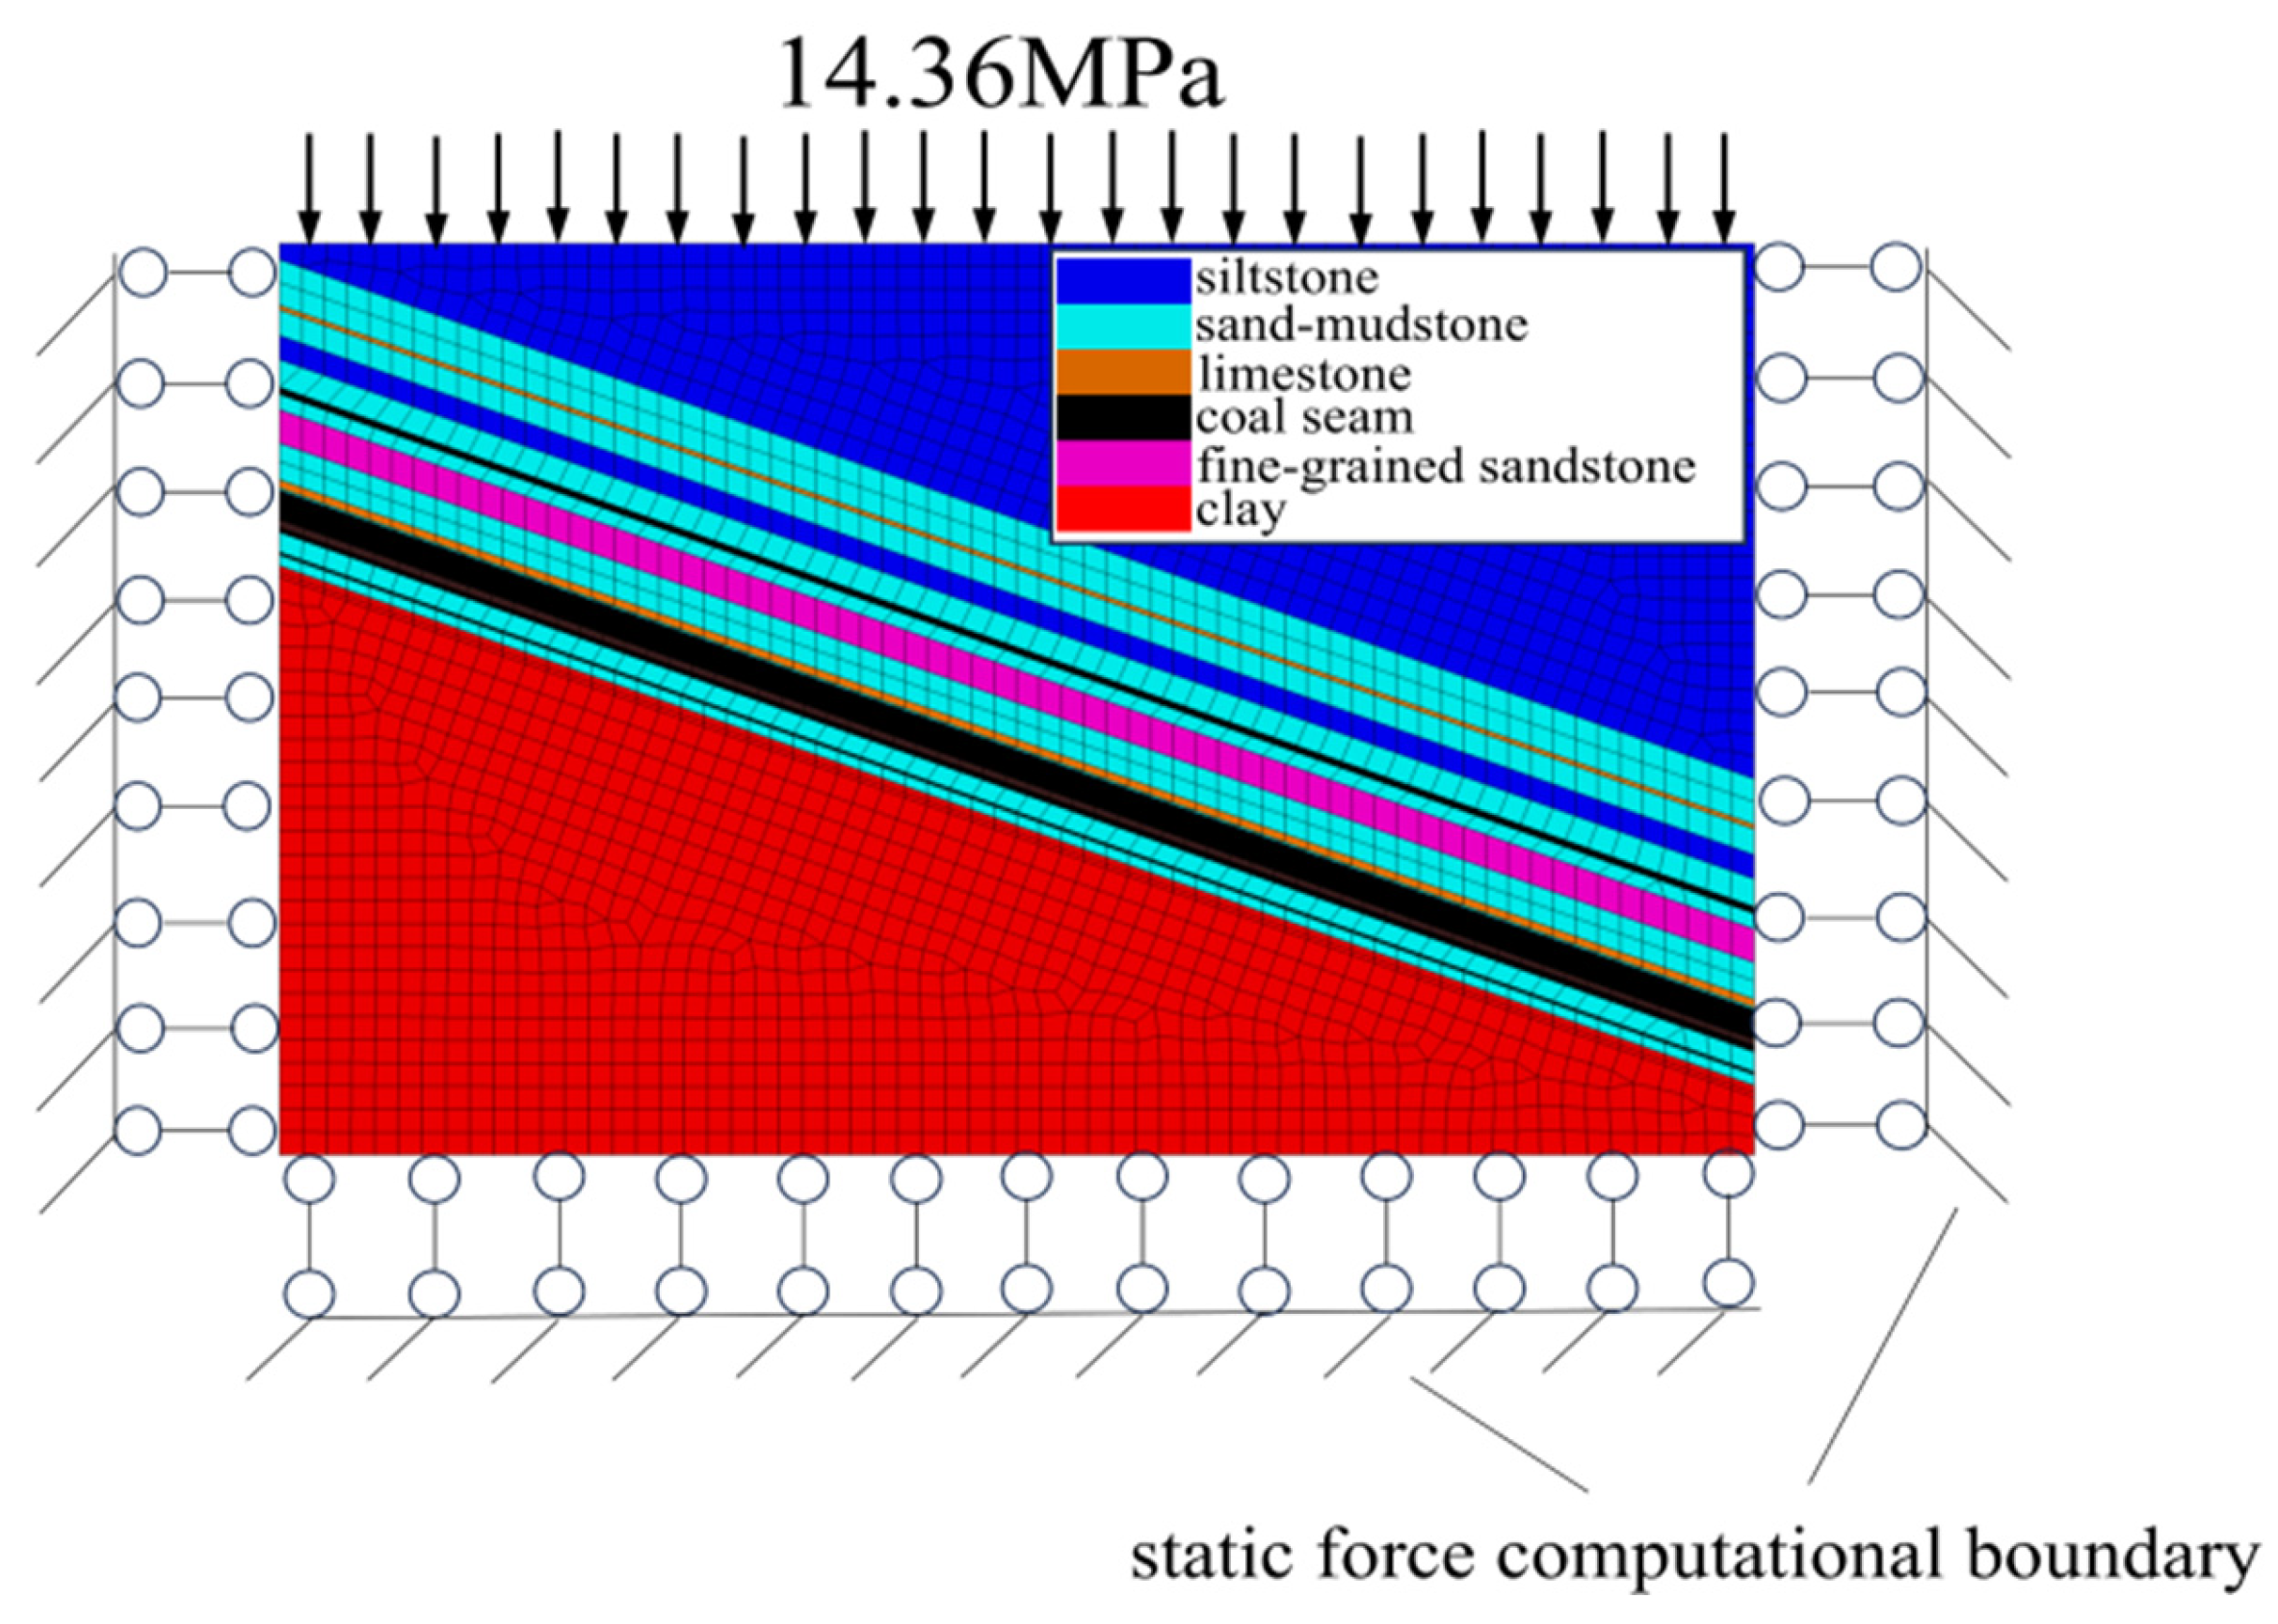
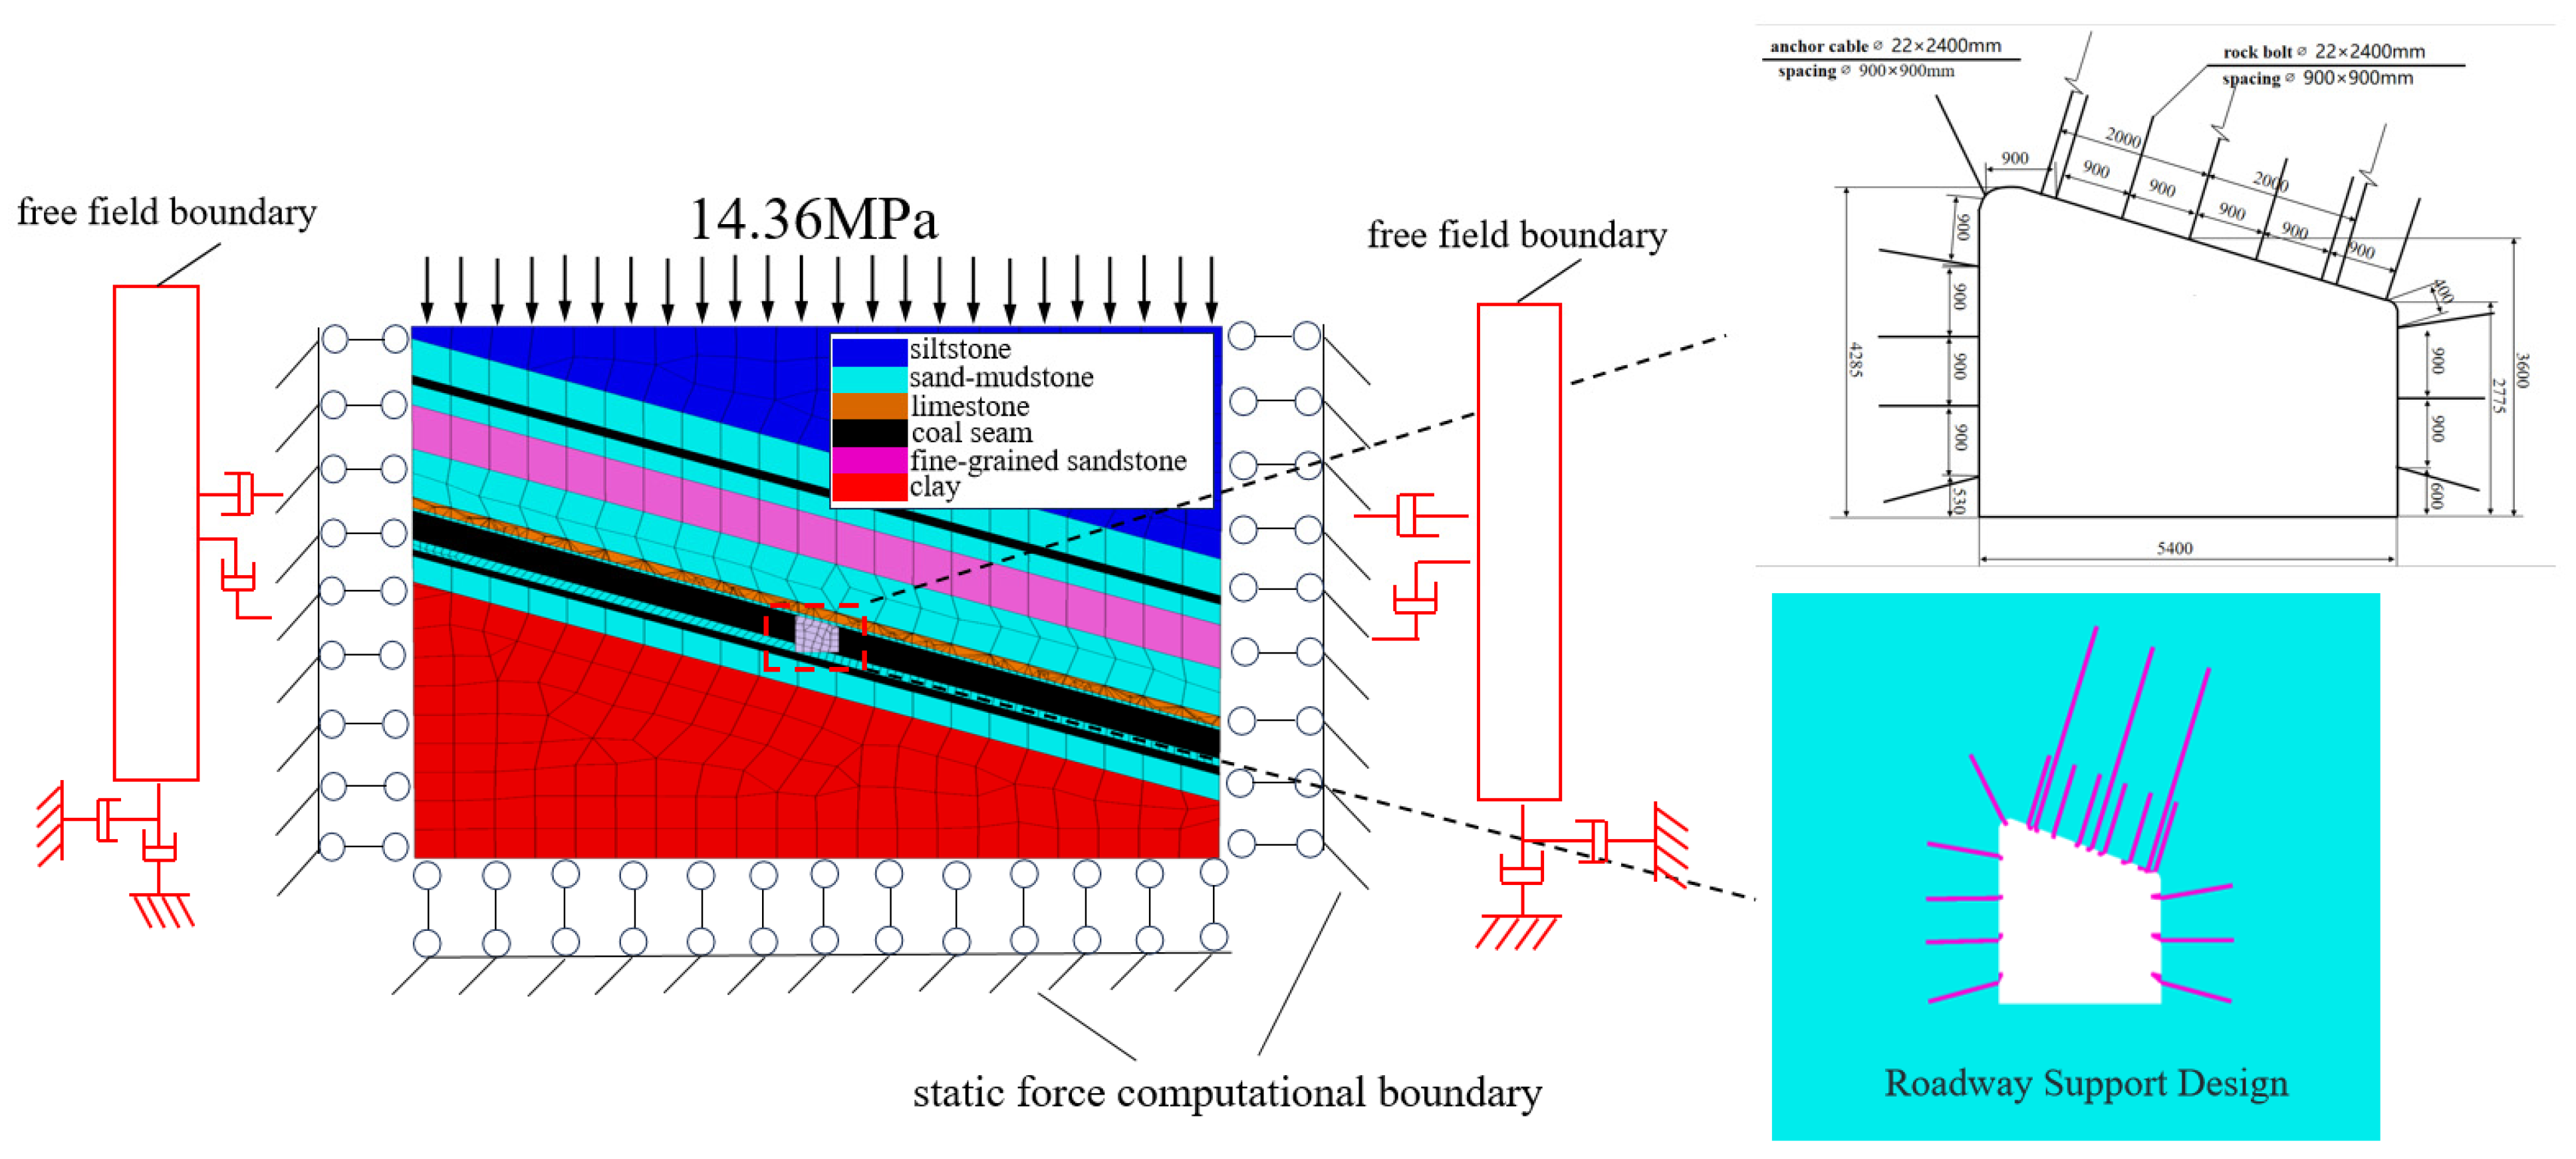
Velocity constraints (fixed horizontal displacement) were applied at the model’s base and four lateral sides for static calculation, while the top was treated as a free boundary with 14.36 MPa equivalent overburden load applied. For dynamic calculation, free-field boundaries were applied to all lateral sides and the bottom of the model, with 5% Rayleigh damping set to eliminate stress wave boundary reflection and natural model vibration, which is consistent with the standard dynamic simulation setting in FLAC3D. To account for boundary effects during modeling, a horizontal width of 30 m was maintained on both sides of the working face.
Q = ρ g h
where:
  • Q is the equilibrium load;
  • ρ is the average density of the rock mass;
  • h is the depth of the working face.
To clarify the application boundary of the numerical model established in this study and to guide its rational application in actual engineering, as shown in Figure 7, the applicability limits of the model are clearly defined as follows:
  • Applicable geological conditions: This model is applicable to close-range coal seam mining areas with relatively complete lithology, no large-scale through faults, well-developed structural planes, or significant stratum pinch-out. For mining areas with fault development, strong stratum heterogeneity, or large thickness variation in coal and rock strata, the model parameters and calculation results need to be revised based on field in situ monitoring data before application.
  • Applicable mining conditions: The model is designed for downward mining of close-range coal seams with a dip angle of 15–25°, a mining height of less than 7 m, and a single working face mining length of 200–400 m. For steeply inclined coal seams, large mining height fully mechanized caving mining, or multi-working face simultaneous mining conditions, the model needs to be reconstructed according to actual mining parameters.
  • Mechanical behavior applicable limits: The model adopts the Mohr–Coulomb constitutive model, which can accurately describe the shear yield and tensile failure characteristics of coal and rock mass under static mining disturbance and low-frequency impact load (vibration frequency ≤ 50 Hz) in this study. For high-frequency dynamic disturbance, rock mass rheological deformation, or large-scale discrete fracture and collapse of overburden, it is necessary to use a discrete element numerical method or coupled constitutive model for further simulation.
  • Dynamic simulation applicable limits: The dynamic calculation of the model is set for an impact load with a peak value of 5–10 MPa and a vibration frequency of 50 Hz, which is consistent with the mining-induced micro-seismic disturbance characteristics of the study area. For high-energy impact loads induced by fault slip, a mine earthquake with a magnitude greater than 2, or blasting disturbance, the dynamic boundary conditions, damping parameters and load input form of the model need to be recalibrated.
Figure 7. Numerical model of close coal seam.
Applsci 16 03839 g007

2.3.2. Model Parameter Design

To investigate how different mining sequences affect overburden structure evolution, stress transfer, and roof stability during close-range coal mining, a 3D numerical model was developed based on field geological conditions. Two typical mining modes were designed for comparative analysis, as shown in Table 2. The study focused on the upper 8# coal seam and lower 9# coal seam. Through numerical simulation, the stress field response patterns, displacement evolution characteristics, and plastic zone development were systematically examined.
Model calibration and validation were carried out in four stages to ensure that the numerical model can accurately reflect the actual mine pressure manifestation characteristics of the working face, and eliminate the deviation between simulation results and actual ground behavior:
1.
Static Parameter Calibration: The mechanical parameters of each rock stratum in the model were calibrated based on the laboratory test results in Table 1, combined with the empirical conversion formula of rock mass mechanical parameters for underground coal mining. The strength parameters of the rock mass were appropriately reduced according to the integrity of the rock mass in the study area, to convert laboratory rock sample parameters into actual rock mass parameters suitable for engineering-scale simulation.
2.
In situ Stress Field Verification: Before formal mining simulation, an initial in situ stress equilibrium calculation was carried out on the model. The vertical stress distribution of the model after equilibrium was verified against the theoretical in situ stress value calculated by overburden gravity, and the error between the simulated value and the theoretical value was controlled within 3%, which meets the accuracy requirements of engineering numerical simulation.
3.
In situ Monitoring Scheme for Model Validation
To validate the accuracy of the numerical model, a field in situ monitoring system was arranged in the 119 working face and its adjacent mining roadway, covering four types of monitoring items consistent with the core research content: Five monitoring sections were arranged along the 119 mining roadway at an interval of 50 m, with monitoring points set at the roof, floor and two sides of each section to monitor the roof-to-floor convergence and two-side convergence of the roadway during the mining process, with a monitoring frequency of 1 time/day. Six groups of borehole stress cells were arranged in the solid coal body of the 119 working face, with a burial depth of 8 m, to monitor the evolution of the leading abutment stress during the working face advancement, with a monitoring frequency of 1 time/hour. Twenty hydraulic supports in the middle section of the 119 working face were equipped with pressure monitoring sensors to monitor the working resistance of the supports during mining, which reflects the roof pressure manifestation characteristics of the working face, with a monitoring frequency of 1 time/10 min. The mine’s ground micro-seismic monitoring system was used to monitor the energy, frequency and spatial distribution of micro-seismic events during the mining process of the 119 working face, to verify the dynamic response characteristics of the surrounding rock under mining disturbance.
4.
Field-Measured Data Calibration and Model Validation
The model was further calibrated and validated using the actual measured mine pressure data of the 119 working face. The simulated peak value of the leading abutment pressure, the influence range of the leading stress, the roof subsidence of the goaf, the roadway convergence deformation, and the periodic weighting step distance of the working face were matched with the field-measured data. The mechanical parameters of the key strata were fine-tuned within the range of the standard deviation of the laboratory test results, to ensure that the model can accurately reproduce the actual mining-induced mine pressure manifestation law of the working face. A detailed comparative analysis between the simulation results and the field-measured data is presented in Section 3.1.4.

2.3.3. Model Establishment

Based on the physical parameters of coal and rock layers and roadway layout at the mining face, FLAC3D software was used to study the failure characteristics of inclined coal seam roadways under impact loads. The model dimensions were length × width × height = 500 m × 310 m × 200 m, with a coal seam dip angle of 20°. The physical parameters of rock layers are shown in Table 1, and the numerical model of the roadway is illustrated in Figure 8. During static load calculation, horizontal displacement constraints were applied to both sides and front/rear of the model, vertical displacement constraints were imposed at the bottom, and the top was treated as a free boundary. Based on burial depth and unsimulated rock layer thickness, a compensation stress of 14.36 MPa was applied to the top of the model, which adopted the Mohr–Coulomb strength failure criterion. For dynamic load calculation, free-field boundaries were applied to both sides, front/rear, and bottom of the model, with Rayleigh damping added to reduce natural vibrations. Stress measurement points were installed at horizontal distances of 0, 5, 10, and 15 m from the direct impact load source directly above the roof to observe the propagation characteristics of the impact load. The roadway layout and anchor bolt/cable arrangement are shown in Figure 8.

2.3.4. Scheme Design

To further investigate the role of roadway support systems in controlling surrounding rock under impact loading, two experimental schemes were designed for simulation evaluation, as shown in Table 3. The numerical simulation process was divided into three stages: (1) applying static boundary conditions; (2) excavating the roadway and calculating the stress redistribution equilibrium of surrounding rock; (3) using the nonlinear dynamics module of FLAC3D to analyze the system, where a stress wave was applied 15 m directly above the roadway roof with dynamic boundary conditions. The dynamic calculation duration was 0.2 s, and the impact load was modeled as a cosine wave with a vibration frequency of 50 Hz and a vibration period of 0.2 s. The relationship between the peak vibration velocity of the shock source and its physical parameters was calculated as shown in Equations (2) and (3). The simulated impact load in this study was 8 MPa, corresponding to a peak vibration velocity of 9.57 m/s.
σ n = 2 ρ C p ν n
In the formula, σn denotes the normal stress (in MPa), ρ represents the rock density (kg/m3), CP indicates the wave velocity (m/s), and Vn is the normal velocity of particles (m/s).
C p = K + 4 3 G ρ
where K is the bulk modulus of the seismic source material (MPa) and G is the shear modulus of the seismic source material (MPa).
The anchor bolt adopted in Scheme D is Φ22 × 2400 mm high-strength threaded steel bolt, with an ultimate tensile bearing capacity of 250 kN and shear strength of 45 MPa; the anchor cable is Φ17.8 × 5400 mm low-relaxation prestressed steel strand, with an ultimate tensile bearing capacity of 600 kN and shear strength of 58 MPa. Stress monitoring points were arranged along the full length of the anchor bolt and anchor cable to track the axial force and shear stress evolution of the support structure during impact loading.
The simulation scheme is to monitor the deformation of surrounding rock and the response characteristics of the support system, including the displacement of the roof, the displacement of the side, the range of the plastic zone and the stress characteristics of the anchor and anchor cable, by arranging the corresponding measuring points around the roadway.

3. Results

3.1. Mine Pressure Manifestation Characteristics Under Mining Disturbance

3.1.1. Evolution of the Mining Characteristics of the Plastic Zone in the Close-Up Coal Seam

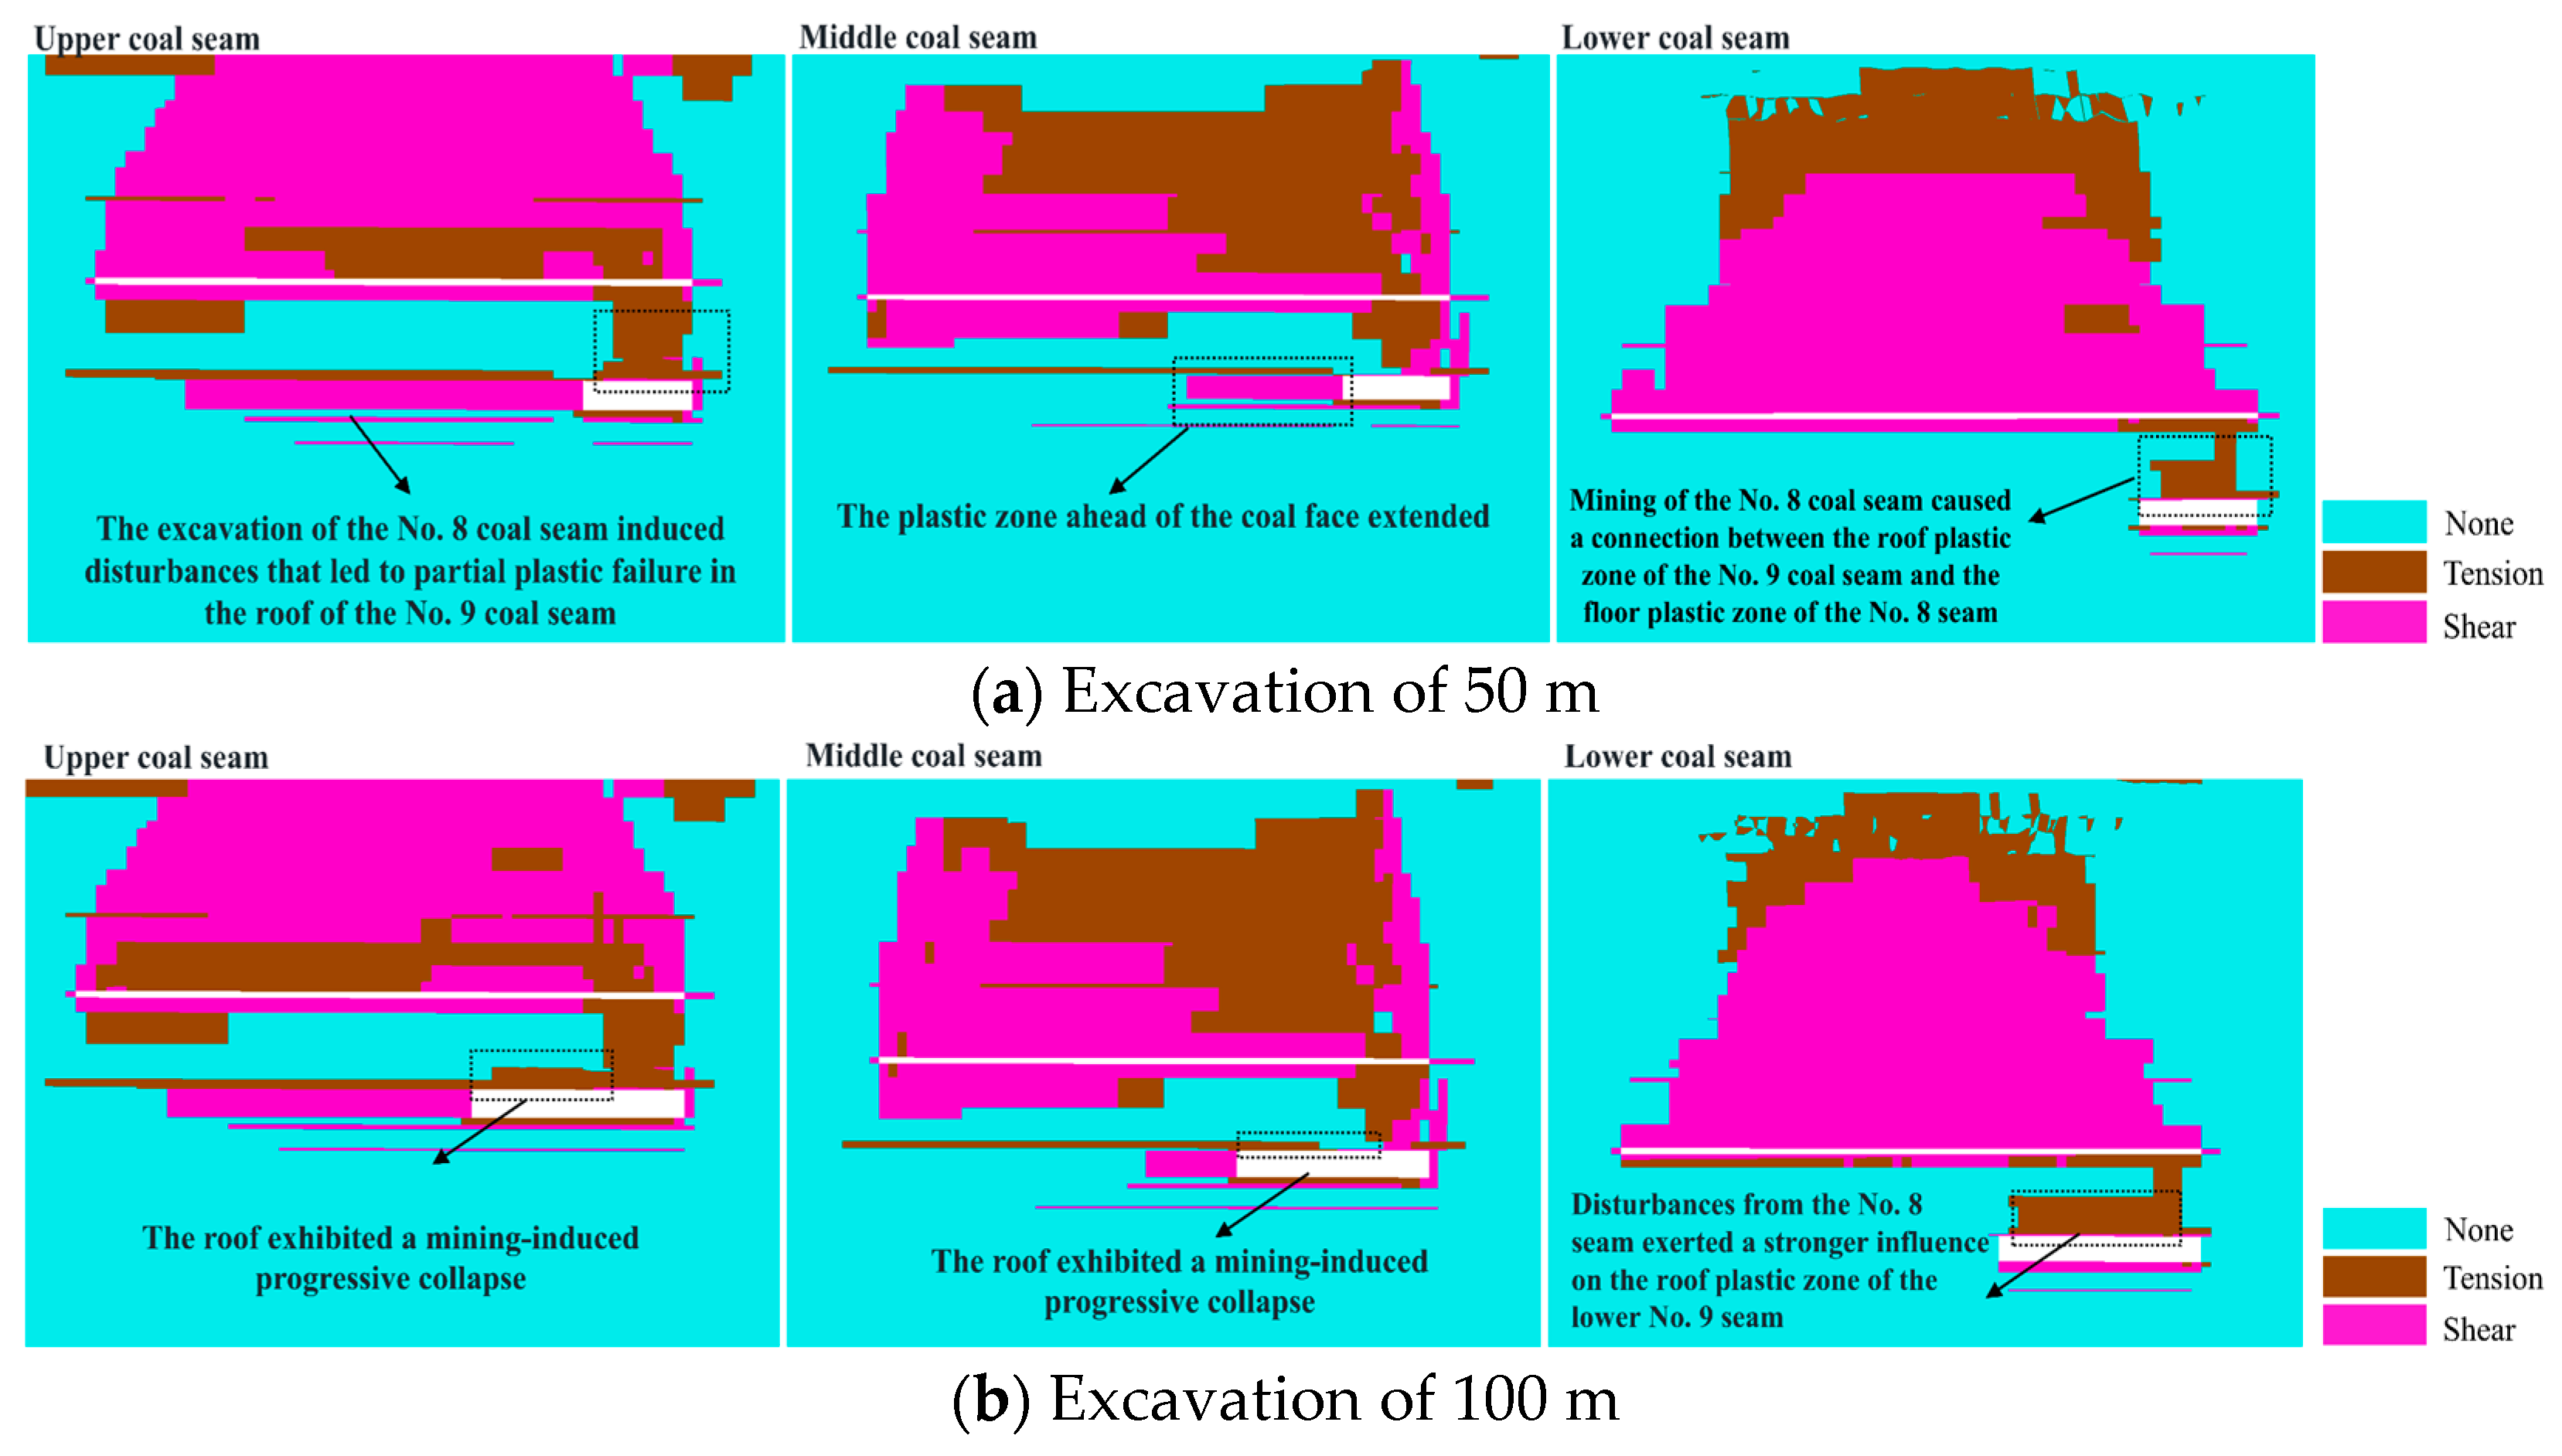
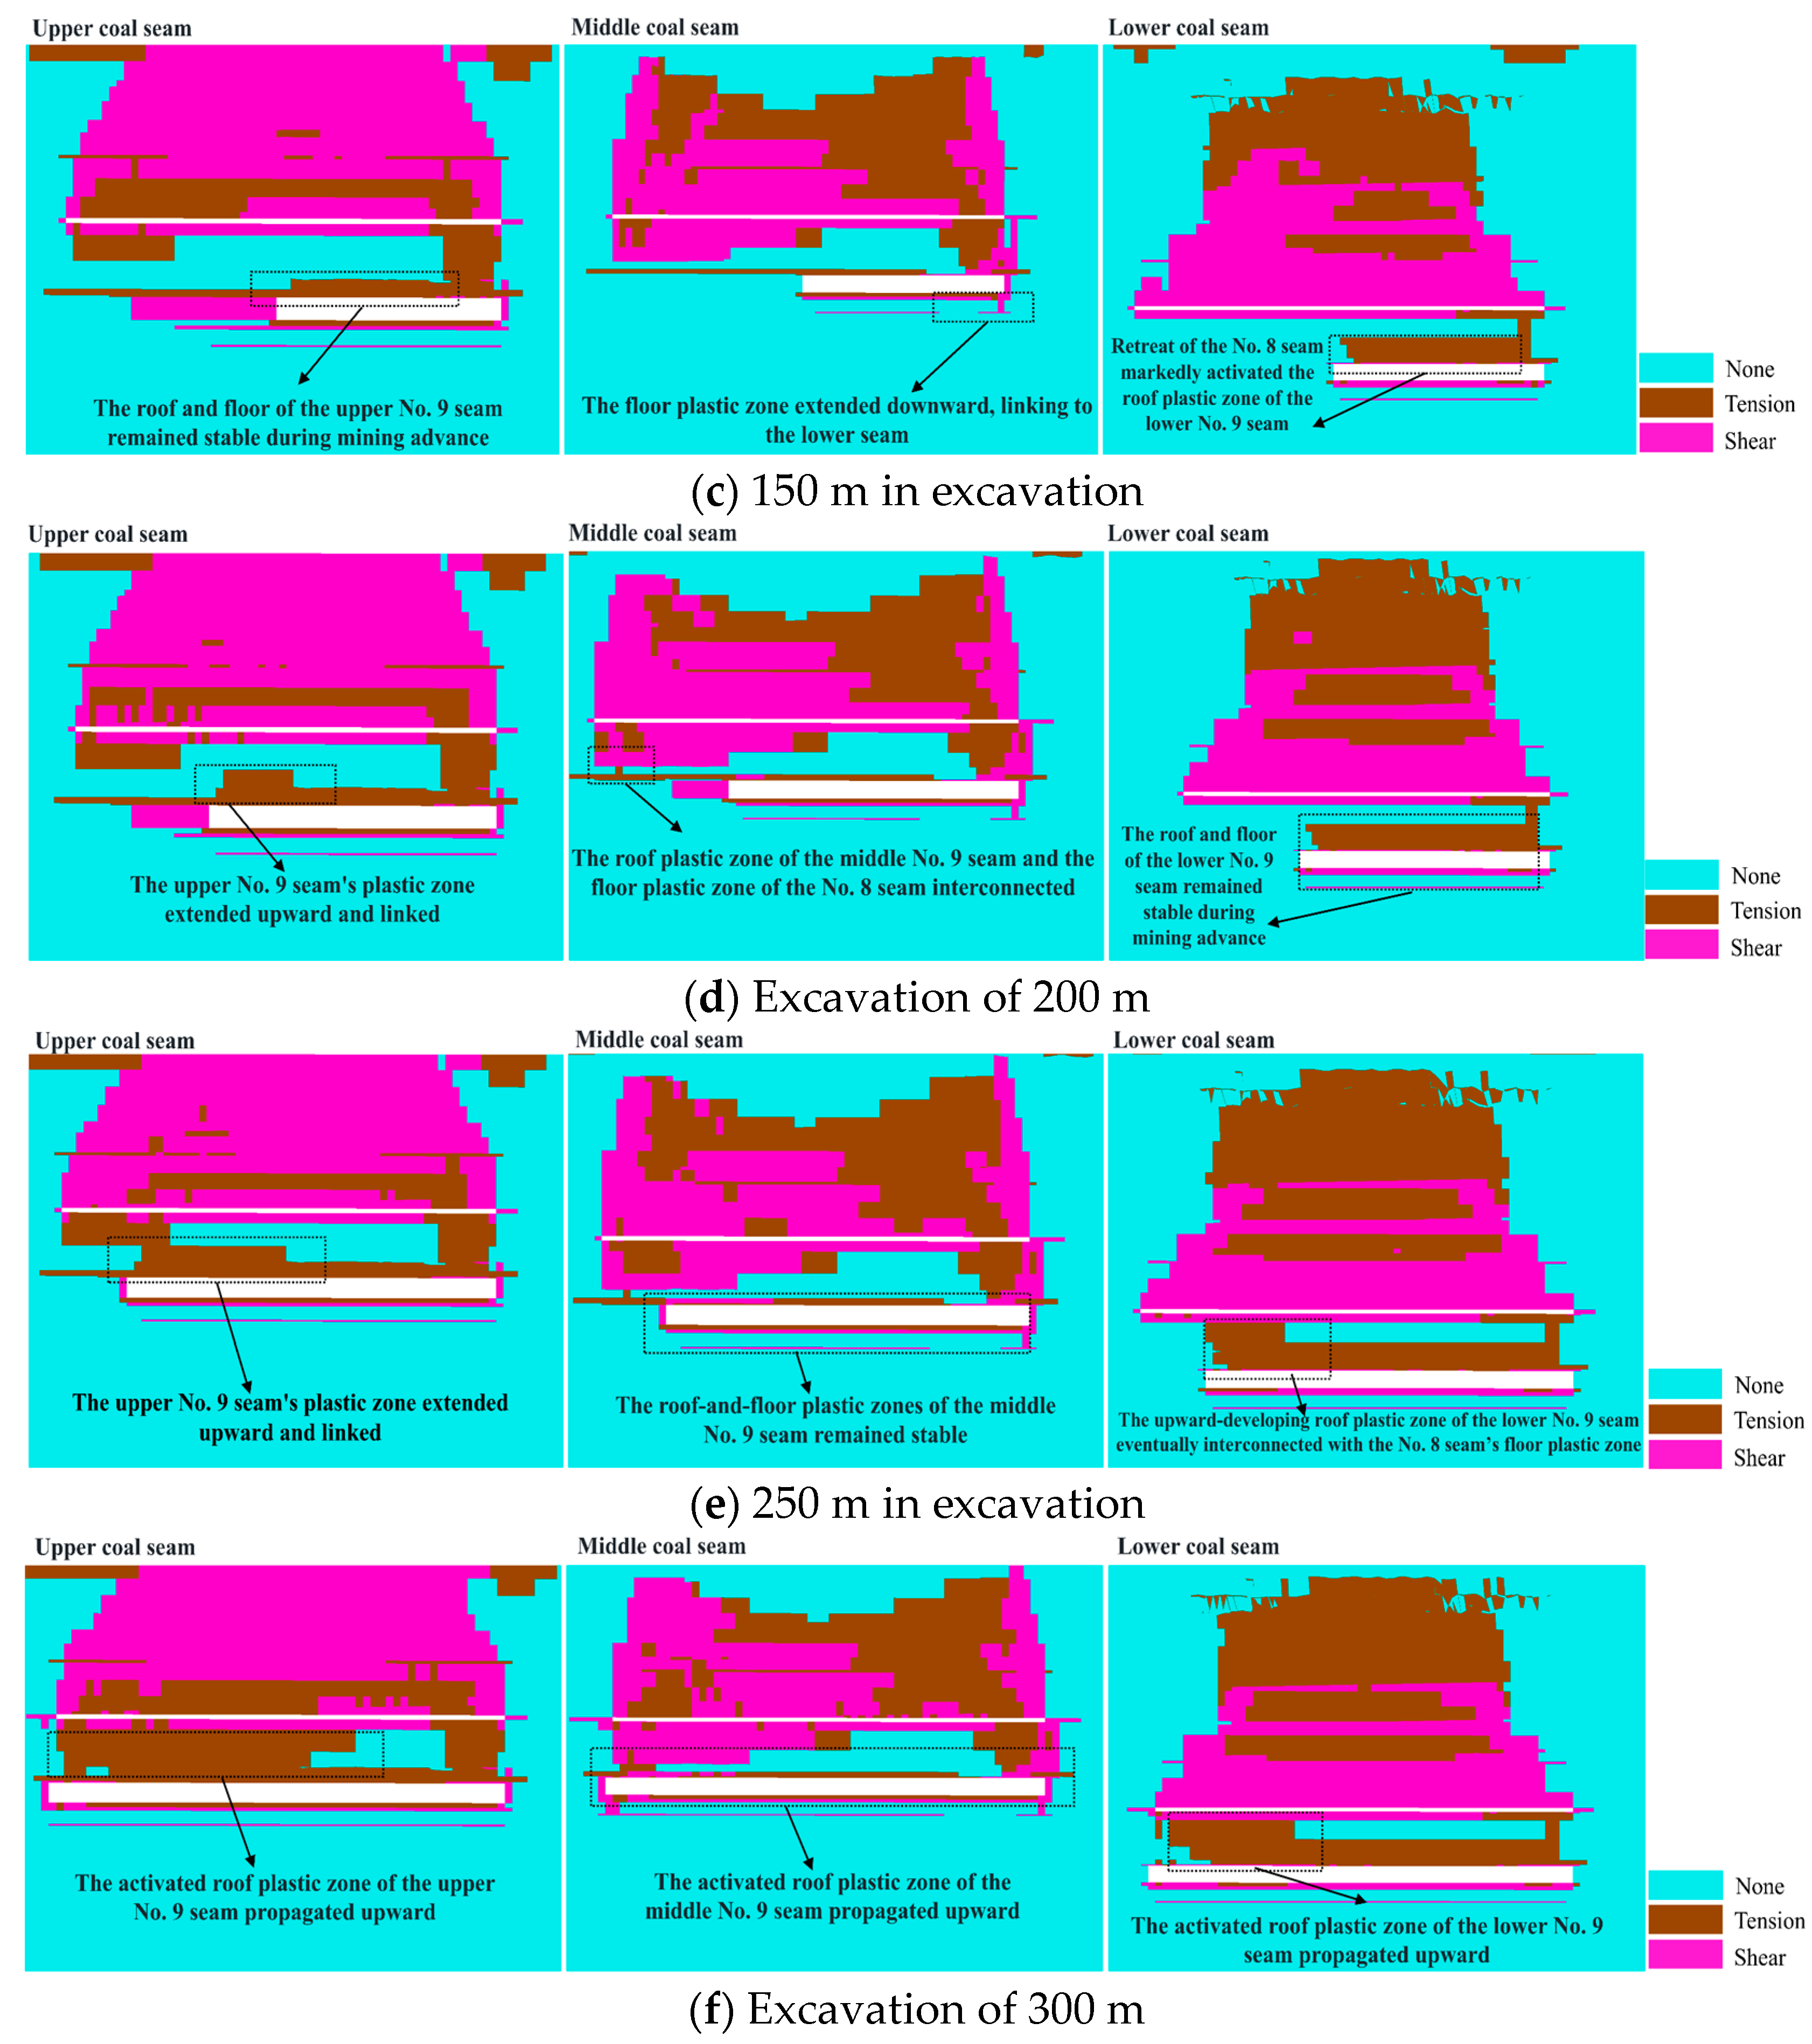
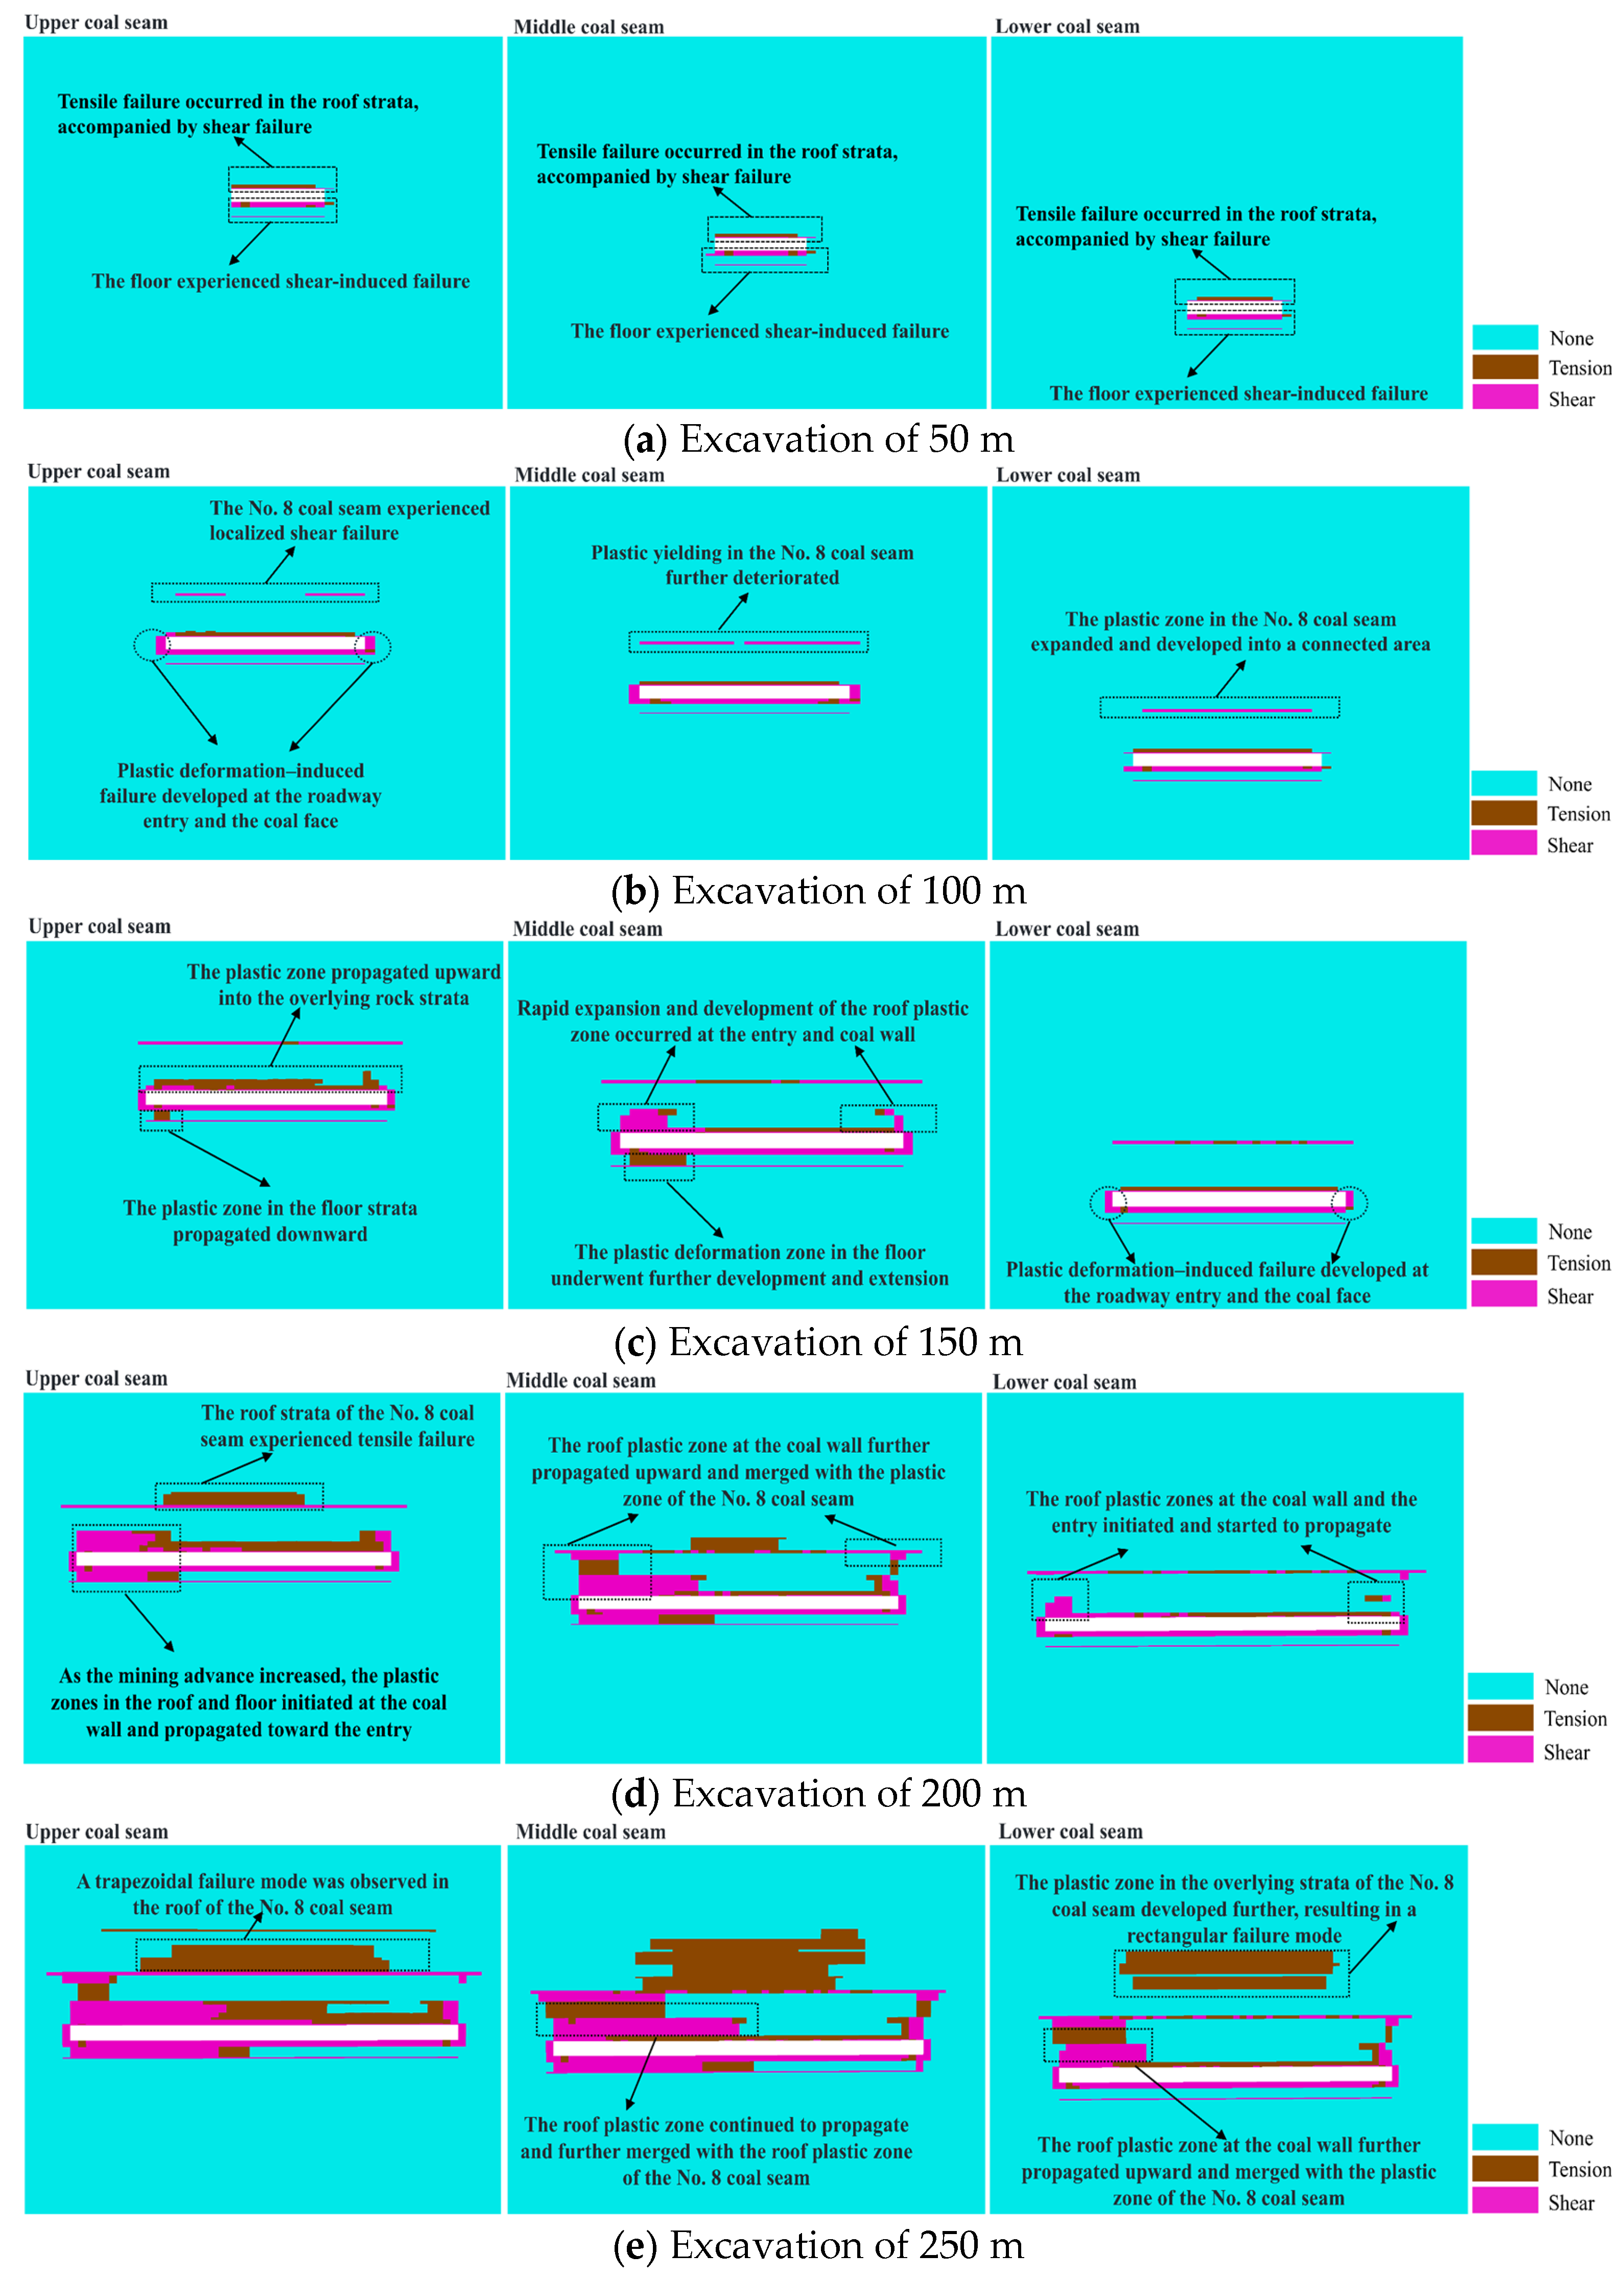
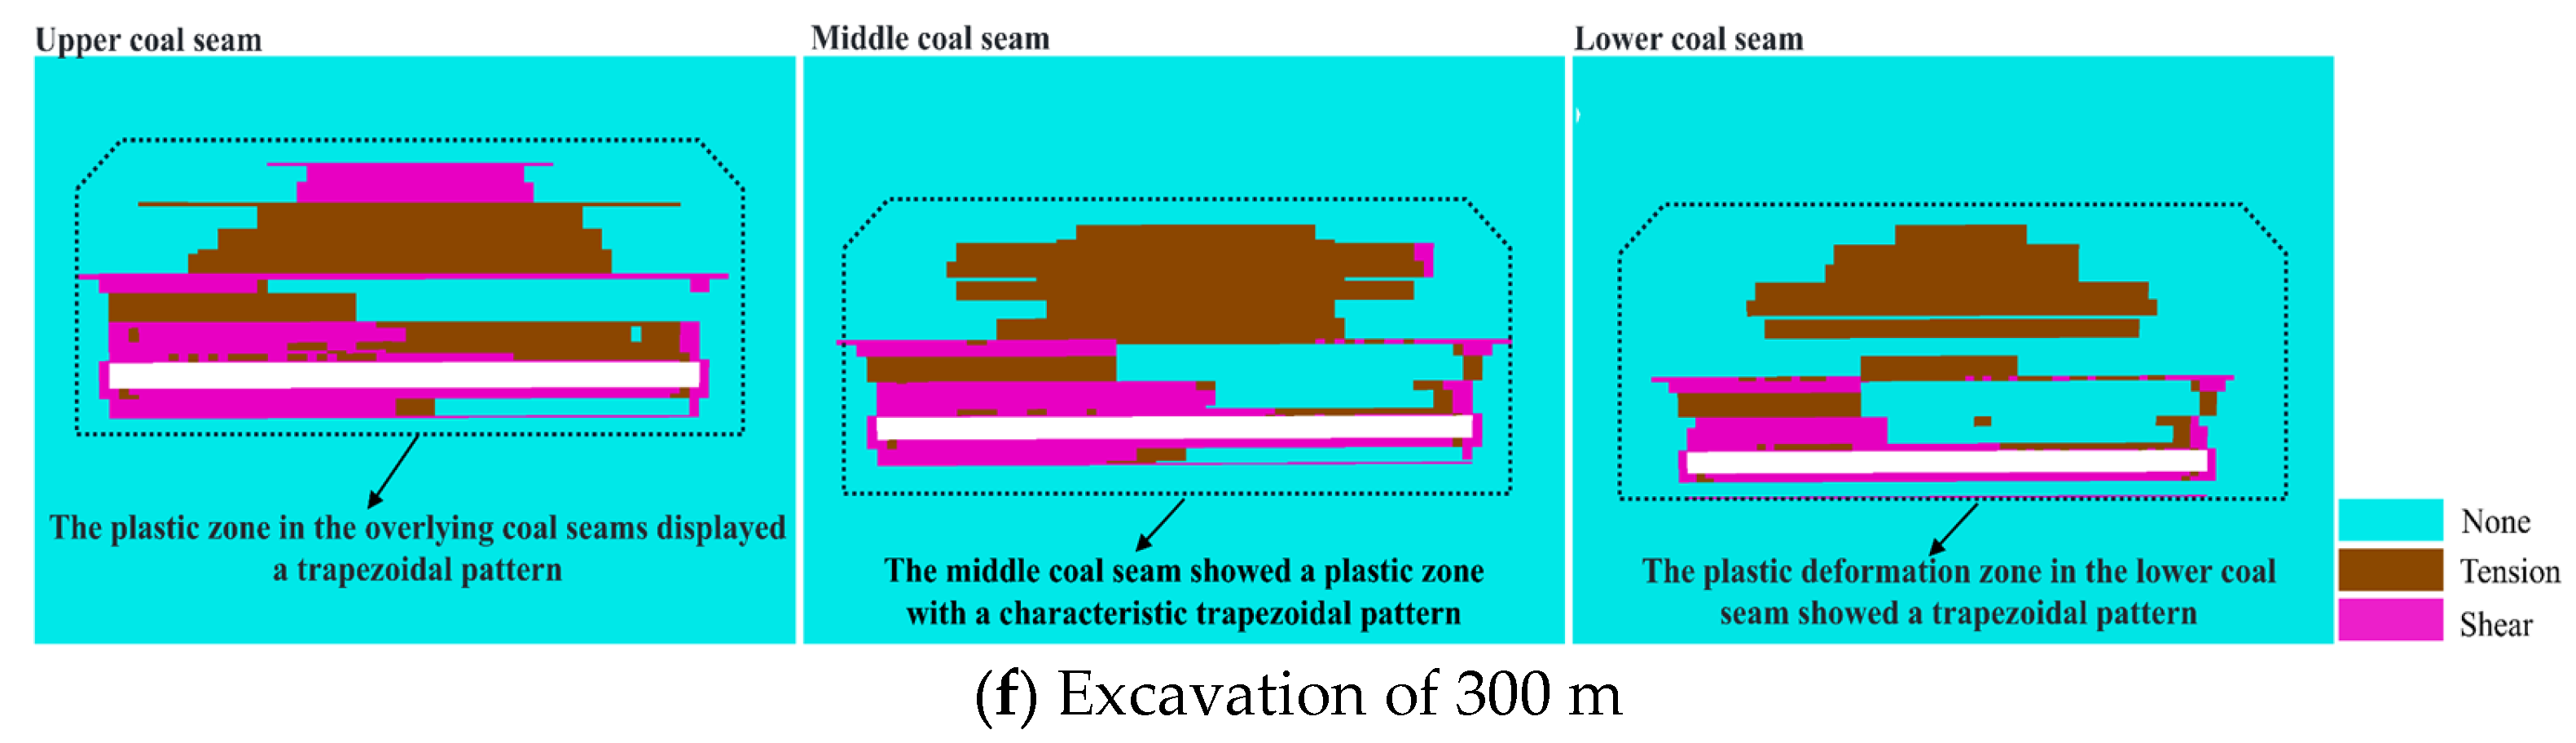
As shown in Figure 9, comparative analysis of six plastic zone distribution maps reveals distinct spatial interaction and linkage failure mechanisms between roof and floor plastic zones during close-range coal seam group mining. The mining activities in the upper 8# coal seam first induce additional stress on underlying strata, causing localized tensile and shear failure in the 9# coal seam roof, forming early plastic zones. As mining progresses, roof failure extends forward and upward, exhibiting progressive collapse characteristics induced by mining activities. When further mining of the upper coal seam occurs, its floor plastic zone expands downward, gradually connecting with the 9# coal seam roof plastic zone to form interlayer composite failure zones. During this process, roof and floor plastic zones in middle and lower coal seams experience significantly intensified disturbances, particularly in the lower 9# coal seam where roof activation occurs earlier and extends upward under upper mining influence, ultimately linking with the failure zones of overlying coal seam floors. Overall, close-range coal seam group mining leads to continuous vertical stress accumulation, transfer, and concentration, resulting in a mechanical response pattern of “top-down activation and bottom-up connectivity” in roof and floor plastic zones across coal seams, demonstrating a typical multi-layer coupled failure mechanism.
As shown in Figure 10, the working face can be divided into upper, middle, and lower sections based on dip direction. During the initial mining phase, all three sections primarily exhibit localized yielding characterized by “roof tension and floor shear.” In the mid-mining stage, the roof in the middle section first develops a continuous plastic zone that extends upward and toward the roadway. Subsequently, the plastic zone in the upper section thickens significantly and connects with the coal wall near the seam. The lower section evolves from point-like yielding to a continuous band-like deformation. As mining progresses, the plastic zone in the middle section first expands from localized to a large-scale trapezoidal band, while the floor shear zone advances deeper and couples with the coal seam’s plastic zone. The upper section then forms a secondary trapezoidal band, whereas the lower section shows delayed expansion and minimal connectivity. By the 300 m mining stage, all sections evolve into through-type failures dominated by roof tension and controlled by floor shear. However, the middle section consistently maintains the largest plastic zone and connectivity, followed by the upper section, with the lower section exhibiting the weakest characteristics. This indicates that concentrated mining stress and pressure relief overlap most significantly in the dip’s middle region. Based on these findings, engineering recommendations suggest: prioritizing single-pass advancement in the middle section while enhancing roof reinforcement and surrounding rock monitoring, followed by the upper section; and, for the lower section, maintaining conventional control parameters while monitoring deep floor shear expansion.

3.1.2. Evolution of Stress Manifestation Characteristics in Close Proximity Coal Seams

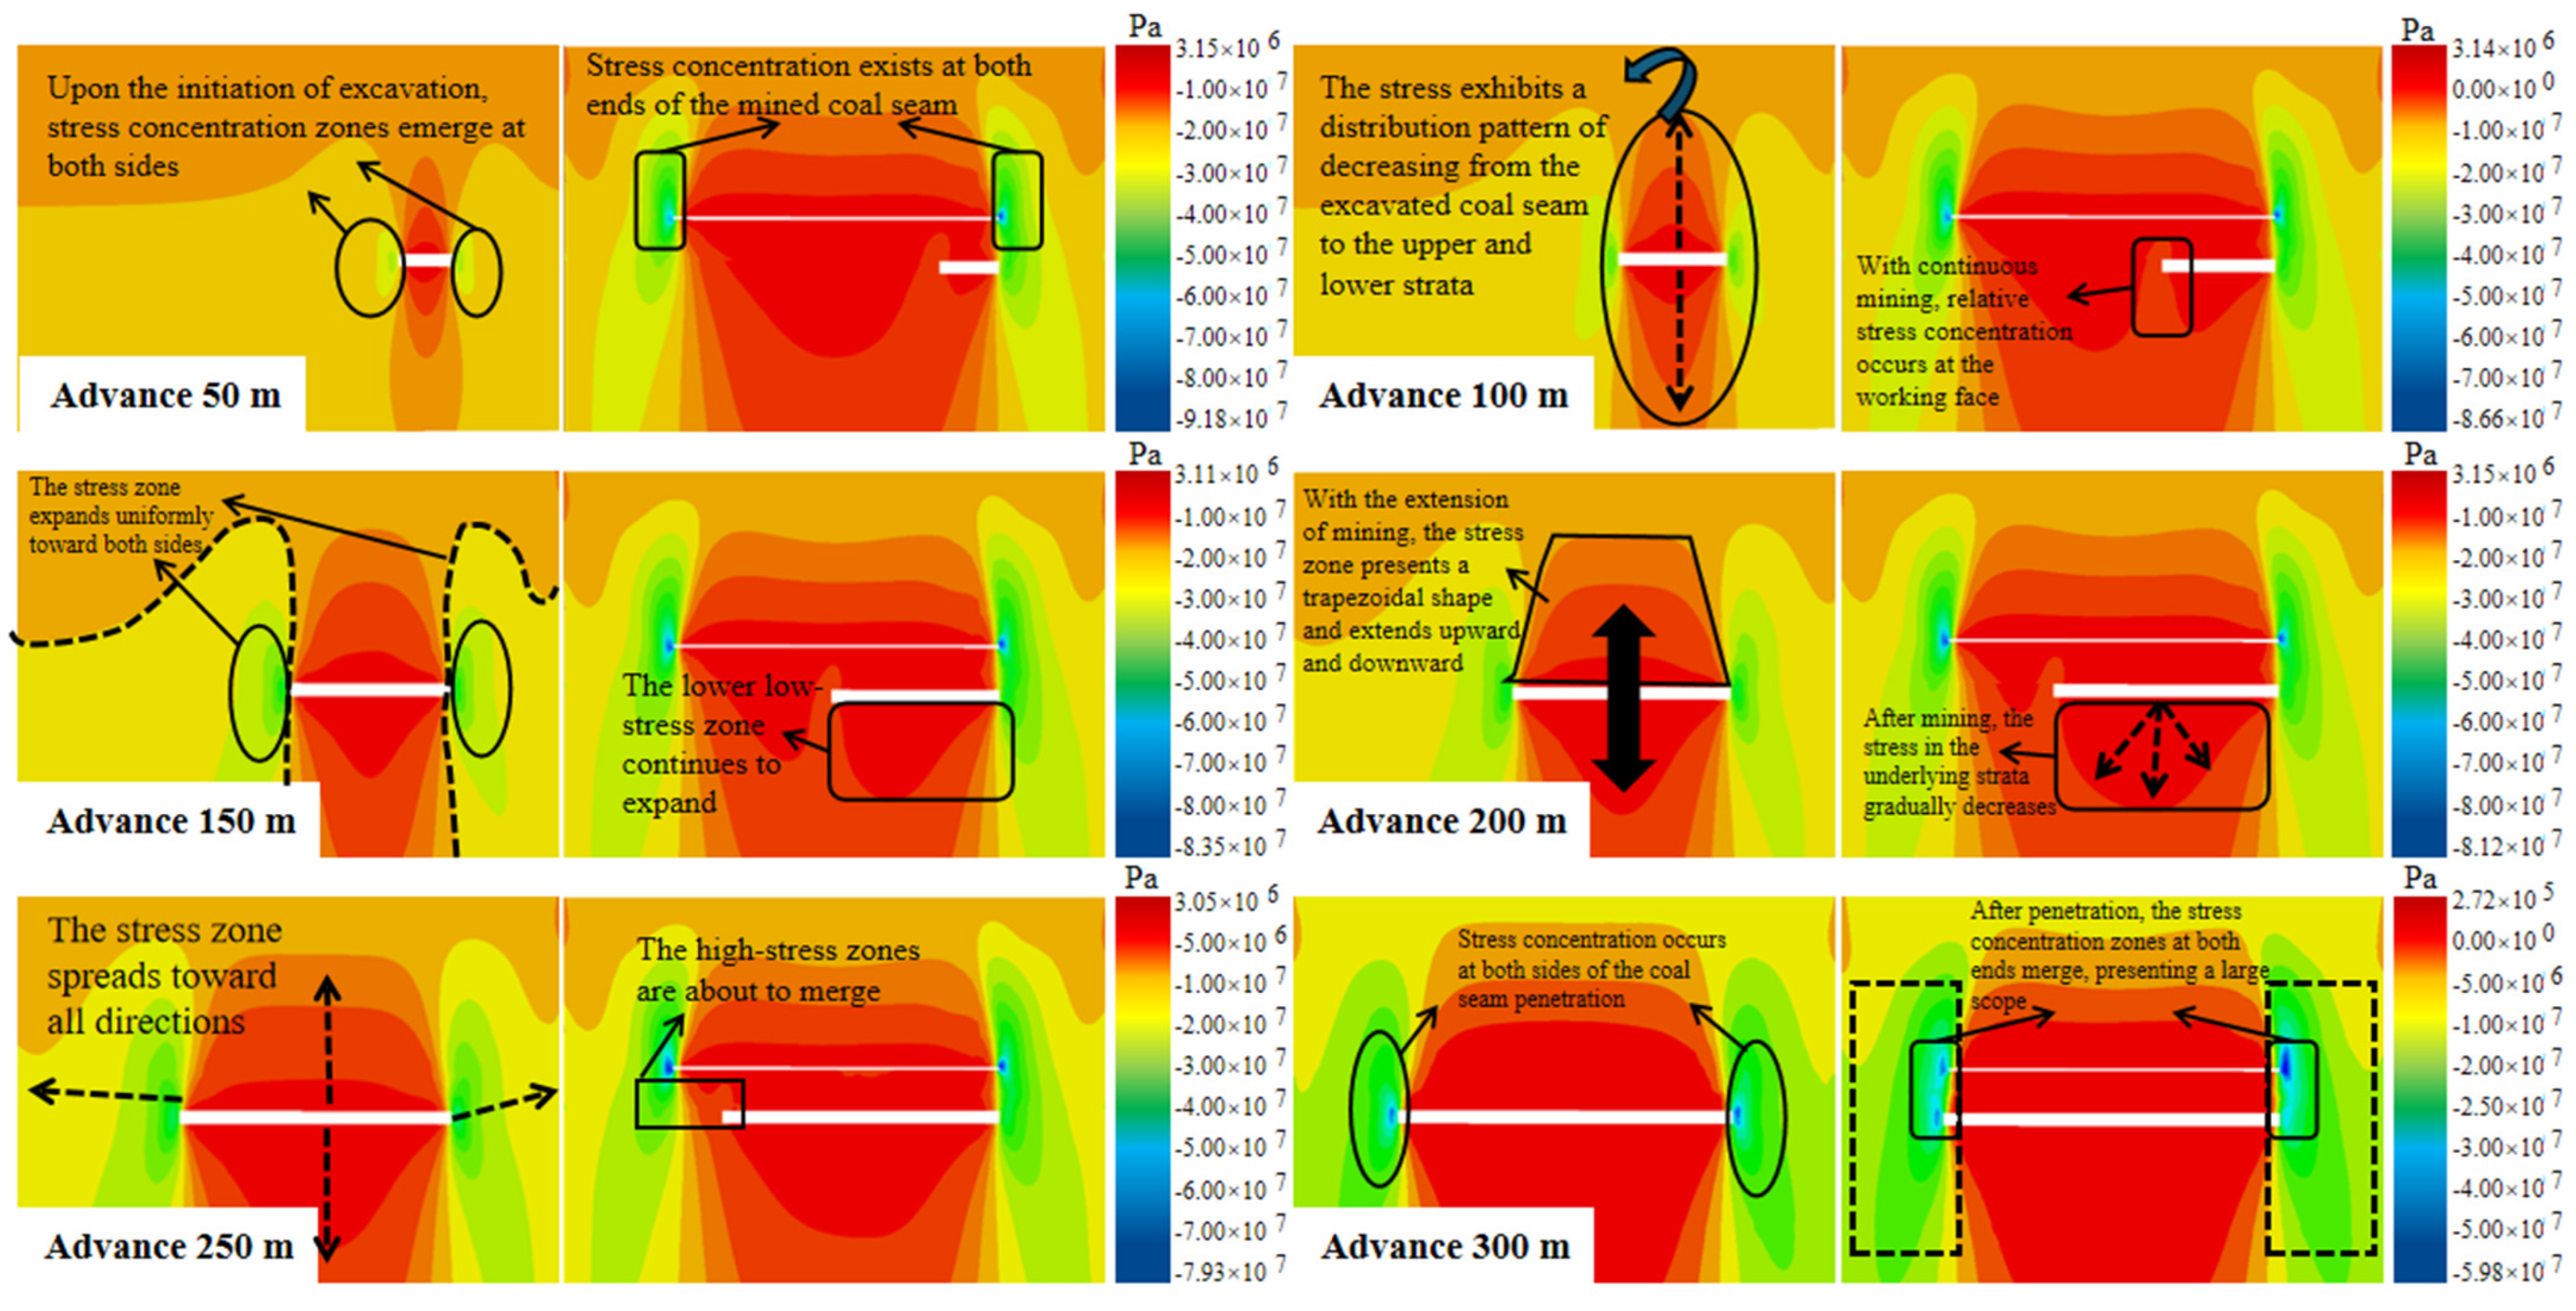
As shown in Figure 11, under close-range coal seam mining conditions, the vertical stress cloud diagrams of Plan A and Plan B at different excavation distances collectively reveal stress manifestation characteristics of “staged evolution with excavation distance and differential modulation with mining schemes”: When excavation reaches approximately 50 m, the roof stress in both schemes remains predominantly composed of original rock stress, with only slightly higher local concentration zones appearing near the working face front and adjacent coal pillars. The decompression range above the goaf remains narrow, and stress zoning features are not yet significant. When excavation extends to 100–150 m, the goaf gradually expands, causing significant curvature in the overlying key strata. In Plan A, low-value depressions form above the goaf in roof vertical stress, while high-gradient concentration zones develop in the working face front and upper coal pillar control areas. Stress peaks rapidly increase with excavation distance, with high-stress zones contracting along the strike toward mining mid-sections and dip sections, gradually forming strip-like patterns. Plan B also exhibits a multi-peak phenomenon of “goaf decompression → front concentration → coal pillar high stress” at the same excavation distance, but with wider concentration zones, slightly lower peaks, and relatively smoother gradients. When excavation reaches 200 m, key strata in Plan A undergo segmented fracture and reconfiguration of the load-bearing system. Roof high-stress zones migrate significantly from near the working face to the upper/lower coal pillars and residual rigid rock beams, while low-stress zones above the goaf expand markedly. The underlying coal seam roof stress begins showing signs of “secondary concentration,” whereas Plan B’s roof high-stress zones demonstrate poorer continuity with relatively limited peak elevation. The excavation continues to approximately 250–300 m, where the superimposed effect of the double-layer goaf intensifies. Under Plan A, the goaf area above the working face experiences significant pressure relief across a large zone. A high-stress bearing structure with high amplitude, narrow coverage, and a steep gradient forms along the working face’s leading edge and the coal pillar control zones, showing the highest concentration in the central section, followed by the upper section, with the lower section exhibiting relatively weaker stress. In contrast, Plan B develops concentrated stress ahead and high-pressure coal pillar zones, but both peak stress values and gradient are lower than those in Plan A, with smoother stress zoning boundaries.
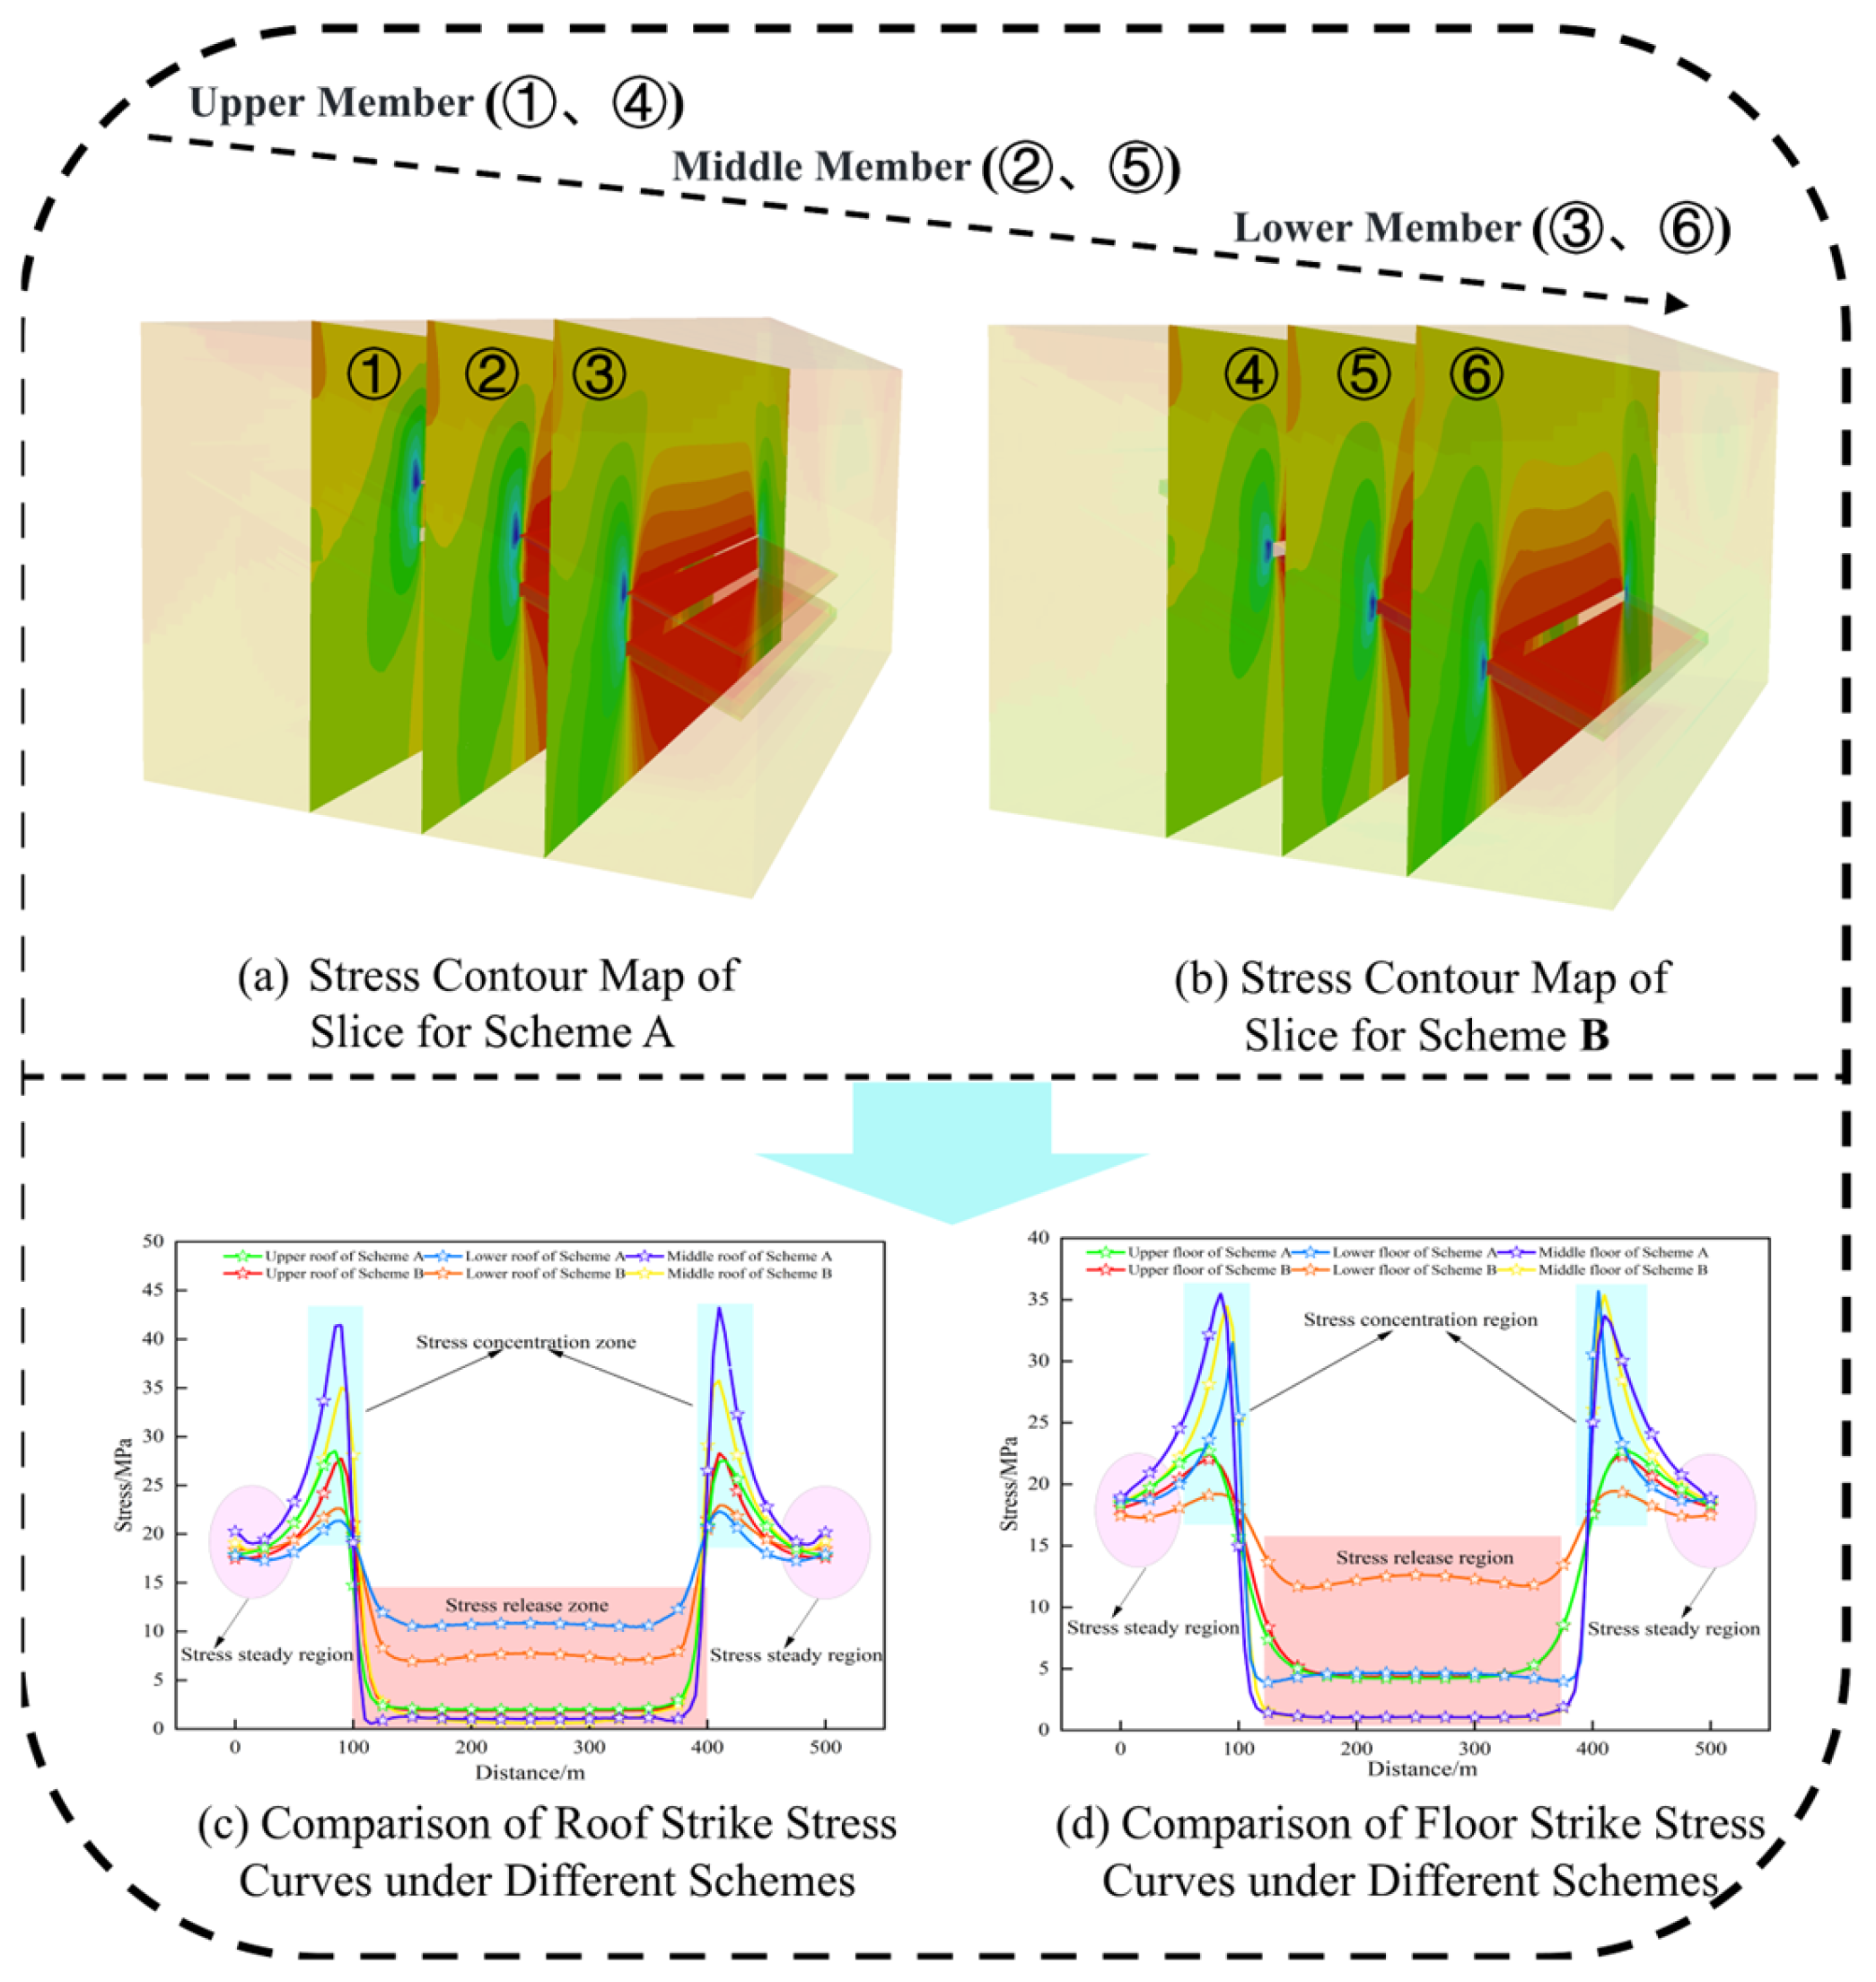
As shown in Figure 12, comparative analysis of stress cloud slices reveals significant differences in spatial distribution patterns, stress concentration levels, and pressure relief ranges between different mining schemes. Figure 12c demonstrates a comparison of roof stress curves, revealing distinct variations in peak magnitude, concentration locations, curve morphology, and stress gradients between the two methods. These differences directly reflect variations in fracture characteristics, structural stability, and load transfer paths of key strata under different mining conditions. Figure 12d further illustrates that at the stress transfer layer, the floor exhibits weaker stress response intensity and fluctuation amplitude compared to the roof, primarily modulated by overlying structural activity and pressure relief in the goaf. Comparative analysis of stress cloud patterns and curves for both roof and floor under different mining schemes reveals a spatial stress redistribution pattern characterized by “strong roof response with weak floor follow-up” induced by mining sequence. Although the floor stress curve shows synchronous stress uplift and peak response at the same strike position, its overall peak amplitude is lower than that of the roof, with more gradual stress fluctuations. This indicates that the floor is predominantly subjected to compressive–shear combined effects, with its load-bearing and deformation being more significantly modulated by the “pressure transmission-diffusion” effect of overlying strata. Within the goaf, both roof and floor stress levels are significantly lower than the original rock, forming continuous pressure relief valleys. Notably, the roof exhibits greater relief amplitude and range compared to the floor, demonstrating a “strong upper, weak lower” load reduction pattern. Further analysis of the curve morphology reveals that the roof stress exhibits more pronounced “segmentation” and “multi-peak” characteristics along the strike direction, with some local sections even displaying secondary small peaks. This indicates that the key layer fractures into segments and that residual local rigid structures contribute to secondary stress concentration. In contrast, the floor stress predominantly shows single-peak or gradual-change curves. Although the high-stress zones generally align with the roof stress concentration areas in strike direction, the peaks are rounded and the slopes are gentler. This suggests that the floor primarily responds to the downward transmission of concentrated roof loads and stress rebound caused by pressure relief in the goaf, with its failure mode being characterized by deep, slow shear deformation.

3.1.3. Evolution of Close-Range Coal Seam Displacement Characteristics

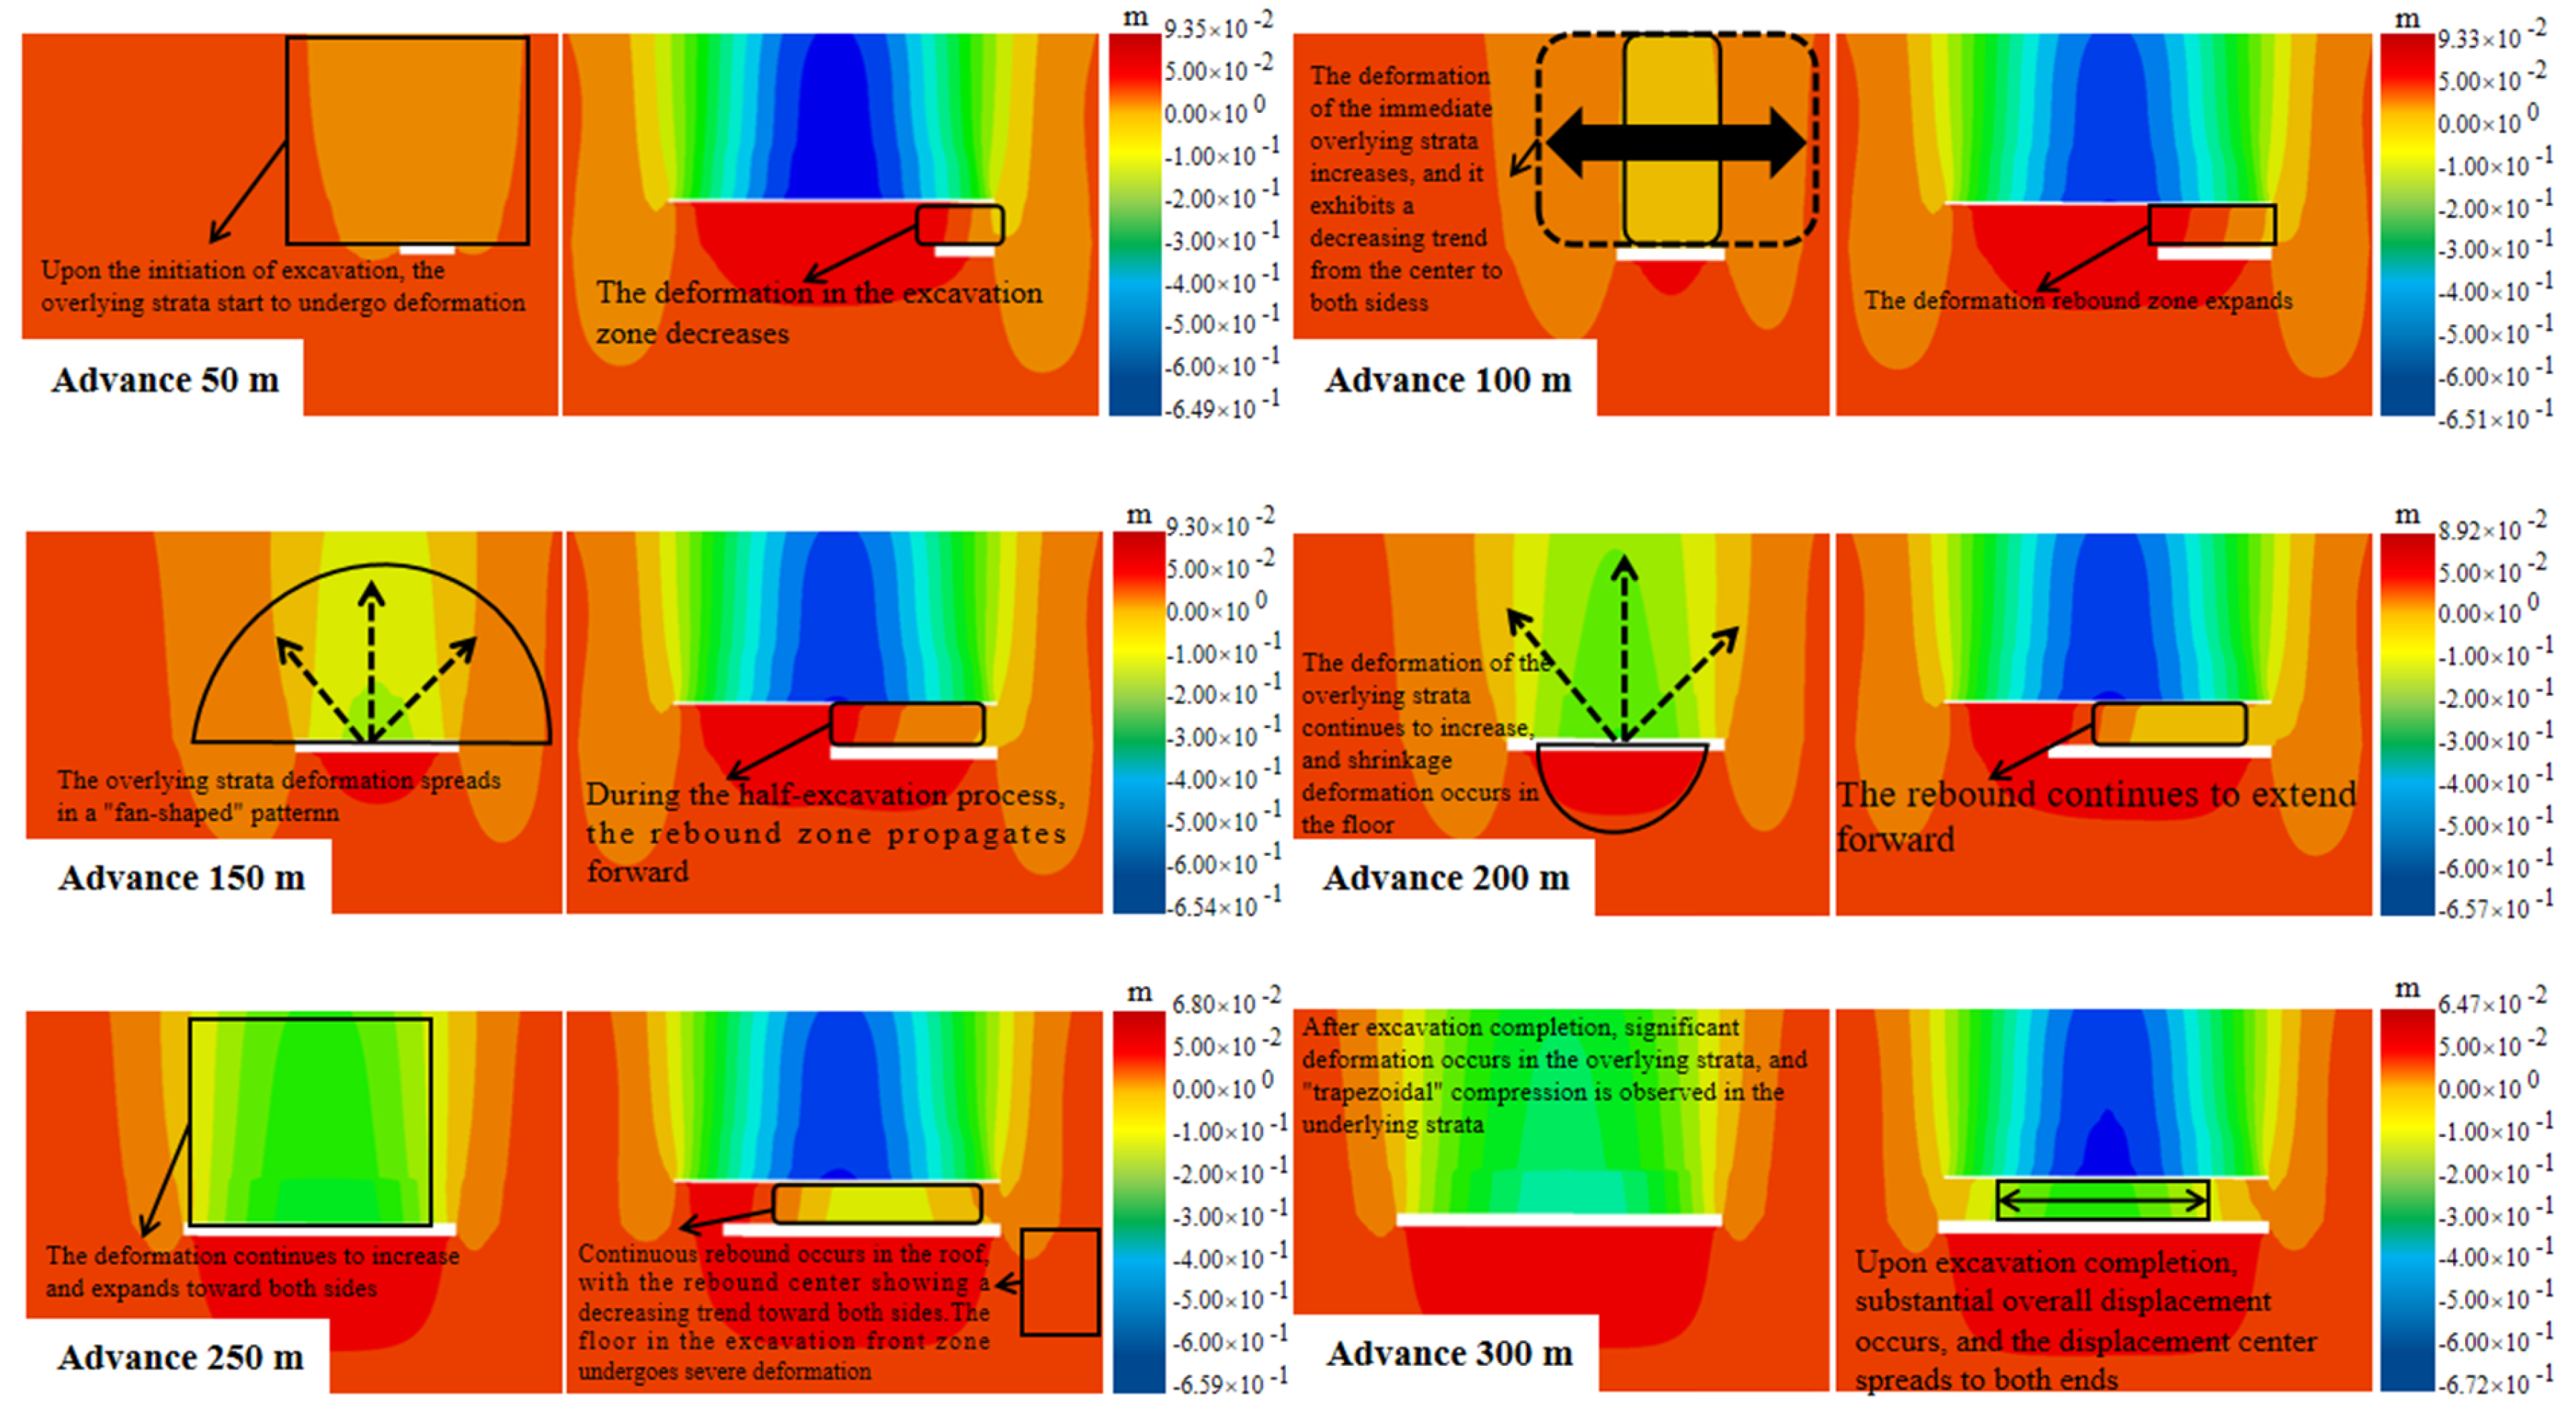
As shown in Figure 13, the displacement cloud diagrams of Scheme A and Scheme B with excavation distances progressively increasing from 50 m to 300 m reveal the coupled characteristics of “staged evolution-modulated by mining sequence” in the close-range coal seam displacement field. When excavation reaches approximately 50 m, both schemes exhibit relatively small goaf areas. The roof shows limited bending subsidence near the working face and coal wall, while the floor experiences slight bulging, with overall displacement remaining in the local elastic deformation stage under original rock stress disturbance. The differences between Scheme A and B are not yet significant. When excavation extends to 100–150 m, the goaf rapidly expands. Under combined gravitational and mining pressure relief effects, the overburden forms a “sinking top, bulging bottom” curved deformation zone. The roof develops asymmetric basin-shaped subsidence above the goaf, with the subsidence center located at the middle rear edge and significantly increased boundary gradient. The floor bulging amplitude increases synchronously but remains smaller than the roof subsidence. Scheme A shows more pronounced segmental bending due to pre-mined 8# coal in the upper section, resulting in reduced key layer stiffness and greater roof subsidence rates compared to Scheme B. At approximately 200 m excavation depth, Scheme A’s key layer accumulates cumulative deformation to its limit, leading to segmental fracture. The roof subsidence rate accelerates markedly, and the “basin-shaped subsidence trough” above the goaf deepens and widens laterally. Differential displacement concentration zones form near coal pillars and residual rock beams, with local arch-foot slippage and shear steps appearing. Floor bulging extends deeper, demonstrating the distinct “strong central, weak end” non-uniform displacement pattern. Under identical excavation parameters, while both Scheme B and Scheme A exhibit synchronized increases in roof and floor displacements, Scheme B demonstrates a more gradual settlement curve with lower maximum subsidence and heaving values compared to Scheme A. The smaller horizontal displacement gradient further indicates that the overburden maintains high structural integrity. When excavation progresses to approximately 250–300 m, the double-layer goaf overlap effect becomes pronounced in Scheme A. The roof formed under joint control of coal seam No. 8 and No. 9 develops a “deep basin-shaped” joint settlement structure, causing extensive subsidence above the goaf. The combined effects of horizontal convergence in coal pillars and roadway surrounding rock with vertical settlement result in localized shear slip zones and step-type displacement discontinuities. Although Scheme B also exhibits basin-shaped settlement and upward subsidence with downward bulging under the same excavation length, its joint settlement depth and shear displacement magnitude are significantly weaker.

3.1.4. Comparative Validation of Simulation Results and Field-Measured Data

To verify the reliability of the numerical model and eliminate the theoretical speculation of the simulation results, a systematic comparative analysis was conducted between the numerical simulation results and the in situ measured data of the 119 working face, with the core mine pressure characteristic indicators as the validation objects. The comparative results are shown in Table 4.
The comparative results show that the relative error between the numerical simulation results and the field-measured data of all core mine pressure indicators is controlled within 8%, which is within the acceptable error range of engineering numerical simulation. This fully proves that the numerical model established in this study can accurately reflect the actual ground behavior and mine pressure manifestation characteristics of the 119 working face under close-range coal seam mining conditions.
In terms of dynamic disturbance response, the micro-seismic monitoring results of the 119 working face show that the frequency and energy of micro-seismic events are significantly higher during the mining of the lower 9# coal seam after the upper 8# coal seam is mined, which is consistent with the simulation result that Scheme A has a higher risk of surrounding rock instability and dynamic disaster. The field-measured peak vibration velocity of the roadway surrounding rock under mining-induced micro-seismic disturbance is 8.92 m/s, which is highly consistent with the 9.57 m/s peak vibration velocity set in the impact load simulation, further verifying the rationality of the dynamic load parameter setting and the reliability of the dynamic response simulation results.
The above validation results fully demonstrate that the numerical simulation results of this study are not purely theoretical and speculative, but have sufficient field-measured data support, and the research conclusions have clear engineering practicability and guiding value for the actual mining of the 119 working face and similar close-range coal seam mining projects.
The relative error between the simulation results and field-measured data is controlled within 8%, which is within the acceptable range for mining engineering numerical simulation. The error mainly comes from the simplification of rock mass homogeneity, the dispersion of mechanical parameters, and field monitoring system error. The error level will not change the core conclusions of this study, and the research results have reliable guiding value for actual mining engineering. For complex geological conditions with well-developed faults and fractures, the results need to be revised combined with field monitoring data before application.
The above validation results fully demonstrate that the numerical simulation results of this study are not purely theoretical and speculative but have sufficient field-measured data support. Meanwhile, all the mechanical parameters, model establishment methods, boundary condition settings, and simulation schemes used in this study are clearly defined in Section 2, which ensures that the research process and core conclusions are completely verifiable and repeatable. Other researchers can reproduce the simulation results and verify the conclusions of this paper by using the same parameters and methods in FLAC3D software for similar close-range coal seam mining conditions, which meets the verifiability requirements of scientific research.

3.2. Dynamic Response of Roadway Surrounding Rock and Support System Under Impact Loading

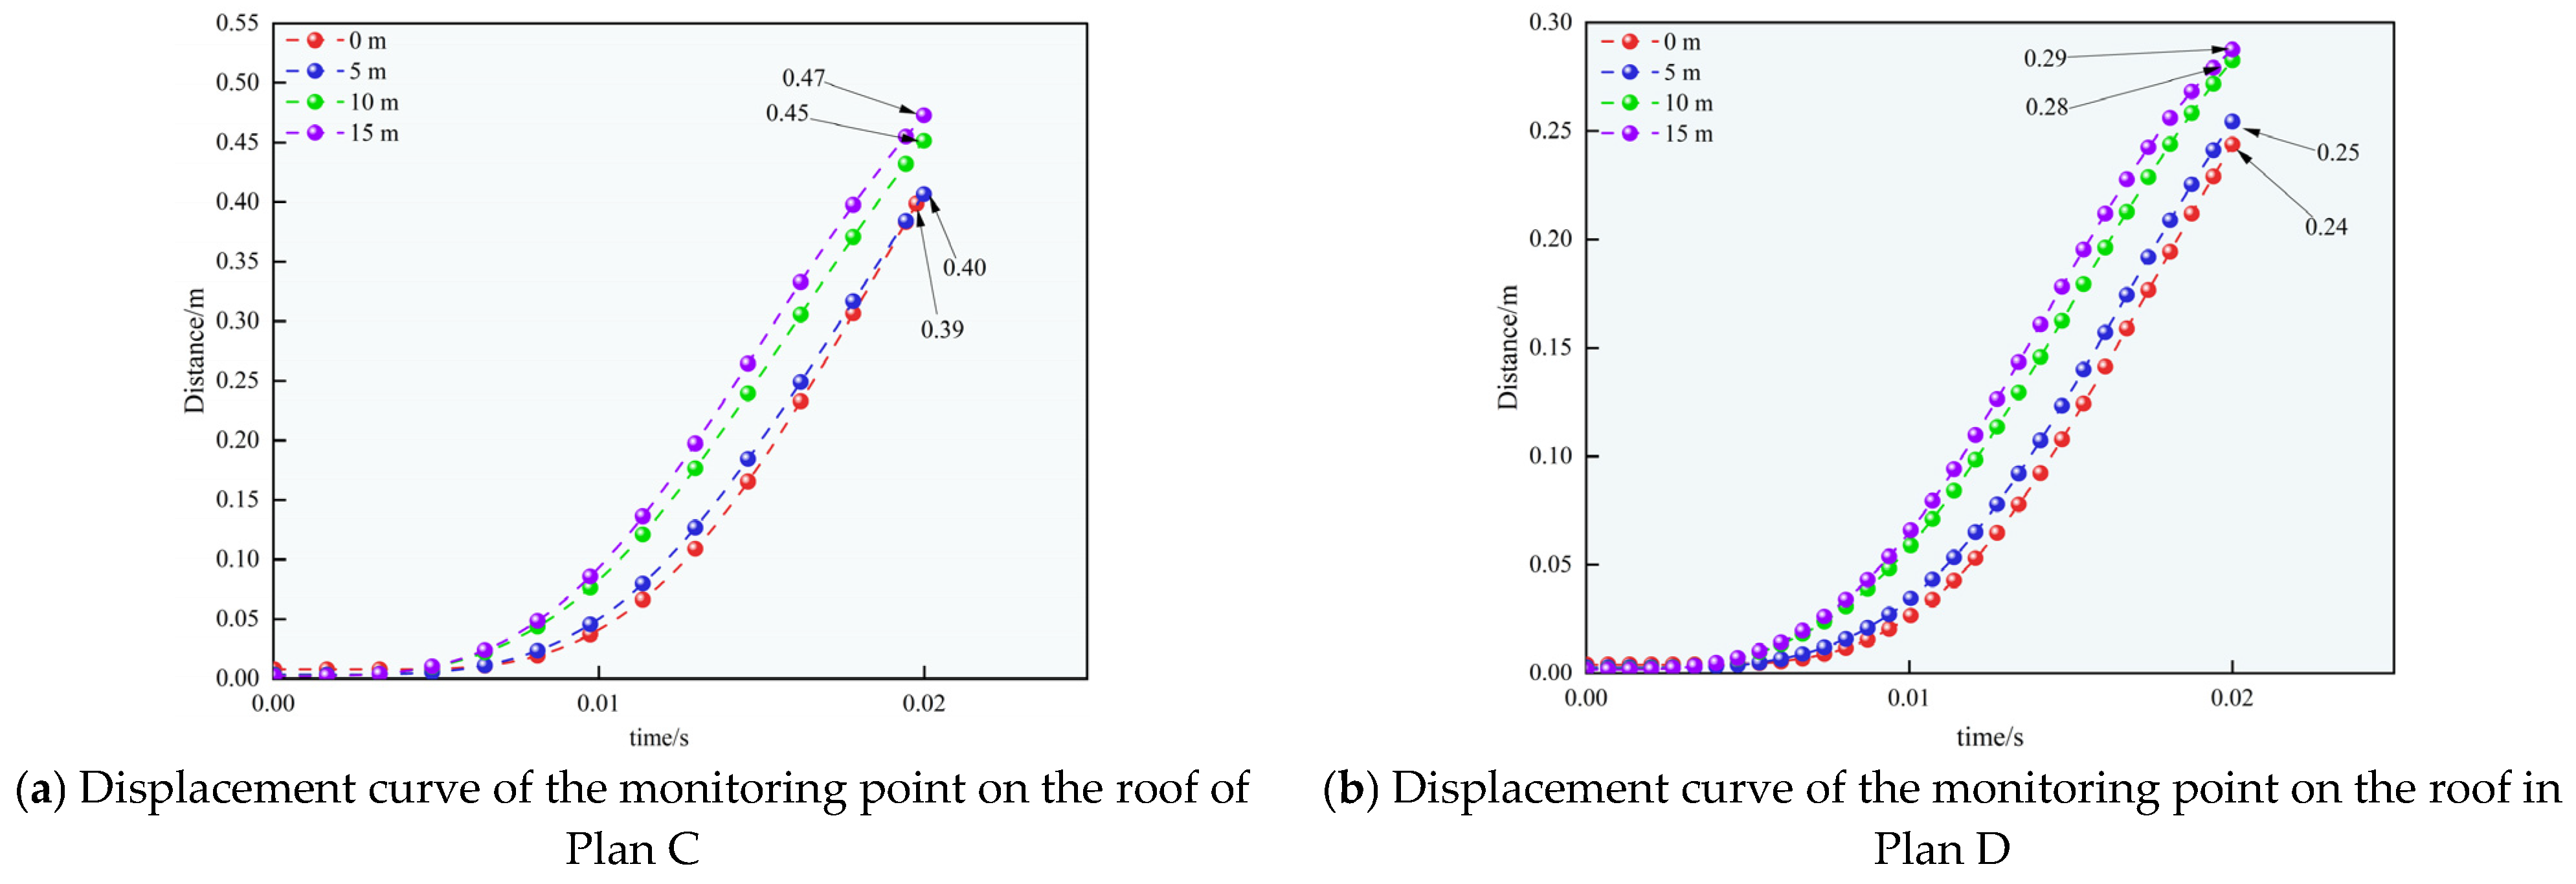
As shown in Figure 14, the displacement changes of monitoring points at 0 m, 5 m, 10 m, and 15 m above the roof in an unsupported roadway (Plan C) and supported roadway (Plan D) under impact loading are illustrated. In Plan C, displacement increases rapidly over time, with peak values significantly higher at greater distances from the roof, demonstrating a pronounced upward cumulative amplification effect. Notably, displacement peaks at 10 m and 15 m reach approximately 0.45 m and 0.47 m, markedly exceeding the 0.39 m and 0.40 m at 0 m and 5 m respectively, indicating intense overall loosening and deformation of the upper surrounding rock under impact disturbance. In contrast, Plan D shows significantly reduced displacement levels under identical impact loading. Constrained by the support structure, all monitoring points exhibit substantially lower peak displacements compared to Plan C, with maximum displacements at 10 m and 15 m dropping to approximately 0.28 m and 0.29 m, representing an over 35% reduction. Simultaneously, the inter-point displacement differences decrease, demonstrating that the support system effectively limits deformation gradients in the upper surrounding rock, preventing further upward amplification and propagation of impact energy. Comparative analysis reveals that unsupported roadways are prone to extensive loosening and concentrated displacement in the upper surrounding rock under impact disturbance, whereas proper support structures can significantly suppress displacement peaks, reduce overall rock deformation, and markedly enhance the roadway’s impact resistance stability and energy absorption capacity.
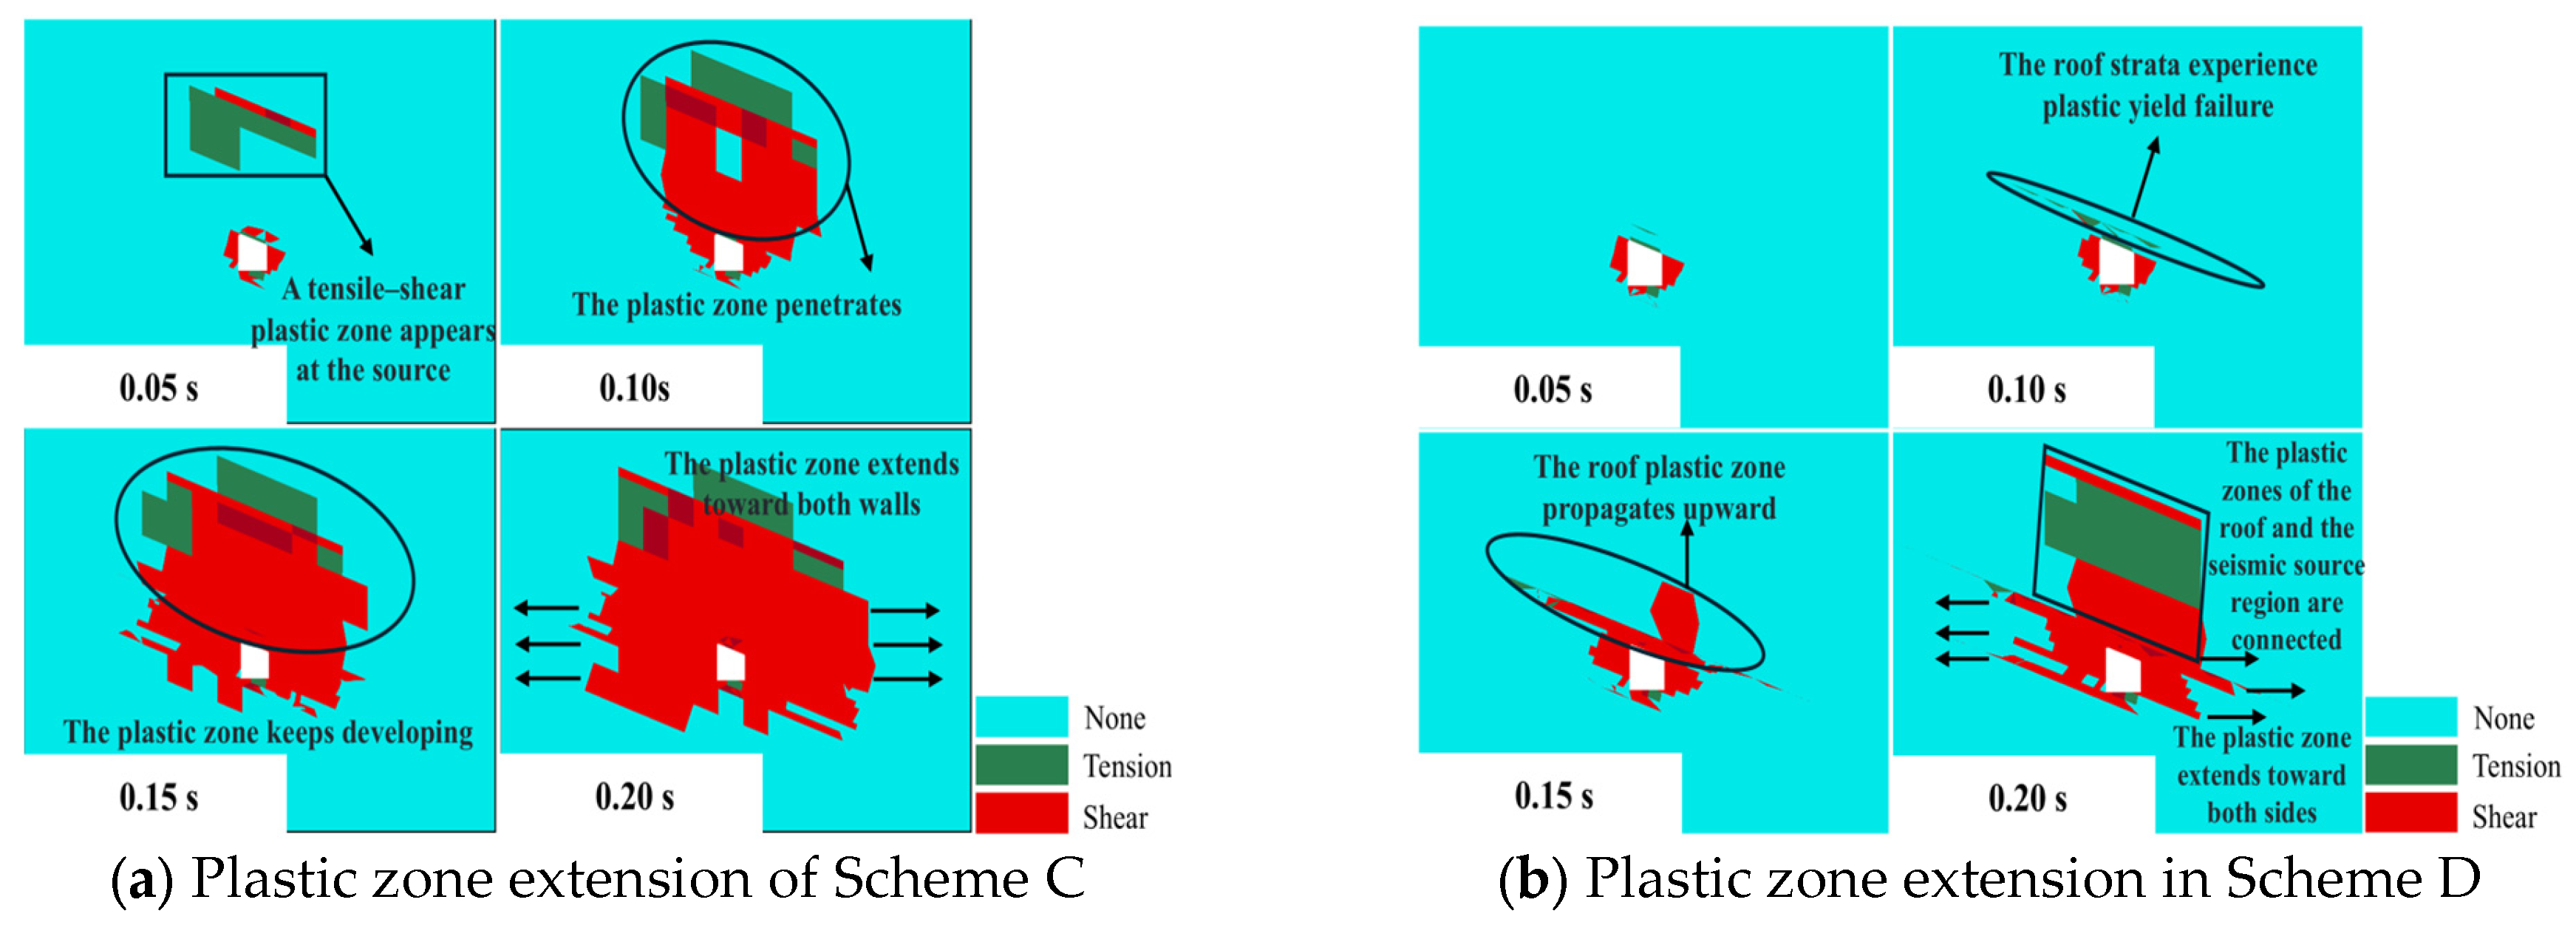
Figure 15 illustrates the expansion and development of plastic zones in roadways under impact loads under different support schemes. In the unsupported condition (Scheme C), plastic zones first appear near the shock source at 0.05 s, primarily exhibiting tensile–shear composite failure. By 0.10 s, these zones rapidly penetrate the roof and extend deeper. During the subsequent 0.15–0.20 s, plastic zones continuously expand toward both sides with extensive development, forming a continuous shear failure zone in the surrounding rock. This indicates that unsupported roadways exhibit highly concentrated plastic failure under impact disturbances, which is difficult to contain. In contrast, the supported condition (Scheme D) significantly inhibits plastic zone expansion. At 0.05 s, only localized yielding occurs in the roof. By 0.10 s, limited plastic failure develops in the roof without rapid penetration. At 0.15 s, plastic zones mainly expand slowly upward along the roof with limited damage range. By 0.20 s, although the plastic zones of the shock source and roof begin to connect, their lateral expansion is markedly restricted, forming a discrete distribution pattern without the continuous fracture zone observed in Scheme C. Comprehensive analysis reveals that unsupported roadways are more prone to forming large-scale connected plastic zones under impact disturbances, leading to extensive rock yielding. In contrast, support structures effectively suppress plastic zone penetration and expansion, reduce stress concentration effects in the roof and sides, and enhance overall roadway stability under impact loads.
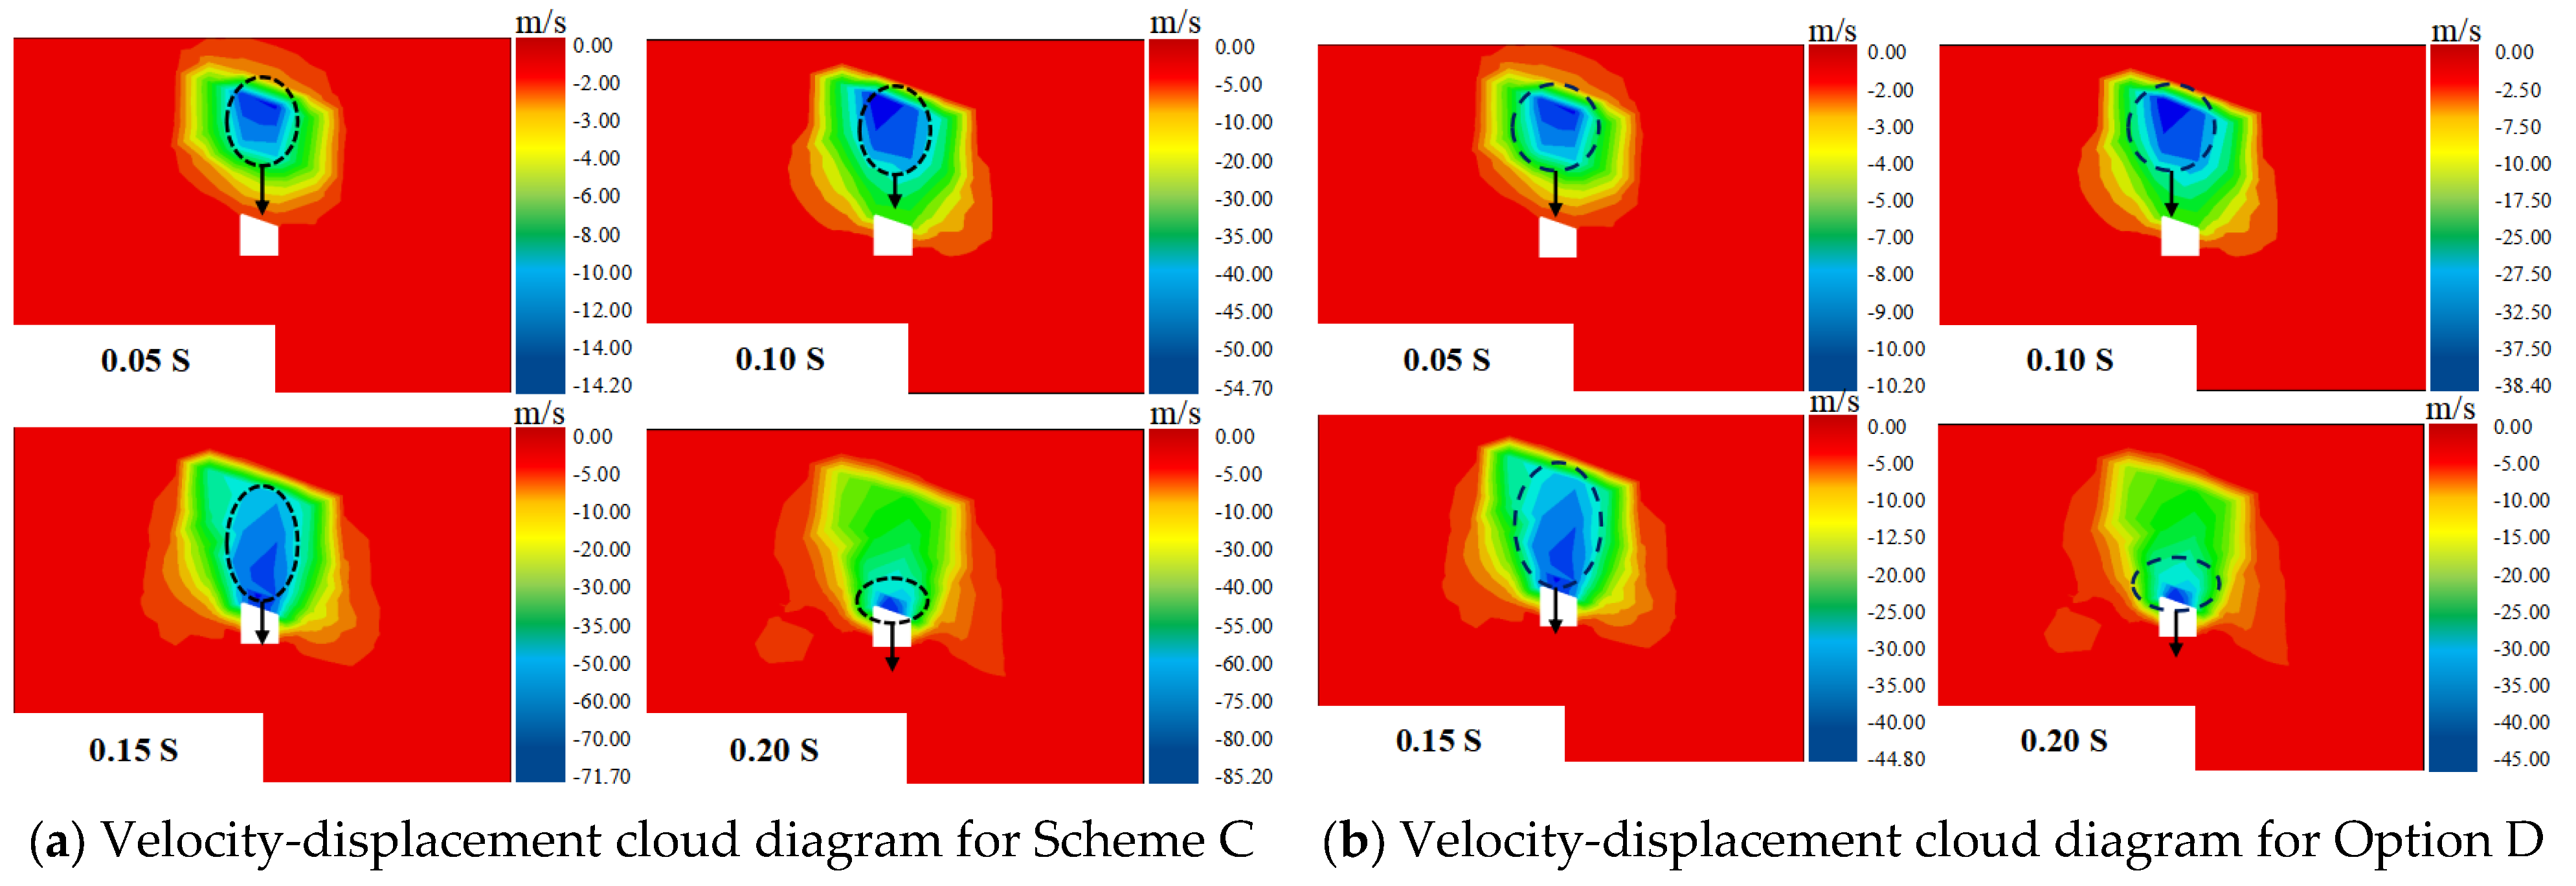
As shown in Figure 16, the velocity cloud diagrams demonstrate the tunnel’s response under impact loads under different conditions. In the unsupported condition (Scheme C), the surrounding rock exhibits a distinct high-speed zone at 0.05 s, with velocity peaks concentrated between the shock source and the roof. By 0.10 s, this high-speed zone extends downward and expands, accompanied by a sharp increase in velocity gradient, indicating rapid energy transfer through the surrounding rock and its accumulation near the tunnel surface. At 0.15 and 0.20 s, the velocity field shows extensive diffusion, with the high-speed zone gradually penetrating the roof and both sides, increasing the risk of rapid dynamic instability in the surrounding rock. In contrast, the supported condition (Scheme D) demonstrates significantly reduced velocity response. During the 0.05–0.10 s interval, the high-speed zone remains limited in scope, with velocity peaks markedly lower than in Scheme C, as the impact energy is partially absorbed and dispersed by the support structure. By 0.15 s, although some velocity concentration persists above the shock source, its expansion is controlled without rapid outward spread. At 0.20 s, compared to the large-scale high-speed penetration zone in Scheme C, Scheme D’s velocity cloud maintains localized concentration with rapid peripheral attenuation.
The comprehensive comparison shows that the velocity response of the unsupported roadway is strong under the impact load, and the high-speed zone is obviously through, which makes it easy to trigger a large-scale dynamic failure of the surrounding rock. However, the support system effectively weakens the transmission speed of the impact energy and limits the diffusion range of the high-speed zone, thus significantly improving the impact resistance and dynamic stability of the roadway.
To clarify the working state and anti-impact mechanism of the support system, the stress evolution characteristics of the anchor bolt and anchor cable under impact load were quantitatively analyzed. The monitoring results show that the axial force of the support structure rises rapidly within 0.05 s after the 8 MPa impact load is applied, which is synchronized with the peak period of surrounding rock displacement. The peak axial force of the anchor bolt reaches 186 kN, accounting for 74.4% of its ultimate tensile bearing capacity; the peak axial force of the anchor cable reaches 362 kN, accounting for 60.3% of its ultimate tensile bearing capacity. Both support components maintain an elastic working state throughout the impact process, with no tensile failure occurring, which ensures the structural integrity of the support system under dynamic disturbance.
In terms of shear stress, the peak shear stress of the anchor bolt is concentrated at the interface between the shallow fractured surrounding rock and the deep stable rock mass of the roof, with a peak value of 28.7 MPa, which is lower than the shear strength of the bolt material. The shear stress distribution of the anchor cable is more uniform, with a peak value of 19.2 MPa, which fully exerts its suspension and stabilization effect on the shallow surrounding rock. The stress evolution law of the support structure quantitatively verifies the integrity of its collaborative impact resistance mechanism: under impact load, the anchor bolt first controls the deformation and crack propagation of the shallow surrounding rock, limits the expansion of the plastic zone, and absorbs part of the impact energy through elastic deformation; the anchor cable anchors the shallow surrounding rock to the deep stable rock stratum, suppresses the upward cumulative amplification of surrounding rock displacement and the downward propagation of shock waves, and forms a collaborative bearing system with the anchor bolt. The stress monitoring data fully prove that the support system can maintain structural integrity and stable bearing capacity under the set impact load, which provides a quantitative basis for the anti-impact effect of the support scheme.

4. Discussion

This paper systematically reveals the overburden structure evolution law, mining-induced mine pressure manifestation characteristics, and roadway surrounding rock dynamic response mechanism under the coupled disturbance of mining movement and impact in close-range coal seams through theoretical analysis and FLAC3D numerical simulation. The comparative validation between the simulation results and the field measured data of the 119 working face fully proves the accuracy and reliability of the numerical model, with the relative error of all core mine pressure indicators controlled within 8%, which eliminates the theoretical speculation of the simulation results. The research results clarify the stress transfer mechanism of the complete bearing overburden structure, quantify the anti-impact effect of the bolt–cable collaborative support system, and provide a systematic theoretical basis and field-verified technical guidance for mine pressure control and rock burst prevention in close-range coal seam mining.
It should be clearly stated that this study has corresponding limitations in the consideration scope of dynamic disturbance sources. This paper mainly focuses on the dynamic disturbances induced by mining-induced stress superposition in close-range coal seam mining and external set impact loading, and does not consider the transient dynamic disturbances caused by geological faults, which are widely recognized as an important dynamic disturbance source in underground coal mining. In fault-affected mining areas, the dynamic instability or sudden slip of faults will generate additional high-energy transient dynamic loads, which will interact with the stress-concentrated zones around the roadway under the influence of close-range coal seam mining, and may further change the impact response and damage characteristics of the roadway surrounding rock.
Based on the above limitations, the conclusions of this paper are primarily applicable to close-range coal seam mining environments without significant fault-controlled dynamic effects. For mining areas with developed faults and high risk of fault-induced rock burst, the coupling effect of fault slip dynamic disturbance and mining-induced stress needs to be further considered in subsequent research. In the future, targeted research on the dynamic response law of roadway surrounding rock under the dual influence of close-distance coal seam mining disturbance and fault slip dynamic load should be carried out, to further improve the applicability of the research results in complex geological mining environments.

5. Conclusions

This paper focuses on the general mechanical behavior of close-distance coal seams under the coupled disturbance of mining-induced strata movement and impact loading, and systematically investigates the overburden structure evolution, mining disturbance response law and roadway anti-impact support mechanism by using rock and soil mechanics theory, numerical simulation and field case verification.
(1) Based on critical block theory and elastic mechanics theory, this study elucidates the stress transfer mechanism of intact load-bearing strata in close-range coal mining. It derives the depth formula for the floor’s plastic zone and establishes a computational model for additional stresses induced by critical block rotation. The research clarifies how interlayer strata’s load-bearing state affects the stability of mining tunnels in lower coal seams, providing a theoretical foundation for evaluating interlayer disturbances in close-range coal mining operations.
(2) Through FLAC3D numerical simulation, comparative analysis of different mining schemes was conducted to reveal their similarities and differences. Both schemes induced stress field reconstruction in overburden, forming a load-bearing pattern of “goaf pressure relief-workface-coal pillar”. The plastic zone exhibited a central tendency distribution, with displacement fields showing basin-like subsidence characterized by “top sinking and bottom bulging”. Scheme A experienced stress superposition effects due to repeated mining operations, resulting in significantly elevated stress peaks and steep gradients during lower coal seam mining, with plastic zones displaying a cross-layer development pattern of “top-down activation-bottom-up penetration”. Scheme B demonstrated relatively gentle mine pressure responses and lower stress concentration, with plastic zones primarily exhibiting independent expansion. Scheme A simultaneously induced significant surrounding rock deformation and secondary stress concentration phenomena, indicating that while mining the upper coal seam first facilitates continuous mining, it substantially increases the risks of mine pressure manifestation and surrounding rock instability.
(3) Through FLAC3D numerical simulation, the dynamic response characteristics of unsupported and bolt-anchored collaborative support tunnels under impact loading were comparatively studied. In unsupported tunnels, the surrounding rock displacement exhibited an upward cumulative amplification effect, with peak displacements reaching 0.45 m at 10 m depth and 0.47 m at 15 m depth. The plastic zone rapidly penetrated within 0.10 s, forming a continuous shear failure zone, where impact energy transfer was concentrated and high-speed penetration was evident. In contrast, the support system significantly suppressed surrounding rock deformation, reducing peak displacement by over 35% and decreasing shock wave propagation velocity by more than 40%, effectively controlling the expansion of the plastic zone.
The above universal conclusions reveal the essential law of mine pressure manifestation and surrounding rock dynamic response in close-range coal seam mining under coupled disturbance, which are not limited to the specific engineering case in this study. The research results can provide universal theoretical guidance and technical reference for mine pressure control, rock burst prevention and roadway support design in similar close-range coal seam mining projects around the world, and can have important academic value and engineering application prospects for the global underground coal mining industry.

Author Contributions

Conceptualization, C.H.; Methodology, C.H.; Validation, G.L.; Resources, Q.R.; Data curation, G.W. and Y.Z.; Writing – original draft, G.W. and Y.Z.; Writing – review & editing, Q.R.; Supervision, G.L.; Funding acquisition, C.H. All authors have read and agreed to the published version of the manuscript.

Funding

This research was funded by [the National Natural Science Foundation of China] grant number [52074110].

Institutional Review Board Statement

Not applicable.

Informed Consent Statement

Not applicable.

Data Availability Statement

The data presented in this study are available on request from the corresponding author (accurately indicate status).

Conflicts of Interest

Author Qiang Ren was employed by the company Ningxia Hongdunzi Coal Industry Co., Ltd. The remaining authors declare that the research was conducted in the absence of any commercial or financial relationships that could be construed as a potential conflict of interest.

References

  1. Pan, Y.; Xiao, Y.; Li, Z.; Wang, K. Study of tunnel support theory of rockburst in coal mine and its application. J. China Coal Soc. 2014, 39, 222–228. [Google Scholar] [CrossRef]
  2. Qi, Q.; Li, Y.; Zhao, S.; Zhang, N.; Zheng, W.; Li, H.; Li, H. Seventy years development of coal mine rockburst in China: Establishment and consideration of theory and technology system. Coal Sci. Technol. 2019, 47, 1–40. [Google Scholar] [CrossRef]
  3. Kang, H.; Wu, Y.; He, J.; Fu, Y. Rock bolting performance and field practice in deep roadway with rock burst. J. China Coal Soc. 2015, 40, 2225–2233. [Google Scholar] [CrossRef]
  4. Jiang, Y.; Zhao, Y. State of the art: Investigation on mechanism, forecast and control of coal bumps in China. Chin. J. Rock Mech. Eng. 2015, 34, 2188–2204. [Google Scholar] [CrossRef]
  5. Yuan, L. Research progress on risk identification, assessment, monitoring and early warning technologies of typical dynamic hazards in coal mines. J. China Coal Soc. 2020, 45, 1557–1566. [Google Scholar] [CrossRef]
  6. Zhang, C.G.; Canbulat, I.; Hebblewhite, B.; Ward, R. Assessing coal burst phenomena in mining and insights into directions for future research. Int. J. Coal Geol. 2017, 179, 28–44. [Google Scholar] [CrossRef] [Scilit]
  7. Wang, G.F.; Gong, S.Y.; Dou, L.M.; Wang, H.; Cai, W. Rockburst characteristics in syncline regions and microseismic precursors based on energy density clouds. Tunn. Undergr. Space Technol. 2018, 81, 83–93. [Google Scholar] [CrossRef] [Scilit]
  8. Cai, W.; Dou, L.M.; Zhang, M.; Cao, W.; Shi, J.; Feng, L. A fuzzy comprehensive evaluation methodology for rock burst forecasting using microseismic monitoring. Tunn. Undergr. Space Technol. 2018, 80, 232–245. [Google Scholar] [CrossRef] [Scilit]
  9. Su, G.; Hu, L.; Feng, X.; Yan, L.; Zhang, G.; Yan, S.; Zhao, B.; Yan, Z. True triaxial experimental study of rockbursts induced by ramp and cyclic dynamic disturbances. Rock Mech. Rock Eng. 2018, 51, 1027–1045. [Google Scholar] [CrossRef] [Scilit]
  10. Hu, L.; Li, Y.; Liang, X.; Tang, C.; Yan, L. Rock Damage and Energy Balance of Strainbursts Induced by Low Frequency Seismic Disturbance at High Static Stress. Rock Mech. Rock Eng. 2020, 53, 4857–4872. [Google Scholar] [CrossRef] [Scilit]
  11. Jiang, Y.; Zhao, Y.; Song, Y.; Liu, W.; Zhu, J. Analysis of blasting tremor impact on roadway stability in coal mining. Chin. J. Rock Mech. Eng. 2005, 24, 3131–3136. [Google Scholar]
  12. Dou, L.; He, J.; Cao, A.; Gong, S.; Cai, W. Rock burst prevention methods based on theory of dynamic and static combined load induced in coal mine. J. China Coal Soc. 2015, 40, 1469–1476. [Google Scholar] [CrossRef]
  13. Liu, D.; Wang, Y.; Hu, X.; Ren, F. Calculation and test analysis on stress of surrounding rock in mine roadway with mine pressure bump occurred by dynamic load. Coal Sci. Technol. 2015, 43, 42–46+116. [Google Scholar] [CrossRef]
  14. Chen, G.; Dou, L.; Gao, M.; Mu, Z. Numerical Simulation of Dynamic Vibration Affecting Rock Burst in Mining Gateway Caused by Tremor. J. Min. Saf. Eng. 2009, 26, 153–157. [Google Scholar]
  15. Liu, X.; Fang, J.; Li, Q.; Yang, Y.; Zhao, Y.; Liu, G.; Li, X. Development and application of large-scale three-dimensional high-precision physical simulation platform. J. China Coal Soc. 2025, 50, 1007–1018. [Google Scholar] [CrossRef]
  16. Tan, Y.; Guo, W.; Zhao, T.; Zhang, D.; Gu, X.; Tan, Y. Development and application of a novel deep roadway test systemwith dynamic-static loading. Chin. J. Rock Mech. Eng. 2022, 41, 1513–1524. [Google Scholar] [CrossRef]
  17. Jiang, F.; Wei, Q.; Wang, C.; Yao, S.; Zhang, Y.; Han, R.; Wei, Z.; Li, Z. Analysis of rock burst mechanism in extra-thick coal seam controlled by huge thick conglomerate and thrust fault. J. China Coal Soc. 2014, 39, 1191–1196. [Google Scholar] [CrossRef]
  18. Zhang, X.; Zhu, S.; Jiang, F.; Liu, J.; Chen, Y.; Wang, X.; Yang, T.; Zhu, C.; Li, J. Research on the mechanism of overall instability type rock burst of fault coal pillars in deep topsoil fully mechanized top coal caving mining area. J. Min. Saf. Eng. 2019, 36, 968–976. [Google Scholar] [CrossRef]
  19. He, Y. Research on Overburden Structure Evolution and Rockburst Mechanism of Fully Mechanized Caving Face in Shanzhai Coal Mine. Master’s Thesis, Xi’an University of Science and Technology, Xi’an, China, 2020. [Google Scholar] [CrossRef]
  20. Hou, Z.; Xiao, F.; Liu, G.; Viktorovich, B.; Lan, L. Mechanical Properties and Acoustic Emission Characteristics of Unloading Instability of Sandstone under High Stress. Minerals 2022, 12, 722. [Google Scholar] [CrossRef] [Scilit]
  21. Li, D.; Shi, X.; Zhao, C.; Ge, D.; Chen, Y.; Dong, C.; Jiang, F.; Wen, Z. Mechanism of rock burst during stope mining with interval coal pillar in one-sided mining space. J. Min. Saf. Eng. 2020, 37, 1212–1221. [Google Scholar] [CrossRef]
  22. Wang, B.; Zhu, S.; Wei, Q.; Gu, Y.; Li, Z.; Zhang, B. Research on mechanism and prevention measures of rock burst in rapidly mined working face with roof water drainage. Saf. Coal Mines 2022, 51, 205–209. [Google Scholar] [CrossRef]
  23. He, S. Study on Mechanism of Rockburst and Early Warning Technology in Steeply Inclined Coal Seams under Fully Mechanized Top-Coal Caving Mining. Ph.D. Thesis, University of Science and Technology Beijing, Beijing, China, 2020. [Google Scholar] [CrossRef]
  24. Li, D.; He, X.; Chen, J.; Song, D.; Li, Z.; He, S.; Zhong, T. Inducing mechanism of rockburst occurring in steeply-inclined coal seam of Wudong coal mine. J. China Univ. Min. Technol. 2020, 49, 835–843. [Google Scholar] [CrossRef]
  25. He, X.; Chen, J.; Song, D.; He, S.; Li, Z.; Zhong, T.; Xue, Y.; Zhou, C. Study on mechanism of rock burst and early warning of typical steeply inclined coal seams. Coal Sci. Technol. 2021, 49, 13–22. [Google Scholar] [CrossRef]
  26. Li, X.; Chen, S.; Li, Z.; Wang, E.; Zhai, M. Research on the mechanism of rockburst based on resonance effect. J. Min. Saf. Eng. 2022, 39, 527–535+545. [Google Scholar] [CrossRef]
  27. Li, K.; Chen, J.; Zhao, Z.; Yan, R.; Du, H. Study on disaster-causing factors and evolution process of rock burst in roadway near gob. Coal Sci. Technol. 2019, 47, 76–82. [Google Scholar] [CrossRef]
  28. Kohler, J.M.; Gaume, J.; Ancey, C.; Sovilla, B. 3D Numerical modeling of compressible and cohesive granular flow impact on narrow obstacles. Comput. Part. Mech. 2026, 13, 79–96. [Google Scholar] [CrossRef] [Scilit]
  29. Wen, Y.; Mu, Z.; Yi, E.; Wang, H.; Liu, Z. The response features of roadway surrounding rock in different hardness coal seams under dynamic disturbance. J. Min. Saf. Eng. 2013, 30, 555–559. [Google Scholar]
  30. Song, X.; Zuo, Y.; Zhu, W. Effect of Lateral Pressure Coefficients on Pressure-released Hole Combined Support with Rockbolt under Dynamic Disturbance. Chin. J. Rock Mech. Eng. 2007, 26, 9. [Google Scholar] [CrossRef]
  31. Xie, L.; Dou, L.; Lv, C.; Yu, G.; Wang, Y. Study on the effect of floorburst induced by dynamic disturbance at different lateral pressure coefficients. J. Min. Saf. Eng. 2013, 30, 251–255. [Google Scholar]
  32. Cao, G.; Hao, Z.; Liu, H. Impact failure mechanism of mining roadway under ultra-thick conglomerate. J. Min. Saf. Eng. 2019, 36, 290–297. [Google Scholar] [CrossRef]
  33. Song, X.; Yang, W.; Wang, M.; Gong, F.; Zhang, Z. Performance of Tunnel Flexible Protection Mesh Under Rockburst Impact Loading: A Numerical Simulation Study. Rock Mech. Rock Eng. 2026, 1–26. [Google Scholar] [CrossRef] [Scilit]
  34. Guo, L.; He, M.; Tao, Z. NPR Anchors as Rock-Burst Mitigation Measures: Insight from Numerical Simulation and Field Test. Rock Mech. Rock Eng. 2026, 1–15. [Google Scholar] [CrossRef] [Scilit]
  35. Jiang, X.; Zhang, G.; Wu, Y.; He, W.; Liu, L. Impact and mechanisms of thermobaric explosive afterburning on shock wave and thermal effects in confined Environments: An integrated experimental and numerical study. Fuel 2026, 415, 138461. [Google Scholar] [CrossRef] [Scilit]
  36. Hao, D.; Wu, Y.; Chen, H.; Chu, X.; Li, Y. Instability mechanism and prevention technology of roadway in close distance and extra thick coal seam under goaf. J. China Coal Soc. 2019, 44, 2682–2690. [Google Scholar] [CrossRef]
  37. Li, C.; Wang, H.; Shi, Y. Study on disturbing influence of overlying remaining coal pillars on underlying coal seam mining. Coal Sci. Technol. 2020, 48, 232–239. [Google Scholar] [CrossRef]
  38. Cai, M.; Kaiser, P.K.; Tasaka, Y.; Maejima, T.; Morioka, H.; Minami, M. Generalized crack initiation and crack damage stress thresholds of brittle rock masses near underground excavations. Int. J. Rock Mech. Min. Sci. 2004, 41, 835–847. [Google Scholar] [CrossRef] [Scilit]
  39. GB/T 23561-2009; Methods for Determining the Physical and Mechanical Properties of Coal and Rock. China Standards Press: Beijing, China, 2009.
Figure 1. Columnar rock strata.
Applsci 16 03839 g001
Figure 2. Overburden structure of stope.
Applsci 16 03839 g002
Figure 3. Lateral overburden structure.
Applsci 16 03839 g003
Figure 4. Mechanical analysis of key block.
Applsci 16 03839 g004
Figure 5. Fully bearing-type overburden structure of stope.
Applsci 16 03839 g005
Figure 6. Lateral overburden structure under fully bearing-type structure.
Applsci 16 03839 g006
Figure 8. Tunnel numerical model.
Applsci 16 03839 g008
Figure 9. Evolution of plastic zones in mining Scheme A.
Applsci 16 03839 g009aApplsci 16 03839 g009b
Figure 10. Evolution of plastic zones in Scheme B.
Applsci 16 03839 g010aApplsci 16 03839 g010b
Figure 11. Cloud map of strike stress distribution of working face under different working conditions.
Applsci 16 03839 g011
Figure 12. Stress variation curves under different working conditions.
Applsci 16 03839 g012
Figure 13. Evolution of working face strike displacement under different schemes.
Applsci 16 03839 g013
Figure 14. Time-dependent curves of surrounding rock deformation under impact load in roadways under different conditions.
Applsci 16 03839 g014
Figure 15. Plasticity evolution of surrounding rock under impact load in roadways under different conditions.
Applsci 16 03839 g015
Figure 16. Velocity cloud map of roadways under impact load.
Applsci 16 03839 g016
Table 1. Statistical results of mechanical parameters of coal and rock layers.
LithologyDensity/kg/m−3Tensile Strength/MPaCohesive Strength/MPaInternal Friction Angle/°Bulk Modulus/GPaModulus of Shearing/GPa
limestone2675 ± 425.0 ± 0.4220.0 ± 1.2635 ± 1.845 ± 2.122.5 ± 1.3
siltite2575 ± 382.5 ± 0.2811.5 ± 0.8733 ± 1.517.5 ± 1.08.0 ± 0.6
fine sandstone2600 ± 353.0 ± 0.3112.0 ± 0.9232 ± 1.620 ± 1.19.0 ± 0.5
clay1900 ± 520.2 ± 0.050.04 ± 0.0118 ± 2.12.0 ± 0.20.7 ± 0.1
coal1400 ± 450.55 ± 0.083.5 ± 0.4120 ± 1.95.0 ± 0.32.5 ± 0.2
sandstone2500 ± 401.75 ± 0.229.0 ± 0.7530 ± 1.714.0 ± 0.86.5 ± 0.4
Table 2. Mining plan of working face.
Program NumberMining SequenceStoping Space/mTotal Mining Length/m
Scheme AFirst mine the No. 8 coal, then the No. 9 coal.5300
Scheme BMining of No. 9 coal5300
Table 3. Roadway excavation scheme under impact load.
Program NumberMining SequenceStoping Space/mTotal Mining Length/m
scheme Cunbraced5300
scheme Danchor bolt + anchor cable5300
Table 4. Simulation of roadway excavation scheme under impact load.
Core IndicatorScheme A Simulation ResultScheme A Field-Measured ResultRelative ErrorScheme B Simulation ResultScheme B Field-Measured ResultRelative Error
Peak value of leading abutment pressure/MPa38.636.94.6%27.225.85.4%
Influence range of leading abutment pressure/m45427.1%32306.7%
Periodic weighting step distance/m18.517.27.6%22.323.86.3%
Maximum roof-to-floor convergence of roadway/mm4524285.6%2862715.5%
Maximum two-side convergence of roadway/mm3183025.3%1951846.0%
Disclaimer/Publisher’s Note: The statements, opinions and data contained in all publications are solely those of the individual author(s) and contributor(s) and not of MDPI and/or the editor(s). MDPI and/or the editor(s) disclaim responsibility for any injury to people or property resulting from any ideas, methods, instructions or products referred to in the content.