Article

Effect of Particle Size Distribution and Dosage of Clam Shell-Derived Filler on the Mechanical Performance of Cementitious Mortars

by
Benjamín Antonio García Montecinos
1,
Meylí Valin Fernández
1,*,
Luis Enrique Merino Quilodrán
2,
Iván Ignacio Muñoz Soto
2 and
José Luis Valin Rivera
3,*
1
Department of Mechanical Engineering (DIM), Faculty of Engineering (FI), University of Concepción, Concepción 4070409, Chile
2
Departamento de Ingeniería Civil, Facultad de Ingeniería, Universidad de Concepción, Concepción 4070409, Chile
3
Escuela de Ingeniería Mecánica, Pontificia Universidad Católica de Valparaíso, Valparaíso 2430000, Chile
*
Authors to whom correspondence should be addressed.
Appl. Sci. 2026, 16(8), 3736; https://doi.org/10.3390/app16083736
Submission received: 4 March 2026 / Revised: 5 April 2026 / Accepted: 8 April 2026 / Published: 10 April 2026

Abstract

From an environmental perspective, the use of clam shells contributes positively to marine waste management and promotes more sustainable construction practices. This study aims to analyze the influence of clam shell-derived filler on the mechanical properties of cementitious mortars, evaluating its effect as a function of dosage and particle fineness, in order to determine its potential as a sustainable additive in construction applications. The shells were ground for 0.5, 1.0, and 1.5 h and incorporated at percentages ranging from 0.5% to 5.0% by mass of cement. Slump (reduced Abram’s cone) was performed in the fresh state for each specimen mixture, while flexural strength, and compressive strength tests were performed at 7, 14, and 28 days of curing. Microstructural characterization was also performed using scanning electron microscopy (SEM) and energy dispersive X-ray spectroscopy (EDX) analysis. In addition, particle size distribution parameters were determined to quantify the effect of grinding time on particle refinement and its relationship with mechanical performance. A multifactor ANOVA was conducted to evaluate the statistical significance of grinding time and filler dosage on compressive strength. The results showed that the combination of 0.5 h of grinding and 1.0% filler provided the best mechanical performance for both flexural and compressive strength, with values of 7.27 MPa and 26.16 MPa, respectively. Dosages higher than 2.0% tended to decrease strength, which is associated with saturation of non-cementing particles. EDX analysis showed adequate calcium distribution without generating chemical segregation. The results showed that the combination of 0.5 h of grinding and 1.0% filler provided the best mechanical performance for both flexural and compressive strength, with values of 7.27 MPa and 26.16 MPa, respectively. Dosages higher than 2.0% tended to decrease strength, which is associated with saturation effects and increased specific surface area. The statistical analysis confirmed that both grinding time and filler dosage significantly influence compressive strength, highlighting the importance of optimizing particle size distribution and filler content to achieve improved mechanical performance.

1. Introduction

Sustainability, as a global challenge, is directly integrated into the Sustainable Development Goals (SDGs), raising the need for a balance between social well-being, economic growth and environmental protection. The simultaneous progress in science and technology, together with environmental deterioration worldwide, underlines the need to investigate ways to reuse materials, including industrial and agro-industrial waste, as resources in civil construction. This concept has posed a challenge in engineering regarding its effective application in the design of new materials and in the creation of road infrastructures [1].
Mortar has been a recurring element in construction, playing roles such as coating, adhesion in the union of prefabricated pieces and as a material for repairs, among other uses. The elaboration of this material requires combining aggregates, water, cement and, sometimes, additional aggregates and complements [2]. Aggregates are used in order to improve properties according to the conditions in which the mortar is to be used.
The continuous growth of urbanization increases the demand for natural resources. In turn, mining extraction and mass transportation of minerals generate greenhouse gas emissions in a considerable and increasing manner, in line with the current development model [3].
For this reason, various studies use recycled materials as fillers. For example, Camargo-Pérez et al. [1] conducted research on the mechanical performance of using recycled rice husk ash as a filler in asphalt mixtures. As a result, they found that the optimal dosage of this aggregate, to maintain the mechanical properties and performance of the asphalt mortar, should not exceed 13.5% of the total weight of the mortar.
Wang et al. [3], on the other hand, used heavy slag powder with a high titanium content as a sustainable filler and studied its influence on the performance of the asphalt mortar by comparing it with the use of limestone. As a result, he found that mortars with slag powder, compared to limestone powder, presented a rougher and more porous surface, with smaller particles and greater surface area, favoring a more structured asphalt.
Chile stands out as a major producer of marine resources, ranking among the top ten countries in fisheries catches. The production is more than 400,000 tons of mollusks annually, mainly mussels, according to official statistics from the National Fisheries and Aquaculture Service (SERNAPESCA), which implies the generation of hundreds of thousands of tons of seashell waste each year [4]. Mollusk shells, rich in calcium oxide similar to that of lime, have applications in construction, but are mostly discarded in landfills or returned to the sea, generating significant environmental impacts, such as groundwater contamination by leaching and high mortality of marine life.
Given their high mineral content, mollusk shells possess hardness and rigidity, characteristics that make them valuable for studies and applications in the field of construction [5]. Seashells have been used in different ways in research. For example, they have been used as both coarse and fine aggregates [6,7], while Ez-Zaki et al. [5] and Salem et al. [8] used marine sediments and oyster shells and Egyptian cornstalk ash as a substitute for cement in mortars, respectively. On the other hand, Maglad et al. [9,10] used clam shells as filler in concrete mixtures.
The use of clam shells in construction works offers a practical and ecological solution. Therefore, the objective of this work is to determine the influence on the mechanical resistance of a mortar when using clam shells as filler. The use of clam shells as filler not only reduces their destination to landfills but also represents a significant contribution to civil works by replacing conventional fillers and contributes to the reduction in the environmental impact generated in limestone mining. In addition, the mechanical properties of construction materials can be improved and the emissions generated by limestone extraction can be reduced. On the other hand, there is not a large amount of information on the use of clam shells as filler in mortars; this work proposes to address that gap by evaluating the effect of varying both the grinding time and the filler content.

2. Materials and Methods

2.1. Materials

The seashells used correspond to clam shells obtained in the municipal market “La Poza” of Talcahuano in the city of Concepción, Chile.
The cement used in this study was a Portland pozzolanic cement (Bío Bío Especial), classified according to NCh 148 [11]. According to the manufacturer’s technical datasheet, the cement presents a specific gravity of 2.8 g/cm3 and an autoclave expansion of 0.1%. The initial and final setting times are 2 h 40 min and 3 h 40 min, respectively. In terms of mechanical performance, compressive strengths of 270 kg/cm2 at 3 days, 320 kg/cm2 at 7 days, and 410 kg/cm2 at 28 days are reported. These values ensure an adequate characterization of the cement used in this study.
Drinking water from the public network was used for the preparation of the mortar, which complies with the requirements of the NCh409 standard [12]. It should be noted that the preparation was carried out in the month of September, since, when carrying out the same preparation, but in another season of the year, the water could vary in temperature and, with this, the mechanical properties of the mortar. The tap water temperature during winter conditions (June–September) in central–southern Chile typically ranges between 9 °C and 13 °C.
The fine aggregate used in this study was a natural sand from Bio-Bio region, characterized according to ASTM international standards. The physical properties, determined through the gravimetric procedure (ASTM C128-22) [13], yielded a relative density (oven-dry) of 2.68, a relative density (SSD) of 2.72, and an apparent relative density of 2.81, presented in Table 1. The measured absorption was 1.77%. Furthermore, the bulk density (unit weight) was evaluated following ASTM C29 [14], resulting in 1.60 Mg/m3 for the loose state and 1.67 Mg/m3 for the compacted state. The material presented a fineness modulus of 2.10, consistent with the grading requirements for fine aggregates in concrete mixtures (ASTM C136) [15]. The grain size distribution was further characterized by the representative diameters D10, D50, D60, and D90, which were determined to be 0.367 mm, 0.856 mm, 0.991 mm, and 2.079 mm, respectively. These parameters were calculated via linear interpolation following the ASTM D6913/D6913M [16] guidelines. From these values, the coefficient of uniformity (Cu) was found to be 2.70. This coefficient indicates a relatively uniform particle size distribution (poorly graded), a typical feature of natural sands from the Biobío region. These grading metrics are critical for predicting the interstitial void space and the overall packing density of the aggregate skeleton within the cementitious matrix.

2.2. Granulometric Analysis

The natural clam shell powder was obtained via ball milling using a Marcy-type mill, manufactured by EDEMET. A representative sub-sample of approximately 125 g was obtained through the standard cone-and-quartering method in accordance with ASTM C702 [17], from an initial batch of 2 kg, adhering to the principles of standardized sampling to prevent sieve overload. Particle size distribution analysis was performed using a series of seven sieves referenced from ASTM C136 [15], ranging from a 2 mm opening down to 0.053 mm (No. 270). A Tyler Ro-Tap sieve shaker (utilizing ASTM B-214 [18]) mechanical action specifications) was employed for optimized fine-particle separation.
To evaluate the influence of grinding duration, the clam shell powder was subjected to milling times of 0.5, 1, 1.5, 2, 2.5, 3, and 4 h. To verify the reproducibility of the grinding process within the Marcy mill, two independent 1 kg batches were processed for each milling duration.
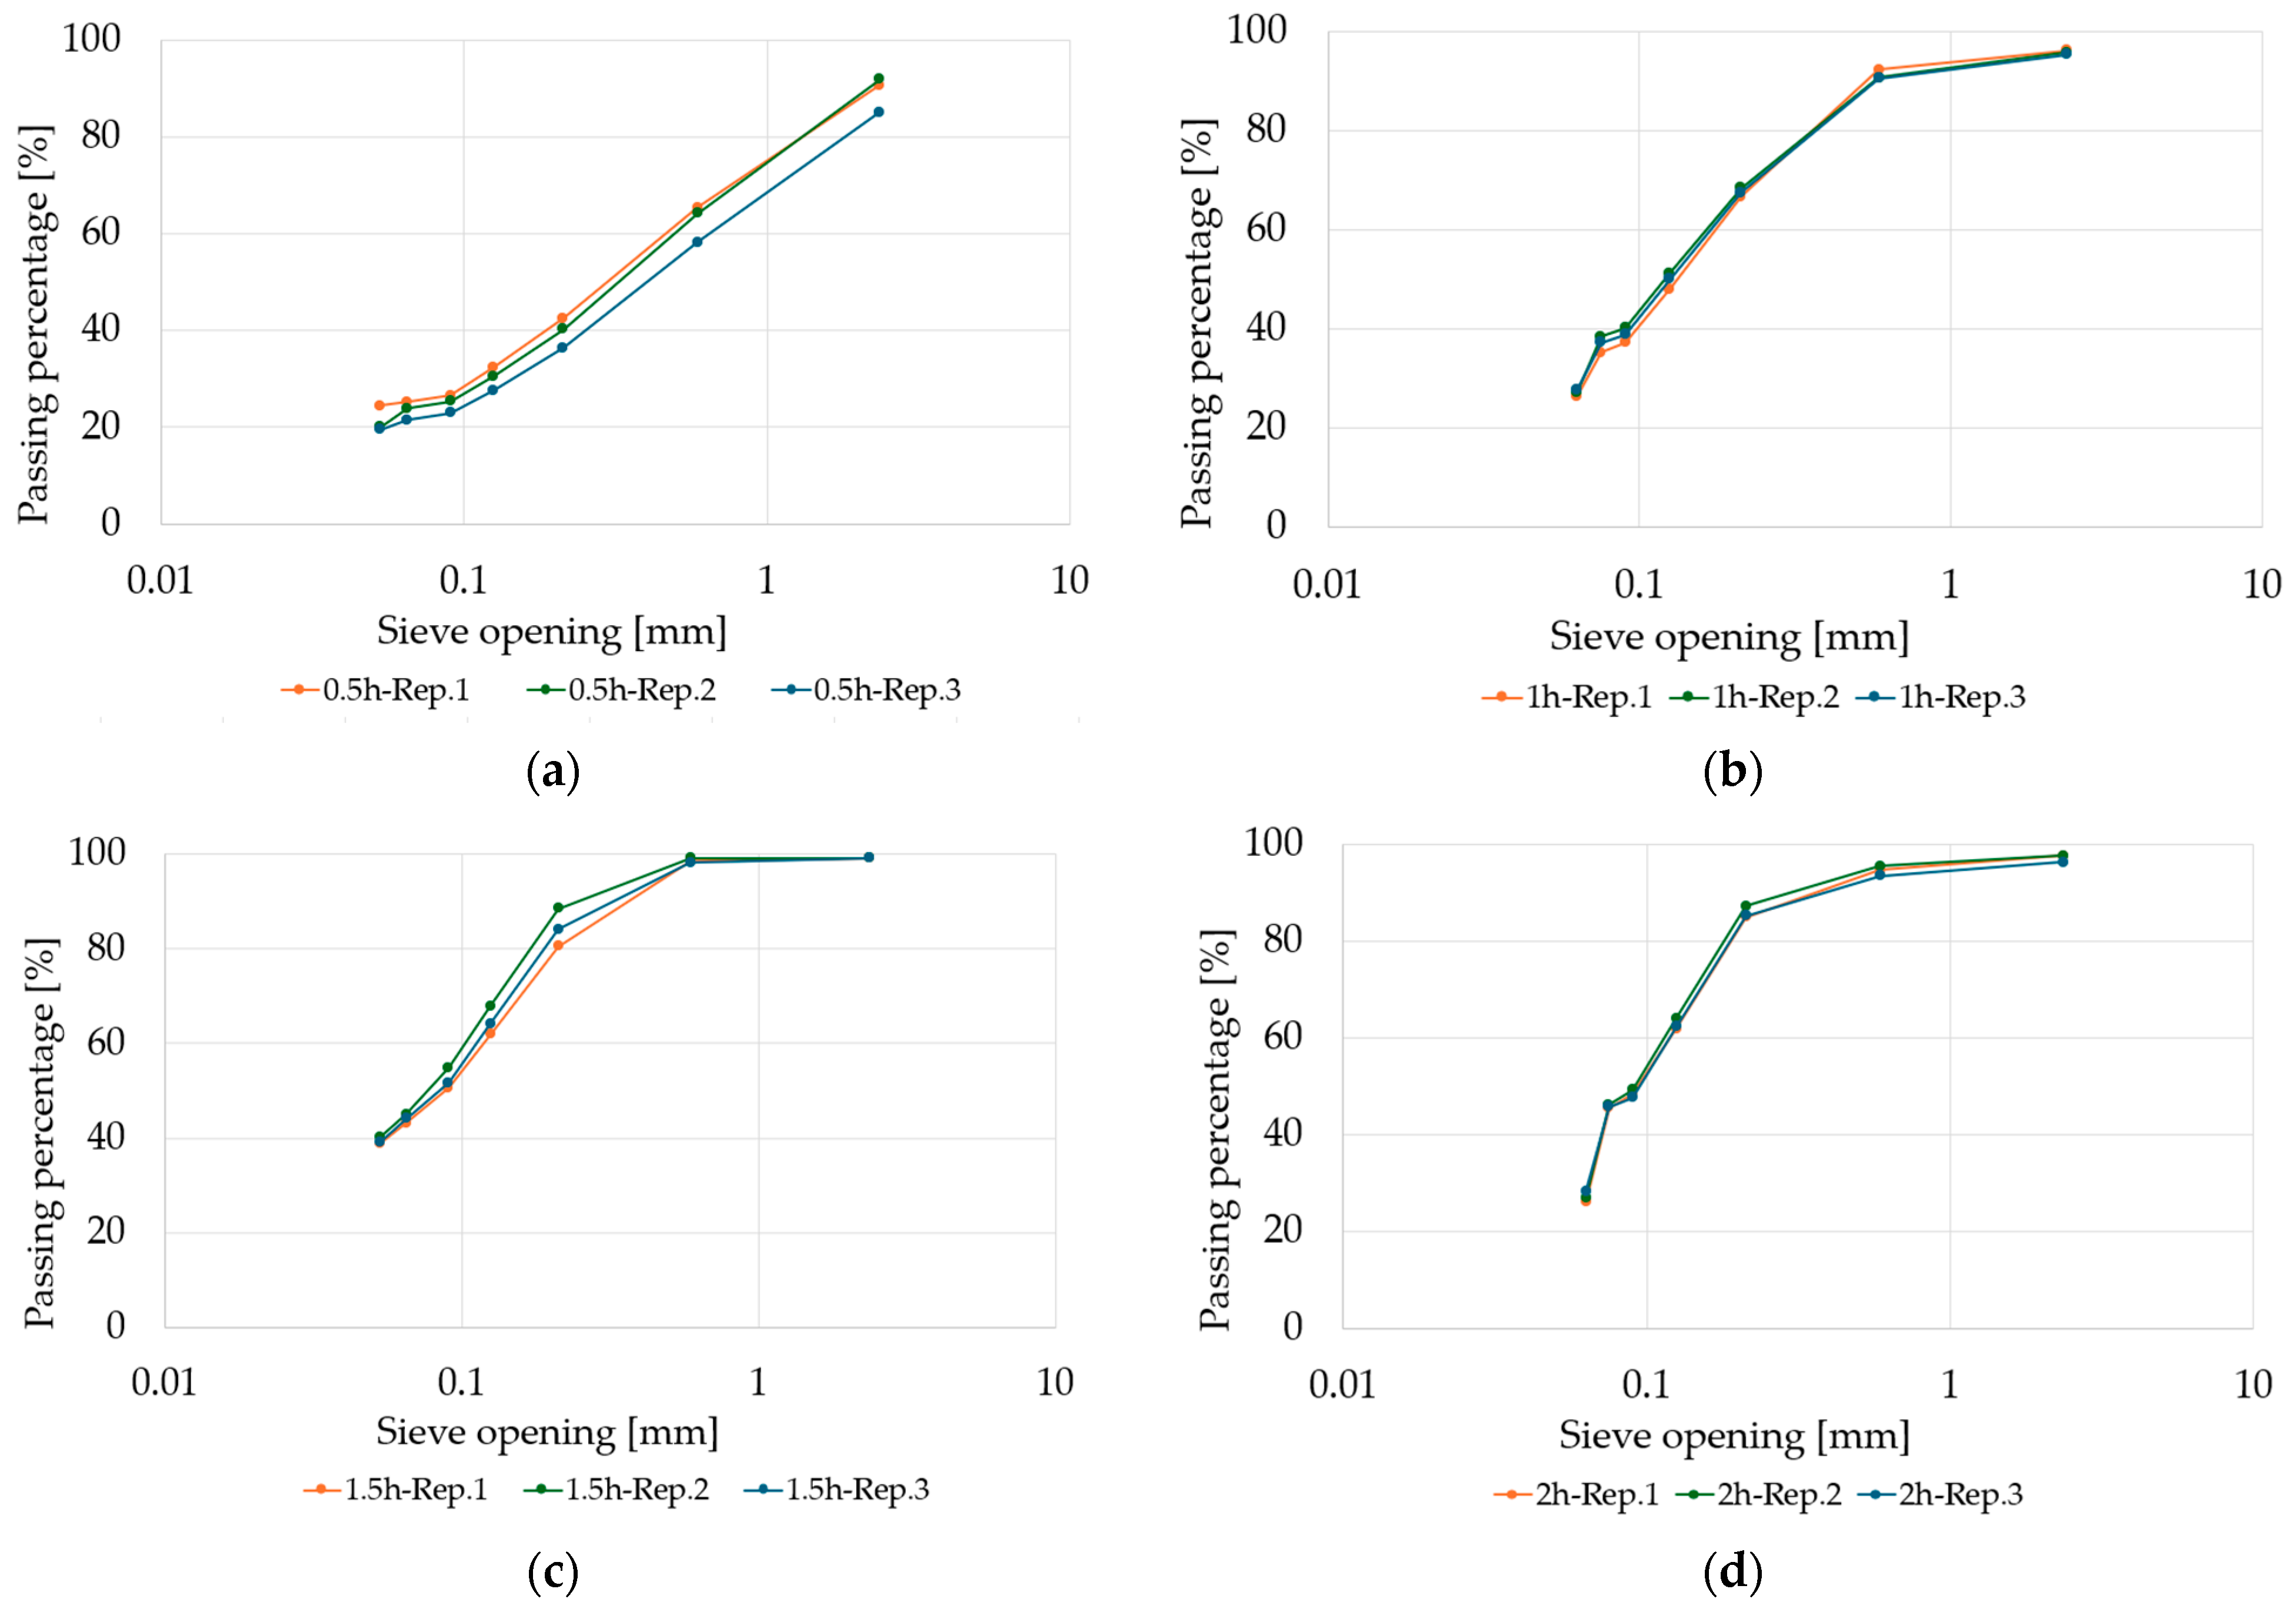
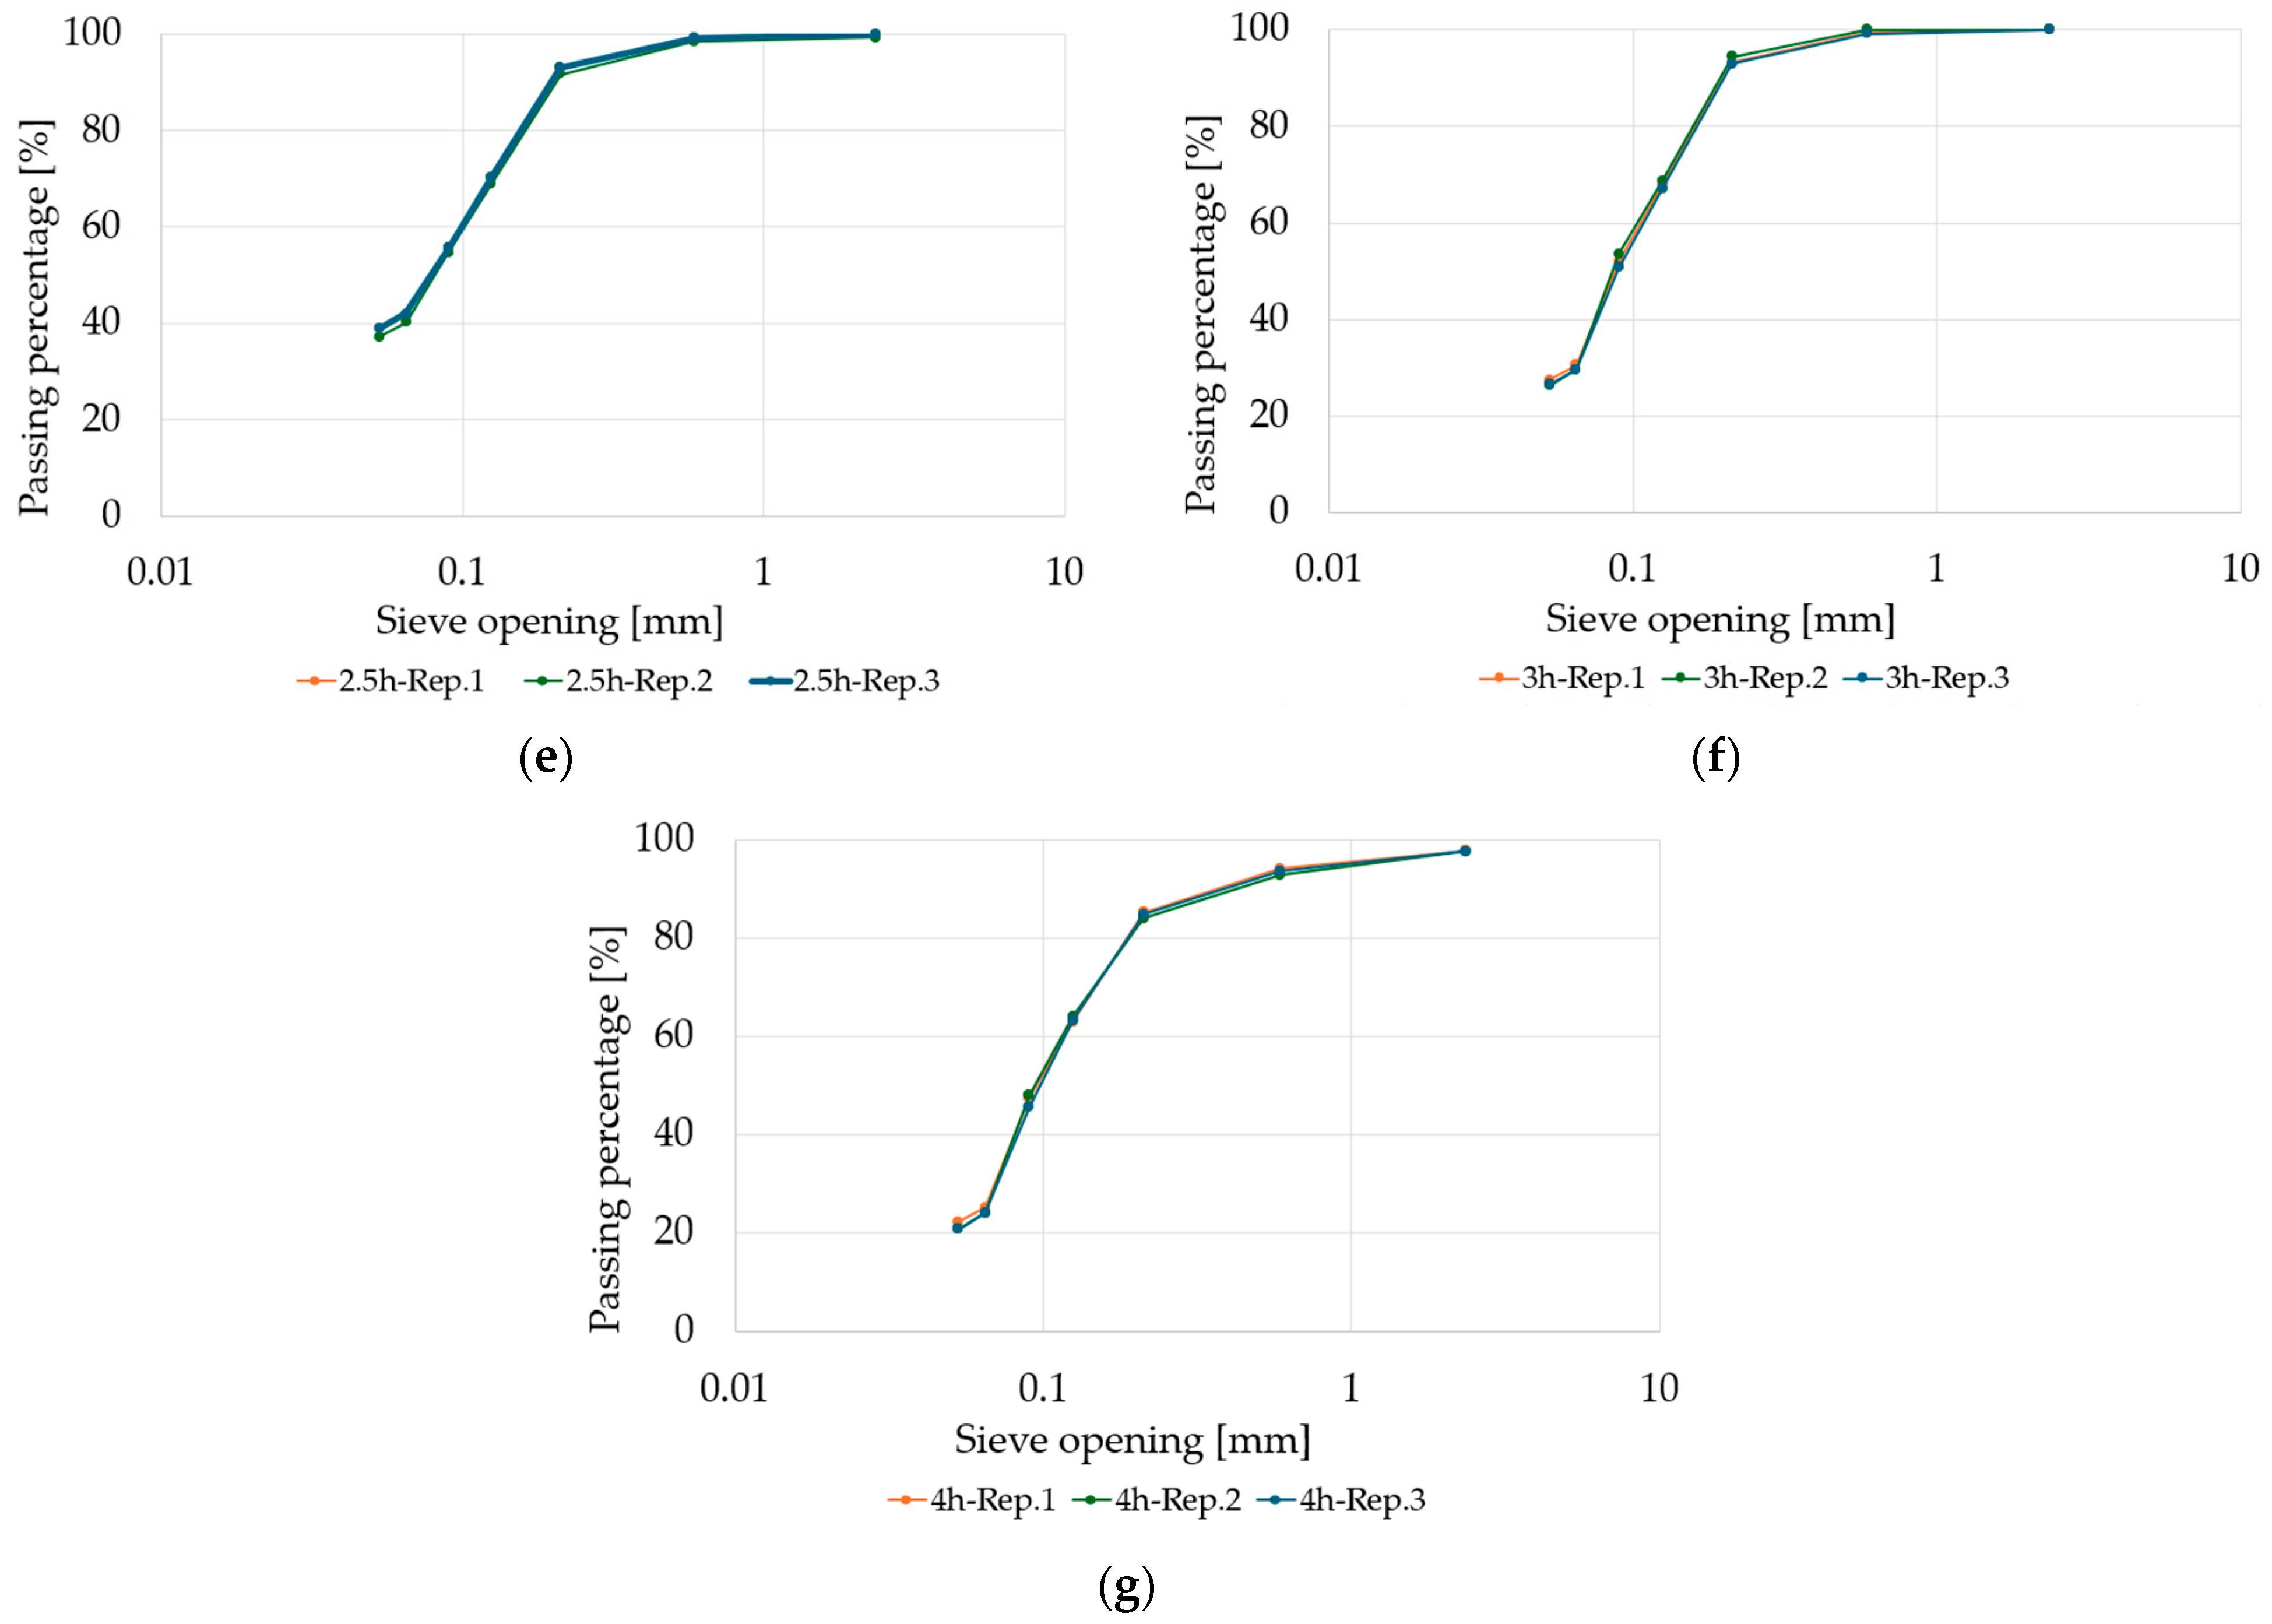
The particle distribution was studied by sieving granulometric tests, taking as a reference the NCh 165 standard [19] for the choice of sieves, starting with sieve No. 10 (with an opening of 2 mm) and ending with sieve No. 230 (with an opening of 0.063 mm). These duplicate samples are identified in the results (Figure 1) with the nomenclature “Replicate.1” (Rep.1) and “Replicate 2” (Rep.2), preceded by the milling time. Furthermore, a composite sample was formed by mixing equal parts of Rep.1 and Rep.2; these curves are designated by “Replicate 3” (Rep.3) preceded by the milling time. This redundant sampling protocol ensured consistency in the filler’s physical properties before comparison across the different granulometric bands for mortar production.
The results showed a clear influence of the grinding time on the particle size distribution, where the most significant size reduction occurs during the first hour, evidenced by a pronounced increase in the percentage of material passing through the sieves. The particle size curves revealed that after 1.5 h of grinding (see Figure 1c), the process reaches a state of equilibrium, where additional grinding times do not produce substantial improvements in particle size reduction or in the uniformity of the material. It is notable to note that the 1.5 h grinding showed a better performance than the 2 h (see Figure 1d) grinding on the 2 mm and 0.589 mm sieves, a variation that could be attributed to factors such as shell moisture, mill conditions or the heterogeneity of the starting material. A mill saturation phenomenon was also observed at 2.5 h (see Figure 1e), evidenced by granulometric curves practically identical to those of 3 h (see Figure 1f), indicating a significant loss of efficiency. The 4 h mills (see Figure 1g) presented anomalies in their results, showing a particle size distribution similar to that of the 2 h millings, suggesting possible irregularities in the process. It is important to mention that the reproducibility of the results was consistent for each milling time, with the exception of the 0.5 h samples, where greater variability was observed. These findings suggest that the optimal milling time is around 1.5 h, at which point an adequate balance is achieved between the degree of milling, the uniformity of the product and the energy efficiency of the process.
The mixture of each sample will be considered but discarding the 2 h, 2.5 h, 3 h and 4 h millings because they suffer from the phenomenon of saturation. Finally, the particle size bands to be used are 0.5 h, 1 h, and 1.5 h. For these selected grinding times, the characteristic particle size parameters D30, D50, and D90 were calculated based on the particle size distribution curves. These parameters were determined for three independent replicates, corresponding to each individual milling batch, in order to ensure the reproducibility of the results. The values are reported as mean values, providing a quantitative description of the granulometric behavior of the material. The corresponding results are presented in Table 2.

2.3. Mix Proportions

The clam shell powder was incorporated as an addition to the reference mortar, at dosages ranging from 0.5% to 5.0% by mass of cement. In all mixtures, the cement, sand, and water contents were kept constant, and only the filler content was varied. In this approach, the specified percentage represents the mass of filler added relative to the cement content in each mix. For instance, in mixture MFC0.5h–0.5%, with a cement content of 0.864 kg, the addition of 0.5% corresponds to approximately 0.0043 kg of filler, which is consistent with the value reported in Table 2 and Table 3.
The mixture design was carried out using the absolute volume method. In this context, abs = 2.1% refers to the water absorption capacity of the aggregates, which was considered to correct the effective mixing water, while w = 0.8% corresponds to the initial moisture content of the aggregates. The term R W/C = 0.66 denotes the water-to-cement ratio by mass, which was kept constant across all mixtures to ensure comparability of results.
In Table 3, it can be observed that the proportions of cement, sand, water, and the water-to-cement ratio remain constant for all mixtures. In Table 4, the variation in filler content is presented as a function of the dosage, highlighting it as the only variable parameter in the mix design.

2.4. Sample Preparation

Prior to the grinding process, the clam shells were subjected to a cleaning stage in which all adhering organic matter was completely removed. Specifically, the shells were washed with water and a brush to eliminate organic residues, then placed in a drying oven made of AISI 304 stainless steel by Labtech Hebro (Nuevo León, México), model DO0.8ME of 9 kW. After drying, they were passed through a General Electric crusher (General Electric, Schenectady, USA), model 5K182AG2 of 440 RPM, three times to obtain a size suitable for grinding. The dried shells are ground in a Marcy-type ball mill, manufactured by EDEMET in AISI 316 steel, with a capacity of 5.4 L and a speed of 130 rpm.
The preparation begins with the standard mortar with the stipulated dosage in a COTEST by Controls S.p.A (Milan, Italy) brand manual mortar mixer, which is worked at a speed of 140 rpm. First, it is mixed dry for 5 s, making sure to lose the least amount of material possible, then approximately 80% of the water is added for about 10 s and finally the rest is poured out and mixed for 2 min.
After mixing the materials, the mortar was placed in 40 mm × 40 mm × 160 mm prismatic molds. These were left for 3 days at room temperature and protected with plastic. After which the specimens were removed from the mold and then placed in a curing chamber until they reached the age of 7, 14 and 28 days. The curing chamber has a temperature between 17 and 23 °C and a humidity of 90%.

2.5. Tests Methods

The workability of the mortar was determined according to the NCh1019 standard [20], which is based on the truncated cone settlement method in the laboratory and in the field. The vertical distance between the initial height and the final position of the center of the mortar was measured with an accuracy of 0.5 cm. The test was performed on the mortar in its fresh state, immediately after mixing.
The flexural tensile strength was determined following the NCh1038 standard for prismatic specimens [21]. For each specimen, three samples were analyzed with 40 mm × 40 mm × 160 mm dimensions. This test was performed in a simple compression apparatus equipped with a mortar bending device. The load was applied at the center of the specimen, and the reading indicated the displacement (Dial displacement). To transform the displacement into force, formula (1) taken from the empirically determined NCh 158 standard [22] was used. The value obtained was introduced into formula (2) to obtain the tensile strength.
P k g f = D i a l   d i s p l a c e m e n t · 3.4 + 15.25
R = P · L b · h 2
where R is the breaking stress [MPa]; P is the maximum load [N]; L is the test span of the specimen [mm]; b the average width of the specimen at the break section [mm]; h the average height of the specimen at the break section [mm].
The compression test was carried out using the Controls Sercomp 7 LH 01.00.B universal testing machine (Controls S.p.A., Milan, Italy). The load was applied at a rate of 1.5 MPa/s, according to the Chilean standard NCh 158 [22]. Each piece obtained from the flexural tensile test was tested under compression in a 40 × 40 mm section, applying the load to both faces coming from the sides of the formwork, placing it between the plates of the compression machine. The overall compressive strength of the prismatic probe was calculated as the simple average of the results of each cubic specimen.

2.6. Morphology Analysis

The specific morphological characteristics of the samples were analyzed by SEM using the scanning electron microscope Carl 240 Zeiss Gemini SEM 360, model Gemini SEM 360 from the manufacturer Carl Zeiss Microscopy (Carl Zeiss AG, Oberkochen, Germany). The specimens were subjected to broken shape treatment. Before the scanning electron microscope test, the surface of the samples was sprayed with gold coating using a vacuum gold plating instrument.
The composition of the specimens was determined by X-ray energy dispersion analysis (EDS), using an Oxford Instruments Ultim Max 65 energy dispersion X-ray detector (EDS/EDX) (Carl Zeiss AG, Oberkochen, Germany), which is coupled to the aforementioned electron microscope.

2.7. Statistical Analysis Methodology

A multifactor ANOVA was performed to evaluate the individual and combined effects of grinding time (hours) and filler percentage on the mechanical performance of the mortars. This statistical approach was selected to determine whether the observed differences between mixtures are statistically significant and to identify the relative influence of each factor. The analysis was conducted by considering compressive strength (MPa) as the dependent variable, while grinding time (hours) and filler percentage (%) were treated as fixed factors. Through this method, the total variability of the results is partitioned into contributions associated with each factor and their potential interaction. The expected outcome of this analysis is to establish whether grinding time and filler dosage significantly affect compressive strength, as well as to quantify their relative importance, providing a robust basis for interpreting the experimental results.

3. Results

3.1. Workability

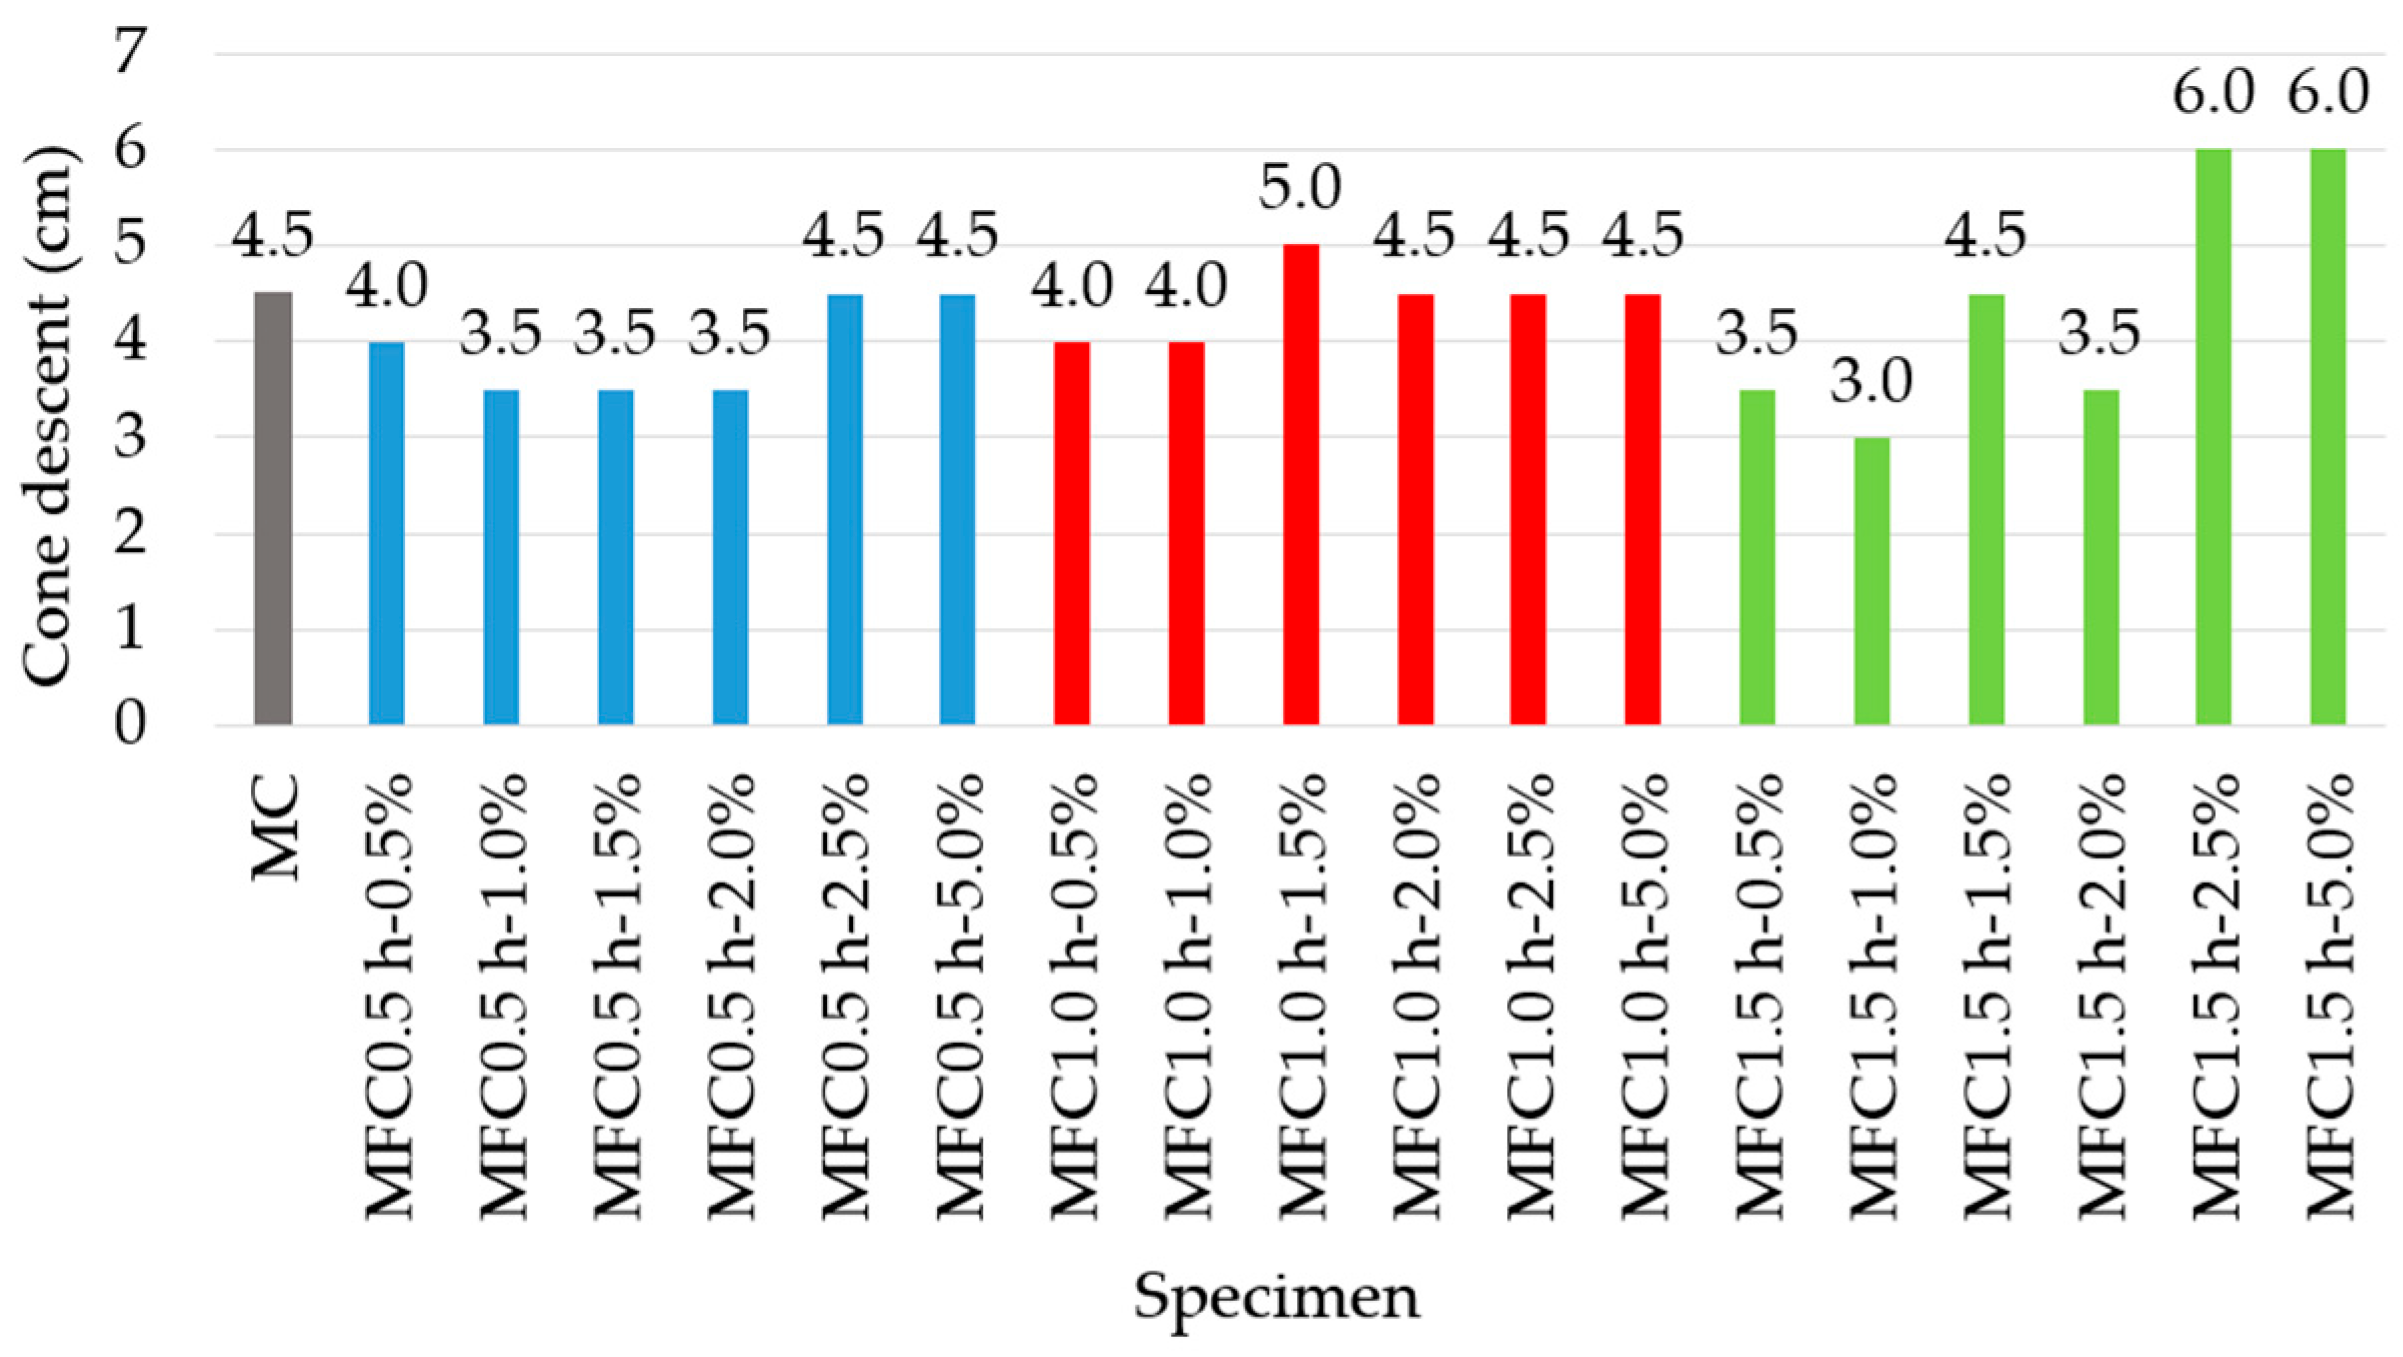
The truncated cone measurements can be seen in Figure 2, where the control mixture (CM) showed a base settlement of 4.5 cm.
For the 0.5 h grinding period, increasing the filler content from 0.5% to 2.0% resulted in a progressive decrease in slump, reaching a minimum value of 3.5 cm, suggesting a loss of workability. However, at 2.5% and 5.0%, slump recovered to 4.5 cm, equaling control. This could be explained by a delayed lubricating effect upon reaching a threshold of sufficient filler volume to compensate for its low fineness. This is consistent with the results presented by Soltanzadeh et al., who specified that the presence of fine particles in the sand causes a decrease in the workability of the mixture due to increased water absorption, and they can also coat the aggregates, impairing the bond of the aggregate paste with the cement [23]. Also, the addition of seashells reduces the mortar’s slump value due to their high porosity and water absorption, angular shape, and rough surface [24]. The use of water-reducing admixtures can improve workability.
For the 1.0 h. milling, performance is stable, with settlements between 4.0 and 5.0 cm throughout all dosages. The maximum value is observed at 1.5% filler (5.0 cm), indicating that this combination optimizes workability. At higher dosages (up to 5.0%), fluidity remains constant (4.5 cm), demonstrating that intermediate milling generates particles with good dispersion and filling capacity, without negatively affecting consistency. Ruslan et al. found that replacing crushed cockleshell content as partial fine aggregate influenced the workability of concrete, and increasing the proportion of crushed cockleshell resulted in a drop in the slump value [25].
On the other hand, with 1.5 h grinding at low dosages (0.5–1.0%), workability decreases (up to 3.0 cm), probably due to water absorption and excessive cohesion generation. From 1.5% onwards, fluidity progressively improves, reaching 6.0 cm at 2.5% and 5.0%, the highest values of the group. This behavior indicates that prolonged grinding combined with adequate dosage allows the filler to act as an effective rheological modifier, promoting mortar deformation and fluidity.

3.2. Flexural Tensile Strength

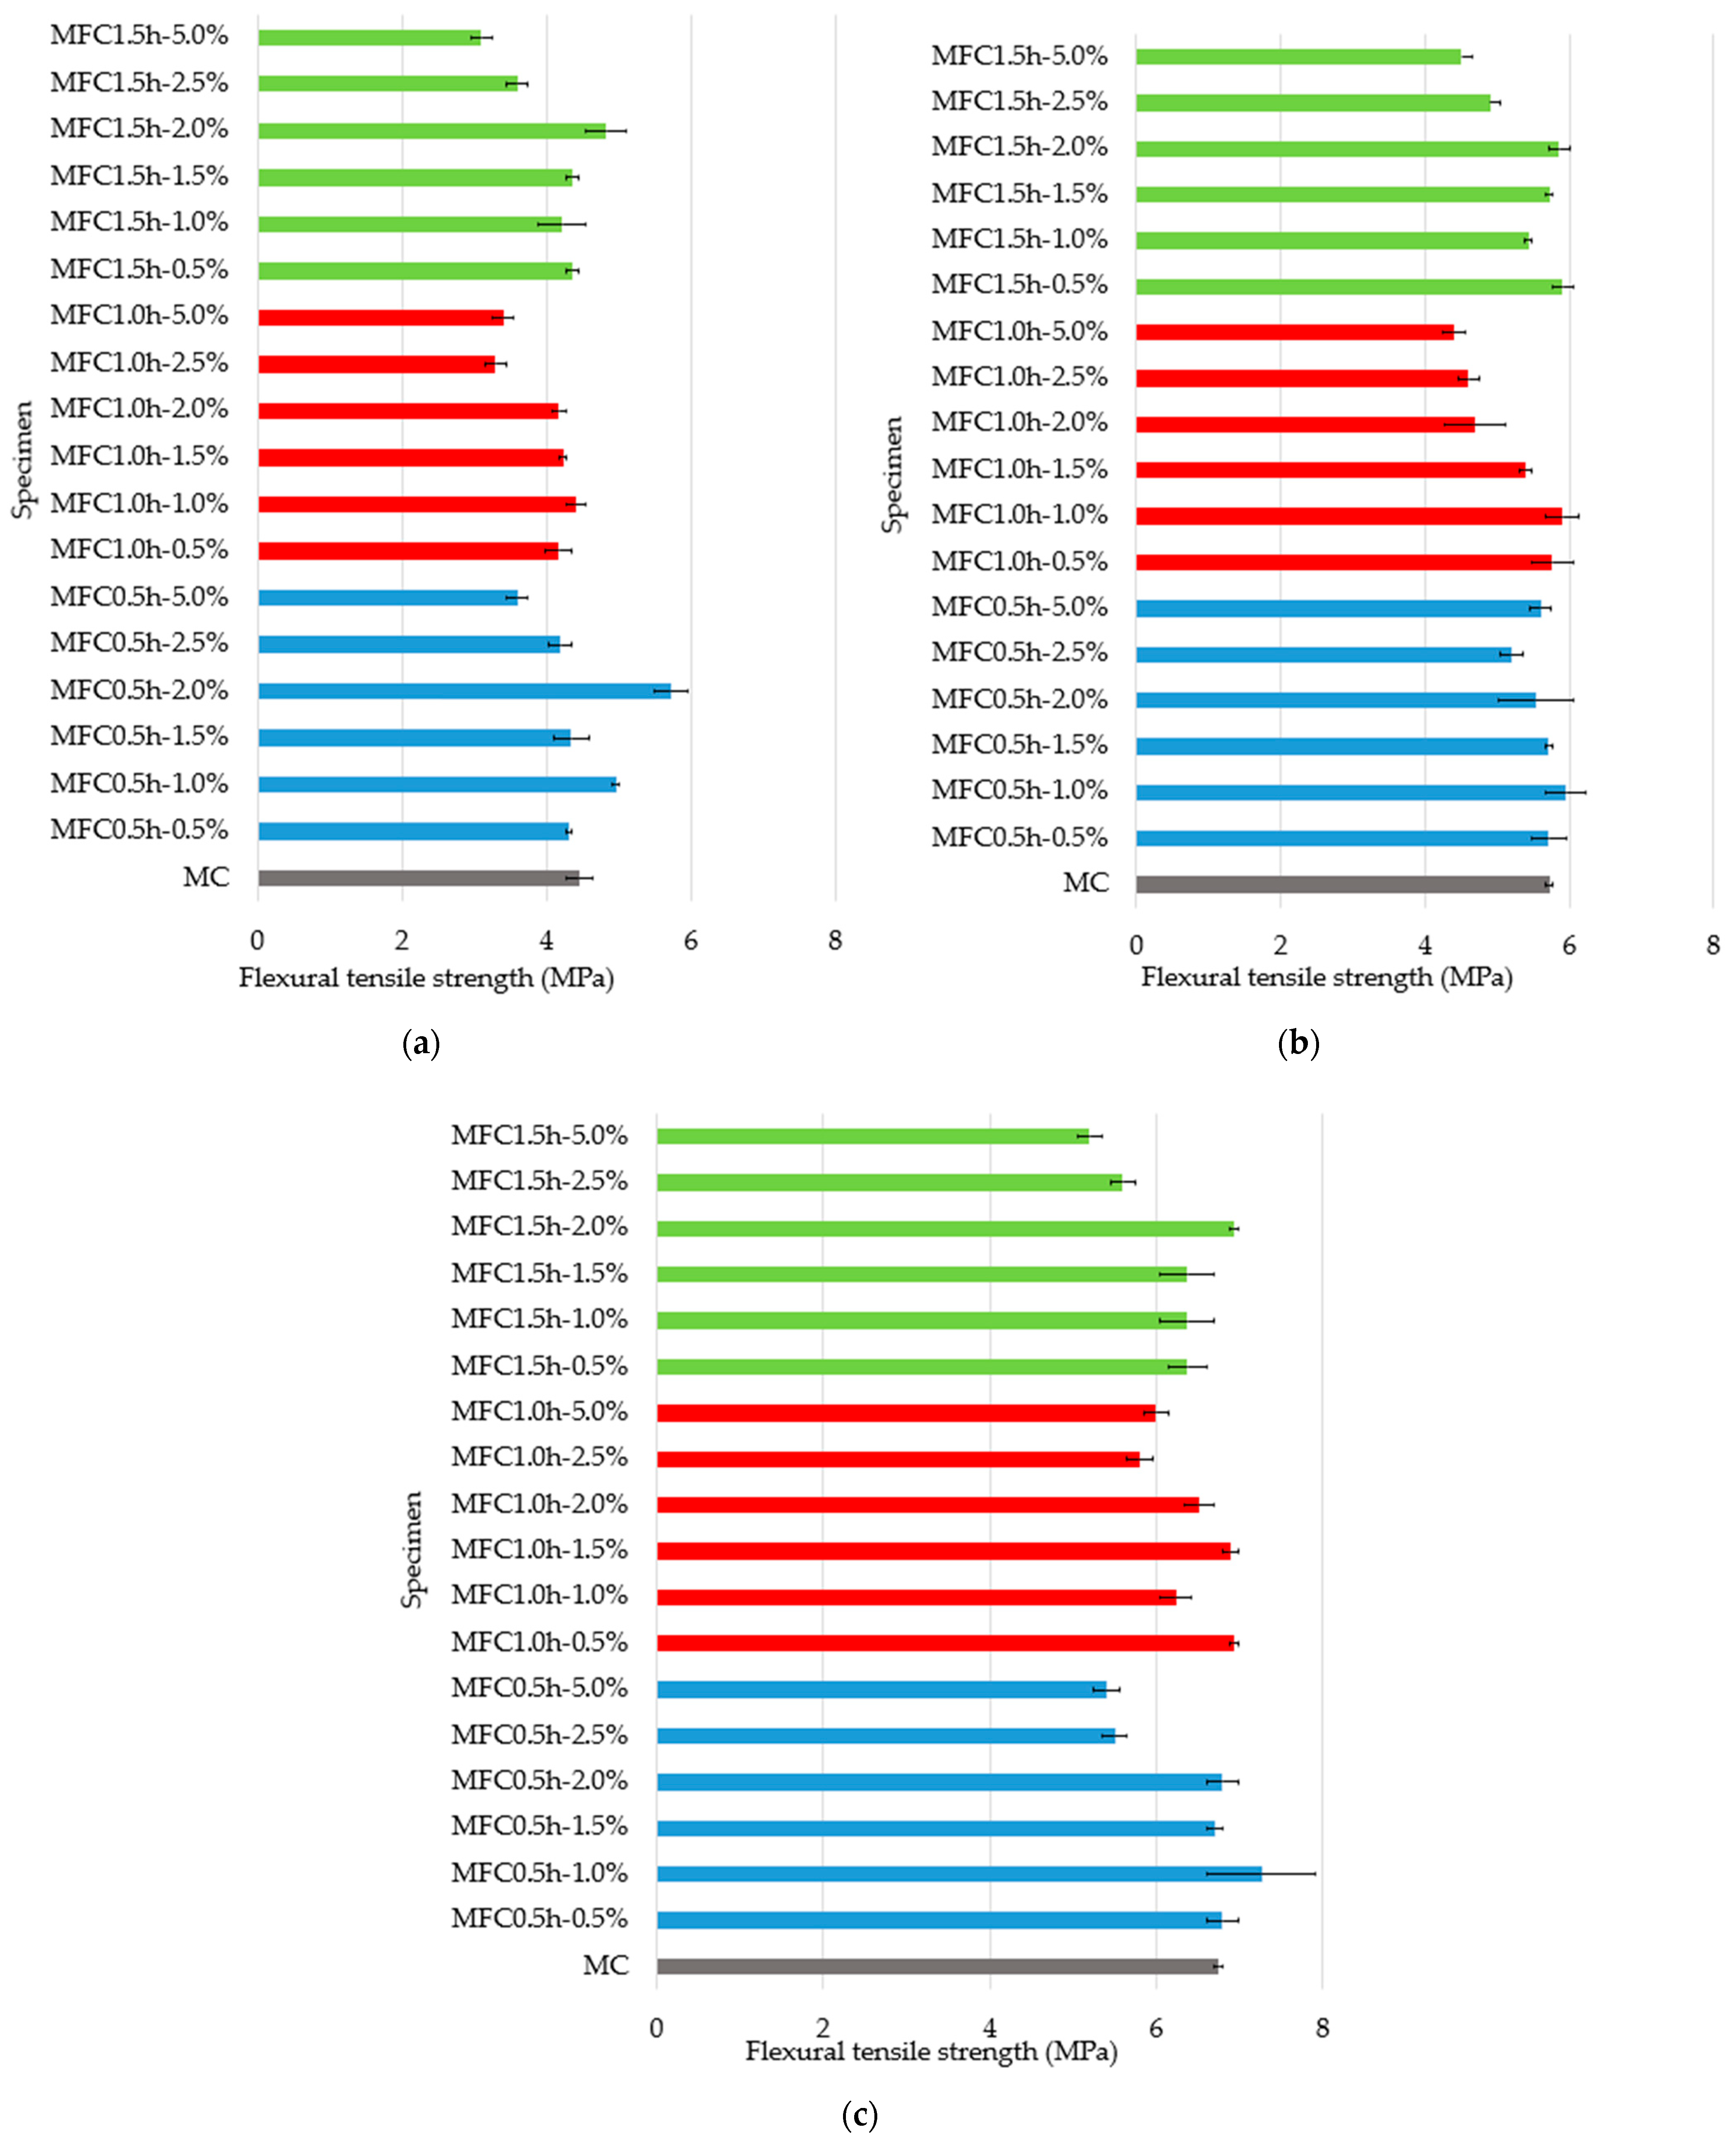
The flexural tensile test results for 7 days are presented in Figure 3a, for 14 days in Figure 3b, and for 28 days in Figure 3c. At 28 days, the samples with filler grinding for 0.5 h, specifically those of 0.5% and 1%, showed increases of 0.7% (6.80 MPa) and 7.1% (7.27 MPa) with respect to the control (6.75 MPa). In the case of the samples with filler ground for 1 h, the 0.5% and 1.5% addition specimens showed increases of 2.7% and 2%, respectively, with respect to the standard. Meanwhile when filler ground for 1.5 h was used, the strength decreased for most of the addition percentages, except for 2%, which showed an increase of 2.7% (6.94 MPa) with respect to the control.
The filler does not behave merely as an inert aggregate; rather, it may actively contribute to the evolution of the cementitious matrix. Its fine particle size can promote heterogeneous nucleation, accelerating hydration reactions, while also enhancing particle packing and reducing porosity, thereby improving matrix densification. Moreover, in contrast to the differences observed at 7 days, the responses among the mixtures tended to converge at 28 days, indicating that the influence of the filler diminishes over time as hydration progresses and the matrix approaches a more stable microstructural state.
The results obtained do not differ greatly from the control, with the largest difference found being 8.3% for the specimens with 1 h of grinding and 1% shell addition. This behavior is attributed to the low percentages of fillers used. In works such as that of González et al. [26], seashell powder was used to replace 100% of the limestone filler, the cement was kept constant, and the powder/fine aggregate ratio was varied. Their results showed a relative decrease due to the use of shell of 12.5%, 7.2%, and 0.8% for powder/fine aggregate ratios of 0.6, 0.7, and 0.8, respectively. The largest decrease in strength was attributed to a less compact matrix in the case of the ratio, while the smallest was attributed to a higher dust content, where the effect of the shell as a filler is stabilized or neutralized. On the other hand, Wang et al. [27] and Lozano et al. [28] speak of a decrease in flexural strength attributed to the fact that a smaller particle size, with a less rounded shape and greater porosity worsens the internal organization between the particles.
At all three grinding levels, when filler content exceeds 2.0%, a general decrease in flexural strength is observed, with values between 5.23 and 5.83 MPa. No mix with 2.5% or 5.0% exceeds the control mortar (6.75 MPa), nor does it match the best formulations with 0.5–2.0%. This suggests that there is an optimal filler dosage threshold (~2.0%), beyond which its addition becomes counterproductive.
The variation in flexural strength can be directly related to the particle size distribution presented in Table 2, which is governed by grinding time. Increasing grinding time from 0.5 h to 1.5 h led to a significant reduction in particle size (D50 from 0.383 mm to 0.081 mm), which did not translate into a proportional improvement in flexural performance.
The highest strength was observed for the 0.5 h condition at 1.0% dosage (7.27 MPa at 28 days), indicating that coarser particles provide a more favorable balance between packing and water demand. In this range, the filler contributes to matrix densification without significantly increasing the specific surface area, allowing adequate dispersion and efficient stress transfer.
In contrast, the finest material (1.5 h) resulted in lower flexural strength at high dosages (5.0%), suggesting that excessive fineness negatively affects the mechanical response. This behavior can be attributed to the increased specific surface area of the particles, which raises the water demand and promotes particle agglomeration, leading to a less homogeneous microstructure and weaker interfacial bonding.
However, at intermediate dosages (2.0%), the finer particles (1.5 h) still achieved competitive strength values (6.94 MPa at 28 days), indicating that particle refinement can be beneficial within a limited dosage range, where improved packing and void filling are not offset by dispersion or water-related effects.
Overall, these results demonstrate that the effect of grinding time on flexural strength is not linear, and that an optimal particle size distribution exists depending on the filler content.

3.3. Compressive Strength

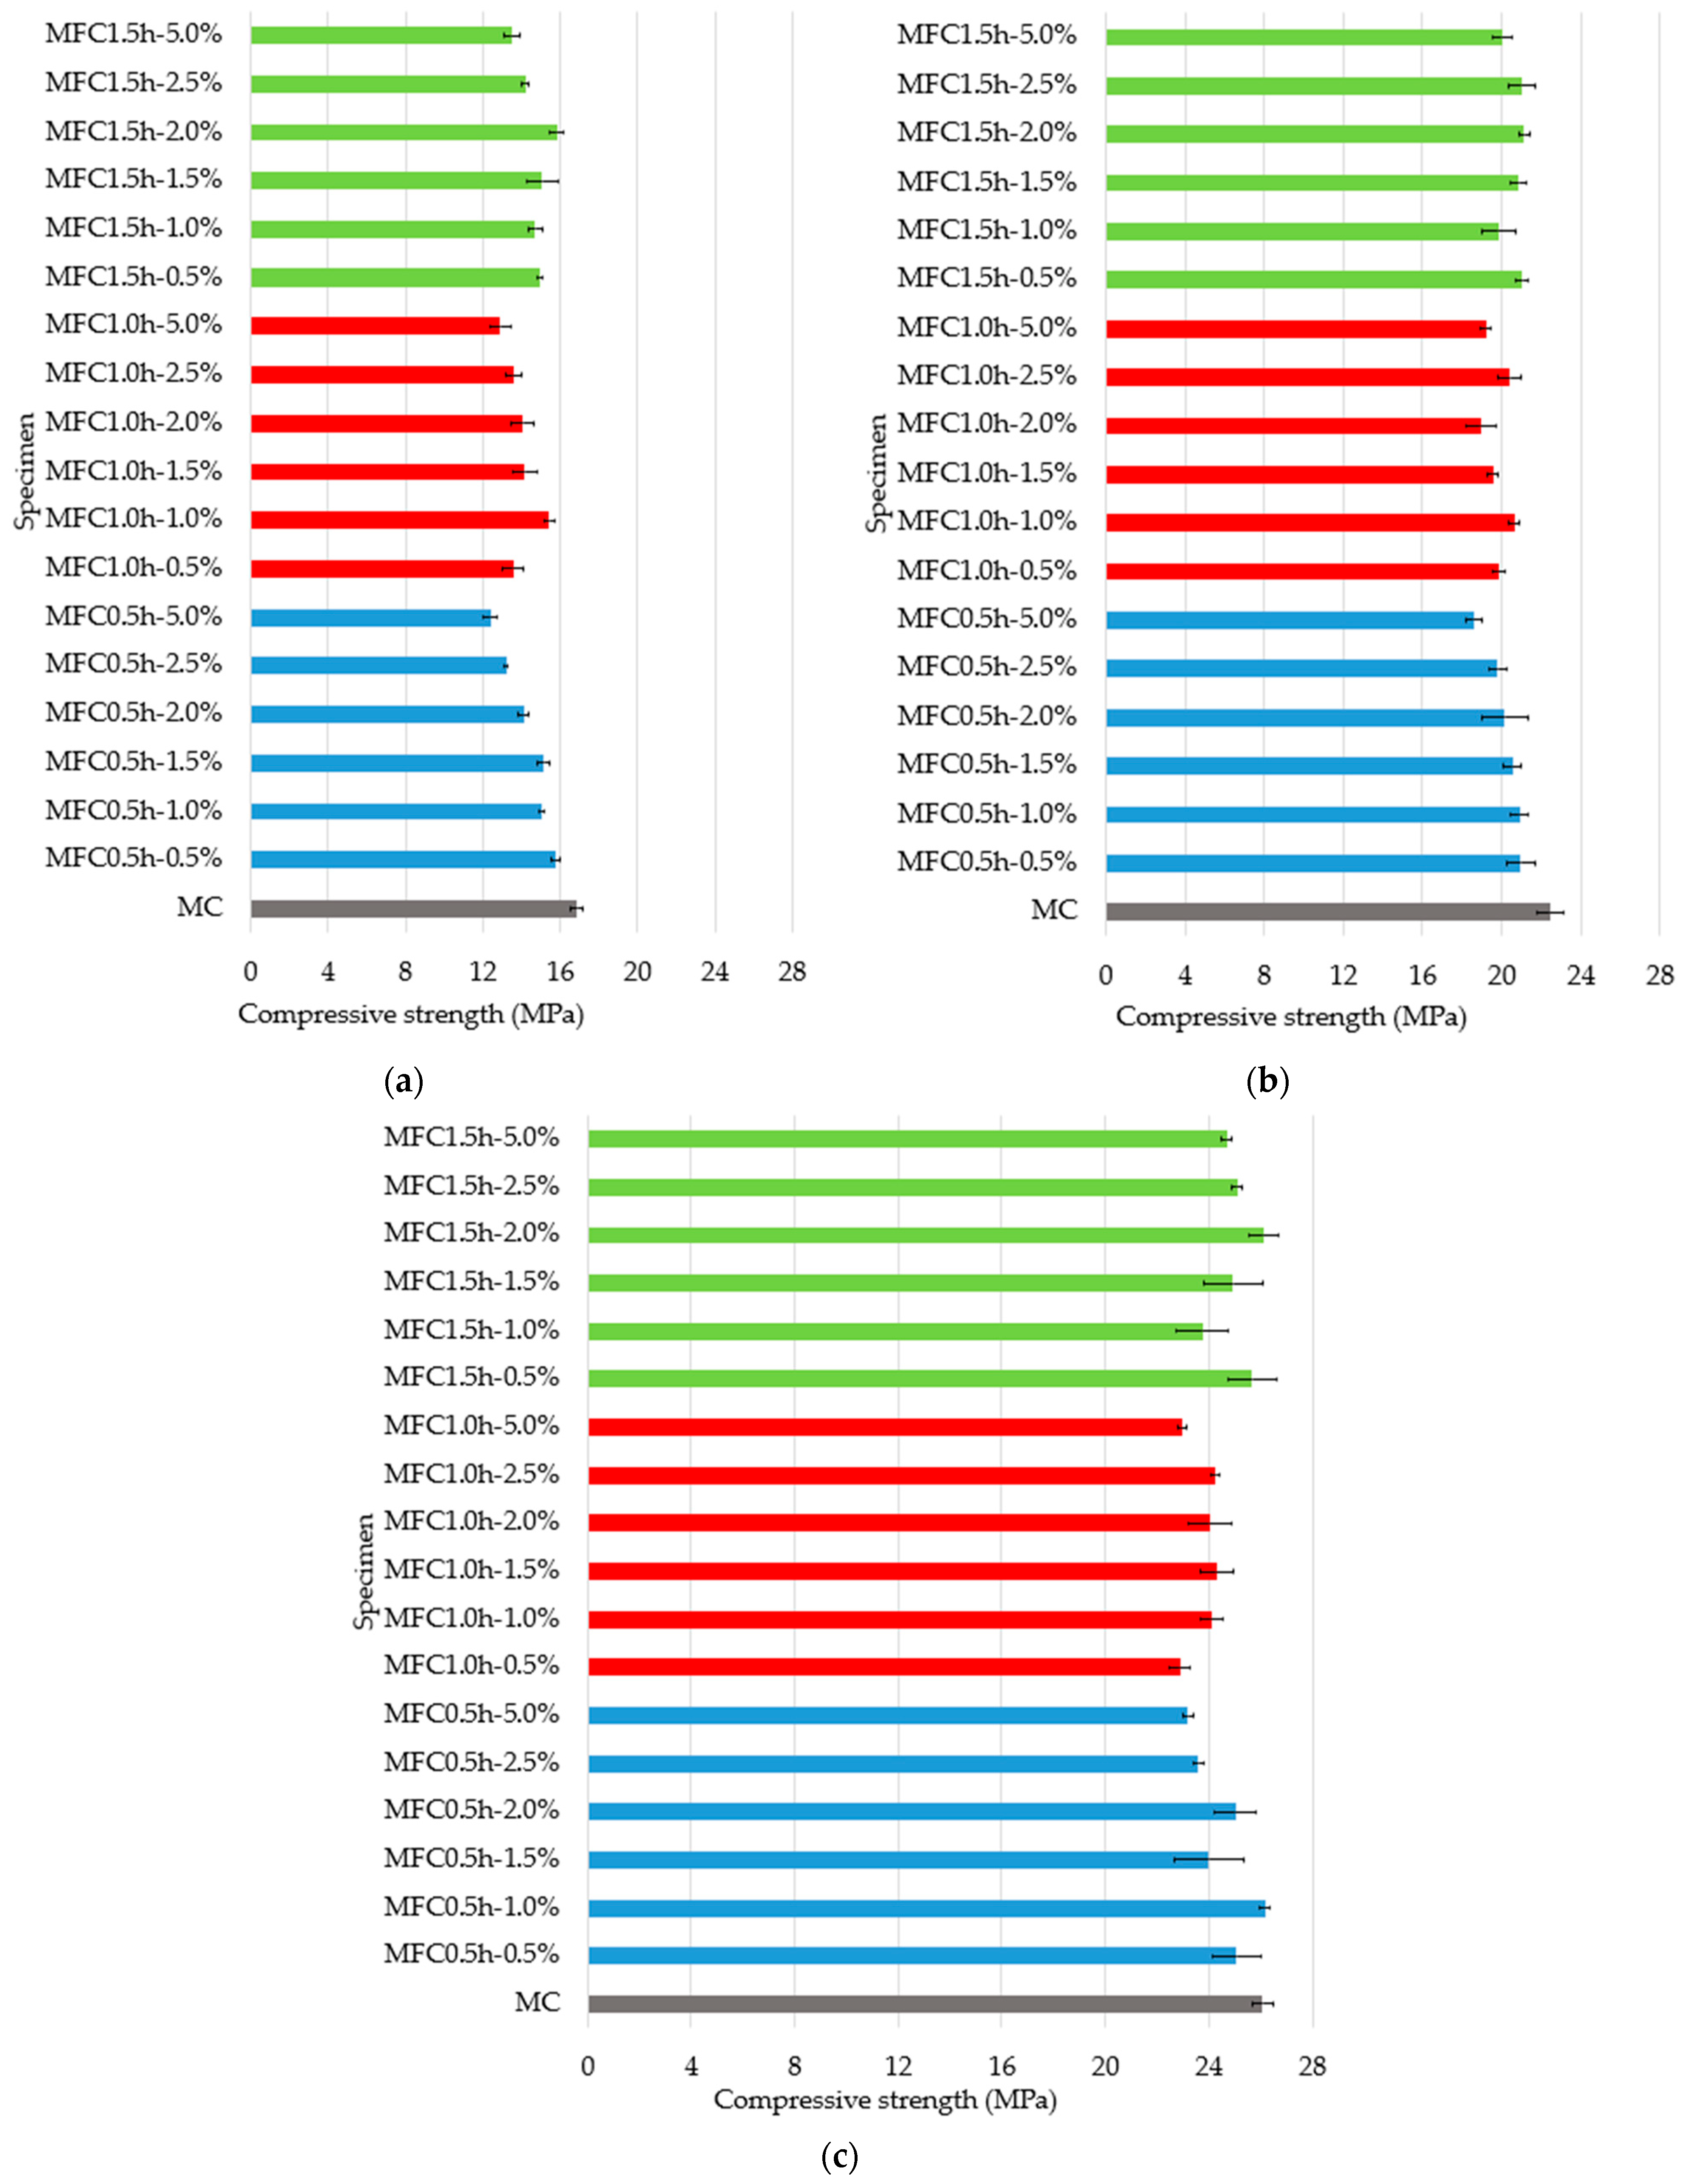
The compressive strength results at 7 days of age are presented in Figure 4a, at 14 days in Figure 4b, and at 28 days in Figure 4c. The control mortar (CM) had a strength of 26.08 MPa at 28 days, which we will use as a reference for the analysis.
Of all the combinations, only the MFC0.5h–1.0% and MFC1.5h–2.0% specimens slightly outperformed the control with 0.3% (26.16 MPa) and 0.1% (26.11 MPa), respectively. This suggests that low grinding and low filler proportions do not negatively affect strength and may even act as a complementary physical filler. Furthermore, longer grinding allows for more efficient filler dispersion, promoting matrix compaction.
Although certain formulations containing seashell filler showed lower compressive strengths than the reference mortar, the variations remained within a narrow range (<3 MPa), suggesting that the filler’s effect on the material’s load-bearing capacity is marginal and does not significantly compromise mechanical integrity after 28 days of curing. Two grinding processes (0.5 h or 1.0 h), combining low or intermediate filler proportions (0.5–1.5%), resulted in a less dense and mechanically less efficient matrix. This highlights the importance of optimizing filler processing (grinding) and dosage to ensure its incorporation has a positive effect.
Works such as that of Assaad and Saba [29] report that the seashell decreased the strength due to a dilution effect that reduces the content of the aluminoscylate precursor and, therefore, the formation of rigid bonds. On the other hand, González et al. [26] proposes that a decrease in strength is due to the distribution of particle size and texture of these, which influences the internal organization and interaction with the cement.
In all cases, filler levels of 2.5% and 5.0% decreased compressive strength compared to formulations containing 0.5% to 2.0%. The loss can exceed 0.75 to 1.55 MPa relative to the control, indicating a loss of matrix structural integrity. This demonstrates a clear penalizing effect of filler overdosing, regardless of the grinding level.
The compressive strength results can also be interpreted considering the particle size distribution presented in Table 2. The slightly higher strength observed for MFC0.5h–1.0% (26.16 MPa) suggests that coarser particles (D50 ≈ 0.383 mm) provide an adequate packing contribution without significantly increasing the specific surface area. In contrast, finer particles obtained at longer grinding times, such as 1.5 h (D50 ≈ 0.081 mm), only resulted in improved strength at moderate dosages (e.g., 2.0%), indicating that particle refinement enhances matrix densification when properly balanced. However, at higher filler contents (2.5% and 5.0%), the finest material led to strength reductions, which can be attributed to the significant increase in specific surface area associated with this level of fineness, which raises water demand and promotes particle agglomeration, negatively affecting matrix continuity and load transfer capacity. These results confirm that the effect of grinding time on compressive strength depends on achieving a balance between particle size (from D50 ≈ 0.383 mm to 0.081 mm), surface area, and filler dosage.

3.4. Microscopic Morphology Analysis

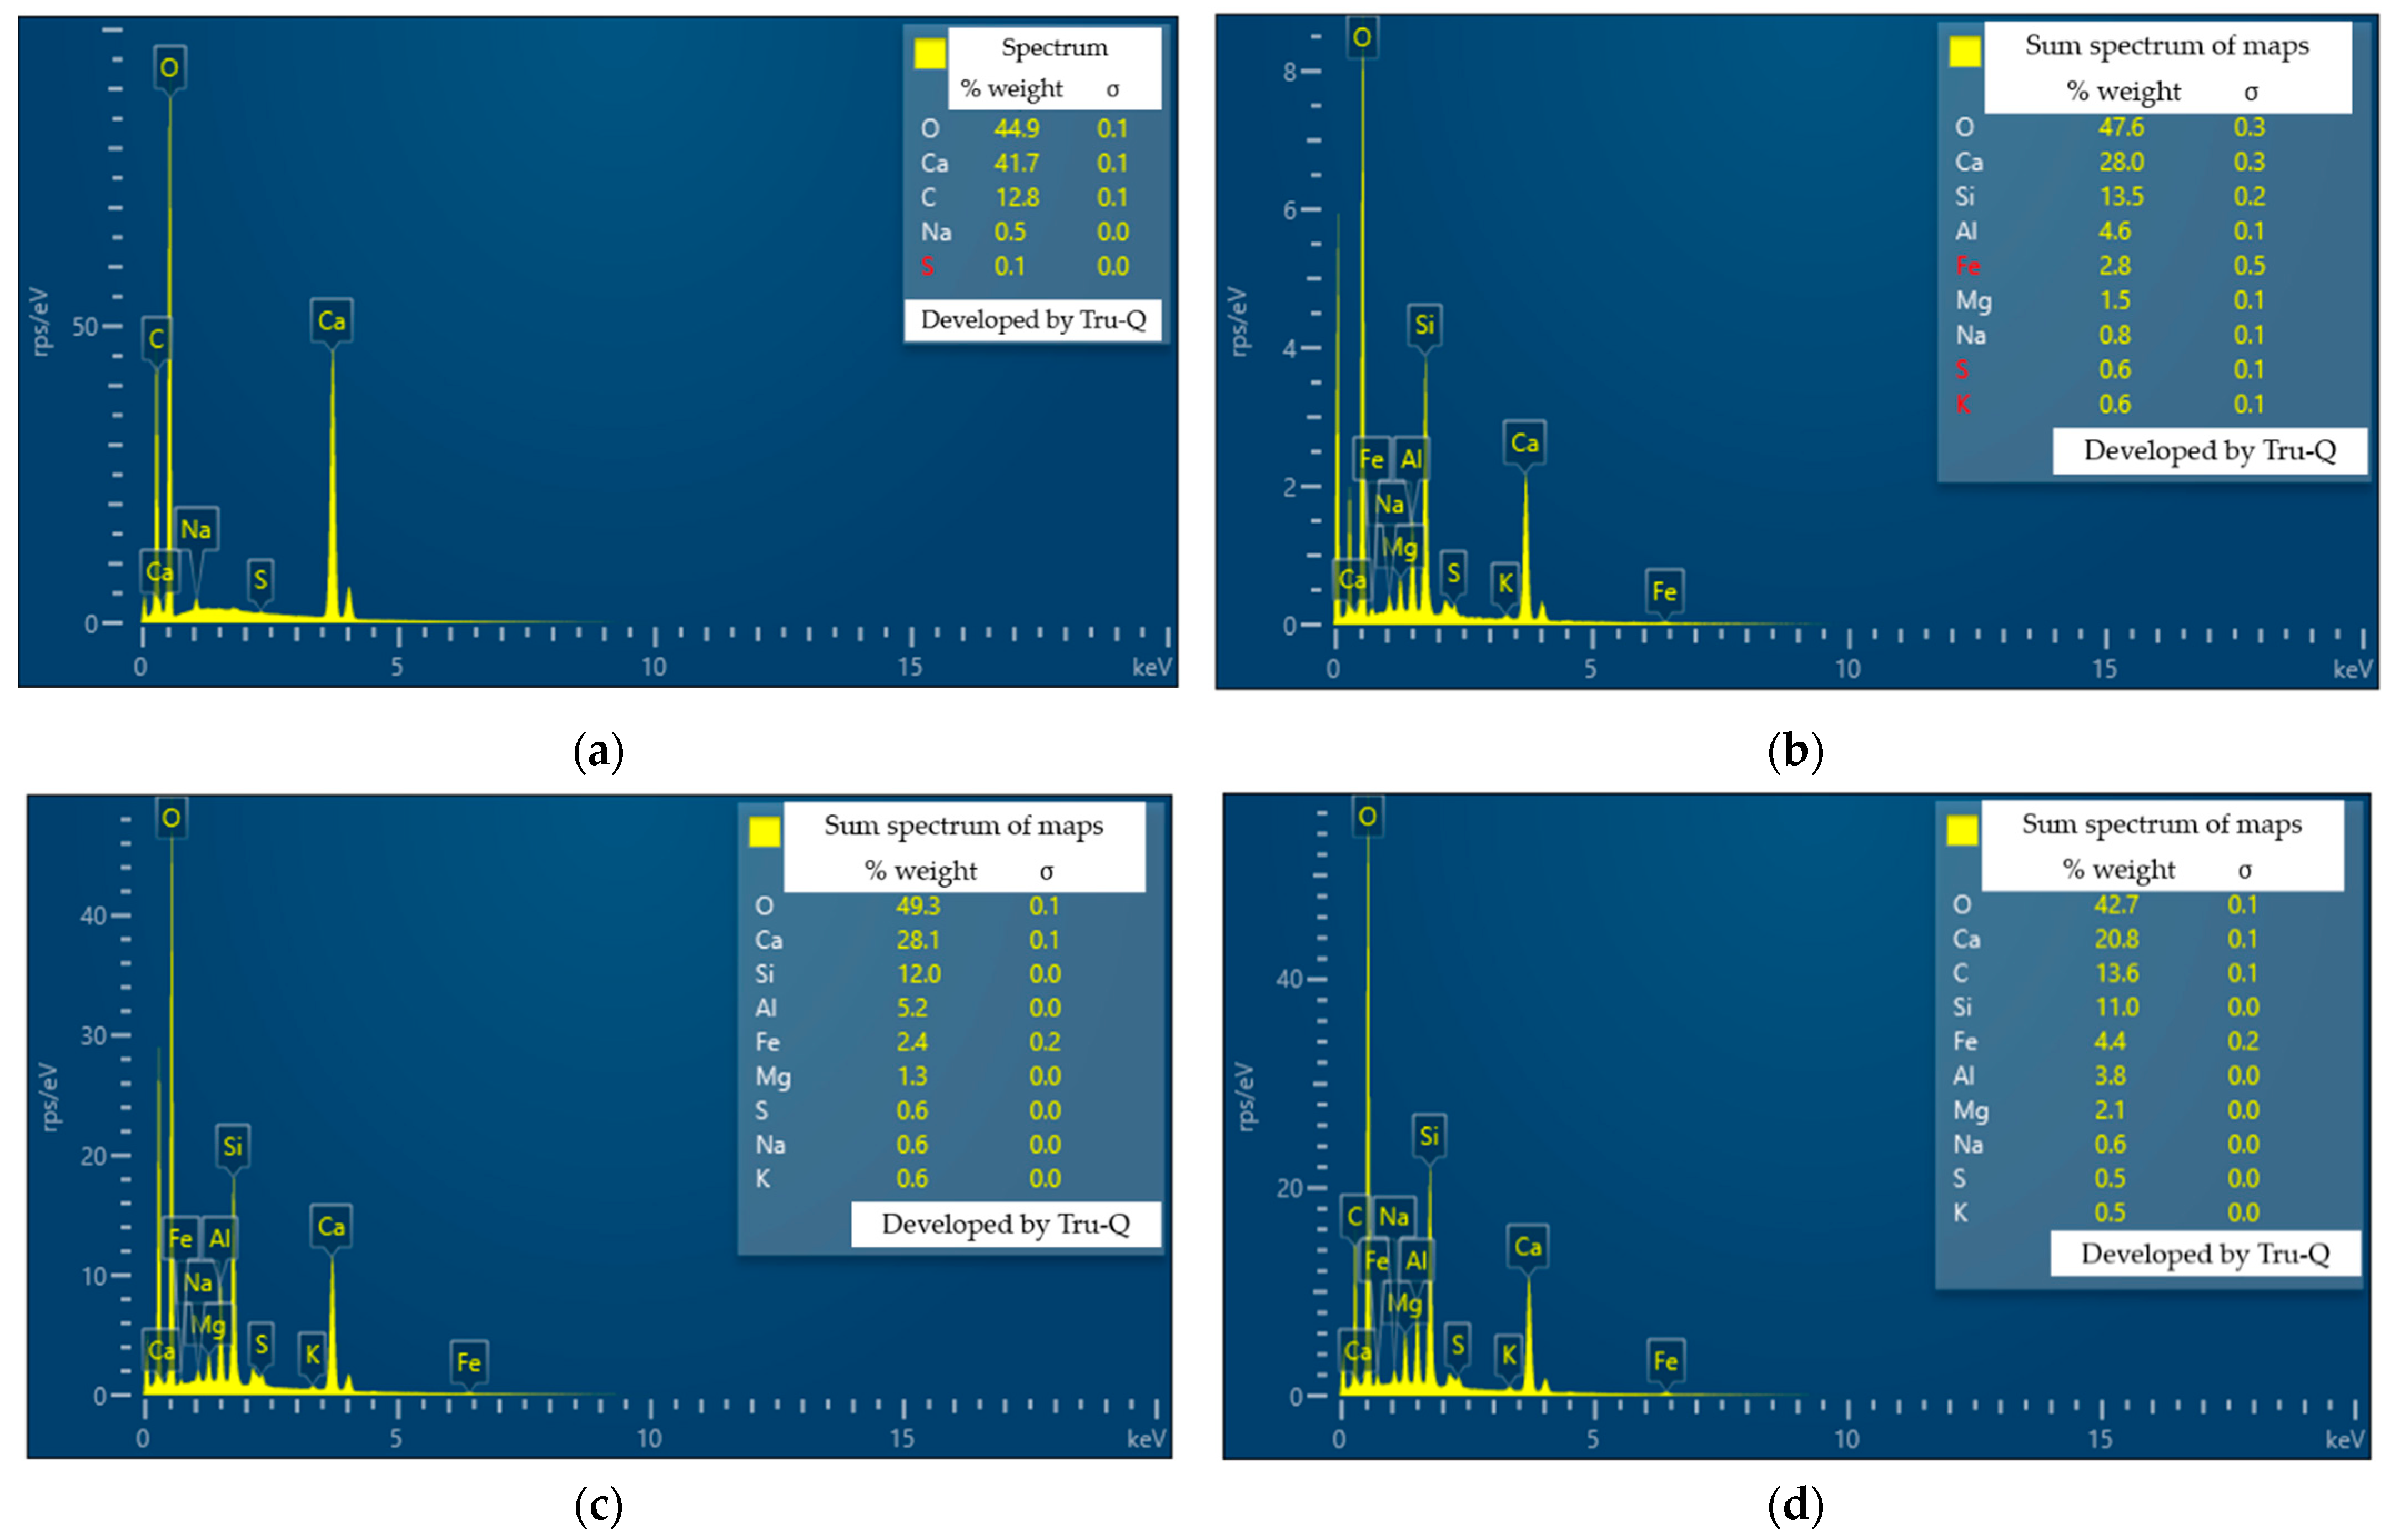
Energy dispersive X-ray spectroscopy (EDX) analysis was performed on clam shell powder (C), control specimen powder (MC), and 1 h milled specimen powder with 2.5% (MFC1.0h–2.5%) and 5% (MFC1.0h–5.0%) filler and is presented in Figure 5. The analysis performed on the clam shell powder presented in Figure 5a revealed an elemental composition dominated by oxygen (44.9%) and calcium (41.7%), consistent with the majority presence of calcium carbonate (CaCO3) [28], a typical structural component of marine biogenic materials. In addition, a significant carbon content (12.8%) was detected, reinforcing the presence of the carbonate group in the matrix. Trace elements such as sodium (0.5%) and sulfur (0.1%) were also identified, possibly associated with soluble salts or traces of natural organic compounds. The high proportion of Ca and O, along with C, confirms the material’s suitability as a source of mineral filler with cementing potential or as an inert filler in cementitious applications or ecological mortars.
The EDX spectrum of the control specimen reveals an elemental composition dominated by oxygen (47.6%) and calcium (28.0%) [26], followed by silicon (13.5%) and aluminum (4.6%), which is characteristic of hydrated cementitious matrices where phases such as C-S-H (hydrated calcium silicate) and calcium aluminates predominate according to Figure 5a. Minor levels of iron (2.8%) and magnesium (1.5%) were also detected, which could be associated with mineral impurities or the original composition of the clinker. Trace elements such as sodium, sulfur, and potassium (0.6–0.8%) reinforce the presence of typical components of Portland cement.
EDX analysis of specimen MFC1.0h–2.5% in Figure 5b reveals a composition rich in oxygen (49.3%) and calcium (28.1%), confirming the significant presence of calcium carbonate (CaCO3) [26], contributed by the addition of marine shell. Relevant amounts of silica (12.0%) and alumina (5.2%), typical components of the hydrated cementitious matrix (C-S-H and hydrated calcium alumina), are also observed. The presence of iron (2.4%), magnesium (1.3%) and traces of sodium, sulfur and potassium (all at 0.6%) indicates a heterogeneous mineralogical composition consistent with supplementary cementitious materials.
Similarly, EDX analysis of specimen MFC1.0h–5.0% shows a chemical composition dominated by oxygen (42.7%) and calcium (20.8%), indicating the significant presence of calcium carbonate from the seashell filler [26]. It also highlights a notable carbon content (13.6%), higher than other formulations with a lower seashell dosage, reinforcing the influence of biogenic material. Silica (11.0%) and alumina (3.8%) are also identified, essential elements of the hydrated cementitious matrix. The presence of iron (4.4%) and magnesium (2.1%), along with traces of sodium, sulfur, and potassium, suggests a complex mineral composition, possibly related to the clinker and secondary hydration products.
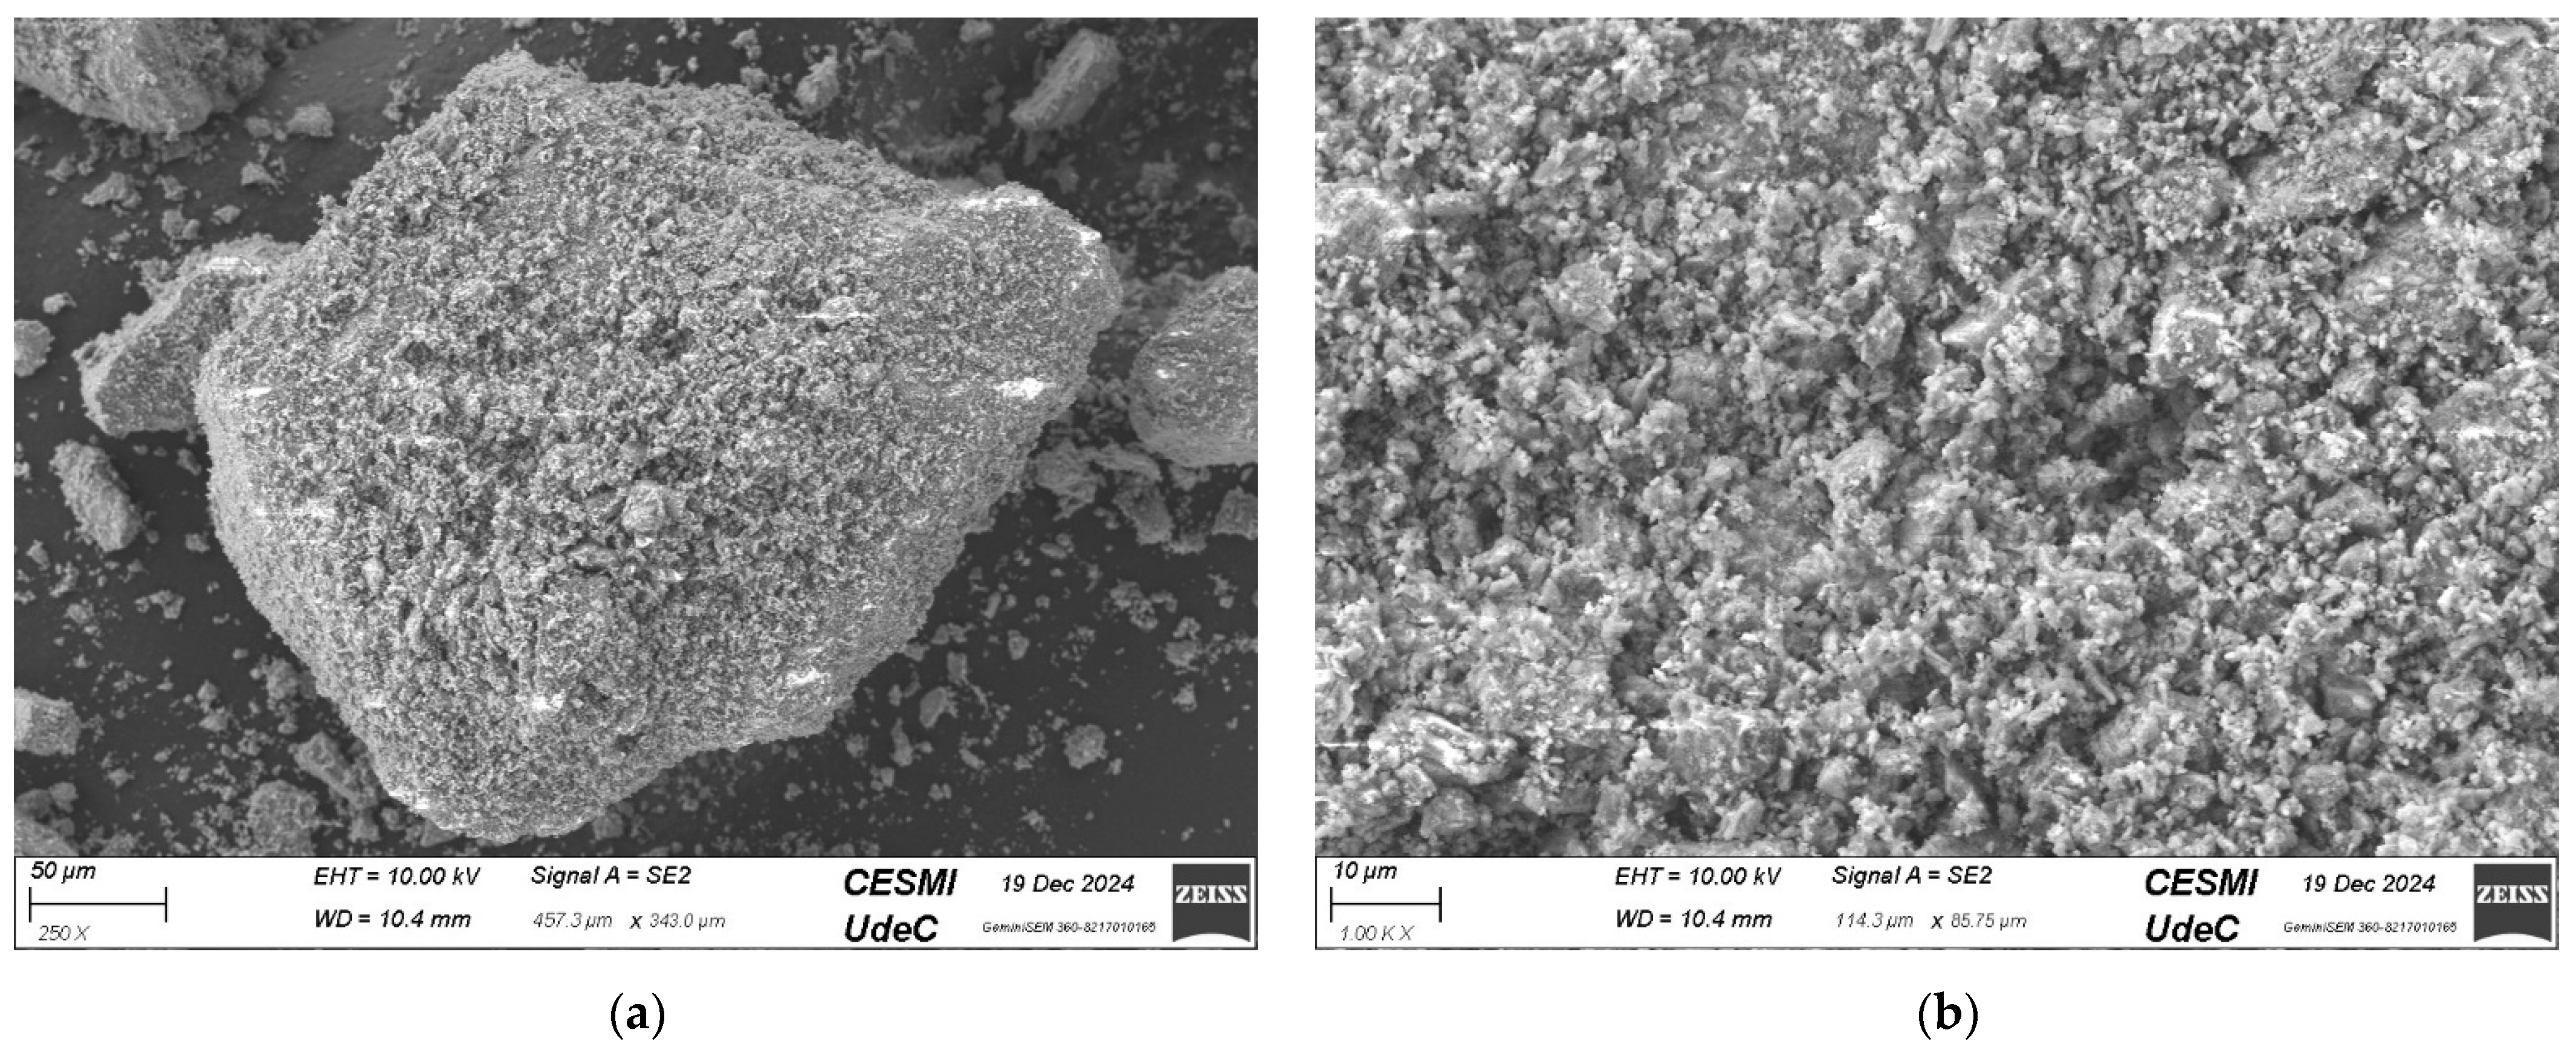
SEM images of the clam sample are presented in Figure 6. First, Figure 6a shows a clam particle with an irregular morphology, its surface covered by fine agglomerated particles, suggesting a complex and highly rough structure. Surface microfractures and interstitial pores are observed, as well as smaller fragments dispersed in the surroundings, a product of the grinding process. This topography indicates that the particle has a high specific surface area, which may favor its interaction with the cementitious matrix by acting as a nucleation center for hydration products or as a physical filler [26]. However, its high porosity and roughness could also increase the water demand in fresh mixtures, affecting workability. On the other hand, Figure 6b shows the same clam particle at a magnification of 1000×. Its microstructure is heterogeneous, composed of particles with irregular geometry and angular edges, with sizes ranging from a few micrometers to tens of microns. A predominantly rough texture is observed, with evidence of fractures and broken surfaces, consistent with a mechanical grinding process. In addition, groups of finer particles adhered to larger structures are distinguished, suggesting a tendency toward agglomeration. This morphology favors its behavior as a physical filler in cementitious matrices, facilitating pore filling and improving system compaction, although its rough surface could also imply greater water demand in fresh mixtures.
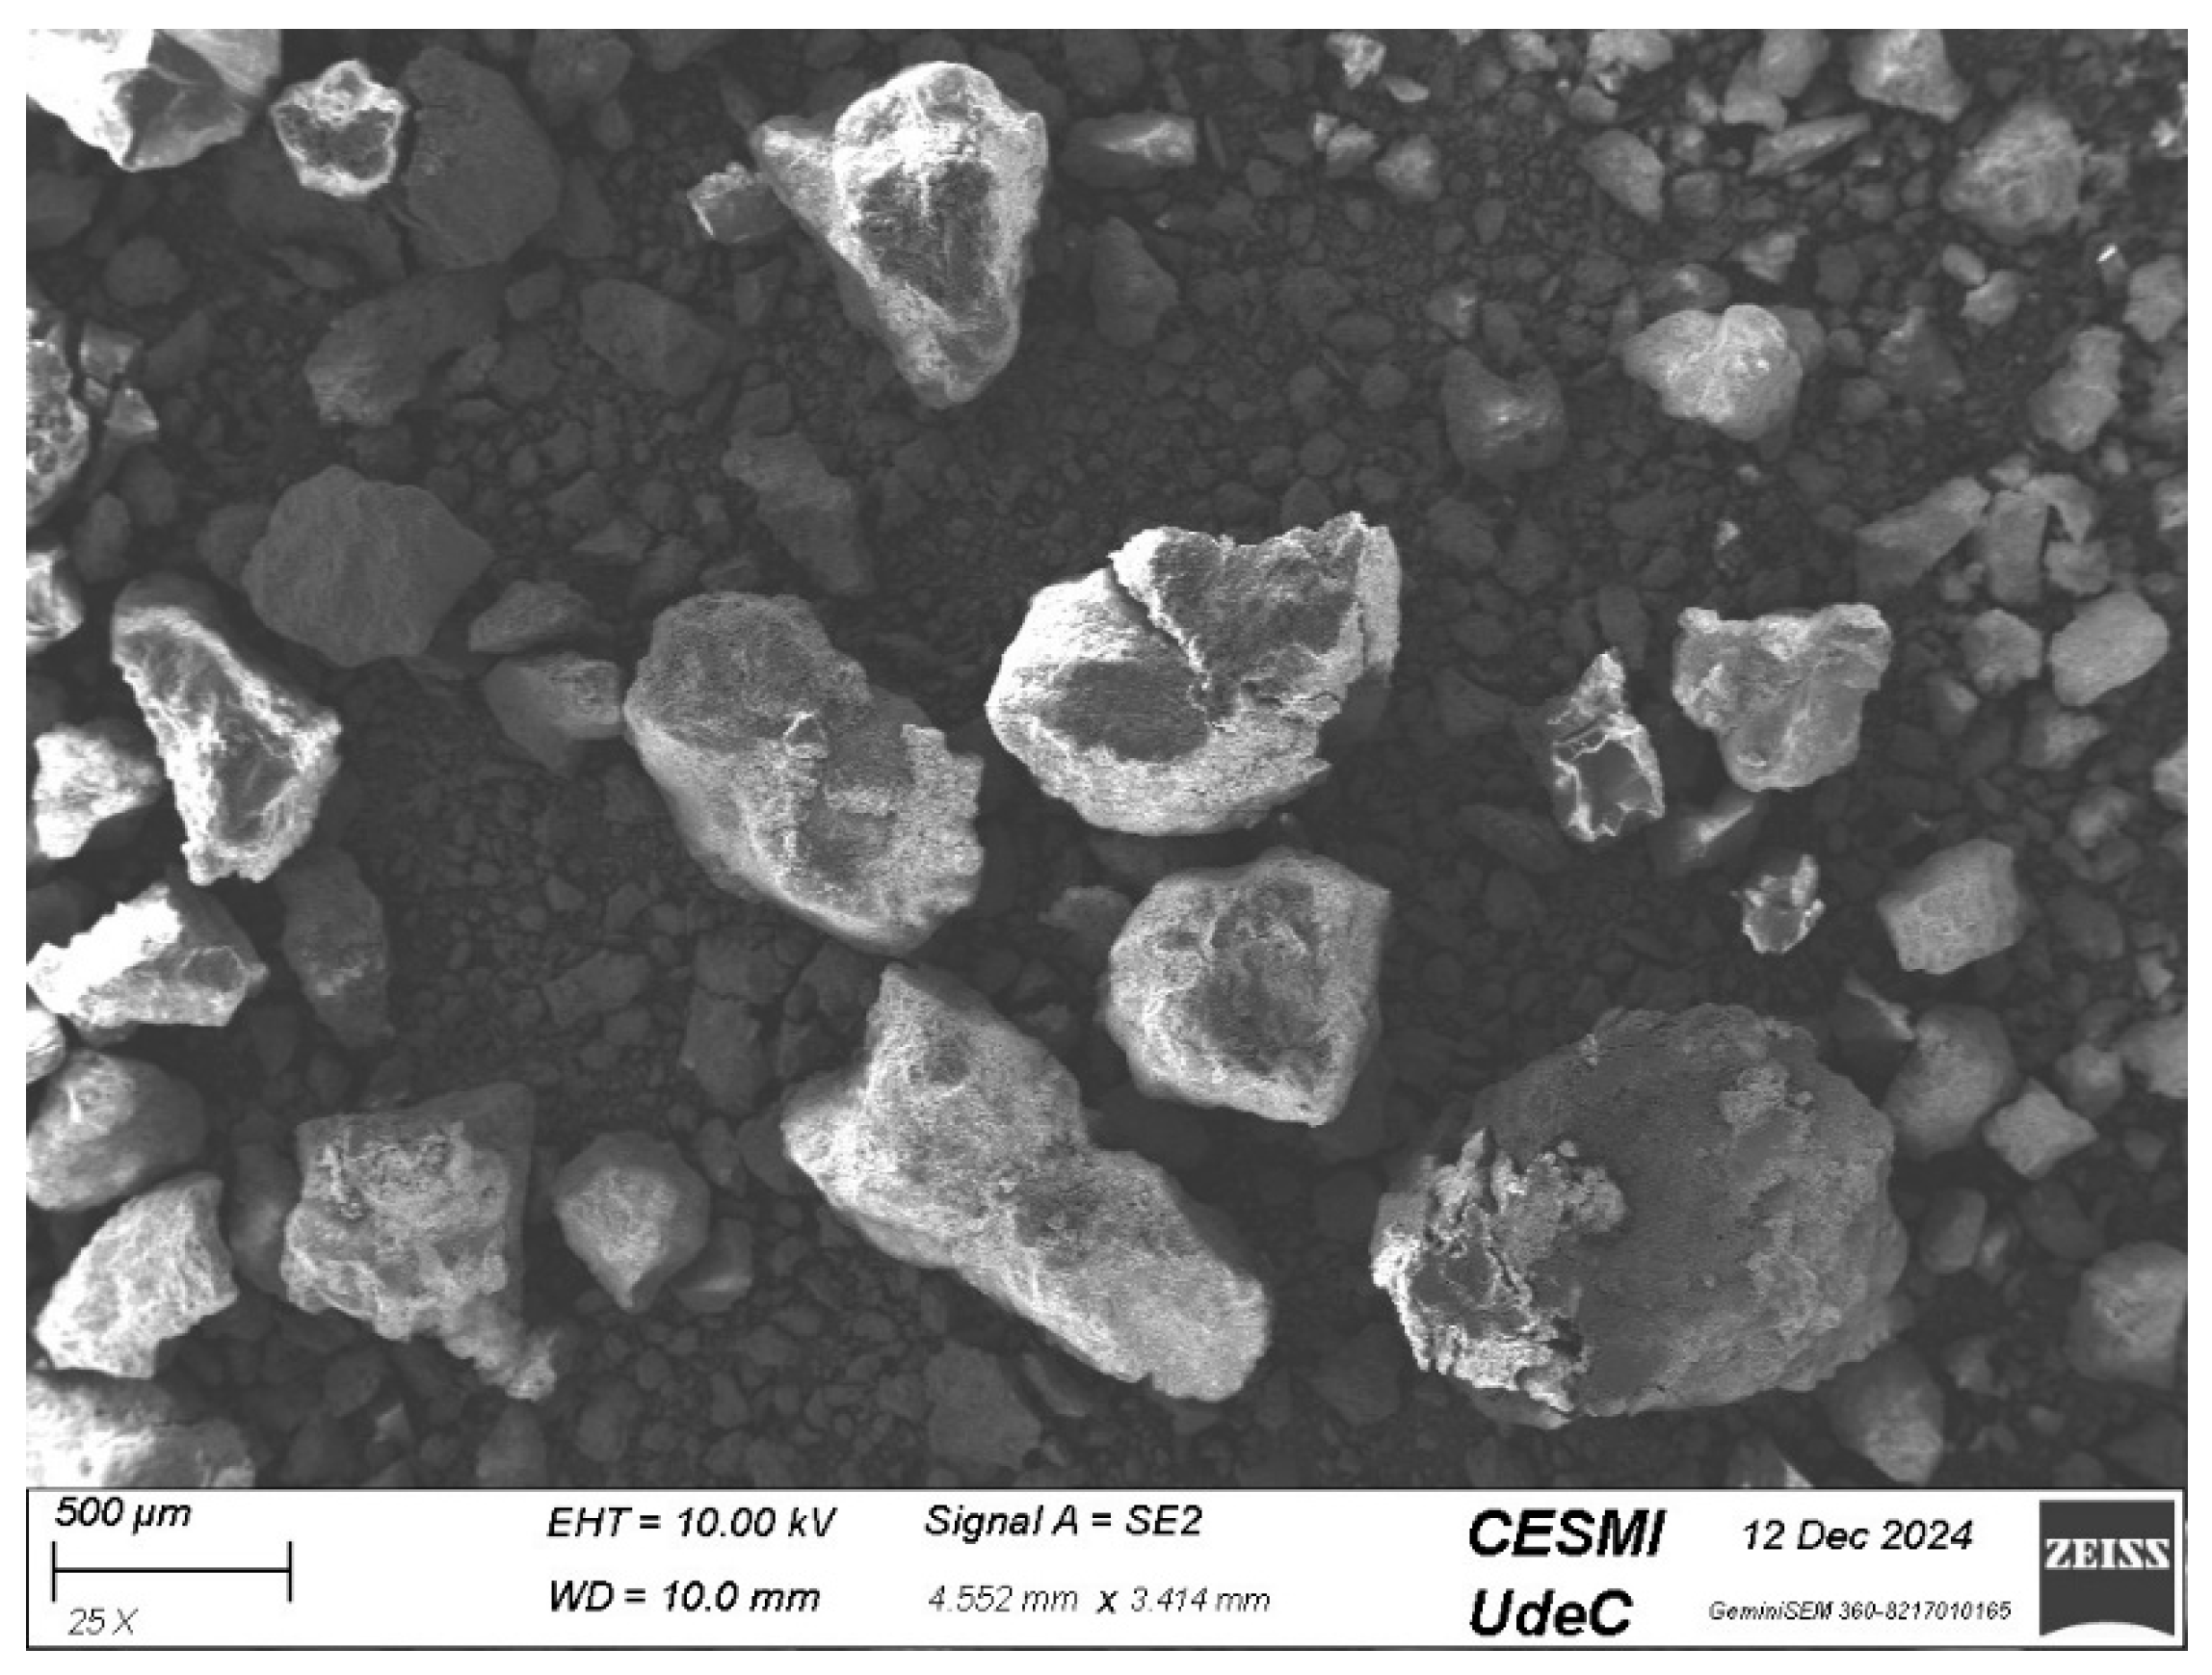
The SEM image in Figure 7 shows the general morphology of the powder belonging to the control sample (MC), composed exclusively of materials from the conventional cementitious system. At this low magnification (25×), medium to coarse particles are observed, with dimensions exceeding 500 µm, with angular and irregular shapes, typical of crushed or incompletely hydrated mineral components. The surface of the particles is more compact and continuous compared to those observed in samples with seashell, and is distinguished by the absence of fine aggregates or secondary coatings. Furthermore, the particulate environment lacks the surface agglomeration present in samples with biogenic filler, indicating lower overall roughness and low surface porosity. This structure suggests more predictable and stable behavior from the perspective of workability and densification.
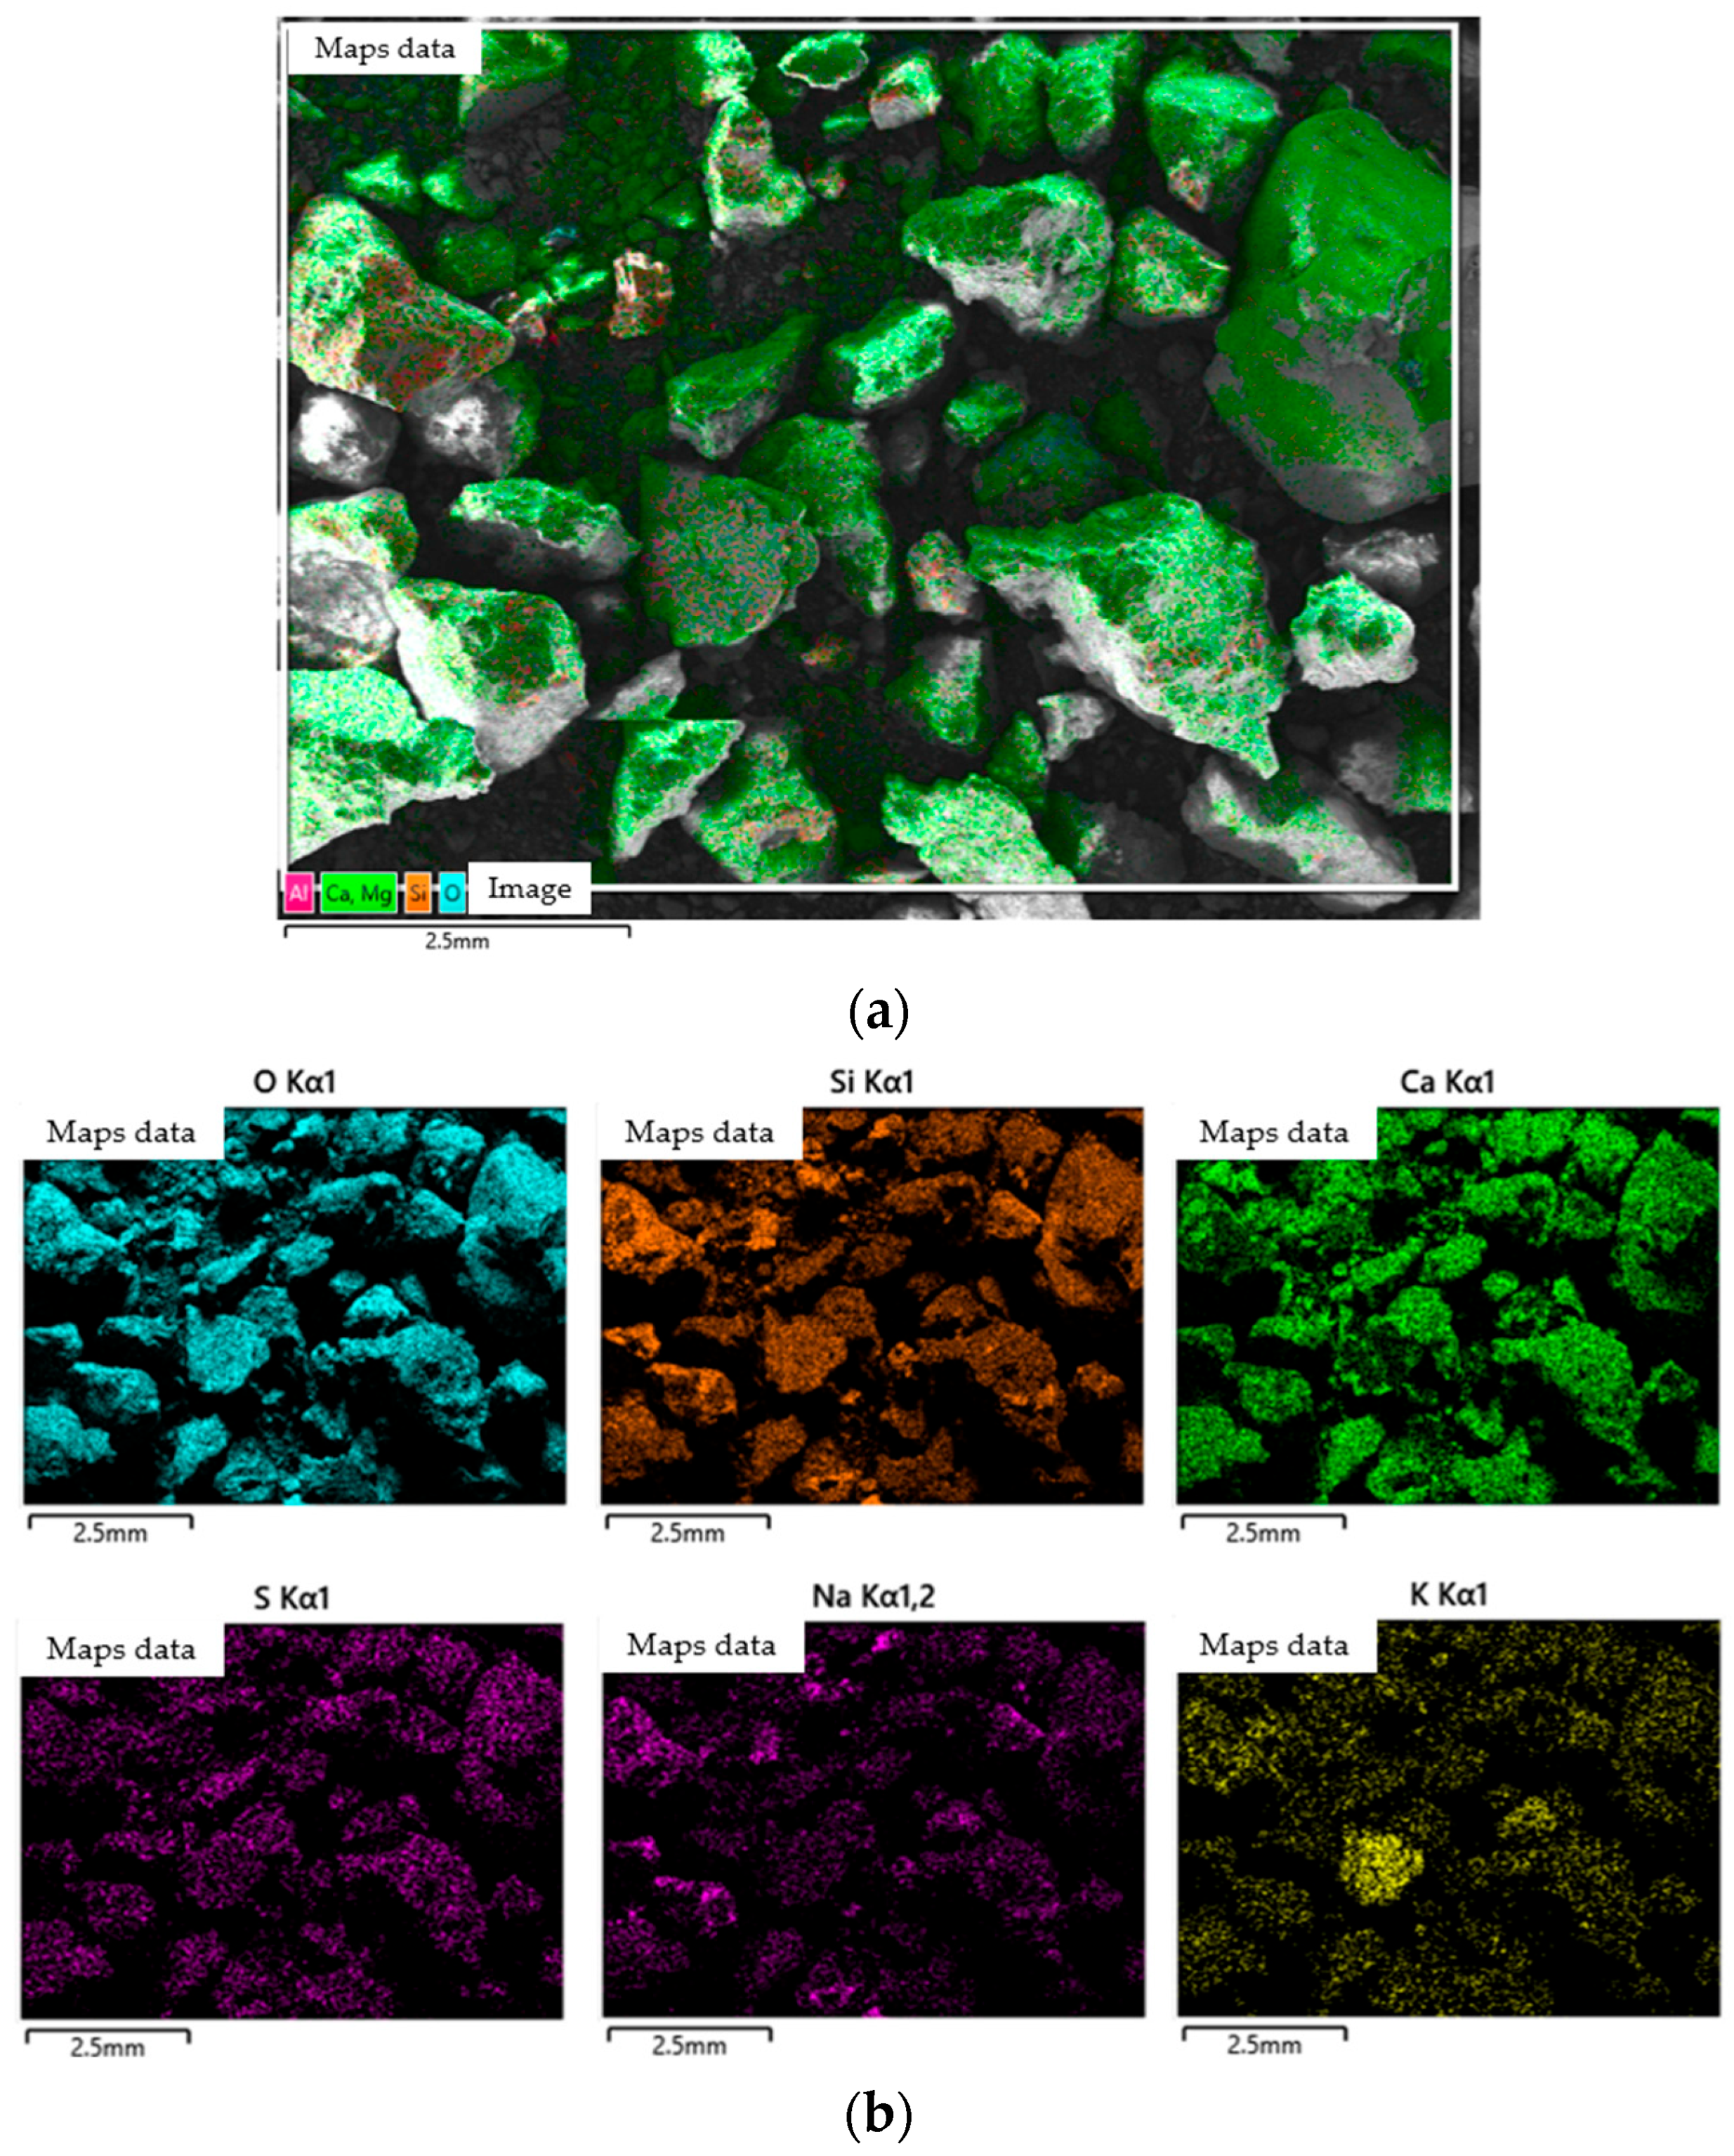
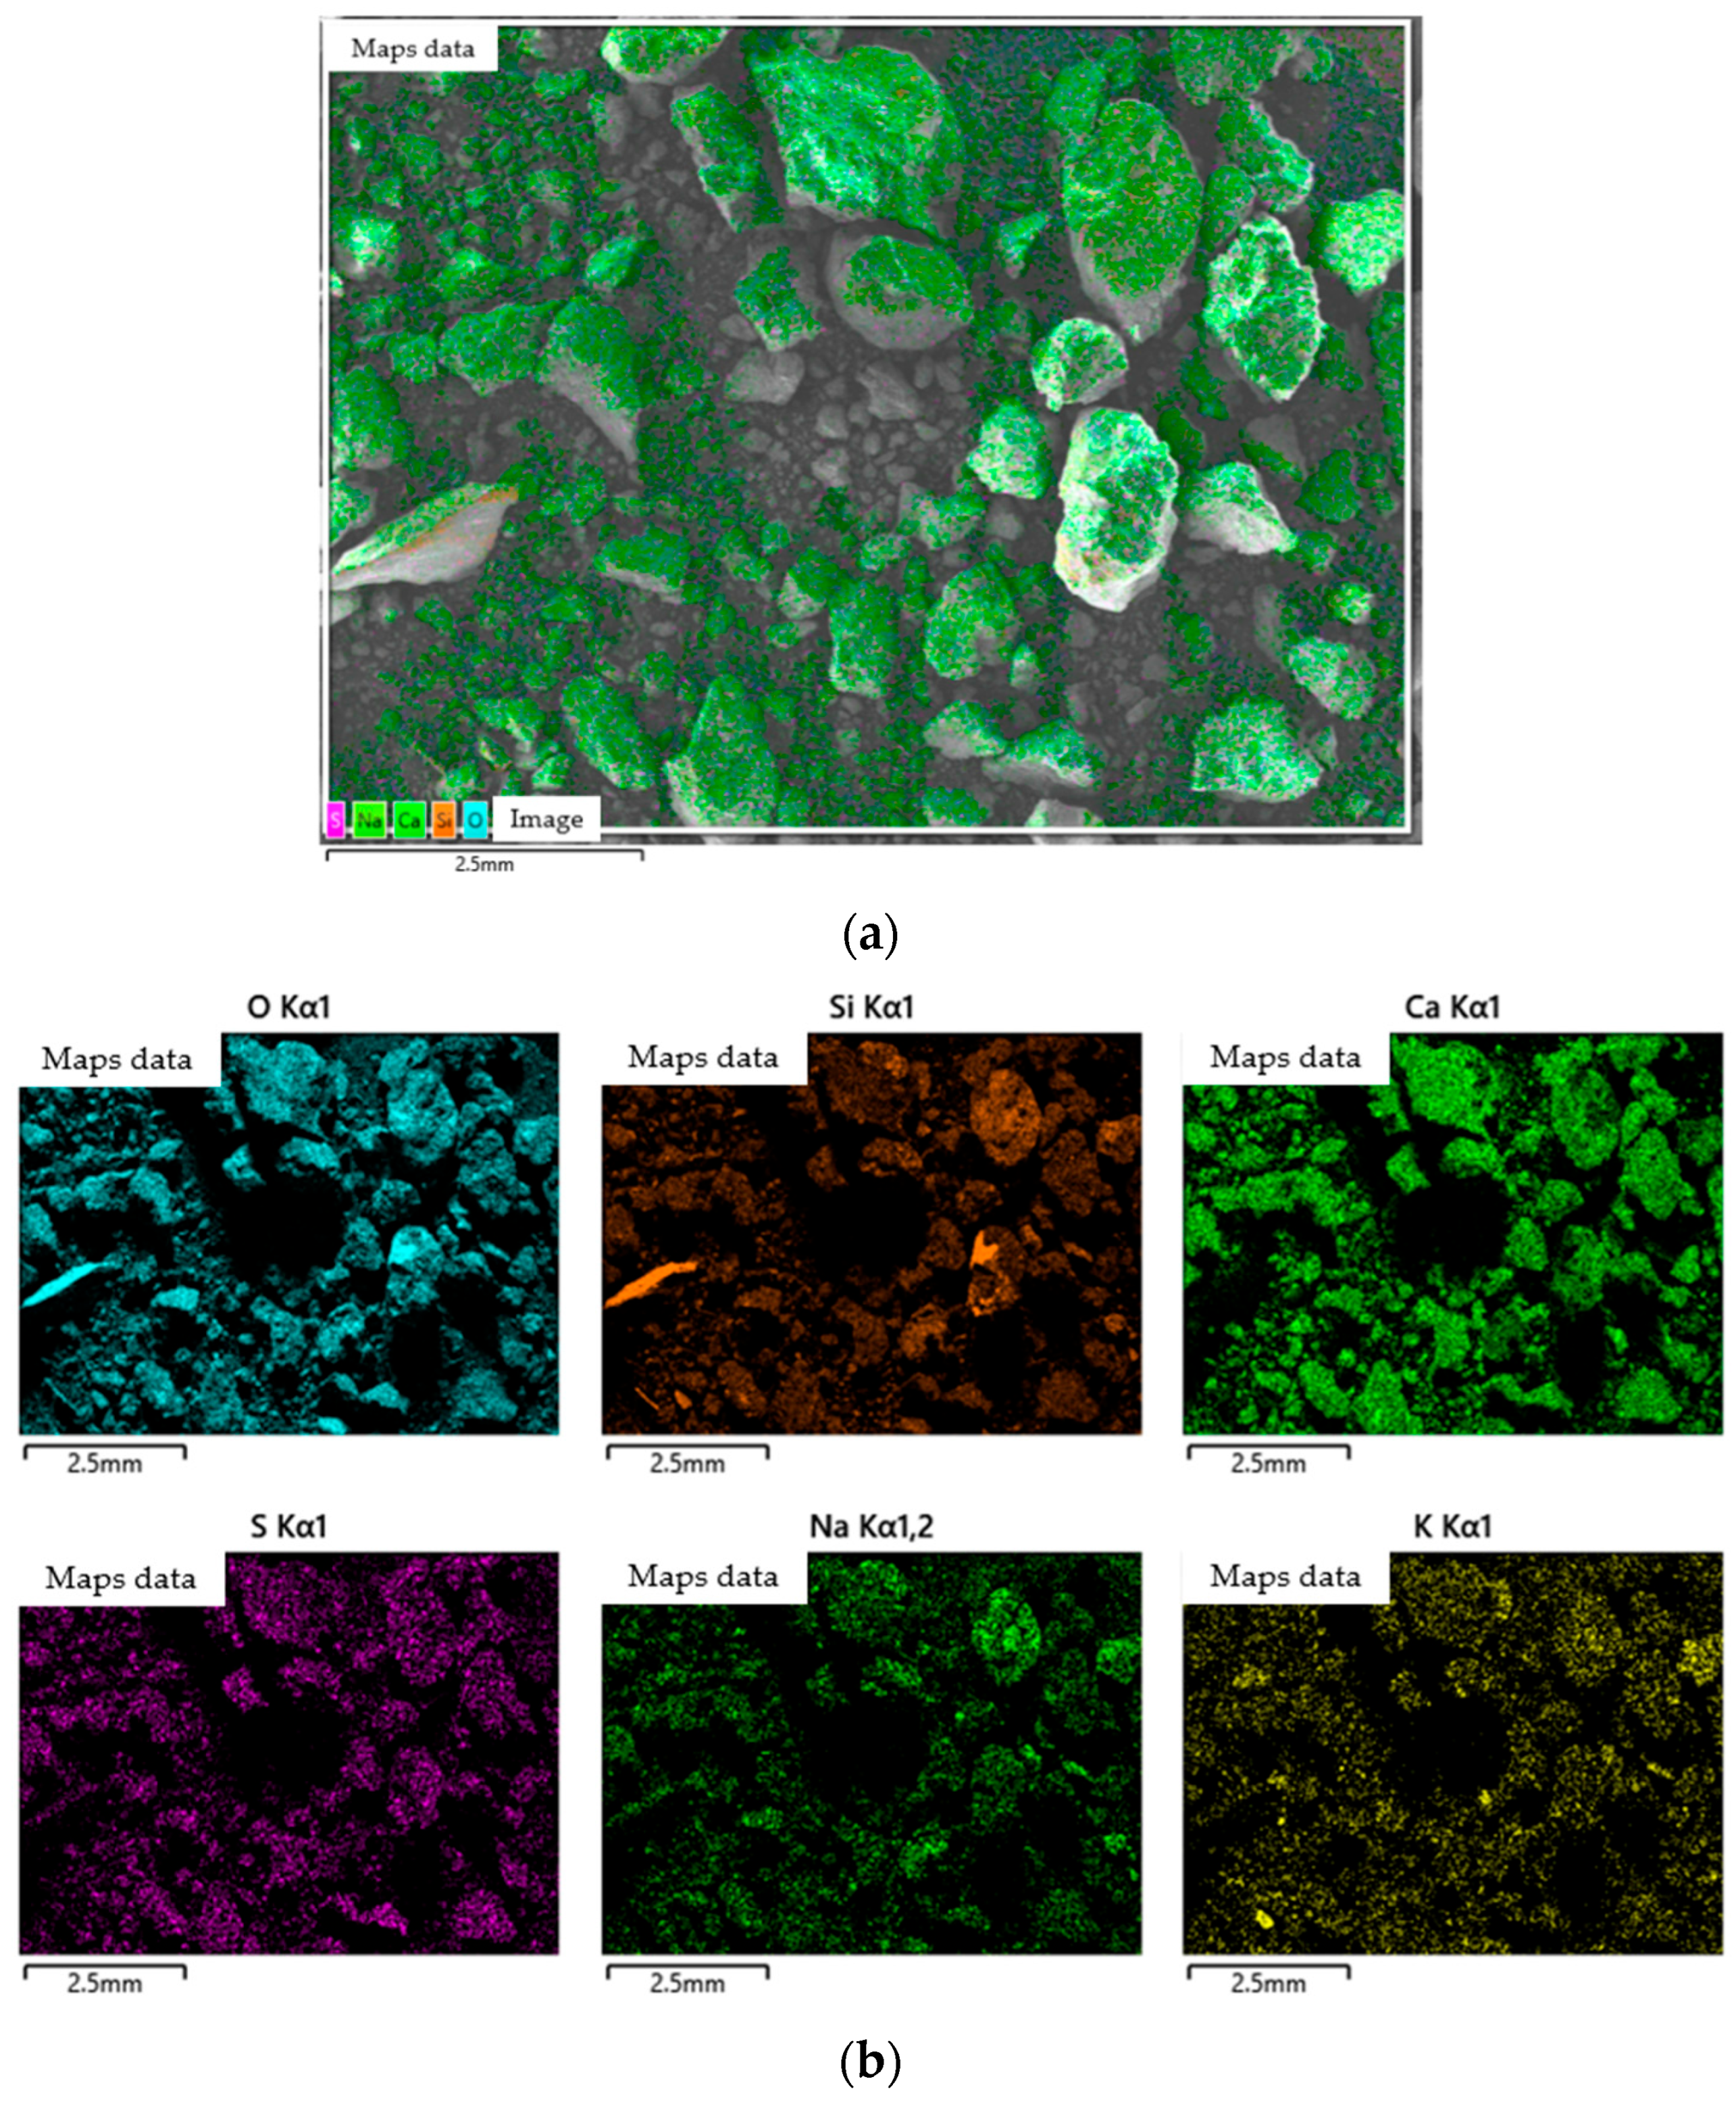
Figure 8 shows the spatial distribution of the main elements detected on the surface of the MFC1.0h–2.5% powder sample by EDX, superimposed on the SEM micrograph. Figure 8a shows that calcium (Ca, in green) is widely distributed over the surface of the larger particles, while elements such as sodium (Na), sulfur (S), silicon (Si), and oxygen (O) appear more dispersed or in specific areas. This visualization corroborates the integration of the seashell filler in the matrix, showing a compositional heterogeneity consistent with the incorporation of biogenic and cementitious material. Figure 8b presents the individual distribution maps of the elements O, Si, Ca, S, Na, and K. The Ca map confirms its predominance over the larger particles, while silicon (Si) appears more homogeneously distributed, reflecting its origin in the cementitious phases (such as C-S-H). Overall, the maps show good dispersion of the filler and allow us to infer that its incorporation does not generate relevant chemical segregations, which supports its potential as a complementary mineral addition.
Figure 9 shows the analysis performed on sample MFC1.0h–5.0%. Figure 9a shows the SEM micrograph on which the elemental mapping of the main elements detected has been superimposed: calcium (Ca, in green), magnesium (Mg, in red), silicon (Si, in pink), and oxygen (O, in cyan). The calcium signal appears very abundantly distributed over the surfaces of the larger particles, demonstrating the strong presence of the calcium carbonate-rich seashell filler. Unlike the 2.5% sample, greater Ca coverage of the matrix is observed here, indicating a higher relative proportion of the filler. Magnesium and silicon appear with lower intensity and in more discrete areas, while oxygen shows a generalized distribution. This visualization suggests a more dominant interaction of the filler within the matrix, although with a possible tendency toward surface agglomeration.
On the other hand, Figure 9b shows the maps of the elements O, Si, Ca, S, Na and K. Calcium (Ca) is the most dominant component, with a dense and continuous distribution, reflecting the abundance of the calcareous filler. Compared to the MFC1.0h–2.5% sample, the Ca signal is observed to dominate more clearly, suggesting a greater surface coverage of carbonate-rich particles.

3.5. Statistical Analysis Results

A multifactor ANOVA was conducted to assess the effects of grinding time (hours) and filler percentage on the compressive strength (MPa) of the mortars. This analysis evaluates the statistical significance of the main factors and quantifies their relative contribution to the variability of compressive strength (MPa) in the system (see Table 5).
Both factors exhibit a statistically significant effect at the 95% confidence level. Grinding time shows a highly significant influence (F = 9.70, p = 0.0002), whereas filler percentage also presents a significant, although less pronounced, effect (F = 2.62, p = 0.0322). The higher sum of squares associated with grinding time indicates that this factor accounts for a larger proportion of the total variability, highlighting its dominant role in controlling compressive strength.
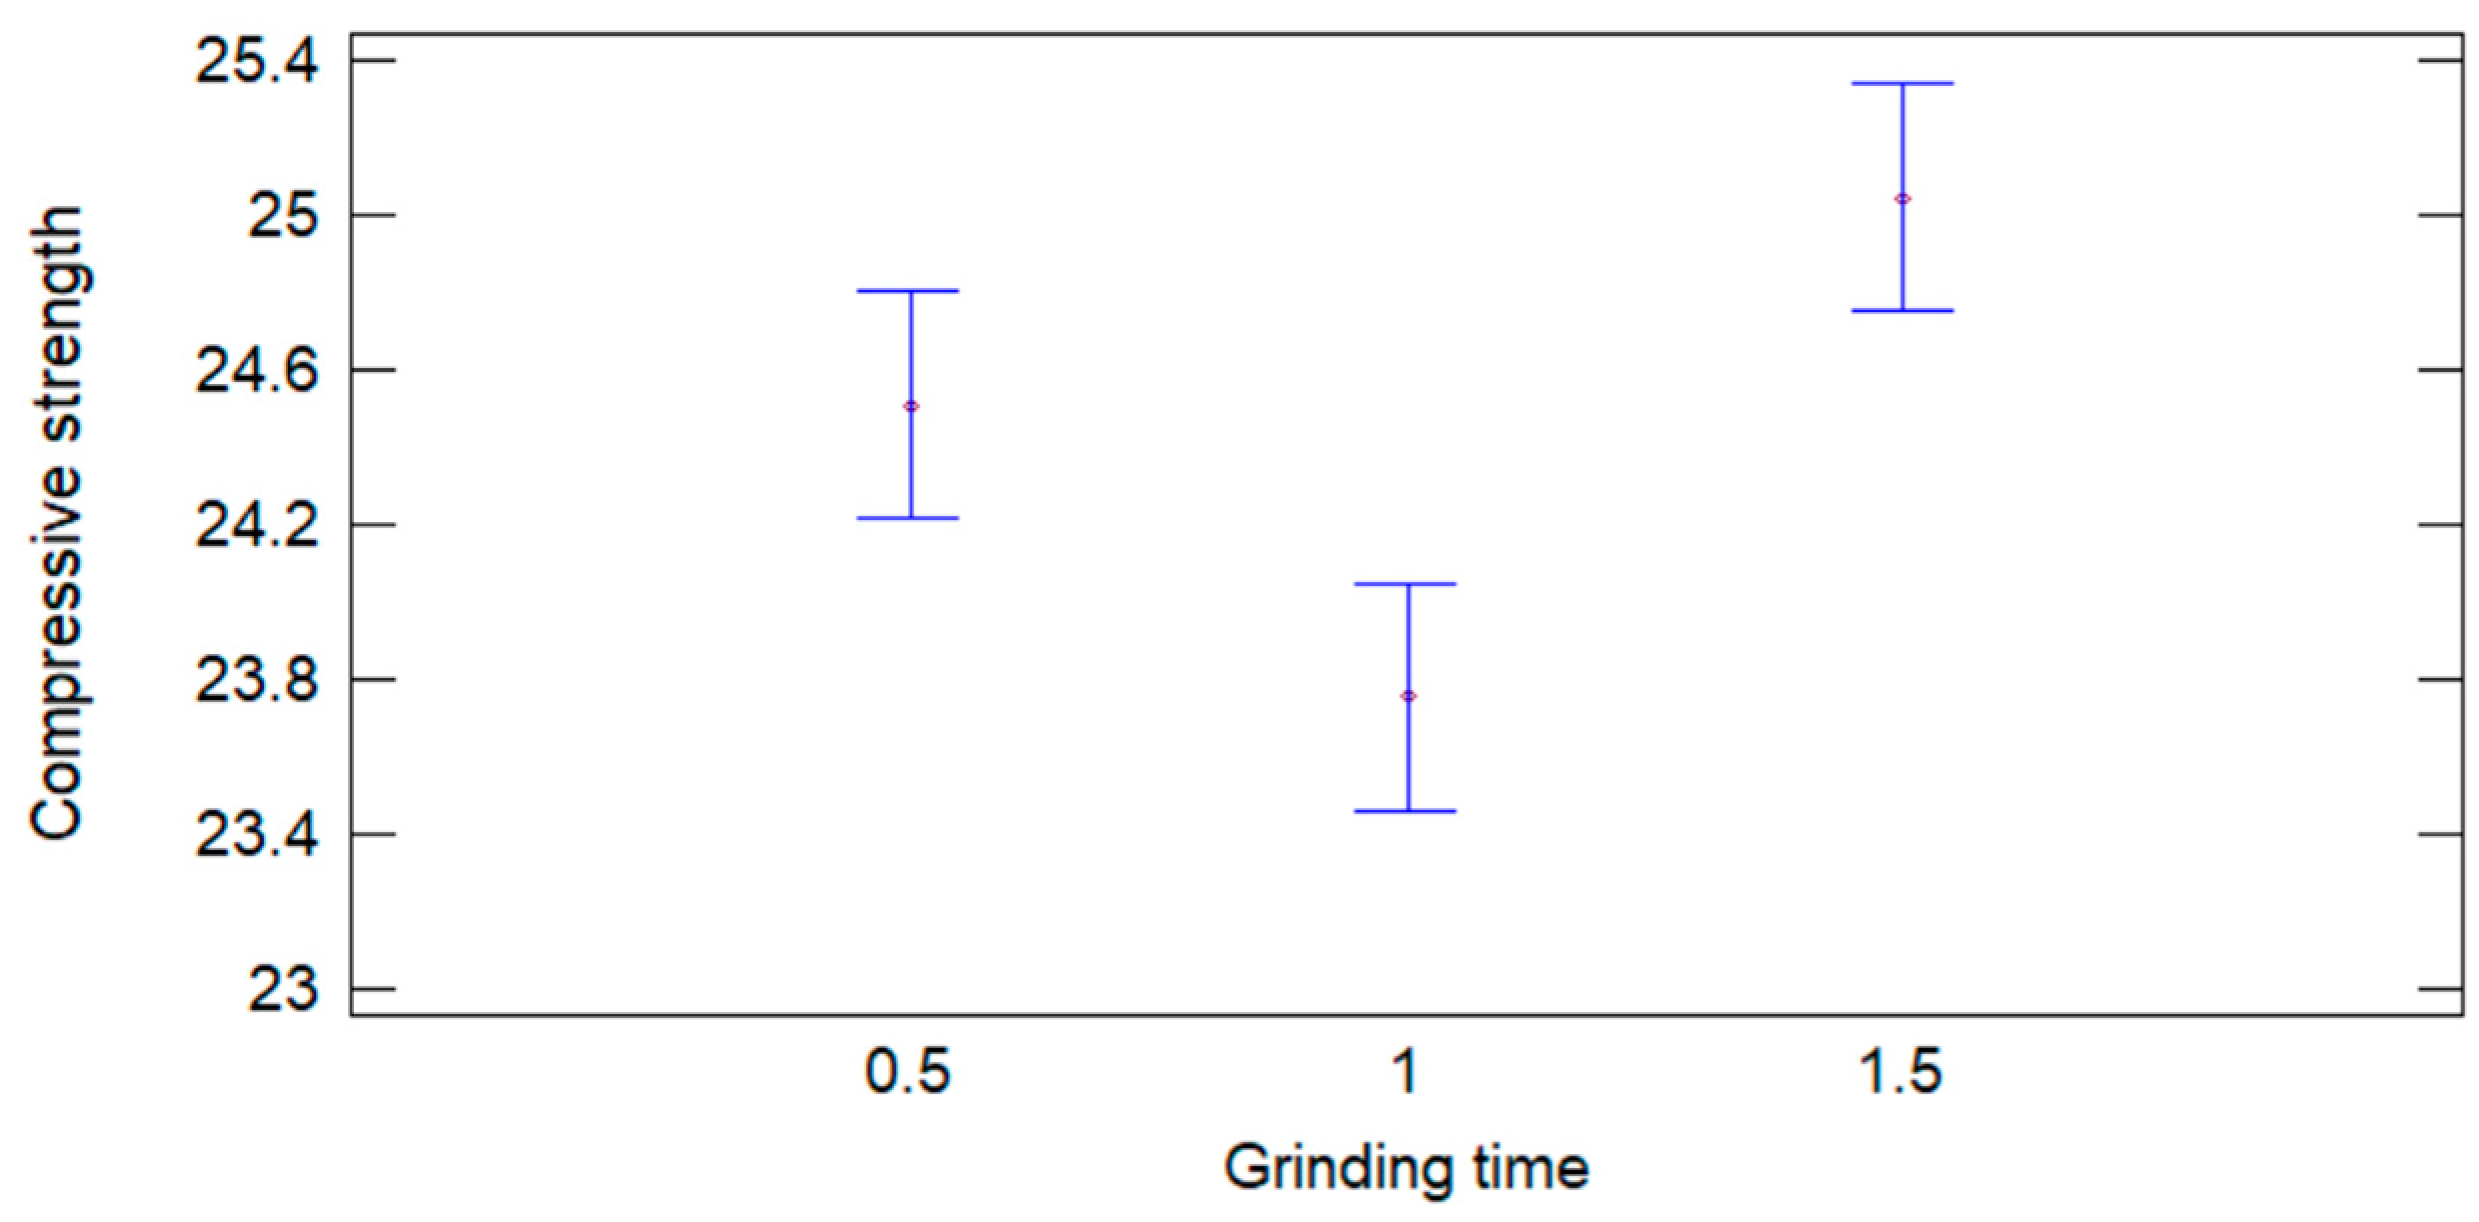
The estimated marginal means for each factor level are presented in Table 6. For grinding time, the highest compressive strength is obtained at 1.5 h (25.05 MPa), followed by 0.5 h (24.51 MPa), while the lowest value corresponds to 1.0 h (23.75 MPa). This behavior suggests that compressive strength does not vary linearly with grinding time and that intermediate fineness does not necessarily lead to improved mechanical performance.
Regarding filler percentage, the variation in compressive strength is less pronounced. The maximum value is observed at 2.0% (25.06 MPa), whereas the lowest strength is associated with 5.0% (23.62 MPa), indicating that higher filler contents may negatively affect the mechanical response.
The multiple comparison test based on Fisher’s Least Significant Difference (LSD), shown in Table 7, reveals statistically significant differences between specific levels of grinding time. In particular, the differences between 0.5 h and 1.0 h, and between 1.0 h and 1.5 h, are significant, whereas no significant difference is observed between 0.5 h and 1.5 h. This confirms that the reduction in compressive strength at 1.0 h is statistically relevant.
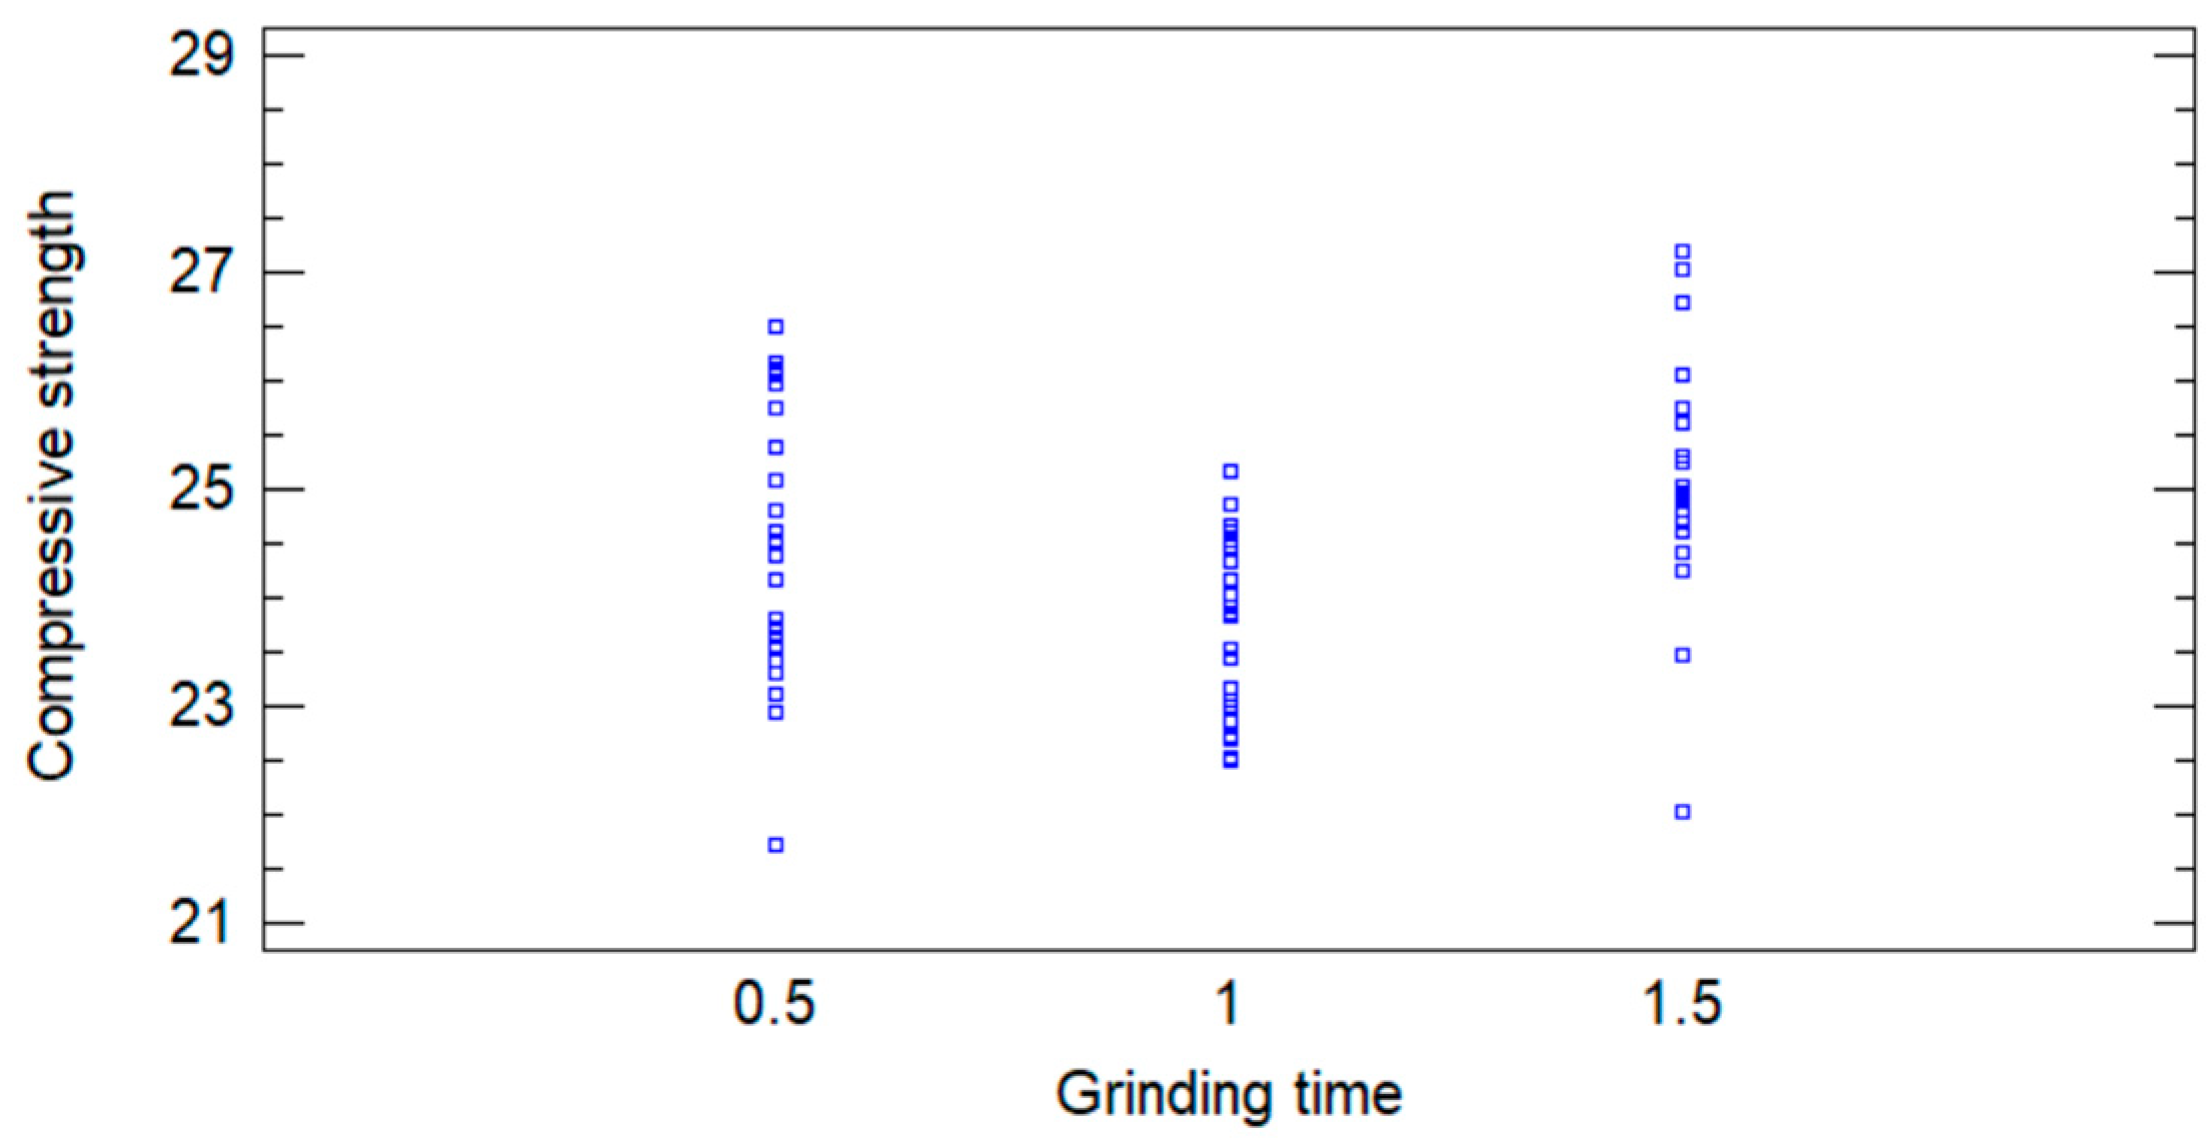
The distribution of experimental data is illustrated in Figure 10, where a clear separation between grinding time levels can be observed. The results for 1.5 h tend to cluster at higher strength values, while those corresponding to 1.0 h are consistently lower. The relatively uniform dispersion across groups suggests homogeneity of variance.
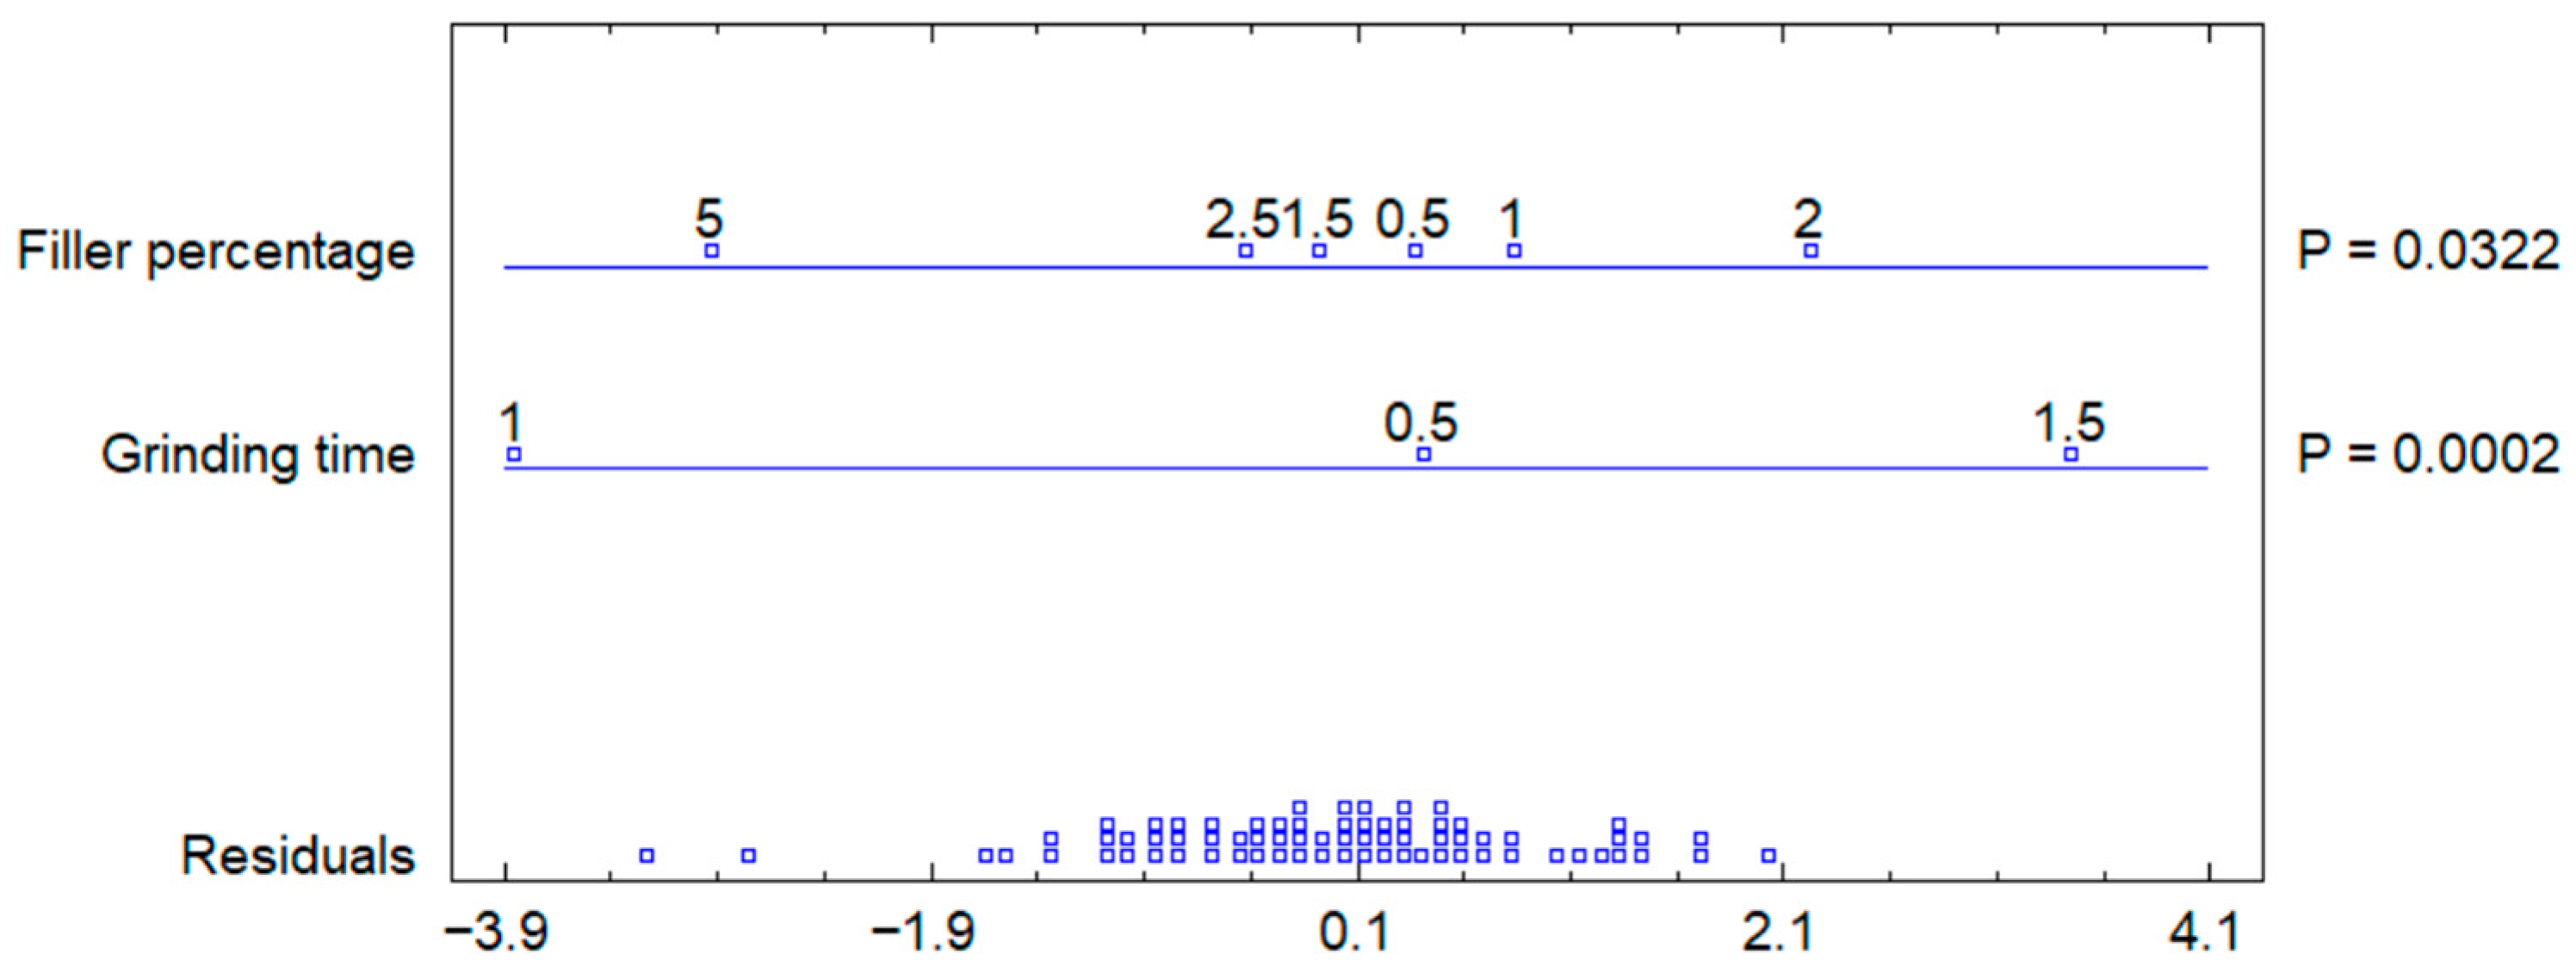
The graphical ANOVA representation (Figure 11) further supports these findings, confirming the stronger influence of grinding time compared to filler percentage. The residuals are randomly distributed around zero, indicating that the assumptions of the ANOVA model are satisfied.
Finally, the means plot with 95% confidence intervals (Figure 12) shows that the confidence intervals for 0.5 h and 1.5 h overlap, whereas those for 1.0 h are clearly separated, reinforcing the statistical differences identified in the LSD analysis.
Overall, the results demonstrate that both grinding time and filler percentage significantly affect compressive strength; however, grinding time is the governing factor. This suggests that particle fineness plays a critical role in defining the mechanical performance of the mortars, while filler dosage exerts a secondary influence.


4. Conclusions

The present study evaluated the effect of clam shell-derived filler on the mechanical performance of cementitious mortars, considering both filler dosage and particle fineness as governing parameters. Based on the experimental and statistical analysis, the following conclusions can be drawn.
The performance of cementitious mortars incorporating clam shell-derived filler is governed by the combined effect of particle size distribution and filler dosage. Grinding time effectively controlled particle refinement, reducing D50 from approximately 0.383 mm to 0.081 mm (with consistent decreases in D30 and D90), which directly influenced both fresh and hardened properties.
Workability decreased with increasing fineness and filler content due to the rise in specific surface area, which increased water demand. From a mechanical perspective, an optimal balance was identified at MFC0.5h–1.0%, where coarser particles provided sufficient packing improvement without adversely affecting rheology, resulting in the highest tensile strength under bending and compressive strength (7.27 MPa and 26.16 MPa, respectively).
Finer particles enhanced matrix densification at moderate dosages; however, excessive refinement combined with higher filler contents led to strength reductions, attributed to increased surface area, particle agglomeration, and reduced matrix homogeneity. These observations were supported by SEM analysis, which revealed improved microstructural compactness at optimal conditions and the presence of clustered regions at higher dosages.
The statistical analysis (multifactor ANOVA) confirmed that both grinding time and filler dosage have a significant effect on compressive strength (p < 0.05). Among these factors, grinding time exhibited the highest influence, indicating that particle fineness plays a dominant role in controlling the mechanical performance of the mortars. In contrast, filler dosage showed a secondary but still statistically significant effect. No interaction between factors was considered in the statistical model; therefore, the observed effects are attributed to the independent contribution of each variable.
Overall, the results confirm that clam shell filler can be effectively used as a sustainable additive in mortars, provided that both particle size and dosage are carefully optimized, enabling improved performance while promoting the valorization of marine waste.

Author Contributions

Conceptualization, M.V.F., L.E.M.Q. and B.A.G.M.; methodology, M.V.F. and L.E.M.Q.; validation, M.V.F., L.E.M.Q. and I.I.M.S.; formal analysis, M.V.F., L.E.M.Q., B.A.G.M. and I.I.M.S.; investigation, B.A.G.M., M.V.F. and L.E.M.Q.; data curation, B.A.G.M., M.V.F., L.E.M.Q. and I.I.M.S.; writing—original draft preparation, B.A.G.M., M.V.F., L.E.M.Q., I.I.M.S. and J.L.V.R.; writing—review and editing, M.V.F., L.E.M.Q. and J.L.V.R.; supervision, M.V.F. and L.E.M.Q. All authors have read and agreed to the published version of the manuscript.

Funding

This research received external funding from “Proyecto UdeC VRID N2022000663INT” financed by Vice-Rectorate for Research and Development (VRID), University of Concepción; and “Project N° 11250997” financed by the National Agency for Research and Development (ANID).

Institutional Review Board Statement

Not applicable.

Informed Consent Statement

Not applicable.

Data Availability Statement

The original contributions presented in this study are included in the article. Further inquiries can be directed to the corresponding author.

Conflicts of Interest

The authors declare no conflicts of interest.

References

  1. Camargo-Perez, R.; Moreno-Navarro, F.; Alvarez, A.E.; Walubita, L.F.; Fuentes, L. Influence of recycled rice husk ash filler on the mechanical performance of asphalt mixtures: A mortar scale analysis. Constr. Build. Mater. 2024, 414, 134832. [Google Scholar] [CrossRef]
  2. Krammart, P.; Tangtermsirikul, S. Properties of cement made by partially replacing cement raw materials with municipal solid waste ashes and calcium carbide waste. Constr. Build. Mater. 2004, 18, 579–583. [Google Scholar] [CrossRef]
  3. Wang, W.; Wang, J.; Shen, J.; Guo, P. High titanium heavy slag powder as a sustainability filler and its influence on the performance of asphalt mortar. J. Mater. Res. Technol. 2023, 25, 5586–5599. [Google Scholar] [CrossRef]
  4. Valin Fernández, M.; Muñoz Toro, B.S.; Merino Quilodrán, L.E.; Valin Rivera, J.L.; Salas Salgado, A.F.; Palacio, D.A. Experimental Study of the Mechanical Properties of Mortar with Biobío Region Clam Shells Used as a Partial Replacement for Cement. Appl. Sci. 2024, 14, 9756. [Google Scholar] [CrossRef]
  5. Ez-zaki, H.; Diouri, A.; Kamali-Bernard, S.; Sassi, O. Composite cement mortars based on marine sediments and oyster shell powder. Mater. Construcción 2016, 66, e080. [Google Scholar] [CrossRef]
  6. Martínez-García, C.; González-Fonteboa, B.; Martínez-Abella, F.; Carro- López, D. Performance of mussel shell as aggregate in plain concrete. Constr. Build. Mater. 2017, 139, 570–583. [Google Scholar] [CrossRef]
  7. Yoon, G.-L.; Kim, B.-T.; Kim, B.-O.; Han, S.-H. Chemical–mechanical characteristics of crushed oyster-shell. Waste Manag. 2003, 23, 825–834. [Google Scholar] [CrossRef] [PubMed]
  8. Salem, S.; Hamdy, Y.; Abdelraouf, E.-S.; Shazly, M. Towards sustainable concrete: Cement replacement using Egyptian cornstalk ash. Case Stud. Constr. Mater. 2022, 17, e01193. [Google Scholar] [CrossRef]
  9. Maglad, A.M.; Othuman Mydin, M.A.; Dip Datta, S.; Tayeh, B.A. Assessing the mechanical, durability, thermal and microstructural properties of sea shell ash based lightweight foamed concrete. Constr. Build. Mater. 2023, 402, 133018. [Google Scholar] [CrossRef]
  10. Stel’makh, S.A.; Shcherban’, E.M.; Beskopylny, A.N.; Hiep, N.Q.; Song, Y.; Elshaeva, D.; Chernil’nik, A.; Shilov, A.A.; Karalar, M.; Aksoylu, C.; et al. Properties and Structure of Functional Concrete Mixtures Modified with River Shell Powder. Civ. Eng. J. 2024, 10, 2384–2403. [Google Scholar] [CrossRef]
  11. NCh148.Of68; Cement–Terminology, Classification and General Specifications. National Institute for Standardization (INN): Santiago, Chile, 1968. Available online: https://www.cesmec.cl/medios/DIC/normas/NCh148Of68.pdf (accessed on 7 December 2025).
  12. NCh409/1.Of2005; Drinking Water–Part 1: Requirements. National Institute for Standardization (INN): Santiago, Chile, 2005.
  13. ASTM C128-22; Standard Test Method for Relative Density (Specific Gravity) and Absorption of Fine Aggregate. ASTM International: West Conshohocken, PA, USA, 2022.
  14. ASTM C29/C29M-97; Standard Test Method for Bulk Density (“Unit Weight”) and Voids in Aggregate. ASTM International: West Conshohocken, PA, USA, 1997.
  15. ASTM C136-06; Standard Test Method for Sieve Analysis of Fine and Coarse Aggregates. ASTM International: West Conshohocken, PA, USA, 2006.
  16. ASTM D6913/D6913M; Standard Test Methods for Determining Particle-Size Distribution (Gradation) of Soils by Sieve Analysis 1. ASTM International: West Conshohocken, PA, USA, 2004.
  17. ASTM C702/C702M-18; Standard Practice for Reducing Samples of Aggregate to Testing Size. ASTM International: West Conshohocken, PA, USA, 2018.
  18. ASTM B-214; Standard Test Method for Sieve Analysis of Metal Powders. ASTM International: West Conshohocken, PA, USA, 2022.
  19. NCh 165.Of2009; Aggregates for Mortars and Concretes—Sieving and Determination of Particle Size. National Institute for Standardization (INN): Santiago, Chile, 2009.
  20. NCh 1019.Of2009; Concrete–Determination of Consistency–Slump Test (Abrams Cone Method). National Institute for Standardization (INN): Santiago, Chile, 2009. Available online: https://www.cesmec.cl/medios/DIC/normas/NCh1019Of2009.pdf (accessed on 6 December 2025).
  21. NCh1038.Of77; Flexural Tensile Test. National Institute for Standardization (INN): Santiago, Chile, 2009.
  22. NCh 158 Of.1967; Cements–Flexural and Compressive Strength Test of Cement Mortars. National Institute for Standardization (INN): Santiago, Chile, 1967. Available online: https://tecnohorm.weebly.com/uploads/9/6/2/7/9627075/nch0158-1967.pdf (accessed on 7 December 2025).
  23. Soltanzadeh, F.; Emam-Jomeh, M.; Edalat-Behbahani, A.; Soltan-Zadeh, Z. Development and characterization of blended cements containing seashell powder. Constr. Build. Mater. 2018, 161, 292–304. [Google Scholar] [CrossRef]
  24. Liao, Y.; Fan, J.; Li, R.; Da, B.; Chen, D.; Zhang, Y. Influence of the usage of waste oyster shell powder on mechanical properties and durability of mortar. Adv. Powder Technol. 2022, 33, 103503. [Google Scholar] [CrossRef]
  25. Ruslan, H.N.; Muthusamy, K.; Ariffin, N.F.; Abdul Wahab, M.M.; Mohamad, N. Effect of crushed cockle shell as partial fine aggregate replacement on workability and strength of lightweight concrete. Mater. Today Proc. 2022, 48, 1826–1830. [Google Scholar] [CrossRef]
  26. González-Caro, Á.; Merino-Lechuga, A.M.; Fernández-Ledesma, E.; Fernández-Rodríguez, J.M.; Jiménez, J.R.; Suescum-Morales, D. The Effect of Acanthocardia tuberculata Shell Powder as Filler on the Performance of Self-Compacting Mortar. Materials 2023, 16, 1734. [Google Scholar] [CrossRef] [PubMed]
  27. Wang, J.; Liu, E.; Li, L. Characterization on the recycling of waste seashells with Portland cement towards sustainable cementitious materials. J. Clean. Prod. 2019, 220, 235–252. [Google Scholar] [CrossRef]
  28. Lozano-Lunar, A.; Dubchenko, I.; Bashynskyi, S.; Rodero, A.; Fernández, J.M.; Jiménez, J.R. Performance of self-compacting mortars with granite sludge as aggregate. Constr. Build. Mater. 2020, 251, 118998. [Google Scholar] [CrossRef]
  29. Assaad, J.J.; Saba, M. Use of Seashell and Limestone Fillers in Metakaolin-Based Geopolymers for Masonry Mortars. Minerals 2023, 13, 186. [Google Scholar] [CrossRef]
Figure 1. Comparison of particle size bands of clam shell powder accord to milling time used: (a) 0.5 h; (b) 1 h; (c) 1.5 h; (d) 2 h; (e) 2.5 h; (f) 3 h and (g) 4 h.
Applsci 16 03736 g001aApplsci 16 03736 g001b
Figure 2. Mortar workability using the reduced Abrams cone slump method [16].
Applsci 16 03736 g002
Figure 3. Flexural tensile strength at different curing ages: (a) 7 days; (b) 14 days and (c) 28 days.
Applsci 16 03736 g003
Figure 4. Compressive strength at different curing ages: (a) 7 days; (b) 14 days and (c) 28 days.
Applsci 16 03736 g004
Figure 5. EDX results: (a) clam shell powder; (b) Control Mix (MC), (c) MFC1.0h–2.5% and (d) MFC1.0h–5.0%.
Applsci 16 03736 g005
Figure 6. Scanning electron microscopy (SEM) of clam powder: (a) 250× and (b) 1000×.
Applsci 16 03736 g006
Figure 7. Scanning electron microscopy (SEM) of MC powder.
Applsci 16 03736 g007
Figure 8. Scanning electron microscopy (SEM) of MFC1.0h–2.5% sample: (a) SEM image and (b) EDX maps of elements.
Applsci 16 03736 g008
Figure 9. Scanning electron microscopy (SEM) of MFC1.0h–5.0% sample: (a) SEM image and (b) EDX maps of elements.
Applsci 16 03736 g009
Figure 10. Scatterplot by level code.
Applsci 16 03736 g010
Figure 11. Graphical ANOVA for compressive strength.
Applsci 16 03736 g011
Figure 12. Means and 95.0 percent LSD intervals.
Applsci 16 03736 g012
Table 1. Sand physical properties.
Physical Properties of SandUnitValue
Relative density (specific gravity) (saturated surface-dry)-2.72
Relative density (specific gravity) (oven-dry)-2.68
Apparent relative density-2.81
Loose unit weightMg/m31.60
Compacted unit weightMg/m31.67
Absorption%1.8%
Humidity%1.0%
Fineness modulus-2.1
Table 2. Characteristic particle size parameters for different grinding times.
Grinding Time (h)D30 (mm)D50 (mm)D90 (mm)
0.50.127 ± 0.0190.383 ± 0.0582.289 ± 0.038
1.00.066 ± 0.0020.128 ± 0.0050.573 ± 0.012
1.5 0.081 ± 0.0050.347 ± 0.075
Table 3. Base mix proportions of mortars.
Dosage, abs = 2.1%, w = 0.8%
MixControl (MC)
Cement [kg]0.864
Sand [kg]2.611
Water [kg]0.572
R W/C0.66
MC: Mortar control.
Table 4. Filler dosage (% by mass of cement) for a grinding time of 0.5 h.
Grinding Time [h]MFCXXh–0.5%MFCXXh–1.0%MFCXXh–1.5%MFCXXh–2.0%MFCXXh–2.5%MFCXXh–5.0%
0.50.00430.00860.0130.01730.02160.0432
1.00.00430.00860.0130.01730.02160.0432
1.50.00430.00860.0130.01730.02160.0432
MFCXXhYY%: Mortar incorporating clam shell filler with a grinding time of XX h, added at YY% by mass of cement.
Table 5. Analysis of variance for compressive strength—type III sums of squares.
SourceSum of SquaresDfMean SquareF-Ratiop-Value
Main Effects
A: Grinding time20.2208210.11049.700.0002
B: Filler percentage13.663752.732742.620.0322
Residual66.7369641.04276
Total (Corrected)100.62171
All F-ratios are based on the residual mean square error.
Table 6. Least squares means for compressive strength with 95.0 percent confidence intervals.
Stnd.LowerUpper
LevelCountMeanErrorLimitLimit
Grand Mean7224.4354
Grinding time
0.52424.50750.20844324.091124.9239
12423.75330.20844323.336924.1697
1.52425.04540.20844324.62925.4618
Filler percentage
0.51224.53750.29478323.948625.1264
11224.66830.29478324.079425.1264
1.51224.41420.29478323.825325.0031
21225.05920.29478324.470325.6481
2.51224.31670.29478323.727824.9056
51223.61670.29478323.027824.2056
Table 7. Multiple range tests for compressive strength by grinding time.
Method: 95.0 Percent LSD
Grinding TimeCountLS MeanLS SigmaHomogeneous Groups
12423.75330.208443X
0.52424.50750.208443X
1.52425.04540.208443X
ContrastSigDifference+/− Limits
0.5–1*0.7541670.58898
0.5–1.5 −0.5379170.58898
1–1.5*−1.292080.58898
* Denotes a statistically significant difference.
Disclaimer/Publisher’s Note: The statements, opinions and data contained in all publications are solely those of the individual author(s) and contributor(s) and not of MDPI and/or the editor(s). MDPI and/or the editor(s) disclaim responsibility for any injury to people or property resulting from any ideas, methods, instructions or products referred to in the content.