3.1. Workability
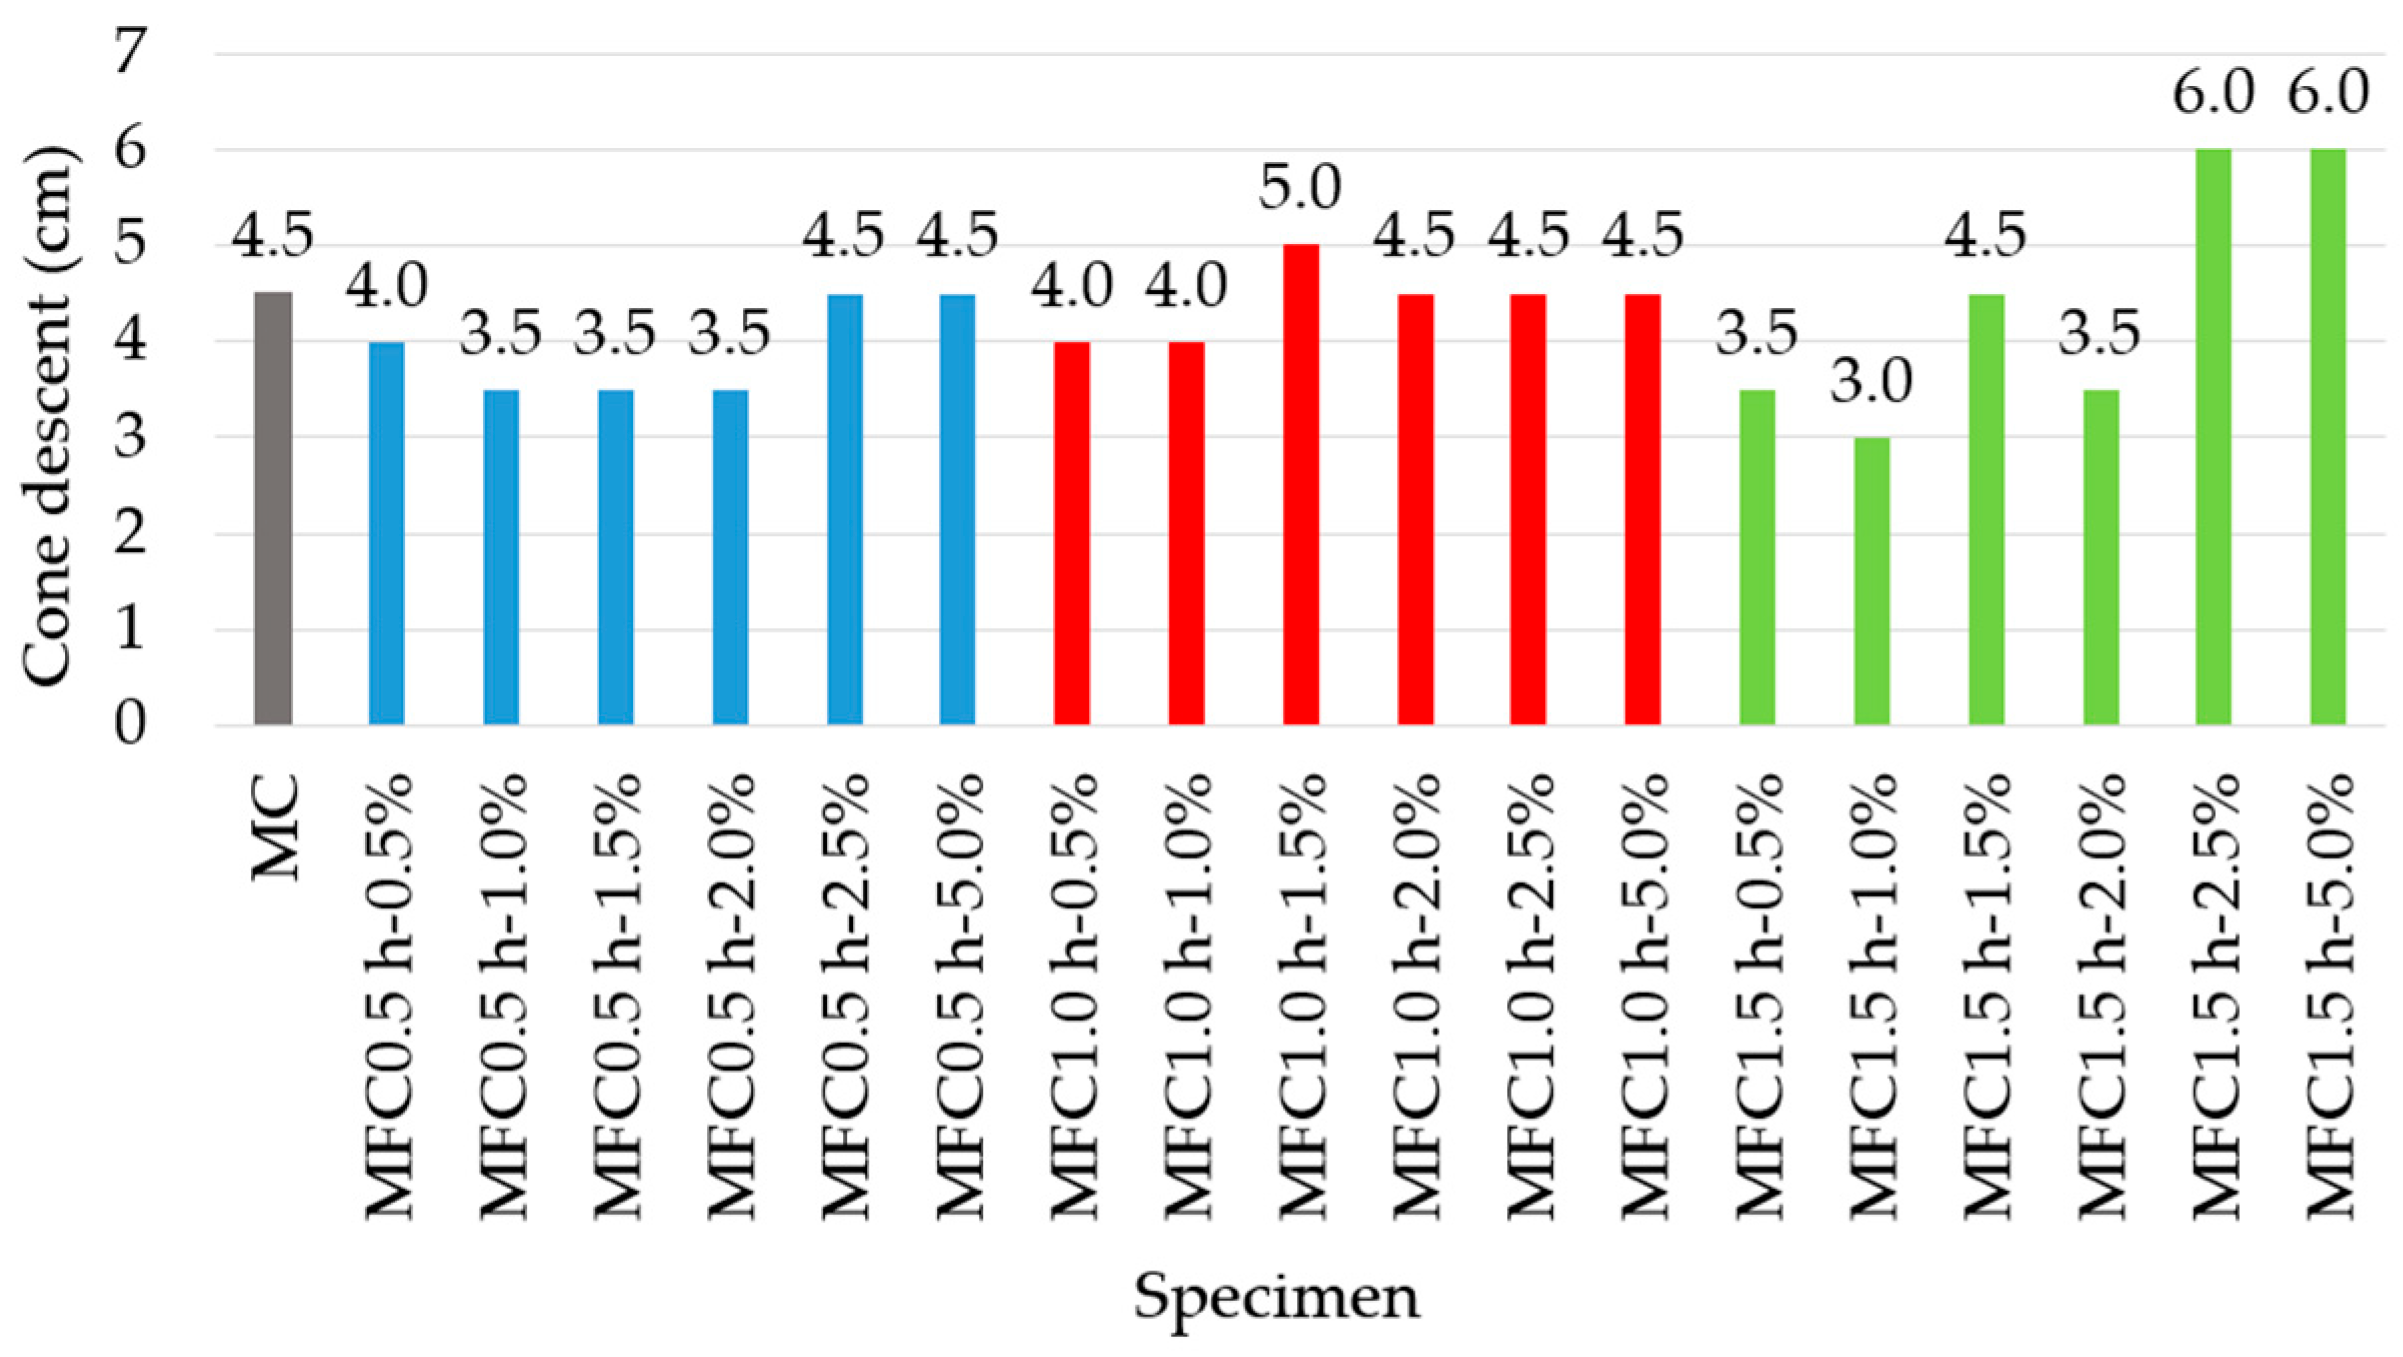
The truncated cone measurements can be seen in
Figure 2, where the control mixture (CM) showed a base settlement of 4.5 cm.
For the 0.5 h grinding period, increasing the filler content from 0.5% to 2.0% resulted in a progressive decrease in slump, reaching a minimum value of 3.5 cm, suggesting a loss of workability. However, at 2.5% and 5.0%, slump recovered to 4.5 cm, equaling control. This could be explained by a delayed lubricating effect upon reaching a threshold of sufficient filler volume to compensate for its low fineness. This is consistent with the results presented by Soltanzadeh et al., who specified that the presence of fine particles in the sand causes a decrease in the workability of the mixture due to increased water absorption, and they can also coat the aggregates, impairing the bond of the aggregate paste with the cement [
23]. Also, the addition of seashells reduces the mortar’s slump value due to their high porosity and water absorption, angular shape, and rough surface [
24]. The use of water-reducing admixtures can improve workability.
For the 1.0 h. milling, performance is stable, with settlements between 4.0 and 5.0 cm throughout all dosages. The maximum value is observed at 1.5% filler (5.0 cm), indicating that this combination optimizes workability. At higher dosages (up to 5.0%), fluidity remains constant (4.5 cm), demonstrating that intermediate milling generates particles with good dispersion and filling capacity, without negatively affecting consistency. Ruslan et al. found that replacing crushed cockleshell content as partial fine aggregate influenced the workability of concrete, and increasing the proportion of crushed cockleshell resulted in a drop in the slump value [
25].
On the other hand, with 1.5 h grinding at low dosages (0.5–1.0%), workability decreases (up to 3.0 cm), probably due to water absorption and excessive cohesion generation. From 1.5% onwards, fluidity progressively improves, reaching 6.0 cm at 2.5% and 5.0%, the highest values of the group. This behavior indicates that prolonged grinding combined with adequate dosage allows the filler to act as an effective rheological modifier, promoting mortar deformation and fluidity.
3.2. Flexural Tensile Strength
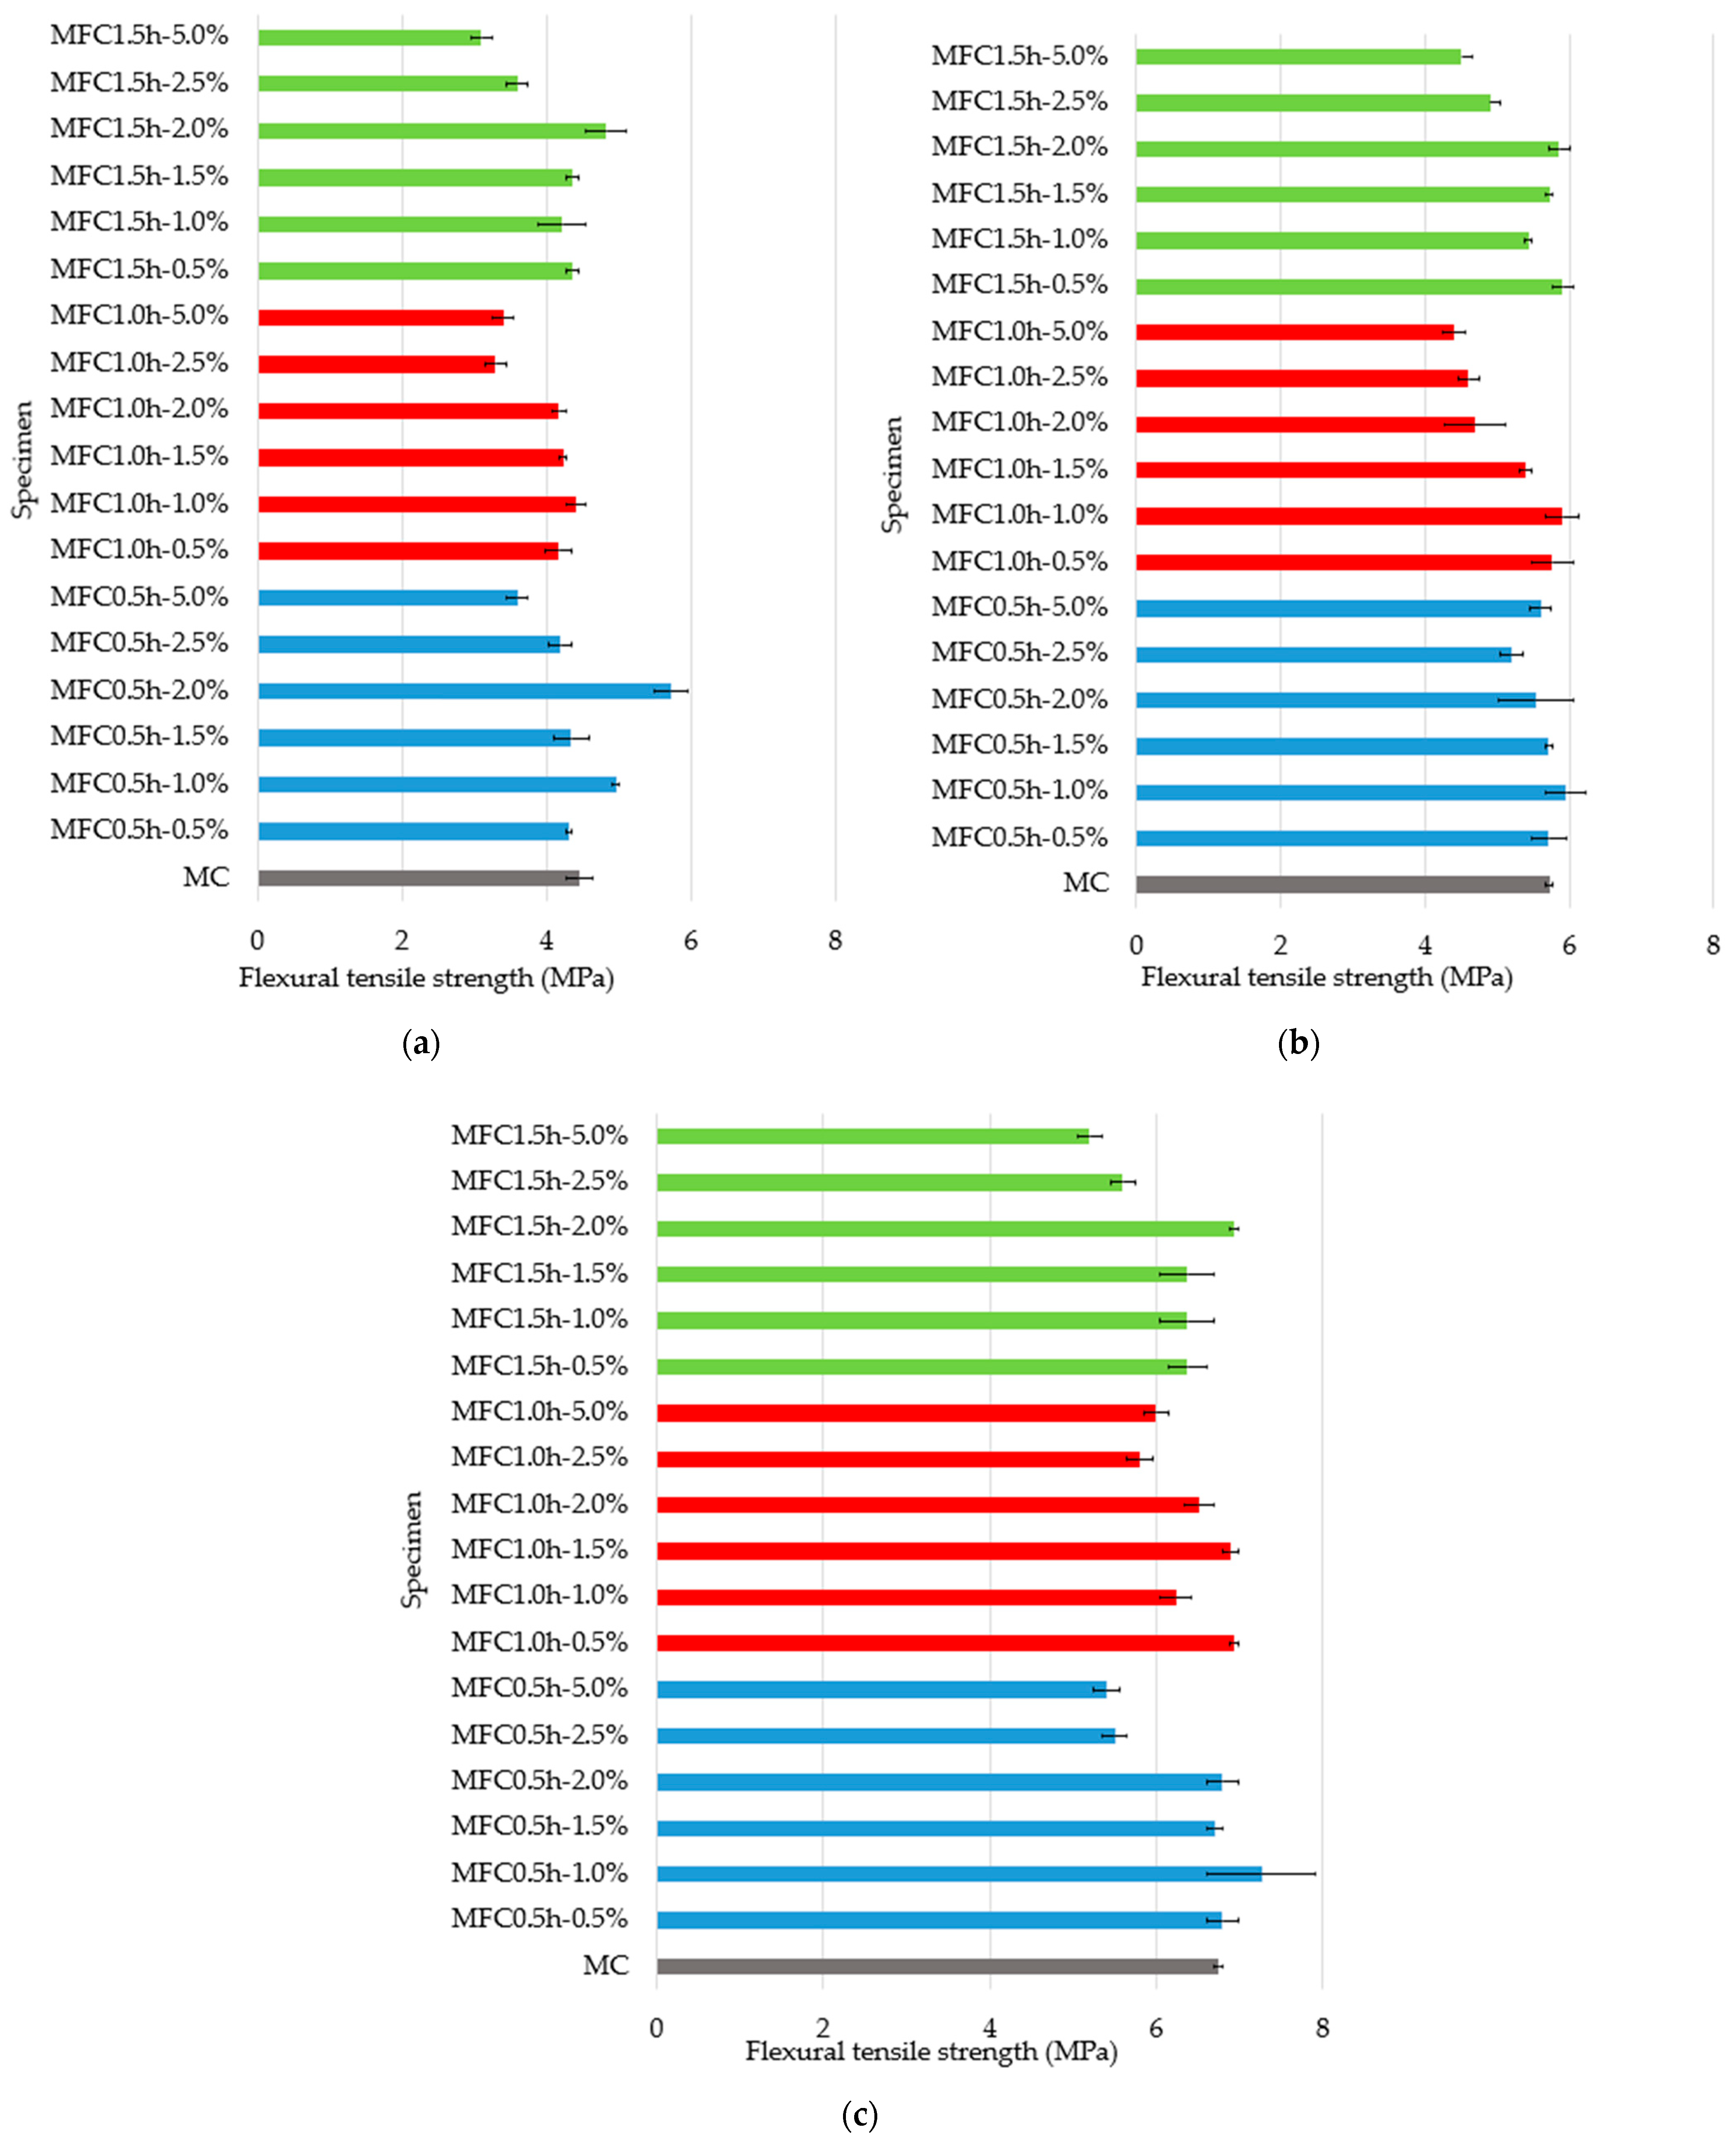
The flexural tensile test results for 7 days are presented in
Figure 3a, for 14 days in
Figure 3b, and for 28 days in
Figure 3c. At 28 days, the samples with filler grinding for 0.5 h, specifically those of 0.5% and 1%, showed increases of 0.7% (6.80 MPa) and 7.1% (7.27 MPa) with respect to the control (6.75 MPa). In the case of the samples with filler ground for 1 h, the 0.5% and 1.5% addition specimens showed increases of 2.7% and 2%, respectively, with respect to the standard. Meanwhile when filler ground for 1.5 h was used, the strength decreased for most of the addition percentages, except for 2%, which showed an increase of 2.7% (6.94 MPa) with respect to the control.
The filler does not behave merely as an inert aggregate; rather, it may actively contribute to the evolution of the cementitious matrix. Its fine particle size can promote heterogeneous nucleation, accelerating hydration reactions, while also enhancing particle packing and reducing porosity, thereby improving matrix densification. Moreover, in contrast to the differences observed at 7 days, the responses among the mixtures tended to converge at 28 days, indicating that the influence of the filler diminishes over time as hydration progresses and the matrix approaches a more stable microstructural state.
The results obtained do not differ greatly from the control, with the largest difference found being 8.3% for the specimens with 1 h of grinding and 1% shell addition. This behavior is attributed to the low percentages of fillers used. In works such as that of González et al. [
26], seashell powder was used to replace 100% of the limestone filler, the cement was kept constant, and the powder/fine aggregate ratio was varied. Their results showed a relative decrease due to the use of shell of 12.5%, 7.2%, and 0.8% for powder/fine aggregate ratios of 0.6, 0.7, and 0.8, respectively. The largest decrease in strength was attributed to a less compact matrix in the case of the ratio, while the smallest was attributed to a higher dust content, where the effect of the shell as a filler is stabilized or neutralized. On the other hand, Wang et al. [
27] and Lozano et al. [
28] speak of a decrease in flexural strength attributed to the fact that a smaller particle size, with a less rounded shape and greater porosity worsens the internal organization between the particles.
At all three grinding levels, when filler content exceeds 2.0%, a general decrease in flexural strength is observed, with values between 5.23 and 5.83 MPa. No mix with 2.5% or 5.0% exceeds the control mortar (6.75 MPa), nor does it match the best formulations with 0.5–2.0%. This suggests that there is an optimal filler dosage threshold (~2.0%), beyond which its addition becomes counterproductive.
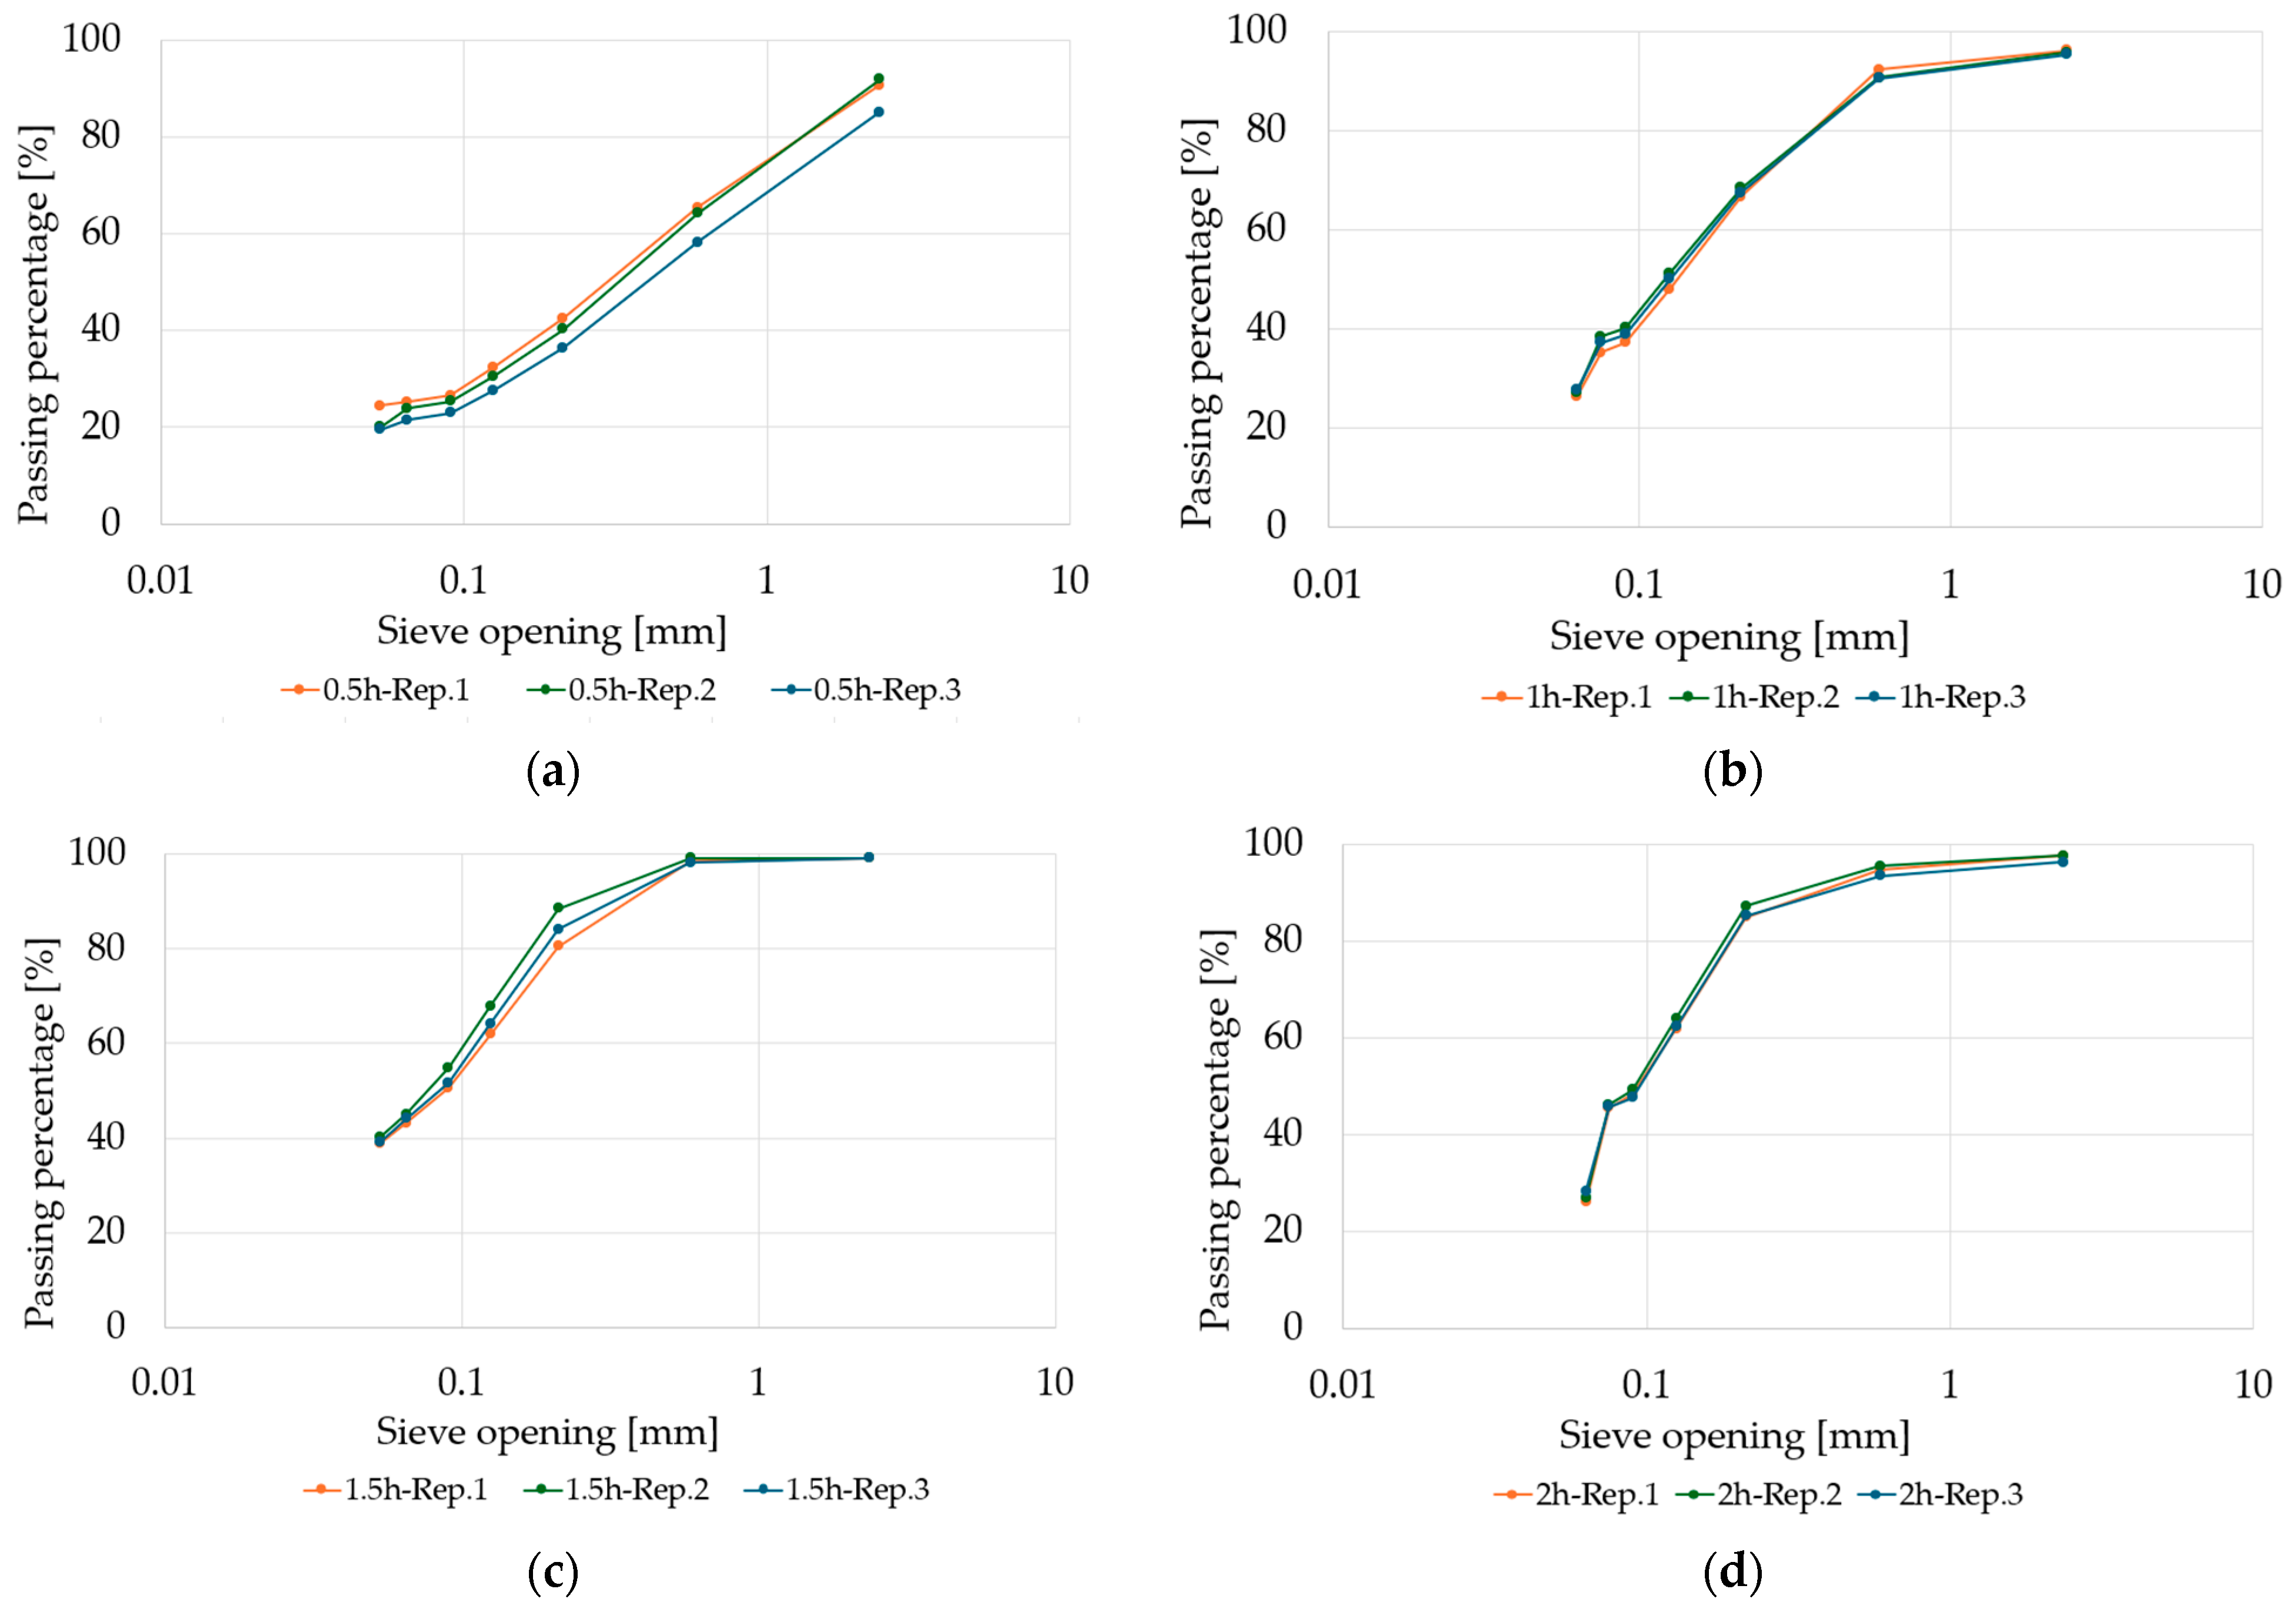
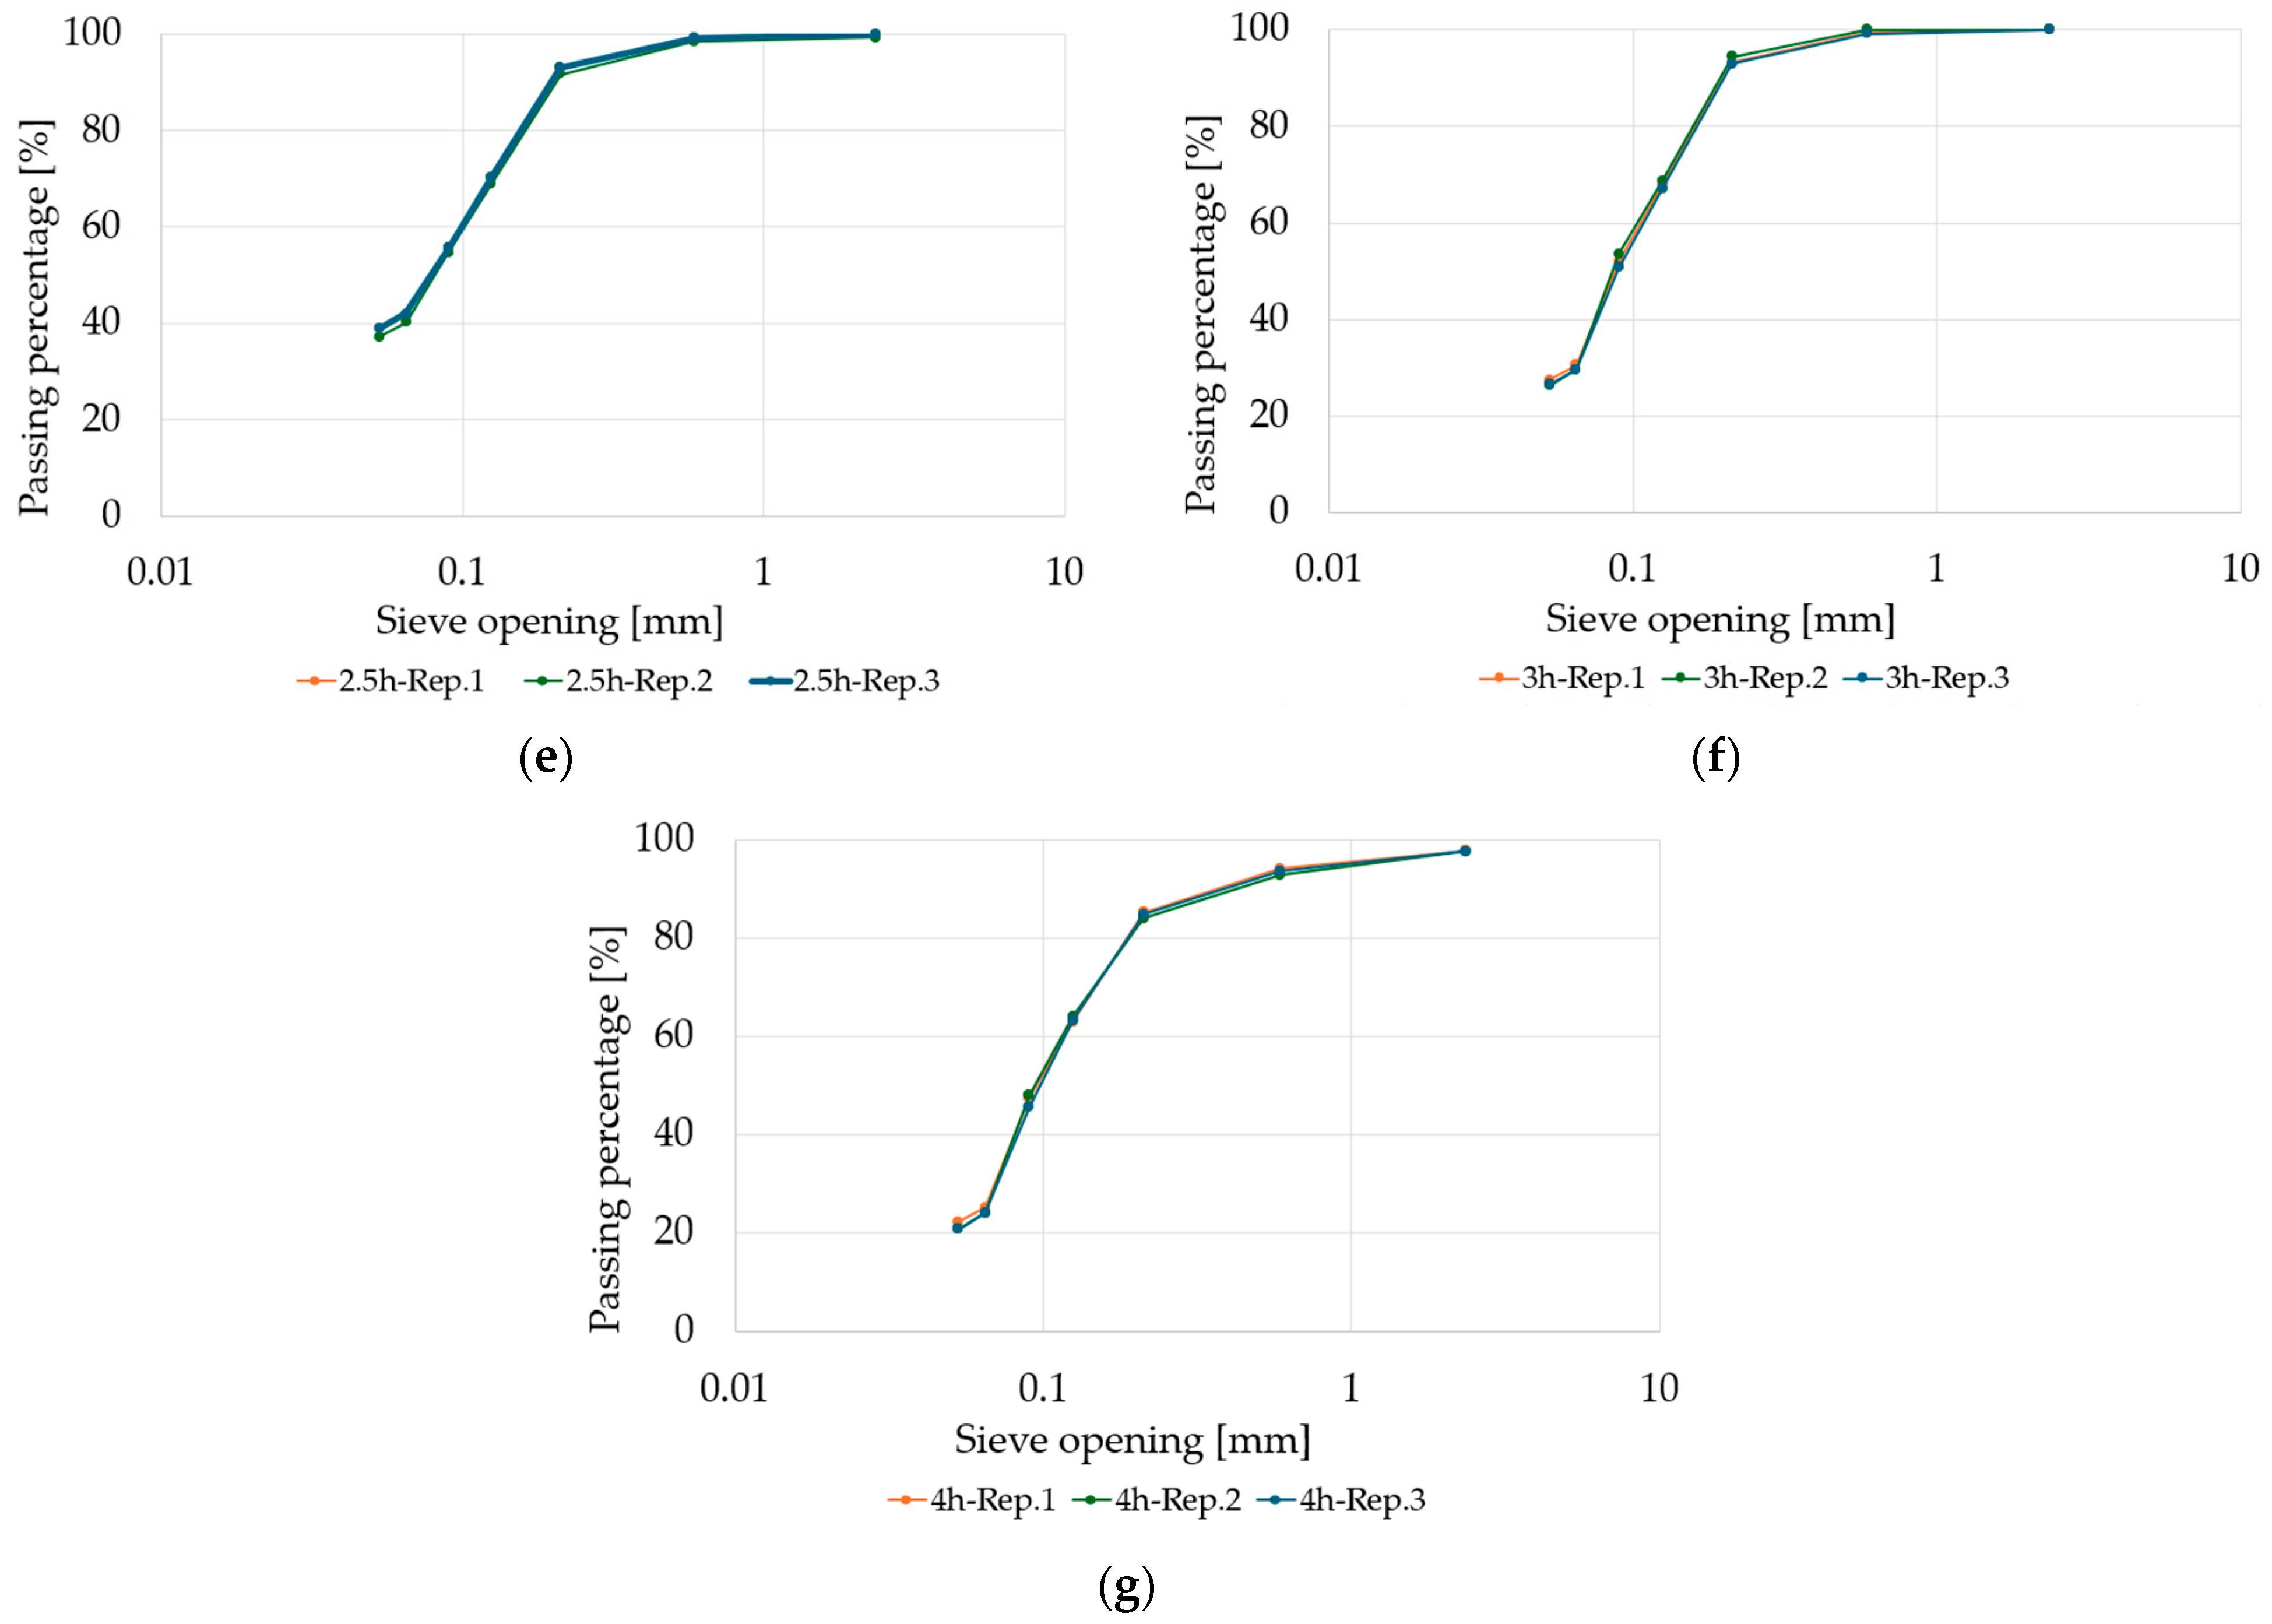
The variation in flexural strength can be directly related to the particle size distribution presented in
Table 2, which is governed by grinding time. Increasing grinding time from 0.5 h to 1.5 h led to a significant reduction in particle size (D
50 from 0.383 mm to 0.081 mm), which did not translate into a proportional improvement in flexural performance.
The highest strength was observed for the 0.5 h condition at 1.0% dosage (7.27 MPa at 28 days), indicating that coarser particles provide a more favorable balance between packing and water demand. In this range, the filler contributes to matrix densification without significantly increasing the specific surface area, allowing adequate dispersion and efficient stress transfer.
In contrast, the finest material (1.5 h) resulted in lower flexural strength at high dosages (5.0%), suggesting that excessive fineness negatively affects the mechanical response. This behavior can be attributed to the increased specific surface area of the particles, which raises the water demand and promotes particle agglomeration, leading to a less homogeneous microstructure and weaker interfacial bonding.
However, at intermediate dosages (2.0%), the finer particles (1.5 h) still achieved competitive strength values (6.94 MPa at 28 days), indicating that particle refinement can be beneficial within a limited dosage range, where improved packing and void filling are not offset by dispersion or water-related effects.
Overall, these results demonstrate that the effect of grinding time on flexural strength is not linear, and that an optimal particle size distribution exists depending on the filler content.
3.3. Compressive Strength
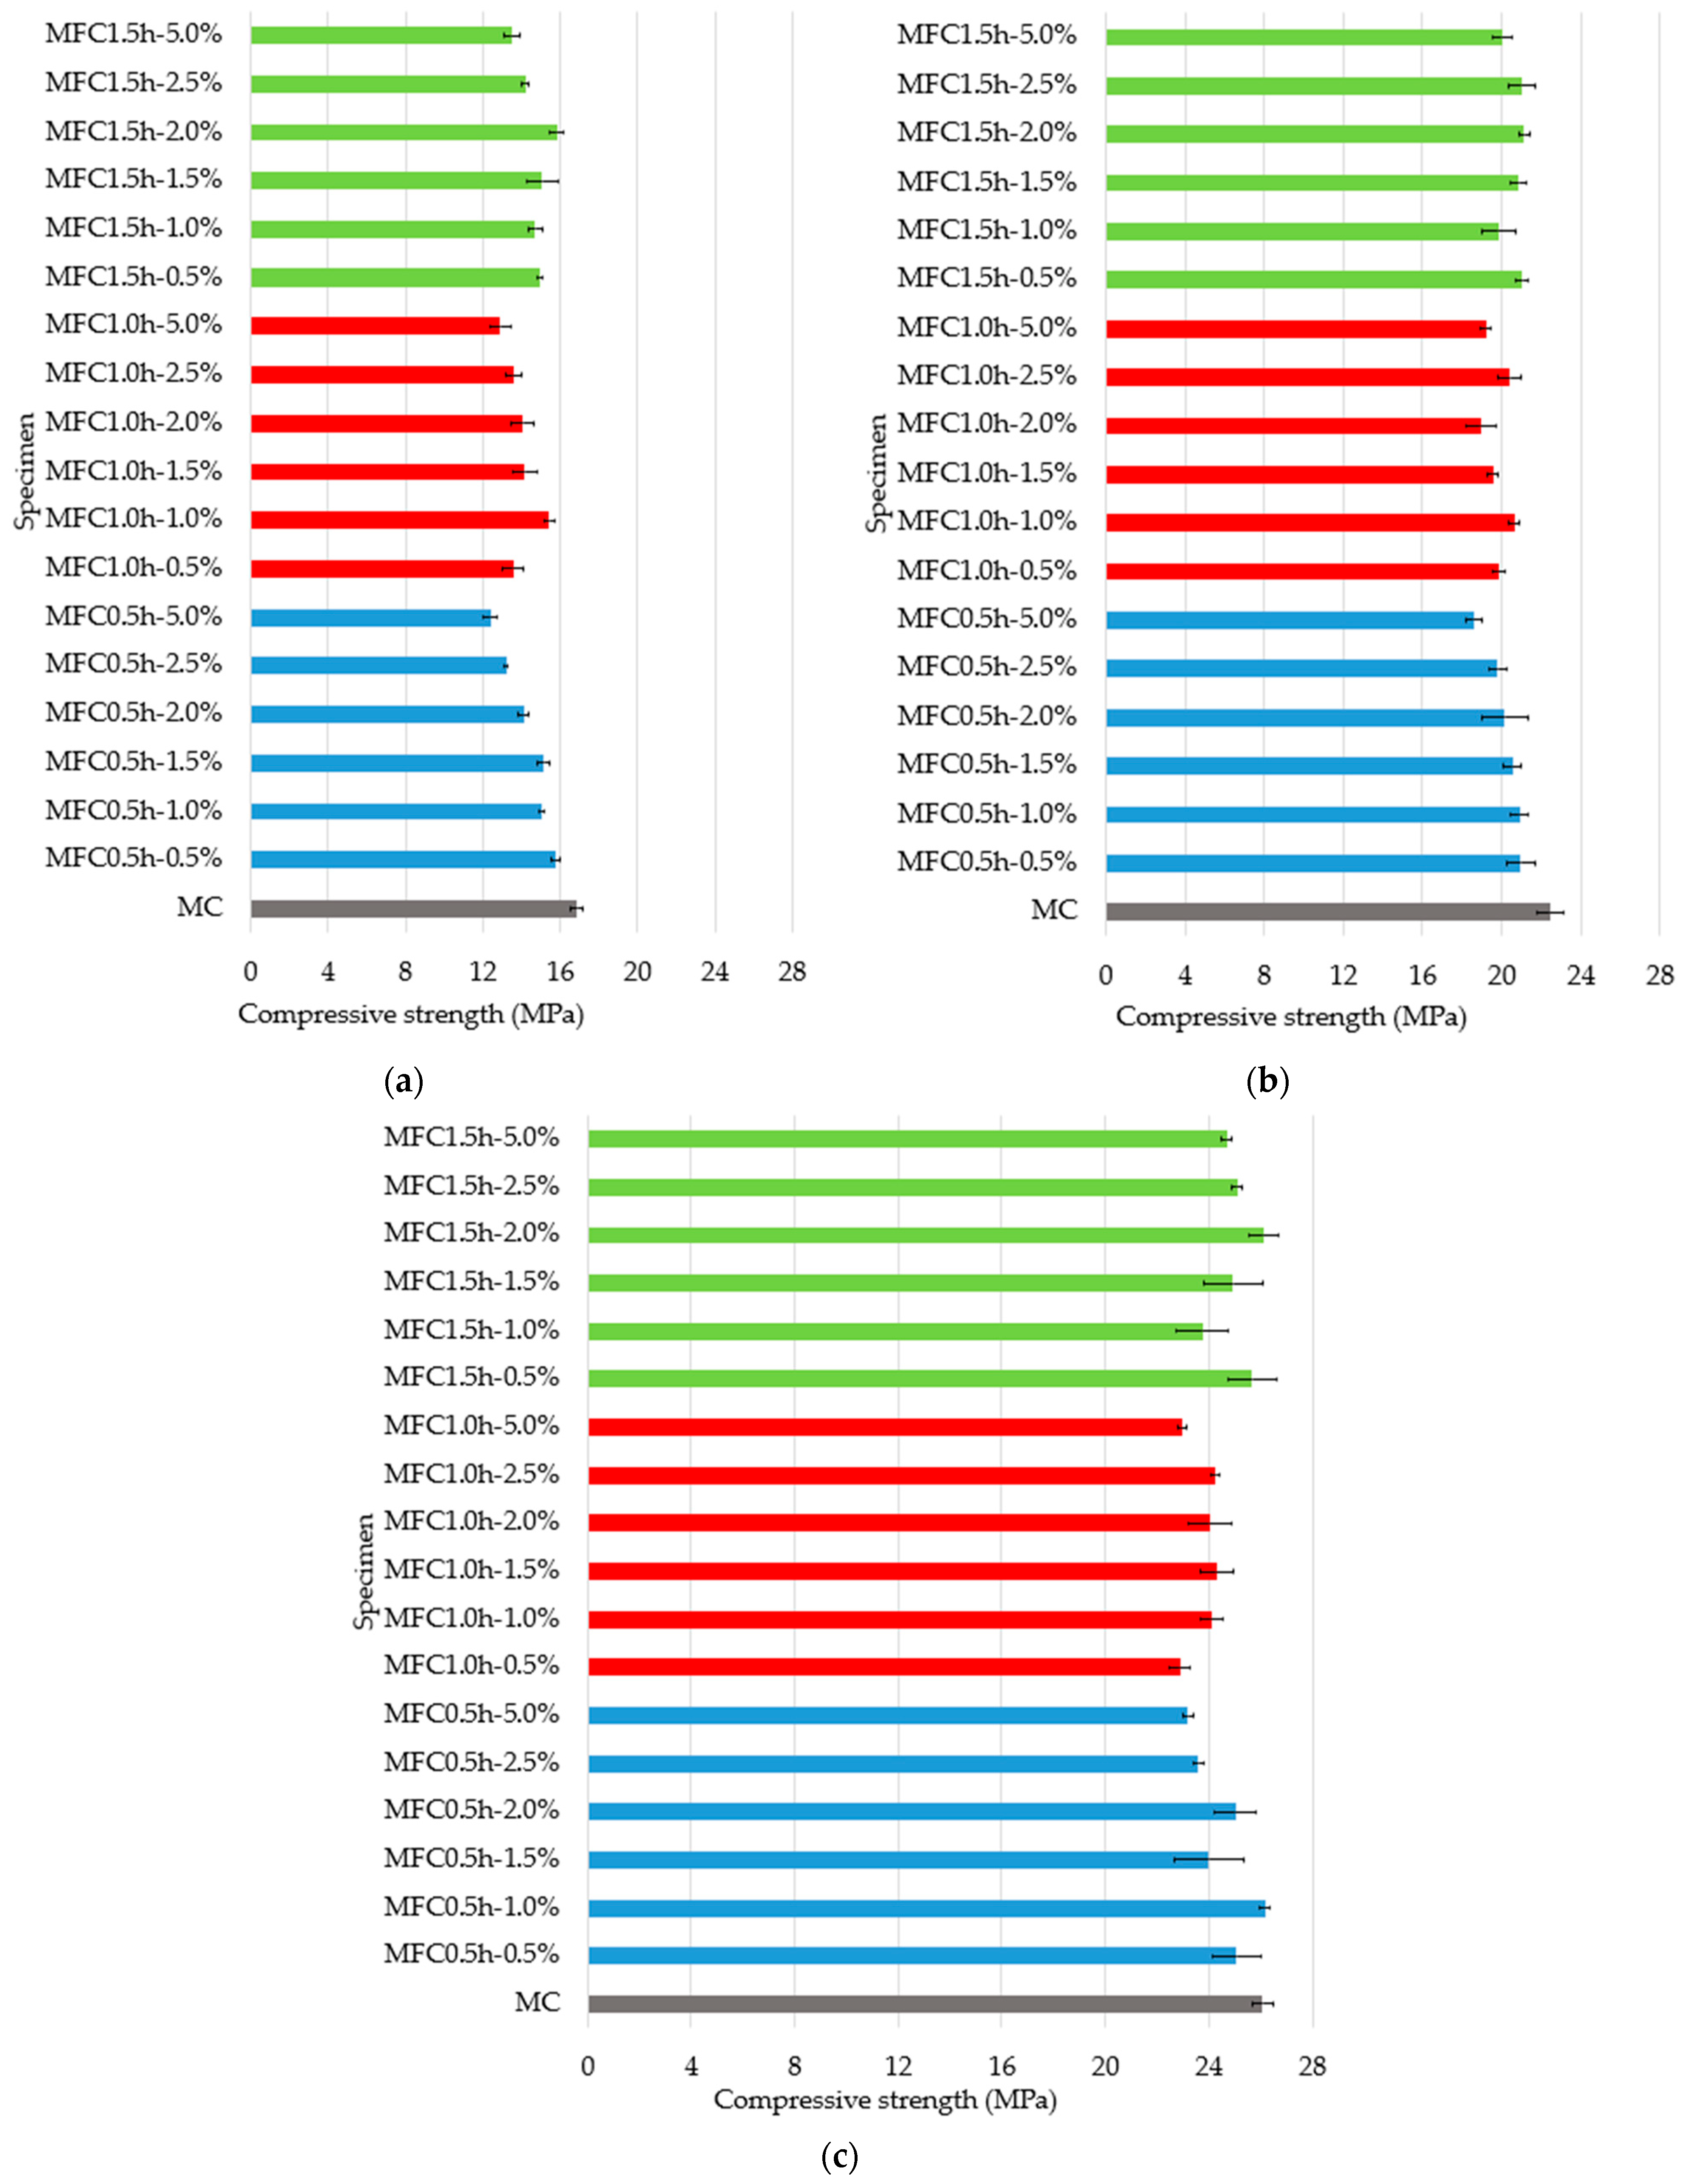
The compressive strength results at 7 days of age are presented in
Figure 4a, at 14 days in
Figure 4b, and at 28 days in
Figure 4c. The control mortar (CM) had a strength of 26.08 MPa at 28 days, which we will use as a reference for the analysis.
Of all the combinations, only the MFC0.5h–1.0% and MFC1.5h–2.0% specimens slightly outperformed the control with 0.3% (26.16 MPa) and 0.1% (26.11 MPa), respectively. This suggests that low grinding and low filler proportions do not negatively affect strength and may even act as a complementary physical filler. Furthermore, longer grinding allows for more efficient filler dispersion, promoting matrix compaction.
Although certain formulations containing seashell filler showed lower compressive strengths than the reference mortar, the variations remained within a narrow range (<3 MPa), suggesting that the filler’s effect on the material’s load-bearing capacity is marginal and does not significantly compromise mechanical integrity after 28 days of curing. Two grinding processes (0.5 h or 1.0 h), combining low or intermediate filler proportions (0.5–1.5%), resulted in a less dense and mechanically less efficient matrix. This highlights the importance of optimizing filler processing (grinding) and dosage to ensure its incorporation has a positive effect.
Works such as that of Assaad and Saba [
29] report that the seashell decreased the strength due to a dilution effect that reduces the content of the aluminoscylate precursor and, therefore, the formation of rigid bonds. On the other hand, González et al. [
26] proposes that a decrease in strength is due to the distribution of particle size and texture of these, which influences the internal organization and interaction with the cement.
In all cases, filler levels of 2.5% and 5.0% decreased compressive strength compared to formulations containing 0.5% to 2.0%. The loss can exceed 0.75 to 1.55 MPa relative to the control, indicating a loss of matrix structural integrity. This demonstrates a clear penalizing effect of filler overdosing, regardless of the grinding level.
The compressive strength results can also be interpreted considering the particle size distribution presented in
Table 2. The slightly higher strength observed for MFC0.5h–1.0% (26.16 MPa) suggests that coarser particles (D
50 ≈ 0.383 mm) provide an adequate packing contribution without significantly increasing the specific surface area. In contrast, finer particles obtained at longer grinding times, such as 1.5 h (D
50 ≈ 0.081 mm), only resulted in improved strength at moderate dosages (e.g., 2.0%), indicating that particle refinement enhances matrix densification when properly balanced. However, at higher filler contents (2.5% and 5.0%), the finest material led to strength reductions, which can be attributed to the significant increase in specific surface area associated with this level of fineness, which raises water demand and promotes particle agglomeration, negatively affecting matrix continuity and load transfer capacity. These results confirm that the effect of grinding time on compressive strength depends on achieving a balance between particle size (from D
50 ≈ 0.383 mm to 0.081 mm), surface area, and filler dosage.
3.4. Microscopic Morphology Analysis
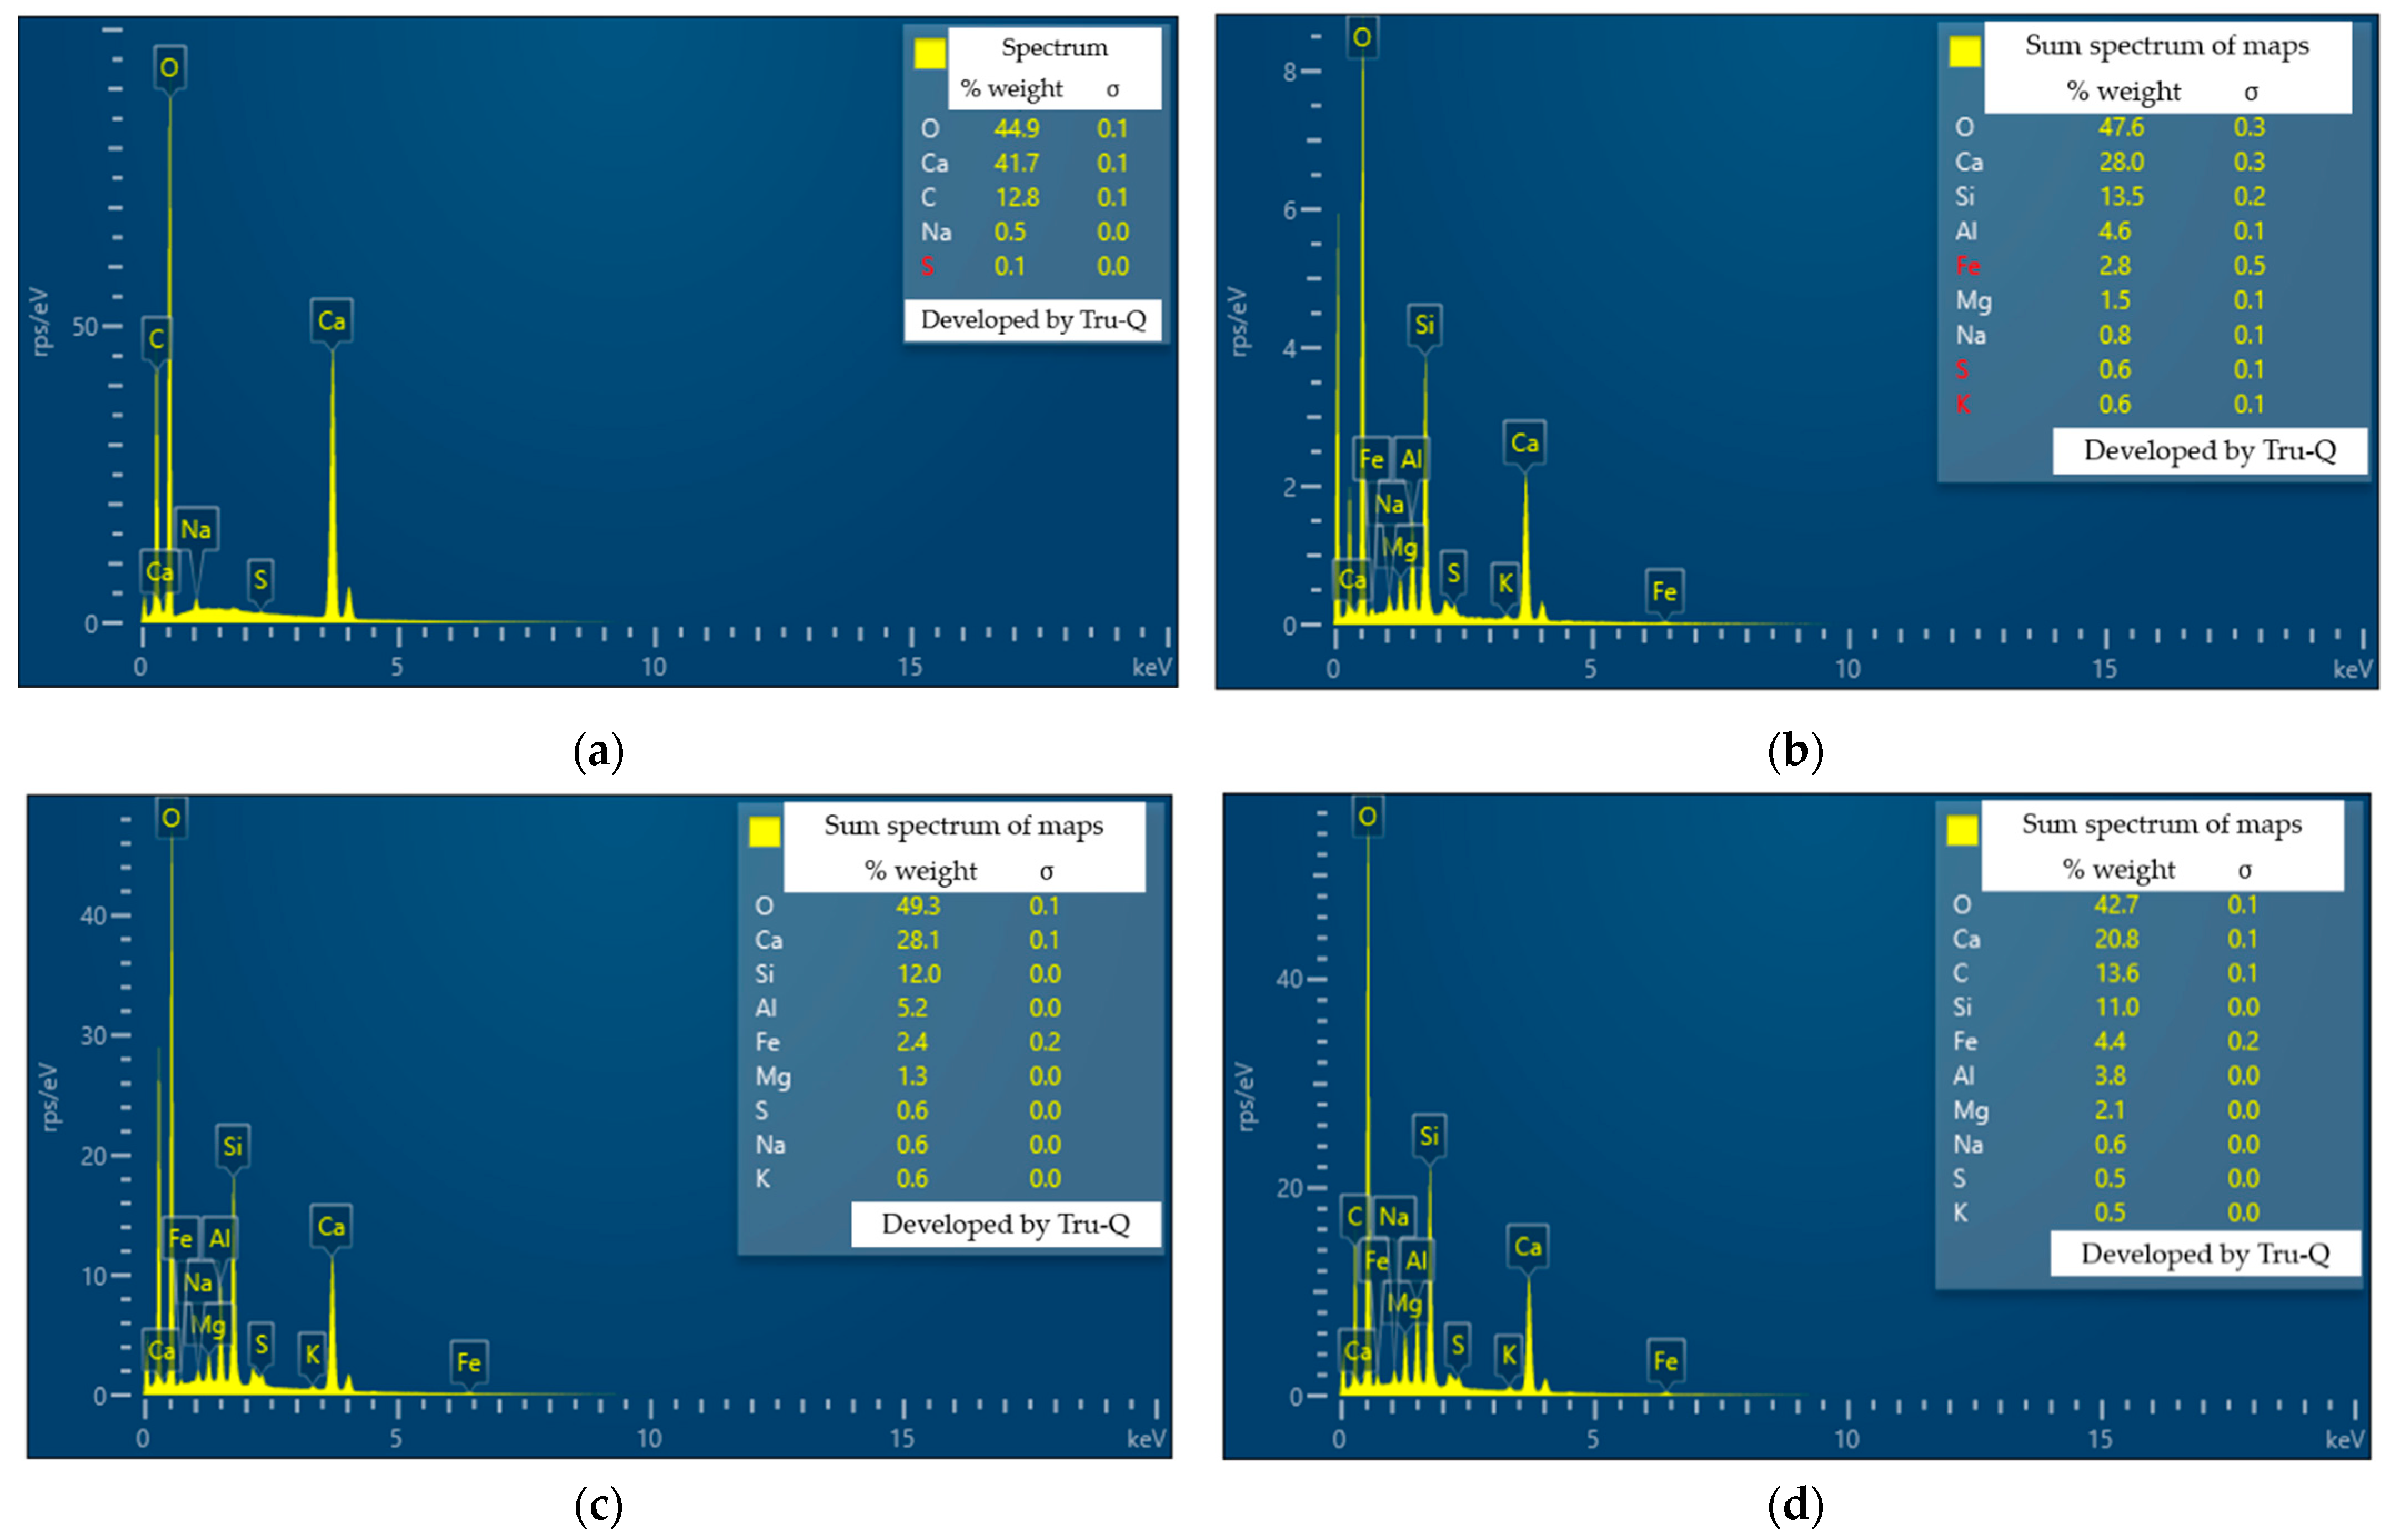
Energy dispersive X-ray spectroscopy (EDX) analysis was performed on clam shell powder (C), control specimen powder (MC), and 1 h milled specimen powder with 2.5% (MFC1.0h–2.5%) and 5% (MFC1.0h–5.0%) filler and is presented in
Figure 5. The analysis performed on the clam shell powder presented in
Figure 5a revealed an elemental composition dominated by oxygen (44.9%) and calcium (41.7%), consistent with the majority presence of calcium carbonate (CaCO
3) [
28], a typical structural component of marine biogenic materials. In addition, a significant carbon content (12.8%) was detected, reinforcing the presence of the carbonate group in the matrix. Trace elements such as sodium (0.5%) and sulfur (0.1%) were also identified, possibly associated with soluble salts or traces of natural organic compounds. The high proportion of Ca and O, along with C, confirms the material’s suitability as a source of mineral filler with cementing potential or as an inert filler in cementitious applications or ecological mortars.
The EDX spectrum of the control specimen reveals an elemental composition dominated by oxygen (47.6%) and calcium (28.0%) [
26], followed by silicon (13.5%) and aluminum (4.6%), which is characteristic of hydrated cementitious matrices where phases such as C-S-H (hydrated calcium silicate) and calcium aluminates predominate according to
Figure 5a. Minor levels of iron (2.8%) and magnesium (1.5%) were also detected, which could be associated with mineral impurities or the original composition of the clinker. Trace elements such as sodium, sulfur, and potassium (0.6–0.8%) reinforce the presence of typical components of Portland cement.
EDX analysis of specimen MFC1.0h–2.5% in
Figure 5b reveals a composition rich in oxygen (49.3%) and calcium (28.1%), confirming the significant presence of calcium carbonate (CaCO
3) [
26], contributed by the addition of marine shell. Relevant amounts of silica (12.0%) and alumina (5.2%), typical components of the hydrated cementitious matrix (C-S-H and hydrated calcium alumina), are also observed. The presence of iron (2.4%), magnesium (1.3%) and traces of sodium, sulfur and potassium (all at 0.6%) indicates a heterogeneous mineralogical composition consistent with supplementary cementitious materials.
Similarly, EDX analysis of specimen MFC1.0h–5.0% shows a chemical composition dominated by oxygen (42.7%) and calcium (20.8%), indicating the significant presence of calcium carbonate from the seashell filler [
26]. It also highlights a notable carbon content (13.6%), higher than other formulations with a lower seashell dosage, reinforcing the influence of biogenic material. Silica (11.0%) and alumina (3.8%) are also identified, essential elements of the hydrated cementitious matrix. The presence of iron (4.4%) and magnesium (2.1%), along with traces of sodium, sulfur, and potassium, suggests a complex mineral composition, possibly related to the clinker and secondary hydration products.
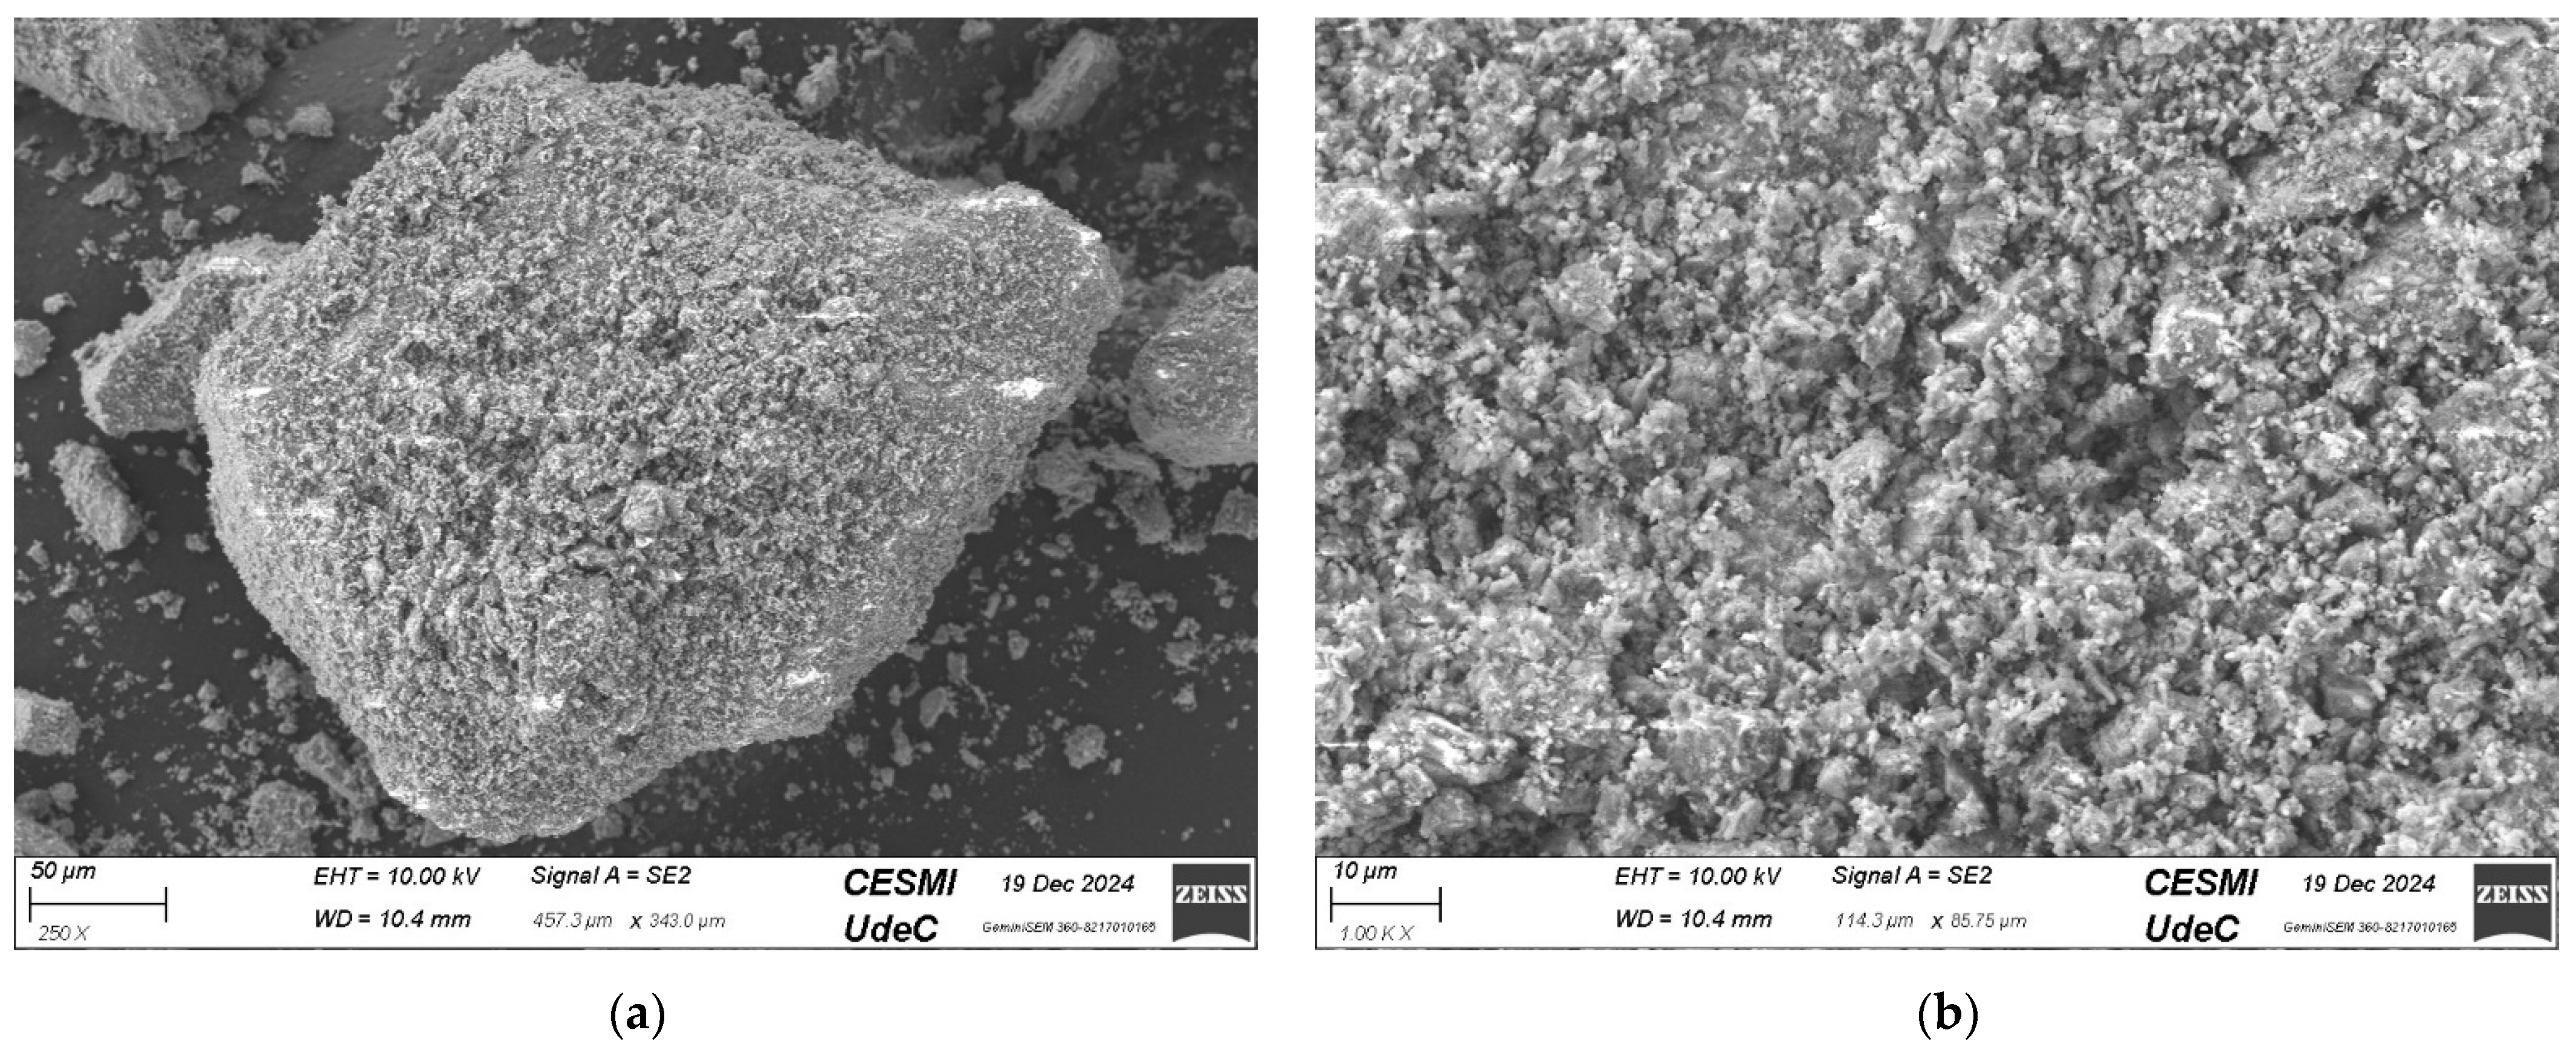
SEM images of the clam sample are presented in
Figure 6. First,
Figure 6a shows a clam particle with an irregular morphology, its surface covered by fine agglomerated particles, suggesting a complex and highly rough structure. Surface microfractures and interstitial pores are observed, as well as smaller fragments dispersed in the surroundings, a product of the grinding process. This topography indicates that the particle has a high specific surface area, which may favor its interaction with the cementitious matrix by acting as a nucleation center for hydration products or as a physical filler [
26]. However, its high porosity and roughness could also increase the water demand in fresh mixtures, affecting workability. On the other hand,
Figure 6b shows the same clam particle at a magnification of 1000×. Its microstructure is heterogeneous, composed of particles with irregular geometry and angular edges, with sizes ranging from a few micrometers to tens of microns. A predominantly rough texture is observed, with evidence of fractures and broken surfaces, consistent with a mechanical grinding process. In addition, groups of finer particles adhered to larger structures are distinguished, suggesting a tendency toward agglomeration. This morphology favors its behavior as a physical filler in cementitious matrices, facilitating pore filling and improving system compaction, although its rough surface could also imply greater water demand in fresh mixtures.
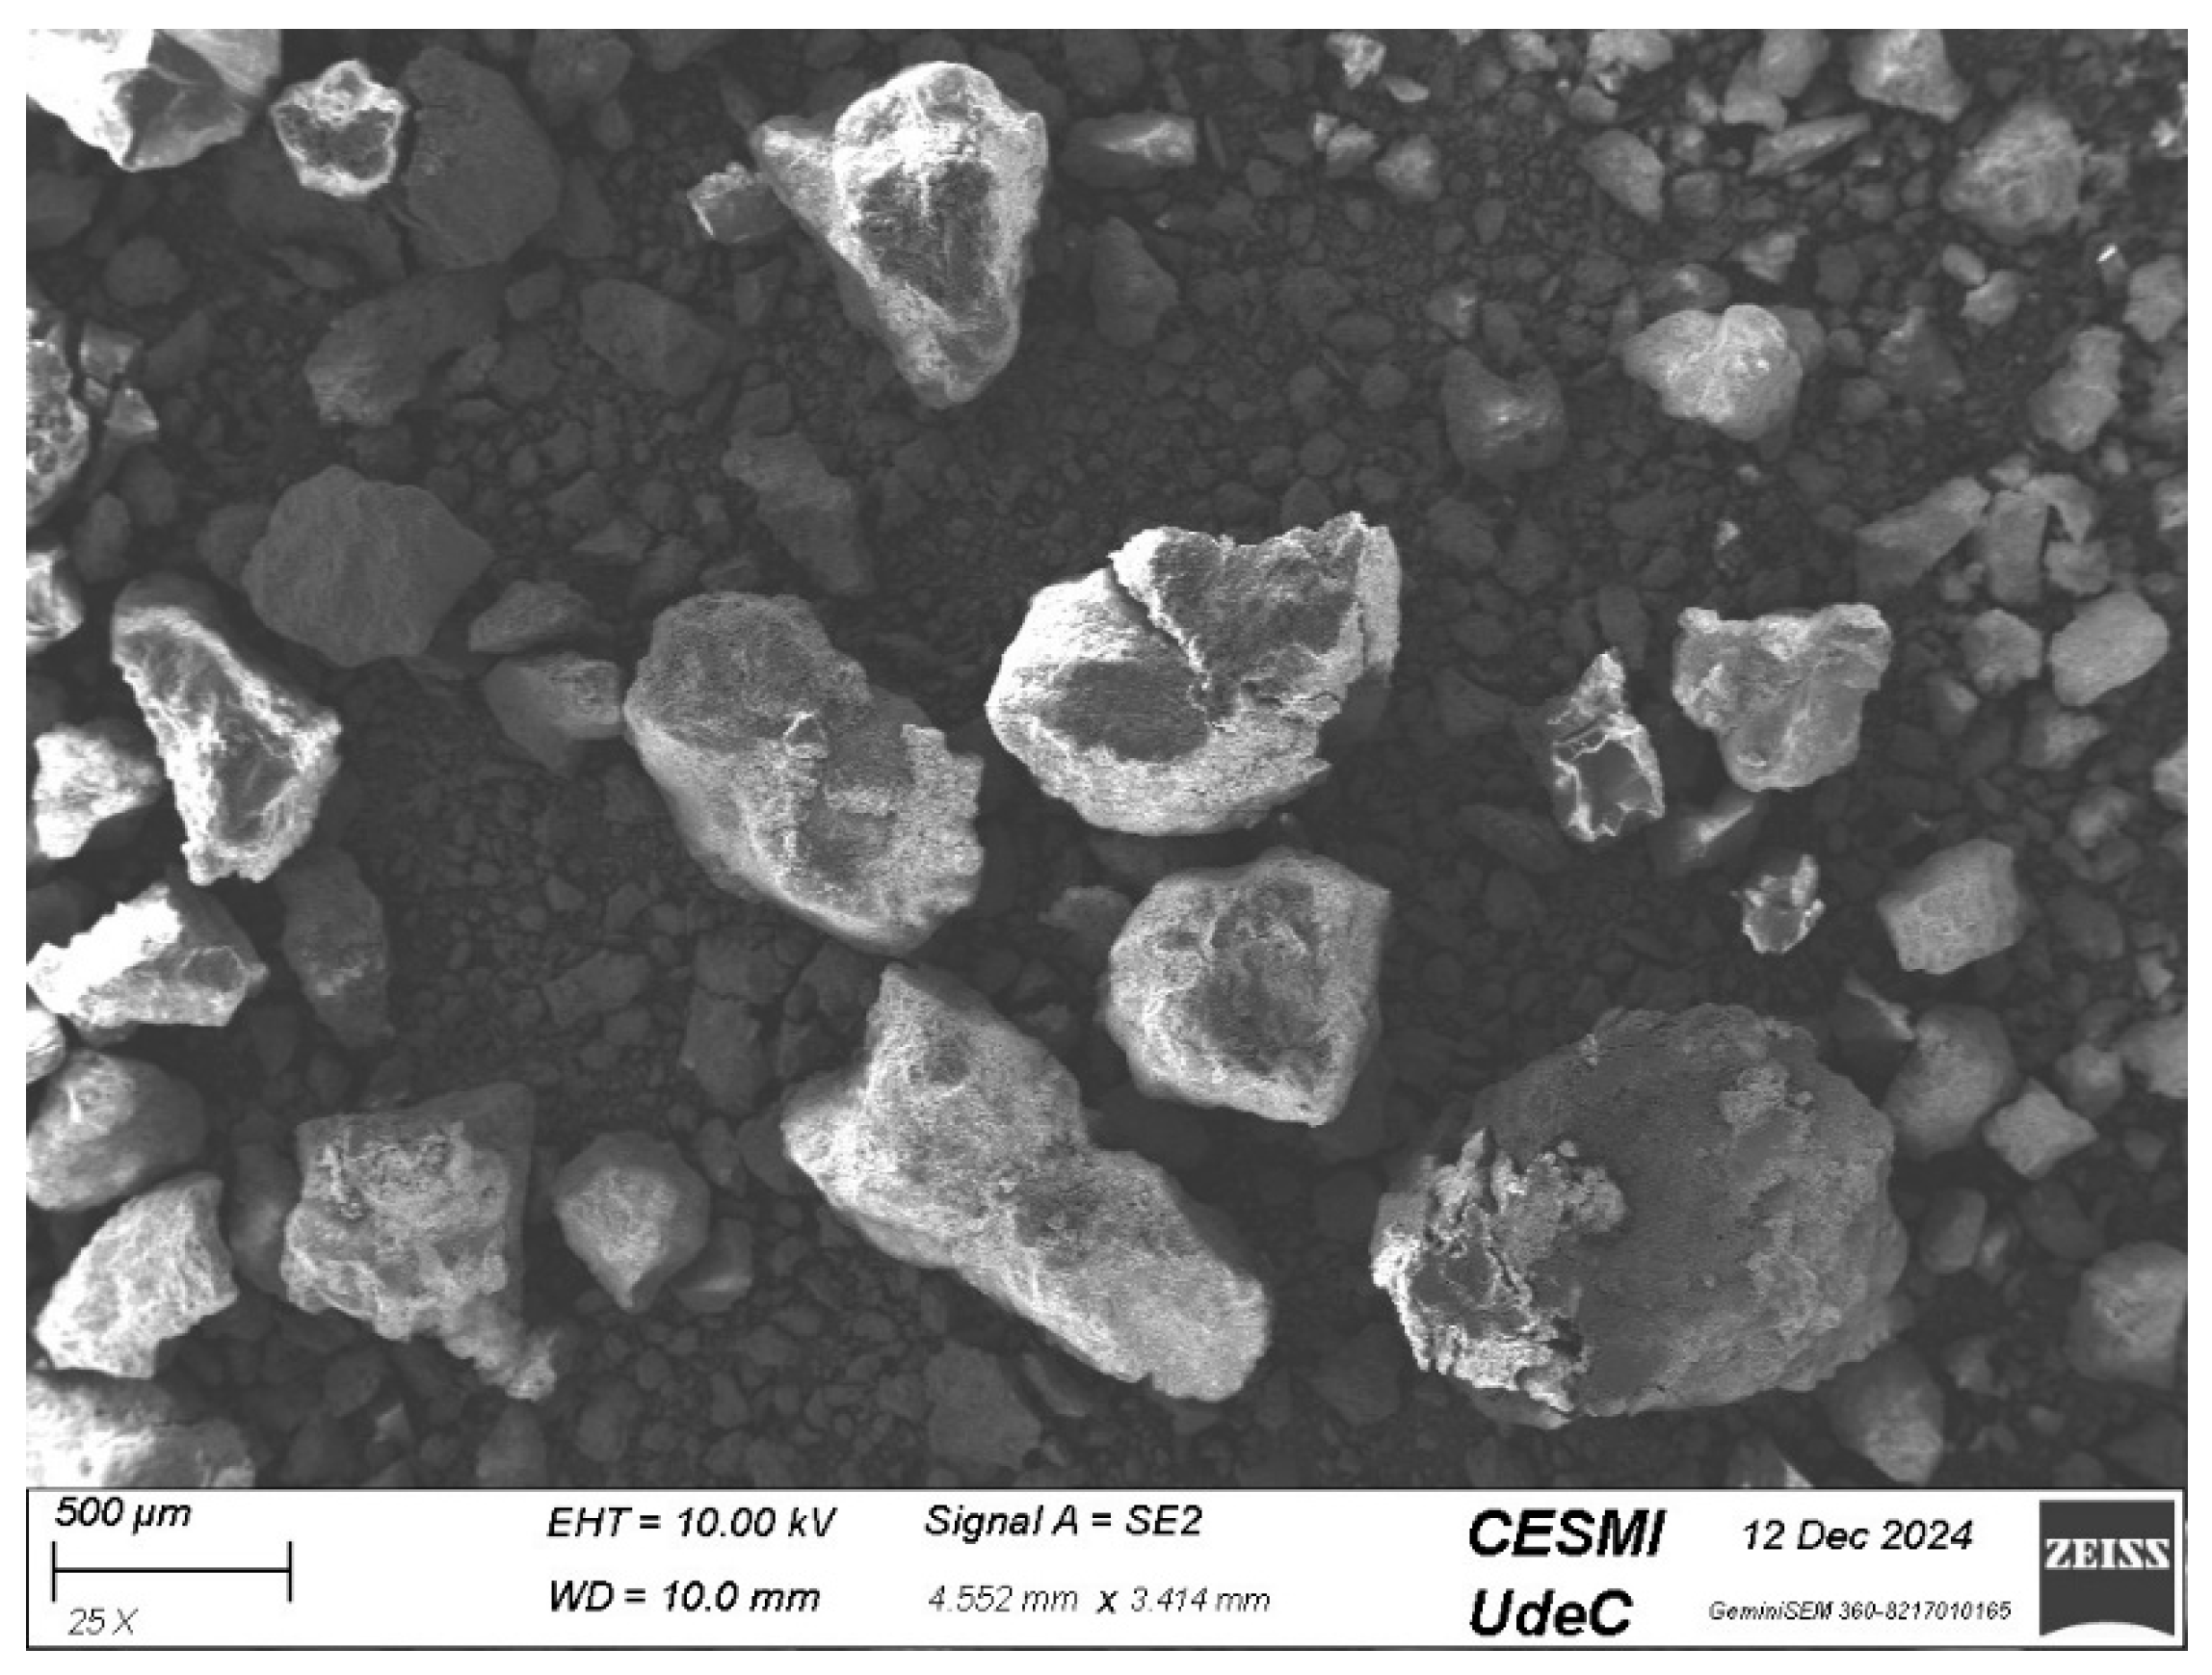
The SEM image in
Figure 7 shows the general morphology of the powder belonging to the control sample (MC), composed exclusively of materials from the conventional cementitious system. At this low magnification (25×), medium to coarse particles are observed, with dimensions exceeding 500 µm, with angular and irregular shapes, typical of crushed or incompletely hydrated mineral components. The surface of the particles is more compact and continuous compared to those observed in samples with seashell, and is distinguished by the absence of fine aggregates or secondary coatings. Furthermore, the particulate environment lacks the surface agglomeration present in samples with biogenic filler, indicating lower overall roughness and low surface porosity. This structure suggests more predictable and stable behavior from the perspective of workability and densification.
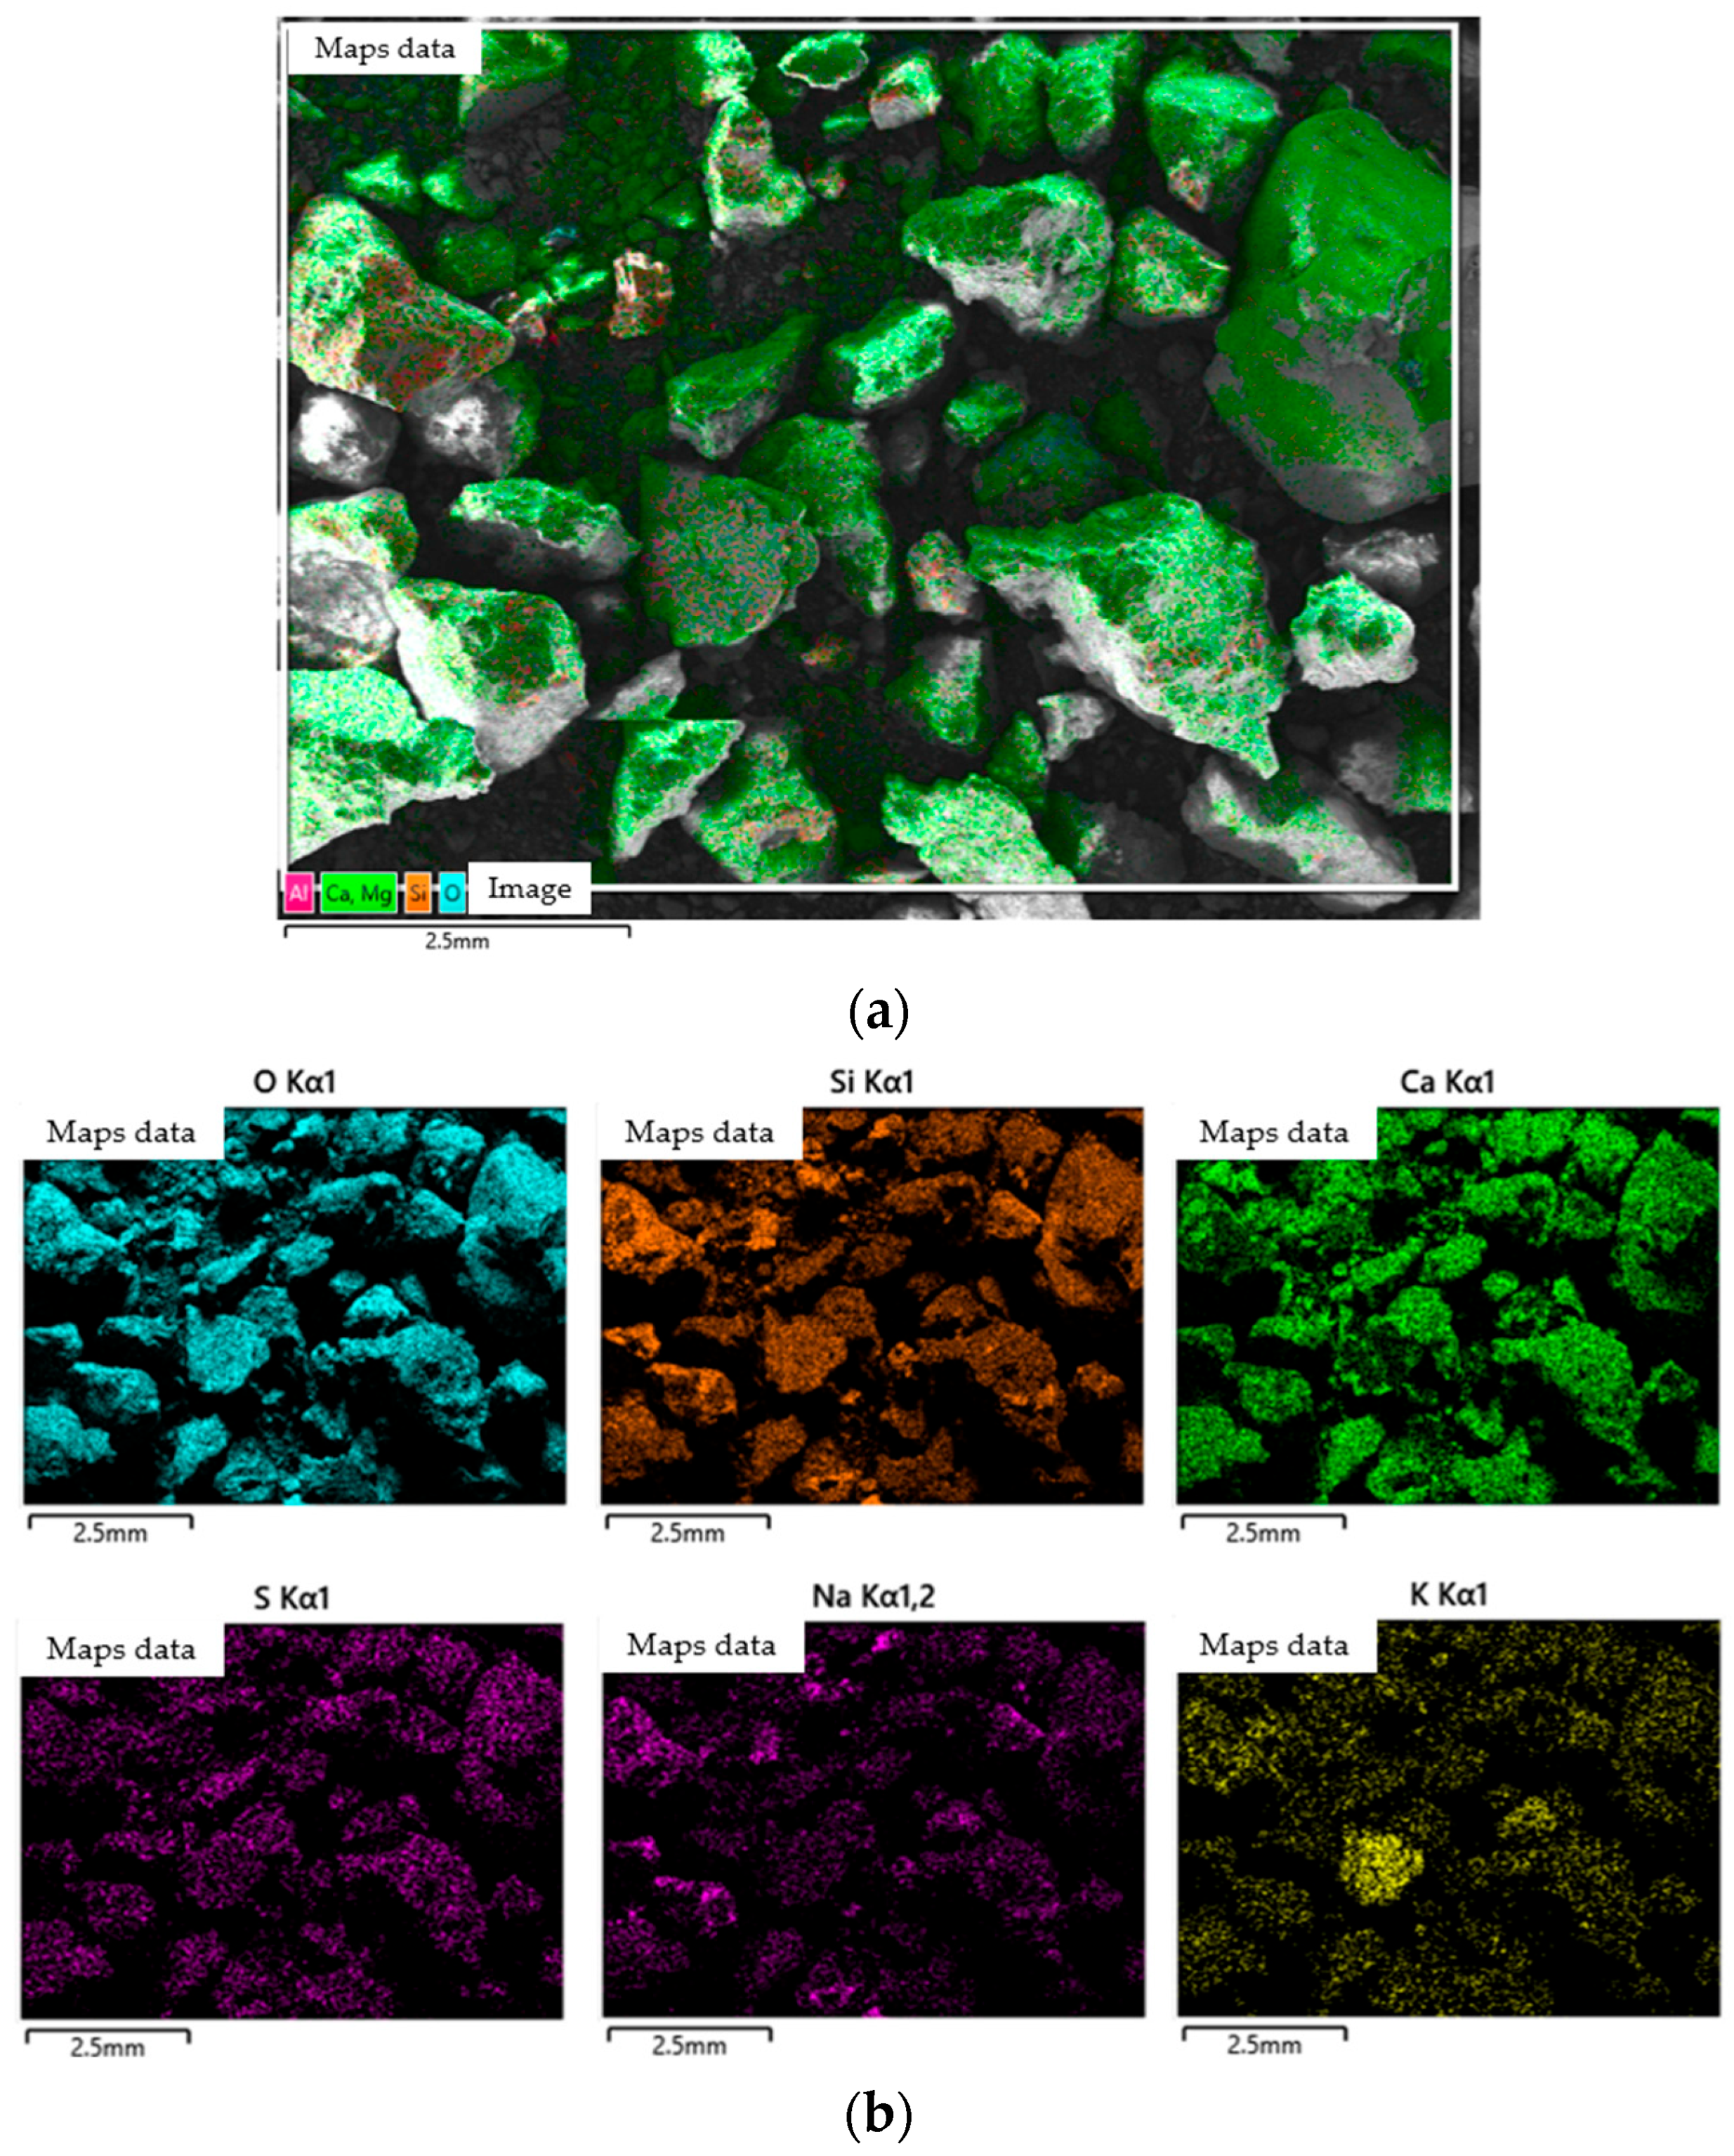
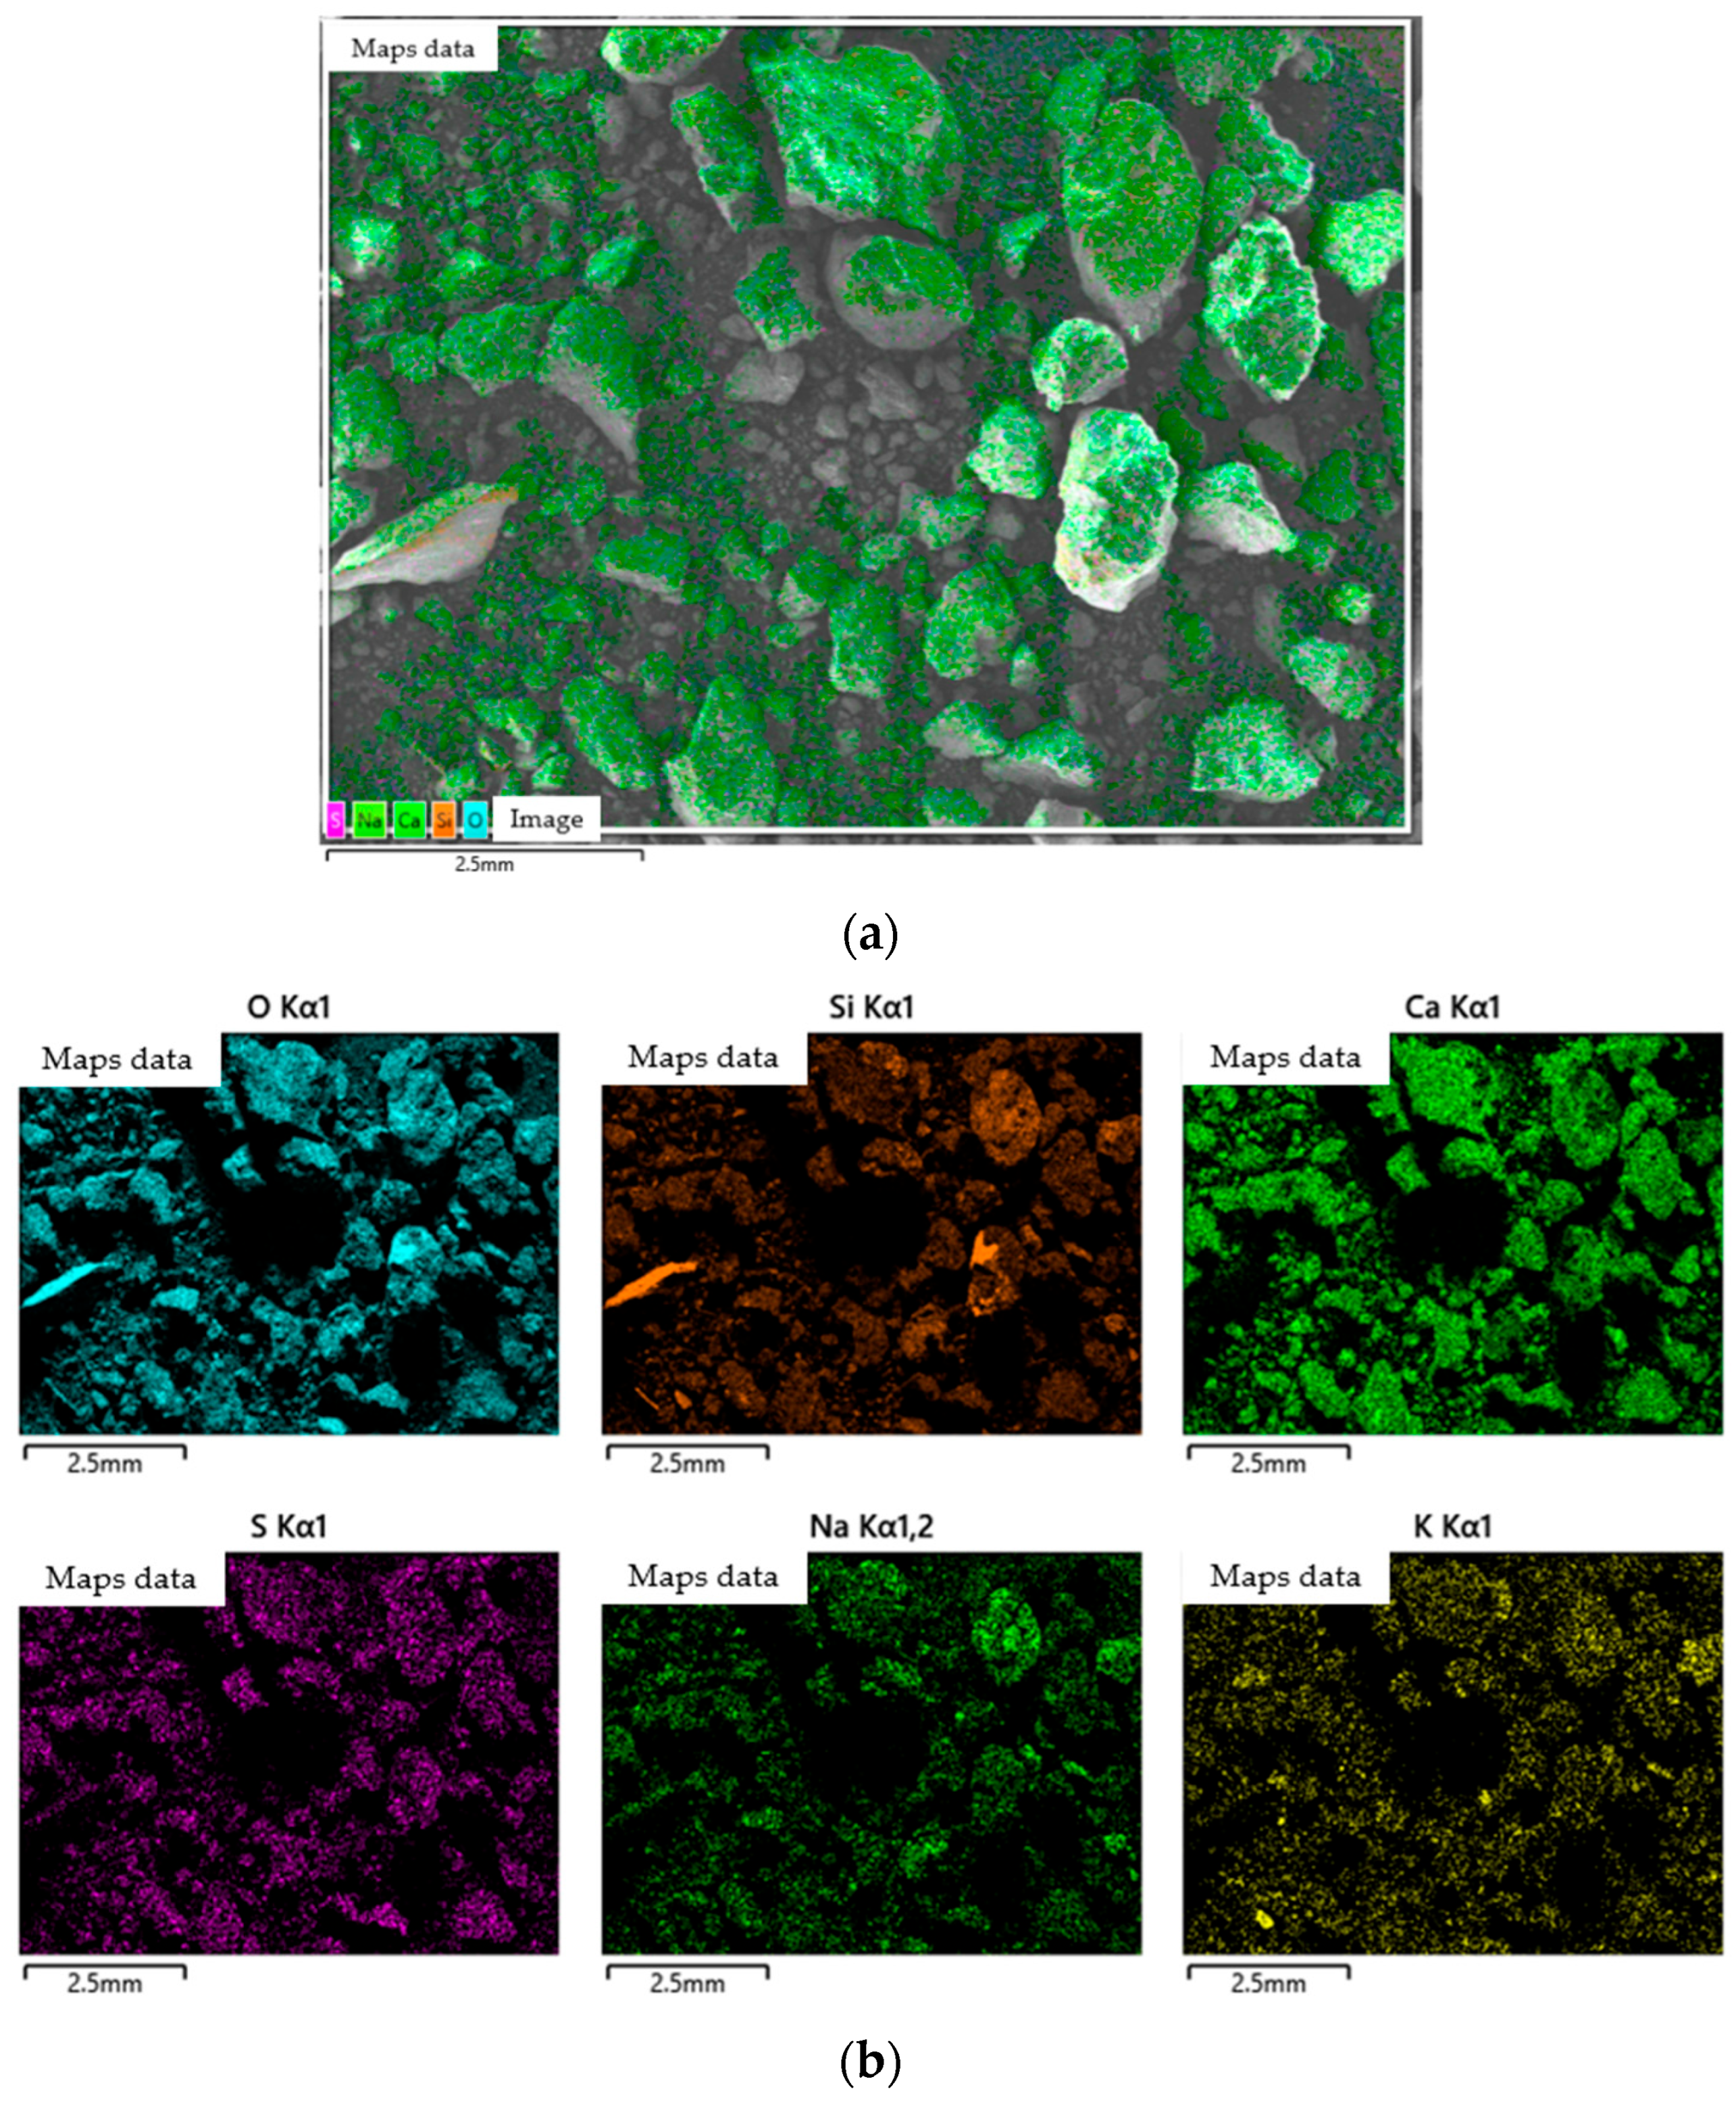
Figure 8 shows the spatial distribution of the main elements detected on the surface of the MFC1.0h–2.5% powder sample by EDX, superimposed on the SEM micrograph.
Figure 8a shows that calcium (Ca, in green) is widely distributed over the surface of the larger particles, while elements such as sodium (Na), sulfur (S), silicon (Si), and oxygen (O) appear more dispersed or in specific areas. This visualization corroborates the integration of the seashell filler in the matrix, showing a compositional heterogeneity consistent with the incorporation of biogenic and cementitious material.
Figure 8b presents the individual distribution maps of the elements O, Si, Ca, S, Na, and K. The Ca map confirms its predominance over the larger particles, while silicon (Si) appears more homogeneously distributed, reflecting its origin in the cementitious phases (such as C-S-H). Overall, the maps show good dispersion of the filler and allow us to infer that its incorporation does not generate relevant chemical segregations, which supports its potential as a complementary mineral addition.
Figure 9 shows the analysis performed on sample MFC1.0h–5.0%.
Figure 9a shows the SEM micrograph on which the elemental mapping of the main elements detected has been superimposed: calcium (Ca, in green), magnesium (Mg, in red), silicon (Si, in pink), and oxygen (O, in cyan). The calcium signal appears very abundantly distributed over the surfaces of the larger particles, demonstrating the strong presence of the calcium carbonate-rich seashell filler. Unlike the 2.5% sample, greater Ca coverage of the matrix is observed here, indicating a higher relative proportion of the filler. Magnesium and silicon appear with lower intensity and in more discrete areas, while oxygen shows a generalized distribution. This visualization suggests a more dominant interaction of the filler within the matrix, although with a possible tendency toward surface agglomeration.
On the other hand,
Figure 9b shows the maps of the elements O, Si, Ca, S, Na and K. Calcium (Ca) is the most dominant component, with a dense and continuous distribution, reflecting the abundance of the calcareous filler. Compared to the MFC1.0h–2.5% sample, the Ca signal is observed to dominate more clearly, suggesting a greater surface coverage of carbonate-rich particles.
3.5. Statistical Analysis Results
A multifactor ANOVA was conducted to assess the effects of grinding time (hours) and filler percentage on the compressive strength (MPa) of the mortars. This analysis evaluates the statistical significance of the main factors and quantifies their relative contribution to the variability of compressive strength (MPa) in the system (see
Table 5).
Both factors exhibit a statistically significant effect at the 95% confidence level. Grinding time shows a highly significant influence (F = 9.70, p = 0.0002), whereas filler percentage also presents a significant, although less pronounced, effect (F = 2.62, p = 0.0322). The higher sum of squares associated with grinding time indicates that this factor accounts for a larger proportion of the total variability, highlighting its dominant role in controlling compressive strength.
The estimated marginal means for each factor level are presented in
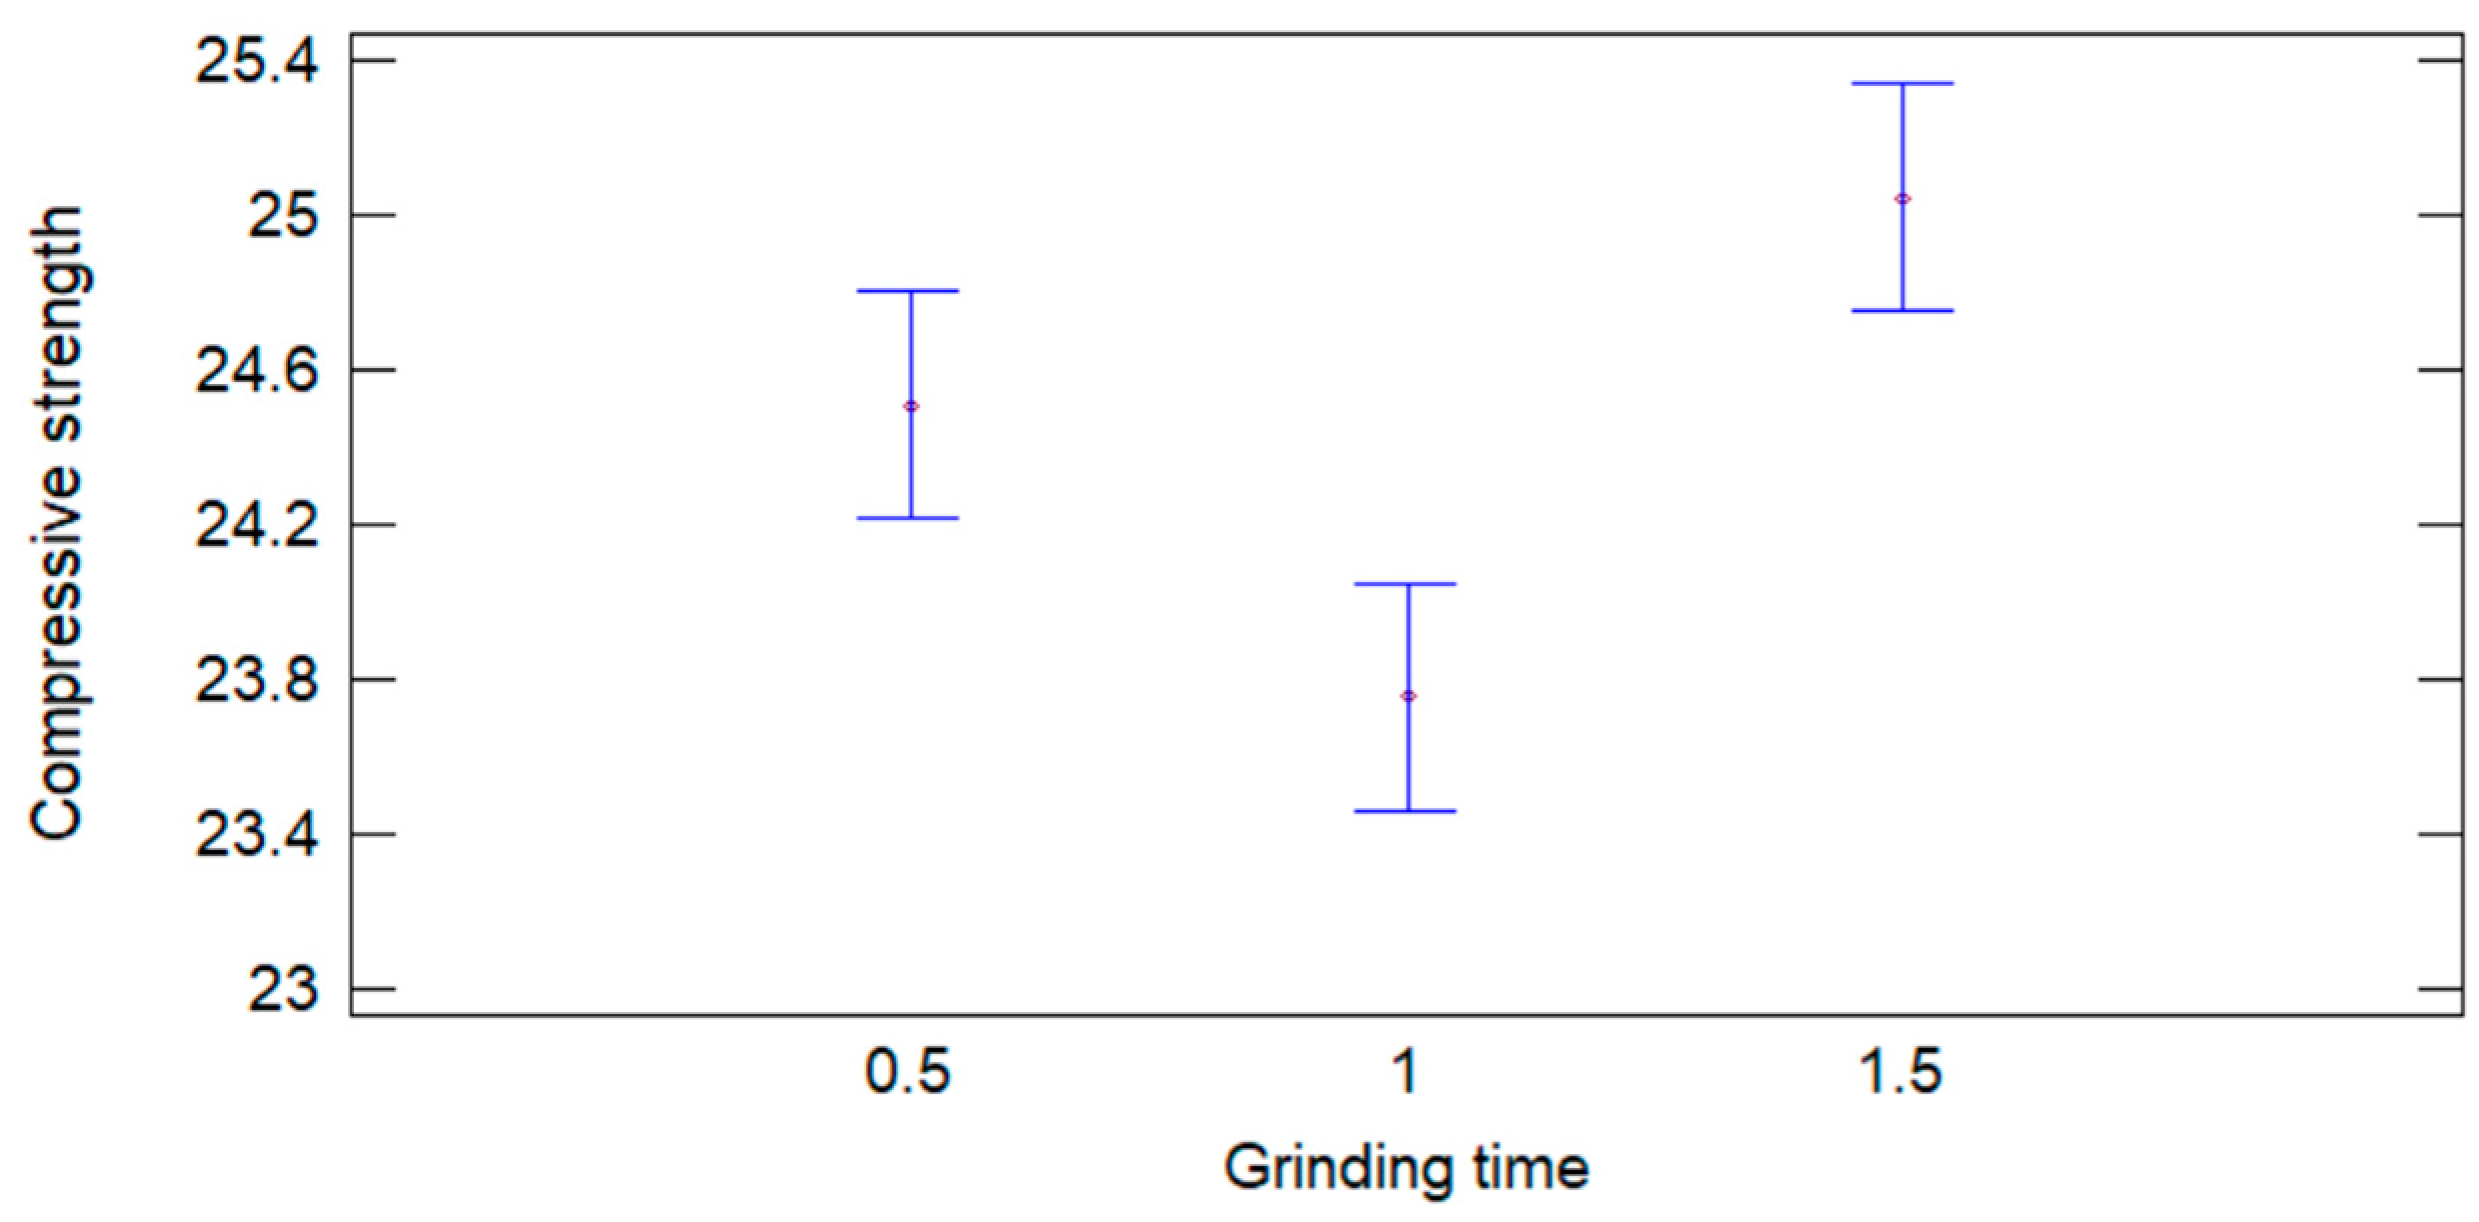
Table 6. For grinding time, the highest compressive strength is obtained at 1.5 h (25.05 MPa), followed by 0.5 h (24.51 MPa), while the lowest value corresponds to 1.0 h (23.75 MPa). This behavior suggests that compressive strength does not vary linearly with grinding time and that intermediate fineness does not necessarily lead to improved mechanical performance.
Regarding filler percentage, the variation in compressive strength is less pronounced. The maximum value is observed at 2.0% (25.06 MPa), whereas the lowest strength is associated with 5.0% (23.62 MPa), indicating that higher filler contents may negatively affect the mechanical response.
The multiple comparison test based on Fisher’s Least Significant Difference (LSD), shown in
Table 7, reveals statistically significant differences between specific levels of grinding time. In particular, the differences between 0.5 h and 1.0 h, and between 1.0 h and 1.5 h, are significant, whereas no significant difference is observed between 0.5 h and 1.5 h. This confirms that the reduction in compressive strength at 1.0 h is statistically relevant.
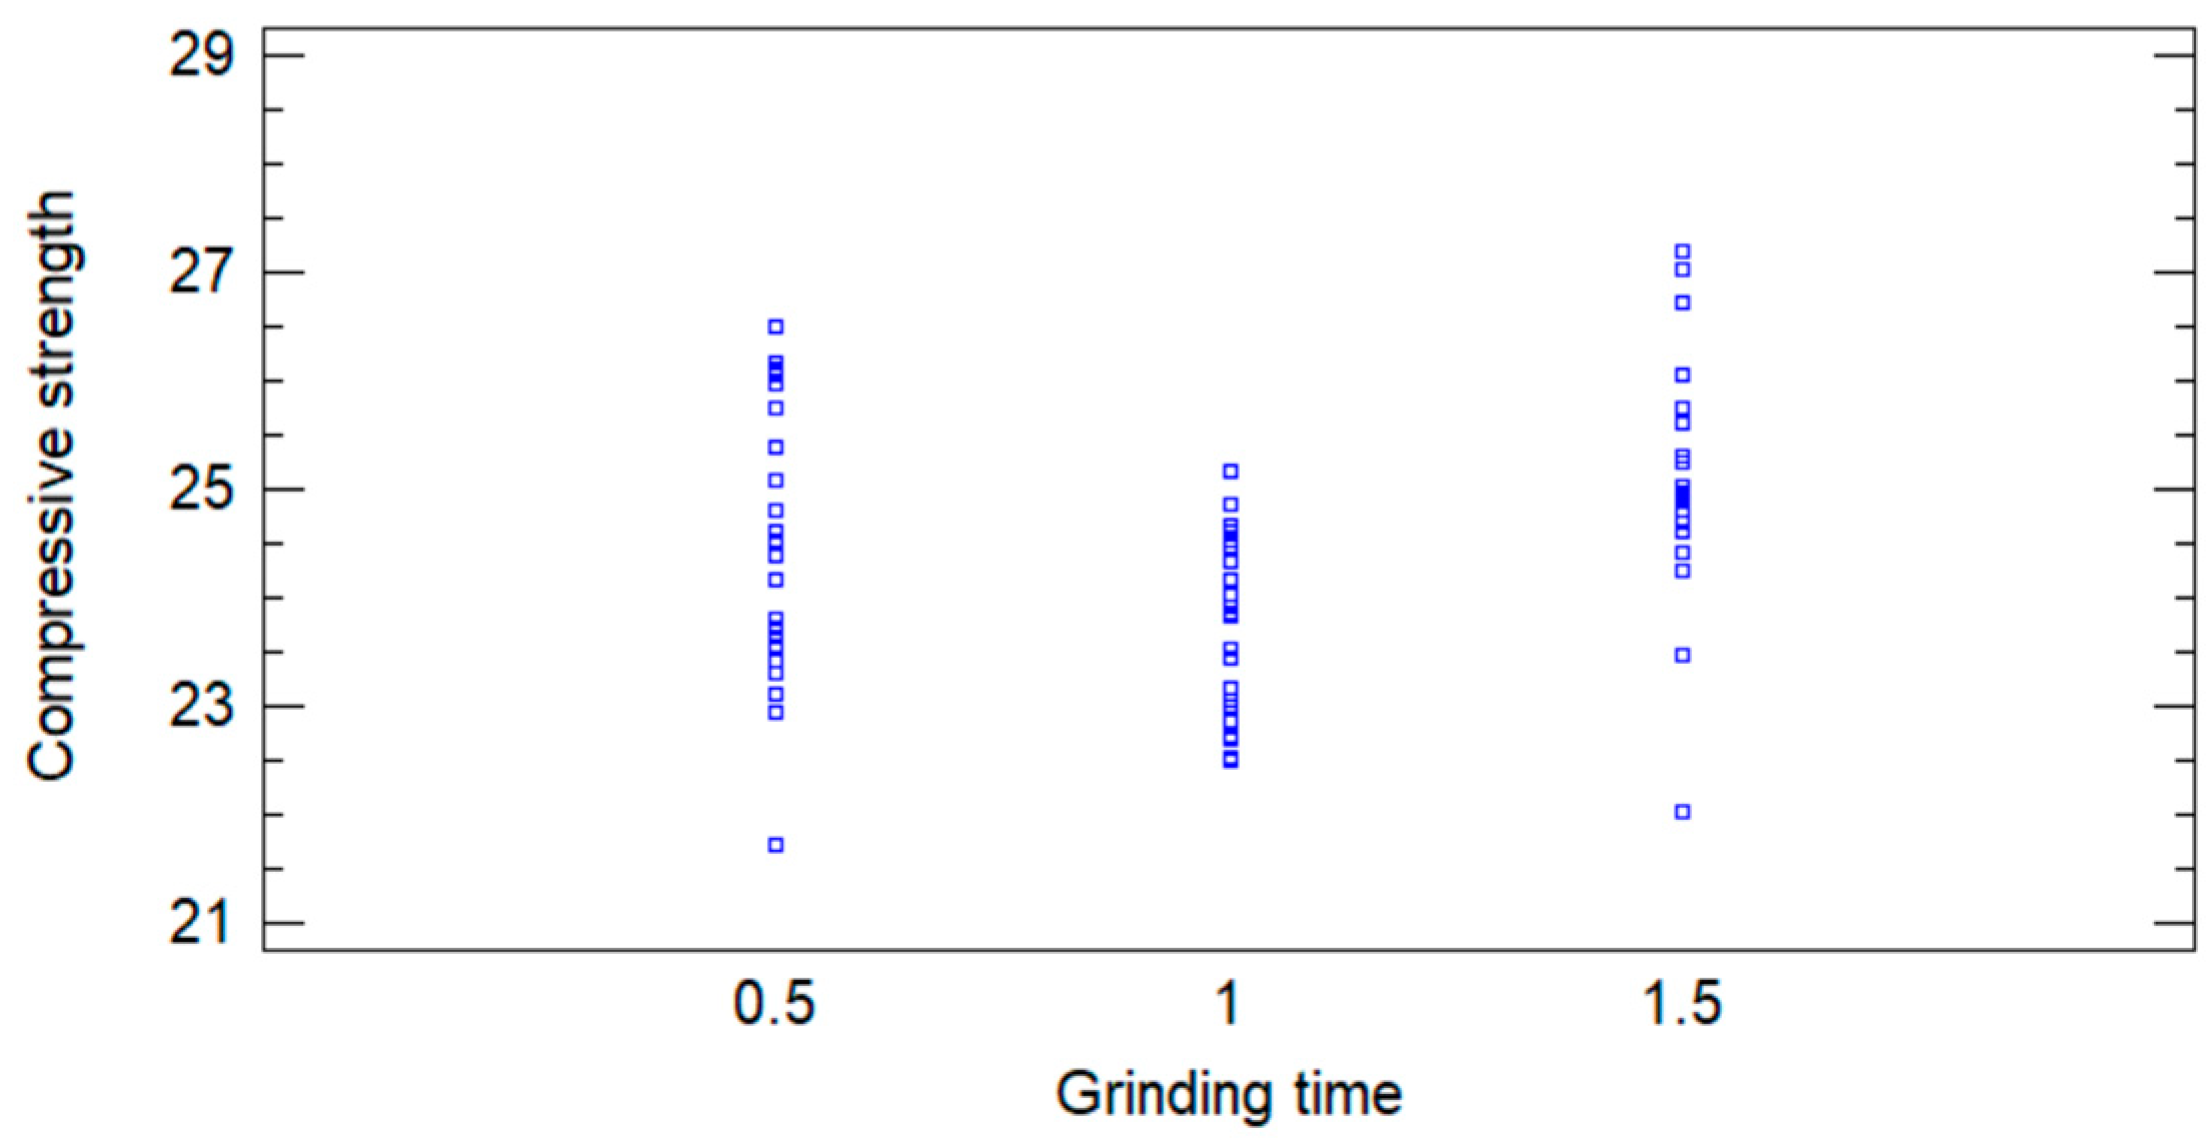
The distribution of experimental data is illustrated in
Figure 10, where a clear separation between grinding time levels can be observed. The results for 1.5 h tend to cluster at higher strength values, while those corresponding to 1.0 h are consistently lower. The relatively uniform dispersion across groups suggests homogeneity of variance.
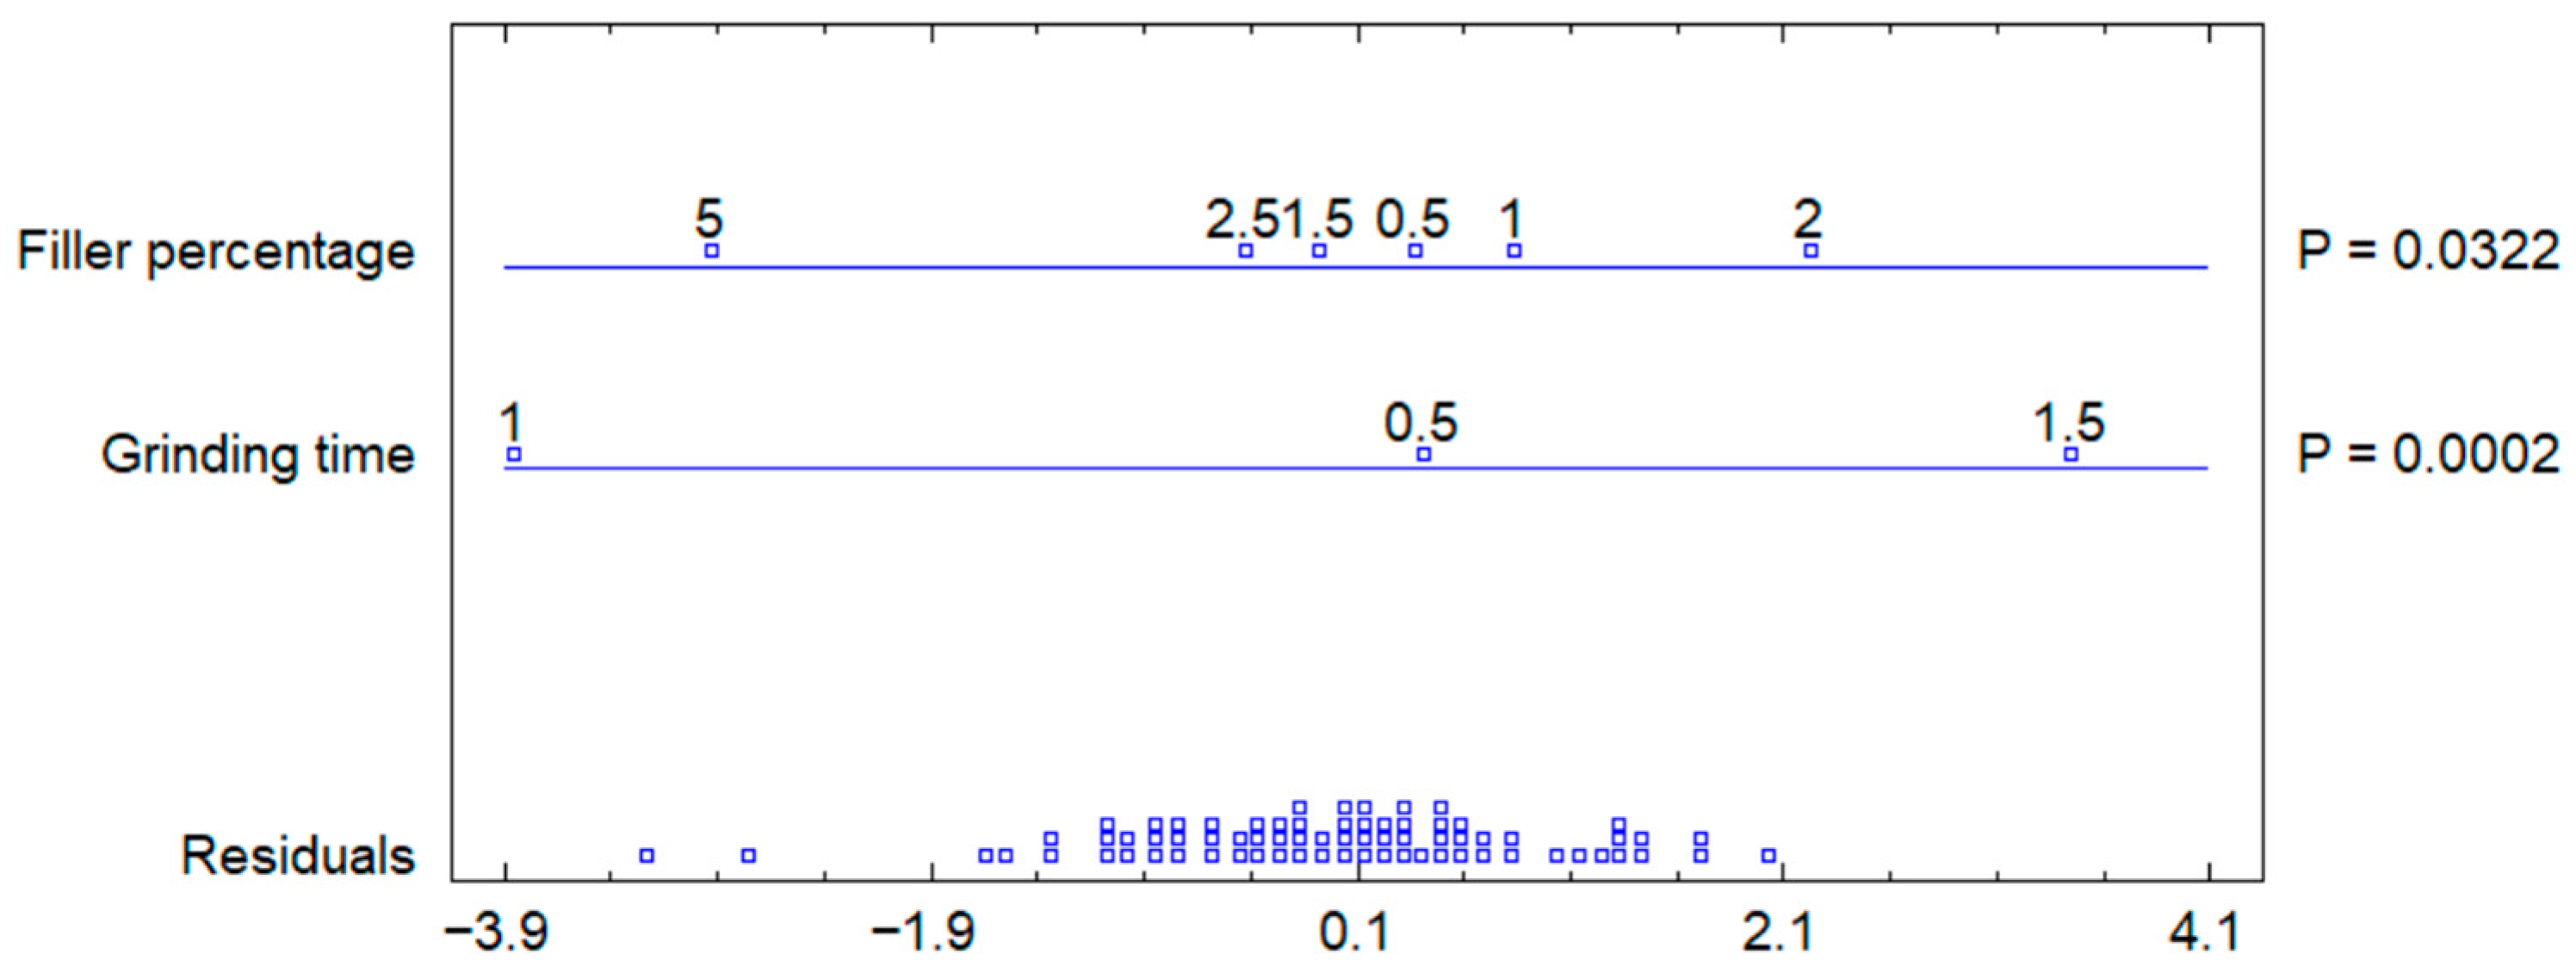
The graphical ANOVA representation (
Figure 11) further supports these findings, confirming the stronger influence of grinding time compared to filler percentage. The residuals are randomly distributed around zero, indicating that the assumptions of the ANOVA model are satisfied.
Finally, the means plot with 95% confidence intervals (
Figure 12) shows that the confidence intervals for 0.5 h and 1.5 h overlap, whereas those for 1.0 h are clearly separated, reinforcing the statistical differences identified in the LSD analysis.
Overall, the results demonstrate that both grinding time and filler percentage significantly affect compressive strength; however, grinding time is the governing factor. This suggests that particle fineness plays a critical role in defining the mechanical performance of the mortars, while filler dosage exerts a secondary influence.




 ,
,