Article

Theoretical and Numerical Investigation of Material-Driven Polymer GRIN Lens Optimization Design


1
Department of Light Sources and Illuminating Engineering, College of Intelligent Robotics and Advanced Manufacturing, Fudan University, Shanghai 200433, China
2
Institute for Electric Light Sources, Fudan University, Shanghai 200433, China
*
Author to whom correspondence should be addressed.
Appl. Sci. 2026, 16(8), 3734; https://doi.org/10.3390/app16083734
Submission received: 16 March 2026 / Revised: 6 April 2026 / Accepted: 7 April 2026 / Published: 10 April 2026
(This article belongs to the Section Optics and Lasers)

Abstract

This paper presents a systematic investigation into the design and performance of layered polymer gradient refractive index (GRIN) lenses. A material-driven optimization algorithm is proposed, which uses physical volume fractions of the constituent polymers to parameterize the refractive index distribution. By integrating effective medium theory with Sellmeier-based dispersion data, the algorithm ensures that the gradients remain within physically realizable material limits while better aligning with actual refractive index profiles. First, refractive index distribution models for first-order radial GRIN lenses and linear spherical radial GRIN lenses were derived based on material properties, establishing manufacturable lens parameterization expressions. Subsequently, simulation software was employed to model and compare a first-order GRIN doublet, a cemented doublet, a linear spherical radial GRIN lens, and a first-order GRIN aspheric lens. Numerical results demonstrate that the proposed GRIN structures exhibit superior performance in both monochromatic aberration suppression and chromatic control, particularly under large aperture conditions. For a lens system with a 50 mm focal length and a 25 mm entrance pupil diameter, the spherically symmetric GRIN lens achieves diffraction-limited chromatic performance, with its secondary spectrum reduced by over 70% compared to conventional cemented doublets. Furthermore, the first-order GRIN doublet maintains the smallest RMS spot size across multiple fields of view and exhibits the most stable aberration growth rate as the aperture increases. These results validate the feasibility of the material-driven GRIN modeling approach and provide theoretical support for high-performance, short-focal-length optical systems.

1. Introduction

Lens development has achieved substantial progress driven by advancements in optical design, materials science, and manufacturing technology; consequently, lenses have become critical components in modern imaging and detection systems. In this context, short-focus lenses face significant constraints in traditional design due to geometric limitations. By utilizing high-refractive-index optical plastics (such as polycarbonate or cyclo-olefin polymer, COP) or glass materials, designers can enlarge the radius of curvature while maintaining a short focal length, thereby reducing system volume. In recent years, the maturation of molding processes for glass aspheric lenses has enabled the mass production of cost-effective, high-precision lenses. These lenses effectively correct aberrations such as spherical aberration, coma, field curvature, astigmatism, and distortion through their aspheric surfaces. Aspherical short-focus lenses have become the predominant design. However, balancing the conflicting requirements of ultra-short focal length, large field of view, high resolution, and thinness remains challenging for aspherical lenses. Gradient refractive index (GRIN) lenses represent a novel class of optical elements. Unlike traditional lenses, their refractive index is distributed according to a specific pattern. This allows for the simultaneous optimization of refractive index distribution and surface geometry, significantly increasing design freedom and thereby enhancing optical performance [1,2,3].
Common GRIN lenses include spherical lenses with centrosymmetric profiles and cylindrical lenses with radial or axial distributions. Spherical lenses primarily encompass optical black holes, Maxwell fish-eye lenses, Luneburg lenses, and Eaton lenses; cylindrical lenses mainly refer to radial gradient refractive index lenses and axial gradient refractive index lenses. An optical black hole is an idealized device where the refractive index distribution changes at a rate of at least 1 / r with a central refractive index of positive infinity. Neglecting reflections, light rays incident from any direction at any angle cannot escape the device, analogous to celestial black holes. A Maxwell fish-eye lens refers to a spherical lens with focal points located at two positions symmetrical about the center of the sphere on the lens surface. The Luneberg lens, proposed by physicist R.K. Luneberg in 1944, can converge parallel light from any direction onto the lens surface and has extensive applications in the electromagnetic field [4,5,6,7]. Eaton lenses refer to a class of spherical lenses capable of deflecting parallel light directions as a whole. Common deflection angles include 180 degrees, 360 degrees, and 90 degrees, with some discussions extending to 540 degrees [8]. Rod lenses are cylindrical optical media that utilize a radial refractive index distribution to provide optical power through planar end surfaces [9,10]; these are fundamentally specialized cylindrical lenses. Radially gradient refractive index lenses exhibit refractive indices that gradually change radially from the central axis of the cylinder while remaining constant axially. Gradient refractive index fibers used in optical communications represent a type of radially gradient refractive index lens [11,12,13]. Regarding the fabrication of polymer GRINs, Wang et al. [14] developed a 1-mm-thick gradient refractive index lens model using polymethyl methacrylate (PMMA) and polylactic acid (PLA), as well as a 1-mm-thick single-refractive-index lens model using photoresist. However, the refractive index difference between these two sets of materials is very small, which limits the performance of the fabricated optical devices. This approach relies on the mutual diffusion of two different polymer solutions and the gelation process of the final mixture. Loffredo et al. [15] proposed a two-step method for preparing gels with continuous axial concentration gradients, using polyvinyl alcohol (PVA) and polyacrylic acid (PAA); however, the volume shrinkage issues associated with these materials make it difficult to guarantee the performance of the final product. Polushtaytsev et al. [12] investigated the diffusion process within a layer of a photopolymerizable composite under non-stationary light irradiation; this process led to the redistribution of the neutral component concentration and the formation of a uniform refractive index distribution, but could only produce a specific refractive index profile.
In this study, we aim to address the limitations of traditional polymer optics by developing a material-driven optimization framework for layered GRIN lenses. Specifically, this work establishes rigorous analytical models for first-order radial and spherically symmetric GRIN profiles, incorporating physical material constraints and dispersion characteristics through Sellmeier-based effective medium theory. By conducting a systematic comparative analysis of various lens architectures under large-aperture conditions, we identify the superior aberration-balancing mechanisms of spherical gradients and doublet configurations. Furthermore, the physical reliability of our numerical simulations is cross-validated using analytical third-order aberration theory, providing a robust foundation for the design of high-performance, short-focal-length optical systems.
To provide a clear overview of the research, the remainder of this paper is structured as follows. Section 2 presents the theoretical derivation of the refractive index profiles and the analytical framework for aberration decomposition. Section 3 describes the material parameters and the deterministic simulation environment utilized for optimization. The numerical results, performance comparisons, and theoretical validations are detailed in Section 4. Section 5 discusses the practical considerations of polymer lenses, followed by the concluding remarks in Section 6.

2. Refractive Index Distribution Profile of Radial GRIN Lens

A radial gradient refractive index lens (Radial GRIN Lens) is an optical element with a continuous gradient of refractive index perpendicular to the optical axis. Its refractive index varies with the distance from the optical axis, and the surfaces of constant refractive index are coaxial cylindrical surfaces. The refractive index distribution of a cylindrically symmetric GRIN lens can be expressed as [16]:
n ( r , z , λ ) = l = 0 L m = 0 M Γ l m ( λ ) z l r 2 m
where
Γ l m ( λ ) = k = 0 K ν k l m ( λ λ 0 ) k
where r is the radial distance to the optical axis, z is the distance along the optical axis from the origin axis, and λ 0 is the working wavelength. The coefficient ν k l m characterizes the dispersion properties of the material. Γ l m ( λ ) is referred to as the (l,m) gradient generator; see [17] for details.
A prominent example is the graded-index fiber, which is widely utilized in multimode optical communications and features a refractive index distribution conforming to a hyperbolic sine function. The present study, however, focuses on first-order radial GRIN fibers.

2.1. Refractive Index Distribution of First-Order Radial GRIN

It is generally accepted that a first-order radial GRIN lens refers to a lens whose refractive index distribution satisfies:
n ( r ) = n 0 ( 1 1 2 K r 2 )
Or
n ( r ) = n 0 + k r 2
where K and k denote the coefficients of the quadratic terms in different forms. Considering the wavelength, the refractive index distribution is:
n ( r , λ ) = n 0 ( λ ) + Γ ( λ ) r 2
Traditionally, the design of GRIN lenses relies on the mathematical optimization of expansion coefficients such as n 0 ( λ ) and Γ ( λ ) in Equation (5). While mathematically convenient, this approach often yields refractive index profiles that exceed the physical limits of available optical materials or fail to account for the complex dispersion of polymer blends.
To bridge this gap, we propose a material-driven optimization framework. Instead of treating the index coefficients as independent mathematical variables, our approach parameterizes the radial distribution through the physical volume fraction g ( r ) of the constituent polymers (Materials A and B).
Some theories suggest approximating the refractive index of the composite material as the volume-weighted average of materials A and B [18,19]. Article [19] states when the thickness of a single layer in a polymer stack is much smaller than the operating wavelength ( < λ / 4 ), the macroscopic refractive index of the composite medium follows a volume-weighted linear average model. This makes it possible to precisely approximate the ideal r 2 gradient distribution by adjusting the composition ratios of the materials in each layer.
This approach is primarily valid when the refractive index difference between materials is small. In this paper, following [20,21], we consider the dielectric constant to be the volume-weighted average, expressed as:
n 2 ( r , λ ) = g ( r ) n A 2 ( λ ) + [ 1 g ( r ) ] n B 2 ( λ )
Here, g ( r ) is the refractive index of material A at radius r . By defining the optimization space in terms of the material ratio g ( r ) , the resulting GRIN profile is inherently constrained within the physically realizable bounds of the selected polymer pair (e.g., PMMA and SAN). This ensures that every optimized solution corresponds directly to a manufacturable material distribution.
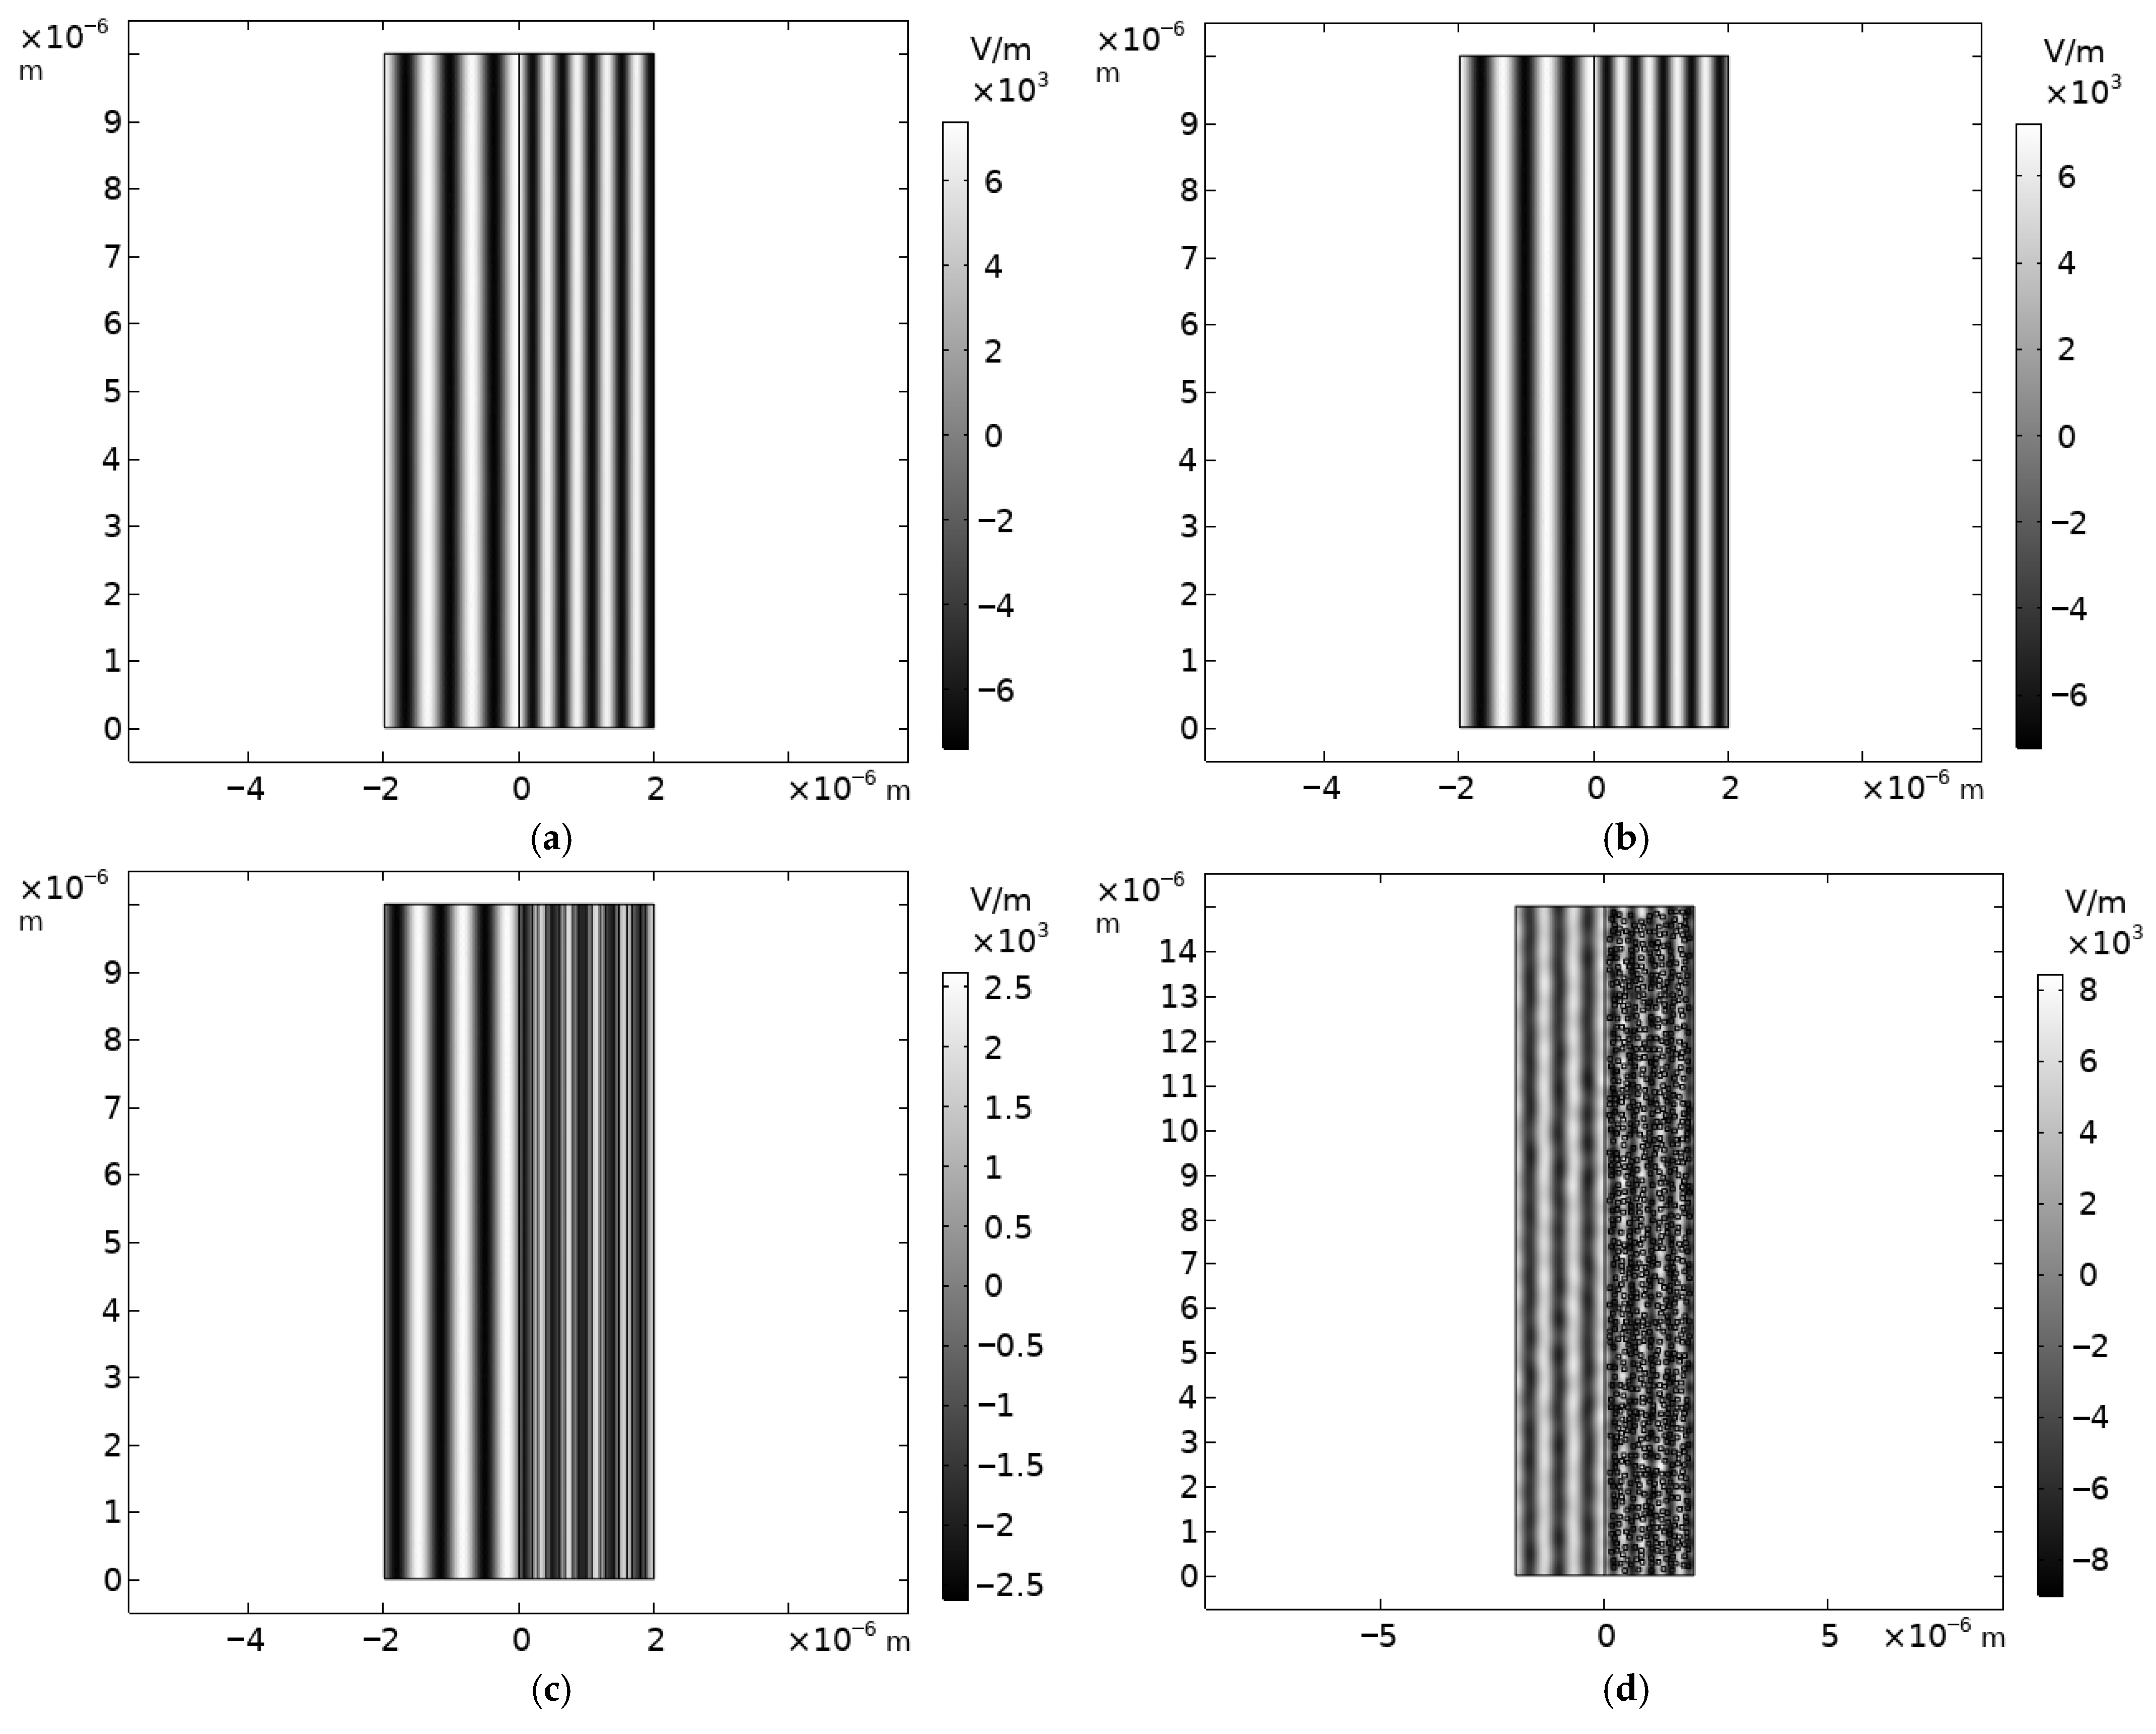
The assumption of linear averaging of the dielectric constant, representing the Wiener upper bound, is employed here to model the effective refractive index. As shown in Figure 1, this model can accurately calculate the refractive index of polymer materials with a layered volume fraction distribution or mixed with small particles with an accuracy of up to 0.001. To verify its reliability for the PMMA and SAN system, we compared it with the Wiener lower bound as the opposite physical extreme. For a 50:50 volume blend, the calculated difference between these two bounding models is approximately 0.001 in refractive index. This discrepancy is negligible compared to typical manufacturing tolerances and material index variations in polymer optics. Furthermore, we ensure that the characteristic feature size of the material structure, such as the nanolayer thickness, remains below 100 nm. Since this size is significantly smaller than the working wavelength, the medium effectively behaves as a macroscopically homogeneous gradient. This condition satisfies the Rayleigh criterion and suppresses scattering losses, thereby justifying the use of the effective medium approximation.
Within this model, we assume that the composite material follows Equation (3) at a specific wavelength, where the distribution is expressed as a polynomial:
n ( r , λ 0 ) = A r 2 + B
Without considering the refractive index distribution at any other wavelengths, it also fails to satisfy Equations (4) and (5). Accordingly, we aim to derive the physical material distribution satisfying Equations (6) and (7), thereby inferring the actual refractive index distribution of the material.
To ensure the generality of the formula, assume that the center of the GRIN lens has volume ratios of materials A and B as c and 1 c , respectively. According to Equation (6), the refractive index at this point is:
n 2 ( 0 , λ 0 ) = c n A 2 ( λ 0 ) + ( 1 c ) n B 2 ( λ 0 )
The outermost layer of the lens has a radius r = R . The volume ratio of material A and B to the total volume is s and 1 s , respectively. At this point, the refractive index is:
n 2 ( R , λ 0 ) = s n A 2 ( λ 0 ) + ( 1 s ) n B 2 ( λ 0 )
Both c and s are values between 0 and 1, but no specific relationship between c and s is required. When c > s , the lens refractive index decreases from the center toward the edge, causing light to converge. When c < s , the lens refractive index increases from the center toward the edge, causing light to diverge. When c = s , the lens degenerates into a lens with a uniform refractive index.
n 2 ( r , λ 0 ) = A 2 r 4 + 2 A B r 2 + B 2
Combined with Equation (8), we can solve for:
B = c n A 2 ( λ 0 ) + ( 1 c ) n B 2 ( λ 0 )
For ease of writing, order:
t = n A 2 ( λ 0 ) n B 2 ( λ 0 )
Combining Equations (9) and (10) yields:
A 2 R 4 + 2 A B R 2 = ( s c ) t
Equation (13) is a quadratic equation for the term A R 2 . By applying the quadratic formula and selecting the root that ensures a positive refractive index at the lens edge, the expression is simplified to A R 2 = n ( R , λ 0 ) n ( 0 , λ 0 ) . Substituting the boundary refractive indices defined in Equations (8) and (9) as functions of parameters s, c and t yields the following result:
A = s t + n B 2 ( λ 0 ) c t + n B 2 ( λ 0 ) R 2
Substituting Equations (9) and (10) into Equation (6) yields that when λ = λ 0 ,
g ( r ) = A 2 r 4 + 2 A B r 2 + B 2 n B 2 ( λ 0 ) t
By expanding Equation (11), the central refractive index squared is expressed as:
B 2 = c n A 2 ( λ 0 ) + ( 1 c ) n B 2 ( λ 0 ) = c [ n A 2 ( λ 0 ) n B 2 ( λ 0 ) ] + n B 2 ( λ 0 )
Given that t = n A 2 ( λ 0 ) n B 2 ( λ 0 ) , it follows that:
B 2 = c t + n B 2 ( λ 0 )
Substituting this relation back into Equation (15) directly yields the simplified spatial distribution in Equation (18):
g ( r ) = A 2 r 4 + 2 A B r 2 t + c
At this point, we can conclude that if a GRIN lens satisfies Equation (7) at λ 0 —that is, a first-order radial GRIN lens—the spatial distribution of its material does not simply follow a linear relationship with r 2 . Substituting Equation (16) into Equation (6) yields the actual refractive index expression for the lens under this material distribution:
n ( r , λ ) = n A 2 ( λ ) n B 2 ( λ ) t A 2 r 4 + n A 2 ( λ ) n B 2 ( λ ) t 2 A B r 2 + c n A 2 ( λ ) + ( 1 c ) n B 2 ( λ )

2.2. Calculation of GRIN Focus Length Under Thin Lens Assumption

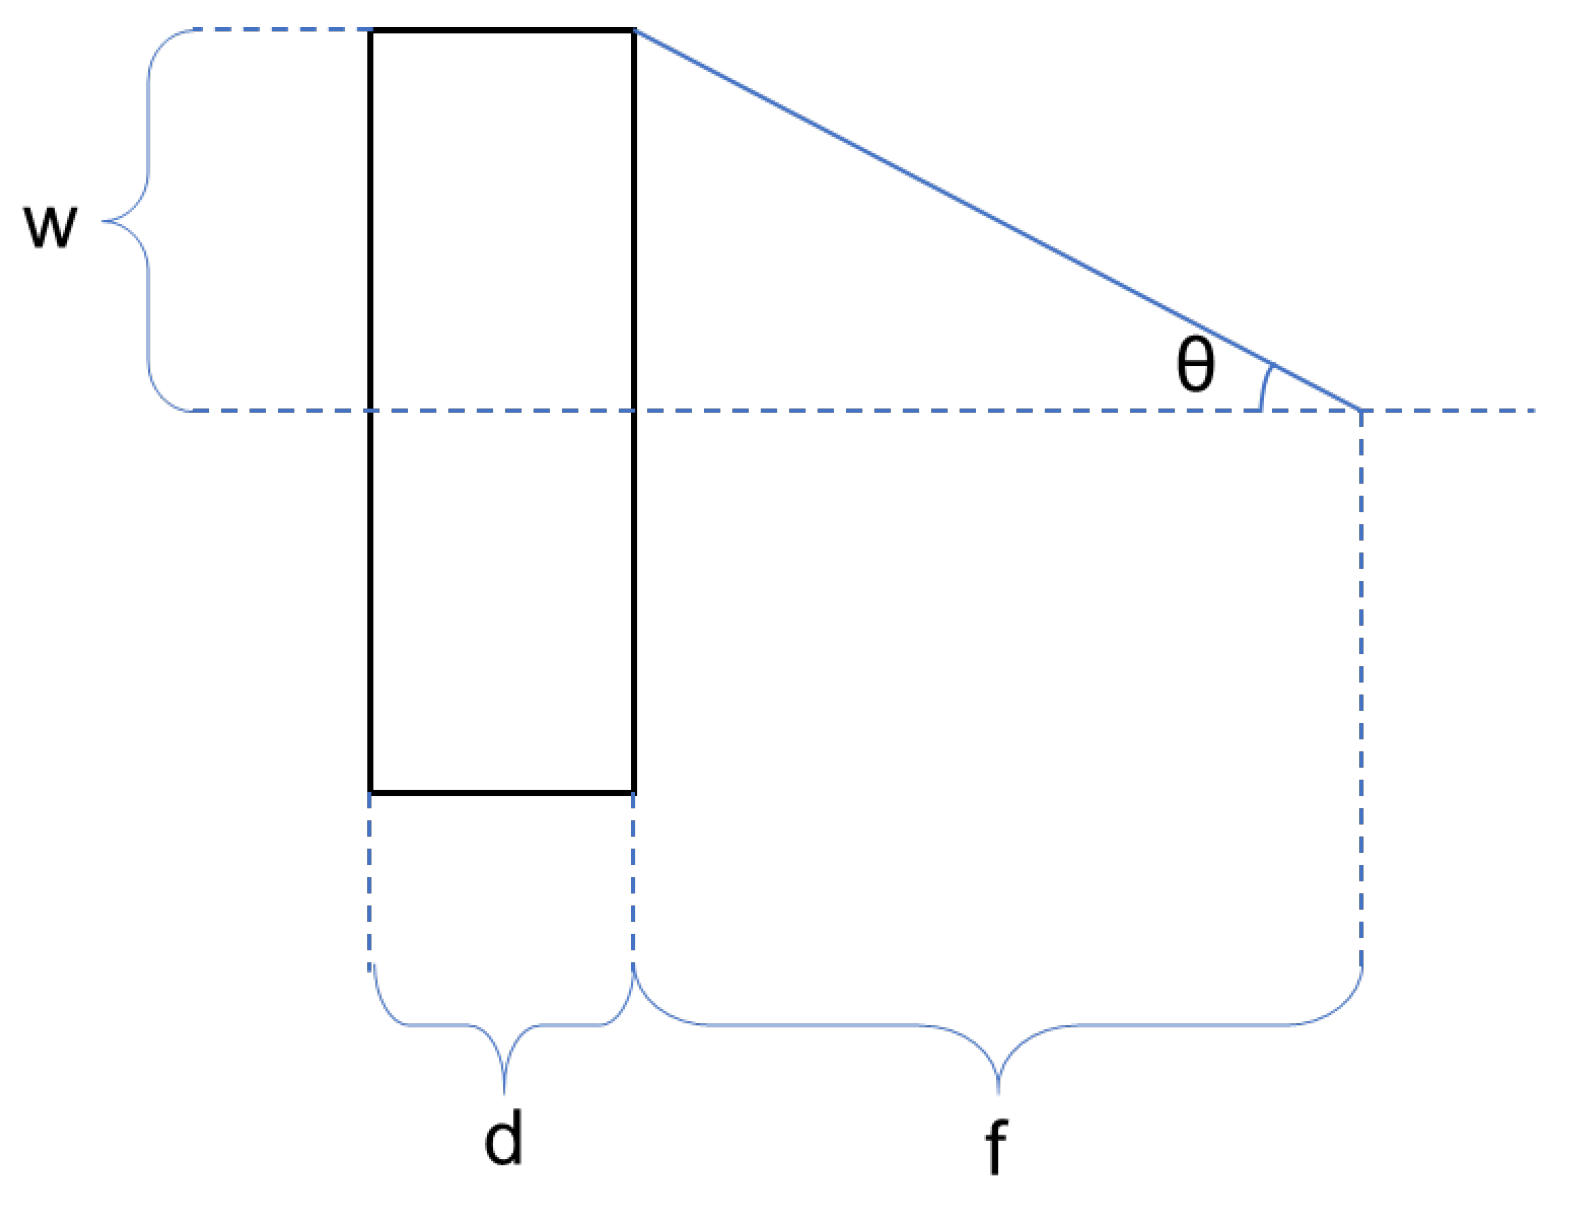
In the analysis of the Wood lens—the simplest first-order GRIN lens—it is observed that, besides the characteristic zero primary aberration and significant higher-order spherical aberration of cylindrical lenses with planar surfaces, another factor limiting its imaging performance is its pronounced chromatic aberration. Under the assumptions of a thin lens and paraxial approximation, we derive a simplified expression for the Wood lens: For a Wood lens with aperture radius w and thickness d the angle θ formed when marginal rays converge to the optical axis is related solely to the distance r from the optical axis. This can be expressed as:
l ( r ) = d n ( r ) + f cos θ ( r )
For a thin Wood lens as shown in Figure 2, at r = 0 , the optical path length is:
l ( 0 ) = d n 0 + f
At the focal point, the optical paths of both rays are equal:
n ( r ) = n 0 f d ( 1 cos θ ( r ) 1 )
where
1 cos θ ( r ) = f 2 + r 2 f
Applying a Taylor expansion yields:
n ( r ) n 0 r 2 2 f d + r 4 8 f 3 d
When considering only the quadratic term, let r = w :
n 1 = n 0 w 2 2 f d
f = w 2 2 d ( n 0 n 1 )
This equation indicates that for a Wood lens with fixed thickness and aperture, the focal length fluctuates across different wavelengths due to the difference between the central refractive index and the edge refractive index. For most material pairs, the refractive index difference n 0 r n 1 r at red light and n 0 b n 1 b at blue light are not constant values; in most cases, this difference is relatively large. For example, the refractive index difference between PMMA and SAN materials at 486 nm is 0.0813, while at 656 nm it is 0.0758. Thus, 1 n 0 r n 1 r and 1 n 0 b n 1 b are 12.3012 and 13.1861, respectively. Calculations show that the focal length at 656 nm increases by 7.19% compared to 486 nm, indicating a substantial chromatic focus shift. While such a large shift renders Wood lenses nearly unsuitable for imaging, it holds significant promise for applications requiring dispersion [22,23,24].

2.3. Aberrations of First-Order Radial GRIN

For a first-order radial GRIN lens, rigorously analyzing the analytical form of their aberrations is complex. However, approximate solutions to Hamiltonian optics equations can be obtained using the paraxial approximation method. Reference [25] provides a detailed analysis of this process; the present paper offers only an overview. The paraxial equations for paraxial rays and field rays in GRIN lenses satisfying the form of Equation (3) are:
X ˙ 1 = 1 n 0 P X 1
P ˙ X 1 = n 0 K X 1
Here, n 0 denotes the refractive index of the material at r = w , X 1 represents the first-order term in the coordinate power series expansion of the actual ray, and P X 1 denotes the first-order term in the momentum power series expansion of the actual ray. These two quantities are used to derive the approximate solution. The general solution to this equation is:
X 1 = A 1 sin ( K z ) + B 1 cos ( K z )
P X 1 = n 0 K A 1 cos ( K z ) n 0 K B 1 sin ( K z )
When the object plane satisfies z = 0 , a reference plane z = ζ can be selected such that
sin ( K ζ ) = 1
Under these conditions, the axial ray ( g , θ ) and the field-of-view ray ( G , Θ ) are given by:
g ( z ) = sin ( K z ) , θ ( z ) = n 0 K cos ( K z )
G ( z ) = cos ( K z ) , Θ ( z ) = n 0 K sin ( K z )
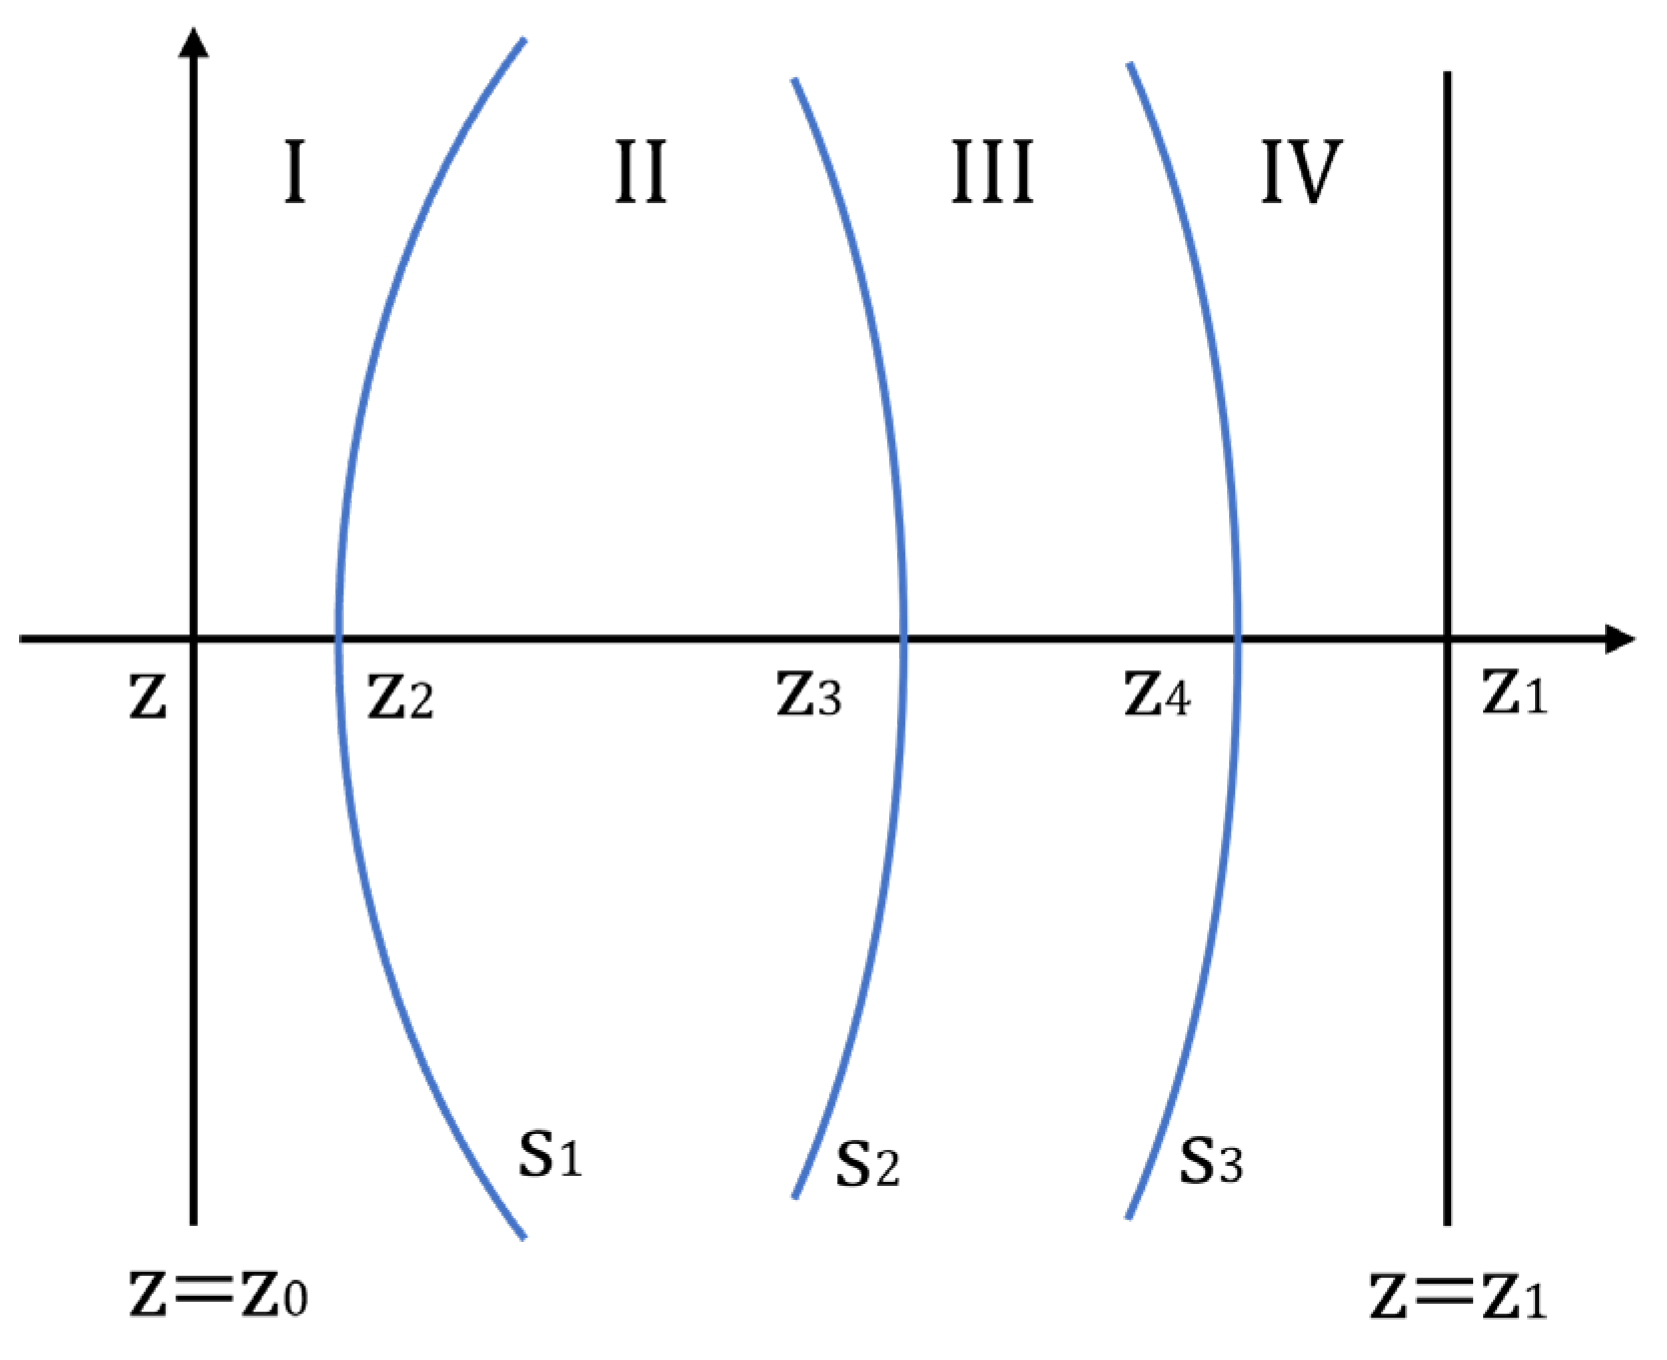
Visible light propagates along a sinusoidal curve within such lenses. For the process of traversing the interface—as depicted in Figure 3, where light travels from the right side of coordinate z 2 to the right side of z 3 , i.e., from GRIN lens II through interface s 2 and then into GRIN lens III—this can be expressed in terms of its spherical aberration coefficient:
A = 1 θ ( z 1 ) ( A 1 + A 2 + A 3 )
A 1 aberration contribution arising from the refractive index discontinuity across the interface. A 2 represents the additional contribution attributed to the refractive index gradients on both sides of the interface. A 3 represents the aberration contribution caused by transmission within gradient refractive index materials. Where
A 1 = 1 2 n 0 ( n 0 n 0 1 ) ( c g + θ ) [ n 0 2 ( c g + θ ) + θ n 0 ]
A 2 = c Δ [ 1 2 n 1 + 1 2 c d n 0 d z ] g 4
A 3 = 1 2 Δ 2 g θ 3 n 0 2 + z 2 z 3 [ 4 n ( r ) 2 g 4 z 4 + 2 n 1 n 0 2 g 2 z 2 θ 2 z 2 ] d z
c is the curvature of interface s 2 , n 0 is the refractive index of lens II along the optical axis, and n 0 is the refractive index of lens III along the optical axis. By repeatedly applying this equation, the spherical aberration of the combined GRIN lens can be determined. It is worth noting that in the ray trajectories described above, when K > 0 , the rays propagate along a sine curve. When K < 0 , rays propagate along a hyperbolic curve, and the ray expression can similarly be written as:
g ( z ) = sinh ( K z ) , θ ( z ) = n 0 K cosh ( K z )
Equations (34)–(37) provide a theoretical framework for decomposing spherical aberration into contributions from interfacial refraction A 1 , index gradients at the boundary A 2 , and internal propagation within the GRIN medium A 3 . In the design process, these expressions serve as a physical guide for balancing the lens curvatures and gradient profiles to minimize the total aberration coefficient A .

2.4. Linear Achromatic Spherical Radial GRIN

The lenses introduced previously exhibit cylindrical symmetry. Furthermore, another common type of GRIN lens features spherical (three-dimensional) symmetry, where the refractive index distribution depends solely on the radial distance from a fixed central point. This is termed a spherical gradient index lens, whose refractive index distribution function n ( r ) is expressed as:
n ( r ) = f ( r )
Here, r denotes the distance from the lens position to the center of the refractive index distribution. For instance, the Luneburg lens is characterized by a spherical geometry with a refractive index distribution following:
n ( r ) = 2 ( r / R ) 2
where R is the radius of the lens, and r is the distance from that point to the center of the sphere. This implies that its refractive index must vary between 1 and 1.414. Current manufacturing techniques are insufficient to support a Luneberg lens in the visible light spectrum. However, using the same principle, other refractive index distributions can potentially be fabricated. For instance, ref. [26] proposes an achromatic GRIN lens. According to [27], such a lens is feasible to produce. This paper provides a brief introduction to this lens; for more detailed information, please refer to [26].
The structure of this lens can be modeled as a segment of a spherically symmetric GRIN lens. At a specific wavelength λ 0 , its refractive index is
n ( λ 0 , r ) = n ( λ 0 , R G ) + a ( r R G )
where r is the distance from the lens position to the center of the refractive index distribution, which can be expressed as
r ( x , y , z ) = x 2 + y 2 + ( z R G ) 2
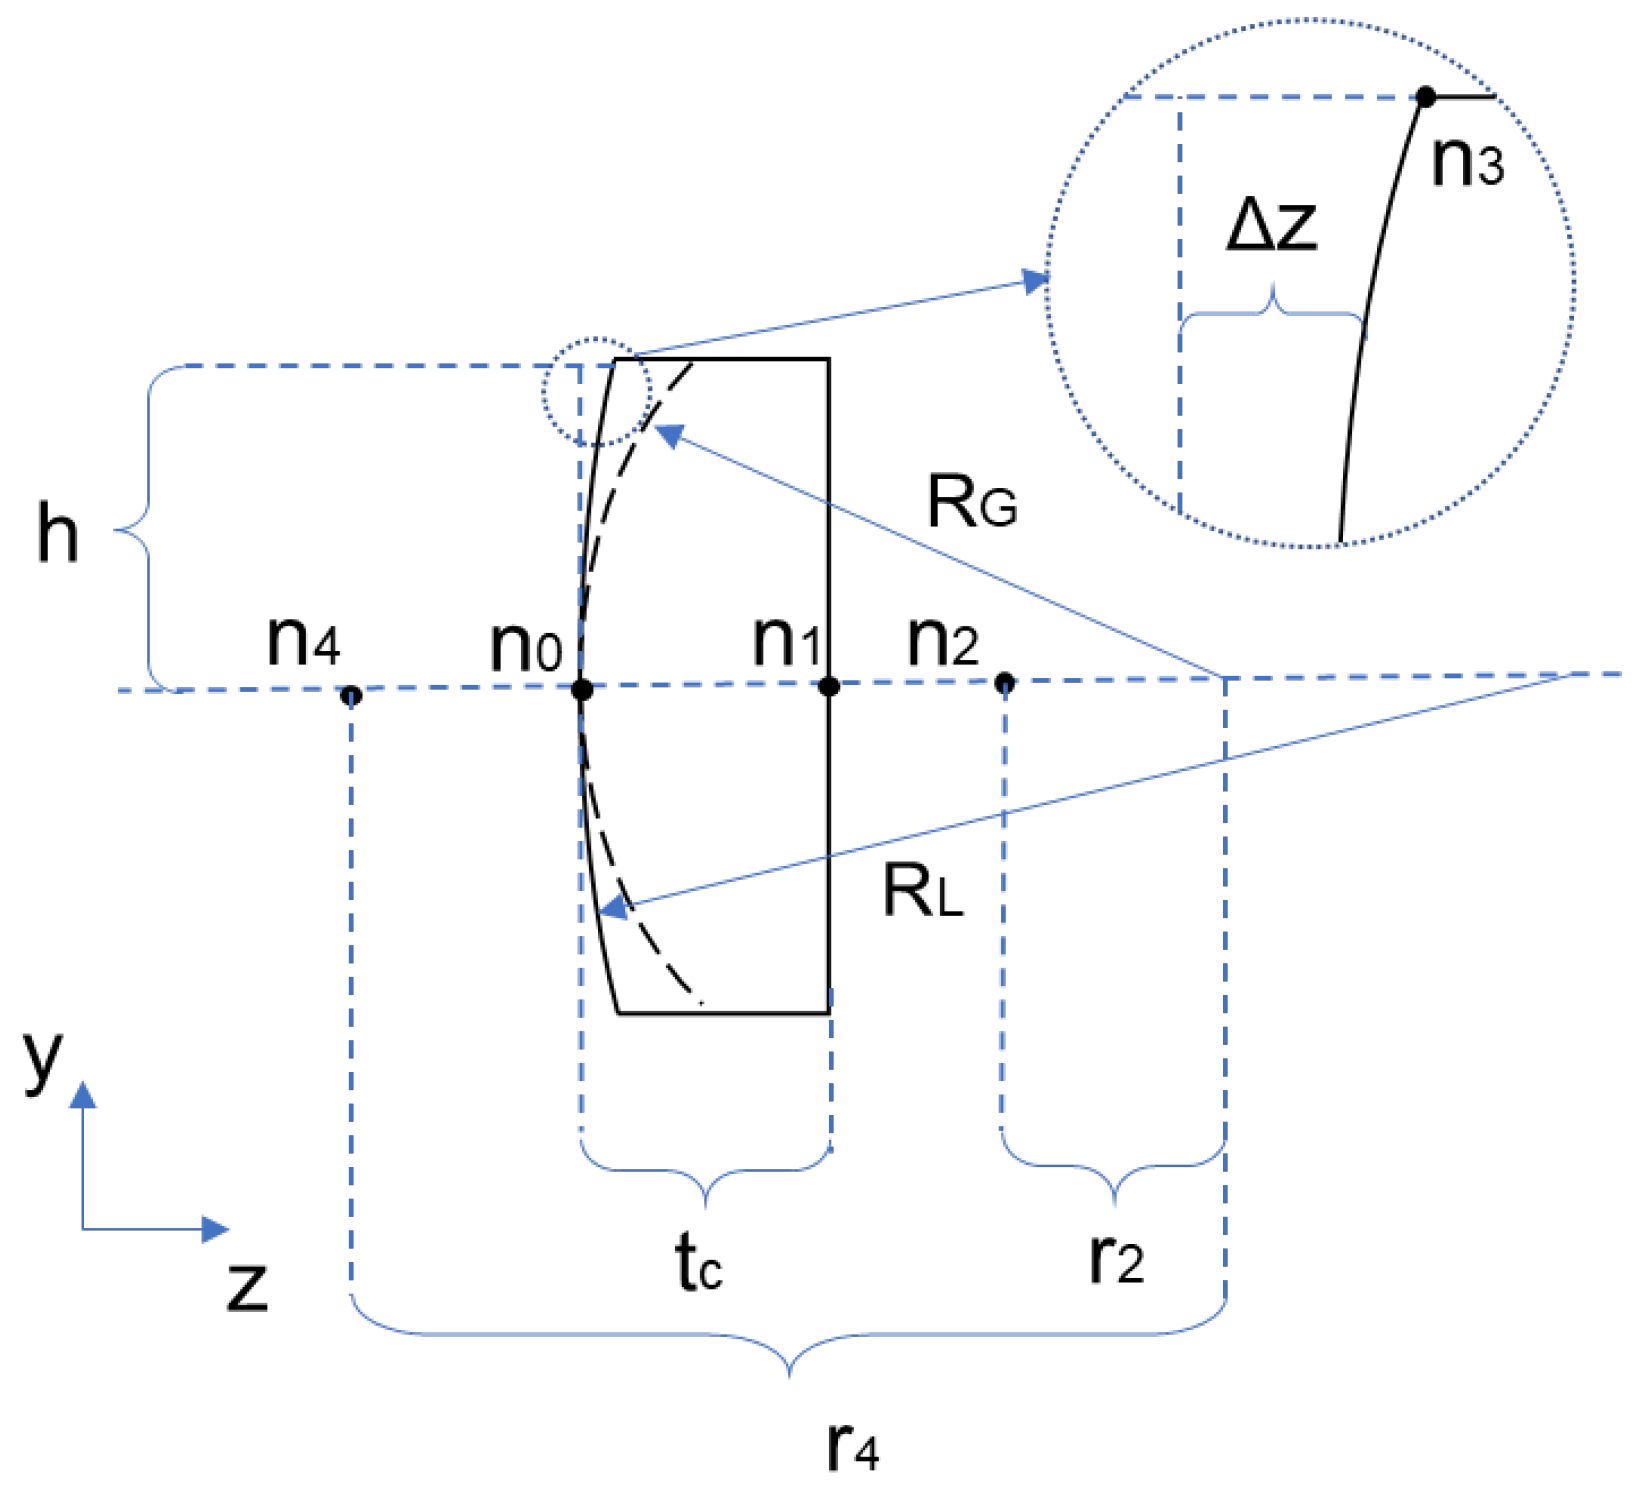
As shown in Figure 4, R G is the distance from the center of the lens’s refractive index distribution to the vertex of the lens’s front surface. The center of the lens’s refractive index distribution is not necessarily coincident with the center of curvature of the lens surface. R L is the radius of curvature of the lens surface. Five points are labeled: n 0 denotes the central refractive index of the front surface, n 1 denotes the central refractive index of the rear surface, n 2 represents the innermost refractive index within the corresponding original three-dimensionally symmetric sphere, n 3 indicates the outer refractive index of the front surface, and n 4 signifies the innermost refractive index within the corresponding original three-dimensionally symmetric sphere. Similarly, in this configuration, n 2 > n 4 is not required: when n 2 > n 4 , the refractive index distribution causes the lens to converge light; when n 2 < n 4 , it diverges light; and when n 2 = n 4 , the lens degenerates into a lens with uniform refractive index. The parameters r 2 and r 4 are defined as the radial distances from the refractive index center to the inner and outer boundaries of the original spherical material stack, respectively, thereby characterizing the physical extent of the linear gradient. Given practical manufacturing constraints, r 2 is not necessarily zero. Specifically, a value of r 2 = 0 would imply a refractive index gradient that is excessively steep for feasible fabrication. h represents the semi-aperture of the lens, and t c denotes its center thickness.
In Equation (40), n ( λ 0 , R G ) represents the refractive index at the lens vertex.
n λ 0 , R G = n 0 ( λ 0 )
According to [15], the focal length of such a lens with a refractive index distribution can be approximately expressed as
f ( λ ) = [ n 0 ( λ ) 1 R L n 0 ( λ ) n 1 ( λ ) R G ] 1
After accounting for chromatic aberration, the target wavelengths λ 1 and λ 2 must satisfy:
f λ 1 f λ 2 = 0
the relationship between R L and R G for a specific material was derived. This subsequently yielded the achromatic focal length when R G is fixed.
f b a l a n c e d = R G ( n 1 ( λ 2 ) n 1 ( λ 1 ) ) n 1 ( λ 2 ) n 1 ( λ 1 ) n 1 ( λ 1 ) 1 n 0 ( λ 2 ) n 0 ( λ 1 ) n 0 ( λ 1 ) 1
By adjusting the size of R G and the material distribution, the focal length of the lens can be modified. However, the authors of the paper could not simultaneously achieve achromaticity and spherical aberration correction. In practical applications, such lenses exhibit significant spherical aberration, necessitating the introduction of aspheric surfaces to reduce spherical aberration and enhance imaging performance. This paper will continue to employ the method described in Section 2.1 for custom surface modeling of this type of lens.
Similarly, consider a lens formed by stacking materials with refractive indices n 4 ( λ ) and n 2 ( λ ) . Since the lens is taken as a portion of this stack, there is no need to consider edge scaling issues as in Section 2.1. Its refractive index distribution satisfies:
n 2 ( r , λ ) = g ( r ) n 2 2 ( λ ) + [ 1 g ( r ) ] n 4 2 ( λ )
When r = r 2
n ( λ 0 , r 2 ) = n 2 ( λ 0 )
When r = r 4
n ( λ 0 , r 4 ) = n 4 ( λ 0 )
By combining Equations (42) and (49), we obtain Equations (50) and (51):
a = n 2 ( λ 0 ) n 4 ( λ 0 ) r 2 r 4
n 0 ( λ 0 ) = R G r 2 r 4 r 2 n 4 ( λ 0 ) + r 4 R G r 4 r 2 n 2 ( λ 0 )
The parameter a represents the linear gradient slope of the refractive index distribution. It characterizes the rate of change in the refractive index per unit of radial distance and determines the refractive power contributed by the GRIN medium.
Substitute Equation (42) square meters into Equation (48):
g ( r ) = a 2 r 2 + 2 a ( n 0 ( λ 0 ) a R G ) r + ( n 0 ( λ 0 ) a R G ) 2 n 4 2 ( λ 0 ) n 2 2 ( λ 0 ) n 4 2 ( λ 0 )
Substituting g(r) back into Equation (48) and taking the square root yields the exact expression for the refractive index distribution:
n ( r , λ ) = n 2 2 ( λ ) n 4 2 ( λ ) n 2 2 ( λ 0 ) n 4 2 ( λ 0 ) [ a 2 r 2 + 2 a ( n 0 ( λ 0 ) a R G ) r ] + n 4 2 ( λ )
Equation (53) defines the complete wavelength-dependent refractive index profile for the spherical radial GRIN lens. This model ensures that the material distribution remains consistent across the working spectrum while accurately maintaining the intended linear gradient at the design wavelength λ 0 .

3. Simulation Conditions

In the evaluation of the Wood lens, the optical system is configured under a deterministic framework where the imaging performance is derived directly from the input physical constants without a stochastic optimization process. Both the front and rear surfaces of the lens are defined as strictly planar, and normal incidence is assumed for the analysis. The refractive index gradient is determined by the physical volume fraction of the constituent polymers, specifically SAN (Styrene Acrylonitrile) and PMMA (Polymethyl Methacrylate). For the gradient profile, the volume fraction of SAN is set to 1.0 at the optical axis and decreases to 0.0 at the outer radial boundary. The dispersion properties are modeled using the Sellmeier equation, with coefficients for SAN assigned as B 1 = 1.3787 , C 1 = 0.017842 and for PMMA as B 1 = 1.1819 , C 1 = 0.011313 . Chromatic performance is analyzed using the 656.3 nm and 486.1 nm as reference wavelengths. The lens equivalent focal length is obtained through the EFFL coefficient.
In the simulation of lens performance comparison, we compared a first-order GRIN lens, a first-order GRIN doublet, a linear spherical radial GRIN lens (Spherically symmetric GRIN), and a cemented doublet. To ensure a fair comparison between single and composite lens systems, the single lenses were configured with first-order aspherical surfaces, whereas the cemented doublets utilized spherical surfaces exclusively. For the cemented doublet, we selected the commonly used lens combinations H-K9L and H-ZF52, which represent a cost-effective pair with relatively small partial dispersion differences. Regarding the three GRIN lenses, manufacturing constraints dictated that the constituent materials must exhibit excellent compatibility, preventing significant phase separation that could generate particles causing strong scattering. From a design perspective, a larger refractive index difference between the two materials allows greater design flexibility. Subsequent simulations demonstrated that for both single lenses, the refractive index contrast significantly impacts lens performance. From an application standpoint, both materials should exhibit good light transmission and lack noticeable coloration. Considering all factors, we selected the PMMA and SAN combination as the material pair for simulating the three GRIN lenses. The method of fabricating GRIN lenses by layering these two materials has been proven to be feasible [19].
Optical simulations were performed using Ansys Zemax OpticStudio (version 2023 R1.00). Due to the limitations of the built-in GRIN profiles in meeting the requirements for arbitrary material ratios and multi-wavelength analysis, custom profiles were developed for first-order radial GRIN lenses and linear spherical radial GRIN lenses. We then employed automatic optimization to enhance simulation results.
The optimization process was performed using the Hammer optimization tool, which employs the Damped Least Squares algorithm as its core engine to efficiently explore the solution space and find the global minimum. In all results presented below, the value of the optimization function is guaranteed to be less than 0.01. The simulations are conducted across the visible spectrum using the standard d-line (587.6 nm) as the primary wavelength, complemented by the F-line (486.1 nm) and C-line (656.3 nm). For aperture sampling, we employ 7 rays per field per wavelength using the Gaussian Quadrature method to ensure an efficient and accurate calculation of the RMS spot size relative to the centroid.
The field-of-view configurations vary according to the specific design requirements: three-field designs utilize 0°, 5°, and 7°; two-field designs utilize 0° and 5°; and single-field designs are optimized solely at 0°. The default merit function is constructed to minimize the RMS spot size while adhering to specific physical and functional constraints through Zemax operands. Specifically, the effective focal length and total center thickness are fixed using PMLT and PMGT operands, while the axial chromatic aberration between the C-line and F-line is controlled through the AXCL operand, with optimization weights of 0.1, 0.0625, and 0.0625 assigned at normalized pupil coordinates of 0, 0.707, and 1, respectively. Additional constraints such as MNCA, MXCA, MNCG, and MXCG are applied to regulate the center and edge thicknesses for both air gaps and glass elements, ensuring a minimum thickness of 1.0 mm for both the center and edge of glass elements to maintain mechanical manufacturability.
The degrees of freedom and fixed constraints for each lens architecture are summarized in Table 1. This clear distinction between fixed parameters and optimization variables ensures a rigorous optimization process for each configuration.
The volume fraction parameters c and s are implemented as continuous optimization variables within the custom surface DLL in Zemax. During the optimization process, these parameters are restricted to the range [ 0,1 ] to ensure physical manufacturability. While the simulation treats the refractive index as a continuous gradient, this model directly translates to an actual layered structure through a discretization process. In practice, for a lens with N layers, the volume ratio for the i-th layer is determined by sampling the g ( r ) function at the corresponding radial position. For high-precision manufacturing such as nanolayered co-extrusion, where thousands of layers are utilized, the discrete step-index profile effectively approximates the continuous theoretical model with negligible error.
Notably, the first-order radial GRIN lens custom surface incorporates two volume fraction coefficients, c and s , whereas the linear spherical radial GRIN surface does not require these parameters. This omission stems from the linear spherical radial GRIN achieving equivalent effects by adjusting the relationship between R 2 and R 4 . For the first-order radial GRIN lens custom profile, we redefined the constraint on the refractive index distribution by restricting the c and s coefficients to the range [0, 1]. This approach prevents unfeasible manufacturing scenarios and eliminates the need to analyze refractive index boundaries arising from variations in marginal ray heights at different wavelengths.

4. Simulation Results

4.1. Verification of Chromatic Aberration in Thin Wood Lenses

Based on the established model, we simulated a typical PMMA-SAN hybrid Wood lens. Since the focal length formula employs the thin lens assumption and the paraxial approximation, we compared four distinct sets of aperture and thickness configurations. The results for wavelengths of 656 nm and 486 nm are presented in Table 2 and Table 3, respectively, while Table 4 summarizes the chromatic focal shift under various conditions.
The data for the 25 mm-diameter, 5 mm-thick lens and the 50 mm-diameter, 10 mm-thick lens exhibit highly consistent patterns: both demonstrate a proportional doubling of focal length and chromatic aberration, while their relative errors remain virtually indistinguishable. This strongly suggests the presence of a specific error factor correlated with the ratio of diameter to thickness, warranting further investigation. Comparing the 25 mm diameter, 10 mm thick lens with the 25 mm diameter, 5 mm thick lens reveals that when the diameter is five times the thickness, errors accumulate due to the breakdown of the paraxial approximation. Similarly, comparing a 25 mm diameter, 10 mm thick lens with a 10 mm diameter, 10 mm thick lens reveals that when the diameter is 1 times the thickness, errors increase sharply due to the deviation from the thin lens approximation. At this point, predicting light paths requires accounting for the lens’s refractive index distribution, which causes light rays to propagate along a sinusoidal curve within the lens rather than approximating a straight line parallel to the optical axis. Furthermore, comparing several data sets reveals that while the ratio of chromatic aberration to focal length (1) in each set is close to the calculated value of 10.4%, it generally remains below the predicted value shown in Figure 5. The discrepancy between the simulated and analytical values exhibits a positive correlation with the aperture-to-thickness ratio, which may also be related to neglected error terms.

4.2. Lens Performance Comparison

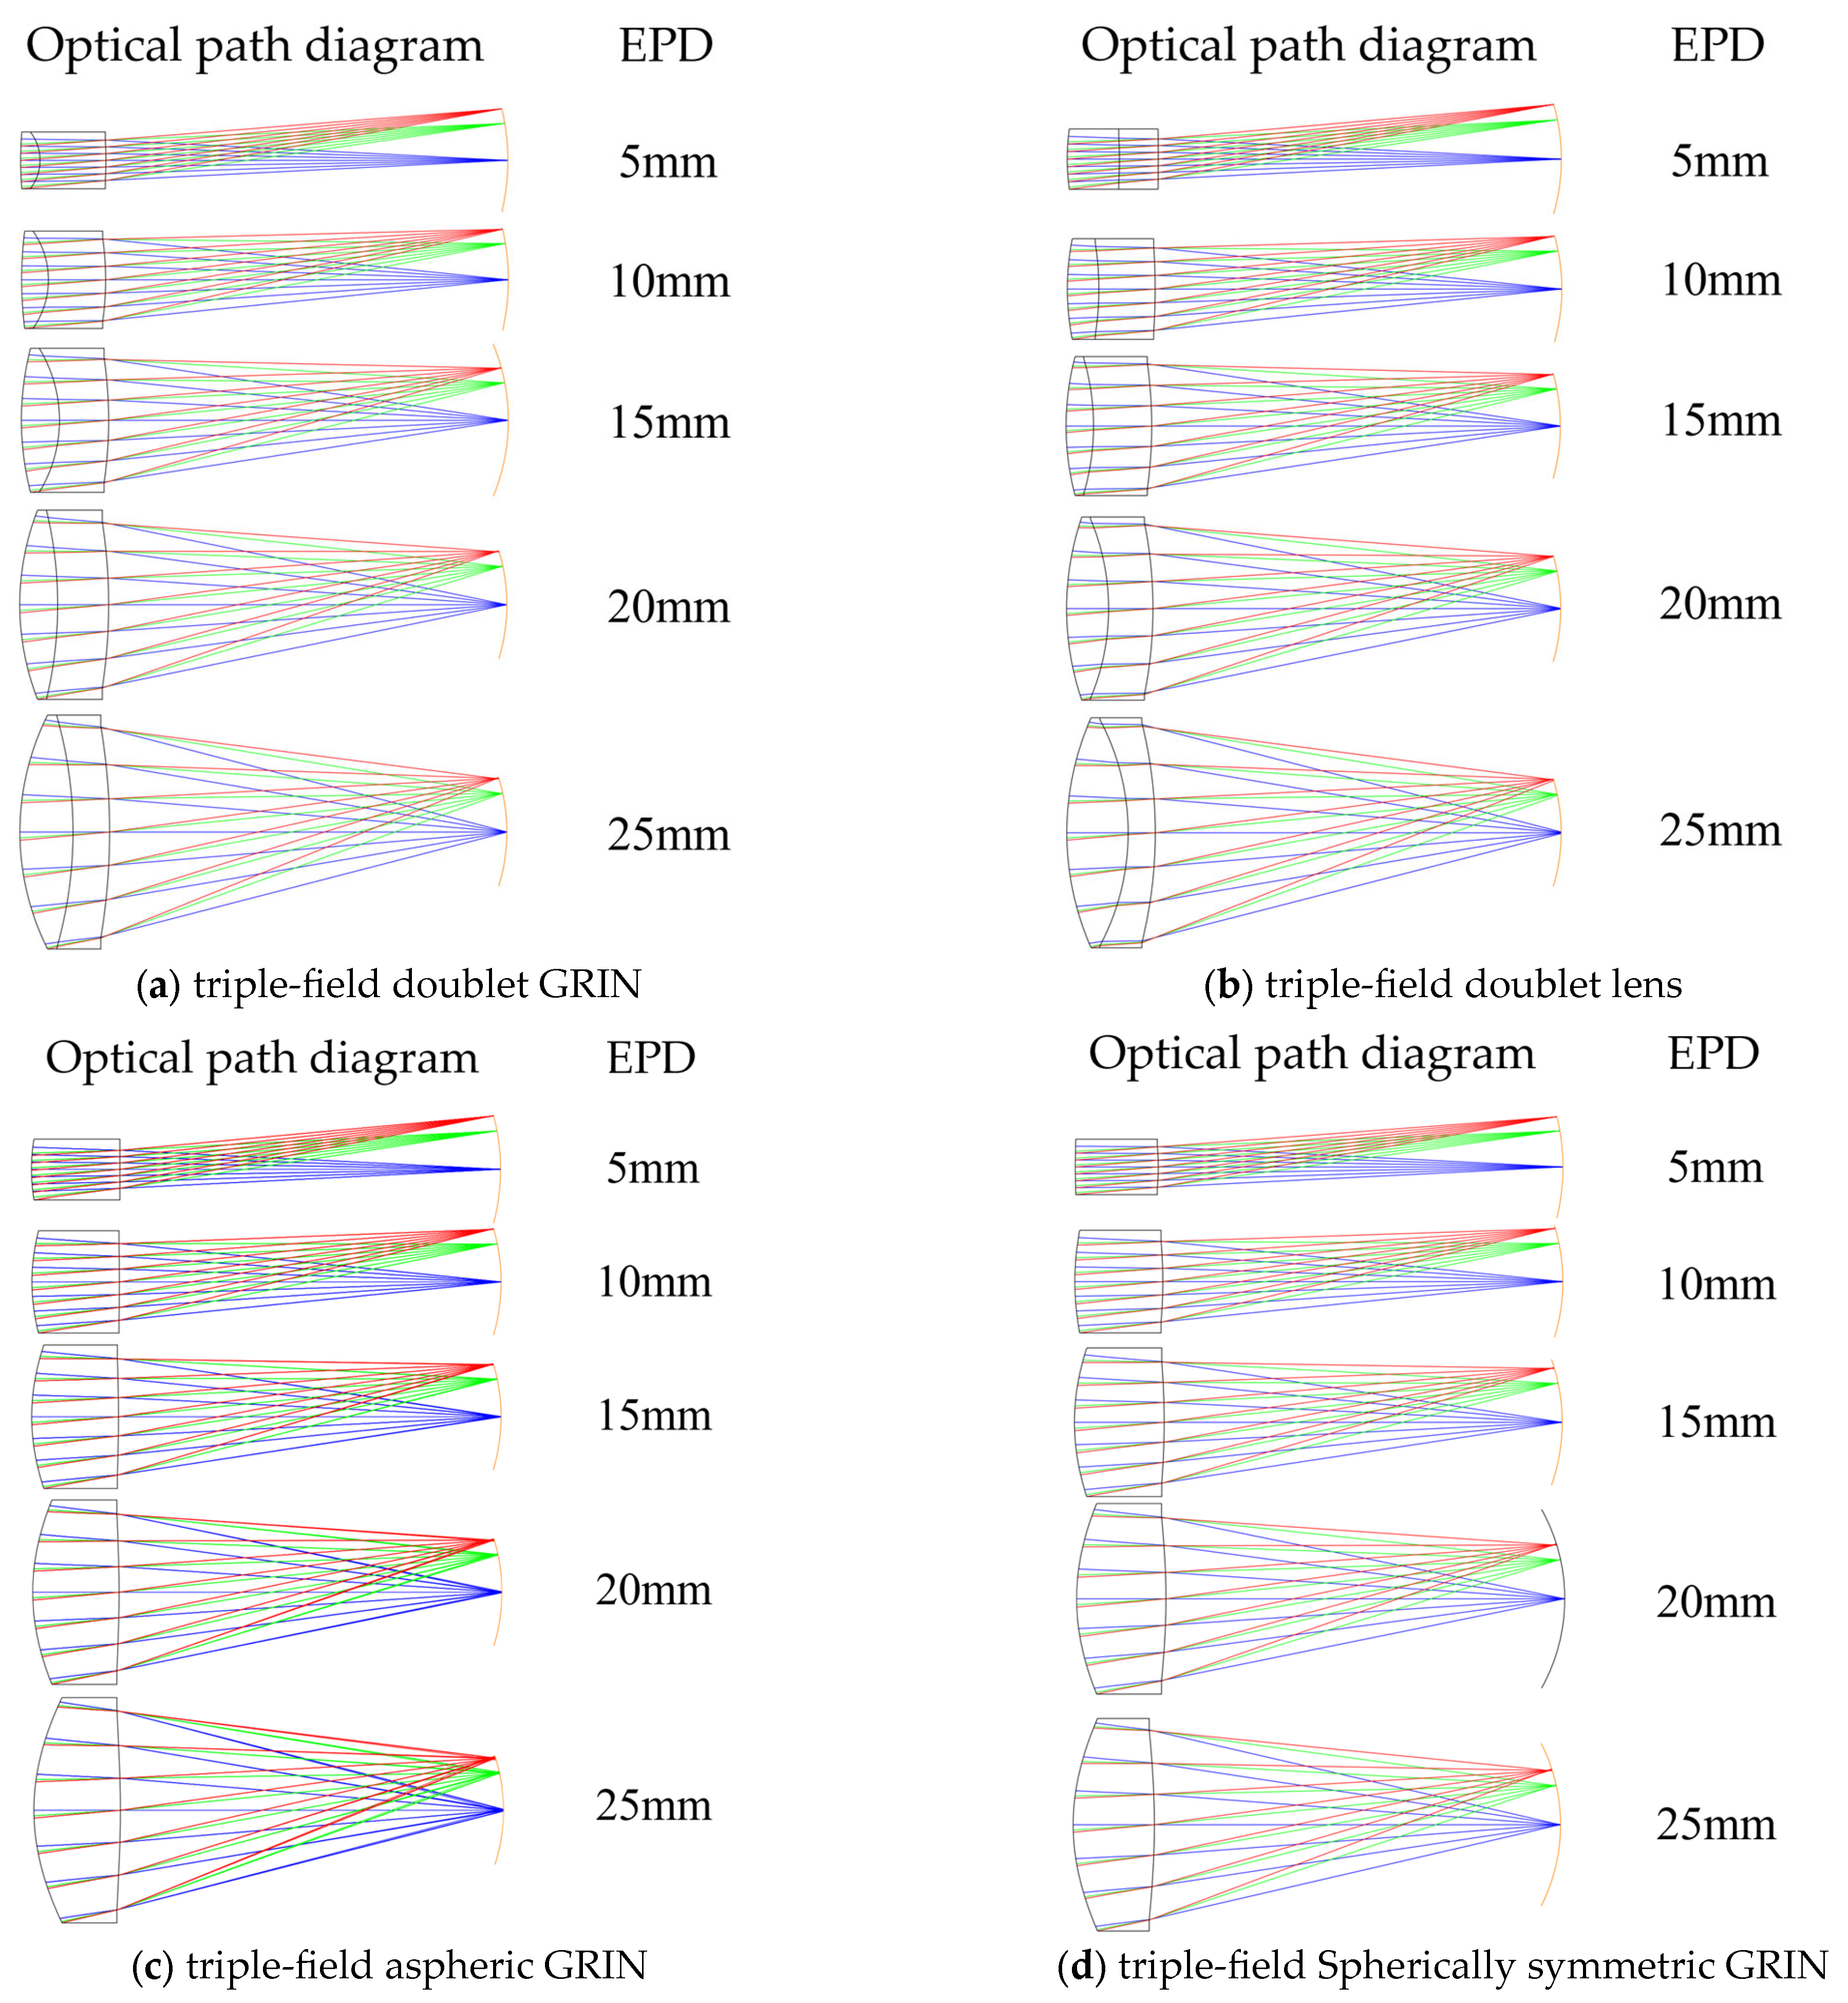
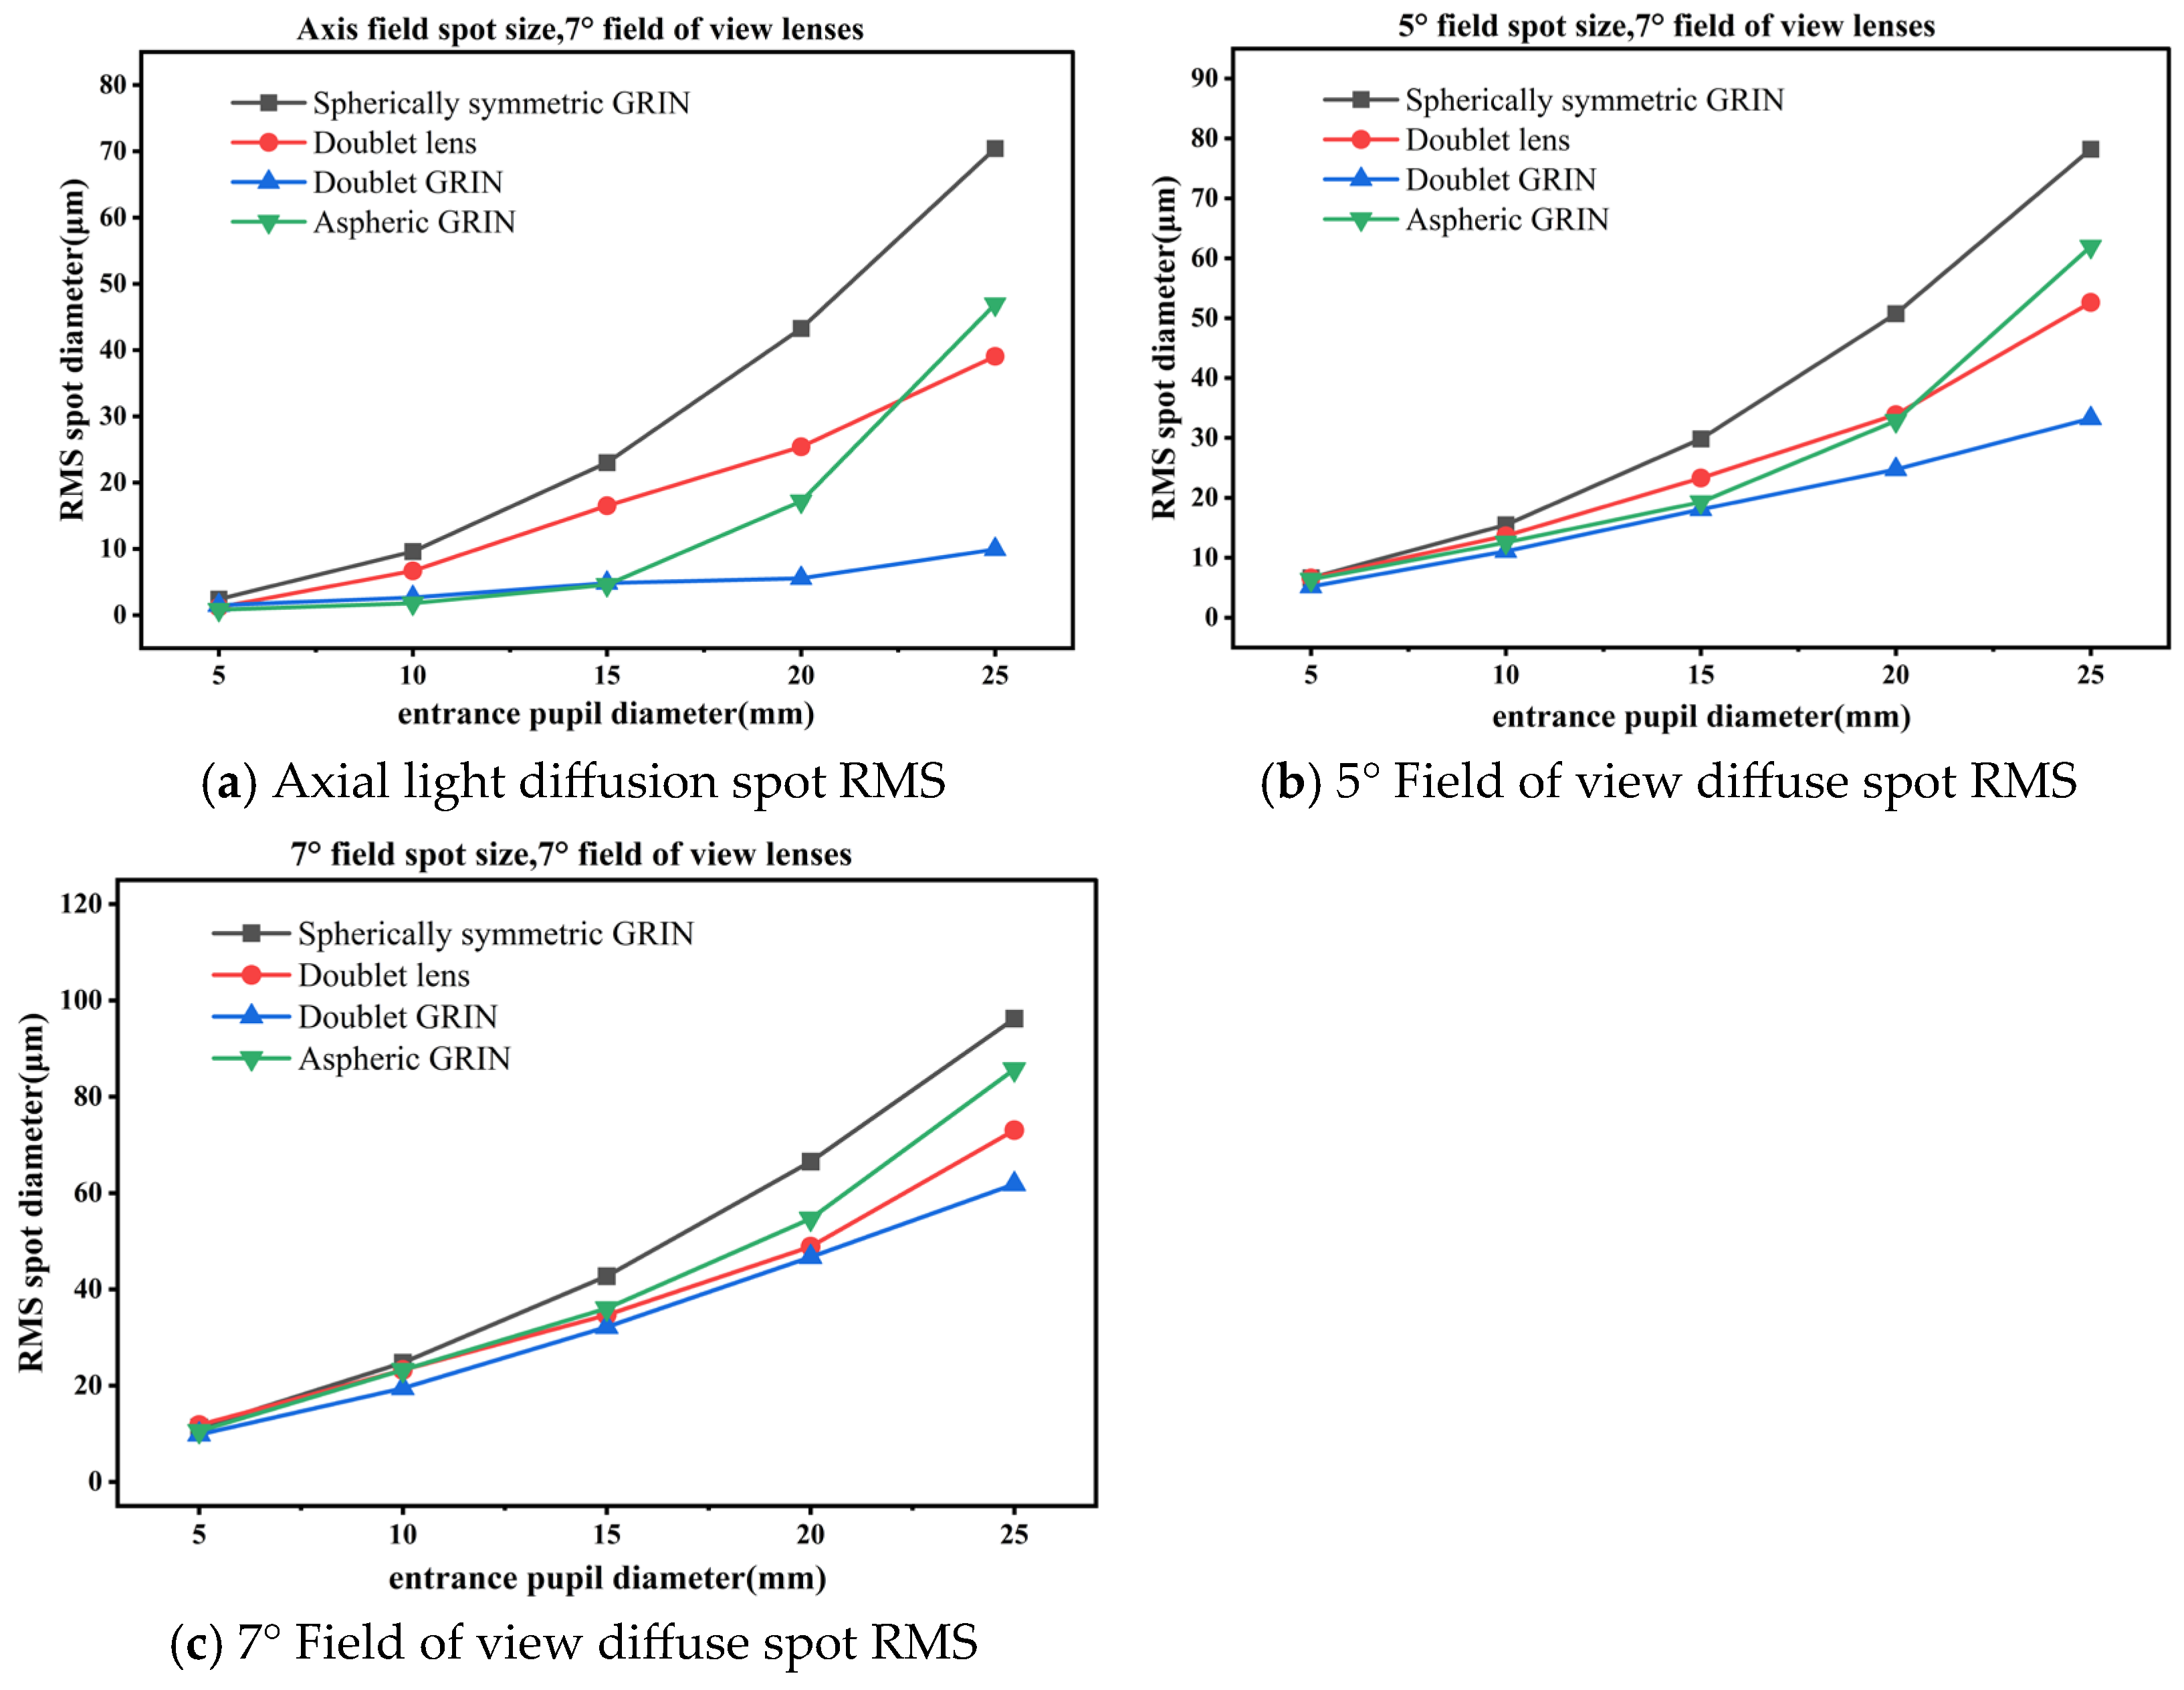
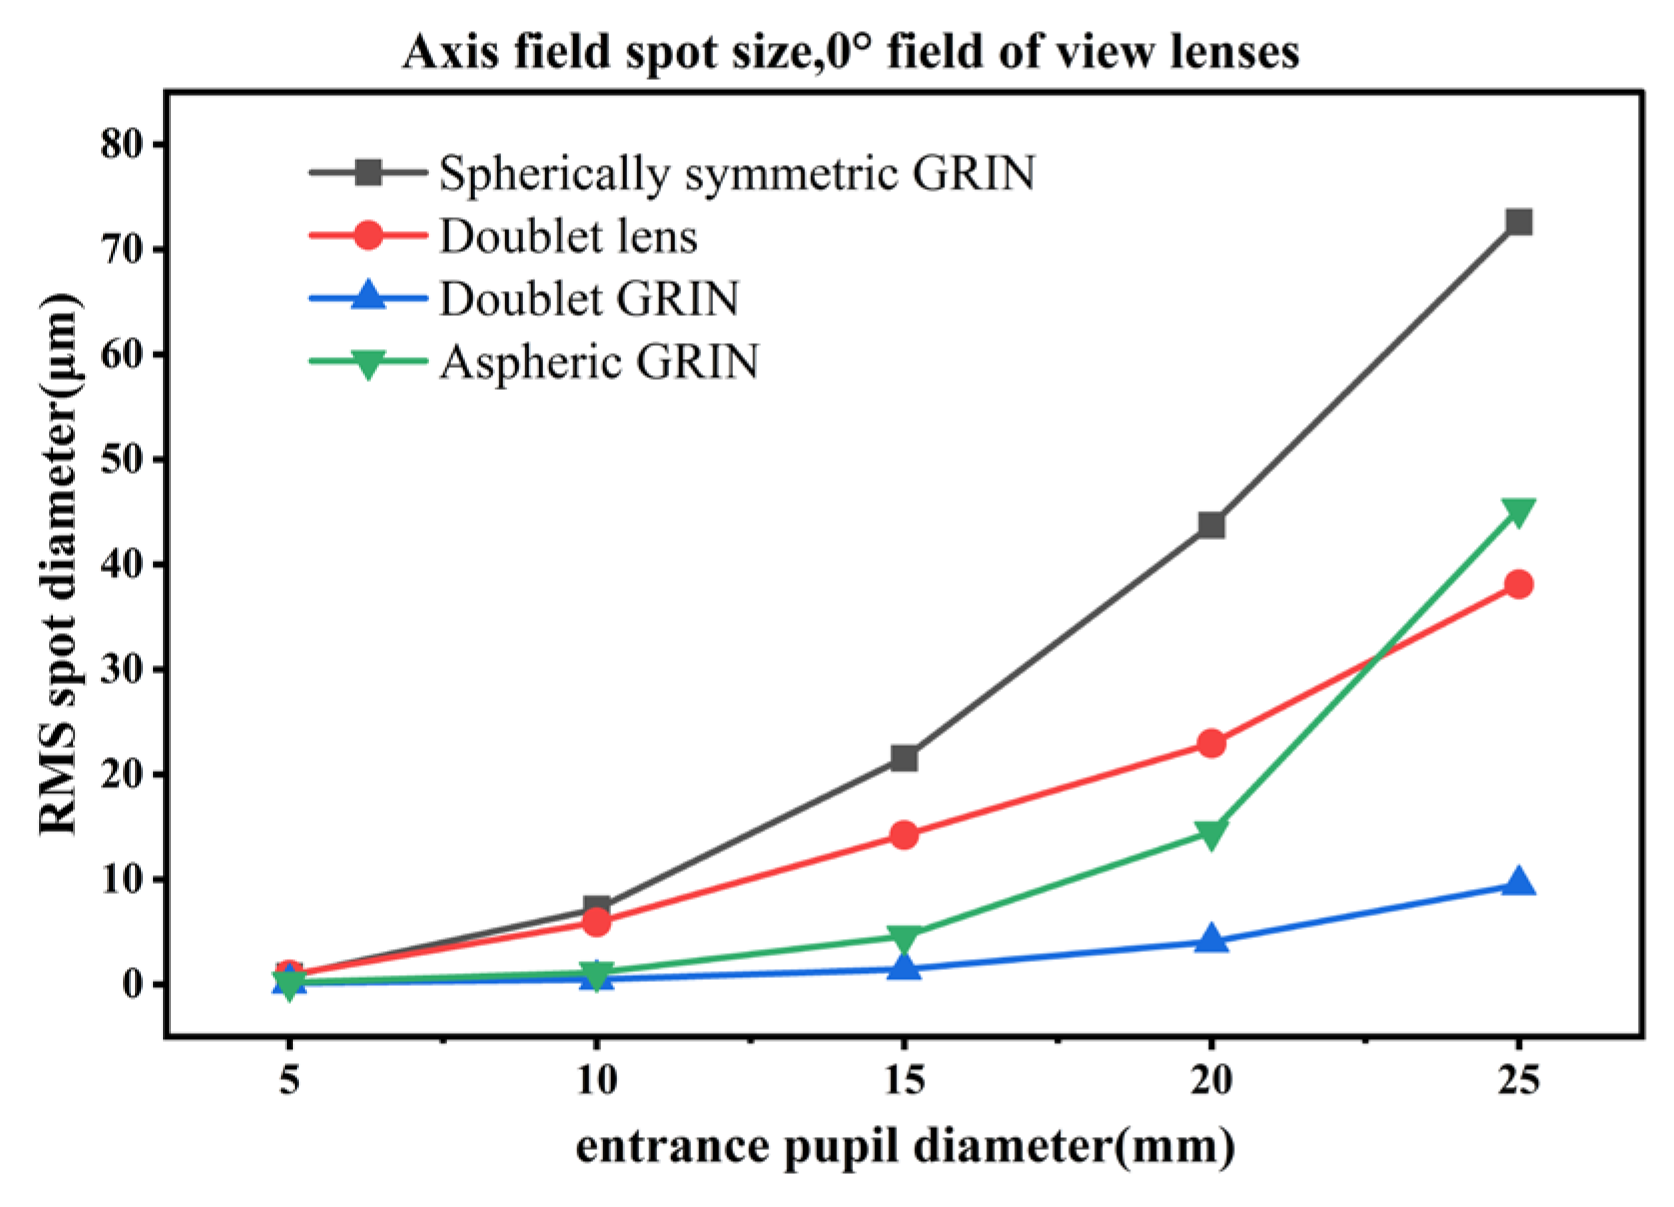
This paper compares simulations of four lens designs across three fields of view ( y = 0 ° , y = 5 ° , y = 7 ° ) , two fields of view ( y = 0 ° , y = 5 ° ) , and a single field of view ( y = 0 ° ) . The equivalent focal length is set to 50 mm, with entrance pupil diameters of 5 mm, 10 mm, 15 mm, 20 mm, and 25 mm. The primary optimization goal was to minimize the Root Mean Square (RMS) spot radius. During optimization, we set equal weighting for diffraction spots in both the x and y directions within each field of view. Additionally, the diffraction spot radii across different fields are equally weighted in the evaluation function. In the ray diagrams, red, green, and blue colors represent rays originating from the 7°, 5°, and on-axis directions, respectively, where rays on-axis are parallel to the optical axis. To prevent unfeasible manufacturing scenarios, the glass edge thickness for both laminated lenses was set to exceed 1 mm. For the laminated Wood lens, the optimization variables included the curvature radius and thickness of each surface (with the combined thickness of both surfaces not exceeding 10 mm), as well as the c and s parameters for each lens element. The optical path diagrams and the comparison of RMS spot sizes for the three fields of view are presented in Figure 5 and Figure 6, respectively.
Based on the simulation results across three fields of view, the first-order GRIN doublet exhibits the smallest RMS spot radius across all configurations, except for the on-axis field at a 10 mm aperture, where the first-order GRIN aspheric lens performs best (likely due to the aspheric design’s superior ability to suppress spherical aberration). Furthermore, the results indicate that as the entrance pupil diameter increases, the first-order GRIN doublet exhibits the lowest sensitivity, characterized by the slowest growth rate in spot size. In contrast, linear spherical radial GRIN lenses and first-order radial GRIN aspheric lenses are highly sensitive to increases in entrance pupil diameter, with their diffraction spot sizes growing rapidly with pupil diameter. At an aperture of 25 mm, the diffracted spot size of the first-order aspheric GRIN lens already exceeds that of the cemented doublet.
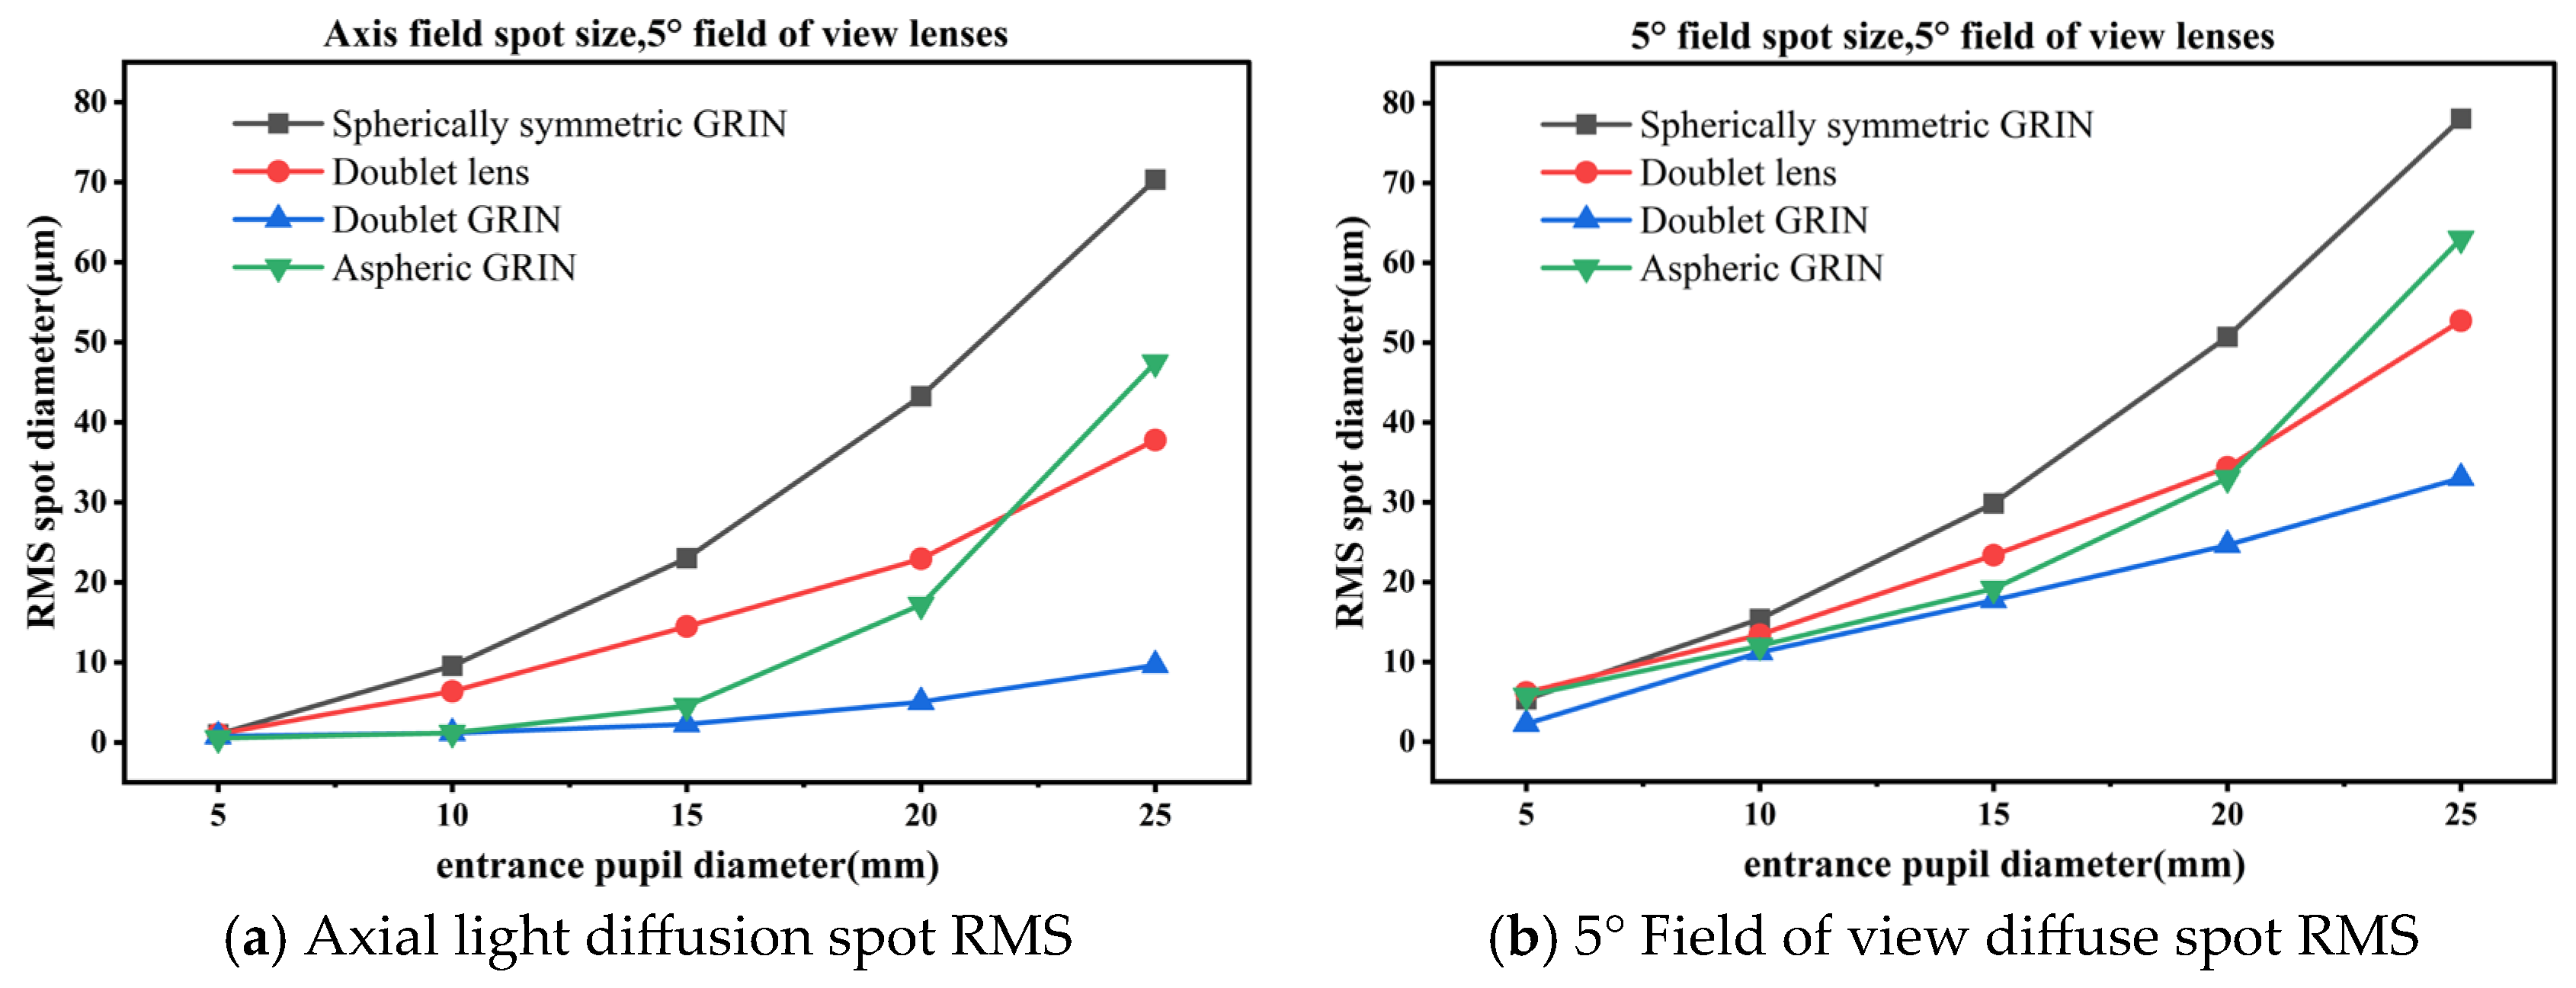
As shown in Figure 7, the comparison of spot radii across two fields of view closely aligns with the observations for the on-axis and 5° field configurations in the three-field simulation. In this case, the diffraction spot radius of any first-order GRIN doublet with an aperture ≤ 25 mm is the smallest. Furthermore, when the aperture is only 5, the theoretical diffraction spot radius in the 5° field of view is significantly smaller than that of other lenses. However, as the spot radius at this aperture falls below the Airy disk radius, the system becomes diffraction-limited, necessitating analysis via wave optics.
When considering only on-axis rays, as shown in Figure 8, the image surface must be defined as planar. Otherwise, an image curvature comparable to the spot radius might be optimized to artificially reduce the spot size, which is of limited practical significance. Therefore, the image plane is set as flat in this case, and the diffraction spot radius of the first-order GRIN doublet maintains a significant advantage.
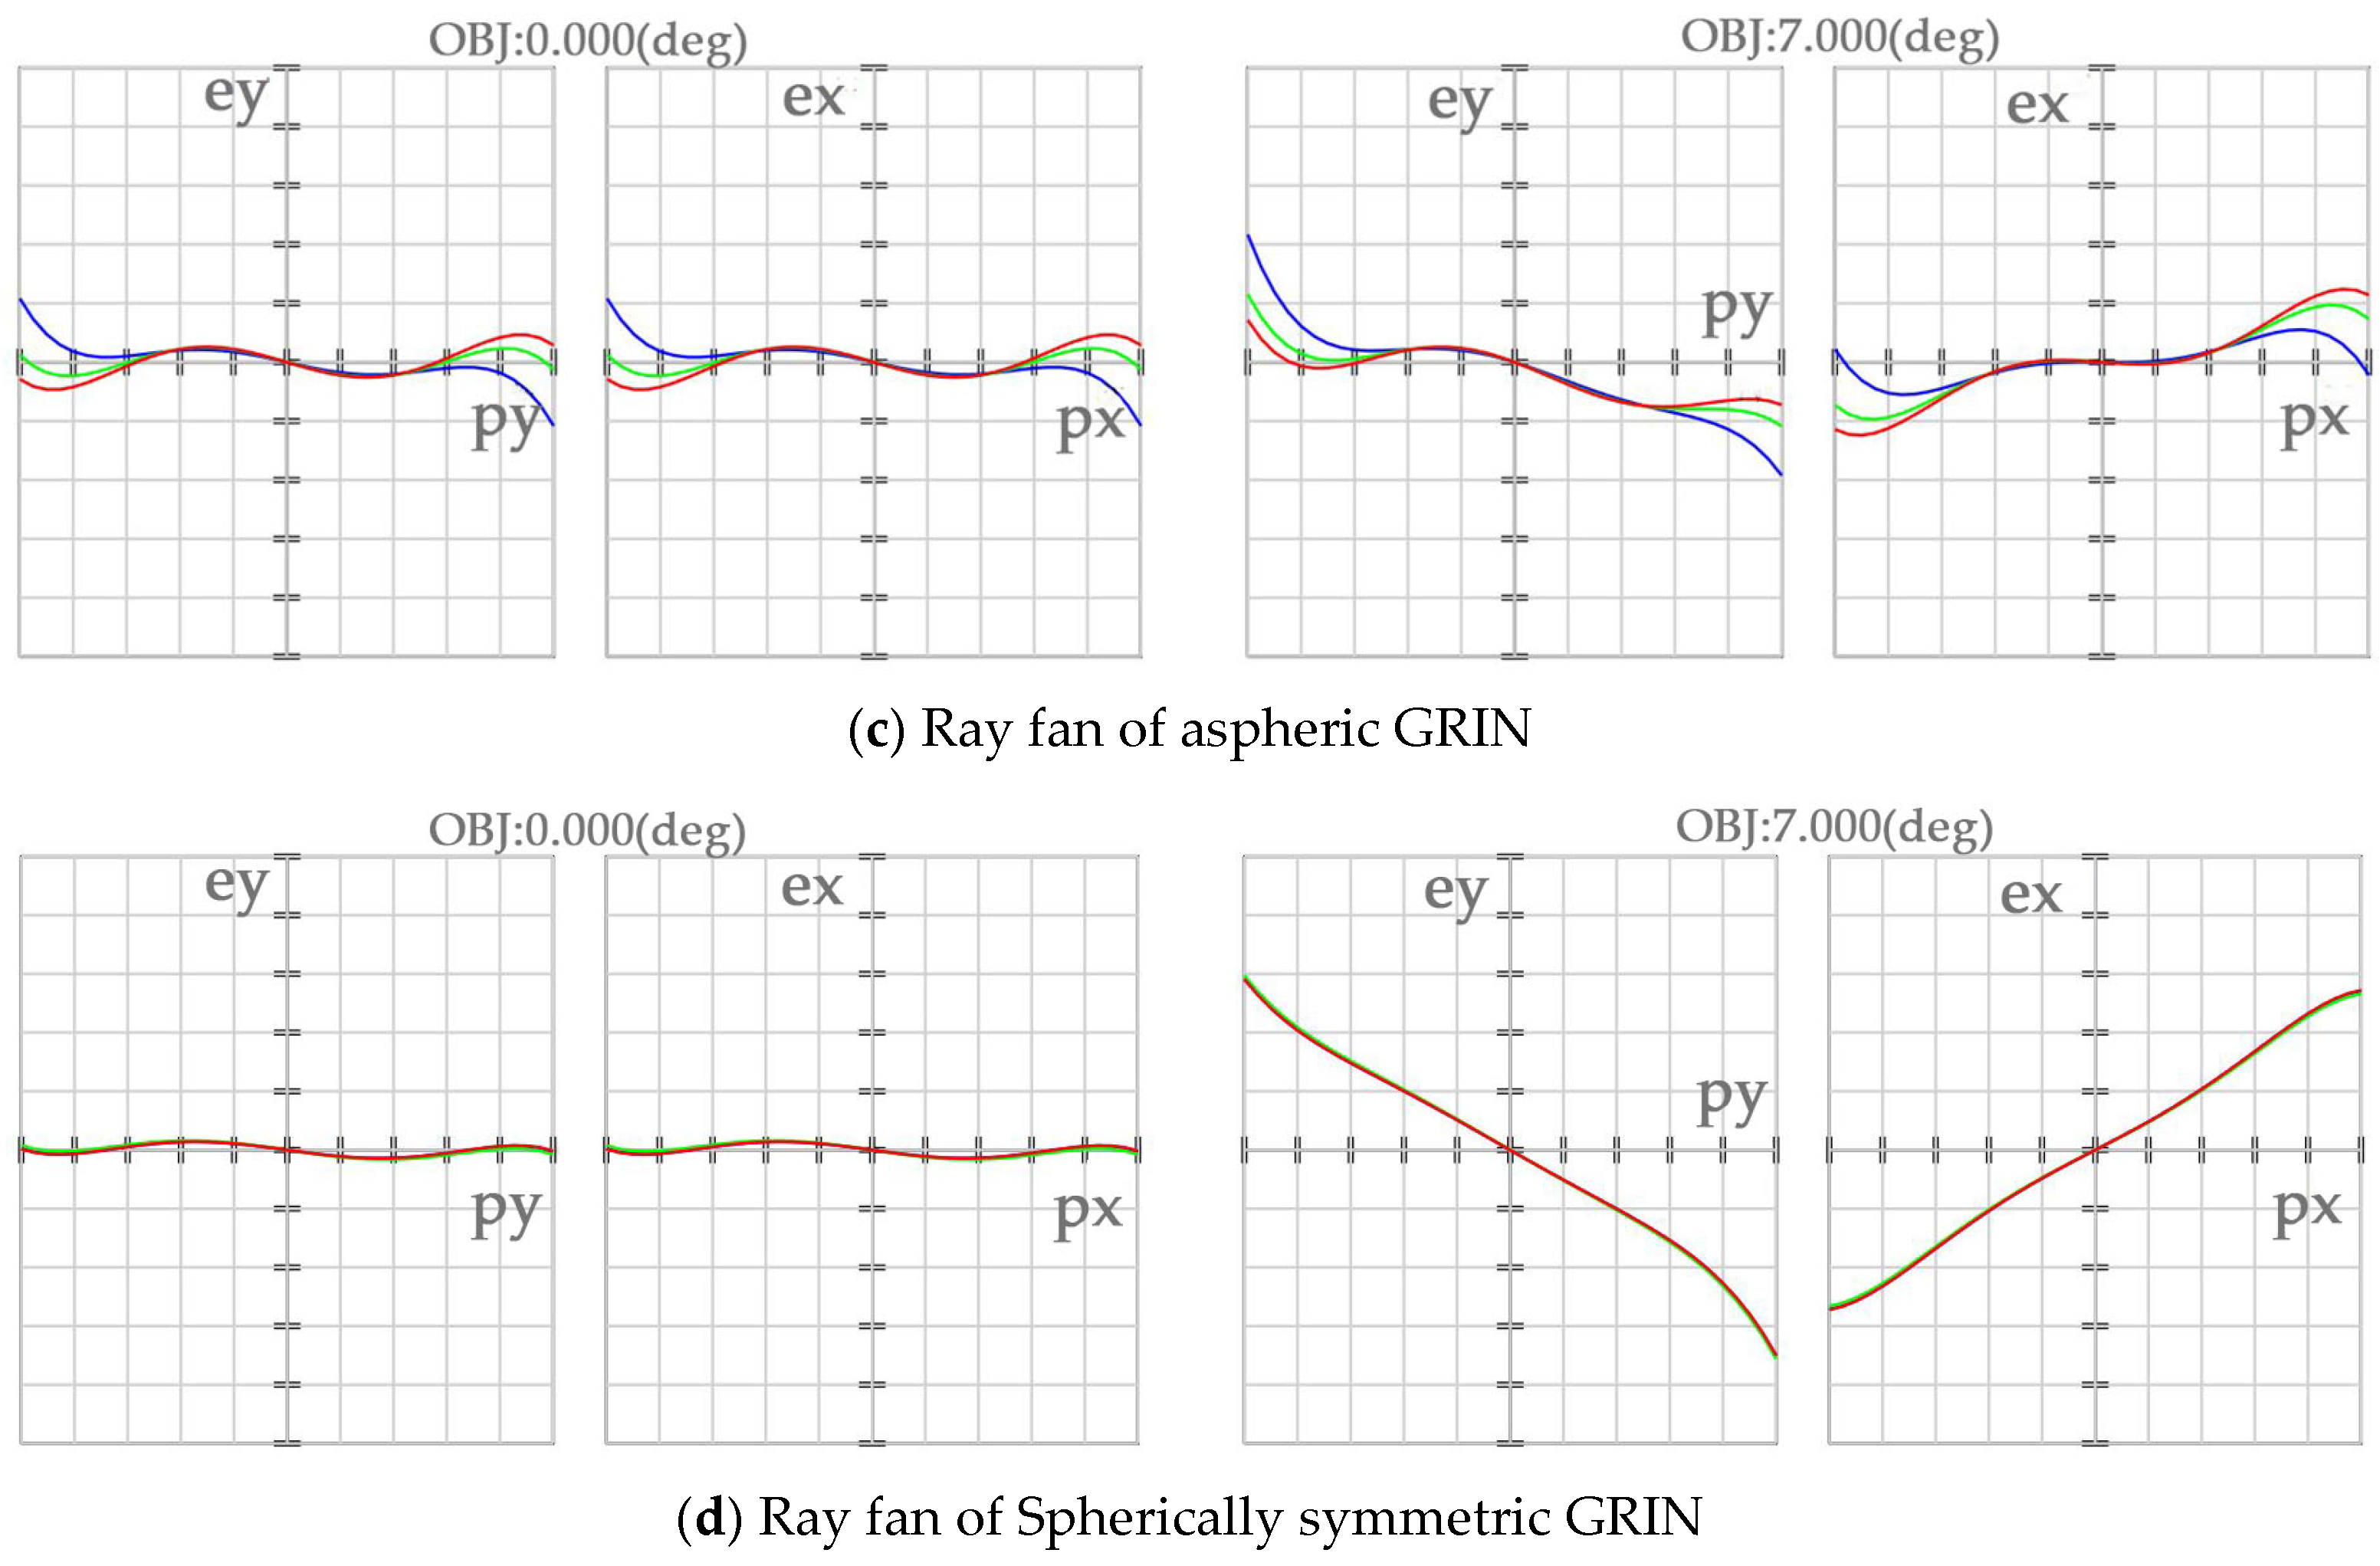
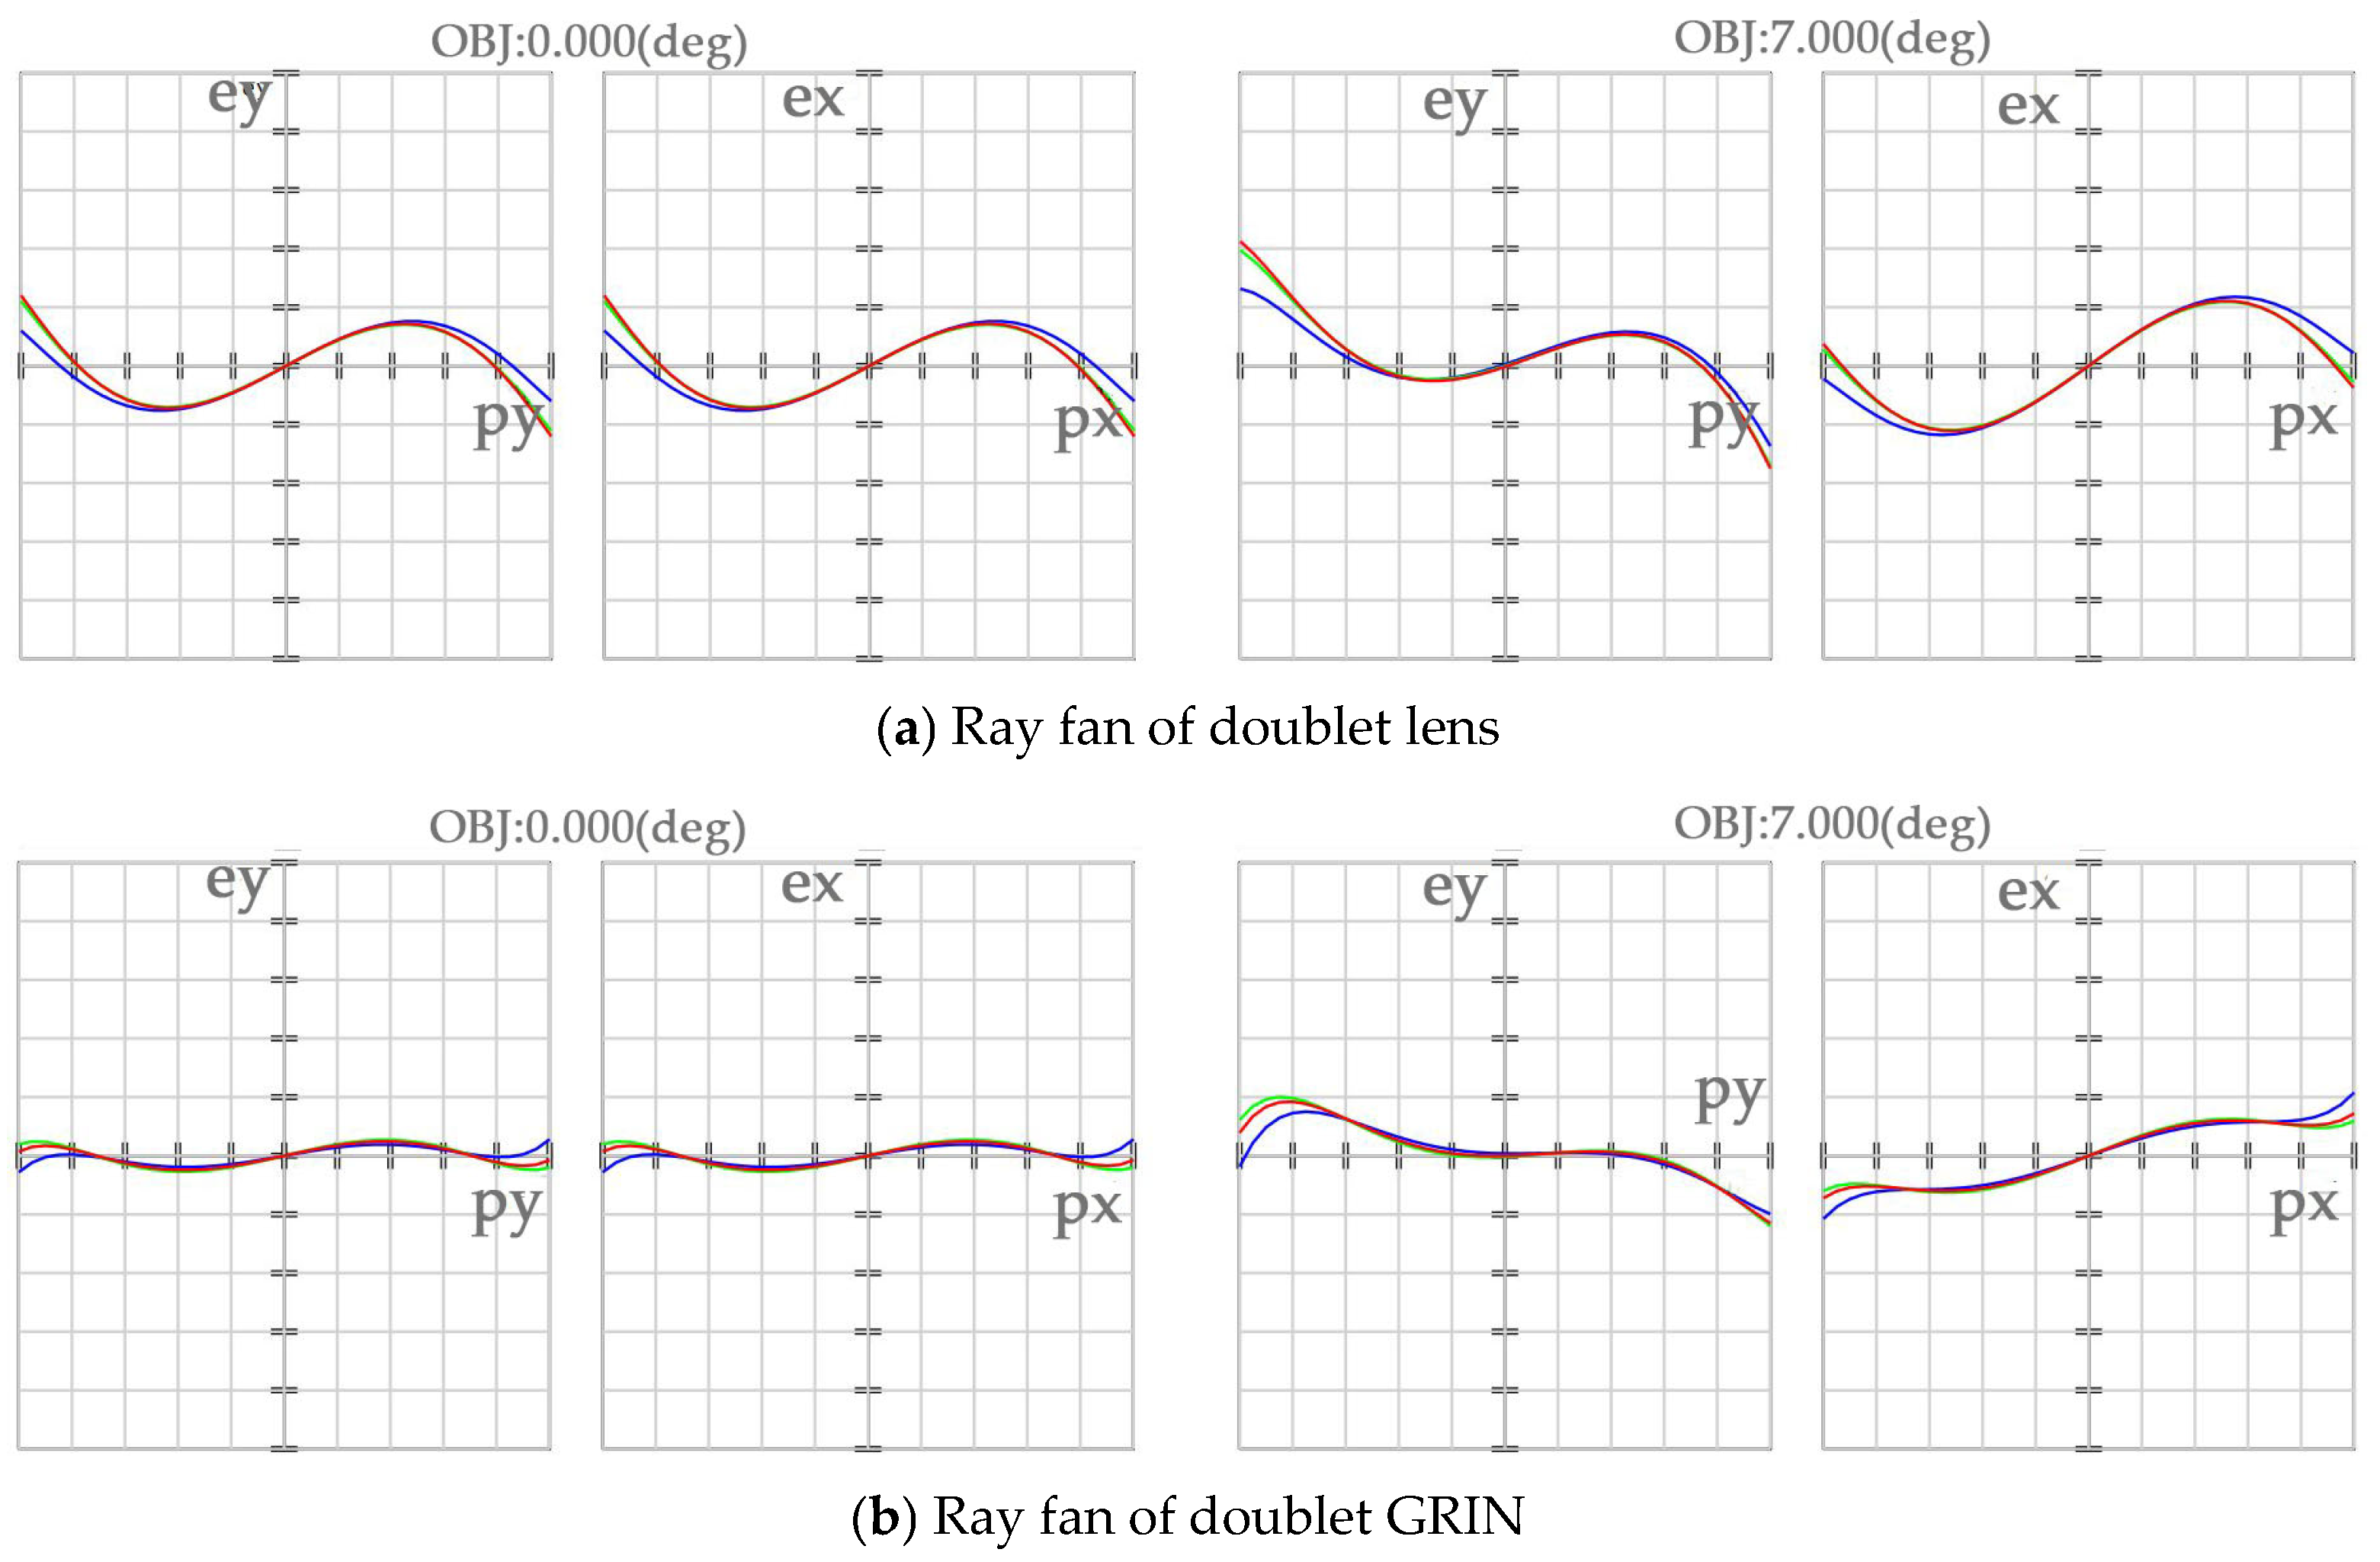
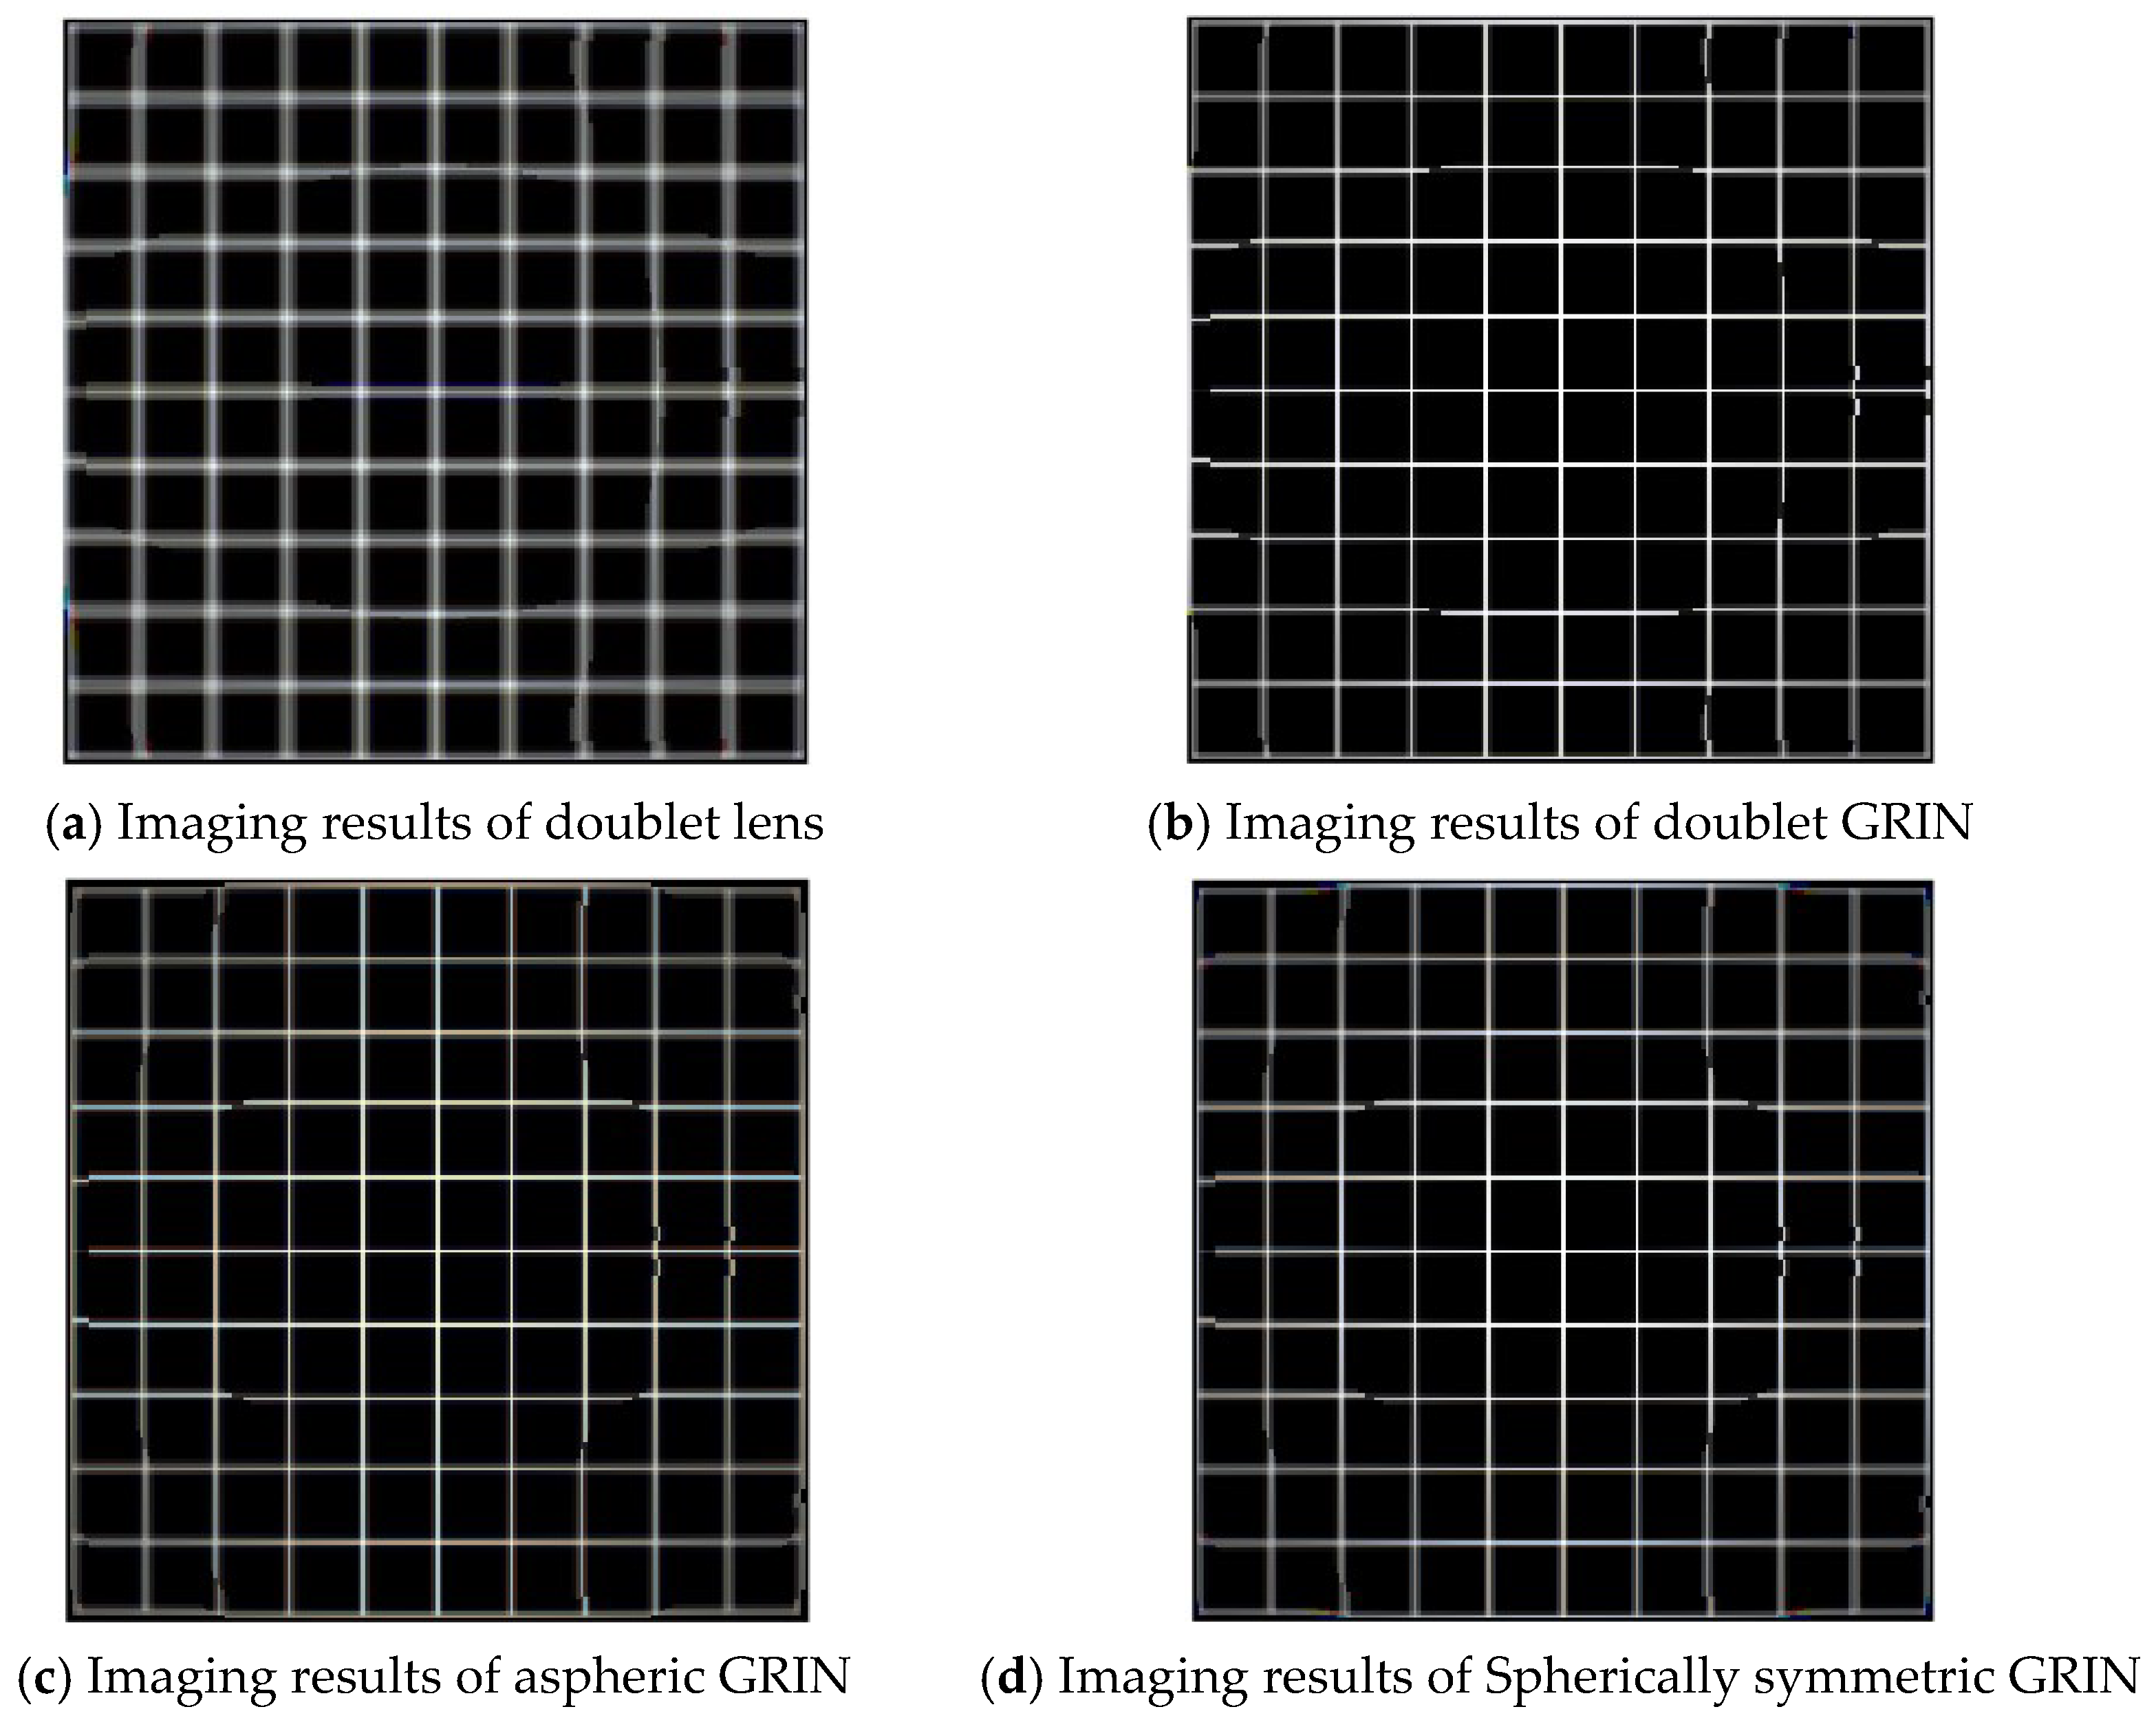
Under the conditions of an entrance pupil diameter of 25 mm and a focal length of 50 mm (F/2), the requirements for aberration correction are significantly high. Under these conditions, the ray fan plots and simulated imaging results for the four lens designs are presented in Figure 9 and Figure 10, respectively. Through quantitative and qualitative analysis of the ray fan plots and image simulation results at the 0° field and the 7° off-axis field, the aberration performance of the four lens architectures is compared.
The performance of the Cemented Doublet is severely limited by the number of physical surfaces and the spherical geometry. The ray fan plots exhibit a significant “S” shape, reflecting substantial third- and higher-order spherical aberrations. Due to the lack of effective suppression of longitudinal chromatic aberration, the red, green, and blue curves are clearly separated in the central region. In the off-axis field, the curves show extremely high slopes and asymmetry, indicating that coma and field curvature have become the dominant aberrations. Image simulation results show an almost total loss of contrast, with the spot size far exceeding the pixel resolution, proving that traditional spherical cemented doublets are unsuitable for such large-aperture imaging requirements.
The First-order GRIN Doublet introduces additional physical degrees of freedom to the system by incorporating a radial gradient refractive index. Ray fan plots show that the flatness of the on-axis (0°) curves is significantly improved compared to the traditional doublet, with the three-color curves converging well near the coordinate origin, proving that this structure can accurately control primary spherical aberration and longitudinal chromatic aberration. However, in the 7° off-axis field, the curves exhibit noticeable tilt and non-linear fluctuations. Image simulation results confirm that while the central clarity is greatly enhanced, residual lateral chromatic aberration remains at the edges. This suggests that while a first-order radial gradient can optimize the wavefront phase to align the focus, it still possesses certain limitations in handling the magnification differences across wavelengths caused by the large aperture.
The First-order Aspheric GRIN combines surface geometry asphericity with internal radial gradients. The ray fan plot at the 0° field is extremely flat in the paraxial region, but exhibits slight “W-shaped” fluctuations at the pupil edge, which is typically a characteristic of coupled higher-order spherical aberration and spherochromatism. The introduction of the aspheric surface effectively compensates for the deficiencies of the low-order radial distribution, resulting in superior central imaging quality compared to the previous two structures. However, in the 7° off-axis field, the blue curve deviates significantly due to a lack of sufficient axial symmetry balance. In image simulations, the edge grid displays certain dispersion fringes, reflecting the inherent challenges of a single-element aspheric GRIN structure in achieving full-field achromatic balance.
The aberration characteristics of the Spherically Symmetric GRIN are manifested as pure astigmatism. Its most prominent advantage is excellent full-field achromatic performance and the complete elimination of coma, which is extremely difficult to handle in large-aperture systems. In the 7° off-axis field, the ray fan plot appears as straight lines with opposite slopes, indicating that the current imaging blur is entirely caused by astigmatism and field curvature. Since the curves are highly linear without higher-order oscillations, these aberrations can be balanced and compensated for in subsequent systems by adding lens groups or fine-tuning surface curvatures. This demonstrates that the single-element spherical radial GRIN structure can effectively complete the correction of spherical and chromatic aberrations.
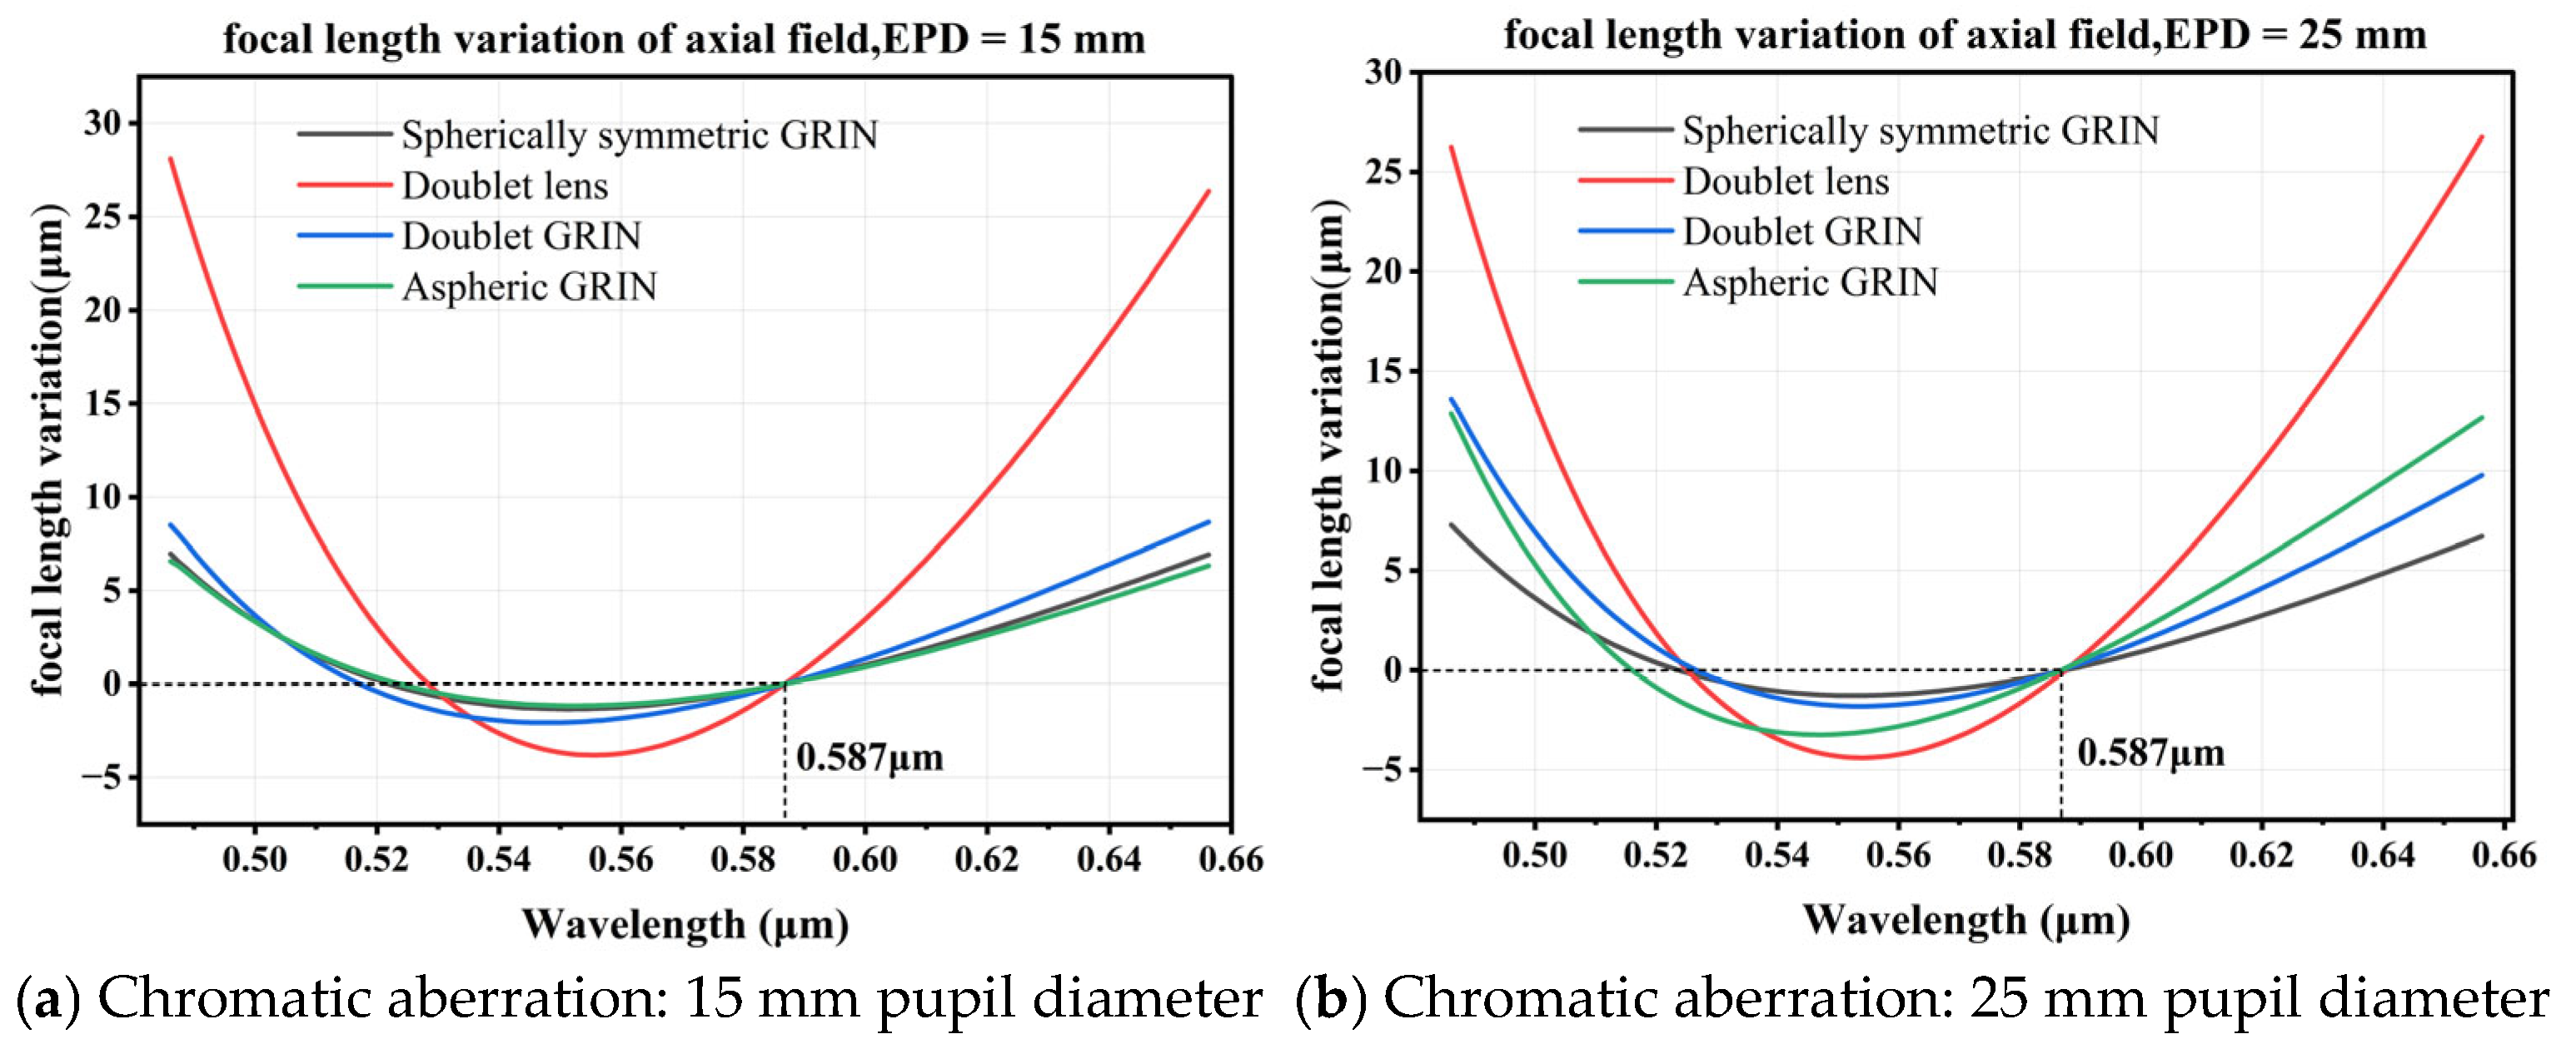
This study evaluates the longitudinal chromatic aberration performance of four lens architectures across the 486.1–656.3 nm spectral range under various entrance pupil diameters, with detailed comparisons conducted for 15 mm and 25 mm apertures. As observed from the focal length variation versus wavelength plots in Figure 11, the gradient-index structures significantly reduce the magnitude of the chromatic focal shift, effectively flattening the dispersion curves compared to traditional homogeneous cemented doublets. The summary results in Table 5 further confirm that the GRIN profiles exhibit substantial physical superiority in suppressing longitudinal chromatic aberration.
At a 15 mm aperture, the chromatic focal shifts in the first-order GRIN doublet and the single GRIN lens are minimal, recorded at 10.74 μm and 9.18 μm, respectively. These values are significantly lower than the 31.92 μm displacement observed in the traditional cemented doublet and are both within their respective diffraction-limited depths of focus. Notably, the spherically symmetric GRIN lens achieves a near-perfect chromatic balance with a focal shift of only 8.29 μm, attributable to its gradient design specifically optimized for achromatization.
As the aperture increases to 25 mm, the superiority of the GRIN designs remains robust. The traditional homogeneous cemented doublet maintains a high chromatic focal shift of approximately 31.14 μm; the slight decrease in this value compared to the 15 mm case is presumably due to the rebalancing of aberration weights within the merit function during the large-aperture optimization process. In stark contrast, several GRIN-based designs exhibit superior dispersion correction capabilities. Specifically, the chromatic focal shift of the first-order GRIN doublet is only 14.69 μm, while the spherically symmetric GRIN lens maintains exceptional performance at 8.56 μm. Given that the diffraction limit at this aperture is approximately 9.42 μm, the spherically symmetric GRIN lens successfully suppresses the residual secondary spectrum to the diffraction-limited level, even at larger scales.
To intuitively evaluate the imaging performance under extreme conditions, using a configuration with a focal length of f = 50 mm and an entrance pupil diameter of 25 mm as a benchmark, we performed image simulations using a grid pattern. As shown in Figure 11, the simulation covers an object field height of 10°, where the imaging remains clear within the 7° field of view but exhibits blurring toward the edges. The conventional cemented doublet lens fails to produce a recognizable image due to the increasingly severe aberrations associated with a fast F/2 system. In contrast, all proposed GRIN architectures significantly enhance the contrast and resolution of the simulated images. It is noteworthy that while the first-order GRIN doublet and the aspheric GRIN lens successfully suppress axial chromatic aberration, they still exhibit residual lateral chromatic aberration at the field edges, reflecting the inherent challenge of correcting off-axis chromatic aberrations with these specific GRIN profiles. The spherically symmetric GRIN lens, benefiting from its spherical refractive index distribution, maintains minimal off-axis chromatic aberration and provides the superior imaging performance across the entire field of view.
To ensure the physical reliability of the numerical optimization performed in Zemax, a cross-check was conducted between the simulation results and the analytical model derived in Section 2. We selected the first lens element of the optimized 10 mm aperture GRIN doublet as a representative sample for this validation.
The structural and material parameters of this sample, including a curvature radius R of approximately 22.52 mm, a center thickness d of 6.38 mm, and volume fraction coefficients c and s of 0.969 and 0.912, respectively, were extracted from the optimized design and substituted into the third-order aberration equations presented in Equations (34)–(37). The analytical calculation yielded a third-order spherical aberration coefficient, S 1 , of 0.009651.
As shown in Table 6, this theoretical value shows high consistency with the numerical output of 0.010299 from Zemax, resulting in a relative error of 6.29%. This small discrepancy, primarily attributed to the exclusion of higher-order terms in the Seidel-based analytical model, confirms that the numerical simulation environment aligns correctly with established physical laws. This cross-validation provides high confidence in the global optimization results presented in this study.

5. Discussion

While this study demonstrates the optical superiority of polymer GRIN architectures through a material-driven optimization framework, several practical factors remain essential for real-world implementation. The radiation resistance of the materials is a primary concern for lenses intended for extreme environments such as aerospace or medical imaging. Unlike inorganic glass, polymers like PMMA and SAN may undergo molecular chain degradation or color center formation when exposed to high-energy ionizing radiation, which can lead to significant transmittance loss. Therefore, exploring radiation-hardened polymers or applying protective inorganic coatings will be necessary to enhance environmental robustness.
Broadband transmittance and scattering losses also play a vital role in imaging efficiency. Although the effective medium theory used in this model assumes a macroscopically homogeneous gradient, actual fabrication must strictly minimize interfacial defects and impurities. Ensuring high transparency across the visible spectrum is a prerequisite for high-performance polymer optics, especially when nanolayer thicknesses must remain significantly below the working wavelength to suppress scattering. Furthermore, the thermal stability of polymer materials presents a well-known challenge due to their relatively high thermo-optic coefficients and thermal expansion rates. Temperature fluctuations can induce variations in both the refractive index gradient and the lens geometry, potentially leading to focal shifts. Incorporating athermalization strategies into the design process will be a vital direction for future work.
In addition to environmental stability, the practical transition from numerical design to physical prototyping requires a robust experimental validation framework. Since the proposed GRIN structures rely on precise spatial modulation of nanolayers, verifying the consistency between the fabricated samples and the theoretical models is paramount.
For the characterization of the internal refractive index profile, interferometric methods [28] provide a high-fidelity approach. By analyzing the phase shift in a probe beam passing through the medium, the three-dimensional refractive index distribution can be reconstructed to verify if the co-extrusion process accurately reproduces the intended g(r) profile. Furthermore, the overall imaging quality and wavefront integrity of the functional lens can be evaluated using a Shack-Hartmann wavefront sensor [29]. Measuring the exit pupil wavefront allows for a quantitative comparison between the measured Zernike coefficients and the numerical predictions from Zemax. Such metrology provides a necessary feedback loop to quantify the impact of manufacturing tolerances on specific aberrations, such as spherical residuals and astigmatism.

6. Conclusions

This paper derives the refractive index distribution of material-based gradient refractive index devices by reverse-engineering the distribution of first-order gradient refractive index materials at specific wavelengths. It establishes refractive index models for first-order radial GRIN and linear spherical radial GRIN lenses, and compares the performance of first-order GRIN doublet, cemented doublet, and linear spherical radial GRIN lens under various conditions. The results have confirmed that first-order GRIN double-bonded lenses exhibit the most robust aberration suppression capabilities across multiple fields of view, while spherically symmetric GRIN lenses successfully reduce second-order spectral aberrations by more than 70%, achieving diffraction-limited levels of chromatic aberration control. These results demonstrate the feasibility of the material-driven optimization framework in physical implementation, providing critical support for overcoming traditional geometric limitations and designing high-performance, large-aperture, short-focus optical systems.

Author Contributions

Methodology, A.G.; Conceptualization, C.S. and A.G.; software, C.S.; validation, C.S., A.G. and Z.J.; investigation, C.S.; resources, C.S. and A.G.; data curation, C.S.; writing—original draft preparation, C.S.; writing—review and editing, A.G.; visualization, Z.J.; supervision, A.G.; project administration, A.G.; funding acquisition, A.G. All authors have read and agreed to the published version of the manuscript.

Funding

This research was funded by the Yiwu Research Institute of Fudan University (grant number 20-1-20) and the recipient is Aiming Ge.

Institutional Review Board Statement

Not applicable.

Informed Consent Statement

Not applicable.

Data Availability Statement

The original contributions presented in this study are included in the article. Further inquiries can be directed to the corresponding author Aiming Ge.

Conflicts of Interest

The authors declare no conflict of interest.

References

  1. Statsenko, T.G.; Ermolaev, G.A.; Gets, D.; Kolchanov, D.S.; Chernyshev, I.Y.; Polezhaev, A.V.; Eliseev, I.E.; Ukleev, V.; Stahn, J.; Taradin, A.S.; et al. Bio-Inspired Giant Refractive Index Gradient Lenses Based on Ionic Polymers. Adv. Opt. Mater. 2025, 13, 2402488. [Google Scholar] [CrossRef]
  2. Qiao, H.; Sudre, G.; Lu, B.; Maazouz, A.; Lamnawar, K. High Barrier and Flexible Biodegradable PLA/CNC Based Multilayer Films via Large-Scale Forced Assembly Layer Multiplication Coextrusion: Role of Crystalline Polymer Layers Under Confinement. ACS Appl. Mater. Interfaces 2025, 17, 20162–20174. [Google Scholar] [CrossRef] [PubMed]
  3. Wang, Y.; Su, R.; Chen, J.; Wang, W.; Zhang, X.; Xu, H.; He, R. A novel mini 0.95MgTiO3-0.05CaTiO3 ceramic Luneburg lens fabricated by vat-photopolymerization 3D printing. Ceram. Int. 2024, 50, 13166–13175. [Google Scholar] [CrossRef]
  4. Pourahmadazar, J.; Virdee, B.S.; Denidni, T.A. Advancing into Millimeter Wavelengths for IoT: Multibeam Modified Planar Luneburg Lens Antenna with Porous Plastic Material. Electronics 2024, 13, 1605. [Google Scholar] [CrossRef]
  5. Djounidi, J.; Castillo-Tapia, P.; Fonseca, N.J.G.; Quevedo-Teruel, O. Low-Profile Fully Metallic Multiple-Ridge Luneburg Lens Antenna. IEEE Trans. Antennas Propag. 2024, 72, 4852–4861. [Google Scholar] [CrossRef]
  6. Chen, Q.; Chen, K.; Yang, F.; Chen, Y.; Qu, S.; Yang, S. Fast Analysis of Parallel-Plate Stratified Cylindrical Luneburg Lens Antennas for Millimeter-Wave Vehicular Communication. IEEE Trans. Veh. Technol. 2025, 74, 4319–4333. [Google Scholar] [CrossRef]
  7. Zhao, L.W.; Wu, Y.F.; Wang, C.; Guo, Y. A 3-D-Printed Deployable Luneburg Lens Antenna Based on the Pop-Up Kirigami Sphere. IEEE Trans. Antennas Propag. 2023, 71, 6481–6489. [Google Scholar] [CrossRef]
  8. Gao, Y.; Xiao, W.; Zhao, P.; Wu, X.; Chen, H. 540-degree deflecting lens and its general version. Opt. Express 2023, 31, 20112–20121. [Google Scholar] [CrossRef]
  9. Yamamura, A.; Oka, K.; Nishiguchi, N. Alignment accuracy of gradient-index rod lens in an array. Opt. Eng. 2019, 58, 085102. [Google Scholar] [CrossRef]
  10. Zhang, K.; Ma, C. Model for chromatic aberration of GRIN-rod lens. Guangzi Xuebao/Acta Photonica Sin. 1998, 27, 81–84. [Google Scholar]
  11. Xu, J.; Guo, C.; Li, Y.; Jin, X.; Quan, X.; Cheng, X. Graded-Index Lens Based Edge Coupler with Low-Loss, Broad Bandwidth for Efficient Coupling Between Silicon Waveguide and Standard Single-Mode Fiber. J. Light. Technol. 2025, 43, 701–711. [Google Scholar] [CrossRef]
  12. Thandaiah Prabu, R.T.; Raja, A.; Vanitha, V.; Ferlin Deva Shahila, F.D.; Subha, T.D.; Naresh, G.; Ali, F.M. Various graded index plastic optical fiber performance signature capability with the optimum dispersion control for indoor coverage applications. J. Opt. Commun. 2025, 46, 299–306. [Google Scholar] [CrossRef]
  13. Huang, X.; Sun, Z.; Yang, C.; Tan, J. Dispersion extension method for ultrasmall fiber probes in the chromatic confocal system. Opt. Express 2025, 33, 18970–18983. [Google Scholar] [CrossRef]
  14. Danqi, W.; Qun, Y.; Changjuir, Y.; Zhishan, G.; Xinhua, L. Intraocular lens model and its three-dimensional printing technology based on human eye data in China. Laser Optoelectron. Prog. 2020, 57, 213301. [Google Scholar] [CrossRef]
  15. Loffredo, F.; Villani, F.; de Girolamo Del Mauro, A.; Sico, G.; Nenna, G. Dual-step method to manufacture a polymeric GRIN lens with a high refractive index range. Appl. Opt. 2021, 60, 11228–11234. [Google Scholar] [CrossRef] [PubMed]
  16. Rama Krishna, K.S.; Sharma, A. Chromatic aberrations of radial gradient-index lenses. II. Selfoc lenses. Appl. Opt. 1996, 35, 1037–1040. [Google Scholar] [CrossRef]
  17. Mait, J.N.; Beadie, G.; Milojkovic, P.; Flynn, R.A. Chromatic analysis and design of a first-order radial GRIN lens. Opt. Express 2015, 23, 22069–22086. [Google Scholar] [CrossRef]
  18. Yin, K.; Ji, S.; Fein, H.; Ponting, M.; Olah, A.; Baer, E. Evaluation of high temperature polymers in nanolayered films and gradient refractive index (GRIN) lenses. J. Appl. Polym. Sci. 2015, 132, 42741. [Google Scholar] [CrossRef]
  19. Ji, S.; Yin, K.; Mackey, M.; Brister, A.; Ponting, M.; Baer, E. Polymeric nanolayered gradient refractive index lenses: Technology review and introduction of spherical gradient refractive index ball lenses. Opt. Eng. 2013, 52, 112105. [Google Scholar] [CrossRef]
  20. Mait, J.N.; Beadie, G.; Flynn, R.A.; Milojkovic, P. Dispersion design in gradient index elements using ternary blends. Opt. Express 2016, 24, 29295–29301. [Google Scholar] [CrossRef]
  21. Beadie, G.; Mait, J.N. Material selection for GRIN-based achromatic doublets. Opt. Express 2019, 27, 17771–17794. [Google Scholar] [CrossRef]
  22. Li, Q.; Ma, R.; Li, X.; Niu, M.; Cao, H.; Pan, Y.; Gao, X.; Xu, S.; Li, D. Dual dispersion turning point co-enhanced fiber sensor. Opt. Laser Technol. 2026, 197, 114811. [Google Scholar] [CrossRef]
  23. Li, C.; Wei, K.; Liu, J.; Zhang, W.; Zhao, X.; Qin, Y.; Ren, K. XGBoost-Based Dispersion Compensation and Optimization of a Two-Stage Objective Lens for GRIN Fiber Spectral Confocal. In Proceedings of the SPIE—The International Society for Optical Engineering, Xi’an, China, 8 December 2025. [Google Scholar]
  24. Li, C.; Li, D.; Liu, J.; Li, K.; Jiang, J. Effect of Optical Aberration on Peak Wavelength Extraction Based on GRIN Dispersion Objective. Guangzi Xuebao/Acta Photonica Sin. 2024, 53, 0322003. [Google Scholar] [CrossRef]
  25. Liu, D. The Theory of Variable Refractive Index Media and Its Technical Applications; Southwest Universitiy Publishing Group: Chongqing, China, 2005. [Google Scholar]
  26. Flynn, R.A.; Fleet, E.F.; Beadie, G.; Shirk, J.S. Achromatic GRIN singlet lens design. Opt. Express 2013, 21, 4970–4978. [Google Scholar] [CrossRef] [PubMed]
  27. Boyd, A.; Ponting, M.; Fein, H. Layered polymer GRIN lenses and their benefits to optical designs. Adv. Opt. Technol. 2015, 4, 429–443. [Google Scholar] [CrossRef]
  28. Su, J.; Tian, A.; Wang, H.; Liu, B.; Zhu, X.; Wang, S.; Liu, B.; Hou, J. Synchronous multi-wavelength interferometric method for measuring aspherical surface profile. Opt. Express 2025, 33, 7672–7683. [Google Scholar] [CrossRef]
  29. Galaktionov, I.V.; Nikitin, A.N.; Sheldakova, J.V.; Toporovsky, V.V.; Kudryashov, A.V. Numerical Analysis of Wavefront Approximation Accuracy by Means of Zernike Polynomials for Optical Surface Flatness Measurements Using a Hartmannometer Device. Opt. Mem. Neural Netw. (Inf. Opt.) 2024, 33, S146–S157. [Google Scholar] [CrossRef]
Figure 1. The distribution of electric fields as light passes from air into different materials. Based on the material, the refractive index can be accurately determined. (a) From air to PMMA material with a refractive index of 1.4879, (b) From air to SAN material with a refractive index of 1.5615, (c) From air to a laminated material (layer thickness less than 1/4 wavelength) where the volume ratio of PMMA to SAN is 4:6, the refractive index is in strict agreement with the calculated value of 1.5325, (d) From air to a material with SAN as the base and 30% volume of PMMA particles doped in it, the refractive index is in strict agreement with the calculated value of 1.5398.
Applsci 16 03734 g001
Figure 2. Schematic diagram of thin Wood lens. For a Wood’s lens defined by a refractive index distribution curve, only the thickness d and the half-diameter w can be adjusted; these two parameters determine the focal length of the Wood’s lens.
Applsci 16 03734 g002
Figure 3. Light propagation in a multilayer GRIN lens. The z = z 0 plane is the object plane, and the z = z 1 plane is the image plane. Regions I and IV represent the ambient media (typically air) in the object space and image space. Light rays propagate from the z = z 0 plane toward the z = z 1 plane, passing through the two layers of GRIN lenses II and III, whose material interface is s 2 .
Applsci 16 03734 g003
Figure 4. Schematic representation of the spherical gradient refractive index lens model. The lens structure can be envisioned as being “cut” from a thick spherical shell of GRIN material. The dashed line indicates the iso-refractive surface passing through the vertex n 0 , where R G represents its radius of curvature. n 2 and n 4 denote the theoretical innermost and outermost refractive indices of the original thick shell, with r 2 and r 4 being the corresponding radii of these iso-refractive surfaces. R L signifies the physical radius of curvature of the lens surface. The parameter n 3 identifies the refractive index at the lens edge. A critical design logic is established: when the physical radius of curvature R L at vertex n 0 is larger than the radius of the iso-refractive surface R G , n 3 represents the extreme refractive index value within the lens volume; otherwise, the extreme value occurs at the vertex n 0 .
Applsci 16 03734 g004
Figure 5. Optical path diagrams of the four lenses. Simulated under three field-of-view conditions, with all focal lengths set to 50 mm; the colors blue, green, and red represent 0°, 5°, and 7° fields of view, and the exit pupil diameter ranges from 5 mm to 25 mm.
Applsci 16 03734 g005
Figure 6. RMS spot diameter vs. EPD optimized across three fields of view (0°, 5°, 7°). The plots characterize the balanced aberration growth rates and the robustness of the GRIN architectures in maintaining full-field imaging quality at large apertures.
Applsci 16 03734 g006
Figure 7. RMS spot diameter vs. EPD optimized for two fields of view (0°, 5°). These curves demonstrate the performance trade-off between axial resolution and mid-field aberration control, highlighting the versatility of the material-driven optimization framework.
Applsci 16 03734 g007
Figure 8. RMS spot diameter vs. EPD optimized for a single on-axis field (0°). The results represent the intrinsic resolution limit of each lens architecture when off-axis constraints are removed, achieving near-diffraction-limited performance for the GRIN designs.
Applsci 16 03734 g008
Figure 9. Ray fan plots for the four architectures at EPD = 25 mm and f = 50 mm, where each grid division represents 100 μm. The red, green and blue lines in the figure respectively represent wavelengths of 486.1 nm, 587.6 nm and 656.3 nm. These plots reveal the transverse aberration residuals at 0 and 7 fields, providing a microscopic view of the wavefront correction capability of each structure.
Applsci 16 03734 g009aApplsci 16 03734 g009b
Figure 10. Image simulation of the four architectures at EPD = 25 mm and f = 50 mm. The pattern spans a 1 0 object height, exceeding the 7 optimization range and resulting in peripheral blurring. The conventional cemented doublet shows severe image degradation due to overwhelming spherical residuals, while the first-order aspheric GRIN exhibits noticeable color fringing indicating residual lateral chromatic aberration.
Applsci 16 03734 g010
Figure 11. Chromatic aberration of four lenses, all three GRIN lenses show significant suppression of the second-order spectrum.
Applsci 16 03734 g011
Table 1. Variables in the optimization of different lenses.
Lens ArchitectureFixed QuantitiesOptimization Variables
Cemented doubletEffective focal length, total center thicknessSurface radii of curvature, individual element center thicknesses, image distance
First-order GRIN doubletEffective focal length, total center thicknessSurface radii of curvature, individual element center thicknesses, image distance, s and c parameters for each element
Linear spherical radial GRIN lensEffective focal length, lens center thicknessSurface radii of curvature, image distance, R G , R 2 and R 4 parameters, conic constants of front and back surfaces
First-order GRIN lensEffective focal length, lens center thicknessSurface radii of curvature, image distance, s and c parameters, conic constants of front and back surfaces
Table 2. Calculation and simulation of the focal length of Wood lenses at a wavelength of 656 nm.
Caliber/mmThickness/mmSimulation Results (Focal Length 1)/mmCalculation Results (Focal Length 1)/mmError 1
251095.9396.110.19%
255190.26192.221.03%
5010380.52384.441.03%
101016.2915.385.59%
201061.7861.510.44%
Table 3. Calculation and simulation of the focal length of Wood lenses at a wavelength of 486 nm.
Caliber/mmThickness/mmSimulation Results (Focal Length 2)/mmCalculation Results (Focal Length 2)/mmError 2
2510105.57106.110.51%
255209.53212.211.28%
5010419.05424.421.28%
101017.8416.98−4.82%
201067.9667.91−0.07%
Table 4. Chromatic focal shift in the Wood lens at wavelengths of 486 nm and 656 nm.
Caliber/mmThickness/mmChromatic Focal Shift/mm
25109.64
25519.27
501038.54
10101.55
20106.17
Table 5. Axial chromatic aberration of different lenses at 15 mm and 25 mm.
Axial Chromatic Aberration/μmSpherically Symmetric GRIN LensDoublet LensDoublet GRIN LensAspheric GRIN Lens
Chromatic shift at EPD = 15 mm8.292731.916310.73659.184
Diffraction limit at EPD = 15 mm26.1428.23525.80326.298
Chromatic shift at EPD = 25 mm8.559431.143114.686515.918
Diffraction limit at EPD = 25 mm9.4229.72211.49611.682
Table 6. Zemax simulation values for aberration coefficients versus theoretical calculations of aberration coefficients.
ParameterAnalytical ModelNumerical Simulation
in Zemax
Spherical Aberration A 1 0.012620/
Spherical Aberration A 2 −0.002998/
Spherical Aberration A 3 0.000030/
Spherical Aberration A 0.0096510.010299
Disclaimer/Publisher’s Note: The statements, opinions and data contained in all publications are solely those of the individual author(s) and contributor(s) and not of MDPI and/or the editor(s). MDPI and/or the editor(s) disclaim responsibility for any injury to people or property resulting from any ideas, methods, instructions or products referred to in the content.