Article

Static and Dynamic Properties of Organic Soils Stabilized with Nano-Silica and Sand

1
Innovation Demonstration Base of Ecological Environment Geotechnical and Ecological Restoration of Rivers and Lakes, Key Laboratory of Intelligent Health Perception and Ecological Restoration of Rivers and Lakes, Ministry of Education, Hubei University of Technology, Wuhan 430068, China
2
School of Intelligent Construction, Wuchang University of Technology, Wuhan 430223, China
*
Author to whom correspondence should be addressed.
Appl. Sci. 2026, 16(7), 3607; https://doi.org/10.3390/app16073607
Submission received: 9 March 2026 / Revised: 26 March 2026 / Accepted: 31 March 2026 / Published: 7 April 2026

Abstract

The stabilization of soft, organic-rich soils with cement is often hindered by retarded hydration and poor long-term performance under cyclic loads. While nano-silica or sand are known modifiers, their individual efficacy in high-organic environments remains limited, and a systematic comparison of their composite effect across different soil types is lacking. This study investigates the synergistic enhancement of cement-stabilized soils using a combined nano-SiO2 and sand composite, comparing its effectiveness in high-organic soft soil and low-organic clay. Laboratory tests, including unconfined compressive strength (UCS), cyclic loading, scanning electron microscopy (SEM), and X-ray diffraction (XRD), were conducted. Results showed a stark contrast in 28-day UCS between unmodified soft soil cement (0.13 MPa) and clay cement (1.04 MPa). The optimal composite of 3.5% nano-SiO2 and 40% sand increased the 28-day UCS to 1.39 MPa for soft soil (a 969% improvement) and 5.51 MPa for clay (a 430% improvement), respectively. Notably, under a cyclic stress ratio (CSR) of 0.7~0.8, unmodified specimens failed after fewer than 120 load cycles, whereas the composite-modified soils withstood 20,000 cycles without failure, demonstrating exceptional fatigue resistance independent of static strength gain. Microstructural analysis revealed that the composite effectively promoted the formation of cementitious hydration products, counteracting the inhibitory effect of organic matter. This research demonstrates that the nano-silica sand composite provides a superior and more broadly applicable improvement for cement-stabilized soils across the tested organic content range (3.3–7.7% LOI) compared to single-additive approaches, significantly enhancing both mechanical strength and long-term durability.

1. Introduction

China’s vast territory and widespread distribution of rivers and lakes have resulted in many urban areas being underlain by soft soils and peat rich in organic matter, which exhibit poor mechanical properties. To address issues such as insufficient bearing capacity and inadequate consolidation of soft soil layers, deep cement mixing (DCM) has been widely employed in geotechnical engineering. However, numerous studies [1,2,3] have demonstrated that excessive organic content in soil significantly impairs the effectiveness of cement stabilization. Organic matter inhibits the hydration process of cement, preventing the full development of its inherent mechanical strength, and often leads to unsatisfactory performance that fails to meet construction standards. This problem is particularly pronounced under repeated cyclic loading from traffic and other dynamic forces. Therefore, in practical applications of embankment engineering along riverbanks, the method of using cement alone to treat soft soil urgently requires further improvement.
Nanomaterials have been widely applied in industries such as medicine and electronics, and in recent years, their application in geotechnical engineering has rapidly expanded. Enhancing the compressive strength of cement-stabilized soils using nanomaterials such as nano-silica (nano-SiO2), nano-alumina, and nano-magnesium has become a key research focus. Among these, nano-silica has shown particularly promising performance. Karimiaza et al. [4] demonstrated that nano-silica significantly improves the California Bearing Ratio (CBR) of clay compared to nano-alumina. When combined with 3% cement, the bearing capacity was equivalent to that of 6–7% pure cement, with a more pronounced reduction in porosity, highlighting its efficiency in soil reinforcement. Chen et al. [5] reported that after 60 wet dry cycles, the strength of nano-SiO2-treated cemented soil was 3.4 times greater than that of ordinary cemented soil. Moreover, in marine environments, the rate of increase in failure strain diminished with more cycles. Tabarsa et al. [6] found that the addition of nano-clay to loess increased the plasticity index and optimal moisture content, while decreasing the maximum dry density. The total stress cohesion improved, and the total stress friction angle decreased. Chen et al. [7] also suggested that the improvement of cemented soils by nano-SiO2 results from both pozzolanic and filling effects. However, high organic matter content can delay the hydration reaction, diminishing the effectiveness of nano-SiO2. Current studies indicate that a high organic matter content in soft soils adversely affects the performance of cement stabilization [8,9,10]. Organic-rich soils not only limit the functionality of nanomaterials but also suppress the hydration process of cement, resulting in poor mechanical properties that fall short of engineering requirements. In nature, sand soil mixtures are commonly encountered. Given that single materials often fail to meet complex engineering demands, composite stabilization of cemented soils has gained research interest [11]. In parallel, the growing global emphasis on environmental protection has spurred the search for new eco-friendly materials for soil stabilization. While the addition of sand does not entirely eliminate the need for cement, the enhanced mechanical properties of sand-based composites can significantly reduce the required cement content, thus achieving environmental benefits. Joel and Agbede [12,13] found that the inclusion of sand improves the strength of cemented soils, meeting the performance requirements for road base materials. Mamun et al. [14] demonstrated through laboratory testing that all four types of sand tested met base strength standards within 14 days, and sand cement mixtures containing 8–10% cement were suitable for use in sub-base layers of traffic roads. Subramanian et al. [15] further showed that hard sand particles bonded to the cemented clay matrix improved stiffness, while the velocity ratio and dynamic Poisson’s ratio decreased as the stiffness of the cemented soil increased.
In recent years, the rapid development of highways and railways has intensified interest in the dynamic behavior of soils under traffic loading. Traffic-induced loads are typically characterized by low frequency, low amplitude, and long-duration cyclic loading. Prolonged exposure of deep, weak subsoil to such traffic-induced cyclic stresses can lead to progressive deformation of the foundation, potentially resulting in various structural failures. This trend has prompted extensive research into the dynamic properties of soils, aiming to better understand and predict their behavior under traffic loads and to mitigate the associated risks of structural damage [16]. Subramaniam et al. [17] observed that the shear modulus of cement-treated clay increases with confining pressure. Although the confining pressure had little effect on the secant shear modulus, and the damping ratio remained nearly constant at a shear strain of 0.1%, a significant increase was found in effective confining pressure. Gao et al. [18] reported that the inclusion of basalt fibers altered the energy absorption mechanisms of the samples under impact loading. Du et al. [19] showed that the accumulation of cyclic shear strain increases with the number of loading cycles, and a turning point in the shear strain curve could serve as a suitable failure criterion for cemented soils. In split Hopkinson pressure bar (SHPB) tests, Ma et al. [20] found that cemented soil with 1.5% basalt fiber exhibited the highest dynamic compressive strength (5.936 MPa), an increase of 7.19% compared to untreated samples. Ding et al. [21] developed a pore pressure model for cement-stabilized soils under cyclic loading. The results showed that pore water pressure initially increases sharply and then gradually stabilizes over time; the degree of initial consolidation significantly influences the development of pore pressure. Panico et al. [22] have shown that cemented specimens exhibit a logarithmic accumulation trend, with a rapid increase in strain once a threshold is reached. Given these findings, it is both scientifically challenging and practically significant to investigate the mechanical behavior and microstructural mechanisms of cement-stabilized soils with varying organic matter contents, modified using sand and nano-silica, under cyclic loading. This study aims to provide insight into the dynamic characteristics of such composites and contribute to the development of more resilient ground improvement techniques.
Although nanomaterials (such as nano-SiO2) and sand have demonstrated potential in enhancing cement soil performance, existing research exhibits distinct gaps: First, the synergistic reinforcement mechanism between nano-SiO2 and sand in high-organic-content soft soils, along with its specific impact on cement hydration, remains unclear. Second, systematic comparative data under dynamic cyclic loading for soils with varying organic matter content is lacking, particularly regarding fatigue performance and energy dissipation characteristics. Furthermore, current research predominantly focuses on macroscopic mechanical indicators, with insufficient mechanistic explanations for microstructural evolution and compositional interactions among organic matter–nanomaterials–sand–cement. These scientific gaps hinder the prediction and optimization of composite materials’ long-term performance under real dynamic loading conditions. Therefore, this study aims to elucidate the aforementioned mechanisms to advance the development of weak foundation reinforcement technologies.
To bridge these gaps, this study aims to:
  • Investigate the synergistic effects of nano-SiO2 and sand composites on the unconfined compressive strength (UCS) of both high-organic soft soil and low-organic clay.
  • Evaluate and contrast the fatigue life, dynamic deformation modulus, and energy dissipation characteristics of the optimally modified composites under uniaxial cyclic loading.
  • Elucidate the underlying microstructural and compositional mechanisms (via SEM and XRD) responsible for the performance differences between soil types and modification methods.
  • Recent comprehensive reviews on performance-efficient stabilized soils emphasize that new mixtures must transcend simple strength metrics and address multi-dimensional performance indicators including carbon footprint, permeability coefficients, and durability under environmental cycling. This study establishes baseline mechanical performance as a prerequisite for subsequent sustainability optimization [23].
The primary contributions are: (a) providing a validated composite formulation effective for high-organic soft soils and low-organic clays, with future validation required for intermediate organic contents and different soil mineralogies that effectively mitigates the detrimental impact of organic matter on cement hydration, (b) delivering comprehensive comparative data on the static and dynamic properties of modified soils across a range of organic contents, and (c) offering microstructural insights that link the composite’s effectiveness to enhanced hydration and soil fabric, advancing the design of durable ground improvement solutions.
Novelty Statement: Unlike previous studies examining nano-SiO2 or sand individually, this work establishes the synergistic mechanism by which nano-SiO2 overcomes organic inhibition through heterogeneous nucleation while sand provides skeletal reinforcement. The study provides the first systematic comparison of static vs. dynamic performance across organic content gradients (3.3–7.7% LOI), demonstrating that the composite enhancement is independent of static strength gains—a critical distinction for traffic loading design.

2. Materials and Experimental Program

2.1. Tested Soils

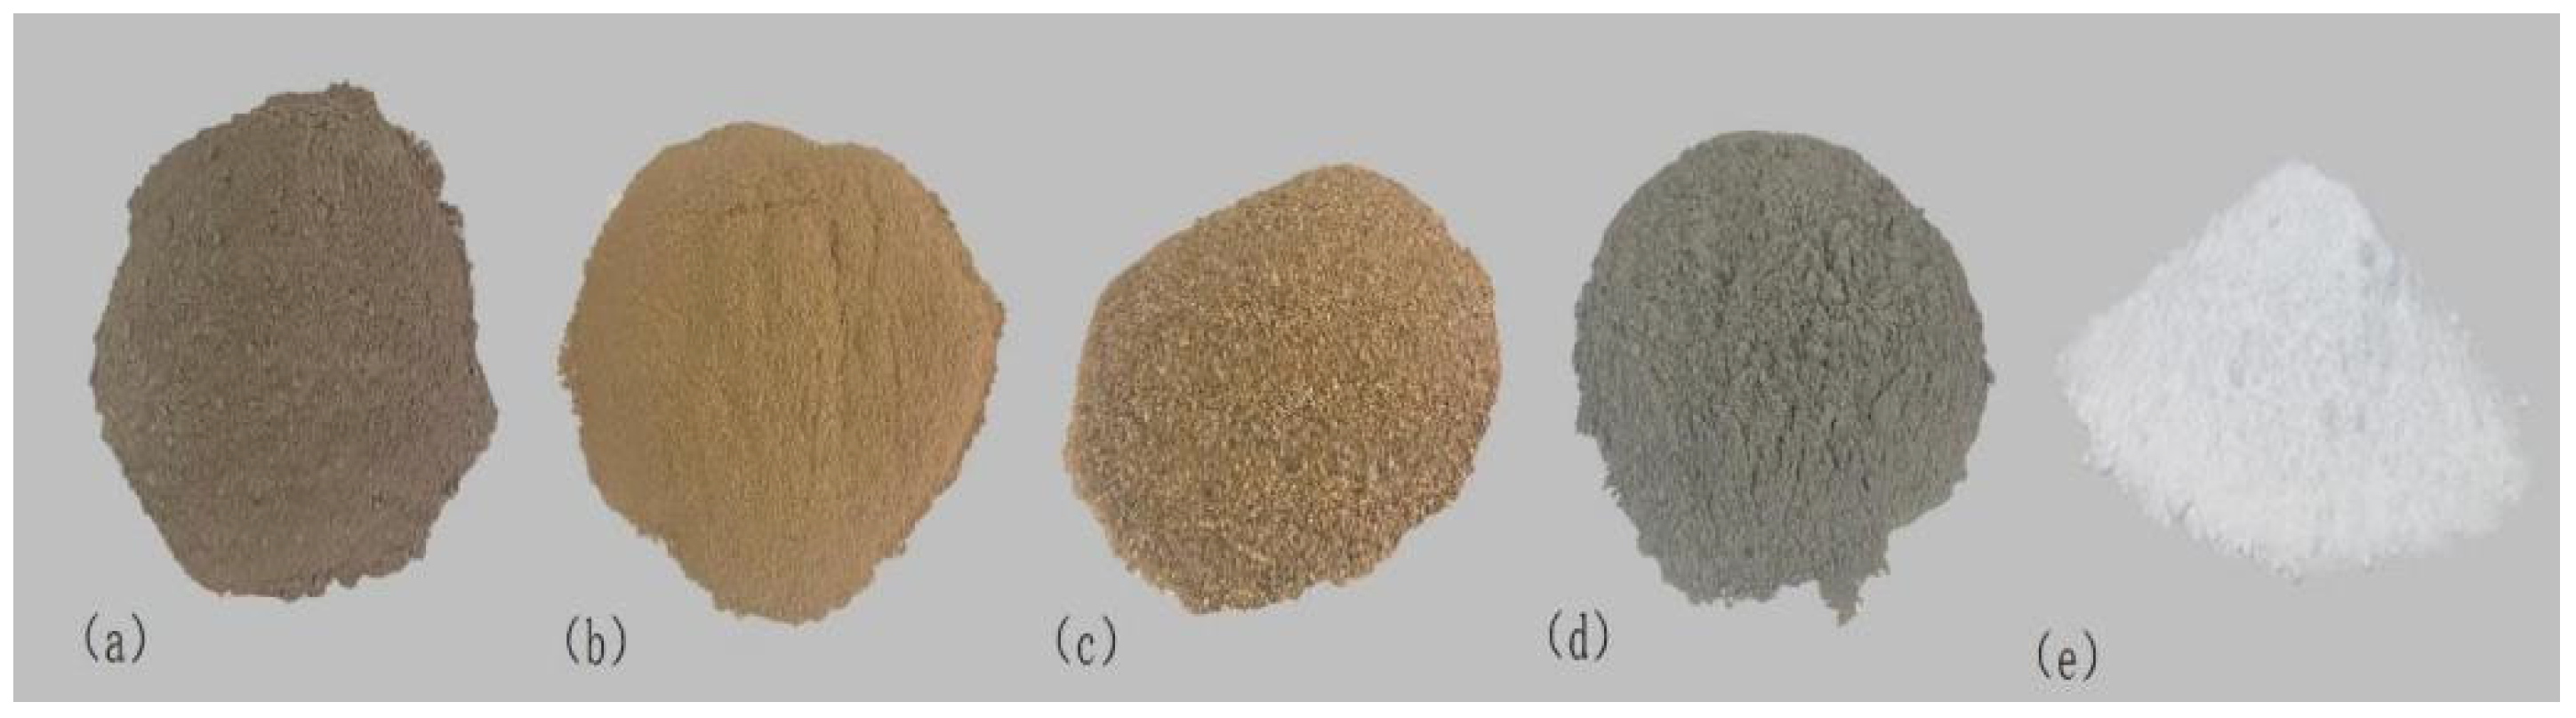
The nano-silica VK-SP30 (Nano-SiO2) used in this study was purchased from Xuancheng Jingrui New Materials Co., Ltd. (Xuancheng, China). It appears as a white powder, as illustrated in Figure 3e, and has a purity of over 99.5%. The detailed physicochemical properties of the nano-silica are listed in Table 1.
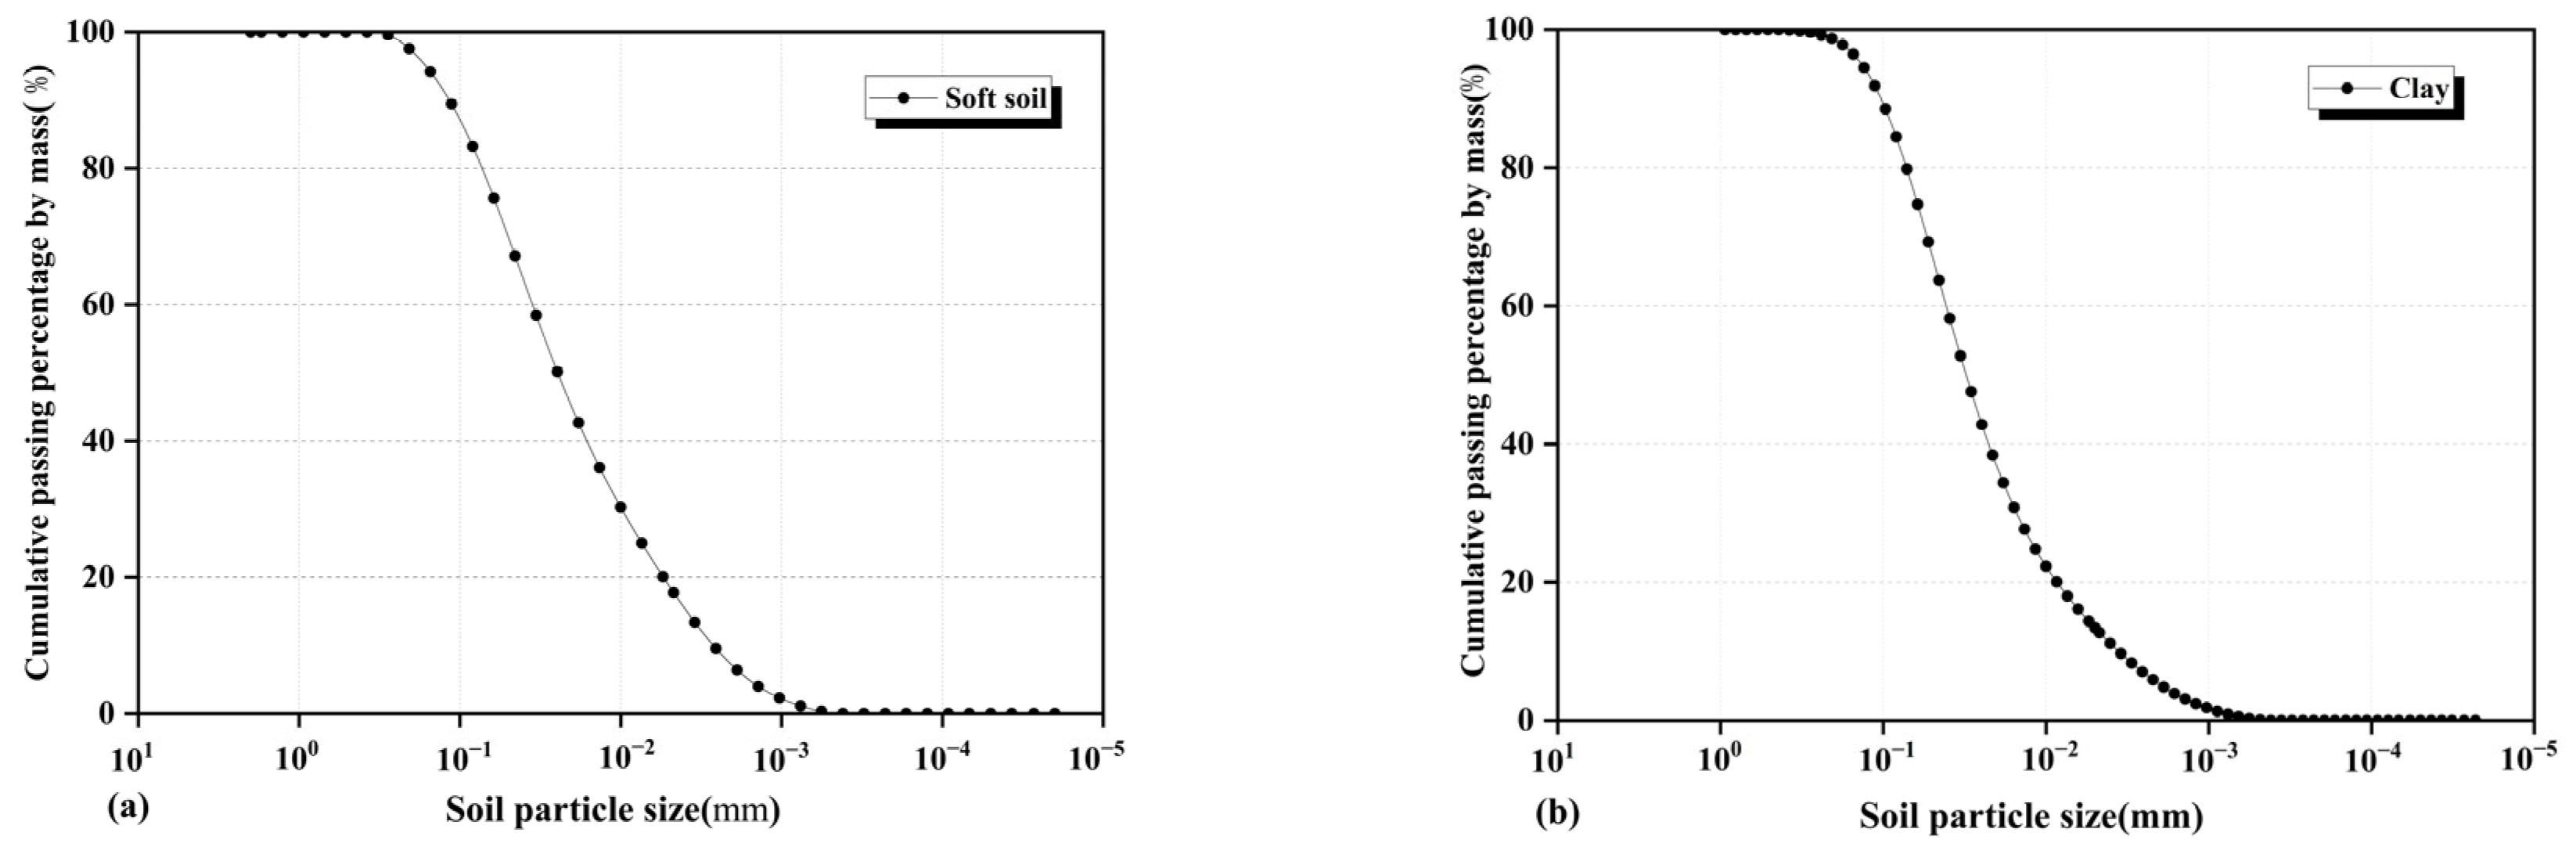
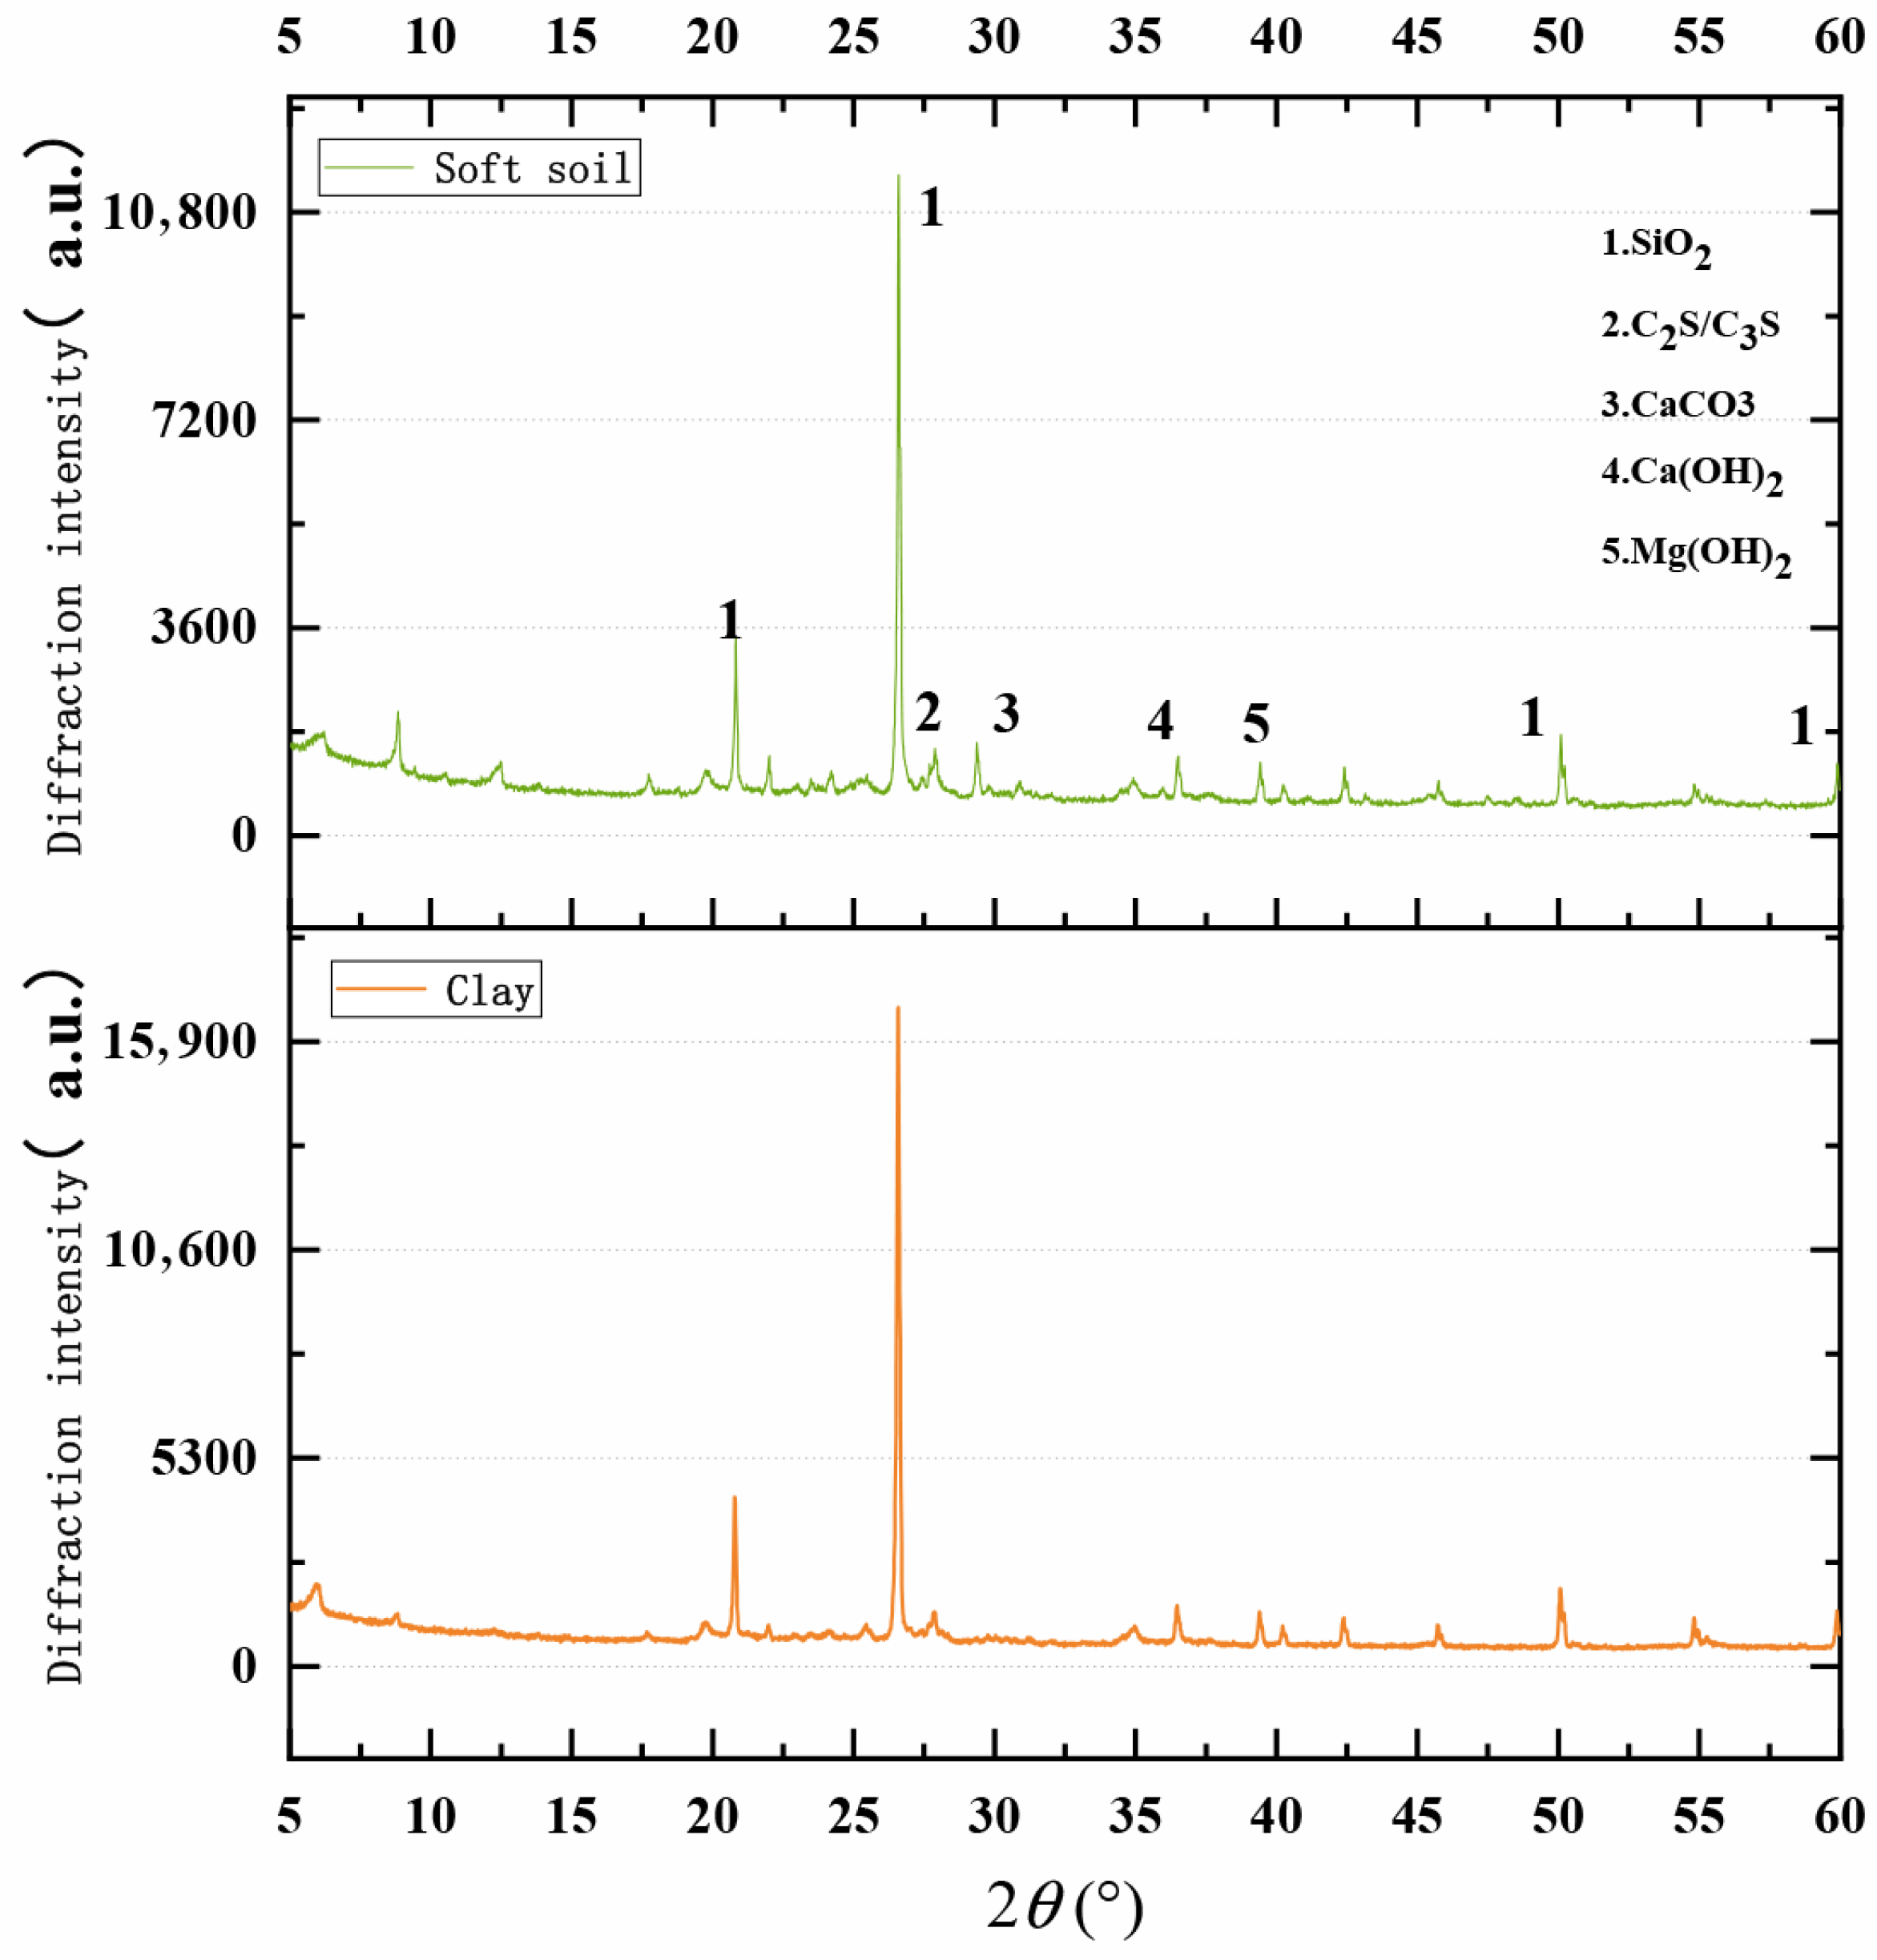
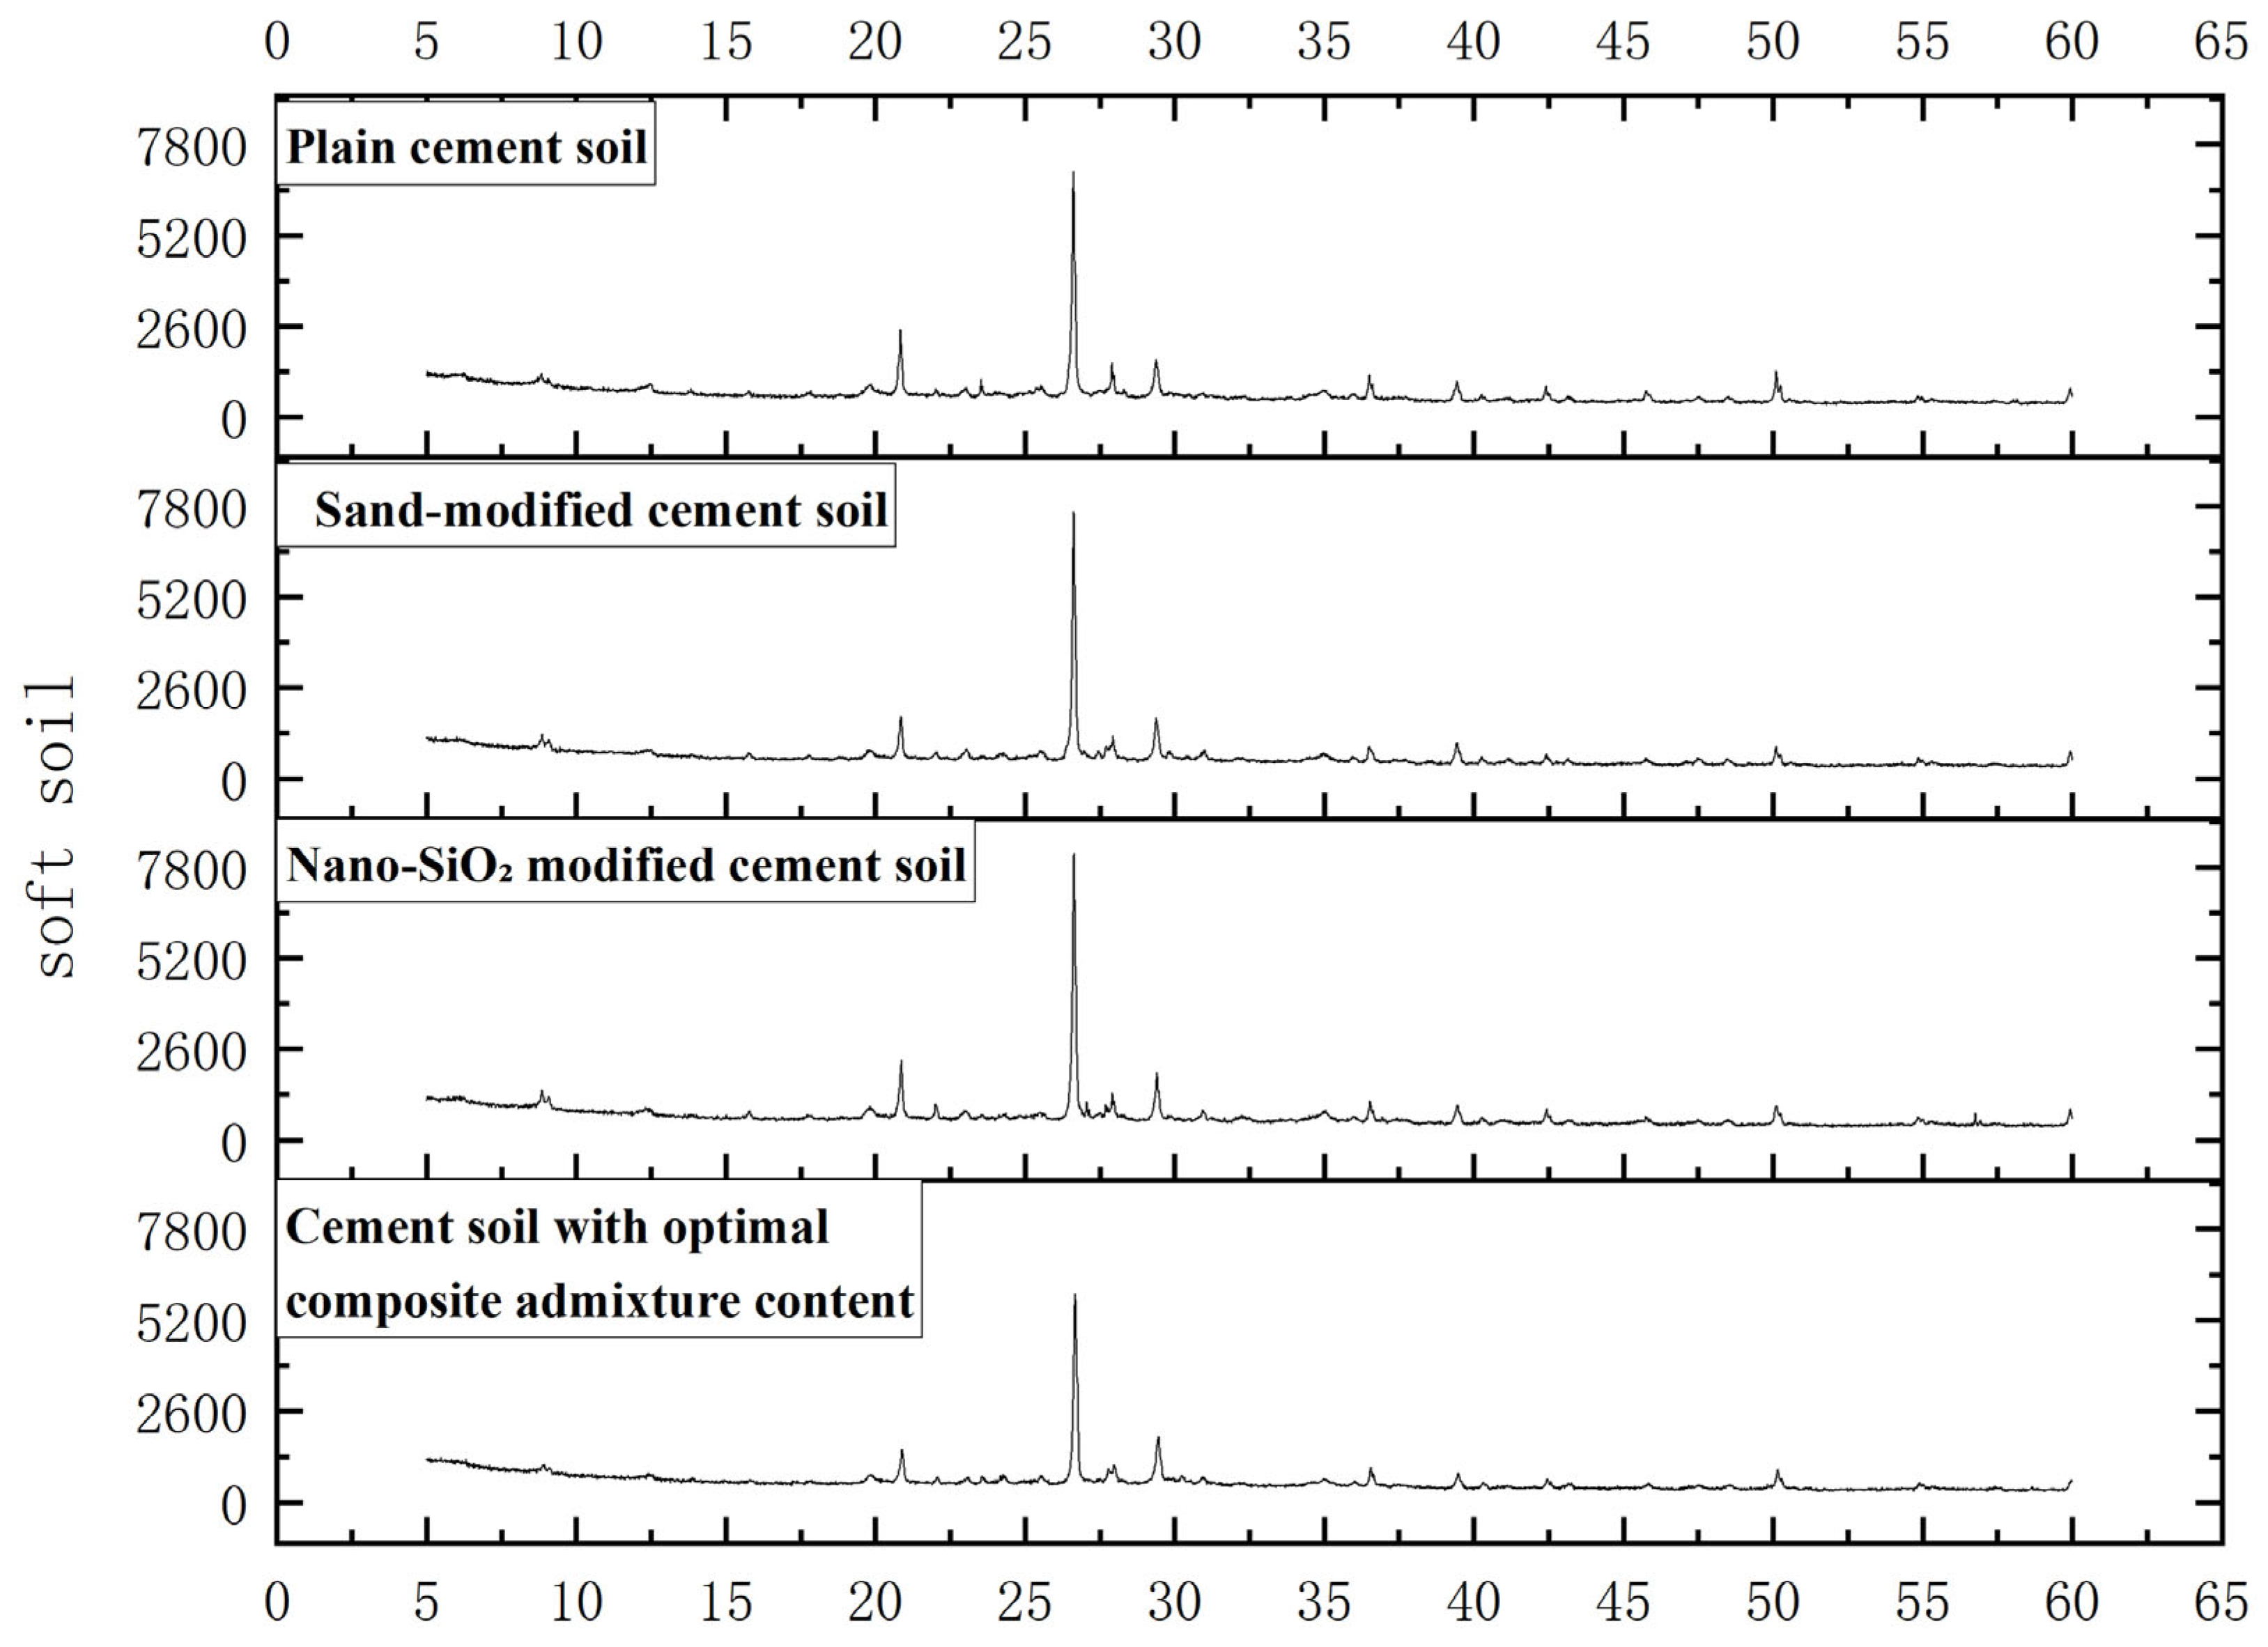
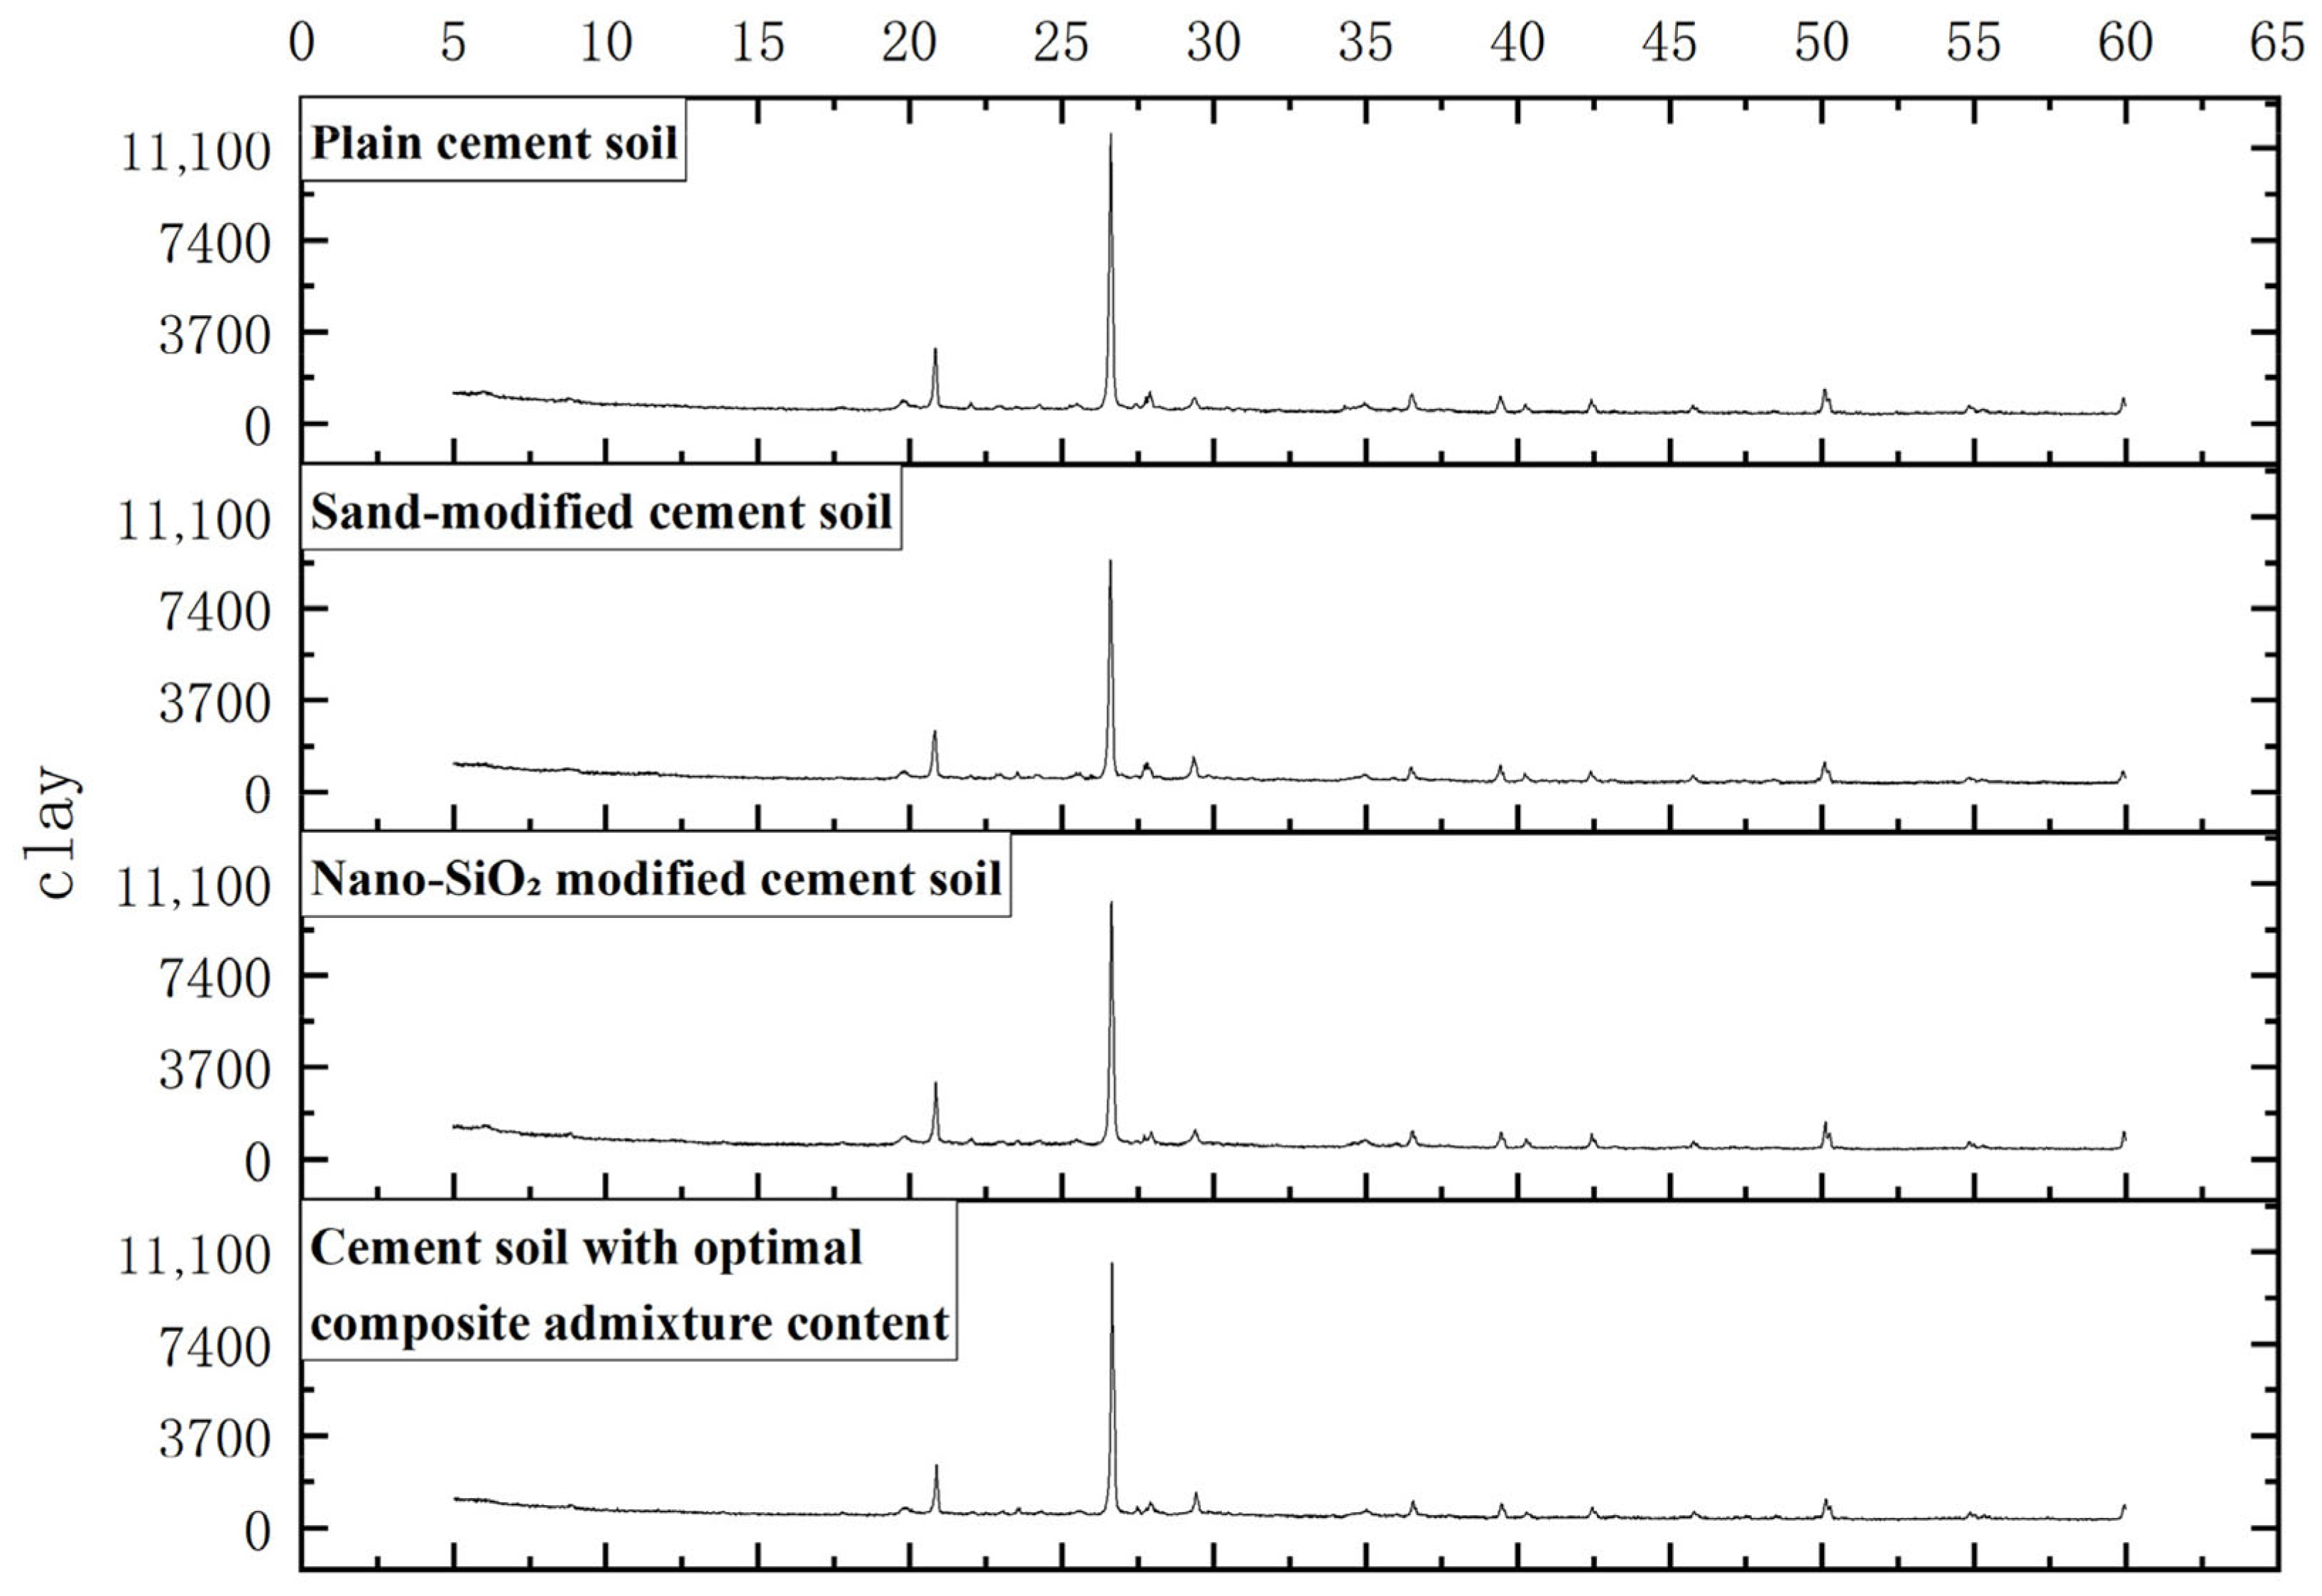
The soils used in this study were collected from two different locations in Wuhan, Hubei Province, China. The first soil type, organic-rich soft clay, was sampled from a river deposit in the Huang pi District, while the second soil, low-organic-content clay, was obtained from a construction site within the city. A river sand used for modification was sourced from a local river in Wuhan. Particle size distribution and Atterberg limits were conducted to determine the basic physical properties. Both soils were identified as cohesive soils, as indicated by plasticity indices (Ip) greater than 17. However, the river-deposited clay exhibited a natural water content exceeding 50%, and a liquid limit exceeded by the water content (w ≥ wL), classifying it as a soft soil. Both soils were classified according to the Unified Soil Classification System (USCS): the high-organic soil is classified as OH (Organic Clay of High Plasticity), while the low-organic clay is CL (Inorganic Clay of Low to Medium Plasticity). Throughout this manuscript, these are referred to as “soft soil” (high-organic, OH) and “clay” (low-organic, CL) respectively [24]. Their basic physical properties are summarized in Table 2, and their particle size distributions and mineral compositions are shown in Figure 1 and Figure 2. The appearance of the soil and sand samples is shown in Figure 3a–c.
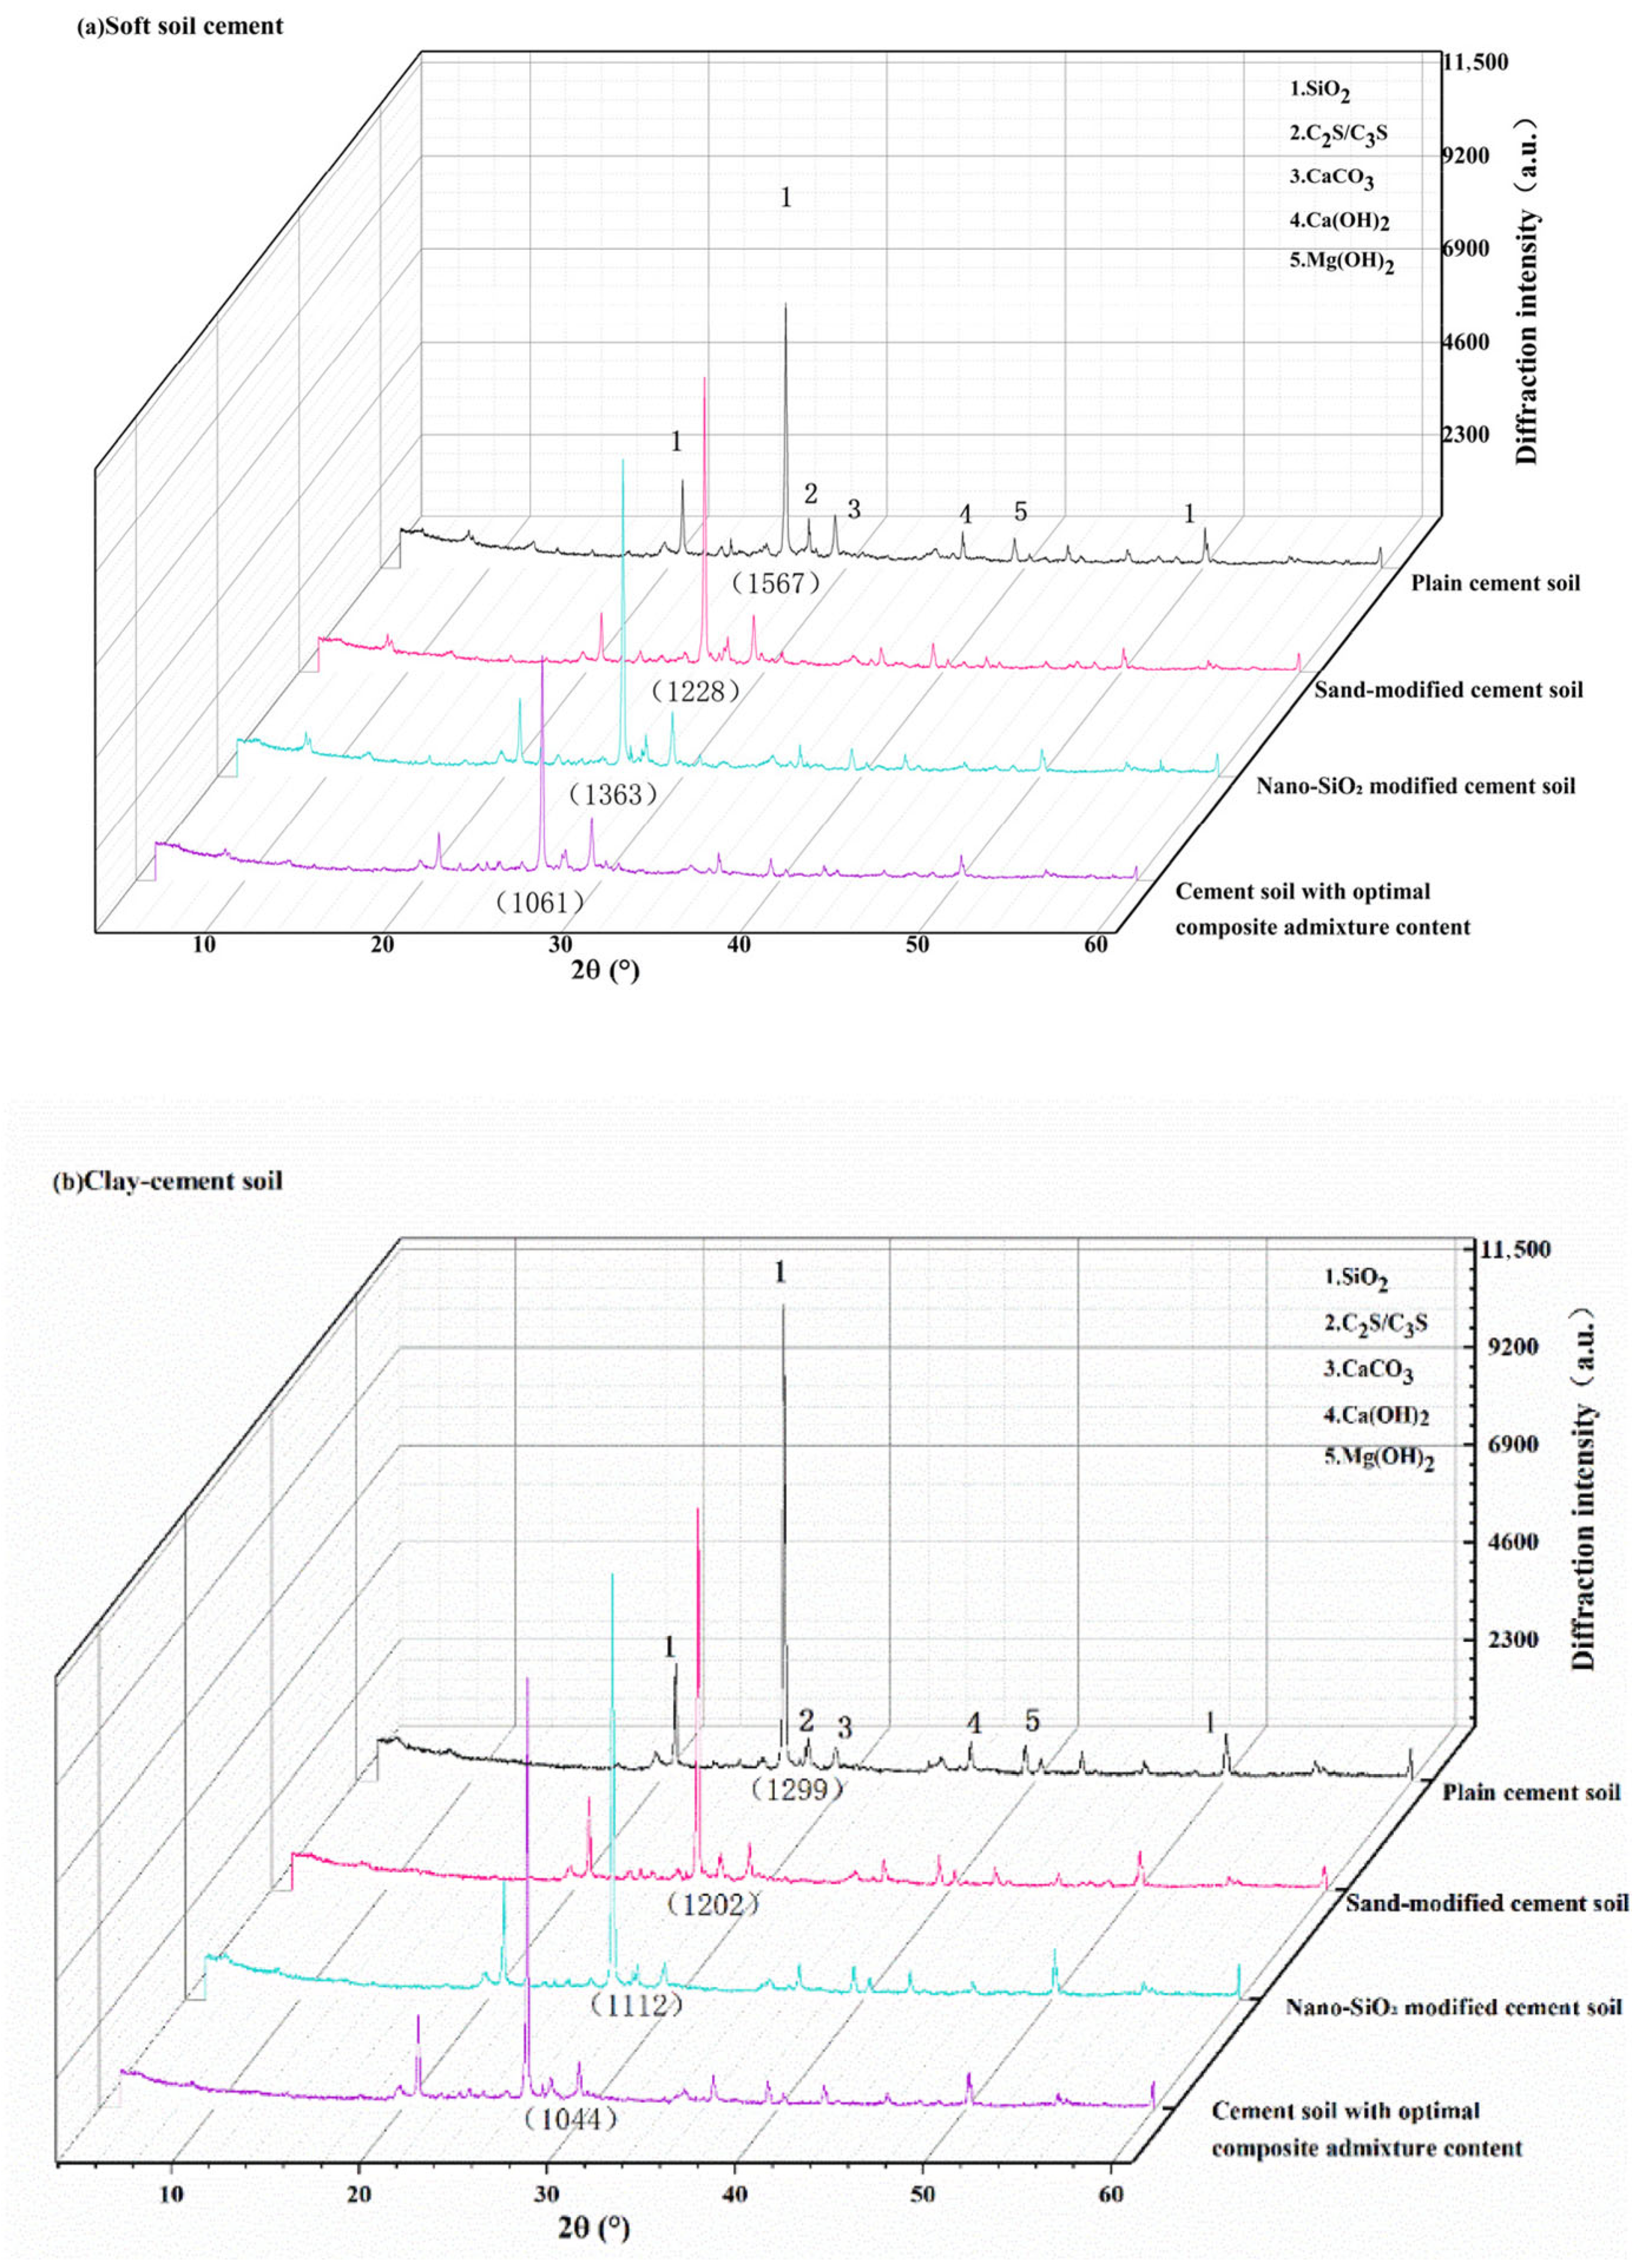
The characteristic diffraction peak of quartz appears at approximately 26.6°, with a corresponding peak intensity of around 15,900 for the clay sample and approximately 10,800 for the soft soil. This indicates that the quartz content in the clay is significantly higher than that in the soft soil.
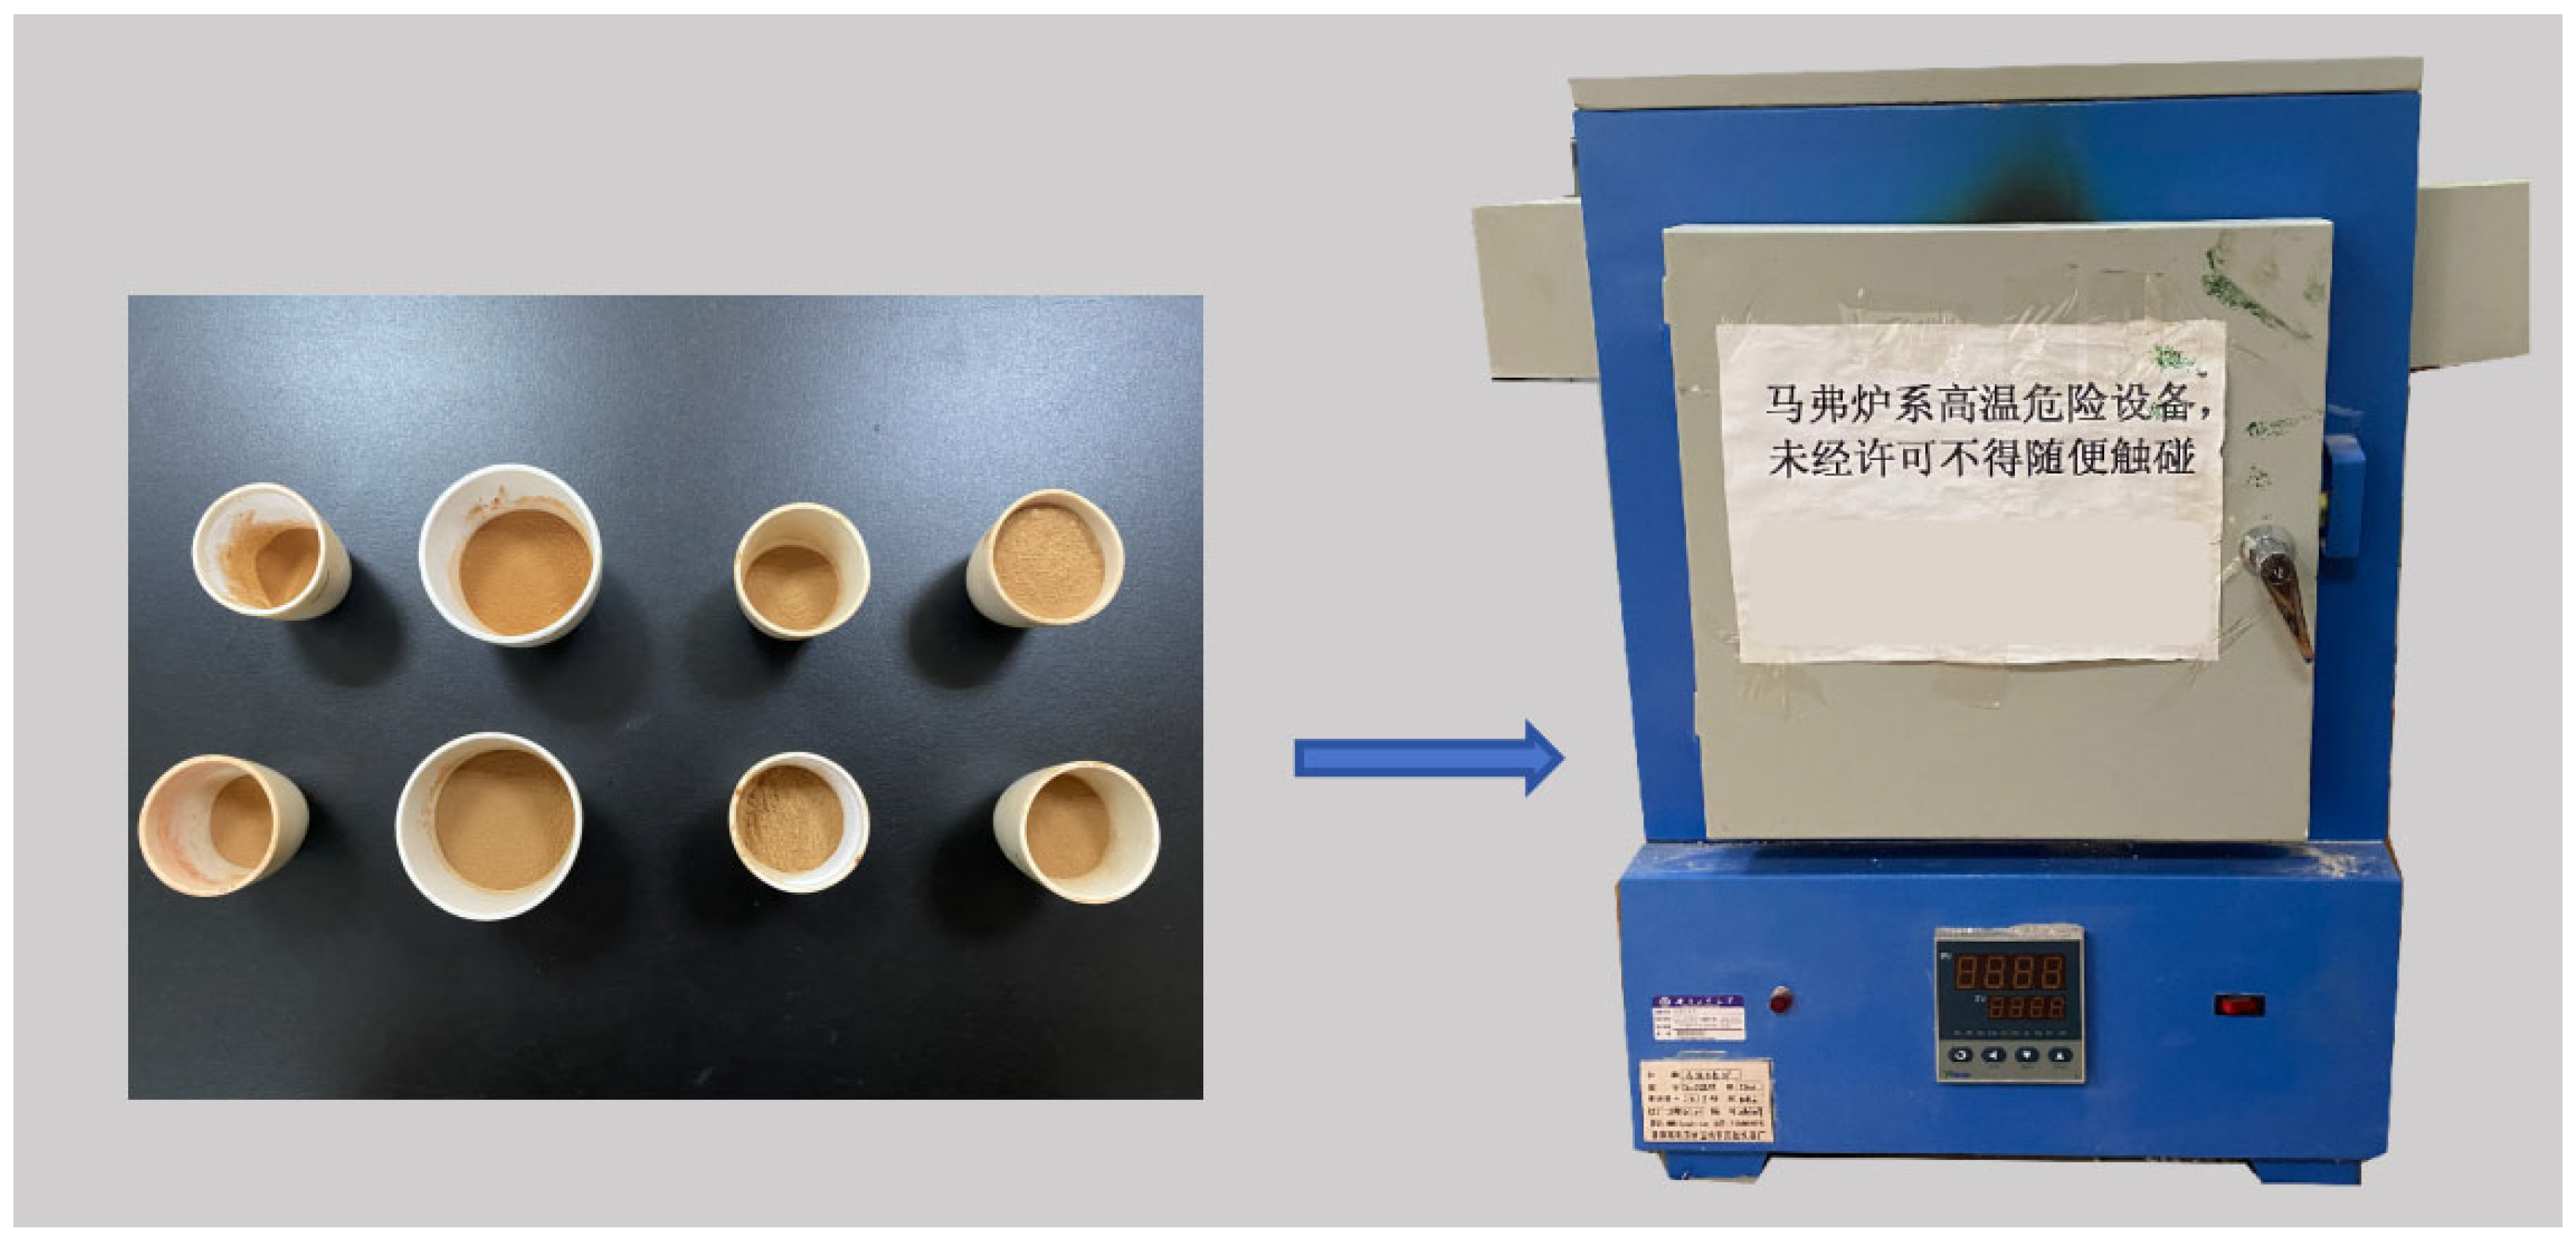
The organic matter content of the two soil types was further determined using the loss-on-ignition (LOI) method. Based on the experimental conditions for organic matter determination proposed by Hu Caili et al. [25], a muffle furnace was used to conduct the tests. This experiment employed a muffle furnace to determine the organic matter content of two soil types, as illustrated in Figure 4. The procedure began by placing crucibles and soil samples into a 105 °C oven until constant weight was achieved. The soil samples were then removed and weighed, with the initial weight of the soil sample and crucible recorded. Subsequently, the soil sample was placed in the muffle furnace and heated to 550 °C at a heating rate of 3 °C/min. After cooling, the sample was removed and weighed. The soil organic matter content was calculated, with the percentage of mass loss expressed as LOI (%).
The results showed that the LOI value for soft soil was 7.65%, while that for clay was 3.32%, indicating that the organic matter content in soft soil was significantly higher than that in clay.
The cement selected for this experiment is Conch brand ordinary Portland cement with a strength grade of PO42.5. Its key physicochemical properties are shown in Table 3, and its material morphology is depicted in Figure 3d.
It should be noted that all soil samples were tested at their natural moisture content and saturation state to replicate field conditions of deep cement mixing (DCM) applications. The soft soil exhibited a natural water content exceeding 50%, approaching full saturation (Sr > 95%), while the clay was partially saturated (Sr ≈ 85–90%). Neither soil underwent artificial consolidation prior to mixing, representing the state of freshly deposited alluvial deposits. This approach ensures that the reported mechanical properties reflect the actual behavior of cement-stabilized organic soils as constructed in the field, rather than reconstituted or pre-consolidated specimens.

2.2. Sample Preparation

Design shall be conducted in accordance with the “Code for Design of Cement-Soil Mixture Proportions” (JGJ/T 233-2011) [26] and the methods specified in actual engineering projects, the water-to-cement ratio was set to 0.45, with a cement content of 15%. For soft soil foundation treatment, cement soil mixing piles or jet grouting methods are commonly adopted in practice [27,28]. Therefore, the slurry preparation method in this study was designed to closely simulate actual engineering applications. Nano-silica (NS) was used as an external admixture, while sand—due to its high dosage—was treated as an internal filler. The mix proportion is expressed as m:mc:n:w, where m is the total mass of the sand soil mixture, mc is the mass of cement, n is the mass of nano-silica, and w is the required water mass, calculated as the sum of the water needed for the water-to-cement ratio (wcn) and 1.5 times the liquid limit moisture content of the mixture (1.5 L) in this study.
The specimen preparation procedure is as follows:
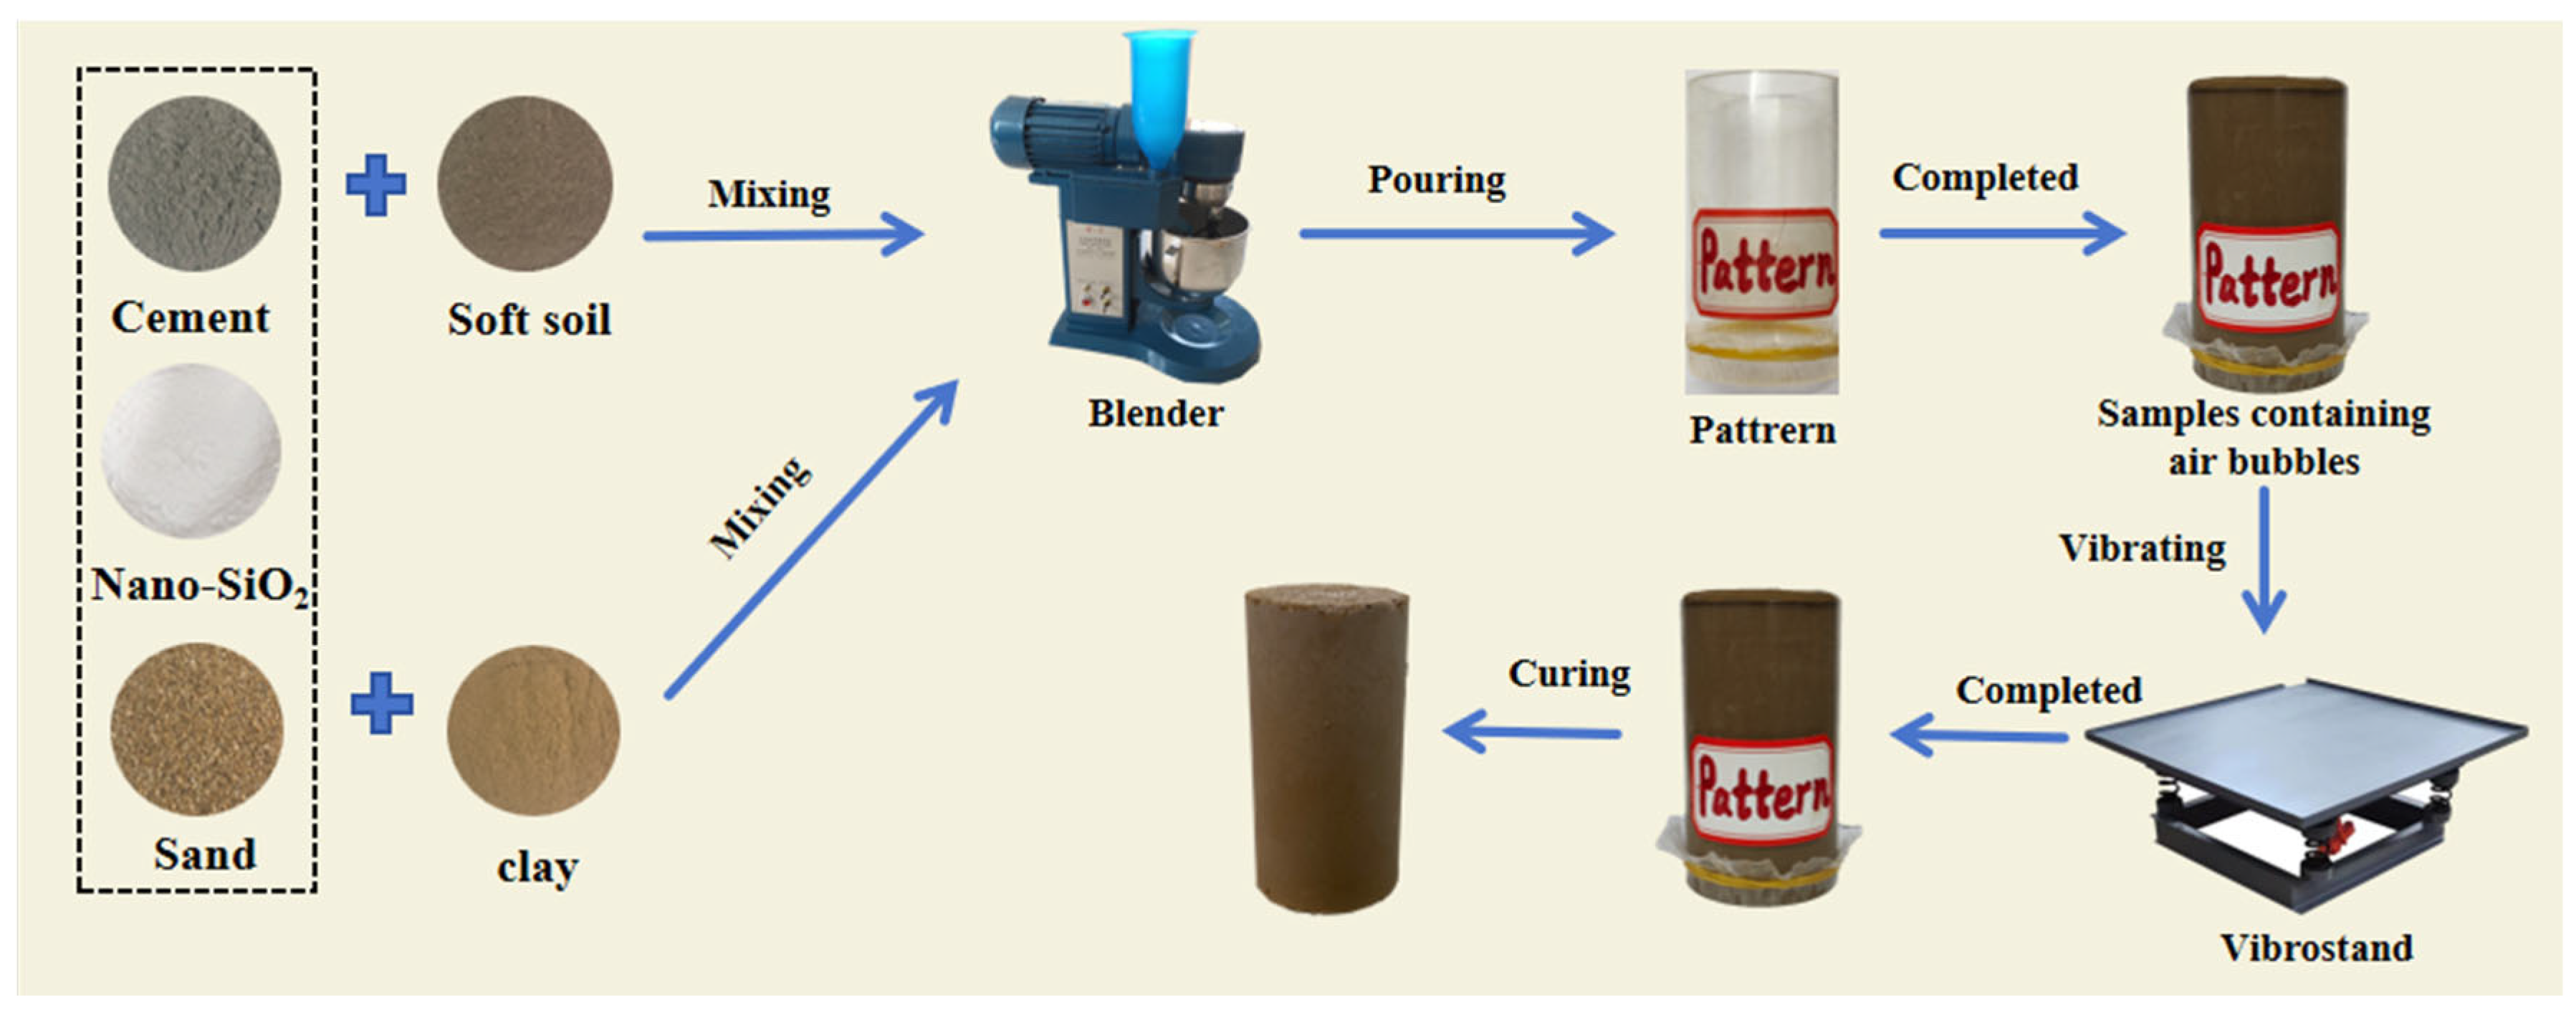
  • The soil, cement, nano-silica, and sand were weighed according to the mix design and mixed at a constant speed for 3 min using a mechanical mixer to ensure homogeneous distribution of materials.
  • Water was gradually added into the mixer, followed by an additional 10 min of mixing until a uniform cementitious slurry was obtained.
  • The slurry was poured into designated molds while simultaneously vibrating the molds on a vibration table to remove entrapped air and ensure sample compactness. Due to instrument limitations, different specimen dimensions were used for various tests: (Φ: diameter; h: height).
Unconfined compressive strength (UCS) test: Φ 50 mm × h 100 mm; Uniaxial cyclic loading test: Φ 39 mm × h 76 mm.
Immerse the sample measuring Φ 39 mm × h 76 mm in fresh water for curing. Replace the water every 10 days to maintain a stable ion concentration in the water.
During molding, the slurry was compacted using a vibration table at 50 Hz for 3 min, followed by static compression at 0.5 MPa. This standardized protocol ensures observed improvements reflect chemical stabilization rather than physical densification effects [29].
4.
Curing and Demolding: Specimens were cured under controlled temperature conditions for 48 h before demolding. The appearance of each demolded sample was examined. Specimens exhibiting visible cracks or large surface pores were deemed unsuitable and were remade.
5.
Labeling and Curing: Qualified specimens were labeled and categorized according to the target curing periods. A schematic of the sample preparation process is illustrated in Figure 5.
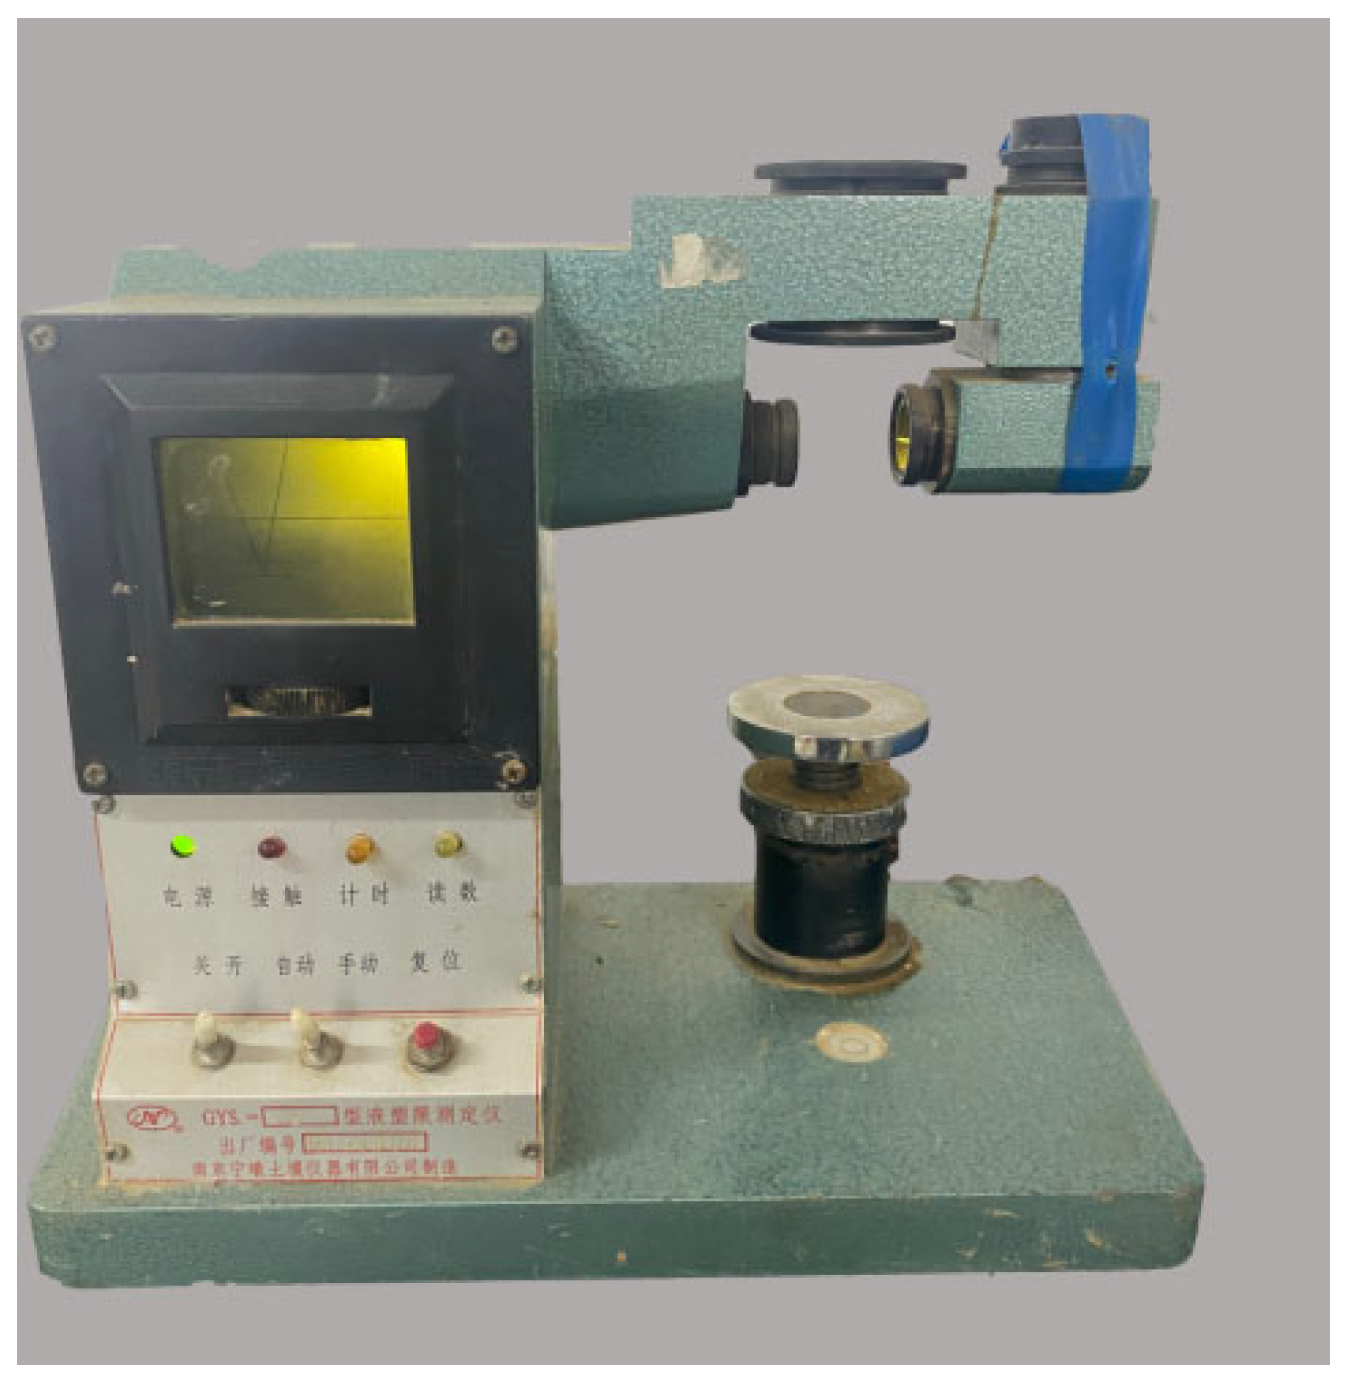
Since varying sand content alters the liquid and plastic limits of mixed soil, these properties must be determined during mud sample preparation. Therefore, liquid and plastic limit tests were conducted on mixed soils with different sand content ratios. Following the standard for geotechnical testing methods GB/T50123-2019 [24], the combined liquid-plastic limit tester (as shown in Figure 6) was used to assess the physical properties of different soils and sand-blended mixtures. The test data are shown in Table 4 and Table 5.

Additive Content Selection Rationale

The dosage ranges were determined through preliminary screening and engineering constraints. For nano-SiO2 (0–3.5%), the upper limit reflects the threshold beyond which marginal UCS gains (<5% increase from 3.5% to 5.0%) do not justify the exponential cost increase, consistent with optimal ranges (2–4%) reported by Karimiaza et al. [4] and Chen et al. [7]. For sand (10–40%), the lower bound represents the minimum threshold for skeletal effects in cemented clays [15], while the upper limit corresponds to the practical maximum for deep cement mixing (DCM) pumpability—beyond 40%, segregation and bleeding violate workability requirements (JGJ/T 233-2011 [26]). This range brackets the optimal packing density (30–35%) identified by Joel and Agbede [12].

2.3. Experimental Program

2.3.1. UCS

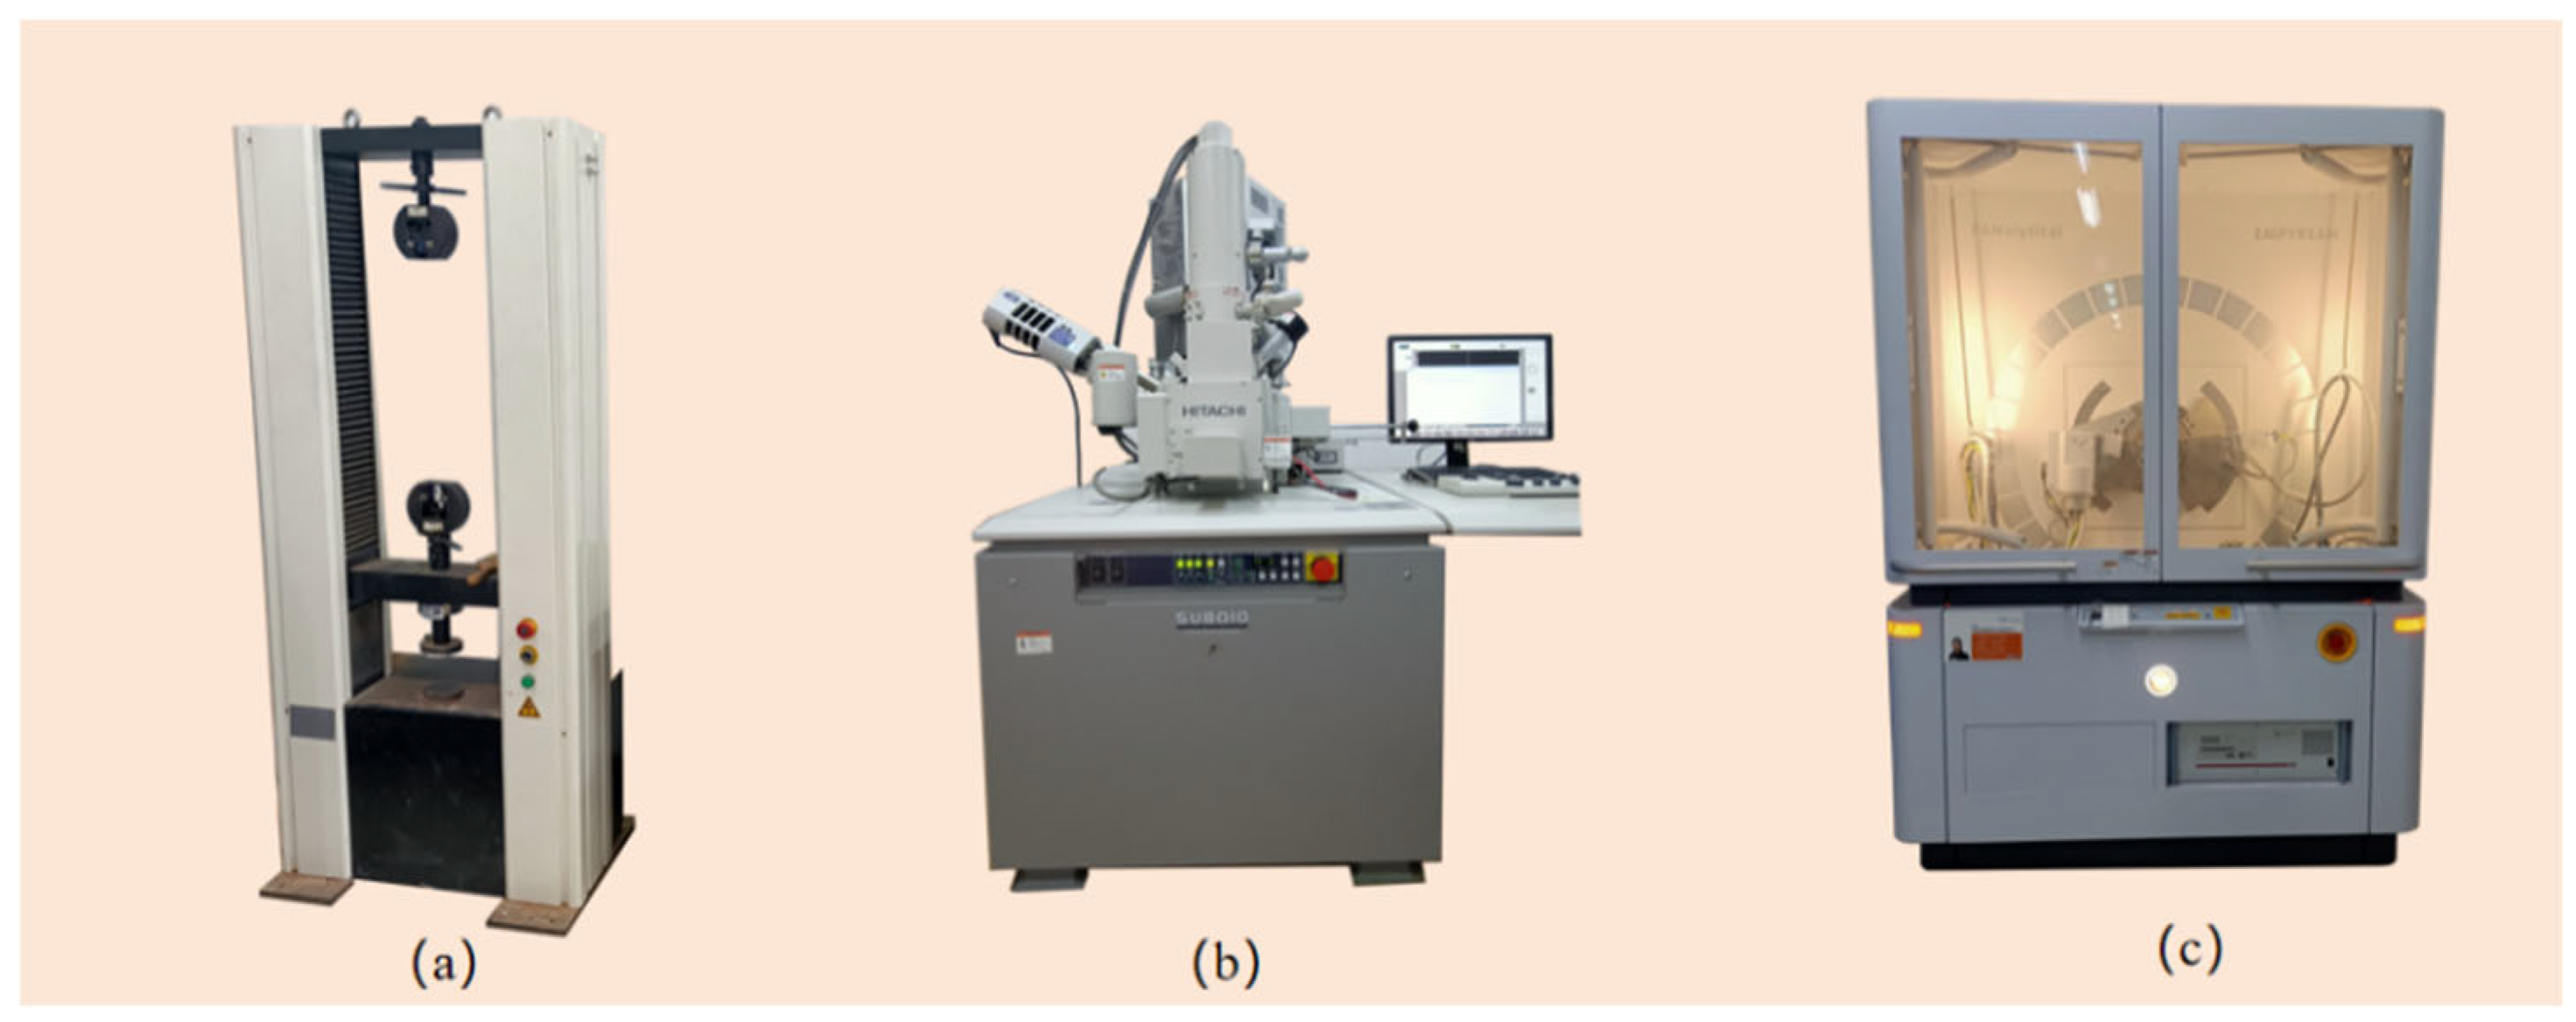
To evaluate the improvement effects of nano-SiO2 on different soils and environments, the unconfined compressive strength of samples was measured using a universal testing machine (see Figure 8a). Unconfined compressive strength (UCS) tests were conducted to investigate the influence of different dosages of nano-SiO2 and sand on the strength of cement-stabilized soils. Five different contents of nano-SiO2 and four different sand contents were cross-compounded and tested after 28 days of curing to determine the optimal single dosage of nano-SiO2, the optimal single dosage of sand, and the optimal combination content for composite modification. Subsequently, UCS tests were performed on the optimal single nano-SiO2, optimal single sand, and optimal composite-modified cemented soils at curing ages of 28. For each mix proportion, a minimum of three specimens were tested to ensure statistical reliability. The coefficient of variation (COV) for UCS tests ranged from 5% to 12%, consistent with typical cemented soil variability [27,28].
As shown in Table 6 and Table 7, these are partial cement soil mix designs for soft soils. They present unmodified cement soil, cement soil with 10% only, cement soil with 10% sand only, and cement soil with 10% sand and varying proportions of nano-SiO2 modified cement.
As shown in Table 8, to determine the optimal composite mix, each sand content (10%, 20%, 30%, and 40% by dry weight of soil) was combined with six nano-SiO2 dosages (0%, 0.7%, 1.4%, 2.1%, 2.8%, and 3.5%), resulting in a total of 20 different composite mix proportions. Both types of soils—organic soft soil and ordinary clay—were subjected to the same mix design and testing protocol. The optimal single-admixture dosage of nano-SiO2 and sand-cemented soil, as well as the optimal composite material cemented soil dosage, were determined through 28-day (UCS) unconfined compressive strength tests. Compressive strength tests at 28 days were further conducted on the optimal single-admixture nano-SiO2, optimal single-admixture sand, and optimal composite material cemented soil.

2.3.2. Dynamic Fatigue Test

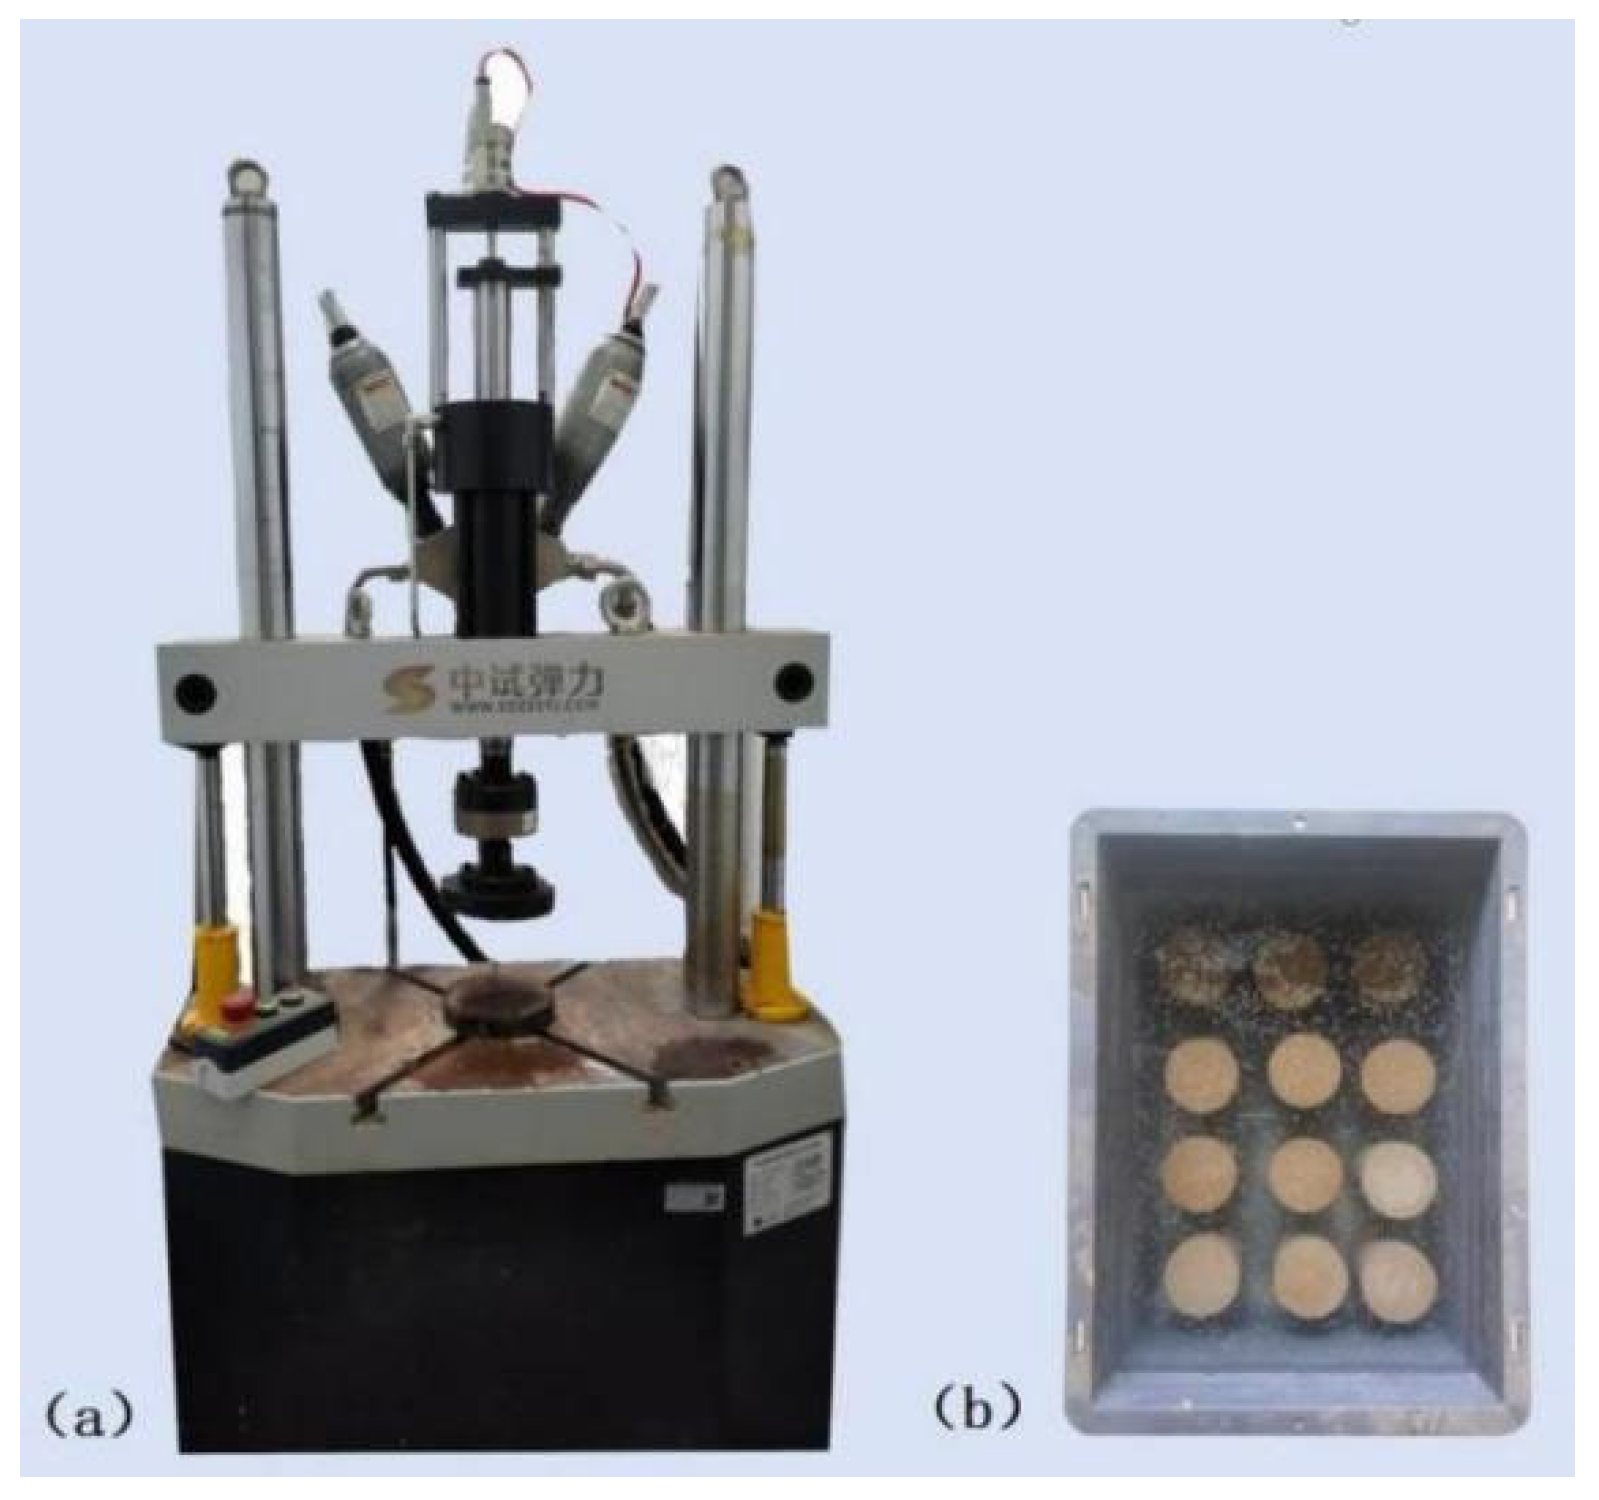
Under long-term cyclic loading from traffic, earthquakes, and other sources, structures such as cement-stabilized subgrades and mixed piles are susceptible to dynamic load damage. Therefore, research on the dynamic properties of cement-stabilized soils holds significant importance for practical engineering applications. To investigate the dynamic properties of modified cement soil under cyclic loading conditions, based on the aforementioned unconfined test results, the optimal composite ratio of 3.5% nano-SiO2 + 40% sand was selected as the research subject. The study examined the improvement effects of the composite material on two types of cement soil. The instrumentation employed in this study was an electro-hydraulic servo dynamic-static fatigue testing machine, model ZSDJ-W25PL, manufactured by Shandong Pilot Elasticity Company (Liaocheng, China), as shown in Figure 7a. This testing apparatus has a maximum dynamic test force of ±20 kN, with an amplitude fluctuation not exceeding ±1% FS. Primary test waveforms include sine waves, triangular waves, rectangular waves, and ramp waves; the main waveform used in this study was a sine wave. Frequency range: 0.01 Hz to 30 Hz. Uniaxial compression cyclic loading and unloading tests were conducted on cement soil specimens under varying vibration frequencies and dynamic stress amplitudes. The study investigated the effects of loading frequency and amplitude on cumulative plastic strain, as well as the influence of vibration frequency and dynamic stress amplitude on the hysteresis loop curve, dynamic elastic modulus, and hysteresis loop area of cement soil. Cement soil specimens were selected as Φ 50 mm × h100 mm samples, as shown in Figure 7b. To ensure comparability of fatigue resistance independent of strength differences, the cyclic stress ratio (CSR), defined as the ratio of applied deviator stress (σd) to the static unconfined compressive strength (qu), was controlled at 0.7~0.8 for soft soil and clay [19]. This isolates the material’s intrinsic fatigue behavior from static strength confounding effects.
Based on the aforementioned experiments, this study investigates the dynamic properties of cement-stabilized soil modified with an optimal composite material comprising 3.5% nano-SiO2 and 40% sand, compared to unmodified cement-stabilized soil. Cyclic loading tests were conducted on specimens using a sinusoidal waveform. Traffic loading frequencies typically range from 0.5 Hz to 10 Hz [30,31,32], depending on vehicle speed and axle spacing: highway traffic at 60–100 km/h generates 1–3 Hz, while high-speed railways (250–350 km/h) induce 2–4 Hz [16,31,32]; loading frequencies of 1 Hz, 2 Hz, 3 Hz, and 4 Hz were selected for this study. A graded range of stress amplitudes was selected based on the unconfined compressive strengths of the two unmodified cement-treated soils. Due to significant differences in their static unconfined compressive strength test results, identical dynamic stress amplitudes could not fully reveal their properties. Therefore, distinct loading amplitudes were employed to fully elicit their mechanical characteristics. For the dynamic stress amplitude tests on soft soil cement, the lower strength limit was uniformly set at 1 kN, while the upper limits were set at 2 kN, 3 kN, 4 kN, and 5 kN. For the dynamic stress amplitude tests on clay cement, the lower strength limit was uniformly set at 1 kN, while the upper limits were set at 2 kN, 4 kN, 8 kN, and 16 kN. The detailed loading scheme is presented in Table 9.
To ensure statistical reliability of the reported fatigue life improvement, each cyclic loading test was repeated with a minimum of three specimens per condition. The coefficient of variation for fatigue life measurements was below 10% for modified specimens and below 15% for unmodified specimens.

2.3.3. SEM

The scanning electron microscope (SEM) used in this study was the SU8010 model as shown in Figure 8b, manufactured by Hitachi, Tokyo, Japan. Since non-conductive or poorly conductive materials tend to accumulate electric charge during SEM observation, which can lead to blurred or distorted images, a gold sputter-coating technique was applied to enhance surface conductivity. This conductive coating facilitates the discharge of accumulated charges, allowing electrons to flow smoothly across the sample surface and enabling the acquisition of high-resolution and well-defined images. In this study, the sputtering process was conducted at a rate of 10 mm/min for a duration of 60 s.

2.3.4. XRD

X-ray diffraction (XRD) is a powerful analytical technique used to investigate the crystalline structure, lattice parameters, and phase composition of materials. A detector records the intensity and angle of the diffracted X-rays, producing a diffraction pattern that reveals structural information about the sample. In this study, the samples used for XRD analysis were collected from the damaged specimens after unconfined compressive strength (UCS) testing. This experiment employed a Panalytical Empyrean X-ray diffractometer (Malvern Panalytical Ltd., Worcestershire, UK) (see Figure 8c). The 2θ range for sample scanning was set at 5–60°, with a scanning rate of 5°/min. The sample preparation procedure is as follows:
(1) Dehydration Treatment: Place specimens that have undergone unconfined compressive strength testing and failed into a low-temperature oven for dehydration and drying.
(2) Sampling Procedure: Extract a portion from the failed specimens, crush it, and sieve it through a 0.075 mm mesh. Store the sieved sample in a sealed sample container to ensure dry preservation.
(3) Sample Preparation: Using a sample spoon, place an appropriate amount of powdered material into the recess of the sample pan. Subsequently, use a tamping tool to compact the powder, ensuring the sample surface is level, continuous, and free of depressions or cracks.
The specific micro-scale tests is shown in Table 10.

3. Experimental Data Analysis

3.1. Investigation on the Static Mechanical Properties of Cement Soil Reinforced with Nano-SiO2 and Sand

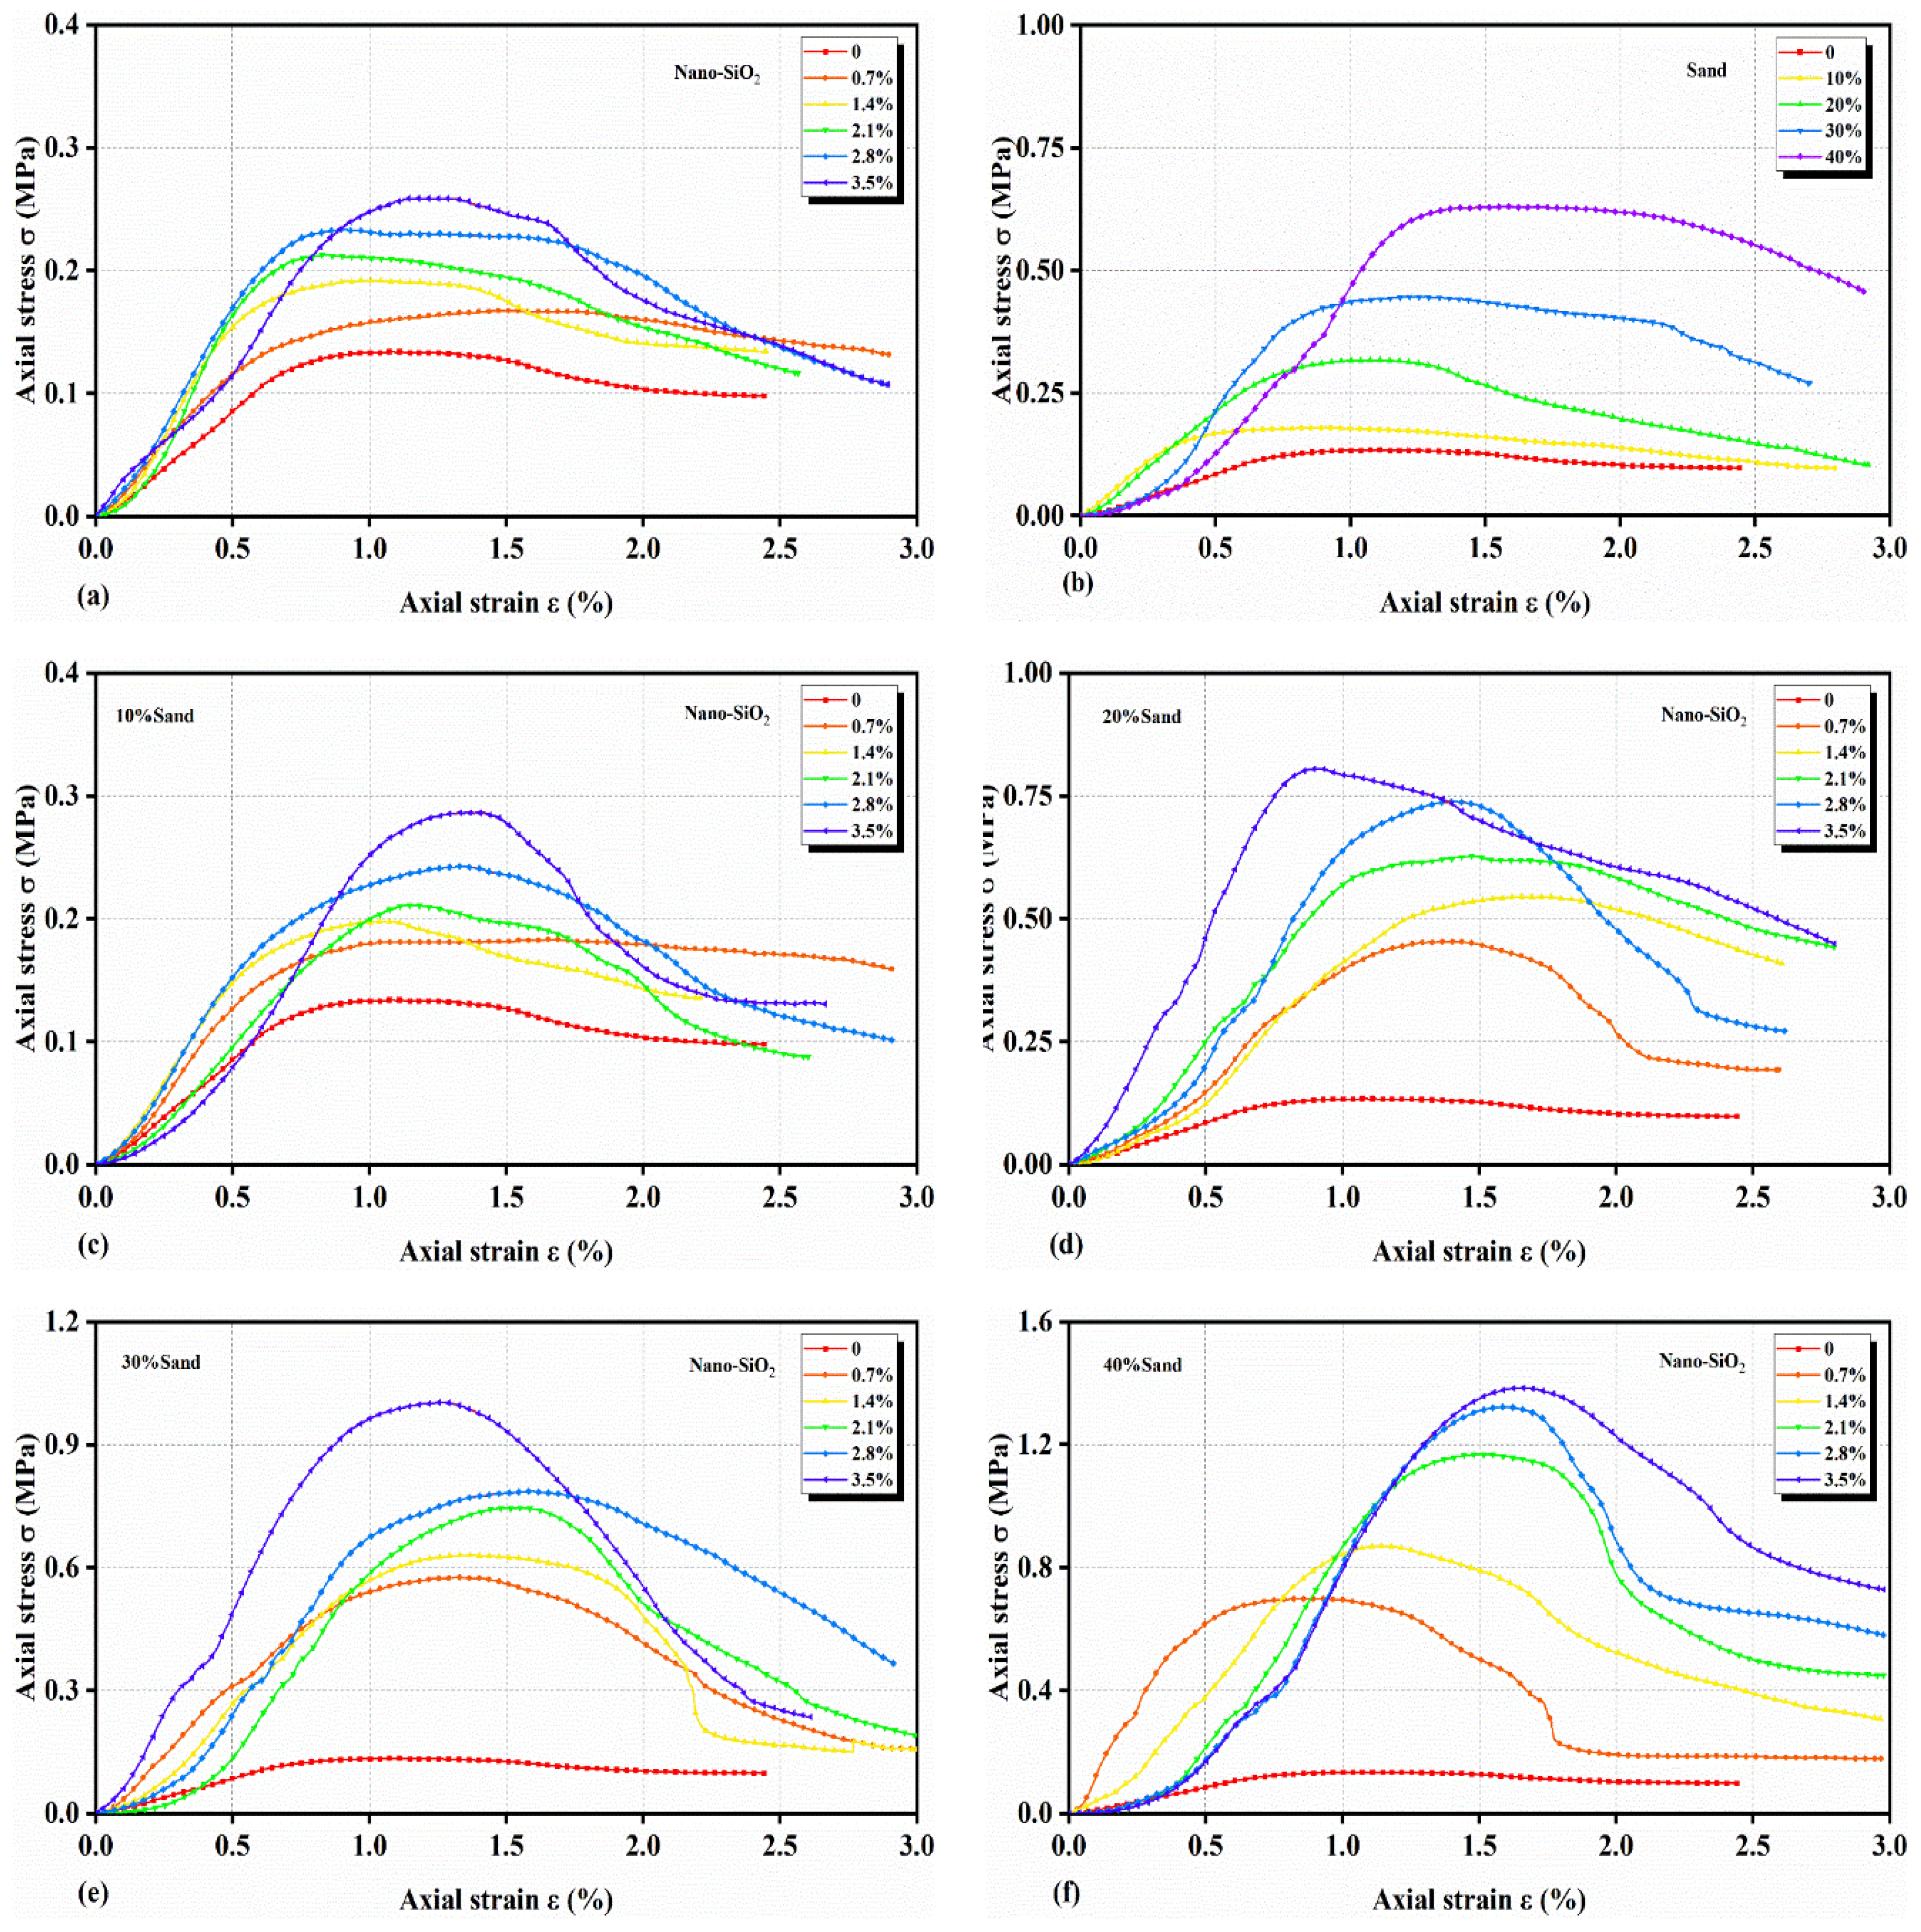
The strain corresponding to the peak stress of the unimproved soft soil cement is approximately 1%, while that of the soft soil cement modified with either nano-SiO2 or sand alone exceeds 1% as shown in Figure 9. For the composite-modified soft soil cement, the strain at peak stress is 0.8% with 20% sand and 3.5% nano-SiO2, and 0.7% with 40% sand and 0.7% nano-SiO2, while for other composite modifications, the peak stress strain exceeds 1.1%. The residual stress of the soft soil cement modified with sand alone is significantly higher than that of the unimproved and the nano-SiO2-modified soft soil cement. Furthermore, regardless of whether it is the unimproved or nano-SiO2-modified cemented soil, the addition of sand leads to an increase in residual stress. It can be observed from Figure 9 that single incorporation of nano-SiO2 has limited enhancement on the deformation capacity of soft soil, and brittle failure predominantly occurs. In contrast, for soft soil cement modified with sand alone or in combination, the strain at failure stress increases, resulting in a slower failure process, which is beneficial for the safety of specimens or structures.
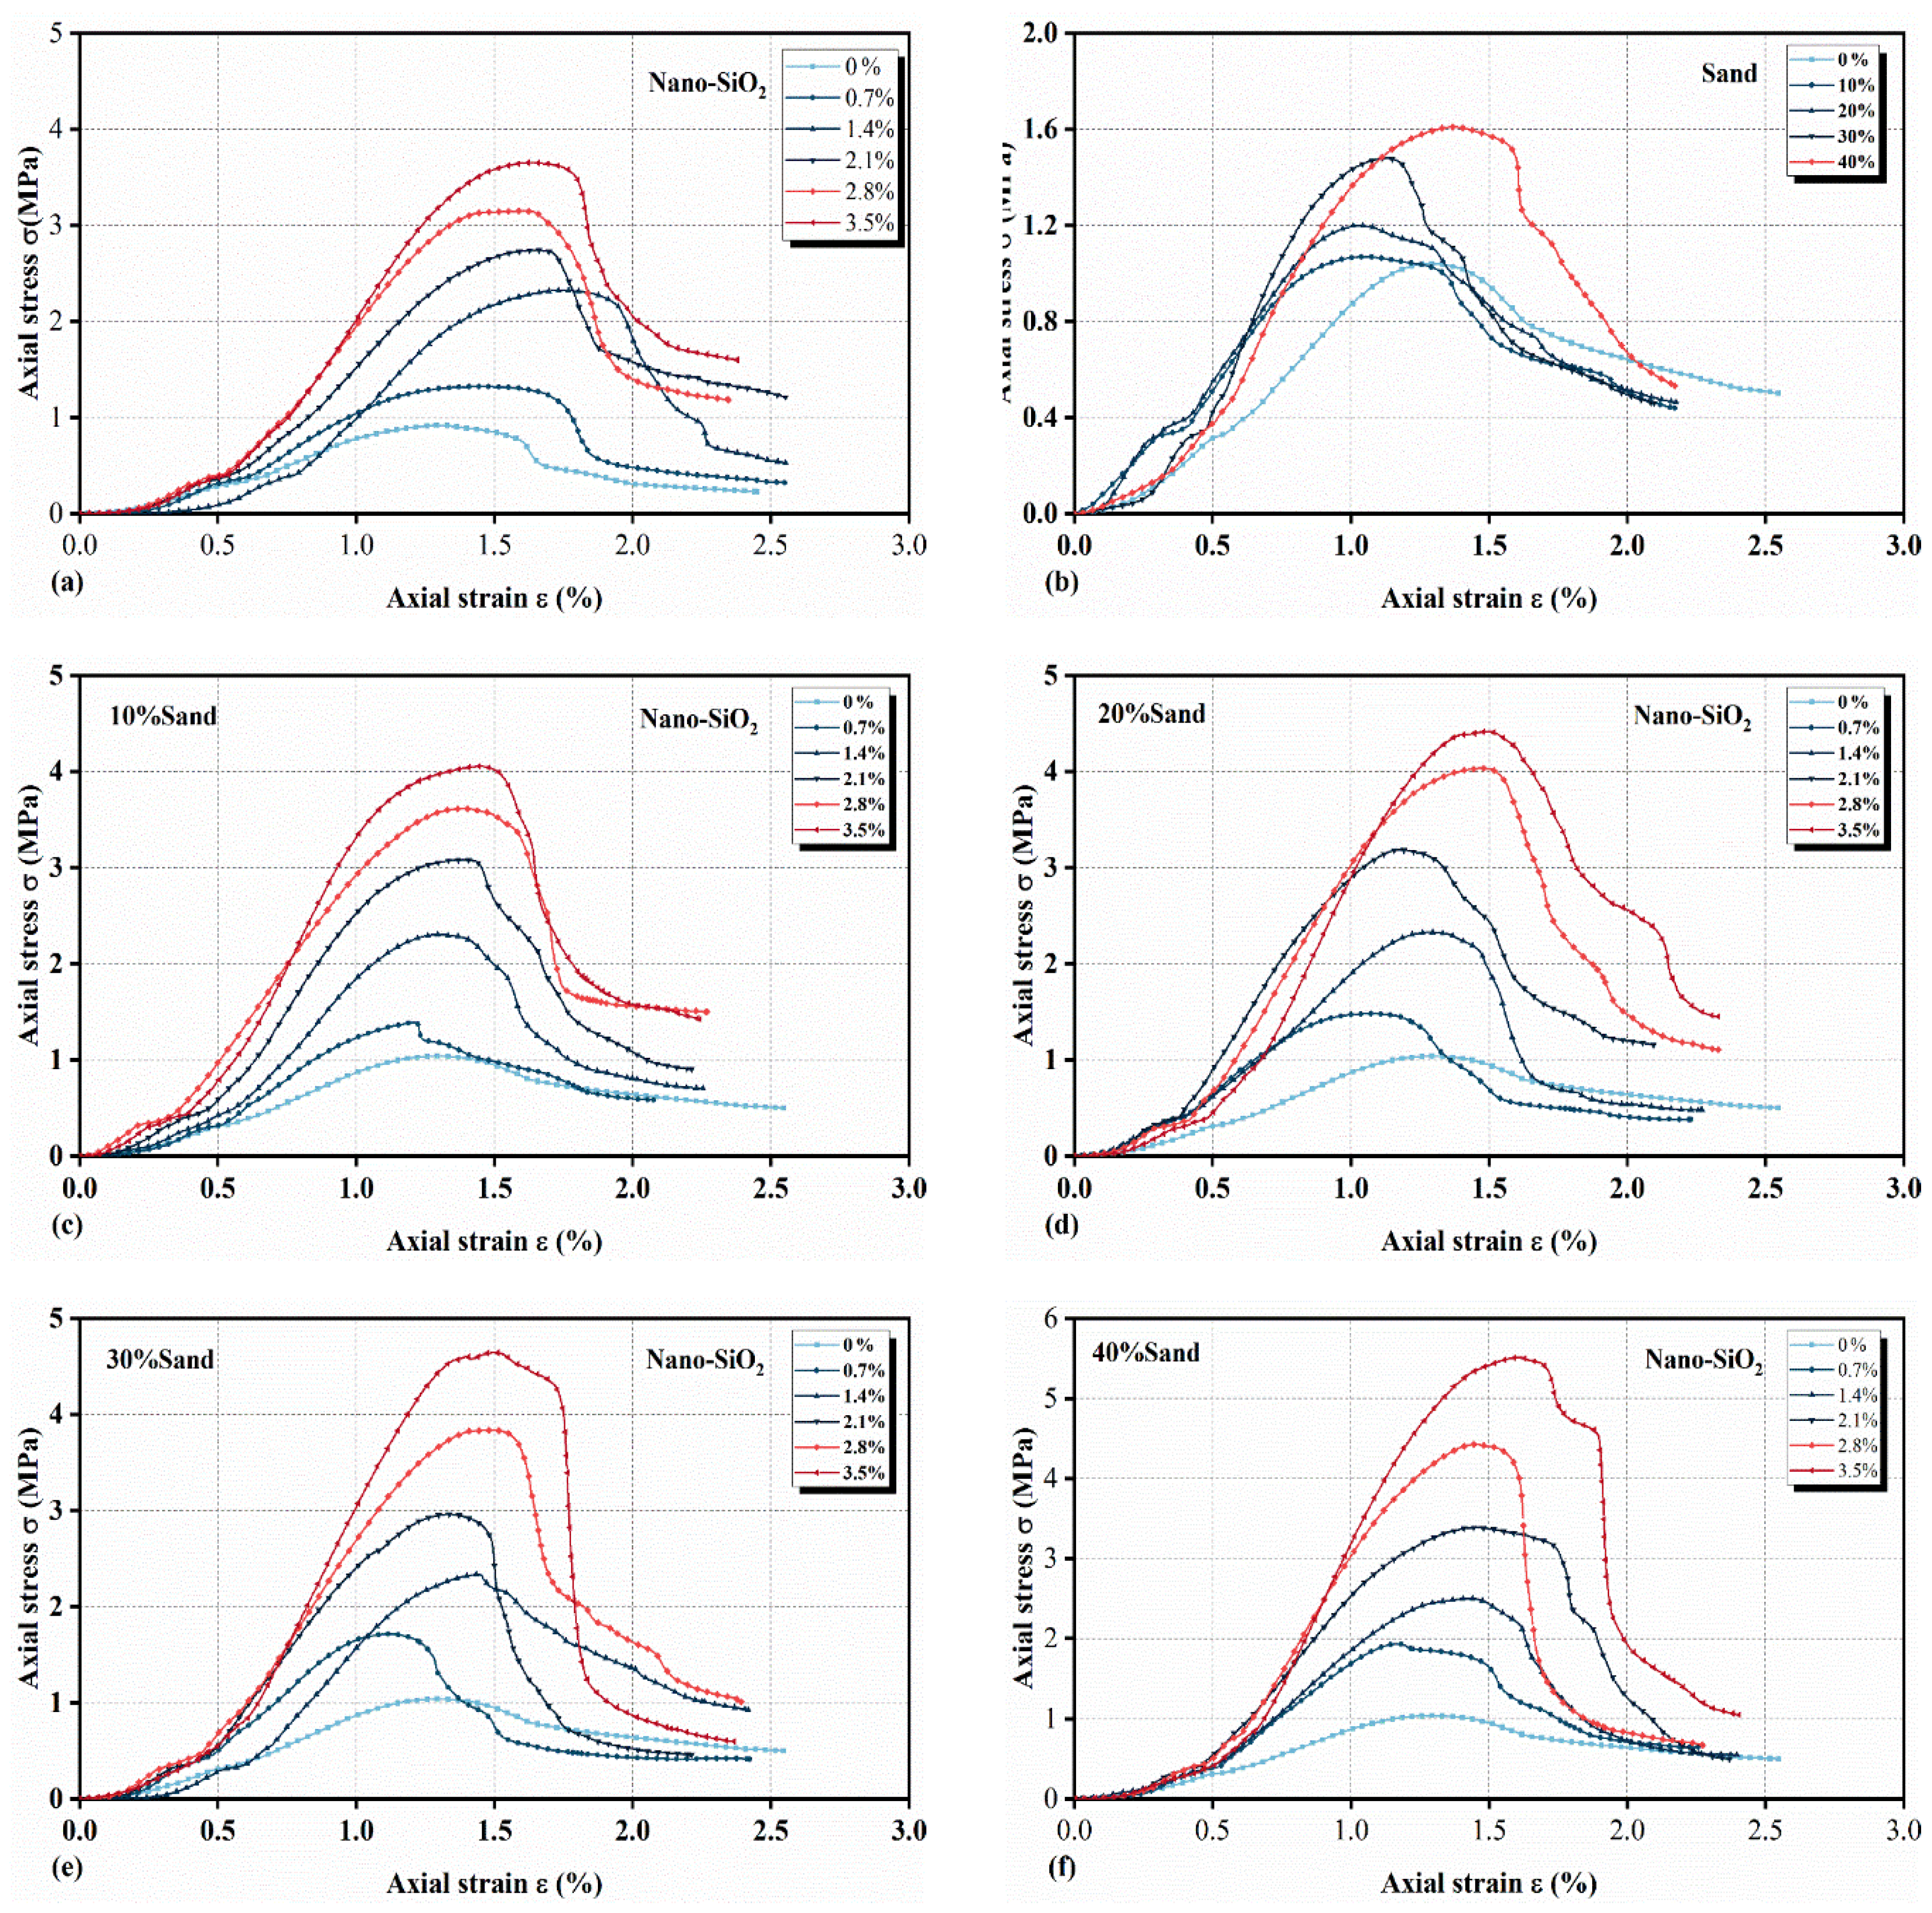
The strain corresponding to the peak stress of untreated clay-cemented soil is approximately 1.3% in Figure 10. With the addition of various contents of nano-SiO2, the peak strain increases slightly, reaching around 1.5% across all nano-SiO2-modified specimens. In contrast, the incorporation of a low sand content shows a relatively limited effect on the stress–strain behavior of the clay-cemented soil, with the strain at peak stress approximately 1.1%, indicating a weaker modification effect compared to nano-SiO2. However, for composite-modified specimens, both the peak strength and corresponding strain are significantly improved. Notably, the enhancement in peak strength does not come at the cost of reduced ductility. Additionally, the residual strength of nano-SiO2-modified clay-cemented soil increases with higher nano-SiO2 content and is markedly higher than that of both the untreated and specimens modified with sand alone.
In summary, the incorporation of nano-SiO2 and sand as composite modifiers significantly enhances the mechanical behavior of cemented soils. While the composite modifications enhance both strength and ductility, single-modifier systems exhibit contrasting effects depending on the type of soil: nano-SiO2 alone is more effective in clay, whereas sand shows limited improvement.
To better quantify the enhancement effect of different admixture contents on the strength of modified clay-cemented soils, a parameter Re is introduced to evaluate the unconfined compressive strength (UCS) increase rate for nano-SiO2 and sand-modified specimens, defined as:
R e = q u i q u 0 q u 0   ( i U c )
qui denotes the unconfined compressive strength (UCS) of the modified cement-stabilized soil; qu0 represents the UCS of the unmodified cemented soil; Re indicates the increase rate of UCS; Uc refers to the dosage parameters.

3.2. Dynamic Relationship and Dynamic Deformation Modulus

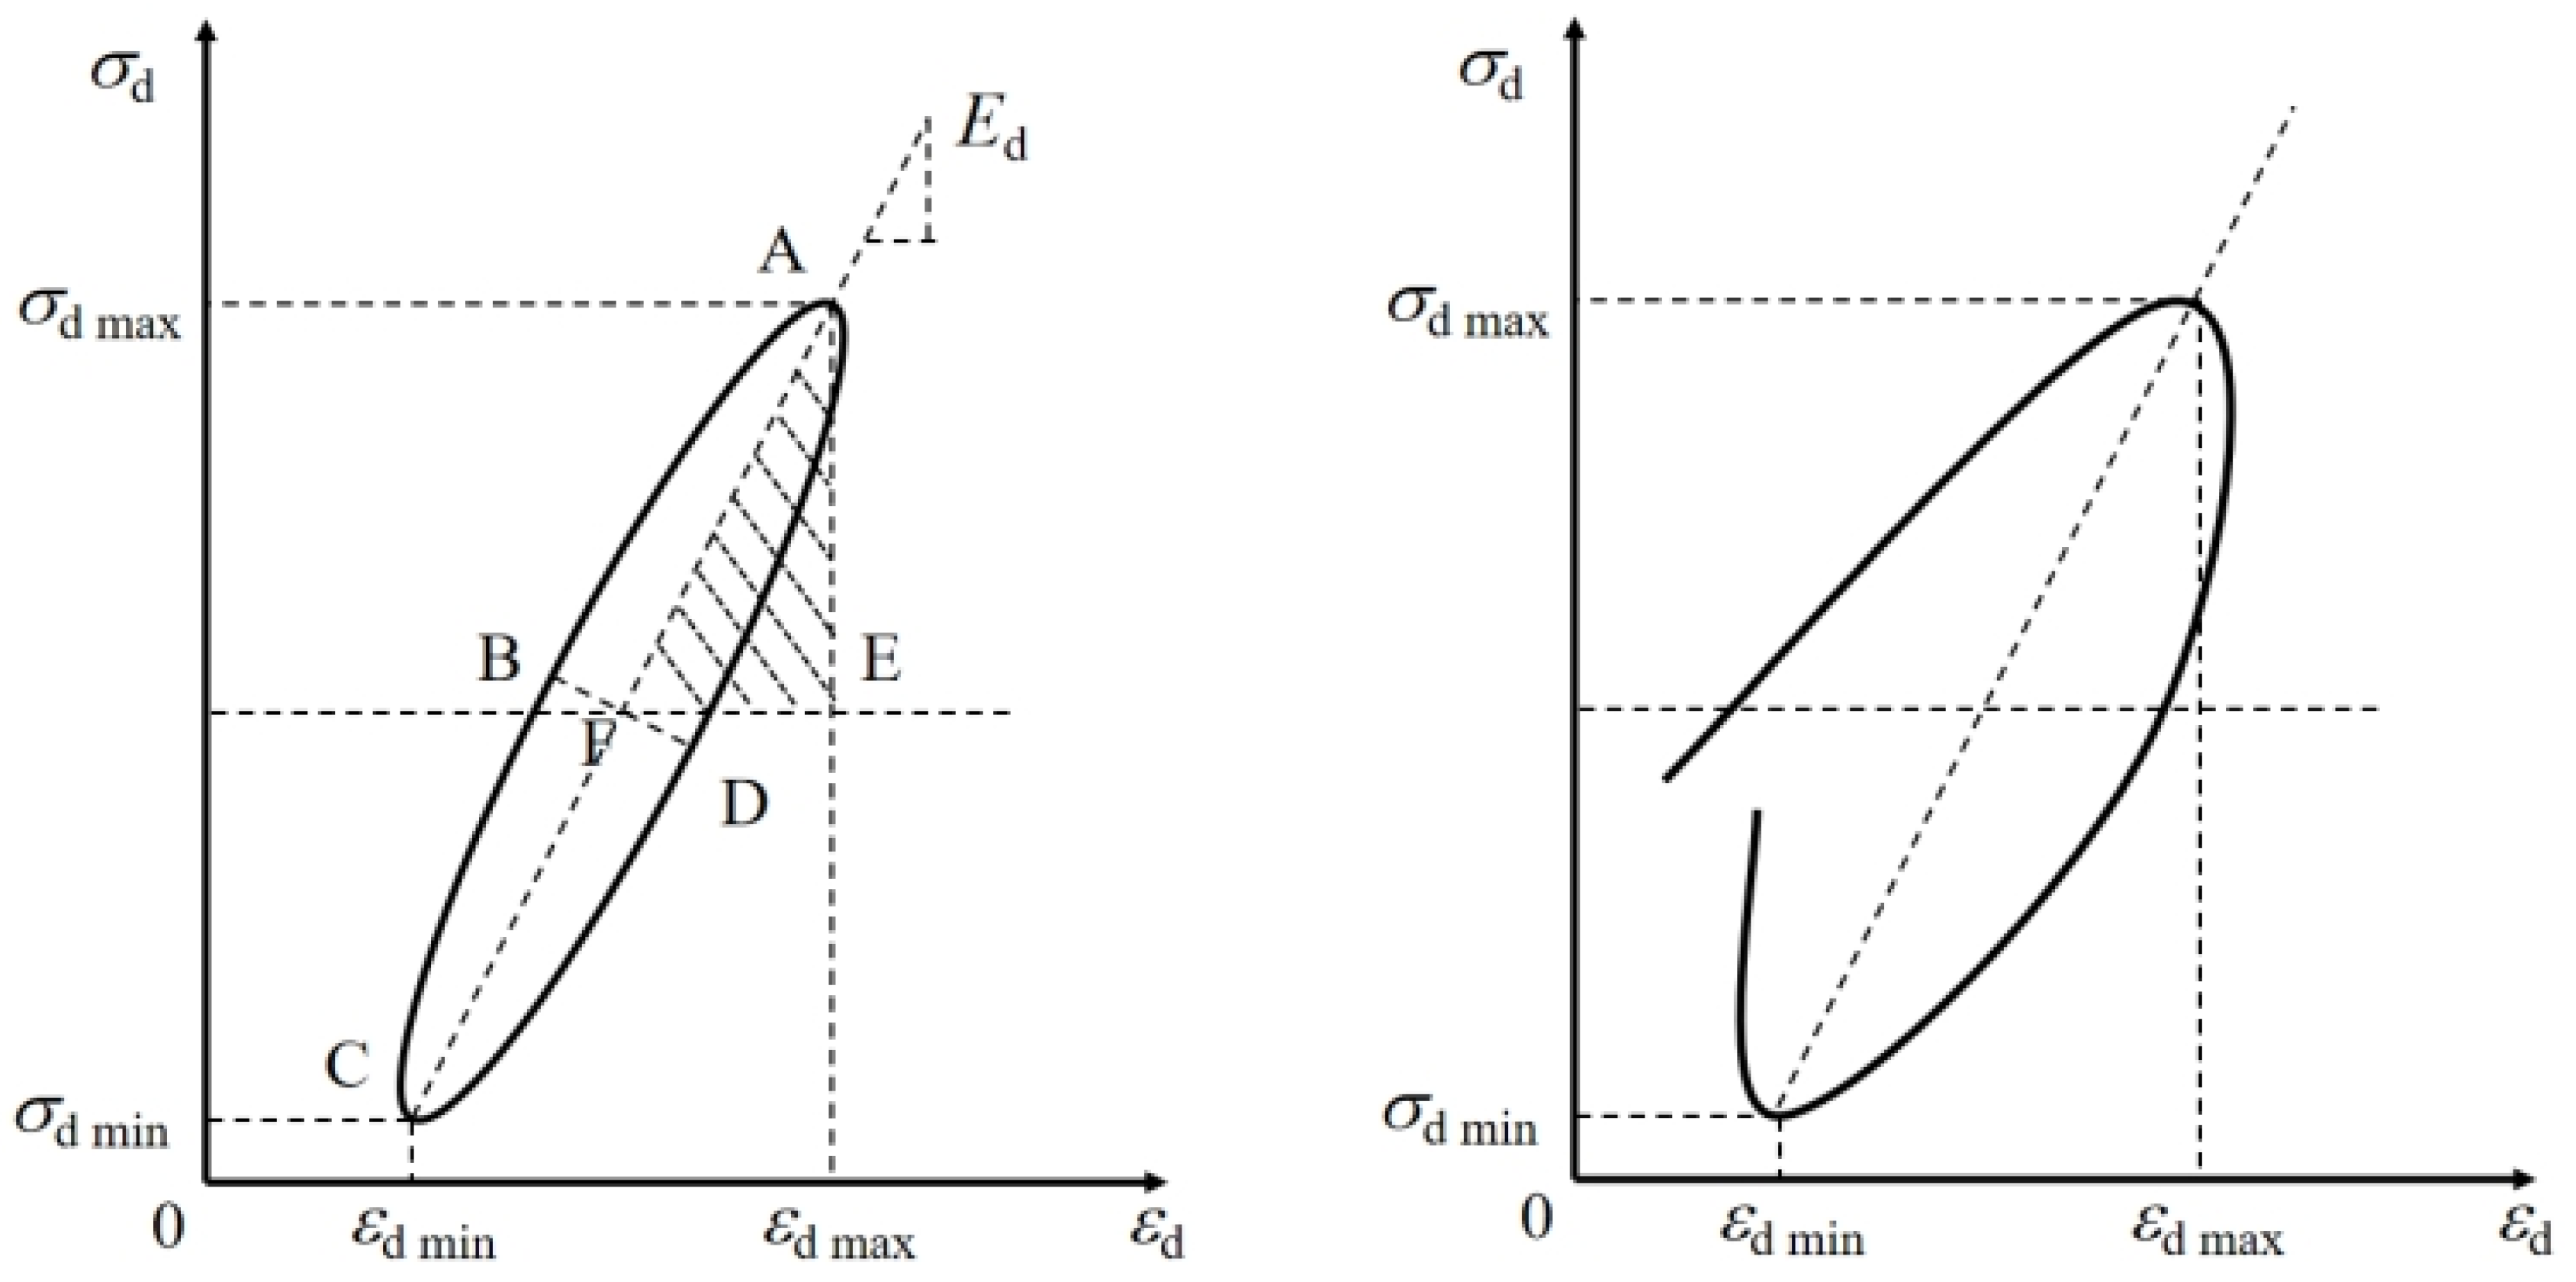
The dynamic deformation modulus (Ed), defined as the secant modulus between the maximum and minimum stress points in a hysteresis loop (Equation (2)), characterizes the elastic response.
The dynamic curve of soil provides the theoretical basis for understanding soil deformation under cyclic dynamic loading. Dynamic curves are graphical representations used to describe the relationship of materials under high-speed or dynamic loading conditions. These curves typically differ from those obtained under static loading conditions, as materials exhibit distinct mechanical responses and behaviors under high-speed loading. Under periodic cyclic loading, the dynamic curve of soil exhibits three fundamental characteristics: nonlinearity, hysteresis, and deformation accumulation. Due to the inherent properties of soil, when the direction of applied stress changes, the material’s deformation does not immediately follow but undergoes a hysteretic process. This hysteresis effect manifests in the hysteresis loop curve, resulting in a closed-loop configuration, as shown in Figure 11. Hysteresis loops describe the nonlinear relationship of soil. Analyzing their morphology reveals strength characteristics such as shear strength and compressive strength, enabling assessment of soil stability and bearing capacity. As plastic deformation accumulates and elastic properties diminish, hysteresis loops may exhibit asymmetry, as shown in Figure 11. Additionally, the area of the hysteresis loop may exhibit various shapes under different test specimens and conditions, such as crescent-shaped or elongated eggplant-shaped forms, with elliptical being the most common. When elastic deformation dominates the specimen, elastic strain responds rapidly. The upper and lower portions of the hysteresis loop curve may occasionally feature sharp points, forming a leaf-like shape. The area of the hysteresis loop curve (ABCD) indicates the energy dissipated by the material during one cycle.
The hysteresis loop area is an important parameter that characterizes the energy dissipation and hysteresis behavior of materials under dynamic cyclic loading. It is generally measured by the enclosed area of the hysteresis curve (i.e., load–displacement or stress–strain curve). Previous studies have shown that the larger the hysteresis loop area, the greater the material’s ability to dissipate energy under dynamic loading conditions [33,34,35].
In this study, the hysteresis loop area was calculated using the numerical integration method (trapezoidal rule) applied to the stress–strain data points forming each closed loop. The area computation was performed on stabilized hysteresis loops recorded at specific cycle numbers (100th, 1000th, 5000th, 10,000th, and 20,000th cycles, or at failure). The stress range for each loop was defined by the maximum and minimum dynamic stress values, while the strain range was determined from the corresponding axial strain measurements. The enclosed area represents the energy dissipated per loading cycle, with larger areas indicating greater energy dissipation due to internal friction and plastic deformation.
The hysteresis curve reflects the deformation, stiffness, and energy dissipation characteristics of soil under dynamic loading, serving as the key basis for nonlinear dynamic response analysis. Specifically, the degree of hysteresis curve fragmentation indicates the extent of micro-damage within the soil. The width and thickness of the hysteresis loop characterize the influence of soil viscosity on dynamic constitutive behavior, while the fullness of the hysteresis curve reveals the soil’s seismic performance, energy dissipation capacity, and slip characteristics [36].
The dynamic modulus of elasticity, typically denoted by Ed, characterizes the elastic response of soil under dynamic loading. It is defined as the ratio of stress to corresponding strain when the soil is subjected to dynamic loading, as shown in Equation (2). This parameter accounts for the soil’s inelastic behavior under dynamic loading conditions and better reflects the deformation characteristics of soil in practical engineering applications compared to the traditional static modulus of elasticity.
E d = σ dmax σ dmin ε dmax ε dmin
In the formula: Ed—is the dynamic elastic modulus.
The dynamic elastic modulus was calculated using the peak-to-peak stress and strain values from the hysteresis loops recorded at the 100th, 1000th, 5000th, 10,000th, and 20,000th loading cycles (or at failure if earlier). The stress range was determined by the maximum and minimum applied dynamic stresses during each cycle, while the corresponding strain range was obtained from the measured axial deformation. All calculations were performed on stabilized hysteresis loops to ensure consistent elastic response evaluation.
σ dmax , σ dmin —The maximum dynamic stress and minimum dynamic stress of the dynamic hysteresis curve, respectively.
ε dmax , ε dmin —The maximum dynamic strain and minimum dynamic strain of the dynamic curve, respectively.

3.3. Results and Analysis of Uniaxial Cyclic Loading Tests

3.3.1. Effect of Amplitude on Cumulative Strain of Soft Soil Cement Mixture

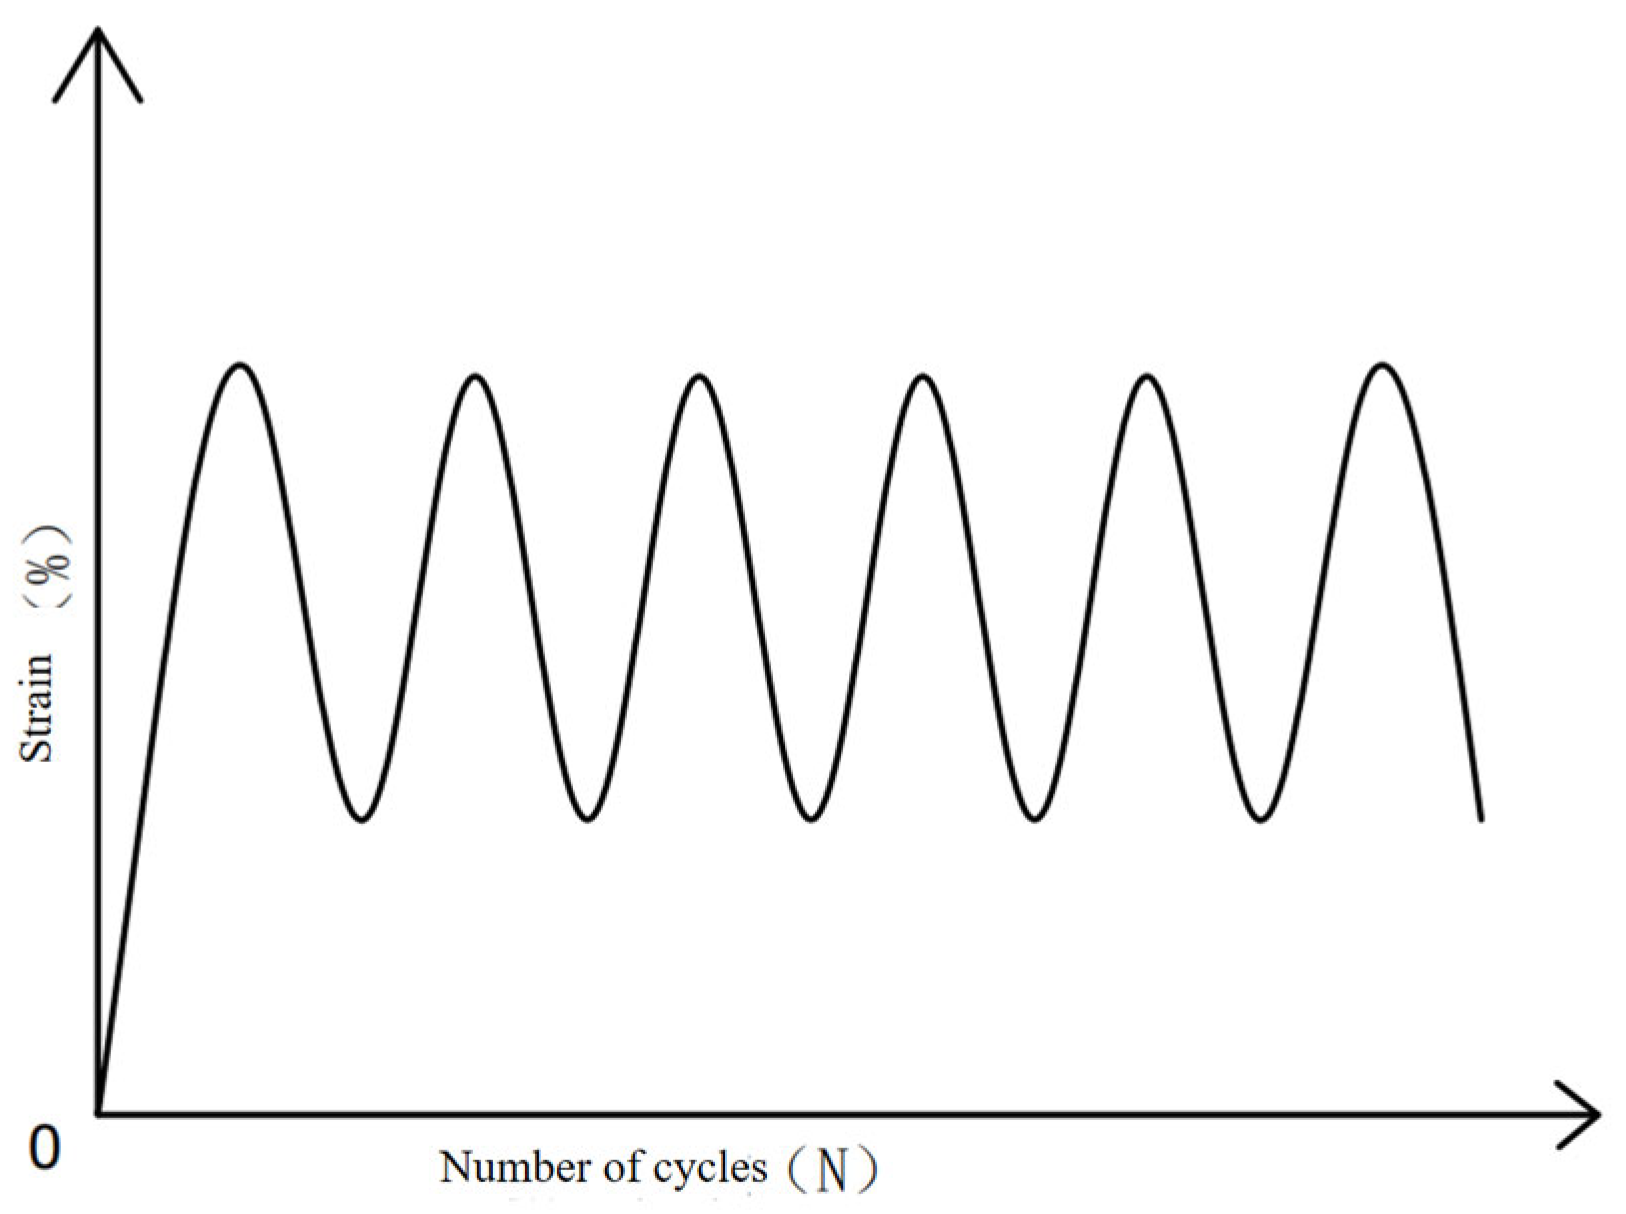
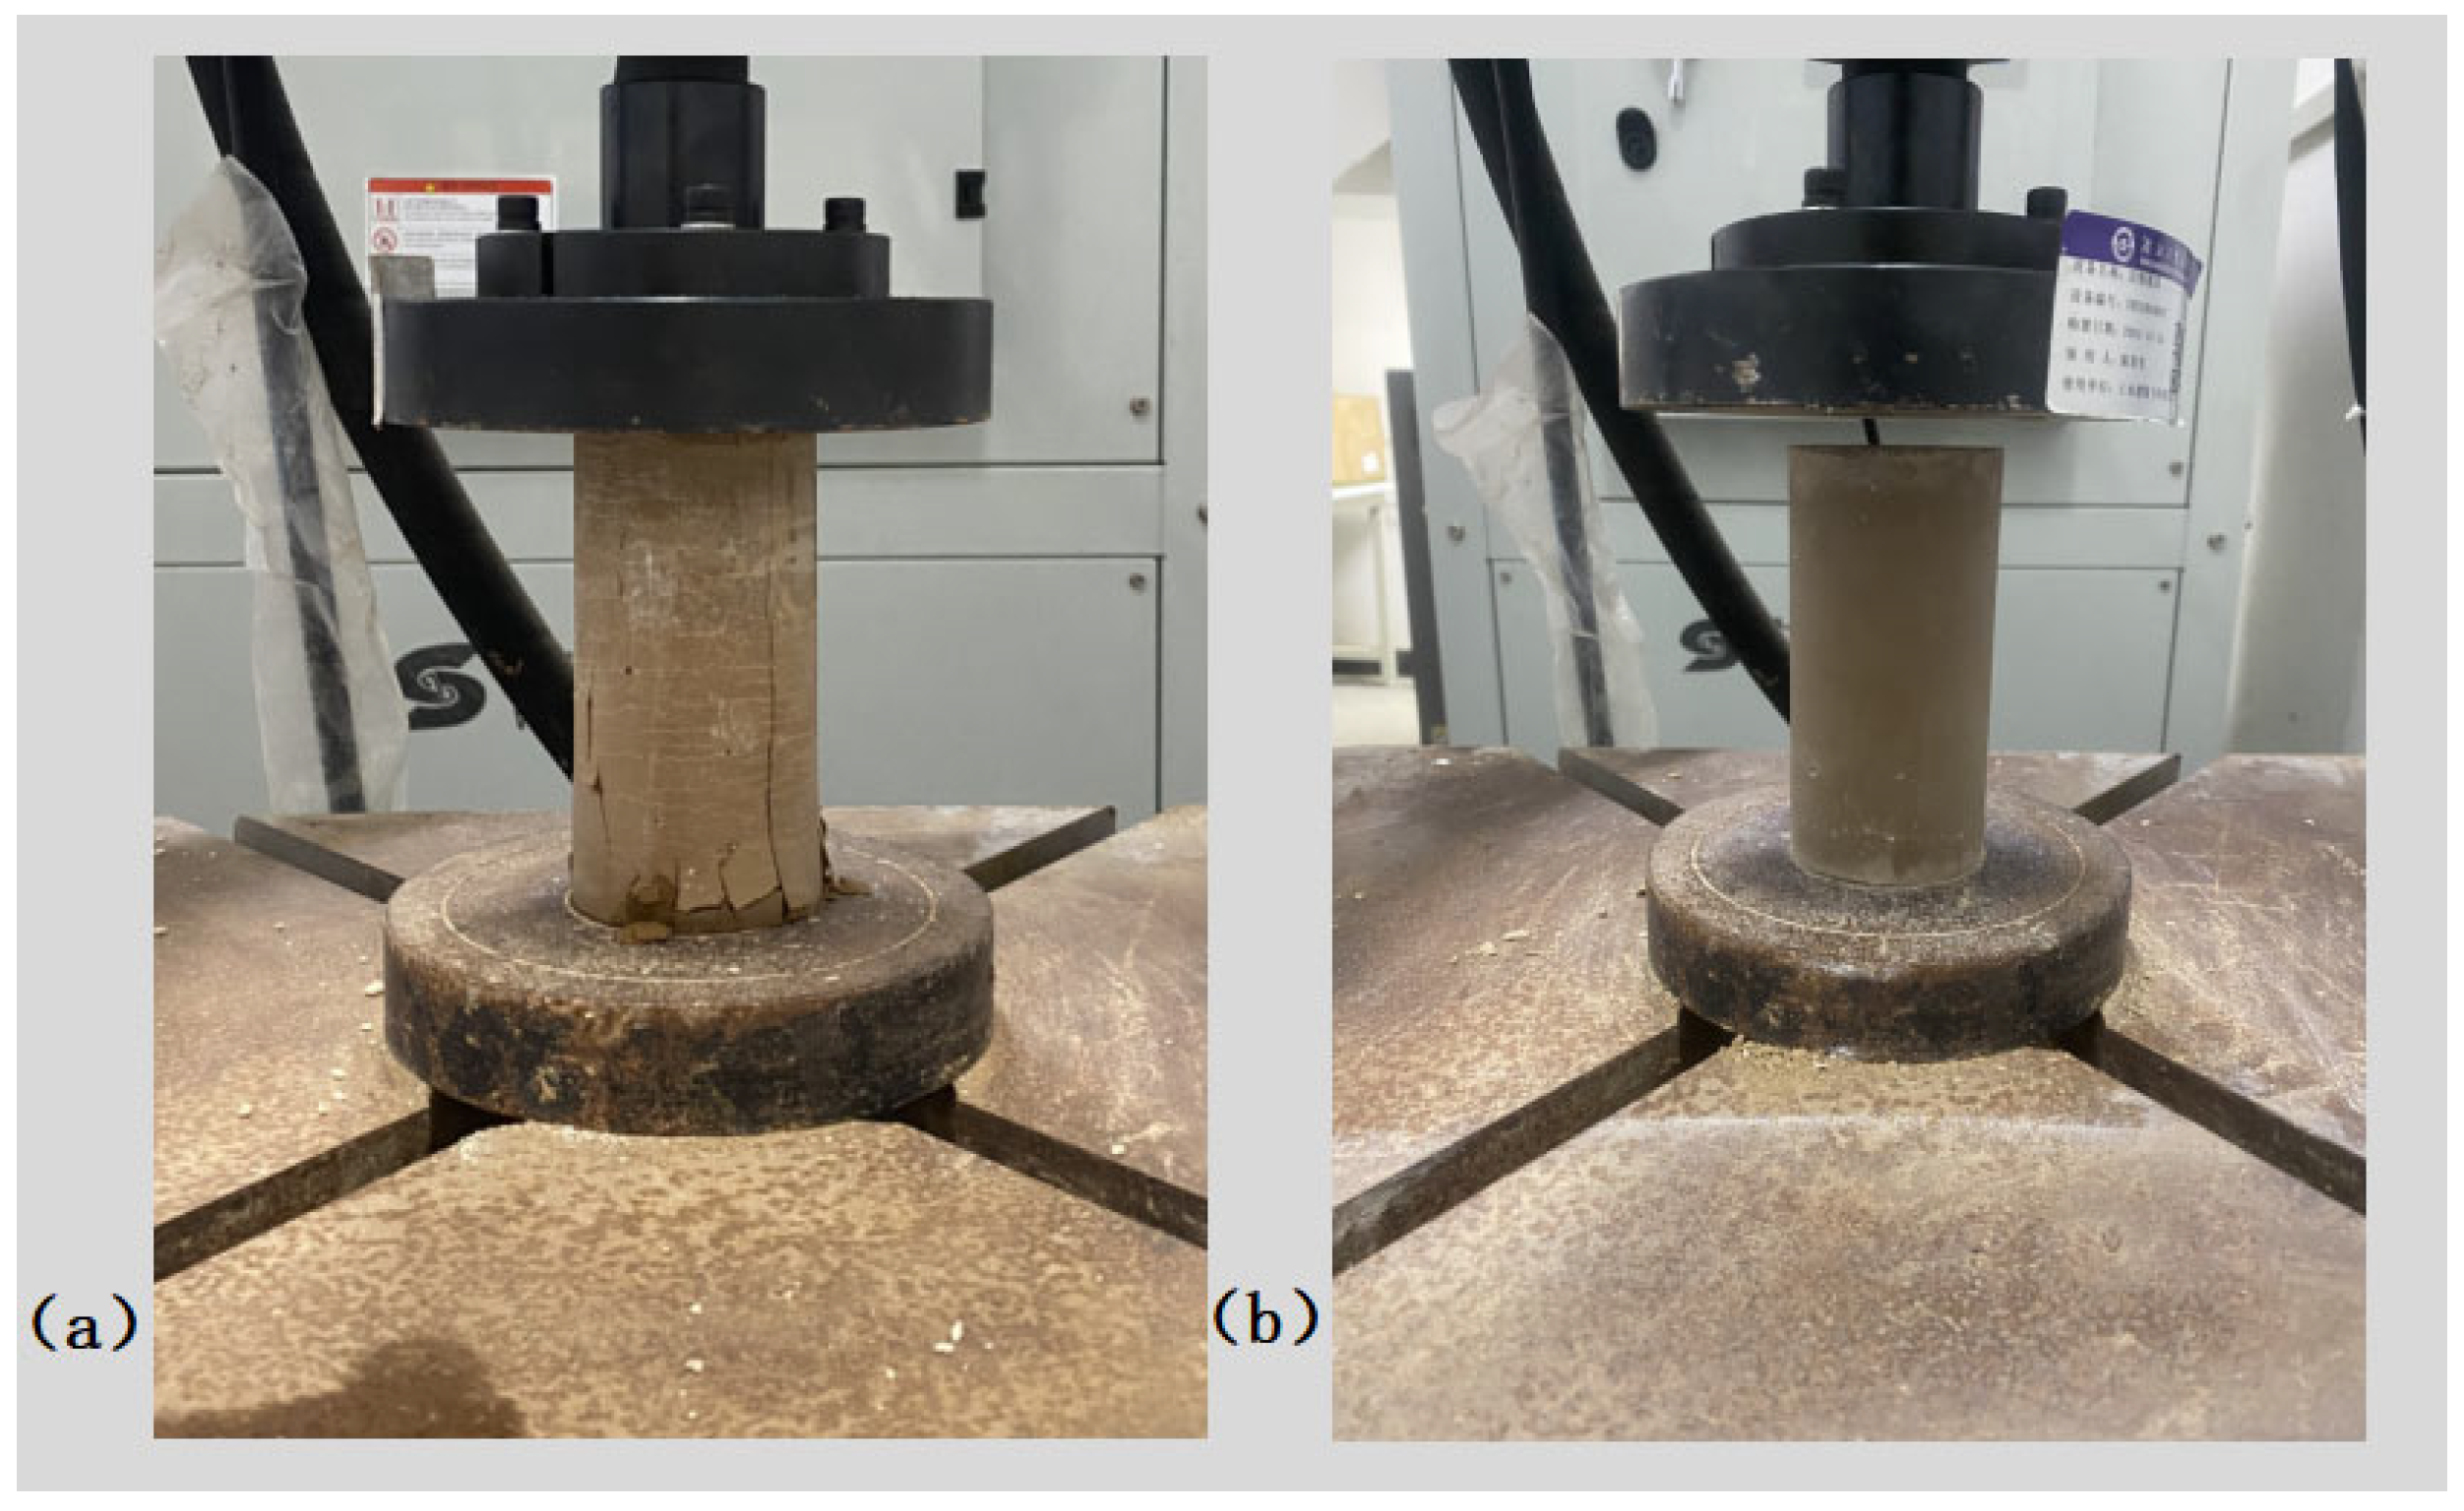
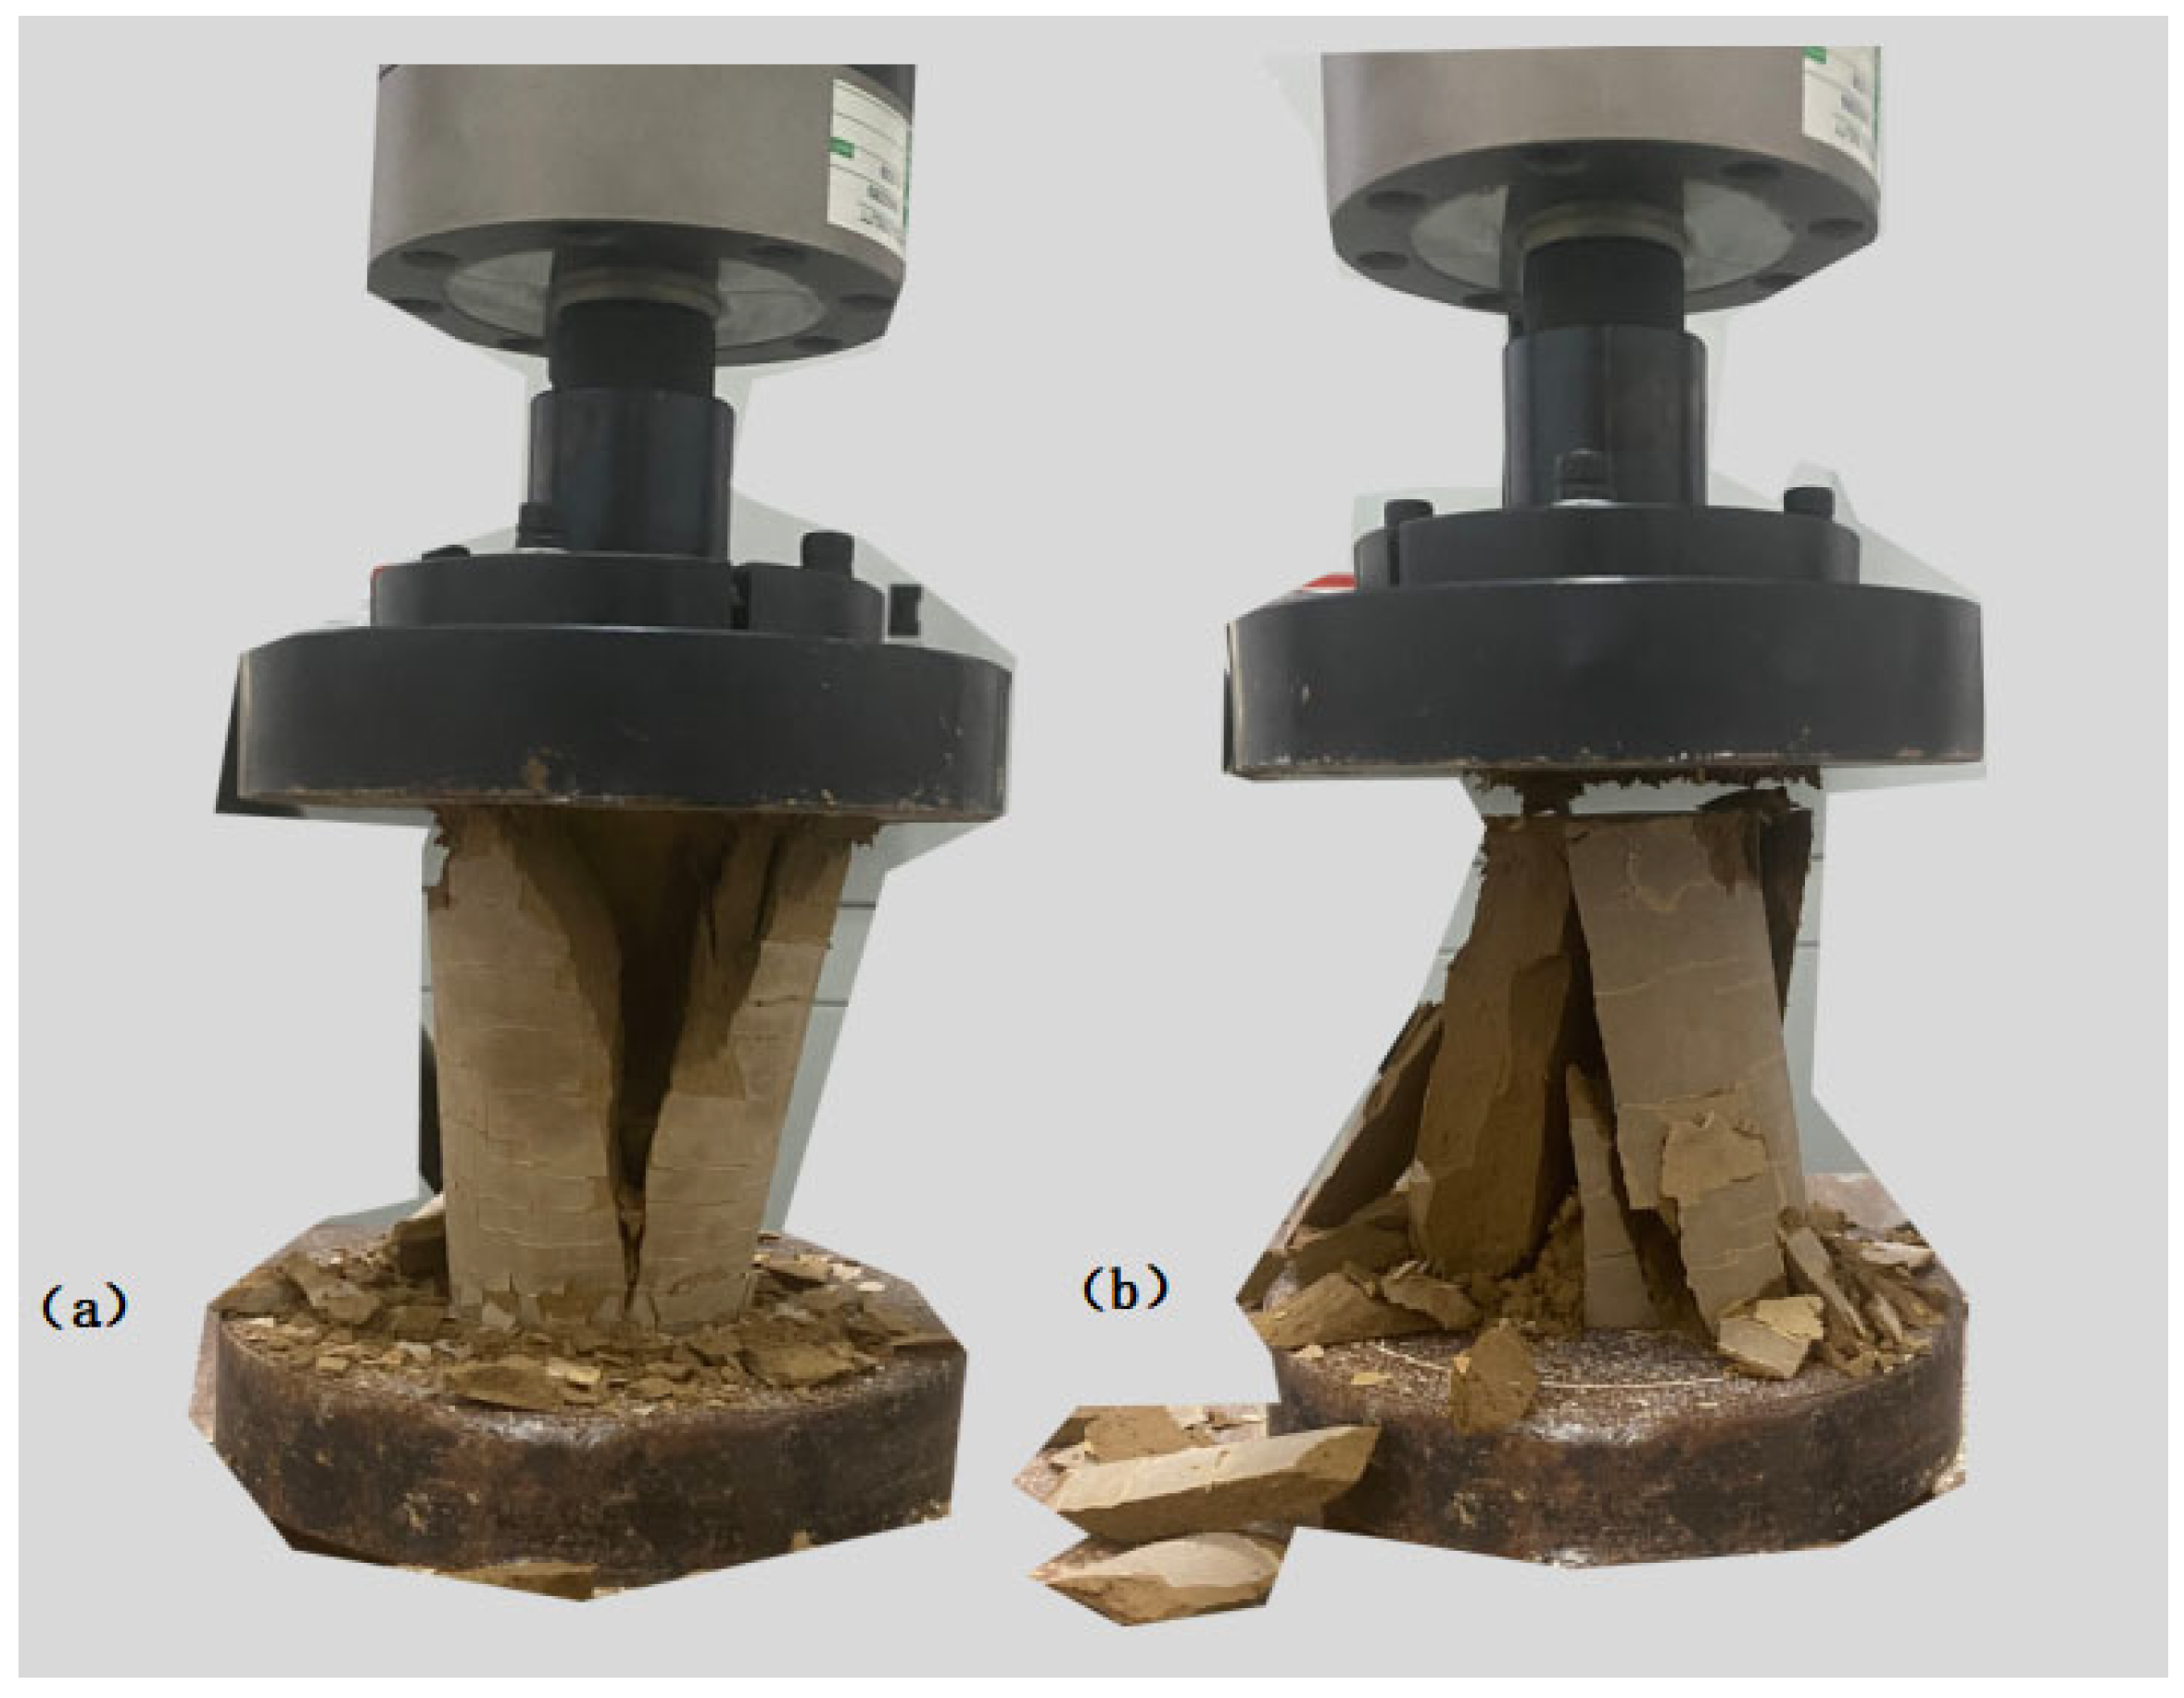
Through conducting 20,000 uniaxial cyclic tests on unmodified cement soil and optimally modified composite cement soil, the relationship between cyclic load cycles and dynamic strain was investigated. Under cyclic periodic loading, the elastic portion of deformation in cement soil materials recovers during unloading, while residual or plastic deformation persists. Figure 12 illustrates the relationship between cumulative strain and number of cycles. The graph reveals three distinct stages of cumulative deformation: initial deformation, stable deformation, and failure. During the initial deformation stage, significant deformation occurs within a small number of cycles, rapidly compacting the specimen. If specimen strength is low, strain may increase rapidly until failure. If specimen strength is high, the material enters a stable deformation stage, potentially enduring long-term cyclic loading. Under prolonged cyclic loading, the specimen may reach a fatigued state where strain undergoes abrupt increases leading to failure. Specimens with higher strength exhibit greater resistance to deformation and may avoid the failure stage. Figure 13 shows an undamaged cement soil specimen after cyclic loading. Figure 14 depicts a specimen failing after 20,000 cycles.
Under identical CSR conditions, the composite-modified specimens exhibited a 166-fold increase in fatigue life (from <120 to 20,000 cycles), confirming this as a primary material property rather than a secondary strength effect.
This dramatic improvement was consistently observed across all replicate specimens (n = 3), with failure modes remaining stable (brittle shattering for unmodified, gradual compaction for modified), confirming the robustness of the composite modification [37].
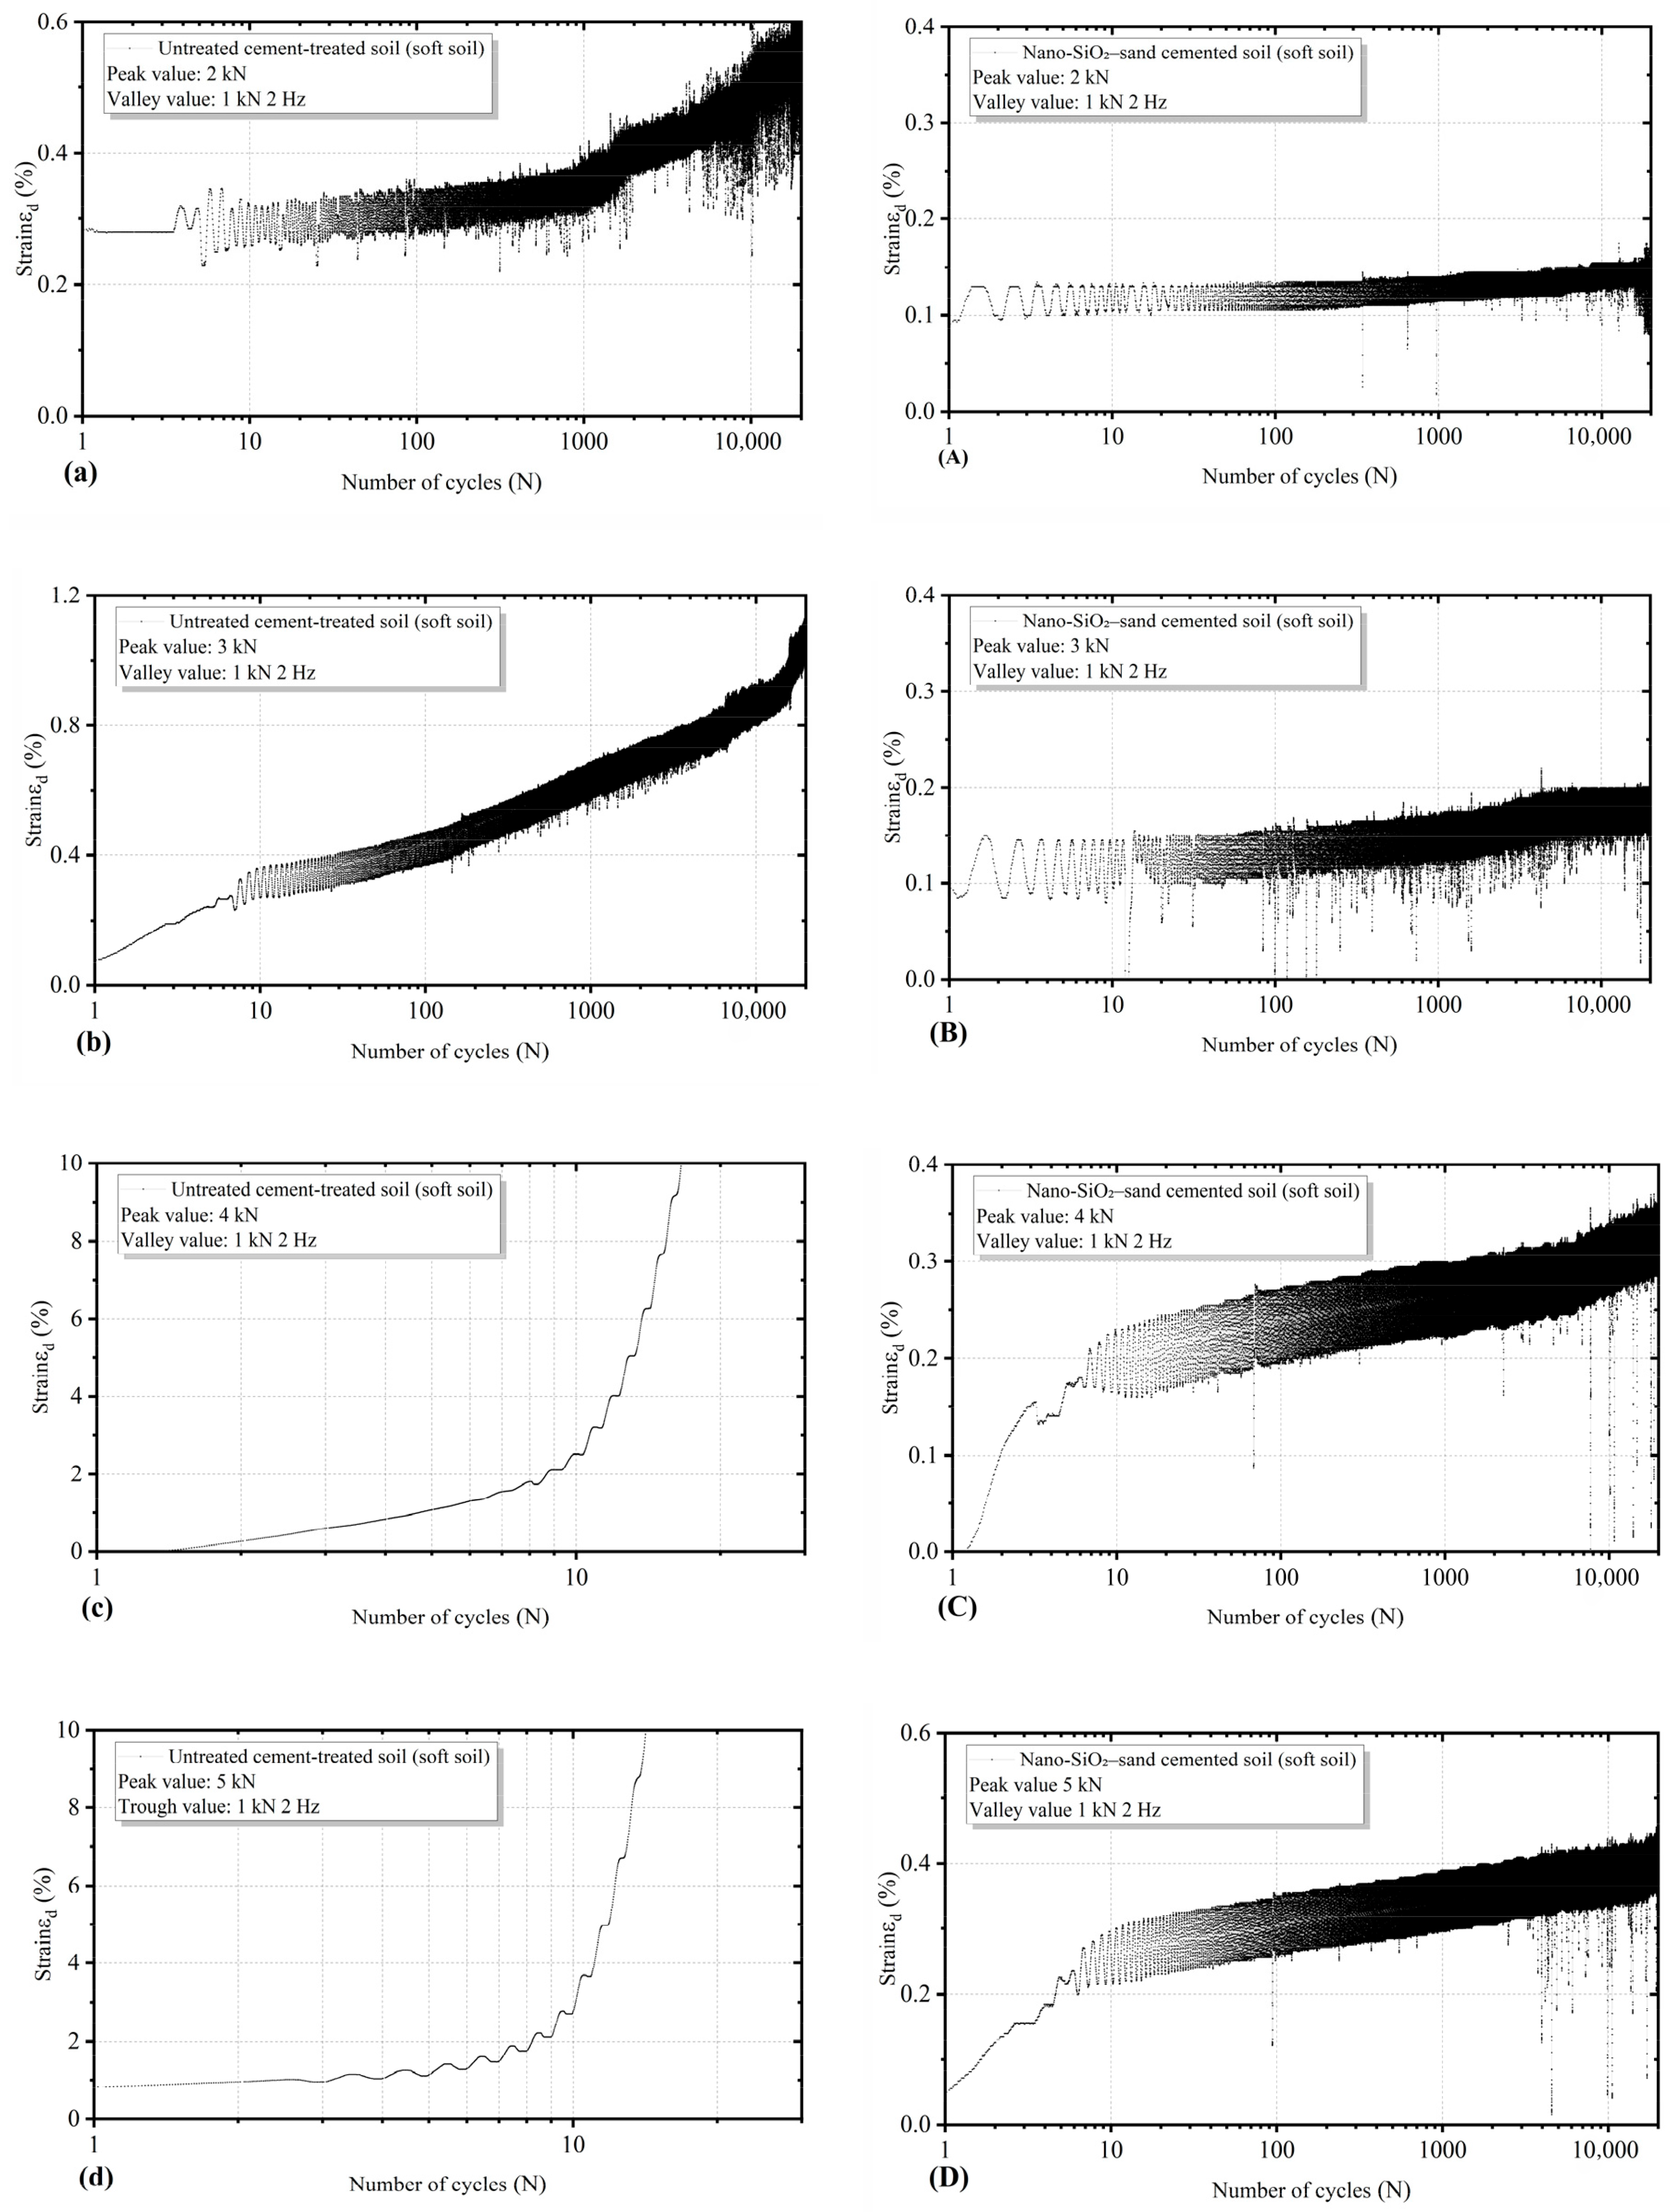
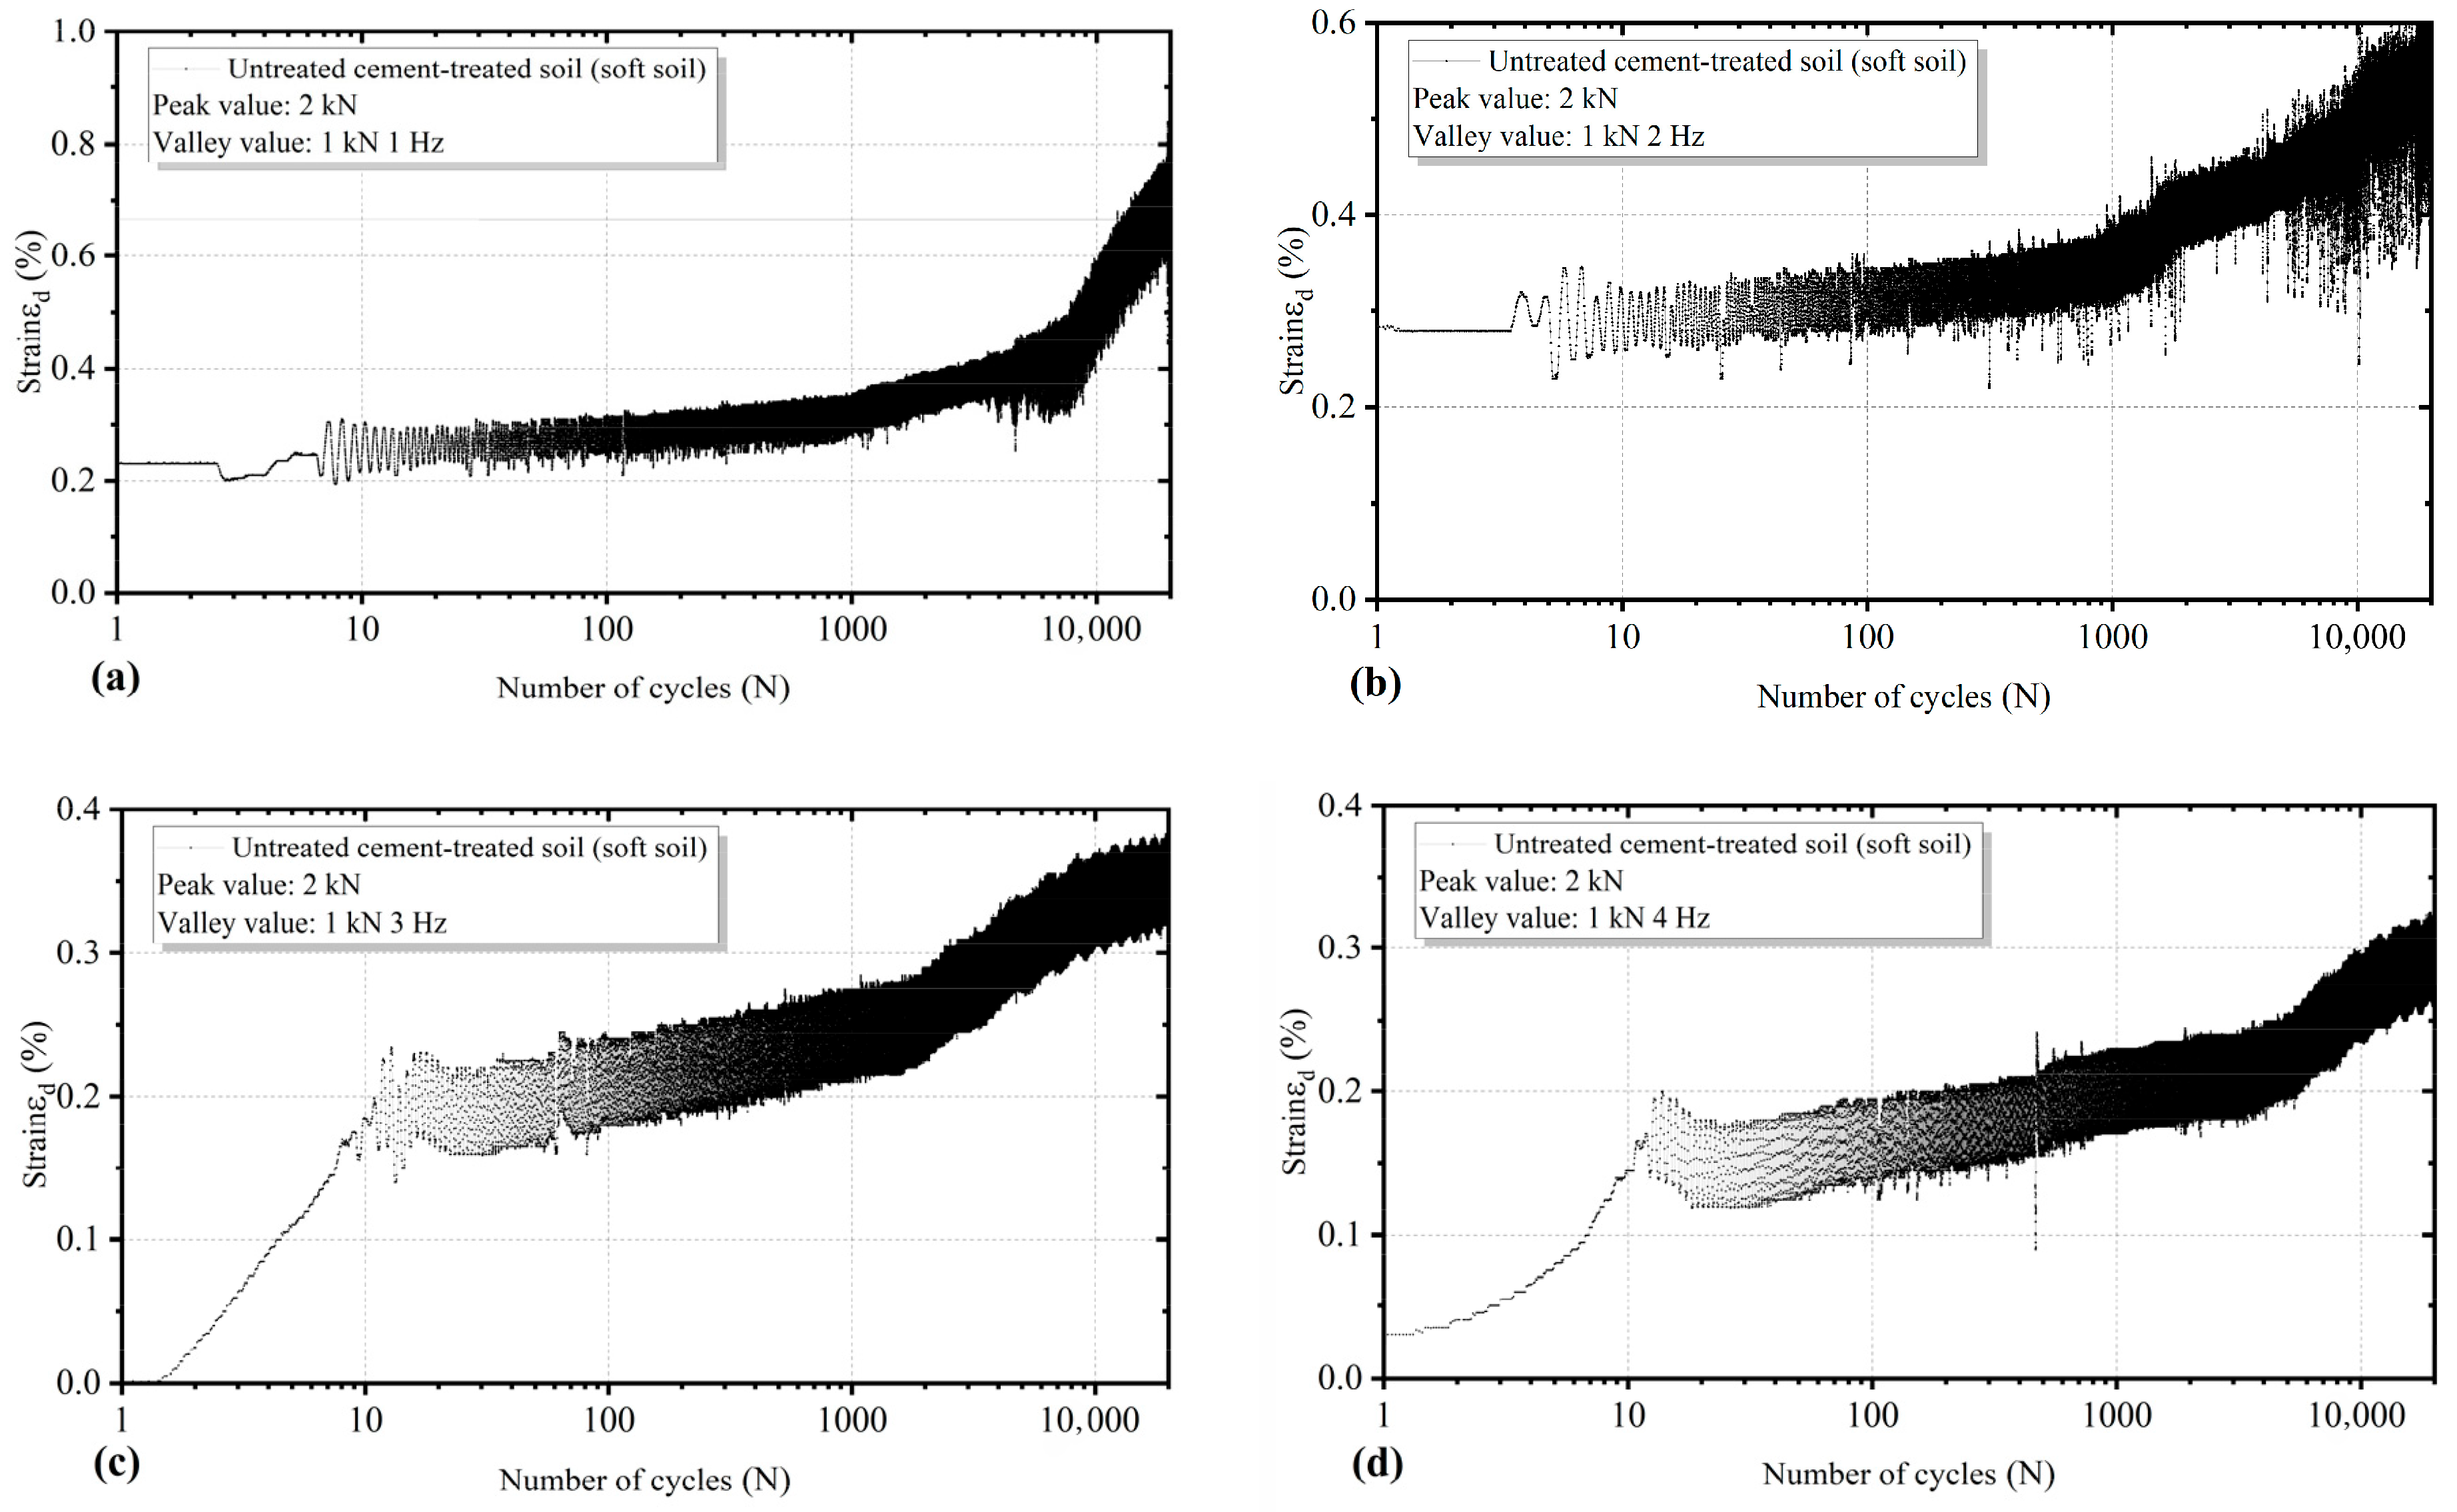
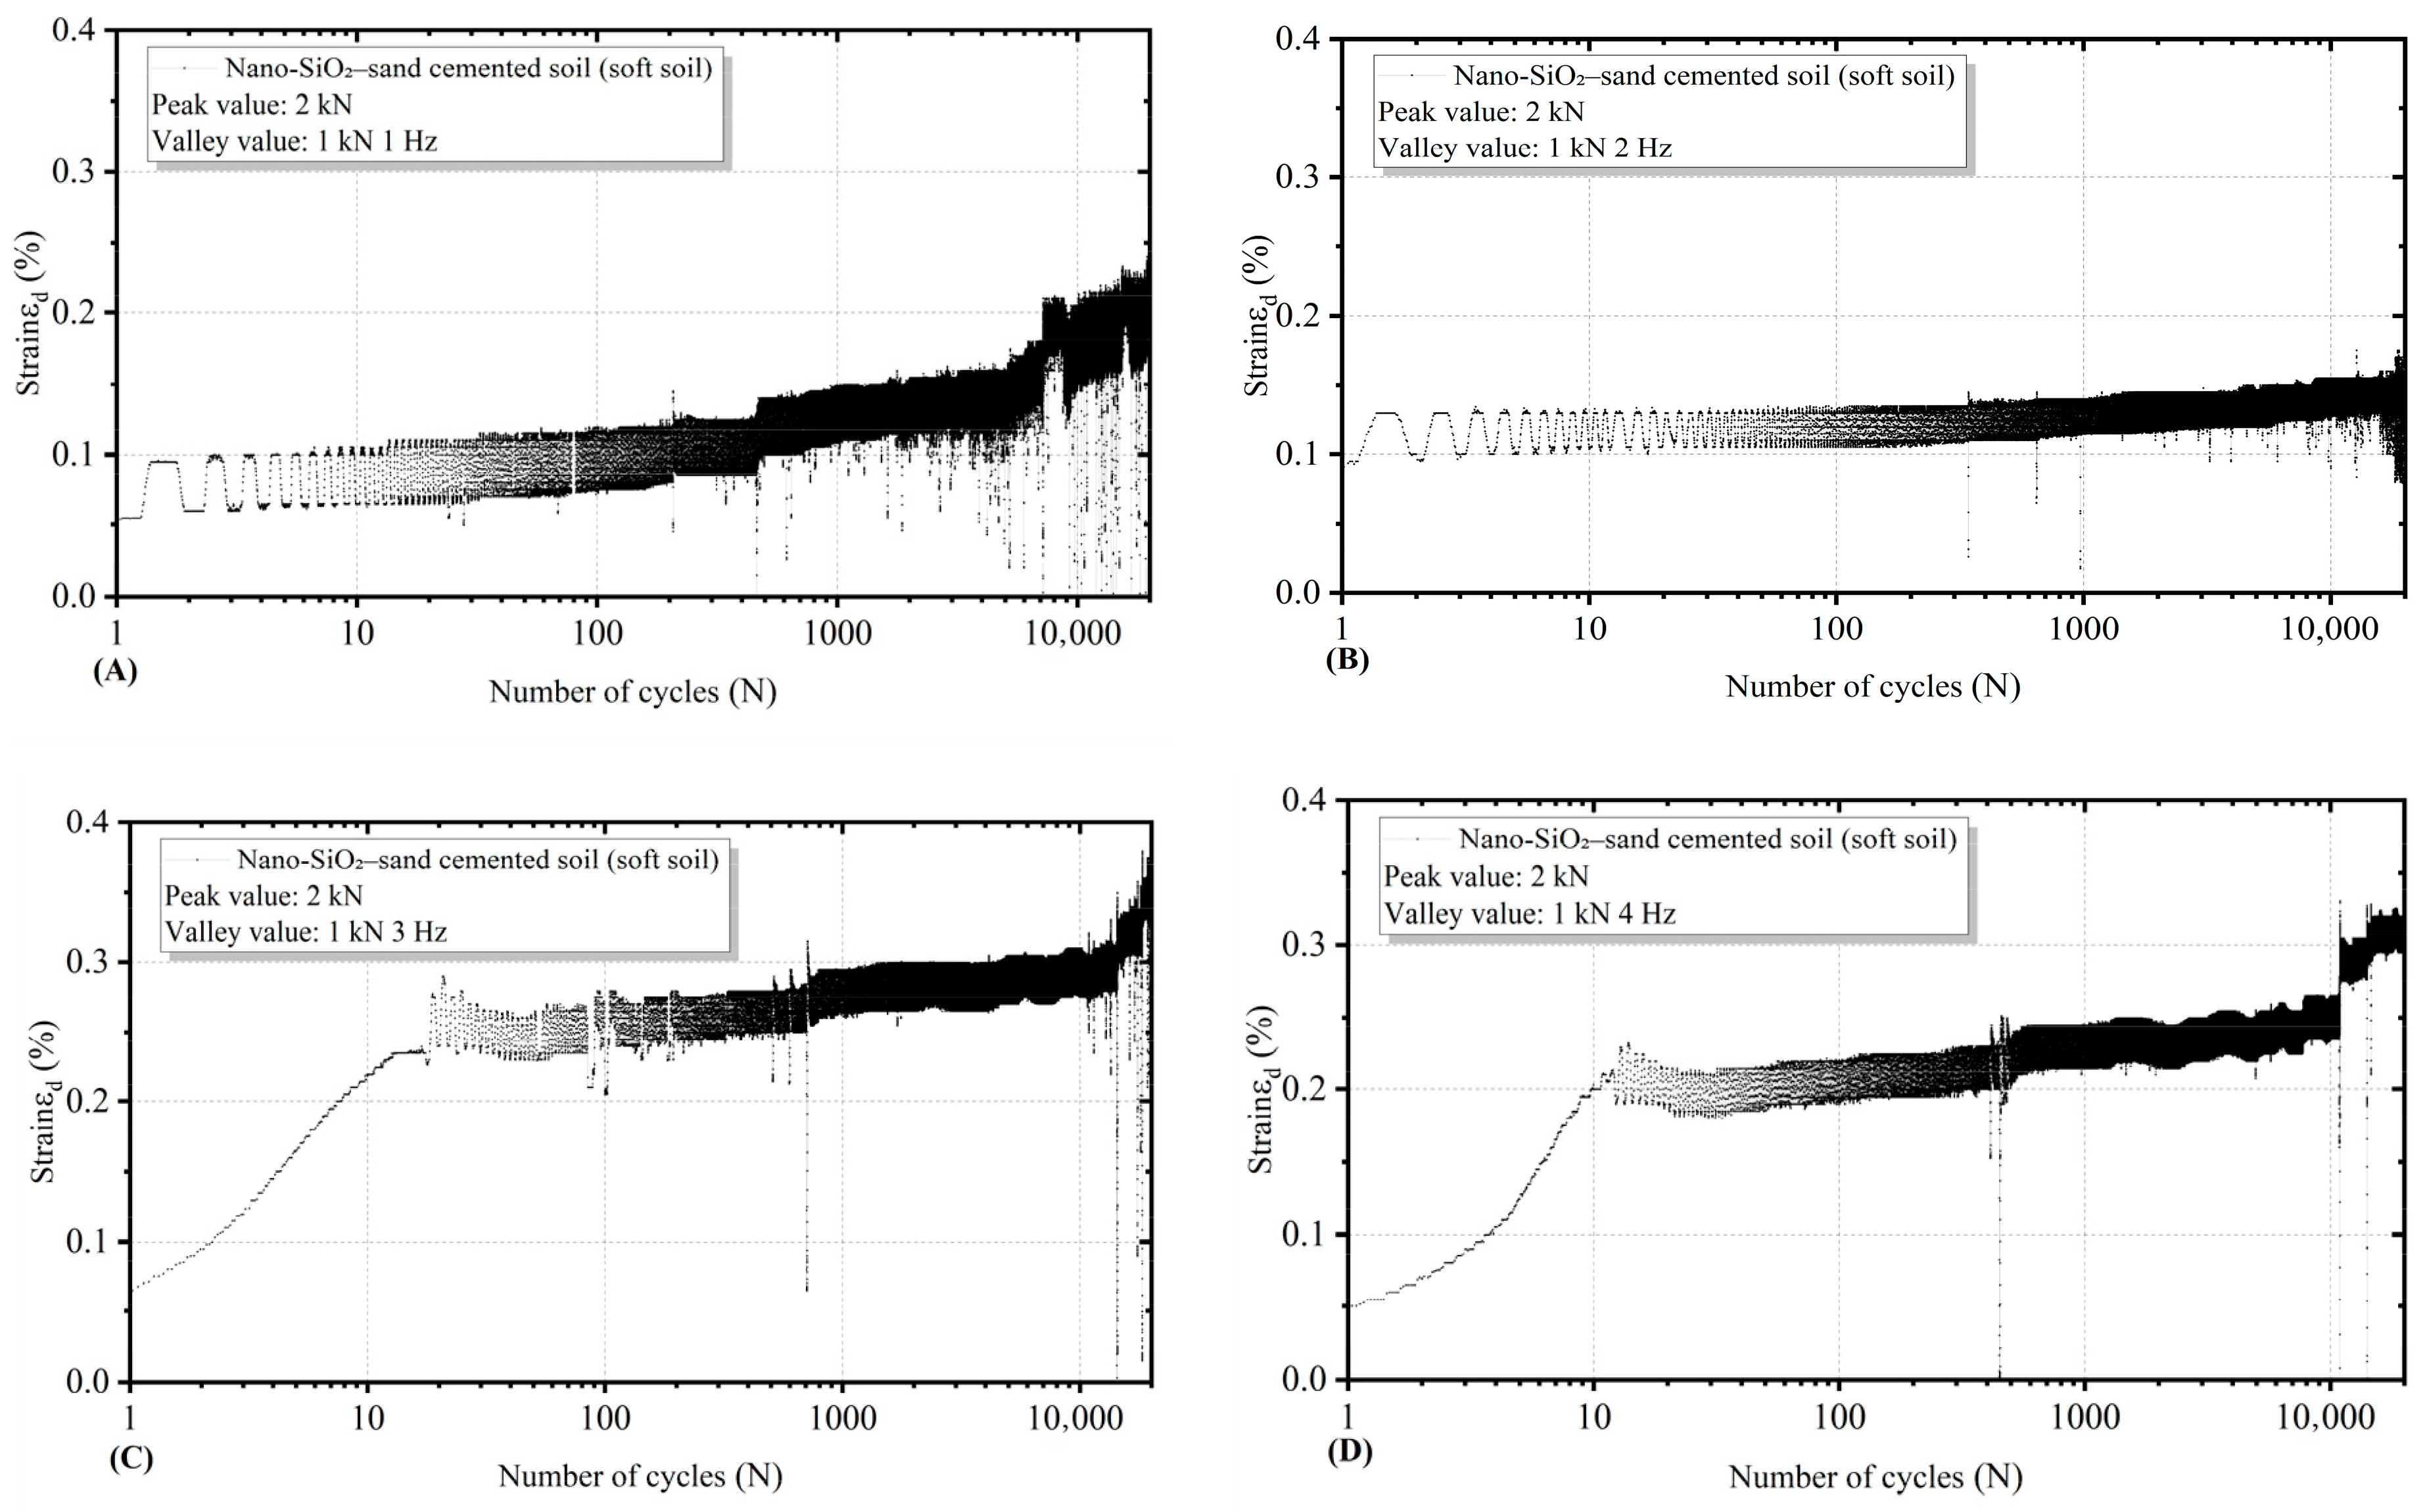
As shown in Figure 15, the relationship between axial dynamic strain and the logarithm of cyclic cycles under different peak strength cyclic loads is presented for unmodified cement-stabilized soil and cement-stabilized soil modified with the optimal nano-SiO2 sand composite material. Figure 15a–d present dynamic strain diagrams for unmodified cemented soft soil subjected to 20,000 uniaxial cycles at different loading amplitudes. The unmodified cemented soil represents untreated cemented soil. Figure 15A–D correspond to cemented soil modified with the optimal composite content of nano-SiO2 sand. Dynamic strain increases with rising peak cyclic load intensity. Figure 15a,b reveal significant strain changes in the unmodified cement-stabilized soil specimens. At a peak stress intensity of 2 kN, the dynamic strain reached approximately 0.3% after 20,000 uniaxial cycles. Strain began to increase significantly around 10,000 cycles, with cumulative strain reaching 0.6%. For unmodified cement-treated soil, after 20,000 uniaxial cycles at a peak stress intensity of 3 kN, the axial cumulative strain in the stable deformation stage increased from 0.3% to approximately 1.1%. Strain growth becomes evident after approximately 100 uniaxial cycles. Although the specimens remain intact and retain some bearing capacity, their resistance to cyclic loading approaches its limit. Figure 15c,d further illustrate that at a peak strength of 4 kN, specimen displacement undergoes a sudden change after 10 cycles, with failure occurring after 16 cycles. At a peak strength of 5 kN, axial displacement of the specimen underwent a sudden change after approximately eight uniaxial cycles, with cement-stabilized soil strain increasing rapidly. Specimen failure occurred after 12 cycles. For soft soil cement-stabilized specimens, the specimens could only withstand cyclic loading at 3 kN. Modified cement-stabilized soil significantly enhances dynamic properties and fatigue life.
The nano-SiO2–sand-cemented soil exhibits minimal cumulative strain increase during 20,000 cycles under a peak stress of 2 kN, reaching a stable deformation stage with an approximate cumulative strain increase of 0.05% as in Figure 15A. Under a peak stress of 3 kN, both peak and valley strains significantly increase within a single cycle. At a peak stress of 4 kN, the cement-treated soil specimen compacted, exhibiting a distinct initial deformation stage. Subsequently, during the stable stage, the cumulative strain increased significantly, rising from approximately 0.15% to 0.35%. The modified cement-treated soil maintained specimen integrity after 20,000 uniaxial cycles at a peak stress intensity of 5 kN as shown in Figure 15D. Second, in the uniaxial cyclic loading test of modified cement-treated soil, strain significantly increased during both the initial stage and the stable deformation stage. The specimen compacted at approximately 0.2% strain, then entered the stable deformation stage. After 20,000 uniaxial cycles, the cumulative strain reached about 0.4%. As the stress loading amplitude increased, the cumulative strain also increased. Within a single loading cycle, both the peak strain and the estimated strain value around 0.1% were significantly smaller than the strain variation in unmodified cement-stabilized soil. The tests demonstrated that compared to unmodified cement-stabilized soil, nano-SiO2 sand-modified cement-stabilized soil exhibited significantly enhanced resistance to deformation and compressive strength under cyclic loading, while also improving the fatigue life of the cement-stabilized soil.

3.3.2. Effect of Amplitude on Cumulative Strain in Clay Cement Compounds

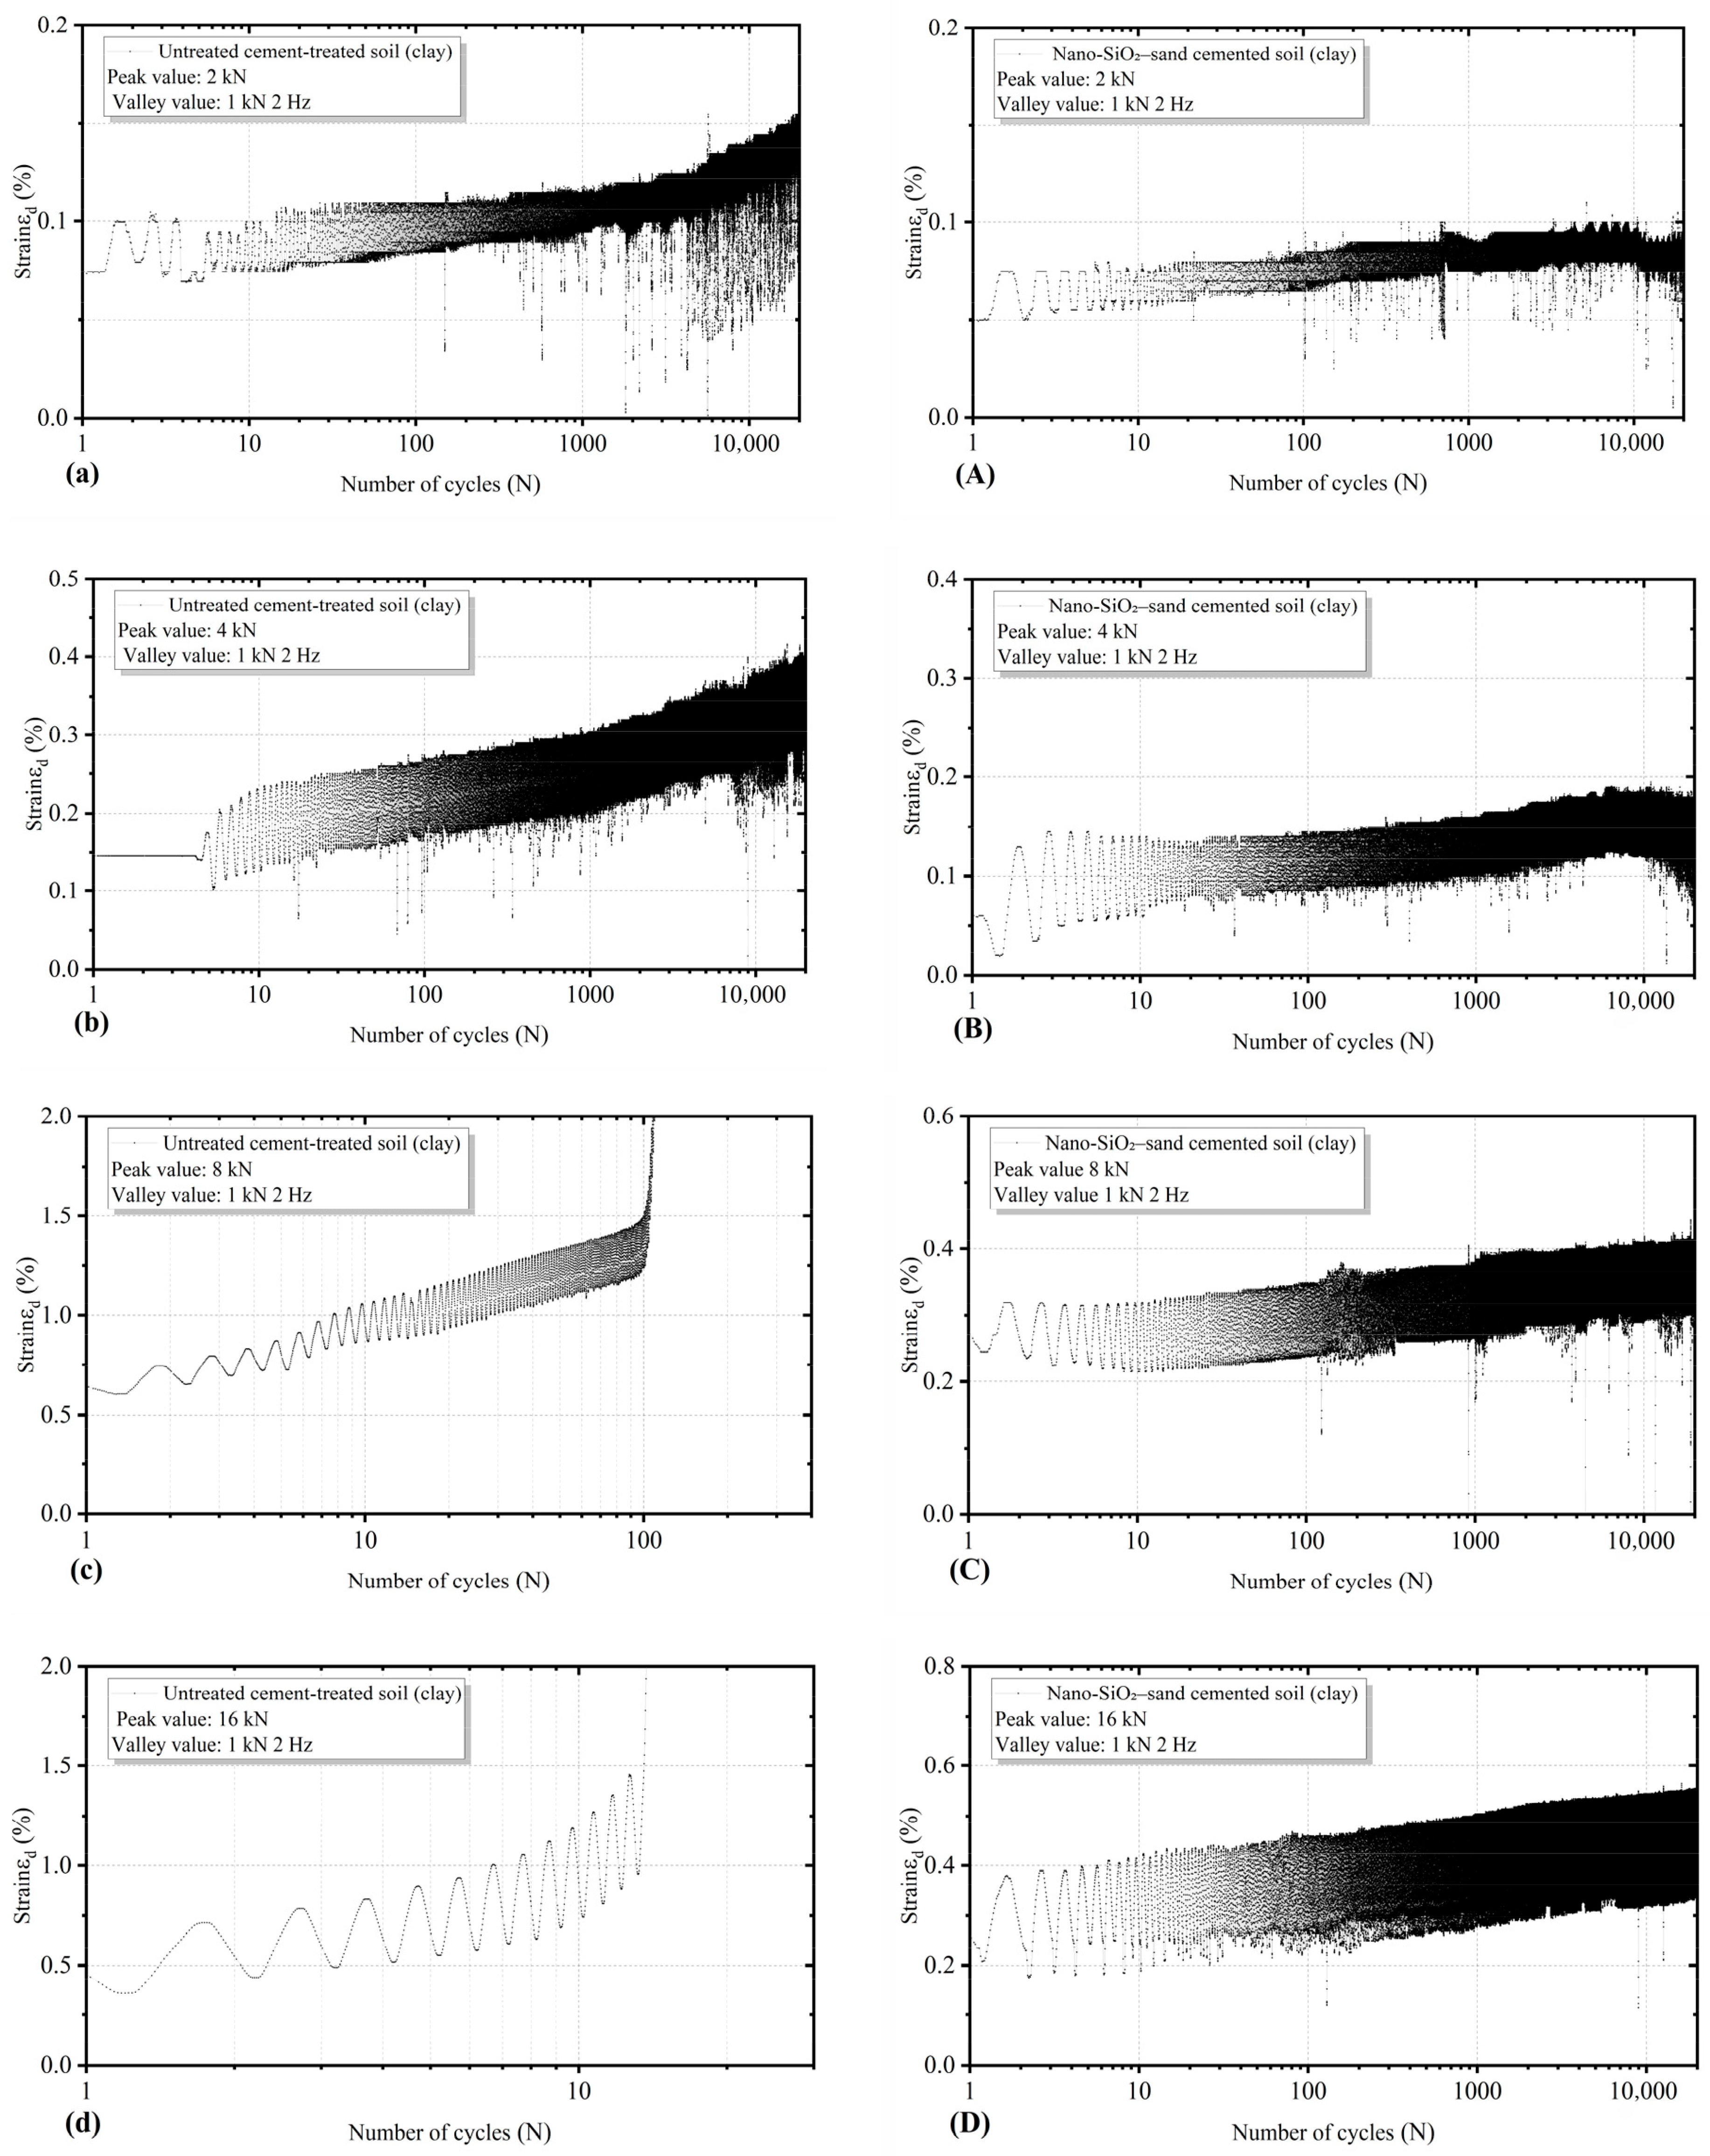
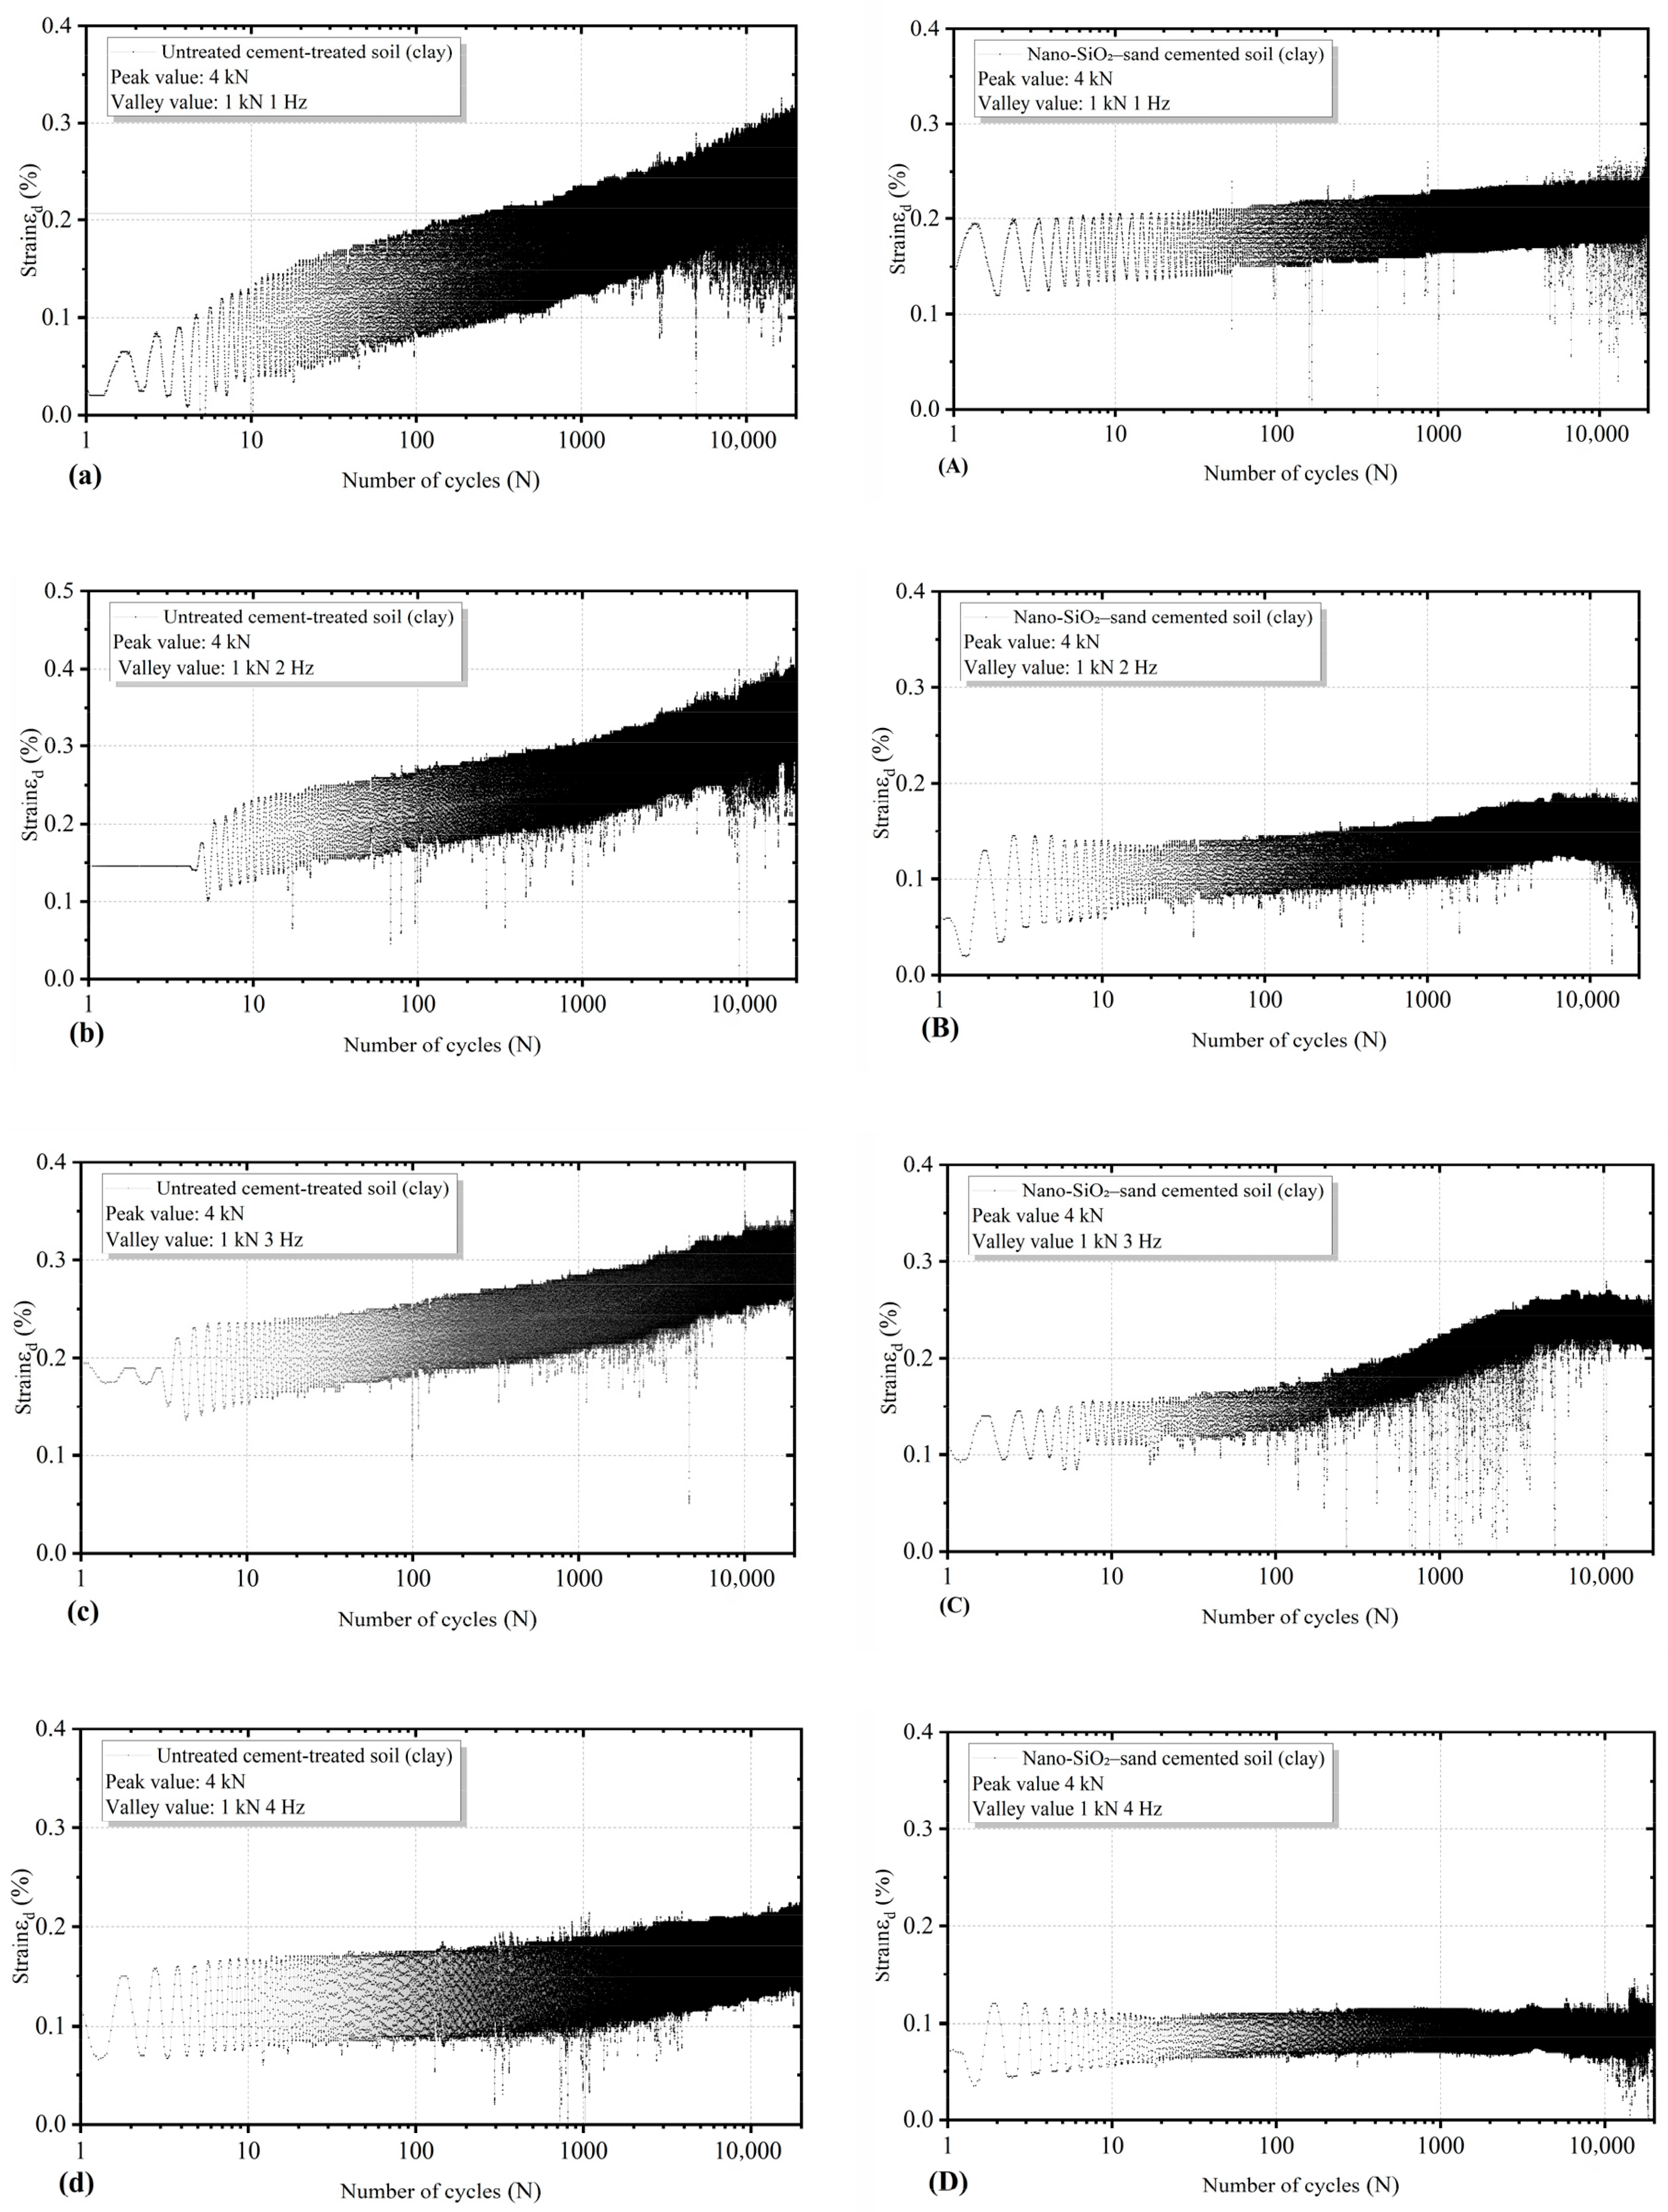
The axial strain response of unmodified cement-stabilized soil and modified cement-stabilized soil (clay) under cyclic loading with varying peak intensities is shown in Figure 16. The selection of different amplitude values for this test compared to the cemented soft soil is due to the significant differences in the inherent mechanical properties of the two soils. Based on the aforementioned strength test results, clay exhibits superior mechanical properties relative to soft soil. If tests were conducted using lower amplitude strengths, it would be difficult to investigate the optimal improvement effect of the modified cemented soil. Therefore, different peak stress intensities were employed to explore the maximum load amplitude it can withstand.
As shown in the figure, strain increases significantly with rising cyclic peak stress intensity. For unmodified cement-treated soil at a peak intensity of 2 kN, after 20,000 uniaxial cyclic load cycles, the plastic dynamic strain increased from 0.1% to 0.15% during the stable deformation stage, with a relatively small cumulative strain. At a peak stress intensity of 4 kN, after 20,000 uniaxial cycles, the plastic dynamic strain increased from 0.2% to approximately 0.4% during the stable deformation stage, with a significant rise in cumulative strain. At a peak stress intensity of 8 kN, displacement underwent a sudden change after 100 uniaxial cycles, causing rapid accumulation of strain, with specimen failure occurring after 117 cycles. At a peak stress intensity of 16 kN, displacement underwent a sudden change after 13 uniaxial cycles, with axial strain increasing rapidly (Figure 16c,d). Subsequently, specimen failure occurred within a few cycles, indicating the presence of a critical transition point on the curve. Beyond this threshold, axial strain increased rapidly, and this phenomenon occurred earlier as the amplitude increased, leading to specimen failure within the following few cycles.
No such critical transition point was observed in the modified cement soil mixture. As the amplitude increased, the cumulative plastic strain of the modified cement soil mixture showed a significant increase. After 20,000 uniaxial cycles at a peak strength of 16 kN, the plastic strain remained around 0.15% during the second stage of axial stabilization, with the specimen retaining its integrity without failure. Consequently, compared to unmodified cement soil, the modified nano-SiO2 sand composite cement soil exhibits a significant reduction in cumulative plastic strain, markedly enhanced resistance to uniaxial cyclic loading, and substantially extended specimen lifespan.

3.3.3. Effect of Frequency on Cumulative Strain in Soft Soil Cement Mixtures

Figure 17 shows the relationship between axial strain and the logarithm of cycle count for unmodified soft soil cement subjected to identical cyclic loading (1 to 2 kN) at different frequencies (1 Hz, 2 Hz, 3 Hz, and 4 Hz). Figure 17a–d respectively display the cumulative strain versus cycle count plots for modified cement soil mixtures at different frequencies. Test results indicate that plastic strain decreases relatively with increasing vibration frequency. Figure 17a shows that at 1 Hz, plastic strain increases significantly around 5000 uniaxial cycles, rising from 0.4% to 0.8%. Compared to frequencies of 2 Hz, 3 Hz, and 4 Hz (shown in Figure 17b–d), the plastic strain at 1 Hz exhibits the maximum dynamic strain.
The axial dynamic strain of nano-SiO2 and sand composite-modified cemented soft soil under cyclic loading at different frequencies is shown in Figure 18. Figure 18A–D correspond to peak loading strengths of 2 kN at frequencies of 1 Hz, 2 Hz, 3 Hz, and 4 Hz, respectively. In Figure 18A, the cyclic plastic strain of the modified cemented soil increases from approximately 0.1% to 0.23% after 20,000 cycles. As the loading frequency increases, the plastic strain of the modified cement-stabilized soil shows a decreasing trend. The modified cement-stabilized soil exhibits identical test results to the unmodified cement-stabilized soil, with plastic strain decreasing as frequency increases. During the initial deformation stage of the cement-stabilized soil, the degree of consolidation deformation varies. With increasing frequency, the initial consolidation deformation first decreases and then increases. Simultaneously, the dynamic strain within a single cycle for cemented soil modified with nano-SiO2 and sand was lower than that of unmodified cement soil. This indicates that under identical loading conditions, the elastic deformation of modified cement soil specimens was smaller than that of unmodified specimens, demonstrating superior stiffness. The deformation resistance characteristics of cemented soil modified with nano-SiO2 and sand were significantly enhanced.

3.3.4. Effect of Frequency on Cumulative Strain in Clay-Cemented Soil

The relationship between axial strain and the logarithm of cyclic load cycles (1–4 kN) at different frequencies (1 Hz, 2 Hz, 3 Hz, and 4 Hz) for unmodified cement-treated soil and modified cement-treated soil (clay) is shown in Figure 19. Figure 19a–d represent unmodified cement-treated soil, while Figure 19A–D represent modified cement-treated soil. Test results indicate that peak strain decreases relatively with increasing frequency. After 20,000 cycles of loading, the axial peak strains in Figure 19a–d reached approximately 0.21%, 0.2%, 0.24%, and 0.2%, respectively, during the stable deformation stage. Overall, a decreasing trend was observed, with plastic strain diminishing as frequency increased.
Compared to unmodified cement-treated soil, the modified cement-treated soils in Figure 19A–D exhibited significantly reduced peak strains. After 20,000 cycles at 1 Hz, the peak axial strain remained around 0.25%. Plastic strain decreases with increasing frequency, while single-cycle strain significantly reduces. This indicates that under identical loading conditions, modified cement-treated soil exhibits enhanced deformation resistance, with plastic deformation lower than that of unmodified cement-treated soil specimens. The stiffness of the specimens outperforms that of unmodified cement-treated soil. The service life of cemented soil modified with nano-SiO2 and sand is significantly extended.
There are a large number of noise values in the data of this section, which is caused by the testing equipment.

3.4. Relationship Between Accumulated Plastic Strain and Number of Cycles

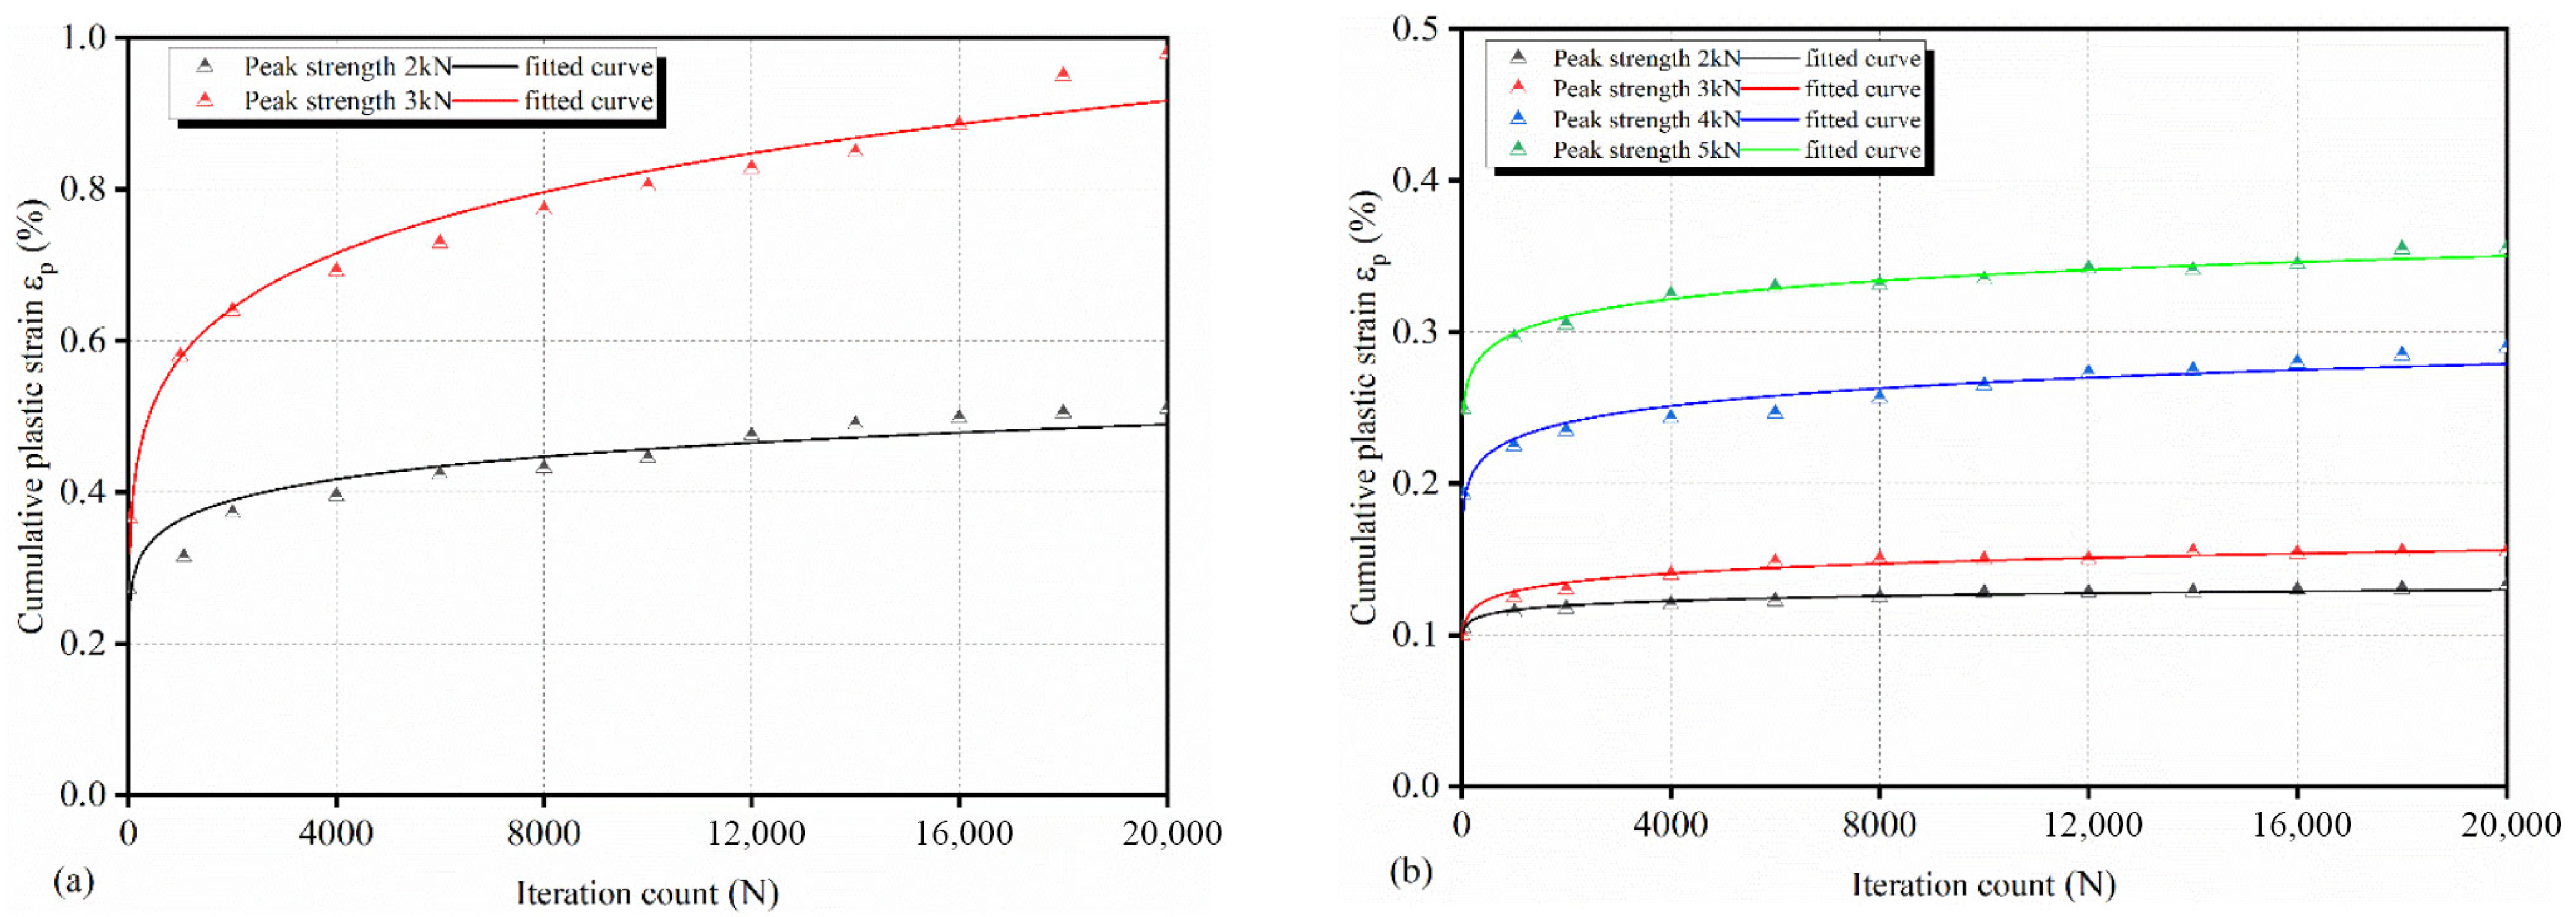
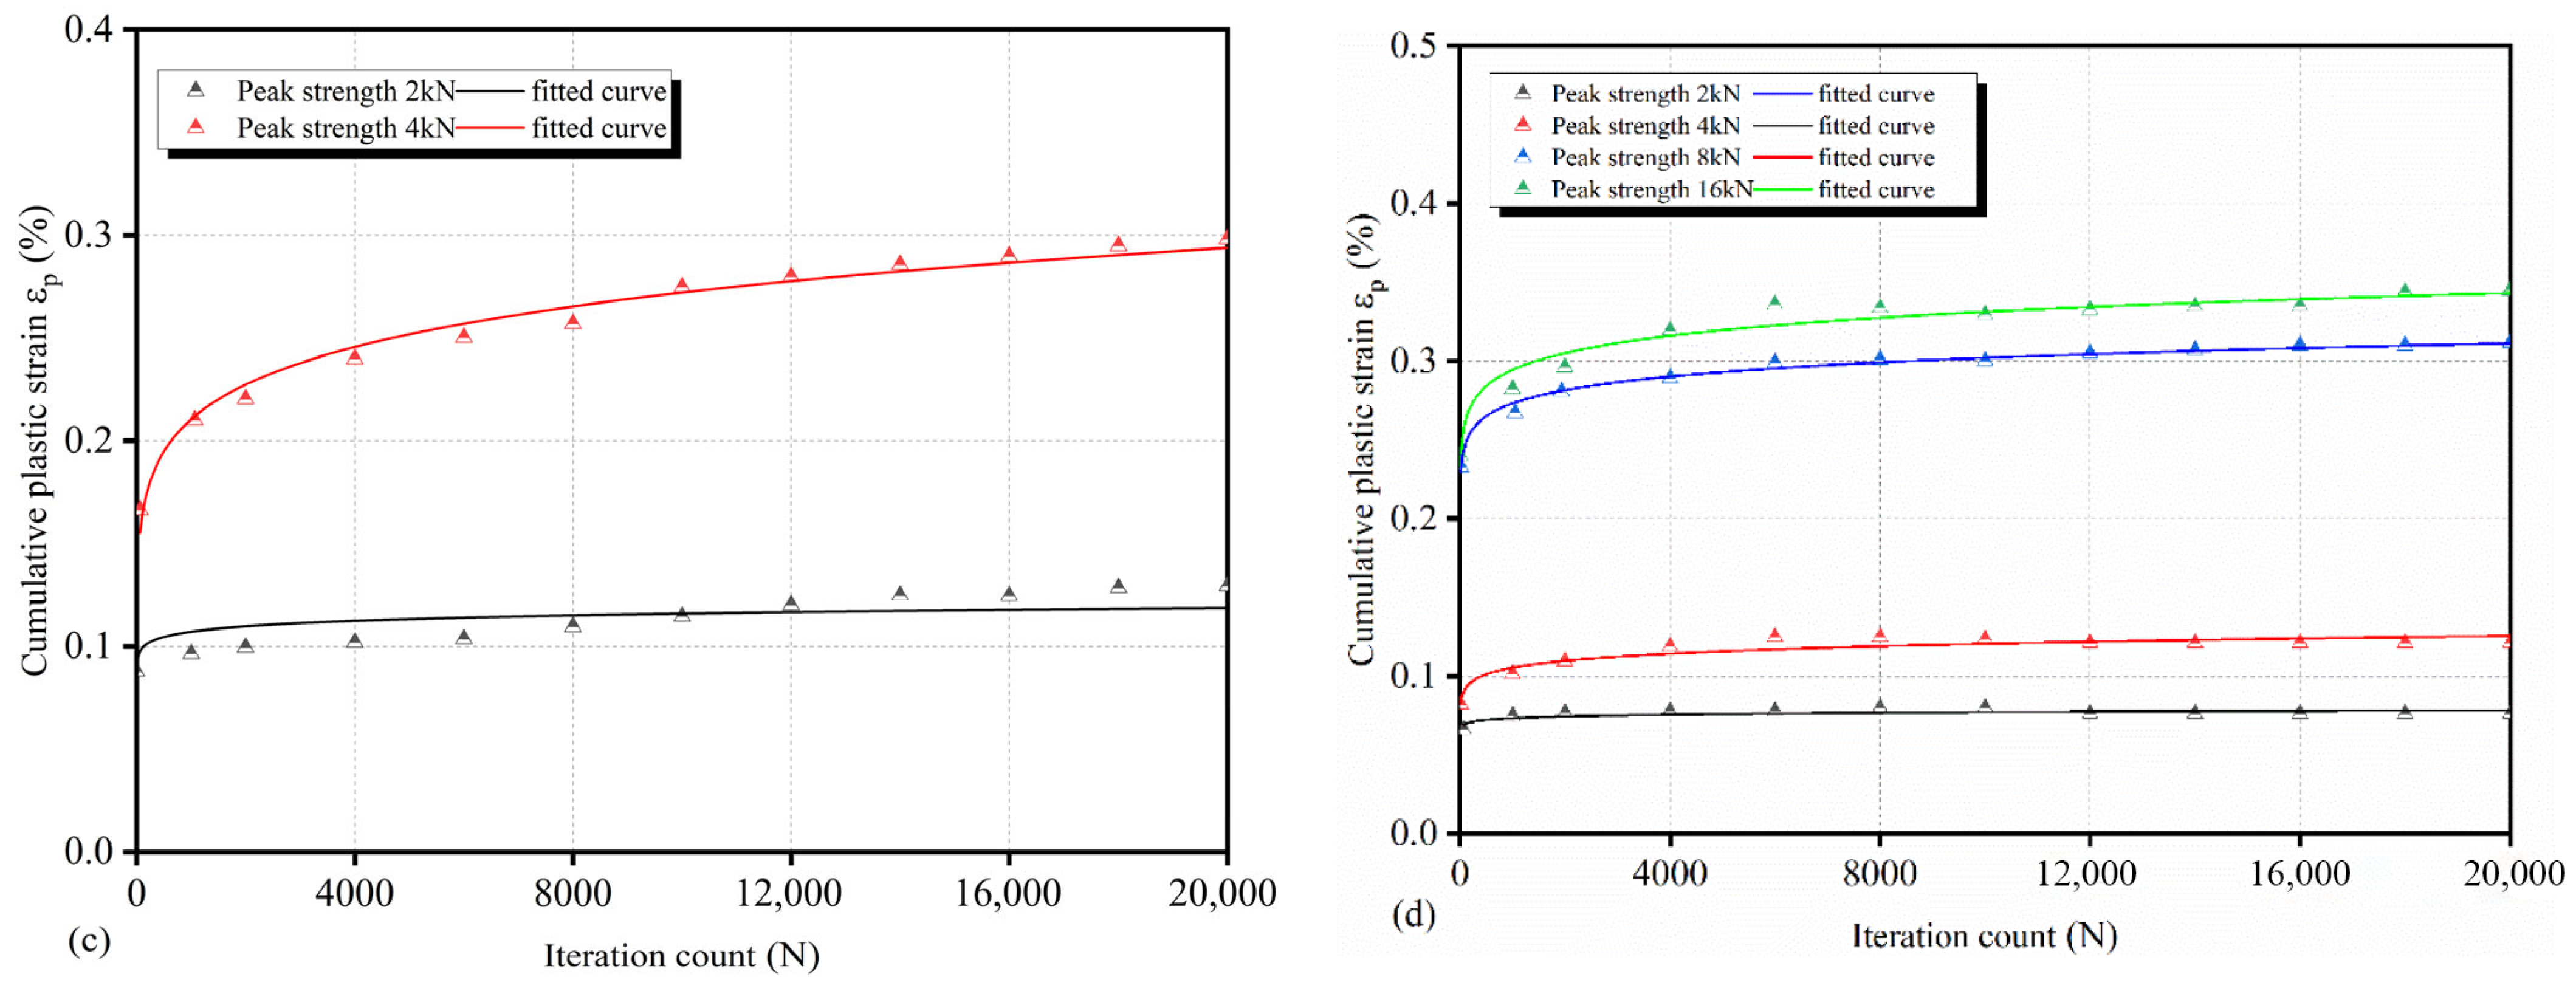
The cumulative deformation model provides a theoretical basis for evaluating the impact of long-term cyclic loading on subgrade dynamic stability and settlement behavior. Numerous empirical models have been developed to predict the cumulative plastic deformation of soils under cyclic loading. These models are particularly applicable to conditions where specimens exhibit rapid accumulation of plastic strain under large amplitude loading. The model proposed by Monismith [38] for the relationship between the cumulative plastic strain εp and the number of cycles N is the most commonly used, and is the most widely adopted, as shown in Equation (3).
ε p = aN b
a: Experience coefficient, which reflects the initial plastic strain level of the material under the first loading condition. b: The plastic strain growth index describes the rate at which plastic strain increases with the number of loading cycles.
Cumulative plastic strain typically exhibits three evolutionary patterns under cyclic loading: “stabilized type”, “critical type”, and “failure type”. Among the various empirical models, the Monismith model is one of the most commonly used. It adopts an exponential form, effectively capturing the rapid increase in cumulative plastic strain under high-amplitude loading conditions.
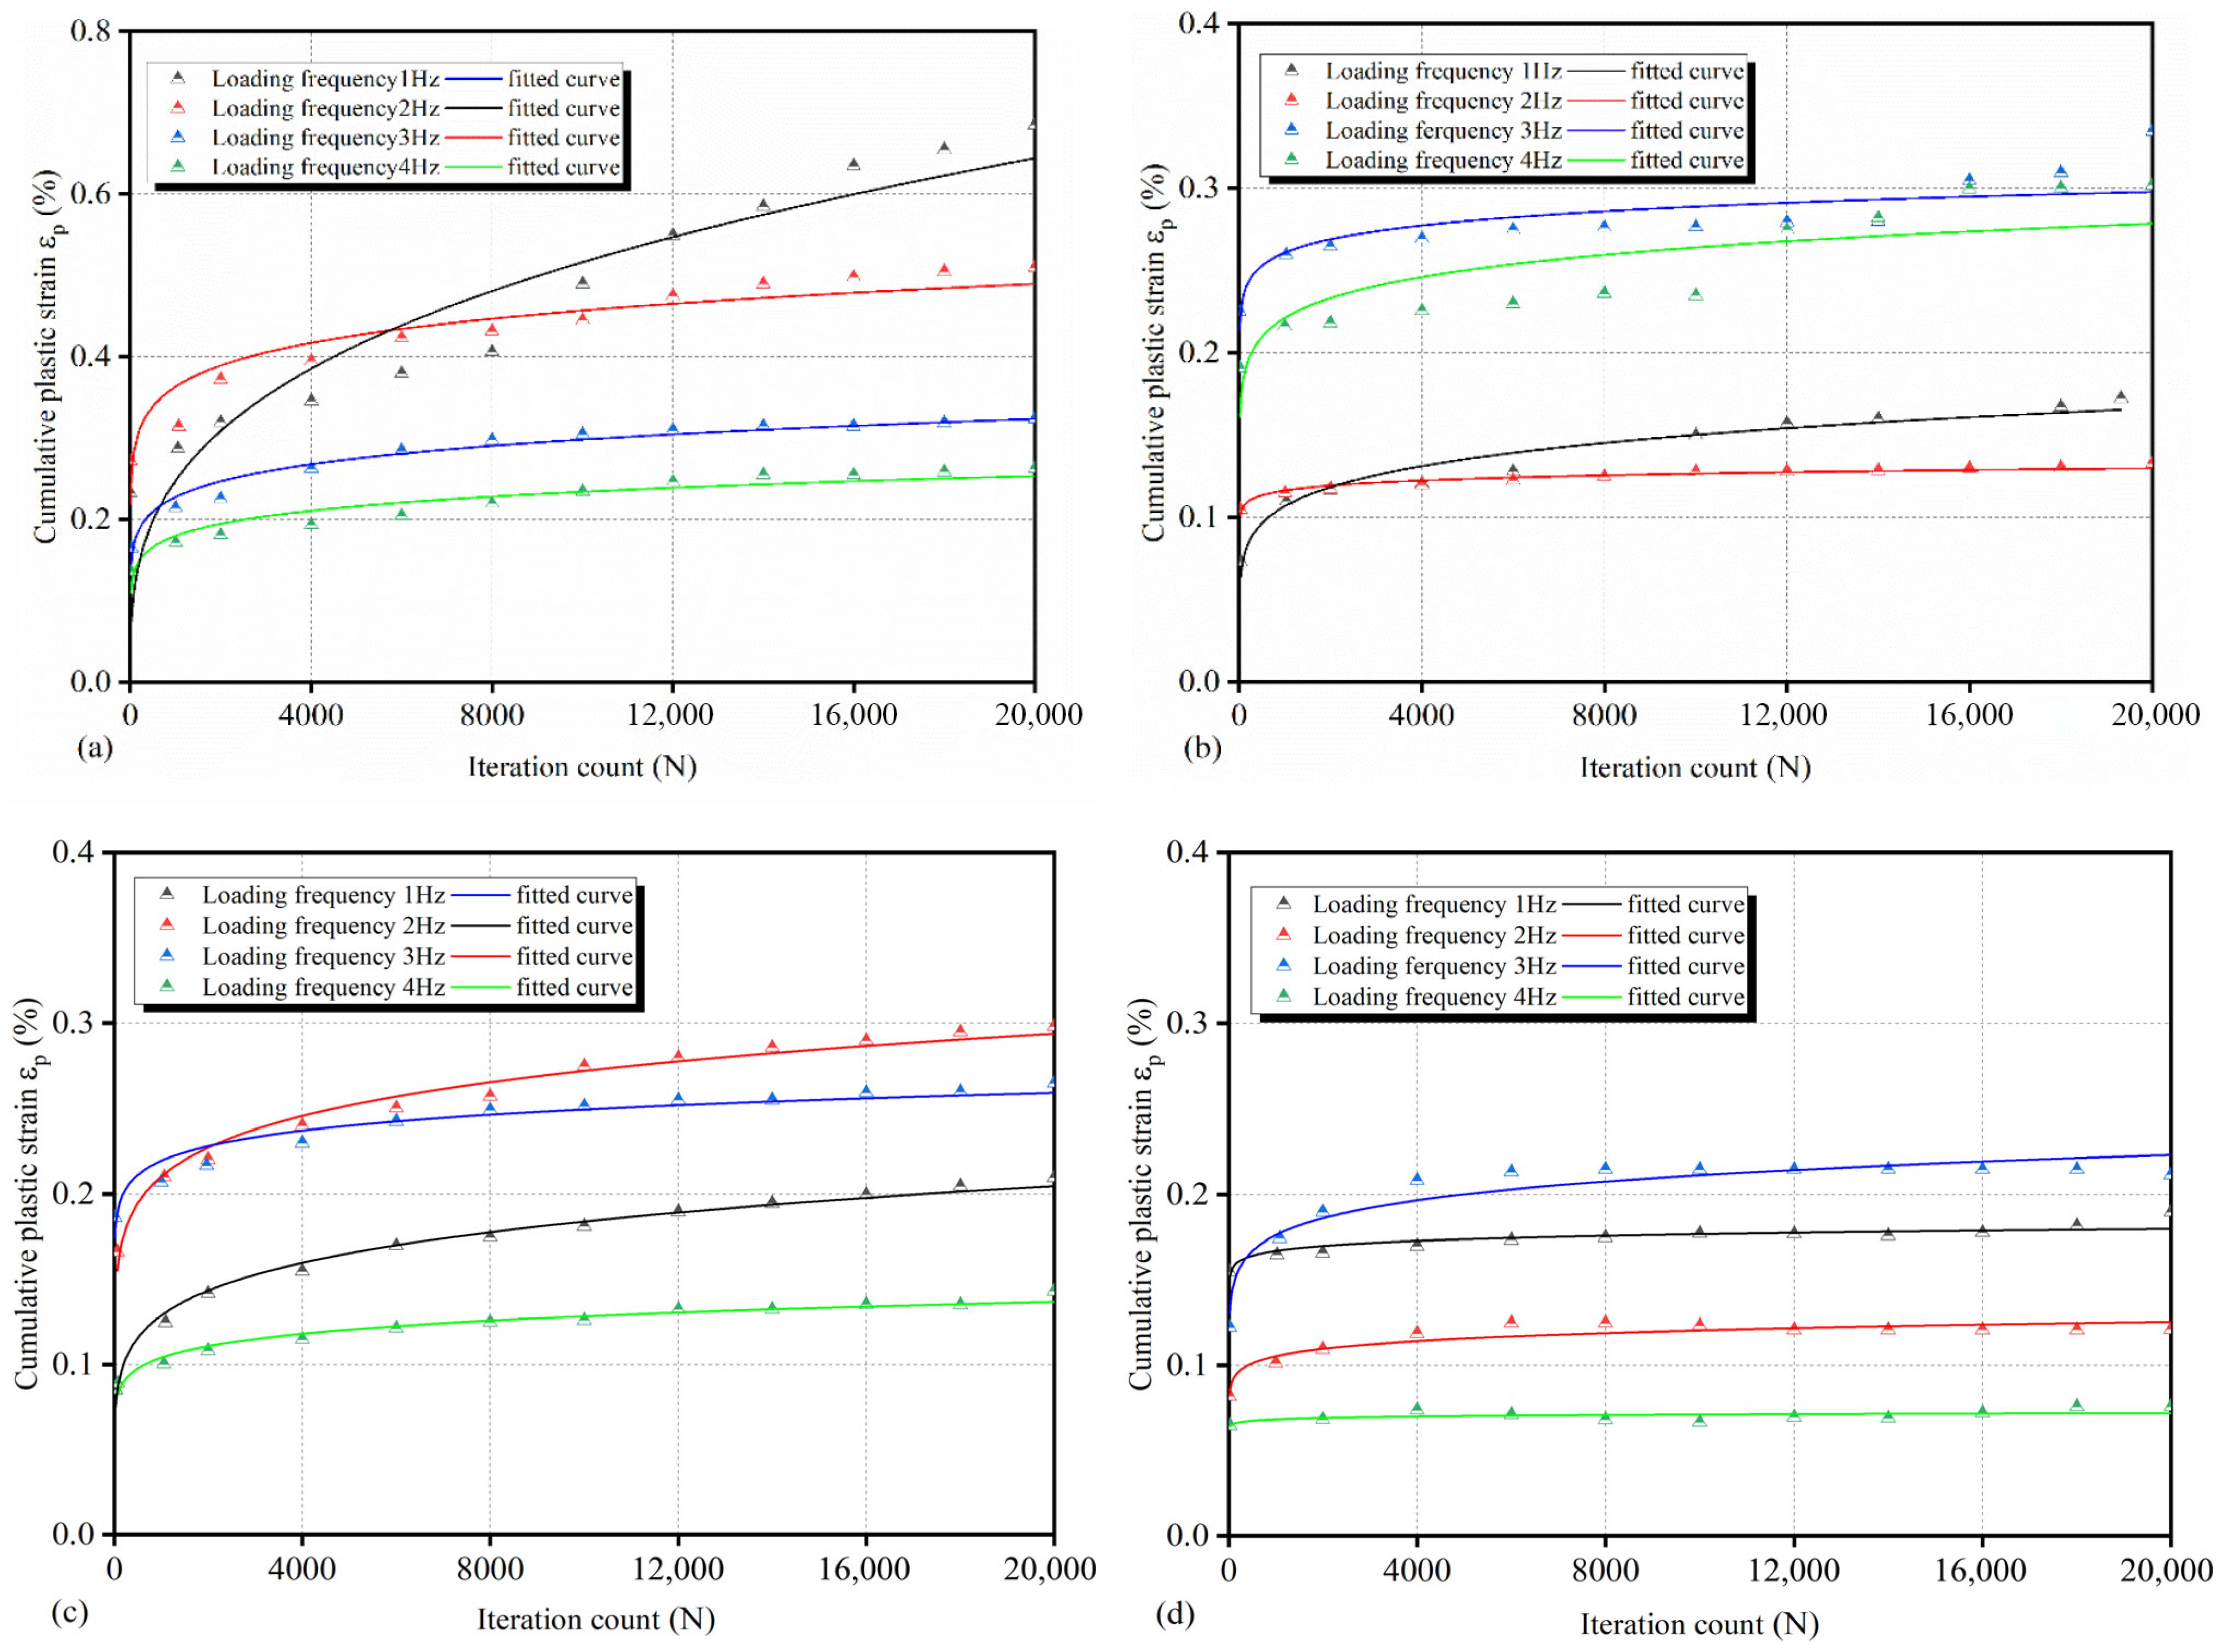
This illustrates the effect of different loading frequencies on accumulated plastic strain, as shown in Figure 20. As shown in Figure 20a, the unmodified soft soil–cemented soil exhibits larger plastic deformation, with a significant increase in accumulated plastic strain at 1 Hz. As the loading frequency increases, the cumulative plastic strain shows a decreasing trend, indicating a frequency-dependent deformation response. The curve fitting results suggest that not all modified specimens achieved strong correlation fits. Unmodified cemented soils generally displayed good fitting performance, while the fitting quality deteriorated for some modified soft soil–cemented soils at 3 Hz and 4 Hz, as well as for modified cohesive clay–cemented soil at 4 Hz. According to the experimental findings, nano-SiO2–sand composite cement-stabilized soils exhibited notable improvements in strength, stiffness, and resistance to deformation under dynamic loading. Therefore, under the peak loads of 2 kN for soft soil and 4 kN for cohesive clay with optimal composite dosage, the accumulated plastic deformation was significantly reduced. In addition, the tests indicate that higher loading frequencies result in lower energy dissipation within the soil matrix. This reduced energy absorption at higher frequencies is likely responsible for the weaker fitting performance observed at 3 Hz and 4 Hz, particularly in modified samples.
The results indicate that accumulated plastic strain increases with increasing loading intensity, as shown in Figure 21. Figure 21 presents the accumulated plastic strain of (a) unmodified soft soil–cemented soil, (b) optimally modified soft soil–cemented soil, (c) unmodified cohesive clay–cemented soil, and (d) optimally modified cohesive clay–cemented soil. Due to the sudden failure of some unmodified cement-stabilized soil specimens under higher peak stress levels, where strain underwent abrupt changes, these cases were not suitable for fitting using the proposed model and were therefore excluded from the curve fitting analysis. Moreover, composite-modified specimens consistently exhibit lower accumulated strain than their unmodified counterparts under the same loading conditions. In addition, cohesive clay–cemented soil shows significantly greater plastic strain than soft soil–cemented soil, highlighting the influence of soil type on deformation behavior.
The proposed model, Equation (3), provides a good fit for the accumulated plastic strain of optimally modified cement-stabilized soils under various loading amplitudes. For instance, the coefficient of determination (R2) exceeded 90% for most modified specimens, indicating a strong correlation. Specifically, the R2 values for unmodified soft soil at 2 kPa and modified cohesive clay at 2 kPa were above 85%, while the unmodified cohesive clay at 2 kPa and its modified counterpart showed R2 values exceeding 50%, reflecting relatively poor fitting accuracy under lower stress levels.
This trend can be attributed to the inherent stiffness of cement-stabilized soils. At lower peak stress levels, the plastic deformation is limited, leading to reduced model sensitivity and, consequently, weaker fitting performance.

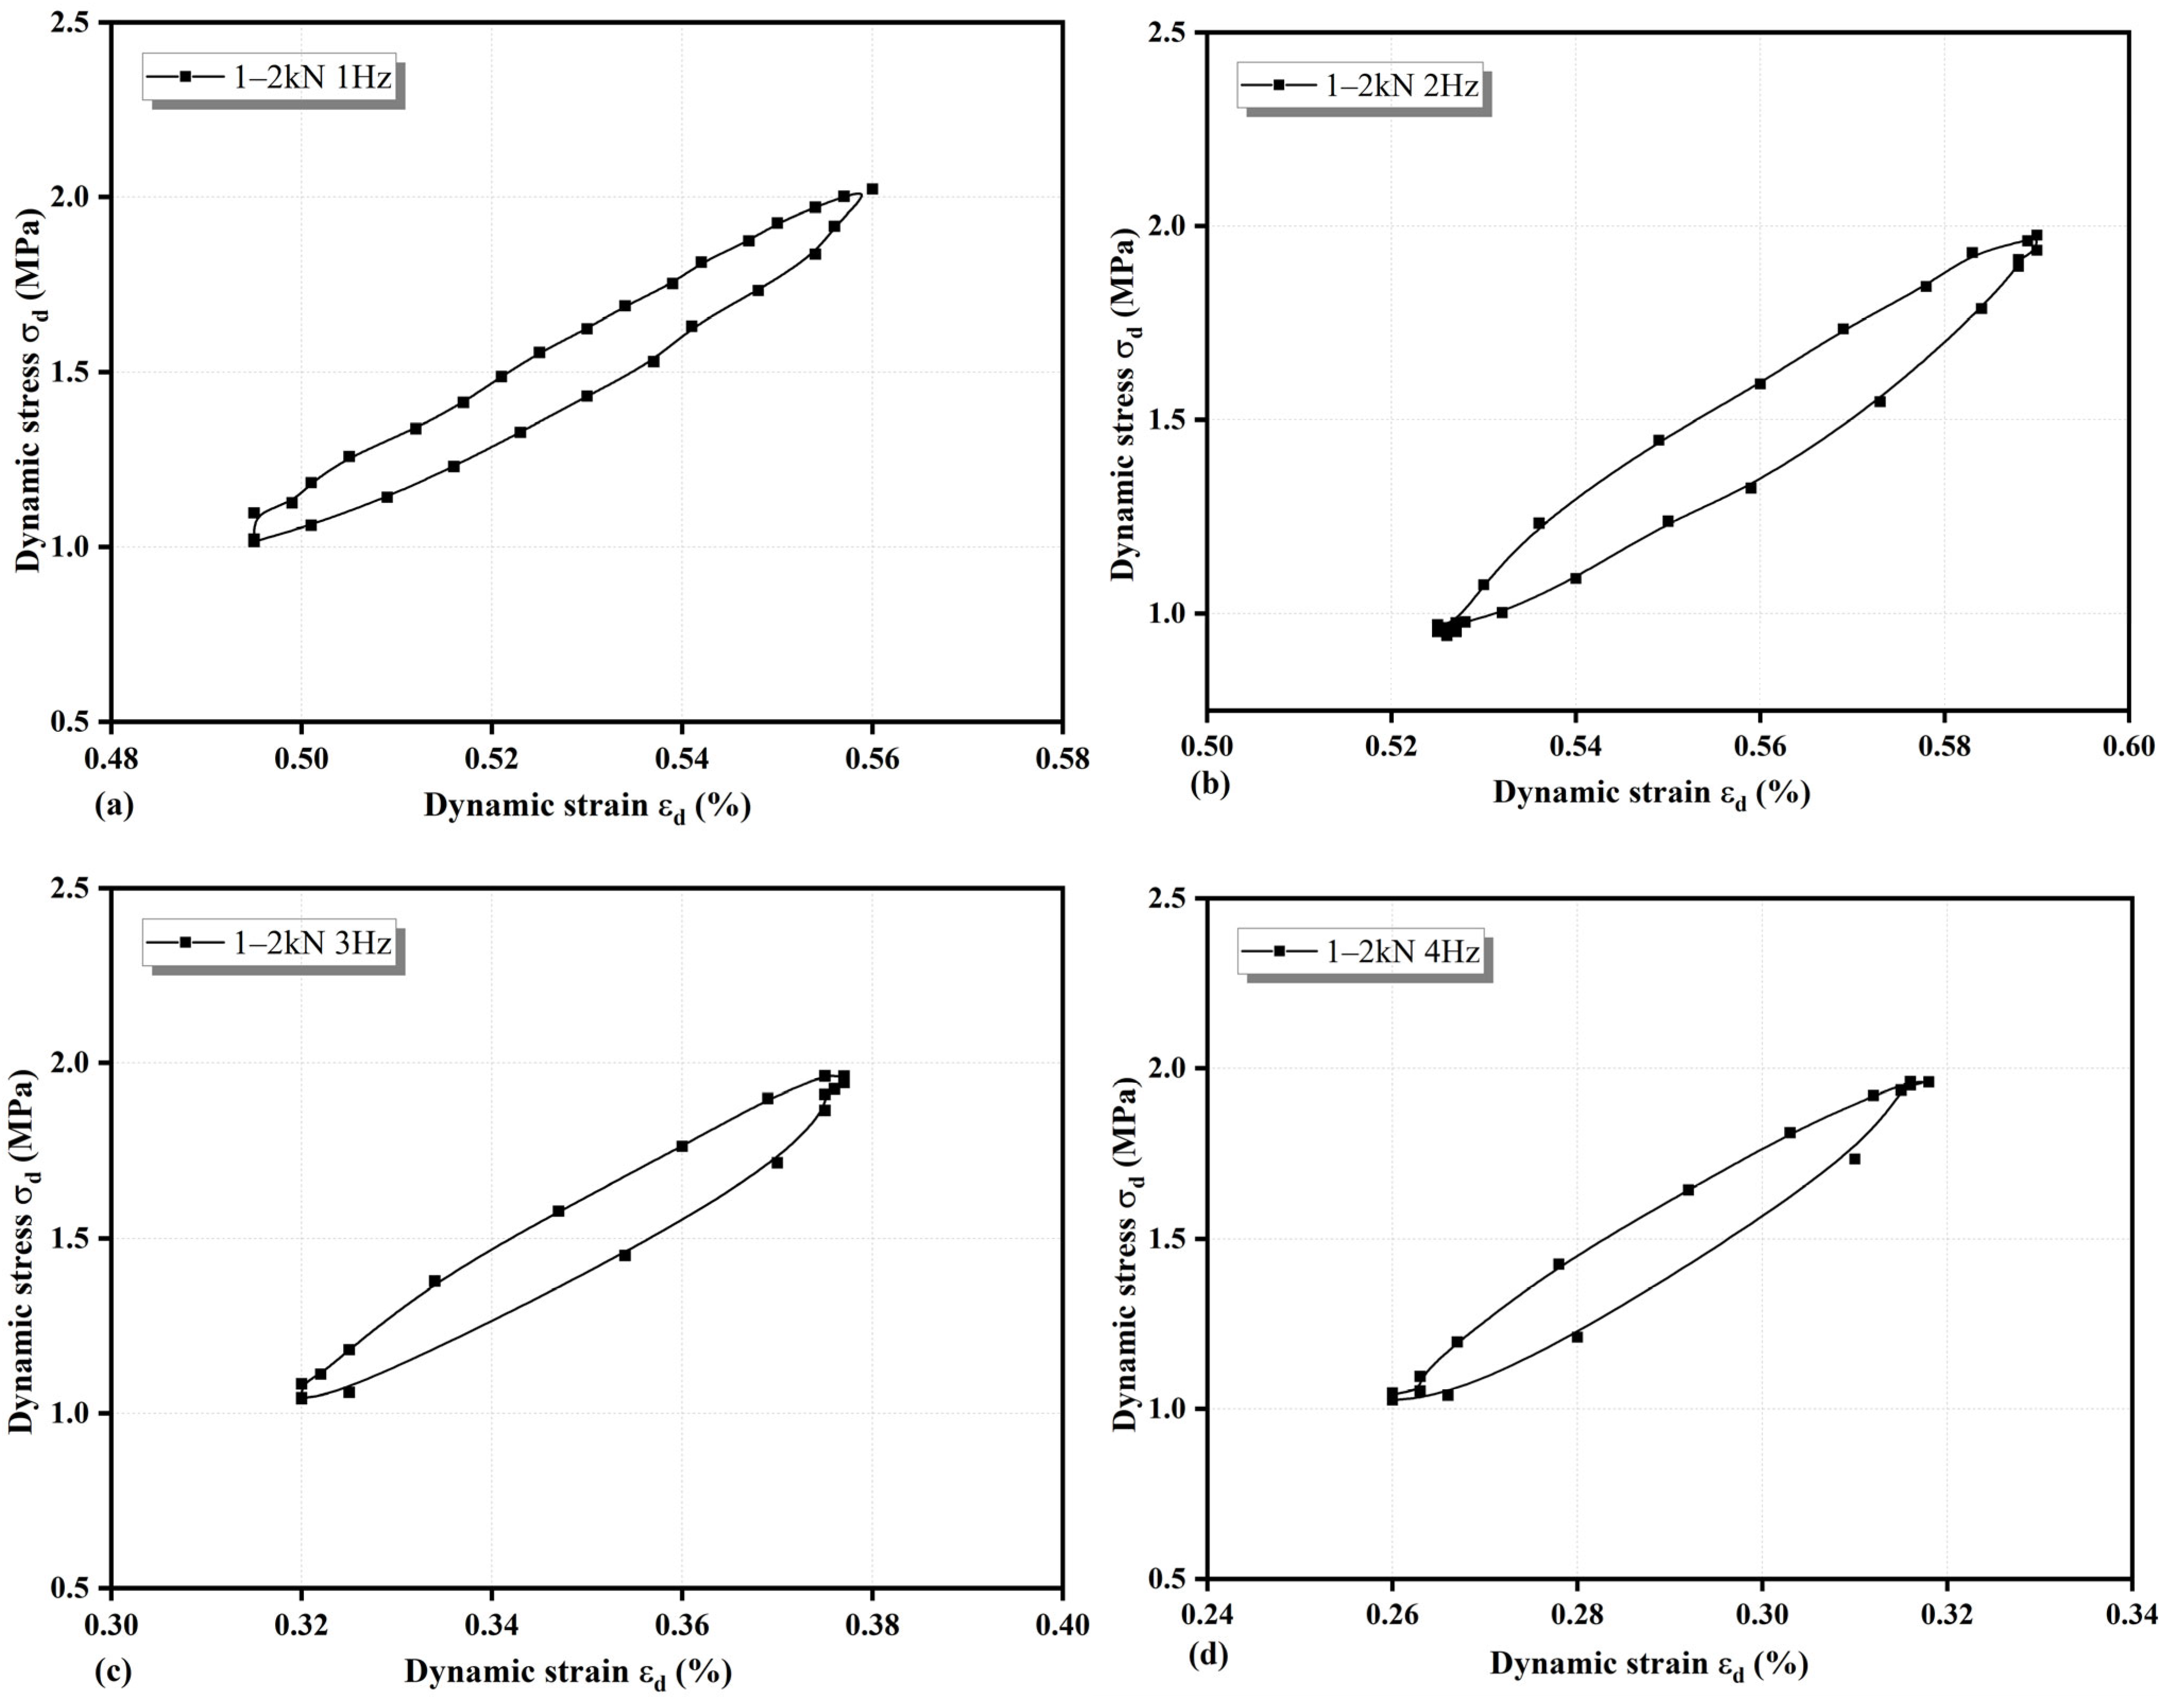
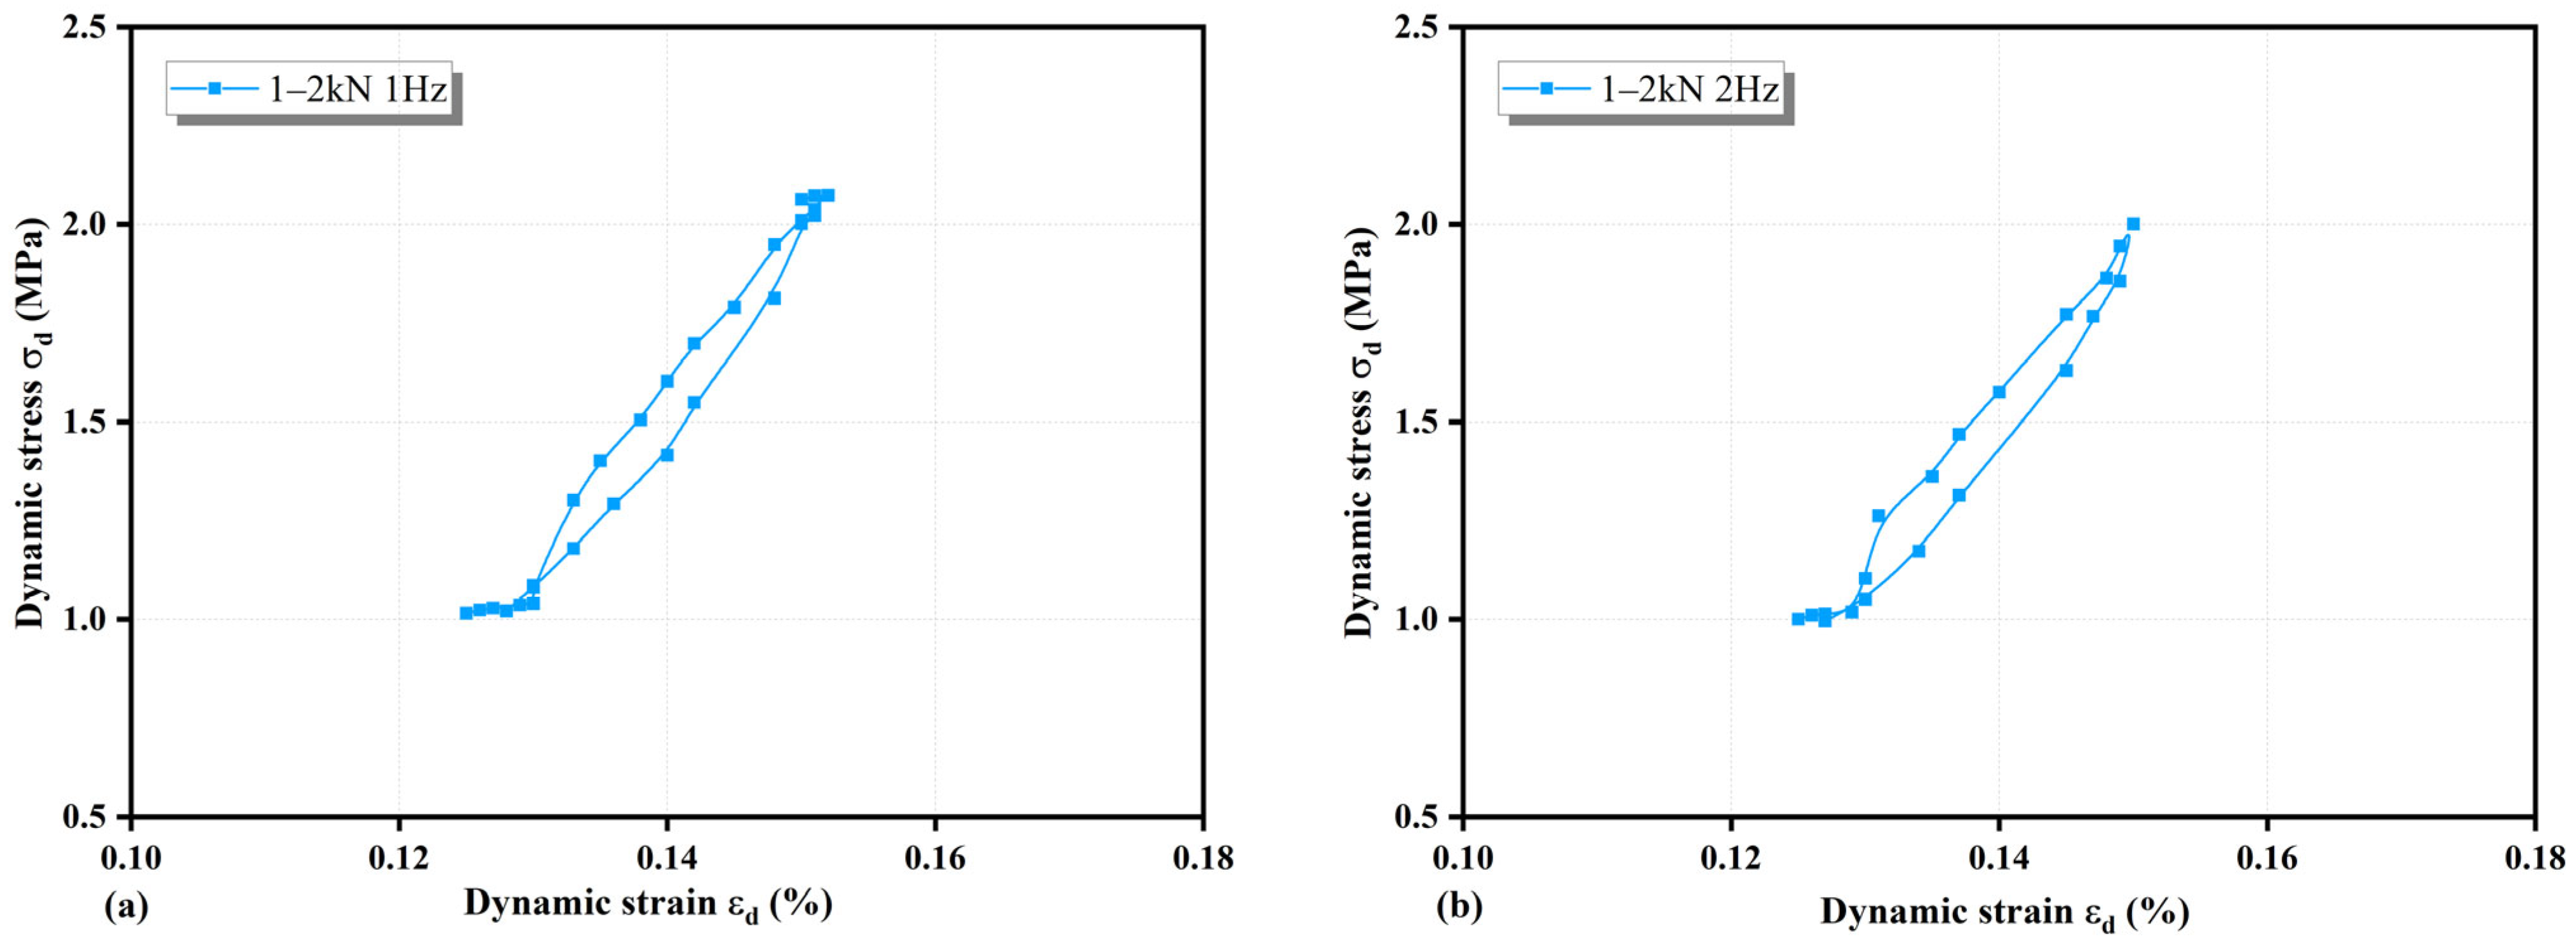
3.5. Analysis of Hysteresis Loop Morphology

Hysteresis curves reflect the deformation, stiffness, and energy dissipation characteristics of soil subjected to dynamic loading, serving as a critical basis for nonlinear dynamic response analysis. Specifically, the dispersion degree of hysteresis curves indicates the extent of microscopic damage in the soil, while the width and thickness characterize the influence of soil viscosity on the dynamic constitutive relationship. The fullness of the hysteresis curves reveals the soil’s seismic performance, energy dissipation capacity, and slip properties. Based on the above experiments, hysteresis loops at 10,000 loading cycles were selected. The initial stage of cyclic loading exhibited unstable sample conditions with large strains, while in the later stages, some samples approached critical failure points, making comparative analysis difficult; therefore, hysteresis curves at 10,000 cycles were selected for this study. As some samples failed during the initial stages of cyclic loading, no hysteresis curves are available for these specimens.
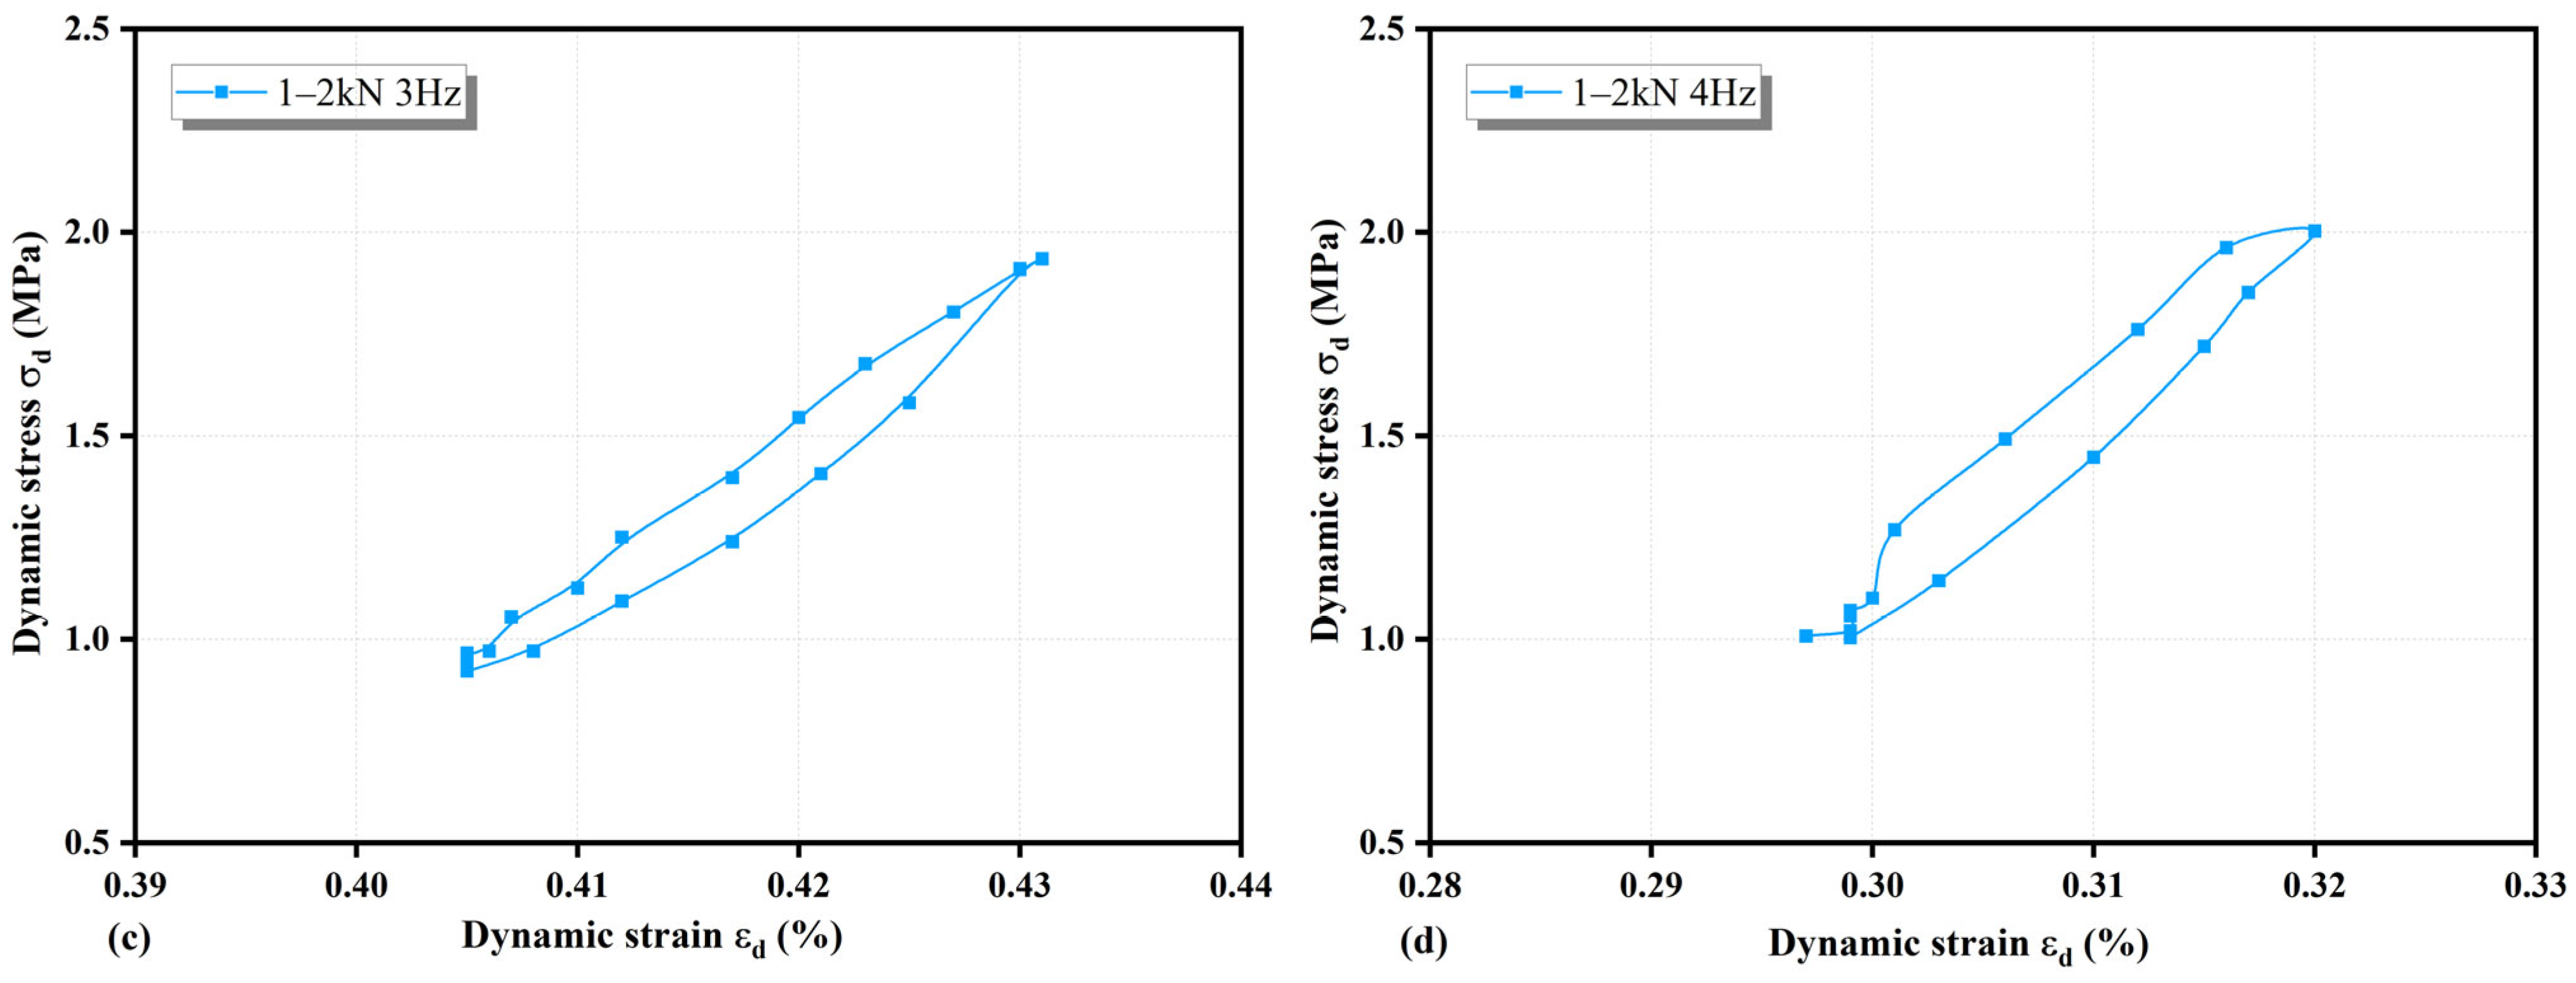
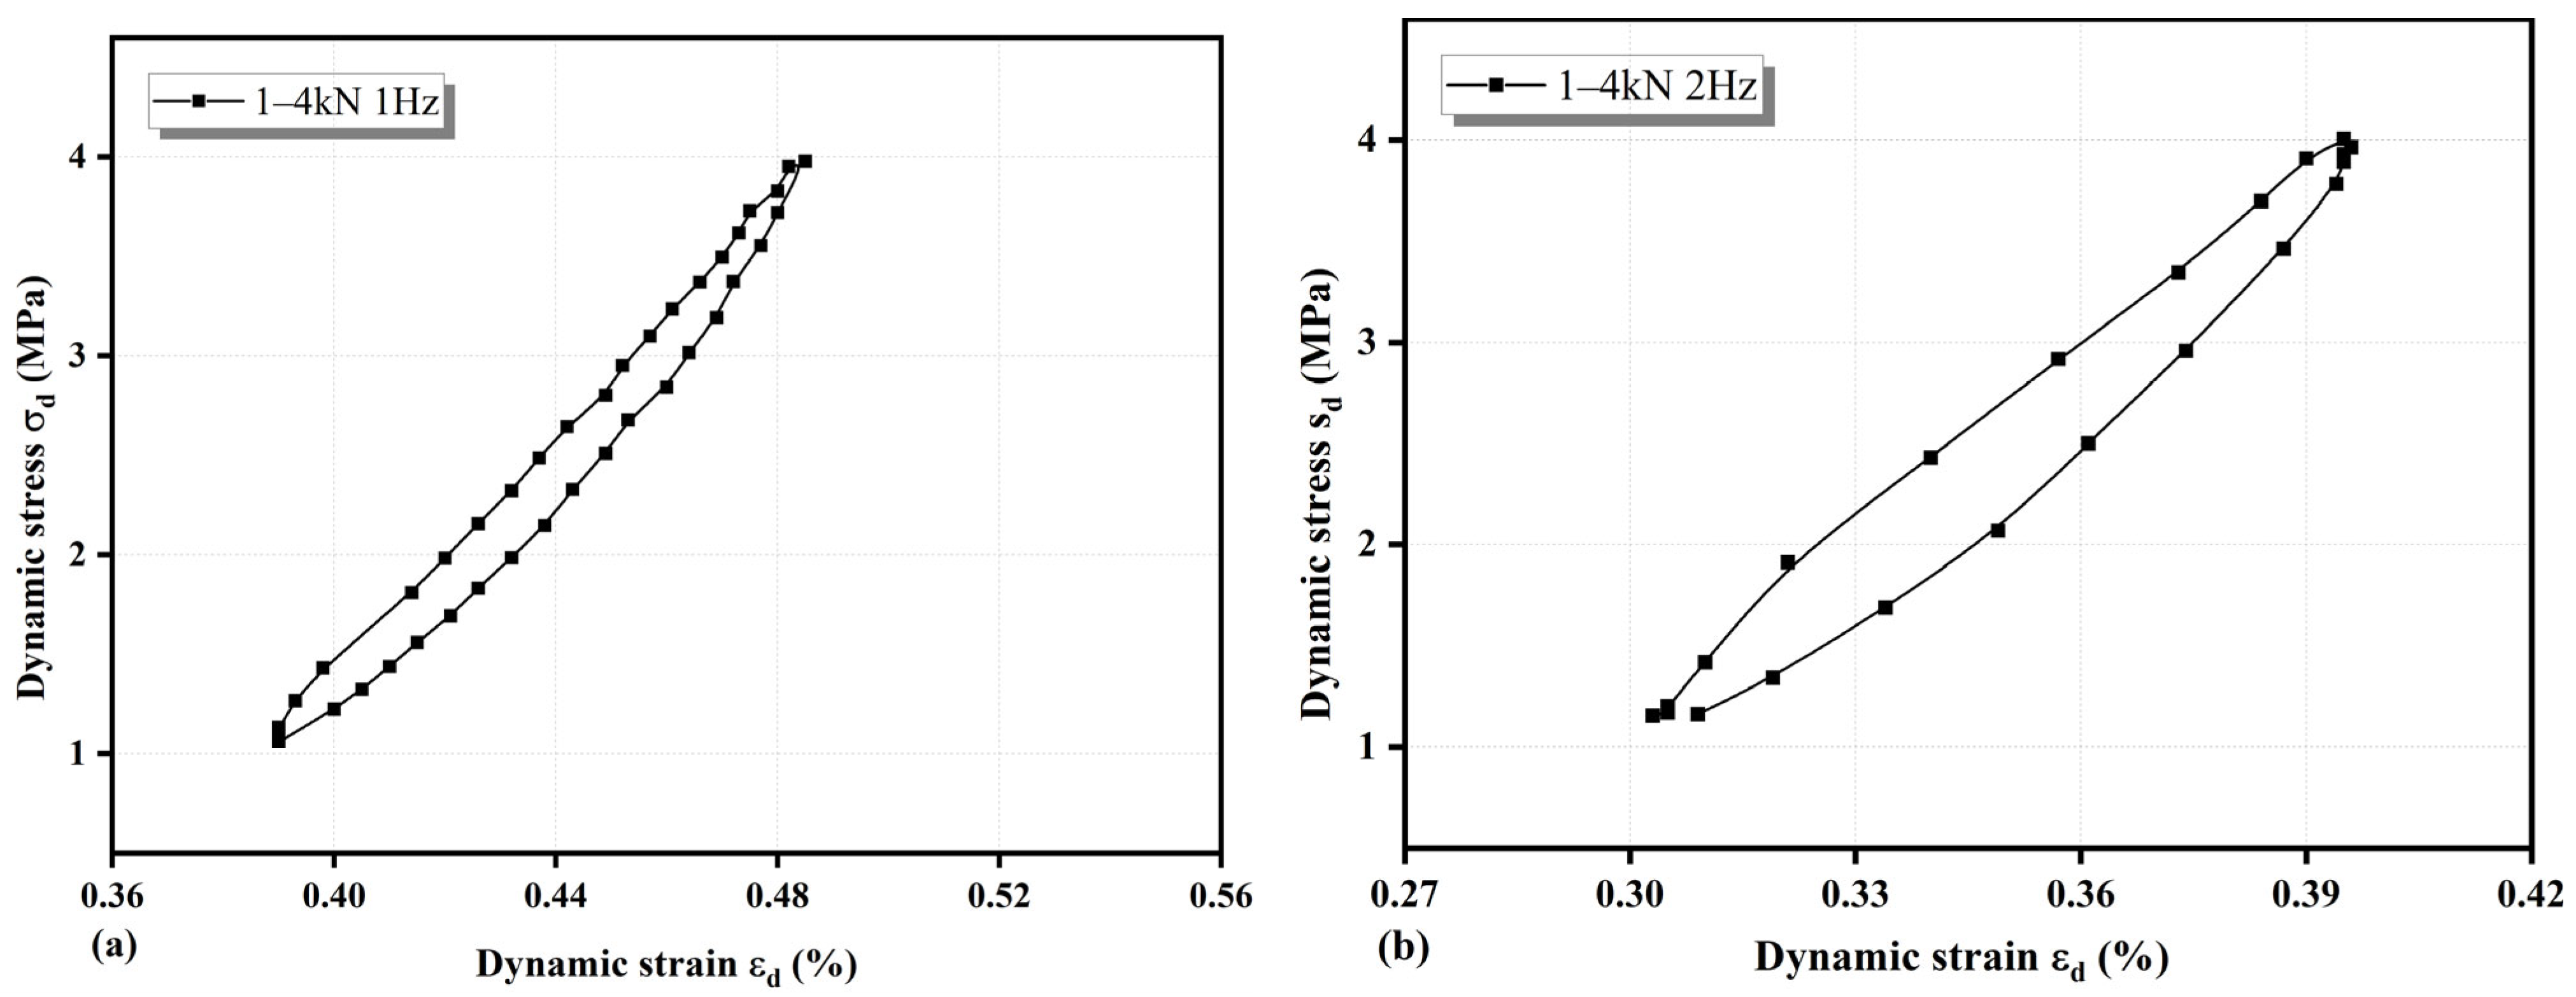
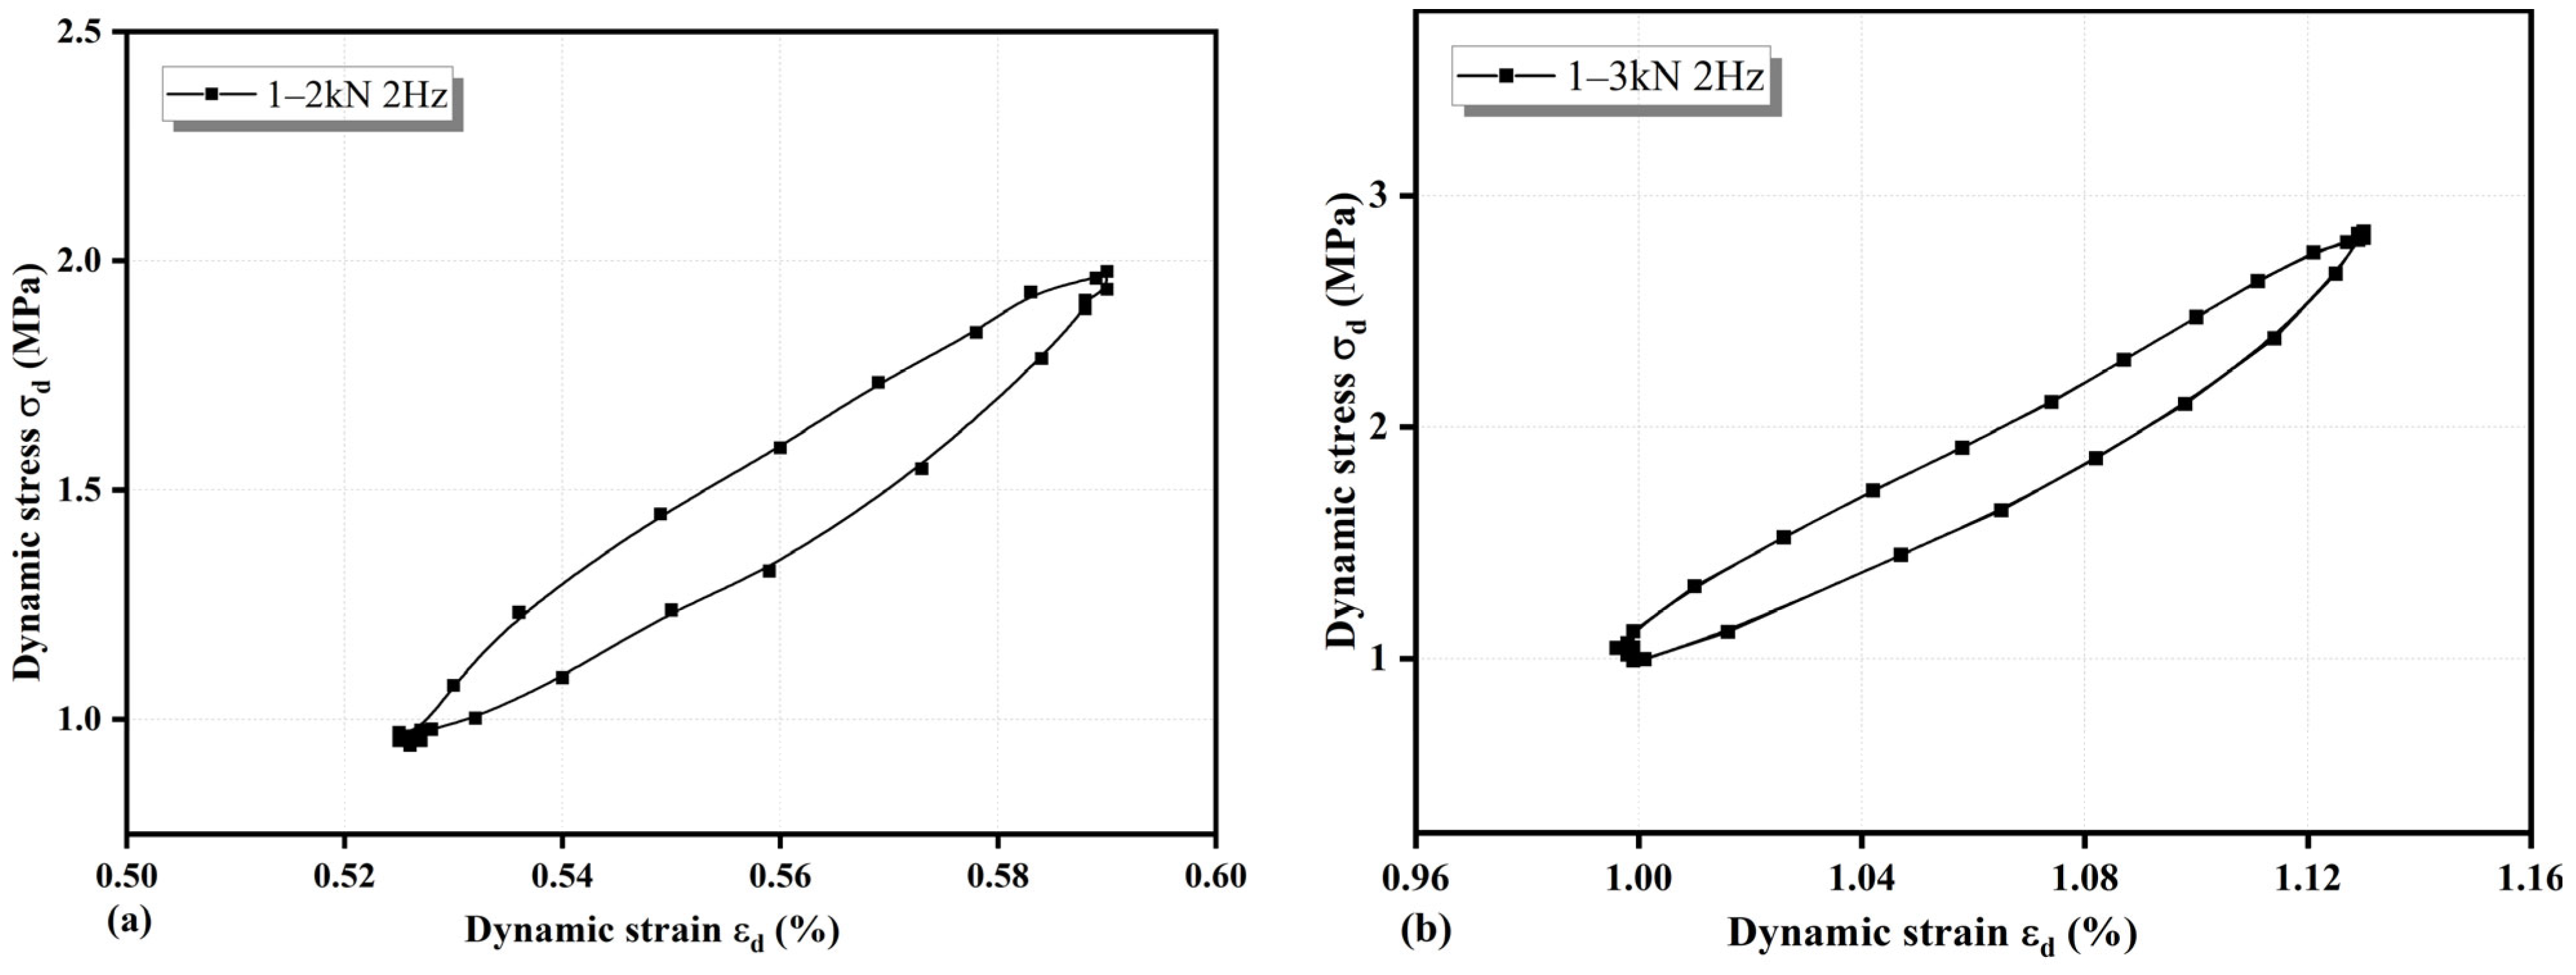
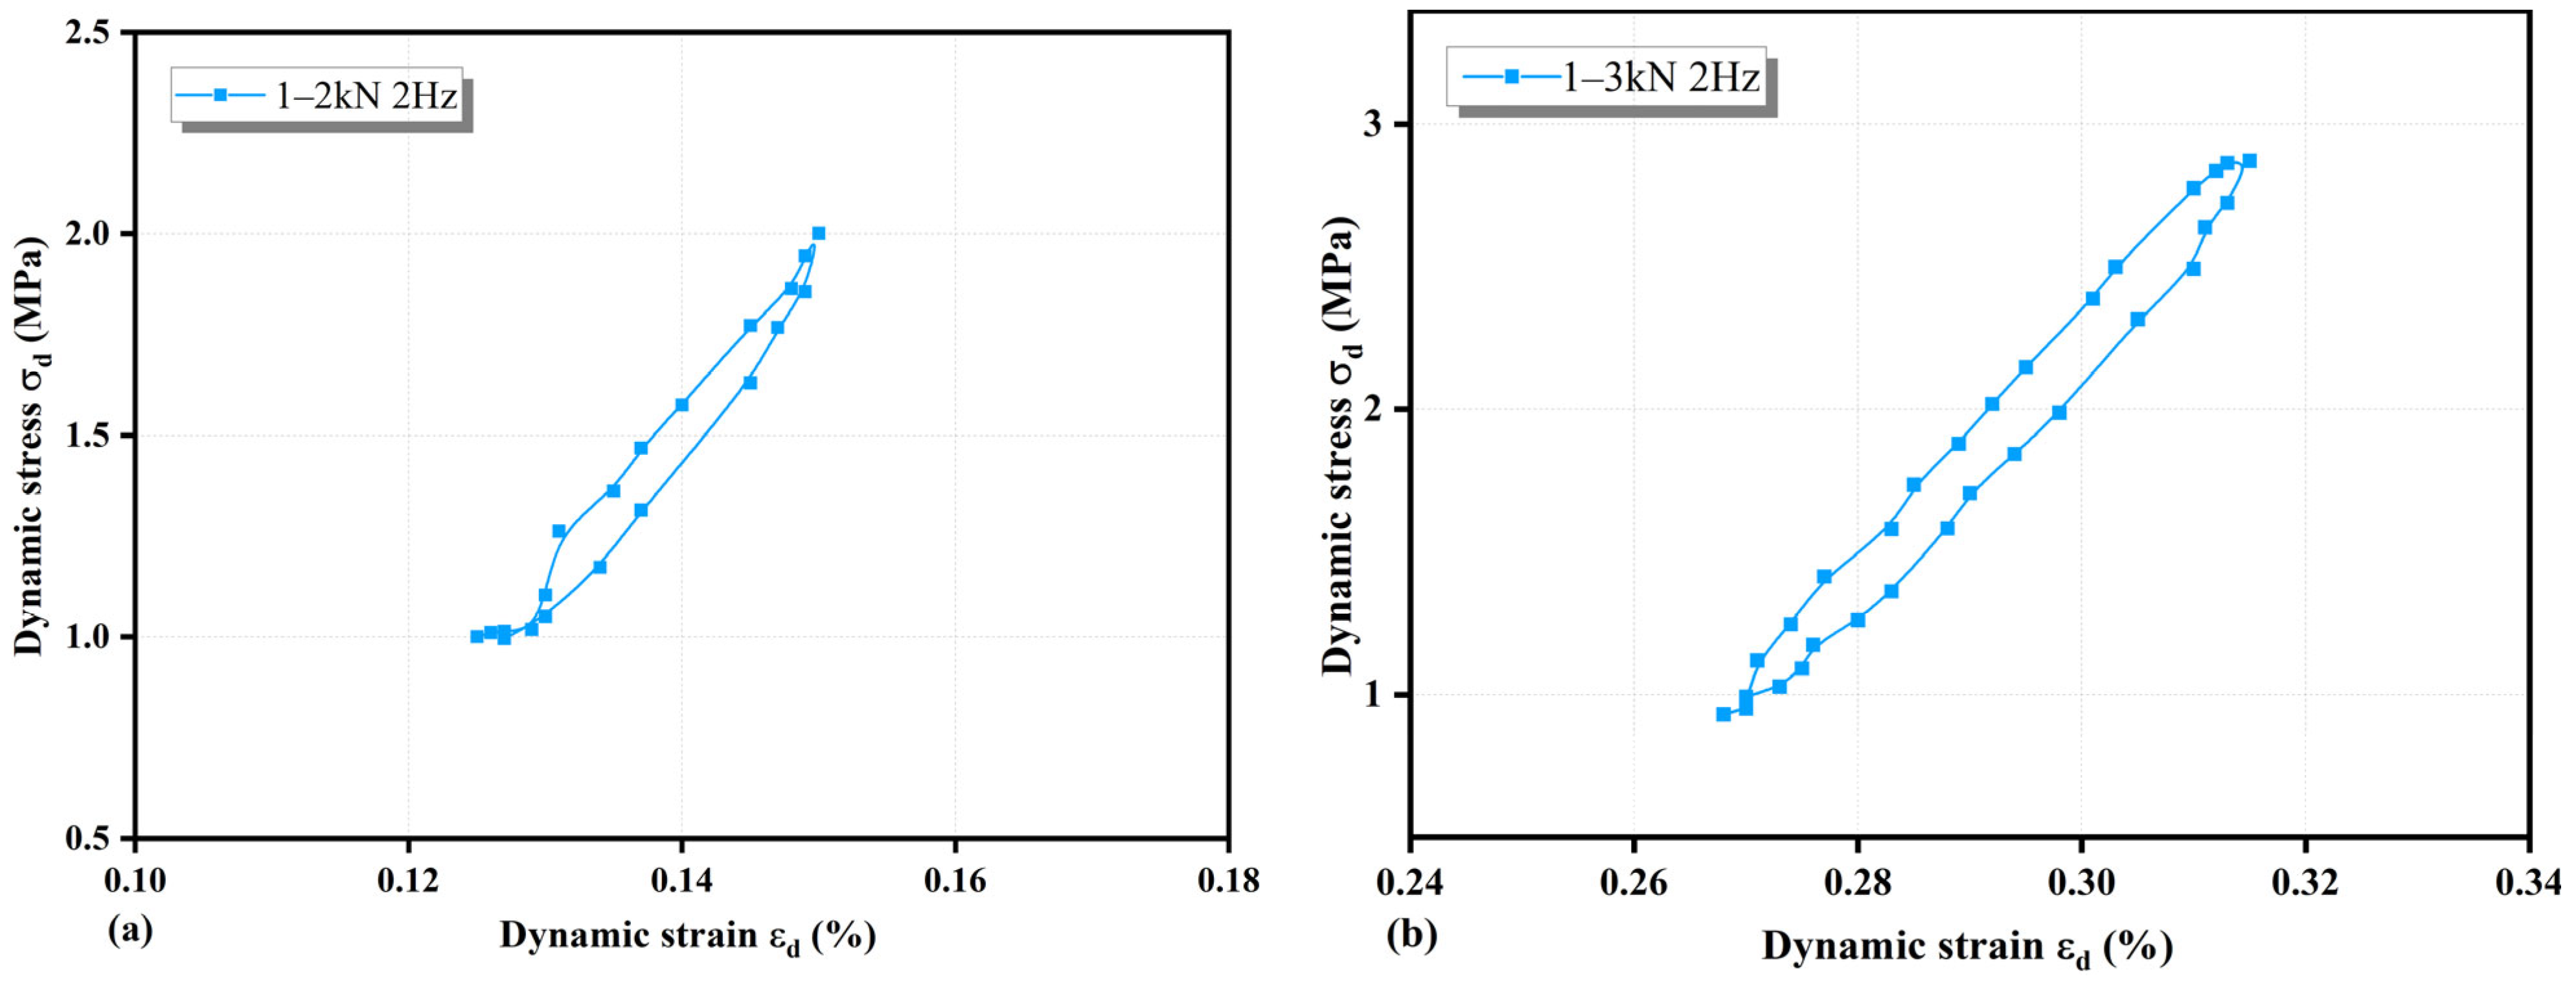
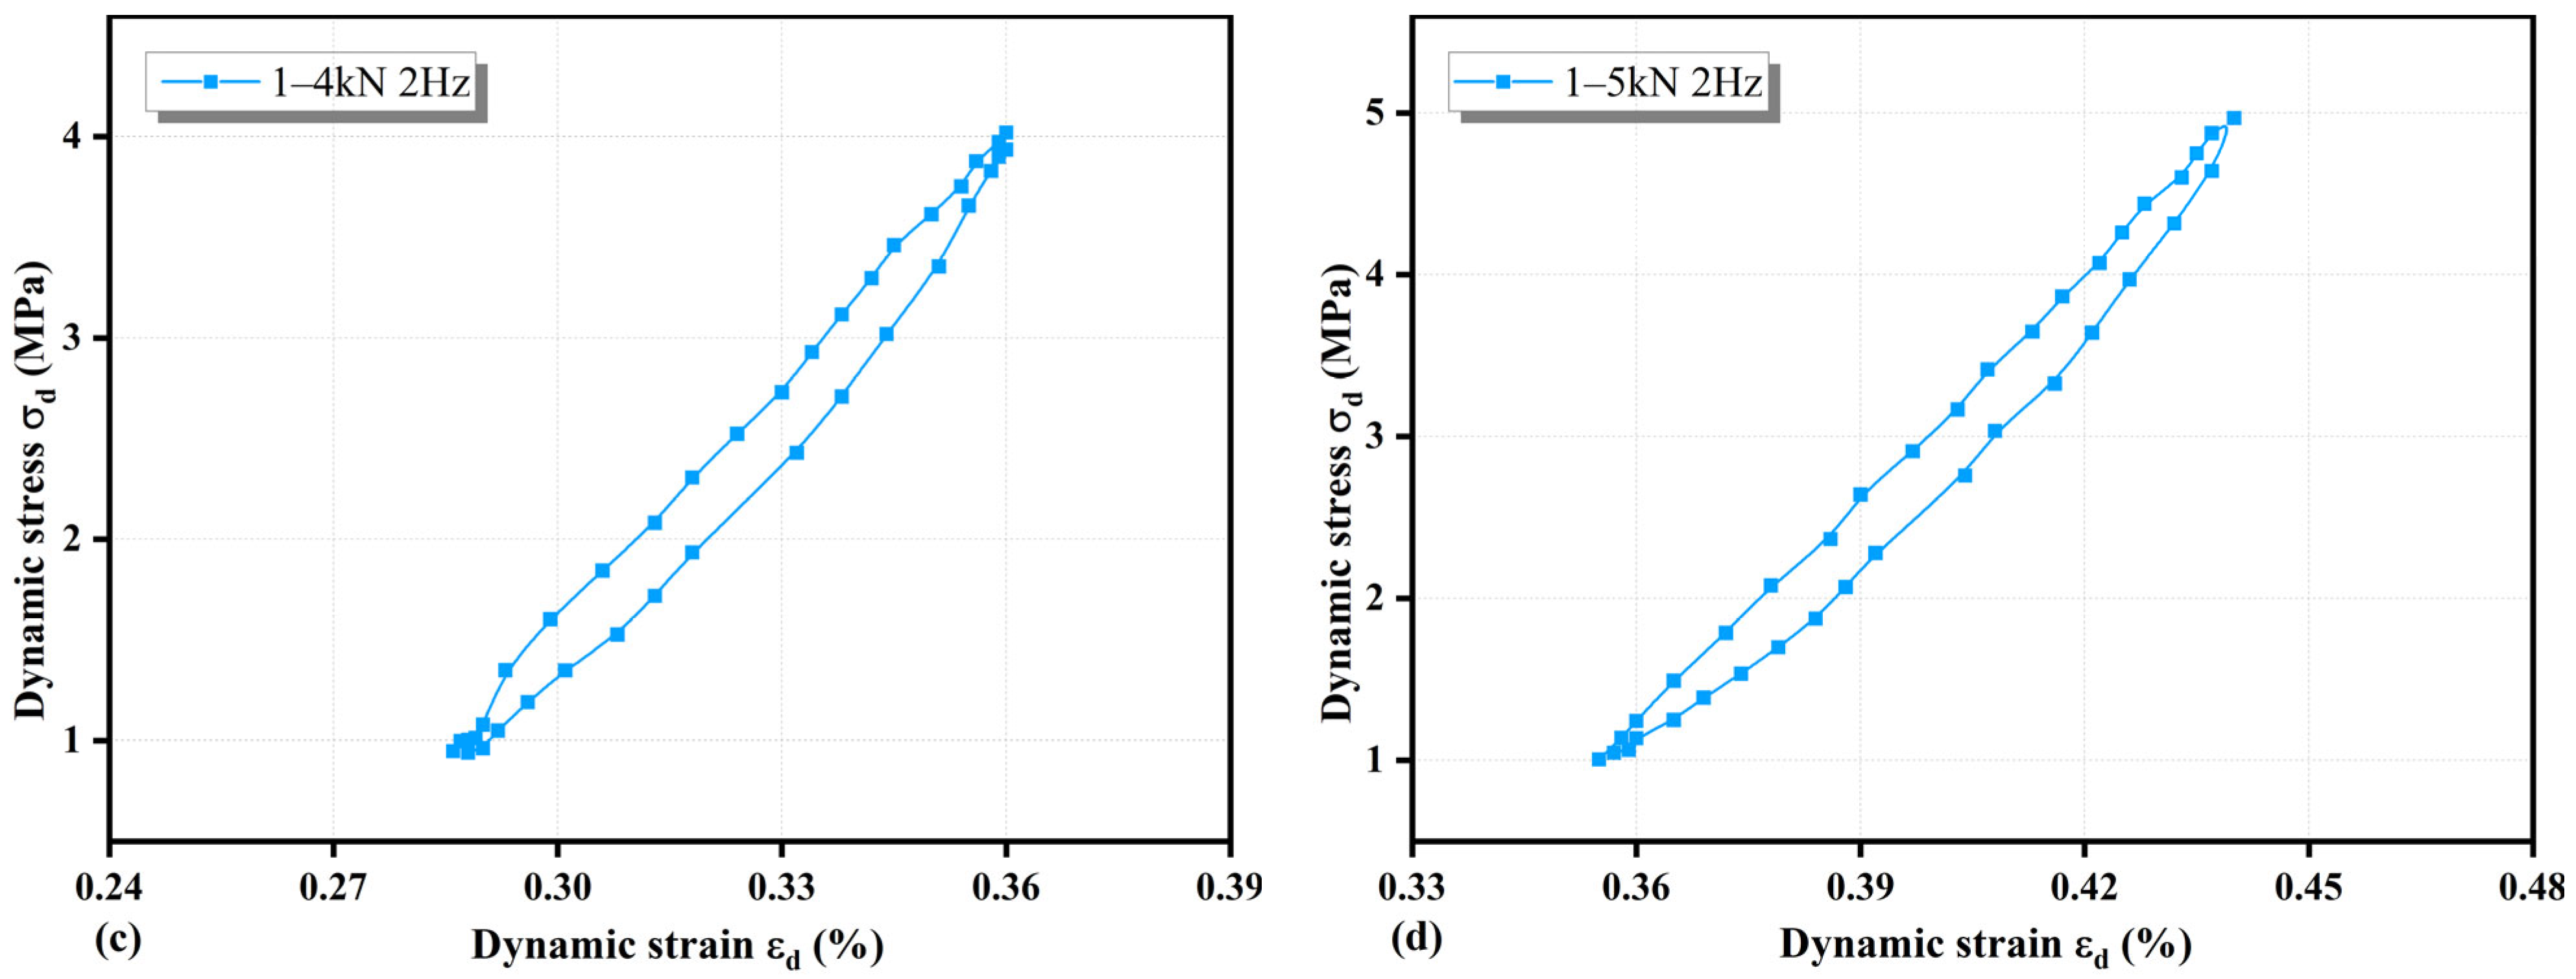
Soft soil cement and nano-SiO2–sand composite cemented soft soil specimens exhibit hysteresis loops under different loading frequencies (1 Hz, 2 Hz, 3 Hz, and 4 Hz) as shown in Figure 22 and Figure 23. The loading and unloading dynamic curves do not coincide, forming fully enclosed curve loops. The inclination of hysteresis loops for unimproved soft soil cement is greater than that of nano-SiO2–sand composite cemented soft soil. The unimproved soft soil cement exhibits fuller hysteresis loops with minimal morphological variation. As frequency increases, cumulative strain shows a decreasing trend. The dynamic curves of nano-SiO2–sand composite cemented soft soil display pointed tips at both ends of the approximately elliptical shape. Compared with unimproved soft soil cement, the curves are less smooth, indicating that during cyclic loading and unloading, the elastic strain response is rapid, with elastic deformation predominating and reducing plastic deformation. In this experiment, frequency had a relatively minor effect on the strength of nano-SiO2-modified soil cement.
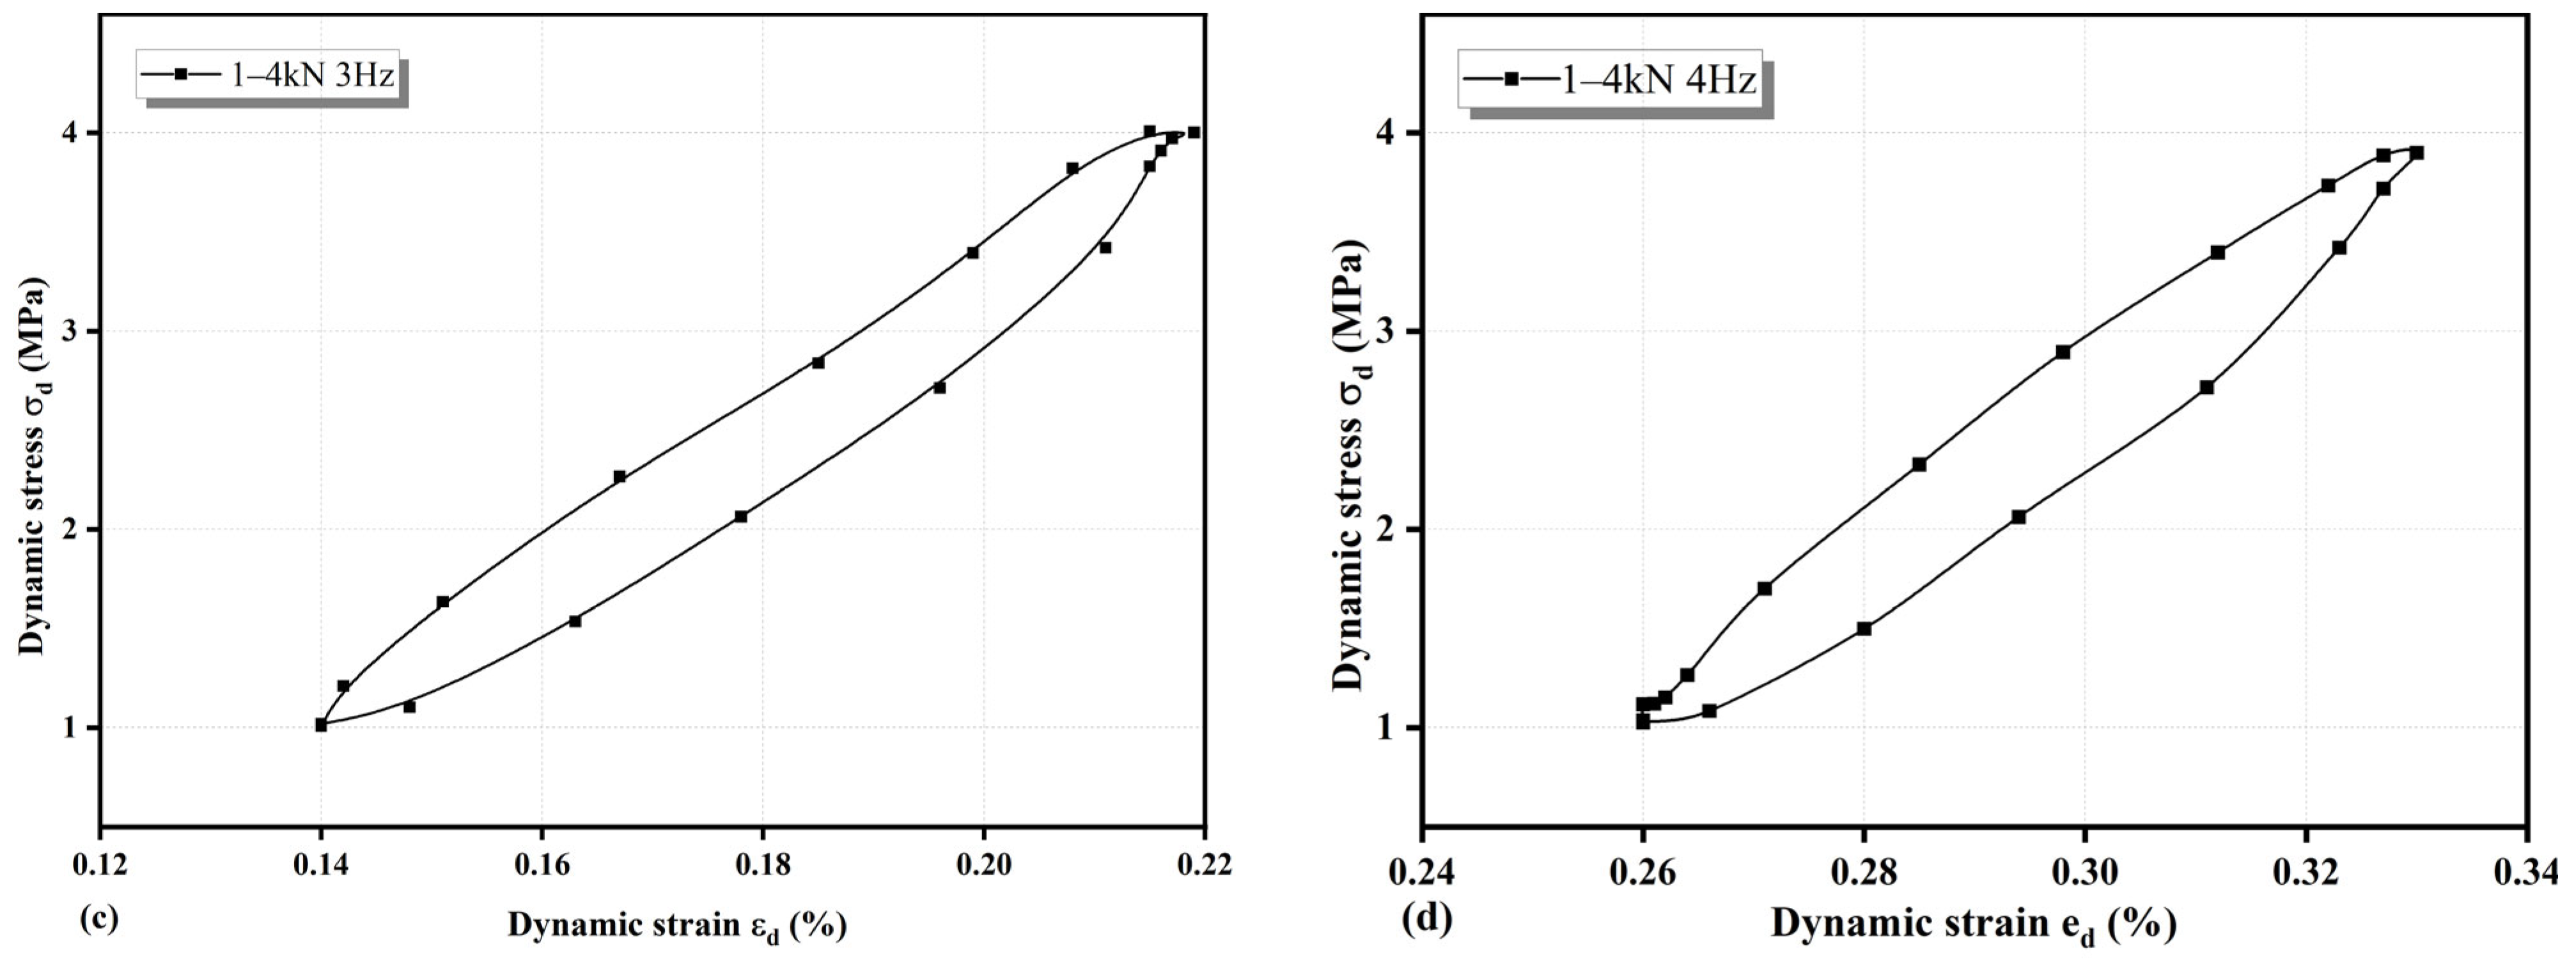
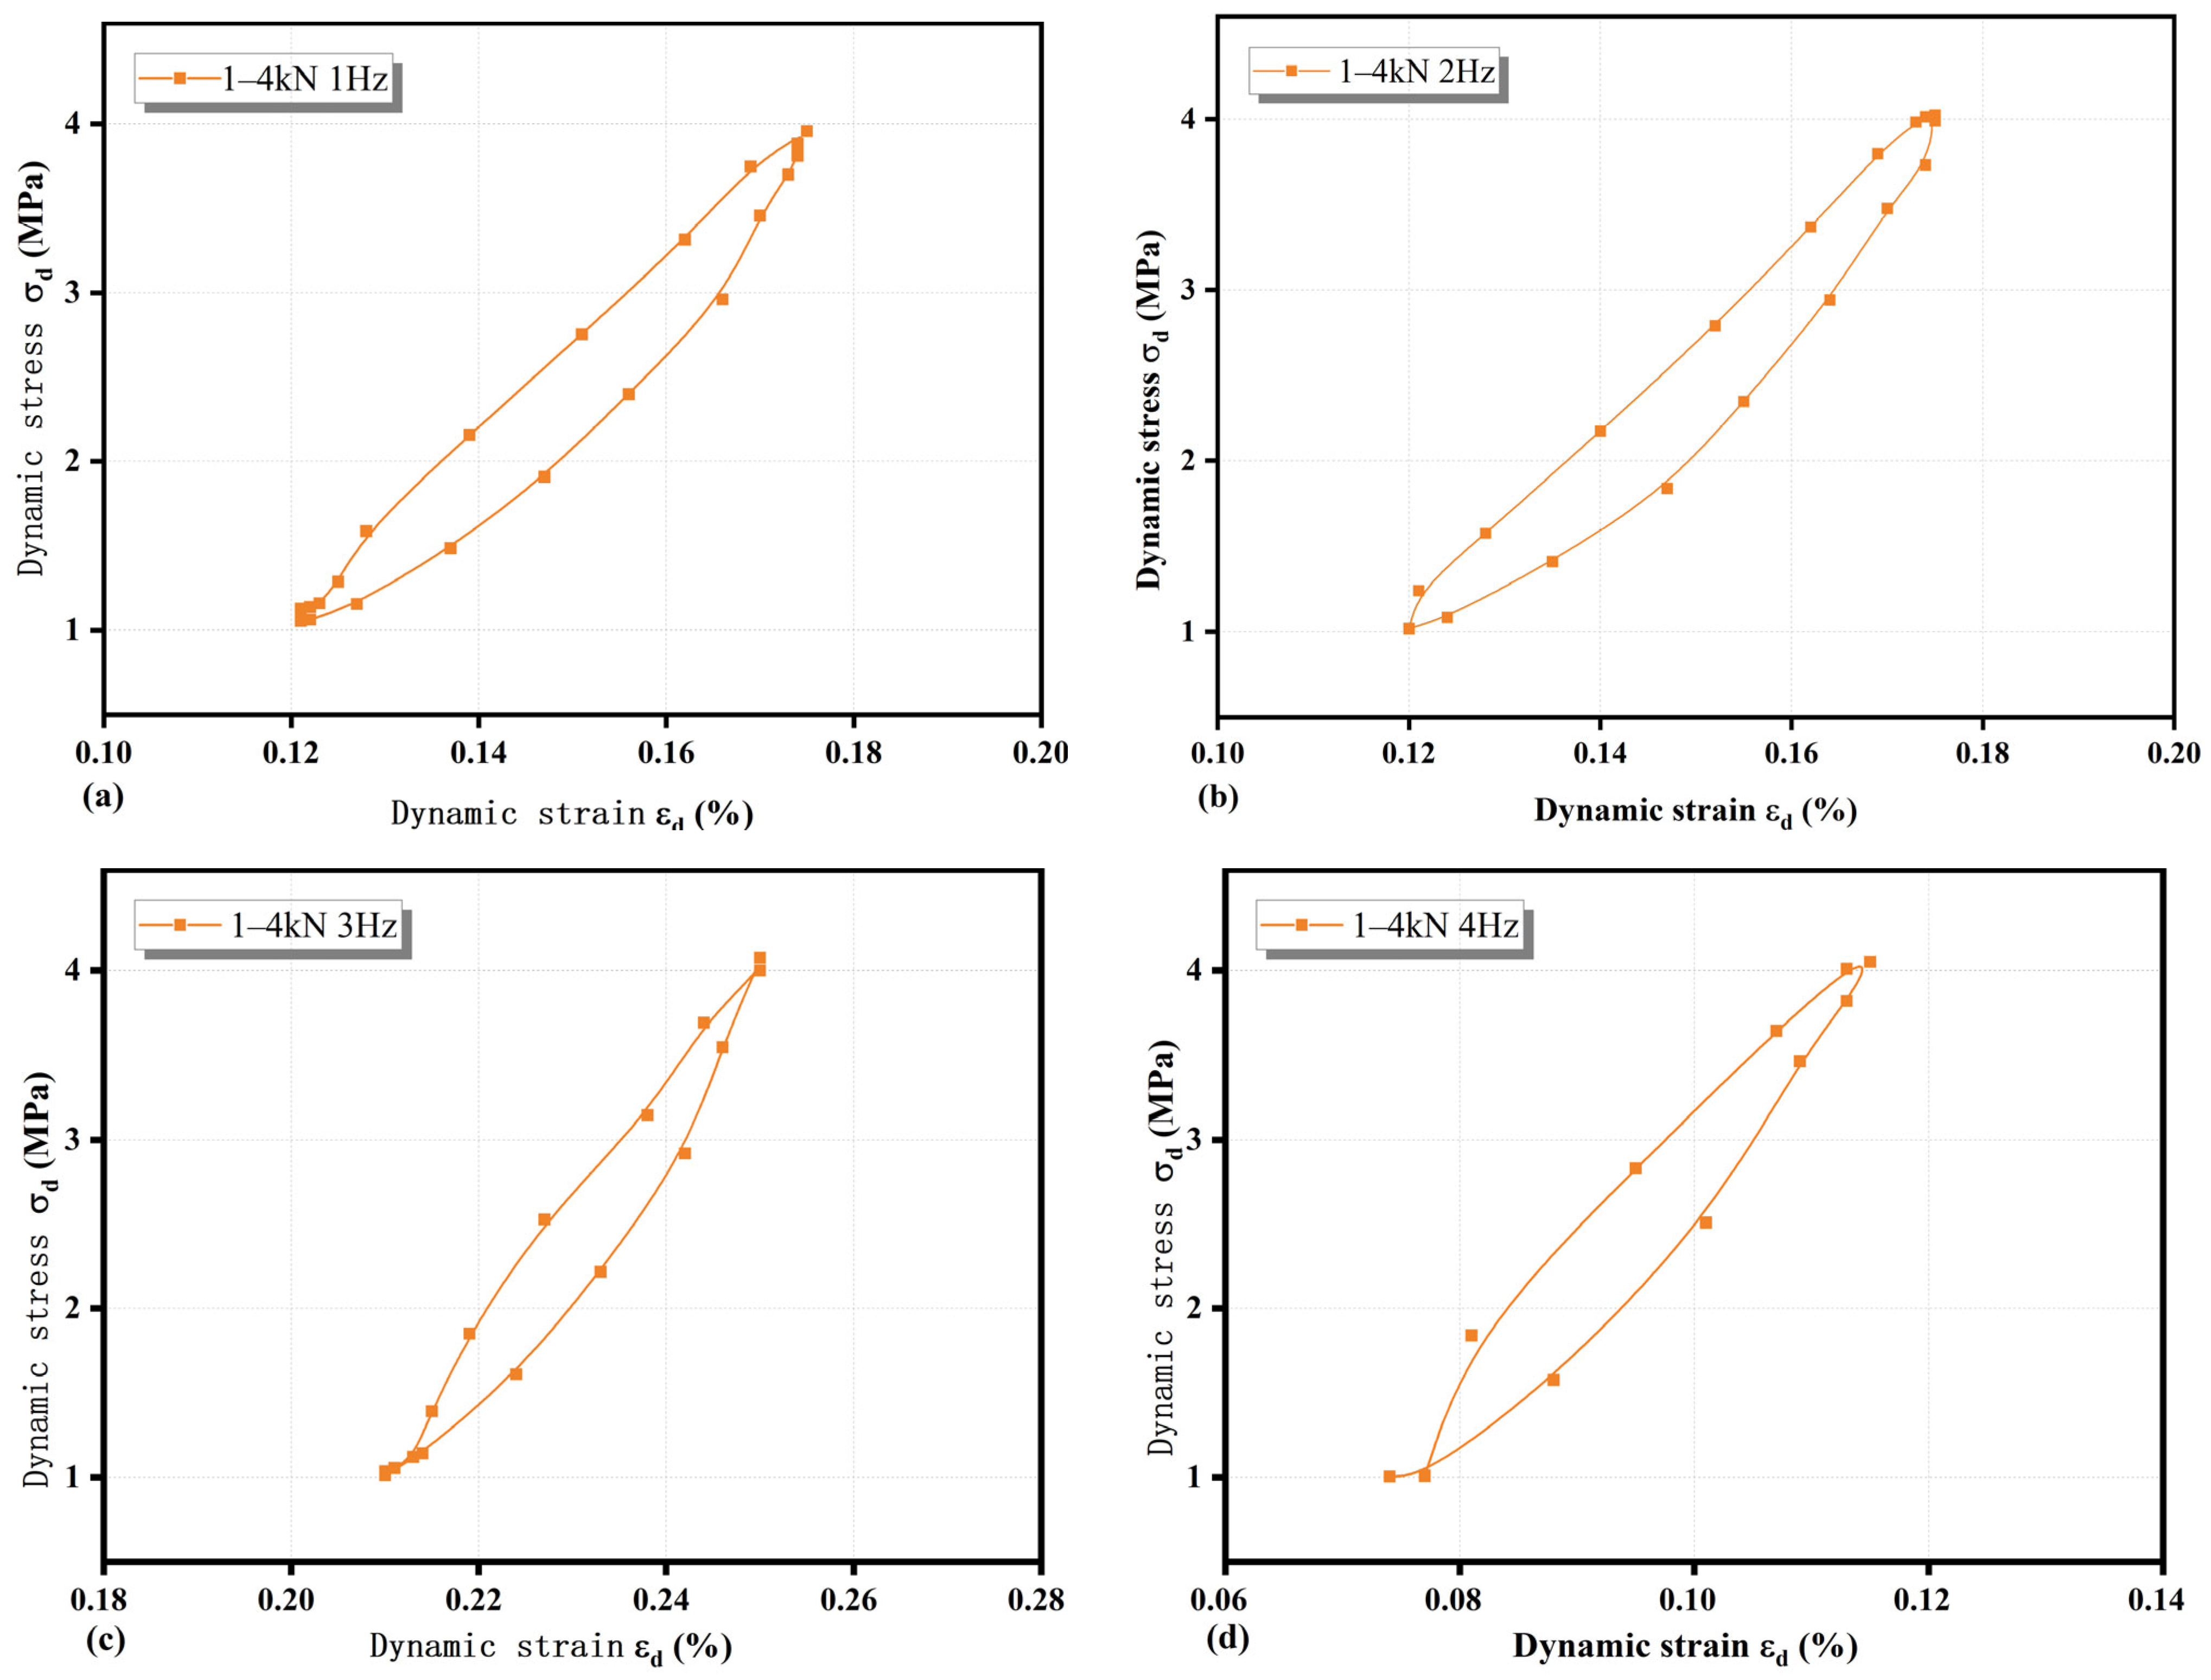
Hysteresis loops are typically asymmetric, meaning the relationship during loading and unloading does not completely coincide. This indicates that the soil experiences certain energy losses during the loading and unloading processes, resulting in hysteretic behavior. Figure 24 and Figure 25 present hysteresis loops of clay soil cement under different loading conditions. The loading and unloading dynamic curves do not coincide, forming fully enclosed curve loops. Compared with unimproved soil cement, the improved soil cement exhibits smaller inclination, indicating rapid sample response. The addition of nano-SiO2 sand enhances stiffness and reduces sample deformation. Frequency variations trigger dynamic responses in the internal microstructure and pore media of the soil. At higher frequencies, particle movement and pore water molecule motion within the soil become more frequent, potentially affecting the dynamic deformation behavior of the soil and thereby influencing hysteresis loop morphology. Due to the high stiffness of the cement-treated soil specimens and the maximum loading frequency of 4 Hz selected in this test, the effect on hysteresis loop morphology within this range is relatively minor.
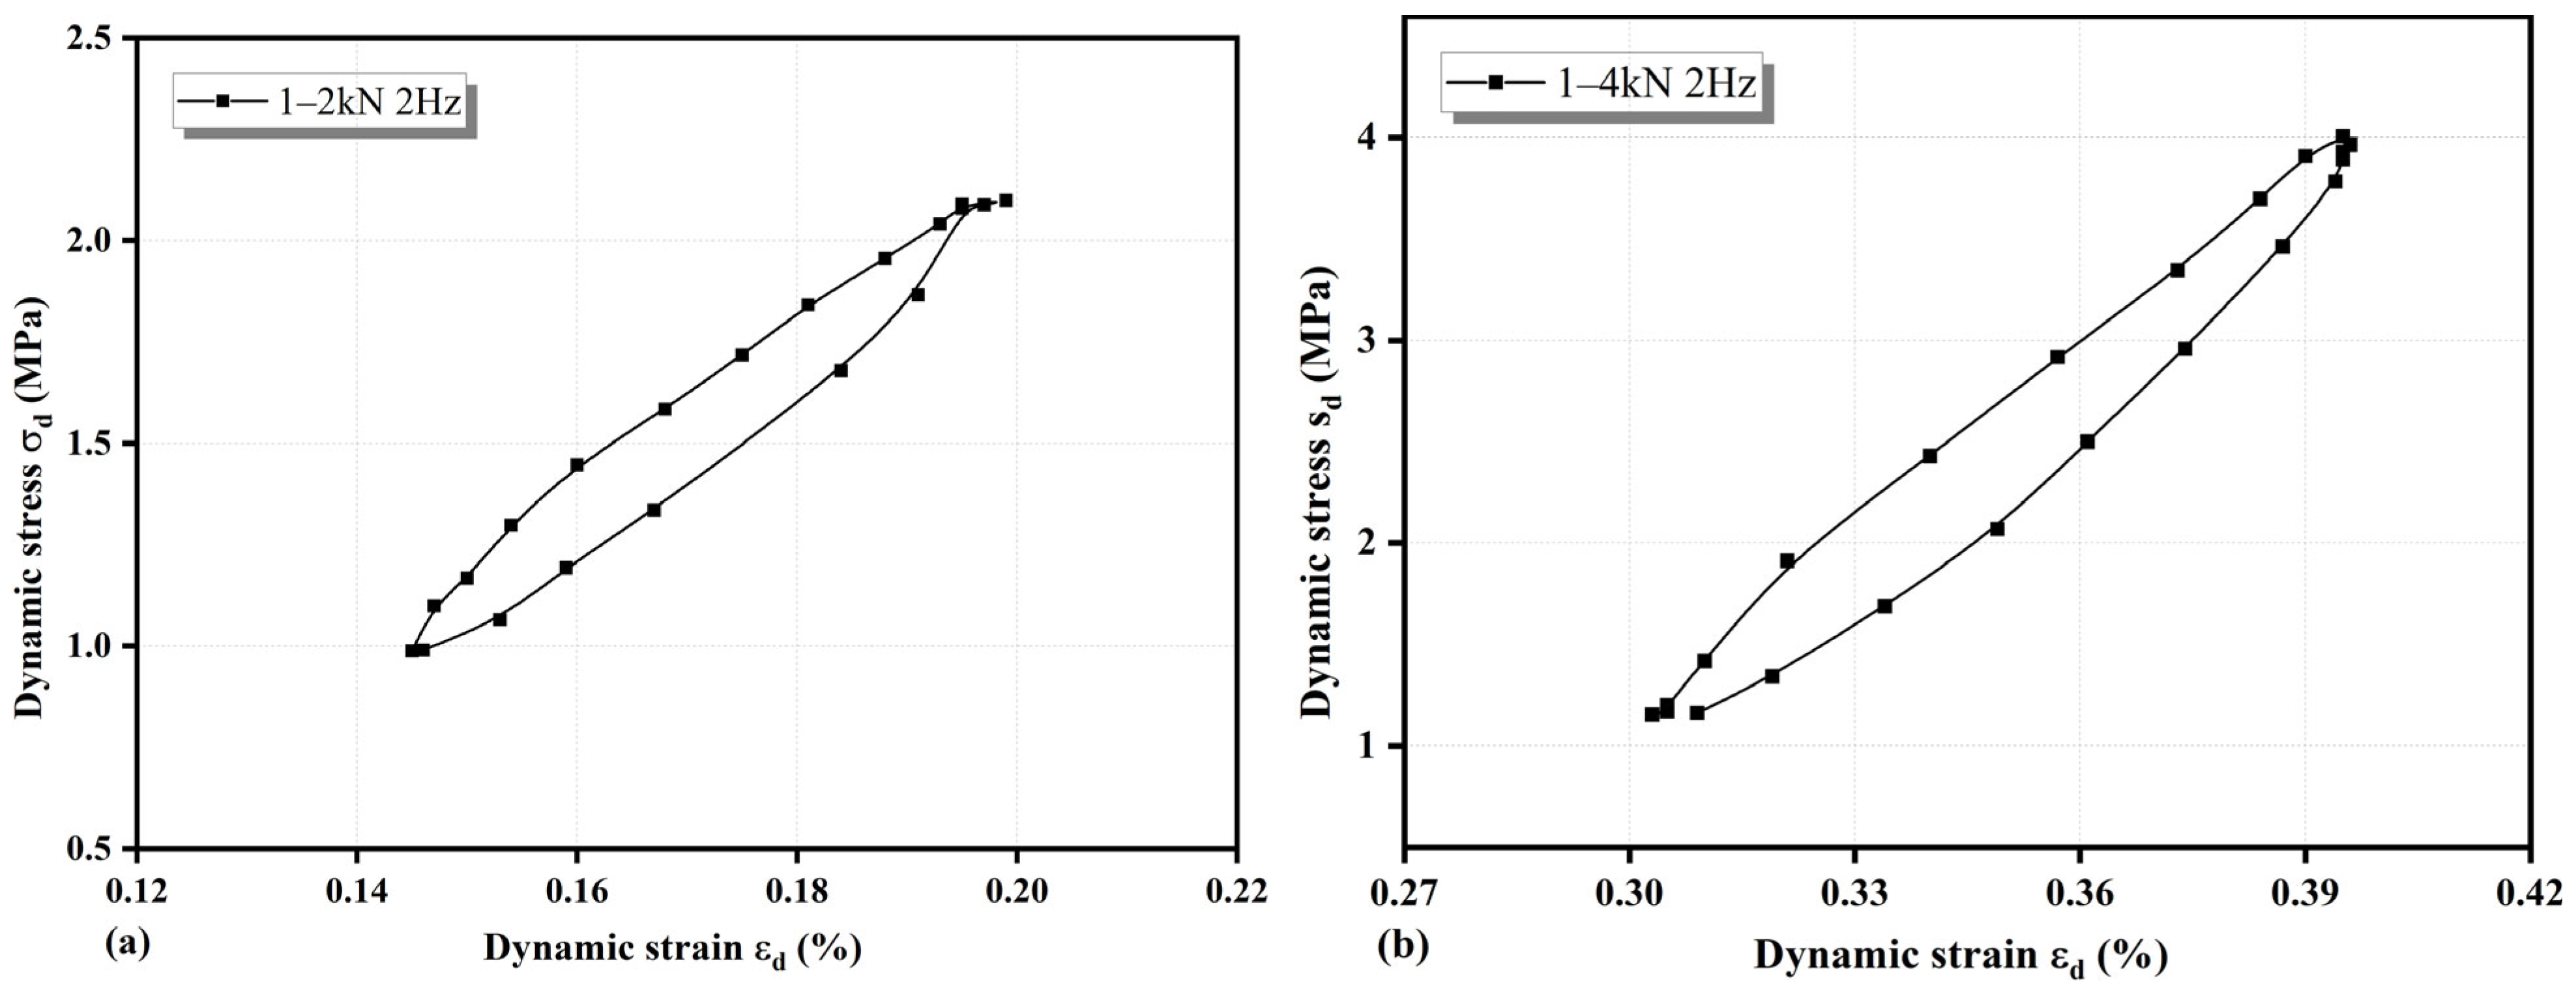
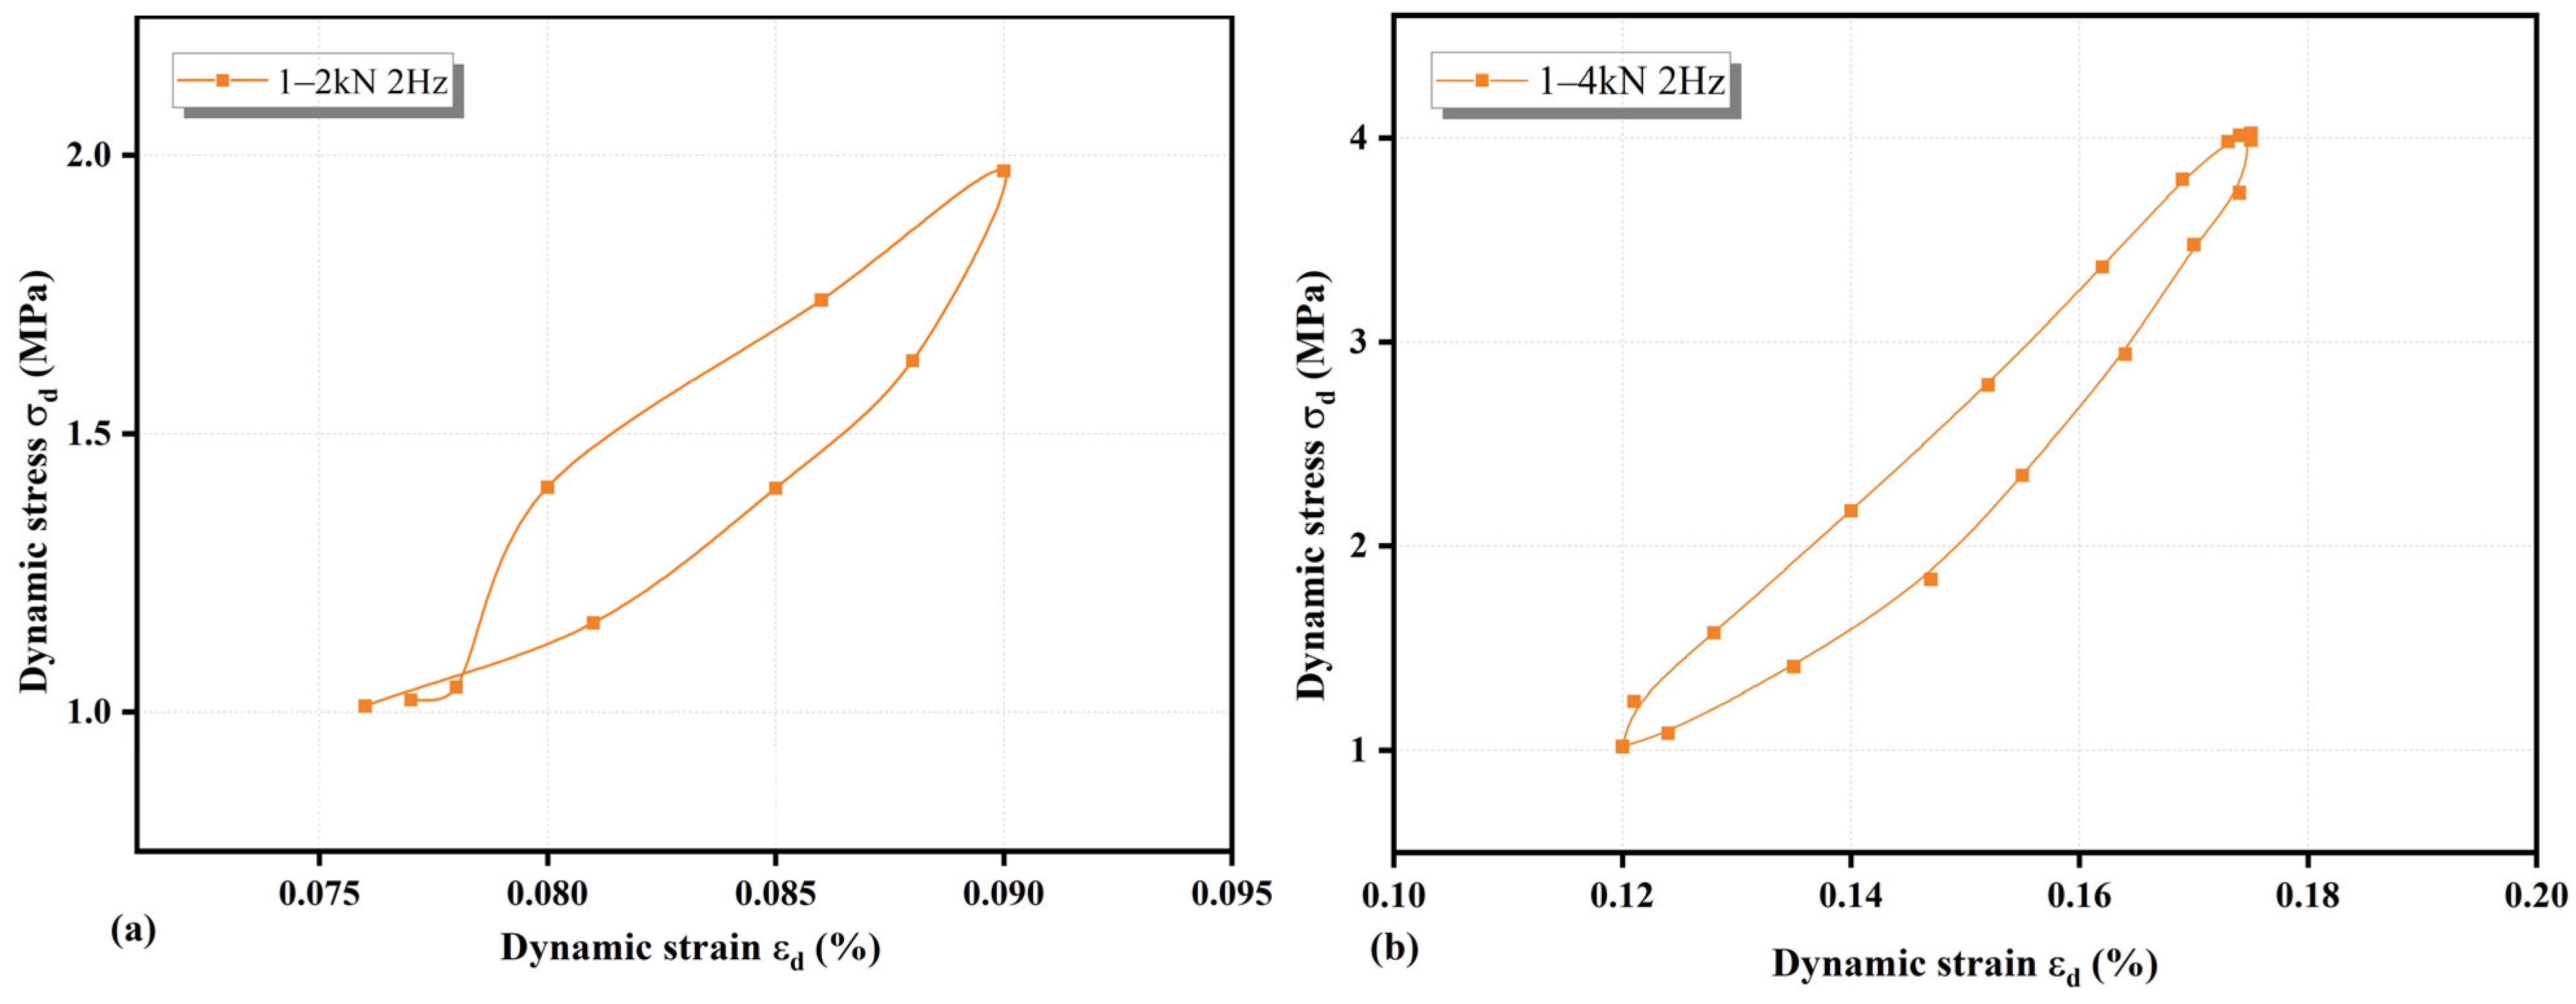
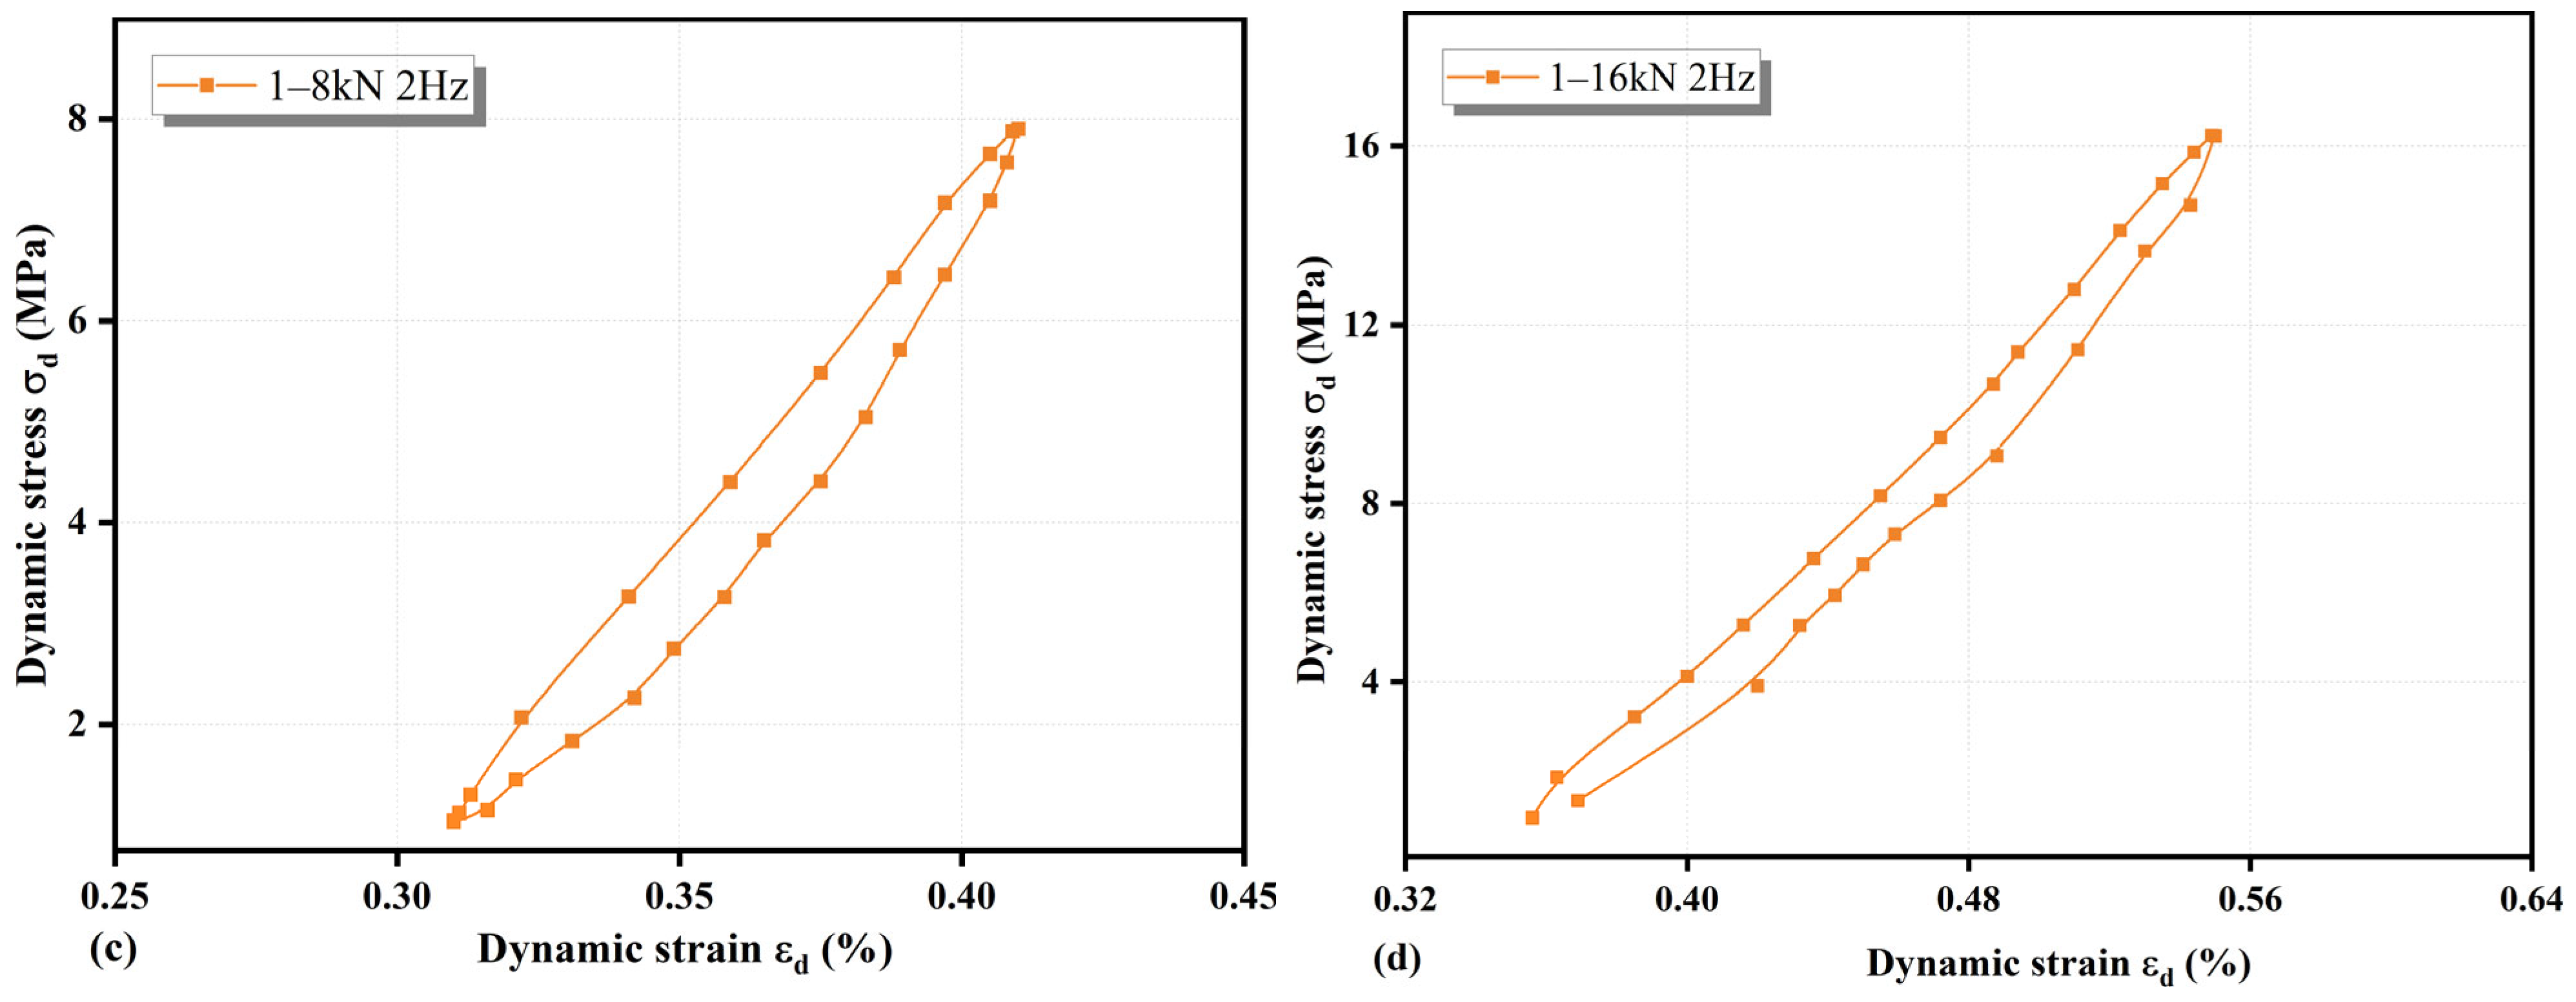
Under the same loading frequency of 2 Hz, soft soil cement was subjected to load amplitudes of 1–2 kN and 1–3 kN as shown in Figure 26 and Figure 27, while clay soil cement was subjected to load amplitudes of 1–2 kN, 1–4 kN, 1–8 kN, and 1–16 kN as shown in Figure 28 and Figure 29. The area of the hysteresis loops increases with increasing load amplitude [18]. Compared with unimproved clay soil cement, nano-SiO2–sand composite cemented clay soil exhibits smoother hysteresis loops with larger areas and fuller curves, indicating greater viscosity and better plastic deformation during cyclic loading. The hysteresis loops of improved clay soil cement are narrow, indicating that during cyclic loading and unloading, the elastic strain response is rapid, with elastic deformation predominating and reducing plastic deformation. The addition of nano-SiO2 sand composite material enhances the stiffness of the soil cement, enabling rapid response during loading and unloading, resulting in narrow curves with pointed tips.
Figure 28 and Figure 29 present hysteresis loops of unimproved and improved clay soil cement under different peak strengths. As the load amplitude increases, the hysteresis loops of improved clay soil cement transform from an “elongated eggplant shape” to a “crescent shape,” with cumulative strain increasing rapidly. At the peak strength of 16 kN, the improved clay soil cement exhibits unclosed curves, indicating reduced residual and plastic deformation in the clay soil cement. At higher loading amplitudes, the increased strain rate within the soil affects its nonlinear behavior and dynamic response.

3.6. Effect of Frequency and Amplitude on Dynamic Deformation Modulus

The results reveal that frequency has a negligible effect on the dynamic deformation modulus of soft soil–cemented soil, whereas for cohesive clay-cemented soil, increasing frequency leads to a marked improvement in dynamic stiffness. Specifically, the dynamic deformation modulus of the modified soft soil-cemented soil increased by 167% compared to the unmodified counterpart. Improved refers to cement-stabilized soil with the optimum composite admixture (3.5% nano-SiO2 + 40% sand for soft soil and 3.5% nano-SiO2+ 40% sand for clay) as in Figure 30.
For cohesive clay–cemented soil, under stress amplitudes ranging from 1 to 4 kN, the incorporation of nano-SiO2 and sand substantially improved the dynamic deformation modulus. Compared with the unmodified specimens, the modified cohesive clay–cemented soil exhibited enhancements of 70%, 88%, 93%, and 89% under loading frequencies of 1 Hz, 2 Hz, 3 Hz, and 4 Hz, respectively.
Figure 30b further demonstrates that unmodified soft soil–cemented soil (Series A) failed under a peak loading strength of 4 kN, resulting in the absence of dynamic modulus data for loading ranges of 1 to 4 kN and 1 to 8 kN. The dynamic deformation modulus of the unimproved cemented soft soil A with an amplitude of 1 to 2 kN and 1 to 3 kN and the optimally proportioned improved cemented soft soil B did not change significantly. Similarly, unmodified cohesive clay-cemented soil (Series C) experienced structural failure under a peak stress of 8 kN, and thus no deformation modulus could be recorded for 1 to 8 kN and 1 to 16 kN.
Across all conditions, the dynamic deformation moduli of unmodified soils were significantly lower than those of the nano-SiO2 and sand-modified soils. For soft soil–cemented soil, the modulus decreased with increasing stress amplitude in the unmodified specimens. However, the modified specimens displayed a clear increasing trend, where higher stress amplitudes led to greater dynamic stiffness. For example, under a loading amplitude of 1 to 2 kN, the dynamic deformation modulus of modified soft soil-cemented soil increased by 160% relative to the unmodified specimen. In the case of cohesive clay-cemented soil, Series D (modified) showed a 166% improvement over Series C (unmodified) under the same conditions.
This enhancement in modulus is attributed to the synergistic effects of nano-SiO2 and sand particles, which strengthen interparticle bonding within the soil matrix. As the stress amplitude increases, these internal interactions become more constrained, limiting relative particle displacement and enhancing the material’s stiffness. Additionally, higher stress amplitudes improve the elastic recovery behavior of the modified soil, indicating an increased ability to restore its original shape after deformation. These findings collectively confirm that nano-SiO2–sand composites significantly enhance the resistance of cement-stabilized soils to external dynamic loads.

3.7. Effect of Frequency and Amplitude on Hysteresis Loop Area

Improved refers to cement-stabilized soil with the optimum composite admixture (3.5% nano-SiO2 + 40% sand for soft soil and (3.5% nano-SiO2 + 40% sand for clay).
The hysteresis loop area of both unmodified and optimally modified cemented soft soil decreases with increasing loading frequency as shown in Figure 31a. For the unmodified material, a slight increase in hysteresis loop area is observed at 2 Hz, followed by a continued decreasing trend. At the same loading frequency, the modified soil consistently exhibits a smaller hysteresis loop area than the unmodified soil.
According to Figure 31b, under a loading amplitude of 1–4 kN, both the unmodified and optimally modified clay cemented soils show a pronounced reduction in hysteresis loop area as the loading frequency rises. The largest hysteresis area occurs at 1 Hz, indicating greater energy dissipation per cycle at lower frequencies. At low frequencies, hysteresis curves spread more horizontally along the strain axis, leading to larger loop areas and reflecting increased energy absorption. In contrast, at high frequencies the curves become steeper and narrower, suggesting higher stiffness. This pattern aligns with the dynamic deformation modulus results and prior studies [39].
At the same loading frequency, the hysteresis loop area of both modified soils is smaller than that of the unmodified soils. The nano-SiO2–sand composite cemented soils show reductions of approximately 45% and 79% in hysteresis area at 1 Hz, respectively, compared to the unmodified soils. This indicates that the modified soils exhibit reduced energy dissipation and more elastic behavior. This improvement is mainly due to the following reasons: nano-SiO2 promotes the hydration reaction and fills internal pores, resulting in a denser soil structure and reduced relative displacement of particles under dynamic loading. Sand particles enhance the soil skeleton and increase stiffness, thereby reducing plastic deformation during vibration [40].
In summary, the nano-SiO2–sand composite significantly improves the mechanical and dynamic properties of cemented soils by increasing stiffness and reducing energy dissipation.
The hysteresis loop area of both soft soil cement and clay cement increases with increasing stress amplitude as shown in Figure 32. As previously observed, the specimens of unmodified soft soil cement (1–4 kN, 1–5 kN) and unmodified clay cement (1–8 kN, 1–16 kN) failed before completing 10,000 loading cycles, and thus no hysteresis loop areas were recorded under these conditions. From Figure 32a, under the same stress amplitude, the hysteresis loop area of unmodified soft soil cement is greater than that of the optimally modified soft soil cement. Moreover, the hysteresis loop area increases as the loading amplitude increases. The same trend is observed for clay cement as for soft soil cement.
Experimental results indicate that the energy dissipation during the loading and unloading processes increases with increasing stress amplitude. This may be attributed to structural changes at the molecular level caused by larger loading amplitudes, which enhance the internal friction and energy dissipation capacity of the material, thus increasing the area enclosed by the hysteresis curve. Under the same loading amplitude, the hysteresis loop area of the optimally modified cement-stabilized soils is smaller than that of the unmodified soils. A smaller hysteresis loop area suggests that the modified cemented soil possesses higher dynamic deformation modulus or stiffness, enabling the specimen to recover to its original state more quickly under identical loading conditions. This results in lower energy dissipation and hysteresis effects, consistent with the trends observed in previous dynamic deformation modulus tests.
Furthermore, a relatively small hysteresis loop area indicates that the composite-modified cemented soil exhibits more elastic behavior and reduced plastic energy dissipation. The incorporation of composite materials densifies the soil structure, enhancing its elastic stiffness and enabling it to recover its original shape more completely during unloading cycles, thereby reducing permanent deformation.
In summary, under a constant loading frequency, both the dynamic deformation modulus and hysteresis loop area increase significantly with the rise in loading amplitude. Compared to unmodified cemented soils, the nano-SiO2 and sand composite-modified cemented soils exhibit significantly reduced hysteresis loop areas and enhanced dynamic deformation modulus, thereby improving stiffness and elastic recovery capacity. The composite materials densify the soil matrix and reduce irreversible deformation. Under constant amplitude, with increasing frequency, the dynamic deformation modulus of soft soil cement shows minor variation, while that of clay cement increases. In both soils, hysteresis loop areas decrease with increasing frequency, and the modified soils show consistently smaller hysteresis loop areas than the unmodified counterparts [41]. The addition of nano-SiO2 and sand significantly improves the dynamic deformation modulus. The composite materials make the cemented soil denser, reducing the interaction time between particles. With insufficient time for particle movement and rearrangement under high-frequency loading, stiffness and dynamic deformation modulus are thus enhanced.
While direct observation of fatigue fracture surfaces was not conducted, the 79% reduction in hysteresis loop area (Figure 31b) and stable dynamic modulus (Figure 30) in modified specimens indirectly suggest altered fracture mechanics. The narrower hysteresis loops indicate reduced internal friction and plastic deformation, consistent with a transition from interfacial debonding (in unmodified soils) to trans-particle or cohesive fracture within the strengthened C-S-H matrix.

4. Mechanism of Cemented Soil Improvement by Nano-SiO2 and Sand Composite Materials

4.1. Mechanism of Cement Hardening

The hydration reactions of cement are diverse, prolonged, and highly complex. During the cement’s stabilization and hardening process, hydrolysis and hydration reactions occur initially. Among the mineral constituents of cement, tricalcium silicate exhibits the fastest hydration rate, rapidly reacting with water to form calcium silicate hydrate gel and calcium hydroxide Ca(OH)2 (see (4a)). In contrast, dicalcium silicate undergoes a slower hydration reaction, but this process persists for an extended duration, sometimes lasting decades (see (4b)). Tricalcium aluminate reacts rapidly in the early stages, contributing to high early strength, but its hydration reaction virtually ceases in later stages. It is characterized by fast early setting speed, accompanied by significant drying shrinkage deformation and poor sulfate resistance (see (4c)). Tetracalcium ferroaluminate, functioning as a polymeric coagulant, exhibits rapid early reaction and high strength, yet its hydration reaction gradually diminishes in later stages (see (4d)).
2(3CaO·SiO2) + 6H2O → 3CaO·2SiO23H2O + 3Ca(OH)2
(2CaO·SiO2) + 4H2O → 3CaO·2SiO2·3H2O + Ca(OH)2
3CaO·Al2O3 + 6H2O → 3CaO·Al2O3·6H2O
4CaO·Al2O3·Fe2O3 + 2Ca(OH)2 + 10H2O → 3CaO·Al2O3·6H2O + 3CaO·Fe2O3·6H2O
During the hydration reaction that produces the cementitious material, Ca(OH)2 is also formed. Part of the remaining Ca(OH)2 undergoes ionization reactions in pore water. At elevated pH and Ca(OH)2 concentrations, the Ca2+ precipitated in the solution exceeds the requirements for ion exchange, leading to the dissolution of active colloidal Al2O3 and SiO2 from soil minerals. Simultaneously, the excess Ca2+ reacts with these dissolved minerals to form calcium aluminate hydrates and calcium silicate hydrates, thereby enhancing the strength of cemented soil (see (4e)–(4g)).
Ca(OH)2 ⇌ Ca2+ + 2OH
3Ca2+ + 2Si4+ + 14OH → 3CaO·2SiO2 + 4H2O
3Ca2+ + 2Al3+ + 20OH + 3H2O → 3CaO·2Al2O3·Ca(OH)2·12H2O
The synergistic mechanism involves two key processes overcoming organic inhibition: (i) Heterogeneous nucleation (seeding effect): In high-organic environments, humic acids chelate Ca2+ ions, forming stable organo-calcium complexes that reduce Ca2+ availability for C-S-H formation [42]. Nano-SiO2 particles act as high-surface-area seeding templates, providing heterogeneous nucleation sites that outcompete organic chelation, facilitating C-S-H precipitation independent of free Ca2+ concentration. (ii) Organic dilution and ITZ (Interfacial Transition Zone) enhancement: The 40% sand replacement dilutes the organic matter concentration per unit volume, while creating a dense skeleton.

4.2. Scanning Electron Microscope (SEM)

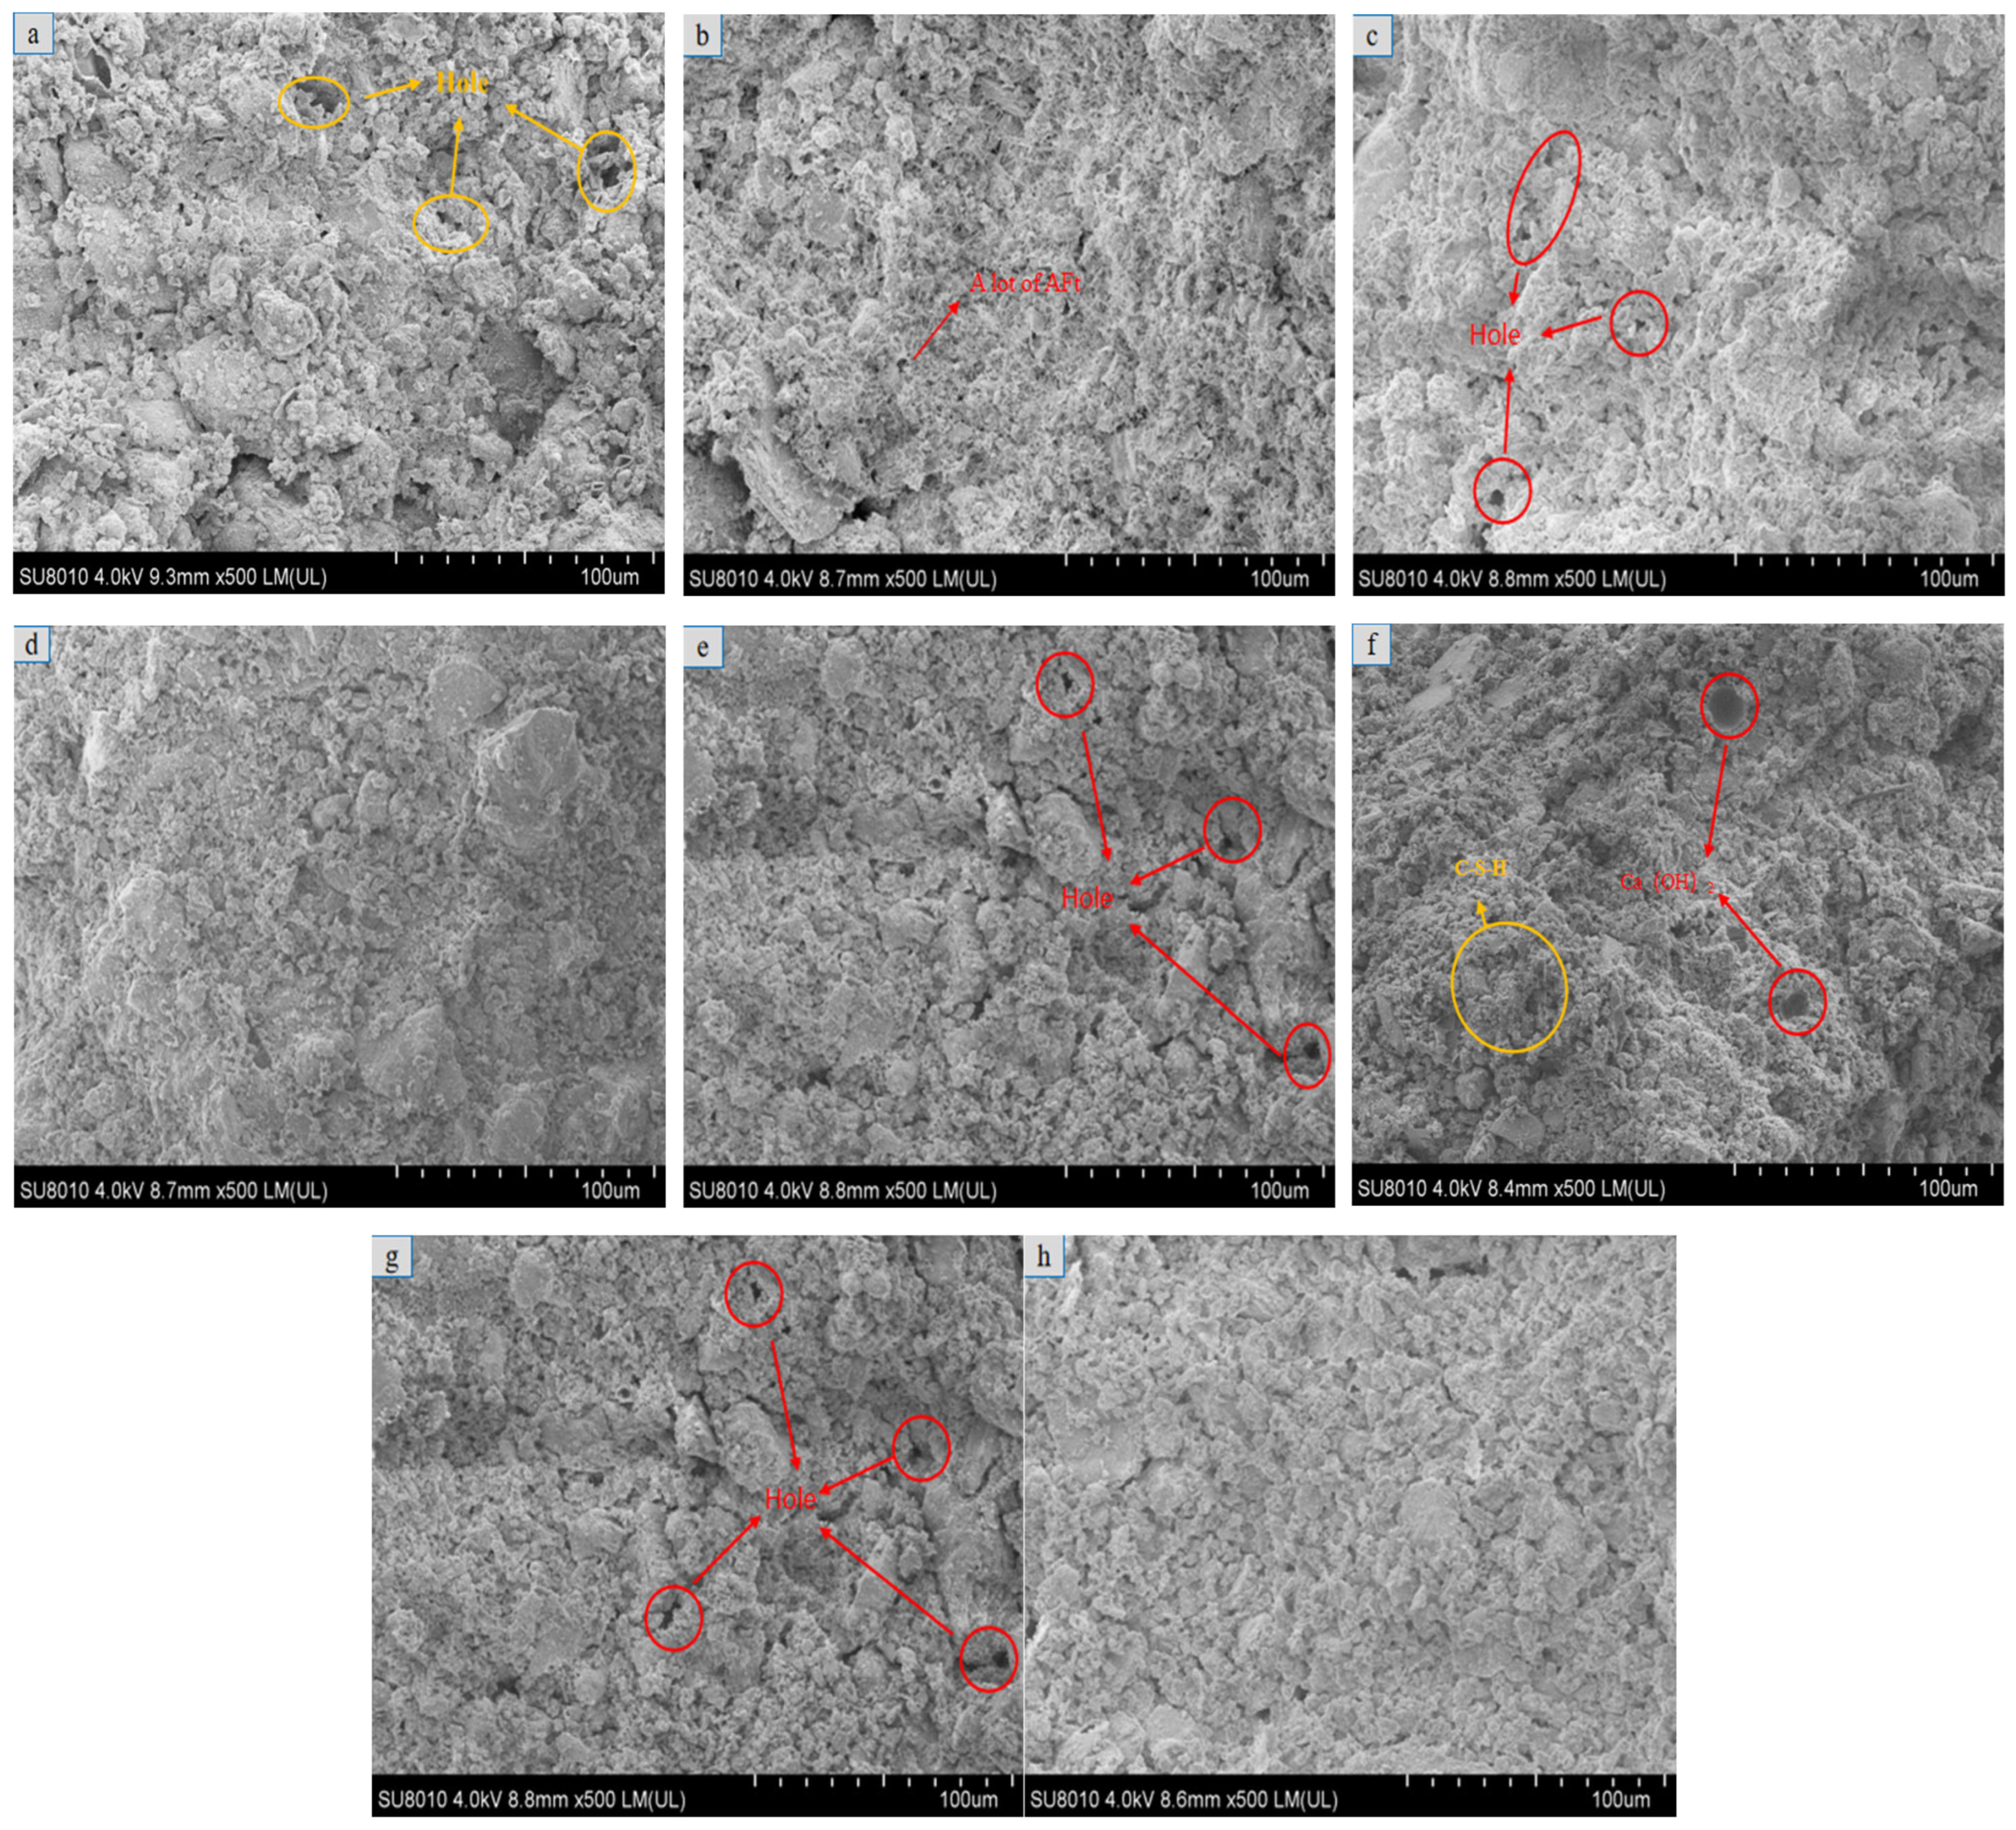
It should be noted that the SEM observations presented in Figure 33 and Figure 34 characterize static compression failure surfaces and intact microstructures, rather than post-cyclic fatigue fracture surfaces. The static failure modes (brittle crushing for unmodified, more ductile shear for modified specimens) provide insight into basic ITZ bonding but do not capture the progressive micro-damage accumulation under cyclic loading. The fatigue resistance demonstrated in Section 3.3 (20,000 cycles) presumably involves distinct micromechanisms—likely including crack deflection at sand particles and energy dissipation through deformable C-S-H networks—that warrant direct fractographic investigation in future studies.
To systematically characterize the microstructure of the sample, multi-scale SEM observation was employed. Figure 33 (20,000×) focuses on the local details to clearly depict the morphology, size and distribution of the secondary products (such as the aqueous phase) on the pore surface; Figure 34 (500×) shows the overall distribution and morphology of the pore structure, which is used to evaluate its uniformity and connectivity. This multi-scale analysis method is helpful for comprehensively explaining the evolution characteristics of the material’s microstructure.
Figure 33a–d represent soft soil-cemented soil; Figure 33e–h represent clay-cemented soil.
As shown in Figure 33, images a–d correspond respectively to unmodified soft soil–cement, soft soil cement with 3.5% nano-SiO2, soft soil cement with 40% sand, and soft soil cement with both 3.5% nano-SiO2 and 40% sand. At 20,000× magnification, it can be observed that the unmodified soft soil cement (a) exhibits a large number of calcium hydroxide (Ca(OH)2, CH) crystals. CH typically appears in layered, square, or plate-like forms, and contributes minimally to the strength of cemented soil. Excessive CH can negatively affect the improvement of soil strength. Due to its specific structural properties, CH often serves as the origin of cracks under stress in cemented soil.
As shown in Figure 33b, numerous rod-like or needle-like products with relatively uniform thickness are observed in the nano-SiO2-modified cemented soft soil. These needle-like crystals exhibit morphological similarities to ettringite (AFt). While AFt formation is thermodynamically favorable given the alkaline environment (theoretical pH > 12) and potential sulfate sources. Alternatively, these may represent other calcium-aluminate-hydrate phases. While AFt can contribute to strength development in cement-stabilized soil to some extent, excessive formation may also lead to adverse effects [43]. In soft soils with high organic content, organic matter inhibits the cement hydration reaction and reduces the formation of calcium silicate hydrate (C-S-H) [44,45,46]. The early incorporation of nano-SiO2 does not significantly promote hydration, which is one of the main reasons for the limited strength observed in both plain and nano-SiO2-modified soft soil cement.
Figure 33c,d show abundant reticular, flocculent, or gel-like C-S-H, which is a primary contributor to strength development in cement-stabilized soils. In Figure 33d, the C-S-H appears denser and more uniformly distributed than in the other samples. In high-organic-content soft soil, both sand-modified and nano-SiO2–sand composite cemented soils rapidly produce substantial C-S-H due to the reaction of tricalcium aluminate. This is attributed to the partial replacement of organic matter by the 40% sand and composite additives, which accelerates the reaction rate. Moreover, sand acts as a key component of the soil skeleton. Hydration products encapsulate the sand particles and, together with C-S-H, form the soil framework, improving compactness and significantly enhancing strength [47,48].
In the cement-stabilized soil system of this study, the early formation of ettringite is inevitable. The fundamental reason lies in the fact that the system fully meets the two key conditions for the formation of ettringite: one is the highly alkaline environment (pH > 12) generated by the cement hydration, and the other is the stable supply of sulfate ions, which mainly comes from the gypsum contained in the cement and may be supplemented due to the collection environment of soft soil and clay. Therefore, the formation of ettringite is an expected and inevitable step in the hydration chemistry of the cement soil system. It, together with the C-S-H gel observed in the text, constitutes the early framework and plays a positive role in the development of strength.
Regarding the formation of ettringite in the studied samples, its occurrence can be considered expected rather than merely coincidental. Ettringite formation requires a high-pH environment and a source of sulfate. Cement hydration inherently provides a highly alkaline medium (pH > 12), satisfying the first condition. As for sulfate sources, both the native soft soil and clay—depending on their depositional environment—may contain natural sulfates. Furthermore, Portland cement itself usually contains sulfate compounds (e.g., gypsum) added to control setting. Therefore, given the ubiquitous alkaline conditions from cement hydration and the likely presence of sulfates either in the soil or in the cement, the formation of ettringite in these cement-stabilized soils appears inevitable under normal curing conditions. Its observed prevalence in the nano-SiO2-modified specimen may further relate to the specific ion availability and hydration kinetics influenced by the additive.
Figure 33e–h show clay cemented soils magnified 20,000 times. It can be seen that in nano-SiO2-modified (f) and optimally composite-modified (h) cemented soils, the distribution of reticular and flocculent C-S-H is denser compared to the unmodified cemented soil (e). Nano-SiO2 promotes the hydration reaction in low-organic-content cemented soil and enhances the generation of C-S-H. In the composite-modified cemented soil, a small amount of fine ettringite (AFt) is observed, which is intertwined with C-S-H, filling pores and contributing positively to early strength development.
One of the main sources of strength in cemented soil is the cement hydration products’ gelation effect. The addition of nano-SiO2 and sand increases the quantity of hydration products in the soil. The modification mainly reflects improvements in the quantity, morphology, and microstructure of hydration products. For low-organic-content clay, nano-SiO2 can fully exert its excellent properties. Through the pozzolanic reaction, it consumes CH produced during hydration, promotes the hydration rate and degree in clay cemented soil, fills pores, enhances the soil skeleton, and improves the microstructure, significantly increasing soil strength. In contrast, the strength improvement from sand addition alone is relatively limited, mainly reflected in the formation of a well-graded soil structure. This densifies pore distribution and reduces the aggregation tendency of clay particles, which aligns with the results of unconfined compressive strength tests.
SEM observations (Figure 34d) reveal a denser Interfacial Transition Zone (ITZ) between sand particles and paste, where C-S-H intimately encapsulates sand grains, reducing stress concentration under cyclic loading.
As shown in Figure 34, macroscopic comparison under low-magnification (500×) scanning electron microscopy (SEM) reveals distinct differences in microstructure. The unmodified cemented soil exhibits a loose structure with numerous visible pores, as seen in Figure 34a,e. In contrast, the nano-SiO2–sand composite cemented soil presents a much denser morphology. The composite additives promote cement hydration, leading to the formation of more calcium silicate hydrate (C-S-H), which effectively binds soil particles together, as illustrated in Figure 34d,h. This improved compactness plays a crucial role in enhancing the unconfined compressive strength and deformation modulus of the stabilized soil.
It should be noted that SEM observations were conducted at different magnification levels for specific purposes. The higher magnification (20,000×) images in Figure 34 allow for detailed examination of hydration products, such as the morphology of ettringite and C-S-H gels. In contrast, the lower magnification (500×) images in Figure 34 provide a broader view of the overall soil fabric, pore distribution, and structural integrity, enabling a comparative assessment of the compactness and homogeneity between different samples.
Drawing from the recent literature on Interfacial Transition Zone (ITZ) mechanics [49], we have expanded our mechanistic discussion to explain how the composite alters stress distribution:
“Mechanistic Insights:
(i) Seeding Effect: In high-organic environments, humic acids chelate Ca2+ ions, inhibiting C-S-H nucleation. Nano-SiO2 particles act as high-surface-area seeding templates (Figure 33d), providing heterogeneous nucleation sites that outcompete organic chelation.
(ii) Interfacial Transition Zone (ITZ) Enhancement: The 40% sand creates a dense skeleton. SEM images (Figure 34d) reveal a denser ITZ between sand particles and paste, where C-S-H intimately encapsulates sand grains. This microstructural density reduces stress concentration at the ITZ under cyclic loading, preventing the crack initiation typically observed at aggregate matrix interfaces in conventional cemented soils” [50].

4.3. X-Ray Diffraction (XRD)

Apart from the inherent physical properties of the soil, the strength of cement-stabilized soil generally originates from three main mechanisms: cement hydration-induced cementation; flocculation of soil particles due to cation exchange between Ca(OH)2 produced by cement hydration and the surface of soil particles; and the pozzolanic reaction between Ca(OH)2 and active components in the soil, forming additional cementitious products. Tricalcium silicate (C3S) and dicalcium silicate (C2S) are primary cement hydration reactants, with characteristic diffraction peaks at 27.95°. According to the cemented soil hydration reaction, a lower presence of C3S and C2S indicates a more complete hydration reaction [47,51,52].
Figure 35 presents the XRD patterns of the unmodified and modified specimens. While the patterns appear largely similar visually, careful analysis of subtle differences in peak intensities provides indirect, supporting evidence for the varying degrees of cement hydration discussed in the microstructure analysis. Figure 36 and Figure 37 are XRD peak intensity charts.
Figure 35a presents the results for cemented soft soil. A comparison of different cement-stabilized soils reveals that the unmodified sample exhibits a C3S/C2S peak intensity of approximately 5200 a.u. at 27.95°. This intensity decreases to about 2600 a.u. in the cemented soils modified with sand alone or with both nano-SiO2 and sand, indicating a reduction in unreacted clinker minerals. However, in the nano-SiO2 only sample, the diffraction intensity of C3S and C2S increases to approximately 5200 a.u., similar to the unmodified sample. In high-organic-content soils, the addition of sand promotes cement hydration to some extent, whereas nano-SiO2 demonstrates limited improvement due to the inhibitory effects of organic matter on the hydration process.
Calcium hydroxide (Ca(OH)2), with characteristic diffraction peaks at 8.11° and 36.57°, is a crucial byproduct of cement hydration. Its presence accompanies the formation of calcium silicate hydrate (C-S-H). Part of the Ca(OH)2 dissociates into Ca2+ ions, which can replace K+, Na+, and other exchangeable cations on the surface of soil particles, enhancing interparticle bonding. Ca(OH)2 also increases the pH, facilitating the dissolution of Al2O3 and SiO2 in the soil, which react with Ca2+ to form hydrated calcium aluminate and additional C-S-H—key contributors to long-term strength development in cement-stabilized soils [45]. The trends for Portlandite (Ca(OH)2), a key hydration product with characteristic peaks near 18.1° and 34.1° are particularly instructive. In the soft soil system, the unmodified sample shows a Ca(OH)2 peak intensity of approximately 1300 a.u. at 18.1°. This intensity decreases to about 650 a.u. in the sand-modified and composite-modified specimens, but remains at approximately 1300 a.u. in the nano-SiO2 only sample. A semi-quantitative comparison shows that, relative to the unmodified sample, the composite-modified specimen has a reduced Ca(OH)2 peak intensity. This decrease suggests a higher degree of hydration, where more Ca(OH)2 is consumed to form C-S-H, correlating with improved strength.
Figure 35b for clay cemented soil shows a different trend. Here, the unmodified sample exhibits a C3S/C2S peak intensity of approximately 7400 a.u. at 27.95°. Both the sand-only and nano-SiO2 only modifications lead to reduced intensities, down to about 3700 a.u., compared to the unmodified soil, indicating both additives promote hydration. The nano-SiO2 modification shows a more pronounced effect, which aligns with the superior mechanical performance observed in clay. For Ca(OH)2, the unmodified sample shows a peak intensity of approximately 1850 a.u. at 18.1°. This intensity is generally lower in all modified samples, decreasing to about 925 a.u., with the most significant reduction occurring in the composite-modified specimen. This strongly supports the conclusion that the combined addition of nano-SiO2 and sand most effectively facilitates the formation of hydration products in clay.
Under identical cement content, the diffraction intensities of C3S and C2S in clay cemented soil are generally lower than those in cemented soft soil. For example, the unmodified clay cemented soil shows a C3S/C2S intensity of 7400 a.u., which is higher than the 5200 a.u. observed in the unmodified cemented soft soil. This can be attributed to the inherent skeletal structure of clay, which offers better load-bearing capacity than soft soil. Additionally, the high organic content in soft soil inhibits cement hydration and limits the generation of hydration products. In contrast, the hydration process in clay cemented soil is more complete, which is one of the main reasons why the unconfined compressive strength of clay cemented soil is higher than that of cemented soft soil.
Summary of Key Phase Trends:
Soft Soil: composite and sand modification promote clinker consumption and Ca(OH)2 use; nano-SiO2 alone shows limited effect.
Clay: all modifications (sand, nano-SiO2, composite) enhance clinker consumption, with the composite most effectively reducing residual Ca(OH)2.
Soil Comparison: clay cement exhibits lower residual clinker phases than soft soil cement, indicating more advanced hydration.

5. Discussions

The present study focused on naturally saturated/near-saturated conditions typical of soft soil deposits. The highwater content of soft soil (w > wL) implies minimal effective stress history, behaving mechanically as normally consolidated material. Future research should systematically evaluate the influence of consolidation history (overconsolidation ratio, OCR) and degree of saturation on cyclic resistance, as preliminary evidence suggests that even moderate desaturation (Sr < 90%) significantly increases stiffness and alters the pore pressure response under cyclic loading.
This study demonstrates that the 28-day unconfined compressive strength (UCS) of untreated soft soil-cemented soil is only 0.13 MPa. However, with a combined modification strategy of 3.5% nano-silica (nano-SiO2) and 40% sand, the UCS can be significantly enhanced to 1.39 MPa—an exponential increase compared to single-material modifications. In the clay-based system, the composite group reached a UCS of 5.51 MPa, significantly outperforming the single nano-SiO2 or sand modifications, thereby confirming the inhibitory effect of organic matter on cementation efficiency [38]. Notably, in high-organic-content soft soils, the pore-filling effect of sand contributes far more to strength enhancement than nano-SiO22, highlighting the unique role of sand in mitigating organic interference. Conversely, in low-organic-content clays, the cementation enhancement effect of nano-SiO2 plays a dominant role in the improvement process. This research is the limited evidence to confirm that the synergistic action of nano-SiO2 and sand overcomes the inhibition barrier posed by organic matter through a dual mechanism of “pore-skeleton construction and acid neutralization,” providing both theoretical insight and practical reference for differential soil improvement.
The deformation modulus of soft soil-cemented soils increases with curing age. However, both sand-modified and composite-modified groups exhibit a decline after reaching a peak value, with the composite material significantly enhancing soil stiffness. For cemented clay, the overall modulus also increases over time, but modified groups (e.g., nano-SiO2 and the combined system) exhibit modulus attenuation in the later stages, whereas the untreated clay shows a stable trend after a certain curing period. Modified groups generally display an “initial strengthening followed by weakening” evolution pattern, which may be related to the continuous decomposition of organic matter and the long-term stability of cementation products.
At 40% sand content, the composite transitions from a cement-stabilized fine-grained soil to a sand matrix composite with cohesive filler. This threshold (40%) represents the point where sand particles establish continuous force chains, fundamentally altering the stress transfer mechanism. XRD and SEM results confirm that sand particles become encased in C-S-H gel, acting as rigid inclusions that reduce the organic matter’s inhibitory effect by dilution. The material behavior shifts from clay-dominated (cohesive) to sand-dominated (frictional), evidenced by the reduction in plasticity index from 20.4 to 9.8 for soft soil (Table 4). This transition explains the strength gains observed beyond 30% sand content and should be considered when applying these results to field mixing designs where segregation control is critical.
While nano-SiO2 offers superior nucleation effects for C-S-H formation in high-organic environments, we acknowledge that commercial nano-SiO2 production involves energy-intensive processes (calcination at >600 °C) and carries higher economic costs compared to agricultural byproducts. Rice Husk Ash (RHA) is a promising low-carbon alternative. RHA contains 60–95% amorphous silica and exhibits comparable pozzolanic reactivity to synthetic nano-silica when properly processed. Recent studies demonstrate that RHA can reduce soil permeability by 35–45% and achieve UCS improvements of 31.7% at 10% dosage, though its effectiveness in high-organic soils (LOI > 5%) remains less established than synthetic nano-SiO2 [53]. We have added the following comparative analysis:
Although 3.5% nano-silica increases material costs, the 166-fold enhancement in fatigue life significantly reduces infrastructure life-cycle costs. However, considering the global annual production of approximately 20 million tons of RHA from rice milling waste, partial substitution of nano-SiO2 with RHA (e.g., 10–15% replacement) represents a viable pathway to reduce the carbon footprint by approximately 25–30% while maintaining performance [54].

6. Conclusions

This study systematically investigated the synergistic enhancement effects and mechanisms of nano-SiO2 and sand on the mechanical properties of cement-stabilized soils, yielding the following key conclusions:
Both individual and combined additions of nano-SiO2 and sand enhance the unconfined compressive strength of cement-treated soft soils and clay soils. The optimal dosages are 3.5% nano-SiO2, 40% sand, and a combined addition (3.5% + 40%). The combined addition yields the most significant strengthening effect.
At optimal dosages, compared to unmodified specimens: nano-SiO2 alone increased the modulus of elasticity by 78% for soft soil and 174% for clay cemented soil; sand alone increased it by 221% and 35%, respectively; combined addition substantially increased it by 685% and 470%, respectively.
High organic matter content (>5%) severely inhibits cement hydration, resulting in 28-day strength of only 130 kPa for soft soil cement (87% lower than clay cement). Organic acids hinder C-S-H gel formation by chelating Ca2+ and lowering system pH (<9), increasing porosity by 15–20%. Composite addition of 3.5% nano-SiO2 and 40% sand elevated soft soil cement strength from 0.13 MPa to 1.39 MPa—a 969% increase.
Microscopic analysis indicates that sand addition replaces part of the organic matter, improves soil spatial structure, and promotes hydration reactions. When nano-SiO2 and sand are used in combination, they generate more flocculent C-S-H and a small amount of calcium aluminate hydrate, significantly enhancing the cemented soil’s density and strength.
These findings confirm that nano-SiO2 sand composites effectively mitigate the detrimental effects of organic matter on cement-stabilized soil properties, offering a viable improvement strategy for reinforcing organic-rich soft soil foundations. Future research should further consider complex stress pathways, long-term environmental effects, and field validation to advance the engineering application of this technology.
To transition from experimental observations to predictive engineering tools, future research should develop calibrated mathematical models describing the strength evolution and damage accumulation. Specifically, extending the Monismith model (Equation (3)) or adopting continuum damage mechanics (CDM) frameworks to incorporate the CSR-dependent fatigue life and energy dissipation characteristics observed in this study would enable predictive design of stabilization depths and service life for transportation infrastructure.
It is important to acknowledge the limitations of this study. While the composite significantly enhances static and dynamic mechanical properties, the following aspects were not within the scope of this investigation:
(1) Direct characterization of fatigue fracture surfaces: The SEM observations presented in this study characterize static compression failure surfaces and intact microstructures, rather than post-cyclic fatigue fracture surfaces. While the 79% reduction in hysteresis loop area (Figure 31b) and stable dynamic modulus (Figure 30) indirectly suggest altered fracture mechanics, direct fractographic evidence—such as EDS elemental mapping of crack paths and quantitative analysis of fracture surface roughness—is required to conclusively validate the hypothesized stress redistribution mechanism. Future research should perform detailed fractographic analysis including: (i) crack path tortuosity measurement to quantify toughening effects at sand particles; (ii) EDS line scans across the sand ITZ interface to verify C-S-H cementation; and (iii) fractal dimension analysis to correlate surface roughness with energy dissipation capacity.
(2) Hydraulic conductivity and long-term durability: The evaluation of hydraulic conductivity (permeability) and long-term durability under aggressive environments (e.g., water absorption, cycles, sulfate attack) was not within the scope of this investigation. These properties are critical for real-world construction applications, as:
Stabilizers must provide adequate impermeability to prevent water ingress and chemical degradation.
Future research must address these limitations to ensure the composite meets holistic construction standards beyond strength.

Author Contributions

G.T. provided funding for this article. N.Y. and E.G. completed the experiments and data processing of this paper. N.Y. and G.T. have drafted the work. S.H. and Q.C. substantively revised it. S.H. and G.T. assisted in designing the logic of this article. Each author has approved the submitted version of the manuscript, including any substantially revised versions that pertain to their individual contributions to the study. Furthermore, each author has agreed to assume personal accountability for their respective contributions and to ensure that any issues concerning the accuracy or integrity of any aspect of the work—regardless of whether the author was directly involved—are thoroughly investigated, appropriately resolved, and that such resolutions are documented in the scholarly record. All authors have read and agreed to the published version of the manuscript.

Funding

This work was supported by the Innovation Research Group Project of the Hubei Provincial Department of Science and Technology (2025AFA020), the Joint Funds of the National Natural Science Foundation of China (U22A20232), the Hubei Provincial Department of Education’s Outstanding Mid-aged and Young Technological Innovation Team (T2024006), the Open Project Funding of Key Laboratory of Intelligent Health Perception and Ecological Restoration of Rivers and Lakes, Ministry of Education (HGKFZ07) and the International Collaborative Research Fund for Young Scholars in the Innovation Demonstration Base of Ecological Environment Geotechnical and Ecological Restoration of Rivers and Lakes.

Institutional Review Board Statement

Not applicable.

Data Availability Statement

Data is contained within the article.

Acknowledgments

The authors have reviewed and edited the output and take full responsibility for the content of this publication.

Conflicts of Interest

The authors declare no conflicts of interest. The funders had no role in the design of the study; in the collection, analyses, or interpretation of data; in the writing of the manuscript; or in the decision to publish the results.

Correction Statement

This article has been republished with a minor correction to the Funding statement. This change does not affect the scientific content of the article.

Abbreviations

The following abbreviations are used in this manuscript:
UCSUnconfined compressive strength
XRDX-Ray diffraction
SEMScanning electron microscope
ITZInterfacial Transition Zone
LOILoss On Ignition
CSRCyclic Stress Ratio
AFtEttringite
C-S-HCalcium Silicate Hydrate
CHCalcium Hydroxide
CDMContinuum damage mechanics
RHARice Husk Ash
EDSEnergy Dispersive X-ray Spectroscopy

References

  1. Clare, K.; Sherwood, P. Further studies on the effect of organic matter on the setting of soil-cement mixtures. J. Appl. Chem. 1956, 6, 317–324. [Google Scholar] [CrossRef]
  2. Du, C.; Zhang, J.; Yang, G.; Yang, Q. The influence of organic matter on the strength development of cement-stabilized marine soft clay. Mar. Georesour. Geotechnol. 2021, 39, 983–993. [Google Scholar] [CrossRef]
  3. Yu, L.; Yan, C.; Guo, S.; Yan, C.; Li, X. Study on the effect of organic content on properties of magnesium phosphate cement solidified soil. J. Eng. Geol. 2020, 28, 335–343. [Google Scholar] [CrossRef]
  4. Karimiazar, J.; Sharifi Teshnizi, E.; Mirzababaei, M.; Mahdad, M.; Arjmandzadeh, R. California Bearing Ratio of a Reactive Clay Treated with Nano-Additives and Cement. J. Mater. Civ. Eng. 2022, 34, 04021431. [Google Scholar] [CrossRef]
  5. Chen, Q.; Yu, R.; Gaoliang, T.; Nimbalkar, S. Microstructure, strength and durability of nano-cemented soils under different seawater conditions: Laboratory study. Acta Geotech. 2023, 18, 1607–1627. [Google Scholar] [CrossRef]
  6. Tabarsa, A.; Latifi, N.; Meehan, C.L.; Manahiloh, K.N. Laboratory investigation and field evaluation of loess improvement using nanoclay—A sustainable material for construction. Constr. Build. Mater. 2018, 158, 454–463. [Google Scholar] [CrossRef]
  7. Chen, Q.; Xie, K.; Tao, G.; Nimbalkar, S.; Zhang, H. Laboratory assessment of impact of nano-SiO2 on different soil types in onshore and offshore environment. Acta Geotech. 2024, 19, 5065–5087. [Google Scholar] [CrossRef]
  8. Chen, H.; Wang, Q. Influences of organic matter on the effects of consolidating soft soil with cement. Chin. J. Rock Mech. Eng. 2005, 24, 5816–5821. [Google Scholar]
  9. Chen, H.; Wang, Q. Laboratory study on consolidation effect of different area soft soils stabilized with cement. Rock Soil Mech. 2007, 423–426. [Google Scholar] [CrossRef]
  10. Yang, B.; Liu, W.; Yu, Y.; Xu, R.; Li, T. Experimental study on the influence of initial water content and organic matter on the strength of cement soil. J. Railw. Sci. Eng. 2023, 20, 3798–3808. [Google Scholar] [CrossRef]
  11. Tian, X.; Li, N.; Jiang, P.; Fang, R.; Yan, H. Study on the Effect of External Blending Materials on the Compressive Properties of Coastal Cement Soil. J. China Three Gorges Univ. Nat. Sci. 2021, 43, 80–84. [Google Scholar] [CrossRef]
  12. Joel, M.; Agbede Isaac, O. Mechanical-Cement Stabilization of Laterite for Use as Flexible Pavement Material. J. Mater. Civ. Eng. 2011, 23, 146–152. [Google Scholar] [CrossRef]
  13. Consoli, N.C.; Párraga Morales, D.; Saldanha, R.B. A new approach for stabilization of lateritic soil with Portland cement and sand: Strength and durability. Acta Geotech. 2021, 16, 1473–1486. [Google Scholar] [CrossRef]
  14. Mamun, M.M.H.; Ovi, M.F.M.; Akhter, F.; Barua, S.; Ahmed, M.; Nipa, T.J. Improvement of sub base soil using sand-cement stabilization. Am. J. Civ. Eng. 2016, 4, 241–246. [Google Scholar] [CrossRef]
  15. Subramanian, S.; Khan, Q.; Ku, T. Effect of sand on the stiffness characteristics of cement-stabilized clay. Constr. Build. Mater. 2020, 264, 120192. [Google Scholar] [CrossRef]
  16. Madshus, C.; Kaynia, A.M. High-Speed Railway Lines on Soft Ground: Dynamic Behaviour at Critical Train Speed. J. Sound Vib. 2000, 231, 689–701. [Google Scholar] [CrossRef]
  17. Subramaniam, P.; Banerjee, S. Dynamic Properties of Cement-Treated Marine Clay. Int. J. Geomech. 2020, 20, 04020065. [Google Scholar] [CrossRef]
  18. Gao, C.; Du, G.; Guo, Q.; Zhuang, Z. Static and Dynamic Behaviors of Basalt Fiber Reinforced Cement-Soil after Freeze-Thaw Cycle. KSCE J. Civ. Eng. 2020, 24, 3573–3583. [Google Scholar] [CrossRef]
  19. Du, Y.; Dai, M.; Wang, C.; Hu, X.; Gou, C.; Wang, H. Cyclic shear characteristics of marine cement soil under stress path with bidirectional shear stress. Mar. Georesour. Geotechnol. 2021, 39, 1177–1191. [Google Scholar] [CrossRef]
  20. Ma, Q.; Gao, C. Effect of Basalt Fiber on the Dynamic Mechanical Properties of Cement-Soil in SHPB Test. Int. J. Geomech. 2018, 30, 04018185. [Google Scholar] [CrossRef]
  21. Ding, Z.; Zhang, M.-Y.; Li, S.-L.; Wei, X.-J.; Do, T.-N. The pore pressure model of cement soil under cyclic loading. Mater. Res. Innov. 2015, 19, S8-409–S8-415. [Google Scholar] [CrossRef]
  22. Panico, F.; da Fonseca, A.V. Long Term Cyclic Response of a Soil-Cement Mixture: Experimental Study and Modelling. Procedia Eng. 2016, 143, 178–186. [Google Scholar] [CrossRef]
  23. Valenzuela, M.; Ciudad, G.; Cardenas, J.P.; Medina, C.; Salas, A.; Oñate, A.; Pincheira, G.; Attia, S.; Tuninetti, V.J.R. Towards the development of performance-efficient compressed earth blocks from industrial and agro-industrial by-products. Renew. Sustain. Energy Rev. 2024, 194, 114323. [Google Scholar] [CrossRef]
  24. GB/T 50123-2019; Standard Test Methods for Geotechnical Engineering (Including Explanatory Notes). China Architecture & Building Press: Beijing, China, 2019.
  25. Hu, C.; Ma, Y.; Guo, C.; Li, D.; Pei, Q. Optimization of the Experiment Conditions for Estimating Organic Matter Content with Loss-on-ignition Method. Earth Environ. 2016, 44, 110–118. [Google Scholar] [CrossRef]
  26. JGJ-T 233-2011; Specification for Mix Proportion Design of Cement Soil. China Architecture and Building Press: Beijing, China, 2011.
  27. Kang, G.-o.; Tsuchida, T.; Kim, Y.-s. Strength and stiffness of cement-treated marine dredged clay at various curing stages. Constr. Build. Mater. 2017, 132, 71–84. [Google Scholar] [CrossRef]
  28. Quiroga, A.J.; Thompson, Z.M.; Muraleetharan, K.K.; Miller, G.A.; Cerato, A.B. Stress–strain behavior of cement-improved clays: Testing and modeling. Acta Geotech. 2017, 12, 1003–1020. [Google Scholar] [CrossRef]
  29. Deng, N.; Wu, Y.-k.; Wang, S.; Hao, R.; Xiong, Z.; Huang, D. Fractal theory-based analysis of strength degradation in steel slag powder-stabilized soil under chloride ion environment. Sci. Rep. 2025, 15, 22875. [Google Scholar] [CrossRef] [PubMed]
  30. Degrande, G.; Schillemans, L. Free-Field Vibrations During the Passage of a Thalys High-Speed Train. J. Sound Vib. 2001, 247, 131–144. [Google Scholar] [CrossRef]
  31. Ni, J.; Zhu, Y.; Chen, Y.; Du, X.; Rujikiatkamjorn, C. Cumulative pore water pressure behaviour of soft clays installed withprefabricated vertical drains under cyclic loads. Rock Soil Mech. 2016, 37, 383–389, 398. [Google Scholar] [CrossRef]
  32. Zhang, X.; Tang, Y.; Zhou, N.; Wang, J.; Zhao, S. Dynamic response of saturated soft clay around a subway tunnel under vibration load. China Civ. Eng. J. 2007, 40, 85–88. [Google Scholar]
  33. Elmenshawi, A.; Brown, T. Hysteretic energy and damping capacity of flexural elements constructed with different concrete strengths. Eng. Struct. 2010, 32, 297–305. [Google Scholar] [CrossRef]
  34. Wang, C.; Wu, H.; Li, C. Hysteresis and damping properties of steel and polypropylene fiber reinforced recycled aggregate concrete under uniaxial low-cycle loadings. Constr. Build. Mater. 2022, 319, 126191. [Google Scholar] [CrossRef]
  35. Zhang, Y.; Zhao, Y. Hysteretic energy dissipation in aluminium matrix syntactic foam under intermittent cyclic compression. Materialia 2019, 6, 100286. [Google Scholar] [CrossRef]
  36. Luo, F.; Zhao, S.; Ma, W.; Jiao, G.; Kong, X. Quantitative Study on the Hysteresis Curve Characteristics of Frozen Clays in the Qinghai-Tibet Plateau. J. Rock Mech. Eng. 2013, 32, 208–215. [Google Scholar]
  37. Lin, J.; Wang, W.; Cheng, X.; Pan, H. Experimental study on the dynamic properties of low-cement sludge solidified soil under long-term cyclic loading. Sci. Rep. 2025, 15, 24947. [Google Scholar] [CrossRef]
  38. Monismith, C.L.; Ogawa, N.; Freeme, C. Permanent deformation characteristics of subgrade soils due to repeated loading. Transp. Res. Rec. 1975, 537, 1–17. [Google Scholar]
  39. Wang, J.; Xiong, F.; Liu, X.; Wang, Y.; Nian, T. Experimental study on the dynamic characteristics of Zhoushan marine soft clay under different loading frequencies and cyclic stress ratios. China Earthq. Eng. J. 2023, 45, 260–269. [Google Scholar] [CrossRef]
  40. Zhuang, X.; Wang, J.; Wang, K.; Li, K.; Hu, Z. Experimental study on dynamic characteristics of expansive soil modified byweathered sand. Rock Soil Mech. 2018, 39, 149–156. [Google Scholar] [CrossRef]
  41. Zhuang, X.S.; Zhao, H.W.; Wang, J.X.; Huang, Y.J.; Hu, Z. Quantitative research on morphological characteristics of hysteretic curves of remolded weak expansive soil under cyclic loading. Rock Soil Mech. 2020, 41, 43. [Google Scholar] [CrossRef]
  42. Liu, M.; Chen, X.; Cai, L.; Luo, H. Regulatory mechanism of humic substances on microbially induced carbonate precipitation. Constr. Build. Mater. 2025, 458, 139581. [Google Scholar] [CrossRef]
  43. Qian, J.; Yu, J.; Sun, H.; Ma, Y. Formation and Function of Ettringite in Cement Hydrates. J. Chin. Ceram. Soc. 2017, 45, 1569–1581. [Google Scholar] [CrossRef]
  44. Jiao, Z.; Liu, H.; Cai, Z. Experimental study on cement-soil strength in mucky-acid soil. Rock Soil Mech. 2005, S1, 57–60. [Google Scholar]
  45. Liu, H.; Xu, Z.; Shao, Z. Effect of Organic Matters on Mechanical Properties of Cement Treated Red Clay and its Micro-mechanism. Soil Eng. Found. 2021, 35, 645–648. [Google Scholar]
  46. Liu, H.; Zhen, W.; Chen, C.; Deng, R. Construction quality control of cement mixing pile for soft ground treatment. J. Ground Improv. 2020, 2, 527–532. [Google Scholar]
  47. Farzadnia, N.; Abang Ali, A.A.; Demirboga, R.; Anwar, M.P. Characterization of high strength mortars with nano Titania at elevated temperatures. Constr. Build. Mater. 2013, 43, 469–479. [Google Scholar] [CrossRef]
  48. Gu, X.; Xu, Y.; Yang, B.; Tong, L. Analysis of Factors Influencing the Strength of Cement-Stabilized Soil. In Proceedings of the 10th National Conference on Soil Mechanics and Geotechnical Engineering, Chinese Society for Civil Engineering, Chongqing City; Springer: Singapore, 2007; pp. 278–283. [Google Scholar]
  49. Wang, H.; Feng, G.; Qi, T.; Wang, L.; Ding, Q.; Pan, D.; He, J. Insight into the fracture mechanical properties of the interfacial transition zone of cemented coal gangue backfill under different stress angles by mesoscopic digital image correlation. Eng. Fract. Mech. 2024, 300, 109988. [Google Scholar] [CrossRef]
  50. Lei, J.J.; Wu, Z.X.; Wen, Z.J.; Cheng, Z.S.; Zhu, R. Mesoscale Analysis of the Effect of Interfacial Transition Zone on the Compressive Damage of Concrete Based on Discrete Element Method. Materials 2022, 15, 8840. [Google Scholar] [CrossRef]
  51. Bakhit, B.; Akbari, A. A comparative study of the effects of saccharin and β-SiC nano-particles on the properties of Ni and Ni–Co alloy coatings. Surf. Coat. Technol. 2014, 253, 76–82. [Google Scholar] [CrossRef]
  52. Huang, W. Effect of Supplementary Cementitous Materials of the Hydration and Microstructural Development of Ultra-High Performence Concrete. Ph.D. Thesis, Southeast University, Nanjing, China, 2017. [Google Scholar]
  53. Yin, X.; Rahman, M.M.; Sun, Y.; Zhao, Y.; Wang, J. Sustainable Soil-Cement Composites with Rice Husk Ash and Silica Fume: A Review of Performance and Environmental Benefits. Materials 2025, 18, 2880. [Google Scholar] [CrossRef]
  54. Manaviparast, H.R.; Cristelo, N.; Pereira, E.; Miranda, T. A Comprehensive Review on Clay Soil Stabilization Using Rice Husk Ash and Lime Sludge. Appl. Sci. 2025, 15, 2376. [Google Scholar] [CrossRef]
Figure 1. Particle size distribution curves of different soil types: (a) soft soil; (b) clay.
Applsci 16 03607 g001
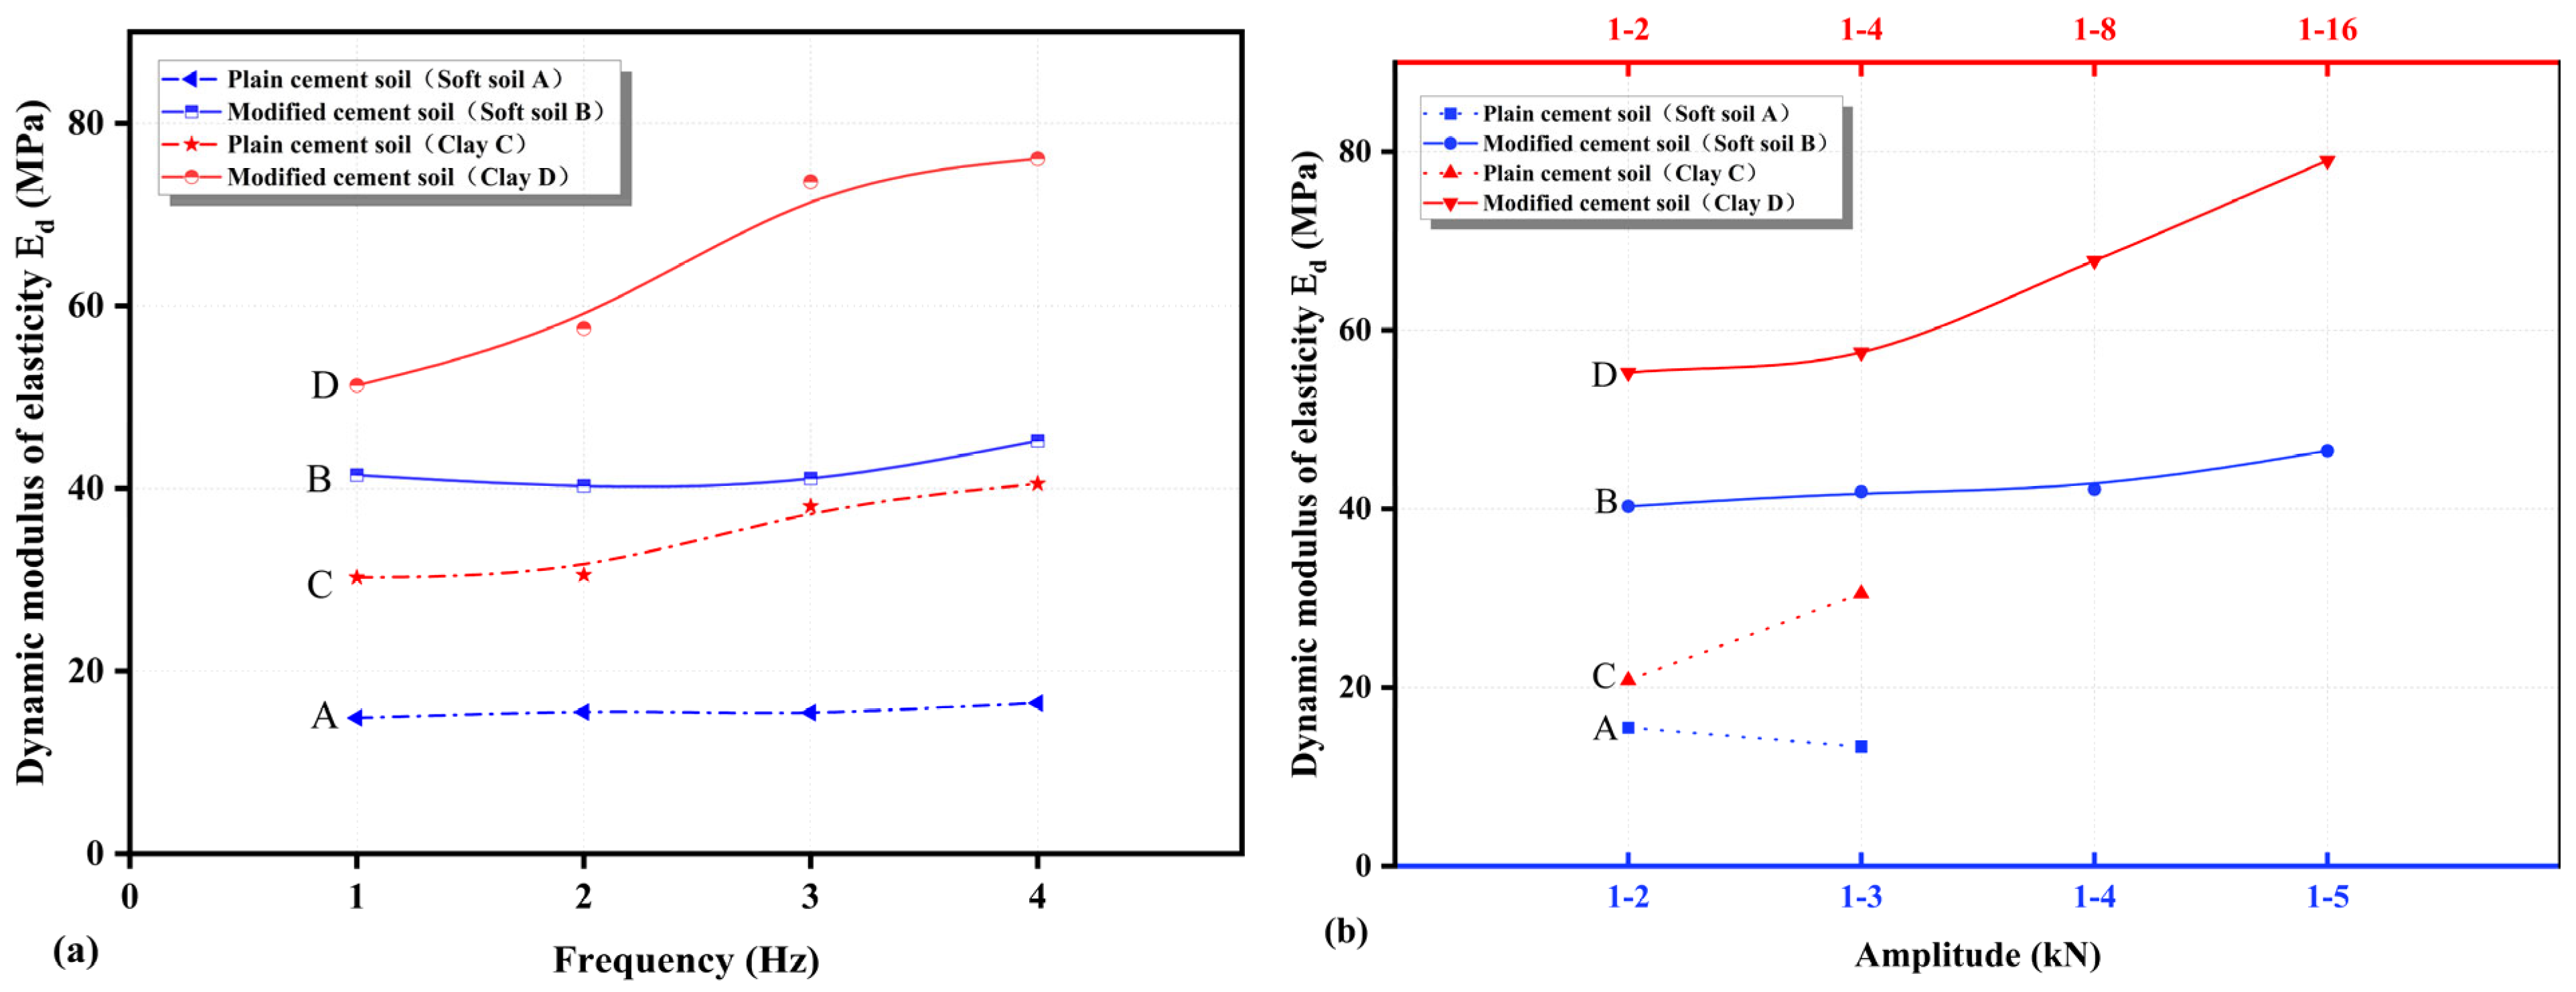
Figure 2. XRD patterns of the two soil types.
Applsci 16 03607 g002
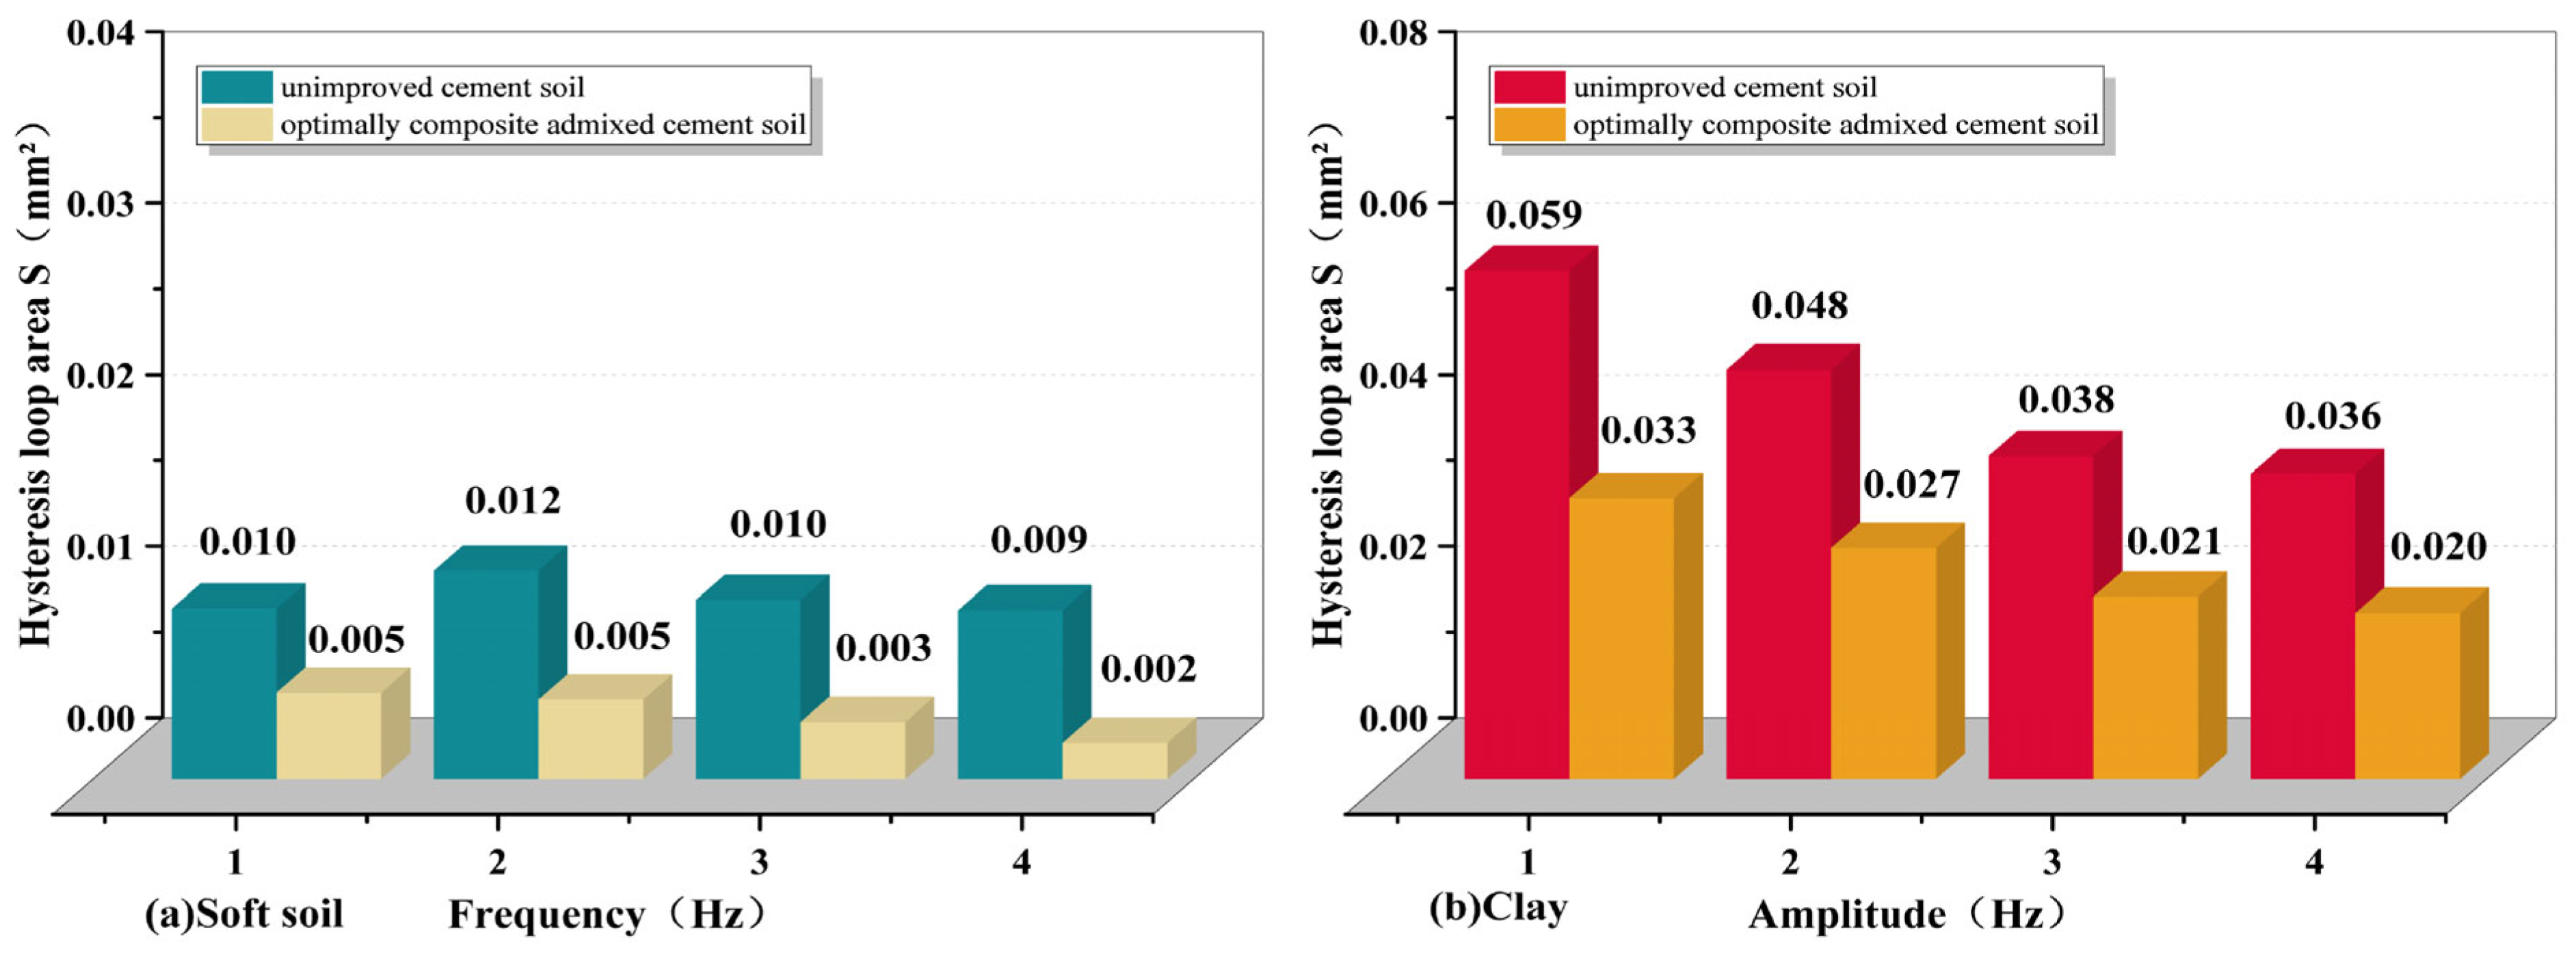
Figure 3. Experimental materials: (a) soft soil; (b) clay; (c) sand; (d) cement; (e) nano-SiO2.
Applsci 16 03607 g003
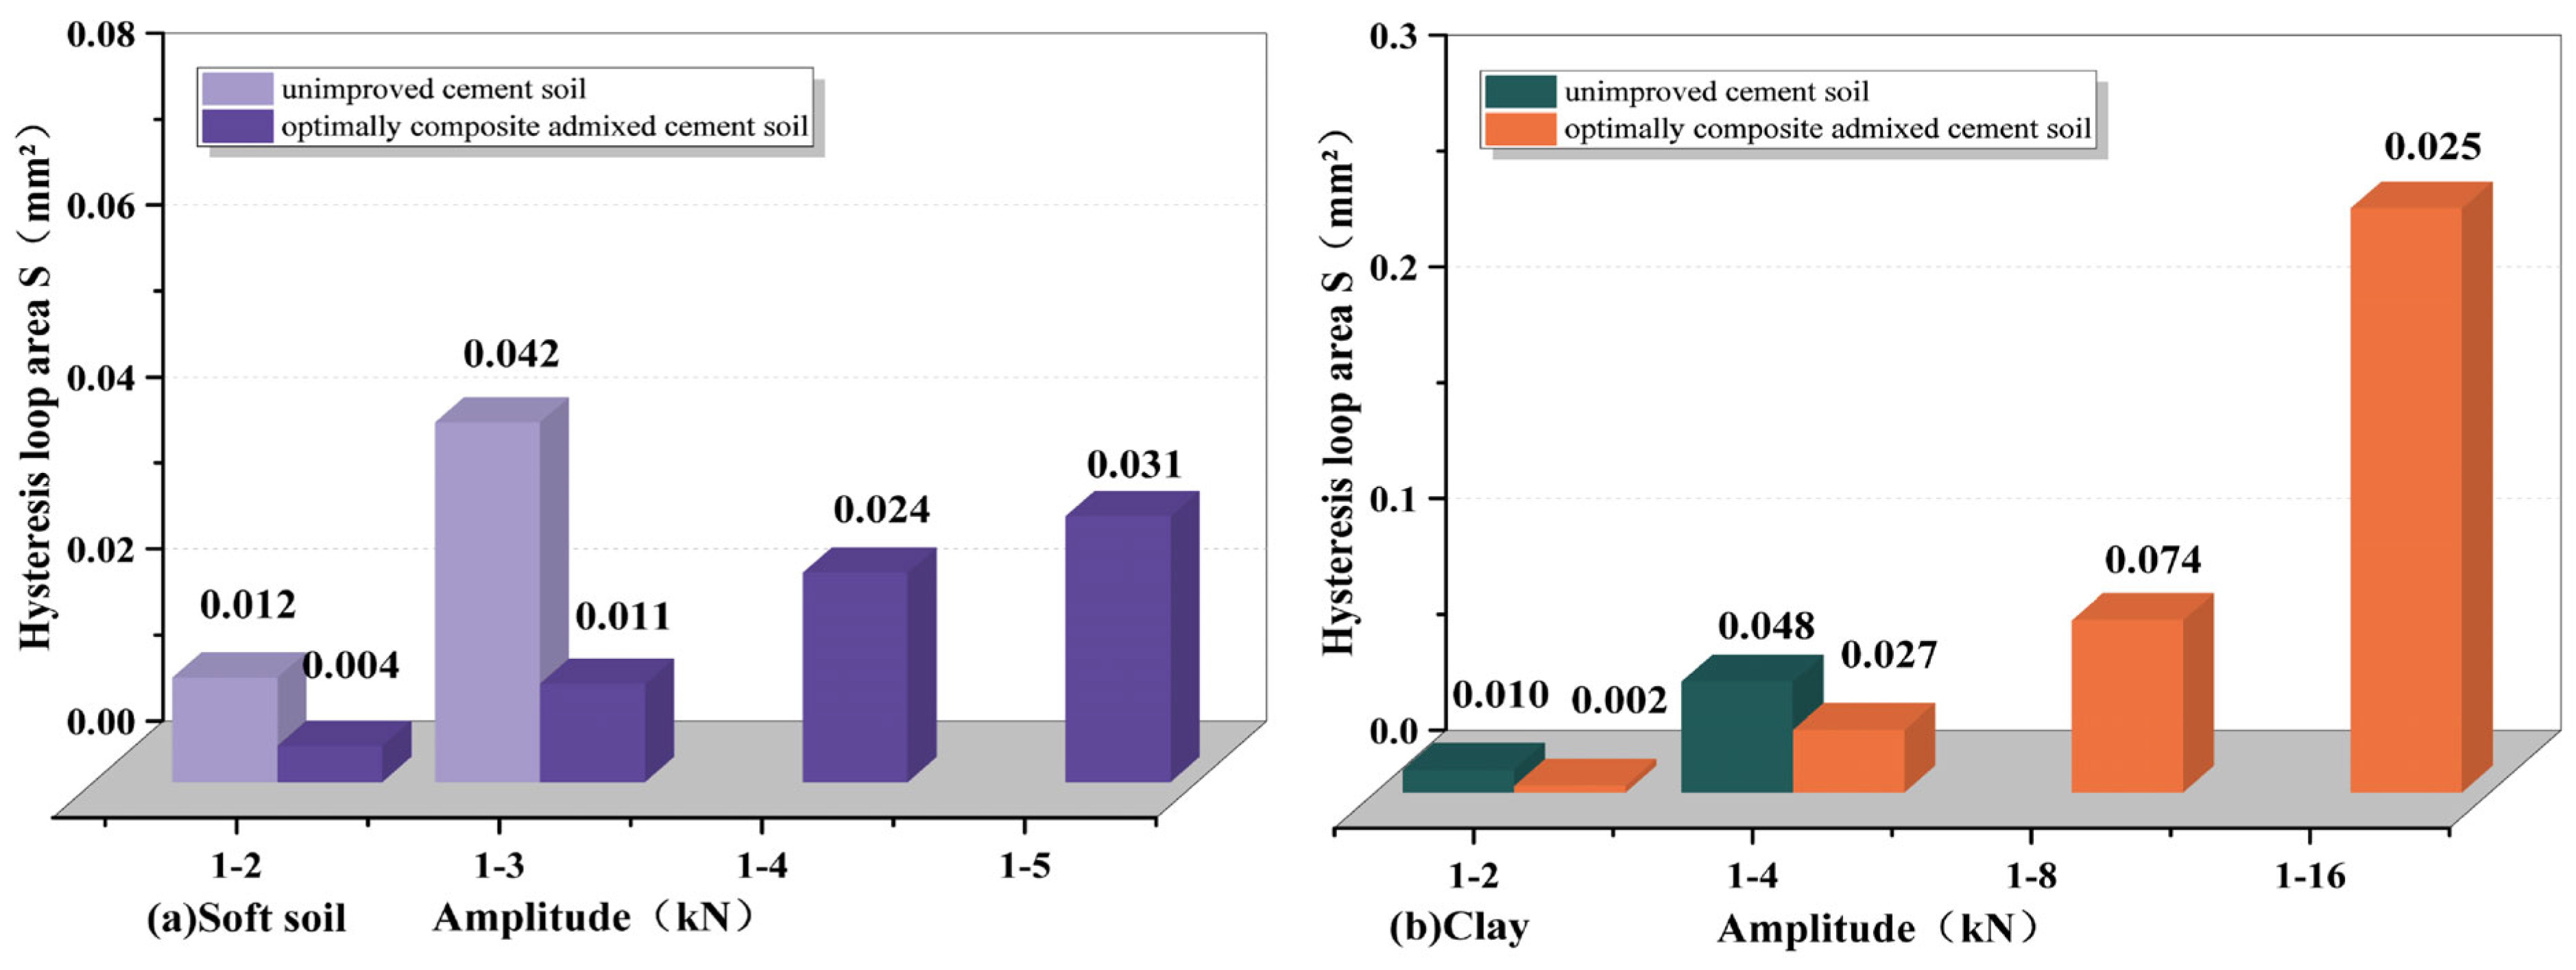
Figure 4. Muffle Furnace Test (“马弗炉系高温危险设备未经许可不得随便触碰”: muffle furnace are high-temperature hazardous equipment and must not be handled without authorization).
Applsci 16 03607 g004
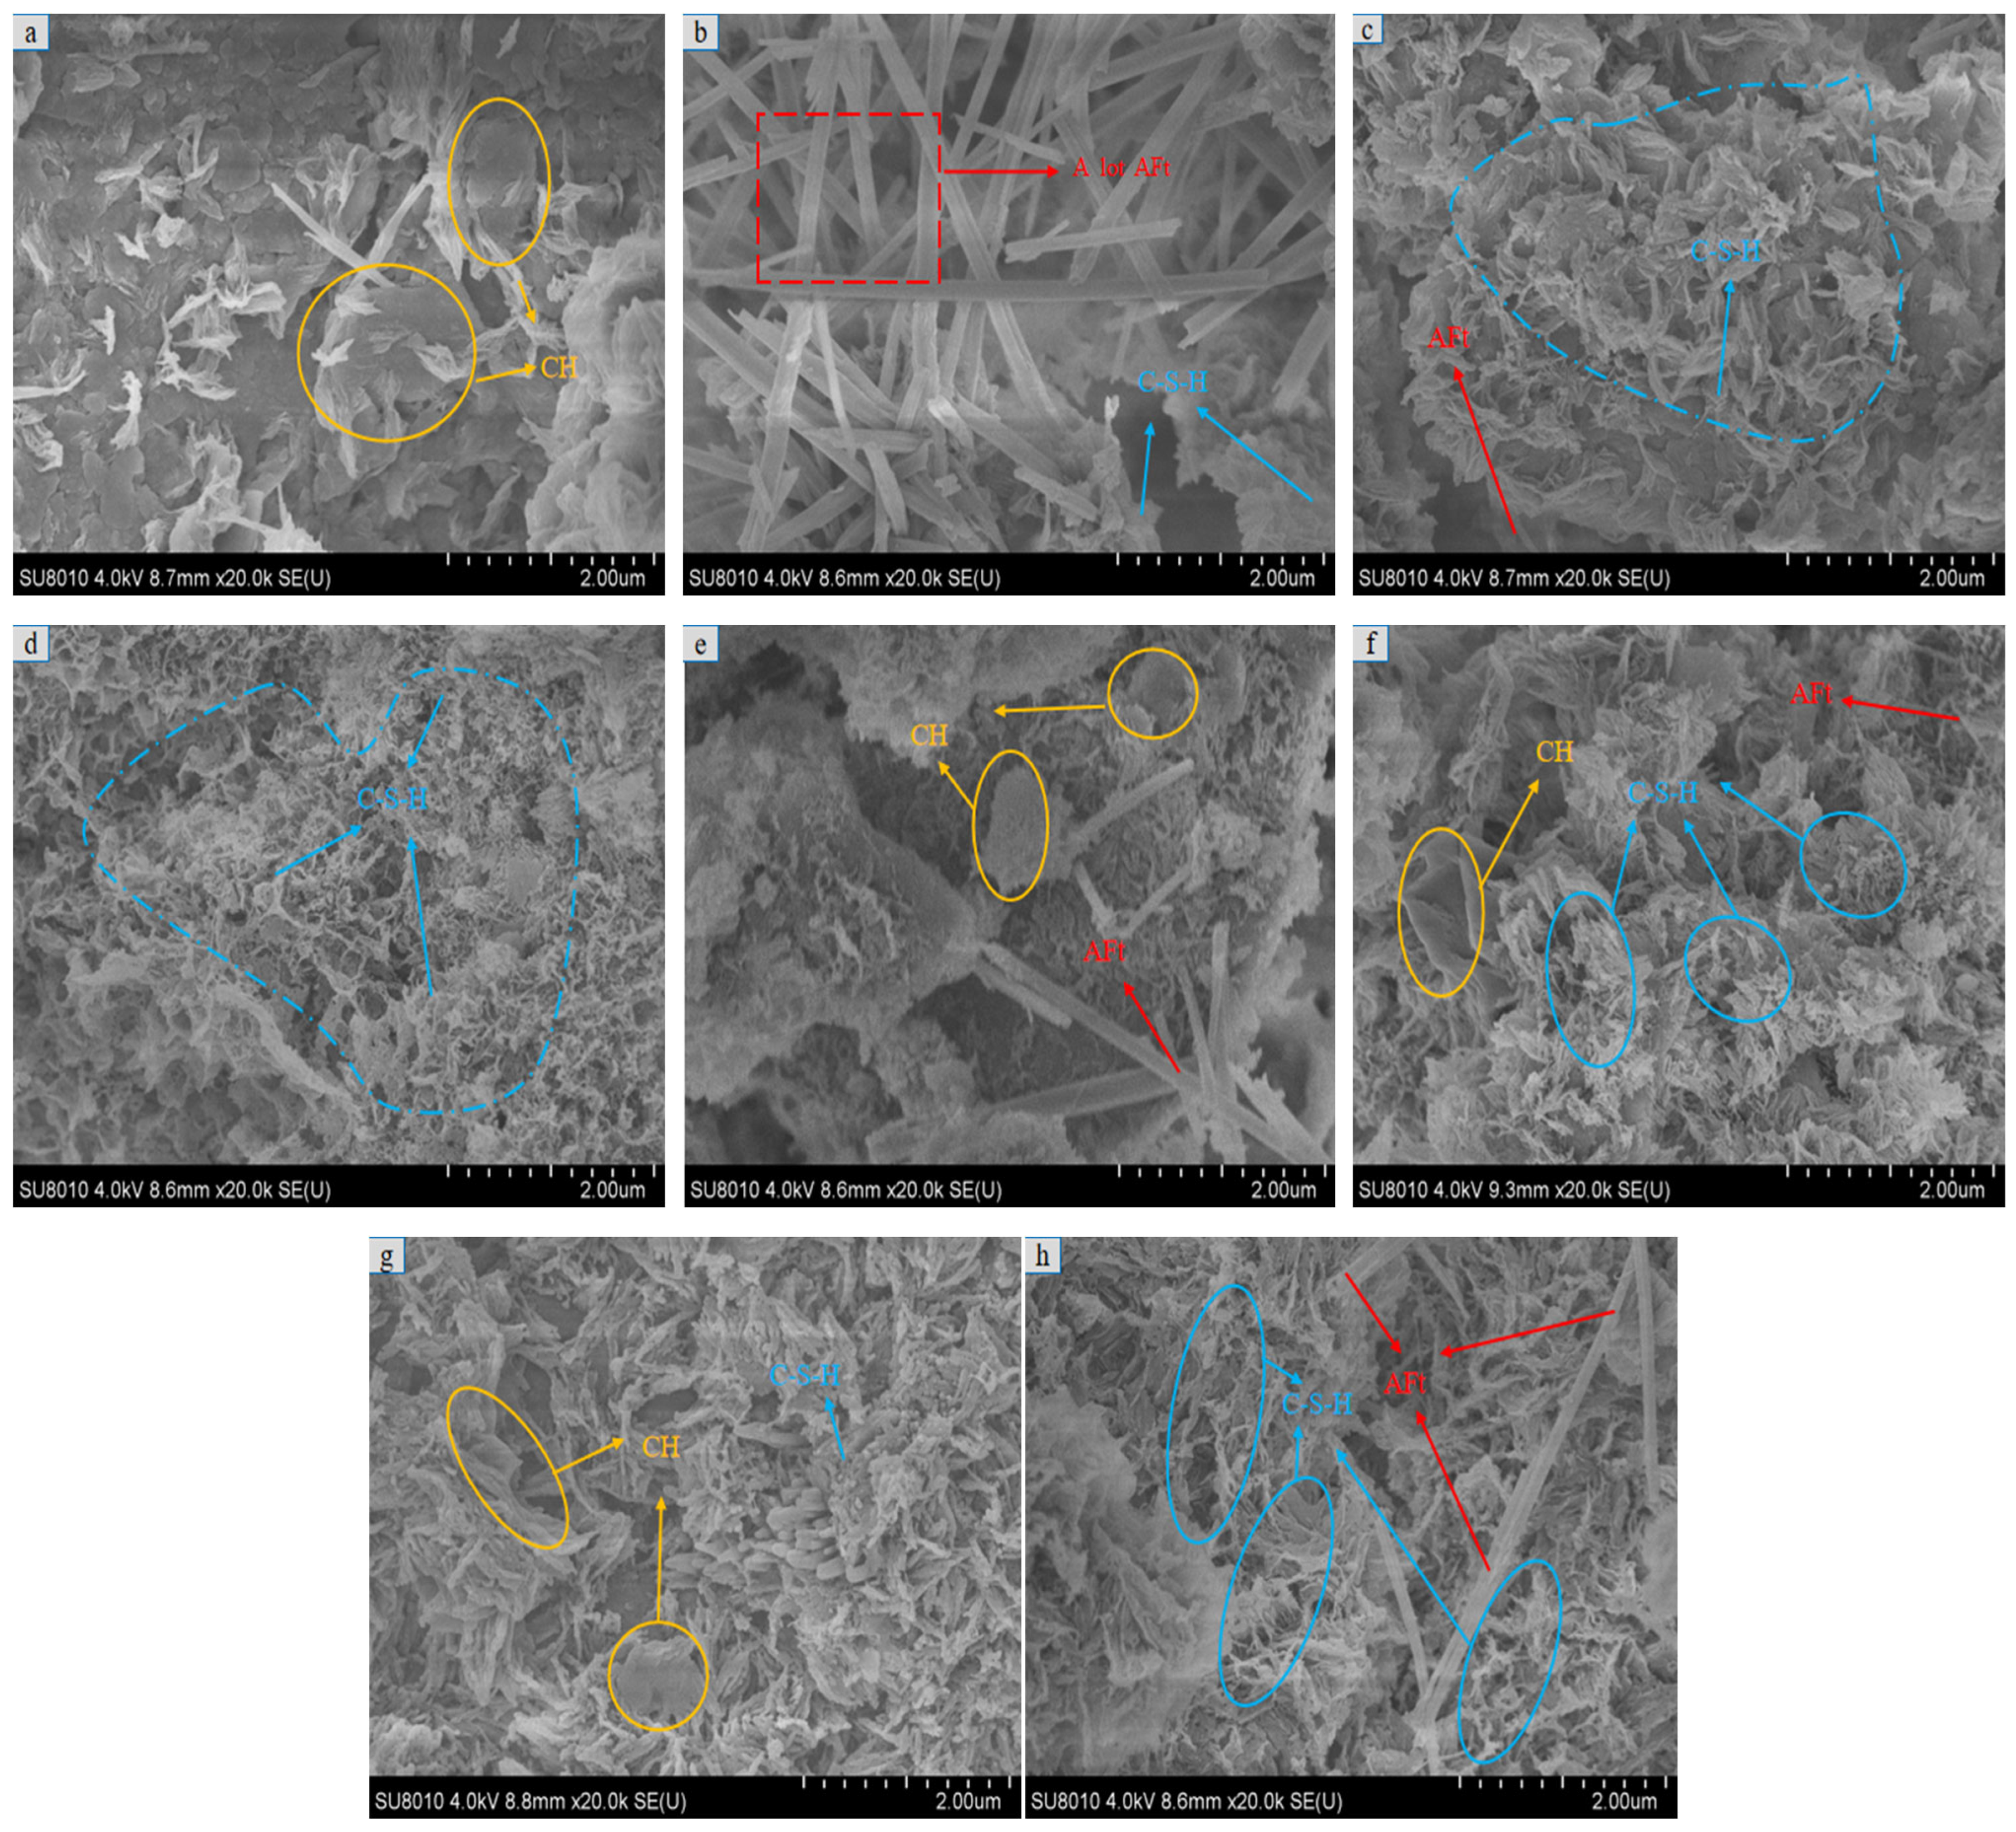
Figure 5. Sample preparation procedure.
Applsci 16 03607 g005
Figure 6. Liquid-plastic limit combined tester.
Applsci 16 03607 g006
Figure 7. (a) Electro-hydraulic servo dynamic/static fatigue testing machine; (b) Cylindrical specimen used for cyclic loading test (“中试弹力” is the name of the instrument manufacturer).
Applsci 16 03607 g007
Figure 8. Test equipment: (a) UCS; (b) SEM; (c) XRD.
Applsci 16 03607 g008
Figure 9. Stress–strain curves of cement-stabilized soft soil improved with different materials after 28 days of curing: (a) nano-SiO2 only; (b) sand only; (c) 10% sand combined with various dosages of nano-SiO2; (d) 20% sand combined with various dosages of nano-SiO2; (e) 30% sand combined with various dosages of nano-SiO2; (f) 40% sand combined with various dosages of nano-SiO2.
Applsci 16 03607 g009
Figure 10. Stress–strain curves from unconfined compressive strength tests of cement-stabilized clay after 28 days of curing with different modification schemes: (a) nano-SiO2 alone; (b) sand alone; (c) 10% sand combined with various dosages of nano-SiO2; (d) 20% sand combined with various dosages of nano-SiO2; (e) 30% sand combined with various dosages of nano-SiO2; (f) 40% sand combined with various dosages of nano-SiO2.
Applsci 16 03607 g010
Figure 11. Dynamic hysteresis loop (left); incomplete closed hysteresis loop curve (right).
Applsci 16 03607 g011
Figure 12. Relationship between cumulative strain and number of cycles.
Applsci 16 03607 g012
Figure 13. Damaged specimen (a) and undamaged specimen (b).
Applsci 16 03607 g013
Figure 14. Destructive test specimen (a) destructed specimen; (b) Complete destruction of the specimen.
Applsci 16 03607 g014
Figure 15. Dynamic strain at different peak strengths for unmodified soft soil cement-treated soil: (a) peak value 2 kN; (b) peak value 3 kN; (c) peak value 4 kN; (d) peak value 5 kN; and optimal composite dosage cement-treated soil: (A) peak value 2 kN; (B) peak value 3 kN; (C) peak value 4 kN; (D) peak value 5 kN.
Applsci 16 03607 g015
Figure 16. Dynamic strain at different peak strengths for unmodified clay-cemented soil: (a) peak value 2 kN; (b) peak value 4 kN; (c) peak value 8 kN; (d) peak value 16 kN; and optimal composite-blended modified cemented soil: (A) peak value 2 kN; (B) peak value 4 kN; (C) peak value 8 kN; (D) peak value 16 kN.
Applsci 16 03607 g016
Figure 17. Dynamic strain of unimproved soft soil: (a) 1 Hz; (b) 2 Hz; (c) 3 Hz; and cement-treated soil under cyclic loading at different frequencies: (d) 4 Hz.
Applsci 16 03607 g017
Figure 18. Dynamic strain of cement-treated soft soil at different frequency cyclic loads with optimal composite dosage: (A) 1 Hz; (B) 2 Hz; (C) 3 Hz; (D) 4 Hz.
Applsci 16 03607 g018
Figure 19. Dynamic strain at different frequencies for unmodified clay-cemented soil: (a) 1 Hz; (b) 2 Hz; (c) 3 Hz; (d) 4 Hz; and optimal composite-blended modified cemented soil: (A) 1 Hz; (B) 2 Hz; (C) 3 Hz; (D) 4 Hz.
Applsci 16 03607 g019
Figure 20. Fitted curves of cumulative strain versus number of load cycles under different loading frequencies: (a) Unmodified soft soil ement; (b) Optimally composite-modified soft soil cement; (c) Unmodified clay cement; (d) Optimally composite-modified clay cement.
Applsci 16 03607 g020
Figure 21. Fitted curves of cumulative strain versus number of load cycles under different loading amplitudes: (a) Unmodified soft soil cement; (b) Optimally composite-modified soft soil cement; (c) Unmodified clay cement; (d) Optimally composite-modified clay cement.
Applsci 16 03607 g021aApplsci 16 03607 g021b
Figure 22. Hysteresis loops of unmodified soft soil cement mixture at different frequencies: (a) 1 Hz, (b) 2 Hz, (c) 3 Hz, (d) 4 Hz.
Applsci 16 03607 g022
Figure 23. Optimal composite soft soil cement mixture at different frequencies: (a) 1 Hz, (b) 2 Hz, (c) 3 Hz, (d) 4 Hz.
Applsci 16 03607 g023aApplsci 16 03607 g023b
Figure 24. Hysteresis loops of unmodified clay-cemented soil at different frequencies: (a) 1 Hz, (b) 2 Hz, (c) 3 Hz, (d) 4 Hz.
Applsci 16 03607 g024aApplsci 16 03607 g024b
Figure 25. Optimal hysteresis loop curves of clay–cement composite soil at different frequencies: (a) 1 Hz, (b) 2 Hz, (c) 3 Hz, (d) 4 Hz.
Applsci 16 03607 g025
Figure 26. Hysteresis loops of unmodified cemented soft soil at different load amplitudes: (a) 1–2 kN; (b) 1–3 kN.
Applsci 16 03607 g026
Figure 27. Optimal composite dosage for improving the hysteresis curve of cement-treated soft soil at different load ranges: (a) 1–2 kN; (b) 1–3 kN; (c) 1–4 kN; (d) 1–5 kN.
Applsci 16 03607 g027aApplsci 16 03607 g027b
Figure 28. Hysteresis loop curves of unmodified clay-cemented soil at different loading amplitudes: (a) 1–2 kN; (b) 1–3 kN.
Applsci 16 03607 g028
Figure 29. Optimal composite dosage for improving clay-cemented soil hysteresis loop curves at different amplitudes: (a) 1–2 kN; (b) 1–4 kN; (c) 1–8 kN; (d) 1–16 kN.
Applsci 16 03607 g029aApplsci 16 03607 g029b
Figure 30. Influencing factors of dynamic deformation modulus of cement-stabilized soil: (a) different loading frequencies; (b) loading amplitudes (The red line corresponds to the upper x-axis, and the blue line corresponds to the lower x-axis).
Applsci 16 03607 g030
Figure 31. Relationship between frequency and hysteresis loop area of cement-stabilized soil: (a) soft soil; (b) clay.
Applsci 16 03607 g031
Figure 32. Influence of loading amplitude on hysteresis loop area: (a) soft soil; (b) clay.
Applsci 16 03607 g032
Figure 33. Scanning electron microscope (SEM) results of cemented soils at 20,000× magnification with different additive amounts: (a) unmodified cemented soft soil; (b) 3.5% nano-SiO2 cemented soft soil; (c) 40% sand cemented soft soil; (d) 3.5% nano-SiO2, 40% sand cemented soft soil; (e) unmodified clay cemented soil; (f) 3.5% nano-SiO2 clay cemented soil; (g) 40% sand clay cemented soil; (h) 3.5% nano-SiO2, 40% sand clay cemented soil.
Applsci 16 03607 g033
Figure 34. Scanning electron microscope (SEM) results of cemented soils at 500× magnification with different additive amounts: (a) unmodified cemented soft soil; (b) 3.5% nano-SiO2 cemented soft soil; (c) 40% nand cemented soft soil; (d) 3.5% nano-SiO2, 40% sand cemented soft soil; (e) unmodified clay cemented soil; (f) 3.5% nano-SiO2 clay cemented soil; (g) 40% sand clay cemented soil; (h) 3.5% nano-SiO2, 40% sand clay cemented soil.
Applsci 16 03607 g034
Figure 35. X-ray diffraction (XRD) patterns of soft soil cement and clay cement after 28 days of curing: (a) soft soil; (b) clay.
Applsci 16 03607 g035
Figure 36. The X-ray diffraction peak intensity of the cemented soft soil after 28 days of curing.
Applsci 16 03607 g036
Figure 37. The X-ray diffraction peak intensity of the clay cemented soil after 28 days of curing.
Applsci 16 03607 g037
Table 1. Basic physicochemical properties of Nano-SiO2.
AppearanceParticle Size
(nm)
Specific Surface Area (m2/g)Bulk Density (g/cm3)Purit
(%)
White powder23~35190~2500.05799.5
Table 2. Basic physical properties of the soils.
Soil ClassificationMaximum Dry Density (g/cm3)Digging Depth
(m)
Organic Content (%)Liquid Limit (%)Plastic Limit (%)Plasticity IndexSampling Position
Soft soil1.363–87.6546.726.320.4District Riverbed
Clay1.753–63.3239.818.521.3A construction site in Wuhan
Table 3. The basic parameters of the PO42.5 ordinary Portland cement used in the experiment.
Inspection Items (Unit)National StandardActual Test Results
Specific surface area (m2/kg)≥300359
Sulfur Trioxide (%)≤3.52.87
Magnesium Oxide (%)≤5.03.66
Initial Setting Time (min)≥45173
Final Setting Time (min)≤600280
StabilityMust be qualifiedQualified
28-day Flexural Strength (MPa)≥6.58.9
28-day Compressive Strength (MPa)≥42.552.6
Table 4. Liquid and plastic limits of sand soft soil mixtures at different mix ratios.
Sand ContentLiquid Limit (%)Plastic Limit (%)Plasticity Index
0%46.728.318.4
10%42.226.317.9
20%37.724.613.1
30%34.023.012.0
40%31.220.49.8
Table 5. Liquid and plastic limits of sand clay mixtures at different mix ratios.
Sand ContentLiquid Limit (%)Plastic Limit (%)Plasticity Index
0%39.818.521.3
10%38.121.916.3
20%35.220.514.7
30%31.718.613.1
40%28.016.511.5
Table 6. Mix proportions for cement-treating soft soil with single-dosed nano-SiO2.
Soil
(g)
Sand Content (g)Cement Content (g)Nano-Level Dosage (g)Soil Moisture Content (g)Water Cement Ratio Moisture Content (g)Total Moisture Content (g)
100015070.056.7576.80
1000150.770.057.0777.12
1000151.470.057.3877.43
1000152.170.057.7077.75
1000152.870.058.0178.06
1000153.570.058.3378.38
Table 7. Composite dosage soft soil cement mixture proportions.
Soil
(g)
Sand Content (g)Cement Content (g)Nano-Level Dosage (g)Soil Moisture Content (g)Total Moisture Content (g)
901015063.370.05
9010150.763.370.37
9010151.463.370.68
9010152.163.371.00
9010152.863.371.31
9010153.563.371.63
Table 8. Unconfined compressive strength test scheme of cement-stabilized soils.
Test StageSoil TypesCement (%)Nano-SiO2 Dosage (%)Sand Dosage (%)Composite DosageCuring Period (d)Experimental Procedure
Stage 1Soft soil150, 0.7
1.4, 2.1
2.8, 3.5
10, 20,
30, 40
Sand-nano-SiO2 blend28UCS
Clay
Stage 2Soft soilThe optimal dosage of single-doped nano-SiO2Optimal dosage of single sand admixtureOptimal composite dosage
Clay
Table 9. Experimental scheme.
Soil TypeDosageCuring Period (d)Loading Frequency (Hz)Ultimate Strength (kN)Number of CyclesTest
Soft soil0%, 3.5% nano
-SiO2, 40% sand
2822, 3, 4, 520,000Cyclic fatigue test
1, 2, 3, 42
Clay22, 4, 8, 16
1, 2, 3, 44
Table 10. Experimental scheme of XRD and SEM.
Soil TypeDosageCuring PeriodText ConditionsTest
Soft soil0%, 3.5% nano-
SiO2, 40% sand, 3.5% nano-SiO2 + 40% sand
28 d500 times, 20,000 timesSEM
Claydiffraction angle 60°XRD
Disclaimer/Publisher’s Note: The statements, opinions and data contained in all publications are solely those of the individual author(s) and contributor(s) and not of MDPI and/or the editor(s). MDPI and/or the editor(s) disclaim responsibility for any injury to people or property resulting from any ideas, methods, instructions or products referred to in the content.