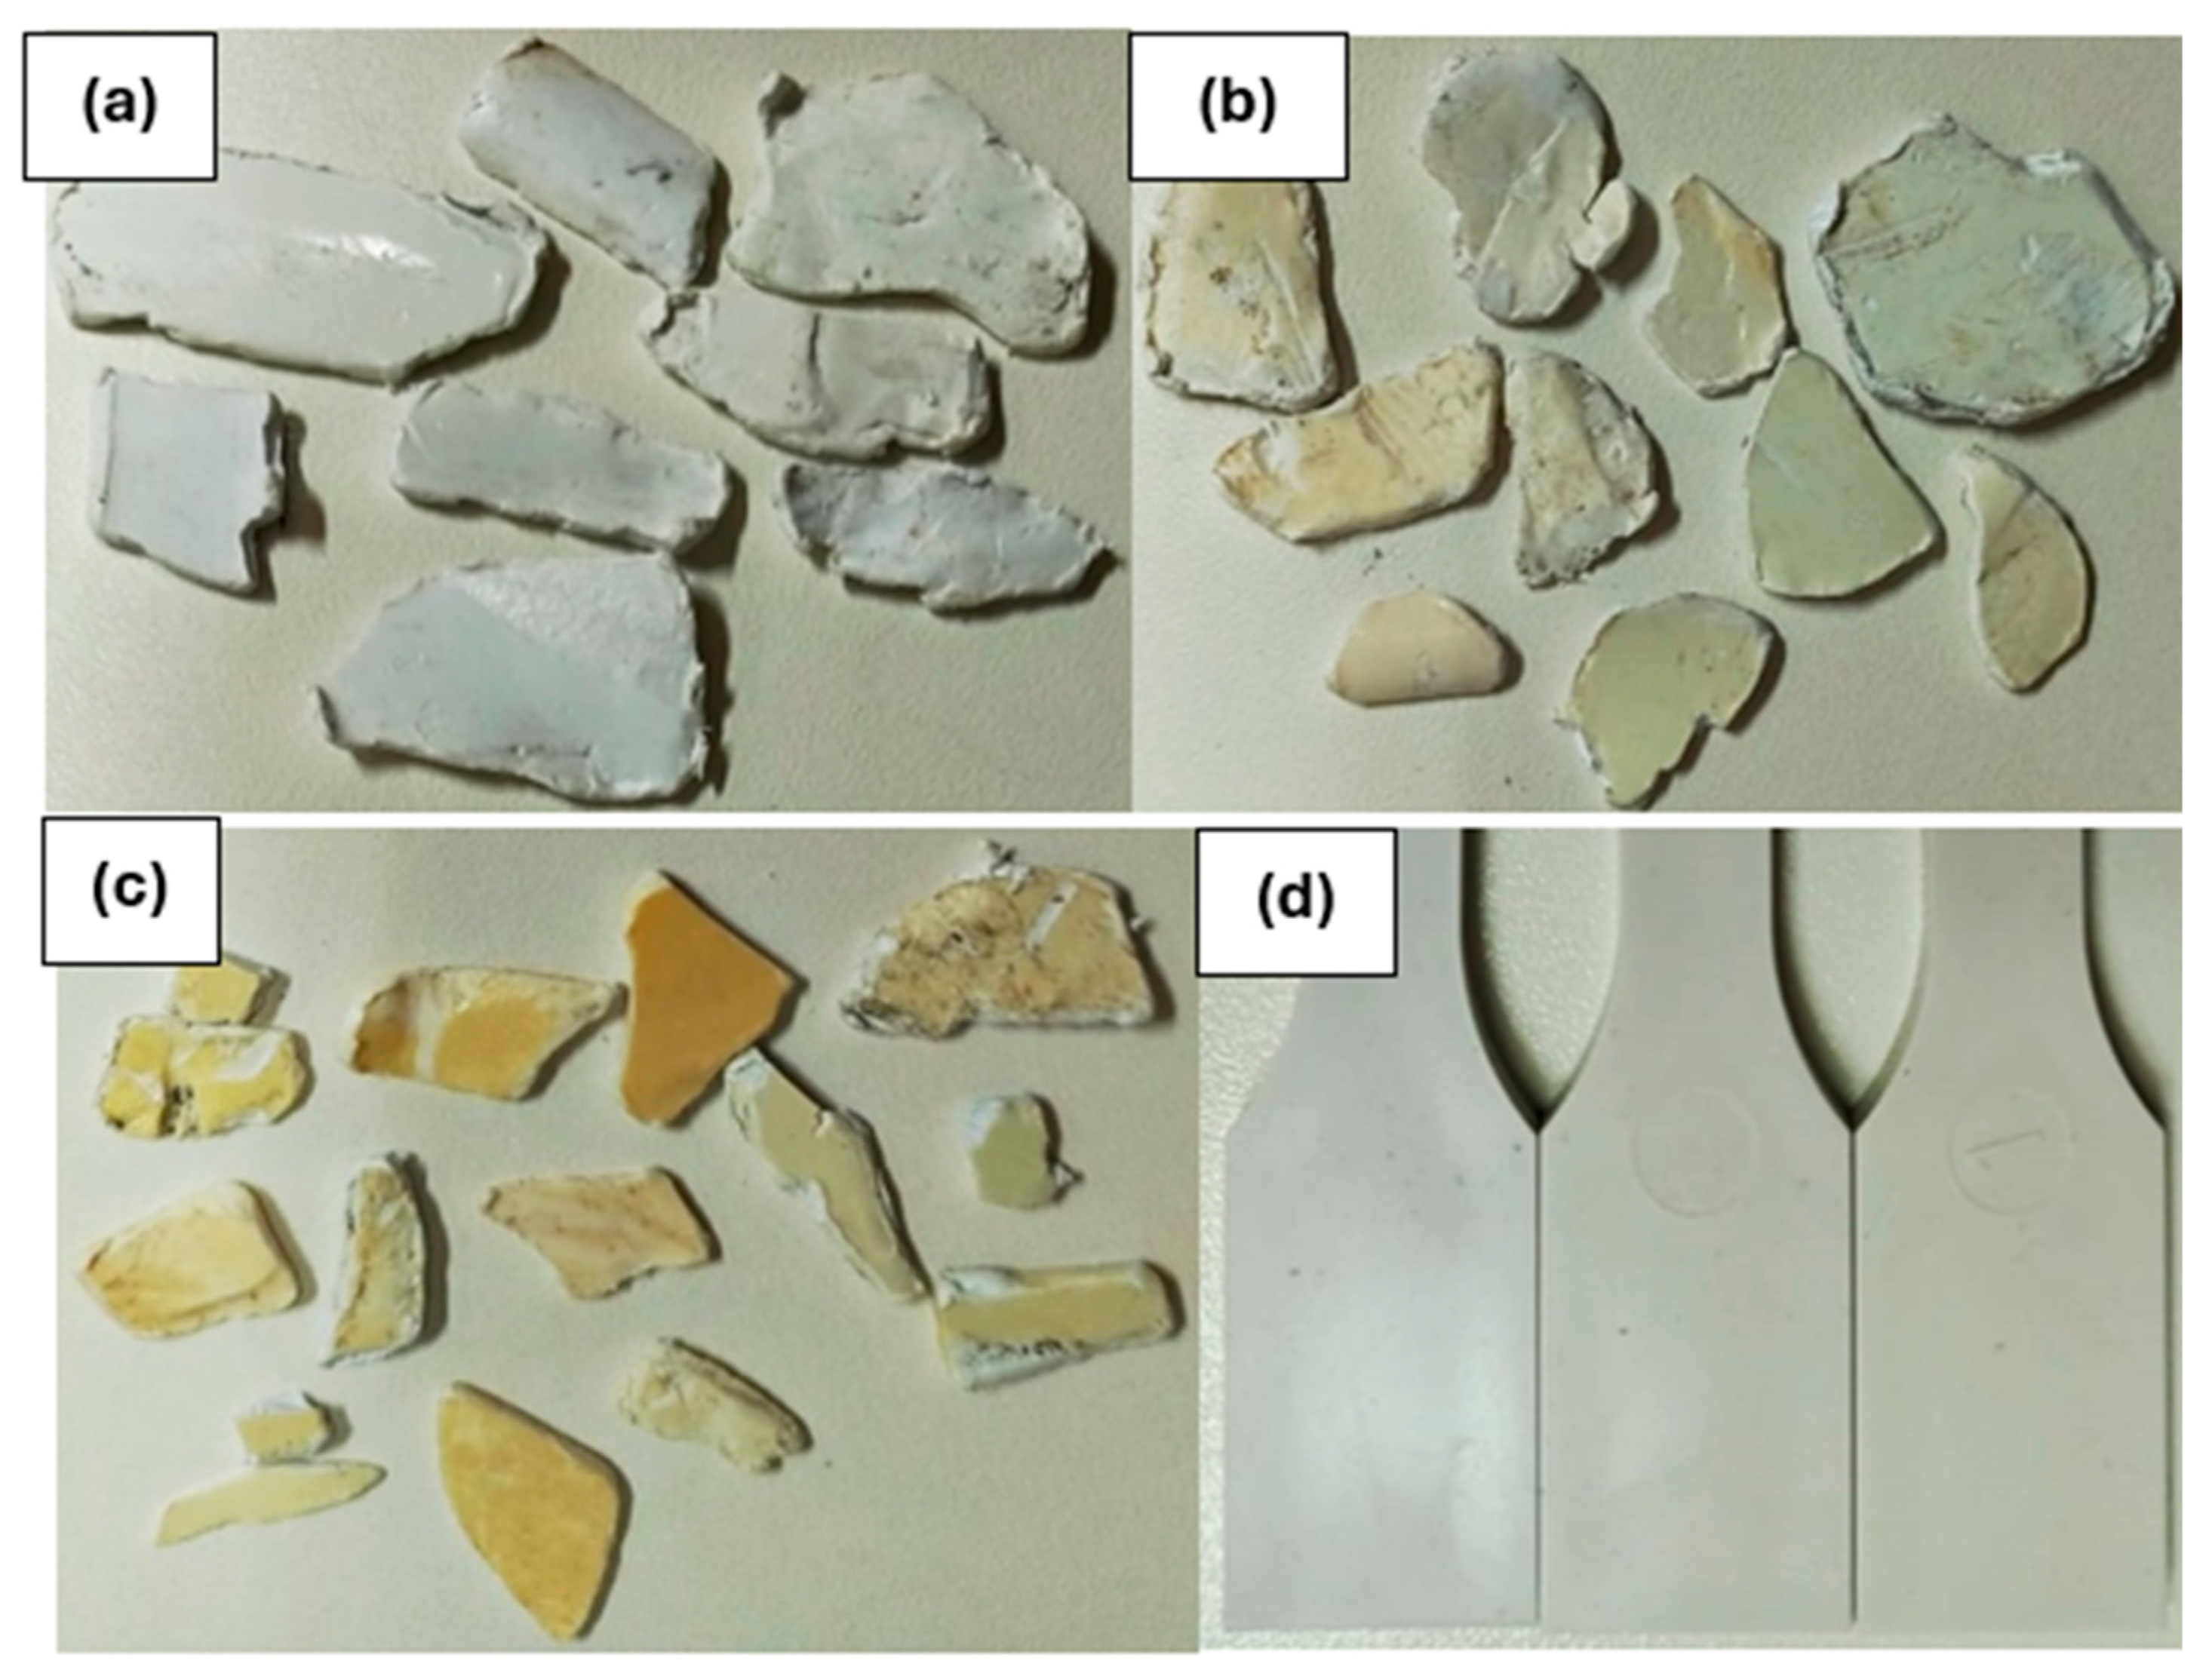
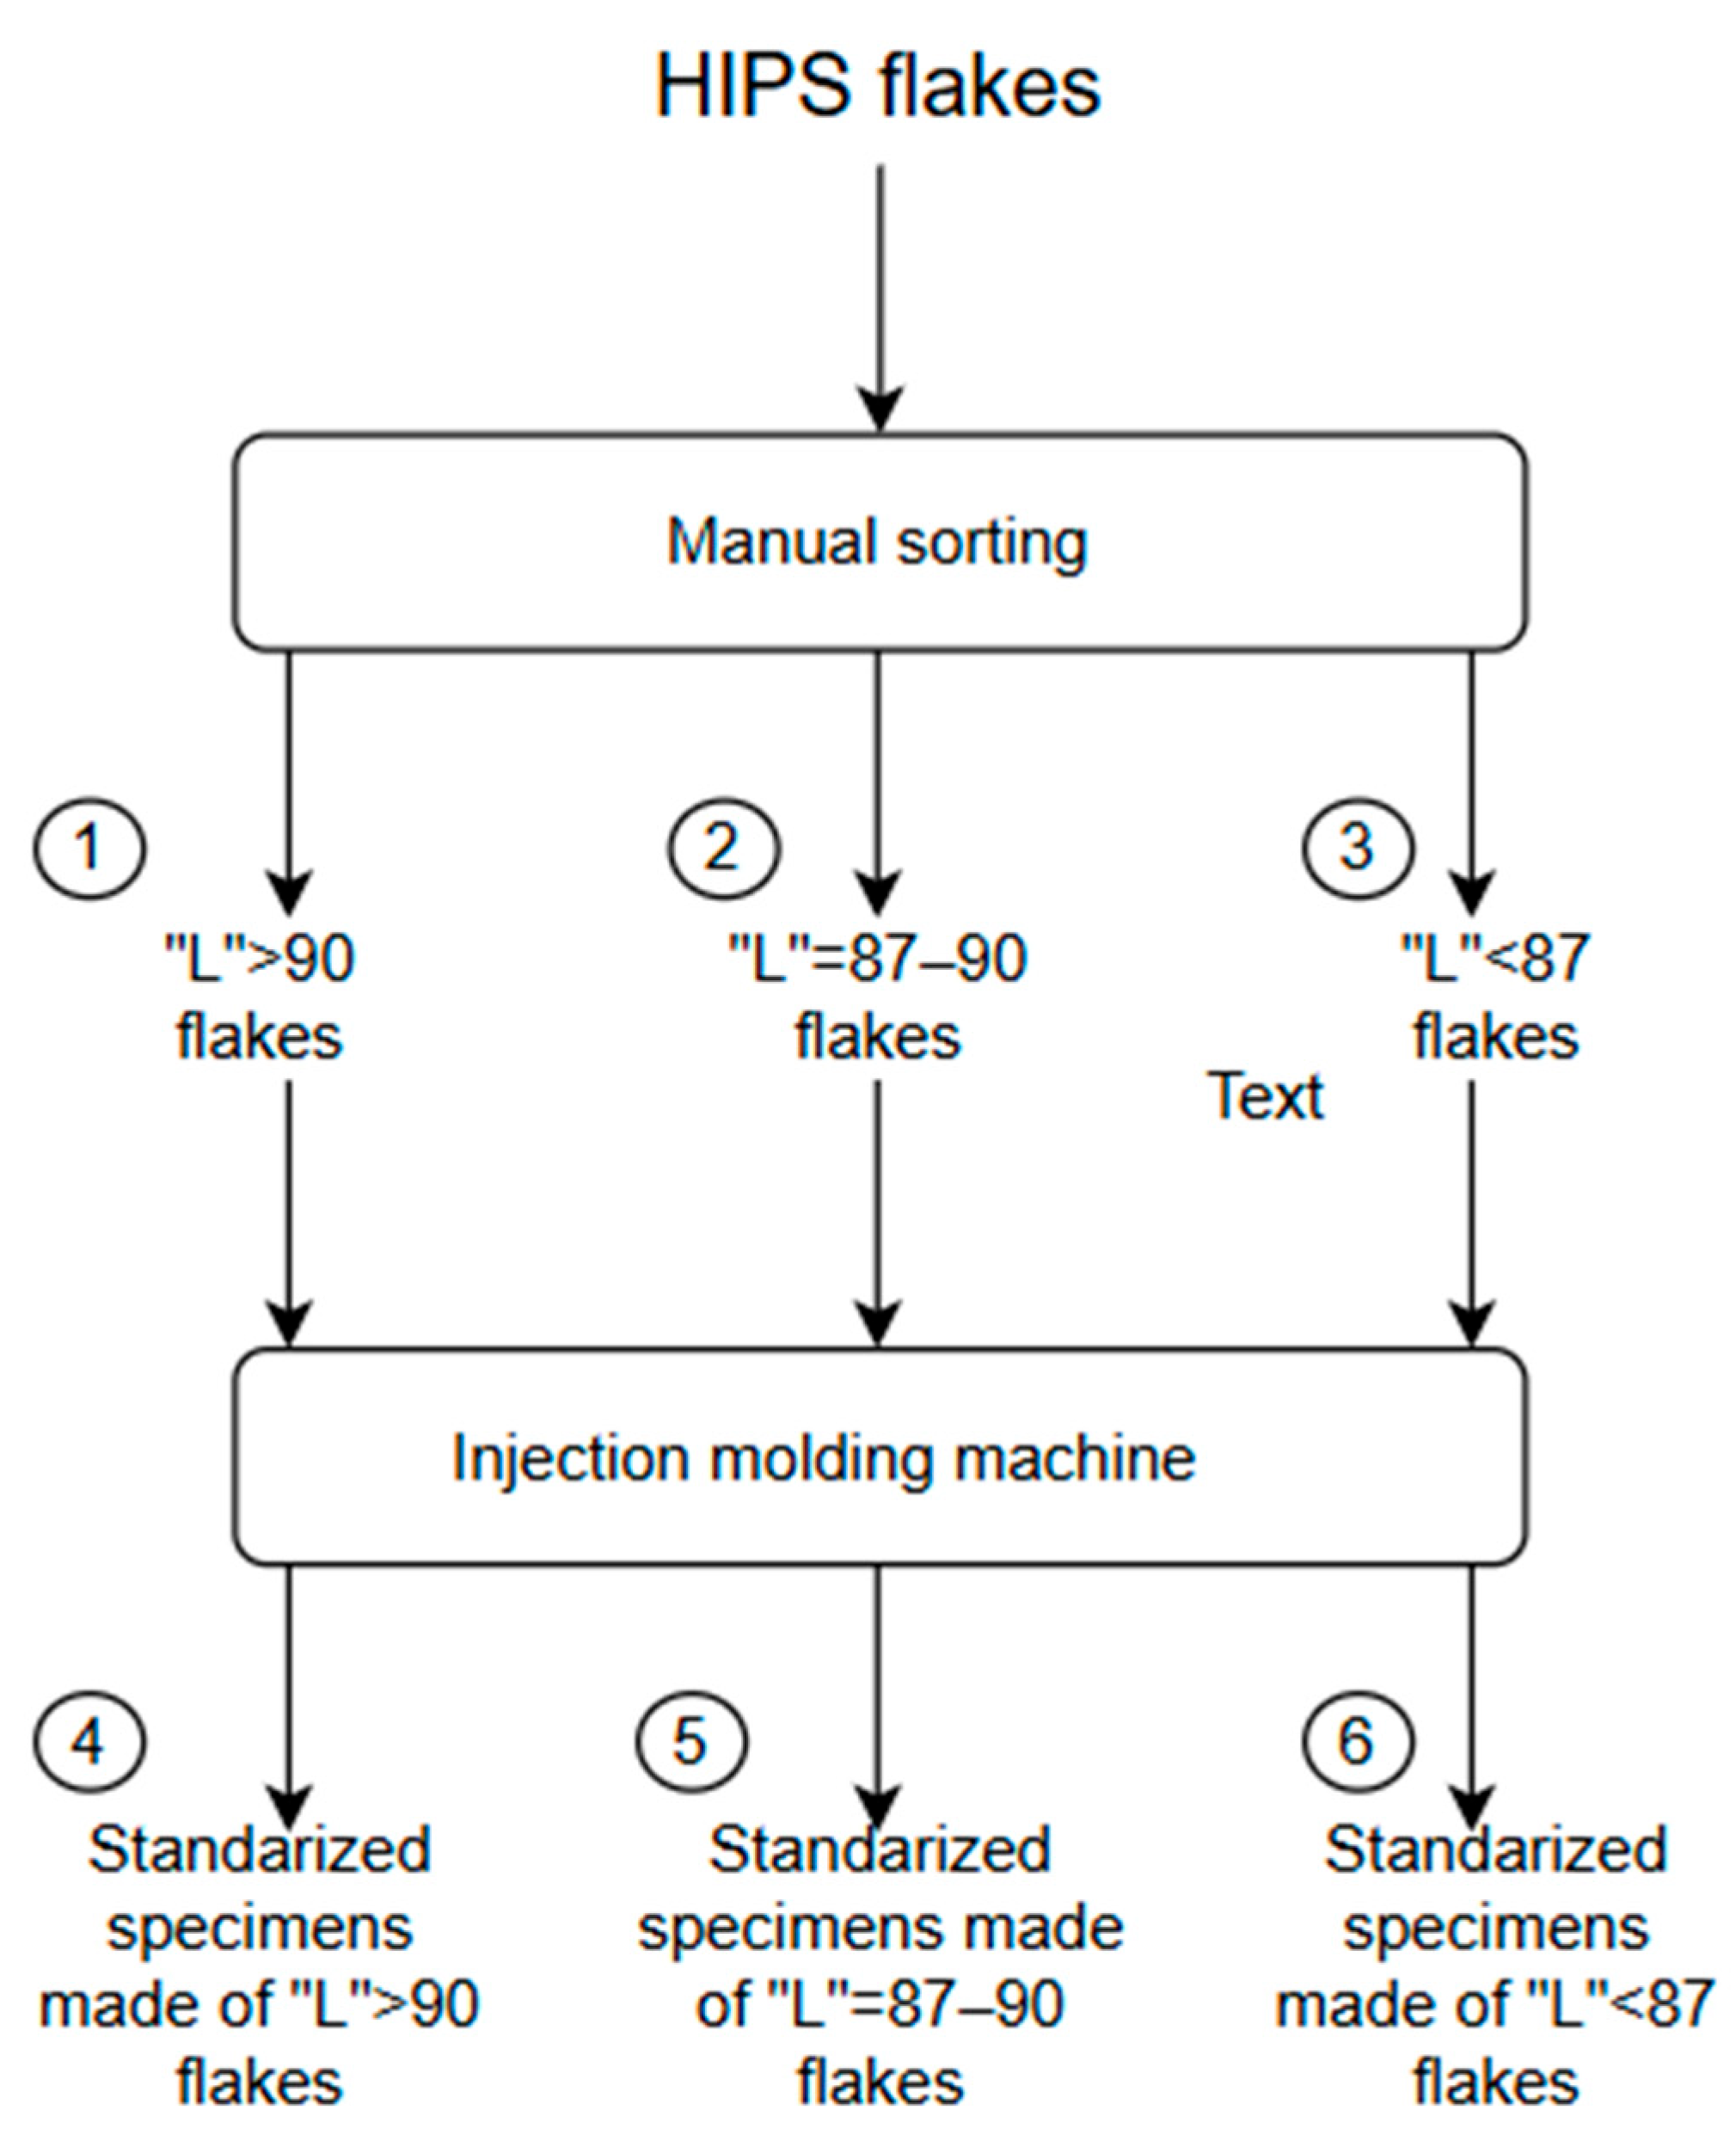
3.2. Melt Flow Index (MFI) Test
MFI results were as follows: “L” > 90 HIPS flakes—4.12 g/10 min, “L” = 87–90 HIPS flakes—3.97 g/10 min, and “L” < 87 HIPS flakes—2.95 g/10 min.
The average melt flow rate is the largest for the sample made of “L” > 90 HIPS flakes (4.12 g/10 min) and the smallest for the sample made of “L” < 87 HIPS flakes (2.95 g/10 min). Additionally, the extrudate obtained from the plastometer for the “L” < 87 fraction contained visible yellow inclusions.
In paper [
9], the melt flow rate (MFI) was measured for the reprocessed HIPS virgin material. Polymer material was subjected to thermo-oxidative aging at 90 °C in order to simulate its period of life. The MFI procedure was also followed according to the ISO 1133:1997 standard. After the first reprocessing step, the MFI value increased by only approximately 2%, and after nine extrusion cycles, the MFI value increased by approximately 45% (from approximately 4 g/10 min to approximately 5.5 g/10 min).
In studies [
11,
27,
28], although different test parameters were applied, an increase in MFI with increasing number of extrusion cycles was also observed. In another study [
1], MFI increased after several injection molding cycles, although a reduction after the first cycle was reported.
In paper [
28], only the first extrusion presented a decrease in MFI result (from 2.8 for the virgin HIPS to 1.7 g/10 min). In a doctoral thesis [
29], MFR increases slightly with reprocessing of HIPS samples subjected to up to nine extrusion cycles, especially for the first three extrusion cycles. The effects of UV radiation on MFI of HIPS have been published in papers [
14,
30]. In the first paper, there are no remarkable changes in MFI values of the materials after weathering (on the building roof) during the time up to 4320 h. Changes in MFI are only visible for longer weathering from 4320 h up to 8760 h. In the second study, after the photodegradation, MFI increases from 0.65 to 2.2 g/10 min. According to paper [
11], the melt flow index for five consecutive steps of reprocessing post-consumer HIPS increases slightly.
In this study, the MFI results indicate that a lower “L” parameter corresponds to a lower melt flow rate, suggesting reduced processability. However, the literature data show that MFI may both increase or decrease depending on the degradation stage and mechanism. This may indicate that the HIPS flakes analyzed in this study were moderately rather than severely degraded.
3.3. Analysis of Contact Angles by the Sessile Drop Method
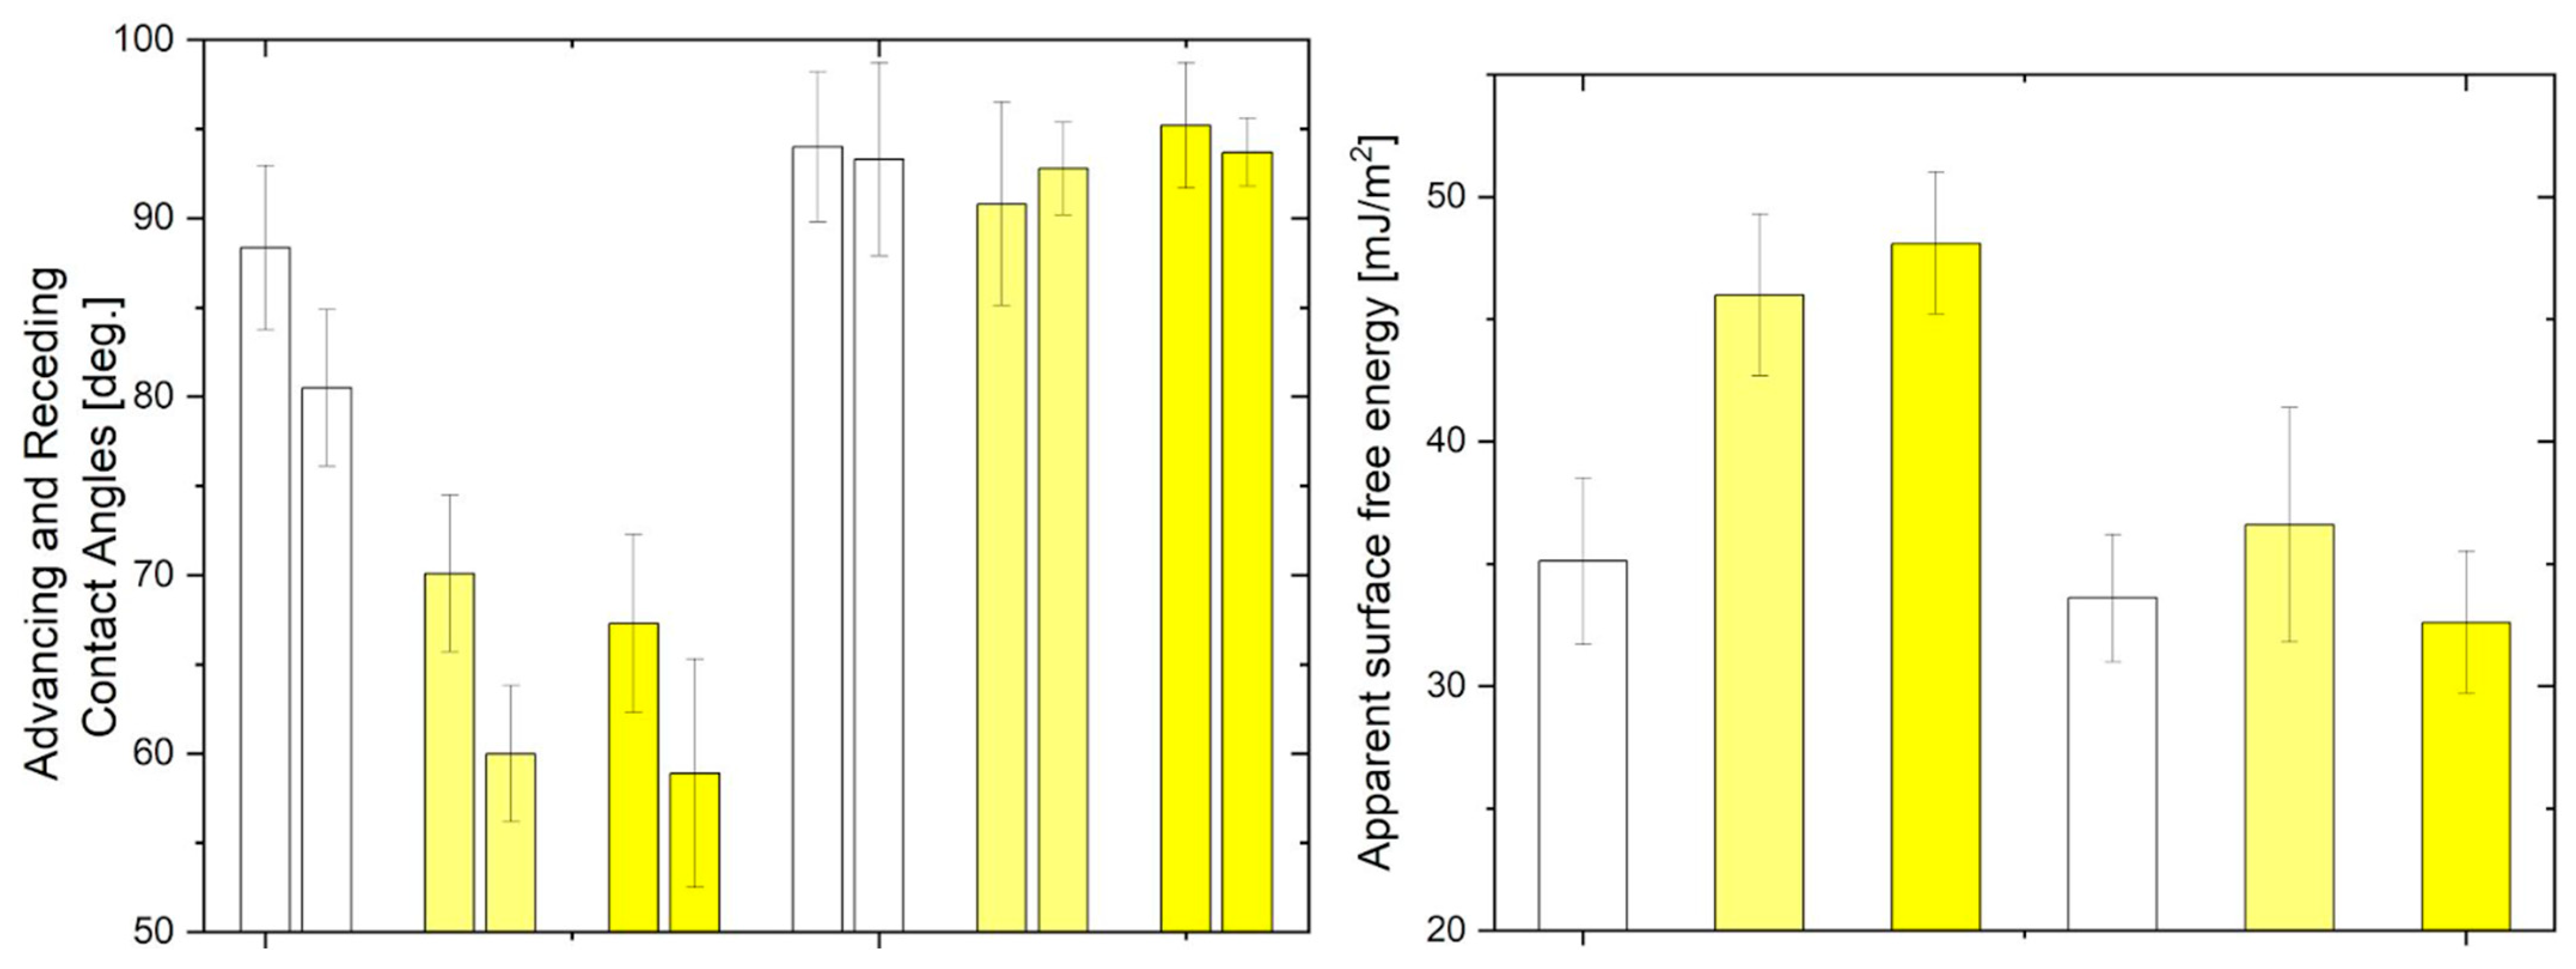
Contact angle results for the HIPS flakes and the HIPS dumbbells are given in
Table 1.
The contact angle of “L” > 90 HIPS flakes was the largest and amounted to 88.3°. The smallest result was obtained by the sample with “L” < 87 HIPS plastics, and it amounted to 68.2°. In the case of dumbbells, for the plates with the highest yellowness, the average contact angle was 93.7°. However, dumbbells made of “L” = 87–90 HIPS flakes had even lower wettability compared to the white dumbbells (86.9°), although this difference should be interpreted with caution because, when standard deviations are taken into account, the contact angle ranges for all dumbbells overlap. Therefore, these values should be considered statistically comparable rather than strictly higher or lower.
The contact angles (before the HIPS degradation) in the studies [
24,
31,
32,
33,
34] for HIPS were 81.0–102.5°, while the contact angle of “L” > 90 HIPS flakes was 88.3°. In this study, smaller contact angles were obtained for “L” = 87–90 and “L” < 87 HIPS flakes (after HIPS degradation) compared to [
24,
31,
32,
33,
34]. No papers about contact angle testing after HIPS thermo-oxidative, photochemical, and weathering degradation were reported.
Contact angles decrease with the decrease in the “L” parameter of the tested flakes’ surface. This indicates that plastic flakes with “L” < 87 are characterized by larger wettability. However, when measurement uncertainty is considered, this trend is not strictly monotonic and should be treated as a qualitative tendency rather than a statistically confirmed relationship. This may be attributed to the uneven surface of more degraded (more yellowed) plastics.
Values of standard deviations for HIPS flakes can be attributed to surface-related factors, such as roughness, curvature of the flakes, and the presence of contaminants (e.g., PUR foam residues or dirt), which locally affect droplet behavior. In contrast, for dumbbell specimens, which are produced by injection molding, surface roughness is significantly reduced and more uniform. Therefore, the relatively high standard deviation values observed for dumbbells (on the order of 4–5°) cannot be explained by surface roughness. Instead, they are most likely associated with the inherent heterogeneity of the recycled material, including variations in composition, pigment distribution, and the effects of melt processing and specimen formation.
Wetting angle results calculated for dumbbells did not show any significant differences (the largest difference was 7.1°), and the observed variations remain within the range of experimental dispersion. This further supports the conclusion that, after homogenization during injection molding, the influence of the degraded surface layer is significantly reduced, and the material exhibits nearly uniform wettability behavior. All the results obtained for dumbbells are similar to the wetting angle results for “L” > 90 HIPS flakes. It should be noted that the processing itself can cause a change in the properties of the processed material (the dumbbells were made after injection molding).
Comparing contact angle tests with [
24,
31,
32,
33,
34], where the HIPS contact angle was in the range from 81.0° to 102.6°, it is evident that “L” = 87–90 and “L” < 87 HIPS flakes were not included in this range. This proves the surface characteristic changes due to the yellowing phenomenon. However, due to the relatively large standard deviations and overlapping value ranges, this conclusion should be interpreted as indicative rather than definitive. The test results for the dumbbells are from 86.9° to 94°, being within the given range. The reason is the homogenization of 1 kg of plastic flakes samples, where only the surfaces were degraded (the remaining part of the flake was white).
Surface roughness plays a crucial role in determining the contact angle values obtained for test liquids on polymer surfaces. In Malinowska B. et al.’s previous study [
35], optical profilometry was used to characterize the surface topography of the same HIPS material as that investigated in the present work, i.e., post-consumer HIPS originating from refrigeration equipment. Surface maps with dimensions of 0.90 × 1.30 mm were recorded, corresponding to the area covered by the droplet during contact angle measurements. Five plates from each color-based fraction were examined. Due to the heterogeneous nature of the technological recyclate, the calculation of a simple average surface map was considered non-representative. Therefore, only the extreme cases (smoothest and roughest surfaces) were presented.
In contrast to laboratory-grade polymers, whose surface roughness is typically in the nanometer range (e.g., untreated ABS exhibiting an average roughness of approximately 53.10 nm), the investigated recyclate exhibits micrometer-scale roughness reaching several tens of micrometers. This pronounced roughness results from the mechanical grinding of entire refrigeration appliances, which generates irregular and curved flake geometries. The curved surface of the flakes inherently increases the dispersion of contact angle results and makes it difficult to obtain low standard deviation values. Furthermore, the recyclate may contain residual polyurethane (PUR) foam particles or surface contaminants that remain adhered to the HIPS flakes despite washing procedures. These heterogeneities contribute to local variations in wettability and thus influence the final contact angle values.
Although surface irregularities and material heterogeneity introduce variability into the measurements, contact angle remains a highly relevant parameter in the context of this research. From a technological perspective, even small differences in contact angle—within the range of standard deviation—can be sufficient for effective flotation-based separation of polymers on an industrial scale, as demonstrated in previous studies and industrial practice. Wettability is directly related to the efficiency of flotation-based separation processes on an industrial scale (tons of materials). Therefore, despite the inherent variability associated with real recyclate materials, contact angle analysis provides valuable insight into the surface condition and separation potential of naturally degraded HIPS.
It is well known that wetting behavior is governed primarily by two factors: surface roughness and surface polarity [
1,
2,
3]. In the present study, surface roughness results mainly from the mechanical grinding process and is therefore considered comparable across the analyzed fractions of the same recyclate stream. Consequently, differences observed in the contact angle values are interpreted mainly in terms of changes in surface chemistry caused by natural aging processes. Photo-oxidative degradation of HIPS leads to the formation of polar oxygen-containing functional groups on the polymer surface, which modifies surface polarity and thus affects wettability [
9,
10,
11,
12,
13,
14,
15]. Under these conditions, the influence of roughness can be regarded as relatively constant, allowing only qualitative conclusions to be drawn regarding the role of aging-induced chemical modifications in the observed wetting behavior.
3.5. Colorimetric Analysis
Table 2 presents the results for three of the HIPS dumbbells samples.
The “L” parameter did not reveal any significant differences between the dumbbells made of “L” > 90, “L” = 87–90, and “L” < 87 HIPS flakes. The same applies to the “a” parameter (the range from −128 to 127).
The “b” parameter, which describes the colors from blue to yellow (the range from −128 to 127), increased with increasing surface yellowness [
12].
The difference in the “b” parameter between the dumbbell made of “L” > 90 plastic flakes and that made of “L” < 87 plastic flakes was over 4.00. This means that the dumbbell made of flakes with a yellowed surface took on a color more similar to yellow, which confirms the obtained result of the “b” parameter.
In paper [
12], all the samples suffer from yellowing as a result of photo-oxidative laboratory degradation. The colorimetric data show a relatively small change in the “L” parameter (from 86.40 to 85.00) and the “a” parameter (from −1.37 to −2.08), but a significant change in the “b” parameter (from 8.46 to 19.10), indicating that discoloration was not a mere change in lightness (“L” parameter). These differences refer to the comparison between the non-aged reference HIPS sample and the HIPS sample subjected to the longest photo-oxidative aging time reported in that study. According to paper [
12], the calculated differences between these samples for the colorimetric parameters “L”, “a”, and “b” were 1.4, 3.45, and 10.46, respectively. The study [
13] presented the evolution of coloration during weathering, and it was mainly along the “b” parameter—the yellow indicator. In that work, the reported differences correspond to the comparison between the initial (unaged) material and the sample exposed to the longest weathering period. The difference between the “L” parameters was 7, and that between the “b” parameters was 19 in paper [
13]. In paper [
15], HIPS was degraded by photo-oxidation for 8 weeks. The luminosities (“L” parameter) were measured, and the evolution of the yellow/blue hue (“b” parameter) was investigated. The lightness parameter decreased from about 67 to 60, and the “b” parameter increased from approximately −4 to 15.
According to paper [
12], differences in parameters “L”, “a”, and “b” were 1.4, 3.45, and 10.46, respectively. The difference between the “L” parameters was 7, and that between the “b” parameters was 19 in paper [
13]. Also, in the study [
15], the largest increase in the parameter “b” was observed with the increasing HIPS degradation time. Comparing the above-mentioned research results, it is evident that the differences for all parameters were the smallest in this study (particularly for the “b” parameter). This may confirm that the HIPS analyzed in this work was less degraded than in the cited studies. Yellowing of only the top layer of HIPS is caused by the fact that oxygen does not have time to migrate deeper because the surface layers are too reactive to it and consume it quickly [
13].
3.6. ATR-FTIR Study—Analysis of Spectra Absorbances Characteristic of the HIPS
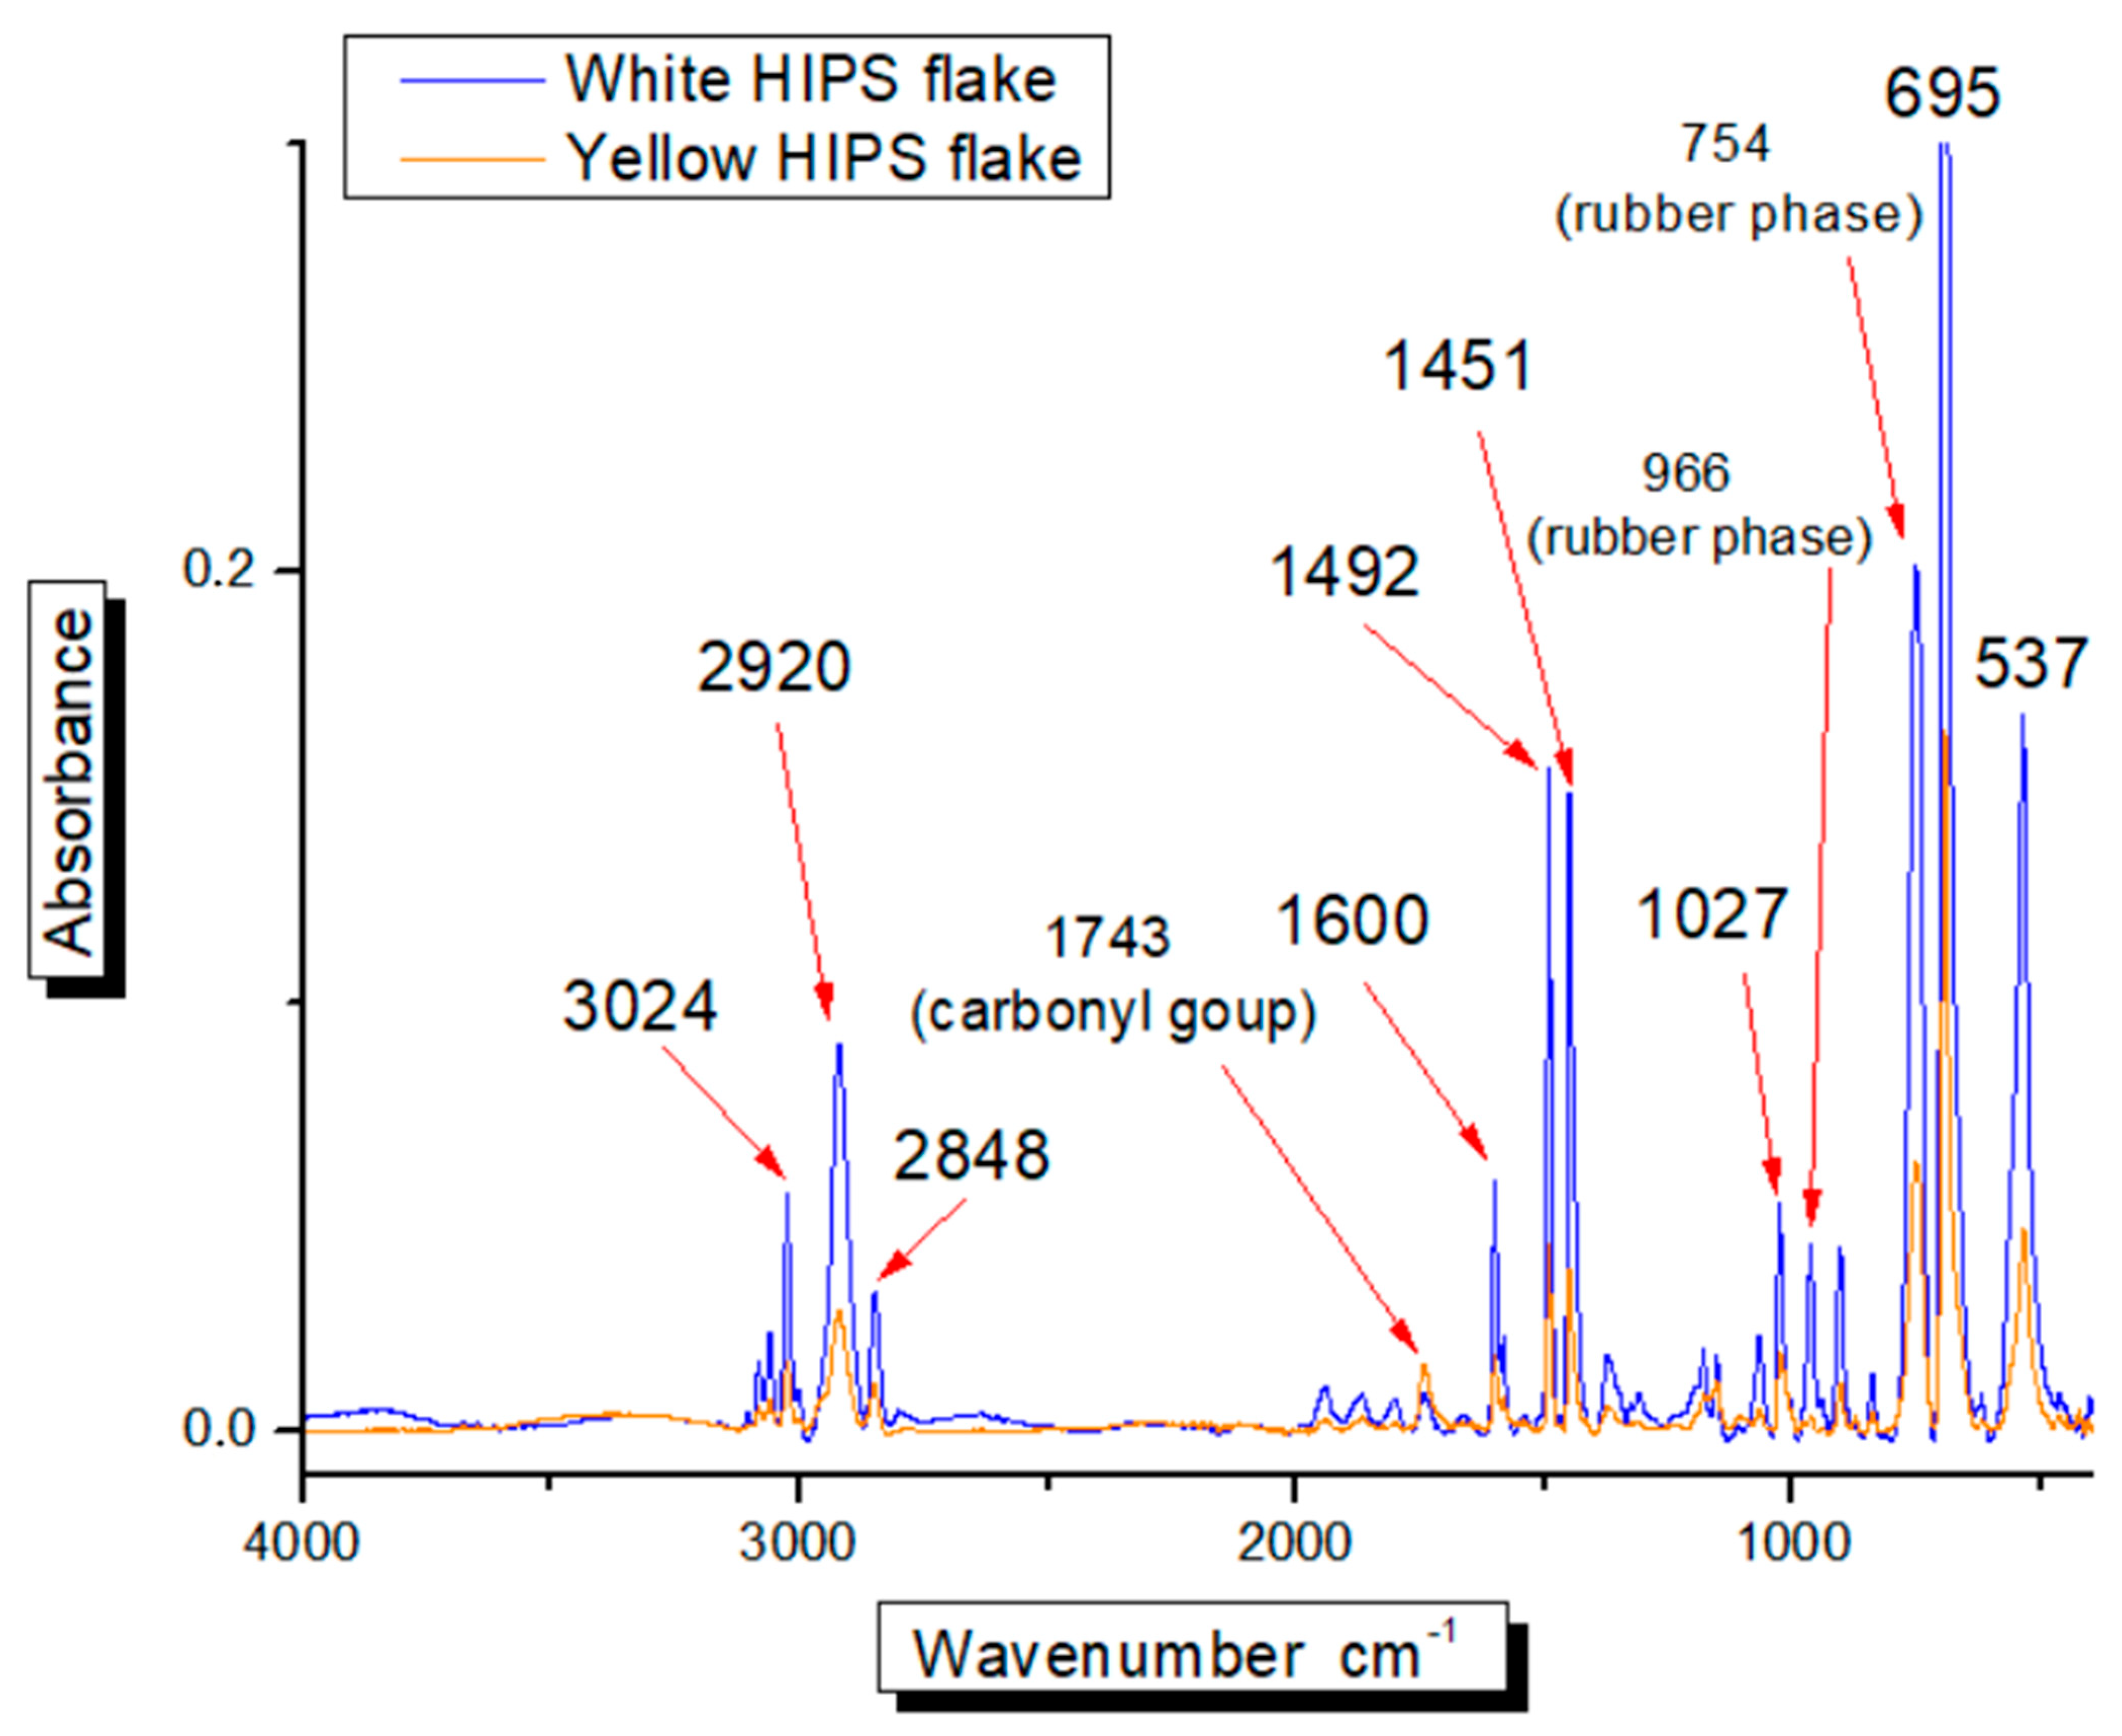
Figure 4 shows the exemplary spectrum for the “L” > 90 and “L” < 87 HIPS flakes obtained by the ATR-FTIR spectrometry (carbonyl group at 1743 cm
−1 and rubber phase at 966 cm
−1 were included).
Table 3 lists the average absorbance results for 10 characteristic HIPS peaks for flakes and dumbbells.
The analysis of the spectra for HIPS flakes indicated a decrease in absorbance with increasing surface yellowing (
Table 3). This indicates that all bonds present in HIPS were degraded (C-H, C=C, and C-C). The largest difference in the spectrum height (37.93%) was noted for the spectrum with a wavenumber of about 2849 cm
−1 for the C-H bond. The band at approximately 2849 cm
−1 is assigned to symmetric aliphatic C–H stretching vibrations (–CH
2− groups) in the polymer backbone. The smallest difference in absorbance was observed for the spectrum with a wavenumber of about 537 cm
−1. This difference amounted to 17.45%. The band near 537 cm
−1 can be attributed to out-of-plane C–H deformation vibrations characteristic of the aromatic ring structure of polystyrene. Additionally,
Figure 4 shows the peak appearing for the carbonyl group (C=O) of “L” < 87 flakes at about 1743 cm
−1. The absorption band at approximately 1743 cm
−1 corresponds to C=O stretching vibrations associated with oxidative degradation products.
The analysis of HIPS dumbbells spectra presented a decrease in the absorbance of each of them, along with the increasing yellowing of the HIPS surface (
Table 3). This means that all bonds were degraded (C-H, C=C, and C-C). The largest difference in the height of the spectrum (25.49%) was noted for that with a wavenumber of approximately 537 cm
−1 for the C-H bond. This region corresponds to out-of-plane C–H deformation vibrations of the aromatic structure, suggesting structural changes in the polystyrene phase. The smallest difference in absorbance was observed for the spectrum with a wavenumber of approximately 2921 cm
−1, being 10.00%. The 2921 cm
−1 band represents asymmetric aliphatic C–H stretching vibrations, indicating that aliphatic chain segments were comparatively less affected after homogenization during injection molding.
Comparing the absorbance results of flakes and dumbbells, it is clear that the average difference in absorbance is larger for the flakes. This is likely due to the surface-localized degradation of flakes, whereas dumbbells represent homogenized bulk material.
In paper [
37], non-irradiated and irradiated HIPS exhibited similar FTIR spectra. In the study [
38], after 15 and 30 days of HIPS UV degradation (0.5, 5, 10, and 21 h), the peaks at about 700 cm
−1, 750 cm
−1, 1450 cm
−1, 1500 cm
−1, and 1600 cm
−1 decreased compared to that of pristine (pure/unspoilt) HIPS. The wavenumber was 650–1650 cm
−1. In [
8], FTIR-ATR spectra of aged and not aged HIPS samples under the accelerated and natural conditions presented an increasing peak at 850 cm
−1 and decreasing peaks at 1450 cm
−1 and 1500 cm
−1. Paper [
9] presents the FTIR absorbance spectra in the region between 1800 and 1400 cm
−1, with an increase in the wavenumbers 1450 cm
−1, 1500 cm
−1, and 1600 cm
−1 after HIPS aging. The increase in the mentioned peaks was observed for the HIPS after multiple processing. According to the study [
39], most peaks’ absorbances decreased significantly after natural aging (large sunlight radiation dose, dry, high temperature, and rainy weather).
The only research results where not irradiated and irradiated HIPS presented the same FTIR spectra are in [
37]. In the study [
38], the peaks at about 700 cm
−1, 750 cm
−1, 1450 cm
−1, 1500 cm
−1, and 1600 cm
−1 decreased after the HIPS degradation and were the same as in this study. The wavenumber was from 650 cm
−1 to 1650 cm
−1. This made it impossible to compare the remaining peaks in this study (400–4000 cm
−1). According to the study [
39], each of the 10 characteristic peaks for HIPS mentioned in this paper (3030 cm
−1, 2900 cm
−1, 2850 cm
−1, 1600 cm
−1, 1500 cm
−1, 1450 cm
−1, 1030 cm
−1, 750 cm
−1, 700 cm
−1, and 550 cm
−1) decreased after natural aging. In paper [
8], the FTIR-ATR spectra of aged and not aged HIPS samples presented an increasing peak for 850 cm
−1 and decreasing peaks for 1450 cm
−1 and 1500 cm
−1. Interestingly, degradation of polybutadiene at 754 cm
−1 and 966 cm
−1 is the first step in the thermo-oxidative aging of HIPS, and some of the radicals formed during that degradation can act as initiators for the polystyrene oxidation [
9]. Scission of the polymer chains occurs, among others, in the rubber particles (in the double-bonded structure). The evidence that surface reactions related to material degradation occurred on the surface of “L” < 87 HIPS flakes is the appearance of the peak originating from the carbonyl group around the wavenumber of 1743 cm
−1 [
15]. Increasing peaks after HIPS degradation are mentioned only in two papers. It should be noted that 50 FTIR analyses were performed for each sample type, and these analyses were averaged in this paper. This affected more accurate absorbance results. Furthermore, it was difficult to compare FTIR spectra due to the lack of consistent baseline correction and detailed spectral analysis in some studies.
3.7. Testing of Mechanical Properties
The results of the mechanical properties test for HIPS specimens are presented in
Table 4.
The larger the Young’s modulus value, the lower the deformation under applied stress [
40]. This indicates that the dumbbells made of “L” > 90 materials are the least deformable (1566.80 MPa) compared to the dumbbells made of “L” = 87–90 (1665.40 MPa) and “L” < 87 materials (1653.80 MPa). However, taking into account the standard deviations, the differences between the “L” = 87–90 and “L” < 87 groups are small and partially overlapping, and therefore, these values should be considered statistically comparable.
Dumbbells made of “L” < 90 HIPS flakes showed the smallest tensile strength (18.70 MPa) and the smallest stress at failure (18.08 MPa). The tensile strength (21.17 MPa) and the stress at failure (20.51 MPa) are the largest for the dumbbells made of “L” < 87 HIPS flakes. The impact strength provides information about the material’s resistance to cracking [
41]. The dumbbells made of “L” < 87 flakes showed the smallest impact strength (29.143 kJ/m
2) and those made of “L” > 90 flakes the largest one (34.672). However, the standard deviations are high (approximately 9–10 kJ/m
2 in all cases), resulting in a substantial overlap of value ranges. Therefore, the impact strength of all analyzed samples should be regarded as statistically comparable, and no clear decreasing trend can be conclusively confirmed.
Hardness results decreased slightly (76.400 for the dumbbells made of “L” > 90, 76.700 for those made of “L” = 87–90, and 76.500 for the dumbbells made of “L” < 87 HIPS flakes), but the observed differences remain within the measurement uncertainty and do not indicate a meaningful trend.
The softening point was the smallest for the dumbbells made of “L” < 87 HIPS flakes (88.100 °C) and the largest for those made of “L” > 90 HIPS flakes (88.600 °C). However, the variation is minimal and within a narrow range, suggesting no significant dependence on the degree of yellowing.
Average elongation at break is the smallest in the case of the dumbbells made of “L” > 90 HIPS flakes (1.52%) and the largest for those made of “L” < 87 HIPS flakes (1.70%). Although this increase appears systematic, it should be treated cautiously due to the limited dispersion range and potential measurement sensitivity.
In paper [
11], the impact strength of post-consumer HIPS in five cycles of processing increased slightly for the first four processings (from 47.2 J/m to 56.4 J/m). However, in the last fifth processing, the impact strength decreased from 56.4 J/m to 53.4 J/m. The other mechanical property, that is, tensile strength, decreased from 27.4 MPa for the first processing to 26.6 MPa for the fifth processing. The other parameter, the Young’s modulus (E-modulus of elasticity), decreased from 1874.0 MPa to 1686.9 MPa. Moreover, elongation at break decreased from 25.9% to 15.8%. In paper [
42], the tensile strength and the strain to failure for unrecycled HIPS are larger than those for the recycled material, but the modulus E is larger for the recycled HIPS polymer. In the study [
13], the Young’s modulus becomes larger with the aging time. Also, stress at failure, strain at break (elongation at break), and Charpy impact strength decreased with the increasing aging time. Tensile strength decreased slightly for HIPS after 60 UV exposure days, according to paper [
3]. In paper [
1], the stress at failure decreased slightly for HIPS after eight cycles of reprocessing. Contrary to stress at failure, impact resistance (Charpy impact test) and tensile modulus exhibited a small increase in the chart. In the same paper, after the HIPS UV exposure for 2000 h, the tensile modulus and stress at failure decreased according to the added charts. HIPS showed a significant reduction in failure strain even at 250 h exposure. There was only a slight reduction in the impact performance. Y. Wang et al. [
39] stated that the Young’s modulus increased after 21 months of natural aging. However, the tensile strength and elongation at break decreased. In paper [
10], just like the tensile strength (increased) and elongation at break (decreased), the impact strength and Vicat softening temperature did not show large variations with the number of extrusion cycles (5), but decreased noticeably. Shore hardness increased after 8760 h of HIPS weathering in paper [
14]. In the study [
43], the Young’s modulus and elongation at break decreased, but Shore hardness and impact strength increased with the increasing number of reprocessing cycles (6). The study [
28] proved that the Izod impact strength decreases slightly after the first processing cycle (from 80 to 69 J/m). On the other hand, tensile stress at break increased. In paper [
9], for HIPS 9-cycle processing, the elongation at break decreased, but stress at break and Young’s modulus increased (slightly for E modulus). The same situation was observed after thermo-oxidative aging; however, the last day (16th) of thermo-oxidation presented a lower E modulus compared to the sample before degradation. In paper [
15], the impact strength, elongation at break, and tensile strength after 60 days of HIPS photo-oxidative aging decreased. However, the elastic modulus increased.
Hardness of the material defines the resistance of the sample surface to penetration of a harder body [
27]. The hardness test suggests that the reprocessed material undergoes chain deterioration, as well as crosslinking with every cycle. This results in the material’s resistance to penetration. Shore hardness increased as much as presented in two papers [
14,
27].
Impact strength describes the material’s ability to resist a mechanical impact loading [
41]. As in [
13,
15] studies, impact strength increased, while in [
10], this value remained practically unchanged. Recycling decreased the impact strength of HIPS in paper [
42], and it was probably due to the presence of TiO
2 pigment, causing the inhomogeneity (which could affect the impact strength in this paper too).
The Vicat softening point (VST) determines the temperature at which the plastic material begins to soften under a specified load [
44]. VST decreased slightly as in paper [
10]. The average Young’s modulus increased for dumbbells made of “L” < 87 HIPS flakes. However, considering the standard deviations, the differences are small and partially overlapping; therefore, they should be regarded as statistically comparable.
The Young’s modulus value also increased in papers [
9,
13,
15,
39,
42]. According to the study [
13], the increase in the Young’s modulus value can be due to polybutadiene, which appears as a result of degradation in the yellowed plastics, especially due to crosslinking [
27]. Interestingly, in paper [
9], in the case of multiple processing of HIPS, the Young’s modulus increased; however, after thermo-oxidation, it decreased. This can point out that, depending on the type of degradation, Young’s modulus will behave differently. The next two studies where the Young’s modulus decreased after aging of HIPS were [
11,
41]. In summary, in most cases (6 out of 9), the Young’s modulus increased as in this paper.
The maximum stress that the material can withstand before its failure is its tensile strength [
45]. The average tensile strength increased in this study, as well as in the case presented in [
1,
10]. Considering the relatively small deviations, this increase should be interpreted as a tendency rather than a statistically strong effect. In the paper [
1], a change in the tensile strength depended on the type of degradation to which HIPS was subjected—after processing, it increased, and after UV exposure, it decreased. In most studies [
1,
3,
11,
15,
39,
42], the tensile strength decreased, but it should be noted that the results obtained in [
1] can indicate that tensile strength depends on the type of aging.
Stress at failure is the maximum stress the material can endure before breaking or fracturing. The average stress at failure increased to the same extent as in papers [
9,
28]. Nevertheless, the overlapping standard deviation ranges indicate that these differences may not be statistically significant. As follows from [
1,
13,
42], stress at failure decreased after degradation.
Elongation at break is the ratio between the changed wavenumber and the initial wavenumber after breakage of the specimen [
40]. Only in this study did the elongation at break increase compared to those in [
9,
10,
11,
13,
15,
39,
43]. However, due to the very low dispersion values, this observation should be interpreted carefully. According to paper [
9], elongation at break should determine recycling possibilities and the second-market application for HIPS.
The statistical interpretation indicates that not all observed differences represent meaningful degradation effects. When standard deviations are taken into account, most mechanical parameters do not exhibit statistically significant differences between the analyzed fractions. In particular, impact strength and Young’s modulus show overlapping value ranges, which prevents confirmation of clear increasing or decreasing trends.
Therefore, the previously suggested relationships, such as the decrease in impact strength or the increase in Young’s modulus with increasing yellowing, should be interpreted as qualitative tendencies rather than definitive trends.
Parameters showing apparent directional changes with increasing yellowing may be associated with structural evolution of HIPS during natural aging, but these observations remain within experimental variability and require cautious interpretation. In contrast, properties such as hardness and selected tensile parameters exhibited only minor differences between fractions, suggesting that these variations may fall within the noise level typical for post-consumer recyclates. Such variability can originate from differences in flake composition, pigment distribution, thermal history, and molding heterogeneity. Consequently, these parameters should be interpreted cautiously and not treated as primary indicators of degradation. The signal-to-noise perspective supports the conclusion that visually driven segregation may reflect certain degradation effects, but does not provide statistically robust differentiation of mechanical performance at this stage of material aging.
3.10. Summary
Mechanistically, the FTIR results suggest a degradation pathway involving initial oxidation of the PB (polybutadiene) phase, followed by radical-induced reactions in the PS matrix, leading to chain scission and possible crosslinking. Chain scission reduces molecular weight and may increase the melt flow index (MFI), as reported in multiple reprocessing studies [
9,
11,
27,
28,
29,
30], whereas crosslinking within the rubber phase may contribute to increased stiffness. The relatively limited spectral changes observed in this study indicate that the investigated flakes were subjected to an early-stage oxidative degradation, which is sufficient to induce yellowing and measurable changes in mechanical and rheological properties, but does not correspond to severe structural breakdown.
The mechanical trends observed with increasing yellowing indicate the coexistence of competing degradation mechanisms acting in different HIPS phases. The simultaneous increase in Young’s modulus, tensile strength, and elongation at break, together with decreasing impact strength, suggests that degradation is governed by a balance between chain scission in the polystyrene matrix and oxidation-induced crosslinking in the polybutadiene phase [
1,
13,
15,
28,
29,
39,
42]. Crosslinking limits the ability of rubber particles to dissipate impact energy, explaining the reduction in impact resistance despite material stiffening.
In addition, oxidation may modify rubber particle morphology and interfacial adhesion, affecting cavitation behavior and stress transfer between phases. Such interfacial restructuring can enhance the quasi-static tensile response while simultaneously promoting embrittlement under dynamic loading [
13,
39,
42]. Therefore, the counterintuitive mechanical behavior can be interpreted as a characteristic of an intermediate degradation stage typical for naturally aged post-consumer HIPS, where stiffening and embrittlement develop concurrently rather than sequentially [
1,
13,
15,
28,
29,
39,
42].
The decrease in MFI with increasing yellowing (from 4.12 g/10 min for “L” > 90 to 2.95 g/10 min for “L” < 87 flakes) contrasts with many reports where HIPS degradation led to an increase in MFI due to dominant chain scission and molecular weight reduction [
9,
11,
27,
28,
29,
30]. However, the literature data also indicate that the rheological response of HIPS depends on the prevailing degradation mechanism. In some studies, an initial decrease in MFI after early processing cycles was observed [
1,
28,
29], suggesting that chain scission does not always control material behavior at moderate degradation levels. Therefore, the results obtained in this work may reflect competing degradation pathways rather than a simple decrease in molecular weight.
FTIR results confirm oxidative reactions in the most yellowed fraction, including the formation of carbonyl groups (~1743 cm
−1) and degradation of the polybutadiene phase. Oxidation of PB can lead not only to chain scission but also to radical recombination and crosslinking within the rubber phase [
9,
27], which restricts chain mobility and increases melt viscosity, thereby reducing MFI. Additionally, morphological changes in rubber particles and possible structural heterogeneity (e.g., inclusions observed in the extruded material) may further hinder flow.
The FTIR analysis indicates that surface yellowing of recycled HIPS is directly associated with chemical degradation processes occurring in both phases of the material, i.e., the polystyrene (PS) matrix and the dispersed polybutadiene (PB) rubber phase. The observed decrease in the absorbance of characteristic bands (3030, 2920–2850, 1600, 1500, 1450, 1030, and 750–700 cm
−1) with increasing yellowing confirms progressive structural deterioration of C–H, C=C, and C–C bonds. In particular, the reduction in the band near 750–760 cm
−1 indicates degradation of unsaturated PB units, which are known to be the primary sites of thermo-oxidative attack in HIPS. As reported in [
9], oxidation of the PB double bonds initiates radical reactions that may subsequently propagate into the PS matrix.
The appearance of a carbonyl band at approximately 1743 cm
−1 in the most yellowed (“L” < 87) flakes provides direct evidence of oxidative processes leading to the formation of oxygen-containing groups such as ketones, aldehydes, or esters [
15]. This confirms that yellowing is not merely a physical aging phenomenon but is related to chemical oxidation at the material surface. The evolution of carbonyl species is consistent with oxidative chain scission reactions and oxygen incorporation, which are typical for thermo-oxidative and photo-oxidative degradation of HIPS [
9,
15,
29,
39]. The absence of a strong carbonyl signal in the less yellowed fractions suggests that the degradation level in these materials remains relatively moderate.