1. Introduction
In recent years, the intensification of global environmental degradation has made energy conservation and emission reduction a pressing global agenda [
1]. In September 2023, the United Nations Environment Programme (UNEP) released a report titled ‘Building Materials and Climate: Constructing a New Future’, which emphasized that the construction industry remains the largest contributor to global greenhouse gas emissions. According to data from the International Energy Agency (IEA), the total carbon emissions from building operations and construction account for approximately 37% of global emissions [
2]. In the United States, building energy consumption constitutes approximately 30% of the nation’s total energy consumption, whereas in the European Union the annual CO
2 emissions from the construction industry reach 1.5 billion tons, representing approximately 15% of global emissions [
3]. In China, as of the end of 2023, historical carbon emissions had reached 312 billion tons, surpassing the European Union’s 303 billion tons [
4]. According to the 2024 China Building Energy Consumption and Carbon Emissions Report, residential buildings account for 42.9% of total building-related carbon emissions, and operational emissions alone amount to as much as 2.1 billion tons of CO
2 equivalent, representing 21.7% of the nation’s total emissions. Substantially reducing building-related carbon emissions is therefore critical for addressing global environmental challenges.
To tackle this issue, countries worldwide have implemented stringent carbon reduction policies [
5]. For example, the European Commission introduced the European Green Deal, which requires member states to carry out extensive renovations of buildings to increase energy efficiency and reduce emissions, with the goal of achieving climate neutrality by 2050 [
6]. Similarly, the Chinese government issued the Action Plan for Carbon Peaking Before 2030, which emphasizes the promotion of prefabricated buildings and industrialized construction methods as key strategies for reducing emissions in the construction sector [
7].
Despite these global efforts, decarbonization in the construction industry remains a major challenge. The difficulty lies in addressing ‘embodied’ carbon emissions [
8], which originate from the design, production, and deployment of materials such as cement, steel, and aluminum. Solutions for reducing these emissions have lagged behind, because the production of building materials and the construction process consume significant amounts of energy and generate substantial carbon emissions [
9]. Furthermore, the construction sector lacks systematic research and reliable data to support the analysis of energy consumption and carbon emissions in these areas [
10]. To tackle this challenge effectively, it is necessary to accurately quantify and control carbon emissions across the entire building life cycle. However, efforts to improve the quantification of life cycle energy use in the construction sector face persistent obstacles [
11], including the lack of standardized benchmarks for carbon emission calculations [
12], inconsistencies in calculation methodologies [
13], and unclear definitions of emission boundaries [
14]. Therefore, identifying the key factors that influence carbon emissions in the construction industry is crucial for achieving energy savings and carbon reductions.
Using prefabricated buildings as a research subject provides a feasible pathway for defining carbon emission factors across the building life cycle. First, compared with traditional construction methods, prefabricated buildings employ standardized, factory-based, and mechanized production processes, which enhance the transparency and traceability of material usage [
15]. By recording the consumption of each material and its associated carbon footprint, it becomes possible to accurately calculate the carbon emissions of an entire project [
16]. Second, the reduction in onsite construction activities in prefabricated buildings also leads to fewer emission sources, minimizing the influence of external factors, such as weather and worker efficiency, and thereby simplifying carbon footprint assessment [
17]. Finally, the fixed processing methods and relatively short construction cycles for prefabricated components make carbon emission data more stable and predictable [
18]. Therefore, investigating the factors that influence carbon emissions in prefabricated construction and proposing optimized energy-saving and emission-reduction strategies hold significant value for reducing the overall carbon footprint of the construction industry.
Most global research on carbon emissions has focused primarily on energy consumption analysis. Existing methodologies are often limited to inventory-based approaches, emission factors, emission calculations, and technical applications, with relatively little attention given to developing evaluation models for carbon emissions [
19,
20,
21,
22]. Furthermore, existing studies lack the ability to simulate carbon emission factors based on energy consumption data or to develop effective carbon reduction strategies by analyzing the coupling relationships between these factors. This limitation significantly hinders the implementation of energy-saving and emission-reduction policies.
This study addresses these gaps through a long-term investigation of a large prefabricated component production plant in western China. By identifying accurate carbon emission factors for the construction industry and building an evaluation model, this study provides the following key contributions:
By collecting detailed data on engineering quantities and energy consumption from projects with varying functions, scales, and prefabrication rates and using national standards and specifications as references, the Min–Max normalization method and PCA were employed to identify the factors influencing carbon emission for prefabricated buildings.
A cloud entropy method was applied to establish a carbon emission evaluation model for prefabricated buildings. Real-world data from the prefabrication process were analyzed to determine the weights of influencing factor indicators, thereby identifying the key factors affecting carbon emission levels.
The evaluation results were integrated into an NK model for large-scale simulations involving tens of thousands of iterations, predicting the impact pathways of interactions between factors. On the basis of these findings, targeted emission reduction strategies were formulated.
2. Related Work
2.1. Carbon Emission Impact Factors
Carbon emission impact factors are crucial statistical indicators for calculating carbon emissions and formulating energy-saving and emission reduction policies. Their accuracy directly affects the scientific validity, specificity, and practicality of such policies. In recent years, numerous studies have been conducted by scholars worldwide to explore the characteristics, influencing factors, mechanisms, and contribution rates of energy consumption and carbon emissions. For example, Jiang et al. analyzed the driving factors of carbon emission changes in the construction industry using the Kaya identity and Logarithmic Mean Divisia Index (LMDI) decomposition method. Their findings highlighted that energy structure, energy intensity, industry scale, and indirect carbon emission intensity are the primary contributors to increased carbon emissions [
23]. Similarly, Liu et al. applied the LMDI method to decompose the influencing factors of carbon emissions in the Beijing–Tianjin–Hebei region’s construction industry. They revealed that energy intensity and energy structure have a suppressive effect on carbon emissions, whereas industrial structure, economic growth, and population size are the main drivers of carbon emission increases [
24].
Moreover, Chen et al. employed an improved STIRPAT model to study energy consumption and carbon emissions in large public building construction, identifying energy types used during the construction phase as the primary driving factors of carbon emissions [
25]. Qiao et al. integrated PCA with a Bidirectional Long Short-Term Memory (BiLSTM) neural network to reduce the dimensionality of multiple features related to carbon emissions in thermal power plants. By adjusting feature weights, their model accurately identified critical factors, such as plant load, fuel composition, and environmental temperature, achieving high-precision carbon emission predictions [
26].
However, despite these advancements several limitations in existing carbon emission research remain evident. First, in defining carbon emission impact factors, significant discrepancies in boundary conditions and analytical methods exist across studies, resulting in a lack of standardized criteria. This inconsistency limits the comparability and practical applicability of research findings. Second, most studies rely on theoretical models or secondary statistical data and fail to incorporate actual project-level data on material quantities and energy consumption. As a consequence, their results often fail to accurately capture the complexities of real-world engineering practices, in particular in new construction methods, such as prefabrication.
Furthermore, existing research on prefabricated buildings remains inadequate. Although prefabrication is characterized by high levels of mechanization and industrialization, with its carbon emissions primarily concentrated in the production phase of prefabricated components, analyses of energy consumption and carbon emission characteristics during this phase are relatively limited. These studies often overlook the inherent complexity and diversity of modern construction methods. Finally, although current carbon emission evaluation models provide theoretical insights, they lack robust analyses of factor coupling effects, nonlinear interactions, and dynamic evolutionary processes. As a result, their predictive accuracy and practical applicability are restricted, making it challenging to deliver comprehensive and effective support for the development of specific carbon reduction strategies.
2.2. Methods for Calculating Building Carbon Emissions
The commonly used methods for calculating building carbon emissions include the direct measurement method, the input–output method, and the carbon emission coefficient method [
27,
28].
The direct-measurement method involves measuring the energy consumption and waste generation of buildings during their operational phase to directly calculate carbon emissions. Although this approach offers high accuracy, it requires the installation of extensive monitoring equipment and sensors, as well as long-term continuous monitoring, making it costly and less commonly applied in practice.
The input–output method, first introduced by Leontief, has been widely employed for analyzing life cycle carbon emissions and multiregional carbon emissions through input–output analysis. This method utilizes average data from related industries and examines various economic activities involved throughout the life cycle of a building to estimate the carbon emissions of the construction sector within a specific region and time period [
29]. At present, the input–output method is often integrated with LCA for carbon footprint evaluation. For example, Zhang et al. applied the input–output method to analyze energy consumption and carbon emissions in China’s construction sector and concluded that the construction phase contributes significantly to life cycle emissions [
30]. However, the input–output method relies on macroeconomic data and cannot accurately capture the specific circumstances of individual buildings, in particular with respect to material selection and construction techniques, where uncertainty remains significant [
31]. In addition, issues related to data quality and computational complexity further hinder its application at the micro level.
The carbon emission coefficient method was first introduced in 1996 by the IPCC in the National Greenhouse Gas Inventory Guidelines. This method estimates carbon emissions by constructing activity-level data and emission factors for each source based on carbon emission inventories. Because of its simplicity, comprehensibility, and ease of operation, it has become one of the most widely adopted methods for carbon emission estimation. Current research on the carbon emission coefficient method focuses primarily on two aspects: the source and definition of emission factors and the use of these factors for carbon emission evaluation. For example, Shen et al. developed a dynamic carbon emission coefficient prediction model that is based on the TimesNet algorithm, which adjusts emission coefficients dynamically to reflect changes in energy structure and material use [
32]. Similarly, Wang et al. employed a Transformer architecture to process multivariate time series data, effectively capturing temporal and dimensional information and thereby enhancing the prediction accuracy of carbon emission factors in the electricity sector [
33]. Despite its widespread application, the carbon emission coefficient method has several notable limitations. On the one hand, most studies have focused on direct emissions during the operational phase of buildings, neglecting the embodied emissions associated with material production, construction, and demolition stages. This omission reduces the comprehensiveness and comparability of carbon emission assessments. On the other hand, few studies have explored the method’s potential for guiding carbon emission policymaking, thereby restricting its development and practical applicability.
2.3. Evaluation Framework for Carbon Emissions in Prefabricated Buildings
The life cycle of prefabricated buildings is similar to that of conventional cast-in-place buildings and comprises three primary phases: materialization, operation, and demolition [
34]. Current studies of carbon emissions in prefabricated buildings predominantly adopt the international standard LCA method to comprehensively evaluate carbon emissions across all life cycle stages, including raw material extraction, production, transportation, use, and end-of-life disposal. For example, Lima, M. et al. integrated Building Information Modeling (BIM) with LCA to develop a comprehensive evaluation model for analyzing the carbon emission potential of buildings [
35]. LCA enables the identification of environmental hot spots and the determination of key pathways to reduce environmental impacts, thereby optimizing product design, production processes, and resource utilization to promote sustainability.
Prefabricated construction is widely recognized as an effective approach to controlling carbon emissions [
36]. Unlike cast-in-place buildings, prefabricated buildings concentrate material production, prefabricated component manufacturing, and transportation processes within the materialization phase, which results in high-intensity energy consumption. Recent studies have systematically investigated carbon emissions during the materialization phase of prefabricated buildings, revealing that factory-based production can reduce construction-related carbon emissions by approximately 15% compared with traditional cast-in-place methods. Thus, the materialization phase is the dominant source of carbon emissions in prefabricated buildings. Targeted and systematic research on the carbon emissions of various processes within this phase, as well as the associated influencing factors, is essential for the further exploration of the energy-saving and emission-reduction potential of prefabricated buildings.
To better understand the carbon emissions during the materialization phase, an effective evaluation model is necessary. Several scholars have proposed relevant models. For example, Nosheen, M. et al. introduced stochastic regression and nonlinear analysis into the original IPAT model, proposing an improved STIRPAT model to examine the impact of urbanization on CO
2 emissions in underdeveloped economies [
37]. Similarly, Yang, J. et al. employed an extended Kaya identity combined with the LMDI method to analyze the driving factors of China’s carbon emissions from 1996 to 2016, further discussing the potential of increasing imported electricity as a strategy to reduce carbon emissions [
38]. Moreover, Wei et al. utilized structural equation modeling to reveal the paths between carbon emissions and their influencing factors [
39].
Although these studies have begun to explore the use of models to uncover carbon emission pathways, existing models, such as the Kaya identity, LMDI decomposition, and STIRPAT, are based primarily on static data for factor decomposition. They struggle to dynamically capture the coupling relationships among carbon emission factors and their temporal or contextual variations. This limitation makes them inadequate for addressing the complex nonlinear interactions among emission factors.
Existing studies of carbon emission factor identification have often neglected dimensional biases caused by data heterogeneity and have failed to resolve the dynamic interaction mechanisms among factors. This study introduces an enhanced Min–Max–PCA method to achieve high-dimensional data standardization and feature extraction. By integrating cloud entropy–based weight allocation and NK model–driven dynamic simulations, we construct a dual-layer analytical framework that encompasses “static factor optimization” and “dynamic pathway projection.” This framework not only overcomes the strong data dependency inherent in traditional coefficient methods but also, for the first time, incorporates the evolutionary behaviors of carbon emission factors under policy interventions into a quantitative assessment system. The proposed methodology provides a decision-making tool for prefabricated building carbon reduction that balances robustness and forward-looking capabilities.
3. Methodology
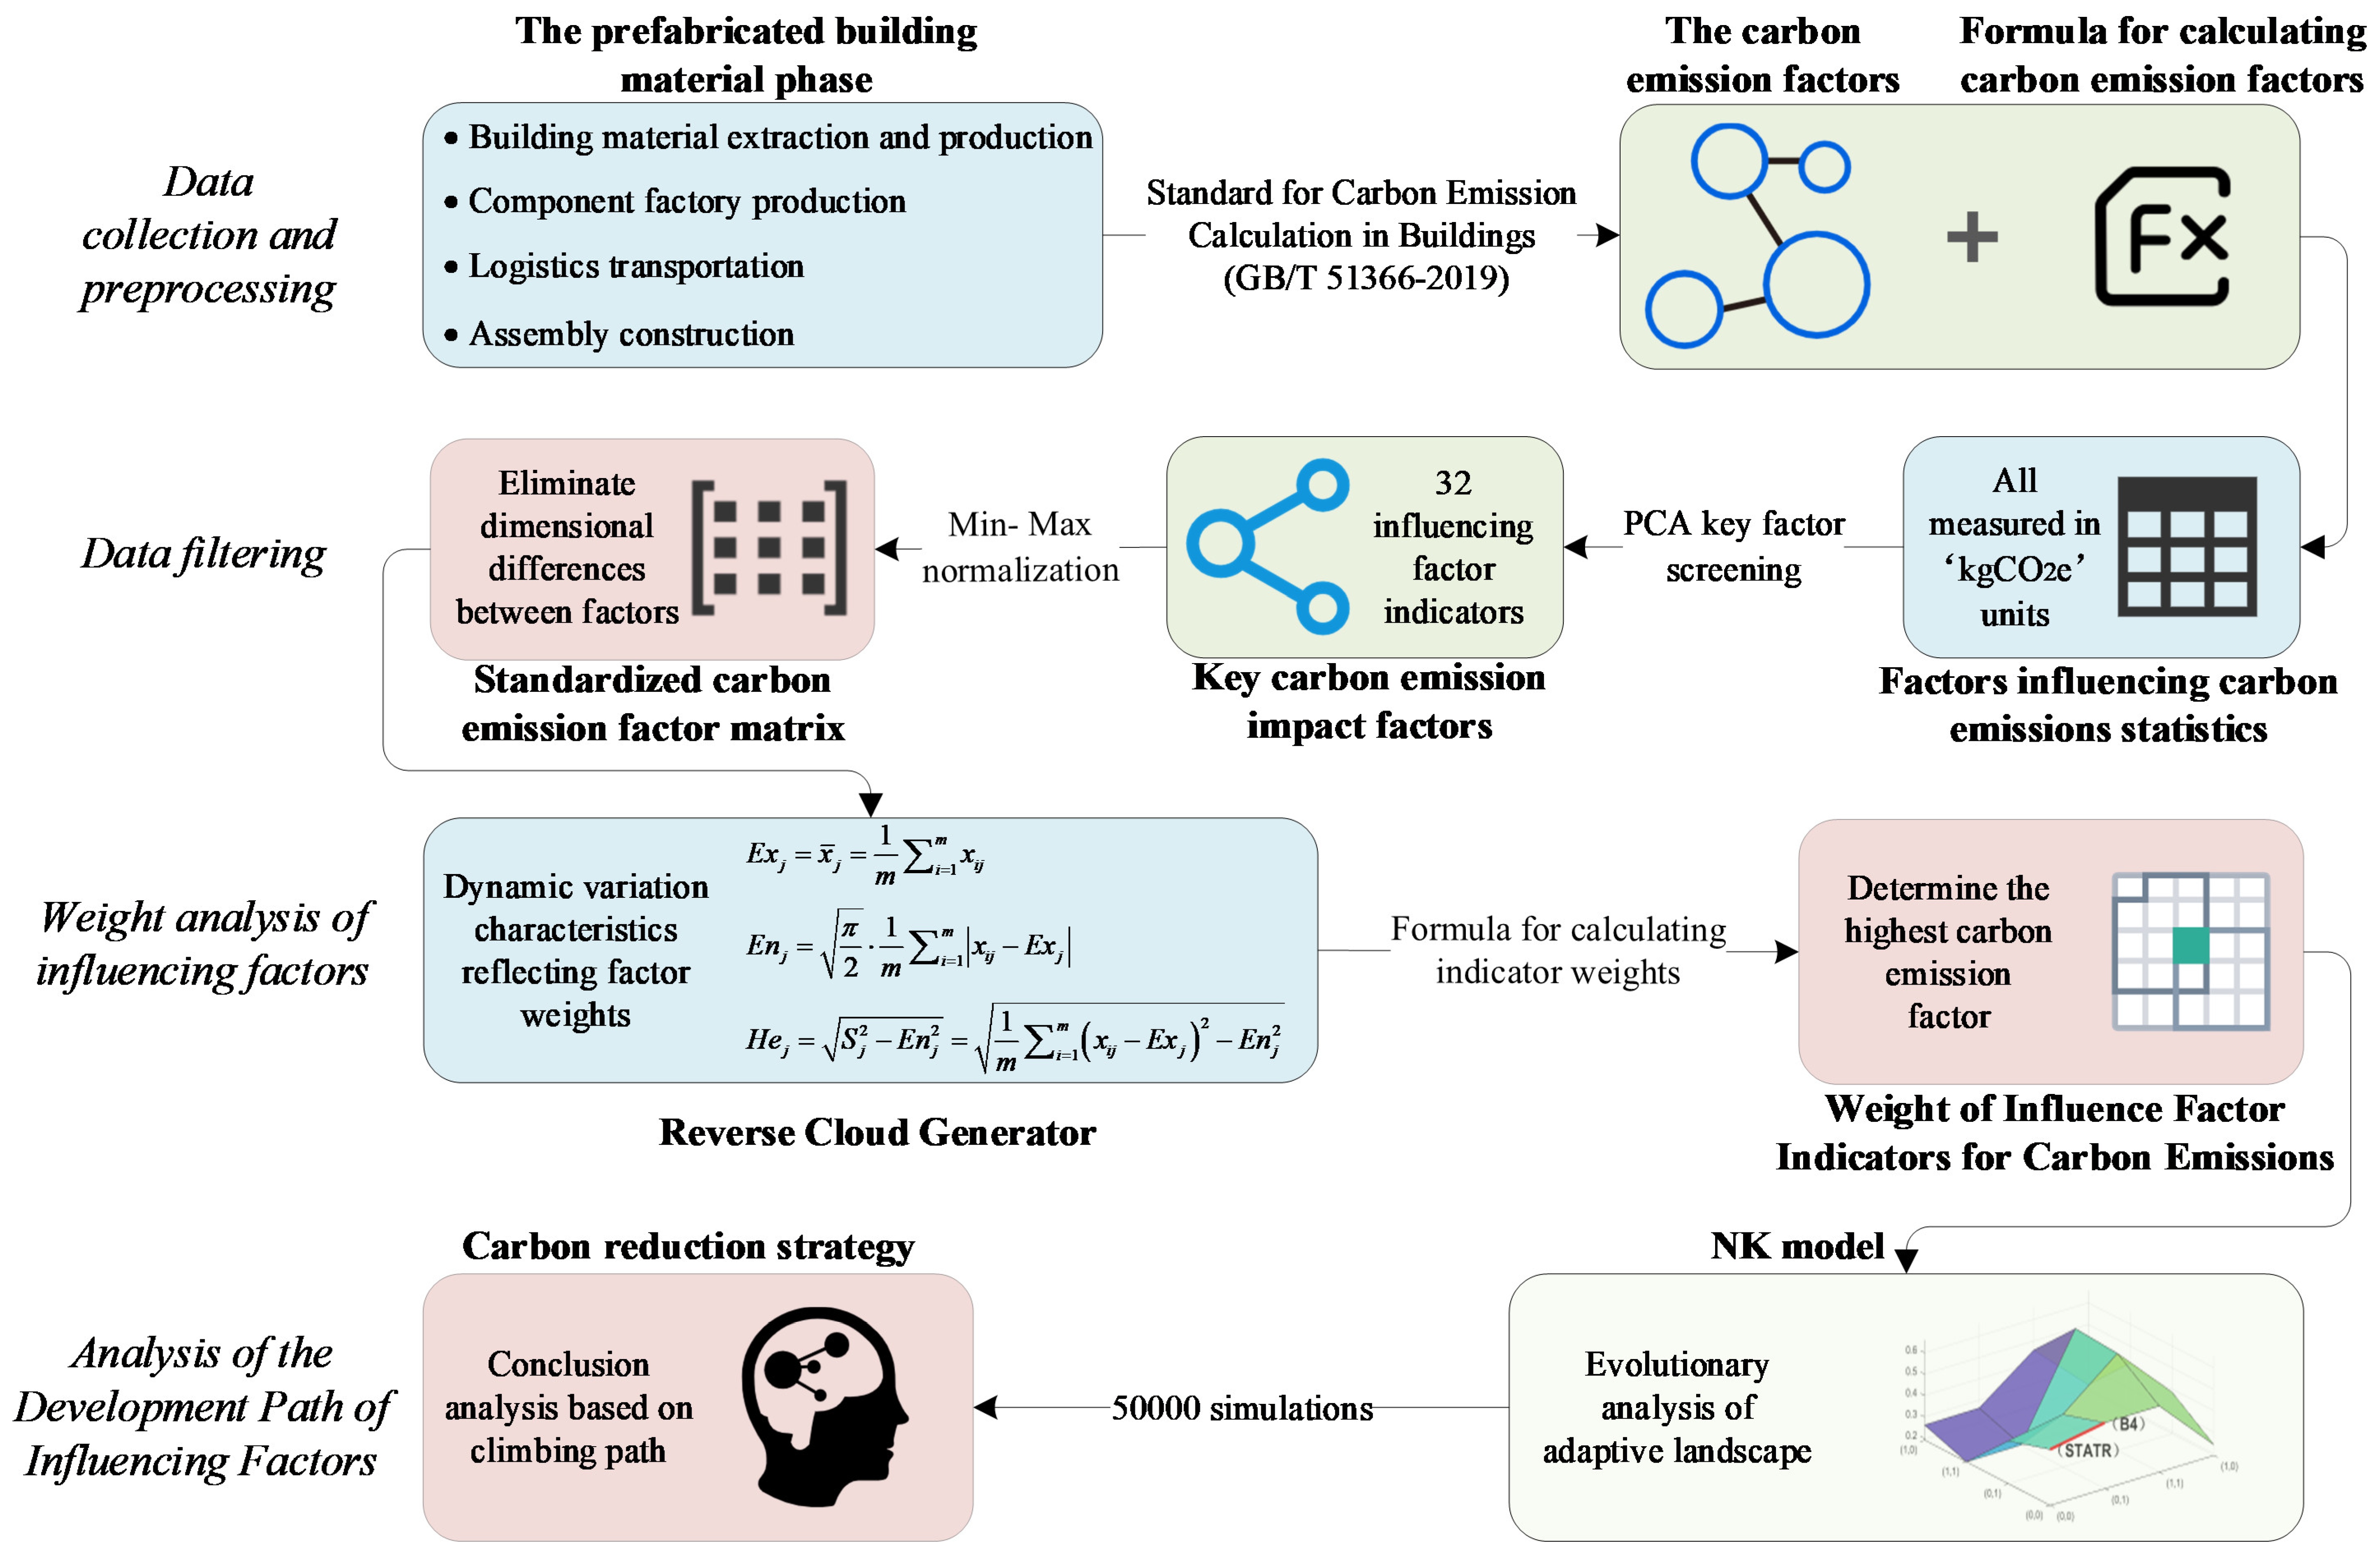
This study enhances the LCA framework by focusing on the materialization phase—the dominant carbon emission stage in prefabricated buildings. We integrate Min–Max–PCA to resolve dimensional inconsistencies in factor identification, reducing data redundancy while preserving critical variations. Cloud entropy quantifies factor weights, and NK model simulations (10,000 iterations) map dynamic emission behaviors under policy shifts, identifying optimal reduction pathways. This dual-scale approach (static optimization and dynamic projection) bridges gaps in evolutionary carbon pathway analysis, offering actionable strategies for robust emission governance. The overall processing procedure is shown in
Figure 1.
In the carbon emission assessment of prefabricated buildings, the LCA method is widely employed internationally to quantify carbon emissions throughout the entire life cycle of a building. According to the system boundary types defined in the ISO 14044 [
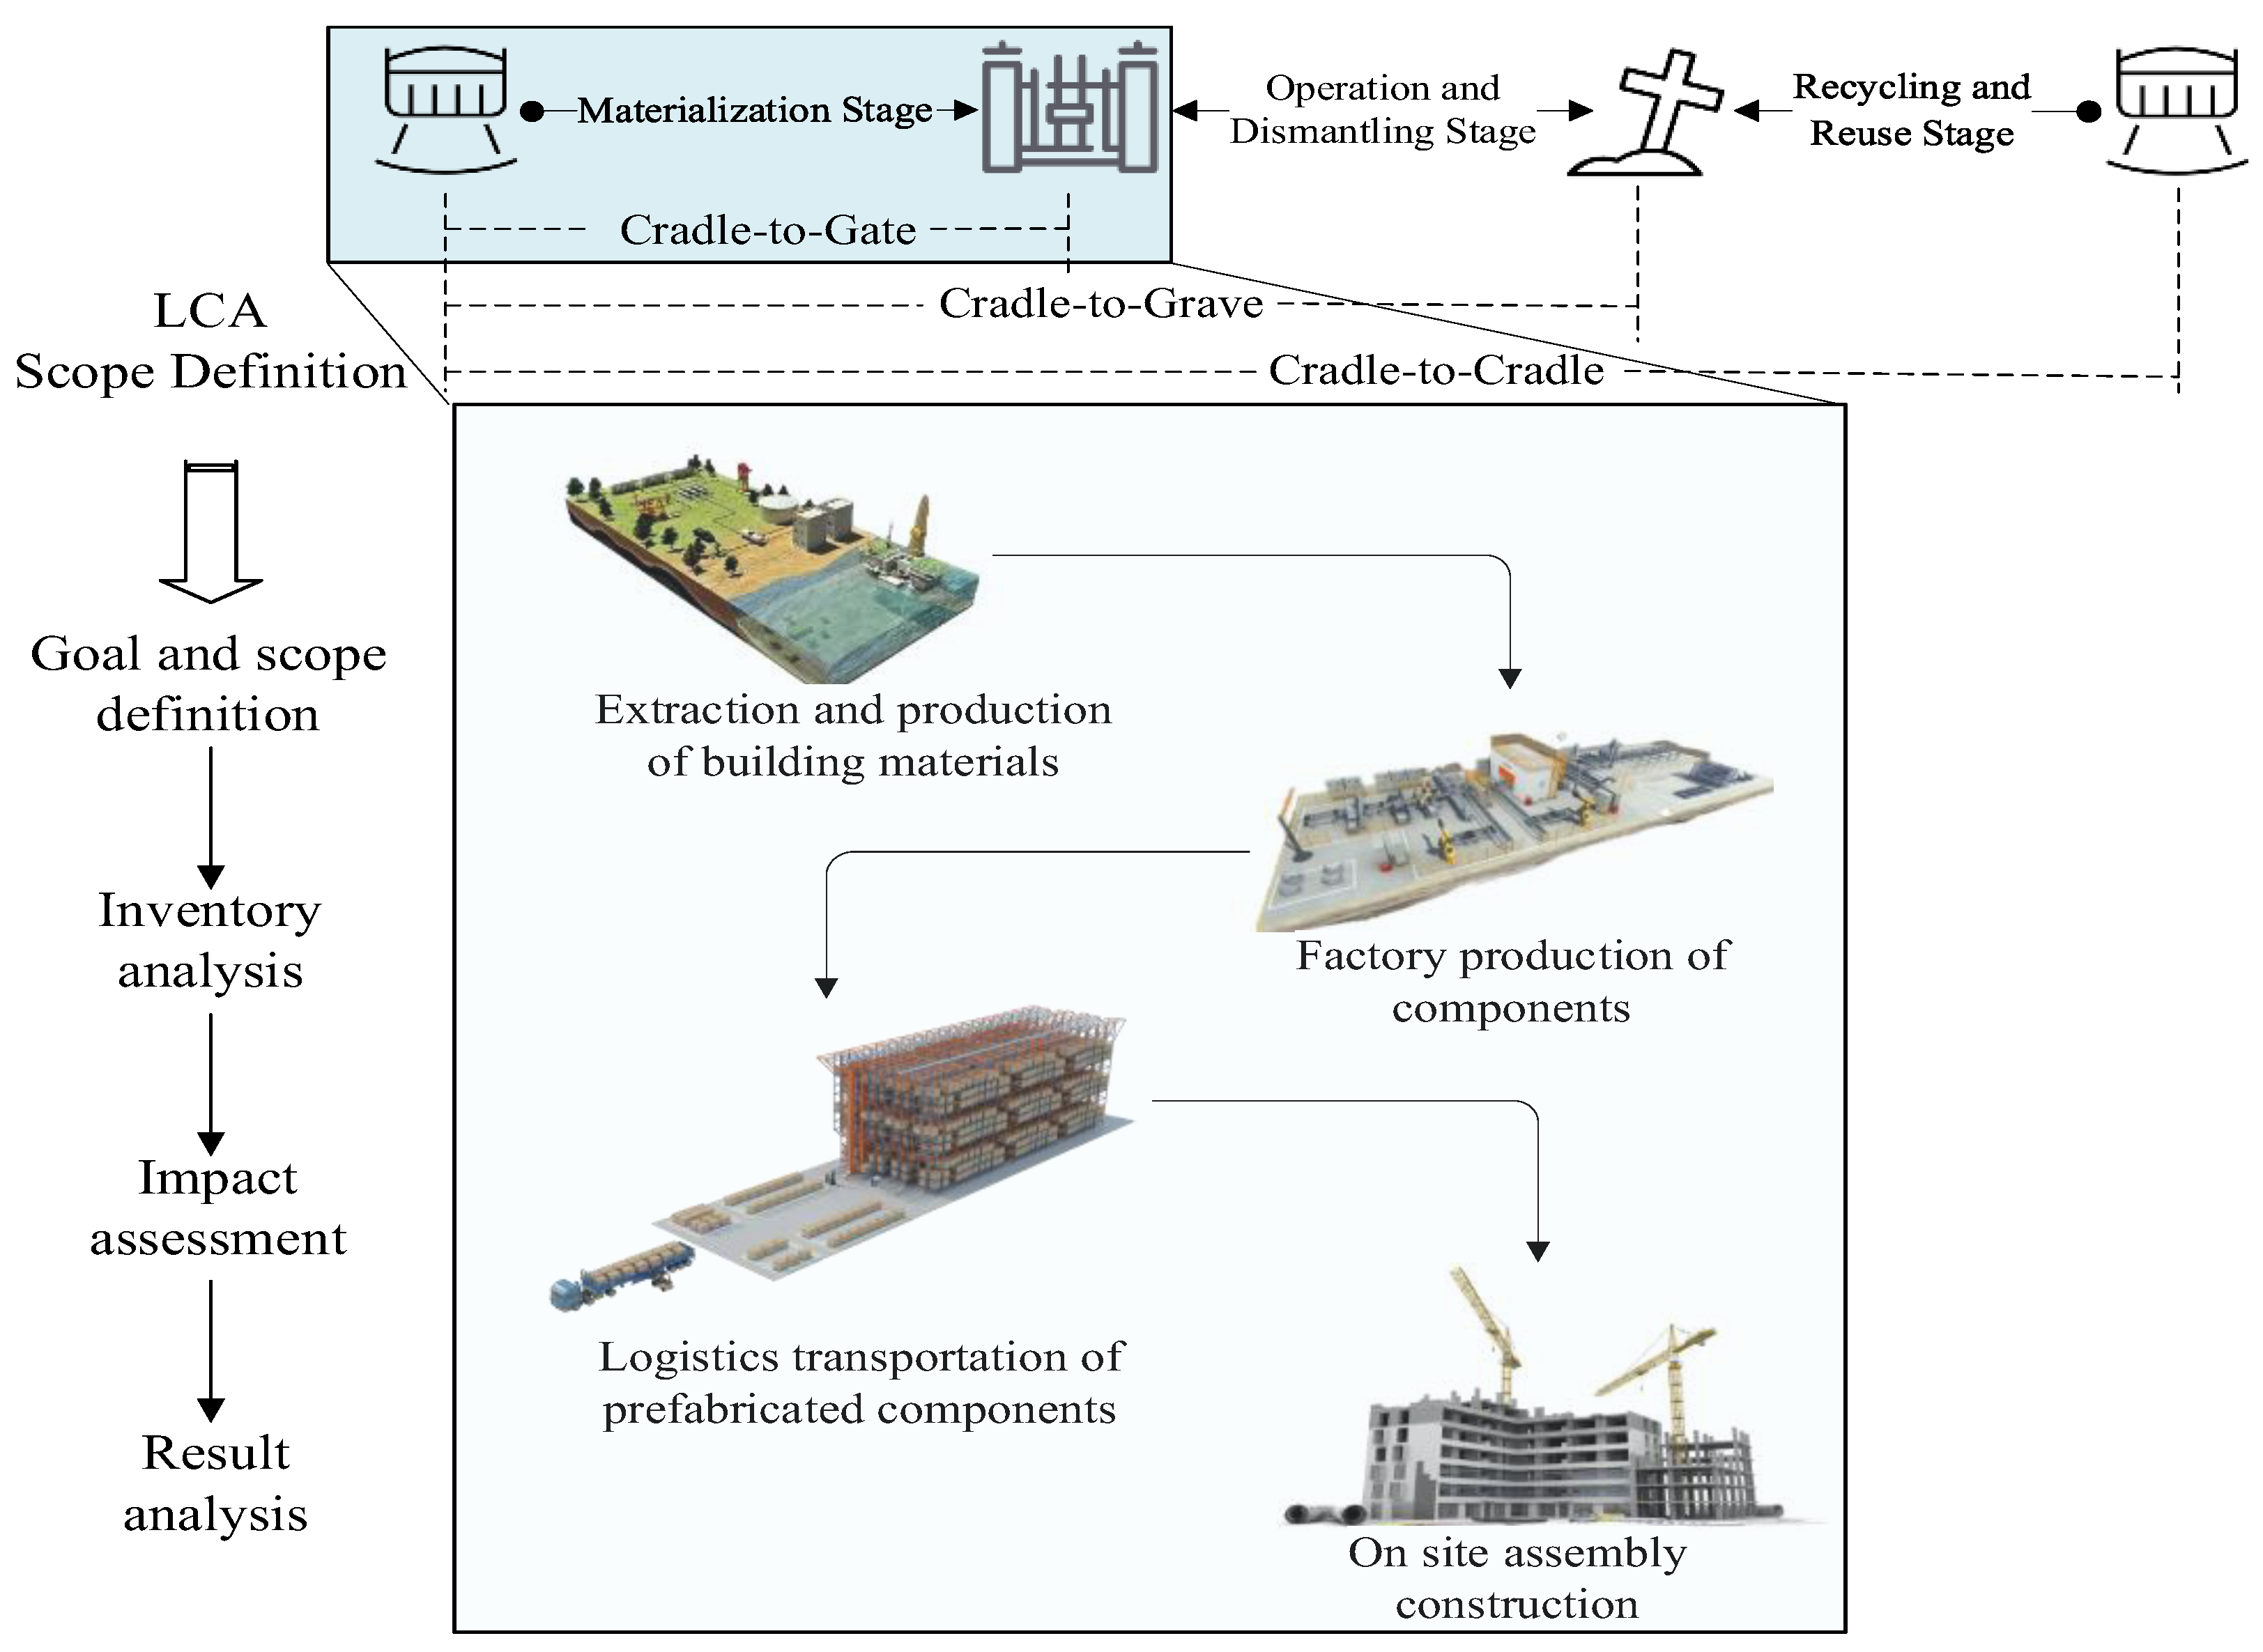
40] standard, for prefabricated buildings the carbon emission evaluation during the materialization phase is typically confined to the ‘Cradle-to-Gate’ boundary. This means that the assessment scope covers the entire process, from raw material extraction and processing to the completion of the finished product and its exit from the factory, excluding the subsequent usage and disposal phases. This evaluation strategy facilitates the focused analysis of carbon emission sources that are relatively concentrated during the production process of prefabricated buildings while avoiding the interference of uncertain factors in the long-term span of the operation, maintenance, and demolition stages, thus ensuring precise data collection and calculation. To further clarify and refine the temporal scope of the ‘Cradle-to-Gate’ phase, this study refers to the carbon emission phase division outlined in the 2022 Chinese Group Standard ‘Calculation Methods and Analysis of Carbon Emissions in Industrial Buildings’ (T/CSTM 00511-2022) [
41]. The materialization phase of prefabricated buildings is further subdivided into four specific subphases: building material extraction and production, component factory production, logistics transportation, and assembly construction [
42]. In accordance with the general procedures of LCA, the study proceeds with the four standardized processes of goal and scope definition, inventory analysis, impact assessment, and result analysis to calculate and assess the total carbon emissions during the materialization phase of prefabricated buildings, as shown in
Figure 2.
3.1. Definition of Goals and Scope
Prefabricated buildings vary in scale, and there are significant differences in material usage and machinery types during the materialization phase, making accurate analysis challenging. Before conducting carbon emission research on the materialization phase of prefabricated buildings, it is necessary to define the carbon emission metrics to improve the comparability of different influencing factors. According to the standards outlined in the Kyoto Protocol, CO
2 is the dominant infrared radiation gas and is responsible for 75% of the greenhouse effect. Both ISO 14064 and documents from the International Energy Agency define the metric for carbon emissions as the carbon dioxide equivalent (CO
2e) [
43,
44,
45]. Therefore, this study also converts various carbon emission factors in the materialization phase of prefabricated buildings into CO
2 equivalents for measurement, and the formula can be expressed as:
The carbon emissions during the materialization phase of prefabricated buildings are composed of specific carbon emissions from four stages: material extraction and production, factory production of components, logistics transportation, and assembly construction:
where
represents the carbon emission factor for the production of the
i-th building material, and
represents the quantity of the
i-th building material;
where
denotes the theoretical energy consumption per unit time for the
i-th processing method,
refers to the carbon emission factor for the consumption of the
j-th energy type,
represents the process efficiency, and
indicates the time consumed by the
i-th processing method to complete the processing of all the components.
where
represents the carbon emissions from vertical hoisting and transportation of components,
refers to the carbon emissions from horizontal transportation of components,
denotes the specific fuel consumption when the
i-th machinery operates,
indicates the rated power of the
i-th machinery,
represents the total working time of the
i-th machinery,
refers to the total transportation capacity of the
i-th vehicle,
indicates the total transportation distance of the
i-th vehicle, and
represents the carbon emission factor for the
i-th vehicle.
,
,
and
can be obtained from standards. Some of the collected indicators are shown in
Table 1, and the remaining indicators are derived from the statistical data of the prefabricated factory production ledger.
3.2. Inventory Analysis
The core objective of inventory analysis is to refine the boundary of the research system into a series of specific processes or activities. By analyzing the input and output characteristics of each unit process or activity and on the basis of the inherent relationships between the system and these unit processes or activities, an inventory of the system is constructed in terms of functional units.
In the study of carbon emissions in the prefabricated building material phase, because of the numerous carbon emission indicators involved, if a direct statistical analysis is performed without screening it may not only be difficult to accurately quantify the carbon footprint because of insufficient data but also lead to calculation redundancies, reducing analysis efficiency and increasing the complexity and uncertainty of decision making.
To address the above issues, this study, which is based on the ‘Standard for Buildings Carbon Emission Calculation’ (GB/T 51366-2019), categorizes the carbon emission factors for the prefabricated building material phase into four types: the commonly used machinery listed in Appendix C is selected as the carbon emission factor for the assembly construction phase; the building materials listed in Appendix D are selected as the carbon emission factors for the building material extraction and production phase; and the transportation categories for building materials listed in Appendix E are selected as the carbon emission factors for the logistics transportation phase; and the construction processes listed in the ‘Quality Control Standards for Prefabricated Concrete Component Production’ (JGJ/T 455-2019) are selected as the carbon emission factors for the prefabricated component factory production phase [
47].
By collecting and organizing actual production data from prefabricated factories; surveying various real prefabricated engineering projects with different usage functions, transportation distances, and assembly rates; and substituting these data into Formulas (2)–(5) to calculate the carbon emissions for each indicator, an emission matrix based on the carbon emission factors for each phase is constructed, laying the foundation for further screening.
To eliminate the interference caused by differences in project scale on factor screening results and establish a unified measurement benchmark for factor screening, this study employs the mass-based method to normalize the original carbon emission data. Using the total weight of prefabricated components in project
i as the unified scale metric, the original carbon emissions of each influencing factor are converted into carbon emissions per ton of prefabricated components, as shown in the following formula:
where
represents the carbon emissions per unit scale for project
i under factor
j,
represents the raw carbon emissions for project
i under factor
j, and
represents the total weight of prefabricated components for project
i. The application of a mass-based normalization method can effectively characterize the physical output scale during the materialization phase of prefabricated buildings. This approach reduces the influence of scale differences across projects in terms of component production volume, prefabrication rate, and logistics organization on analytical outcomes, thereby ensuring that subsequent correlation analyses and principal component extraction are established on a unified measurement basis. Meanwhile, critical information contained in original carbon emissions—including material consumption, energy intensity levels, and carbon emission coefficients—remains preserved. Consequently, the distinct carbon emission characteristics resulting from density variations, processing methodologies, and inherent unit emission features among different materials can still be maintained.
Next, to reduce information redundancy caused by the similarity in fluctuation characteristics, the Spearman Correlation Coefficient is used to assess the correlation between factors. The formula is as follows:
where
represents the difference in the ranking values between factors
i and
j and
n is the sample size, and the coefficient 6 is a constant term in the standard Spearman rank correlation formula used to normalize the squared rank differences. The Spearman Correlation Coefficient
ranges from
. A value of
indicates a perfect positive correlation; a value of
indicates a perfect negative correlation; and a value of
indicates no correlation. In this study,
or
is set as the correlation threshold to screen for highly correlated factors, which are marked as redundant factors. To address the redundancy issue between highly correlated factors, PCA is employed to extract key features while retaining the most significant variance in the data. By applying linear transformations, the original high-dimensional data are mapped to a lower dimensional space, and principal components are extracted to explain the main variations in the data.
First, the data matrix is centralized by subtracting the mean from each variable in the original matrix. Then, the covariance matrix of the centered data is computed using the following formula:
The covariance matrix
is subjected to eigenvalue decomposition to obtain the eigenvalues
and their corresponding eigenvectors
. The magnitude of the eigenvalues represents the proportion of variance explained by each principal component. The eigenvectors corresponding to the top
k eigenvalues are selected to construct the principal component matrix:
The dimensionality-reduced data eliminate redundant information while retaining the main variation characteristics of the original data, making factor analysis more efficient and concise. Finally, the selected factor data are standardized using the Min–Max normalization method, mapping the values to the range
. The resulting values are then scaled by a factor of 100 to produce a percentage score table that reflects the carbon emission levels of various impact factors. Through the normalization process, the values of different carbon emission factors are transformed into dimensionless data, facilitating subsequent weight calculations and comparisons. The Min–Max normalization formula is as follows:
3.3. Impact Assessment
The purpose of the impact assessment is to analyze the contribution rates and sensitivities of the carbon emission factors in each stage based on the list analysis. Through the impact assessment, a deeper understanding of the environmental impact of energy consumption and carbon emissions in prefabricated buildings can be gained. In this study, the Cloud Entropy Method (a combination of the cloud model and entropy weighting method) is used to evaluate the carbon emission impact factors selected in the list analysis for the prefabricated building’s materialization stage. This evaluation identifies the weight of each impact factor, providing a basis for the next step of simulating and identifying improvement paths.
Carbon emission impact factors are highly complex, with nonlinear relationships or coupling effects often existing between indicators. Methods such as the entropy weighting method or fuzzy comprehensive evaluation may neglect this complexity when handling multiple indicators. Compared with traditional methods, the Cloud Entropy Method can further quantify the randomness and uncertainty of the dispersion using the three characteristic values of the cloud drop distribution: expectation, ; entropy, ; and hyper-entropy, . This allows for a more accurate reflection of the importance of the indicators. Moreover, the dynamic nature of the Cloud Entropy Method can adapt well to the dynamic fluctuations in indicator data caused by changes in the scenario, making the weight calculation results more robust.
For the various potential factors that affect carbon emissions, the scoring table formed by Min–Max normalization is first used as input data. The cloud model then processes it into key parameters that represent differences and serve as the basis for calculating the indicator weights using the entropy weighting method. This creates a complete cloud entropy method evaluation model, allowing for a more objective assessment of the importance of the various impact factors.
Assuming that data surveys have been conducted for
m projects, after PCA,
n column indicators are selected. According to the inverse cloud generator operation rules, the cloud model mathematical characteristics of the
j-th indicator can be expressed as:
To fully reflect the impact of the changes in cloud entropy and cloud hyper-entropy of each indicator factor on the indicator weights during the calculation process, the expectation value
needs to be optimized to
, which is then substituted into the formula to calculate the indicator weights:
3.4. Results Analysis
The purpose of the results analysis is to classify and summarize the results of the inventory analysis and impact assessment, assess the environmental impact of prefabricated buildings, and propose improvement suggestions to reduce energy consumption and minimize environmental burden. After completing the calculation of the indicator weights for the carbon emission impact factors, the inverse operation of the judgment matrix is performed on the basis of the weight vector. This relationship vector between the evaluation factors is then substituted into the NK model. The model is analyzed in conjunction with Fitness Landscape Theory, and computer simulation is used to find the optimal evolutionary path for carbon emissions. In the model, ‘N’ represents the number of elements in the system, and ‘K’ indicates the degree to which each element is influenced by other related factors. When any element changes, it has a cascading effect on the K related elements, thereby altering the overall fitness of the system. If this change improves fitness, it is considered a success; otherwise, it is deemed a failure. The process continues through repeated iterations until the system’s fitness reaches its maximum, indicating that the optimal genotype combination has been found, marking the system’s best evolutionary state.
Without considering the interrelationships of the factors themselves, a direct association matrix
is constructed between the factors. The direct association evaluation matrix is normalized to obtain the normalized direct association matrix
, and the comprehensive impact association evaluation matrix
is then calculated. The formula is as follows:
The elements in the comprehensive impact management evaluation matrix are examined, and the influence degree, affected degree, and centrality of each factor are calculated. These calculations are used to reflect the role of a particular influence factor within the set of influence factors. The formulas are as follows:
To extract the key elements for improving carbon emissions during the prefabricated building materialization phase (to determine the parameter
N), it is necessary to calculate the centrality extraction threshold
:
In the formula,
represents the maximum centrality coefficient of the influencing factors, with a value range of
. A larger value of ooo indicates a higher centrality of the influencing factor, and the final number of selected key elements will be lower. When
,
N influencing factors are extracted to construct the key element set
. The
S-th key element
is calculated, and the parameter
N is determined according to the following formula:
Only the row and column vectors corresponding to the key elements in
are retained, resulting in the key element direct association matrix
. The matrix elements
are subsequently calculated to construct the key element adjacency matrix
:
where
indicates that key element
y influences key element
x. When key element
y changes, it leads to a corresponding change in the fitness value of key element
x;
indicates that key element
y does not influence key element
x. Next, the sum of the row elements in
is calculated. Without considering the influence of key elements on themselves, the association degree between key elements is computed as follows:
On the basis of the NK model theory, the average association degree
of each key element is denoted as
K, which represents the average number of influences each key element receives from other elements. The larger the value of
K, the greater the interaction between the elements in the system, making the system more complex. The
K value is calculated as follows:
According to the mutual correlation relationships of key elements in the adjacency matrix
, when key element
itself changes, its fitness will also change accordingly. On the basis of the
NK model principle, several values are randomly extracted from the uniform distribution
as the fitness values of the key element
, constructing the key element fitness matrix
. The matrix elements
are calculated as follows:
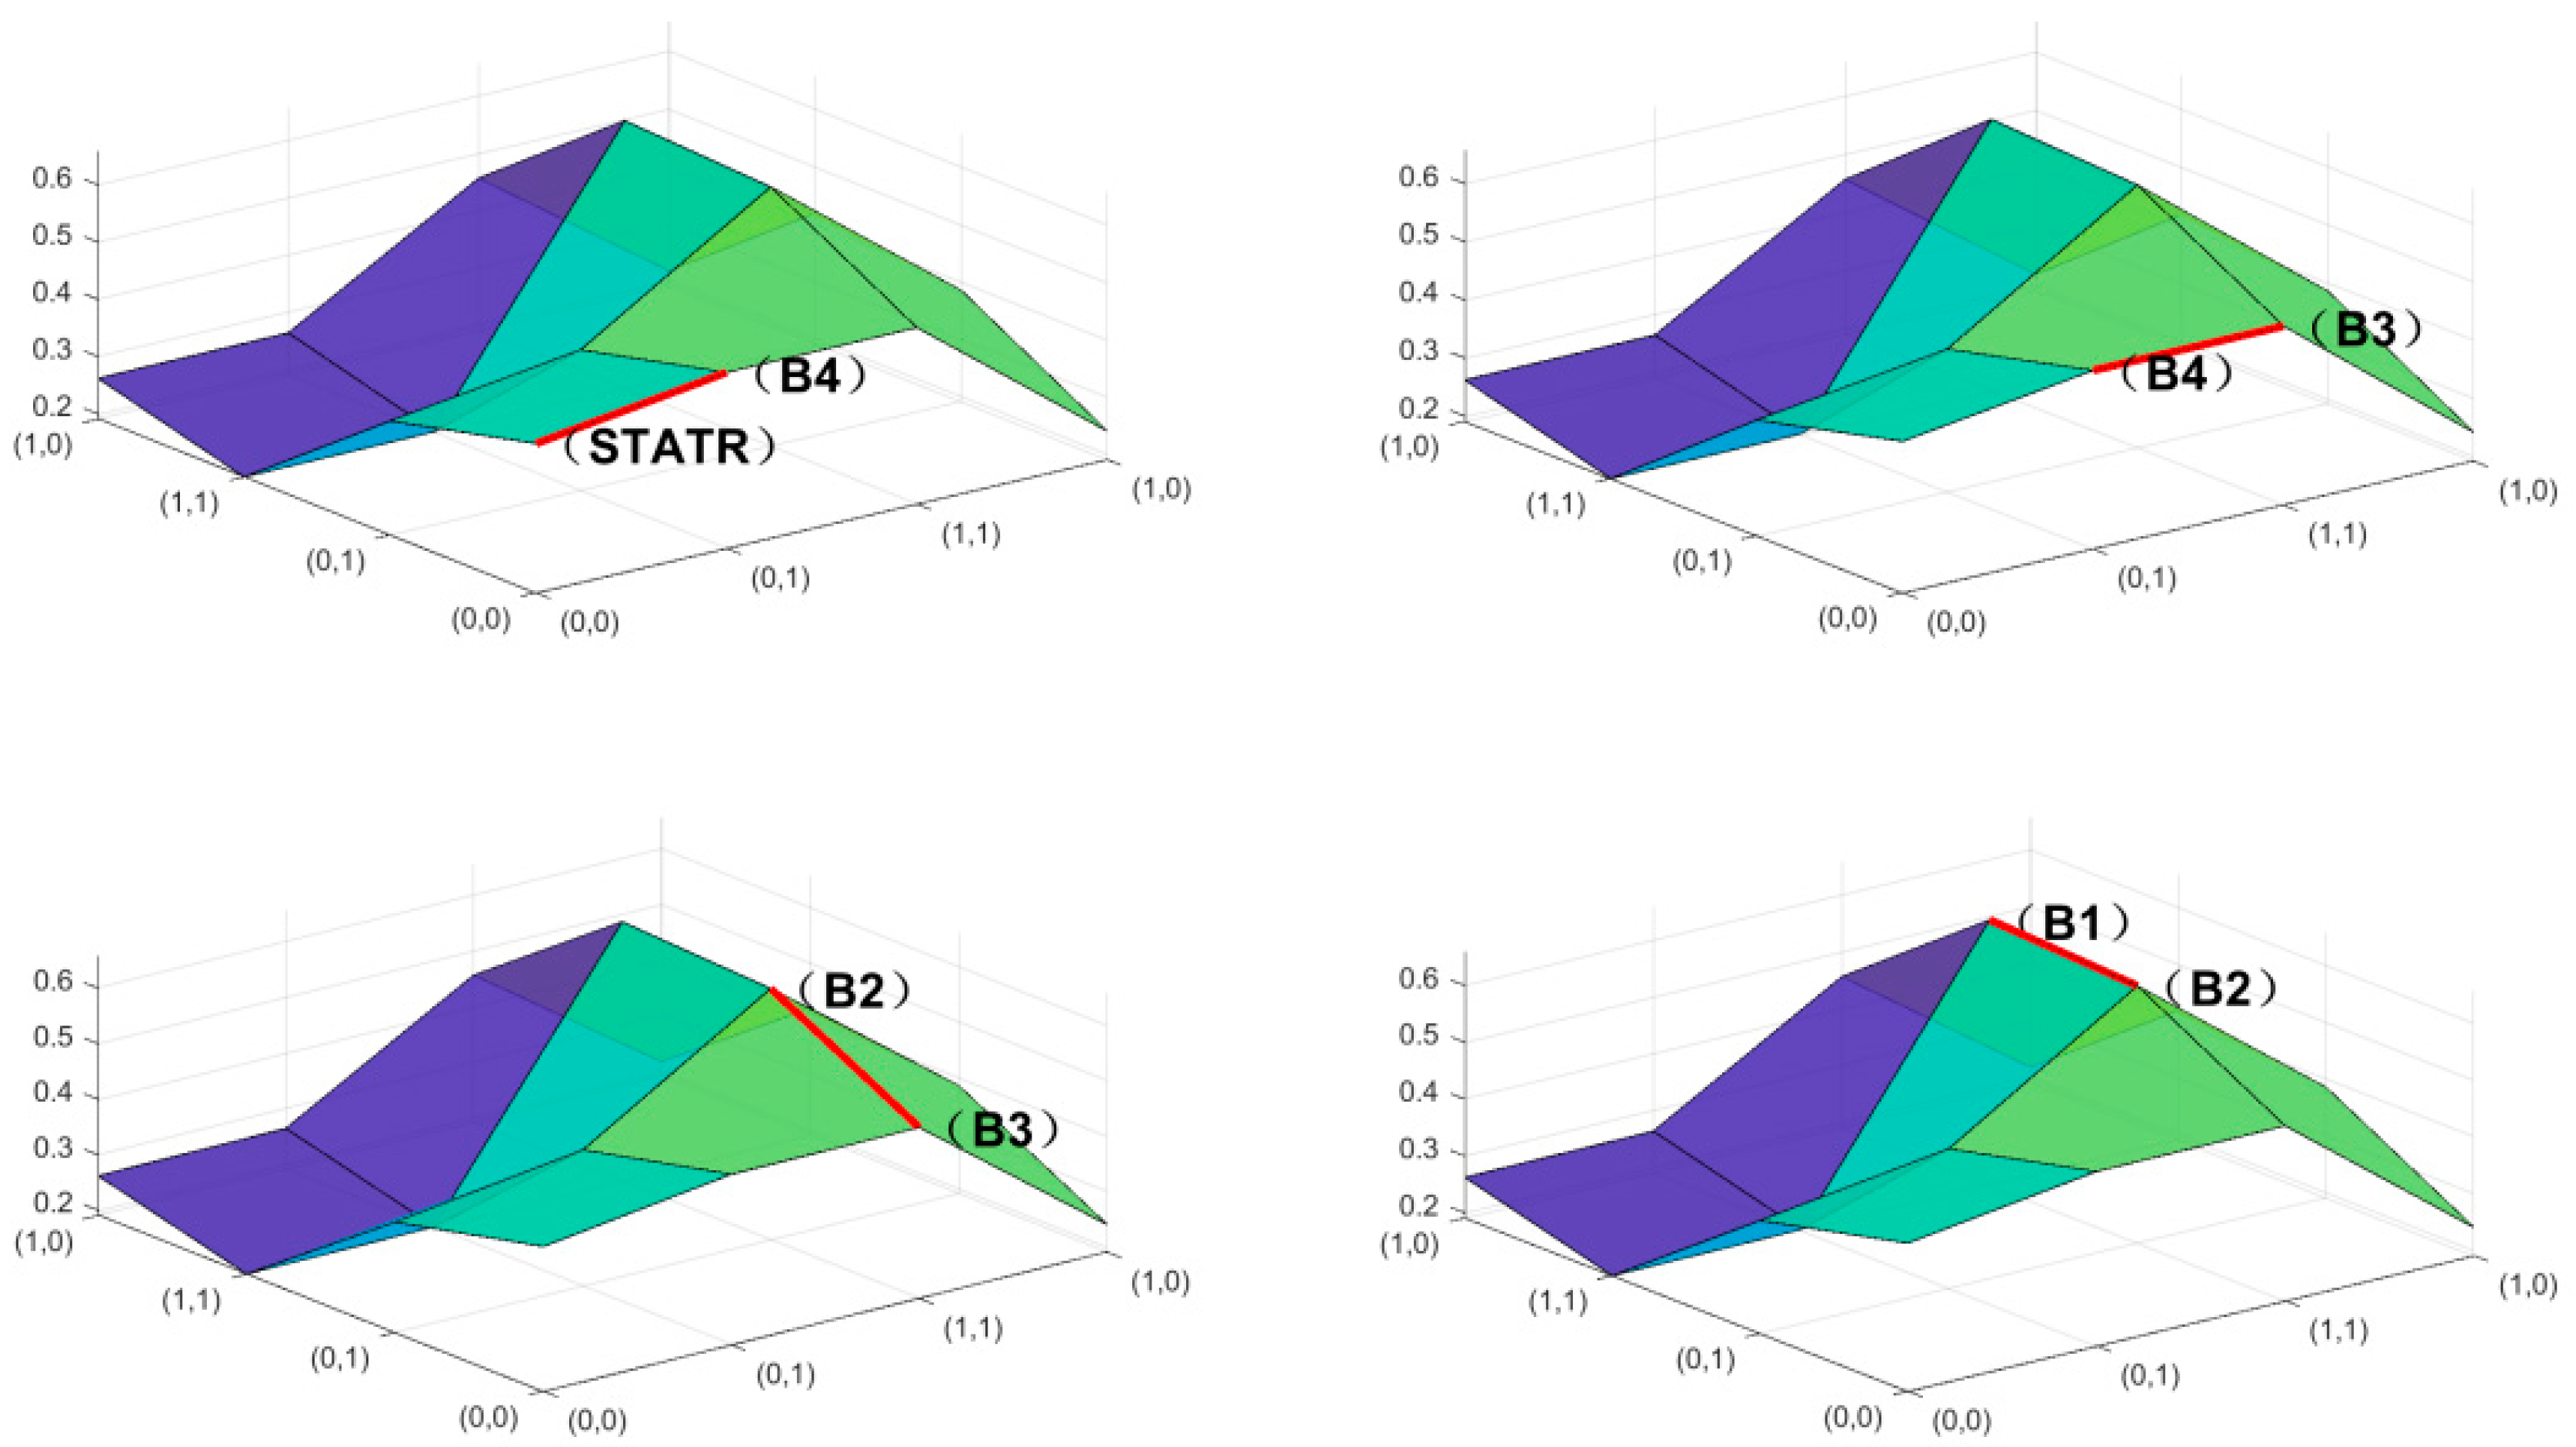
By mapping the fitness values of all combinations of key element alleles to three-dimensional space, a fitness landscape climbing diagram can be plotted, thereby enabling the analysis of the influence path.
4. Experiments
To comprehensively and clearly analyze the carbon emissions in the four materialization stages of prefabricated buildings, from the extraction and production of building materials to the factory production of components, logistics transportation, and assembly construction, the keywords ‘prefabricated buildings’ and ‘carbon emissions’ were first used to screen the relevant standards issued by the competent departments of Chinese industries. The appendix of the document ‘Building Carbon Emission Calculation Standard’ (GB/T 51366-2019) clearly describes the materials, lifting equipment, and transportation vehicles commonly used in the construction process of the building industry, which can fully cover various situations of the production of prefabricated buildings. Moreover, the appendix lists the carbon emission factors of various building materials, facilitating principal-components analysis and calculation. In the document ‘Quality Control Standard for Prefabricated Concrete Component Production’ (JGJ/T 455-2019), the construction technology of prefabricated buildings is also detailed. Therefore, by analyzing these two standards, the carbon emission factors in the materialization stage of prefabricated buildings can be determined.
4.1. Filter Influencing Factors
Taking the stage of material extraction and production as an example, in Appendix D of the document ‘Standard for Building Carbon Emission Calculation’ (GB/T 51366-2019), a total of 69 building material index factors are listed. After excluding some materials, such as page rock and large-diameter submerged arc welding straight seam steel pipes, which do not participate in the production of prefabricated components, we initially selected 23 raw materials closely related to the production of prefabricated building components as the basis for PCA. To comprehensively and accurately complete the index screening, we conducted long-term tracking research on the Yuzhong Innovation Technology Industrial Park in Gansu China, selecting as data sources six prefabricated building projects with different functional uses, transportation distances, and assembly rates. Assembly rate refers to the ratio of the concrete volume of prefabricated components to the total concrete volume used within a building unit [
48]. Project1 (Tianshui City shopping center) is 320 km from the factory with full assembly construction; Project2 (an out-of-province villa complex) is 1300 km away with a 100% assembly rate; Project3 (a high-rise residential building) is 520 km distant, at an 80% assembly rate; Projects 4–5 (a multistory residential building) are both 100 km from the factory but differ in assembly rates (50% vs. 20%); and Project 6 (an office building) has the shortest distance (17 km) yet the lowest assembly rate at 20%. We collected actual production data of the 23 material index factors in different projects and substituted them into Formulas (2)–(6) to calculate the carbon emissions of each index. The original data after descaling are shown in
Table 2.
After the carbon emissions of each stage’s influencing factors were de-scaled, they were substituted into Formula (7). The Spearman Correlation Coefficient was used to evaluate the correlation between the factors. The calculation results are shown in
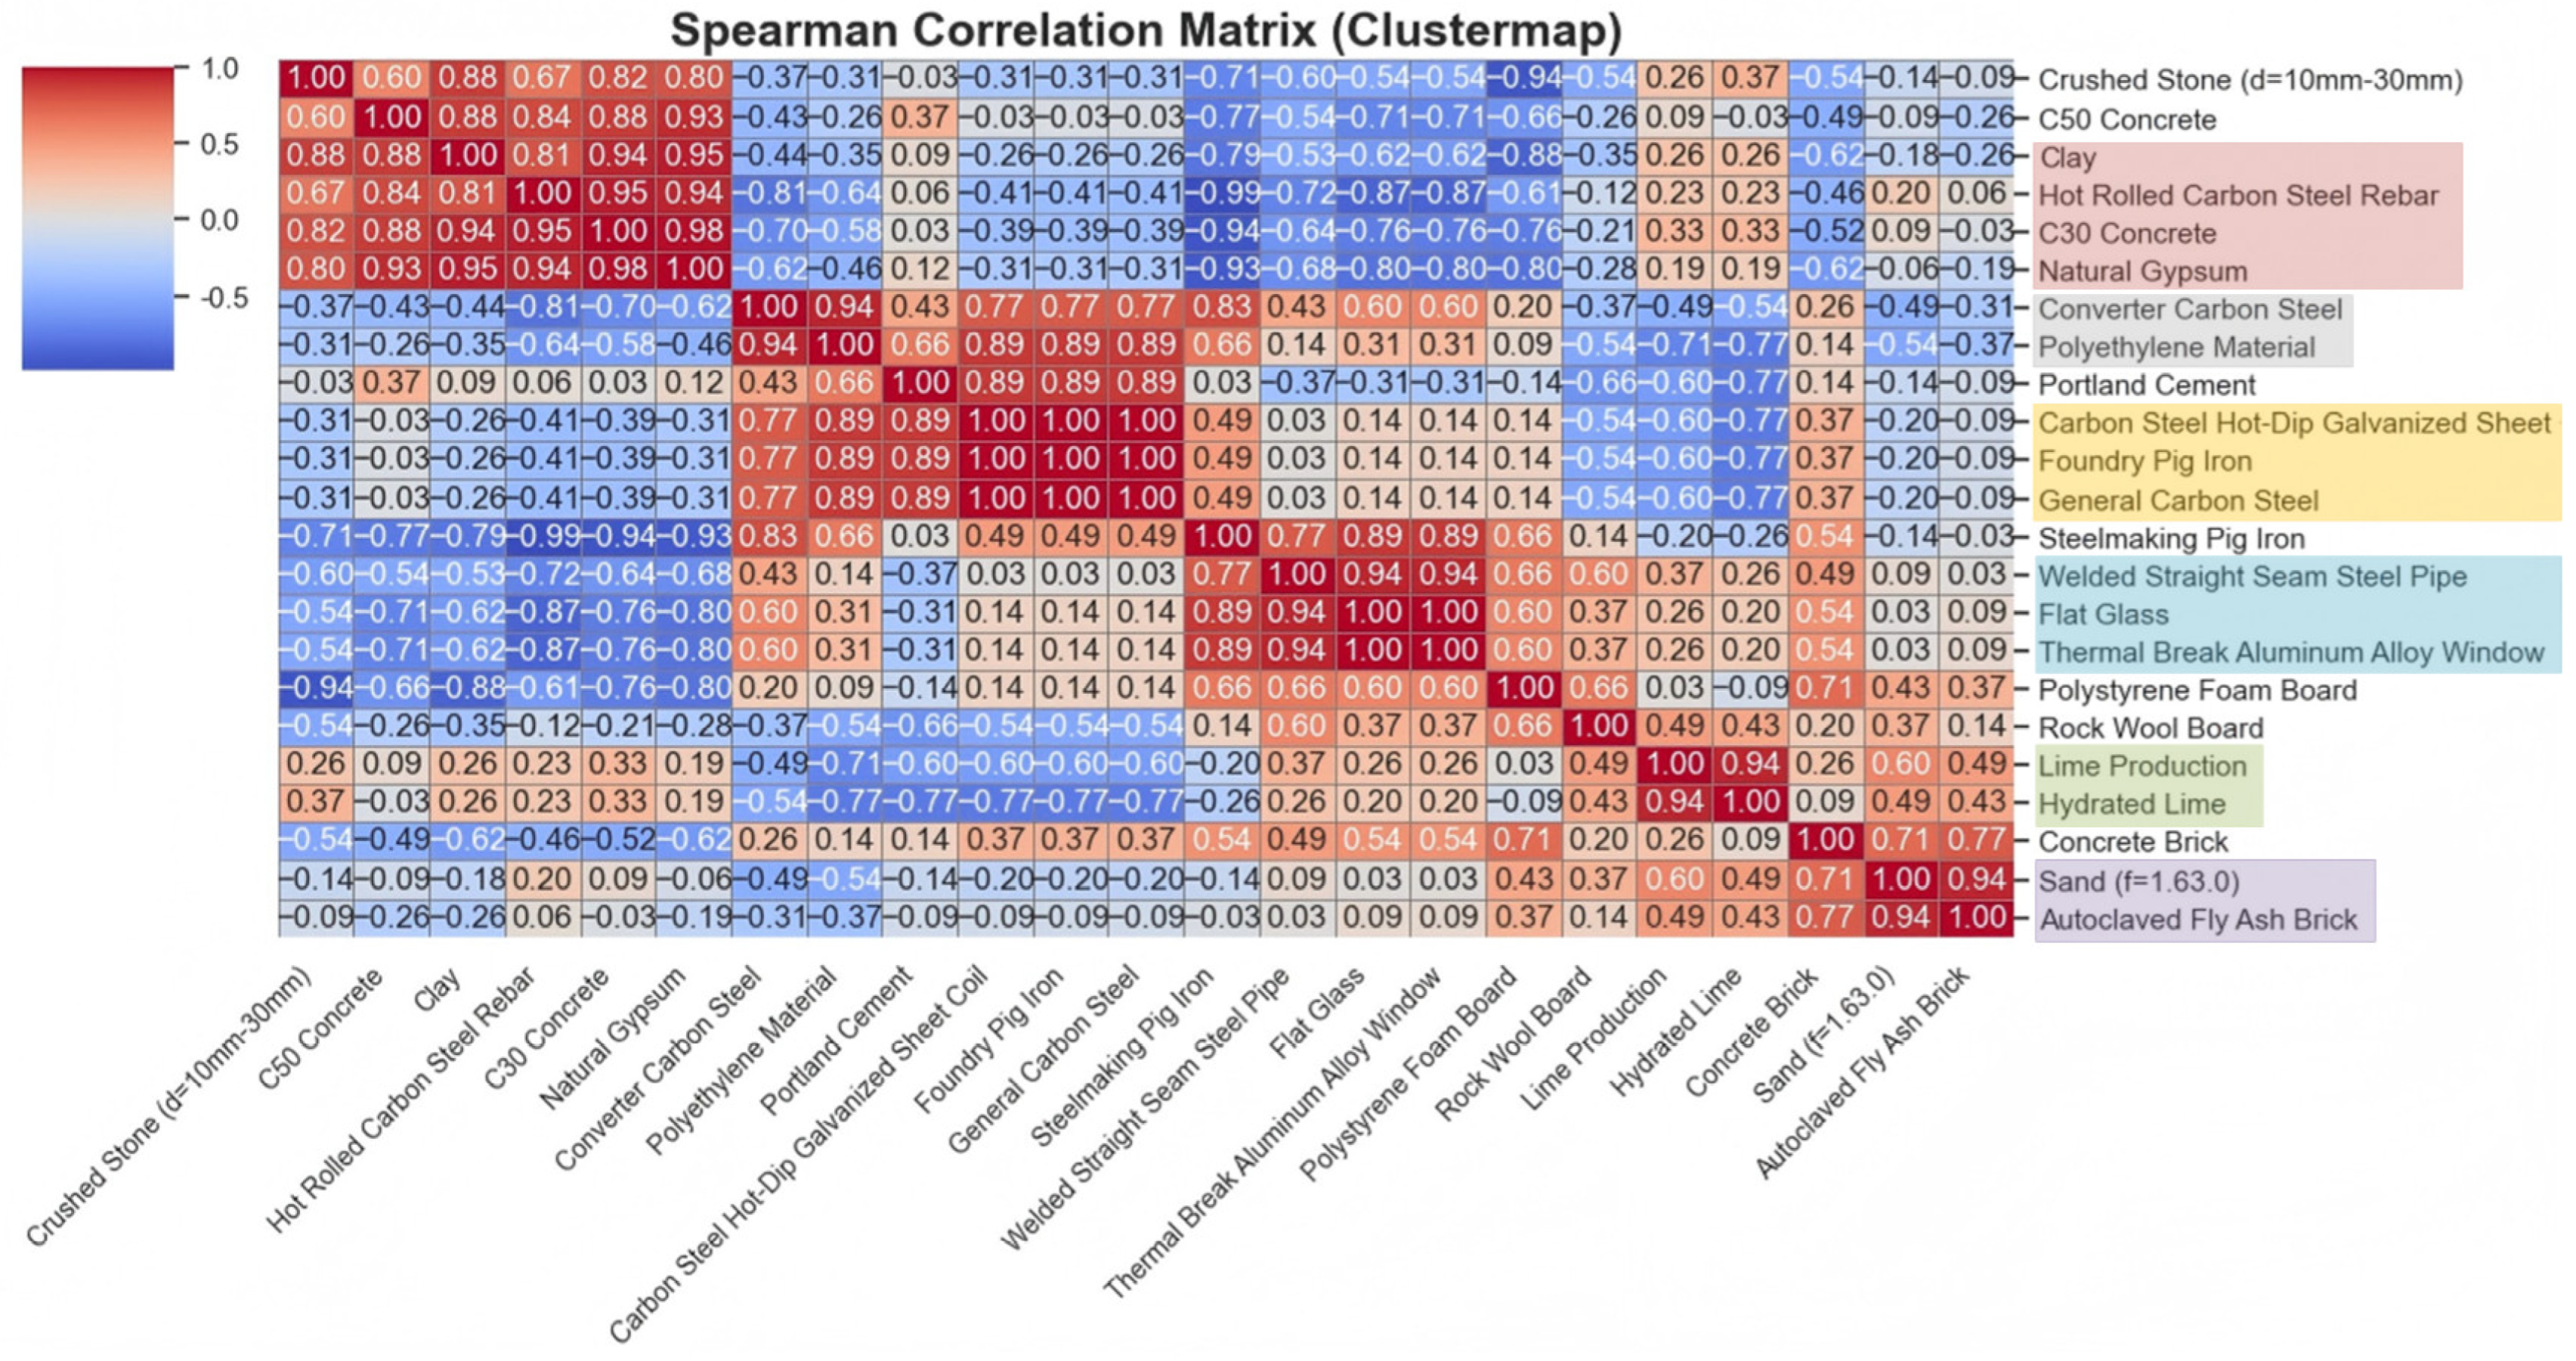
Figure 3. We noted that clay, C30 concrete, natural gypsum, and hot-rolled carbon steel bars are highly positively correlated; converter carbon steel and polyethylene materials are highly positively correlated; carbon steel hot-dip galvanized coils, cast pig iron, and common carbon steel are highly positively correlated; welded straight seam steel pipes, flat glass, and aluminum alloy windows are highly positively correlated; lime production and slaked lime are highly positively correlated; and sand (f = 1.63.0) and autoclaved fly ash bricks are highly positively correlated.
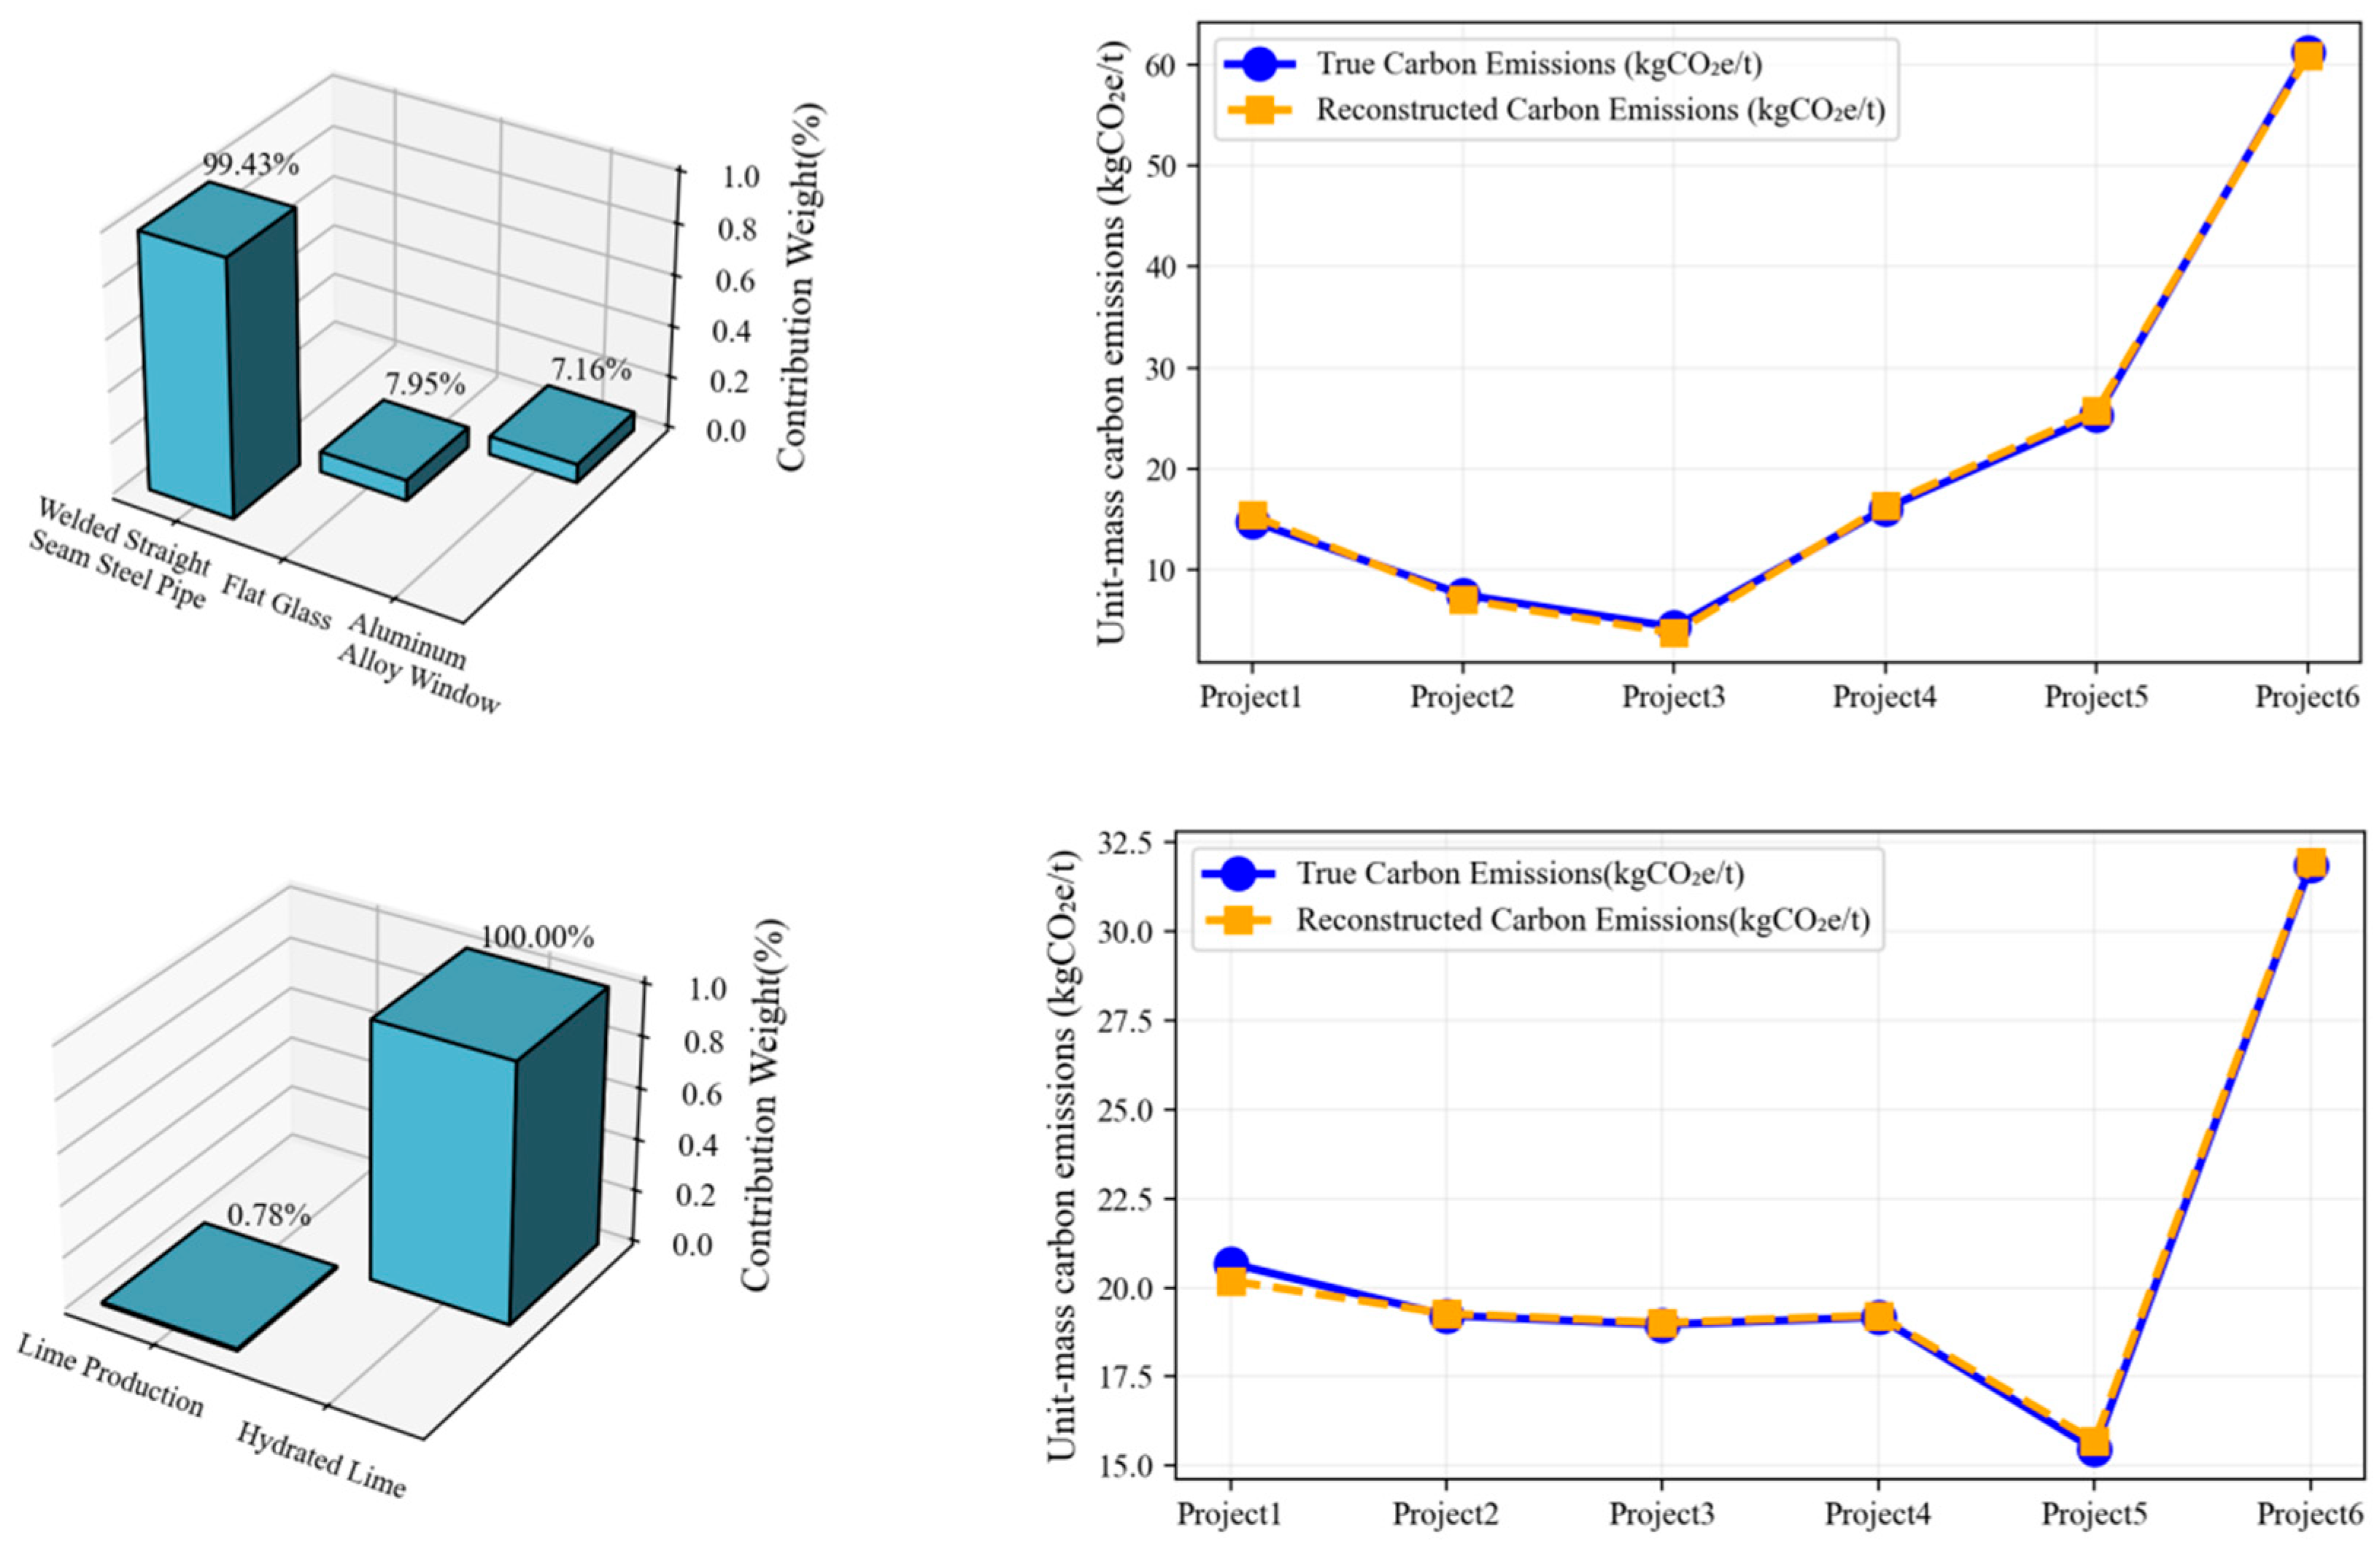
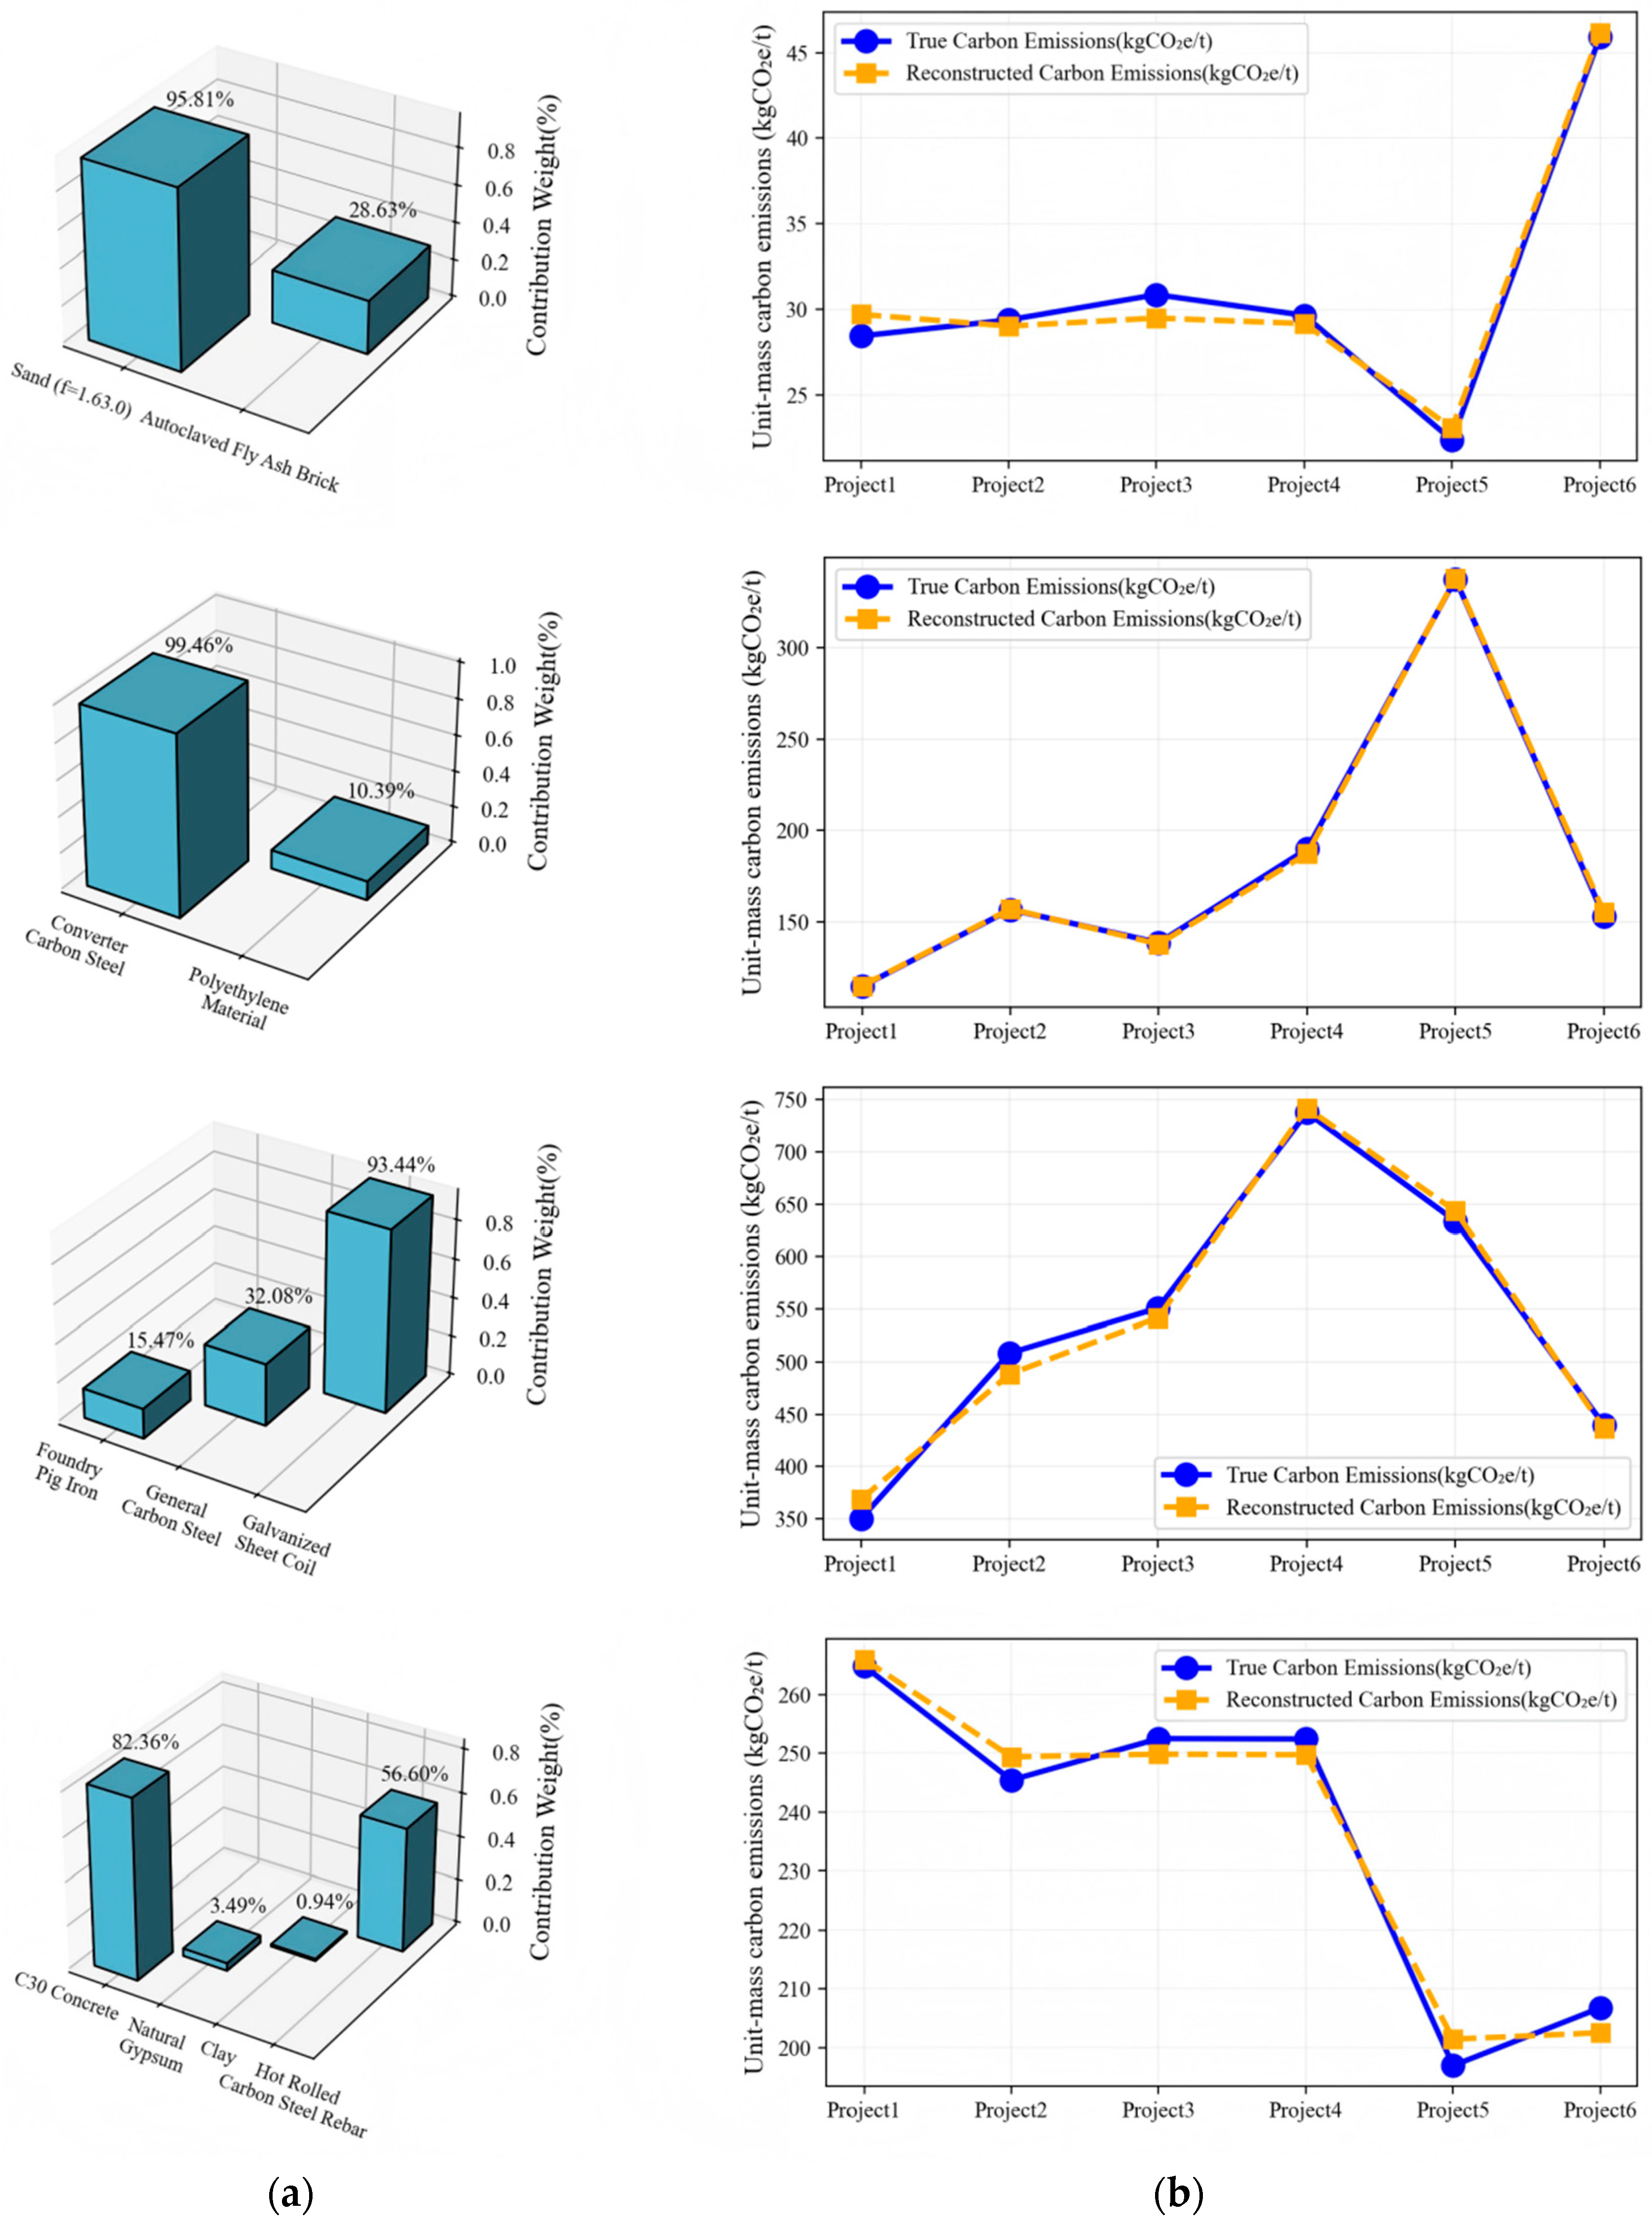
In the next step, PCA is performed on the six groups of indicators that show a high degree of correlation. The scaled impact factor carbon emissions are still used in Formulas (8)–(10) to calculate the proportion of variance in the interpretation of each factor to the principal component, as well as the carbon emission situation of the restored value and the comparison with the actual situation, to judge the impact of calculating carbon emissions with the principal component on the final result, as shown in
Figure 4, to further screen the key carbon emission factors in each group of related indicators.
According to the PCA results, eliminating indicators with small contributions hardly affects the impact assessment of carbon emissions. Therefore, impact factors with a contribution greater than 50% are chosen as key indicators for subsequent weight calculations. Carbon emission factors from the stages of component factory production, logistics transportation, and assembly construction are also screened using the same approach. Finally, the key impact factors of carbon emissions during the assembly phase of prefabricated buildings are determined. The raw data of the screened key carbon emission factors are substituted into Formula (11) for Min–Max normalization, resulting in
Table 3.
4.2. Weight Analysis of Influencing Factors
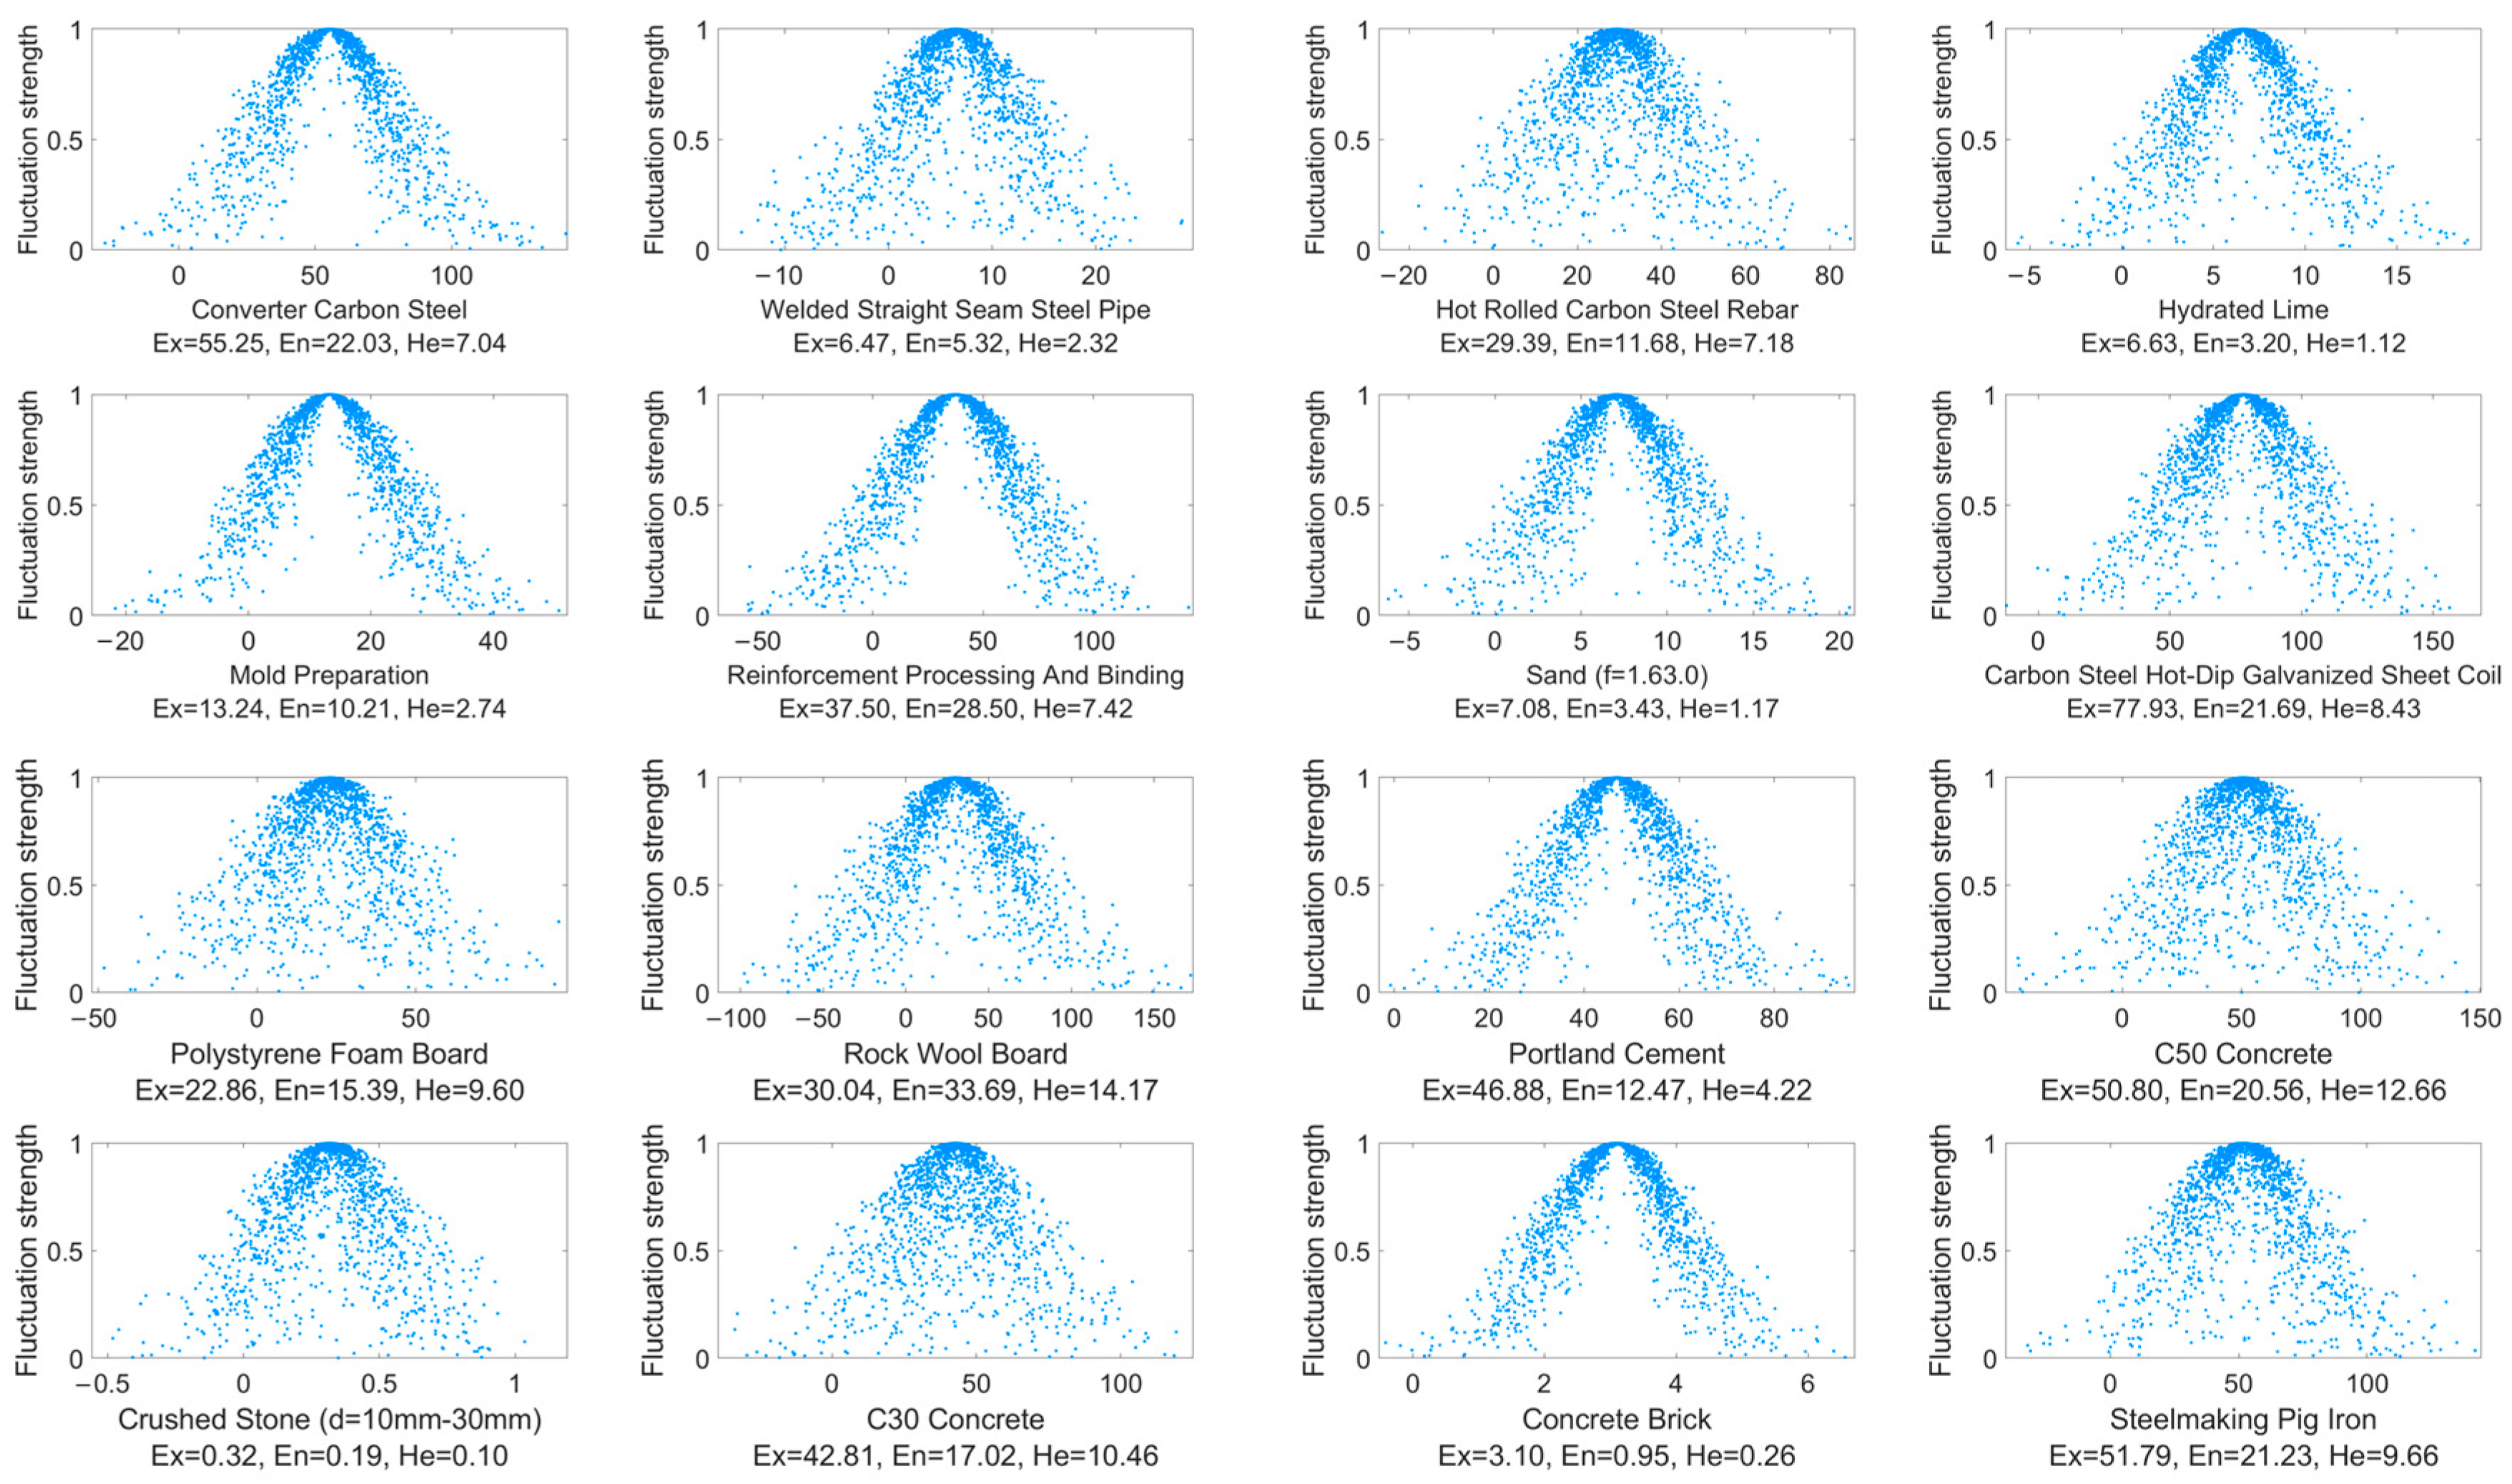
The cloud model is used to process the Min–Max standardized scores of various indicators through the inverse cloud generator. The expected values (Ex), entropy (En), and hyper-entropy (He) of each influencing factor are calculated according to Formulas (12)–(14). This results in cloud diagrams for each influencing factor, as shown in
Figure 5. The discrete points on the cloud diagram represent the functional distribution of each indicator.
An analysis of the cloud charts of various influencing factors reveals that the scatter points of indicators such as concrete bricks, broken stone, electric heat curing, and tower cranes are highly concentrated, with low entropy and hyper-entropy, and that their performance is very stable, which is suitable as a benchmark or standard indicator. On this basis, the scatter points of indicators such as steel bar tying and processing, rock wool board, and heavy duty diesel truck (30–46 t) have a very wide distribution range, and the entropy and hyper-entropy are significantly high, indicating that the performance has large fluctuations and needs key monitoring and in-depth analysis. In addition, the scatter point distribution ranges of indicators such as ordinary Portland cement, C30 and C50 concrete, hot rolled carbon steel bars, and polystyrene foam board are moderate, the entropy and hyper-entropy are within a reasonable range, the performance fluctuation is moderate, the randomness is small, and the overall situation is controllable. Overall, the cloud chart of the indicators covers a range from high stability to high randomness, which can provide an important reference for decision making at different stages, such as production, transportation, assembly, and subsequent carbon emission reduction path planning. The expected values and entropy values of each index are substituted into Formulas (15) and (16) to calculate the weights of the influencing factor indicators; the results are given in
Table 4.
The results of the indicator weight calculations clearly indicate that during the assembly phase of prefabricated buildings the mining and production of building materials remain the main sources of carbon emissions. Among them, the expected values (Exj) and entropy values (Enj) of seven materials—ordinary Portland cement, steel-making pig iron, polystyrene foam board, C30 concrete, hot-dip galvanized carbon steel plate coil, converter carbon steel, and rock wool board—are relatively high. This indicates that these materials have high energy consumption or resource utilization and cause significant fluctuations in environmental impacts; thus, they should be prioritized for control. During the factory production phase, the expected and entropy values of rebar processing and tying are also high, revealing significant energy consumption and environmental impacts at this stage. It is necessary to focus on optimizing their production processes to reduce carbon emissions. In the logistics phase, transportation tools, such as medium-sized gasoline trucks (8 t) and heavy-duty diesel trucks (30–46 t) have a considerable impact on the environment. It is important to note that because of the small usage of some high-impact factors (such as polystyrene foam boards and medium-size (8 t) gasoline trucks), their weight ratios are not high, and the carbon reduction effects of controlling them are relatively limited.
4.3. Analysis of the Development Path of Influencing Factors
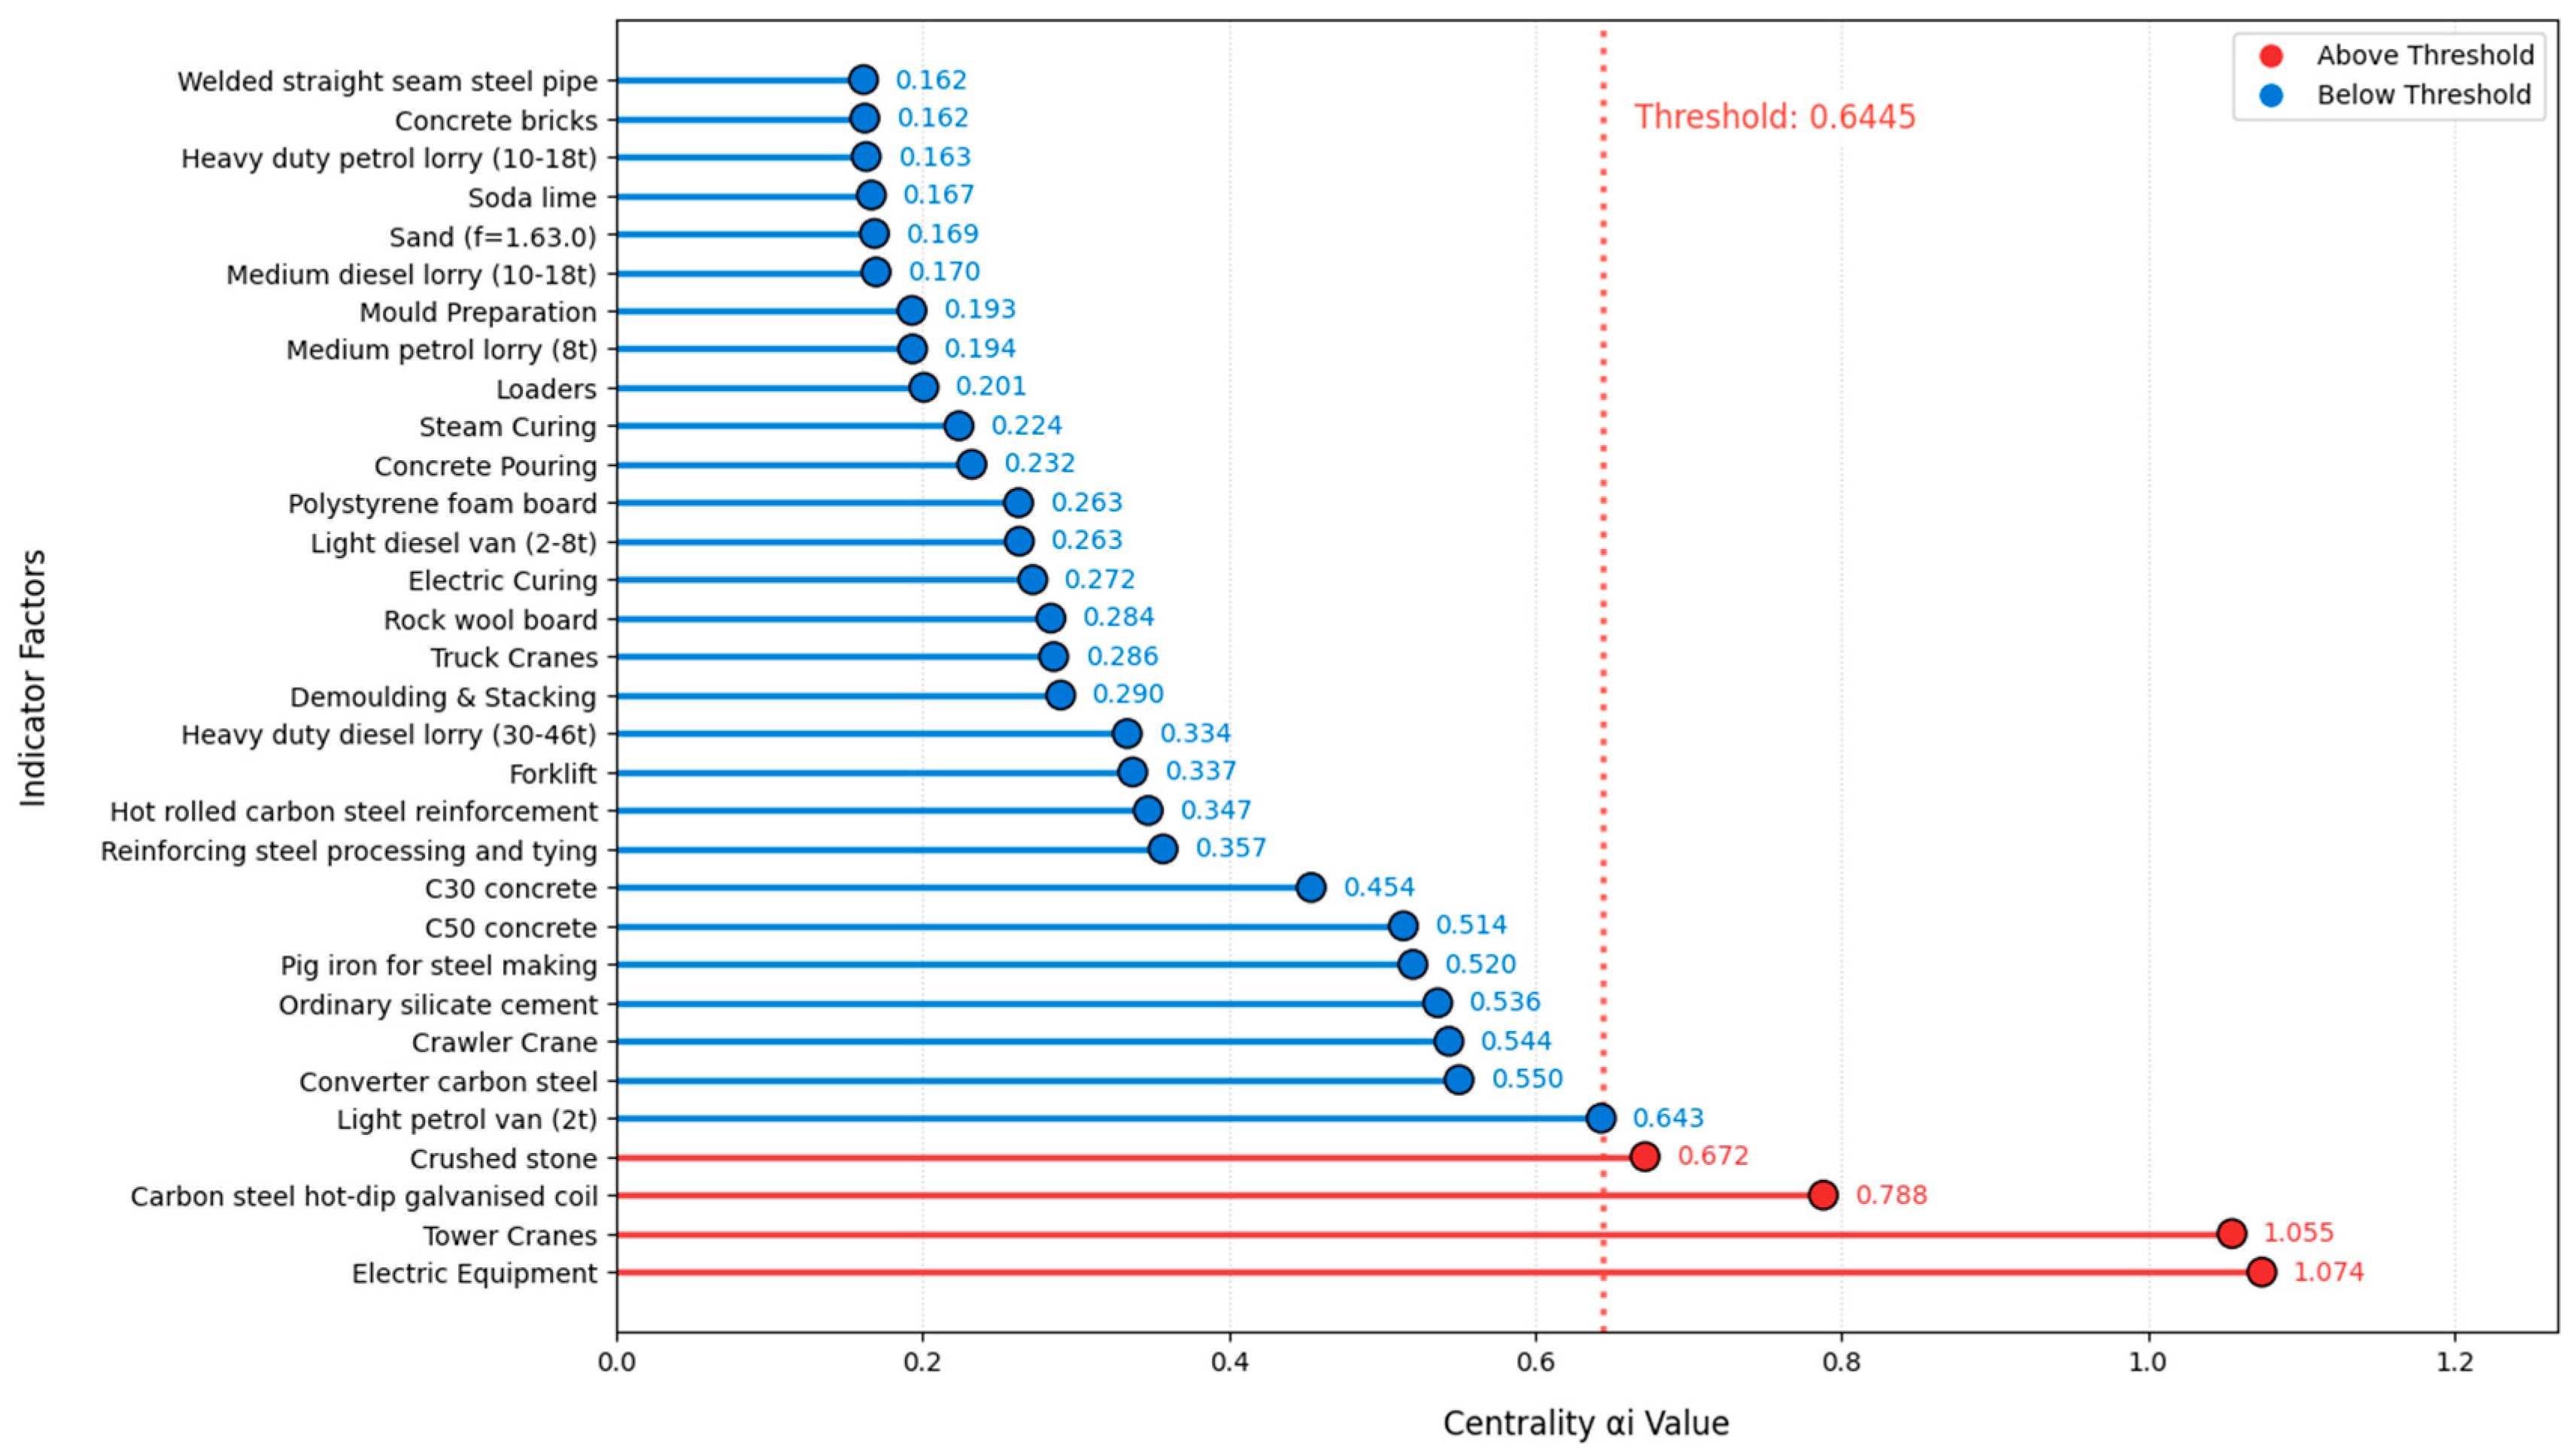
In real-world scenarios, the carbon emissions of various indicators in the assembly phase of prefabricated buildings are not independent of each other. There are interactions and influences between factors. When optimized or improved, factors with high centrality can drive the improvement of the entire system through their connections with other factors, resulting in greater emission reduction effects. To identify the most influential indicators from a systemic perspective, and to scientifically formulate carbon reduction measures, the weights of the 32 factors that influence carbon emissions calculated by the Cloud Entropy Method were used as raw data. They were substituted into Formulas (17)–(19) to calculate the centrality of each indicator, determining the role of each influencing factor within the set of influencing factors. The results are shown in
Figure 6.
To emphasize the more impactful factors, we set the maximum centrality ratio to
. According to Formula (20), this results in a centrality extraction threshold of
. Indicators with a centrality higher than this extraction threshold are considered to be high-impact factors in reducing carbon emissions in the materialization phase of prefabricated buildings. With
, this forms the key element set
.
corresponds to gravel (d = 10–30 mm),
represents galvanized carbon steel coils,
represents tower cranes, and
represents electric equipment. Using Formulas (21)–(24), we calculate
, indicating that the interactions between these factors are strong and that optimization is challenging. After 50,000 simulations on the optimization path of factors that influence carbon emissions in the materialization phase of prefabricated buildings, we found that the key element optimization path is
. This means that the selection and use of electric equipment should be optimized first, followed by the selection of tower cranes, galvanized carbon steel coils, and the use of gravel with particle sizes ranging from 10 mm to 30 mm, as shown in
Figure 7. By controlling these four indicators in sequence, other carbon emission factors can be significantly affected, thereby reducing the overall carbon emission level in the materialization phase of prefabricated buildings. It should be noted that this control does not necessarily involve reducing the use of a particular material or equipment; it might also involve increasing its use to reduce the carbon emission levels of other factors.
5. Discussion
A comparison of the results of the fitness landscape simulation with the weights of the carbon emission impact factors reveals that the carbon emission factors selected by the analysis model are not those with the largest carbon emissions at this stage. This is because these factors have a ‘leverage effect’. By controlling these factors, they can indirectly affect other factors, ultimately having a greater impact on overall carbon emissions. Therefore, the results of the fitness landscape simulation are more focused on the formulation of future emission reduction policies rather than the control of current carbon emission situations.
On the basis of the path information reflected in the landscape map, to effectively reduce the carbon emission level during the materialization phase of prefabricated buildings it is first necessary to control and optimize the carbon emissions of prefabricated building components during the assembly phase. To be specific, priority should be given to controlling electric equipment and tower cranes. Both of these machines consume electrical energy and, compared with gasoline and diesel energy equipment, their carbon emissions are extremely low, accounting for only 0.22% of the total carbon emissions in the materialization phase. Under the current power grid energy structure the indirect carbon emissions of electric equipment are low, especially in areas with a high proportion of clean energy, where the carbon emission advantages are even more prominent. Therefore, vigorously promoting the use of clean energy machinery and gradually replacing it is an effective way to significantly reduce the carbon emissions of prefabricated buildings.
The extraction and production of building materials is undoubtedly the largest source of carbon emissions in current prefabricated construction, accounting for 71.71% of the total carbon emissions in the materialization phase. Among all the raw materials, the carbon steel hot-dip galvanizing coil has the highest carbon emission, reaching 12.07%. According to surveys, during the steel production process blast furnaces need to maintain a high-temperature environment of approximately 2000 °C for a long time, consuming enormous amounts of fuel. After treatment, the steel plate still needs to be immersed in a zinc bath heated to 450–480 °C for galvanizing, further increasing energy consumption. Steel companies are considered high-energy–consuming, high-emitting, and high-polluting enterprises worldwide. The simulation results of the adaptive landscape show that after the original equipment is gradually replaced with new energy devices to achieve carbon emission reductions, it is also necessary to control high-emission materials, such as carbon steel hot-dip galvanizing coils. In the future, with the iteration of new material technologies, dependence on these materials in prefabricated component production can be gradually reduced, ultimately achieving carbon emission reductions.
The simulation results of the fitness landscape also include gravel as the last control factor. Although the current carbon emissions from gravel are not high, accounting for only 0.17% of the total emissions in the materialization phase of prefabricated buildings, gravel is the most important auxiliary material in the production of prefabricated components and can indirectly affect carbon emissions through its synergistic effects on other materials and processes. According to surveys, gravel is an important aggregate in concrete, accounting for approximately 60–70% of the concrete’s weight. The gradation and surface roughness of gravel affect the compactness and flowability of concrete, and optimizing the quality of gravel can help reduce the use of cement, thereby indirectly reducing the carbon emissions of concrete. In addition, the gradation and quality of gravel have a significant effect on the pouring and curing of concrete and other, related processes. Therefore, fine-grained control of the raw material quality and processing technology of prefabricated components is also very beneficial for promoting carbon emission reduction in prefabricated buildings.
From the perspective of research methodology, integrating the cloud entropy method with the NK model for analyzing carbon emissions during the materialization phase of prefabricated buildings holds certain theoretical value. The materialization phase of prefabricated construction involves multi-agent collaboration and multi-process interleaving, where original emission data typically exhibit significant fuzziness and randomness. Traditional weighting methods struggle to capture the uncertainty inherent in such data, whereas the cloud entropy method accurately characterizes the central tendency and dispersion degree of carbon emission factors through three numerical features—expectation, entropy, and hyper-entropy—thereby ensuring robust weight identification under complex engineering conditions. Carbon emission accounting for prefabricated buildings is not merely a simple summation of emissions across stages but involves interactions among multiple factors. By constructing a fitness landscape, this approach can identify globally optimal emission reduction pathways while avoiding the limitations of traditional single-factor reduction strategies that focus solely on “local peaks.” Combining the cloud entropy method with the NK model enables answering two critical questions: “Which factors are currently more important?” and “Which factors should be prioritized for control to achieve systemic emission reduction benefits?” This methodological extension from static evaluation to dynamic path analysis helps overcome existing research constraints that focus only on emission magnitudes or stage proportions, shifting emission reduction decision-making from single-factor control toward systemic coordinated optimization.
Nevertheless, this study has specific applicability boundaries and conditional limitations. Firstly, the research sample primarily derives from actual project data of prefabricated factories within a single region. While this reflects authentic production conditions, variations in energy structures, transportation conditions, and material supply systems across different regions may alter key factor identification outcomes. Secondly, the interaction strength parameters and centrality extraction thresholds in the NK model inevitably influence the resulting fitness landscape. Although repeated simulations have yielded relatively stable optimization paths, further sensitivity testing remains necessary for these parameters. Future research could expand the sample scope by incorporating cross-regional and cross-typology project data, while integrating dynamic grid emission factors, material supply chain information, and time-series production data to validate the robustness of key control factors under diverse scenarios.
6. Conclusions
This work proposes a theoretical model that is based on the Cloud Entropy Method to identify the factors that influence carbon emissions in the materialization phase of prefabricated buildings. Using the index weights evaluated by the Cloud Entropy Method as a data foundation, it introduces them into the NK model for tens of thousands of simulations, quantitatively analyzing the optimal development path to reduce carbon emissions in the materialization phase of prefabrication. This method overcomes the shortcomings of past research, in which indicator evaluation and simulation were separate, breaking down the data barriers between the two phases. Through tens of thousands of simulations, indicator cloud maps and optimization path climbing graphs are formed for observation, overcoming the limitations of previous studies, in which empirical data measurements were challenging. The results of this case study indicate that although the building material extraction and production phase is currently the largest source of carbon emissions, significant carbon reduction effects can be achieved by optimizing equipment used in the assembly phase, such as electric devices and tower cranes, and by controlling high-energy–consuming materials, such as galvanized steel coils. The fitness landscape simulation further reveals that, in the future, the focus should be on the application of new energy devices and the development of new material technologies to gradually reduce the dependence on traditional high-carbon materials. In summary, this research not only provides a scientific basis for energy savings and emission reductions in the field of prefabricated buildings but also highlights directions for formulating specific carbon reduction strategies.