Article

Methodology for Determining Tree Visibility from Apartments on Different Floors

by
Bartłomiej Wyrzykowski
* and
Albina Mościcka
Faculty of Civil Engineering and Geodesy, Military University of Technology, 00-908 Warsaw, Poland
*
Author to whom correspondence should be addressed.
Appl. Sci. 2026, 16(7), 3514; https://doi.org/10.3390/app16073514
Submission received: 25 February 2026 / Revised: 21 March 2026 / Accepted: 31 March 2026 / Published: 3 April 2026

Abstract

Contemporary urban planning increasingly refers to pro-environmental standards, among which the 3–30–300 principle plays a significant role. One of its key assumptions is that at least three trees should be visible from every dwelling. However, a review of the existing literature reveals a substantial research gap: current analyses of green visibility are predominantly based on two-dimensional models, which fail to account for variations in the elevation of the observation point. This article introduces an original methodology for three-dimensional tree visibility analysis that explicitly incorporates building floor level as a critical factor shaping the resident’s visual perspective. The proposed approach integrates the determination of observation point locations, the modeling of architectural obstacles, and line-of-sight analysis within a 3D spatial framework. The results obtained for the selected test area indicate that only 16.3% of the analyzed windows provide a view of the required minimum of three trees. From 14.3% of windows, two trees are visible, while a single tree is visible from 27.4% of windows. Notably, as many as 42% of observation points offer no view of any trees at all.

1. Introduction

Visibility, defined as the ability to perceive a given object from a specific point in space [1] where points A and B [2] are considered to be visible to each other, is a key element of analytical processes, especially in situations that require consideration of visual relationships between individual components of the landscape [3]. Therefore, research on visibility has become increasingly important and finds wide application across numerous fields, including spatial planning [3,4], the assessment of historical site significance [5], environmental protection, and landscape analysis [6,7] or planning [8]. Today, a substantial share of visibility studies relies on geographic information systems (GIS), which enable the modeling and evaluation of spatial phenomena without the need for field surveys, thereby creating a basis for much broader use of such analyses.
An example of research in this field is the study by Longyun Ren and Yongkang Cao [9] that presents the use of GIS tools to delineate areas visible from various viewpoints within the city of Xinchang, China. The proposed methodology was based on analyzing the relationship between the observer and the target object. The method focused on identifying areas that are visible from selected points, which proved useful for examining large regions but less effective for analyses requiring higher levels of detail and more in-depth spatial interpretation. The main limitations included prolonged computation time when using high-resolution data, the assumption of flat roof structures, and interpretive challenges that arise from presenting results in the form of 2D raster maps.
Visibility analyses are used not only to identify areas that can be observed from specific points but also to support the interpretation of historical phenomena. An example is the study by J. Kanter and R. Hobgood [10] on the function of kiva towers in the Chaco region (USA), in which GIS tools were employed to analyze their potential observational ranges. The analysis, based on a DEM derived from the NED dataset and the Viewshed tool in ArcGIS 3.5.1, demonstrated that such methods are also applicable to research on history and cultural heritage, as they enable empirical verification of earlier hypotheses.
An area in which visibility analyses have recently gained importance involves research related to green-city concepts. This trend stems from the growing recognition of the benefits of living in cities that are rich in greenery, including the mitigation of negative impacts of climate change [11], the healthy development of children [12], urban temperature reduction [13,14,15,16,17], positive effects on human health [18,19,20,21,22,23], stress reduction [24,25], and the decrease in noise pollution [26]. One notable example is the 3–30–300 concept developed by Prof. Cecil Konijnendijk [27,28,29]. This concept focuses on the actual needs of residents, aiming to ensure universal and equitable access to green spaces. The first and simultaneously most challenging criterion to assess is the requirement that residents should be able to see at least three trees from their homes. Konijnendijk emphasizes that trees included in such analyses should meet appropriate size thresholds, as views of greenery significantly influence mental health and overall well-being [30,31,32,33]. This issue became particularly evident during the COVID-19 pandemic, when many people spent long periods indoors. The author also notes that “a view of greenery from our home helps maintain a connection with nature and its rhythms. It provides important breaks during work, can inspire us, and enhance creativity” [28,34,35,36,37], particularly those concepts focused on assessing the visibility of three trees.
The practical application of the 3–30–300 concept was presented by Croeser T, Sharma R et al. [38]. The authors analyzed cities across all continents, using data from the OpenTrees.org portal [39] to obtain a representative sample and consistent tree-location information. Buildings were divided into 5 m segments, and observation points simulating windows were placed at the centers of these segments. The authors note, however, that incorporating visibility from individual windows as well as accounting for building heights could improve the accuracy of the results.
In their study, Wyrzykowski and Mościcka [40] assessed the extent to which Warsaw meets the assumptions of the concept. Spatial data from the topographic database [41] and three-dimensional tree models were used. Building polygons were divided into a 15 m grid, simulating the locations of apartments and windows. For each grid cell, a buffer with a radius of 20 m was generated and clipped to the building footprint, which made it possible to assess tree visibility. The authors note several limitations of this method, including the omission of building heights and the potential obstruction of views by other objects, both of which affect the precision of the results.
A similar approach to visibility analyses in studies assessing compliance with the 3–30–300 concept was applied by Battisti, Giacco et al. [42]. The authors focused on the city of Turin, located in the Piedmont region. Their methodology is based on creating buffers around buildings and subsequently counting the trees located within each building’s buffer. However, this approach does not fully meet the assumptions of the concept, either, as it does not assess each apartment individually, resulting in incomplete outcomes.
Another example of research related to the implementation of the 3–30–300 concept is the development of a methodology for identifying new urban spaces, presented in the study entitled “Methodology for Increasing Urban Greenery According to the 3–30–300 Concept: A Warsaw Case Study” [43]. The aim of the study was to identify areas that could contribute to increasing the level of compliance with the assumptions of this concept at the city scale. The analysis proposed an innovative approach supporting sustainable development through the strategic expansion of green infrastructure in Warsaw. The methodology is based on the integration of the multi-criteria Fuzzy Analytic Hierarchy Process (F-AHP) with geographic information system (GIS) tools, which enabled the objective and precise identification of optimal locations for new parks with an area of at least 1 hectare.
Another approach to examining tree visibility in cities is the use of qualitative methods based on resident-reported data. In the study by Lahoti, Thomas et al. [44] a qualitative assessment of the visibility of green elements from participants’ homes was conducted. The measurement relied on a structured survey question: “How many trees can you see from the window of your home?”; response options included 0, 1, 2, 3, 3+, and others. For analytical purposes, the answers were grouped into the following categories: below 2, 3, 3+, and 10+, based on patterns observed in the dataset.
However, this methodology is not suitable for analyses of this kind, as it assesses visibility in a subjective manner. For each individual, the notion of “visibility from the window” may imply something different—some may consider objects located 10 m away as visible, while others might include trees situated 100 or even 200 m away. Therefore, this type of analysis is insufficient for establishing an objective definition of visibility.
In view of the above, the aim of the research presented in this article was to propose a method for determining the visibility of three trees within the 3–30–300 concept, taking into account different building floors, and also taking into account the location of each apartment on this floor. This objective is grounded in the assumption of the 3–30–300 concept that trees should be visible from every apartment, which requires 3D analysis. Moreover, we assumed that the parameters relating to the height of the trees and their distance to the building should not be arbitrarily determined by the researchers, but should be based on the actual requirements and expectations of the residents. Table 1 provides a detailed comparison of previous research on tree visibility within the context of the 3–30–300 rule with the methodology proposed in this study. The first difference between our study and previous studies lies in the methods used to determine tree visibility. Table 1 illustrates the two primary approaches used in the literature: spatial analysis, which was used by most researchers to model tree visibility, and residents’ opinions, which were gathered through questionnaires and used as the primary data source in [44]. The methodology proposed in our work synthesizes these two approaches: it utilizes advanced spatial analysis, but the input parameters are strictly defined by the opinions of actual residents.
A significant difference between our research and that of previous studies is how the parameters for the ‘3’ in the 3–30–300 rule (seeing at least three trees from one’s window) are established. Specifically, this concerns the minimum tree height and the maximum distance between trees and windows. In studies [38,40,42,44], these values were arbitrarily determined by scientists. These values were based on theoretical assumptions or ‘best guesses’ that may not reflect what residents actually identify as visible trees. Our work eliminates this researcher bias by basing the height and distance thresholds on empirical data from resident surveys. This ensures that the 3D spatial models align with how people actually perceive green spaces from their windows.
The final and most important difference concerns the dimensionality of the GIS analyses used to analyze the three-tree visibility criterion (2D vs. 3D). Most existing studies (e.g., [38,40,42]) rely on 2D GIS spatial analyses. While these “flat” models are efficient for large-scale assessments, they fail to account for the vertical complexity of modern cities. The Nagpur study [44] bypasses GIS altogether, relying solely on questionnaires. In contrast, our work introduces a 3D-modeling approach, which is essential for accurately calculating visibility from different apartment floors.
This assumption made in our solution requires, above all, consideration of the floor level on which the apartments are located. Floor height directly influences the elevation of apartments that serve as observation points and consequently affects the extent of the area (including trees) that is visible to them. Therefore, two research questions were formulated:
RQ1: How does the visibility of three trees change depending on the floor level?
RQ2: What impact does incorporating floor height into visibility assessment have on meeting all criteria of the 3–30–300 concept?
Addressing these research questions is an important step toward quantifying the qualitative requirements adopted for green cities under the 3–30–300 concept, and consequently toward supporting its implementation across different urban contexts, enabling an objective assessment of urban greenery.

2. Materials and Methods

2.1. Methodological Foundations

The requirement of tree visibility in the 3–30–300 concept does not specify either the minimum size of a tree or the maximum distance from the dwelling at which it should be located. Therefore, it was assumed that the starting point for developing a method to determine the visibility of three trees should be determining the values for these parameters. Since the literature does not provide guidance in this regard, and the author of the concept merely states that the trees should be of “adequate size” [28], it was proposed to begin with conducting a survey to examine residents’ preferences on this matter. Defining the maximum distance of trees considered visible is one of the key elements of the analysis, as otherwise trees located even several hundred meters from a given apartment could be included, despite having no direct impact on the quality of life of the residents of the examined building. Since the concept on which the study is based has a local character, only trees located in the immediate surroundings should be taken into account. A similar issue concerns tree height: according to the concept author’s recommendation, trees should be of an “adequate size”, which means that young and newly planted trees should be excluded from the analysis, as they do not significantly affect residents’ quality of life. Moreover, only the adoption of specific threshold values for tree height and distance makes it possible to perform the analyses and identify apartments that meet (or do not meet) the assumptions of the concept. For this purpose, an online survey was carried out among a group of 141 respondents. The study specifically included defining the optimal height of trees and their distance from residential windows. To ensure objective results, the participant group was designed to be as diverse as possible, encompassing residents of different ages, educational backgrounds, and other demographic characteristics. Such diversity allowed for a cross-sectional representation of public opinions and enhanced the reliability of the collected data. The detailed questionnaire is included in the Supplementary Materials.
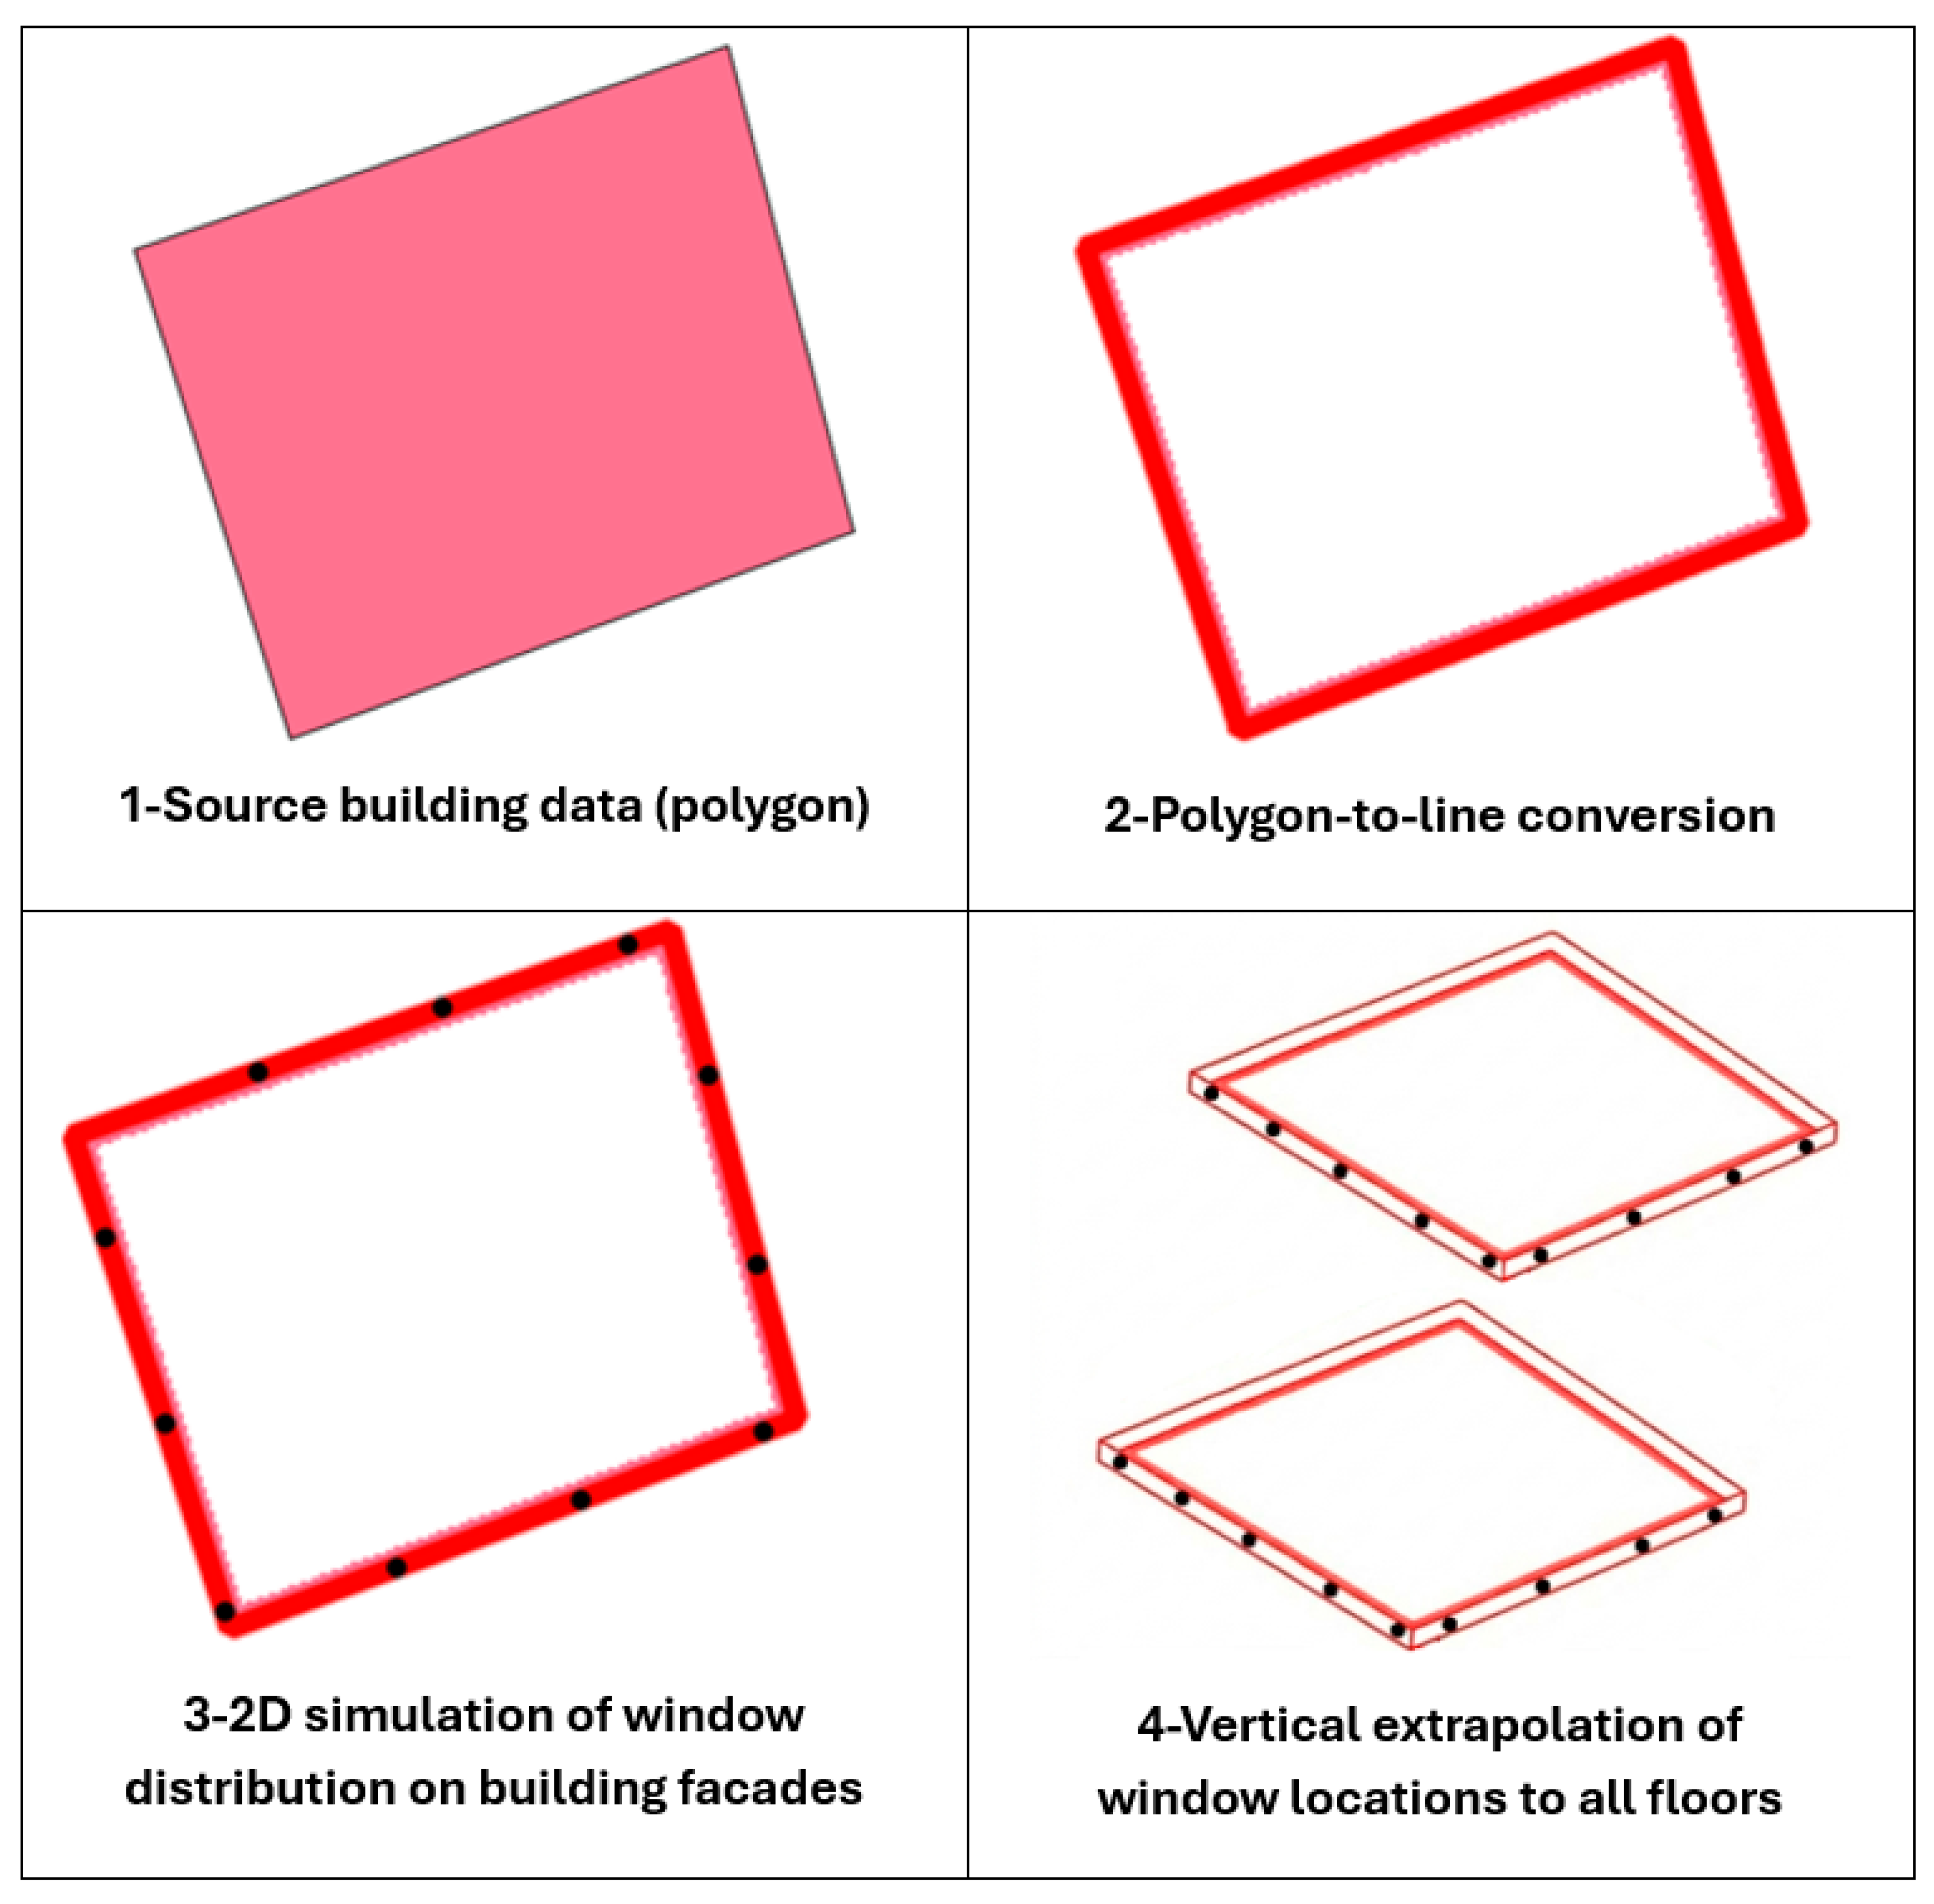
Another important factor influencing the precision of the results is the location of the given apartment within the building. In most countries, data at such a detailed level—specifying the exact location of each apartment—are not available. Therefore, it was assumed that determining the placement of potential apartments within a building would be an essential component of the proposed method. To achieve this, an original approach was introduced, simulating their location based solely on the building footprint and the number of floors. For clarity, this process is illustrated in Figure 1. The procedure involved transforming the polygon representing the building footprint into lines representing its walls, and then generating points along each wall to symbolize the central position of an apartment, that is, the location from which tree visibility is assessed. The points were spaced at regular 10 m intervals. This distance was chosen as a compromise between approximating the real distribution of apartments and ensuring computational efficiency in spatial analyses. The points generated were subsequently replicated across all building floors. Finally, analogous points were assigned to each floor of the building.
Information on the location of apartments and trees, together with the parameters describing tree size and their distance from the given apartment, is sufficient to determine tree visibility from each apartment. For this purpose, a visibility analysis based on a linear relationship between the observer and the target was proposed [41]. This task involves checking whether the target (a tree) is visible from a given location in the terrain (from the observer’s position, i.e., from the apartment), taking into account terrain relief and possible obstacles.
To accomplish this, so-called lines of sight are generated, connecting the target and the observer, which may be
  • Fully visible (the line of sight is uninterrupted between the apartment and the tree);
  • Partially visible (the line of sight is interrupted by an obstacle);
  • Completely invisible (the line of sight is blocked by an obstacle).
Based on the lines of sight, apartments from which a specified number of trees are visible are determined. Four groups of apartments were defined based on the number of visible trees, namely
  • Apartments from which no trees are visible;
  • Apartments from which one tree is visible;
  • Apartments from which two trees are visible;
  • Apartments from which three or more trees are visible.
This approach allows obtaining not only information on the apartments that meet the visibility requirement of three trees but also whether any trees are visible from a specific apartment at all.
In summary, the developed methodology for determining the visibility of three trees comprised the following steps:
  • Defining residents’ expectations regarding tree visibility, including maximum distance from apartment and tree height.
  • Determining the location of apartments on different building floors.
  • Generating lines of sight from apartments located on various floors to the trees.
  • Identifying apartments from which at least three trees are visible.
  • Visualizing the visibility of three trees from the apartments.
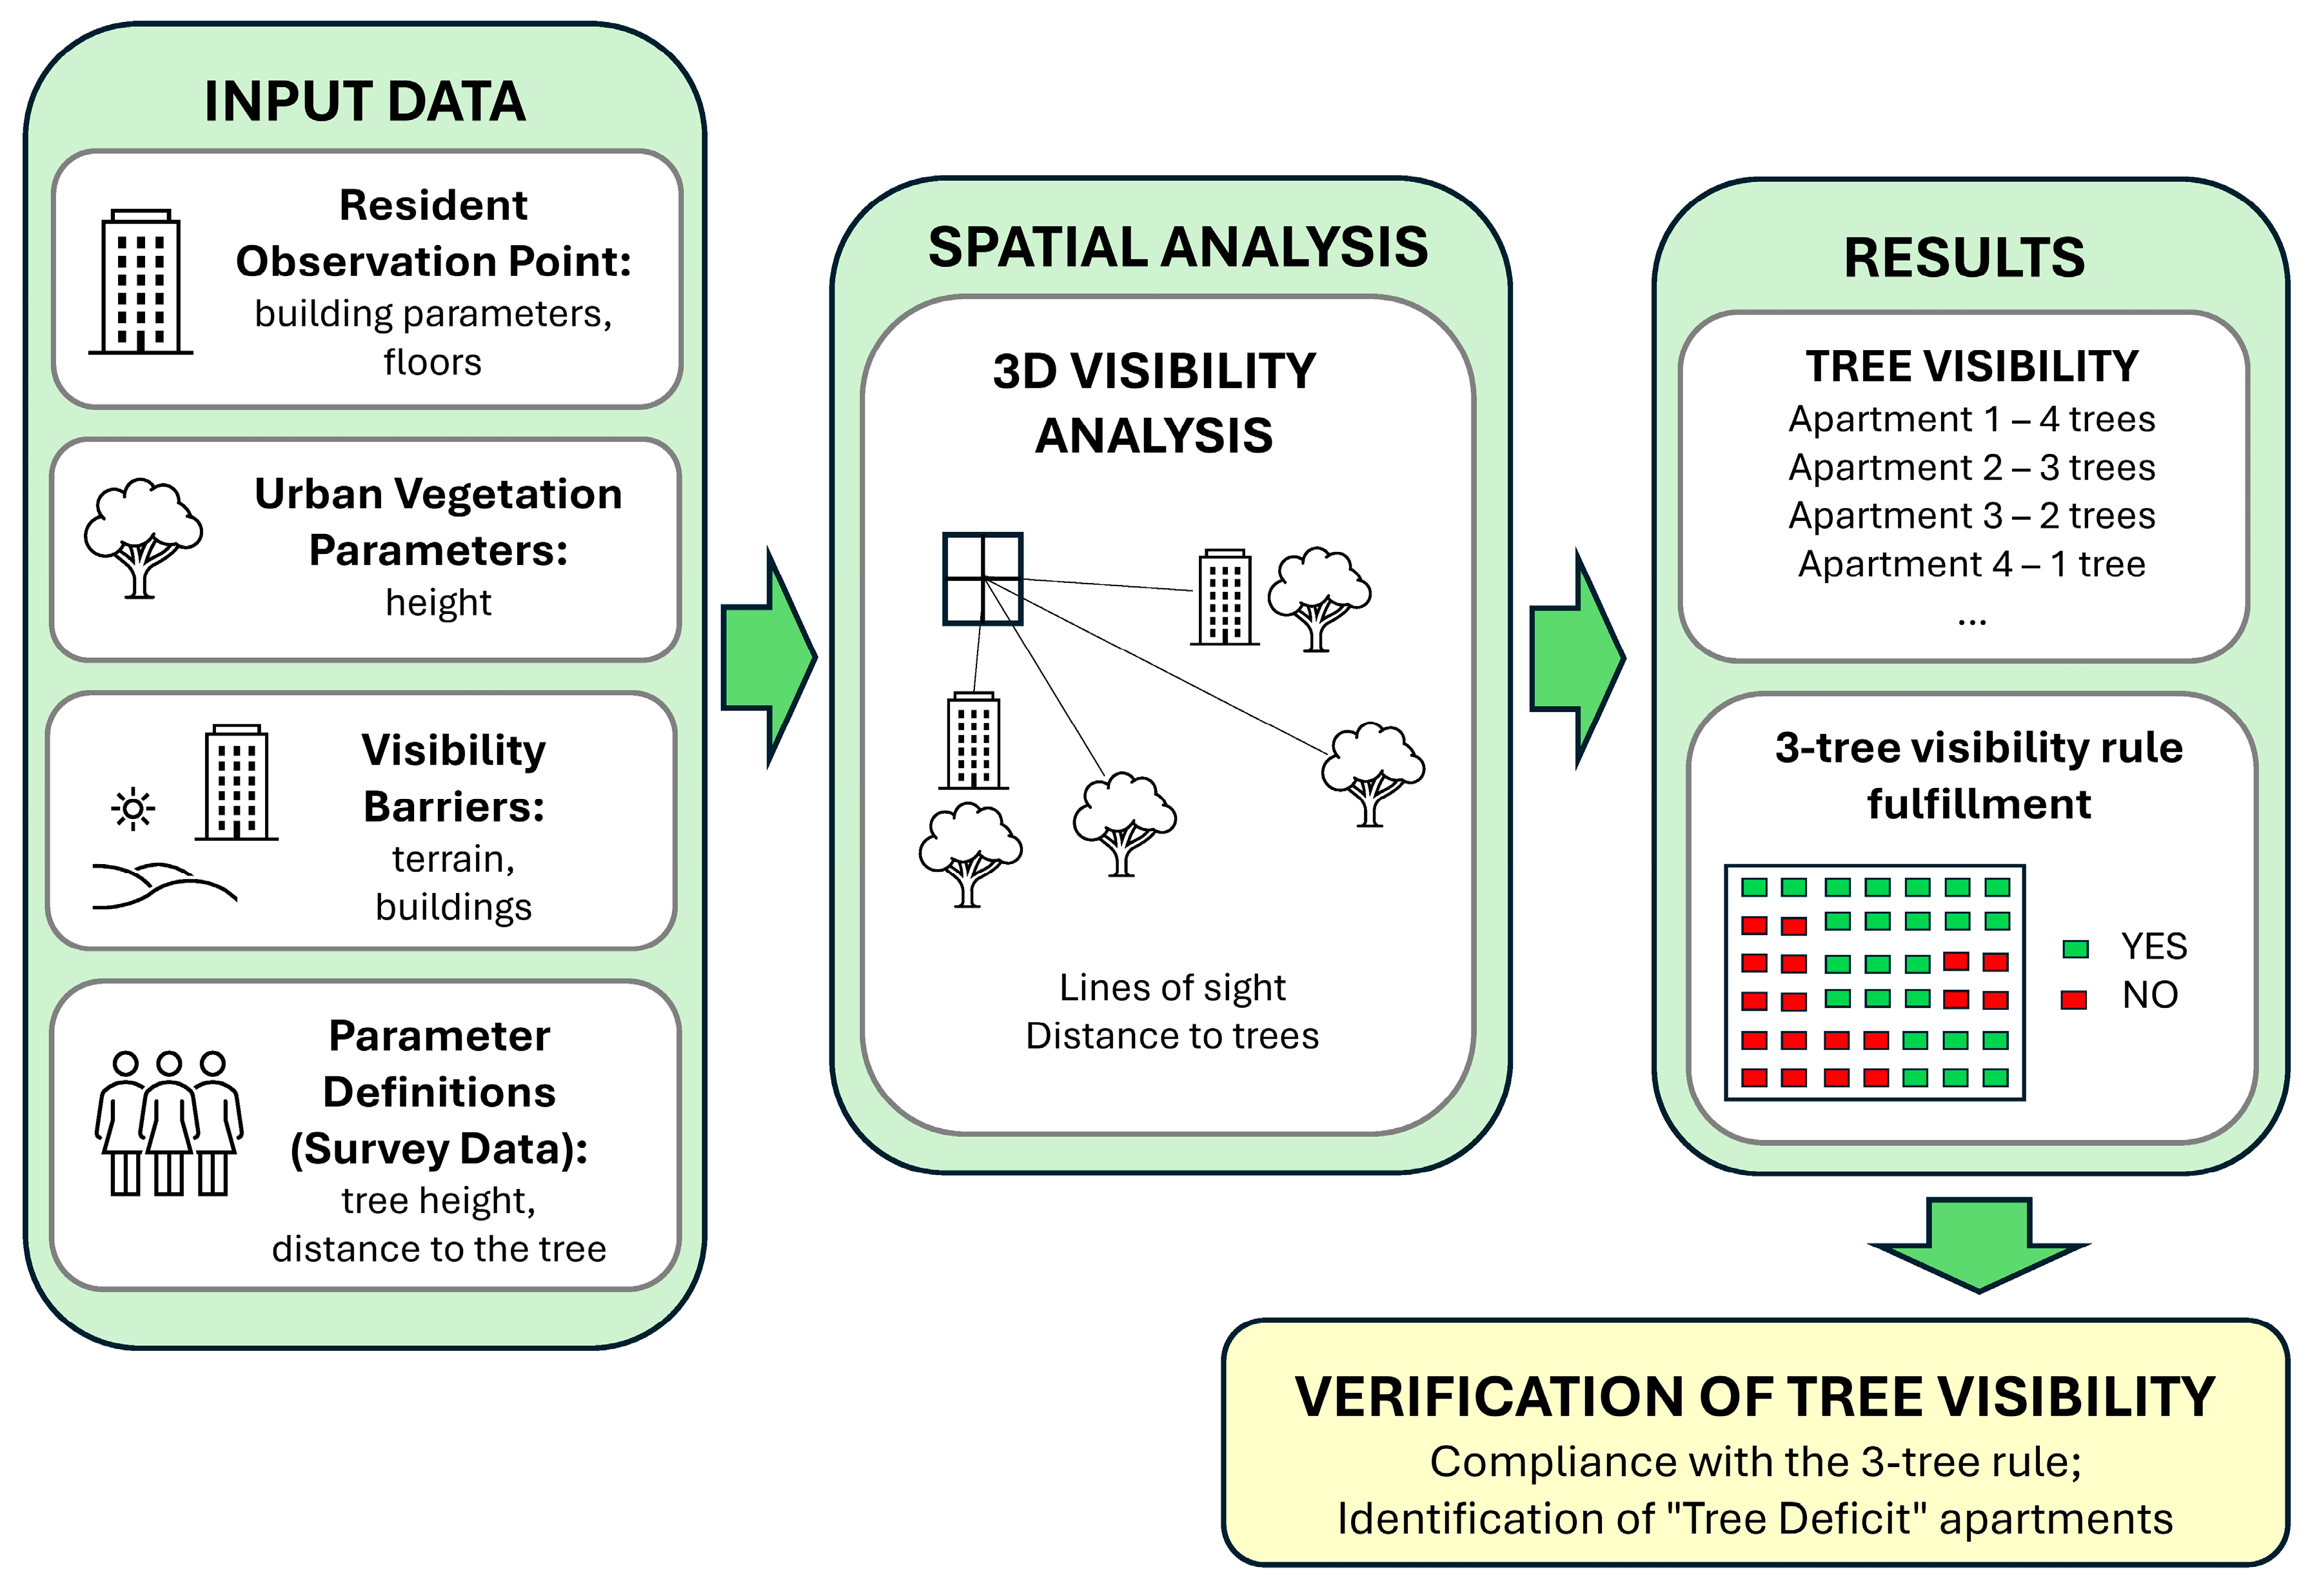
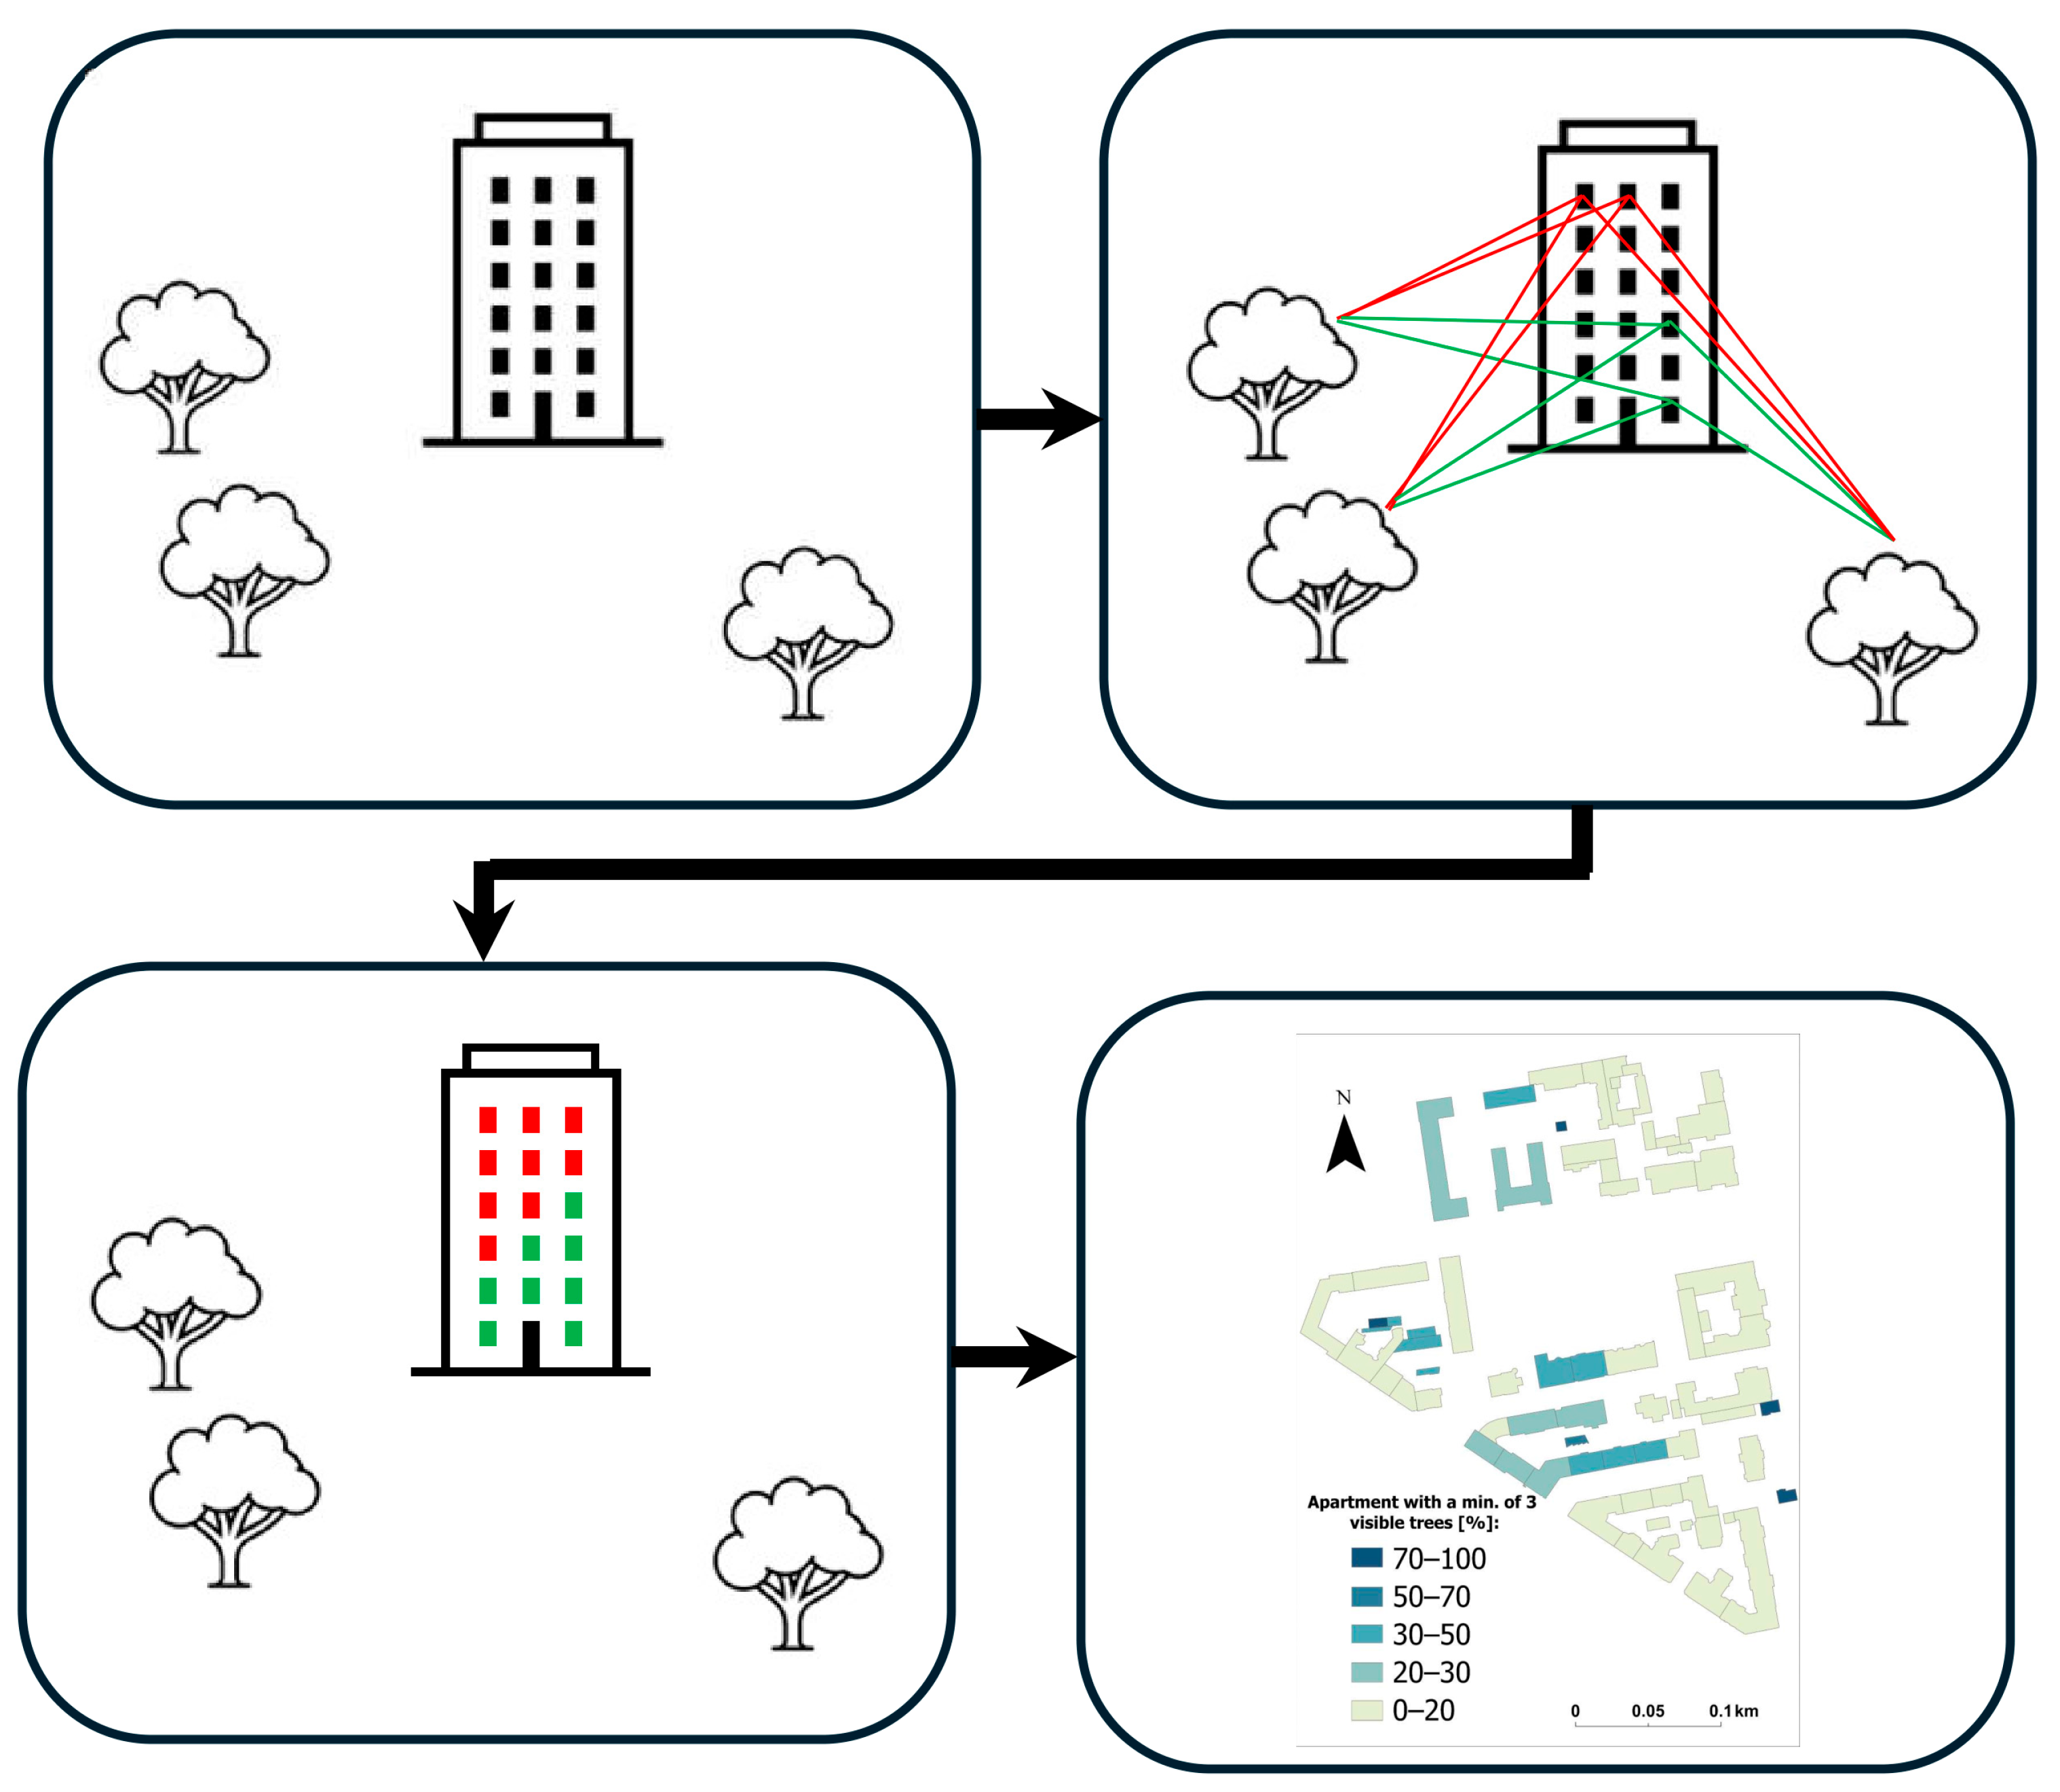
The conceptual framework based on three-tree rule is shown in Figure 2, while Figure 3 presents stages of determining the visibility of trees. The conceptual model combines objective spatial data with subjective resident perceptions in order to provide a more accurate assessment of tree visibility. The research workflow is divided into four main stages. Input data combines building features (observation points on various floors) and tree parameters with empirical survey data. Thresholds for tree height and distance are derived from resident feedback rather than from arbitrary scientific assumptions. Spatial analysis uses 3D modeling to determine lines of sight from apartment windows, accounting for visual obstructions such as terrain and surrounding buildings. The results will provide a quantitative count of the number of visible trees per apartment and an assessment of compliance with the three-tree visibility rule. The final stage involves identifying apartments with a “tree deficit”.

2.2. Case Study

2.2.1. Test Area

The area selected to test the developed methodology is located in Warsaw, the capital of Poland. Warsaw is situated in the Mazowieckie Voivodeship, covering an area of approximately 517 km2 [45] and home to 1,863,845 inhabitants [46]. Warsaw is widely considered to be a green city. However, previous research [40] has shown that this is not entirely accurate, as access to green spaces varies greatly across the city. Some districts and housing estates in Warsaw are surrounded by lots of greenery, including single trees, parks and forests (e.g., Rembertów, Wawer and Wesoła). However, the city is also struggling with newly built housing estates where hardly any space is allocated for greenery. This creates areas that are almost entirely covered in concrete (e.g., the Ursus district).
Warsaw, Poland’s most populous city, has a population density of 3600 people per km2 [47]. This level of population density presents significant challenges for urban designers, who must strike a balance between intensive development and ensuring there are sufficient green spaces to maintain a high quality of life for residents.
Warsaw boasts a wide variety of green spaces, ranging from iconic central parks such as Łazienki Królewskie and Pole Mokotowskie to peripheral urban forests such as Las Kabacki and the forests in Wawer and Rembertów. The city actively pursues sustainability through several key initiatives:
  • The ‘Million Trees’ project: This participatory program enables residents to use the ‘Warszawa 19115’ mobile app to suggest locations for street and public square planting [48].
  • ‘Green Streets’: This initiative focuses on revitalizing major traffic arteries by integrating new plant arrangements and modernizing existing greenery through public consultation [49].
  • De-concreting: This is a systematic effort to replace paved surfaces with natural soil and plants. In 2022 alone, nearly 3000 m2 of urban space was reclaimed in this way [50].
However, at the same time, there has also been a rapid expansion of new housing estates in areas lacking spatial development plans. In their quest to maximize profits, developers leave no space for green areas, resulting in huge concrete deserts being created. Our earlier research showed that some districts have greenery covering only 3% of the area (e.g., Ursus) [40].
The contradiction between urban policy and actual activities in the city, together with Warsaw’s intricate urban structure and diverse ecosystems, makes it an ideal subject for this research. The solutions proposed in this research could help the authorities in Warsaw to highlight the inequality of access to green spaces for the city’s residents, a matter of increasing concern.
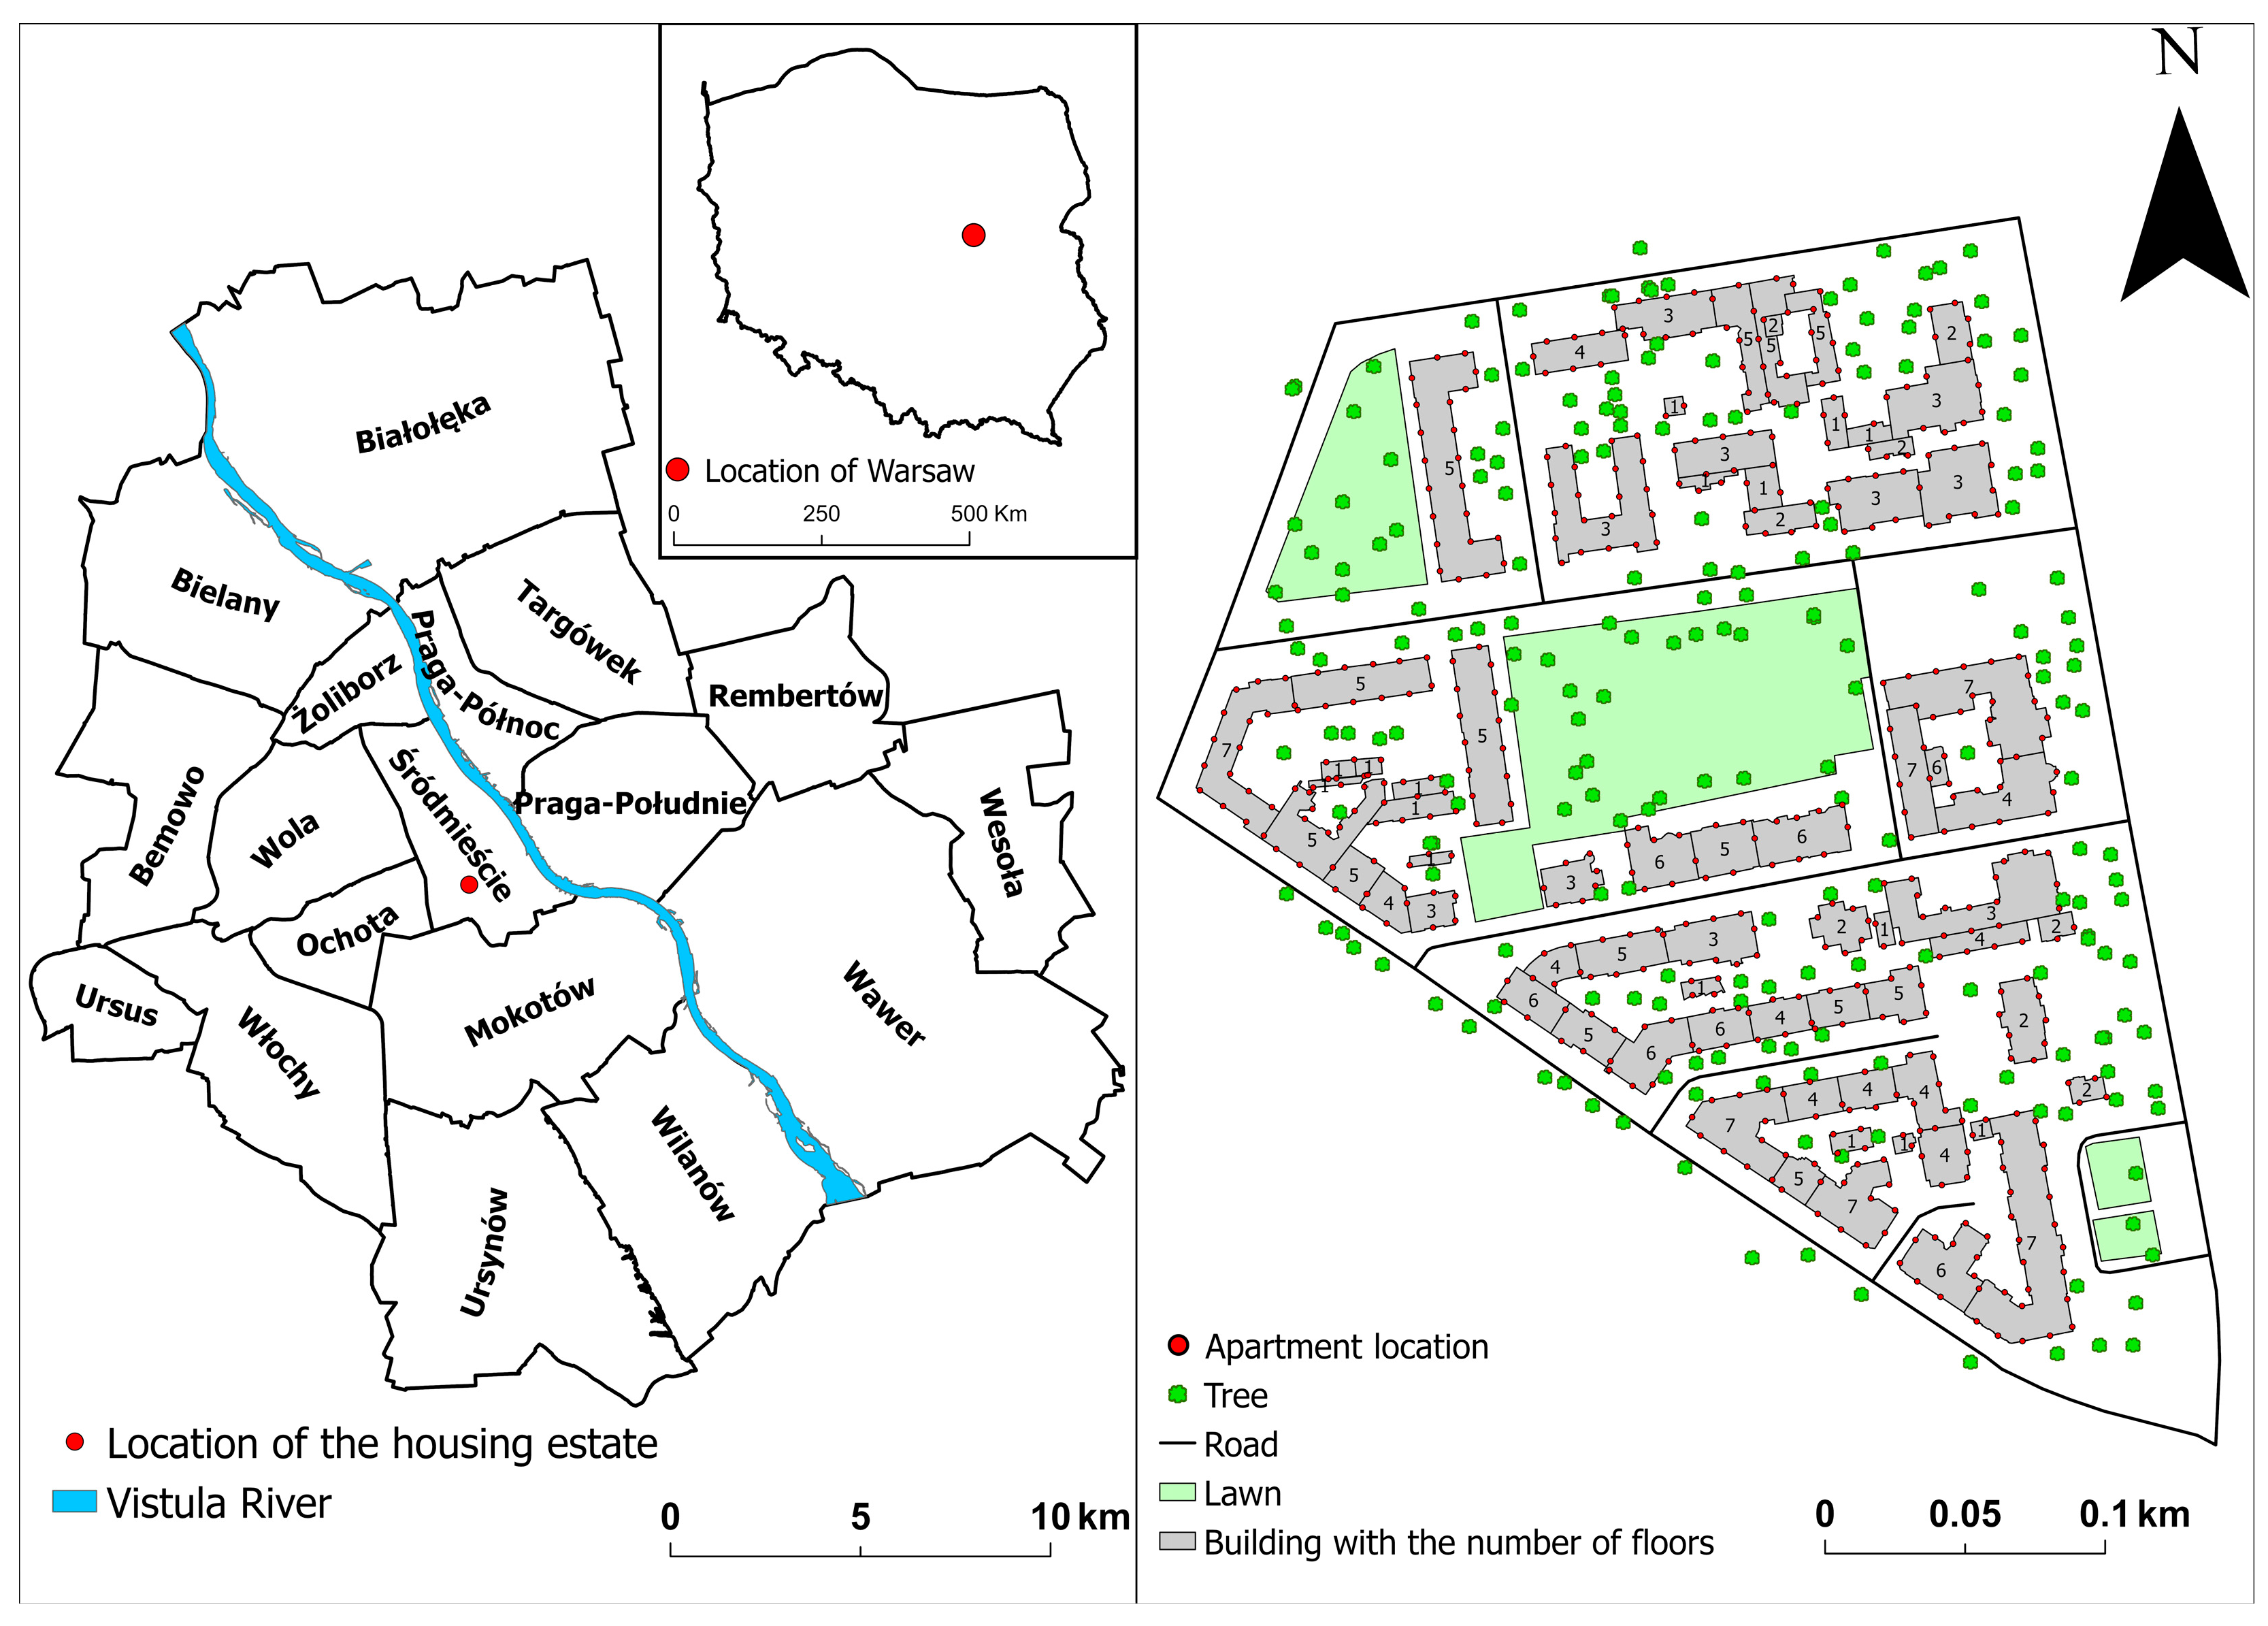
To test the proposed methodology, a residential estate located in the Śródmieście district was chosen (Figure 4). In the central part of the estate lies a recreational and leisure garden called Dolina Szwajcarska, established in 1786 and operational until 1944, when it was destroyed as a result of wartime activities. After World War II, only a fragment of the garden survived, which remains to this day [51].
The selected estate contains buildings with varying numbers of floors and numerous trees, distributed unevenly. This urban structure allows for testing the proposed methodology under conditions of a real, complex urban environment. The analyzed estate comprises a total of 71 buildings, with floor counts ranging from 1 to 8. There are 214 trees located within the estate. Detailed statistics of the studied buildings are presented in Table 2. Rows 1 and 2 of Table 2 are similar in that the number of buildings with floors 1 and 2 is the same. This is because there are no buildings with just one floor. Every building has at least two floors, meaning that every building with a second floor also has a first floor. In other words, we have 71 buildings, each of which has a ground floor.

2.2.2. Data

The data used in the study were obtained from publicly available resources on the portal www.geoportal.gov.pl (accessed on 20 March 2026) [41,53]. The datasets employed are characterized by a high degree of topicality and detail.
The analyses were primarily based on the Digital Terrain Model (DTM) [54] with a spatial resolution of 5 m, current as of 2024. The model was developed in the vertical coordinate system PL-EVRF2007-NH and the horizontal system PL-1992 [55]. These data enabled precise representation of the terrain, which is critical for determining lines of sight while accounting for terrain barriers.
Another dataset utilized was the Topographic Object Database (BDOT10k), which contains detailed vector data on the spatial distribution of objects and related information. The thematic scope of this database corresponds to a classical topographic map at a scale of 1:10,000 [52]. For the analyses, objects coded as BUBD, representing buildings of various functions, were used. To cover the largest possible portion of the built environment, no division into specific building types was applied. Attributes of each building include, among others, information on the number of floors.
The final dataset employed consisted of 3D tree models [56] representing trees taller than 4 m. These data were developed and provided by the Head Office of Geodesy and Cartography in accordance with the CityGML LoD1 standard. Each tree is described using standardized attributes, including object identifier, data source, topicality of the source material, tree height, and trunk height.

3. Results

3.1. Survey Results

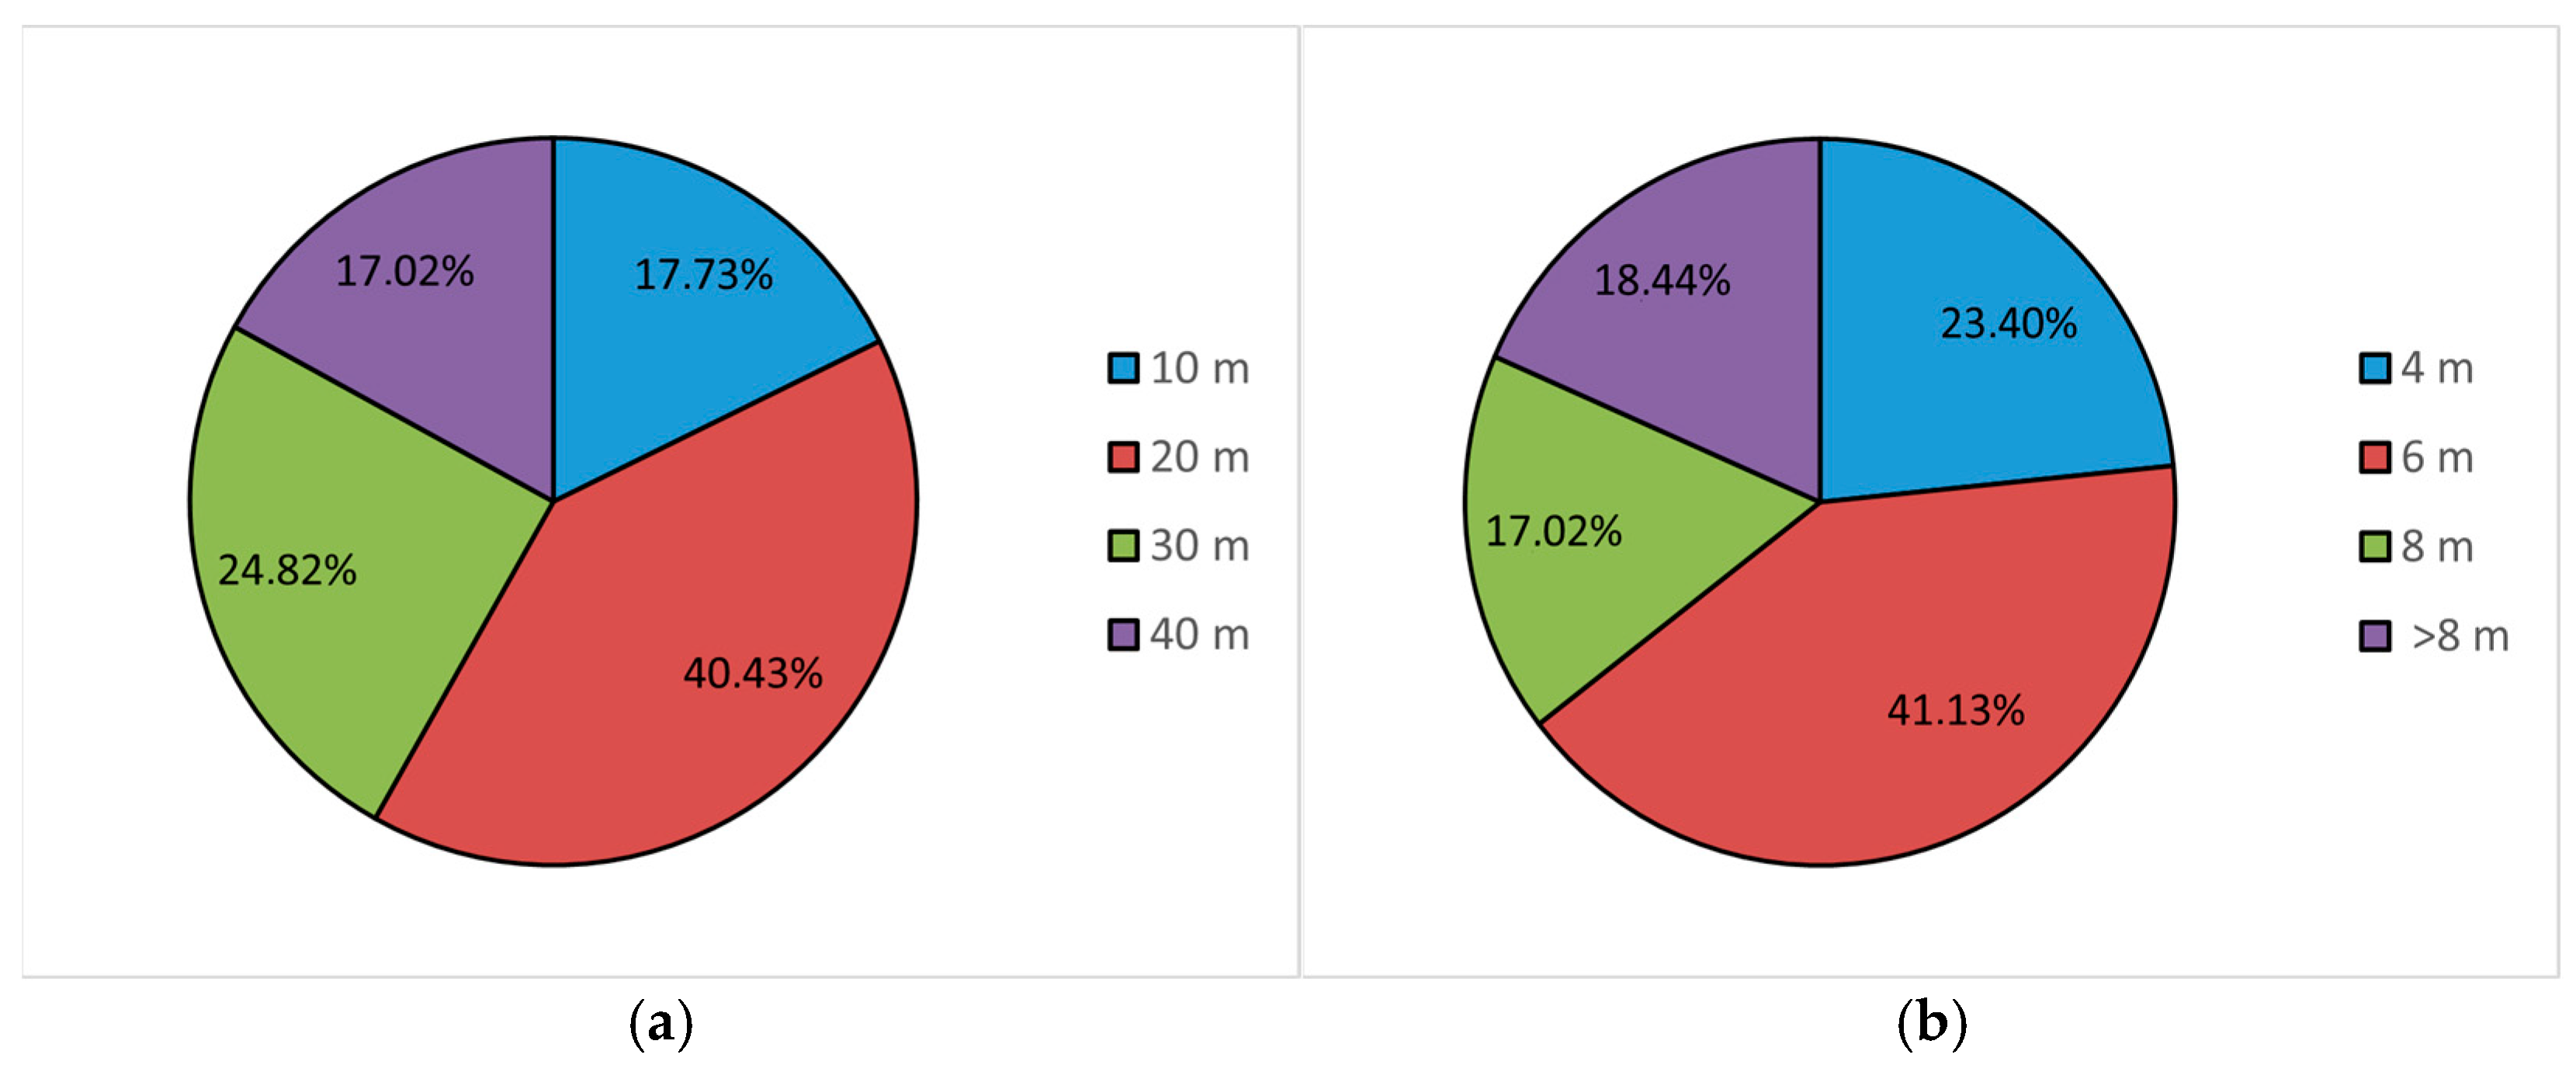
The results of the survey indicate that the expected maximum distance between a tree and a building should be 20 m—this response was selected by approximately 40% of participants (Figure 5a). In turn, the minimum tree height most frequently indicated by respondents was 6 m (around 41%) (Figure 5b). The obtained data make it possible to define the analyzed parameters with greater precision—rather than treating all cases uniformly, the analysis can focus on the values preferred by residents.

3.2. Lines of Sight

The total number of lines of sight generated between each apartment and tree was 608,830. Such a large dataset (Table 3) made it difficult to perform further analyses efficiently; therefore, all lines exceeding the assumed 20 m limit (the distance to tree determined based on the survey results) were deleted. After applying this condition, the number of lines of sight was reduced to 5446, which represents 0.9% of the initial amount (Table 4). Among these, 3252 were positive lines—i.e., indicating actual visibility of a tree from a given apartment—which accounted for 59.7% of all distance-compliant lines. The remaining 2194 were negative lines (indicating interrupted visibility), corresponding to 40.3% of the analyzed cases.
As we can see in Table 3, there are some similarities in data for floor 1 and 2: the total number of lines of sight are the same. This is probably because a 6 m tree is roughly the height of the ground floor plus the first floor together. So, the same trees are captured from floors 1 and 2. The number of positive lines for the first floor increases slightly—meaning you can see a bit more from above.

3.3. Visibility of Trees

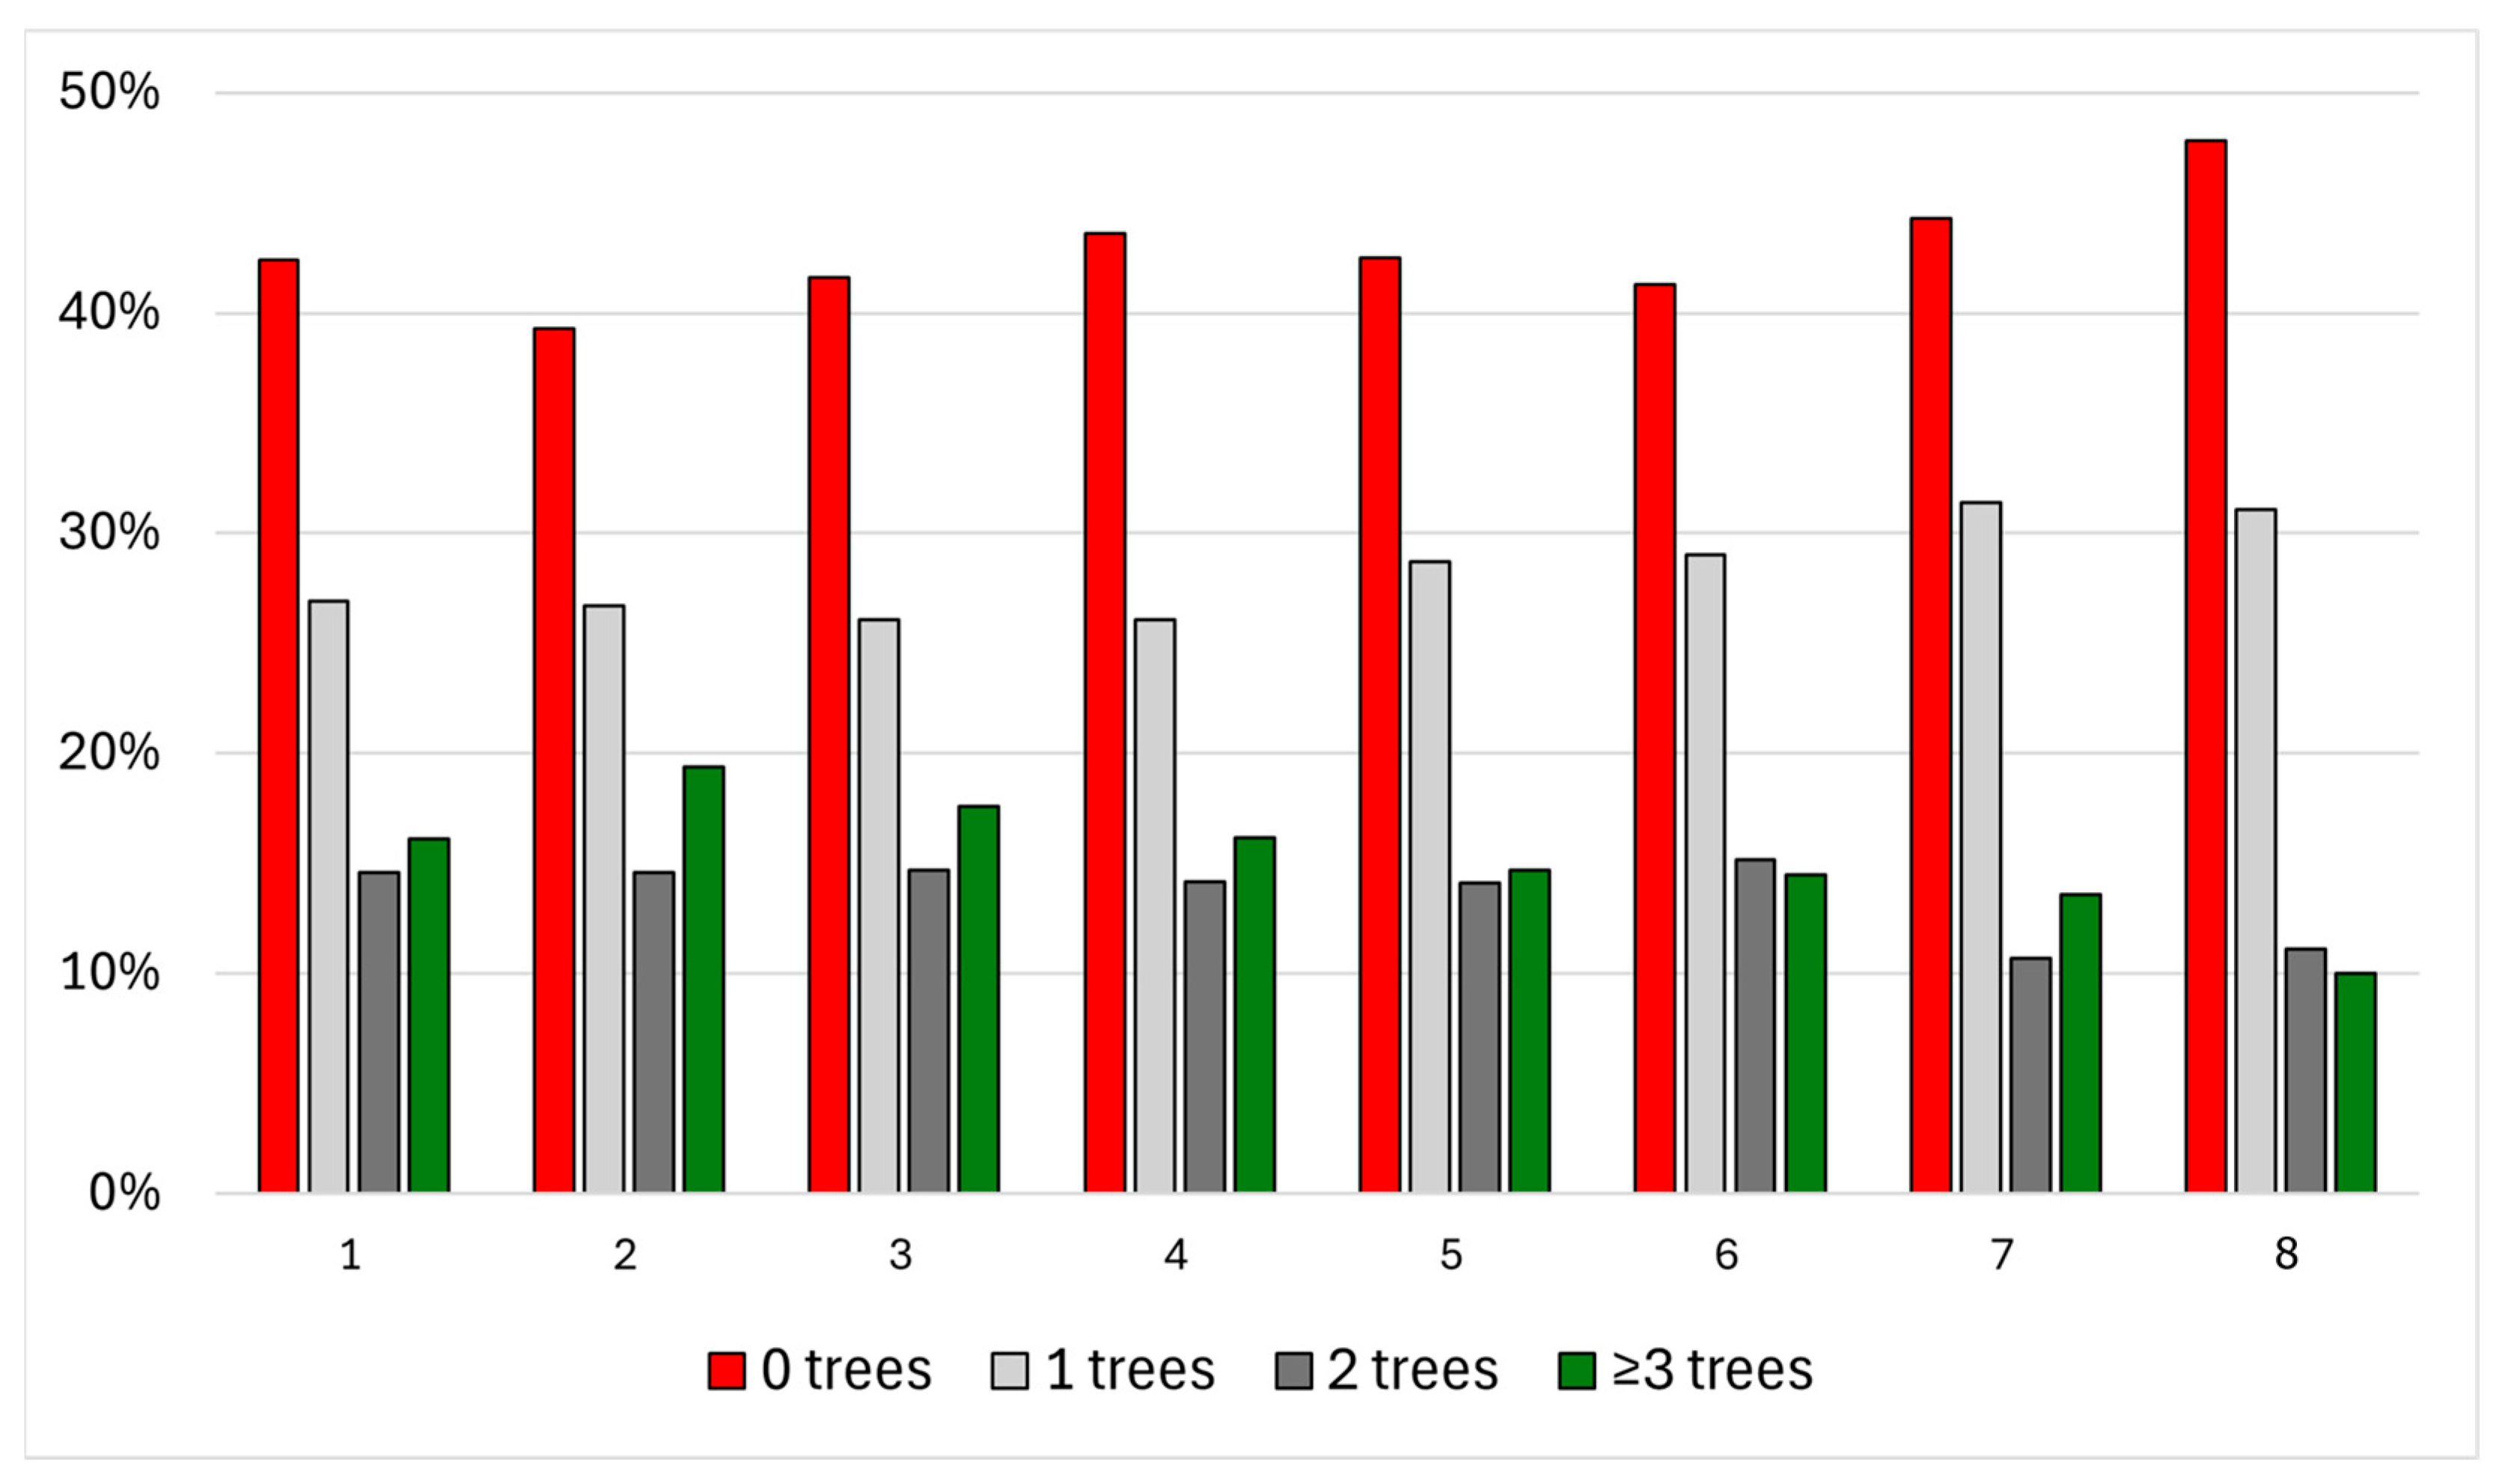
Based on the lines of sight, an assessment was conducted to determine the extent to which individual apartments (located on different floors) meet the criterion of visibility of three trees (Table 5). This analysis also made it possible to identify how these proportions are shaped in a general overview, taking into account all floors, as well as the percentage of the total number of points representing apartments that meet the adopted criterion (Figure 6).
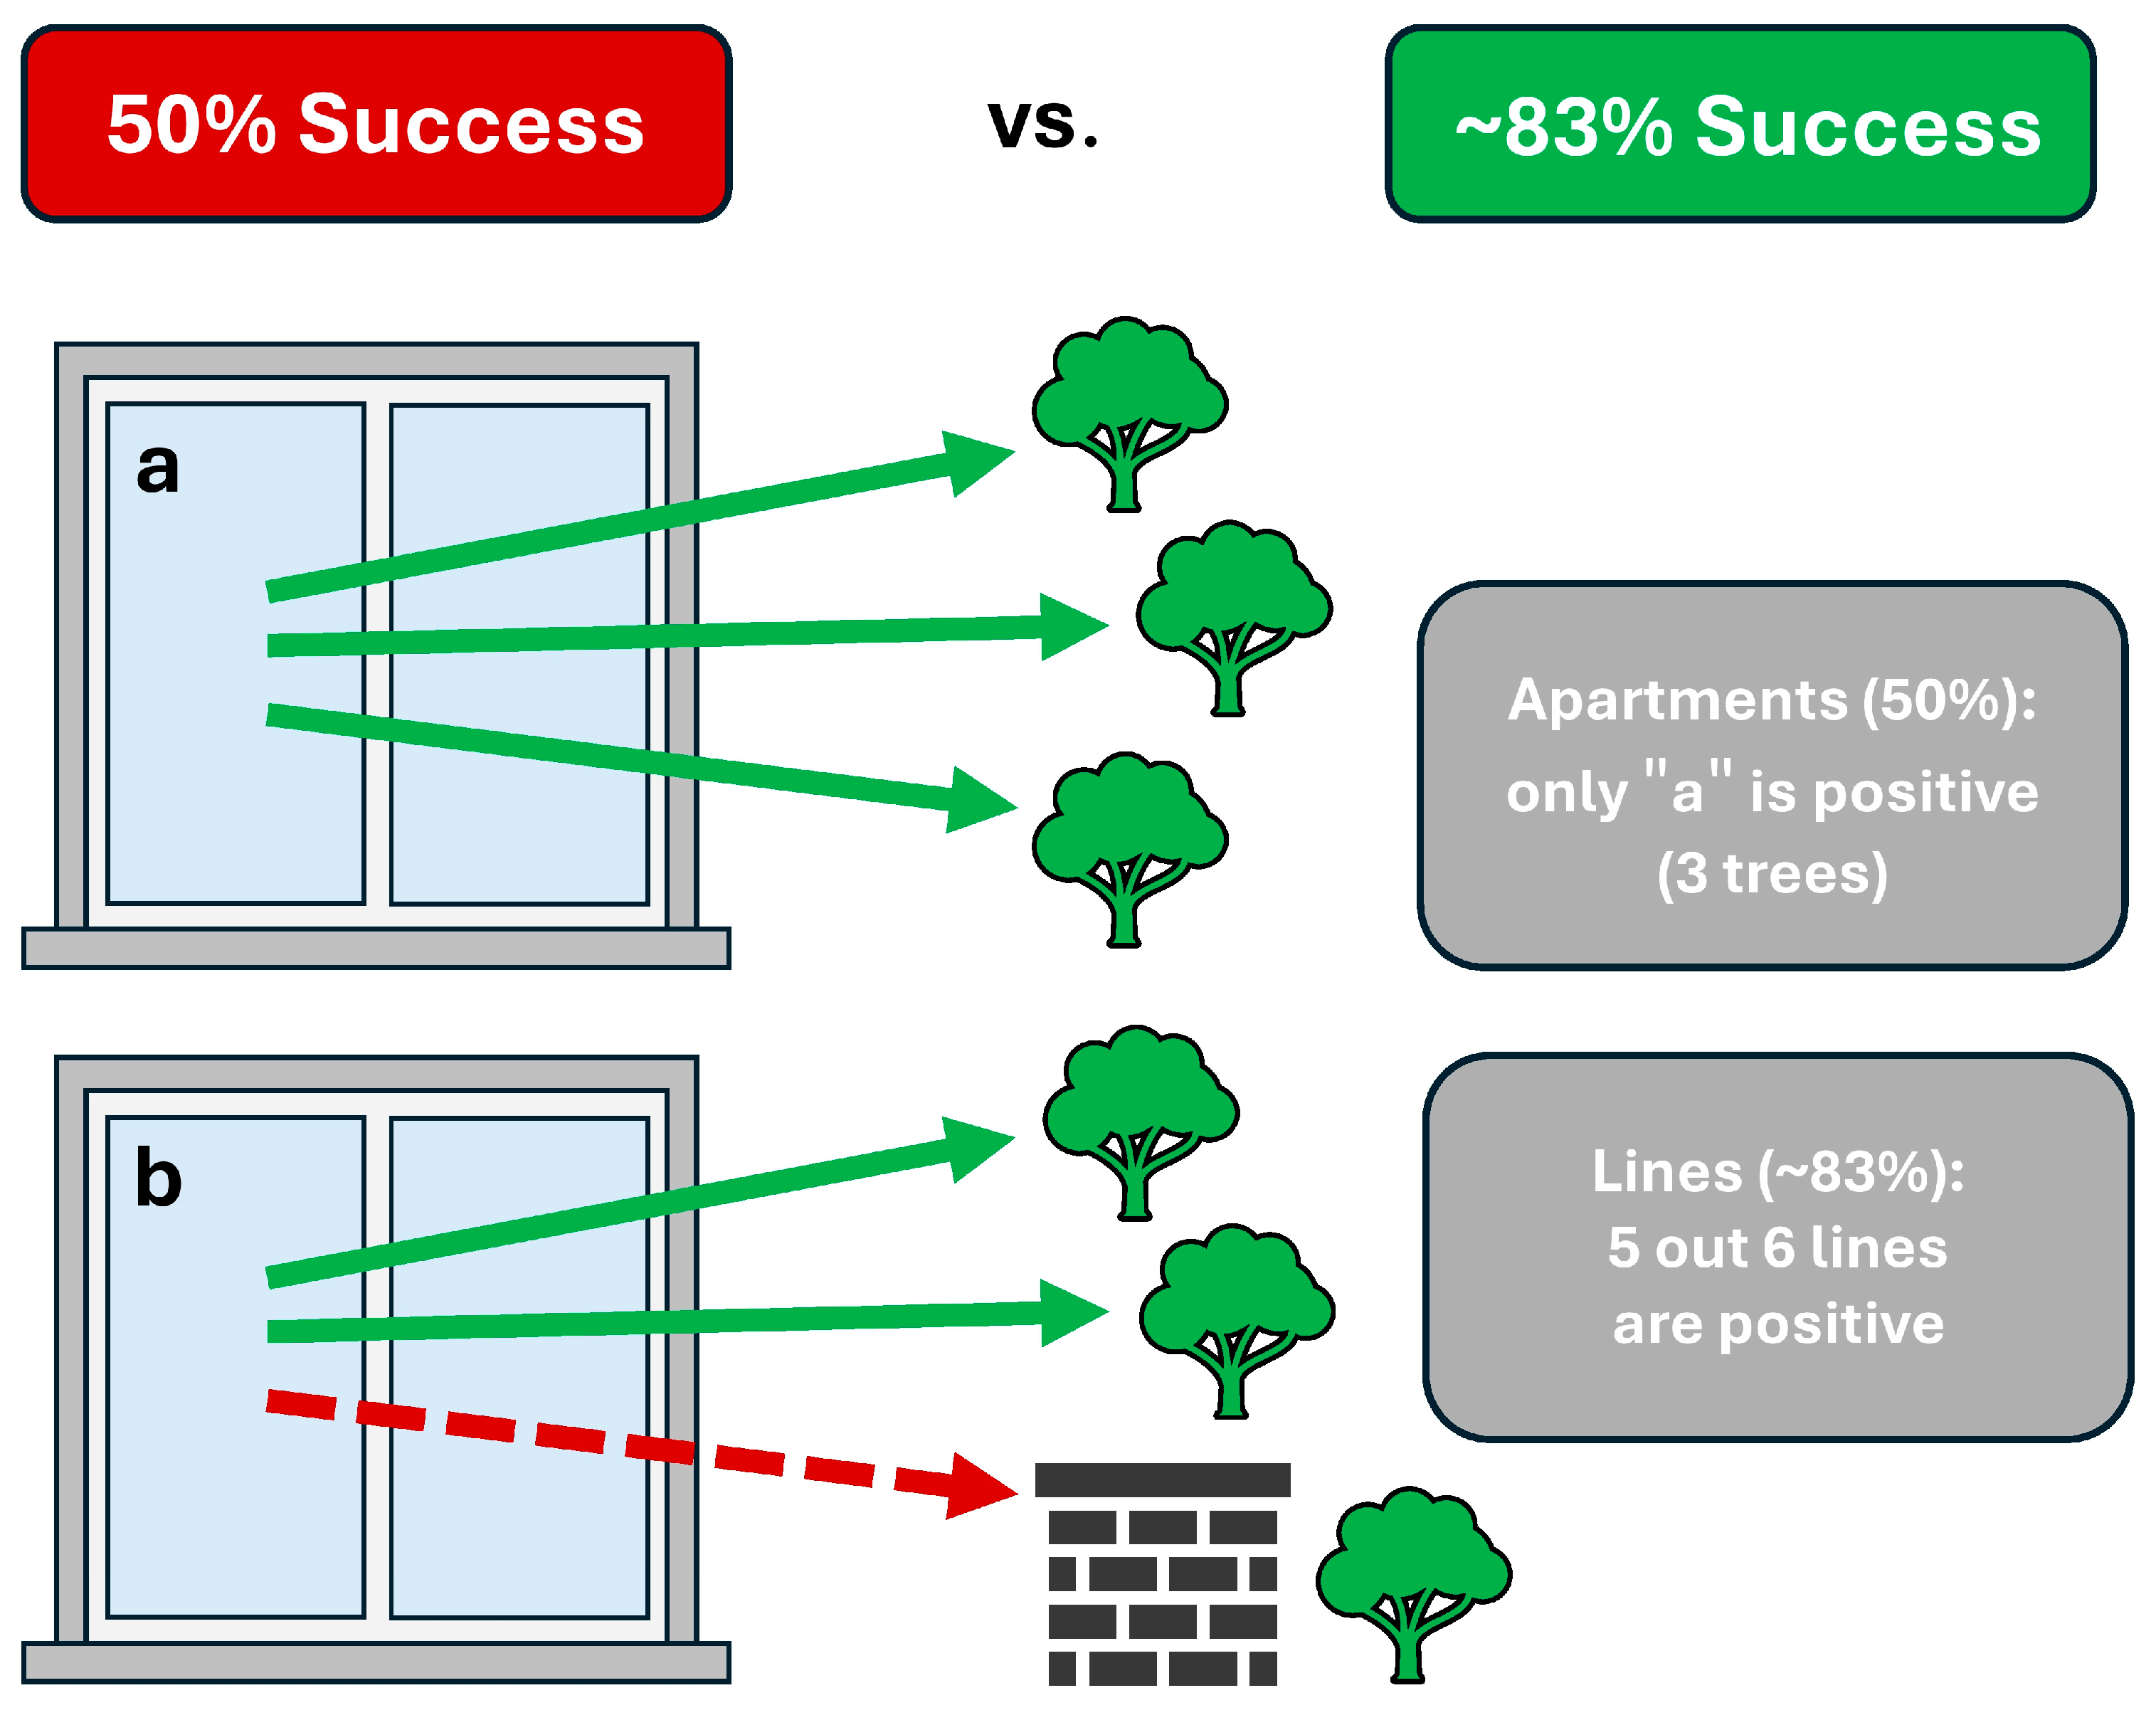
The results indicate that the percentage of apartments with a positive outcome (i.e., the possibility of seeing ≥1 tree) is lower than the percentage of individual lines of sight classified as positive. This difference arises from the fact that, in the first case, individual apartments were analyzed—each could generate multiple lines of sight, yet it was still treated as a single unit. In contrast, in the second case, the total number of all positive lines of sight was counted, regardless of how many apartments they originated from. In practical terms, this means that multiple trees could be visible from one apartment, while another apartment might not have any positive lines at all (Figure 7).
Figure 6. Percentage of apartments on each floor with a specific number of trees visible.
Applsci 16 03514 g006
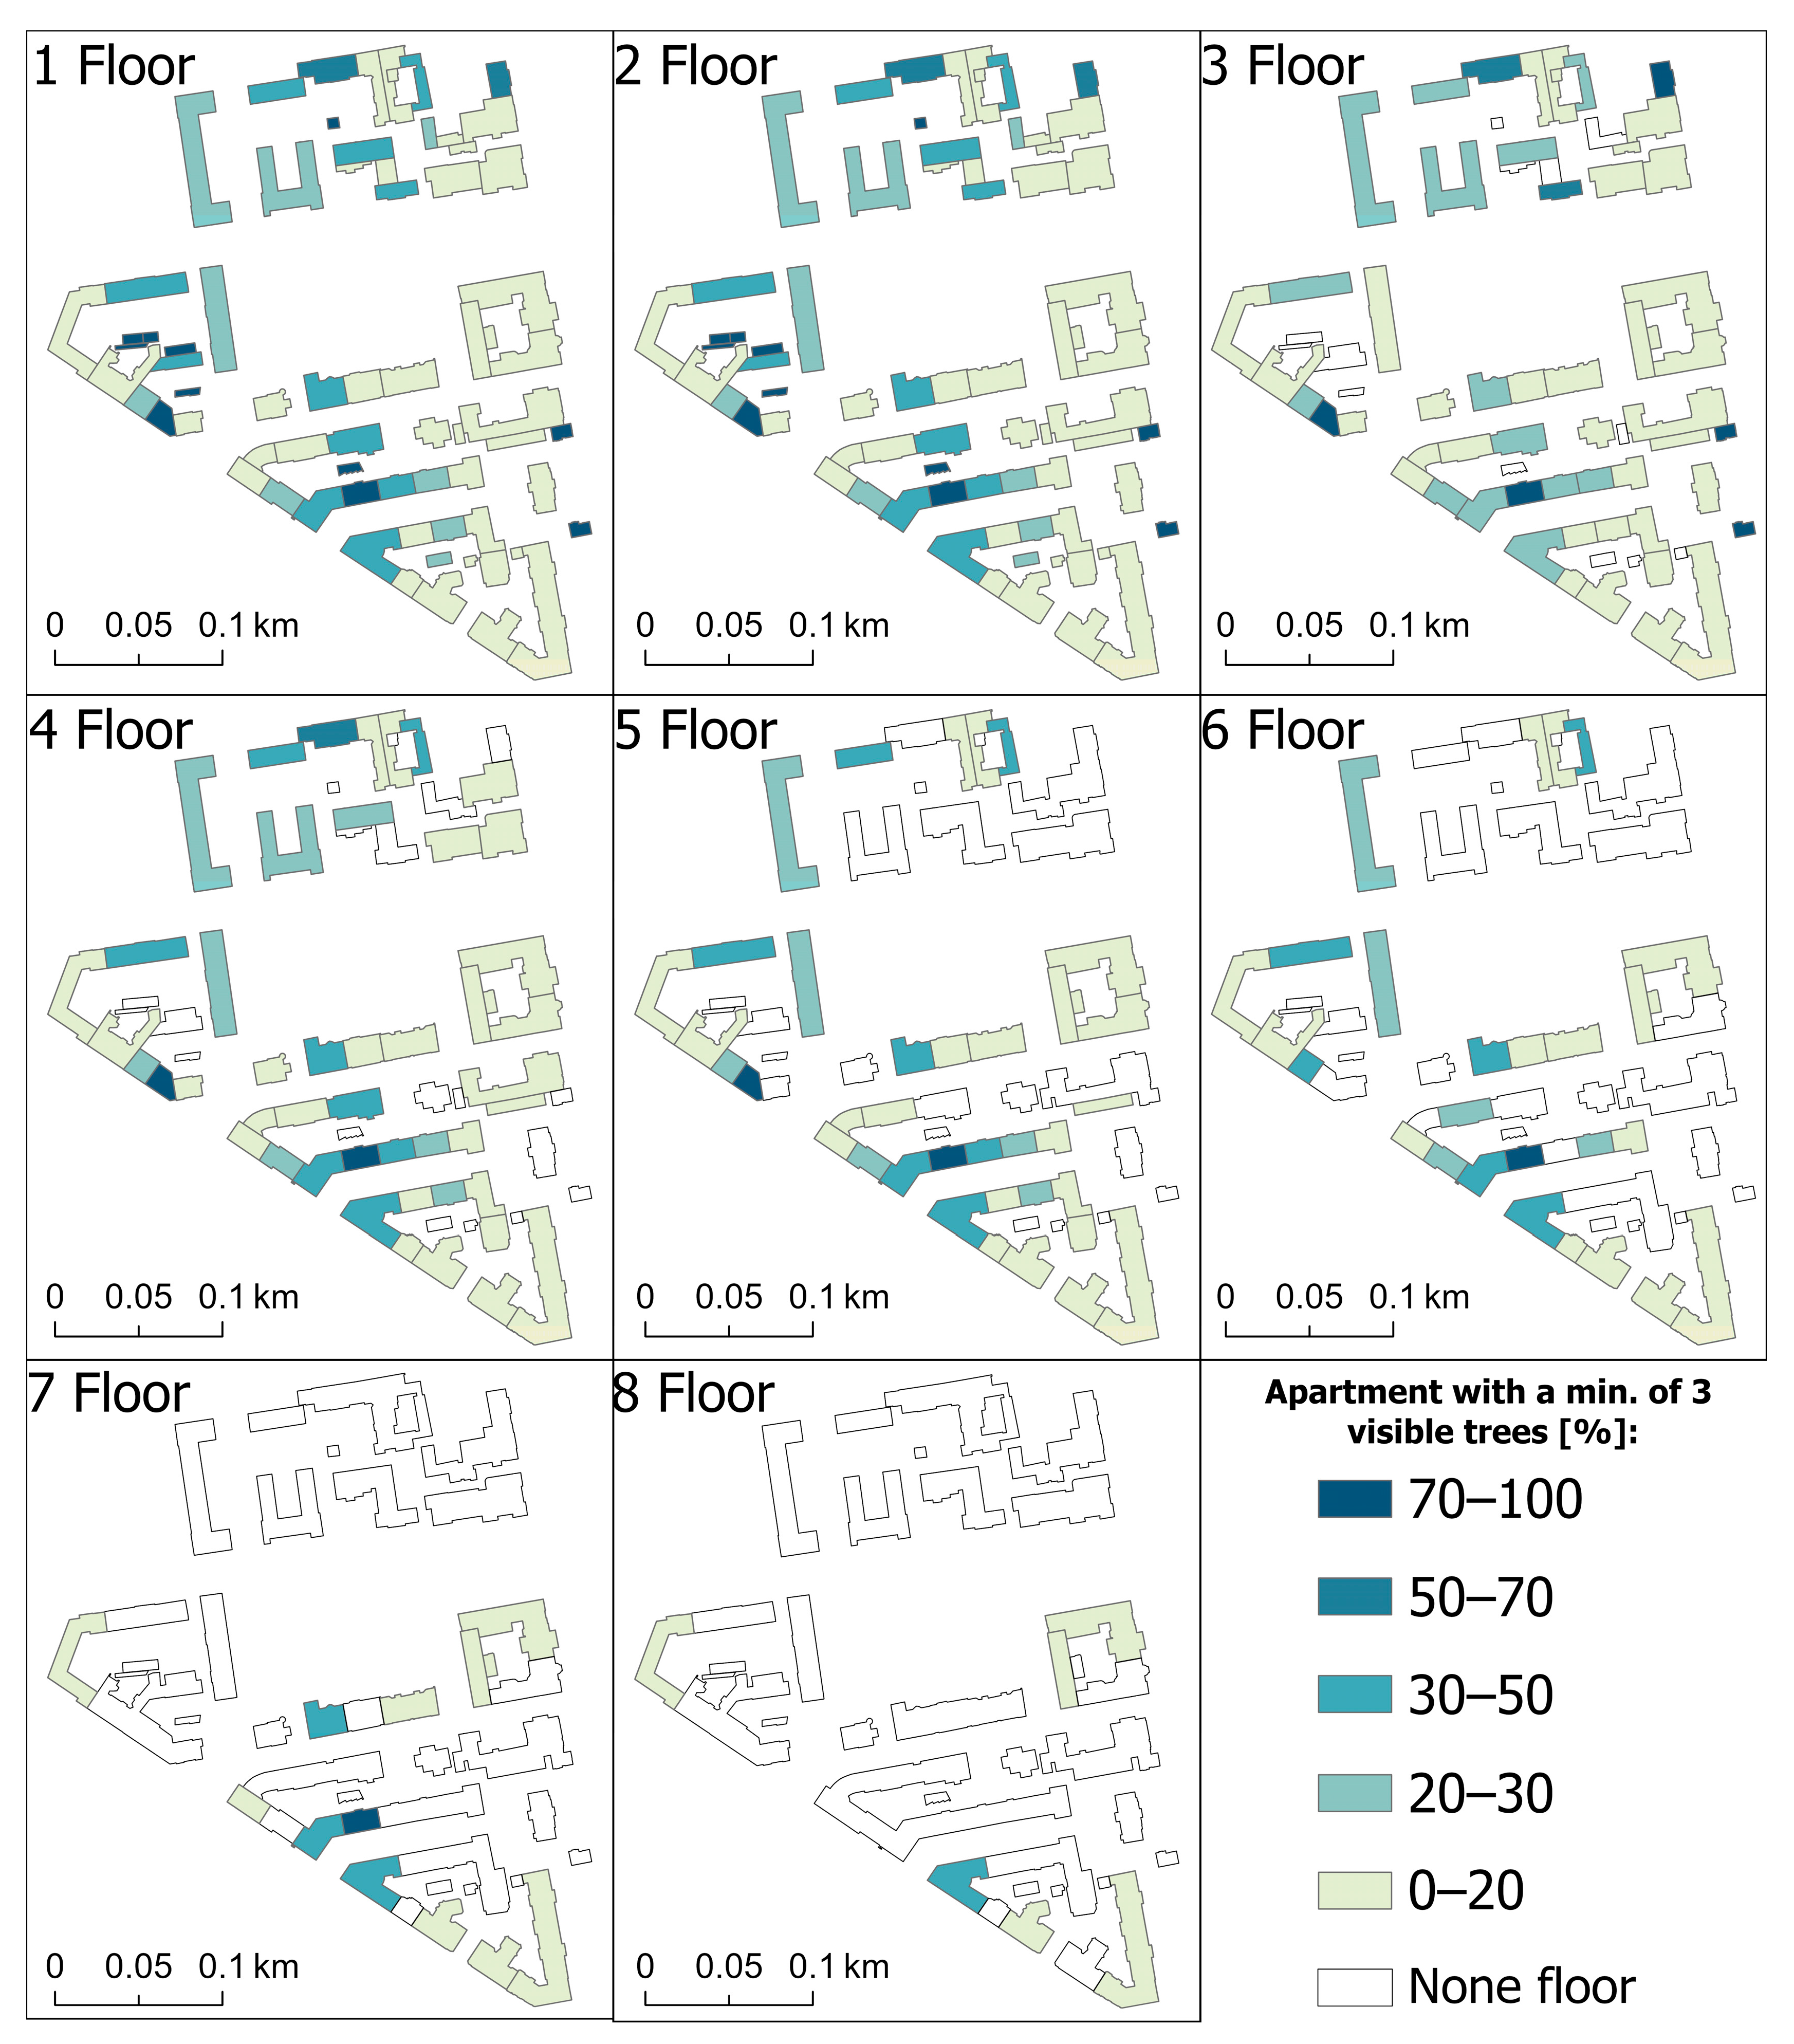
Figure 7. Example of differences between visibility analysis at the apartment level and at the individual line-of-sight level; out of two apartments, only one meets the positive criterion (50%), whereas five out of six lines of sight are classified as positive (≈83%); (a) apartments from which three trees are visible, (b) apartment from which only two trees are visible. The percentage of apartments in buildings, broken down by individual floors, that meet the 3–30–300 criterion—namely, ensures visibility of at least three trees from a single apartment—is presented in Figure 8. The selected minimum number of trees follows directly from the 3–30–300 concept, and, additionally, visual contact with a greater number of trees has a proven psychological [19] and environmental [16] significance.
Applsci 16 03514 g007
Figure 8. Percentage of apartments in buildings (by floor) with views of at least three trees.
Applsci 16 03514 g008
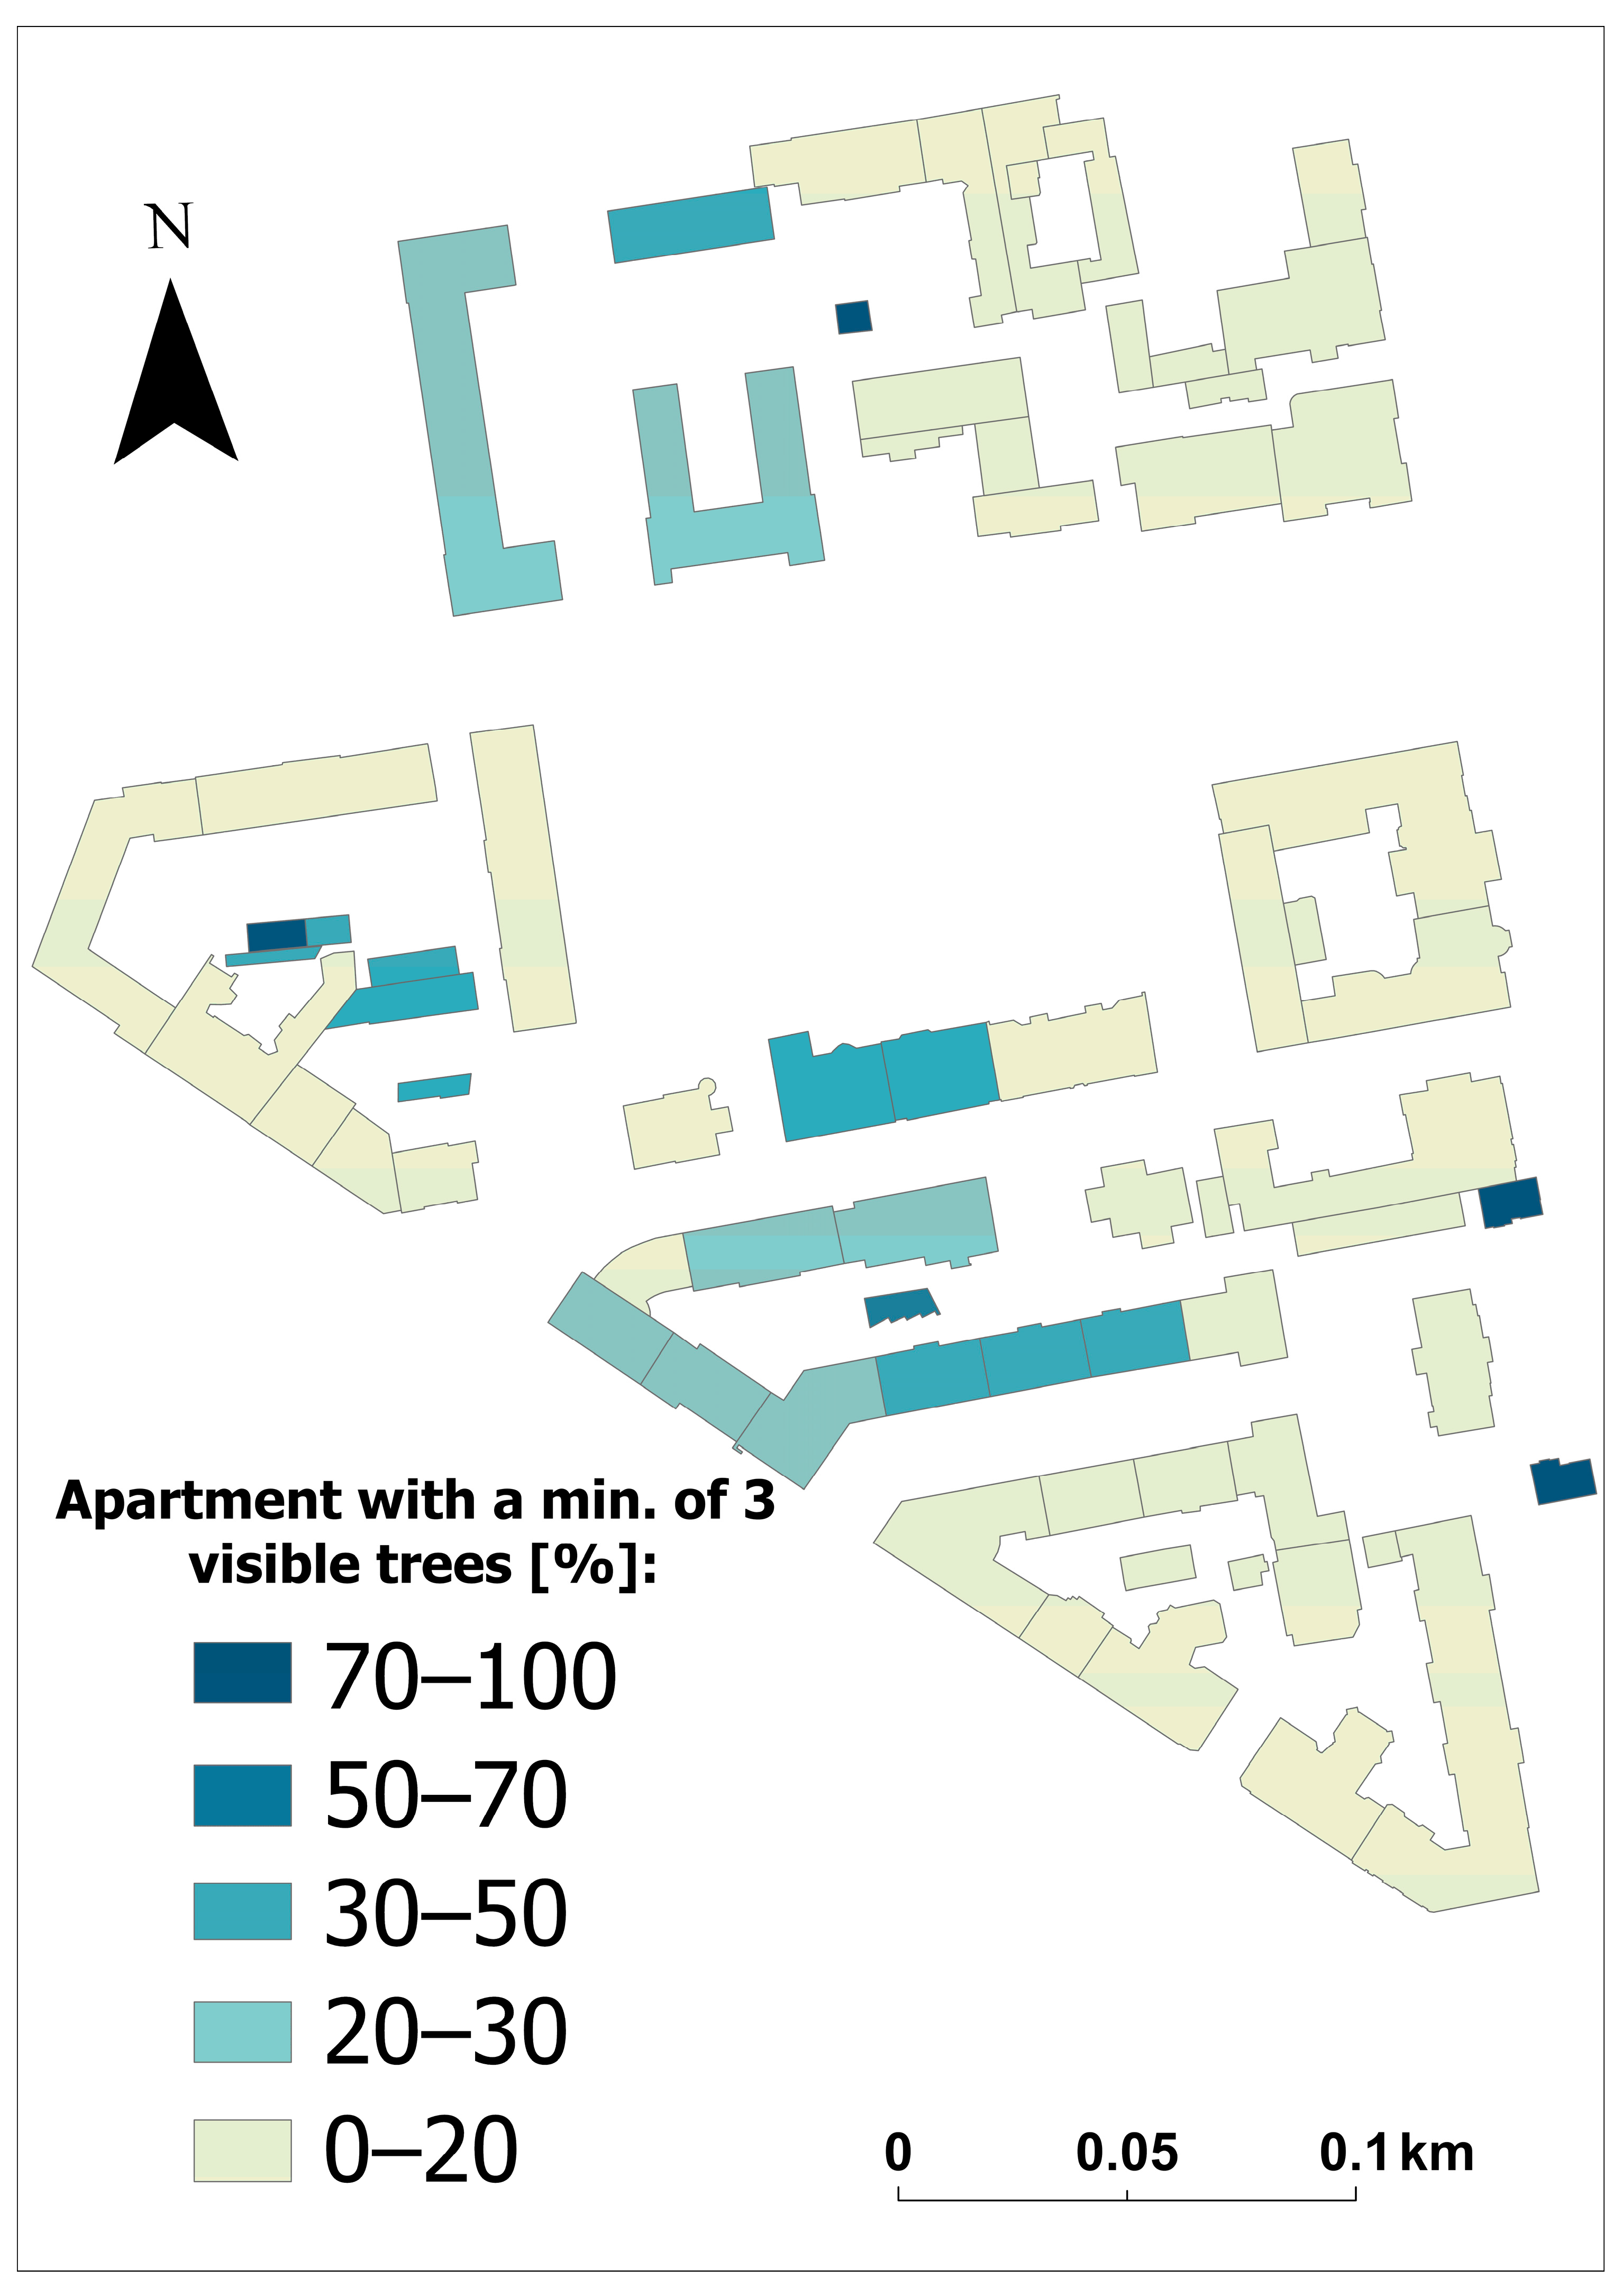
The maps presented in Figure 9 and Figure 10 show the results of the three-tree visibility analysis; however, in this case, no distinction was made between individual floors—each building was treated as a single object.

4. Discussion

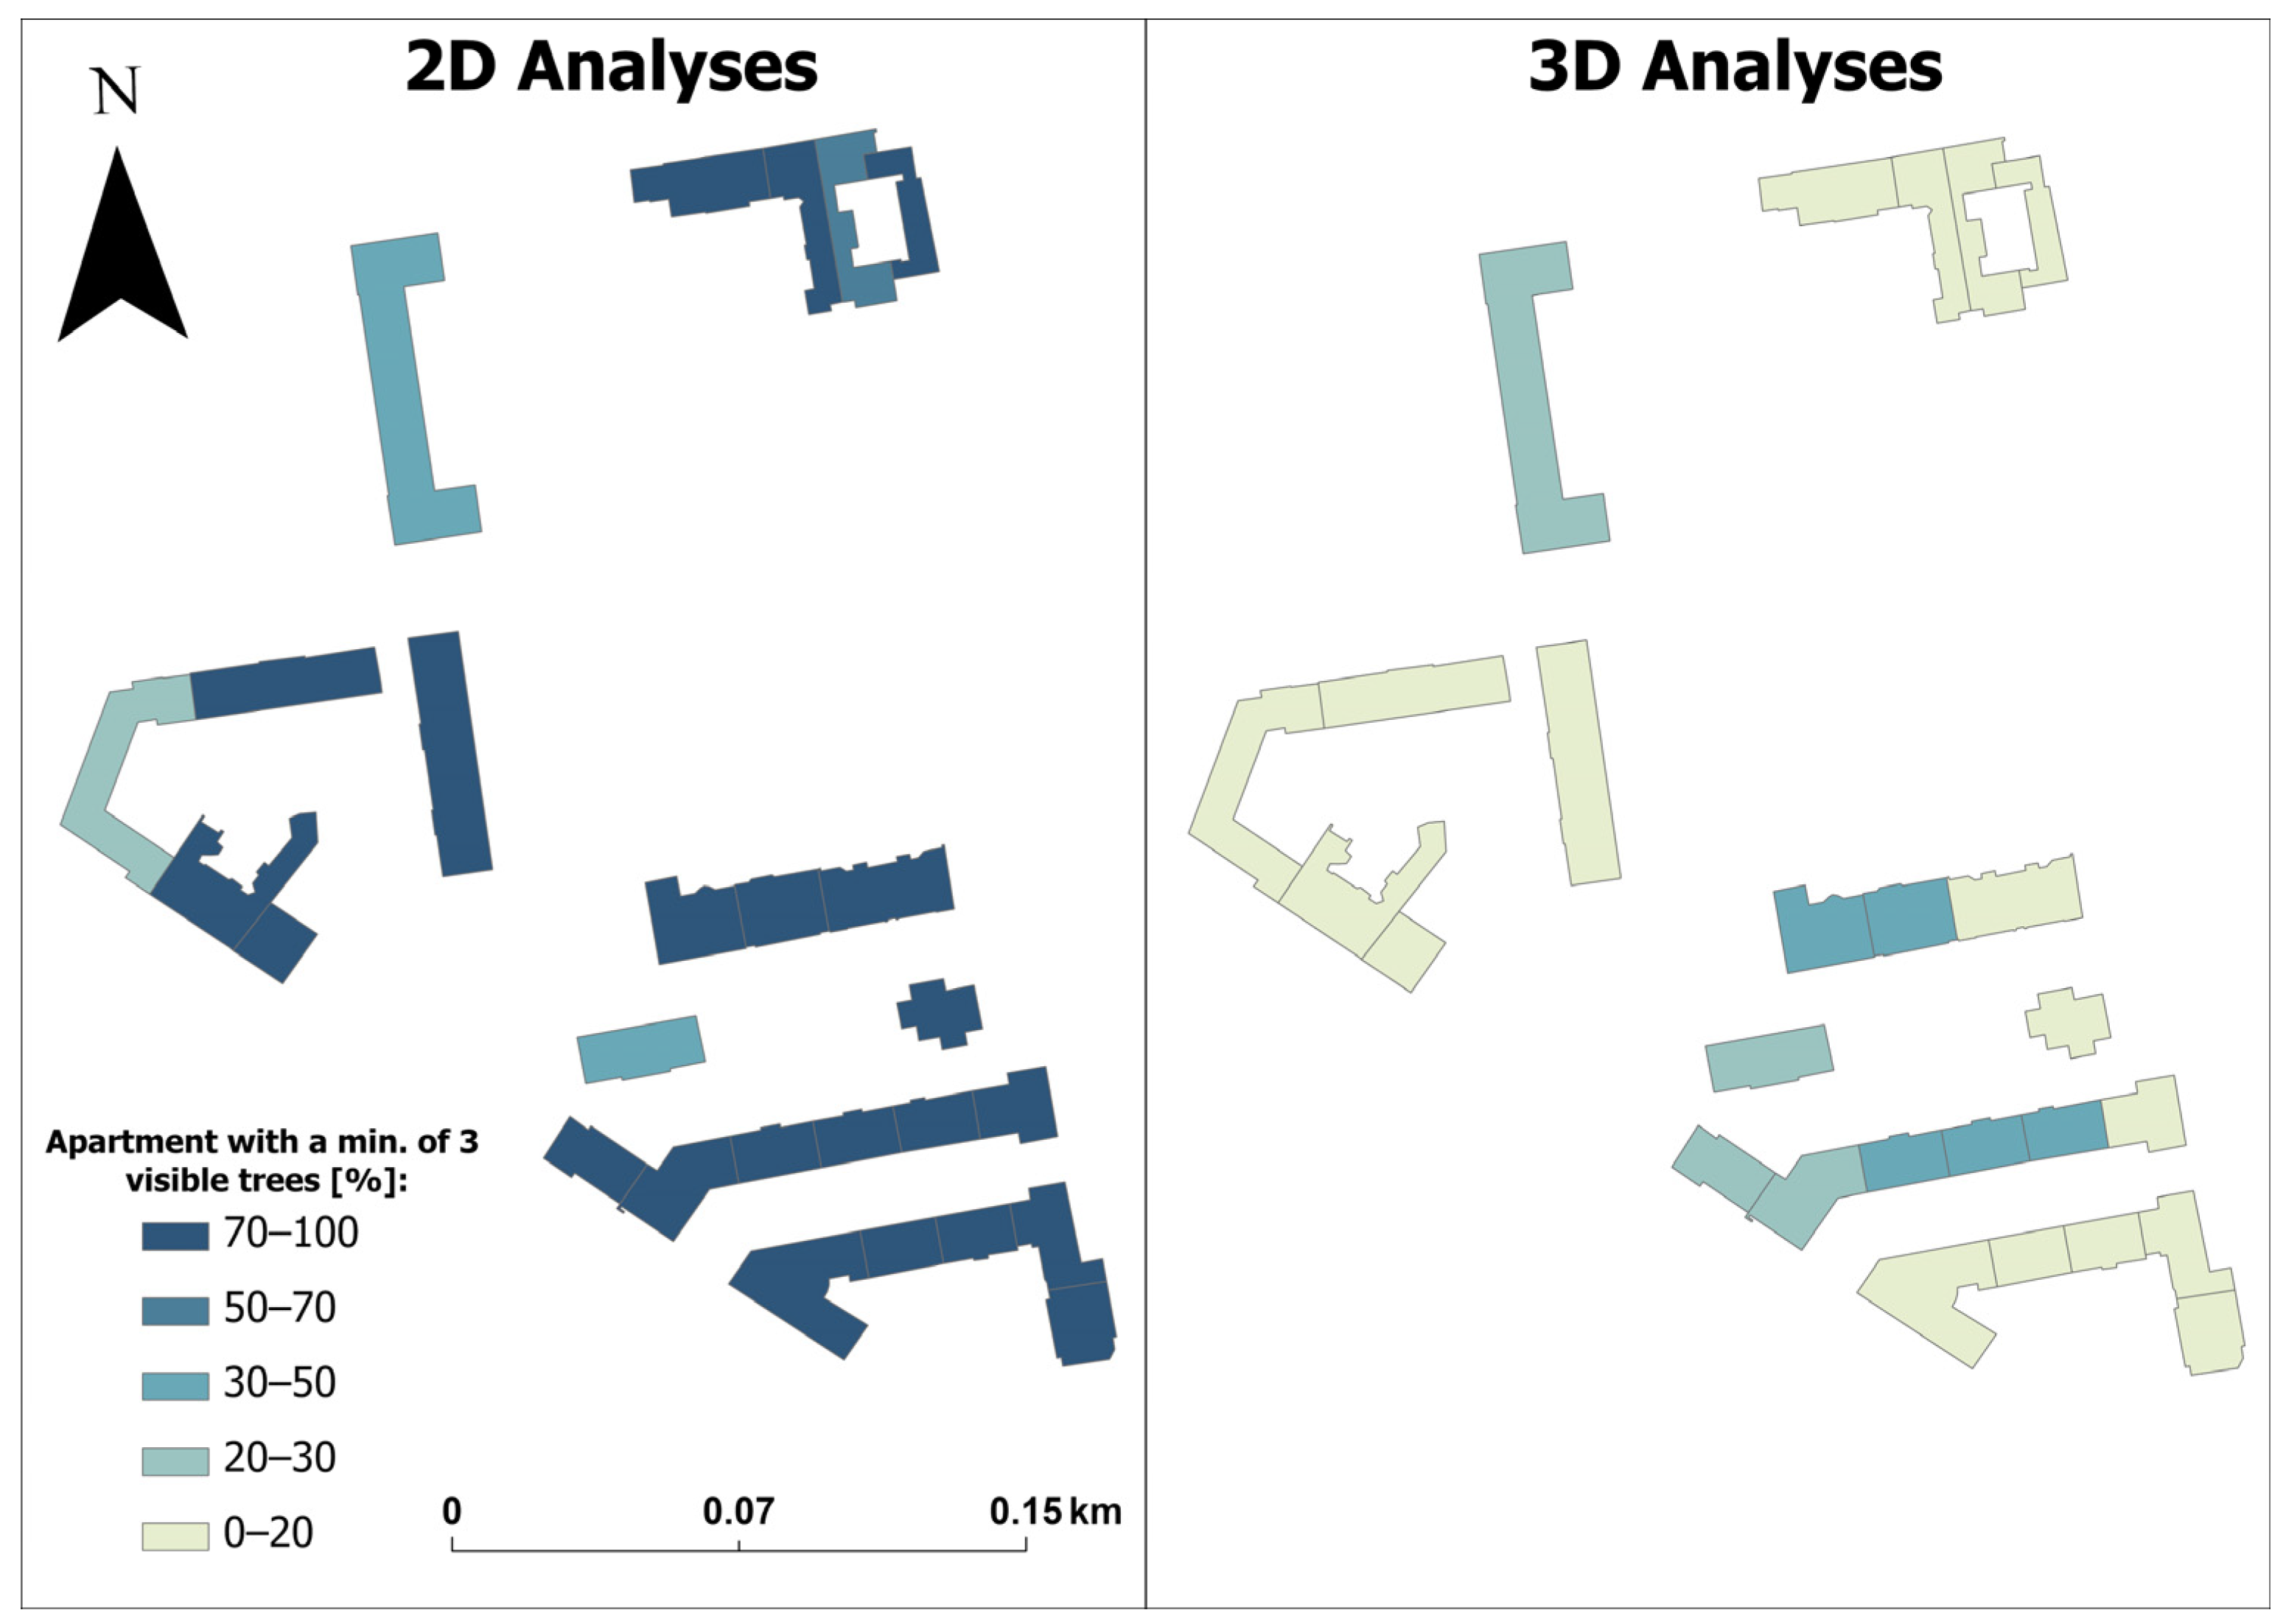
The method proposed in this study for determining the visibility of trees from apartments enables the acquisition of precise results concerning the presence of greenery in the immediate surroundings of buildings. This, in turn, allows for more accurate analyses reflecting the assumptions of the 3–30–300 concept than would be possible without accounting for building storeys. This assumption is supported by a comparison of the results obtained in the present study with those from earlier research conducted without considering floor levels [40] (Figure 11).
In two-dimensional (2D) analyses, it was shown that, on average, as many as 87% of apartments within each building in the study area met the criterion of visibility of at least three trees. This result might suggest that most residents have access to greenery in their immediate surroundings.
However, the application of a three-dimensional (3D) approach demonstrated that, on average, only 15.17% of apartments in the buildings satisfied the requirement of visibility of three trees. It is also important to note that the method of determining visibility in the present study was more precise, as it relied on tree line-of-sight analysis rather than buffer-based calculations used in previous research. This emphasizes the importance and added value of our research in comparison with the previous solutions presented in Table 1. Our findings highlight the necessity of accounting for storeys and variations in building height in visibility analyses, particularly when assessing access to urban green spaces in densely built environments. A significant advantage of the proposed methodology is not only its precision but also the very short time required to determine the location of a specific apartment. After full automation of the process—including the copying of points for individual floors to the appropriate layers—the procedure took, on average, approximately 13 s.
Another notable feature is the objective nature of the methodology. All data are analyzed according to uniform criteria and are based on metric data, which distinguishes this approach from subjective methods, such as surveys on residents’ perception of greenery from their apartment.
However, despite the generally positive aspects of the proposed methodology, several limitations were observed during its implementation that should be addressed in future studies. Limitations are related mainly to the detailed data, which are necessary in such kinds of analysis. Unfortunately, there is a lack of publicly available data on apartment layouts, precise window locations and sizes, and window shapes. This has an impact on the accuracy of analyses and the results obtained. Therefore, this research required these data to be simulated.
Simulated data also have their limitations. These apply, for example, to buildings with more complex geometries or situations where buildings adjoin each other along their walls. In such cases, the algorithm for automatically determining potential apartment locations did not always function correctly, occasionally failing to generate points or generating them incorrectly. Therefore, in future research, the script logic should be slightly modified. First, at the beginning of the process, all adjoining buildings should be merged into a single geometric object. Next, lines should be generated along the external boundaries of the resulting building polygon, and points should be placed along these lines at defined intervals. This approach would prevent the creation of points at the junctions of two buildings, which currently leads to the emergence of incorrect points.
An undeniable disadvantage of the method is the considerable time required for the entire process, primarily due to the generation of lines of sight. For the analyzed area, the process took approximately 2 h; thus, conducting it for an entire city would take weeks or even months.

5. Conclusions

Contemporary urban planning increasingly focuses not only on the presence of greenery but also on its actual visual accessibility from residential spaces.
The view of greenery and trees from within buildings has a significant impact on residents’ quality of life [13,57,58], making it crucial to examine the extent to which greenery is genuinely visible from living spaces. In response to this need, a comprehensive methodology for visibility analysis has been developed, taking into account several key factors—the height of the observation point apartment, terrain morphology, the minimum tree height, and the maximum distance of trees from buildings, determined based on survey results.
Unlike previous approaches presented and compared in Table 1, which relied solely on two-dimensional analyses, the proposed method enables assessment of visibility while accounting for the three-dimensional structure of the city. Each apartment is treated as an individual observation point, allowing for a detailed evaluation of tree visibility from a specific apartment. The proposed solution represents a valuable and innovative tool that, with further development, can be applied not only to assessing tree visibility but also in broader studies of urban space quality. The inclusion of height data, individual point-based analysis, and consideration of terrain topography, as well as the use of 3D spatial data make this methodology a comprehensive and scalable solution. Its potential extends beyond academic research to practical applications—such as planning new plantings, improving access to greenery, and supporting more informed urban planning decisions. A relevant example is the “Million Trees for Warsaw” program [48], where applying this methodology could significantly streamline the initial stage of identifying areas in need of new plantings.
An unquestionable advantage of this methodology is that it can also be used by decision-makers and urban planners to assess the degree of intervention required in a given area in terms of planting new trees. This would allow actions to be prioritized in locations where they are most needed.
It is also worth emphasizing that future research should focus on improving algorithms for the automatic identification of apartments in buildings with complex geometry or in adjoining structures. In addition, methods for optimizing computation time should be developed so that the process can be applied efficiently at a larger urban scale.
In summary, the developed methodology constitutes an important step toward a more precise and objective measurement of greenery accessibility in urban environments. Accounting for the three-dimensional structure of buildings allows for a more accurate reflection of real conditions of urban landscape perception, making this method a valuable tool for both scientific research and practical urban planning.

Supplementary Materials

The following supporting information can be downloaded at: https://www.mdpi.com/article/10.3390/app16073514/s1.

Author Contributions

Conceptualization, B.W.; Methodology, B.W.; Formal analysis, B.W.; Writing—original draft, B.W.; Writing—review & editing, A.M.; Visualization, B.W.; Supervision, A.M. All authors have read and agreed to the published version of the manuscript.

Funding

This research and publication process was funded within the statutory project UGB 531-000130-W400-22, titled “Acquisition and processing of spatial data for the needs of geospatial reconnaissance”, realized in 2026 at the Faculty of Civil Engineering and Geodesy, Military University of Technology, Warsaw, Poland.

Institutional Review Board Statement

Not applicable.

Informed Consent Statement

Not applicable.

Data Availability Statement

The data that support the findings of this study are available from the corresponding author upon reasonable request.

Conflicts of Interest

The authors declare no conflicts of interest.

References

  1. Lee, J.; Stucky, D. On Applying Viewshed Analysis for Determining Least-Cost Paths on Digital Elevation Models. Int. J. Geogr. Inf. Sci. 1998, 12, 891–905. [Google Scholar] [CrossRef] [Scilit]
  2. Petrasova, A.; Harmon, B.; Petras, V.; Mitasova, H. Viewshed Analysis. In Tangible Modeling with Open Source GIS; Springer International Publishing: Berlin/Heidelberg, Germany, 2015; pp. 77–82. [Google Scholar]
  3. Poerwoningsih, D.; Antariksa; Leksono, A.S.; Hasyim, A.W. Integrating Visibility Analysis in Rural Spatial Planning. Procedia Soc. Behav. Sci. 2016, 227, 838–844. [Google Scholar] [CrossRef] [Scilit]
  4. Tsilimigkas, G.; Derdemezi, E.-T. Spatial Planning and the Traditional Settlements Management: Evidence from Visibility Analysis of Traditional Settlements in Cyclades, Greece. Plan. Pract. Res. 2020, 35, 86–106. [Google Scholar] [CrossRef] [Scilit]
  5. Saunaluoma, S.; Leppänen, J. Visibility Analysis of Medieval and Early Modern Period Fire Beacon Sites in Turku Archipelago, Southwestern Finland. Fennosc. Archaeol. 2024, 41, 114–134. [Google Scholar] [CrossRef] [Scilit]
  6. Szpil, N.; Mihaylov, V. GIS Analysis of the Urban Religious Landscape: The Case of Piekary Śląskie. Diss. Cult. Landsc. Comm. 2024, 52, 121–146. [Google Scholar] [CrossRef]
  7. La Rosa, D.; Izakovičová, Z. Visibility Analysis to Enhance Landscape Protection: A Proposal of Planning Norms and Regulations for Slovakia. Land 2022, 11, 977. [Google Scholar] [CrossRef] [Scilit]
  8. Chamberlain, B.C.; Meitner, M.J. A Route-Based Visibility Analysis for Landscape Management. Landsc. Urban Plan. 2013, 111, 13–24. [Google Scholar] [CrossRef] [Scilit]
  9. Ren, L.; Cao, Y. Gis-Based Viewshed Analysis on the Conservation Planning of Historic Towns: The Case Study of Xinchang, Shanghai. Int. Arch. Photogramm. Remote Sens. Spat. Inf. Sci. 2021, 46, 609–616. [Google Scholar] [CrossRef] [Scilit]
  10. Kantner, J.; Hobgood, R. A GIS-Based Viewshed Analysis of Chacoan Tower Kivas in the US Southwest: Were They for Seeing or to Be Seen? Antiquity 2016, 90, 1302–1317. [Google Scholar] [CrossRef] [Scilit]
  11. Urban Green Spaces: A Brief for Action. Available online: https://iris.who.int/handle/10665/344116 (accessed on 20 March 2026).
  12. Islam, M.Z.; Johnston, J.; Sly, P.D. Green Space and Early Childhood Development: A Systematic Review. Rev. Environ. Health 2020, 35, 189–200. [Google Scholar] [CrossRef] [Scilit] [PubMed]
  13. Giannopoulou, M. Bioclimatic Principles and Urban Open Spaces: The Case of Xanthi. Int. J. Humanit. Soc. Sci. 2012, 6, 1845–1848. [Google Scholar] [CrossRef]
  14. Schwaab, J.; Meier, R.; Mussetti, G.; Seneviratne, S.; Bürgi, C.; Davin, E.L. The Role of Urban Trees in Reducing Land Surface Temperatures in European Cities. Nat. Commun. 2021, 12, 6763. [Google Scholar] [CrossRef] [Scilit] [PubMed]
  15. Marando, F.; Heris, M.P.; Zulian, G.; Udías, A.; Mentaschi, L.; Chrysoulakis, N.; Parastatidis, D.; Maes, J. Urban Heat Island Mitigation by Green Infrastructure in European Functional Urban Areas. Sustain. Cities Soc. 2022, 77, 103564. [Google Scholar] [CrossRef] [Scilit]
  16. Wong, N.H.; Tan, C.L.; Kolokotsa, D.D.; Takebayashi, H. Greenery as a Mitigation and Adaptation Strategy to Urban Heat. Nat. Rev. Earth Environ. 2021, 2, 166–181. [Google Scholar] [CrossRef] [Scilit]
  17. Iungman, T.; Cirach, M.; Marando, F.; Pereira Barboza, E.; Khomenko, S.; Masselot, P.; Quijal-Zamorano, M.; Mueller, N.; Gasparrini, A.; Urquiza, J.; et al. Cooling Cities through Urban Green Infrastructure: A Health Impact Assessment of European Cities. Lancet 2023, 401, 577–589. [Google Scholar] [CrossRef] [Scilit] [PubMed]
  18. Maas, J.; Verheij, R.A.; de Vries, S.; Spreeuwenberg, P.; Schellevis, F.G.; Groenewegen, P.P. Morbidity Is Related to a Green Living Environment. J. Epidemiol. Community Health 2009, 63, 967–973. [Google Scholar] [CrossRef] [Scilit]
  19. Dadvand, P.; Bartoll, X.; Basagaña, X.; Dalmau-Bueno, A.; Martinez, D.; Ambros, A.; Cirach, M.; Triguero-Mas, M.; Gascon, M.; Borrell, C.; et al. Green Spaces and General Health: Roles of Mental Health Status, Social Support, and Physical Activity. Environ. Int. 2016, 91, 161–167. [Google Scholar] [CrossRef] [Scilit]
  20. Hartig, T.; Kahn, P.H. Living in Cities, Naturally. Science 2016, 352, 938–940. [Google Scholar] [CrossRef] [Scilit]
  21. Barboza, E.P.; Cirach, M.; Khomenko, S.; Iungman, T.; Mueller, N.; Barrera-Gómez, J.; Rojas-Rueda, D.; Kondo, M.; Nieuwenhuijsen, M. Green Space and Mortality in European Cities: A Health Impact Assessment Study. Lancet Planet. Health 2021, 5, e718–e730. [Google Scholar] [CrossRef] [Scilit]
  22. Labib, S.M.; Lindley, S.; Huck, J.J. Spatial Dimensions of the Influence of Urban Green-Blue Spaces on Human Health: A Systematic Review. Environ. Res. 2020, 180, 108869. [Google Scholar] [CrossRef] [Scilit]
  23. Shanahan, D.F.; Bush, R.; Gaston, K.J.; Lin, B.B.; Dean, J.; Barber, E.; Fuller, R.A. Health Benefits from Nature Experiences Depend on Dose. Sci. Rep. 2016, 6, 28551. [Google Scholar] [CrossRef] [Scilit]
  24. Li, L.; Lange, K.W. Assessing the Relationship between Urban Blue-Green Infrastructure and Stress Resilience in Real Settings: A Systematic Review. Sustainability 2023, 15, 9240. [Google Scholar] [CrossRef] [Scilit]
  25. Urban Green Spaces and Health. Available online: https://www.who.int/europe/publications/i/item/WHO-EURO-2016-3352-43111-60341 (accessed on 12 February 2026).
  26. Ow, L.F.; Ghosh, S. Urban Cities and Road Traffic Noise: Reduction through Vegetation. Appl. Acoust. 2017, 120, 15–20. [Google Scholar] [CrossRef] [Scilit]
  27. Browning, M.H.E.M.; Locke, D.H.; Konijnendijk, C.; Labib, S.M.; Rigolon, A.; Yeager, R.; Bardhan, M.; Berland, A.; Dadvand, P.; Helbich, M.; et al. Measuring the 3–30–300 Rule to Help Cities Meet Nature Access Thresholds. Sci. Total Environ. 2024, 907, 167739. [Google Scholar] [CrossRef] [Scilit] [PubMed]
  28. Konijnendijk, C. The 3–30–300 Rule for Urban Forestry and Greener Cities. Biophilic Cities 2022, 4, 12–15. [Google Scholar]
  29. Konijnendijk, C.C. Evidence-Based Guidelines for Greener, Healthier, More Resilient Neighbourhoods: Introducing the 3–30–300 Rule. J. For. Res. 2023, 34, 821–830. [Google Scholar] [CrossRef] [Scilit]
  30. Ebi, K.L.; Bowen, K. Green and Blue Spaces: Crucial for Healthy, Sustainable Urban Futures. Lancet 2023, 401, 529–530. [Google Scholar] [CrossRef] [Scilit]
  31. Ekkel, E.D.; de Vries, S. Nearby Green Space and Human Health: Evaluating Accessibility Metrics. Landsc. Urban Plan. 2017, 157, 214–220. [Google Scholar] [CrossRef] [Scilit]
  32. Nutsford, D.; Pearson, A.L.; Kingham, S.; Reitsma, F. Residential Exposure to Visible Blue Space (but Not Green Space) Associated with Lower Psychological Distress in a Capital City. Health Place 2016, 39, 70–78. [Google Scholar] [CrossRef] [Scilit]
  33. Rugel, E.J. Connecting Natural Space Exposure to Mental Health Outcomes Across Vancouver. Ph.D. Thesis, University of British Columbia, Vancouver, BC, Canada, 2019. [Google Scholar]
  34. Mitelsztedt, K.; Ciesielski, M.; Hycza, T.; Lisańczuk, M.; Guderski, K.; Kurpiewska, S.; Korzeniewski, K. Exploring the Possibilities of Implementing the ALS-Based 3–30–300 Concept for Urban Green Space Management in Small Municipalities. Land 2025, 14, 358. [Google Scholar] [CrossRef] [Scilit]
  35. Nieuwenhuijsen, M.J.; Dadvand, P.; Márquez, S.; Bartoll, X.; Barboza, E.P.; Cirach, M.; Borrell, C.; Zijlema, W.L. The Evaluation of the 3–30–300 Green Space Rule and Mental Health. Environ. Res. 2022, 215, 114387. [Google Scholar] [CrossRef] [Scilit]
  36. Owen, D.; Fitch, A.; Fletcher, D.; Knopp, J.; Levin, G.; Farley, K.; Banzhaf, E.; Zandersen, M.; Grandin, G.; Jones, L. Opportunities and Constraints of Implementing the 3–30–300 Rule for Urban Greening. Urban For. Urban Green. 2024, 98, 128393. [Google Scholar] [CrossRef] [Scilit]
  37. Robitaille, É.; Douyon, C. Using the 3–30–300 Indicator to Evaluate Green Space Accessibility and Inequalities: A Case Study of Montreal, Canada. Geographies 2025, 5, 6. [Google Scholar] [CrossRef] [Scilit]
  38. Croeser, T.; Sharma, R.; Weisser, W.W.; Bekessy, S.A. Acute Canopy Deficits in Global Cities Exposed by the 3–30–300 Benchmark for Urban Nature. Nat. Commun. 2024, 15, 9333. [Google Scholar] [CrossRef] [Scilit] [PubMed]
  39. OpenTrees.Org. Available online: https://opentrees.org/#pos=1/-33.7/145 (accessed on 20 March 2026).
  40. Wyrzykowski, B.; Mościcka, A. Implementation of the 3–30–300 Green City Concept: Warsaw Case Study. Appl. Sci. 2024, 14, 10566. [Google Scholar] [CrossRef] [Scilit]
  41. Geoportal. Available online: https://www.geoportal.gov.pl/ (accessed on 20 March 2026).
  42. Battisti, L.; Giacco, G.; Moraca, M.; Pettenati, G.; Dansero, E.; Larcher, F. Spatializing Urban Forests as Nature-Based Solutions: A Methodological Proposal. Cities 2024, 144, 104629. [Google Scholar] [CrossRef] [Scilit]
  43. Siok, K.; Wyrzykowski, B. Methodology for Increasing Urban Greenery According to the 3–30–300 Concept: A Warsaw Case Study. Sustainability 2025, 17, 5563. [Google Scholar] [CrossRef] [Scilit]
  44. Lahoti, S.A.; Thomas, M.; Pimpalshende, P.; Dhyani, S.; Sahle, M.; Kumar, P.; Saito, O. 3–30–300 Benchmark: An Evaluation of Tree Visibility, Canopy Cover, and Green Space Access in Nagpur, India. Urban Sci. 2025, 9, 120. [Google Scholar] [CrossRef] [Scilit]
  45. Warsaw Statistics. Available online: https://um.warszawa.pl/-/2021-budzet-statystyka-warszawy (accessed on 20 March 2026).
  46. Population Status. Available online: https://bdl.stat.gov.pl/bdl/dane/podgrup/tablica (accessed on 20 March 2026).
  47. Kacperczyk, E.; Ciesielska, K.; Hernik, G.; Matysek-Zdun, U. Area and Population by Territorial Division in 2023 [In Polish: Powierzchnia i Ludność w Przekroju Terytorialnym w 2023 r.]; Główny Urząd Statystyczny: Warsaw, Poland, 2023.
  48. The Greenery Board of the Capital City of Warsaw. A Million Trees For Warsaw. Available online: https://zzw.waw.pl/2017/03/28/milion-drzew-dla-warszawy/ (accessed on 20 March 2026).
  49. The Greenery Board of the Capital City of Warsaw. Green Streets. [In Polish: Zielone Ulice]. Available online: https://zzw.waw.pl/zieloneulice/ (accessed on 20 March 2026).
  50. The Greenery Board of the Capital City of Warsaw. In 2022, We Paved Almost 3000 M2—The Appearance of Greenery in Warsaw [In Polish: W 2022 r. rozpłytowaliśmy niemal 3000 m2–przybyło zieleni w Warszawie]. Available online: https://zzw.waw.pl/2023/08/09/w-2022-r-rozplytowalismy-niemal-3000-m2-przybylo-zieleni-w-warszawie/?projekt=1&b=75 (accessed on 20 March 2026).
  51. Wikipedia.Org. Available online: https://pl.wikipedia.org/wiki/Dolina_Szwajcarska (accessed on 20 March 2026).
  52. Topographic Object Database. Available online: https://www.geoportal.gov.pl/pl/dane/baza-danych-obiektow-topograficznych-bdot10k/ (accessed on 20 March 2026).
  53. Geoportal—Spatial Information for Everyone. Available online: https://www.gov.pl/web/archiwum-inwestycje-rozwoj/geoportal-informacja-przestrzenna-dla-kazdego (accessed on 20 March 2026).
  54. Digital Elevation Model (DEM). Available online: https://www.geoportal.gov.pl/pl/dane/numeryczny-model-terenu-nmt/ (accessed on 20 March 2026).
  55. Council of Ministers of the Republic of Poland. Council of Ministers Regulation of the Council of Ministers of 15 October 2012 on the National Spatial Reference System; Council of Ministers of the Republic of Poland: Warsaw, Poland, 2012.
  56. 3D Tree Models. Available online: https://www.geoportal.gov.pl/pl/dane/inne-dane/modele-3d-drzew/ (accessed on 20 March 2026).
  57. Zhang, Y.; Mavoa, S.; Zhao, J.; Raphael, D.; Smith, M. The Association between Green Space and Adolescents’ Mental Well-Being: A Systematic Review. Int. J. Environ. Res. Public Health 2020, 17, 6640. [Google Scholar] [CrossRef] [Scilit]
  58. Wortzel, J.D.; Wiebe, D.J.; DiDomenico, G.E.; Visoki, E.; South, E.; Tam, V.; Greenberg, D.M.; Brown, L.A.; Gur, R.C.; Gur, R.E.; et al. Association Between Urban Greenspace and Mental Wellbeing During the COVID-19 Pandemic in a U.S. Cohort. Front. Sustain. Cities 2021, 3, 686159. [Google Scholar] [CrossRef] [Scilit]
Figure 1. The process of simulating the arrangement of apartments on one floor of a building: (1) loading the building polygon; (2) converting the polygon into a linear structure; (3) automatic generation of apartment location points at 10 m intervals; (4) copying the line to the height corresponding to each floor.
Applsci 16 03514 g001
Figure 2. The conceptual framework based on the three-tree rule.
Applsci 16 03514 g002
Figure 3. Stages of determining the visibility of trees. Green—apartments from which trees are visible; Red—apartments from which trees are not visible.
Applsci 16 03514 g003
Figure 4. Test area location [52].
Applsci 16 03514 g004
Figure 5. Survey results: (a) maximum distance between tree and building expected by respondents; (b) minimum tree height expected by respondents.
Applsci 16 03514 g005
Figure 9. Percentage of apartments in residential buildings with visibility of ≥3 trees.
Applsci 16 03514 g009
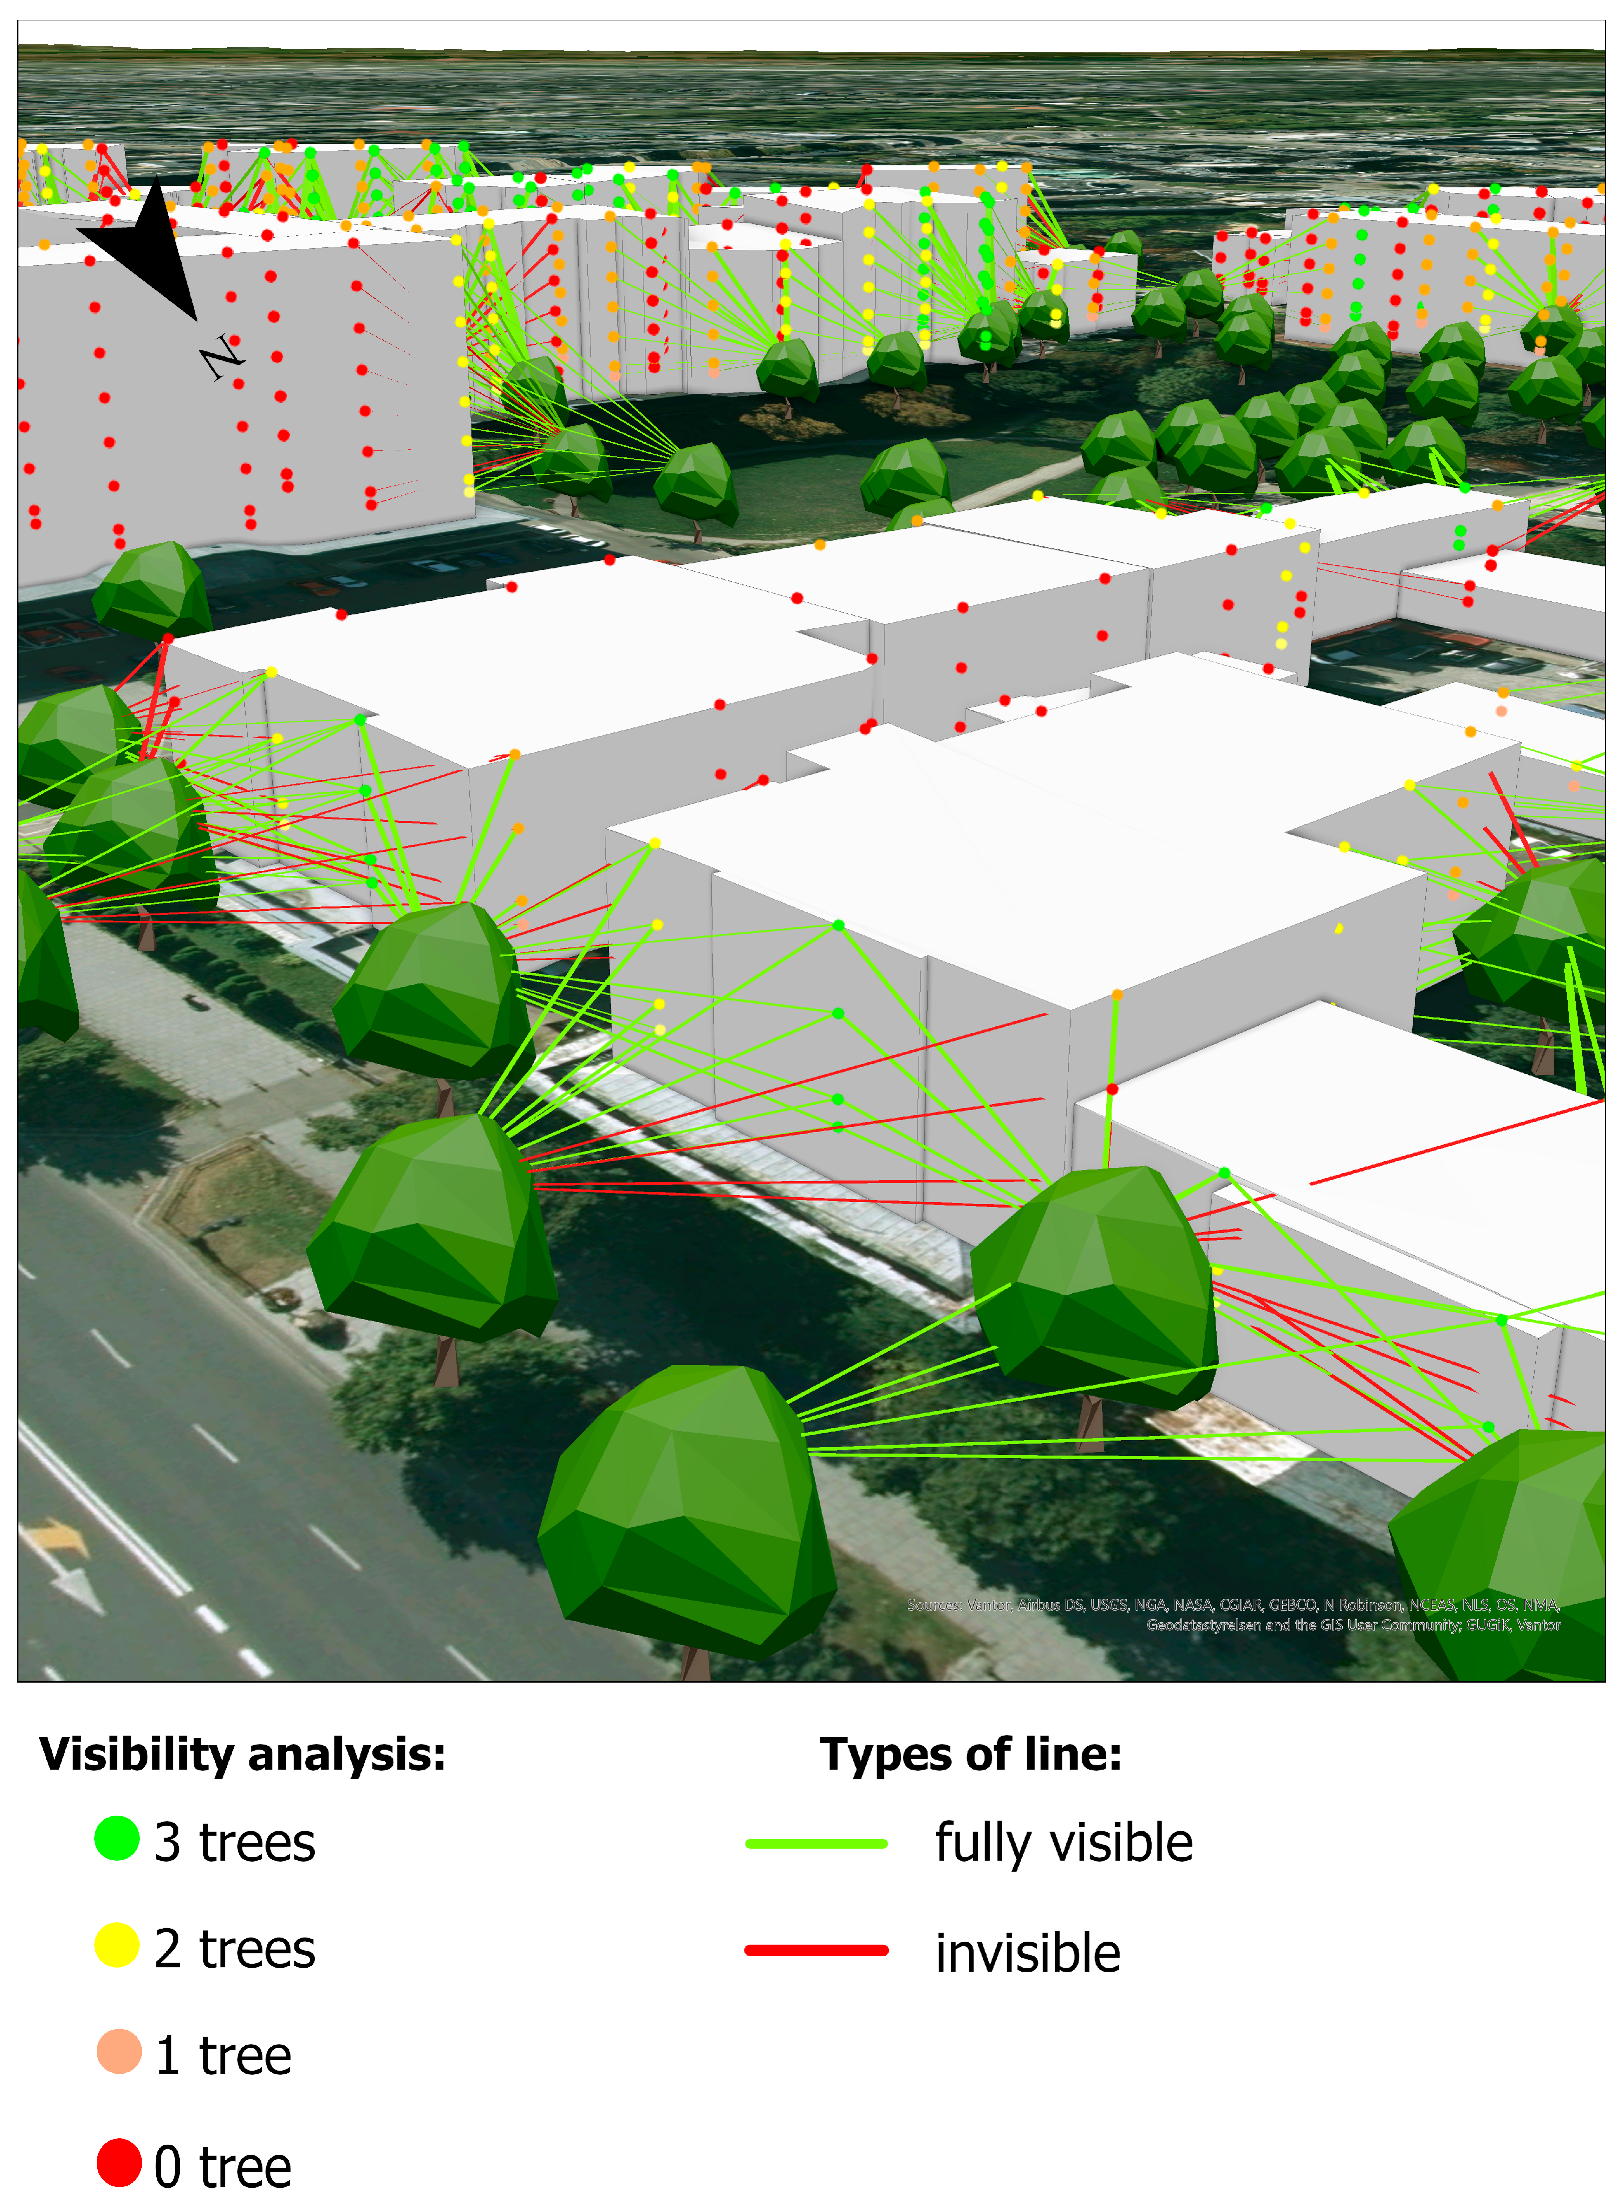
Figure 10. 3D visualization including analysis of the results.
Applsci 16 03514 g010
Figure 11. Comparison of the results of two visibility analysis methodologies: the left map shows flat (2D) analyses, while the right one shows current three-dimensional (3D) analyses. The smaller number of buildings visible on the presented maps is due to the fact that previous research focused exclusively on residential buildings. Although the current 3D methodology was tested on all building types to verify its effectiveness on a larger dataset, the results shown here have been limited to residential structures to ensure a direct and consistent comparison between the two methods.
Applsci 16 03514 g011
Table 1. Comparison of previous studies on tree visibility analyses in relation to the 3–30–300 concept with the methodology developed in this study.
Study Name The Way of Determining the Visibility of Trees2D/3D GIS Visibility AnalysesThe Way of Determining the Height of TreesThe Way of Determining the Tree–Window Distance
Acute canopy deficits in global cities exposed by the 3–30–300 benchmark for urban nature [38]spatial analysis2Darbitrarily
by a scientist
arbitrarily
by a scientist
Implementation of the 3–30–300 Green City Concept: Warsaw Case Study [40]spatial analysis2Darbitrarily
by a scientist
arbitrarily
by a scientist
Spatializing Urban Forests as Nature-based Solutions: a methodological proposal [42]spatial analysis2Darbitrarily
by a scientist
arbitrarily
by a scientist
3–30–300 Benchmark: An Evaluation of Tree Visibility, Canopy Cover, and Green Space Access in Nagpur, India [44]residents’ opinions (questionnaire)not applicablearbitrarily
by a scientist
arbitrarily
by a scientist
Methodology for determining tree visibility from apartments on different floors [this work]spatial analysis3Dbased on
residents’ opinion (questionnaire)
based on
residents’ opinions (questionnaire)
Table 2. Analyzed buildings with information about the number of floors.
Number of Floors in the BuildingNumber of BuildingsNumber of Buildings That Have Such a Floor
1-71
21671
3855
41047
51037
61427
7713
866
TOTAL:71327
Table 3. Number of lines of sight generated, including number of floors.
FloorTotal Number of Lines of SightLines of Sight Meeting the 20 m Distance RequirementPositive Visibility LinesNegative Visibility Lines (Partially Visible + Completely Invisible)
1 114,4901096604492
2114,4901096674422
3103,362958581377
495,230849498351
572,974630372258
659,064479302177
729,96022014080
819,2601188137
AVERAGE:76,104681407274
TOTAL:608,830544632522194
Table 4. Percentage of lines of sight by floor.
Number of FloorLines of Sight That Meet the Distance Condition Relative in All Generated LinesLines of Positive Visibility in Lines Meeting the Distance ConditionNegative Visibility Lines in Lines That Meet the Distance Condition
11.0%55.1%44.9%
21.0%61.5%38.5%
30.9%60.6%39.4%
40.9%58.7%41.3%
50.9%59.0%41.0%
60.8%63.0%37.0%
70.7%63.6%36.4%
80.6%68.6%31.4%
TOTAL:0.9%59.7%40.3%
Table 5. Number of apartments on each floor with the possibility of seeing a certain number of trees.
Number of Floor
(Number of Apartments)
0 Trees1 Tree2 Trees3 or More Trees
1 (535)2271447886
2 (535)21014378104
3 (483)2011267185
4 (445)1941166372
5 (341)145984850
6 (276)114804240
7 (140)62441519
8 (90)4328109
TOTAL: (2845)1196779405465
Disclaimer/Publisher’s Note: The statements, opinions and data contained in all publications are solely those of the individual author(s) and contributor(s) and not of MDPI and/or the editor(s). MDPI and/or the editor(s) disclaim responsibility for any injury to people or property resulting from any ideas, methods, instructions or products referred to in the content.