1. Introduction
The pantograph is a critical current-collecting component in electrified railway systems. It is mounted on the roof of the train and maintains sliding contact [
1] with the overhead contact wire to continuously transmit electrical power from the traction power supply network to the train. The reliable operation of electrified railways relies heavily on the stable power transmission of the pantograph–catenary system [
2]. However, the dynamic interaction between the pantograph and the contact wire often leads to an offline arc due to mechanical vibration, operational processes, or surface defects [
3]. Under such dynamic conditions, various transition processes may occur; the typical situations are as follows:
Due to hard spots on the contact wire or track irregularities, mechanical vibration may occur between the pantograph and catenary [
4]. This leads to pantograph–catenary disconnection and intermittent arcing [
5].
During the train’s passage through a phase separation section [
6], the pantograph separates from and reconnects with the catenary conductor and neutral line. During the separation process, the contact pressure gradually decreases until complete separation, forming a prolonged drawn arc.
During contact, if the pantograph does not fully connect with the catenary, the gap between them may be broken down by high voltage [
7], generating an arc.
Additionally, pantograph freezing, malfunction of the lifting airbag, or spring mechanism failure may create a fixed gap between the pantograph and catenary, thereby triggering an arc.
This pantograph–catenary arc is the primary cause of electrical erosion and burning of the contact wire and pantograph strip. It significantly shortens their service life [
8]. Moreover, the arc generates intense electromagnetic transient processes. These processes create broadband electromagnetic disturbances. Such disturbances seriously threaten the normal operation of onboard electrical equipment and railway communication signals. They also jeopardize the electromagnetic compatibility of the train control system [
9]. Therefore, investigating the electromagnetic transient characteristics of pantograph–catenary arcs under different operating conditions [
10] and their correlation mechanism with mechanical dynamic parameters [
11] holds significant theoretical importance and engineering value for enhancing the operational safety and reliability of electrified railways.
To deeply understand and effectively mitigate the hazards of pantograph–catenary arcs, scholars worldwide have investigated the characteristics of pantograph–catenary arcs from the perspective of multiple influencing factors. Current research methods for pantograph–catenary arc characteristics can be broadly divided into two categories: experimental research [
12] and simulation modeling [
13]. In terms of experimental research, Guo et al. [
14,
15,
16,
17] conducted pantograph–catenary offline experiments using an electromagnetic noise experimental platform for pantograph–catenary arcs. They analyzed the relationship between the amplitude-frequency characteristics of the electric field noise generated by pantograph–catenary offline arcs and the contact pressure, circuit current, and operating speed. Furthermore, they investigated the effects of pressure load fluctuation amplitude and frequency, sliding speed, and reciprocating speed of the slider on the electrical characteristics and arc motion patterns of pantograph–catenary arcs. Jin et al. [
18] designed a pendulum-type moving electrode discharge simulation device to equivalently study the pantograph–catenary discharge behavior. The study focused on the transient current and electromagnetic radiation characteristics induced by such discharges, analyzing the effects of factors including voltage, gap distance, and relative electrode motion on the discharge behavior. The results indicated that the electromagnetic radiation amplitude is proportional to the rate of current change, and the vertical approach speed significantly influences the discharge characteristics. Based on an equivalent pantograph–catenary experimental platform, Xu et al. [
19] investigated the distribution of arc root positions and the longitudinal drift height of the arc column under varying air pressures and airflow velocities. The study found that the arc duration and arc root stagnation time under low pressure were significantly longer than those under normal pressure. Furthermore, it was observed that as the airflow velocity increased, both the longitudinal drift speed and the height of the arc column increased.
In the area of simulation modeling, the most widely applied are two black-box arc equivalent models: the Cassie model [
20] and the Mayr model [
21]. Building upon this foundation, Habedank developed the Habedank arc model [
22] by connecting these two arc models in series, achieving higher fidelity and a broader range of applicability. Xiao et al. [
23] developed a finite element model of the “pantograph–catenary-vehicle-rail” system incorporating a pantograph–catenary arc simulation model. The study analyzed the effects of train operating speed and pantograph–catenary offline time on the development of pantograph–catenary arcs. The results indicated that the evolution of pantograph–catenary offline arcs is positively correlated with the offline time. Han et al. [
24] investigated the influence of different initial phase angles and ignition positions on the development of an arc during electrical phase separation using a chain arc model. It was found that magnetic force plays a dominant role in arc motion, and the arc movement is particularly notably affected by the ignition position, while the initial phase angle has little impact.
Significant progress has been made in existing research, with various influencing factors on pantograph–catenary arc characteristics being analyzed through both experimental and simulation approaches. However, most existing experimental studies have focused on arc behavior under isolated operating conditions, such as fixed gap, specific raising or lowering process. These studies typically rely on separate experimental setups that are not directly comparable, making it difficult to systematically compare electromagnetic transient responses across different mechanical excitation modes. In particular, the experimental platforms dedicated to pantograph–catenary offline vibration conditions remain scarce, so there is relatively little research on arc characteristics under such dynamic vibration scenarios. For simulation models, the classical black-box arc models, including the Cassie, Mayr, and Habedank models, are derived based on thermal equilibrium theory and are primarily developed for circuit simulation. These models treat the arc as a time-varying conductance and rely on parameters such as time constant and dissipated power. The parameters are typically calibrated under specific conditions, limiting their generalizability across different mechanical excitation modes. As a result, these models are insufficient for describing the electromagnetic transient characteristics of pantograph–catenary arcs under varying mechanical excitation scenarios, and they cannot support the systematic comparison of arc behavior across multiple operating conditions within a unified framework. Current studies predominantly leave a gap in the comparison of electromagnetic transient characteristics of pantograph–catenary arcs under multiple operating conditions based on a unified experimental platform. Systematic comparative studies on the electromagnetic transient response of pantograph–catenary arcs under different mechanical excitation modes, such as static fixed gaps between the pantograph and catenary, pantograph raising and lowering operations, and pantograph–catenary offline vibrations, remain insufficient. The quantitative correlation mechanism between mechanical dynamic parameters (including clearance distance, motion speed, etc.) and electromagnetic transient characteristics (including current rise time, oscillation frequency, etc.) remains to be further elucidated. Unlike previous studies that focus on a single operating condition, this work presents a systematic comparison of electromagnetic transient responses under four typical pantograph–catenary operating scenarios using a unified experimental platform. This allows the quantitative relationship between mechanical excitation and electromagnetic interference characteristics to be established.
This study aims to analyze the electromagnetic transient response waveforms and influencing factors of current, electric field, and voltage through experimental measurements under four typical operating conditions. Based on a unified experimental platform covering various operating conditions, this study employs synchronous measurement techniques [
25] to achieve a multi-parameter collaborative analysis of transient waveform characteristics. It systematically investigates the evolution laws of the electromagnetic transient characteristics of pantograph–catenary arcs under different mechanical excitation modes. In this study, electromagnetic transient characteristic refers to the transient electrical responses generated at the moment of air gap breakdown between the pantograph and the contact wire. These responses are quantified by three key parameters:
Peak values: the maximum absolute amplitude of current, electric field, or voltage during the transient event.
Current rise time: the time interval from 10% to 90% of the peak current on the rising edge of the transient waveform.
Oscillation frequency: the dominant frequency component obtained by applying FFT to the transient waveform.
By extracting these parameters from synchronized multichannel measurements, this study reveals the quantitative correlation mechanism between key mechanical parameters (including gap distance, pantograph raising speed, termination distance of pantograph lowering, and pantograph–catenary offline vibration amplitude) and multi-physics electrical responses (including arc current, electric field outside the train, and voltage between carriages). Consequently, a complete mapping relationship from mechanical excitation to electromagnetic response is established. This research aims to provide a theoretical basis and data support for accurate pantograph–catenary condition diagnosis, optimized design of pantograph operation, and system electromagnetic compatibility assessment.
2. Experimental Platform
This section describes the composition of the experimental platform and the parameters of the main equipment. It then introduces the specific experimental content and testing procedures. Finally, it details the parameters of the measurement devices and the spatial layout of the measurement points on the experimental platform. This section provides the basis for ensuring the accuracy and repeatability of the experimental data.
2.1. Composition of the Experimental Platform
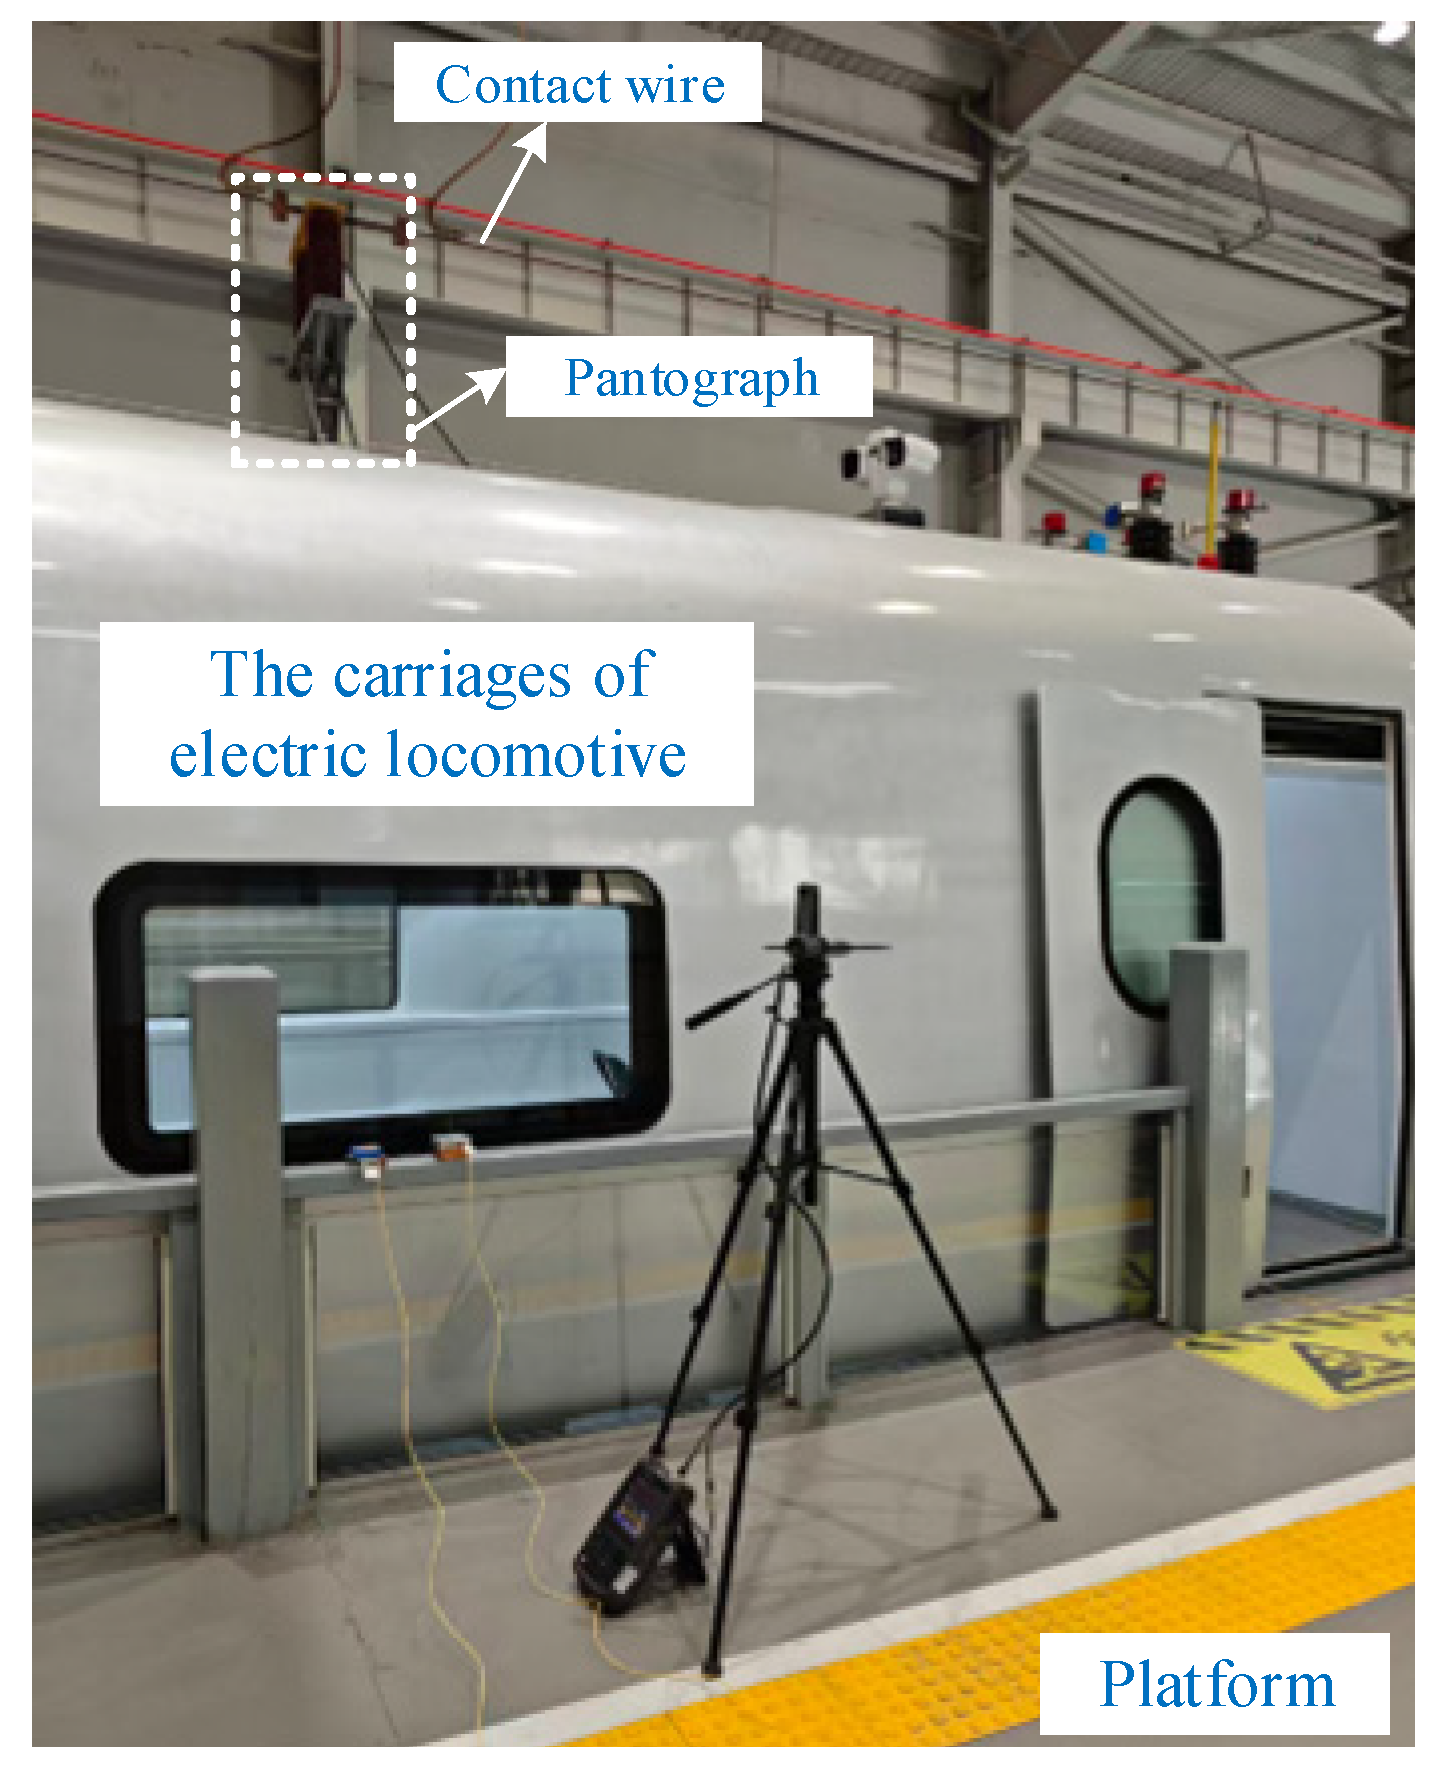
Considering the actual train operating scenarios, the pantograph–catenary arc experimental platform [
26] adopted in this study is shown in
Figure 1. The equipment in the experimental platform includes the pantograph, catenary wire, train, rail, and train equivalent load, among others. The parameters of the main equipment are listed in
Table 1.
To simulate the energized and loaded working environment in actual operation, a 275 Ω equivalent load was connected to the load side of the pantograph. This configuration enables the experimental platform to achieve a maximum contact wire voltage of 27.5 kV and a maximum operating current of 100 A. The platform enables vertical vibration of the contact wire, driven by an air pump and pantograph raising or lowering actions driven by a motor. Specifically, the vibration amplitude can be adjusted by varying the air pressure of the pump, while the raising or lowering distance of the pantograph can be changed by regulating the step count of the stepper motor.
2.2. Experimental Content
Under energized and loaded conditions, experimental tests were conducted based on the unified experimental platform shown in
Figure 1 for four operating conditions: fixed-gap breakdown, pantograph raising gap breakdown, pantograph-lowering arc interruption, and pantograph–catenary offline vibration. The experimental variables and arc states for each operating condition are presented in
Table 2.
The experimental procedures for the four operating conditions are as follows:
For the fixed-gap breakdown condition, the pantograph and catenary remain separated in the initial state. The pantograph is driven by the motor to raise or lower, thereby altering the gap distance between the pantograph and the contact wire. Measurements are performed under various gap distances.
For the pantograph raising gap breakdown condition, the pantograph and catenary remain separated in the initial state. The pantograph is driven by the motor to rise, gradually approaching the contact wire until contact is achieved. Measurements are performed under various pantograph raising speeds.
For the pantograph-lowering arc interruption condition, the pantograph and catenary remain in contact in the initial state. The pantograph is driven by the motor to lower, gradually moving away from the contact wire until the target distance is reached. Measurements are performed under various final separation distances between the pantograph and catenary.
For the pantograph–catenary offline vibration condition, the pantograph and catenary remain in contact in the initial state. The contact wire is driven by an air pump to vibrate vertically, causing repeated separation and contact between the pantograph and the contact wire. The vibration amplitude can be adjusted by varying the air pressure of the pump. Measurements are performed under various vibration amplitudes.
2.3. Measurement Devices and Layout
To accurately analyze the transient responses under different operating conditions, this study employs three types of probes listed in
Table 3 for synchronous measurement of three key physical quantities:
A flexible current probe is used to measure the current in the circuit where the arc occurs.
A time-domain electric field sensor is used to measure the electric field near the pantograph–catenary arc outside the train.
An active differential probe is used to measure the voltage between the two train carriages.
Table 3.
Parameters of measuring instruments.
Table 3.
Parameters of measuring instruments.
| Instrument | Model | Bandwidth | Range |
|---|
| Current probe | CWTHF30B | 1.5 Hz–30 MHz | Range: 6 kA |
| Electric field sensor | In-house development | 10 Hz–500 MHz | Range: 20 kV/m |
| Active differential probe | MDP3000 | 0 Hz–100 MHz | Range: 3 kV |
| Oscilloscope | Tektronix DPO3054 | 500 MHz | Sample rate: 2.5 GS/s |
To ensure the reliability and reproducibility of the experimental results, all measurement instruments are calibrated prior to the experiments using appropriate procedures. The electric field sensor is calibrated using a dedicated calibration system consisting of a pulse generator, a TEM cell, attenuators, and an oscilloscope, following the method described in [
27]. This setup enables accurate determination of the sensor’s transfer function over the frequency range of interest. The current probe is factory-calibrated by the manufacturer, and the calibration certificate is verified before the experiments. The active differential voltage probe is calibrated in the laboratory by shorting its two input terminals and pressing the “Zero” button while powered on, thereby eliminating offset errors and ensuring measurement accuracy.
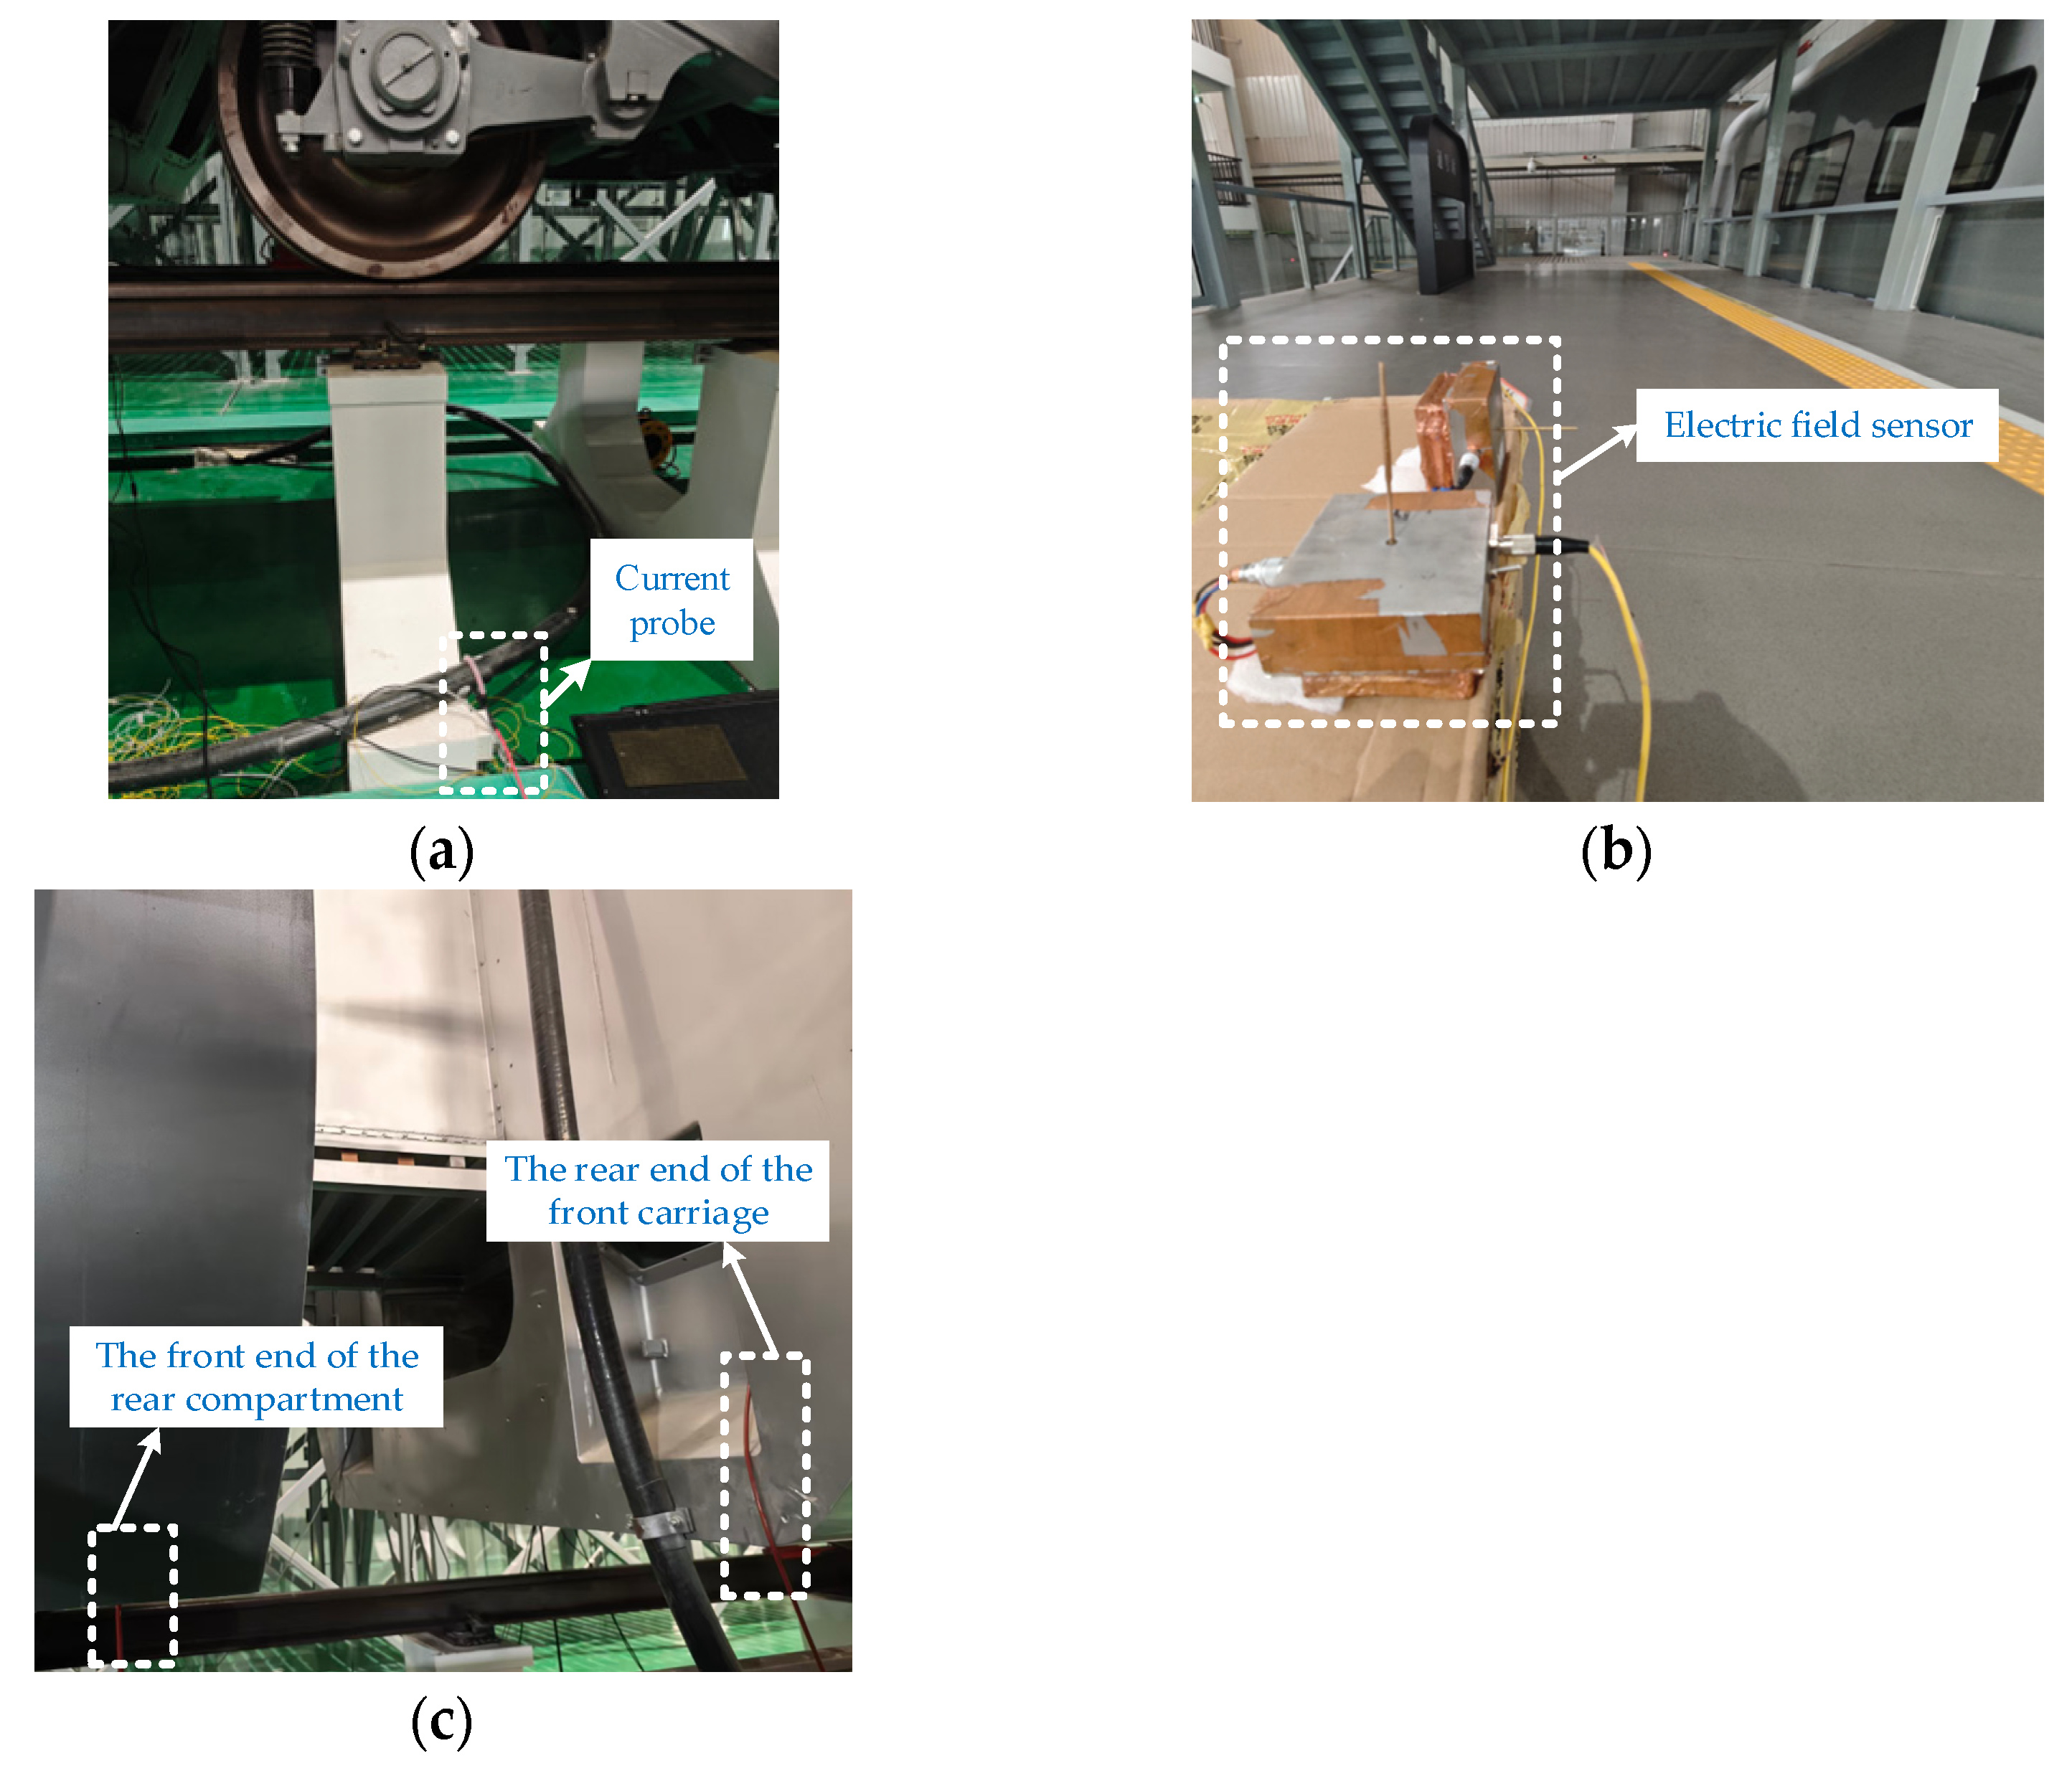
The measurement positions of each probe are shown in
Figure 2. Specifically, the current probe is placed on the connecting line at the load side of the pantograph. The electric field sensor is installed on the platform outside the train. The positive and negative terminals of the voltage differential probe are connected to the rear end of the front carriage and the front end of the rear carriage, respectively.
During the tests, the ambient temperature is 32.4 °C, and the relative humidity is 66.9%. To ensure the validity and reliability of the collected data, this study conducts no fewer than three valid repeated tests for each experimental condition. By verifying reproducibility to exclude random interference and fortuitous factors, this approach ensures data stability and the reliability of the conclusions, thereby guaranteeing that each data sample genuinely reflects typical arc electrical characteristics.
3. Experimental Results
All experimental data are processed and analyzed using MATLAB (R2022b). First, the raw measurement data are imported and filtered to remove noise. Subsequently, time-series data from current, electric field, and voltage sensors are synchronized. The waveforms, including both the time domain and frequency domain, are generated. These scripts enable efficient, reproducible processing of the experimental data and provide the basis for the quantitative analysis presented in subsequent sections.
3.1. Fixed Gap
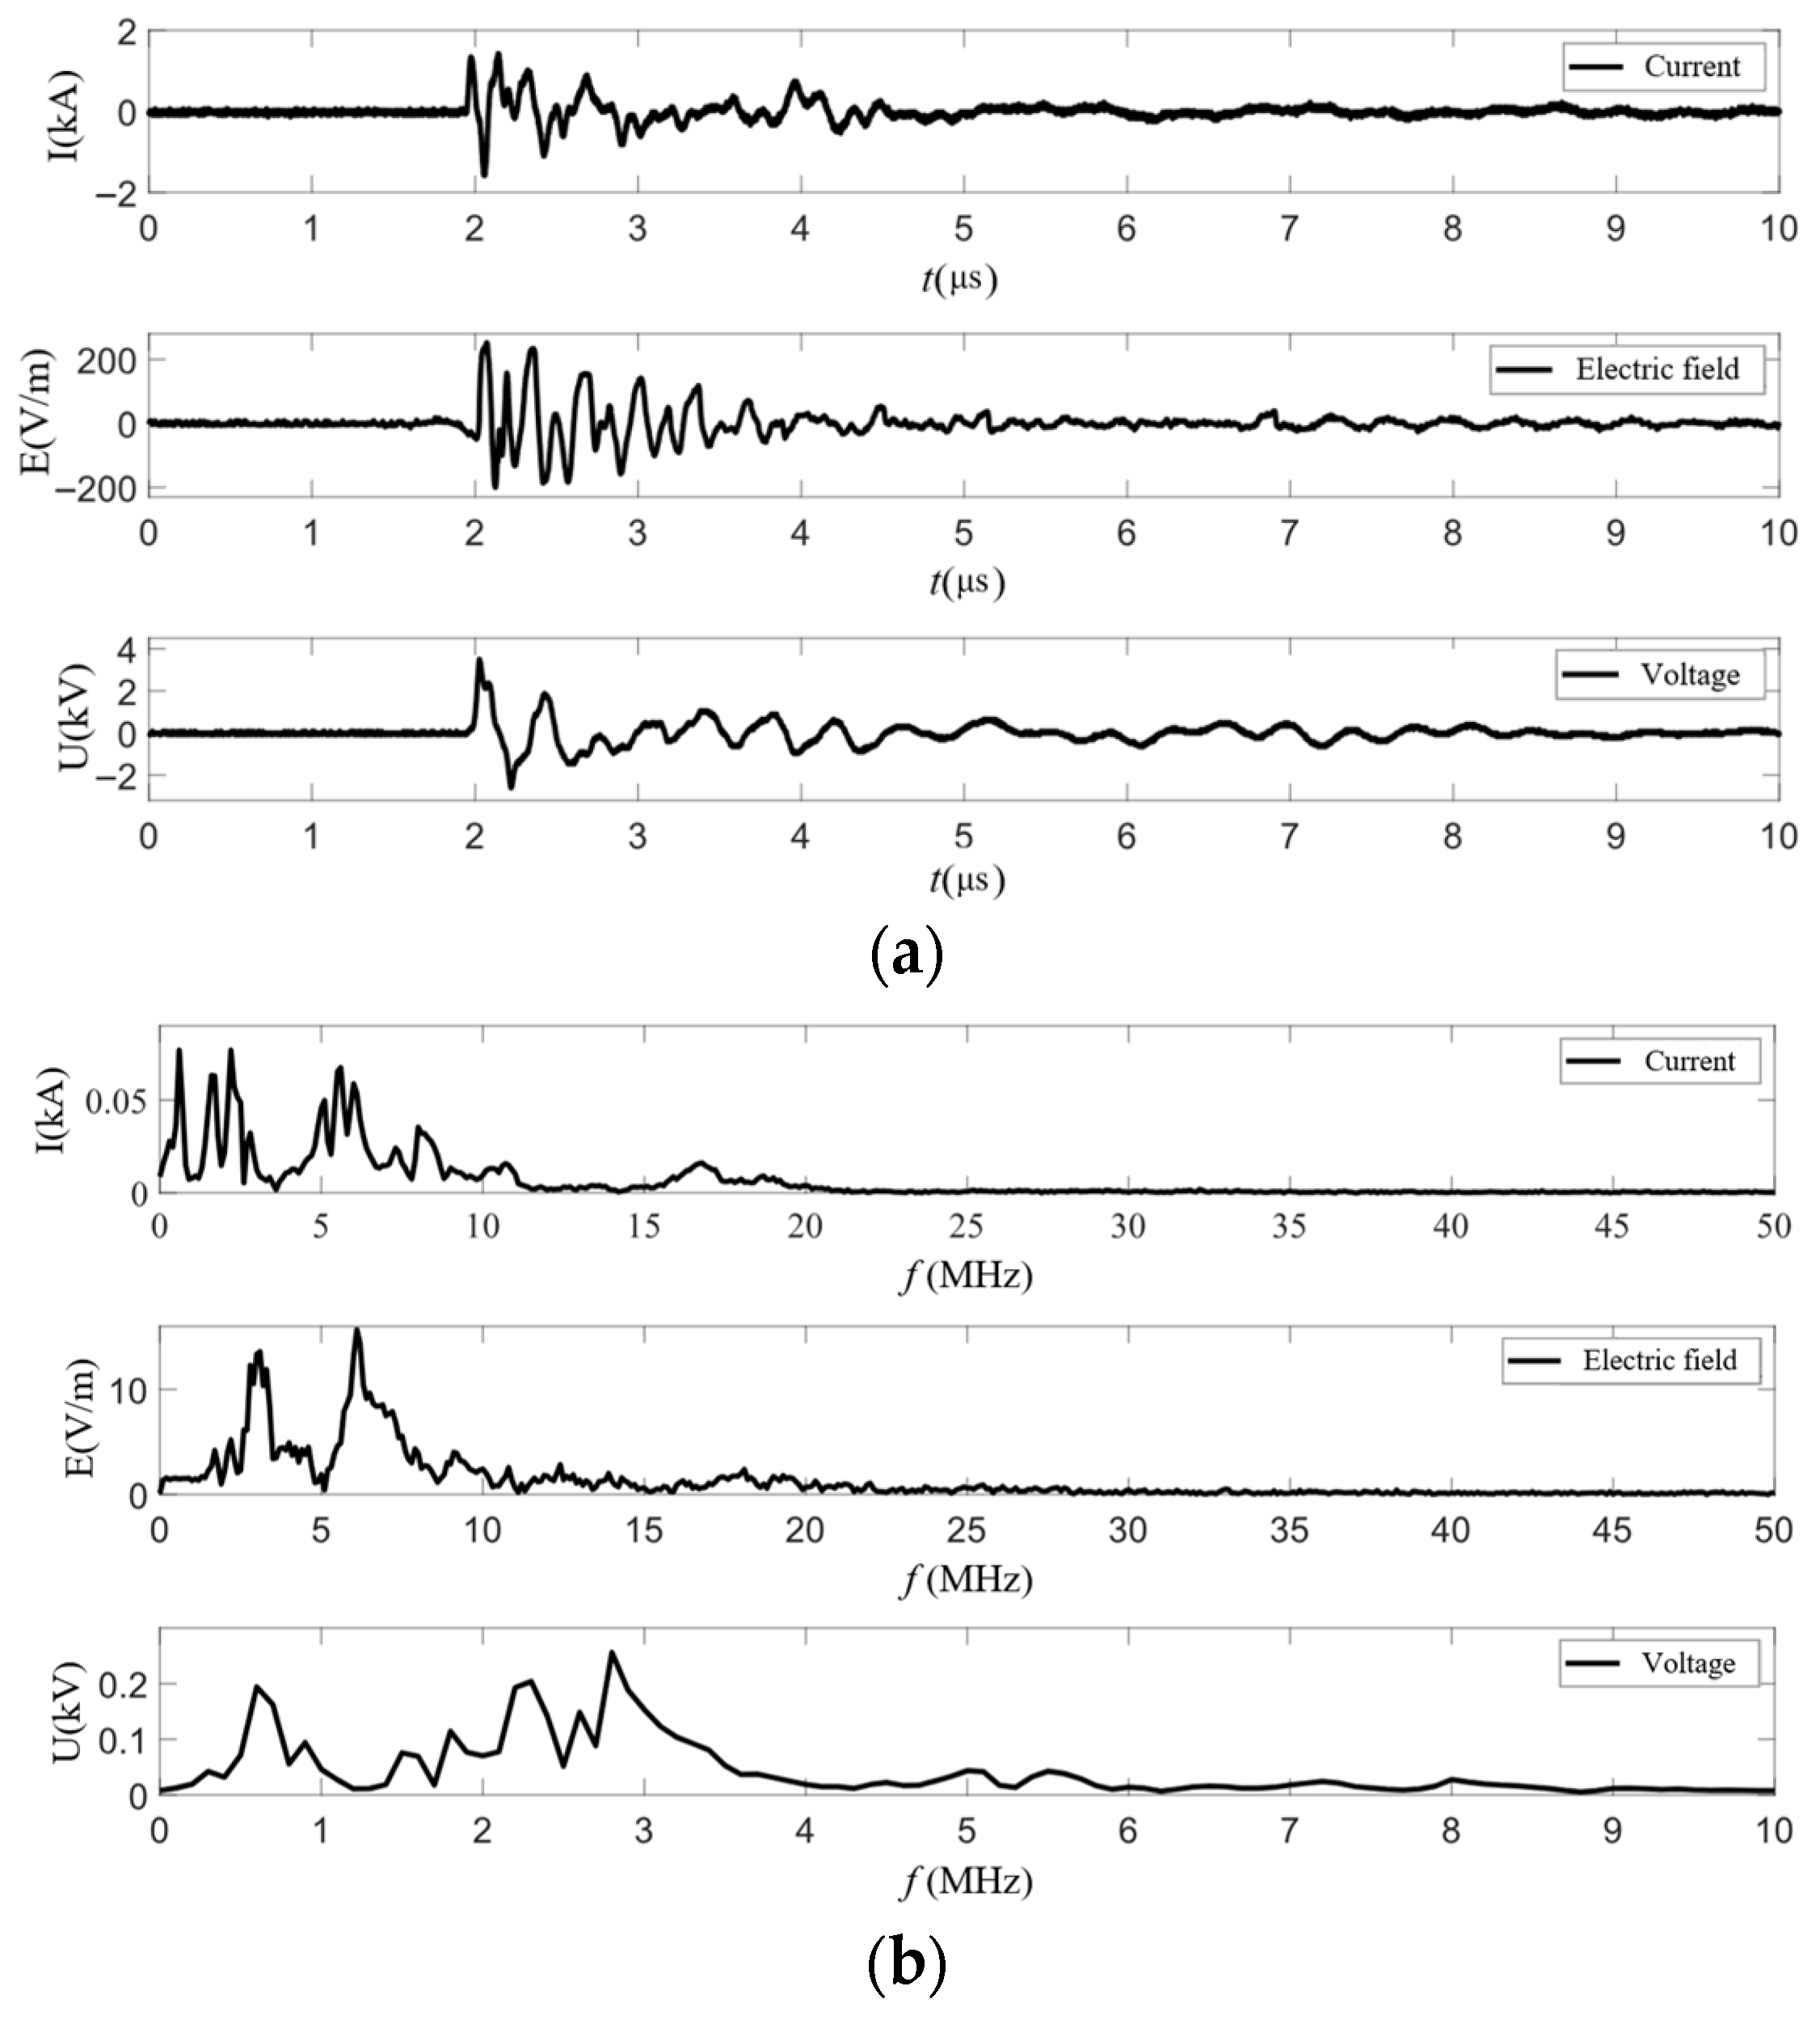
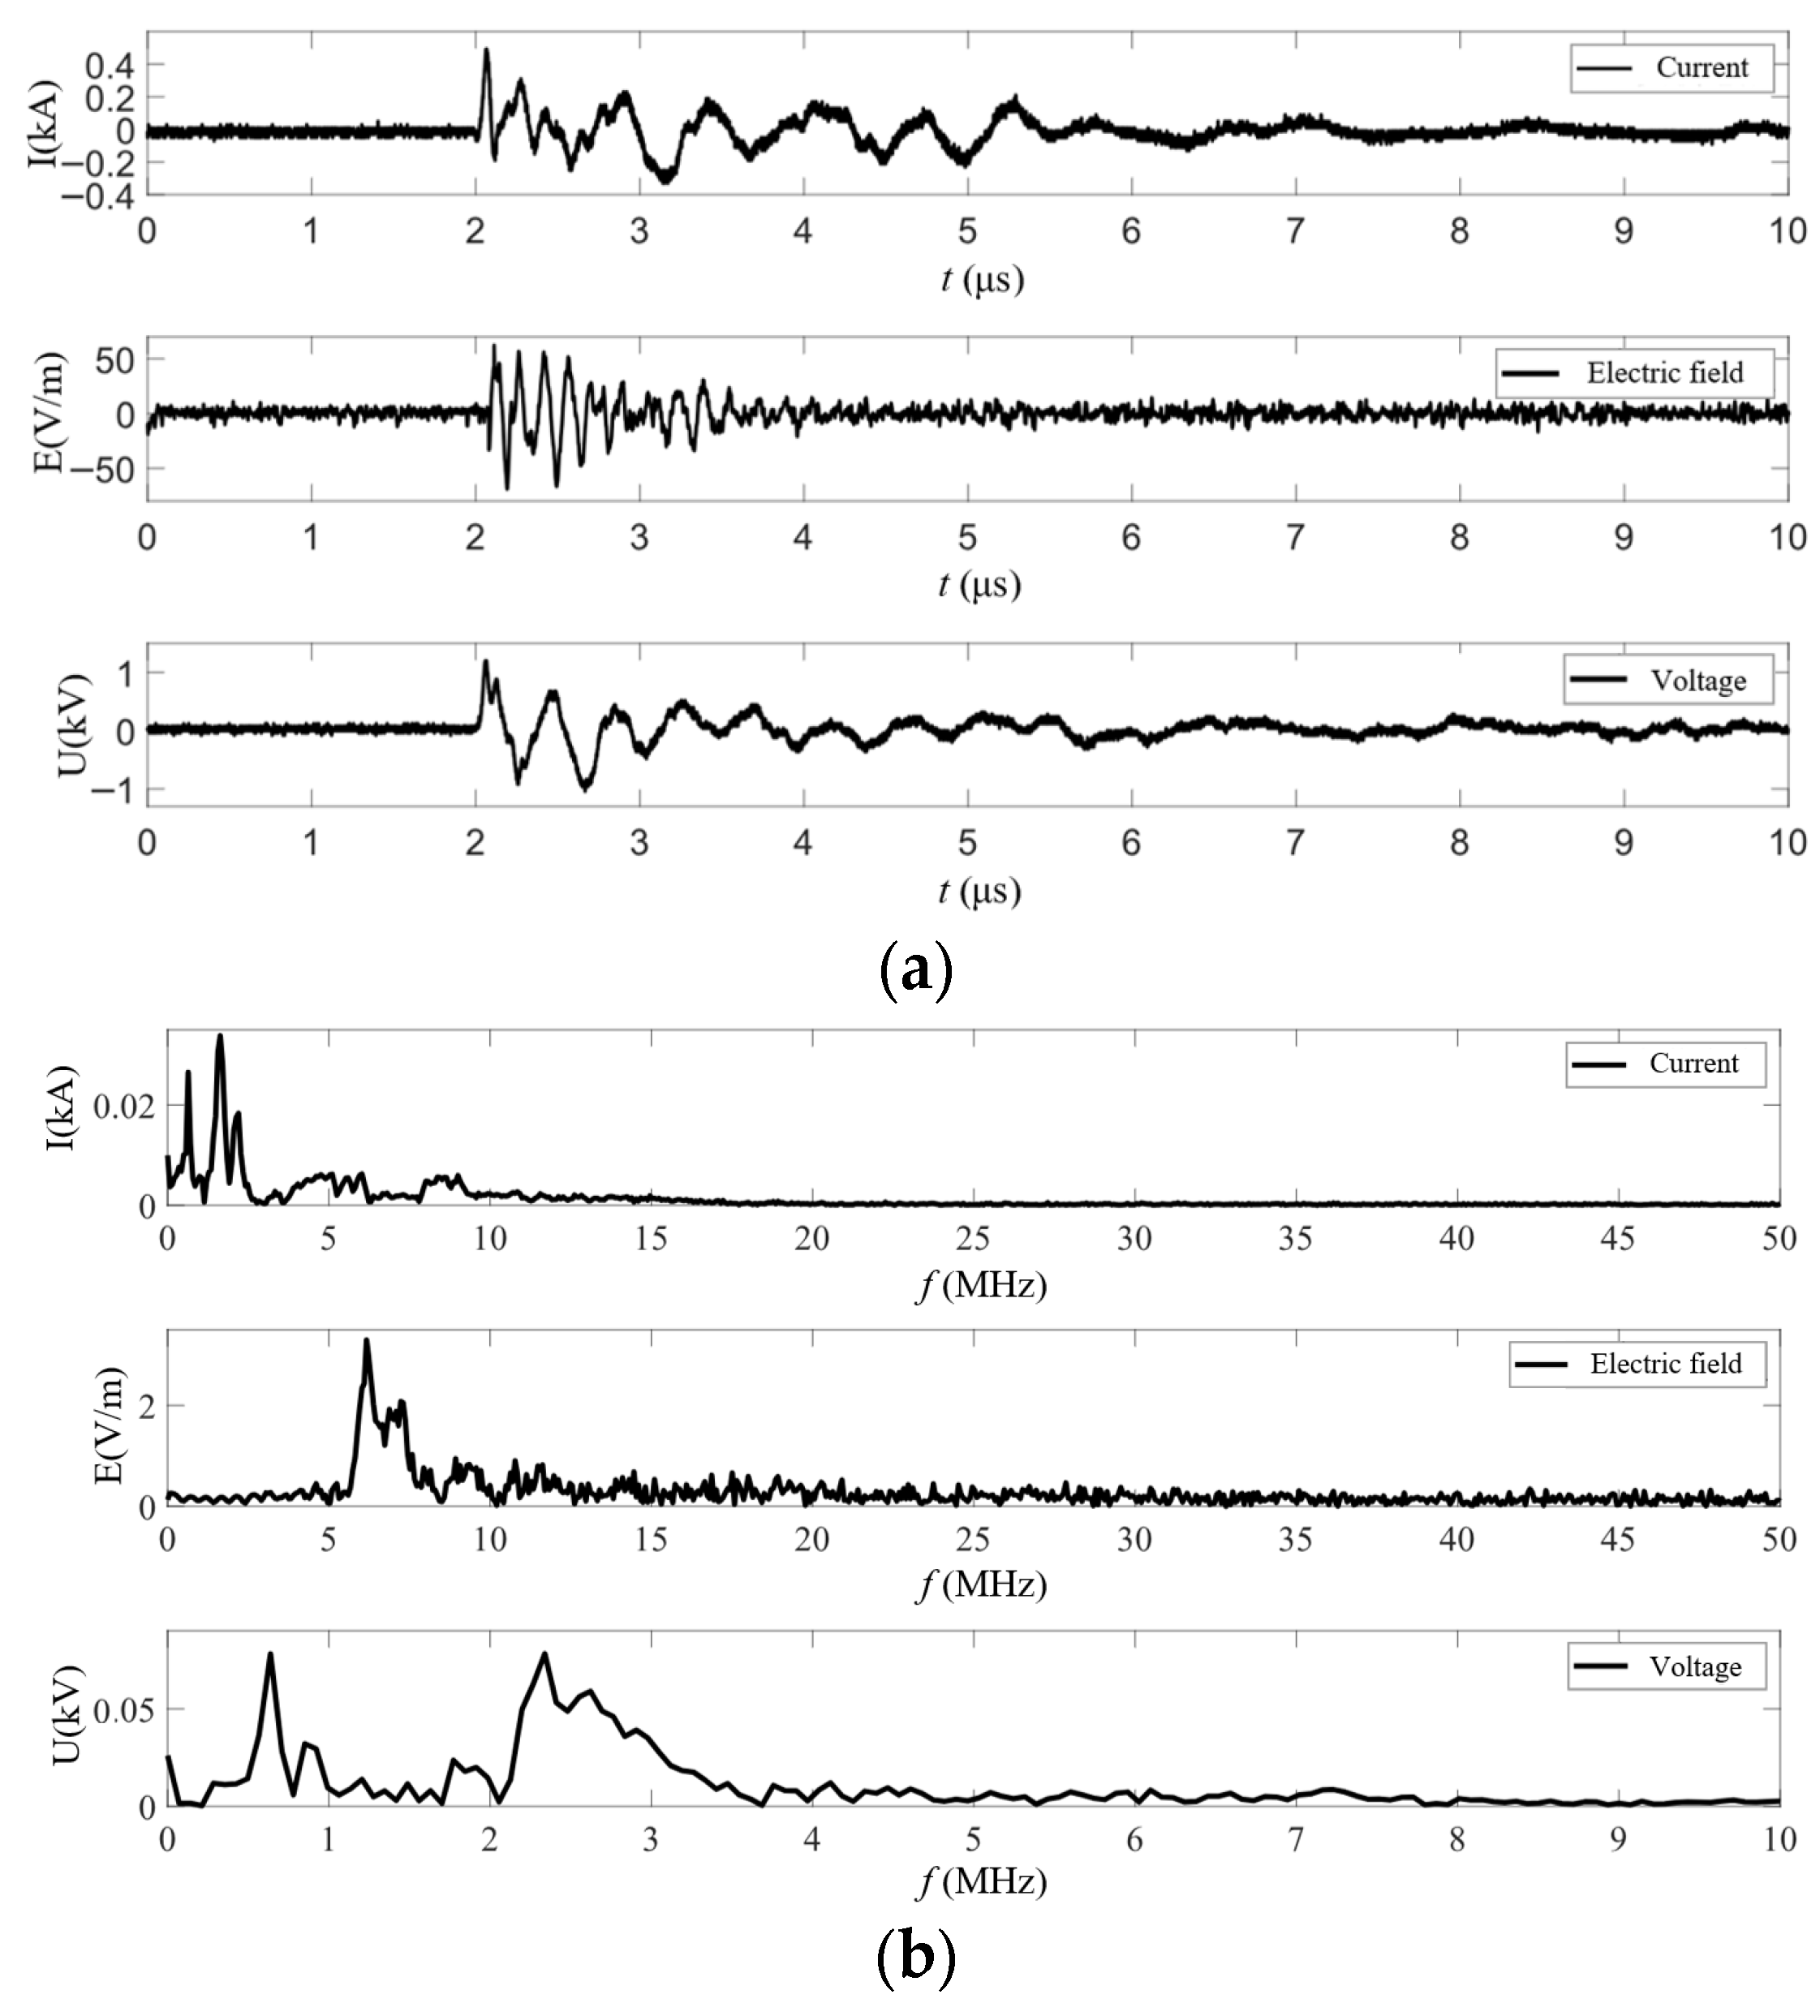
A fixed-gap distance is maintained between the contact wire and the pantograph. Upon energization, when the electric field strength in the pantograph–catenary gap exceeds the dielectric strength of air, the air in the gap is instantaneously broken down into plasma, forming a stable arc channel. Upon breakdown, the load current, the electric field on the platform outside the train, and the voltage between the two carriages exhibit a pattern of periodic damped oscillation with progressively decreasing amplitude, as shown in
Figure 3.
The oscillation duration is approximately 3 μs. The energy of the current and the electric field is primarily concentrated in the frequency band below 10 MHz, while the frequency spectrum range of the voltage between carriages is significantly narrower, with its effective energy confined to within 4 MHz. This is because the interference is conducted through the train body circuits, and the high-frequency components are attenuated during propagation due to obstruction by distributed inductance and shunting by distributed capacitance.
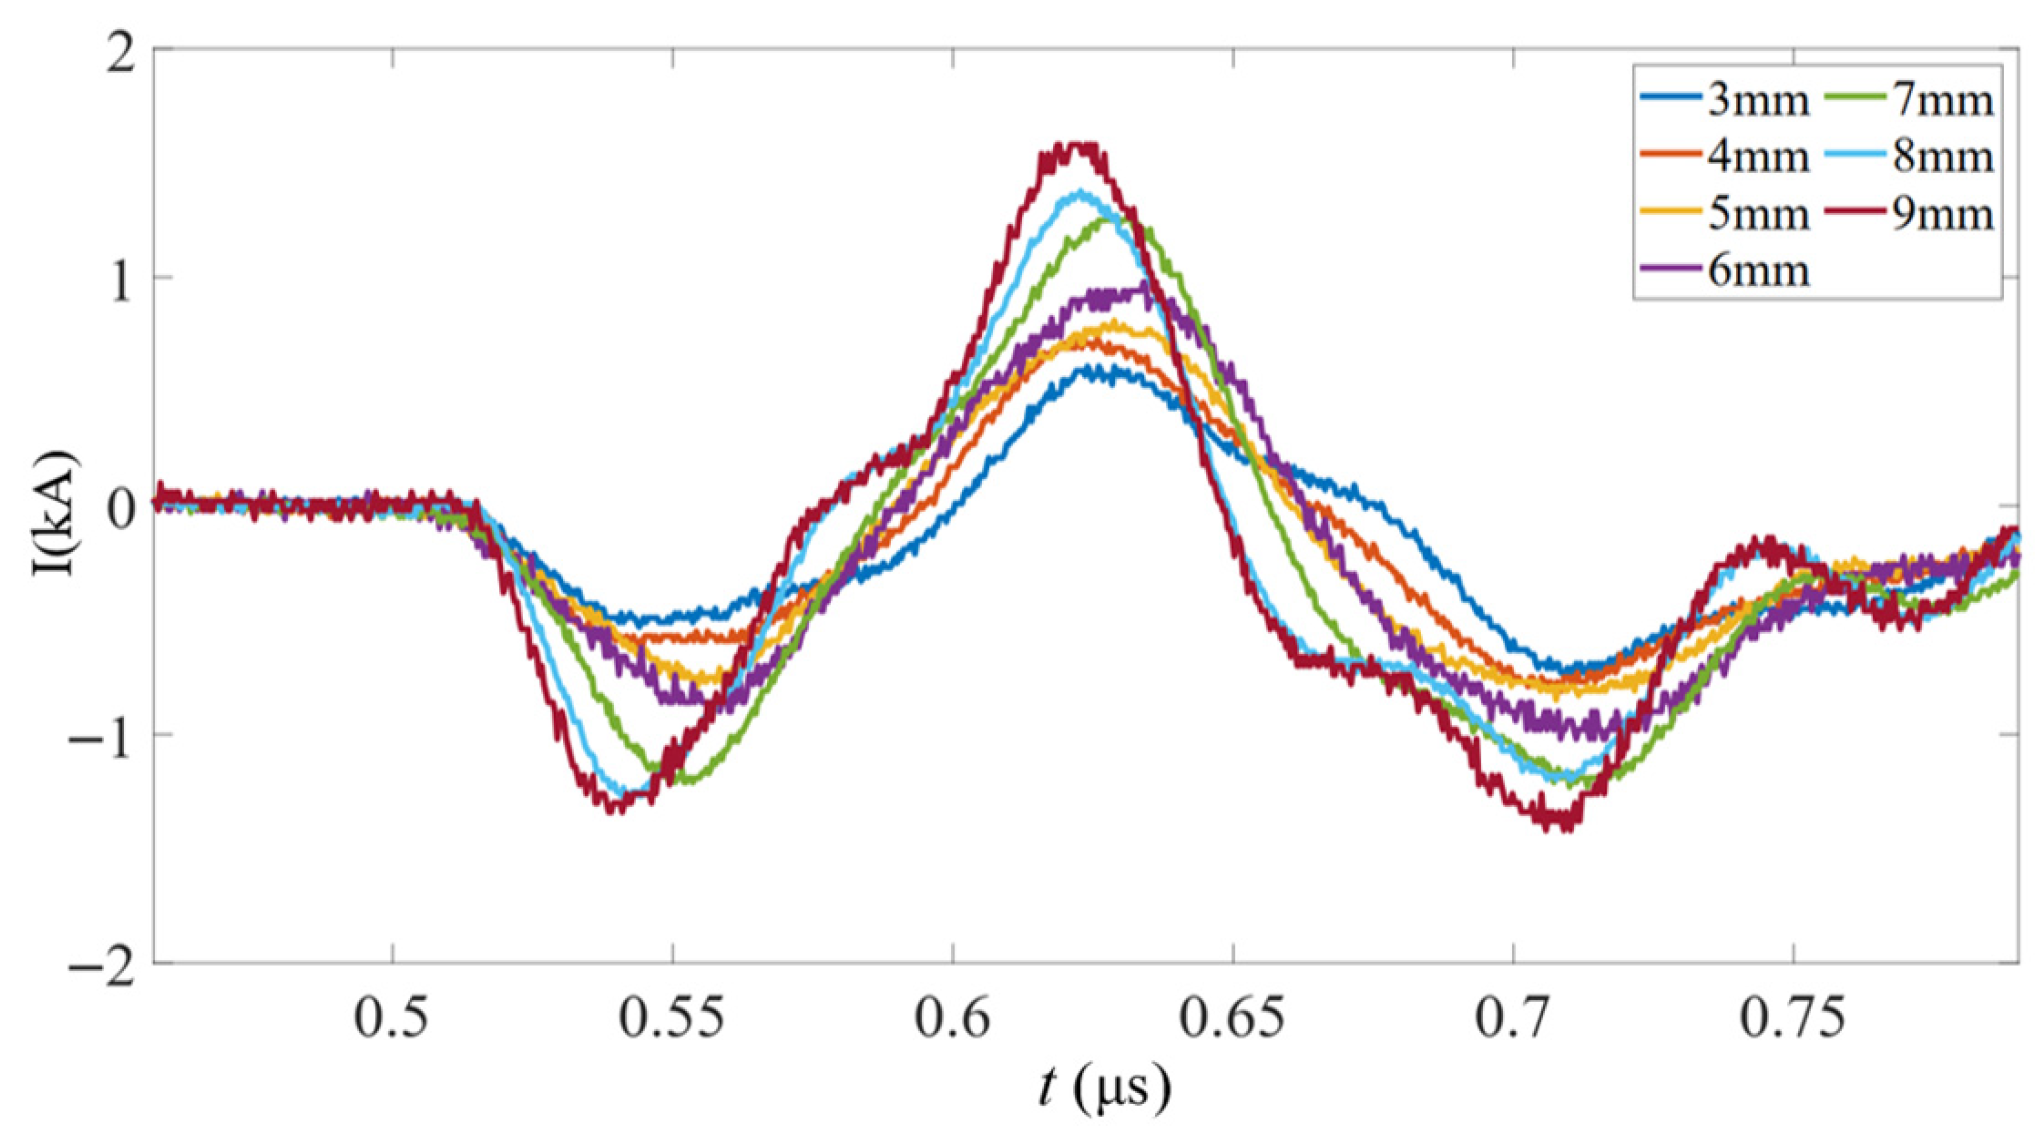
The variation characteristics of the current pulse under fixed-gap distances ranging from 3 mm to 9 mm, measured at 1 mm intervals, are shown in
Figure 4. As the pantograph–catenary gap increases, the current peak becomes higher, and the rise time becomes shorter. This phenomenon originates from the proportional relationship between breakdown voltage
Ub and air pressure
p, gap distance
d described by Paschen’s Law [
28]:
Paschen’s Law is derived under the assumption of constant gas temperature and uniform electric field conditions. It is strictly valid for air under standard temperature and pressure, within a moderate range of the product of pressure and gap distance (pd). In this study, the gap distances are 3–9 mm. The corresponding pd values are significantly greater than the minimum pd value for air. It falls well within the valid regime where Paschen’s Law provides a reasonable approximation. A larger gap implies that a higher voltage is established between the electrodes before breakdown occurs; consequently, more electrical energy is stored.
As shown in
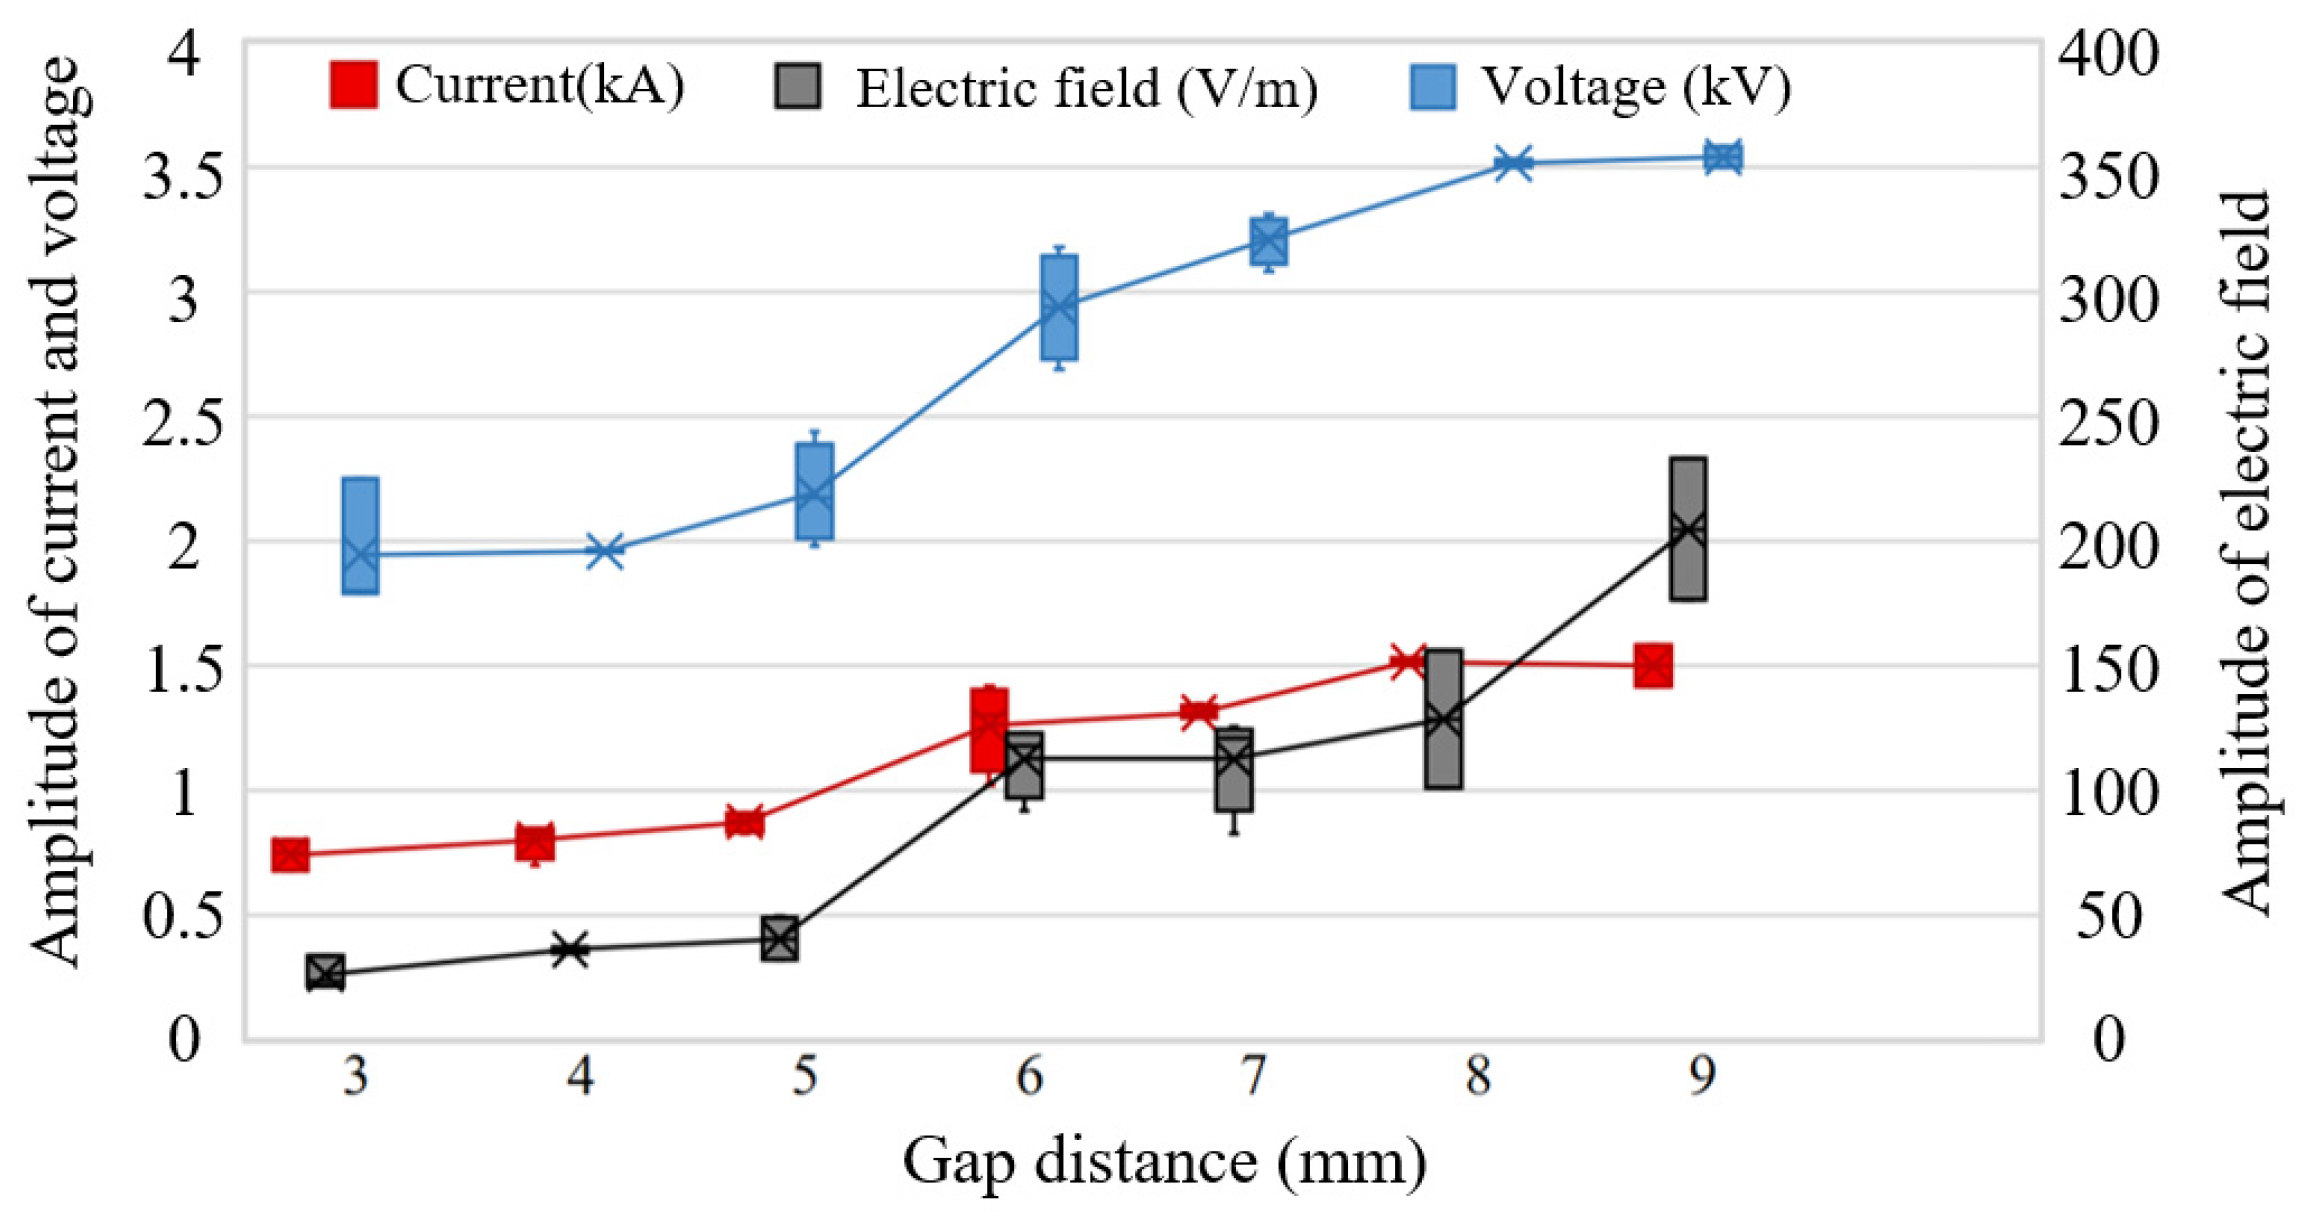
Figure 5, the peak values of the load current, the electric field outside the train, and the voltage between carriages all increase with the gap distance, exhibiting a clear positive correlation. This phenomenon can be attributed to the systematic influence of the gap distance on the discharge energy and the transient process.
No fewer than three repeated tests are performed under each condition, and their mean values and standard deviations are presented in
Table 4. Under the fixed-gap condition, the peak arc current, peak electric field, and peak voltage all exhibit strong linear relationships with gap distance, with coefficients of determination
R2 = 0.94, 0.91, and 0.93, respectively. These linear trends indicate that the stored electrical energy prior to breakdown increases proportionally with electrode separation, while the radiated electromagnetic interference intensity and conducted overvoltage also rise linearly with gap distance.
The specific mechanism is as follows: An increase in the gap distance leads to a higher breakdown voltage, which in turn enhances the intensity of the arc discharge. This not only results in a higher rate of current change but also excites a transient overvoltage with a larger amplitude at the pantograph. Since the radiated field strength is proportional to the rate of current change, the peak value of the electric field outside the train increases synchronously with the gap distance. On the other hand, this transient overvoltage propagates along the rooftop circuits of the train. When the voltage travels to the connection point between the two carriages, it forms a voltage division between the stray capacitance to ground of the front carriage, C1, and the stray capacitance to ground of the rear carriage, C2. Since C1 and C2 are typically very small, exhibiting high impedance characteristics, the transient overvoltage is primarily applied across them. Therefore, the measured peak voltage between carriages is essentially the voltage division response of this overvoltage across the coupling impedance. As the gap increases, the amplitude of the original overvoltage at the pantograph rises, and consequently, all coupled voltages generated along its entire propagation path, including the voltage between carriages, increase accordingly.
Experimental results indicate that the gap distance is a key parameter influencing the transient characteristics of pantograph–catenary discharge. An increase in the pantograph–catenary gap directly leads to more severe spatial radiation and conducted electromagnetic interference along the train body by elevating the discharge energy. Therefore, it is advisable to avoid, as much as possible, situations where the pantograph becomes stuck, forming a fixed gap with the contact wire. In the design of pneumatic or spring systems, mechanical redundancy or emergency lowering and raising devices should be incorporated. When the main system fails, a backup mechanism can be activated to ensure the pantograph returns to its normal operating position or lowers safely. When the gap distance is 6 mm or more, the voltage difference at the connection point between the two carriages can even exceed 3 kV. This overvoltage level poses a serious threat to the insulation safety and normal operation of onboard low-voltage equipment, such as signaling, communication, and control units, presenting a significant risk of equipment breakdown or performance malfunction [
29]. Protective measures against this can be implemented by strengthening equipotential bonding, optimizing the electromagnetic shielding capability of critical signal cables and sensitive electronic equipment enclosures, and installing surge protection devices at circuit ports.
3.2. Pantograph Raising
The contact wire is kept stationary, and the pantograph is driven by the motor to rise until it contacts the contact wire. As the distance between the pantograph and the catenary wire decreases, an arc is generated by the instantaneous breakdown of the air gap when the electric field strength exceeds the insulation withstand limit of the air medium.
The waveform at the moment of breakdown is shown in
Figure 6, exhibiting a pattern of periodic damped oscillation with progressively decreasing amplitude. The oscillation duration is approximately 4 µs. The energy of the current is primarily concentrated in the frequency band below 10 MHz, the electric field energy is mainly distributed in the 5–10 MHz range, and the voltage energy is distributed below 4 MHz.
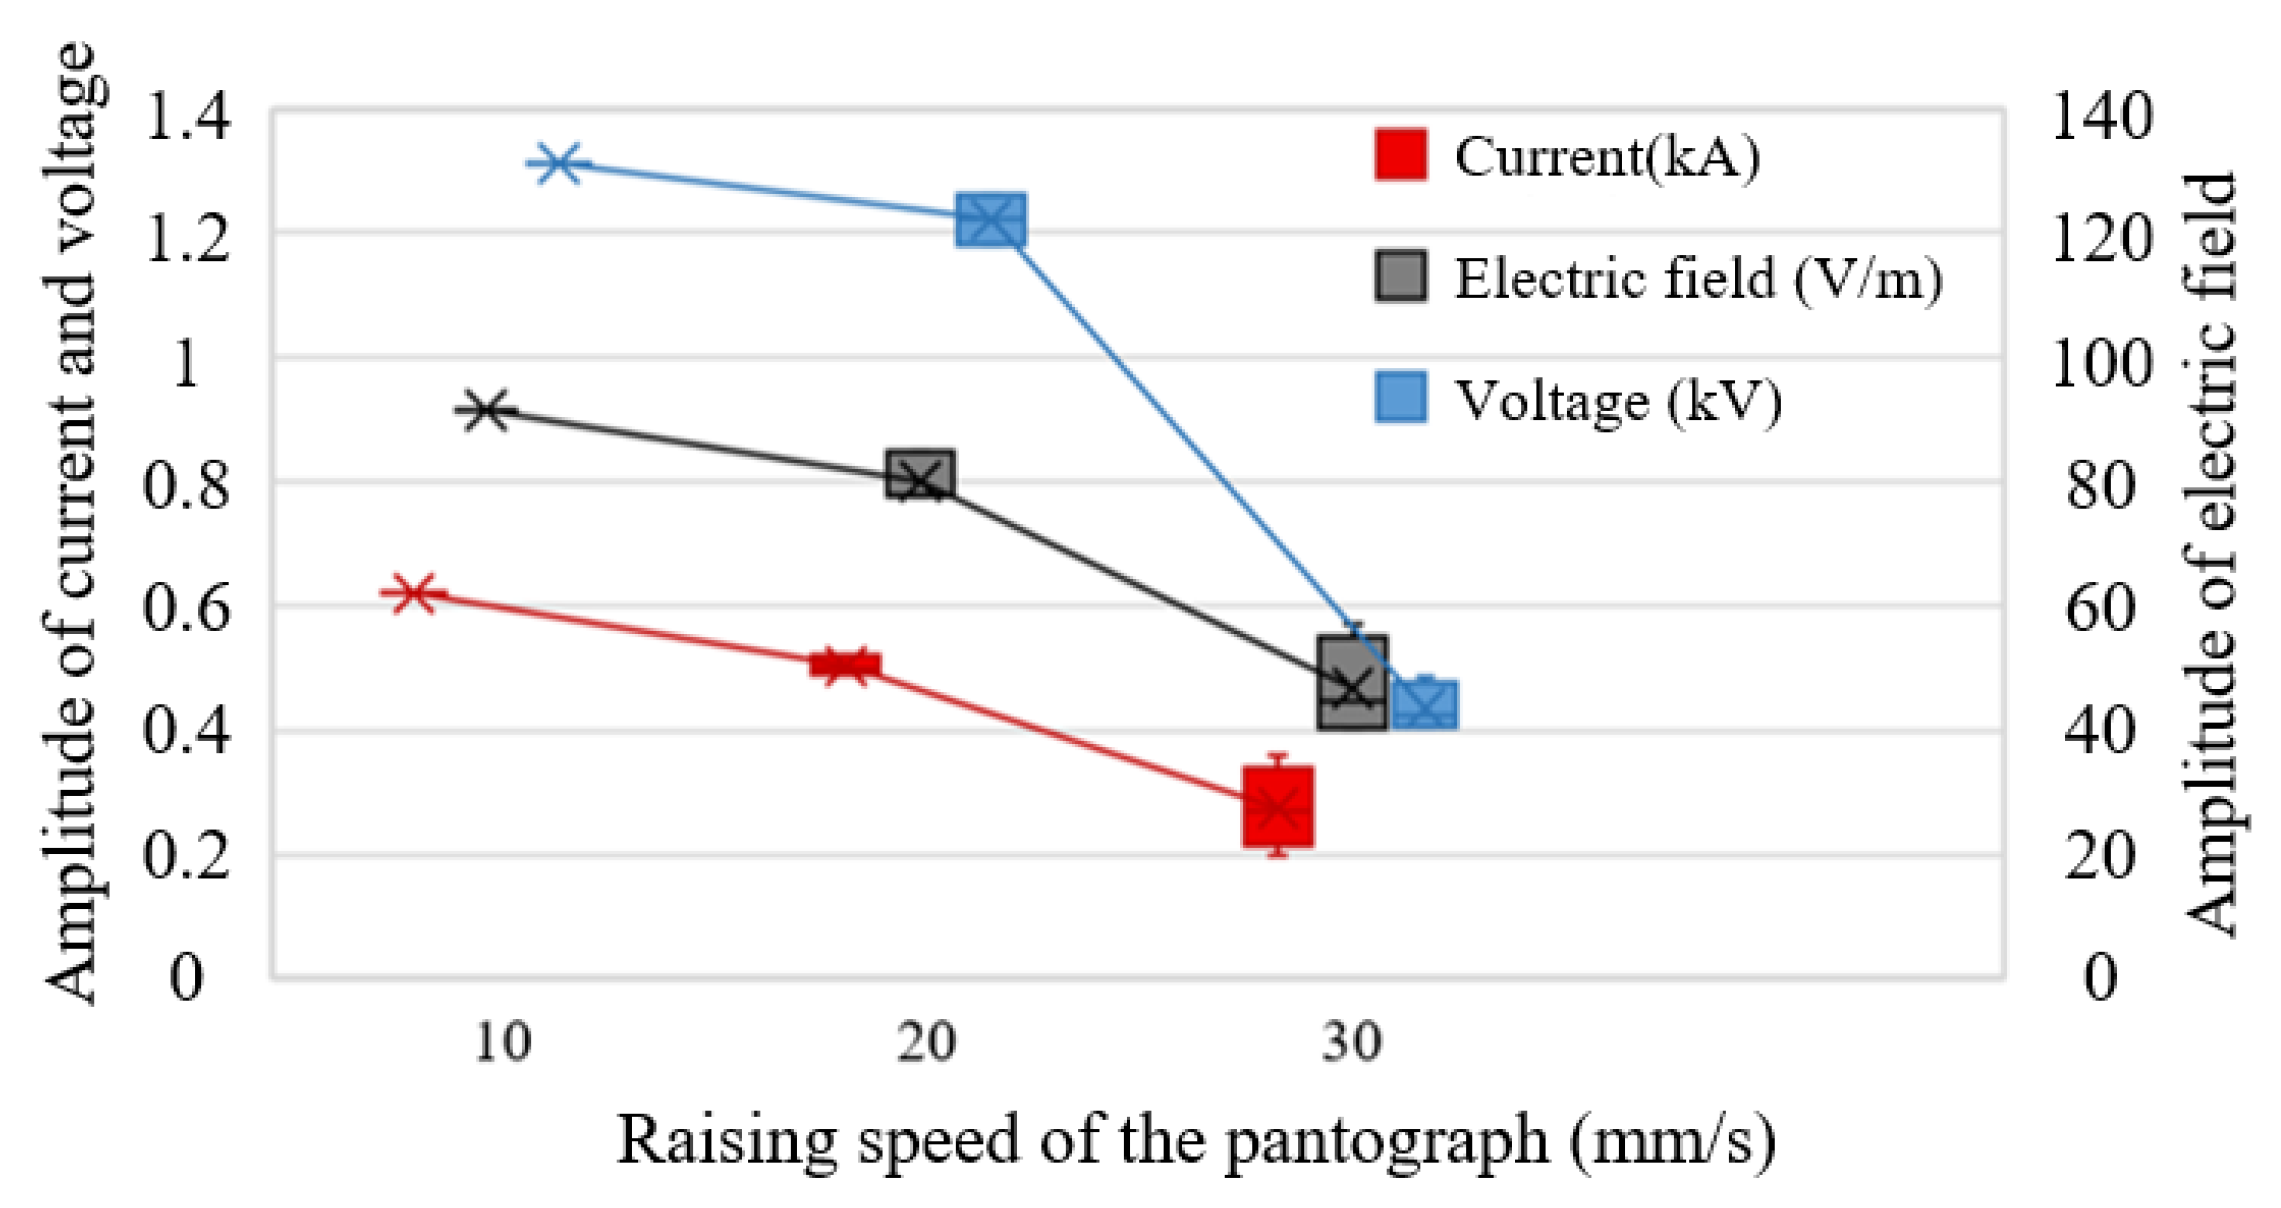
The initial distance between the pantograph and catenary is maintained at 22 mm. As the pantograph raising speed increases, the peak values of the load current, the electric field outside the train, and the voltage between carriages all decrease significantly. The variation trends are presented in
Figure 7. When the pantograph raising speed is 10 mm/s, breakdown occurs at a contact wire voltage phase of approximately 77.47°, with an instantaneous contact wire voltage of 23.67 kV. When the pantograph raising speed is 20 mm/s, the breakdown phase is approximately 63.64°, with an instantaneous voltage of 19.44 kV. When the pantograph raising speed is 30 mm/s, the phase at which breakdown occurs is approximately 40.86°, and the instantaneous voltage is 12.48 kV. Since the breakdown voltage of the air gap is proportional to the gap distance, within a certain range, as the raising speed increases, the gap distance decreases more rapidly, resulting in a lower instantaneous contact wire voltage at the moment of breakdown. Consequently, breakdown occurs at a lower voltage, leading to a reduction in the peak current, as well as decreases in the peak values of the electric field outside the train and the voltage between carriages.
No fewer than three repeated tests are performed under each condition, and their mean values and standard deviations are presented in
Table 5. Under the pantograph raising condition, the peak arc current, peak electric field, and peak voltage all exhibit strong linear relationships with the raising speed of the pantograph, with coefficients of determination
R2 = 0.98, 0.96, and 0.85, respectively. These linear trends indicate that as the rising speed increases, the transient electromagnetic interference and conducted overvoltage decrease significantly. This negative correlation arises because a higher raising speed causes the gap distance to diminish more rapidly, resulting in breakdown occurring at a lower instantaneous contact wire voltage and thus a smaller release of stored electrical energy.
Unlike the fixed-gap condition, the timing of breakdown during pantograph raising is not determined by a fixed voltage threshold. Instead, it depends on the ratio of the instantaneous voltage to the instantaneous gap distance. Breakdown may occur either near the peak of the power supply voltage or at a moment when the voltage is low, but the gap has already become sufficiently small. When the pantograph raising process takes less than one quarter of the cycle during which the contact wire voltage rises from zero to its first peak, increasing the raising speed significantly reduces the electromagnetic interference and conducted interference caused by the breakdown. Therefore, selecting an appropriate pantograph raising speed based on the phase of the contact wire is favorable for reducing the electrical stress during system closing.
3.3. Pantograph Lowering
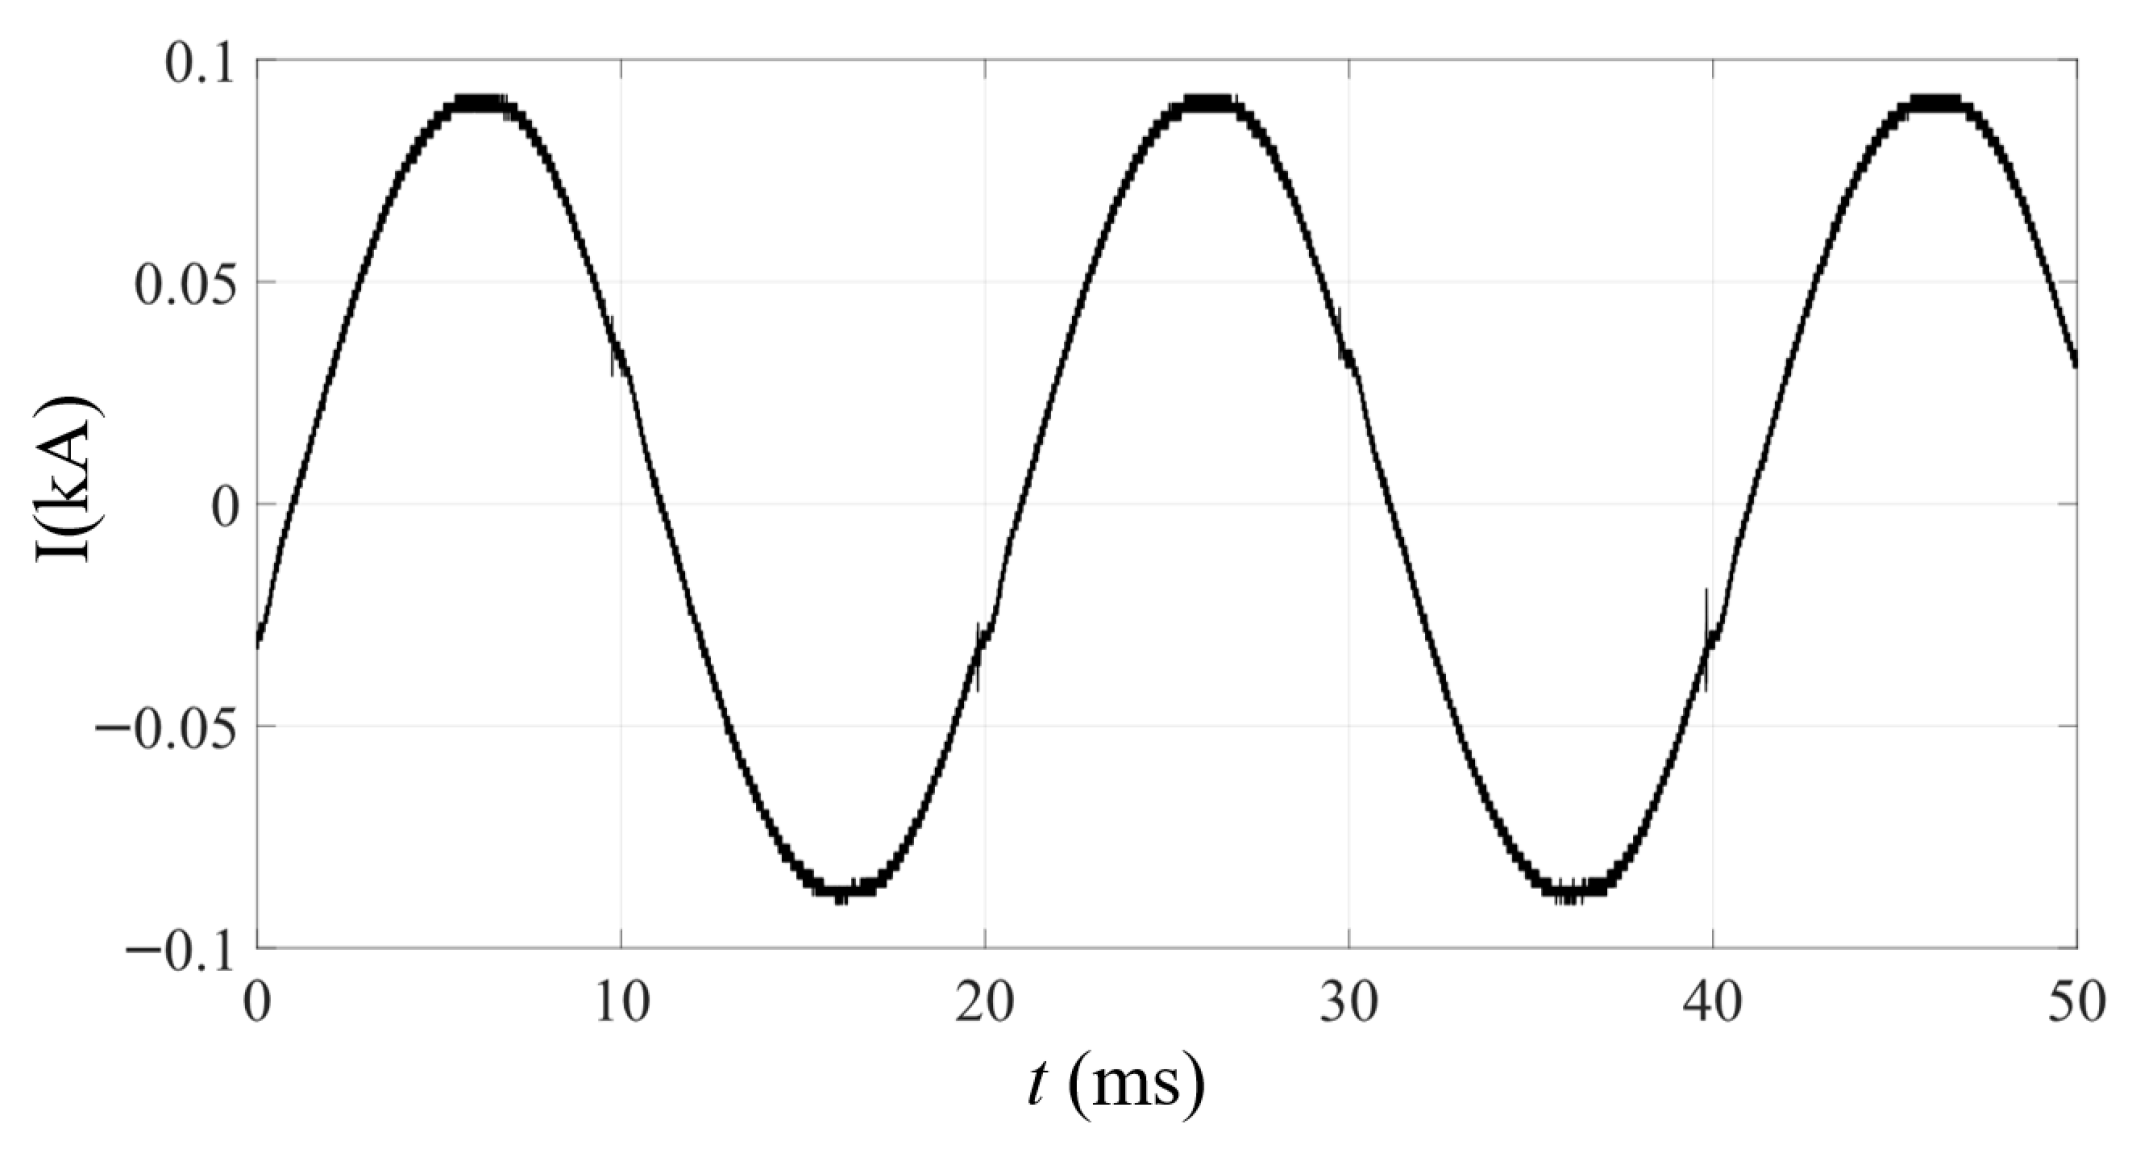
The contact wire is kept stationary. In the initial state, the pantograph maintains stable contact with the contact wire. Subsequently, the pantograph is driven by the motor to lower until it separates from the contact wire. At this moment, the load current still exhibits the power frequency characteristics shown in
Figure 8. This is because, at the moment the pantograph actively separates from the catenary under loaded conditions, the distance between the contacts is extremely small while the voltage is very high. The air in the gap is ionized by electrons generated through field emission and thermionic emission, forming an arc. The arc maintains the original sinusoidal conduction state of the load current.
Near the zero-crossing point of the power frequency, the experimental waveform after removing the fundamental frequency is shown in
Figure 9. The current is very low, and effectively no measurable waveform is detected for the electric field. The total duration of the current and voltage oscillations is approximately 25 μs, with the duration of a single oscillation being about 1 μs. The energy of the current is primarily concentrated in the frequency band below 10 MHz, and the voltage energy is distributed below 4 MHz.
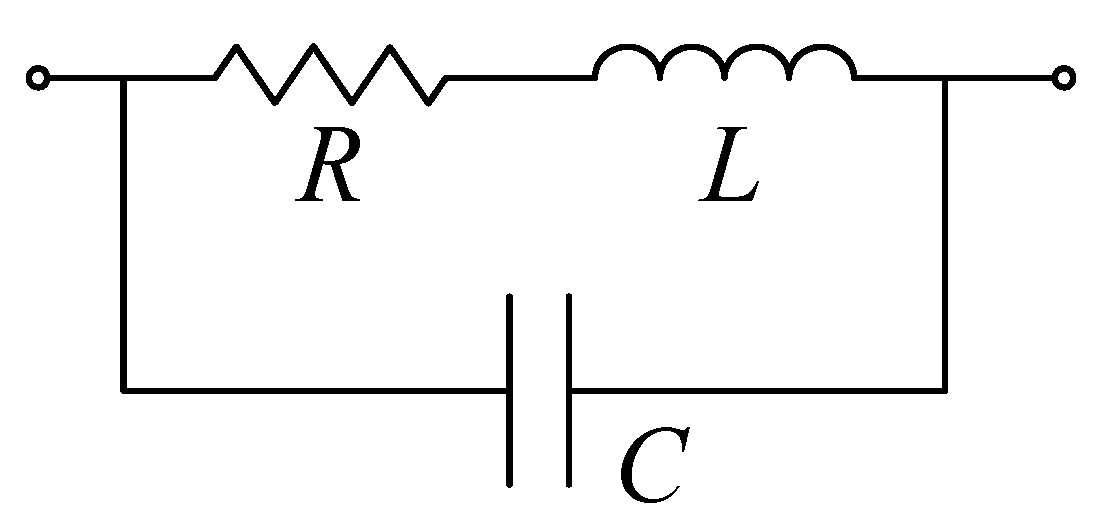
At the current zero-crossing, the small current reduces the energy input to the arc, leading to a decrease in arc temperature and a consequent reduction in the degree of ionization of the plasma. At this point, the dielectric recovery strength of the arc gap begins to rise rapidly, and the arc resistance increases instantaneously. Due to the presence of parasitic inductance in the circuit, the abrupt change in current induces a very high reverse induced electromotive force across the inductor. This high-voltage spike is applied across the arc gap, charging the parasitic capacitance. The parasitic capacitance then discharges through the parasitic inductance and the equivalent resistance of the arc at that moment, forming a typical RLC damped oscillation circuit as shown in
Figure 10.
When a breakdown occurs, the arc resistance drops sharply from a high-resistance state to a low-resistance state, inducing a transient response in the circuit. The circuit equation is as follows:
where
L is the total inductance of the circuit,
R is the total resistance of the circuit,
C is the total stray capacitance of the circuit,
Um is the peak voltage of the catenary,
ω is the angular frequency of the catenary, and
ϕ is the phase angle of the catenary voltage at the moment of breakdown.
Differentiating the above equation yields a second-order differential equation:
Under the fixed-gap condition, there is an initial gap between the pantograph and the catenary, indicating that no physical contact occurs prior to breakdown, and the initial load current is zero. For a circuit in an underdamped state, the load current exhibits a periodically damped oscillation with gradually decreasing amplitude. The solution for the current is given by:
where the damping coefficient is
α =
R/(2
L), and the damped oscillation angular frequency is
.
Furthermore, as observed in
Figure 9a, during the pantograph-lowering process, as the gap distance increases, the peak value of the high-frequency oscillation at the zero-crossing point first increases and then decreases, indicating the existence of a critical gap that produces the strongest oscillation. Within a smaller gap range, the increase in peak value with distance is primarily attributed to the enhanced excitation energy playing a dominant role. Specifically, the increase in gap distance leads to a higher breakdown voltage, thereby increasing the total energy injected into the circuit. This generates a stronger initial current pulse and excites higher oscillation peaks. At this stage, the arc is relatively stable with low resistance, thus having a limited damping effect on the circuit. However, when the gap distance exceeds a certain critical value, the oscillation peak begins to decrease. This is because the arc, being excessively elongated, becomes slender and unstable, resulting in a sharp increase in its resistance and a significantly enhanced cooling effect. In the RLC oscillation circuit, this high resistance becomes the dominant damping source. Although the breakdown energy remains substantial, the oscillation energy is rapidly dissipated by the resistance during its buildup, being converted into heat and radiation. This causes the current amplitude to decay before reaching a higher level. Therefore, under larger gap conditions, the suppressing effect of circuit damping supersedes the excitation energy as the dominant mechanism, ultimately leading to a decrease in the oscillation peak.
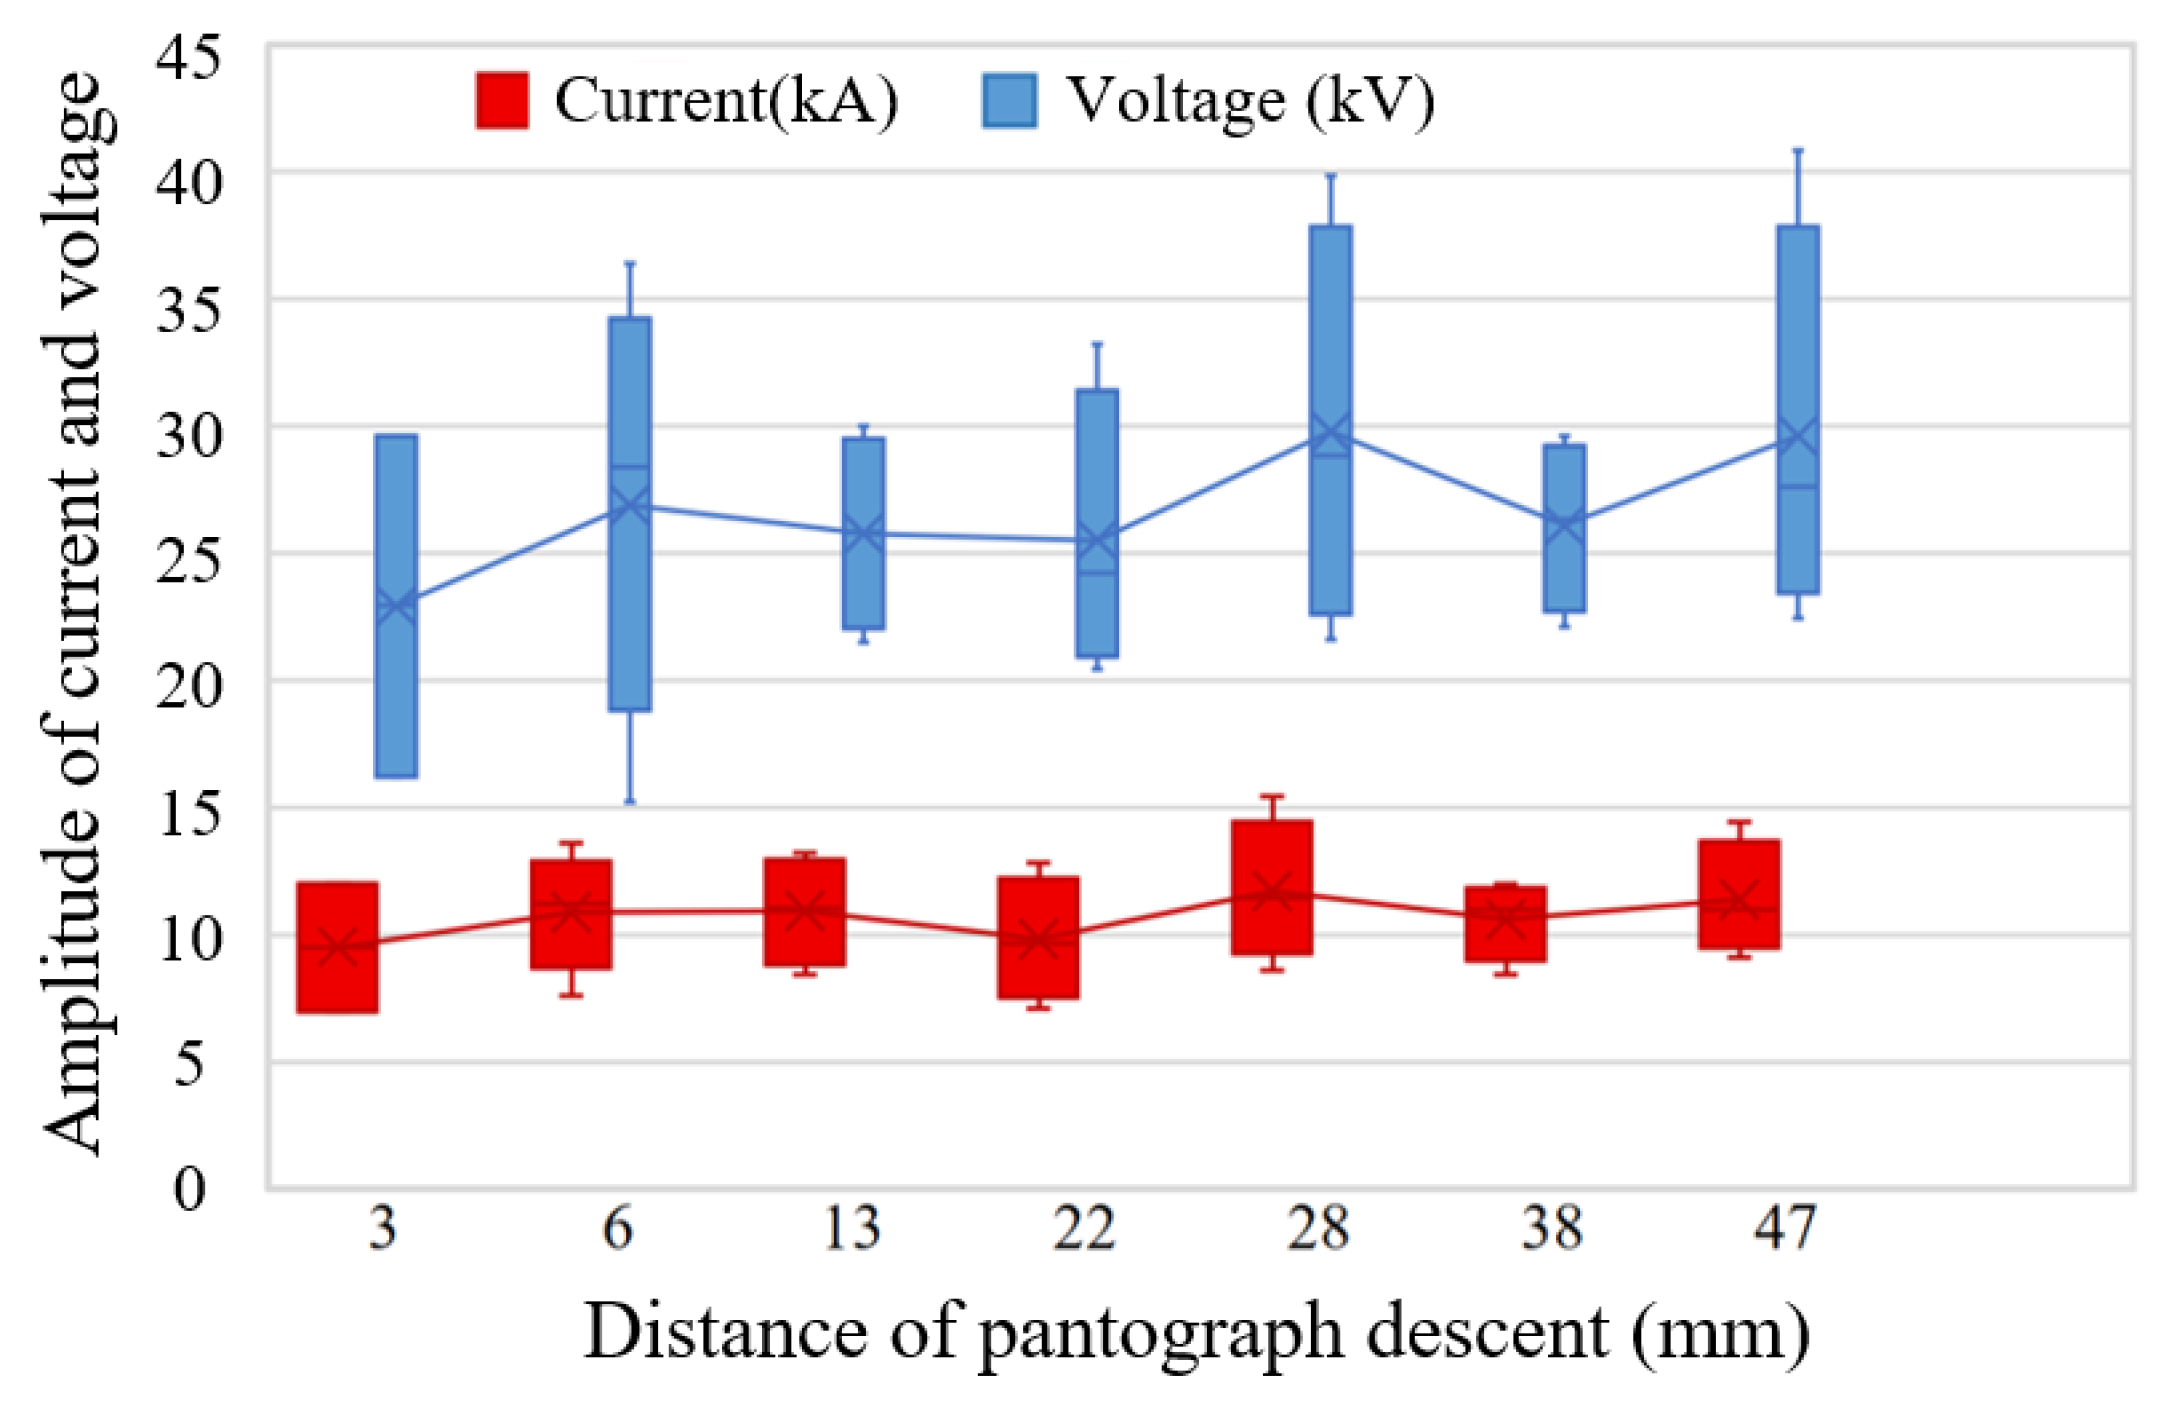
The final lowering distance of the pantograph is varied by adjusting the step count of the stepper motor. At the same moment, the peak value of the high-frequency oscillation near the power frequency zero-crossing does not show a significant correlation with the final lowering distance of the pantograph. The variation trend is presented in
Figure 11. No fewer than three repeated tests are performed under each condition, and their mean values and standard deviations are presented in
Table 6.
Compared to the pantograph raising and fixed-gap conditions, the transient effects induced by pantograph lowering are significantly reduced. During pantograph-lowering, high-frequency oscillations composed of multiple periodic damped oscillations with progressively decreasing amplitudes are generated near the power frequency zero-crossing point. The total duration of these oscillations shortens as the lowering distance increases. In a single high-frequency oscillation, the peak value of the damped oscillation exhibits a trend of first increasing and then decreasing as the distance increases. This reflects the dynamic competitive relationship between the dielectric recovery strength and the voltage recovery strength of the arc gap during the elongation process. This phenomenon can provide a reference for the application and modification of the current zero-crossing arc extinction theory [
30] in the context of a dynamic variable gap scenario such as the pantograph–catenary system.
3.4. Pantograph–Catenary Offline Vibration
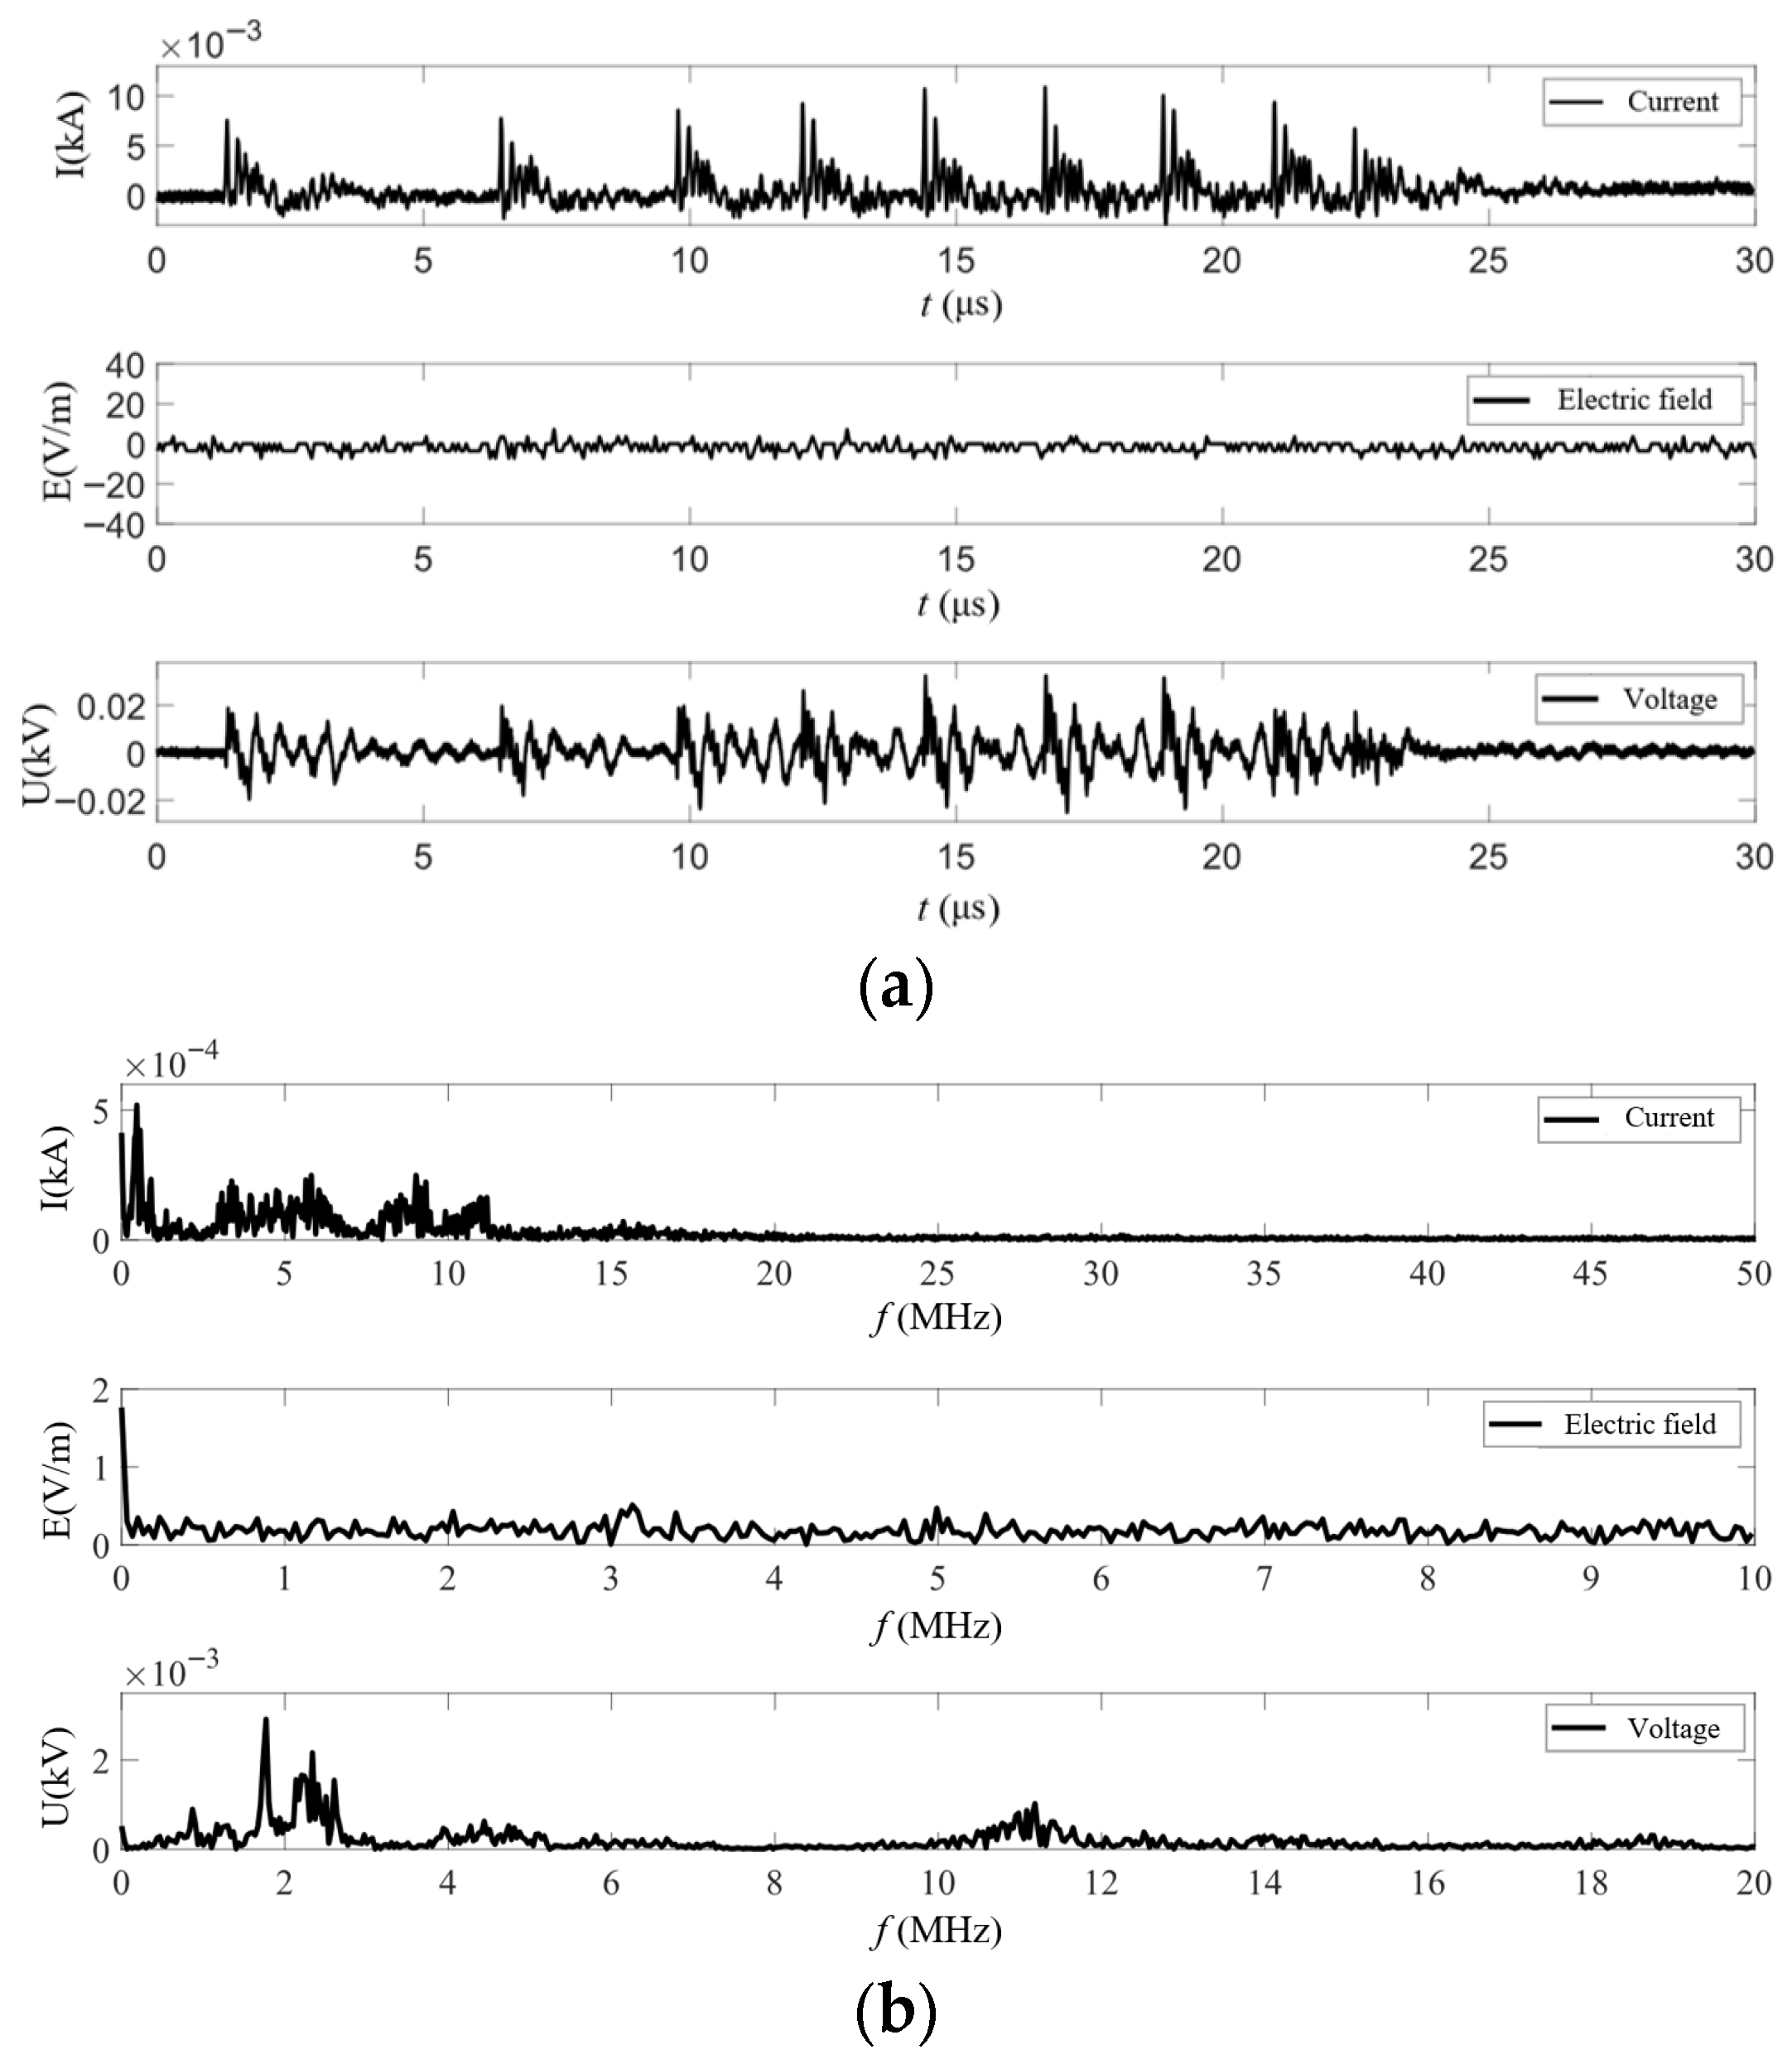
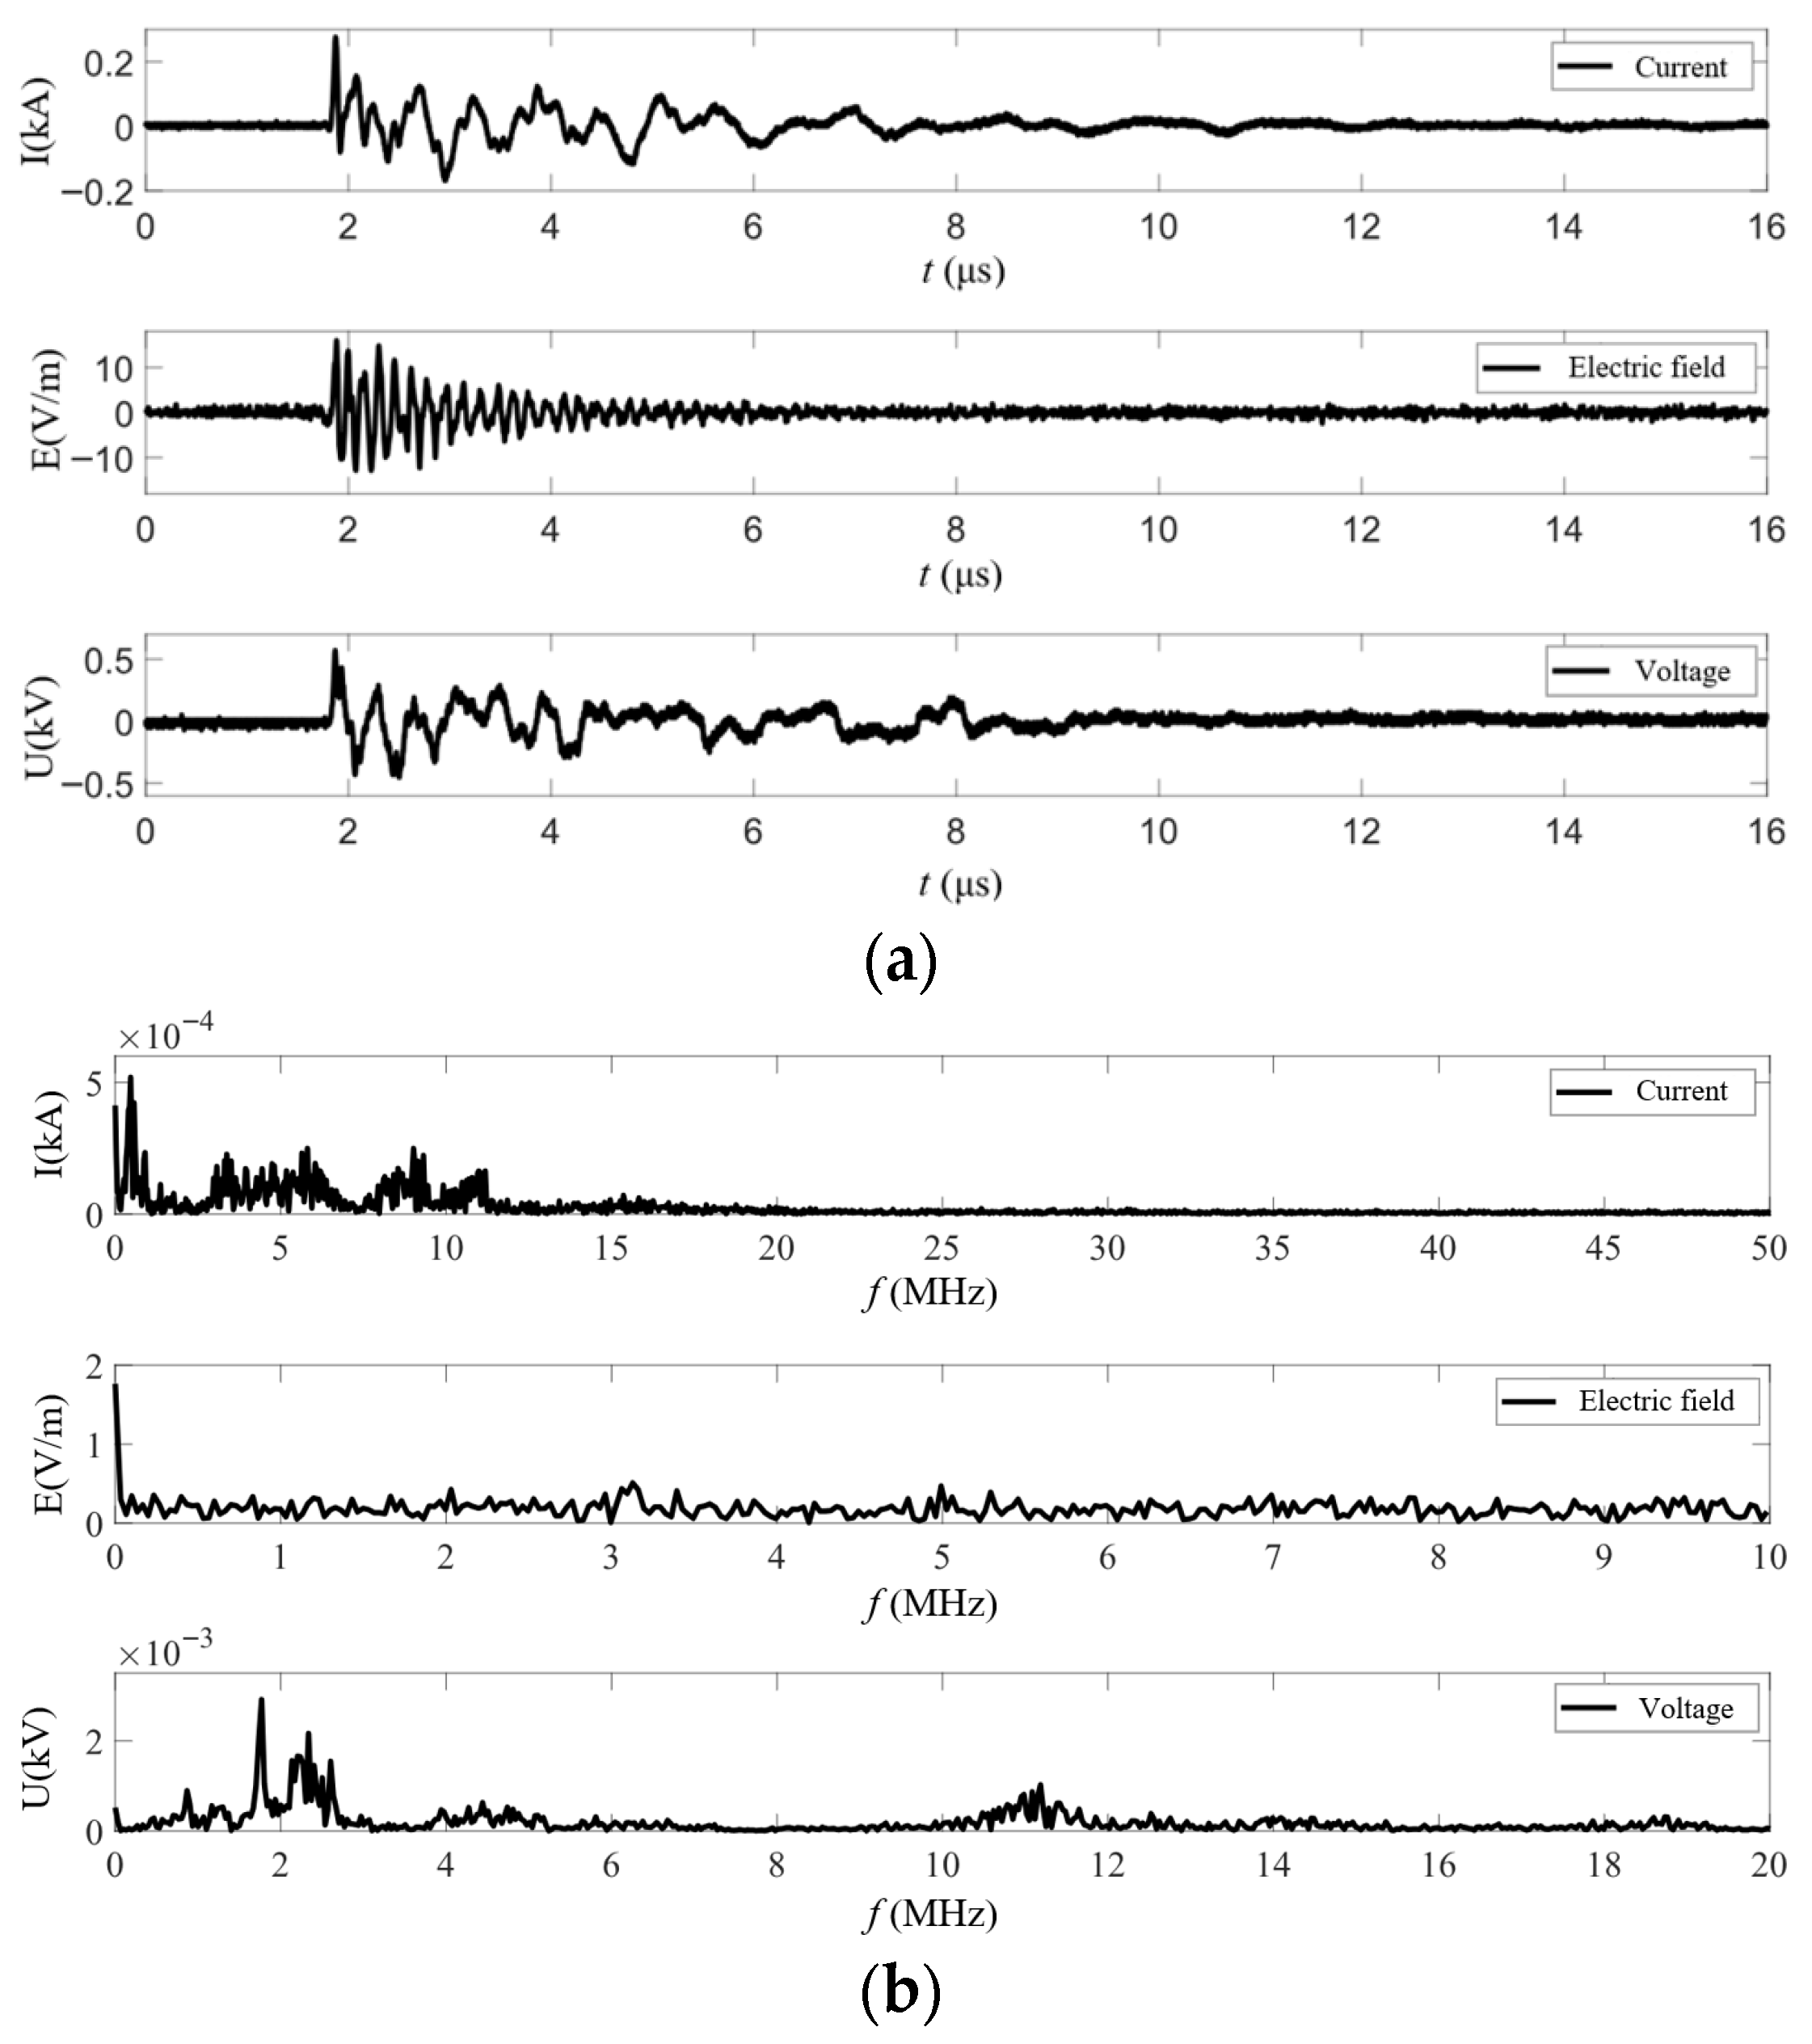
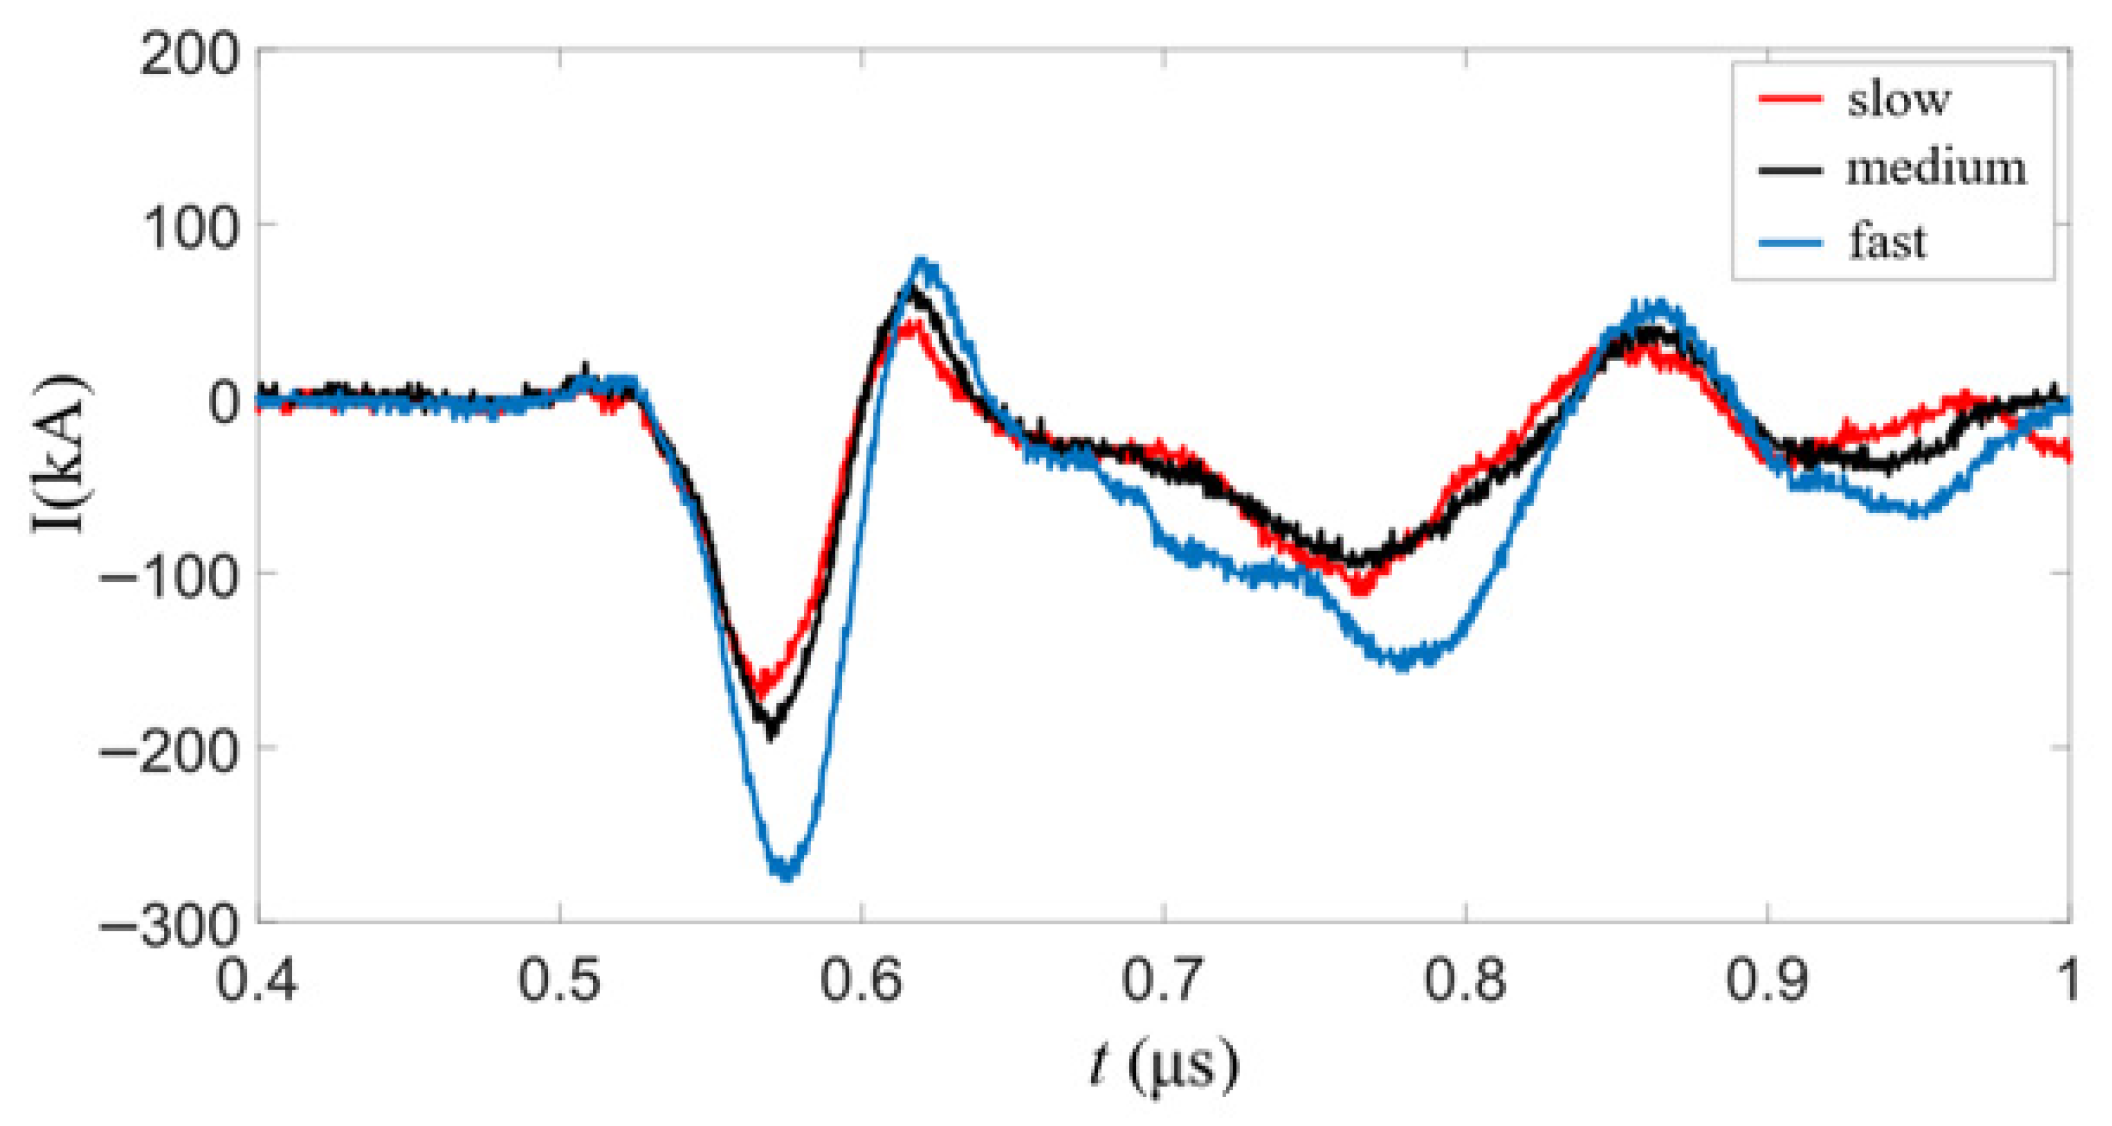
The pantograph remains stationary, and the contact wire is driven by an air pump to vibrate vertically. During this process, the pantograph and contact wire are constantly in a state of high-speed relative motion and unstable vibration, causing the pantograph–catenary gap to change continuously. This results in the arc being repeatedly stretched, extinguished, and reignited, forming frequent and short-duration arcs. During the process of continuous vibration in the pantograph–catenary system, which triggers multiple arc discharges, the arc generated at the moment of the first separation between the pantograph and catenary is typically the most severe. The experimental waveform triggered by this initial arc ignition exhibits a pattern of periodic damped oscillation with progressively decreasing amplitude, as shown in
Figure 12. The oscillation duration is approximately 4 μs. The energy of the current is primarily concentrated in the frequency band below 10 MHz, the electric field energy is mainly distributed in the 5–10 MHz range, and the voltage energy is distributed below 4 MHz.
The vibration amplitude is kept constant while the air pressure of the pump is increased, resulting in a higher vibration frequency of the contact wire. Consequently, the peak value, rise time, and pulse width of the load current all increase. The variation trends are presented in
Figure 13. When the vibration amplitude is constant, the vibration frequency is proportional to the rate at which the pantograph–catenary distance increases. A higher vibration frequency results in a larger pantograph–catenary gap at the moment of first separation breakdown. A longer air gap requires a higher breakdown voltage; therefore, prior to arc ignition, more magnetic field energy has been stored in the parasitic inductance of the system. Upon gap breakdown, this energy is rapidly released into the oscillatory circuit formed by the parasitic inductance and capacitance, thereby exciting a higher peak oscillation current. Simultaneously, the increased arc resistance reduces the effective resonant frequency of the circuit, prolonging the oscillation period and ultimately resulting in an increase in the current pulse width.
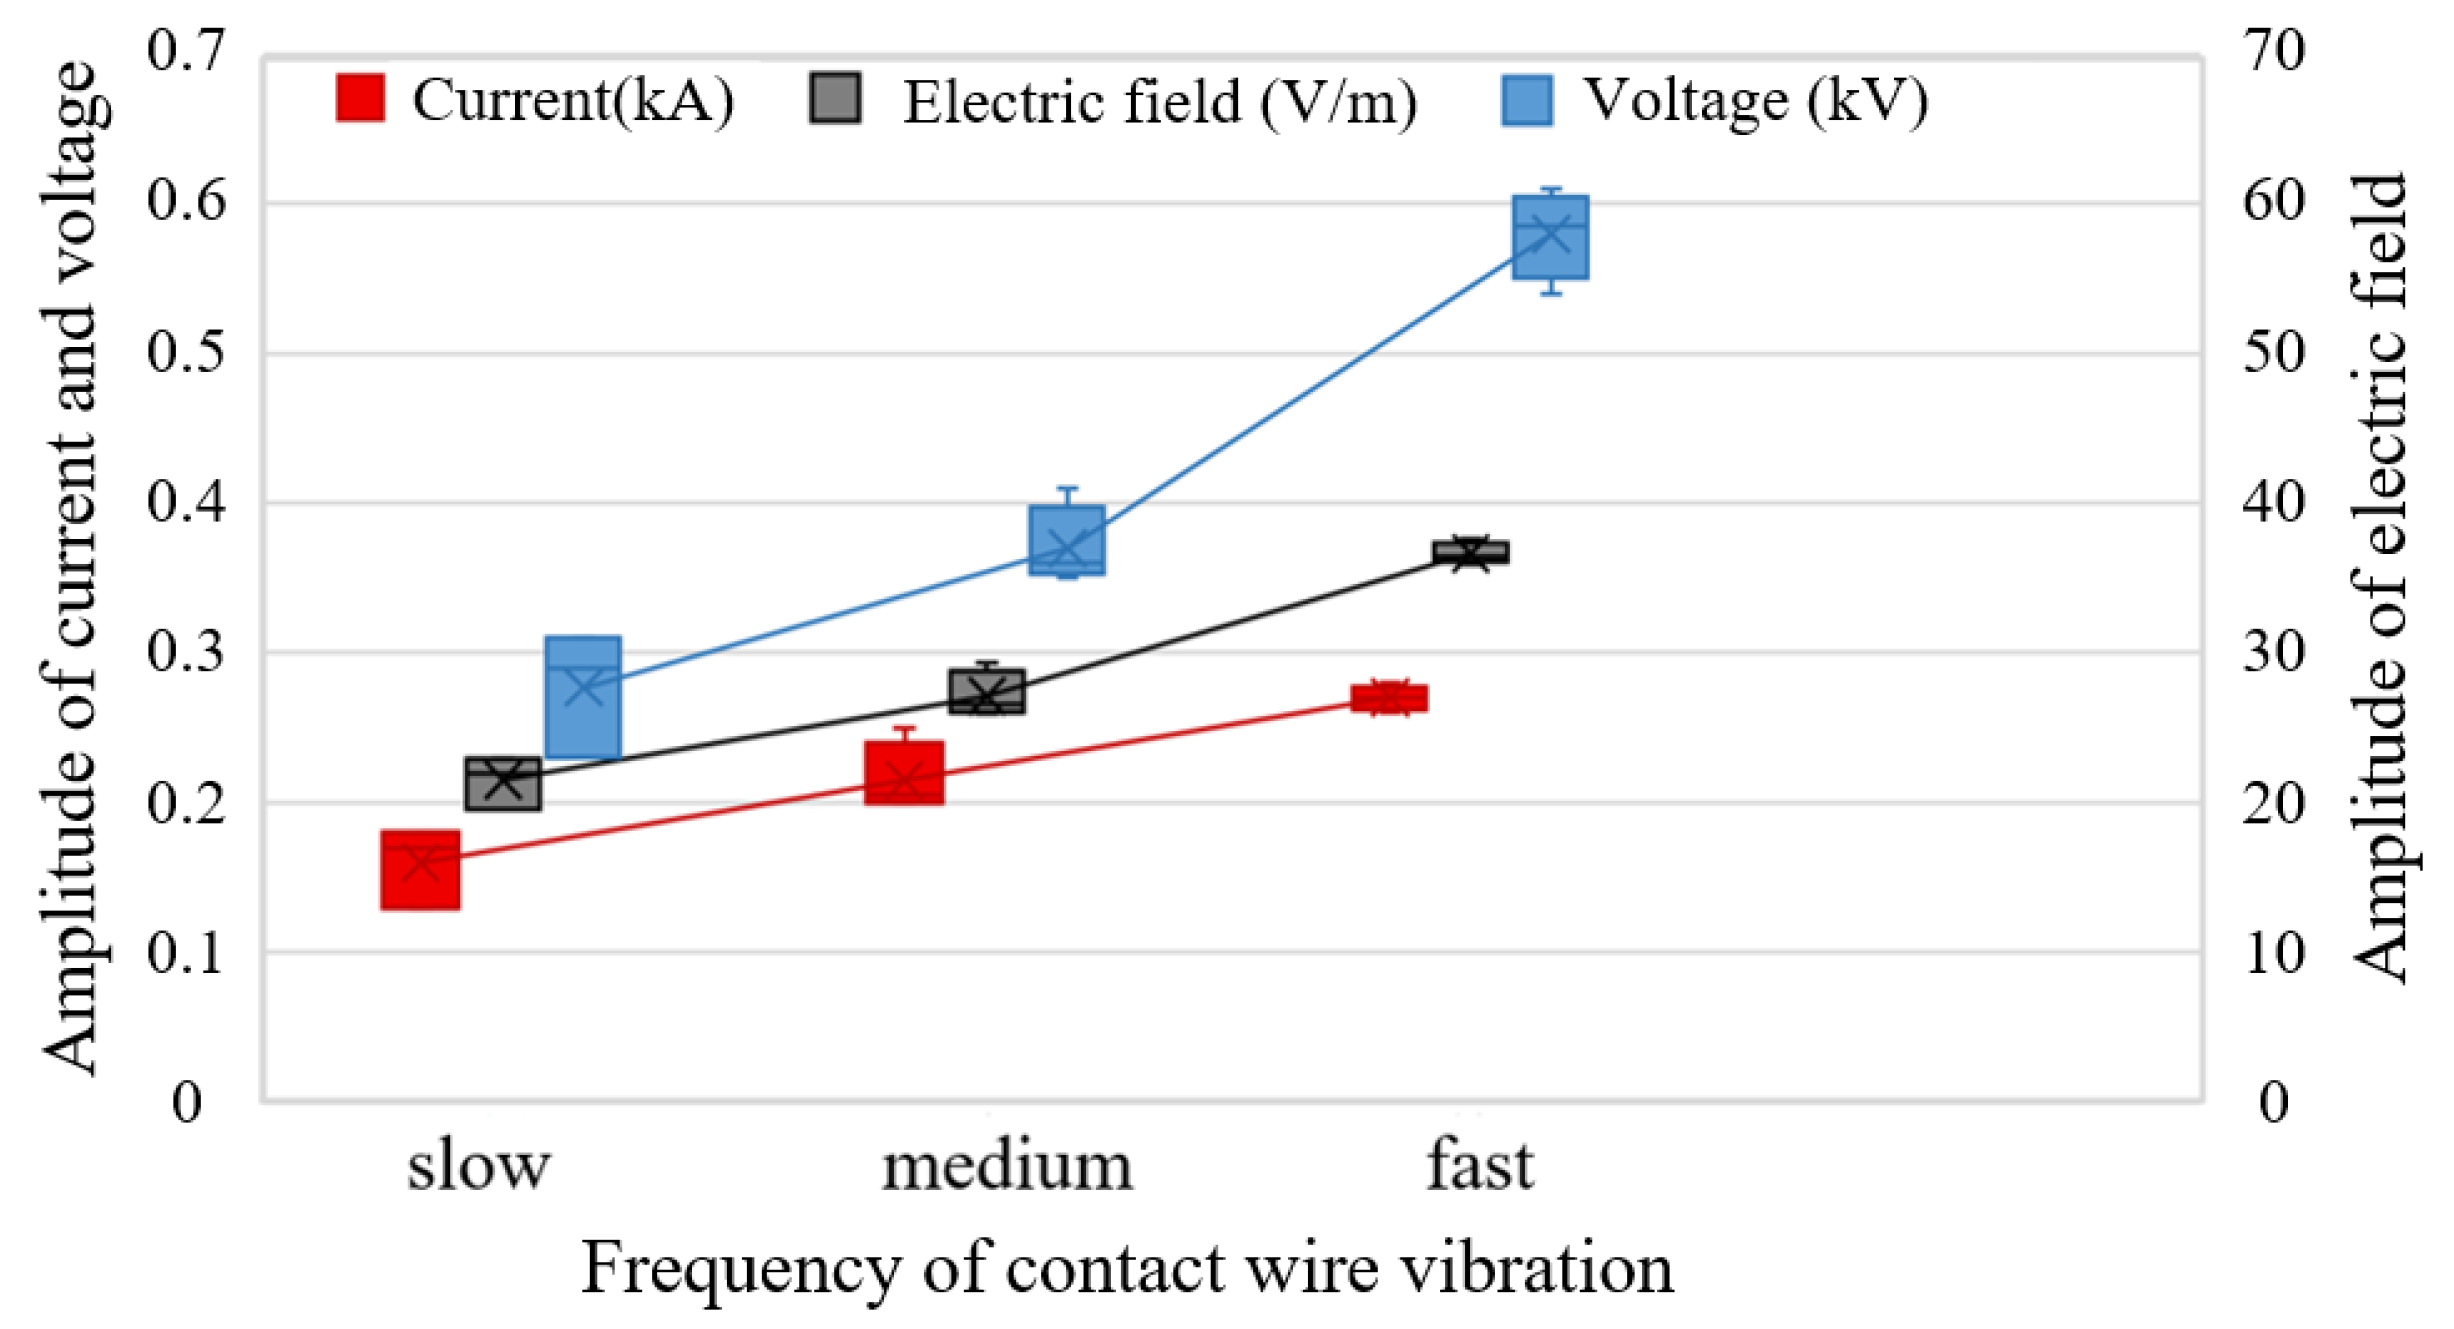
When the vibration frequency between the pantograph and catenary increases, the arcing distance at the moment of separation also increases. In this scenario, the resulting longer arc exhibits high resistance, is unstable, and is prone to extinction. Subsequently, the distance between the pantograph and catenary decreases rapidly, forming a short arc. This large-amplitude, periodic, and drastic change in arc length causes the arc resistance to fluctuate rapidly over a wide range. As a result, this dynamic, together with the parasitic inductance and capacitance of the circuit, constitutes a damped oscillation circuit. The increase in pantograph–catenary vibration frequency, by intensifying the stretching and instability of the arc, makes the high-frequency oscillatory current more pronounced. Consequently, the peak values of current, electric field, and voltage exhibit a positive correlation with the increasing vibration frequency of the contact wire, as shown in
Figure 14. In this experiment, the contact wire is driven to oscillate by an air pump. The vibration frequency and vibration amplitude are controlled by adjusting the valve opening, which regulates the airflow rate. Specifically, the larger the valve opening, the greater the airflow rate, resulting in increased vibration frequency and amplitude of the contact wire. The three operating conditions labeled as slow, medium, and fast in
Figure 14 correspond to valve opening settings of 40, 45, and 50, respectively. The exact vibration frequency and vibration amplitude cannot be measured precisely under the current setup. Therefore, the qualitative descriptors are retained to reflect the relative trend.
No fewer than three repeated tests are performed under each condition, and their mean values and standard deviations are presented in
Table 7. Under the pantograph–catenary offline vibration condition, the peak arc current, peak electric field, and peak voltage all exhibit strong linear relationships with valve opening settings, with coefficients of determination
R2 = 0.99, 0.98, and 0.95, respectively. These linear trends indicate that as the valve opening increases, corresponding to a higher airflow rate and thus greater vibration intensity, the electromagnetic transient severity rises proportionally. This positive correlation arises because increased vibration frequency and amplitude lead to larger dynamic gap variations, which promote more intense arcing and greater energy release at breakdown. Consequently, higher vibration intensity under offline conditions exacerbates both radiated and conducted electromagnetic interference, highlighting the importance of suppressing excessive pantograph–catenary vibrations to maintain electromagnetic compatibility.
Experimental results indicate an intrinsic correlation between mechanical vibration and electromagnetic interference intensity during pantograph–catenary offline processes: higher vibration frequencies lead to significantly increased peak values of the arc current, spatial electric field, and overvoltage between carriages, while also increasing the rise time and width of the current pulse. This phenomenon confirms that high-frequency mechanical vibration exacerbates the transient electromagnetic effects of pantograph–catenary discharge, posing a direct threat to the insulation of onboard low-voltage equipment and the reliability of communication systems. Therefore, it is necessary to optimize the damping design of the pantograph to reduce the probability of high-frequency offline arcing at the source and to enhance the protection level of critical equipment.
4. Comparative Analysis of Experimental Results
The physical foundation of all four operating conditions lies in gas discharge and the negative resistance characteristic of the arc. Their fundamental difference resides in the mode of control and the dynamic process of gap variation. This directly determines the energy input, stability, and electromagnetic interference characteristics of the arc. Under loaded conditions, the characteristics of the four operating conditions are presented in
Table 8.
There are significant differences in the electromagnetic transient characteristics of pantograph–catenary arcs under different mechanical excitation modes. Parameters such as gap distance, pantograph raising speed, pantograph-lowering distance, and pantograph–catenary vibration frequency all influence these electromagnetic transient characteristics. According to the experimental results, the load current, the electric field outside the train, and the voltage between carriages under all operating conditions have exhibited a pattern of periodic damped oscillation with progressively decreasing amplitude.
The electromagnetic transient characteristics measured under the four typical operating conditions pose potential threats to onboard equipment through both conducted and radiated interference paths. Conducted interference is primarily associated with the measured current and inter-carriage voltage transients. Under all four conditions, the transient current exhibits a steep rise time (as short as 0.037 µs). This high di/dt current flows through the train body and grounding system, inducing significant voltage drops across parasitic inductances in the grounding network. These voltage drops create common-mode disturbances that can couple into signal cables and control circuits, potentially triggering false signals in onboard protection and communication systems. Meanwhile, the measured inter-carriage voltage during arcing events reaches peak values of up to 3 kV under fixed-gap conditions. The transient overvoltage propagates along power supply lines and signal cables through direct electrical connections, and it can exceed the insulation withstand capacity of onboard low-voltage equipment. For example, when coupled into the control circuits or the communication systems, the overvoltage can cause insulation breakdown, dielectric aging, or permanent damage to semiconductor components. Radiated interference is primarily associated with the measured electric field transients. During air gap breakdown, the electric field strength peaks at values up to several hundred volts per meter, with oscillation frequencies concentrated in the 10 MHz range. These transient electric fields radiate directly from the arc source and propagate through space, coupling into unshielded cables, enclosure gaps, and printed circuit board traces. The induced voltages and currents from such coupling can disrupt the normal operation of sensitive onboard equipment, including wireless communication systems, axle counters, and train control modules. Notably, the oscillation frequency band of 10 MHz overlaps with the operating frequencies of certain railway signaling and communication systems, increasing the risk of electromagnetic compatibility issues. Even at lower electric field strengths, repetitive arcing under offline vibration conditions can produce cumulative interference effects, potentially degrading the performance of electronic systems over time.
The practical relevance of these findings extends to the operational context of high-speed railways. As train operating speeds increase, the pantograph–catenary system experiences more intense mechanical excitation, which can increase the frequency and severity of arc events. The experimental conditions in this study are representative of the dynamic behavior encountered in high-speed operation. Consequently, the measured electromagnetic transient characteristics provide a basis for evaluating the EMC performance of trains operating at higher speeds.
Due to fundamental differences in the underlying mechanisms, the spatial radiation and conducted electromagnetic interference along the train body caused by fixed gap and pantograph raising conditions are significantly greater than those caused by pantograph-lowering and pantograph–catenary offline vibration. However, regardless of the operating condition, any arc poses a threat to the insulation safety and normal operation of electrified trains and their onboard equipment. By referencing the quantitative correlation between pantograph–catenary mechanical parameters and electromagnetic transient responses established in the experimental results, the operational reliability of vehicles in electromagnetic interference environments can be enhanced. This can be achieved through measures such as incorporating mechanical redundancy or emergency lowering/raising devices, selecting an appropriate pantograph raising speed based on the catenary phase, and optimizing the pantograph’s damping design.
5. Conclusions
This paper employs experimental measurements to thoroughly investigate the transient electrical characteristics of electrified railways under four typical non-ideal operating conditions. The research results elucidate the influence of mechanical parameters on the key electrical parameters. The specific conclusions are as follows:
Under the fixed-gap condition, as the gap distance increases from 3 mm to 9 mm, the peak values of the arc current, the electric field outside the train, and the voltage between carriages all increase significantly. Specifically, the peak values of the arc current increase from 0.74 to 1.50 kA, the peak values of the electric field outside the train increase from 26.29 to 204.73 V/m, and the peak values of the voltage between carriages increase from 1.95 to 3.54 kV. Simultaneously, the rise time of the current pulse decreases from 0.076 μs to 0.053 μs accordingly.
Under the pantograph raising condition, breakdown occurs within the range from zero to the first peak of the catenary power frequency voltage. As the pantograph raising speed increases from 10 mm/s to 40 mm/s, the transient peak values of current, electric field, and voltage all decrease significantly. Specifically, the transient peak values of current decrease from 0.63 to 0.24 kA, the peak values of electric field decrease from 95.15 to 44.62 V/m, and the peak values of the voltage between carriages decrease from 1.34 to 0.45 kV.
Under the pantograph-lowering condition, the high-frequency oscillation at the zero-crossing point consists of a series of damped oscillation waveforms. Their peak value exhibits a trend of first increasing and then decreasing as the pantograph-lowering distance increases. Specifically, the peak values increase from 7.56 to 10.88 A and then decrease to 6.7 A for the arc current, and from 18.8 to 32.4 V and then decrease to 17.2 V for the voltage between carriages. This reflects the dynamic competitive relationship between the dielectric recovery strength and the voltage recovery strength of the arc gap during the elongation process.
Under the pantograph–catenary offline vibration condition, as the vibration frequency increases, the gap is larger at the moment the offline arc is generated. Consequently, the transient peak values of current, electric field, and voltage, as well as the rise time of the first current pulse, increase accordingly. Specifically, the peak values of current increase from 0.16 to 0.27 kA, the peak values of electric field increase from 21.77 to 36.63 V/m, the peak values of voltage between carriages increase from 0.28 to 0.58 kV, and the rise time of the first current pulse increases from 0.037 to 0.046 μs.
Among the four mechanical parameters investigated, gap distance exhibits the strongest influence on electromagnetic compatibility risk, with a 7.8-fold increase in electric field peak over the tested range. Pantograph raising speed also significantly affects EMC risk, as increasing the speed from 10 mm/s to 40 mm/s reduces the electric field peak by approximately 53%. These findings suggest that priority should be given to controlling fixed-gap distance and optimizing pantograph raising speed for effective electromagnetic compatibility mitigation in practical engineering applications. The study reveals the arc discharge phenomena induced by different mechanical dynamic processes. Furthermore, corresponding countermeasures are proposed. This study can provide a reference for condition monitoring, fault diagnosis, and electromagnetic compatibility protection of pantograph–catenary systems in electrified railways.
This study is based on experimental measurements conducted under controlled laboratory conditions. Two main limitations should be acknowledged. First, the offline vibration condition was realized using an air pump to drive the contact wire. While the valve opening settings provided qualitative control of vibration intensity, the exact vibration frequency and amplitude could not be measured precisely due to limitations of the excitation system. Second, the parameter ranges investigated were selected based on typical operating conditions; extending these ranges may reveal nonlinear behaviors not captured in the present study.
To address the limitations identified above, future work will focus on developing predictive arc models that incorporate mechanical excitation parameters such as gap distance, motion speed, and vibration frequency. Such models would enable the simulation-based investigation of vibration frequency and amplitude effects that could not be precisely measured in the present experimental setup, as well as the exploration of potential nonlinear behaviors beyond the current operating windows. Building on the experimental data, further efforts will be directed toward applying machine learning techniques for real-time prediction of arcing severity and integrating the established quantitative correlations into condition monitoring systems for early detection of abnormal pantograph–catenary conditions.