Article

Human Reliability Analysis in Interaction Design Based on CREAM, FCE, and DEMATEL

School of Mechanical and Electrical Engineering, Jiangsu Normal University, Xuzhou 221116, China
*
Author to whom correspondence should be addressed.
Appl. Sci. 2026, 16(7), 3326; https://doi.org/10.3390/app16073326
Submission received: 15 February 2026 / Revised: 22 March 2026 / Accepted: 26 March 2026 / Published: 30 March 2026

Abstract

Human reliability analysis of the human–computer interaction process between users and systems is critical because human error can introduce significant system risks. Interaction systems designed with human reliability analysis can reduce human error. This study proposed a research methodology for analyzing human error to design interactive systems that align with users’ cognitive demands. First, the cognitive reliability and error analysis method (CREAM) is used to investigate cognitive function failures and determine the nominal cognitive failure probability. Next, fuzzy comprehensive evaluation (FCE) is used to assess the level of common performance conditions (CPCs). Subsequently, the decision-making trial and evaluation laboratory (DEMATEL) method is employed to compute the factor centrality weights of CPCs and human intrinsic factors (HIFs). The interactions among CPCs are analyzed, leading to the determination of cognitive impact weights. Then, the cognitive failure probability is calculated by combining factor centrality weights and cognitive impact weights. Finally, error causes are analyzed to propose optimization strategies and implement design improvements. An in-vehicle information system was used to validate the proposed approach. The findings revealed that this method effectively minimizes cognitive failure probability during system interaction. It also identifies the causes of human error in human–computer interactions and offers a systematic strategy to enhance human reliability in interaction design.

1. Introduction

With the advancement of information technology, the human–computer interaction process has become more complex [1], leading to a higher susceptibility to human error [2]. Human error in interactive systems is an inherent aspect of system performance [3]. Interaction design for human error can effectively improve the usability of interactive systems [4,5]. Human reliability analysis of interactive systems can reduce human error by providing recommendations for design improvements, thereby minimizing the negative impact of these errors and improving system usability [6,7,8].
Human reliability analysis (HRA) provides insights into human–computer interaction behaviors during tasks and quantifies failures [9]. The first generation of HRA methods is recognized for its intuitiveness and practicality [10]. However, the increasing demand for a deeper understanding of human–computer interaction has driven the development of second-generation HRA methods [11]. The cognitive reliability and error analysis method (CREAM) is a representative second-generation HRA method [12]. It is known for identifying cognitive tasks and determining the causes of cognitive reliability degradation [13]. Existing studies have applied the CREAM to analyze human reliability in system operations [14]. For example, Chen et al. [15] used the CREAM to assess human error in the operation of high-speed railway systems. Additionally, the CREAM has been employed in accident risk analysis. For instance, Elidolu et al. [16] used the CREAM to quantify the causes of failures in a cruise ship explosion at sea. However, to the best of the authors’ knowledge, limited research has been conducted on applying the CREAM in interaction design to analyze cognitive function failures.
The CREAM defines the factors influencing cognitive, technological, environmental, and organizational performance as common performance conditions (CPCs) [17]. However, two key limitations encountered in the practical application of the traditional CREAM include the objective assessment of the level of CPCs and the detailed analysis of the interaction among CPCs [18]. The traditional CREAM lacks refined evaluation factors for CPCs [19], and the evaluation process relies heavily on expert knowledge and experience, which are often subjective and inconsistent [20]. Fuzzy comprehensive evaluation (FCE) is a widely used uncertainty assessment method that improves the objectivity of assessment results by representing expert judgments using fuzzy linguistic terms [21]. By simplifying complex decision-making processes, FCE provides a reliable and adaptable tool for addressing ambiguity in evaluation scenarios [22]. It has been demonstrated to be useful in optimizing evaluation effectiveness [23,24]. Therefore, to mitigate the impact of subjective expert assessments on the quantification of human reliability, this paper integrates FCE into the traditional CREAM framework to evaluate the levels of CPCs in interactive systems.
The traditional CREAM primarily examines the effects of CPCs on cognitive reliability in the cognitive dimension, providing only a simplified analysis of the interactions between factors [25]. However, the interrelationships among CPCs can affect their impact on interactive systems, influencing the results of human reliability analysis [26]. Therefore, a correlation impact analysis of CPCs is crucial for interaction systems. The decision-making trial and evaluation laboratory (DEMATEL) method effectively evaluates complex systems by analyzing factor relationships [27]. It has been extensively applied to investigate the interrelationships among factors that influence system security [28]. For example, Shi et al. [29] used the DEMATEL method to analyze the interdependence and interactions of the factors influencing the cargo loading process. DEMATEL improves the reliability of failure analysis in interactive systems by identifying the causal relationships and interactions among factors [30]. Therefore, to quantify the impact of human–computer interaction factors on the cognitive reliability assessment of interactive systems, DEMATEL is incorporated in this paper.
Human intrinsic factors (HIFs) influence the user’s comprehension and execution of tasks, which is crucial for determining the human reliability of interactions with the system [31]. Considering the impact of HIFs on user behavior in interaction design can enhance interactive quality [32]. The traditional CREAM, which does not explicitly incorporate the influence of HIFs on cognitive function failures, may have limited accuracy in predicting human error in interactive systems [19]. Therefore, to provide a more comprehensive assessment of cognitive function failures, this paper integrates the impact of CPCs and HIFs.
Building on the above analysis of DEMATEL’s role and the integration of CPCs and HIFs, this study offers distinct research novelties. The novelty of this study lies in the synergistic effect of four dimensions: first, a human–computer interaction-specific CPC/HIF analysis system, which has a wide range of applications and is highly suitable for human reliability analysis; second, a normalized product-based weight integration mechanism, which solves the problem of low fusion accuracy; third, a closed-loop design improvement cycle, which realizes iterative optimization of human–computer interaction design; and finally, an end-to-end workflow, which covers the entire link from indicator establishment to effect verification.
This paper introduces a method for human reliability analysis in interaction design, integrating the CREAM, FCE, and DEMATEL. This research includes three main contributions that enhance the applicability and accuracy of human reliability analysis in interactive systems. First, to reduce uncertainty in evaluating CPC levels, FCE is incorporated. Second, to comprehensively explore the impact of human error in interactive systems, the impact of CPCs and HIFs is integrated into the traditional CREAM framework. Third, to enhance the accuracy of cognitive reliability analysis, the interrelationships among CPCs are analyzed, and the factor centrality weights of CPCs and HIFs are calculated using the DEMATEL method.
The structure of the paper is as follows: Section 2 outlines the research background, while Section 3 explains the proposed methodology. Section 4 presents a case study, followed by a discussion of its results in Section 5. Finally, Section 6 provides the conclusions.

2. Theoretical Background

2.1. Cognitive Reliability and Error Analysis Method

The CREAM was proposed by Hollnagel in 1998 [33]. It integrates human cognitive, technological, environmental, and organizational factors into a reliable cognitive model and error classification system [34]. The model emphasizes the influence of cognitive processes and environmental factors on human error, referring to these as CPCs [35]. The CREAM has been widely applied in human reliability analysis in fields such as nuclear power [36], aerospace [37], and the maritime sector [38].
The traditional CREAM consists of basic and extended methods. The basic CREAM assesses the overall perceived probability of failure for the entire system, and the extended CREAM calculates the cognitive failure probability (CFP) for each step [39]. The CREAM is applicable for both predictive analysis of complex human–machine systems to identify tasks prone to human error, and retrospective analysis to identify causative factors that lead to reliability degradation [40]. In this study, the extended CREAM is applied to analyze the CFPs of users in completing human–computer interaction tasks and to explore the root causes of human error.

2.2. Fuzzy Comprehensive Evaluation

FCE is a widely applied decision-making approach that combines fuzzy logic and multiple-factor evaluation techniques to address complex and uncertain systems [41]. This method converts qualitative information into measurable data and integrates various evaluation criteria into a unified assessment framework by constructing a fuzzy evaluation matrix [42]. Due to its flexibility and robustness, the FCE method has been extensively used in program assessment [43], risk analysis [44], and performance evaluation [24], providing a systematic and reliable framework for decision-making in uncertain conditions.
The traditional CREAM determines the level of CPCs through expert evaluation, but expert assessments often involve uncertainty. To reduce the uncertainty in expert evaluations and enhance the CREAM’s effectiveness in interaction design, this research uses FCE to refine the evaluation process by synthesizing experts’ ratings of the evaluation factors through fuzzy logic.

2.3. Decision-Making Trial and Evaluation Laboratory

DEMATEL was developed by the Battelle Memorial Institute in Geneva in the 1970s [45]. It has been used to address complex system problems involving the interaction of multiple factors, providing decision-makers with a clear understanding of the system dynamics [28]. The DEMATEL method has been successfully applied to analyze factor correlations and importance across various domains [46,47]. In this paper, DEMATEL is used to improve the accuracy of human reliability analysis in interactive systems by quantifying the factor centrality weights of CPCs and HIFs on cognitive function failures. In addition, to reduce the limitation of the traditional CREAM whereby it does not thoroughly analyze the interaction of CPCs, this paper uses DEMATEL to analyze the interrelationships among CPCs in interactive systems.

3. Proposed Methodology

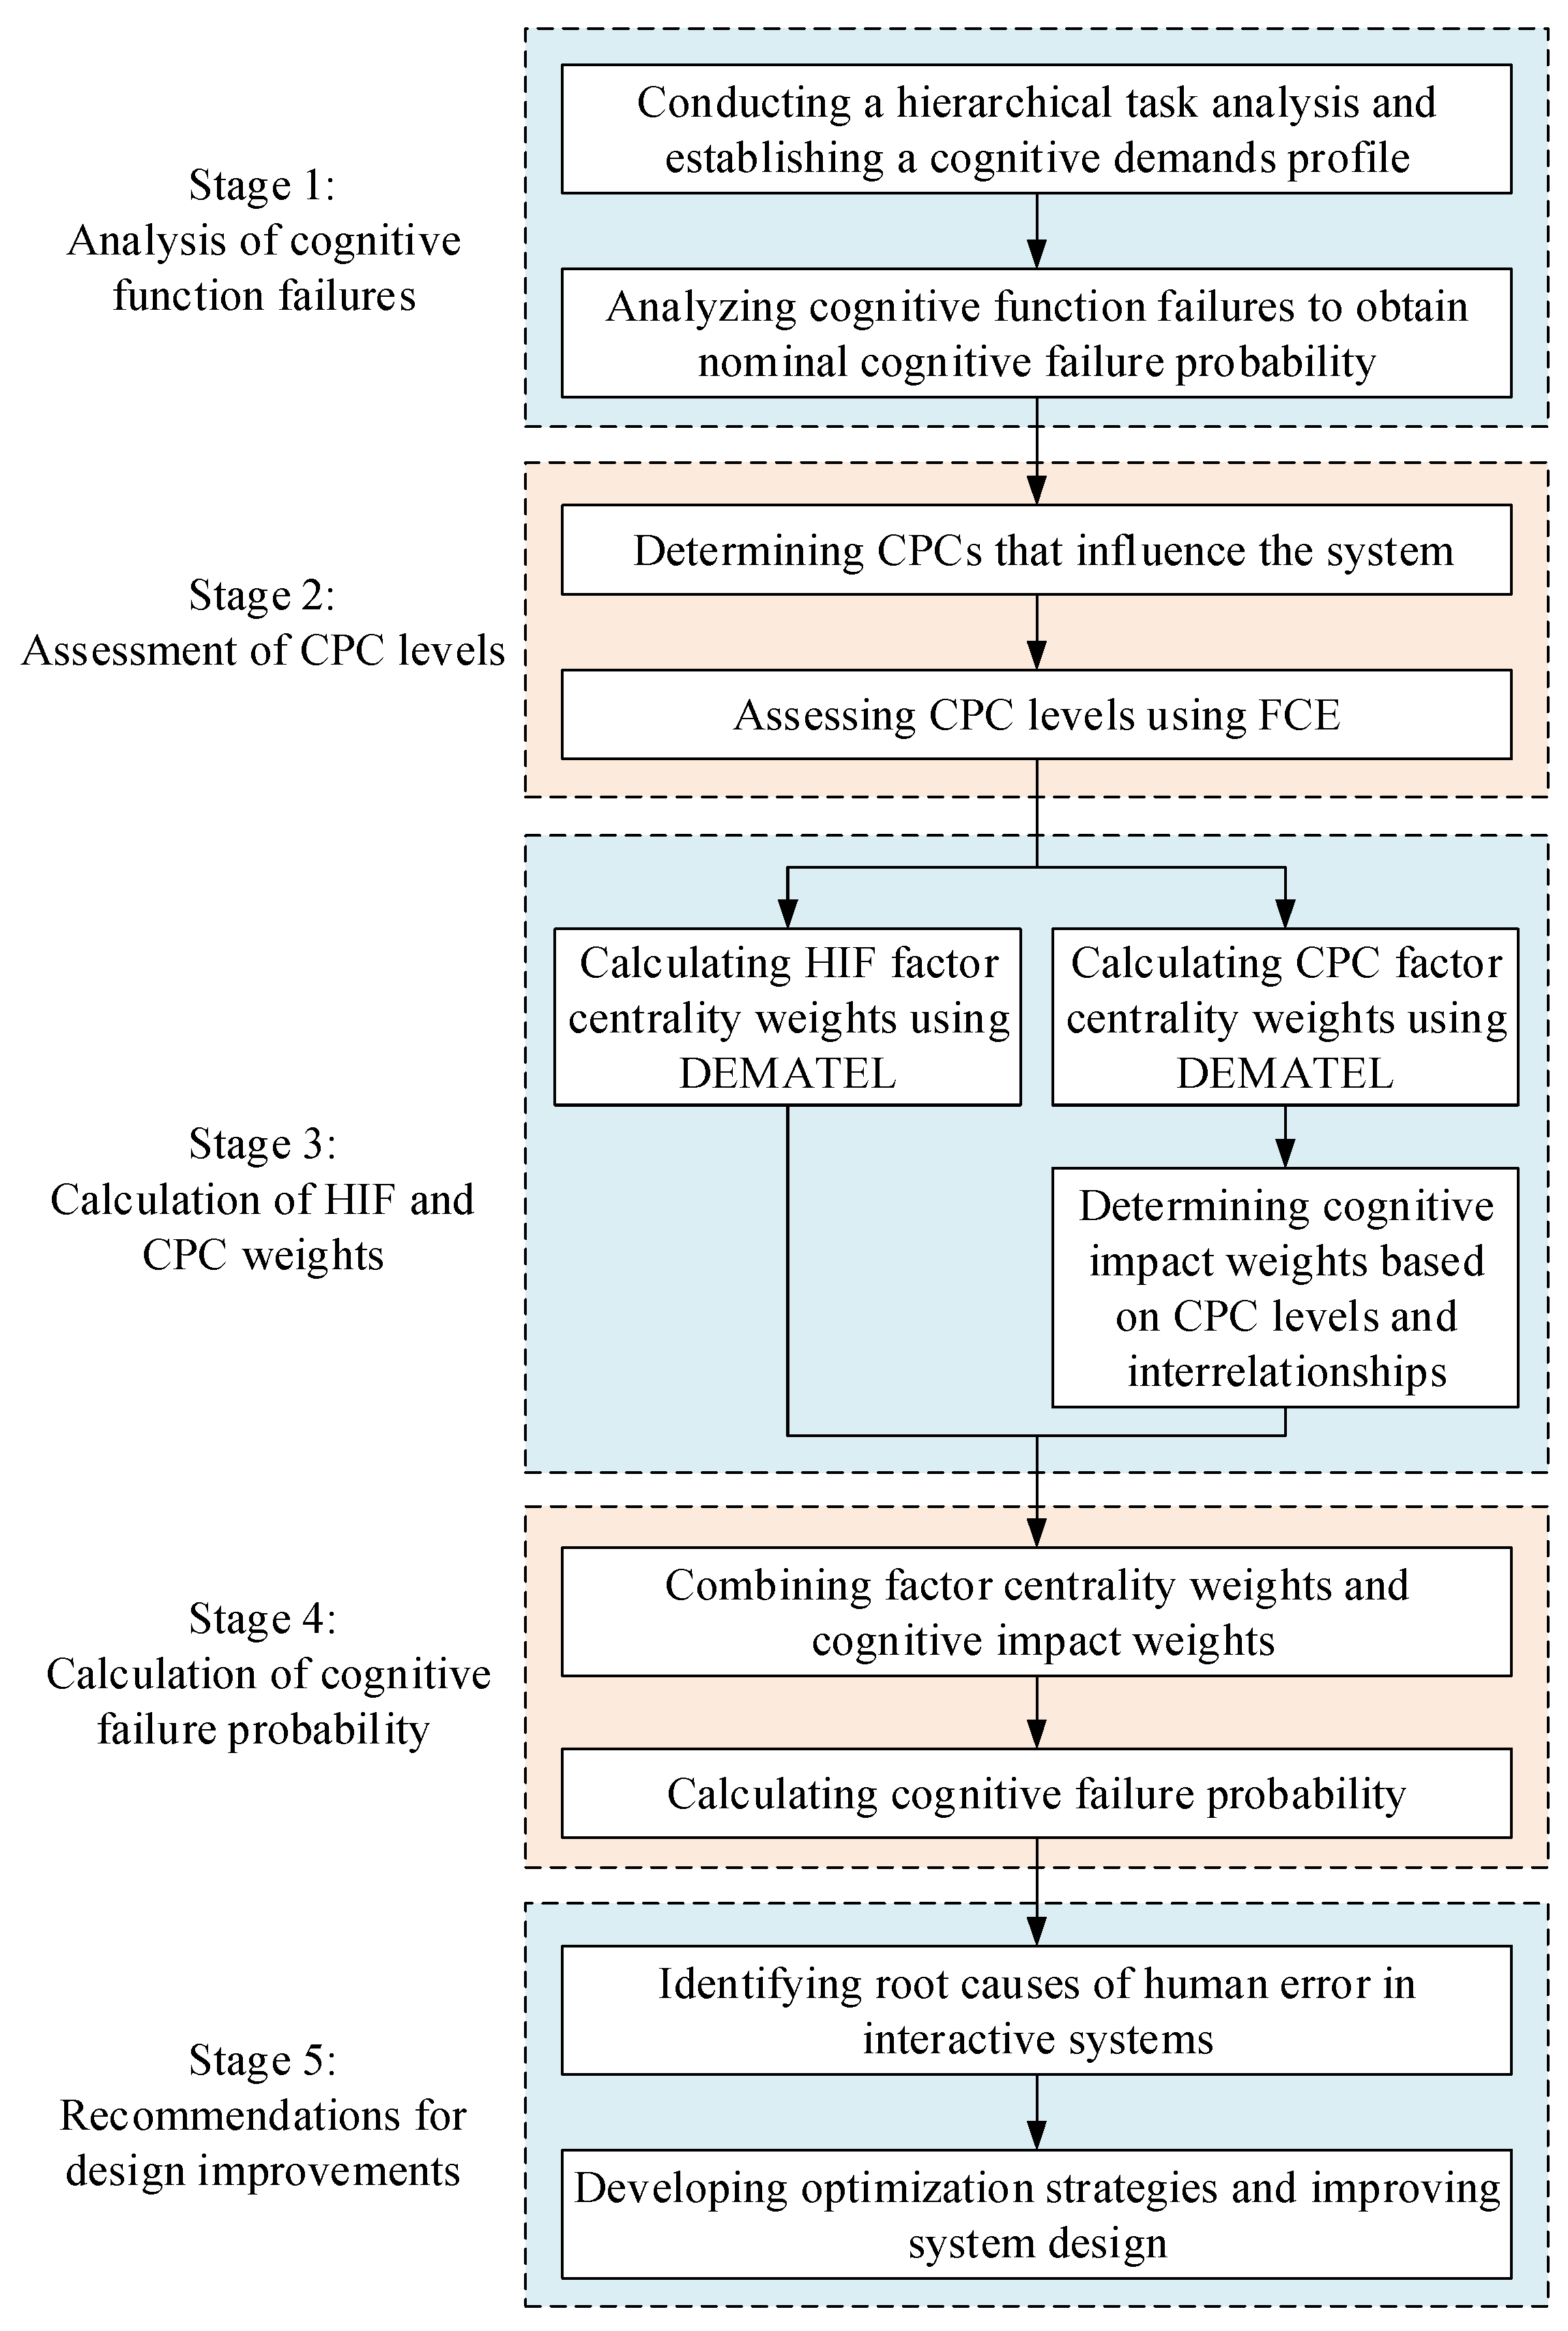
This paper proposes a novel method integrating the CREAM, FCE, and DEMATEL to analyze human error in interaction design and reduce cognitive load on users interacting with the system. The framework of the proposed methodology is shown in Figure 1 and consists of five stages. In stage 1, cognitive function failures are evaluated. In stage 2, CPC levels are assessed. In stage 3, the HIF and CPC weights are calculated. In stage 4, the cognitive failure probability is determined. In stage 5, recommendations for design improvements are proposed.

3.1. Analysis of Cognitive Function Failures

3.1.1. Conducting Hierarchical Task Analysis and Establishing a Cognitive Demand Profile

To analyze the tasks of the target interactive system, hierarchical task analysis (HTA) was performed. HTA provides a clear, structured breakdown of complex tasks [48]. It is a widely used method for decomposing tasks into subtasks and represents the result of a hierarchical tree diagram [49].
A cognitive demand profile is constructed based on the user’s performance during the completion of subtasks from the hierarchical tree diagram. The key cognitive activities and associated cognitive functions involved in interacting with the system are identified through the observation and recording of task completion. The fifteen cognitive activity types and four cognitive functions used to construct the cognitive demand profile are presented in Table 1.

3.1.2. Obtaining the Nominal Cognitive Failure Probability

The CREAM categorizes four types of cognitive functions into various cognitive function failures and assigns the corresponding nominal CFPs, as shown in Table 2 [19]. Human error is analyzed based on the cognitive demand profile, and the cognitive function failures occurring during system interaction are identified.

3.2. Assessment of CPC Levels

Interaction contexts are established by analyzing CPCs defined based on the target interaction system [37]. By determining CPC levels, interaction contexts where human error occurs during human–computer interaction can be identified. This paper evaluates the impact level of each CPC using FCE. Each CPC is further divided into sub-factors. The system’s performance level is then derived through FCE, which involves the following five steps:
Step 1: Establish the factor set.
The factor set is a collection of factors that affect the level of each CPC, represented by set C, C = c 1 , c 2 , , c i , , c m , and c i ( i = 1 , 2 , , m ) represents the refined sub-factors for each CPC.
Step 2: Establish the weight set.
The weight set reflects the importance of each sub-factor in the CPCs by assigning weight a i ( i = 1 , 2 , , m ) to sub-factor ci. The weights of all sub-factors form set A, A = a 1 , a 2 , , a i , , a m , where i = 1 m a i = 1 , with a i 0 .
Step 3: Establish the evaluation set.
The evaluation set is a collection of evaluation results of the CPCs of the interactive system. The evaluation set is set as L, L = l 1 , l 2 , , l j , , l n , and l j ( j = 1 , 2 , , n ) denotes the impact level possessed by the sub-factors of the CPCs.
Step 4: Perform a fuzzy comprehensive evaluation.
The evaluation is conducted on the ith sub-factor ci of the CPCs, with the affiliation degree of the CPCs to the jth level lj in the evaluation set denoted as rij. The evaluation results of the sub-factors for each CPC are then aggregated into an evaluation matrix R, as shown in Equation (1).
R = r 11 r 12 r 1 j r 1 n r 21 r 22 r 2 j r 2 n     r i 1 r i 2 r i j r i n     r m 1 r m 2 r m j r m n
Based on the weight set A and evaluation matrix R, the fuzzy synthesized evaluation set B is calculated using Equations (2) and (3).
B = A R = b 1 , b 2 , , b j , , b n
b j = i = 1 m a i r i j
where b j ( j = 1 , 2 , , n ) is the fuzzy synthesized evaluation index and “ ” represents the fuzzy synthesis process.
Step 5: The evaluation indicators are processed using the maximum affiliation method to determine CPC levels.

3.3. Calculation of HIF and CPC Weights

In this paper, to calculate the factor centrality weights of CPCs and HIFs, DEMATEL is employed. This method quantifies the relationships between factors and their respective degrees of influence with precision. DEMATEL quantitatively analyzes the relationships between factors to identify their causality and centrality, typically following five steps:
Step 1: Define and evaluate factors.
Identify the factors influencing the system and assess the relationships between factors using expert judgment. These relationships are categorized into four levels of influence: 0 represents no influence, 1 represents slight influence, 2 represents moderate influence, and 3 represents strong influence.
Step 2: Obtain the direct relationship matrix X.
Based on the evaluations from Step 1, the factors are compared pairwise to assess their influence. The arithmetic mean of the scores is used to construct an n × n direct relationship matrix, denoted as X = x i j n × n , where xij represents the degree to which factor i influences factor j, with all diagonal elements set to 0.
Step 3: Calculate the normalized direct relation matrix D.
The normalized direct relation matrix D can be calculated using Equations (4) and (5).
Q = min 1 max 1 i n j = 1 n x i j , 1 max 1 j n i = 1 n x i j
D = X × Q
Step 4: Calculate the total impact relationship matrix T.
Due to lim k D k = 0 , the total matrix T = t i j n × n can be calculated using Equation (6).
T = k = 1 D k = D I D
where I is the identity matrix, 0 is the null matrix, and tij represents the degree to which factor i affects factor j.
Step 5: Conduct an analysis to get the sum of rows and columns.
Let h and g denote the sum of the rows and columns in matrix T, which can be calculated using Equations (7) and (8).
h = h n × 1 = j = 1 n t i j n × 1
g = g n × 1 = i = 1 n t i j 1 × n t
Let hi represent the sum of the ith row and gi represent the sum of the ith column. In this paper, hi indicates the degree to which CPC i influences other CPCs, while gi represents the degree to which it is influenced by others. The value of hi + gi represents the degree of centrality of CPC i, reflecting its relative importance. Therefore, the value of hi + gi can then be normalized to calculate the factor centrality weight of CPC i using Equation (9).
w i = h i + g i i = 1 9 h i + g i
where wi is the factor centrality weight of CPC i on subtasks.
In this paper, hj indicates the degree to which HIF j influences other HIFs, while gj represents the degree to which it is influenced by others. Based on the analysis above, the value of hj + gj can then be normalized to calculate the factor centrality weight of HIF j using Equation (10).
ν j = h j + g j j = 1 9 h j + g j
where vj is the impact weight of HIF j on subtasks.
Based on the DEMATEL analysis results, we identify the CPCs influenced by others as CPCs with values higher than the average. Then, the relevance adjustment rules are applied to analyze the interactions among CPCs. The cognitive impact weights are determined based on CPC interactions and levels.

3.4. Calculation of the Cognitive Failure Probability

The factor centrality weight of CPCs and the impact weight of HIFs are integrated via Equation (11) to yield the comprehensive weight.
p i = u i w i v j
where pi is the comprehensive weight, ui is the cognitive impact weight of the ith CPC, wi is the factor centrality weight of CPC i on subtasks, and vj is the impact weight of HIF j on subtasks.
Based on the derived comprehensive weight, the CFP for each subtask is calculated via Equation (12).
C F P = C F P 0 i = 1 m p i
where CFP0 denotes the nominal CFP of each subtask.
Note that Equation (11) combines the node centrality and the factor impact degree of cognitive risk factors within the DEMATEL causal network. The normalized product form is adopted to eliminate dimensional differences and highlight their synergistic effect, which is more reasonable than additive or unnormalized product forms, and this combination is a fusion operator rather than a weight update or risk amplification operator. Equation (12), which is closely related to Equation (11) in the cognitive reliability analysis process, uses multiplicative aggregation for CFP. This method assumes the conditional independence of cognitive failure events across different factors within the human–computer interaction scenario. To reconcile DEMATEL-based interaction modeling with multiplicative aggregation that may implicitly assume separability, we adopt a two-stage strategy: first using DEMATEL to screen key cognitive factors, and then applying multiplicative aggregation to calculate CFP. The key cognitive factors screened by DEMATEL inherently have independent characteristics in terms of their impact on cognitive failure, which ensures the rationality of the multiplicative aggregation method and effectively resolves potential conflicts between the two methods.

3.5. Recommendations for Design Improvements

To improve the design, we recommend the following: Identify human-error-prone subtasks in the interactive system based on the CFPs. Analyze the causes of human error using CREAM’s cause-effect matrix proposed by Hollnagel [33]. Develop optimization strategies and implement design improvements for the target interactive system [50].

4. Case Study

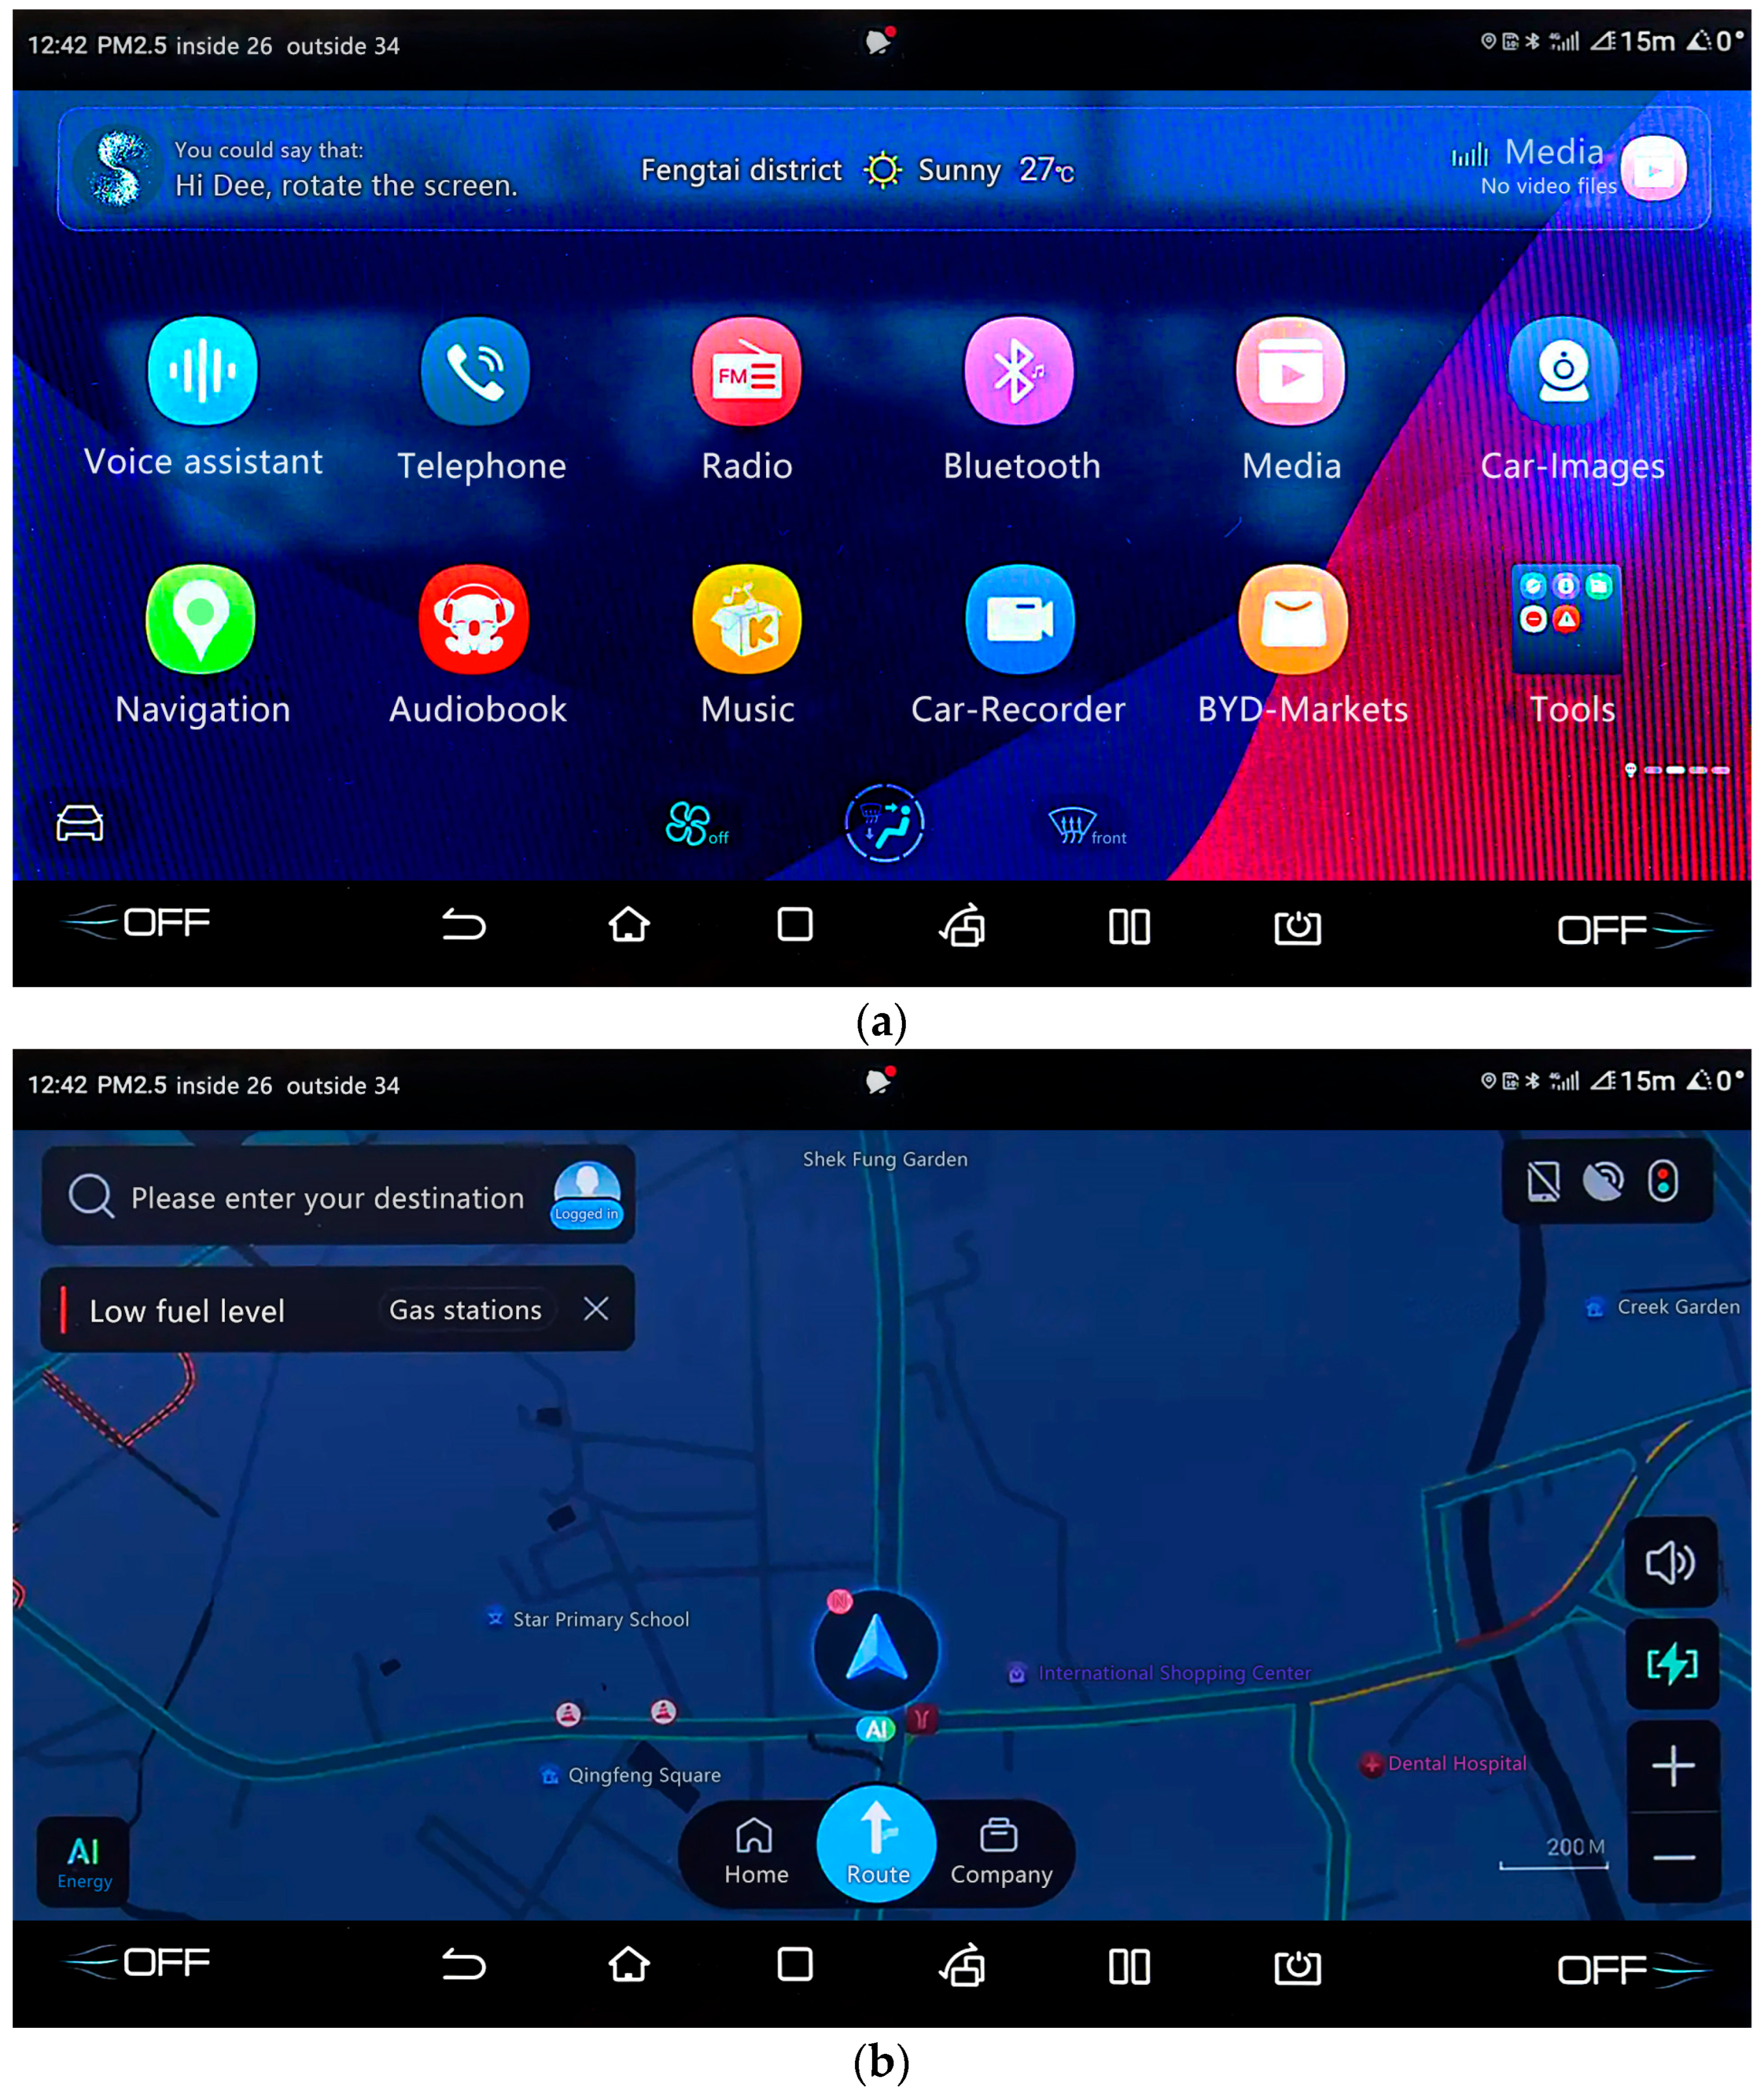
The increasing complexity of human–machine interactions in modern in-vehicle information systems (IVIS) underscores the importance of researching human reliability [51]. An IVIS requires multitasking and intensive cognitive processing, which can overwhelm drivers, particularly under complex driving conditions [52]. This paper focuses on drivers’ interaction errors with IVISs and identifies cognitive function failures. Strategies for improving the design of interactive systems are proposed based on the analysis. The interface of the target IVIS is illustrated in Figure 2.
The focus group for this case study consisted of ten members, including four reliability experts and six interaction designers. All reliability experts possessed more than ten years of professional experience, while each interaction designer had over seven years of relevant professional experience. This study recruited 30 drivers (14 females and 16 males, aged 30–60 years) to interact with the IVIS. All participants had at least five years of experience using such systems.

4.1. Analysis of Cognitive Function Failures in Drivers Interacting with IVIS

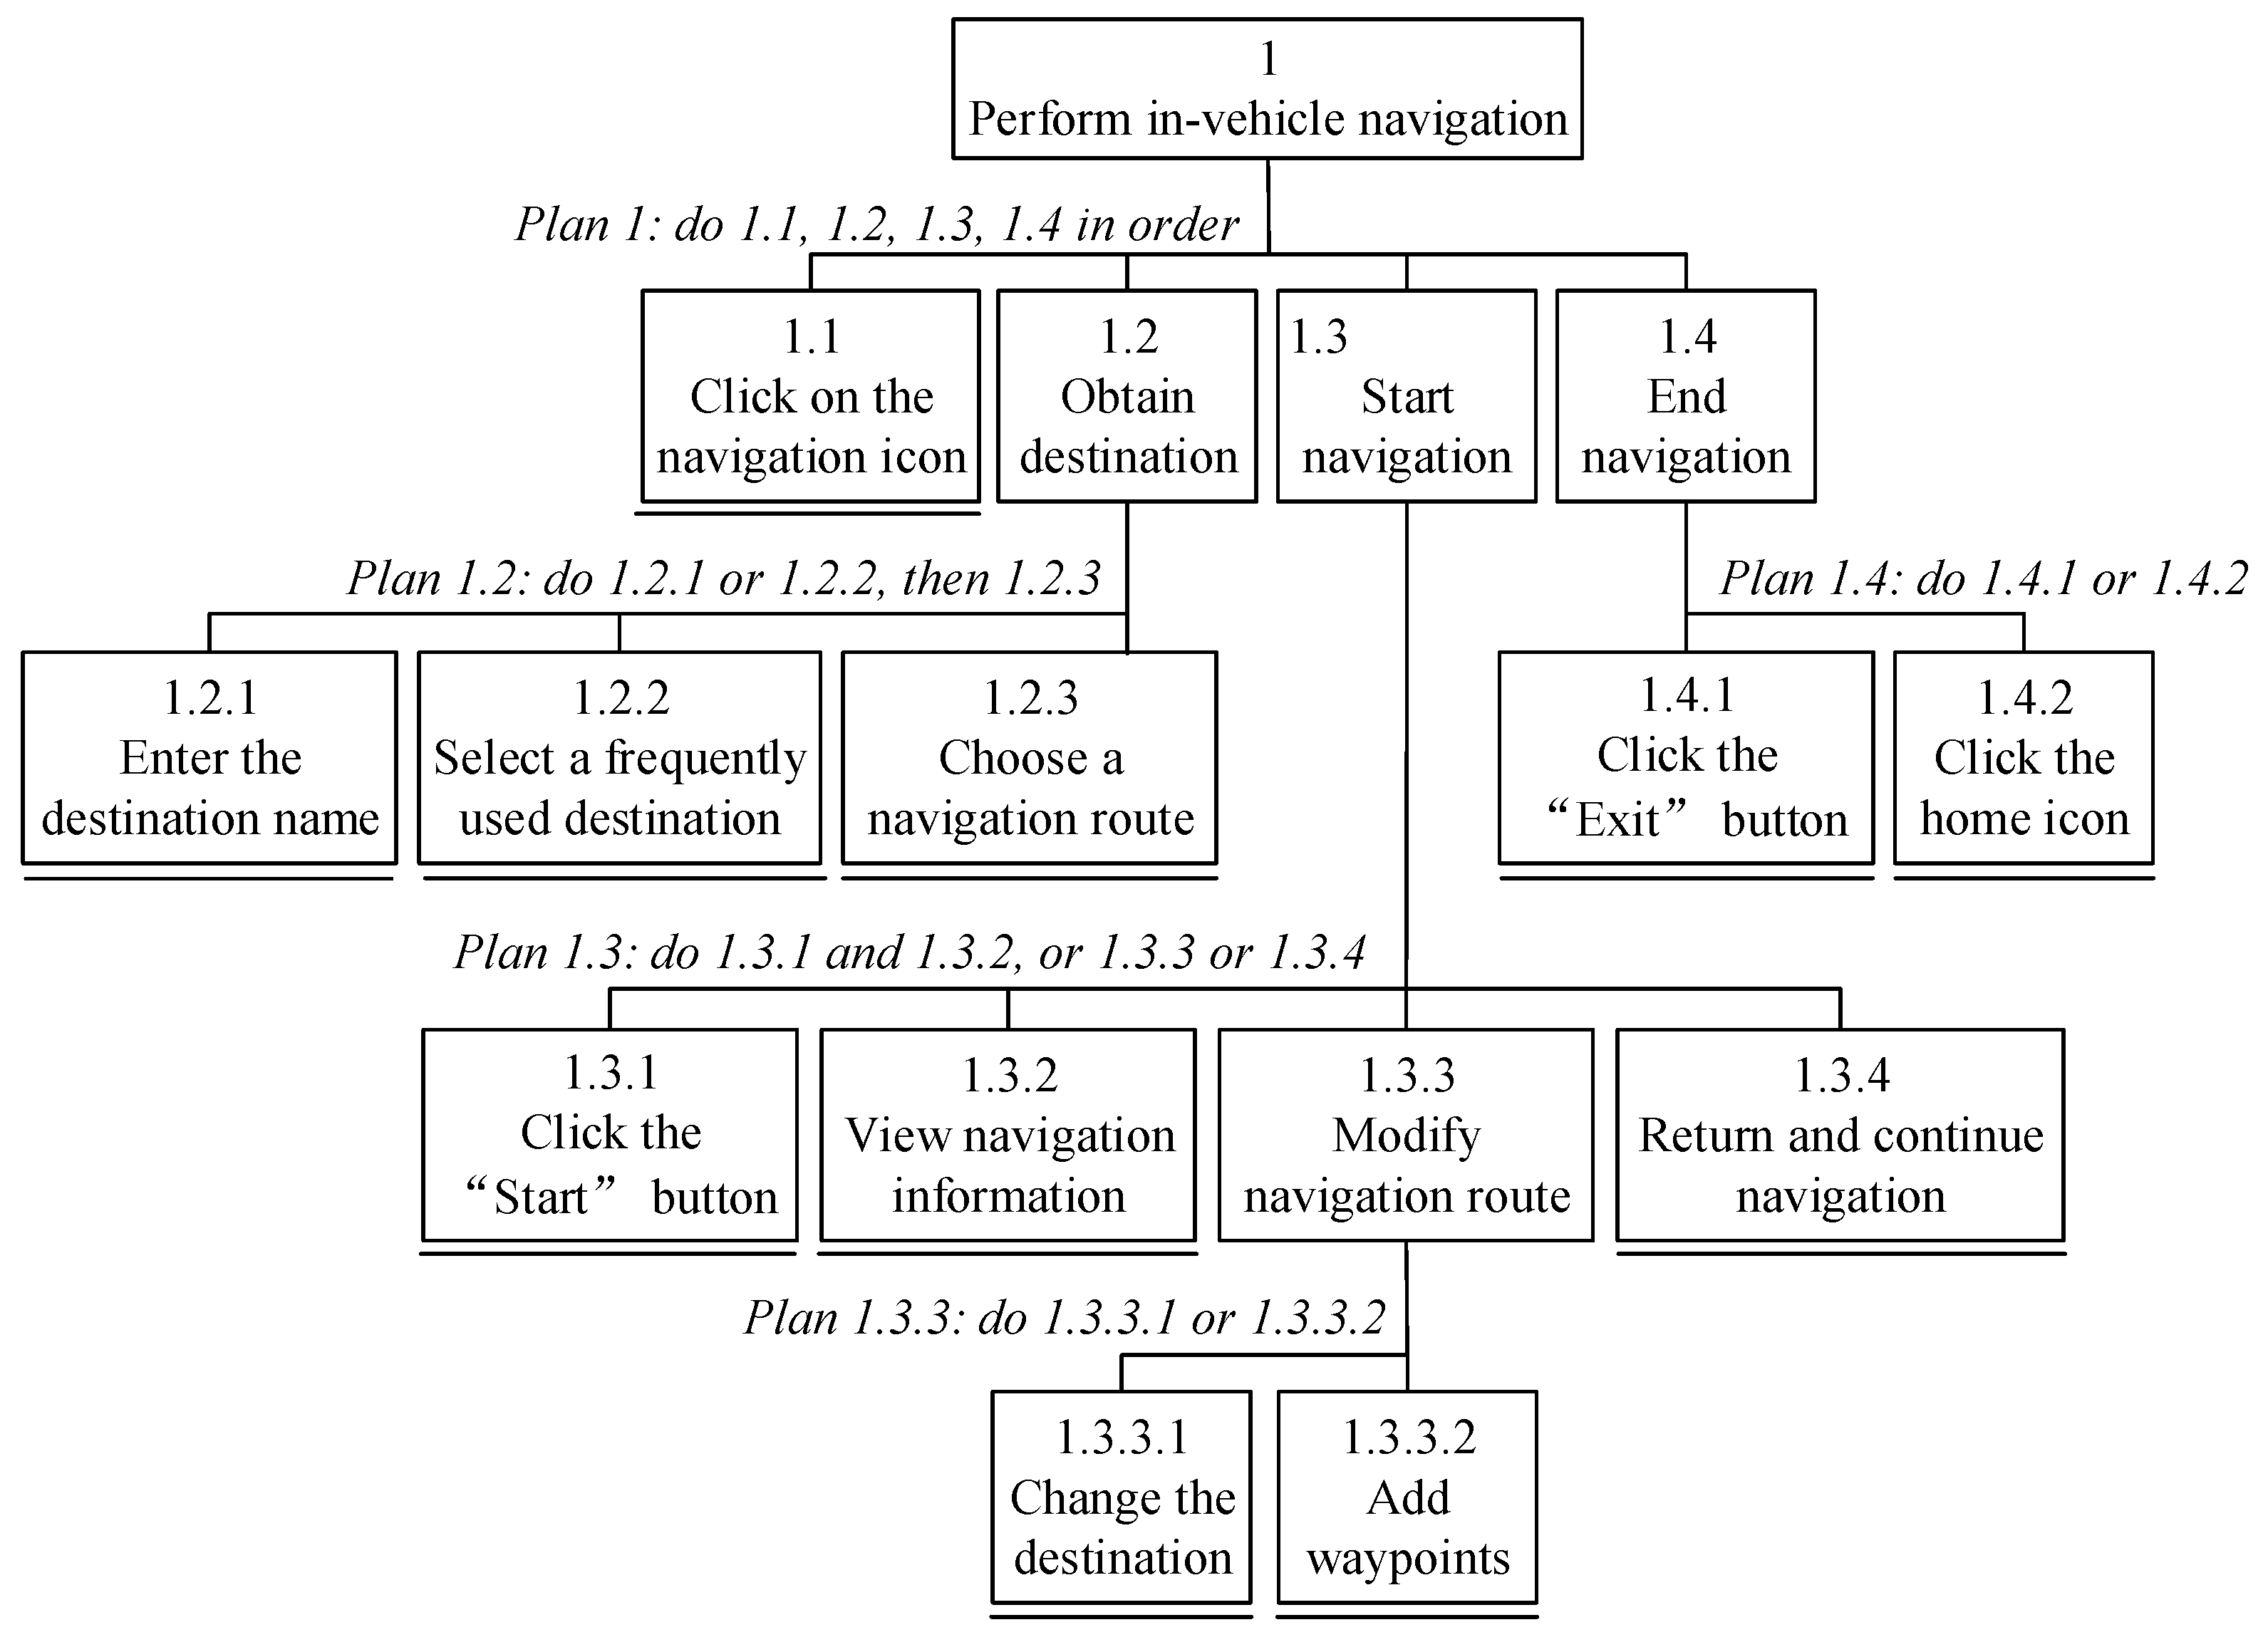
The team conducted the HTA of the in-vehicle navigation function, resulting in a hierarchical tree diagram representing the tasks performed by drivers during navigation. The results are presented in Figure 3.
A cognitive demand profile for drivers performing in-vehicle navigation tasks was established, and the result is shown in Table 3. For example, the key cognitive activity for task 1.2.1 (Enter the destination name) is to identify, and the associated cognitive functions are observation and interpretation.
Based on the cognitive demand profile analysis, human error and cognitive function failures during drivers’ interactions with the IVIS were identified. The nominal CFPs were derived, and the results are shown in Table 4.

4.2. Assessment of CPC Levels Related to IVIS

The CPCs of the traditional CREAM are not fully applicable to human reliability analysis in automobile driving, requiring adjustments to reflect human–computer interaction. Nine CPC factors and sub-factors relevant to drivers’ use of the IVIS were identified by analyzing the automotive driving context [53,54,55,56] and human–computer interaction [57,58,59,60], and the results are shown in Table 5. These CPCs were categorized into multiple levels based on the traditional CREAM and presented in Table 6.
We then evaluated the level of CPCs of the target IVIS using FCE. Take CPC1 (Degree of visualization of the interface) as an example. According to Table 5, the factor set C1 = {Information hierarchy, Visual fluency, Icon recognition, Color contrast} was established. The team members were invited to rate the CPC sub-factors on a scale from 1 to 10, where higher scores indicate greater importance. The expert assessments were collected using open group discussions. The group for this case study consisted of ten members, including four reliability experts and six interaction designers. The members conducted joint open discussions to evaluate the sub-factors on a 1–10 scale, and multiple rounds of discussion were conducted to ensure the consistency and reliability of the assessment results. The total scores for each sub-factor were normalized to calculate their weights using Equation (13), and the results are presented in Table 7.
f i = k = 1 m s i k j = 1 n k = 1 m s j k
where fi represents the normalized weight of the sub-factor i, and sik denotes the score given by the kth member to sub-factor i. The total number of members is m, and n represents the total number of sub-factors.
The set of weights for the evaluation factors was established according to Table 7 as A1 = (0.247, 0.239, 0.290, 0.224). The evaluation set for CPC1 was then built according to Table 7 as L1 = {Supportive, Adequate, Tolerable, Inappropriate}. The evaluation matrix R1 of CPC1 was constructed according to Equation (1). For example, analyzing the affiliation degrees of R1 shows that for the Information hierarchy level of CPC1, 10% of members considered it supportive, 10% considered it adequate, 20% considered it tolerable, and 60% considered it inappropriate.
R 1 = 0.1 0.1 0.2 0.6 0 0.3 0.3 0.4 0.1 0.1 0.4 0.4 0 0.2 0.3 0.5
Using the weight set A1 and evaluation matrix R1, fuzzy synthesis was applied to the evaluation results of CPC1. The fuzzy comprehensive evaluation set B1 was obtained using Equations (2) and (3), and the result is as follows:
B 1 = A 1 R 1 = 0.247 , 0.239 , 0.290 , 0.224 0.1 0.1 0.2 0.6 0 0.3 0.3 0.4 0.1 0.1 0.4 0.4 0 0.2 0.3 0.5 = 0.054 , 0.170 , 0.304 , 0.472
Based on the maximum affiliation method, the maximum fuzzy evaluation result is 0.472, indicating that the level of CPC1 is “Inappropriate”. Similarly, the levels for all CPCs were determined, and the results are shown in Table 8.

4.3. Calculation of HIF and CPC Weights Related to IVIS

4.3.1. The Factor Centrality Weights of HIFs

This study integrated physiological and psychological dimensions to identify nine HIFs that affect drivers’ task performance [57,61]. The physiological factors identified were arm co-ordination (HIF1), fatigue resistance (HIF2), and attention level (HIF3). The psychological factors included emotional condition (HIF4), psychological tolerance (HIF5), memory ability (HIF6), reaction ability (HIF7), judgment ability (HIF8), and perceptual ability (HIF9).
The DEMATEL method was applied to calculate the factor centrality weights of HIFs for drivers interacting with the IVIS. First, the arithmetic mean of the member evaluations was calculated to derive the HIF direct relationship matrix X, and the results are presented in Table 9. Then, the normalized direct relationship matrix D was determined using Equations (4) and (5). Finally, the total impact relationship matrix T was calculated using Equation (6), and the result is as follows:
T = 0.393 0.494 0.549 0.610 0.535 0.517 0.519 0.544 0.601 0.566 0.508 0.672 0.793 0.721 0.557 0.642 0.672 0.740 0.500 0.531 0.511 0.717 0.606 0.583 0.601 0.614 0.684 0.434 0.523 0.542 0.525 0.573 0.493 0.511 0.566 0.587 0.430 0.498 0.514 0.640 0.459 0.510 0.505 0.546 0.602 0.450 0.388 0.445 0.525 0.514 0.377 0.459 0.503 0.549 0.647 0.631 0.722 0.786 0.664 0.628 0.562 0.693 0.765 0.561 0.538 0.631 0.679 0.607 0.594 0.611 0.521 0.710 0.524 0.558 0.631 0.725 0.619 0.579 0.612 0.578 0.573
According to Equations (7) and (8), hj and gj can be obtained. By calculating hj + gj, the weight value vj of HIFs can be derived according to Equation (10), and the results are presented in Table 10.

4.3.2. The Factor Centrality Weights of CPCs

This study used DEMATEL to evaluate the factor centrality weights of CPCs. After assessing the interactions among CPCs, the team calculated the CPC direct relationship matrix X′ using the arithmetic mean of the evaluation results. The results are presented in Table 11. Based on X′, the normalized direct relationship matrix D′ was computed using Equations (4) and (5). Finally, the total impact relationship matrix T′ was derived using Equation (6), and the result is presented as follows:
T = 0.398 0.605 0.650 0.642 0.883 0.451 0.737 0.256 0.460 0.513 0.566 0.728 0.805 0.973 0.463 0.825 0.235 0.586 0.561 0.728 0.631 0.886 1.059 0.520 0.903 0.288 0.662 0.551 0.729 0.766 0.754 1.084 0.566 0.929 0.308 0.676 0.631 0.783 0.739 0.889 0.949 0.632 0.901 0.312 0.662 0.540 0.595 0.596 0.761 0.964 0.424 0.750 0.260 0.611 0.468 0.615 0.663 0.821 0.972 0.493 0.676 0.277 0.563 0.373 0.373 0.442 0.505 0.657 0.307 0.537 0.155 0.402 0.394 0.56 0.533 0.643 0.815 0.443 0.684 0.225 0.418
The sum of rows hi and the sum of columns gi were computed using Equations (7) and (8), and the results are presented in rows 2 and 3 of Table 12. Then, the factor centrality weights of CPCs were calculated using Equation (9), and the results are shown in row 6 of the table.
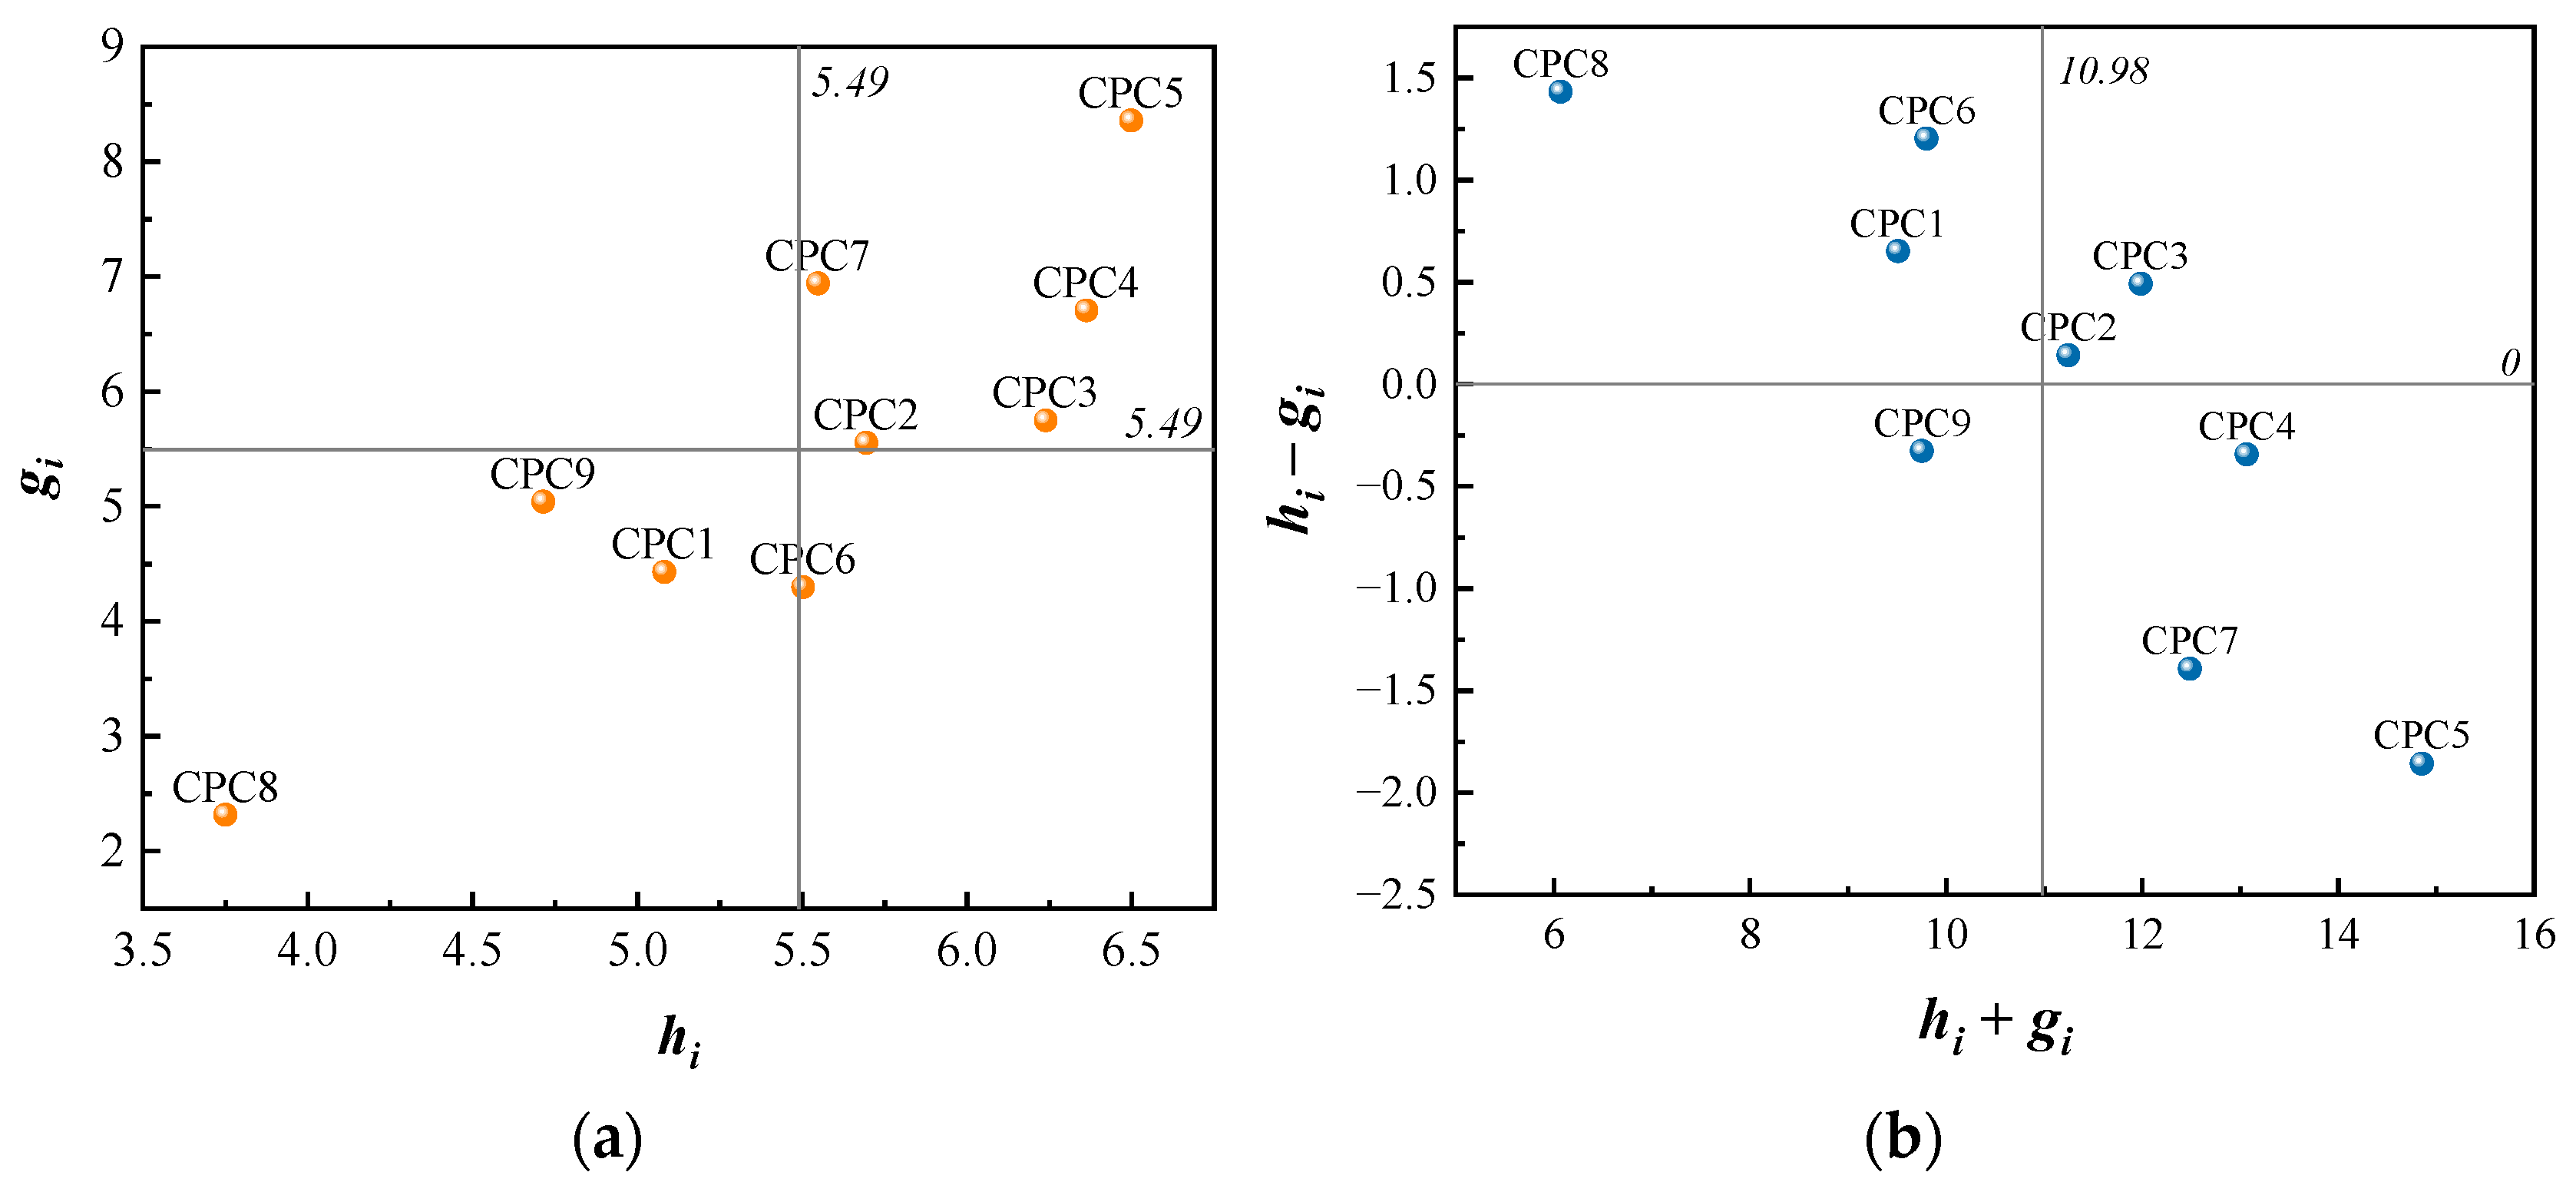
Based on the values of hi and gi in Table 12, the relationship between the degree to which CPCs influence and are influenced is illustrated in Figure 4a. The relationship between the centrality and the causality degree of CPCs is derived from hi + gi and higi, and the results are shown in Figure 4b. The value of hjgj reflects the degree of causality, with a positive value suggesting a cause factor and a negative value indicating an effect factor. According to Figure 4, the influence and centrality of CPC2, CPC3, CPC4, CPC5, and CPC7 are higher than the average values, indicating the need for correlation adjustment.
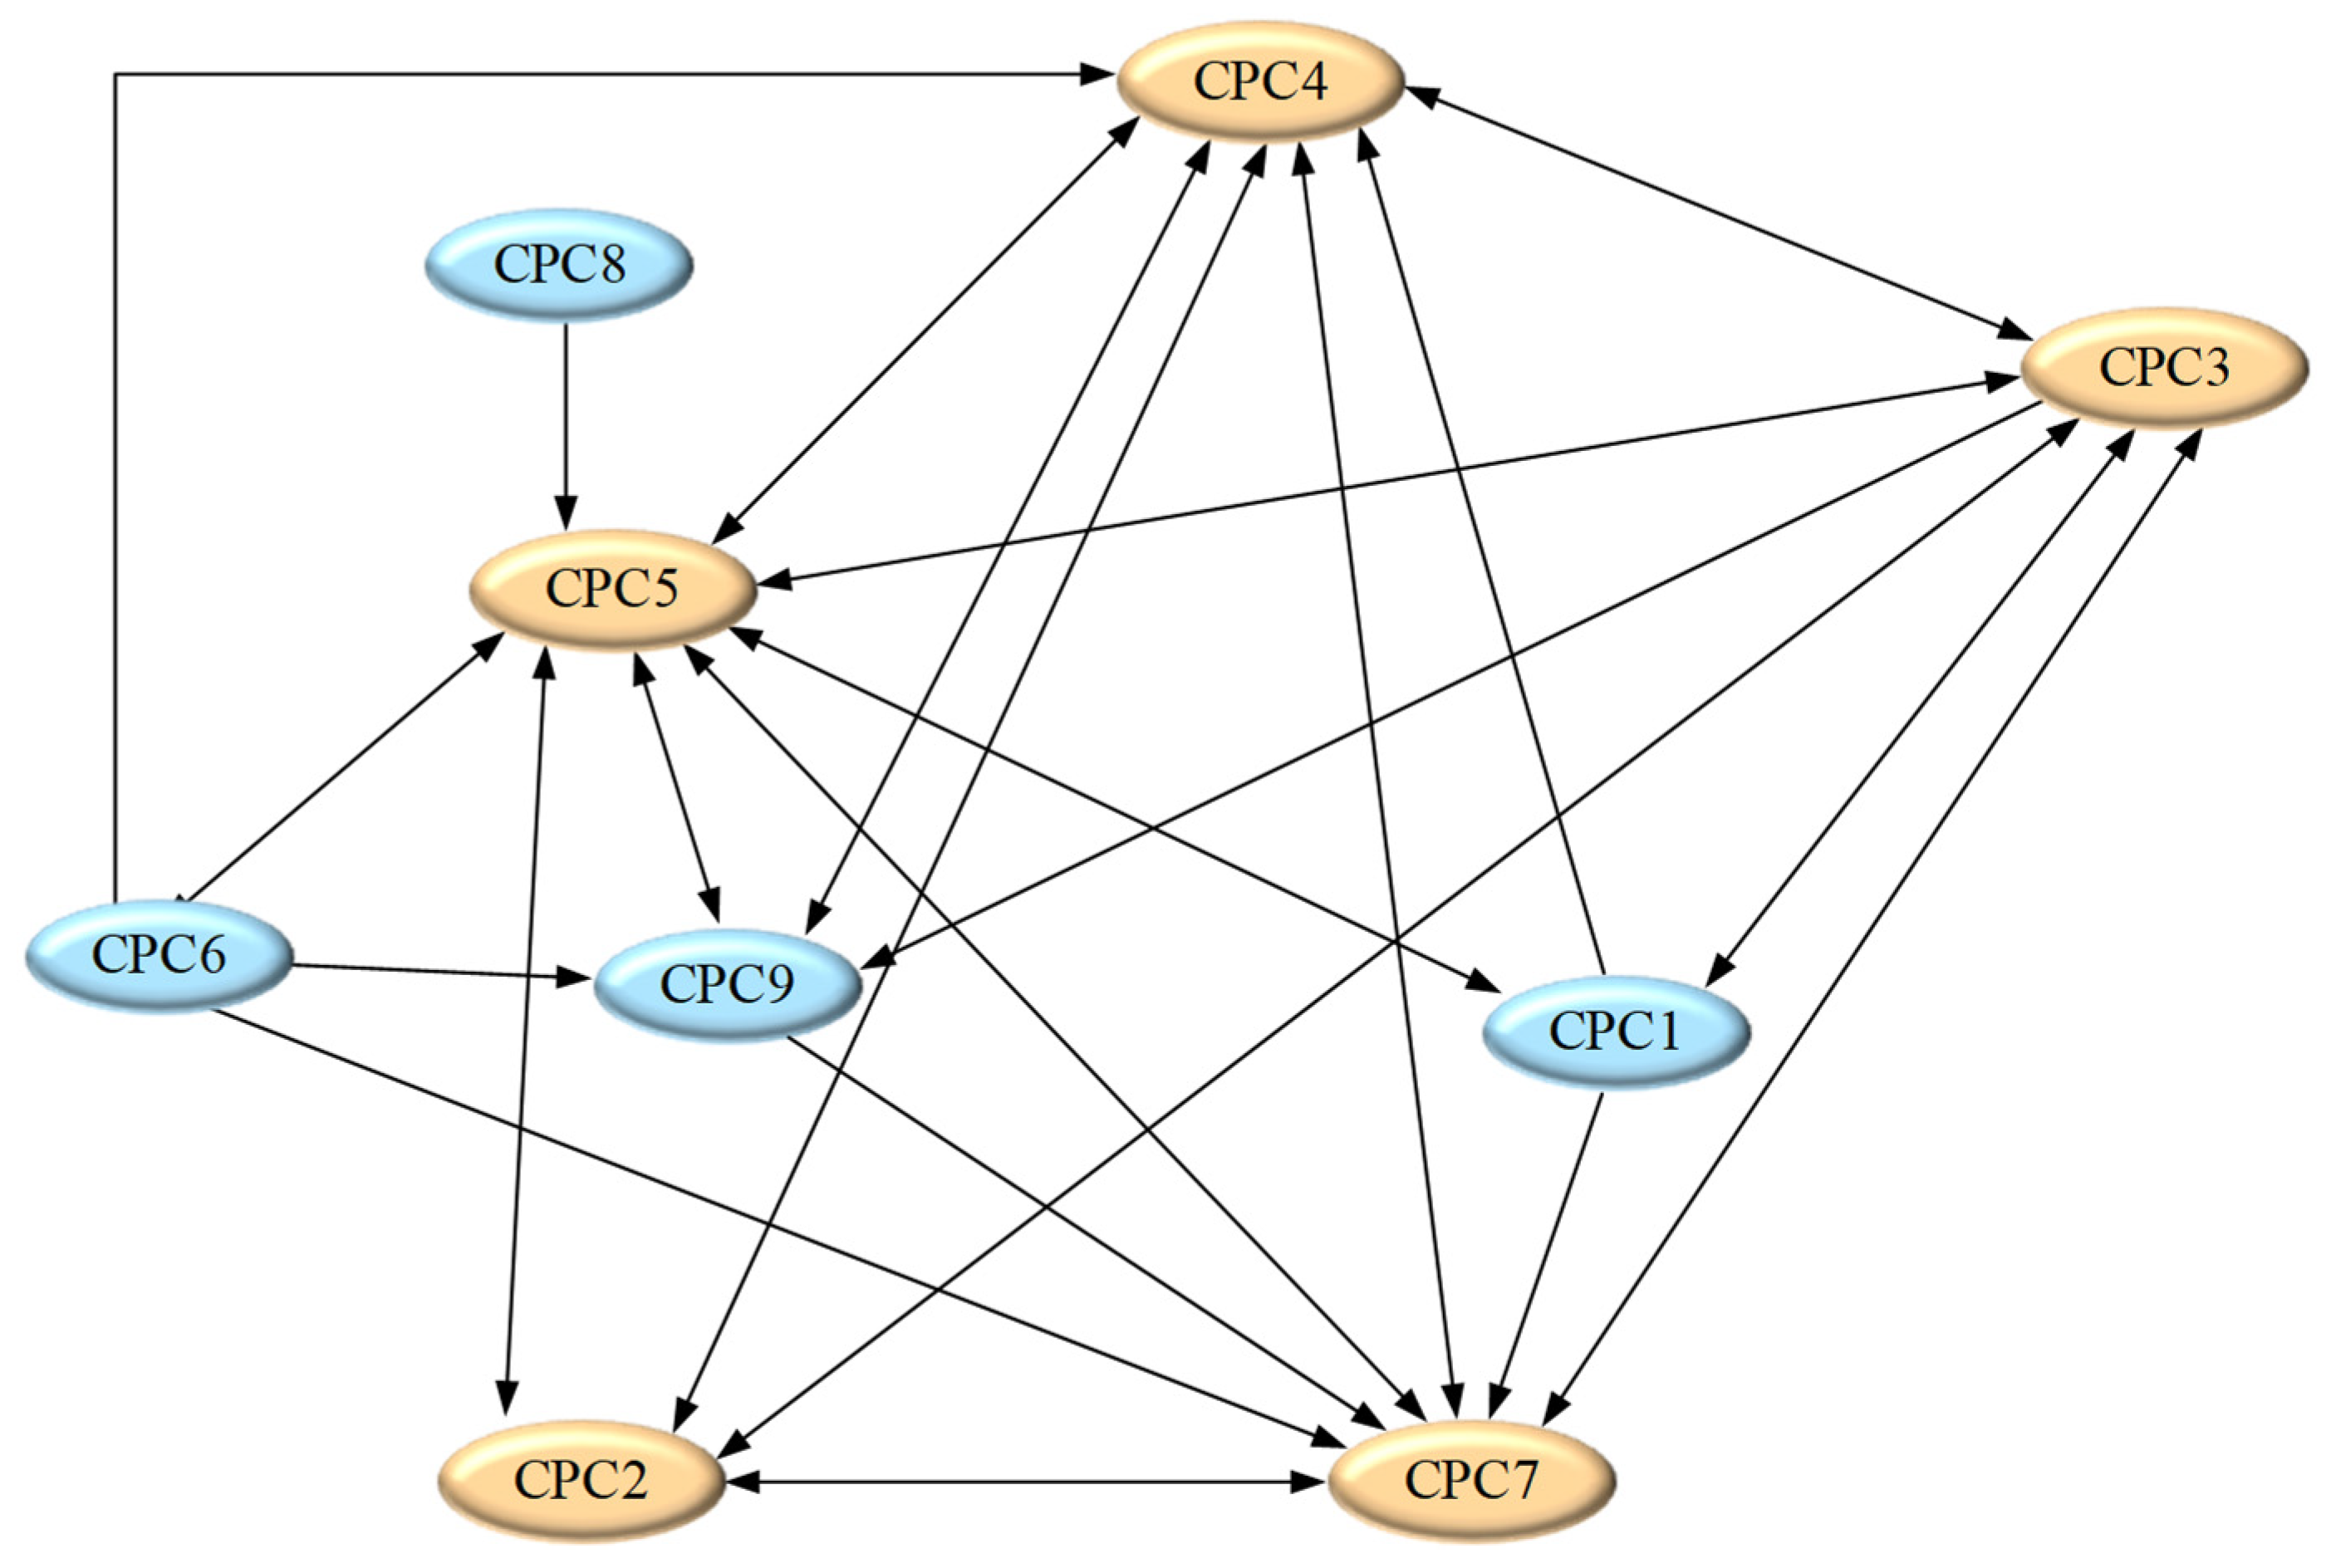
A visually simplified relationship matrix was developed to intuitively represent the interrelationships among CPCs. The threshold was set at the mean value of the full relational matrix, which can ensure a balanced cutoff, retaining significant inter-factor influences and filtering out negligible ones, thereby improving the stability and interpretability of the results. Only entries with tij greater than the threshold (i.e., the mean value of 0.6089) were retained to highlight the dominant interconnections among CPCs, thereby generating the simplified matrix T″, as shown in Table 13. The interactions between CPCs were visualized using the simplified matrix T″. The result is illustrated in Figure 5, where single arrows indicate unidirectional effects and double arrows indicate mutual effects.

4.3.3. The Cognitive Impact Weights of CPCs

The CREAM proposes that CPC levels influence cognitive function failures differently and that interactions among CPCs can modify these effects. This paper determined the effects and cognitive impact weights of cognitive function failures at each CPC level based on the traditional CREAM [33], and the results are shown in Table 14.
According to the effect adjustment rules of the CREAM, CPC2, CPC3, CPC4, CPC5, and CPC7 were adjusted, and the results are presented in Table 15. For instance, if three or more factors in the four dependent CPCs of CPC2 show consistent improvements or reductions in their original effects, CPC2 is adjusted accordingly. The cognitive impact weights of CPCs on cognitive function failures were derived through a combined analysis, and the results are shown in Table 16.

4.4. Calculation of the Cognitive Failure Probability Related to IVIS

The factor centrality weights of HIFs and CPCs were obtained based on the above analysis. The weight vi for HIFs was obtained from Table 10. The weight wi for CPCs was obtained from Table 12. The cognitive impact weight uis for CPCs was obtained from Table 16. For subtask 1.2.2, the comprehensive weight was calculated using Equation (11), with the corresponding result listed in the last column of Table 17, yielding a combined weight of 19.568. Then, using Equation (12), the CFP was calculated as 0.196 (0.010 × 19.568 ≈ 0.196). Similarly, the CFPs for other subtasks can be obtained, as shown in Table 18.

4.5. Recommendations for Design Improvements Related to IVIS

In interaction design, design improvements can lead to new usability issues [62]; therefore, the most critical problems must be prioritized for identification and resolution. The subtasks with the top 50% of CFPs were analyzed in depth (see Table 17). Task 1.2.2 (Select a frequently used destination) and task 1.3.3.2 (Add waypoints) exhibited the highest CFPs, with cognitive function failures P1 (Priority error) and P2 (Inadequate plan) occurring. Next, task 1.1 (Click on the navigation icon), task 1.3.2 (View navigation information), 1.3.4 (Return and continue navigation), and 1.4.2 (Click the home icon) showed cognitive function failures O2 (Wrong identification) and O3 (Observation not made).
To explore the causes of human error, the CREAM cause–effect matrix created by Hollnagel was employed to analyze the types of cognitive function failures and match the corresponding effects with causes [33]. A cause analysis was conducted based on the physiological and psychological characteristics of drivers, followed by the proposal of improvement measures [58,63]. First, for Priority error and Inadequate plan among the plan functions, the causes of human error included legitimate higher priorities, inattention, communication failures, uncertainty, distraction, errors in goals, design failures, parallel tasks, and excessive demands. Corresponding design improvements included optimizing the interface hierarchy, reducing distractions from secondary information, and providing timely interactive feedback (corrective actions for cognitive function failures P1 and P2). Then, for Wrong identification and Missed observation among the observation functions, the causes of human error included erroneous information, ambiguous symbol sets, missing information, ambiguous signals, information overload, hidden information, and multiple signals. Design improvements were focused on optimizing the interface layout, enhancing the visual style of the interface, and rationalizing the simultaneous presentation of information (corrective actions for cognitive function failures O2 and O3).

5. Discussion

This paper introduces a hybrid approach that combines the CREAM, FCE, and DEMATEL for human reliability analysis, focusing on cognitive demands in interaction design. By integrating FCE with the traditional CREAM, the subjectivity of expert evaluations in assessing CPC levels was reduced, enhancing the accuracy of the assessment. Additionally, the impact of HIFs and CPCs on cognitive function failures was comprehensively considered. To quantify the factor centrality weights of HIFs and CPCs, DEMATEL was employed, allowing for the analysis of the correlations between CPCs. Furthermore, to provide valuable insights for optimizing interaction design, the underlying causes of human error were explored. A case study of an IVIS design was conducted to demonstrate the proposed approach.
Based on the analysis of drivers using the in-vehicle navigation functions of the original IVIS, cognitive errors can be categorized into misinterpretation of functional information and misperception of visual symbols. The physiological and psychological characteristics of drivers contribute to these errors, with causes such as cognitive biases and workload leading to prioritization errors and misinterpretation during interaction. Additionally, failures in IVIS interface design and excessive task demands result in information overload and low visibility. Design improvements are proposed to mitigate human error in the IVIS.
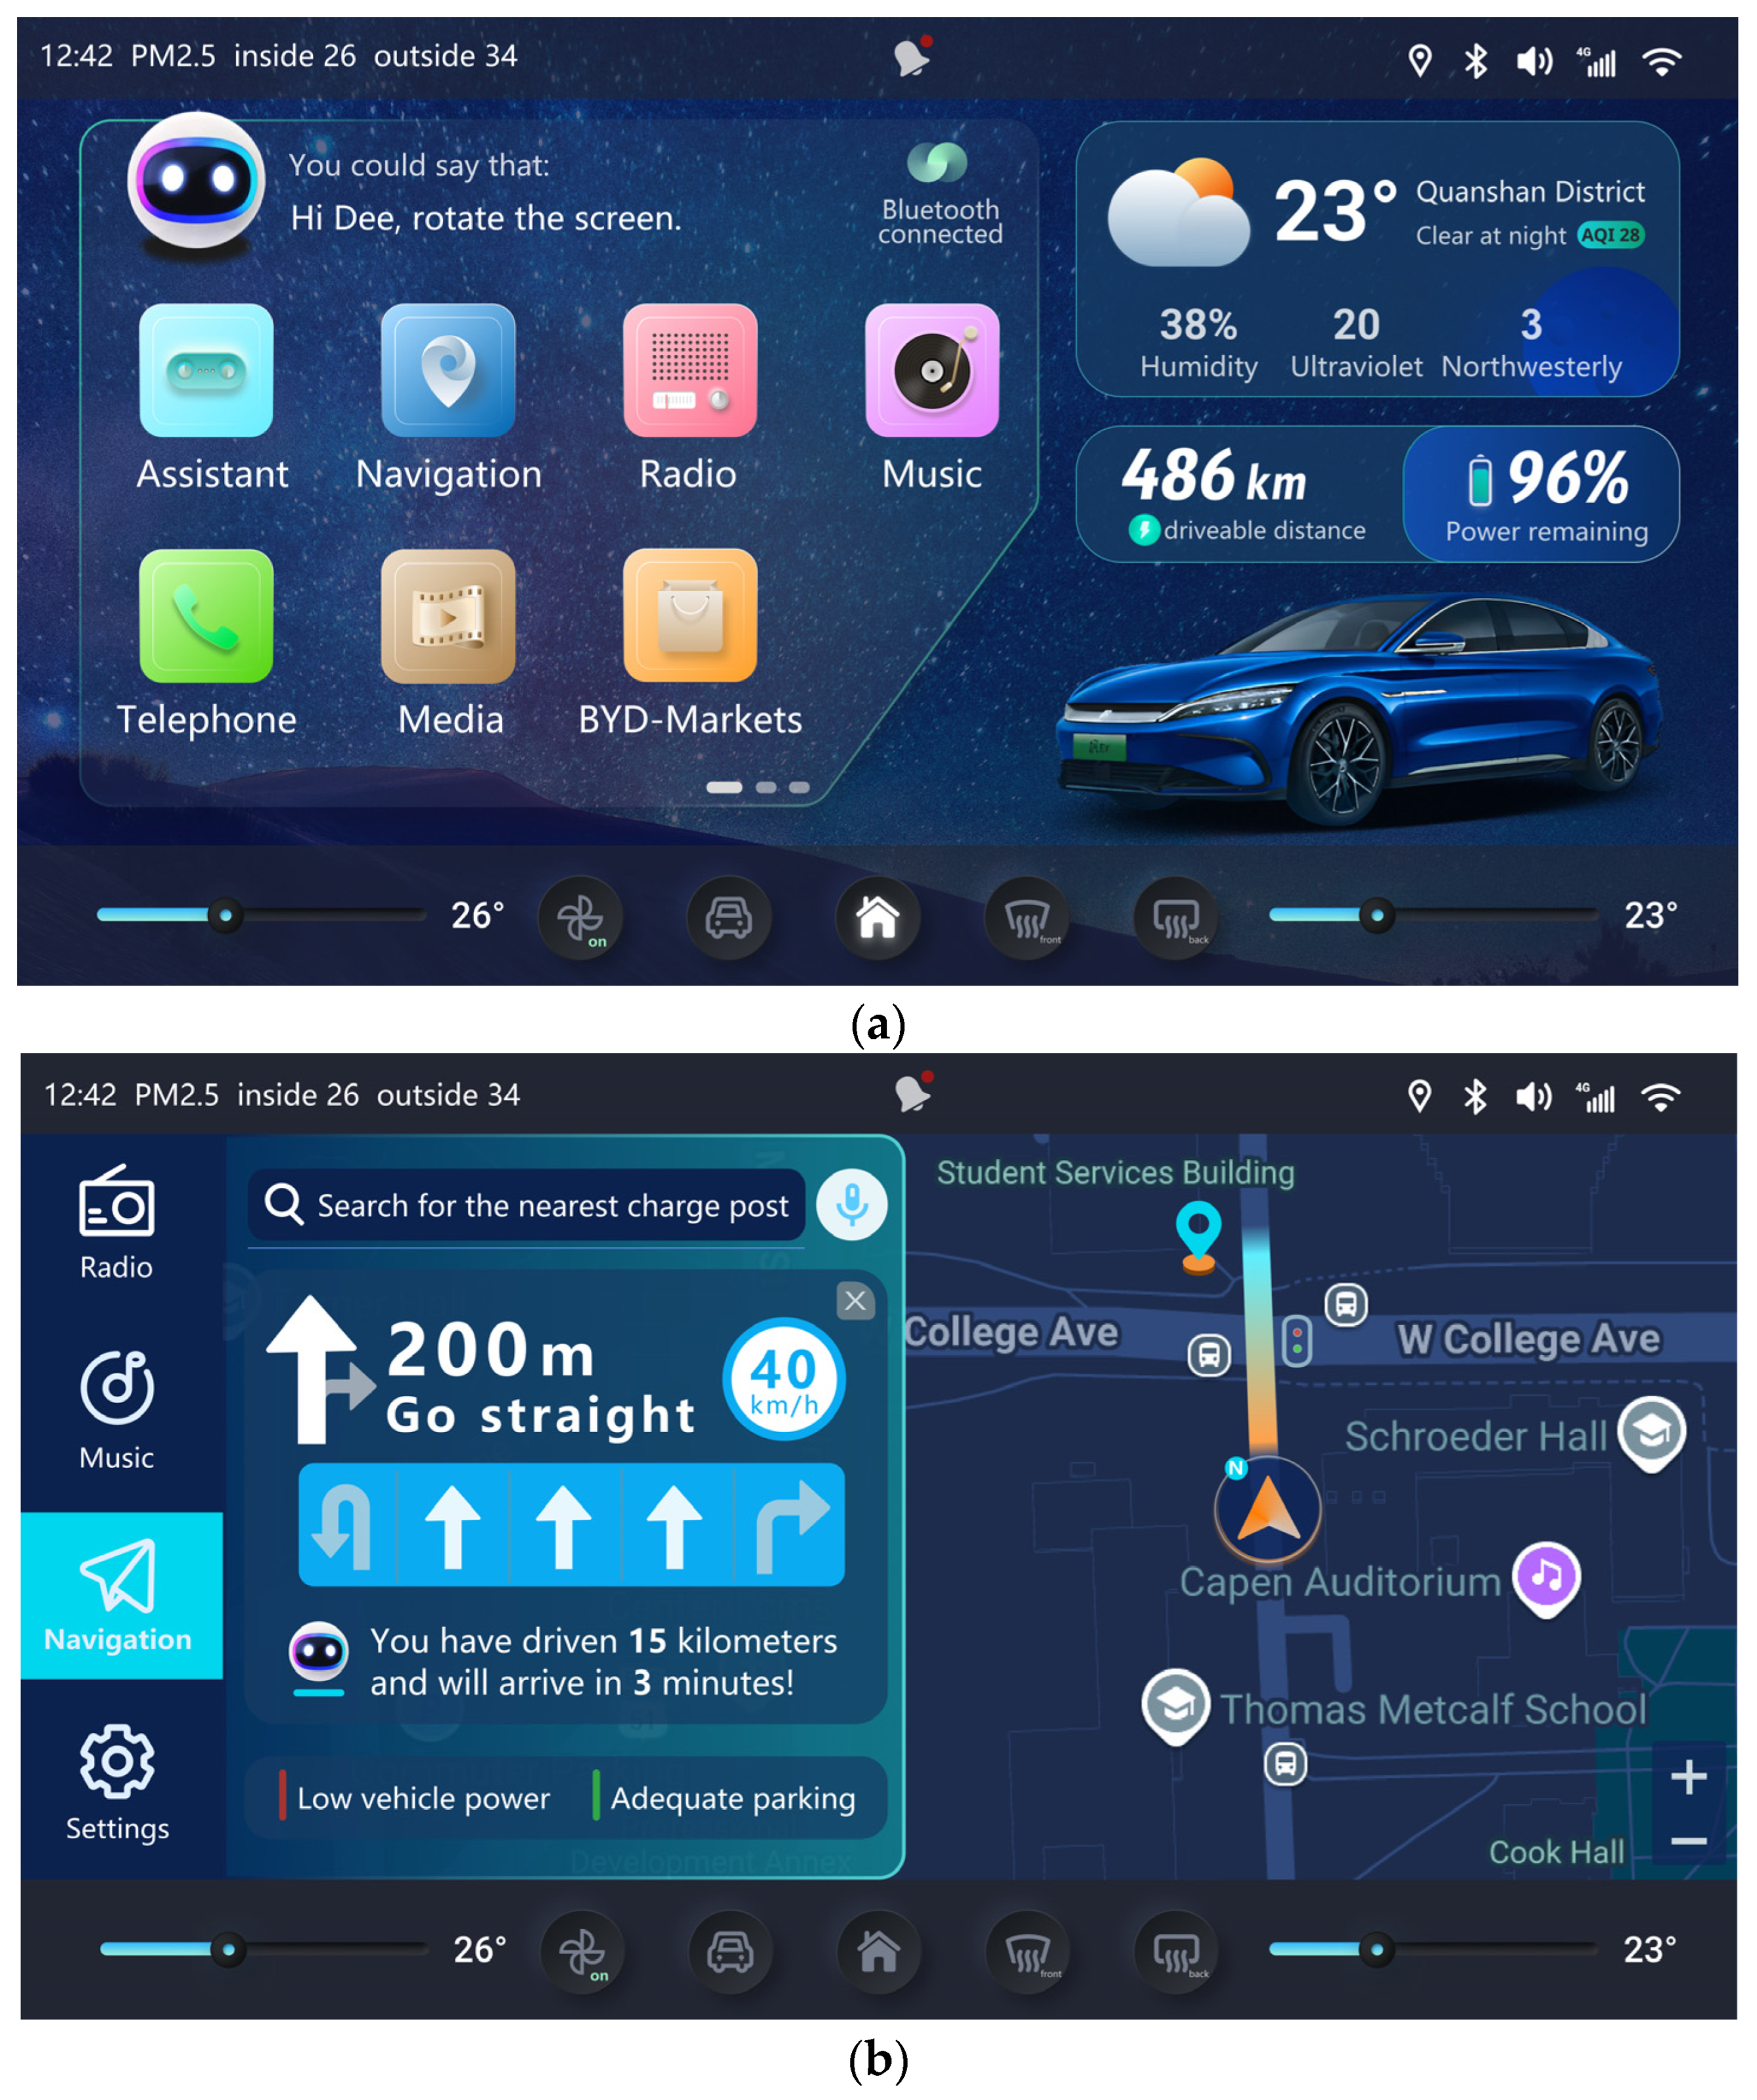
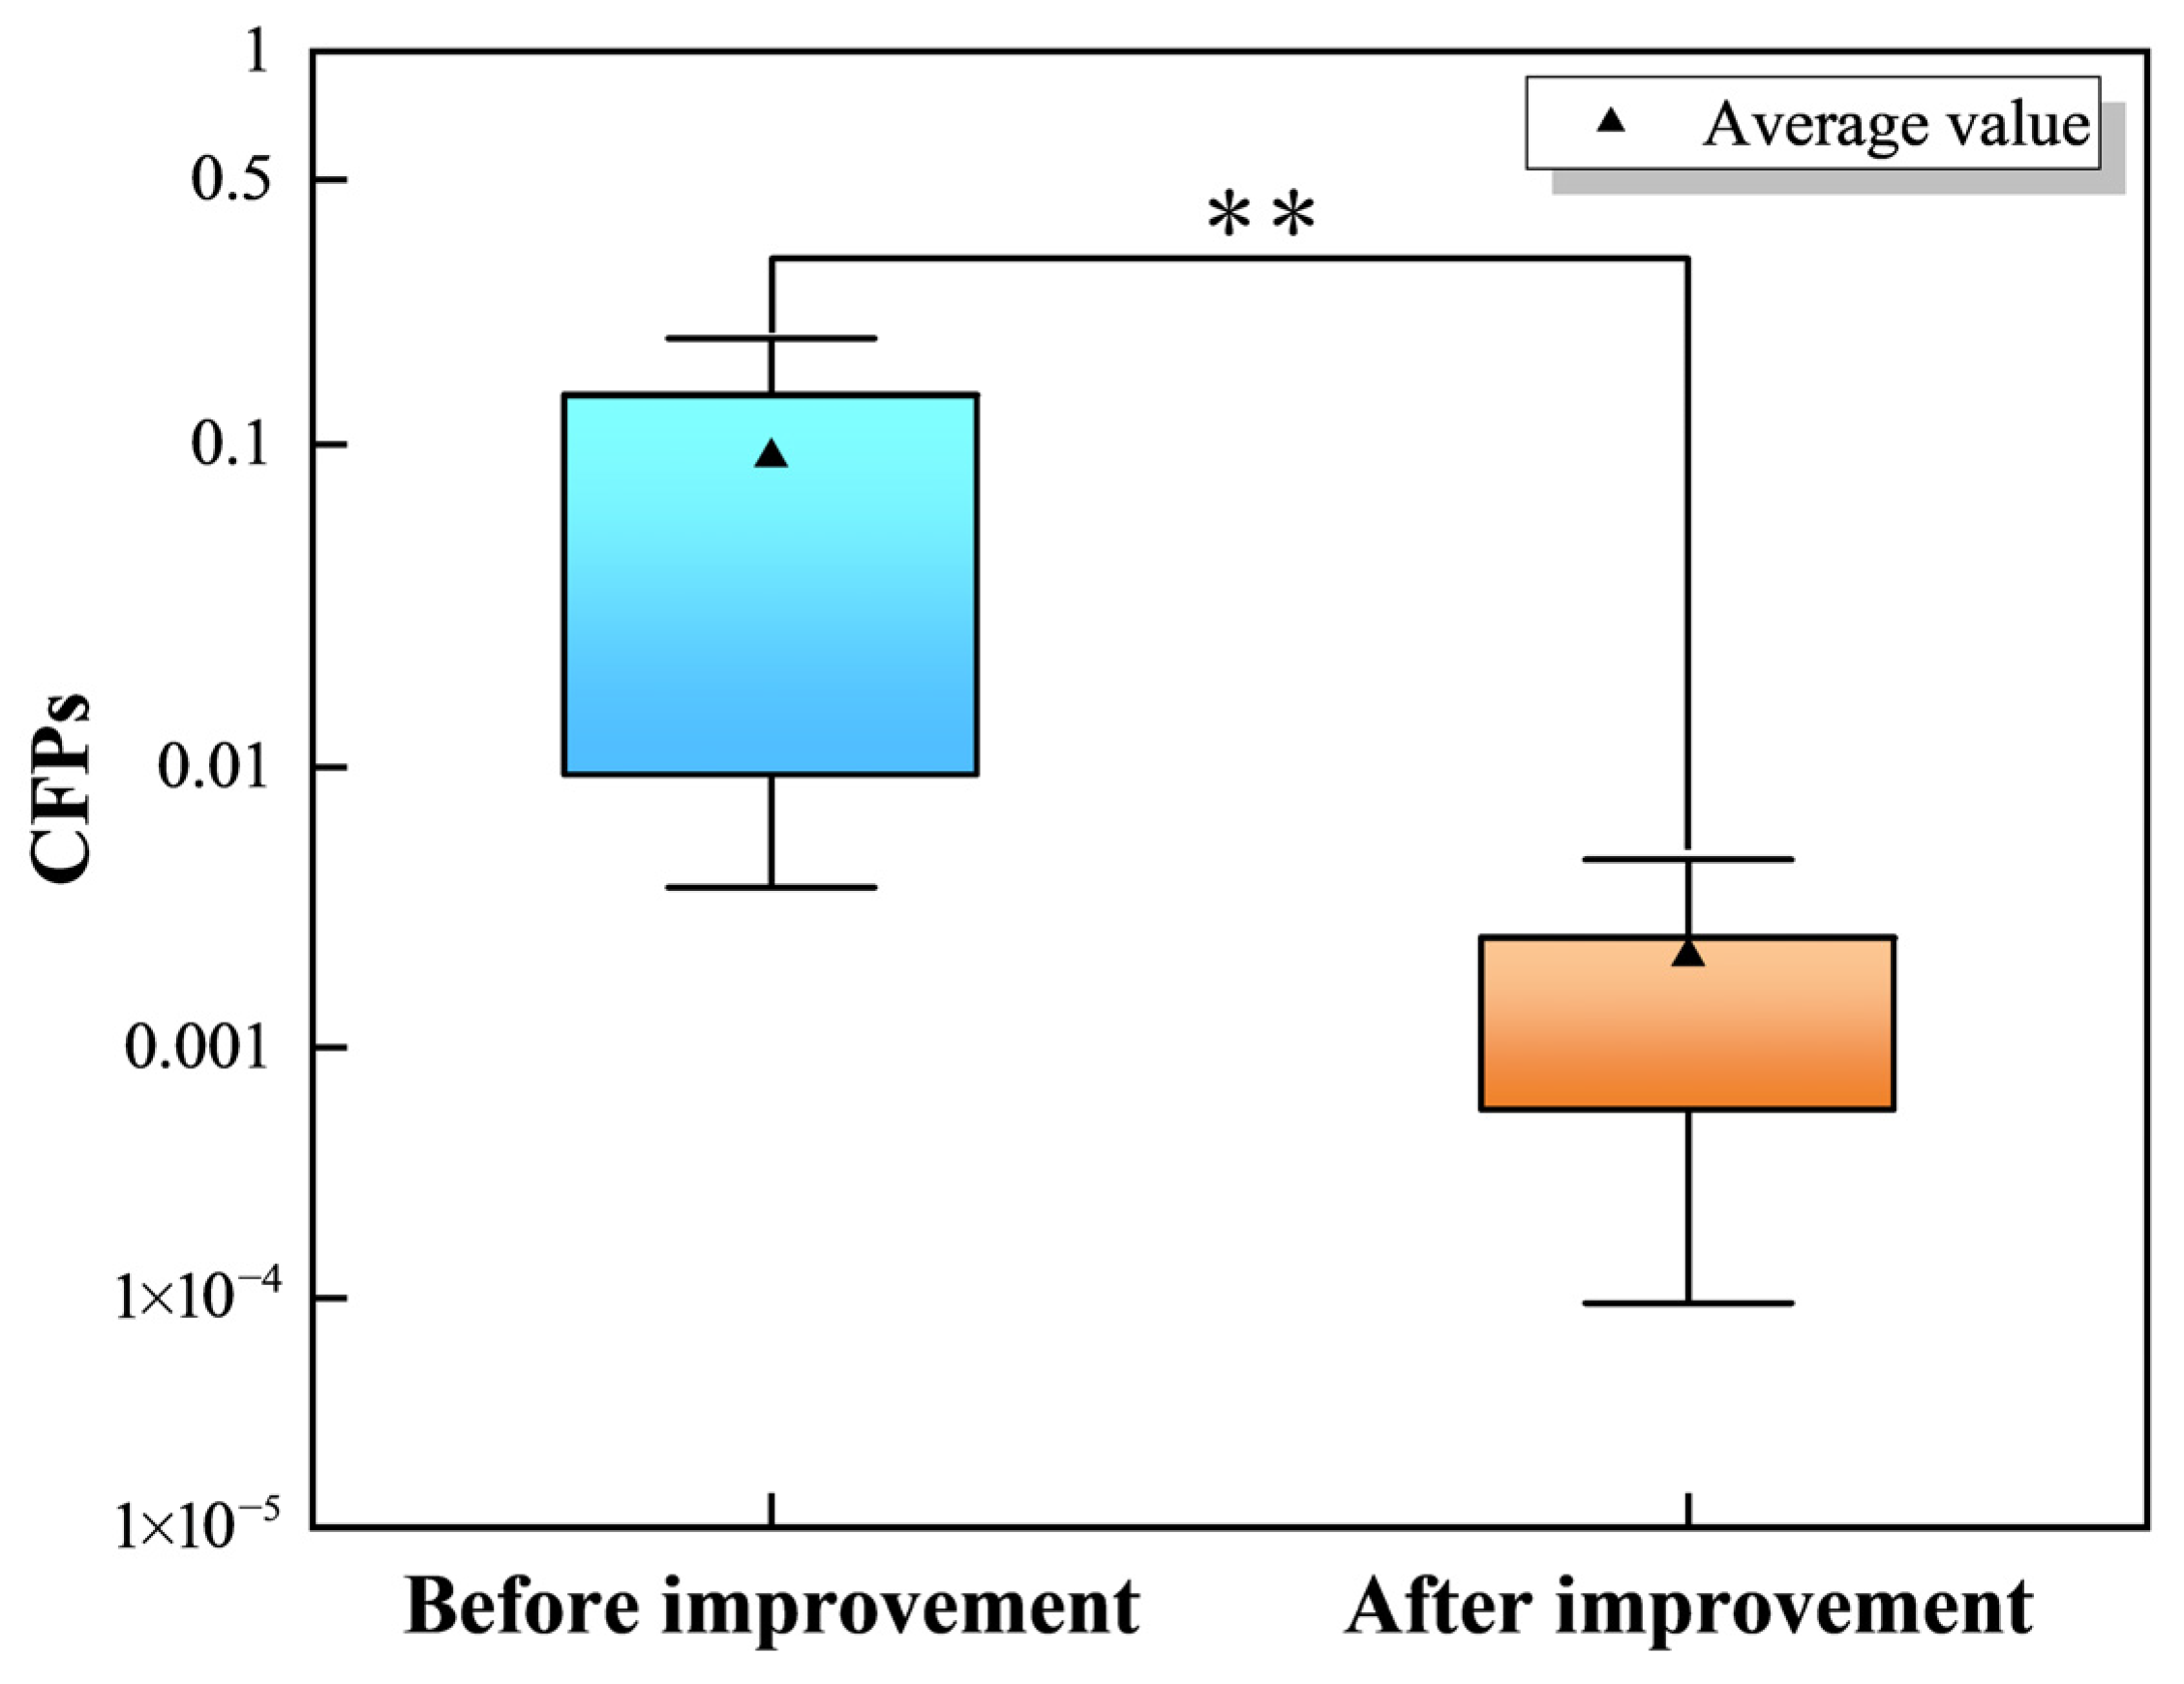
The main page and the navigation page of the revised IVIS are presented in Figure 6. The research team reanalyzed the revised IVIS, and post-improvement CFPs were reassessed using the same method as the pre-improvement CFPs. To compare the CFPs before and after the improvement, A/B testing was employed. As a widely used method in human–computer interaction research, A/B testing allows for evaluating two versions of a design to identify the statistically more effective one [64]. The results showed that CFPs after improvement (M = 0.002, SD = 0.002) were significantly lower than CFPs before improvement (M = 0.092, SD = 0.078), t(10) = 3.79, p = 0.004. The box plot is shown in Figure 7, and the CFPs before and after improvement are marked using two * symbols, indicating a significant difference between the two groups. These results suggest a significant difference in CFPs during task completion with the revised IVIS, demonstrating the effectiveness of the proposed improvements and confirming the human reliability of the improved interaction system, thus validating the proposed methodology.
To further elaborate on the design improvement measures and their correlation with CPCs and HIFs, four optimization strategies were implemented to achieve a significant reduction in CFP, with their specific mapping relationships clarified as follows: (1) UI layout optimization, which effectively improved the visual attention allocation of CPCs; (2) feedback timing optimization, which reduced the response delay of HIFs; (3) icon redesign, which alleviated the cognitive ambiguity of HIFs; (4) hierarchy adjustment, which enhanced the information processing efficiency of CPCs. In addition, the reliability of the post-improvement CFP values was verified by two complementary methods: recalculation based on updated CPCs assessments, and repeated user experiments involving 30 subjects, which further confirmed the robustness of the improvement effects.
In order to consider the impact of CPC correlations on cognitive function failures, the traditional CREAM proposes basic adjustment rules. However, in the practical application of human reliability analysis for interactive systems, CPCs should be adjusted based on their interaction. To analyze the interrelationships among CPCs, the proposed method used DEMATEL. In the IVIS case study, the effects of CPCs were adjusted for interrelationships and the adjustment rules. For example, the original effect of CPC2 was not significant, and the adjusted effect was reduced. The proposed method provides a more accurate understanding of the effects of CPCs on cognitive function failures.
HIFs play a crucial role in user-centered interaction design, especially among IVIS users. However, the traditional CREAM does not focus on the impact of HIFs on human error in interactive systems during human reliability analysis. The proposed method identifies nine HIFs relevant to interactive systems operations and uses DEMATEL to examine their influence on human error. It also integrates the combined weights of CPCs and HIFs when calculating the CFPs. As a result, this approach offers more accurate outcomes, improving effectiveness and adaptability in practice.
To clarify the differences between the proposed method and related methods (including the traditional CREAM, single FCE, and single DEMATEL) in terms of output results and uncertainty handling, the details are presented in Table 19. Compared with these related methods, the proposed method has the following innovation points: it constructs a human–computer interaction-specific CPC/HIF system, adopts DEMATEL for causal structure analysis of factors, uses FCE for quantitative assessment of factor levels, and integrates these three methods through a normalized product integration formula to form a systematic cognitive reliability analysis pipeline for interaction design.
This study was primarily conducted with drivers as the representative sample. Future research could include a broader range of participants to improve the applicability of the results. To resolve the limitations of the traditional CREAM in analyzing the interrelationships among CPCs, this study used DEMATEL to explore the interaction effects within interactive systems. This paper focused on CPC analysis and excluded the analysis of interaction among HIFs. Future research will investigate the mutual influences of HIFs to enhance human reliability analysis. Furthermore, this study mainly focused on identifying human errors and the causes of cognitive function failures. The interrelationship between cognitive function failures has not been explored in depth. Bayesian network analysis can be employed to explore the interrelationships among factors [26,37]. Bayesian network analysis effectively handles conditional dependencies, providing more accurate insights for optimizing human–computer interaction [65,66]. To comprehensively analyze human error in interactive systems, future research could integrate Bayesian networks with the proposed method to analyze the interrelationships among CPCs and the relationships between cognitive function failures. To ensure participant safety, the tests were conducted in static scenarios; however, future studies are planned for dynamic scenarios.
The proposed approach is relatively complex and involves multiple computational steps. Nevertheless, it is implemented systematically. More importantly, the approach integrates five well-defined simplification steps: analysis of cognitive function failures, assessment of CPC levels, calculation of HIF and CPC weights, calculation of the CFP, and recommendations for design improvements. With these detailed and standardized steps, the proposed approach is sufficiently reproducible. Although an IVIS was used as a case study, the approach is generalizable to other interactive systems for human error reduction. Future work will further validate and extend the approach by incorporating additional application cases.


6. Conclusions

This paper presents an approach for human reliability analysis in interactive systems design based on the CREAM, FCE, and DEMATEL. The approach employs the CREAM to analyze the cognitive demands of users in interactive systems. FCE is used to enhance the objectivity of expert evaluations of CPCs. DEMATEL is applied to explore the factor centrality weights of CPCs and HIFs on cognitive function failures and to analyze the interactions among CPCs. The cognitive reliability analysis was conducted by combining the cognitive impact weights of CPCs. Based on the analysis of human errors, design improvements are proposed. This approach provides a comprehensive framework for human reliability analysis in interaction design. Practical validation shows that the proposed approach yields a statistically significant reduction in the cognitive failure probability of the target interactive system, thereby fully confirming its effectiveness in improving human reliability.
This paper focused on user and system design aspects. Future research will aim to expand the scope to include a more integrated human reliability analysis, considering all components contributing to human error. Additionally, the following key directions should be emphasized in future studies. First, researchers should recruit a more diverse group of subjects to increase the sample size and improve the generalizability of the results. Second, users’ physical and psychological factors should be integrated into the CPC-HIF evaluation system to optimize the model. Third, a real-time online optimization system should be developed for dynamic human–computer interaction design, further reducing cognitive failure probability.

Author Contributions

L.Z. conducted the experiments, analyzed the data, and revised the manuscript. Q.L. conducted the investigation and created visualizations. Y.L. conceived and designed the study. All authors have read and agreed to the published version of the manuscript.

Funding

This research received no external funding.

Institutional Review Board Statement

This study was conducted in accordance with the Declaration of Helsinki, and the protocol was approved by the Special Committee on Scientific Research Ethics, Academic Committee of Jiangsu Normal University (No. H2023-12), on 23 February 2023.

Informed Consent Statement

Informed consent for participation was obtained from all subjects involved in this study.

Data Availability Statement

The original contributions presented in this study are included in the article. Further inquiries can be directed to the corresponding author.

Conflicts of Interest

The authors declare no conflicts of interest.

Abbreviations

CFPCognitive failure probability
CPCsCommon performance conditions
CREAMCognitive reliability and error analysis method
DEMATELDecision-making trial and evaluation laboratory
FCEFuzzy comprehensive evaluation
HIFsHuman intrinsic factors
HRAHuman reliability analysis
HTAHierarchical task analysis
IVISIn-vehicle information system

References

  1. Rogers, Y.; Sharp, H.; Preece, J. Interaction Design: Beyond Human-Computer Interaction, 6th ed.; John Wiley & Sons, Inc.: Hoboken, NJ, USA, 2023. [Google Scholar]
  2. Mohammadfam, I.; Bascompta, M.; Khajevandi, A.; Dehghani, H. Modeling of causes and consequences of human error in mining processes design: A Qualitative Study. Sustainability 2022, 14, 14193. [Google Scholar] [CrossRef]
  3. Reason, J. Human Error; Cambridge University Press: New York, NY, USA, 1990. [Google Scholar]
  4. Benyon, D. Designing User Experience: A Guide to HCI, UX and Interaction Design, 4th ed.; Pearson: Harlow, UK, 2019. [Google Scholar]
  5. Li, Y.; Zhu, L. Failure modes analysis related to user experience in interactive system design through a fuzzy failure mode and effect analysis-based hybrid approach. Appl. Sci. 2025, 15, 2954. [Google Scholar] [CrossRef]
  6. Nielsen, J. Usability Engineering; Morgan Kaufmann: San Diego, CA, USA, 1993. [Google Scholar]
  7. Zarei, E.; Khan, F.; Abbassi, R. Importance of human reliability in process operation: A critical analysis. Reliab. Eng. Syst. Saf. 2021, 211, 107607. [Google Scholar] [CrossRef]
  8. Friederich, J.; Lazarova-Molnar, S. Reliability assessment of manufacturing systems: A comprehensive overview, challenges and opportunities. J. Manuf. Syst. 2024, 72, 38–58. [Google Scholar] [CrossRef]
  9. Fujita, Y.; Hollnagel, E. Failures without errors: Quantification of context in HRA. Reliab. Eng. Syst. Saf. 2004, 83, 145–151. [Google Scholar] [CrossRef]
  10. Swain, A.D. Human reliability analysis: Need, status, trends and limitations. Reliab. Eng. Syst. Saf. 1990, 29, 301–313. [Google Scholar] [CrossRef]
  11. Setayesh, A.; Di Pasquale, V.; Neumann, W.P. An inter-method comparison of four Human Reliability Assessment models. Appl. Ergon. 2022, 102, 103750. [Google Scholar] [CrossRef]
  12. Li, X.; Ge, F.L.; Lin, W.D.; Yang, F.Q. A risk assessment method to quantify the effect of human reliability on storage tank safety combining optimized CREAM and dynamic Bayesian network. Saf. Sci. 2025, 185, 106796. [Google Scholar] [CrossRef]
  13. Marseguerra, M.; Zio, E.; Librizzi, M. Quantitative developments in the cognitive reliability and error analysis method (CREAM) for the assessment of human performance. Ann. Nucl. Energy 2006, 33, 894–910. [Google Scholar] [CrossRef]
  14. Yu, Y.; Wu, S.; Fu, Y.; Liu, X.; Zeng, Q.; Ding, H.; Pan, Y.; Wu, Y.; Guo, H.; Yang, Y. Human reliability analysis of offshore high integrity pressure protection system based on improved CREAM and HCR integration method. Ocean Eng. 2024, 307, 118153. [Google Scholar] [CrossRef]
  15. Chen, X.; Liu, X.; Qin, Y. An extended CREAM model based on analytic network process under the type-2 fuzzy environment for human reliability analysis in the high-speed train operation. Qual. Reliab. Eng. Int. 2021, 37, 284–308. [Google Scholar] [CrossRef]
  16. Elidolu, G.; Akyuz, E.; Arslan, O.; Arslanoğlu, Y. Quantitative failure analysis for static electricity-related explosion and fire accidents on tanker vessels under fuzzy bow-tie CREAM approach. Eng. Fail. Anal. 2022, 131, 105917. [Google Scholar] [CrossRef]
  17. La Fata, C.M.; Adelfio, L.; Micale, R.; La Scalia, G. Human error contribution to accidents in the manufacturing sector: A structured approach to evaluate the interdependence among performance shaping factors. Saf. Sci. 2023, 161, 106067. [Google Scholar] [CrossRef]
  18. Pei, H.; Gong, H.; Ding, M.; Ma, Y.; Wang, Z.; Xin, Q. A CREAM model optimization method based on fatigue testing experiments and machine learning techniques for maritime transportation applications. Ocean Eng. 2024, 311, 118868. [Google Scholar] [CrossRef]
  19. He, Y.; Kuai, N.-S.; Deng, L.-M.; He, X.-Y. A method for assessing human error probability through physiological and psychological factors tests based on CREAM and its applications. Reliab. Eng. Syst. Saf. 2021, 215, 107884. [Google Scholar] [CrossRef]
  20. Ahn, S.I.; Kurt, R.E. Application of a CREAM based framework to assess human reliability in emergency response to engine room fires on ships. Ocean Eng. 2020, 216, 108078. [Google Scholar] [CrossRef]
  21. Xi, X.; Qin, Q. Product quality evaluation system based on AHP fuzzy comprehensive evaluation. J. Ind. Eng. Manag. (JIEM) 2013, 6, 356–366. [Google Scholar] [CrossRef][Green Version]
  22. Li, Y.; Sun, Z.; Han, L.; Mei, N. Fuzzy comprehensive evaluation method for energy management systems based on an internet of things. IEEE Access 2017, 5, 21312–21322. [Google Scholar] [CrossRef]
  23. Zhong, J.; Li, Z.; Zhang, D.; Yang, J.; Zhu, J. An evaluation framework for urban ecological compensation priority in China based on meta-analysis and fuzzy comprehensive evaluation. Ecol. Indic. 2024, 158, 111–125. [Google Scholar]
  24. Hou, J.; Gao, T.; Yang, Y.; Wang, X.; Yang, Y.; Meng, S. Battery inconsistency evaluation based on hierarchical weight fusion and fuzzy comprehensive evaluation method. J. Energy Storage 2024, 84, 110878. [Google Scholar] [CrossRef]
  25. Sezer, S.I.; Elidolu, G.; Aydin, M.; Ahn, S.I.; Akyuz, E.; Kurt, R.E. Analyzing human reliability for the operation of cargo oil pump using fuzzy CREAM extended Bayesian Network (BN). Ocean Eng. 2024, 299, 117345. [Google Scholar] [CrossRef]
  26. Ashrafi, M.; Davoudpour, H.; Khodakarami, V. A Bayesian network to ease knowledge acquisition of causal dependence in CREAM: Application of recursive noisy-OR gates. Qual. Reliab. Eng. Int. 2017, 33, 479–491. [Google Scholar] [CrossRef]
  27. Thakkar, J.J. Decision-making trial and evaluation laboratory (DEMATEL). In Multi-Criteria Decision Making; Springer: Singapore, 2021; pp. 139–159. [Google Scholar]
  28. Zhang, H.; Chen, S.; Wang, C.; Deng, Y.; Zhang, Y.; Dai, R. Analysis of factors affecting space teleoperation safety performance based on a hybrid fuzzy DEMATEL method. Space Sci. Technol. 2024, 4, 140. [Google Scholar]
  29. Shi, H.; Wang, J.H.; Zhang, L.; Liu, H.C. New improved CREAM model for human reliability analysis using a linguistic D number-based hybrid decision making approach. Eng. Appl. Artif. Intell. 2023, 120, 105896. [Google Scholar] [CrossRef]
  30. Liu, H.C.; You, J.X.; Shan, M.M.; Su, Q. Systematic failure mode and effect analysis using a hybrid multiple criteria decision-making approach. Total Qual. Manag. Bus. Excell. 2019, 30, 537–564. [Google Scholar]
  31. Huang, Q.Y.; Wei, Y.N.; Zhang, J.Y.; Xu, X.C.; Jin, X.P. A comprehensive CREAM method for human reliability analysis of armored vehicle crews based on cognitive performance and operational environment. Risk Anal. 2025, 45, 2736–2758. [Google Scholar] [CrossRef]
  32. Ruiz-Pastor, L.; Chulvi, V.; Mulet, E.; Royo, M. The relationship between personal intrinsic factors towards a design problem and the degree of novelty and circularity. Res. Eng. Des. 2022, 33, 7–30. [Google Scholar]
  33. Hollnagel, E. Cognitive Reliability and Error Analysis Method (CREAM); Elsevier Science Ltd.: New York, NY, USA, 1998. [Google Scholar]
  34. Lee, D.; Kim, H.; Koo, K.; Kwon, S. Human reliability analysis for fishing vessels in Korea using cognitive reliability and error analysis method (CREAM). Sustainability 2024, 16, 3780. [Google Scholar] [CrossRef]
  35. Modares, A.; Bafandegan Emroozi, V.; Gholinezhad, H.; Modares, A. An integrated Cognitive Reliability and Error Analysis Method (CREAM) and optimization for enhancing human reliability in blockchain. Decis. Anal. J. 2024, 12, 100506. [Google Scholar] [CrossRef]
  36. Hamza, M.; Diaconeasa, M.A. Investigating the applicability of human reliability analysis methods during early design stages of non-light-water nuclear power plants. Prog. Nucl. Energy 2023, 161, 104716. [Google Scholar] [CrossRef]
  37. Chen, J.; Zhou, D.; Lyu, C.; Zhu, X. A method of human reliability analysis and quantification for space missions based on a Bayesian network and the cognitive reliability and error analysis method. Qual. Reliab. Eng. Int. 2018, 34, 912–927. [Google Scholar] [CrossRef]
  38. Wu, B.; Yip, T.L.; Yan, X.; Guedes Soares, C. Review of techniques and challenges of human and organizational factors analysis in maritime transportation. Reliab. Eng. Syst. Saf. 2022, 219, 108249. [Google Scholar] [CrossRef]
  39. Garg, V.; Vinod, G.; Kant, V. Auto-CREAM: Software application for evaluation of HEP with basic and extended CREAM for PSA studies. Reliab. Eng. Syst. Saf. 2023, 236, 109318. [Google Scholar] [CrossRef]
  40. Wu, B.; Yan, X.; Wang, Y.; Soares, C.G. An evidential reasoning-based CREAM to human reliability analysis in maritime accident process. Risk Anal. 2017, 37, 1936–1957. [Google Scholar] [CrossRef]
  41. Feng, S.; Xu, L.D. Decision support for fuzzy comprehensive evaluation of urban development. Fuzzy Sets Syst. 1999, 105, 1–12. [Google Scholar] [CrossRef]
  42. Hao, Y.Y.; Hasna, M.F.; Aziz, F.A. Integrating LDA thematic model, FCE, and QFD methods for consumer-centered visual planning of the creative tourism destination: A macrosystem decision approach. Appl. Soft Comput. 2025, 177, 113299. [Google Scholar] [CrossRef]
  43. Mei, Y.; Ye, J.; Zeng, Z. Entropy-weighted ANP fuzzy comprehensive evaluation of interim product production schemes in one-of-a-kind production. Comput. Ind. Eng. 2016, 100, 144–152. [Google Scholar] [CrossRef]
  44. Wang, G.; Li, J.; Shen, L.; Ding, S.; Shi, Z.; Zuo, F. Towards efficient and accurate prediction of freeway accident severity using two-level fuzzy comprehensive evaluation. Heliyon 2024, 10, e36396. [Google Scholar] [CrossRef]
  45. Fontela, E.; Gabus, A. DEMATEL: Progress achieved. Futures 1974, 6, 361–363. [Google Scholar] [CrossRef]
  46. Kang, J.; Wang, H.; Jin, H.; Wang, Z.X.; Zhang, J.X. Risk analysis and management of hydrogen station fire and explosion accidents using DEMATEL-ISM and complex network models. Int. J. Hydrogen Energy 2025, 136, 1230–1241. [Google Scholar] [CrossRef]
  47. Feng, J.K.; Li, W.B.; Lu, D.H.; Deng, J.; Wang, Y. Risk factor analysis of elevator brake failure based on DEMATEL-ISM. Appl. Sci. 2025, 15, 3934. [Google Scholar] [CrossRef]
  48. Shepherd, A. HTA as a framework for task analysis. Ergonomics 1998, 41, 1537–1552. [Google Scholar] [CrossRef]
  49. Mandal, S.; Singh, K.; Behera, R.K.; Sahu, S.K.; Raj, N.; Maiti, J. Human error identification and risk prioritization in overhead crane operations using HTA, SHERPA and fuzzy VIKOR method. Expert Syst. Appl. 2015, 42, 7195–7206. [Google Scholar] [CrossRef]
  50. Ruiz, J.; Serral, E.; Snoeck, M. Unifying functional user interface design principles. Int. J. Hum.–Comput. Interact. 2021, 37, 47–67. [Google Scholar]
  51. Ma, J.; Gong, Z.Y.; Tan, J.J.; Zhang, Q.W.; Zuo, Y.Y. Assessing the driving distraction effect of vehicle HMI displays using data mining techniques. Transp. Res. Part F Psychol. Behav. 2020, 69, 235–250. [Google Scholar] [CrossRef]
  52. Metz, B.; Landau, A.; Just, M. Frequency of secondary tasks in driving—Results from naturalistic driving data. Saf. Sci. 2014, 68, 195–203. [Google Scholar]
  53. Graichen, L.; Graichen, M. Do users desire gestures for in-vehicle interaction? Towards the subjective assessment of gestures in a high-fidelity driving simulator. Comput. Hum. Behav. 2024, 156, 108189. [Google Scholar]
  54. Tabone, W.; Happee, R.; García, J.; Lee, Y.M.; Lupetti, M.L.; Merat, N.; de Winter, J. Augmented reality interfaces for pedestrian-vehicle interactions: An online study. Transp. Res. Part F Traffic Psychol. Behav. 2023, 94, 170–189. [Google Scholar]
  55. Antrobus, V.; Large, D.; Burnett, G.; Hare, C. Enhancing environmental engagement with natural language interfaces for in-vehicle navigation systems. J. Navig. 2019, 72, 513–527. [Google Scholar] [CrossRef]
  56. Kim, B.; Baek, Y. Sensor-based extraction approaches of in-vehicle information for driver behavior analysis. Sensors 2020, 20, 5197. [Google Scholar]
  57. Voinescu, A.; Morgan, P.L.; Alford, C.; Caleb-Solly, P. The utility of psychological measures in evaluating perceived usability of automated vehicle interfaces—A study with older adults. Transp. Res. Part F Traffic Psychol. Behav. 2020, 72, 244–263. [Google Scholar] [CrossRef]
  58. Young, K.L.; Koppel, S.; Charlton, J.L. Toward best practice in human machine interface design for older drivers: A review of current design guidelines. Accid. Anal. Prev. 2017, 106, 460–467. [Google Scholar] [CrossRef]
  59. Zhang, F.; Roberts, S.C. Factors affecting drivers’ off-road glance behavior while interacting with in-vehicle voice interfaces. Accid. Anal. Prev. 2023, 179, 106883. [Google Scholar] [CrossRef]
  60. Graichen, L.; Graichen, M.; Krems, J.F. Evaluation of gesture-based in-vehicle interaction: User experience and the potential to reduce driver distraction. Hum. Factors 2019, 61, 774–792. [Google Scholar] [PubMed]
  61. Park, J.; Zahabi, M.; Blanchard, S.; Zheng, X.; Ory, M.; Benden, M. A novel autonomous vehicle interface for older adults with cognitive impairment. Appl. Ergon. 2023, 113, 104080. [Google Scholar] [CrossRef] [PubMed]
  62. Nielsen, J.; Budiu, R. Mobile Usability; New Riders: Berkeley, CA, USA, 2013. [Google Scholar]
  63. Wu, J.F.; Jiao, D.F.; Lu, C.F.; Li, C.M.; Huang, X.F.; Weng, S.Z. How do older adults process icons in visual search tasks? the combined effects of icon type and cognitive aging. Int. J. Environ. Res. Public Health 2022, 19, 4525. [Google Scholar] [CrossRef]
  64. King, R.; Churchill, E.F.; Tan, C. Designing with Data: Improving the User Experience with A/B Testing; O’Reilly Media, Inc.: Sebastopol, CA, USA, 2017. [Google Scholar]
  65. Zhou, Q.; Wong, Y.D.; Loh, H.S.; Yuen, K.F. A fuzzy and Bayesian network CREAM model for human reliability analysis–The case of tanker shipping. Saf. Sci. 2018, 105, 149–157. [Google Scholar]
  66. Weber, P.; Medina-Oliva, G.; Simon, C.; Iung, B. Overview on Bayesian networks applications for dependability, risk analysis and maintenance areas. Eng. Appl. Artif. Intell. 2012, 25, 671–682. [Google Scholar] [CrossRef]
Figure 1. Framework of the proposed methodology.
Applsci 16 03326 g001
Figure 2. The interface of the target IVIS for (a) the home page and (b) the navigation page.
Applsci 16 03326 g002
Figure 3. Hierarchical task analysis of the in-vehicle navigation function.
Applsci 16 03326 g003
Figure 4. Interaction analysis of CPCs for (a) influence degree diagram and (b) centrality and causality degree diagram.
Applsci 16 03326 g004
Figure 5. Visual simplified interrelationship diagram of CPCs.
Applsci 16 03326 g005
Figure 6. The interface of the revised IVIS for (a) the home page and (b) the navigation page.
Applsci 16 03326 g006
Figure 7. Box plots of CFPs before and after design improvements. Notes: The “**” symbol indicates a significant difference between the two groups.
Applsci 16 03326 g007
Table 1. The elements of the CREAM cognitive demand profile.
Cognitive Activity TypeCognitive Functions
ObservationInterpretationPlanningExecution
Co-ordinate ++
Communicate +
Compare++
Diagnose ++
Evaluate ++
Execute +
Identify++
Maintain ++
Monitor++
Observe+
Plan +
Record + +
Regulate+ +
Scan+
Verify++
Note: The “+” symbol denotes a correlation between cognitive activities and functions [18].
Table 2. Cognitive function failures and nominal CFPs in CREAM.
Cognitive FunctionsCognitive Function FailuresNominal CFPs
ObservationO1 (Wrong object observed)0.001
O2 (Wrong identification)0.07
O3 (Observation not made)0.07
InterpretationI1 (Faulty diagnosis)0.2
I2 (Decision error)0.01
I3 (Delayed interpretation)0.01
PlanP1 (Priority error)0.01
P2 (Inadequate plan)0.01
ExecutionE1 (Action of wrong type)0.003
E2 (Action of wrong time)0.003
E3 (Action on wrong object)0.0005
E4 (Action out of sequence)0.003
E5 (Missed action)0.03
Table 3. Cognitive demand profile for drivers using the in-vehicle navigation function.
SubtasksCognitive ActivityCognitive Functions
ObservationInterpretationPlanningExecution
1.1Observe+
1.2.1Identify++
1.2.2Co-ordinate ++
1.2.3Regulate+ +
1.3.1Execute +
1.3.2Observe+
1.3.3.1Identify++
1.3.3.2Co-ordinate ++
1.3.4Observe+
1.4.1Execute +
1.4.2Observe+
Table 4. Cognitive function failures that occurred in the interaction with the IVIS.
SubtasksCognitive Function FailuresNominal CFPs
1.1 Click on the navigation iconO2 (Wrong identification)0.07
1.2.1 Enter the destination nameI3 (Delayed interpretation)0.01
1.2.2 Select a frequently used destinationP1 (Priority error)0.01
1.2.3 Choose a navigation routeE1 (Action of wrong type)0.003
1.3.1 Click the “Start” buttonE3 (Action on wrong object)0.0005
1.3.2 View navigation informationO3 (Observation not made)0.07
1.3.3.1 Change the destinationI2 (Decision error)0.01
1.3.3.2 Add waypointsP2 (Inadequate plan)0.01
1.3.4 Return and continue navigationO2 (Wrong identification)0.07
1.4.1 Click the “Exit” buttonE1 (Action of wrong type)0.003
1.4.2 Click the home iconO2 (Wrong identification)0.07
Table 5. Factors and sub-factors of CPCs for drivers using the IVIS.
CPC FactorsCPC Sub-Factors
CPC1 (Degree of visualization of the interface)CPC1-1 (Information hierarchy)
CPC1-2 (Visual fluency)
CPC1-3 (Icon recognition)
CPC1-4 (Color contrast)
CPC2 (Rationalization of interaction mechanisms)CPC2-1 (Logic clarity)
CPC2-2 (Ease of operation)
CPC2-3 (Function matching)
CPC2-4 (Speed of response)
CPC3 (Adequacy of information feedback)CPC3-1 (Timeliness of feedback)
CPC3-2 (Clarity of information)
CPC3-3 (Consistent format)
CPC3-4 (Comprehensiveness of feedback)
CPC4 (Number of simultaneous tasks)CPC4-1 (Task prioritization)
CPC4-2 (Parallel operation)
CPC4-3 (Switching methods)
CPC4-4 (Task focus)
CPC5 (The cognitive load of drivers)CPC5-1 (Transient cognition)
CPC5-2 (Load distribution)
CPC5-3 (Dynamic information)
CPC5-4 (Operational stability)
CPC6 (Personal health status)CPC6-1 (Vision health)
CPC6-2 (Hearing health)
CPC6-3 (Reactivity)
CPC6-4 (Energy status)
CPC7 (Available task execution time)CPC7-1 (Attention allocation)
CPC7-2 (Energy management)
CPC7-3 (Time constraints)
CPC7-4 (Time perception)
CPC8 (Cockpit environment of automobiles)CPC8-1 (Space layout)
CPC8-2 (Noise control)
CPC8-3 (Temperature control)
CPC8-4 (Wide field of vision)
CPC9 (Driving skills and experience)CPC9-1 (Driving skills)
CPC9-2 (Road awareness)
CPC9-3 (Driving experience)
CPC9-4 (Adaptability to road conditions)
Table 6. The level indicators of the nine CPCs.
FactorsLevel
CPC1Supportive; Adequate; Tolerable; Inappropriate
CPC2Very sensible; Reasonable; Tolerable; Unreasonable
CPC3Very efficient; Efficient; Inefficient; Deficient
CPC4Appropriate; Acceptable; Inappropriate
CPC5Low; Medium; High
CPC6Healthy; Generic; Unhealthy
CPC7Adequate; Limited; Inadequate
CPC8Appropriate; Acceptable; Inappropriate
CPC9Enough; Limited; Insufficient
Table 7. Scoring and assessment weights for CPC sub-factors.
Sub-FactorsM1M2M3M4M5M6M7M8M9M10TotalWeights
CPC1-16754665889640.247
CPC1-25667774767620.239
CPC1-39788667897750.290
CPC1-45877656743580.224
CPC2-16897554576620.238
CPC2-29888966768750.289
CPC2-36767575588640.246
CPC2-45554467779590.227
CPC3-17669997886750.284
CPC3-27668888995740.281
CPC3-34555566767560.212
CPC3-44568865557590.223
CPC4-15776765448590.242
CPC4-25664657684570.234
CPC4-38436374886570.233
CPC4-46688988666710.291
CPC5-14755985958650.248
CPC5-25677868757660.252
CPC5-38968876766710.271
CPC5-47666387467600.229
CPC6-18785775786680.246
CPC6-28577875677670.242
CPC6-38896867788750.272
CPC6-49765585966660.240
CPC7-17566786979700.276
CPC7-25786876698700.275
CPC7-37644563659550.217
CPC7-46565584677590.232
CPC8-15776655558590.263
CPC8-24756466458550.246
CPC8-34465645337470.210
CPC8-46777565686630.281
CPC9-17787688668710.278
CPC9-25666877376610.239
CPC9-36578454455530.208
CPC9-48887676677700.275
Table 8. The level of all CPCs associated with using target IVIS.
FactorsDefinitionLevel
CPC1Degree of visualization of the interfaceInappropriate
CPC2Rationalization of interaction mechanismsTolerable
CPC3Adequacy of information feedbackInefficient
CPC4Number of simultaneous tasksInappropriate
CPC5The cognitive load of driversHigh
CPC6Personal health statusHealthy
CPC7Available task execution timeLimited
CPC8Cockpit environment of automobilesAppropriate
CPC9Driving skills and experienceEnough
Table 9. The HIF direct relationship matrix X.
FactorsHIF1HIF2HIF3HIF4HIF5HIF6HIF7HIF8HIF9
HIF10.0001.5711.7141.5711.2861.7141.4291.5711.714
HIF21.5710.0002.0002.7142.8570.5711.8572.0002.143
HIF31.0001.2860.0002.4291.5712.0002.0001.8572.143
HIF40.7142.1431.5710.0002.0001.2861.2862.0001.429
HIF50.7141.7141.1432.2860.0001.7141.2861.7141.857
HIF61.8570.4290.7141.1432.0000.0001.2861.8571.857
HIF72.7142.0002.5712.1431.2861.5710.0002.0002.143
HIF82.0001.2862.0001.4291.4292.0002.0000.0002.429
HIF91.4291.7142.1432.4291.7141.8572.1431.0000.000
Table 10. DEMATEL analysis results for HIFs.
CodesDefinitionshjgjhj + gjhjgjvj
HIF1arm co-ordination4.7624.5059.2670.2570.099
HIF2fatigue resistance5.8704.66710.5371.2030.113
HIF3attention level5.3475.21610.5630.1310.113
HIF4emotional condition4.7535.99910.752−1.2460.115
HIF5psychological tolerance4.7055.29810.003−0.5930.107
HIF6memory ability4.2094.8389.048−0.6290.097
HIF7reaction ability6.0975.02111.1181.0760.119
HIF8judgment ability5.4525.23610.6880.2160.115
HIF9perceptual ability5.3995.81211.211−0.4130.120
Table 11. The CPC direct relationship matrix X′.
FactorsCPC1CPC2CPC3CPC4CPC5CPC6CPC7CPC8CPC9
CPC10.0001.8572.4290.5712.5711.1432.1430.8570.143
CPC21.2860.0002.7142.2862.5710.4292.2860.0001.429
CPC31.4292.0000.0002.7142.7140.7142.5710.5712.000
CPC41.0001.8572.2860.0002.8571.4292.8570.8572.000
CPC52.2862.7141.4292.2860.0002.5712.0000.8571.571
CPC62.0000.8570.7142.1433.0000.0001.4290.5712.286
CPC70.5711.1431.8573.0003.0001.1430.0000.8571.143
CPC81.4290.0001.1431.1432.0000.2861.4290.0001.286
CPC90.4291.7141.0001.4292.2861.4292.0000.5710.000
Table 12. DEMATEL analysis results for CPCs.
FactorsCPC1CPC2CPC3CPC4CPC5CPC6CPC7CPC8CPC9
hi5.0825.6956.2396.3636.4985.5035.5483.754.714
gi4.435.5535.7486.7068.3564.2996.9422.3185.04
hi + gi9.51211.24811.98713.06914.8549.80212.496.0689.754
higi0.6510.1420.491−0.344−1.8581.204−1.3941.432−0.326
wi0.0960.1140.1210.1320.1500.0990.1260.0610.099
Table 13. The CPC simplified relation matrix T″.
FactorsCPC1CPC2CPC3CPC4CPC5CPC6CPC7CPC8CPC9
CPC10.0000.0000.6500.6420.8830.0000.7370.0000.000
CPC20.0000.0000.7280.8050.9730.0000.8250.0000.000
CPC30.0000.7280.6310.8861.0590.0000.9030.0000.662
CPC40.0000.7290.7660.7541.0840.0000.9290.0000.676
CPC50.6310.7830.7390.8890.9490.6320.9010.0000.662
CPC60.0000.0000.0000.7610.9640.0000.7500.0000.611
CPC70.0000.6150.6630.8210.9720.0000.6760.0000.000
CPC80.0000.0000.0000.0000.6570.0000.0000.0000.000
CPC90.0000.0000.0000.6430.8150.0000.6840.0000.000
Table 14. The effects and cognitive impact weights of CPCs on cognitive function failures.
CodeLevelEffectImpact Weights on Cognitive Function Failures
ObservationInterpretationPlanningExecution
CPC1SupportiveImproved0.51.00.80.8
AdequateNot significant1.01.01.01.0
TolerableNot significant1.01.01.01.0
InappropriateReduced5.01.02.02.0
CPC2Very sensibleImproved0.81.00.50.8
ReasonableNot significant1.01.01.01.0
TolerableNot significant1.01.01.01.0
UnreasonableReduced2.01.05.02.0
CPC3Very efficientImproved1.00.81.00.8
EfficientNot significant1.01.01.01.0
InefficientReduced1.01.21.01.2
DeficientReduced1.02.01.02.0
CPC4AppropriateImproved0.80.80.50.8
AcceptableNot significant1.01.01.01.0
InappropriateReduced2.02.05.02.0
CPC5LowImproved1.00.81.00.8
MediumNot significant1.01.01.01.0
HighReduced1.02.01.02.0
CPC6HealthyImproved0.51.01.00.8
GenericNot significant1.01.01.01.0
UnhealthyReduced5.01.01.02.0
CPC7AdequateImproved0.80.50.80.5
LimitedNot significant1.01.01.01.0
InadequateReduced2.05.02.05.0
CPC8AppropriateImproved0.51.01.00.8
AcceptableNot significant1.01.01.01.0
InappropriateReduced2.01.01.02.0
CPC9EnoughImproved0.50.50.50.8
LimitedNot significant1.01.01.01.0
InsufficientReduced5.05.05.02.0
Table 15. The adjustment rules and adjusted effect of CPCs.
CPCDepends on the Following CPCsMinimum Number of Synergetic CPCsOriginal EffectAdjusted Effect
CPC2CPC3, CPC4, CPC5, CPC73 out of 4Not significantReduced
CPC3CPC1, CPC2, CPC4, CPC5, CPC74 out of 5ReducedReduced
CPC4CPC1, CPC2, CPC3, CPC5, CPC6, CPC7, CPC96 out of 7ReducedReduced
CPC5CPC1, CPC2, CPC3, CPC4, CPC6, CPC7, CPC8, CPC97 out of 8ReducedReduced
CPC7CPC1, CPC2, CPC3, CPC4, CPC5, CPC6, CPC96 out of 7Not significantNot significant
Table 16. The cognitive impact weights of CPCs on cognitive function failures.
SubtasksCPC1CPC2CPC3CPC4CPC5CPC6CPC7CPC8CPC9
1.15.02.01.02.01.00.51.00.50.5
1.2.11.01.01.22.01.01.01.01.00.5
1.2.22.05.01.05.01.01.01.01.00.5
1.2.32.02.01.22.02.00.81.00.80.8
1.3.12.02.01.22.02.00.81.00.80.8
1.3.25.02.01.02.01.00.51.00.50.5
1.3.3.11.01.01.22.01.01.01.01.00.5
1.3.3.22.05.01.05.01.01.01.01.00.5
1.3.45.02.01.02.01.00.51.00.50.5
1.4.12.02.01.22.02.00.81.00.80.8
1.4.25.02.01.02.01.00.51.00.50.5
Table 17. The integration of weights for subtask 1.2.2.
Cognitive Impact Weights for CPCs
(ui)
Weights for CPCs
(wi)
Weights for HIFs
(vj)
Comprehensive Weights
(pi)
20.0960.0991.939
50.1140.1135.044
10.1210.1131.071
50.1320.1155.739
10.150.1071.402
10.0990.0971.021
10.1260.1191.059
10.0610.1150.530
0.50.0990.120.413
Table 18. The CFPs of the drivers using the in-vehicle navigation function.
SubtasksNominal CFPsCombined WeightsCFPs
1.2.2 Select a frequently used destination0.01019.5680.196
1.3.3.2 Add waypoints0.01019.5680.196
1.1 Click on the navigation icon0.0701.9570.137
1.3.2 View navigation information0.0701.9570.137
1.3.4 Return and continue navigation0.0701.9570.137
1.4.2 Click the home icon0.0701.9570.137
1.2.3 Choose a navigation route0.0037.6950.023
1.4.1 Click the “Exit” button0.0037.6950.023
1.2.1 Enter the destination name0.0100.9390.009
1.3.3.1 Change the destination0.0100.9390.009
1.3.1 Click the “Start” button0.00057.6950.004
Note: The bold underlined numbers represent the subtasks selected for corrective actions.
Table 19. Comparison between related methods and the proposed method.
MethodOutput ResultsUncertainty Handling
Traditional CREAMCFP; no CPC weights or causal dependenciesNo systematic method; ignores factor interaction uncertainty
Single FCEFactor-level evaluation; simple weights; no CPC/causal infoFuzzy membership functions; ignores incomplete factor uncertainty
Single DEMATELFactor causal dependencies; no CPC weights or CFPExpert pairwise comparison; cannot handle CFP uncertainty
Proposed methodCPC weights, CFP, causal dependencies between CPCs and HIFsIntegrates FCE, DEMATEL, and CREAM to reduce multi-source uncertainty
Disclaimer/Publisher’s Note: The statements, opinions and data contained in all publications are solely those of the individual author(s) and contributor(s) and not of MDPI and/or the editor(s). MDPI and/or the editor(s) disclaim responsibility for any injury to people or property resulting from any ideas, methods, instructions or products referred to in the content.