Article

Effect of Melamine on the Oxygen Evolution Reaction Performance of PGM-Free Catalysts Under Alkaline Conditions


1
LEPABE, Chemical Engineering Department, Faculdade de Engenharia da Universidade do Porto, 4200-465 Porto, Portugal
2
Bondalti Chemicals, Rua do Amoníaco Português no10, 3860-680 Estarreja, Portugal
3
LAQV-REQUIMTE, Chemistry Department, Faculdade de Ciências e Tecnologia, Universidade Nova de Lisboa, 2829-516 Caparica, Portugal
4
ALiCE–Associate Laboratory in Chemical Engineering, Faculty of Engineering, University of Porto, Rua Dr. Roberto Frias, 4200-465 Porto, Portugal
*
Author to whom correspondence should be addressed.
Appl. Sci. 2026, 16(7), 3310; https://doi.org/10.3390/app16073310
Submission received: 13 January 2026 / Revised: 23 March 2026 / Accepted: 26 March 2026 / Published: 29 March 2026
(This article belongs to the Section Chemical and Molecular Sciences)

Abstract

The PGM-free Fe–Ni–Co trimetallic catalysts developed in this study demonstrated outstanding performance for the oxygen evolution reaction (OER), achieving overpotentials as low as 300 mV at 10 mA cm−2 in rotating disk electrode (RDE) measurements, a value competitive with the most efficient non-noble electrocatalysts reported in the literature. This study validates the strong catalytic performance of the baseline trimetallic configuration and provides important insights into the relationships among synthesis, structure, and morphology that govern catalyst activity. In particular, the findings highlight that although organic additives can be promising modifiers, the interaction between precursors and transition metals must be carefully controlled to avoid active-site isolation when designing efficient catalysts for sustainable hydrogen production. Actually, to further enhance catalytic activity, the nitrogen-rich precursor melamine was introduced into the supported trimetallic catalyst and then carbonized. However, no improvement in OER performance was observed. During carbonization, melamine promotes the formation of tip-growth carbon nanotubes, which mechanically disrupt the catalyst structure and degrade the supported active phase.

1. Introduction

As the planet experiences unprecedented temperature increases, the harmful impacts on ecosystems, weather patterns, and sea levels become more evident. Reducing greenhouse gas emissions and transitioning to sustainable energy sources as quickly as possible are imperative. Electrochemical technologies, with water electrolysis at the forefront, offer a beacon of hope in mitigating climate change by providing clean energy solutions. Water electrolysis technologies face a significant challenge in synthesizing catalysts that can enhance overall reaction efficiency. Catalysts play a pivotal role in lowering the activation energy of chemical reactions, making the process more efficient by facilitating the breaking and forming of chemical bonds. However, the intricate nature of catalysts, often multiphasic with varying structures and morphologies, presents challenges in their characterization, especially under reaction conditions [1,2].
The development of efficient and durable electrocatalysts for the oxygen evolution reaction (OER) is a critical challenge for electrochemical energy-conversion technologies, as sluggish kinetics and catalyst degradation substantially limit overall system efficiency and long-term stability. A suitable catalyst must exhibit high activity and stability while adhering to sustainability principles to be effective in an electrolyzer application. In this context, the study focuses on addressing the intricate factors that influence the Oxygen Evolution Reaction (OER), as described by Equation (1), which is the dominant reaction in water electrolysis due to its higher kinetic overpotentials compared to the hydrogen evolution reaction (HER) [3].
4 OH (aq) → O2 (g) + 2H2O (l) + 4e
Materials such as iron, nickel, and cobalt, which have low associated CO2 emissions and energy expenditure during mining [4], as well as one of the most electrically conductive metals [5] stand out as promising candidates and are already reported as the best materials to be applied in the Oxygen Evolution Reaction (OER), as work developed by McCrory et al. [6] and the work produced by Anderson et al. [7] stated, and that is why they were chosen for this work.
Melamine (C3H6N6) was selected as a nitrogen precursor based on prior reports demonstrating that nitrogen doping improves the OER activity in transition-metal catalysts by increasing electronic conductivity, promoting favorable metal–support interactions, and generating catalytically active defect sites. A recent study [8] showed a significant enhancement in OER performance for a Fe–Ni–Co catalyst supported on N-doped carbon, which is closely comparable to the catalyst synthesized and evaluated in the present work, differing primarily in the nitrogen precursor employed.
Melamine was employed as a nitrogen-rich precursor because approximately 66 wt.% of its mass consists of nitrogen, making it an efficient, low-cost, and comparatively less hazardous N source compared to nitrogen-containing organic solvents often used in catalyst synthesis, such as dimethylformamide (DMF). Melamine is a derivative of urea, which has been shown to provide significant advantages when added to the electrolyte by promoting Urea Oxidation Reactions (UOR). As reported by Liu et al. [9], UOR proceeds at a significantly lower thermodynamic potential than OER, resulting in reduced cell voltages, improved energy efficiency, and enhanced anodic reaction kinetics during hydrogen production. These findings motivate the exploration of nitrogen-rich urea derivatives, such as melamine, as functional additives or dopants capable of influencing electrochemical activity and stability.
The assessment of the catalyst performance was performed using the Rotating Disk Electrode (RDE), a valuable tool for characterizing catalysts, which is crucial for optimizing electrochemical reactions and understanding their relationship with physicochemical properties [10].

2. Materials and Methods

2.1. Catalyst Synthesis

All materials were purchased in the specified grade and used as received. As metal precursors, inorganic metal salts of cobalt Co(NO3)2·6 H2O (ACS 98%, Sigma-Aldrich, St. Louis, MO, USA), nickel Ni(NO3)2·6 H2O (ACS grade, Merck, Darmstadt, Germany) and iron Fe(NO3)3·9 H2O (98%, Alfa Aesar, War Hill, MA, USA) were used. The melamine used (C3H6N6, 99%) was obtained from Alfa Aesar, War Hill, MA, USA. Two carbon supports were investigated: Ketjenblack EC-600JD (Nouryon, Amsterdam, The Netherlands) and Vulcan Black XC72R GP-3909 (Cabot Corporation, Boston, MA, USA).
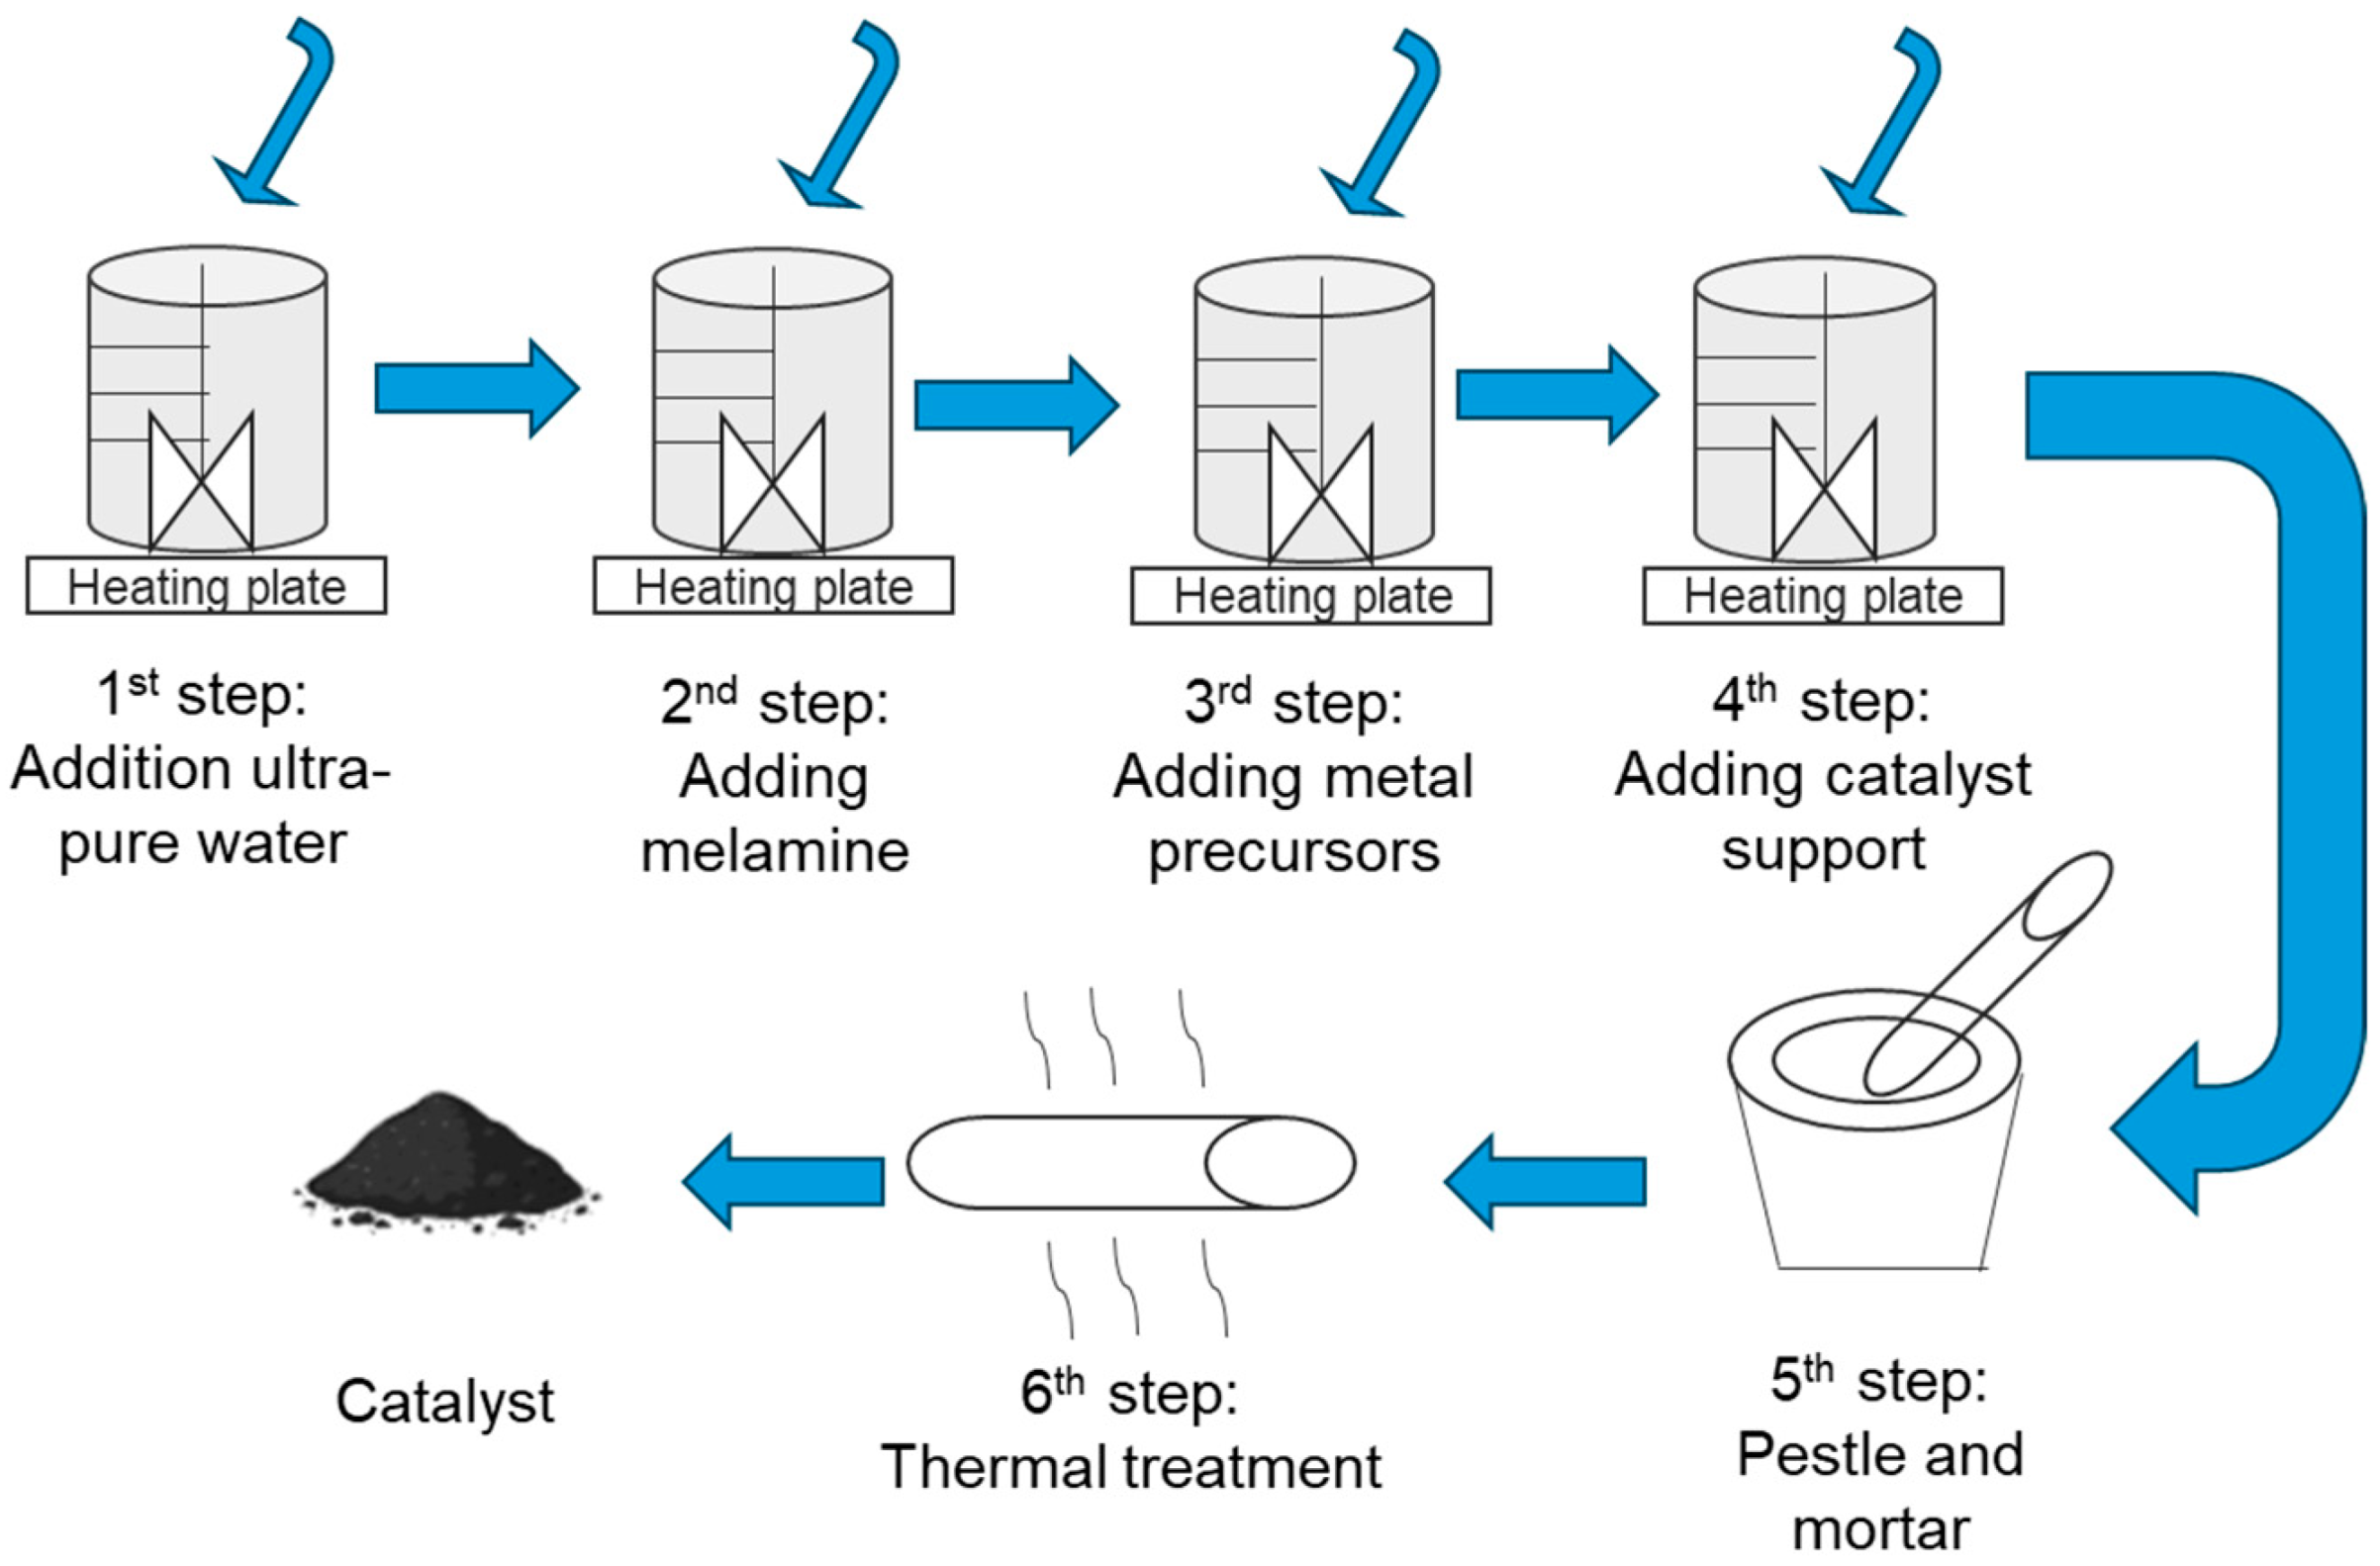
The catalysts were prepared by the wet impregnation method. The precursors were dissolved in ultrapure water (18.2 MΩ·cm at 25 °C, Millipore Synergy UV, Merck, Darmstadt, Germany) under constant stirring. The resulting materials were then heat-treated (calcined) in a split-type tubular furnace (Termolab, Águeda, Portugal) under an argon inert atmosphere, up to 750 °C, with a total thermal cycle time of approximately 10 h. A schematic of the synthesis process is shown in Figure 1.

2.2. Electrode Preparation

A catalyst ink was prepared by dispersing 5 mg of catalyst powder in 560 μL of ultra-pure water (18.2 MΩ·cm−1 at 25 °C, Millipore Synergy UV), 125 μL of 2-propanol (ACS reagent, >99.5%, Honeywell Riedel-de Haën, Seelze, Germany), and Nafion D521 ionomer (Chemours, Wilmington, DE, USA), followed by 30 min of bath sonication. This ink was drop-cast onto a gold surface (0.196 cm2), as shown in Figure S1 in the Supplementary Information. Gold tip was chosen because of its superior corrosion resistance at high potentials compared to glassy carbon [1]. The deposition was performed at 100 rpm and dried at 700 rpm in air at room temperature, for approximately 1.5 h [1]. Prior to catalyst deposition, the electrode was polished with a 0.05 µm alumina suspension (Allied High-Tech Products, Rancho Dominguez, CA, USA) to remove surface contaminants and minimize surface roughness, thereby ensuring consistent electrode preparation and reproducible electrochemical performance.

2.3. Electrochemical Characterization

Electrochemical measurements were carried out using a Zahner Zennium electrochemical workstation. Rotating disk electrode (RDE) experiments were conducted using an RDE710 system and a jacketed EuroCell™ (Gamry, Warminster, PA, USA) at room temperature (25 ± 3 °C) and atmospheric pressure. A gold RDE tip (AFE3T050AU) was used as the working electrode (WE), where the catalysts were deposited. A graphite carbon rod was employed as a counter-electrode, and an Ag/AgCl electrode was used as the reference. The recorded potential values were converted to the reversible hydrogen electrode (RHE) scale using Equation (A1) in Appendix A.1 [11].
Before and during the measurements, the electrochemical cell was purged with argon to prevent contamination of the electrolyte from the external environment. The electrolyte used was a 0.1 M KOH (puriss p.a. > 86% from Sigma-Aldrich, St. Louis, MO, USA) aqueous solution prepared with ultrapure water (Millipore Synergy UV).
To assess the electroactivity of catalysts toward oxygen evolution reaction (OER), Cyclic Voltammogram (CV) was first performed between 1.0 V and 2.0 V (later, the range was increased to 1.2–2.2 V to ensure complete activation of the catalyst surface under highly oxidative OER conditions) at a scan rate of 100 mV s−1 for two cycles, to activate and then another CV for three cycles, between 0.0 V and 1.0 V at a scan rate of 20 mV s−1, in the non-faradaic region, to ensure stabilization of the electrode–electrolyte interface after the activation (“break-in”) step and to probe the capacitive response, enabling estimation of the electrochemically active surface area (ECSA).
Linear Sweep Voltammetry (LSV) was performed between 1.2 and 2.0 V (vs. RHE) at a scan rate of 10 mV s−1 (later increased to 1.2–2.2 V), and the current density was recorded with the electrode rotating at 1600 rpm. The rotation was demonstrated to improve the activity, as shown in [12,13], because it helps to remove the bubbles caused by the gas produced.
Electrochemical Impedance Spectroscopy (EIS) was performed at 1.6 VRHE with an amplitude of 5 mV and a frequency range of 980 Hz to 1 kHz to determine the electrolyte resistance (ohmic resistance).
The catalyst was further submitted to an accelerated stress test (AST). This test provides insight into the catalyst’s stability by enabling a comparison between the LSV recorded at the beginning of life, BoL, and after the AST (end of life, EoL). The AST cycles impose a potential between 1.3 and 2.0 V (vs. RHE), mimicking the transient conditions associated with start-up and shut-down in hydrogen production, at a rotation rate of 350 rpm (higher rotation rates can delaminate the catalyst layer before completion of the test), for a total of 5000 cycles [14]. The schematic representation is shown in Figure S2 in the Supplementary Information.

2.4. Material Characterization

The metal content of the synthesized catalysts (Fe, Ni, and Co) was determined by inductively coupled plasma–optical emission spectroscopy (ICP–OES, Thermo Scientific iCAP 7000 seriesm, Cambridge, UK), and validated by atomic absorption spectrometry (AAS, Unicam 939 AA spectrometer, Waltham, MA, USA). Particle size distribution was measured by laser scattering (Horiba LA-960, Kyoto, Japan). Structural characterization was performed by X-ray powder diffraction (XRD, Rigaku SmartLab SE, Tokyo, Japan), and textural properties were evaluated by N2 physisorption (Quantachrome Autosorb-1 instrument, Graz, Austria) using the BET method, with pore size distribution obtained from the BJH model. Raman spectroscopy (WITec alpha300, Ulm, Germany) was used to analyze structural order, while thermogravimetric analysis (TGA, Netzsch STA 449 F3 Jupiter, Selb, Germany) was conducted under inert and oxidative atmospheres to assess thermal stability. Morphological features were examined by transmission electron microscopy (TEM, JEOL JEM 1400 TEM, Tokyo, Japan). The electrical conductivity of carbon black was measured using a Conductivity Meter Press (Vasco da Gama, Model CMP-5, Porto, Portugal). Surface chemical composition was analyzed by X-ray photoelectron spectroscopy (XPS, ESCALAB 250Xi from Thermo Fisher Scientific, East Grinstead, UK), and functional groups were identified by Fourier-transform infrared (FT-IR) spectroscopy (Vertex 70 FT-IR Spectrometer from Bruker, Billerica, MA, USA).
Detailed experimental procedures and instrumental parameters for all characterization techniques are provided in the Supplementary Information.

3. Results and Discussion

3.1. Catalyst Composition

The prepared catalysts consist of Fe, Ni, and Co supported on carbon-based materials. The primary role of carbon support is to ensure adequate dispersion of the active metallic phase, thereby increasing the electrochemical surface area while providing mechanical stability to the catalyst layer [15]. The selection of an appropriate support is governed by several key factors, including sufficient surface area and porosity to host metal nanoparticles, chemical resistance to alkaline or acidic electrolytes and operating temperatures, high electronic conductivity, and stability under the electrochemical potentials applied during cell operation.
Carbon materials were selected as catalyst supports due to their excellent electronic conductivity and their versatility in tailoring morphology and nanostructure, which enables uniform dispersion and stabilization of metallic nanoparticles within porous electrodes. Despite these advantages, degradation mechanisms associated with metal nanoparticles supported on carbon—such as carbon corrosion and metal detachment—have been widely reported in the literature [16]. Increasing the degree of carbon graphitization is commonly regarded as an effective strategy to enhance corrosion resistance by forming a more ordered and robust carbon structure. However, highly graphitized carbons typically exhibit lower porosity and surface area, which can hinder nanoparticle dispersion, reduce ECSA, and limit mass transport within the electrode [17,18,19]. In addition, graphitized carbon surfaces are generally more hydrophobic, which can impede uniform ionomer distribution—an essential requirement for efficient ion conduction in electrolyzer electrodes [20,21].
Consequently, the rational design of advanced carbon supports that combine high graphitization with sufficient surface area and tailored surface chemistry is crucial to achieving improved catalyst stability without compromising catalytic activity. In this context, heteroatom doping represents an effective strategy to modulate the physicochemical properties of carbon supports.
In this work, melamine (C3H6N6) was used as a nitrogen source to dope the catalyst, aiming to increase catalyst activity and stability, inspired by previous studies that reported this effect when the catalyst was N-doped [8]. The previous investigators used dimethylformamide (DMF, HCON(CH3)2), containing polyvinylpyrrolidone (PVP K-30, (C6H9NO)n) as a stabilizing agent to N-dope the catalyst. This method is incompatible with the synthesis conditions adopted in this work due to its strong reactivity with nitrates and its unsafe handling at temperatures above 58 °C in an open atmosphere [22]. Melamine offers a safer route. The impact of nitrogen doping will be evaluated using two carbon supports (Ketjen and Vulcan) and by varying the metal loadings. This approach enables assessment of the combined effects of carbon structure, dopant chemistry, and metal content on catalyst activity, stability, and electrochemical performance.
Three pairs of catalysts were synthesized, differing in whether melamine was present during synthesis. The loading of the metals and the support were varied. The first step was to perform ICP-OES analyses to confirm the proportion ratio of the trimetallic catalysts. The results are presented in Table 1 and were also validated using atomic absorption spectrometry. The detailed results are available in the Supplementary Information.
According to the ICP-OES results summarized in Table 1. As expected, the metal loading decreases across all supported catalysts upon the introduction of melamine. Achieving precise Fe/Ni/Co ratios across all the prepared catalysts is experimentally challenging; therefore, slight variations in metal distribution are expected and observed.
Furthermore, ICP analysis indicates that carbon constitutes approximately 80% of the catalyst mass. This high carbon content provides an extended conductive matrix and abundant surface area for metal anchoring, which may limit macroscopic agglomeration but does not prevent the melamine-induced redistribution and encapsulation effects observed after calcination.

3.2. Surface Area Analysis

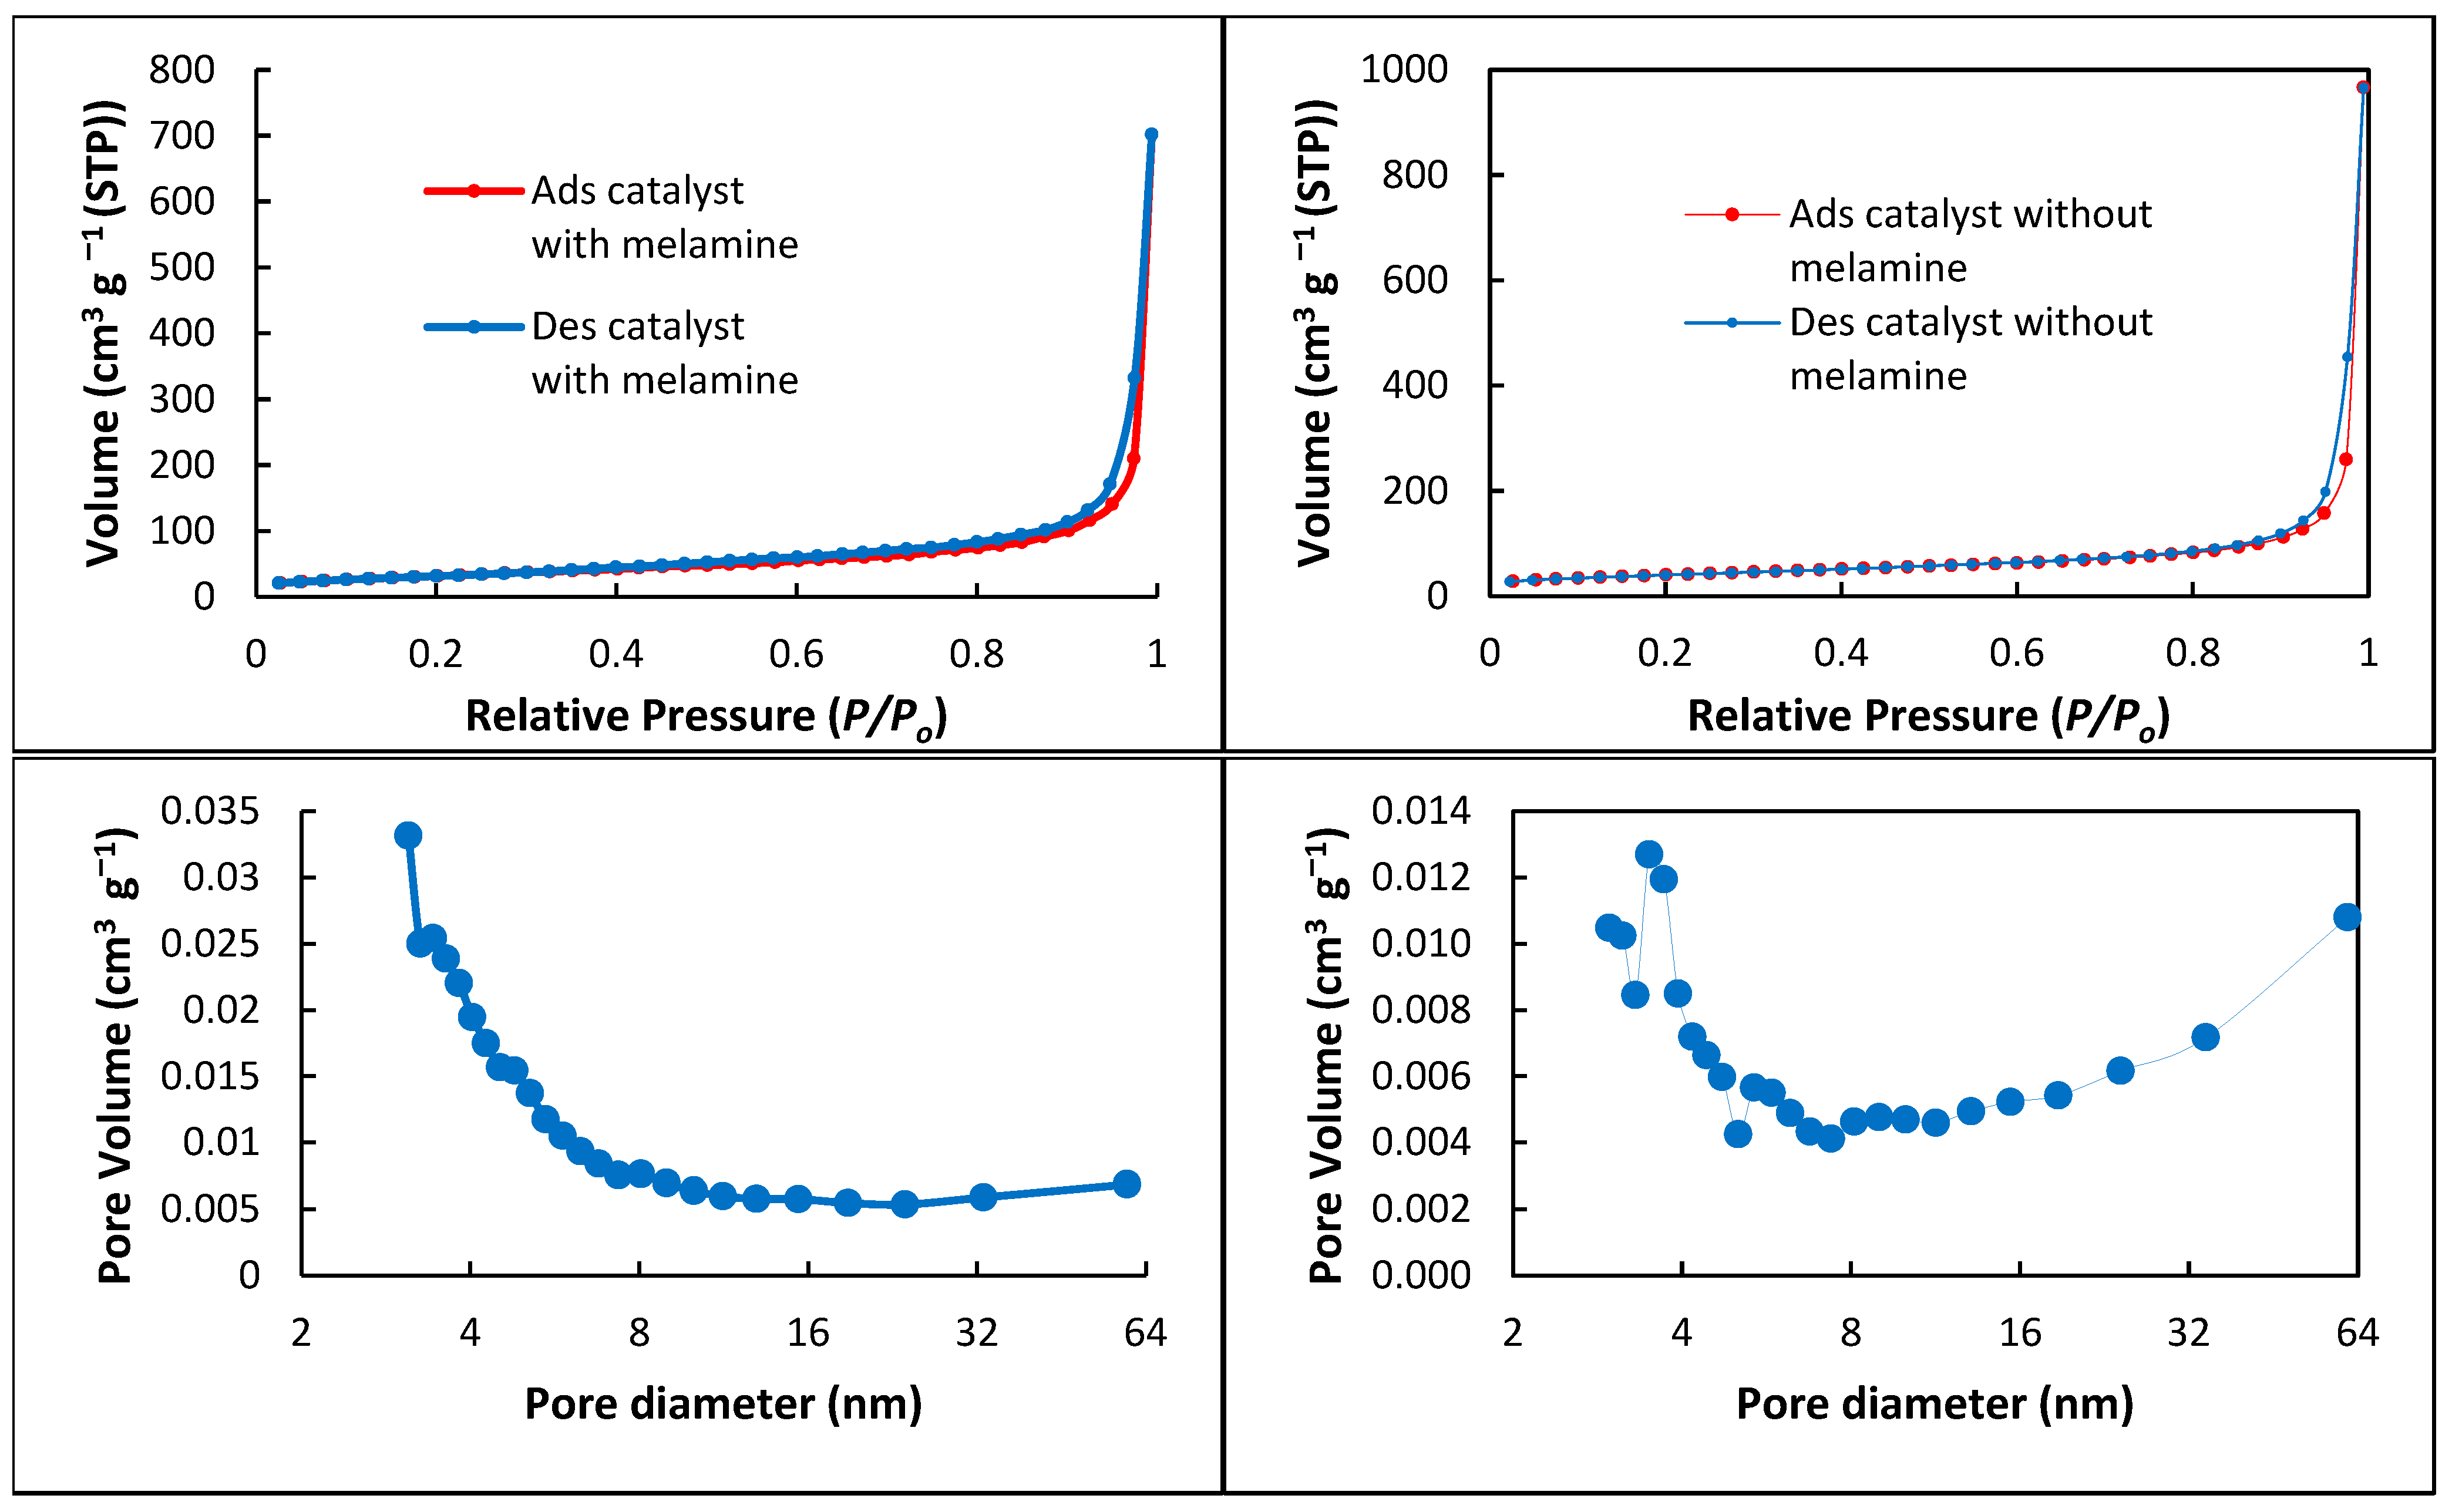
The physical architecture of an electrocatalyst, specifically its specific surface area and porous structure, represents a primary determinant of its overall electrochemical efficiency, particularly in multi-electron transfer processes such as OER. The textural properties were quantitatively characterized through an automated physisorption flow analyzer (physisorption of nitrogen at 77 K) to evaluate the results in terms of surface area (As) using the multi-point Brunauer-Emmett-Teller (BET), and porosity (pore volume and pore diameter) was determined according to the Barret-Joyner-Halenda (BJH) method. The results of the characterization of the catalysts and melamine are presented in Table 2. Appendix A.1 presents the isothermal curves and their discussion.
According to the IUPAC, all samples with pores between 2 nm and 50 nm are called mesoporous. The results in Table 1 show that all catalysts have mesopores, but they are closer to micropores (<2 nm) than to mesopores (>50 nm).
The narrow range indicates that the synthesis route produces a uniform mesoporous network, with only minor variations in average pore size among the materials [23].
The results presented in Table 2 reveal two tendencies: first, the catalyst with melamine reduces the surface area and pore volume, as expected, since melamine in its pure state has a low surface area, which can potentially hinder the availability of the active site and negatively influence the electrochemical results. Another notable observation is the variation in surface area across different catalyst supports. The Ketjenblack EC-600JD consistently exhibits a higher surface area and pore volume than Vulcan XC72 carbon black. It is essential to understand how this result affects the electrochemical results. This difference was expected, as the BET-specific surface area reported in the literature for Ketjenblack EC-600JD is approximately 1400 m2 g−1, and for Vulcan Black XC72R GP-3909, approximately 218 m2 g−1 [14], which explains the significant difference observed between the catalysts. These differences can significantly affect catalytic activity, adsorption capacity, and mass-transport phenomena relevant to water electrolysis.

3.3. Rotating Disk Electrode

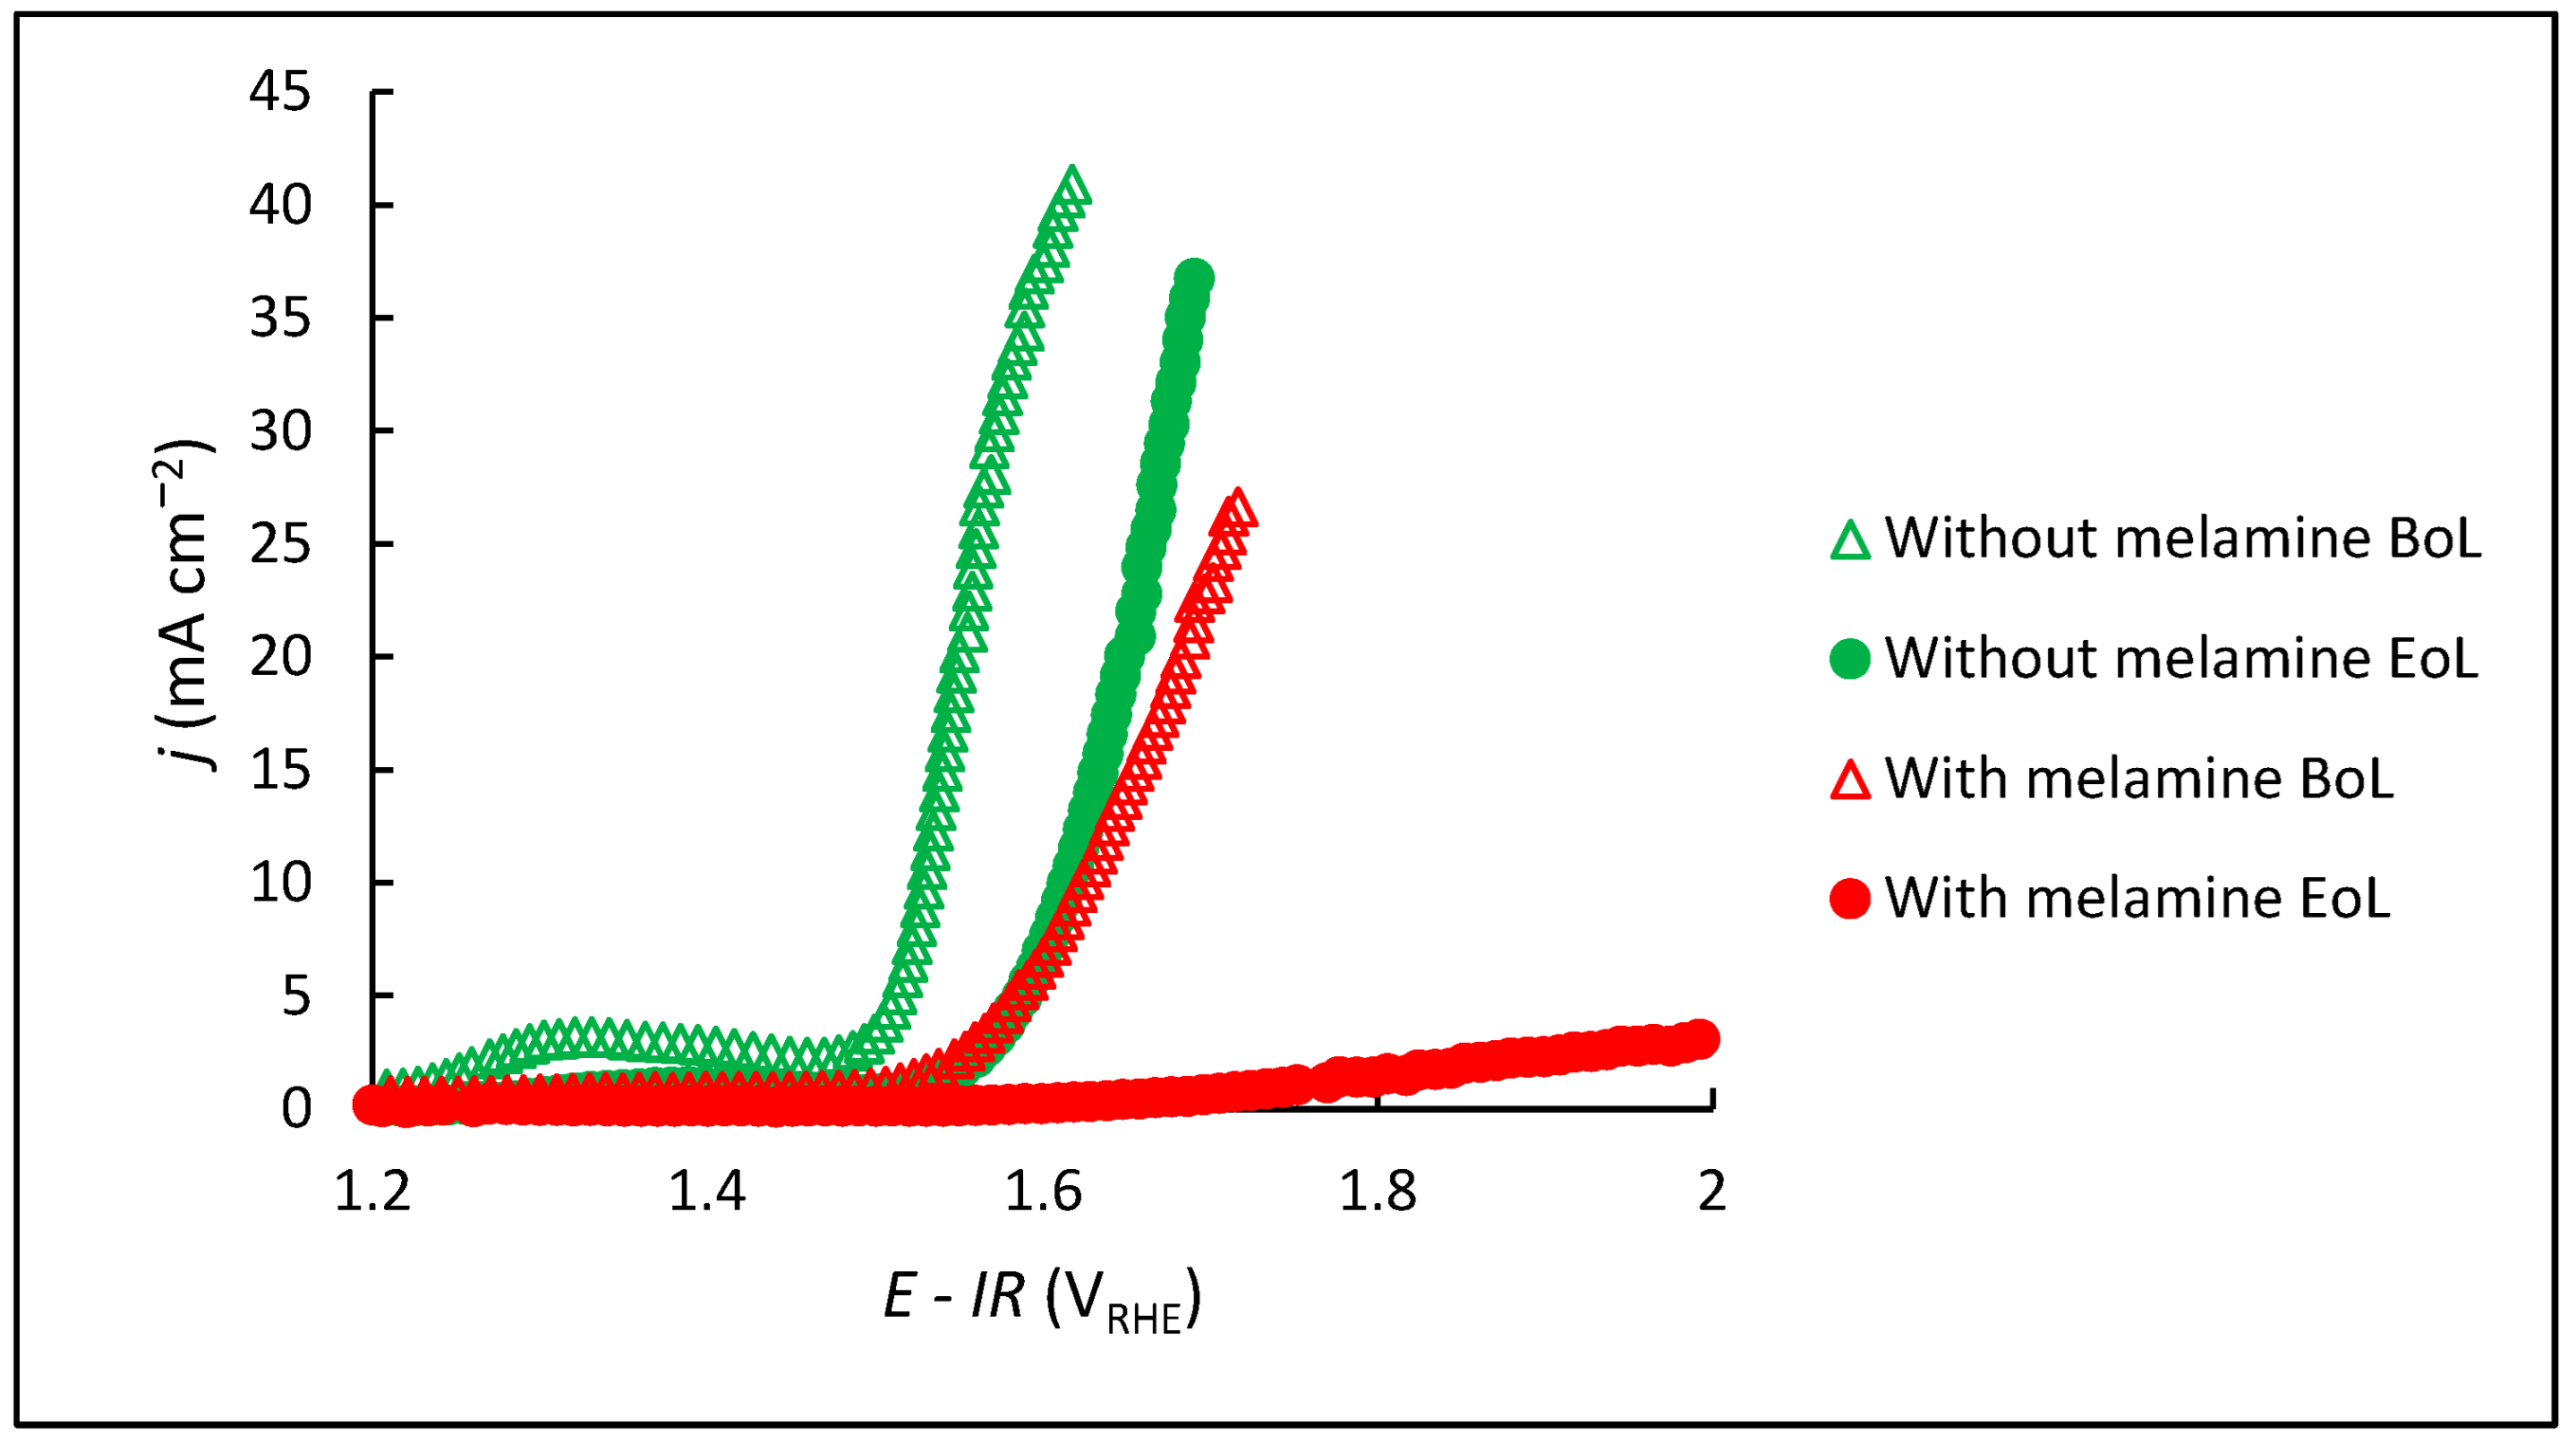
The electrochemical results for the different catalysts were measured using a rotating disk electrode. The discussion is divided into 3 pairs of catalysts: FeNiCo 54 with Ketjen support, with and without melamine; FeNiCo 72 with Ketjen support, with and without melamine; and FeNiCo 54 with Vulcan support, with and without melamine. Tables S7–S9 in the Supplementary Material provide more detailed parameters for the electrochemical results.
The polarization curves for FeNiCo 54 with Ketjen support are shown in Figure 2.
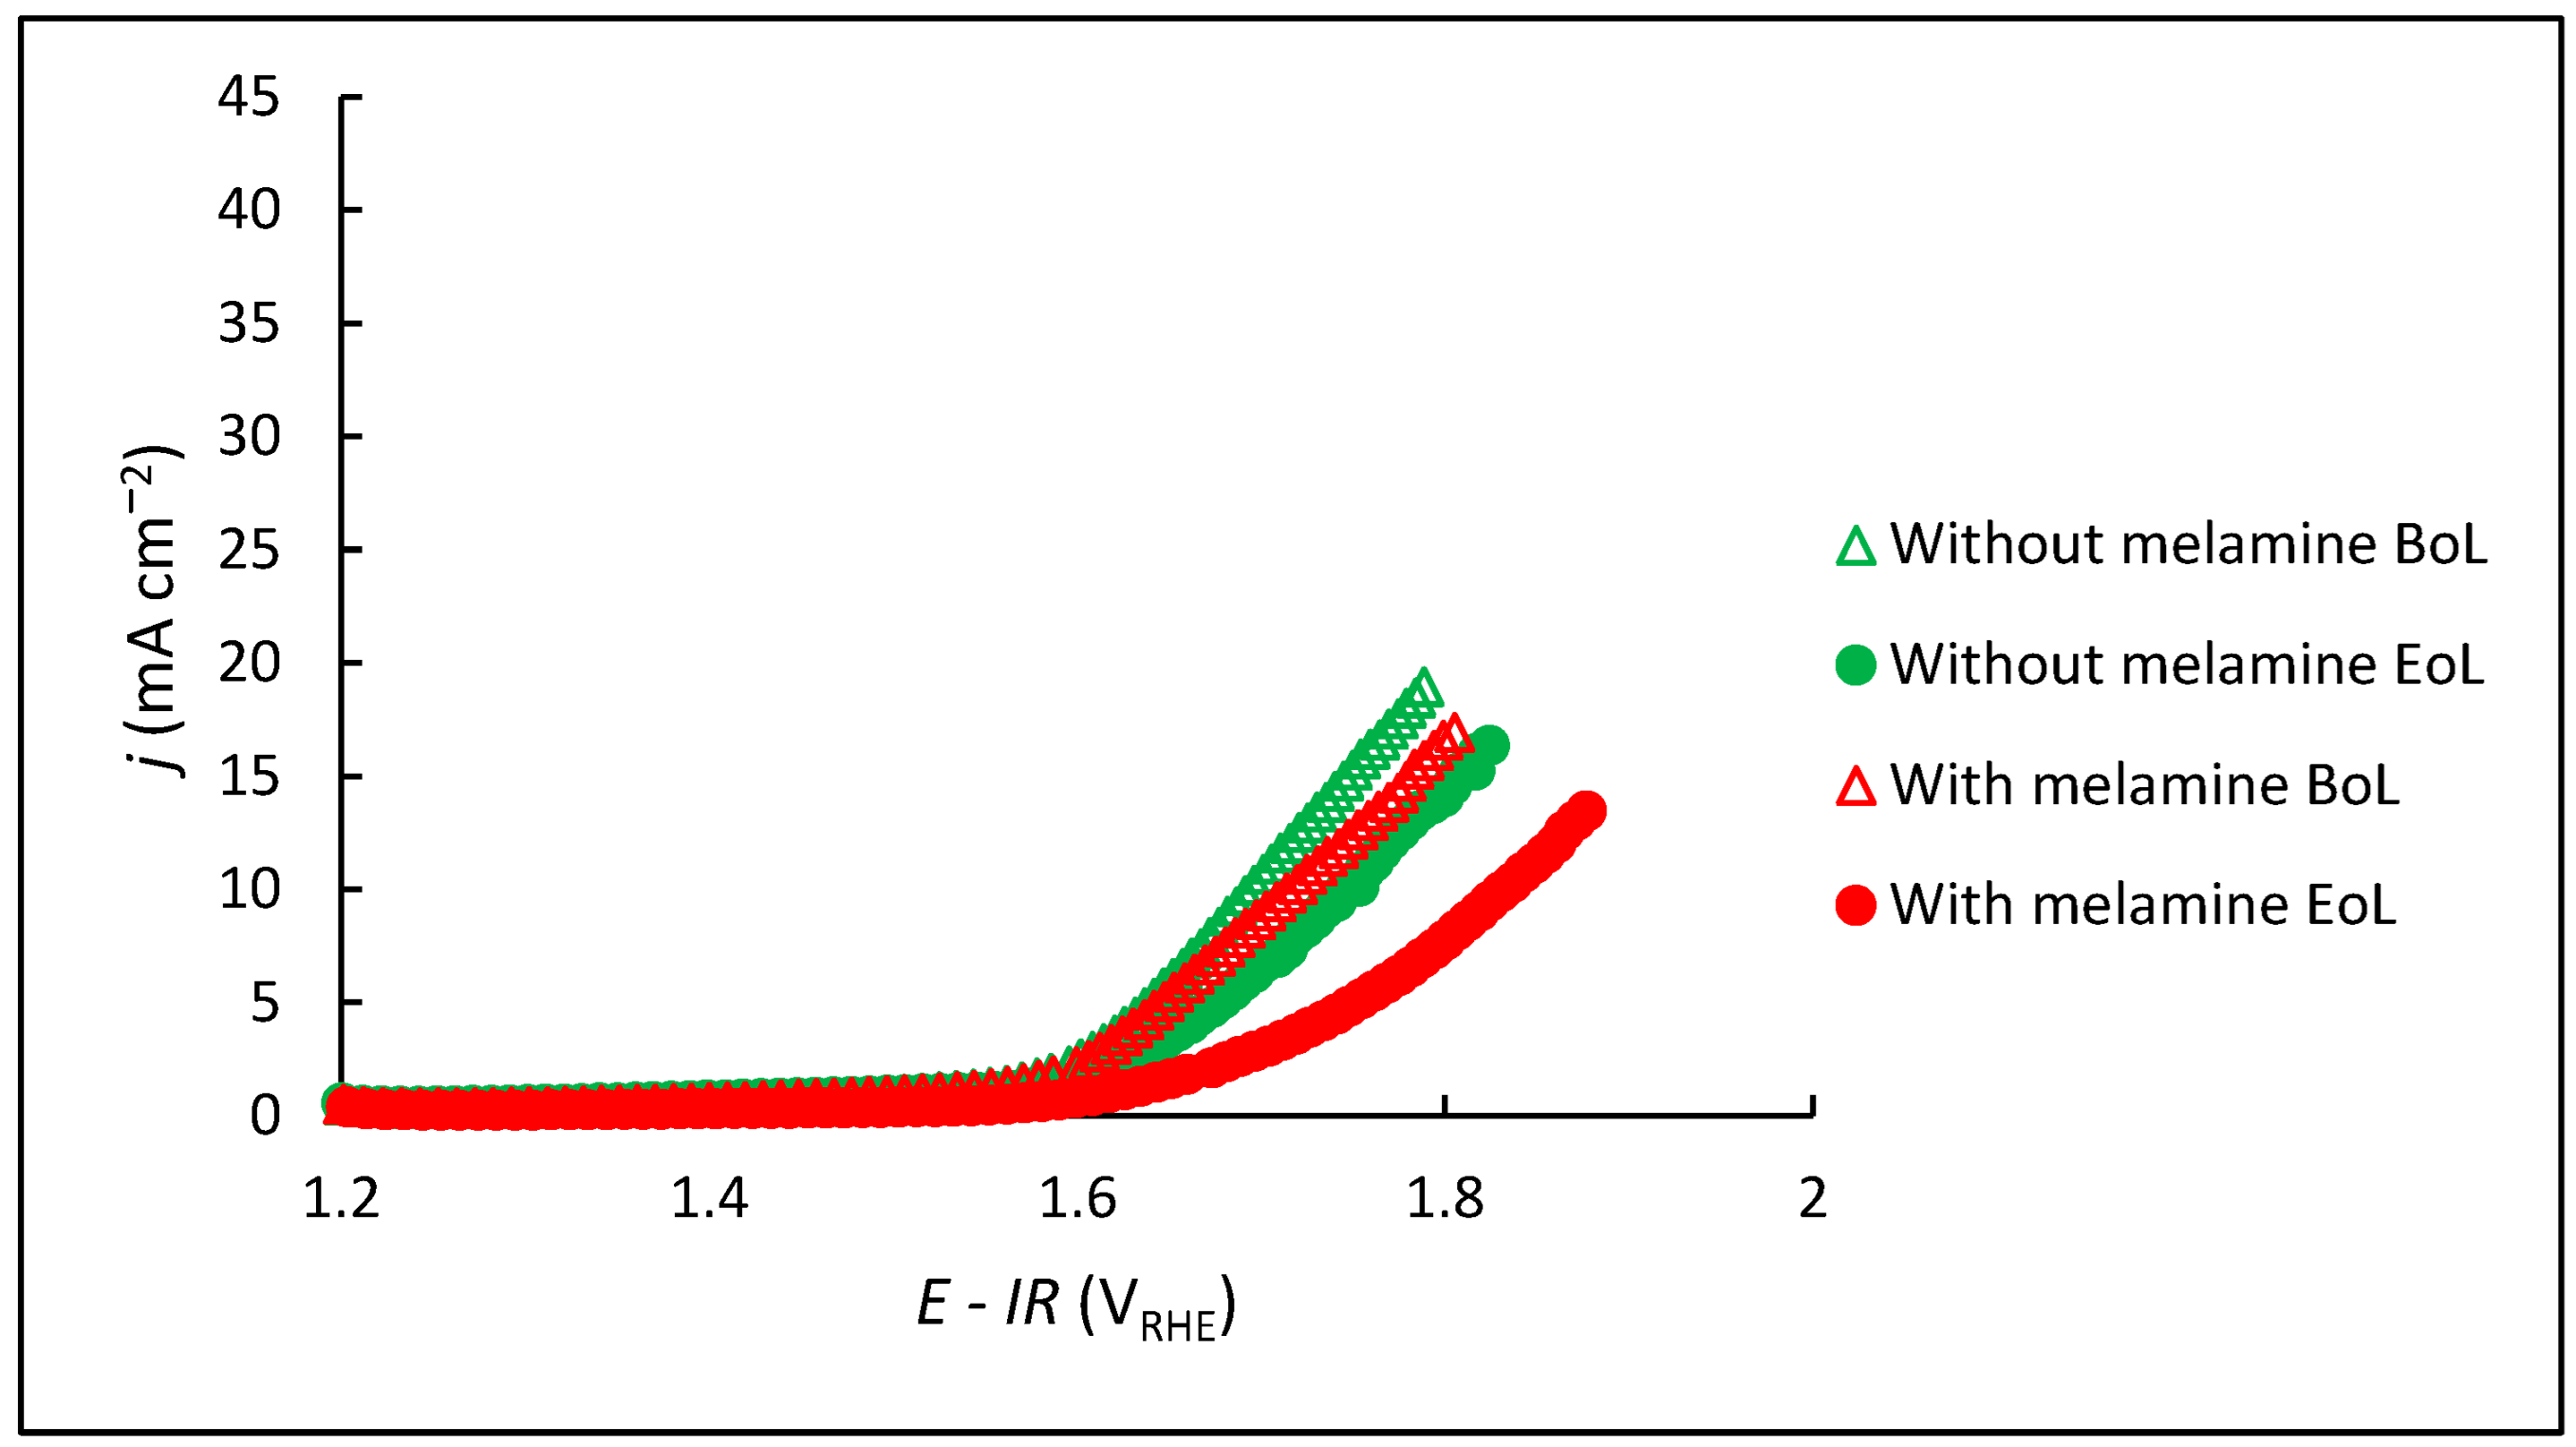
In Figure 2, it is evident that the introduction of melamine negatively impacts the catalyst’s performance, affecting both its activity and stability. The electrochemical parameters, such as the onset potential, Tafel slope, and overpotential at 10 mA cm−2, as well as the loss of efficiency, are all improved in the catalyst without melamine.
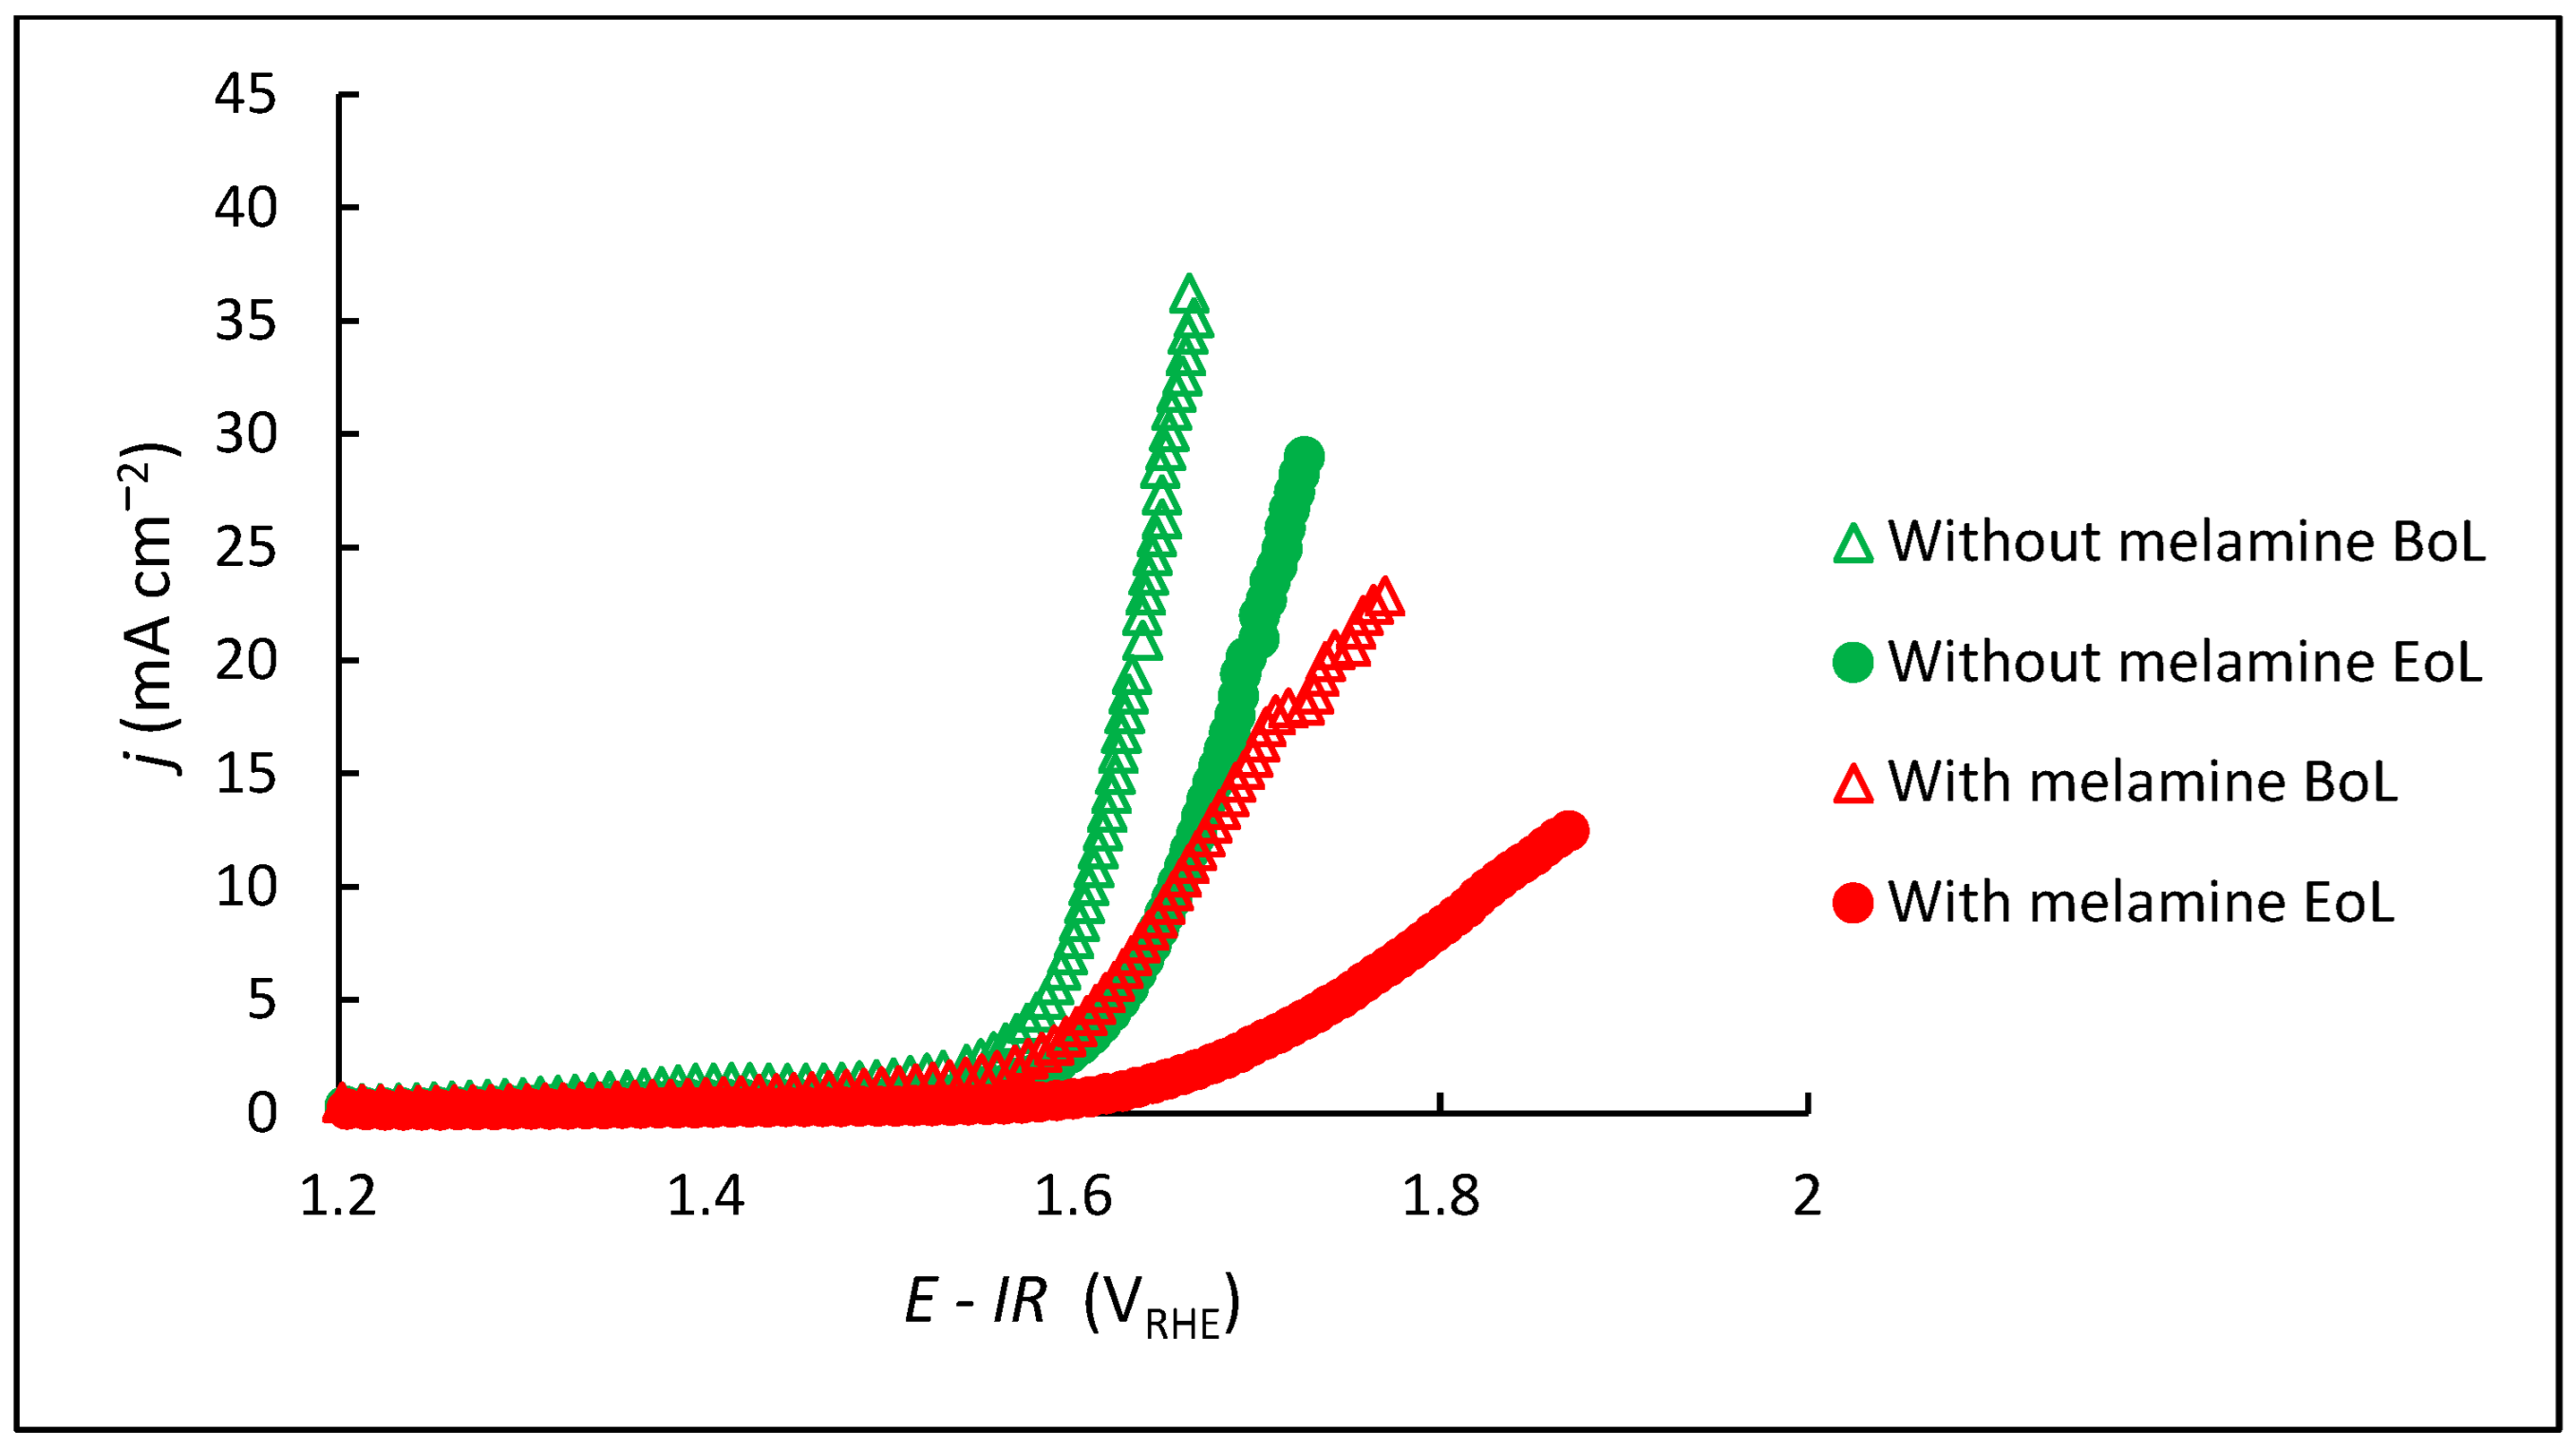
The second pair of catalysts, FeNiCo 72 with Ketjen support, had a higher metal loading than the previously discussed catalyst (FeNiCo 54 with Ketjen support). Figure 3 shows the polarization curve obtained.
Figure 3 shows the same results as the previous pair of catalysts. The introduction of melamine reduced catalyst performance, particularly in terms of activity and stability.
Regarding the metal concentration on the catalyst, even though more active centers were present (by a small margin), this did not translate into higher activity and/or stability.
This analysis’s third and final pair is the catalyst FeNiCo 54 with Vulcan support. This catalyst differs from the previously discussed one on the carbon support, in which the four previously used Ketjen are now replaced by Vulcan. Figure 4 shows the polarization curve.
The introduction of melamine reduced the catalyst performance with Vulcan support, as verified in the previous pairs of catalysts.
Comparing the results of the catalysts with different carbon supports, the Vulcan catalyst showed better results than the Ketjen catalyst, in terms of activity, although showing a marginally lower stability, as reflected by a higher loss of activity (in %) between BoL and EoL, but still better than the catalysts with Ketjen support in both cases in absolute values.
More information about the results can be found in Tables S1–S3 of the Supplementary Information.

3.4. TEM

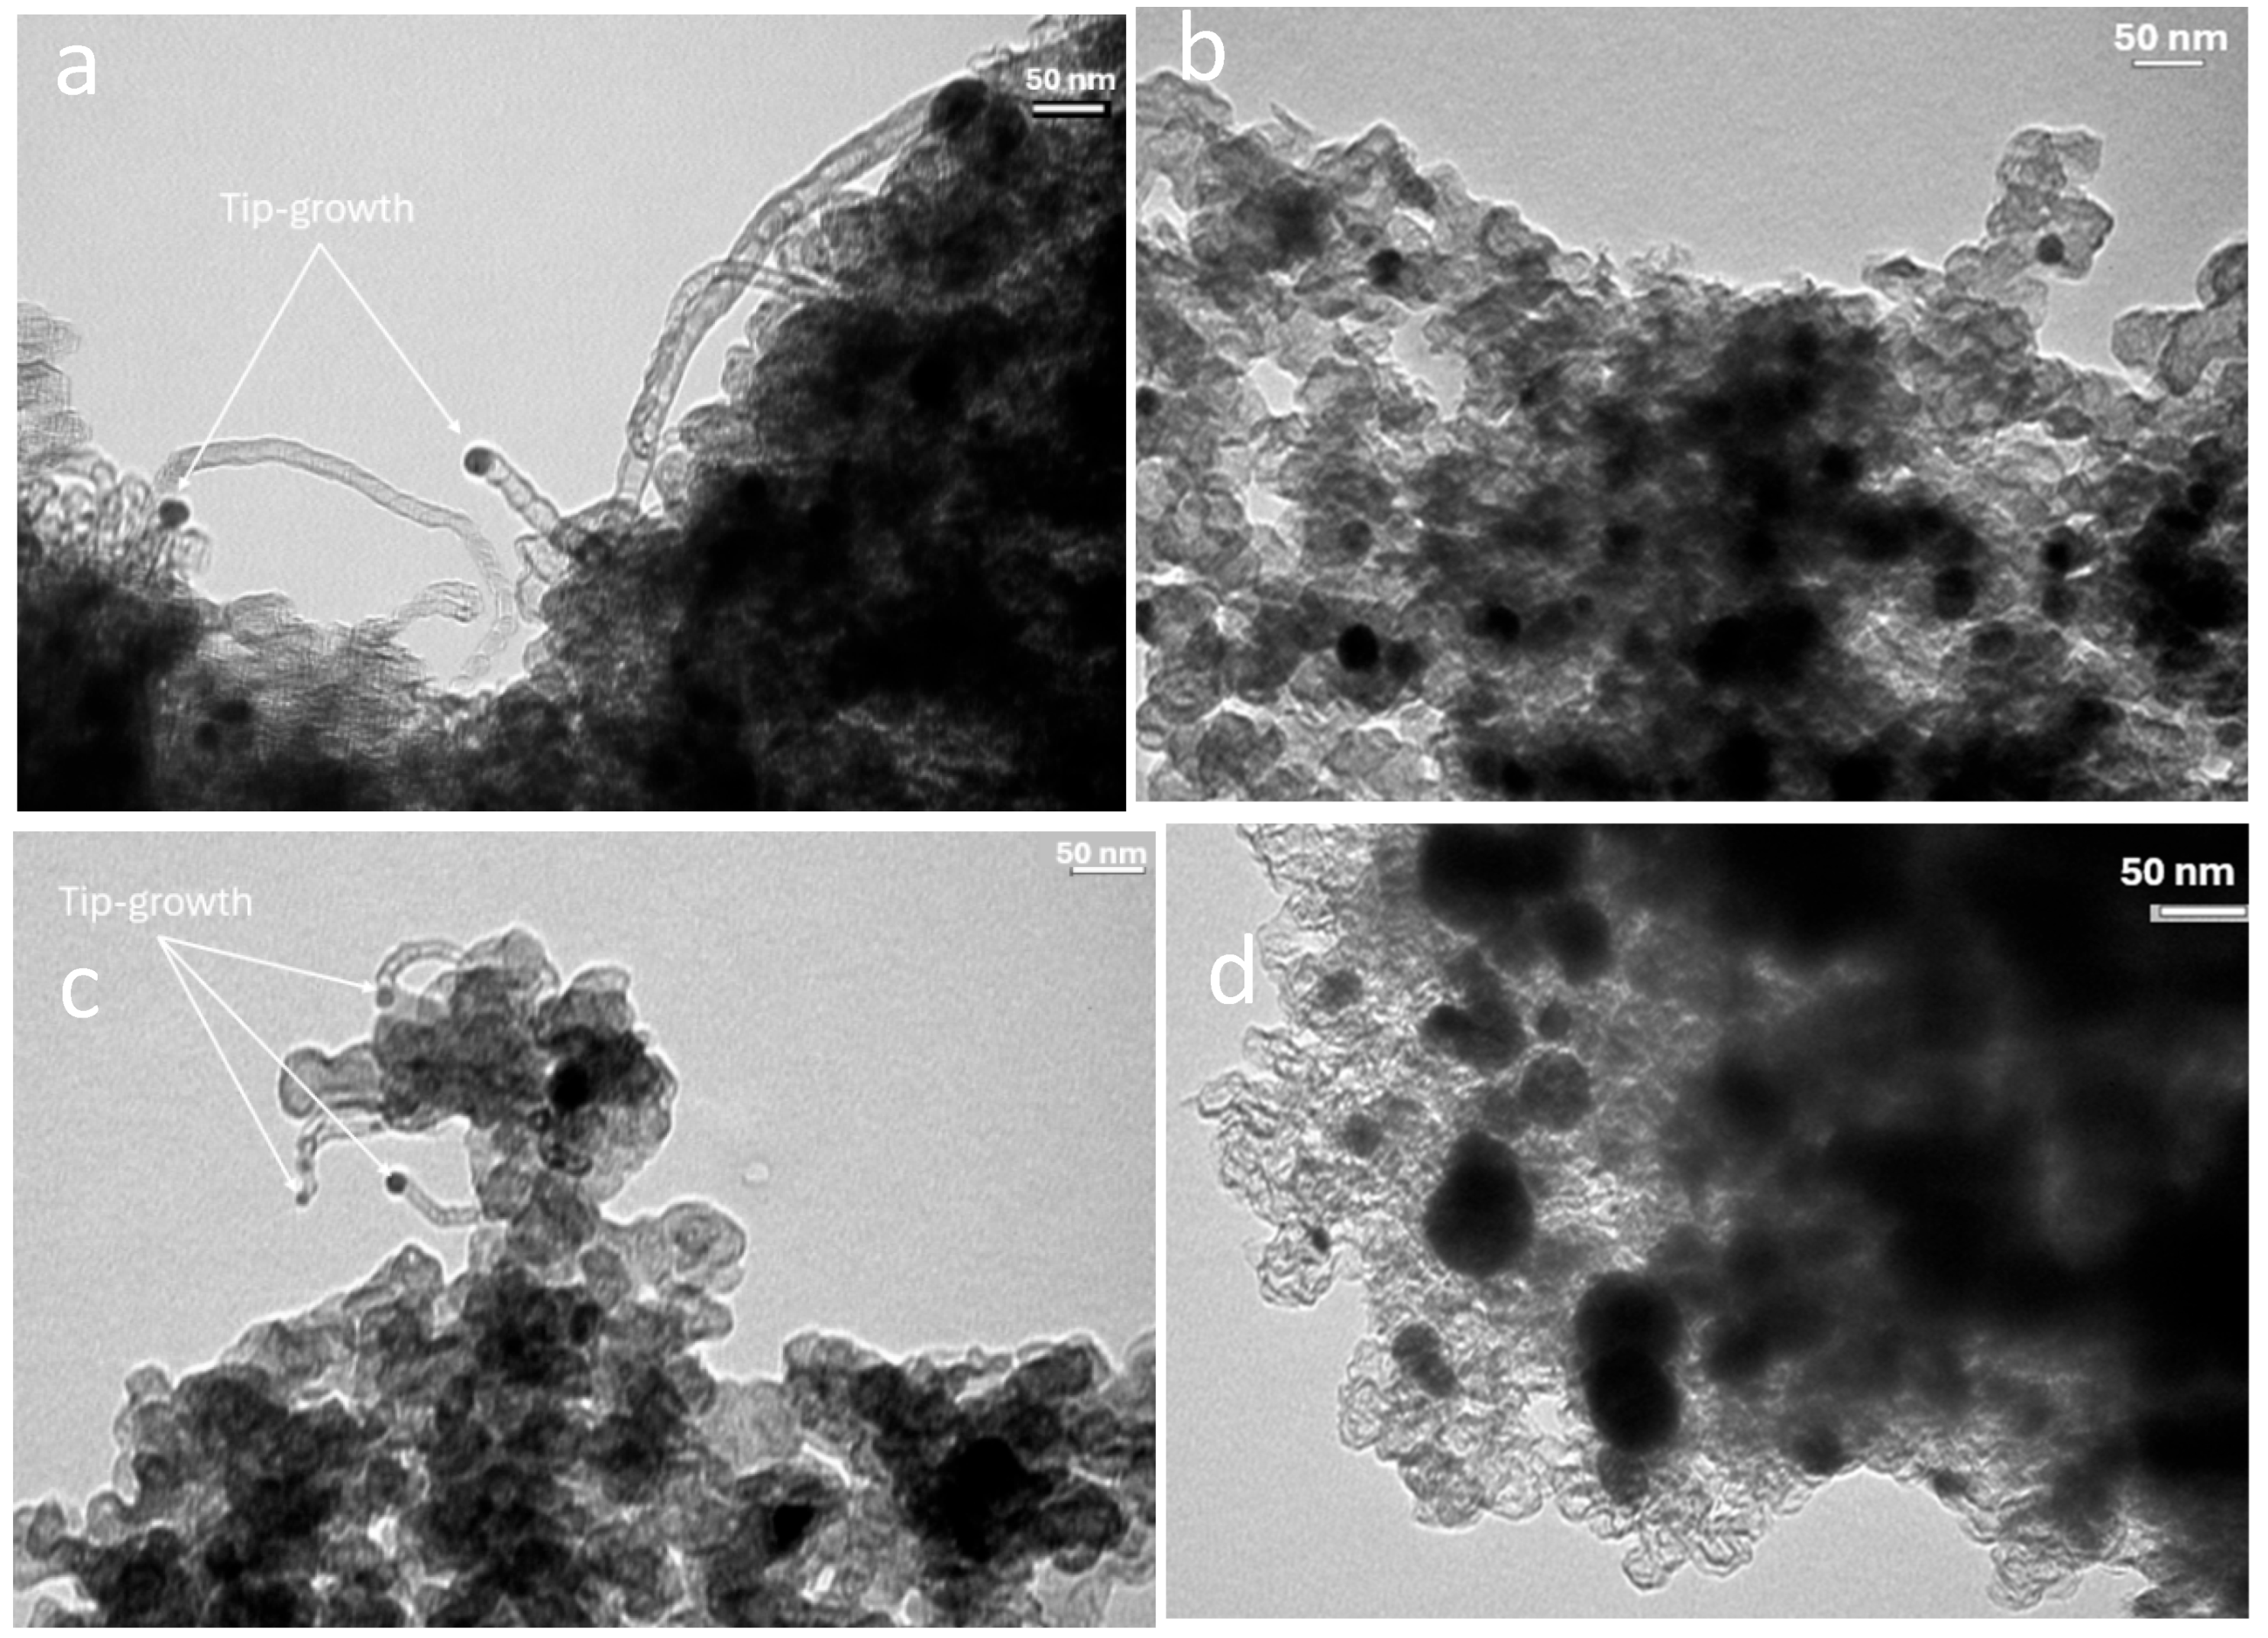
The nanomorphology of the catalyst samples was studied by TEM. Representative images from the catalyst with melamine and others without melamine are presented in Figure 5.
Initial morphological observations of the melamine-modified trimetallic catalyst (Fe-Ni-Co) revealed extensive in situ formation of complex nanocarbon structures during thermal treatment. The TEM images clearly show metal nanoparticles located at the tips of concentric, bamboo-like carbon nanotubes (CNTs), indicating a predominant tip-growth mechanism under furnace conditions [24].
Importantly, due to this specific growth mechanism and the differing carbon diffusion kinetics of the individual metals, the active elements undergo physical separation and migrate away from one another [25]. This spatial segregation disrupts the bonds required for synergistic electronic interactions among Fe, Ni, and Co. As a result, the isolated metal particles are less effective at reducing activation overpotentials, consistent with the inferior electrochemical performance observed during rotating disk electrode (RDE) measurements.
In contrast, catalysts synthesized without melamine did not form extended CNT structures. Instead, the metals remained more intimately alloyed and well anchored to the carbon support, leading to improved catalytic performance. This observation highlights the critical importance of preserving trimetallic proximity, as the primary advantage of the engineered catalyst lies in its synergistic multimetallic nature, which has been shown to outperform mono- and bimetallic systems [26].
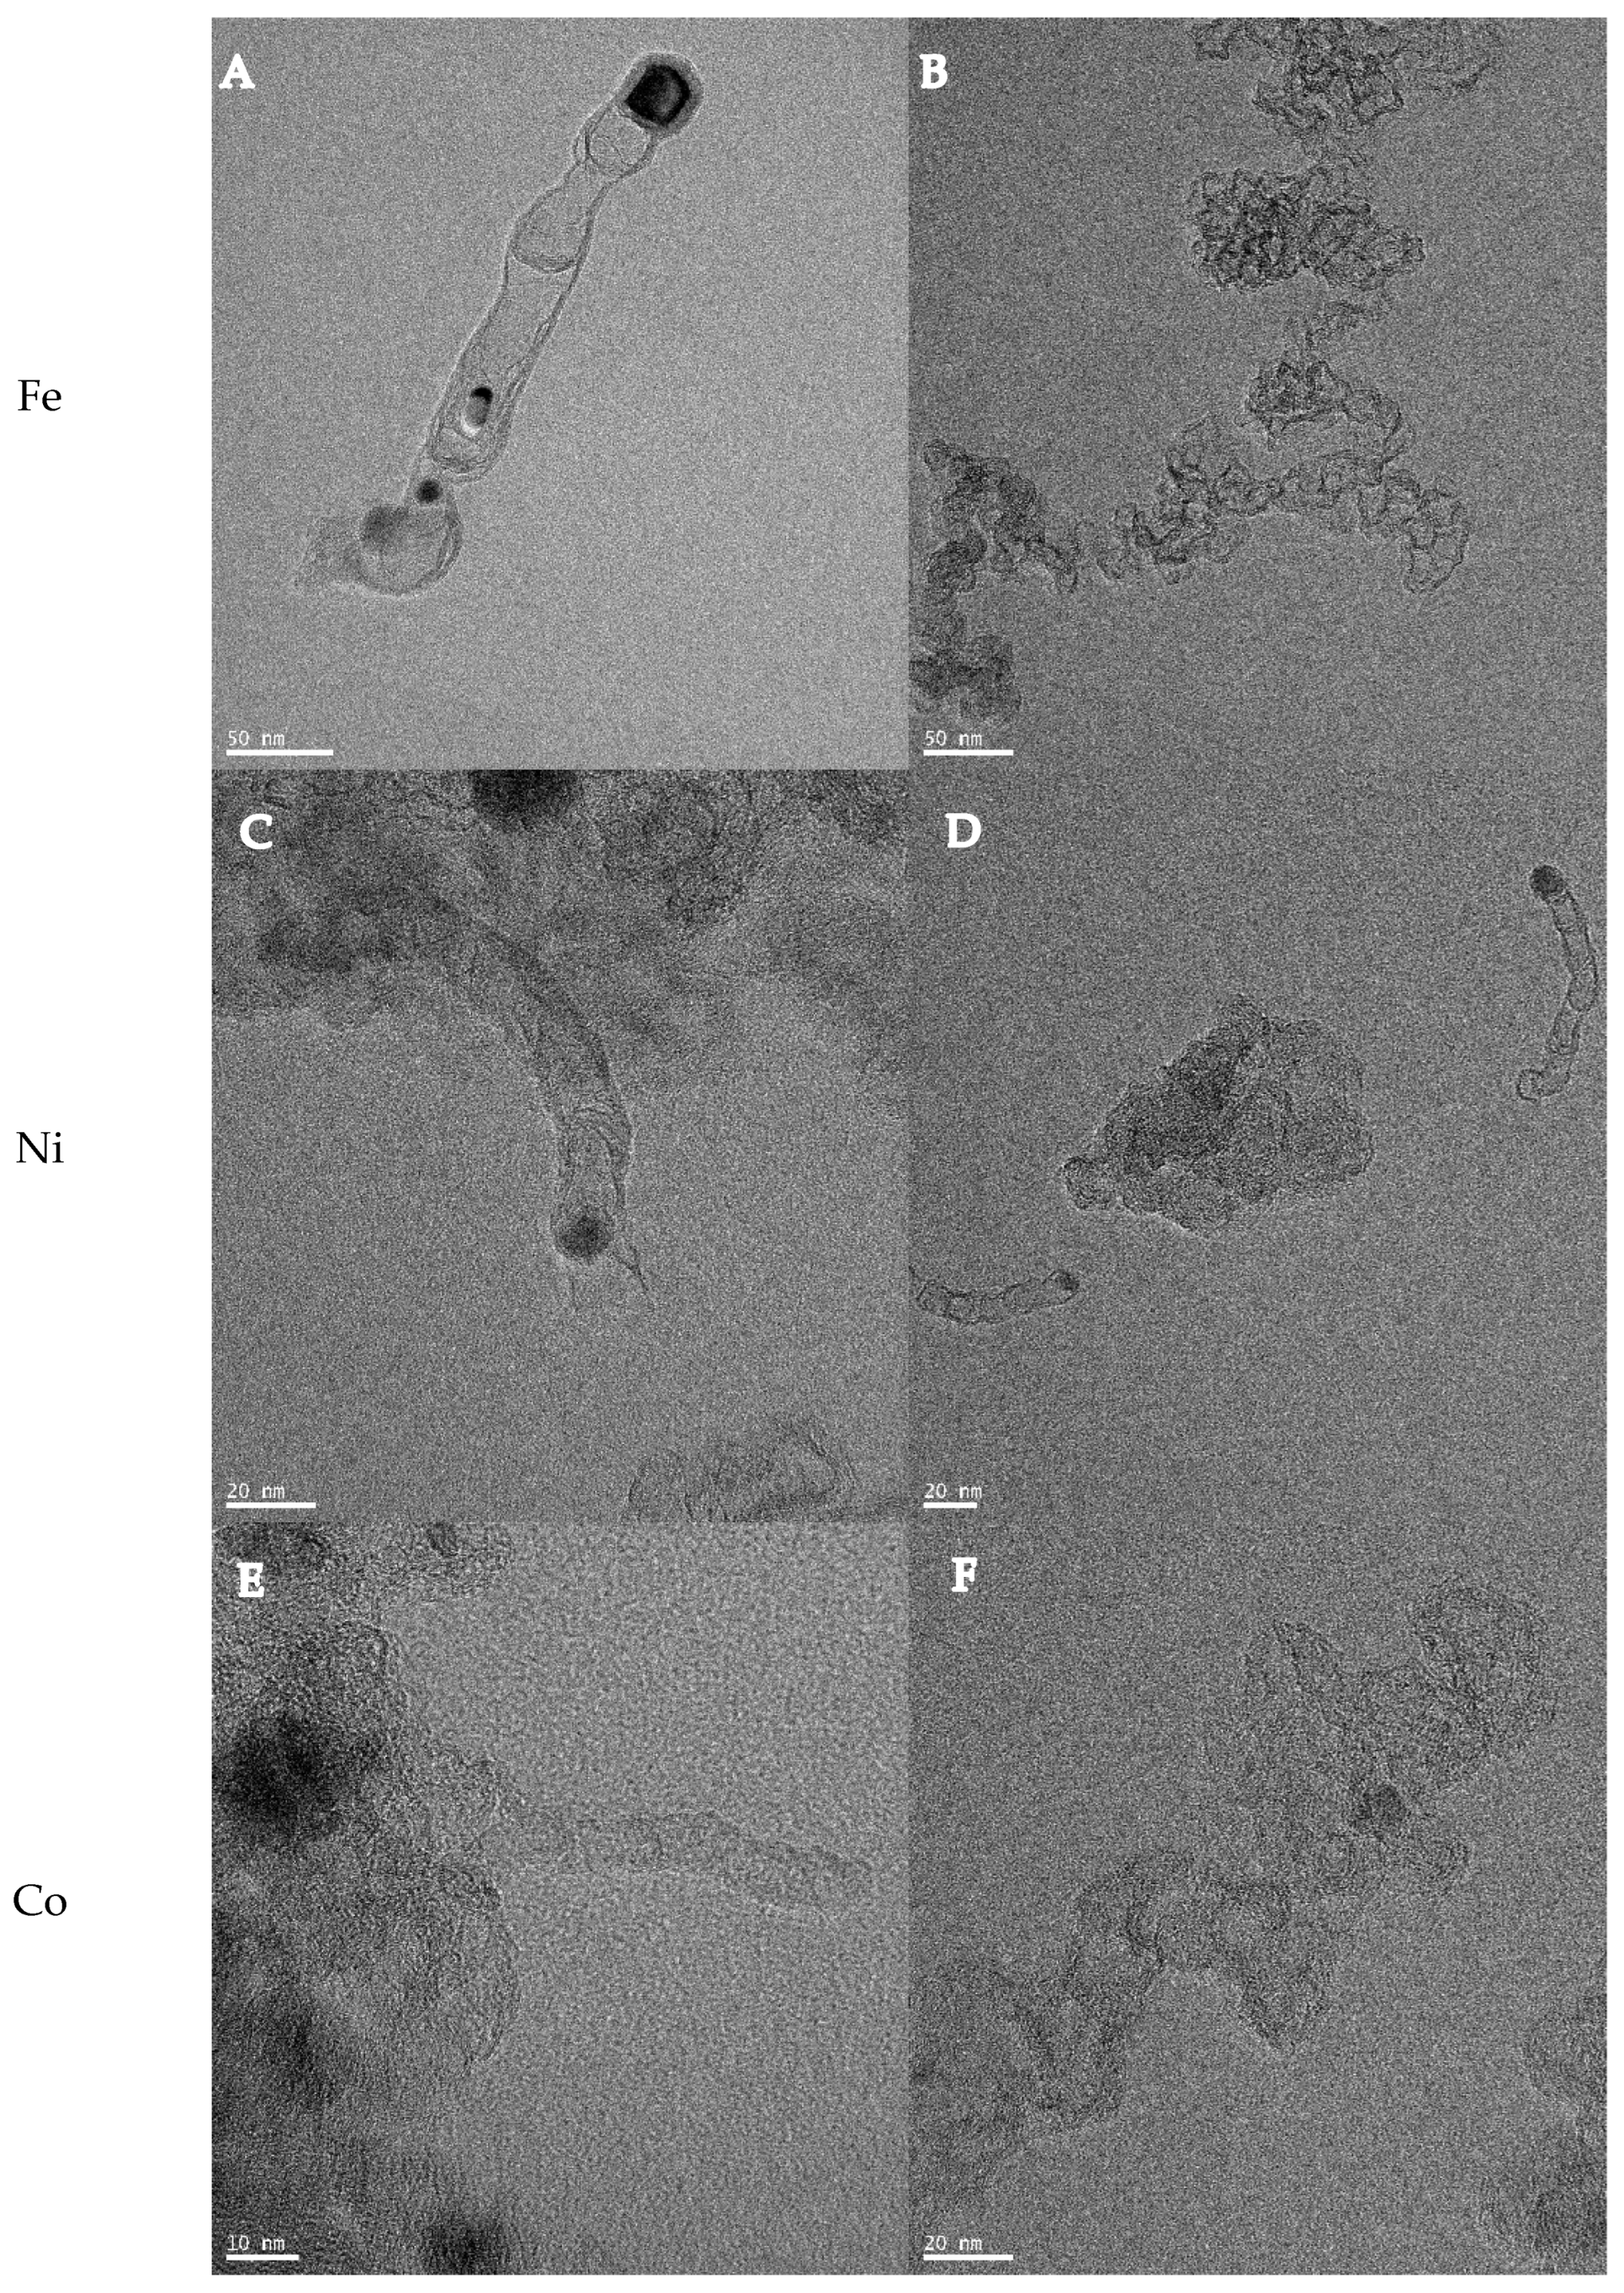
To further elucidate the intrinsic behavior of each metal and its role in promoting the observed tip-growth phenomenon, three monometallic control catalysts (Fe, Ni, and Co) were synthesized using melamine and Ketjen Black as supports, and the catalysts were subsequently analyzed by TEM. The resulting micrographs confirm that all three transition metals catalyze the formation of carbon nanostructures during thermal treatment. However, their distinct physicochemical properties lead to markedly different morphologies, as shown in Figure 6.
As observed in the Fe-based samples, iron exhibits a strong tendency to catalyze the growth of highly crystalline, straight carbon nanotubes (CNTs). The TEM images reveal well-defined, rigid tubular structures, often displaying the characteristic “bamboo-like” compartmentalization associated with nitrogen-doped CNTs [27]. The dark, high-contrast regions observed within these structures correspond to metallic nanoparticles, which act as active centers driving the highly directional and ordered growth of graphitic planes.
In contrast, the Ni-based catalysts promote the formation of significantly more tortuous and wavy carbon nanofibers (CNFs). The TEM images indicate a growth mechanism predominantly governed by tip growth, in which the catalytic Ni nanoparticle remains at the leading edge of the growing fiber [28].
As evidenced by the TEM analysis, cobalt catalyzes the formation of relatively thick, multi-walled carbon nanotubes (MWCNTs). These structures combine tubular features with densely graphitized, onion-like carbon layers encapsulating the metallic nanoparticles [29]. Metal clusters are frequently observed either embedded within the carbon matrix or anchored at the base of thicker nanotubes.
Consequently, the in situ growth of these N-doped carbon nanostructures is fundamentally detrimental to the OER activity of the trimetallic system. The carbon-growth mechanism, especially the Ni-driven tip growth, forces spatial segregation of the Fe, Ni, and Co phases during thermal treatment. As a result, the phase-segregated catalyst yields inferior performance compared to systems in which the transition metals remain intimately alloyed with the primary carbon matrix [30].

3.5. SEM/EDS

Scanning Electron Microscopy (SEM) coupled with Energy-Dispersive X-ray Spectroscopy (EDS) was employed to investigate the morphology and elemental composition of the catalyst used for the Oxygen Evolution Reaction (OER). SEM analysis revealed surface features, including particle size, porosity, and aggregation, which can significantly influence electrocatalytic activity. EDS allowed for qualitative and semi-quantitative assessment of surface elemental composition, confirming the presence and distribution of active metals and dopants. This characterization is essential for correlating the material’s structural and compositional properties with its OER performance.
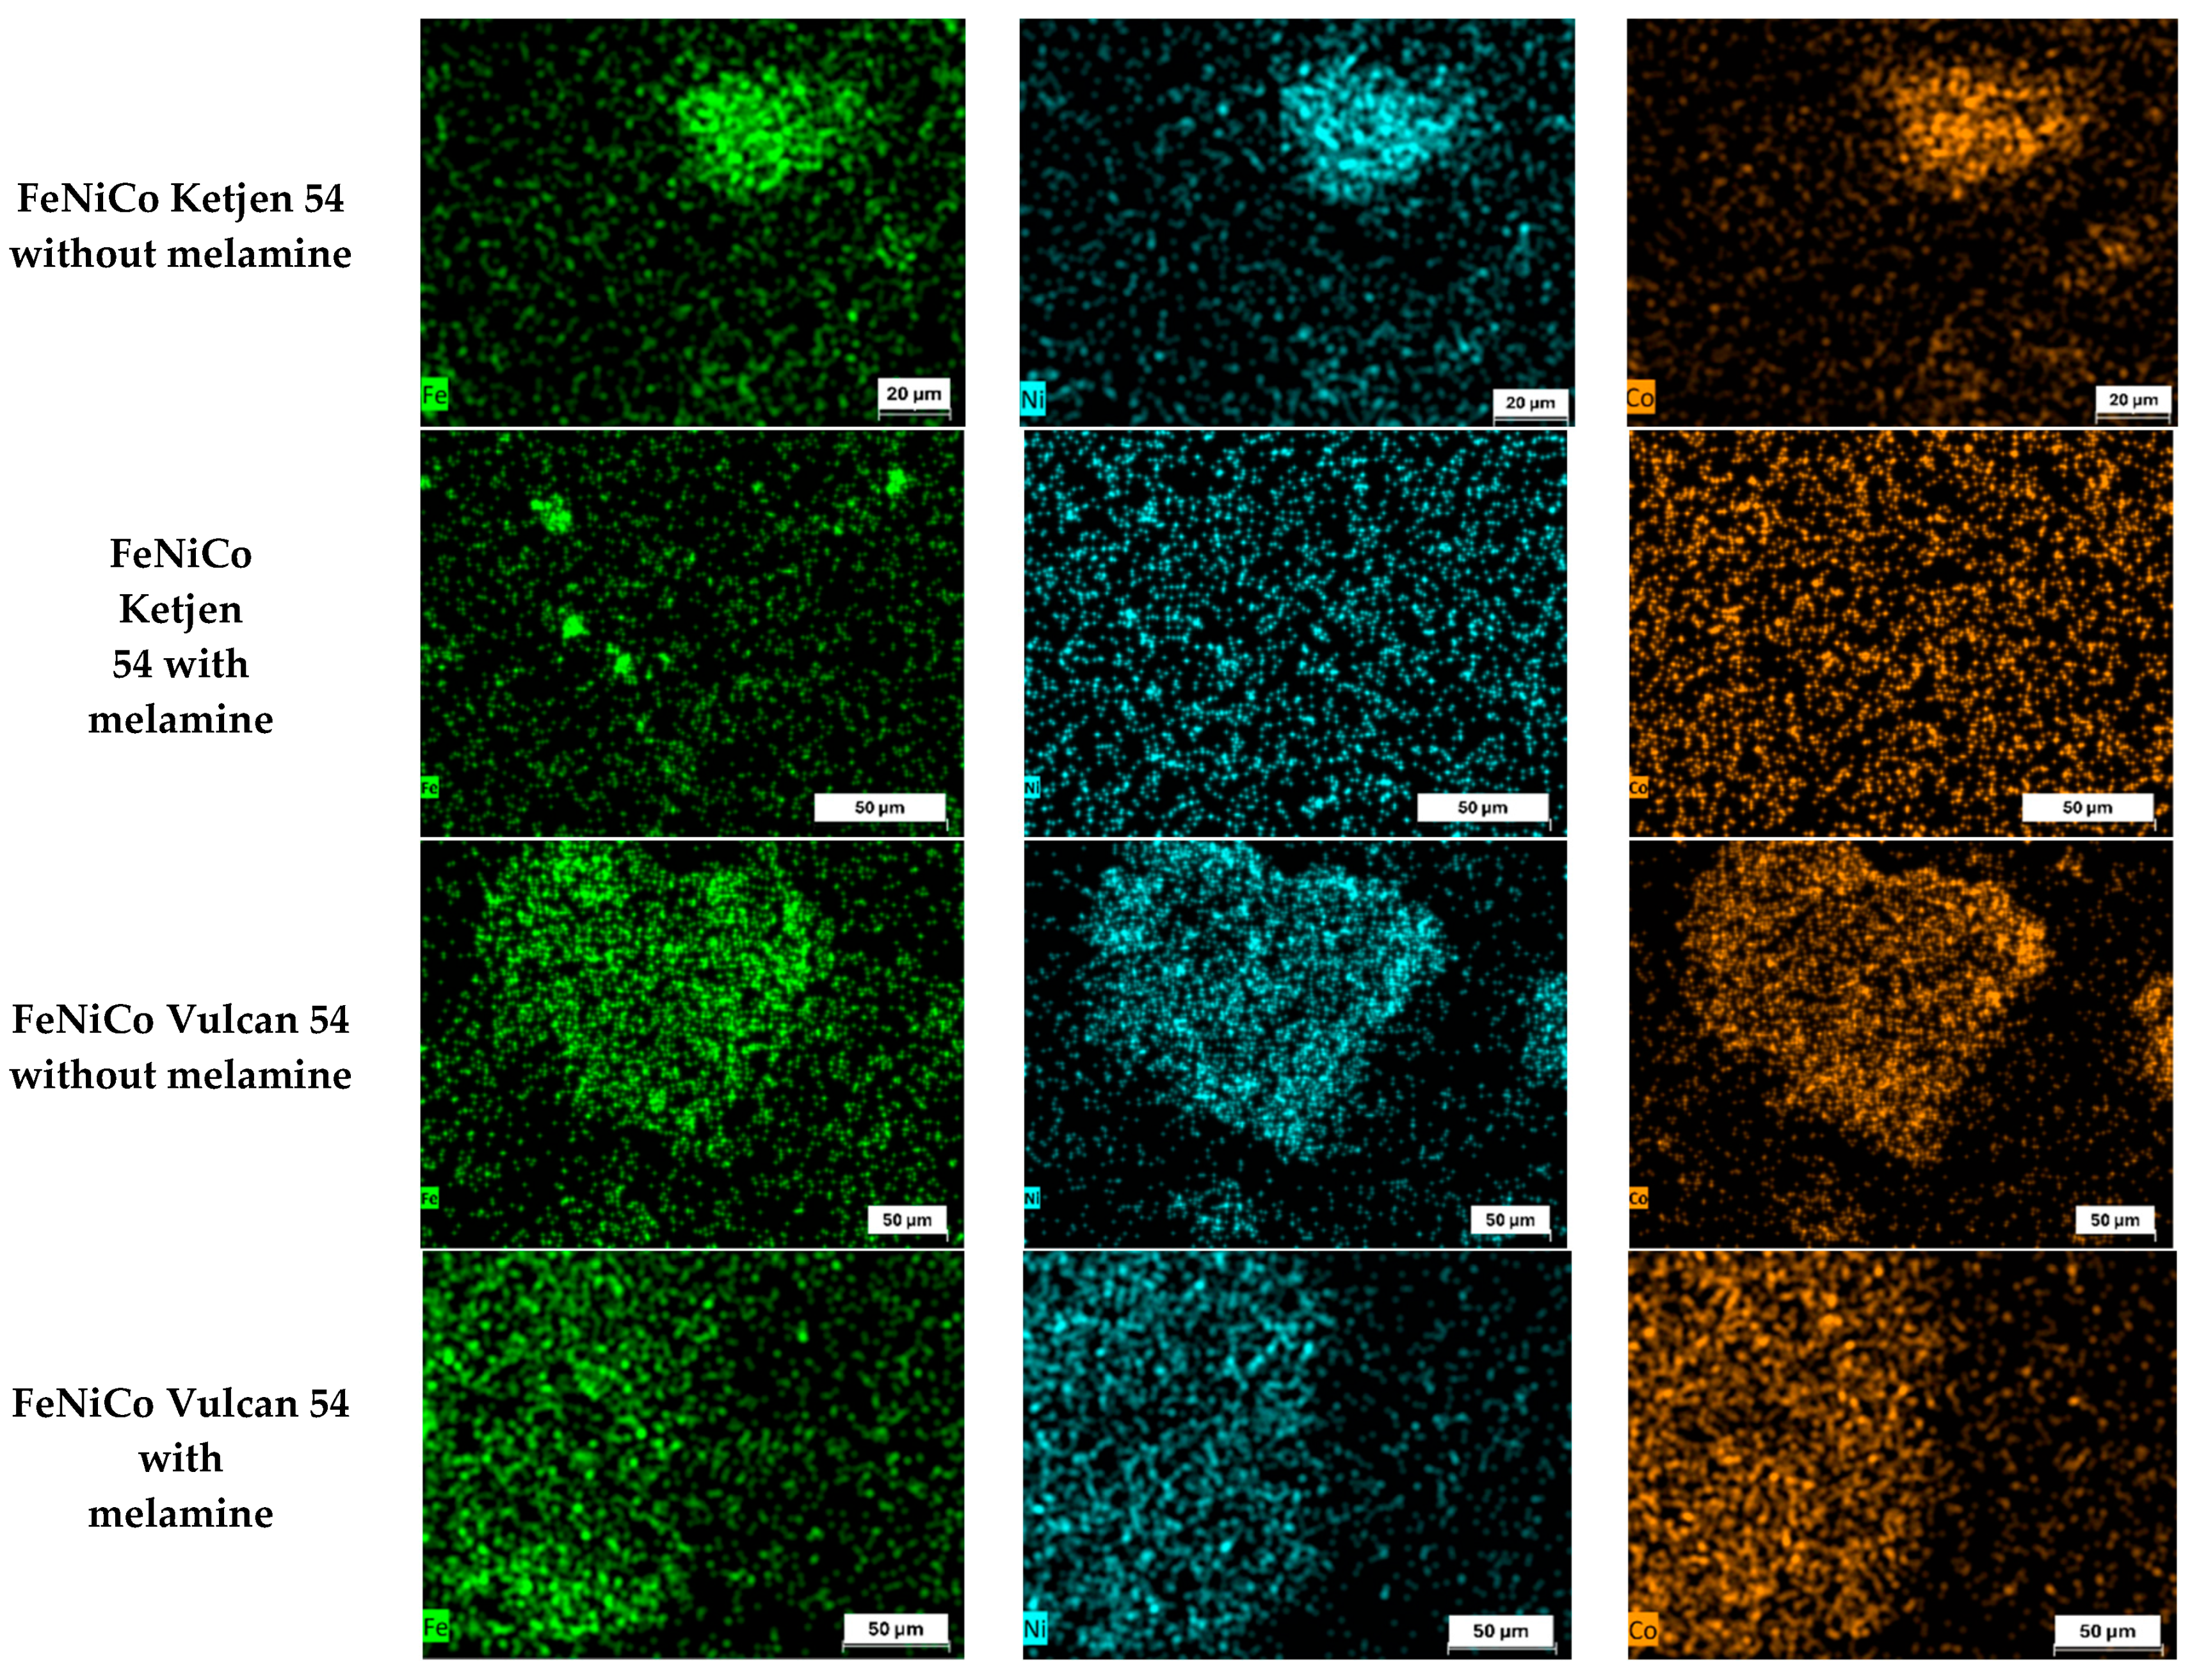
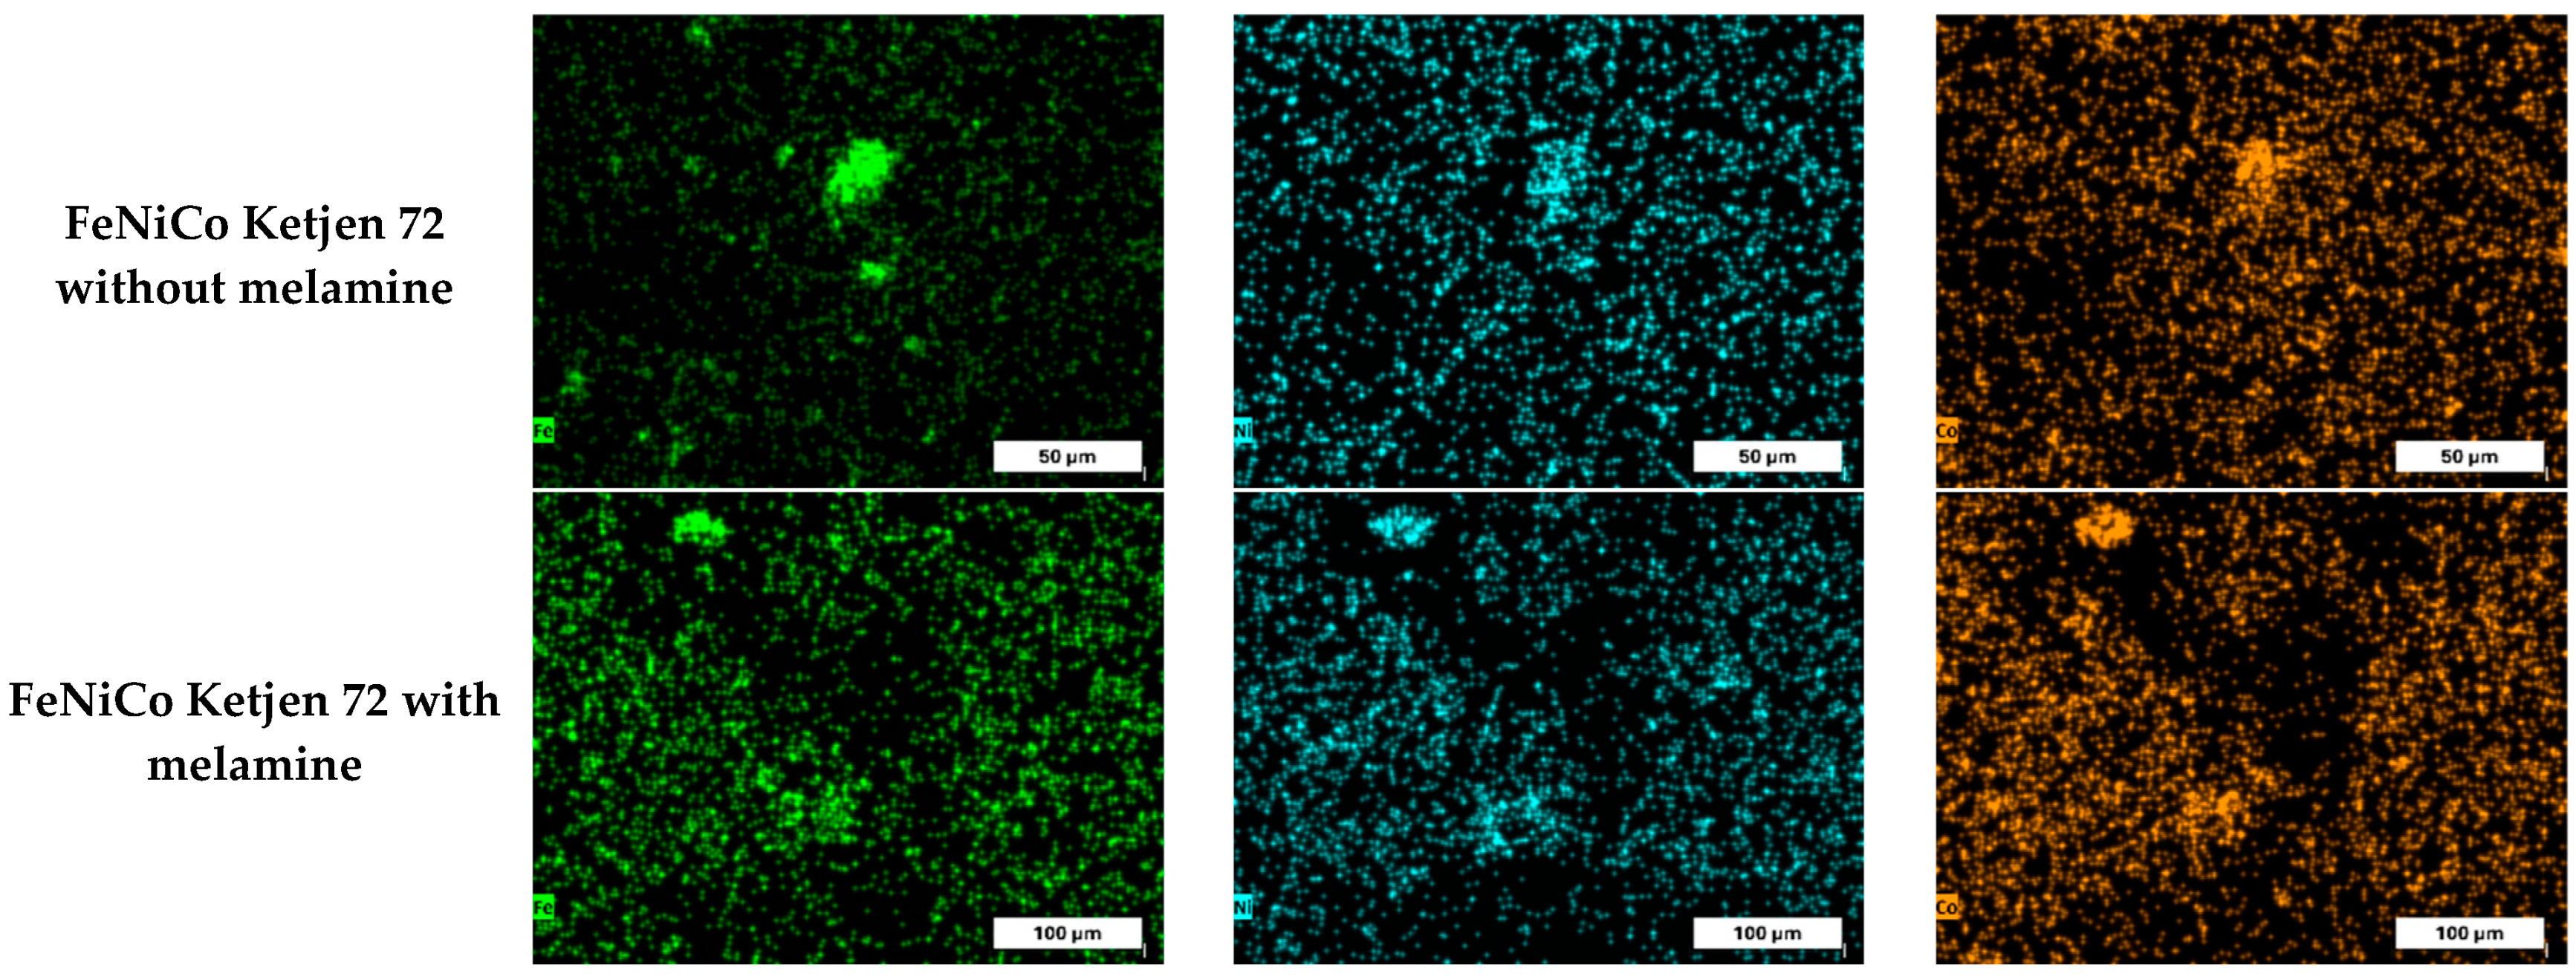
SEM images are presented in Appendix A2, while EDS results are presented next in Figure 7.
All catalysts prepared without melamine consistently show co-localization of the three metals, indicating the formation of trimetallic systems. In contrast, this co-localization is not systematically observed in catalysts prepared with melamine. A direct comparison between the FeNiCo Ketjen 54 catalysts synthesized with and without melamine suggests that the presence of melamine influences the spatial distribution of the metallic elements. However, this effect is not uniformly observed across all catalyst formulations.
While regions of higher local metal concentration persist, the introduction of melamine appears to limit the formation of highly concentrated metal domains, leading instead to a broader surface distribution of the metal nanoparticles. This behavior may be associated with melamine’s chemical role during synthesis, which can influence metal nucleation and growth. In particular, the formation of carbon nanostructures, discussed in the previous section, may contribute to a partial spatial separation of the metallic species during catalyst formation [31,32].
Although the specific carbon support (Vulcan vs. Ketjen) influences baseline particle dispersion, the addition of melamine is the dominant driving force, altering the spatial distribution and proximity of the active metal sites regardless of the support used. Consequently, catalysts prepared without melamine exhibit enhanced inter-metallic synergy, which contributes to their superior electrochemical performance, as the close association of the three metals appears to be highly favorable for OER activity under the conditions investigated.

3.6. Spectroscopic Characterization Techniques

Fourier Transform Infrared (FTIR) spectroscopy was employed to complement XPS analysis and probe the chemical structure of the catalysts. The results (Figure S6) and the discussion are presented in the Supplementary Information.

3.6.1. X-Ray Photoelectron Spectroscopy

XPS analysis was employed to investigate the near-surface chemical speciation of the catalysts, aiming to evaluate nitrogen incorporation and distinguish differences among the carbon supports. Notably, after the thermal treatment, a white powder was observed at the furnace outlet (Figure S3 of the Supplementary Material), which appeared to be melamine (Figures S4 and S5 of the Supplementary Material). The formation of this by-product raised uncertainty about the effectiveness of the nitrogen-doping process, suggesting that nitrogen incorporation may have been limited or absent. This hypothesis is further discussed in the context of the XPS N 1s spectra.
The focus will be on carbon (C 1s, ranging from 280 eV to 295 eV) and nitrogen (N 1s 394 eV to 408 eV), but spectra from the metals (Ni 2p (850 eV to 870 eV), Co 2p (775 eV to 805 eV), Fe 2p (700 eV to 725 eV) and oxygen (O 1s (528 eV to 542 eV) will also be treated.
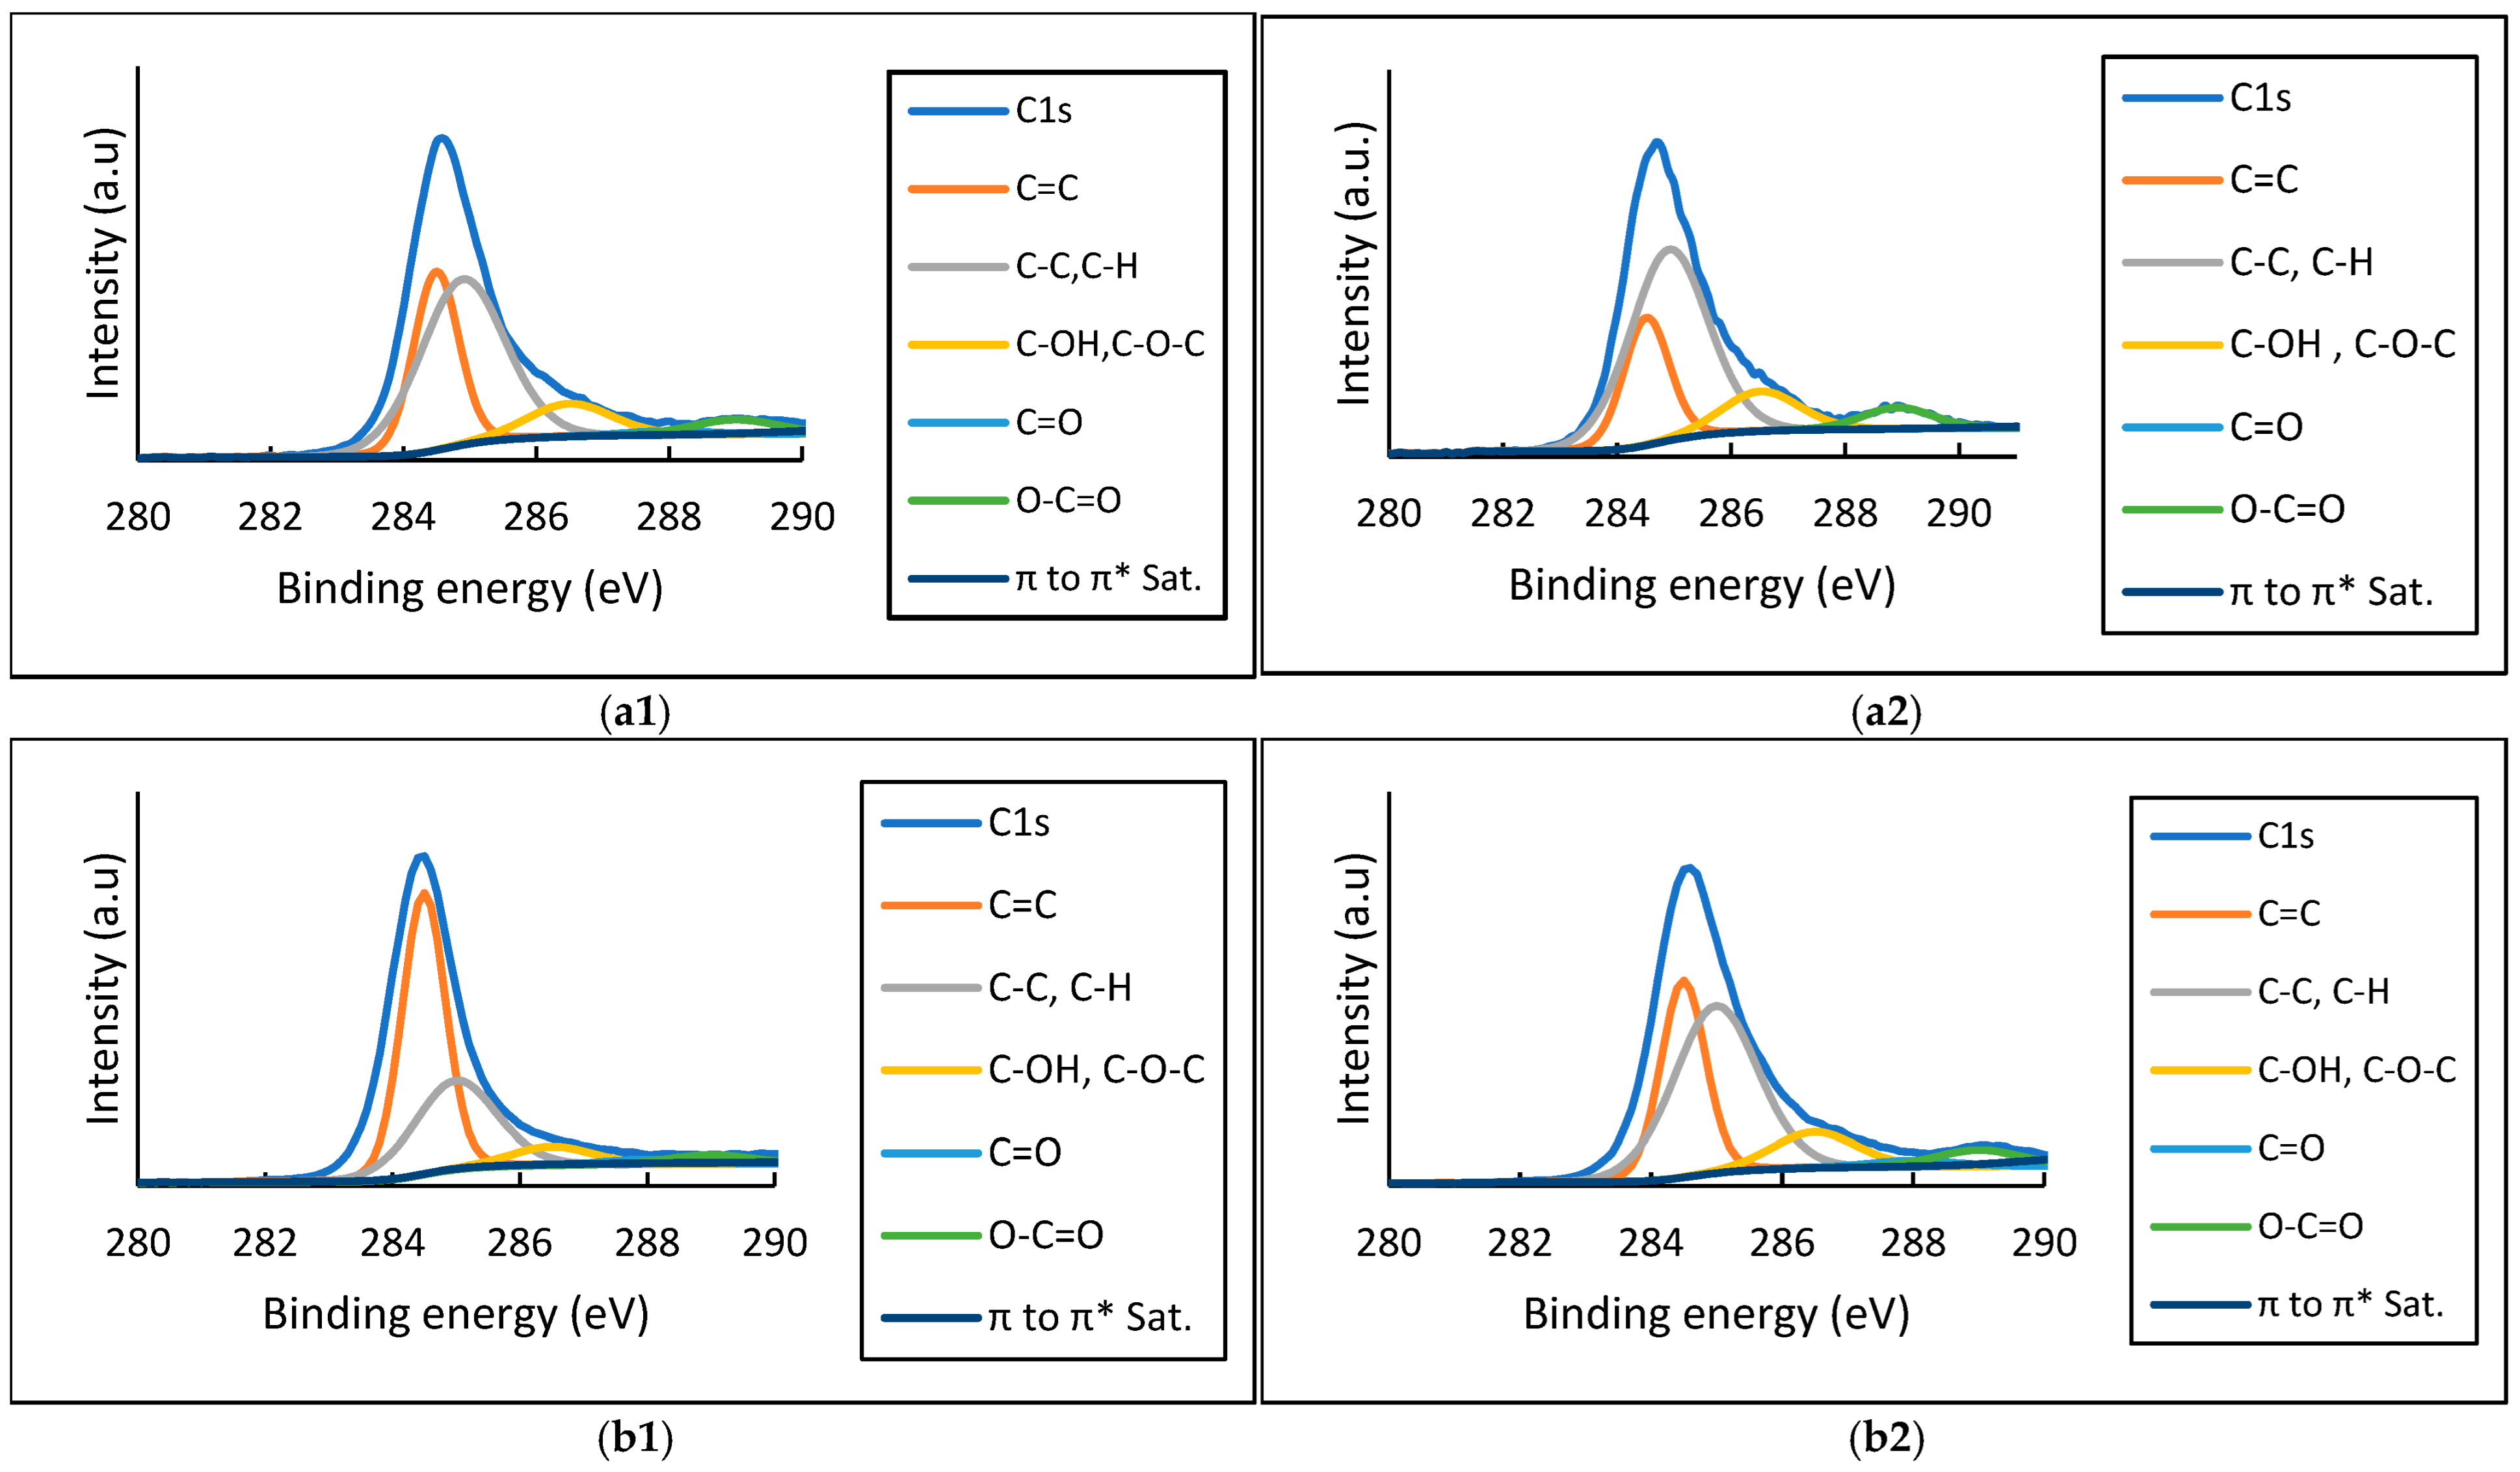
The primary XPS region for carbon corresponds to the C 1s binding energy range, approximately 284–290 eV, providing valuable information about the chemical states of carbon in the sample. The main peak located at ~284.5 eV is typically assigned to sp2-hybridized C–C bonds (graphitic or aromatic carbon) and sp3-hybridized C–C/C–H bonds present in aliphatic structures. Peaks observed at 285–286 eV are attributed to carbon atoms bound to more electronegative atoms, such as those in C–N or C–O functional groups. C–N functional groups (285.4 eV to 286.2 eV) may influence the deconvolution of the peaks around these binding energies and will be discussed later. Higher binding energies, between 286 eV and 288 eV, are generally associated with carbonyl (C=O) or ether/ester (O–C–O) groups, while a component around 289 eV corresponds to carboxyl or carbonate (O–C=O) species. The fitting was performed according to the curve-fitting procedure for graphitic/graphene/carbon nanotubes [33].
It is essential to note that the C 1s region alone does not permit the unambiguous identification of specific metal–carbon interactions (e.g., Co–C, Fe–C, Ni–C), as these signals typically overlap with the main C–C/C–H peak at 284.5 eV, taking the account the low metal loading compared to carbon. Therefore, to confirm the presence and nature of metal–carbon bonding, it is necessary to analyze the core-level spectra of the corresponding metals (e.g., Co 2p, Fe 2p, Ni 2p) and to correlate these results with the overall chemical composition and bonding environment of the material.
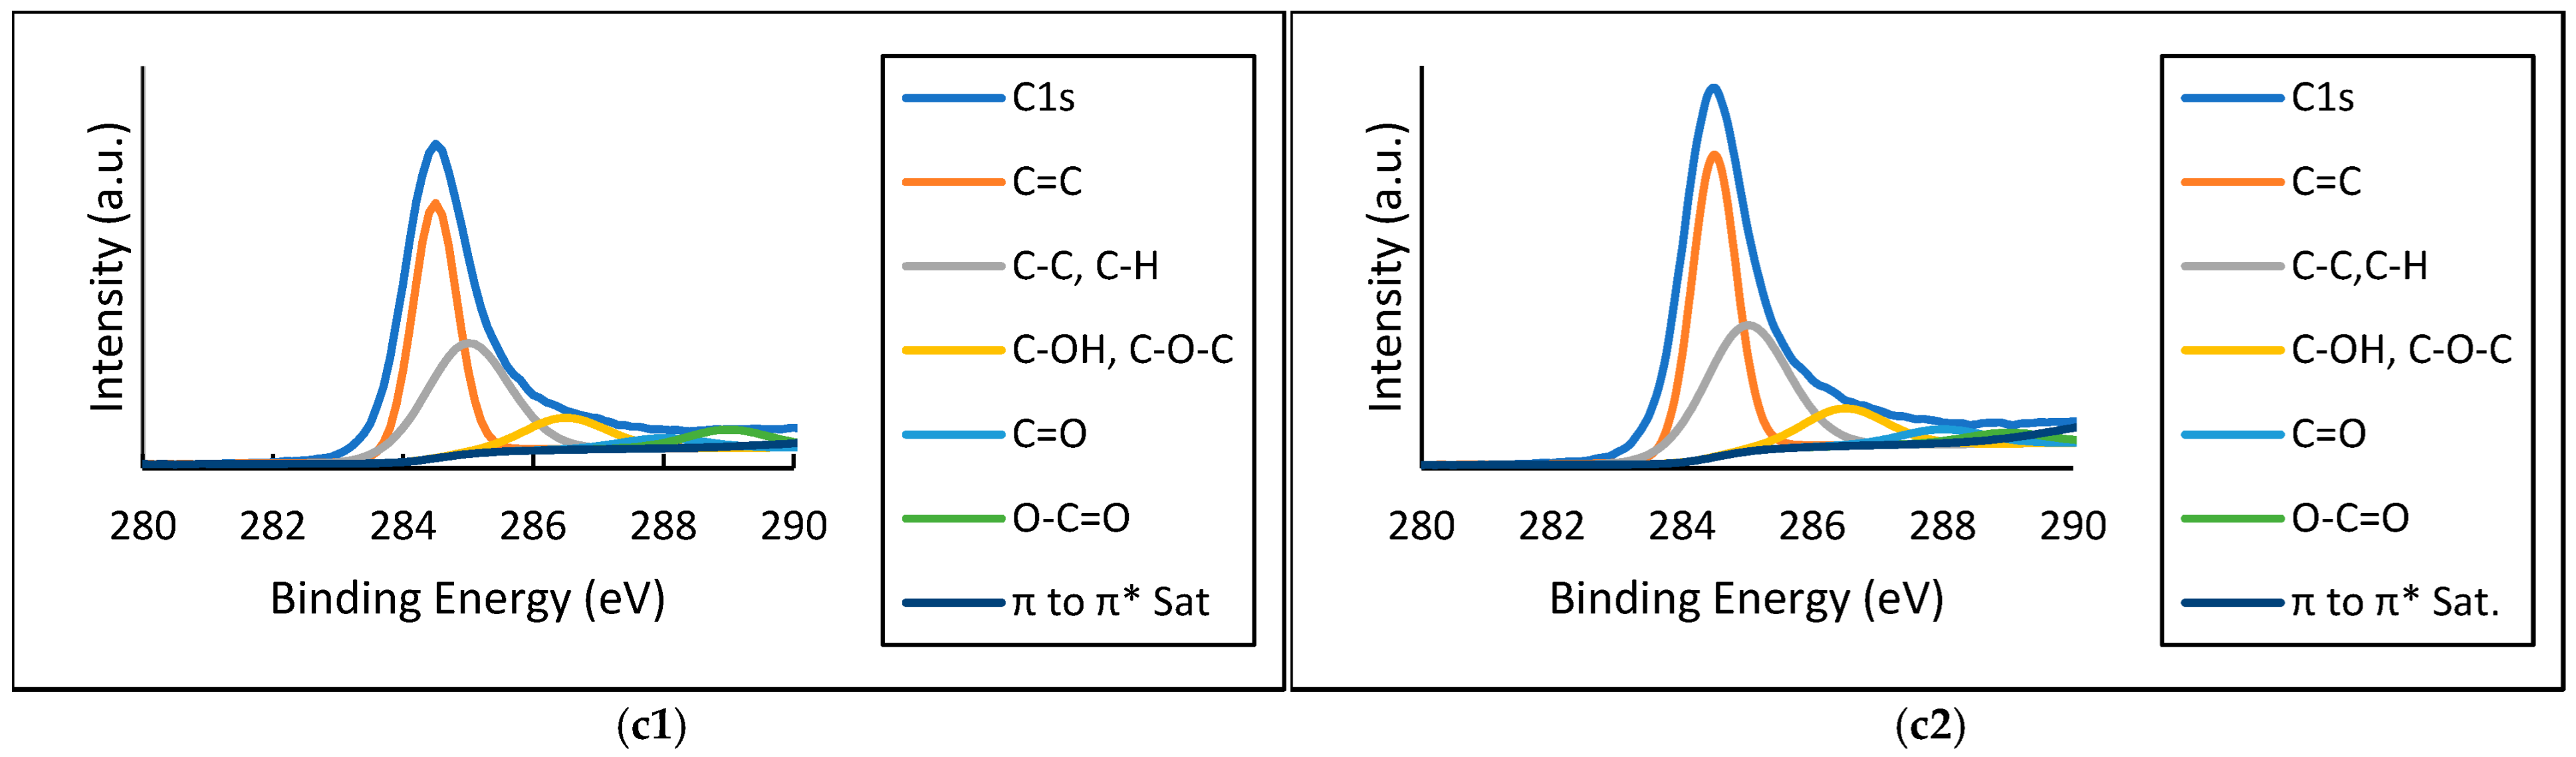
The results for C 1s are presented in Figure 8.
The C 1s region of the XPS spectra of all catalysts is dominated by a main asymmetric contribution centered at approximately 284.5 eV, characteristic of electronically conductive carbon with a high degree of sp2 hybridization, indicative of well-developed graphitic domains. However, this contribution does not have the same relative intensity in samples prepared without and with melamine. Upon the introduction of melamine, a decrease in intensity is observed, suggesting reduced graphitization. A broader satellite feature at higher binding energy (around +6.4 eV relative to the central peak) is also observed and is assigned to π–π* transitions associated with aromatic graphitic structures.
Catalysts prepared with melamine exhibit an additional and more pronounced contribution around 286 eV compared to their counterparts without melamine. This feature is commonly attributed to oxygen-containing carbon species (C–O, C–OH, C–O–C) and indicates increased surface functionalization and chemical heterogeneity of the carbon matrix. It should be noted that C–N species can also contribute to this binding energy region; however, since nitrogen is present in much lower amounts than carbon, this feature likely reflects, at least in part, surface modifications of the carbon support. This difference becomes less evident for the FeNiCo 72 Ketjen catalyst pair, suggesting that melamine has a smaller impact on the surface chemistry in this case, despite the higher nitrogen atomic concentration observed in the N 1s spectra (see Table 3 and Table 4).
Nitrogen incorporation is more reliably assessed from the N 1s spectra, located in the 397–401 eV binding energy range. In this region, contributions associated with metal–nitrogen species (typically 397–398 eV) may be present; however, due to peak overlap, the specific metal–nitrogen bonding environment cannot be unambiguously distinguished without analyzing the individual metal core-level spectra. The region between approximately 399 and 401 eV is also of interest, as it can indicate nitrogen bound to carbon species. The results for N 1s, Fe 2p, Co 2p, and Ni 2p are presented in Table 3 and Table 4.
Nitrogen is detected exclusively in the samples prepared with melamine, confirming its successful introduction onto both carbon supports at comparable concentrations. The N 1s binding energies are the same for both catalysts, suggesting that nitrogen is anchored in a similar chemical environment, most likely associated with the carbon support, as a binding energy around 398.8 eV is typical of azide- or pyridinic-type nitrogen species. In contrast, nitrogen coordinated directly to transition metals is often reported at binding energies near 397 eV [34]. Given the high carbon atomic concentration (ca. 90%), it is therefore reasonable to expect that nitrogen is predominantly bonded to carbon. Despite lower metal concentrations, small shifts in the metal core-level binding energies are observed, suggesting that some degree of electronic reorganization is also occurring in these metals.
Comparing the Vulcan and Ketjen supports, Ketjen generally shows a slightly higher nitrogen content, which can be attributed to its higher surface area and greater density of surface functional groups. This enhanced nitrogen incorporation may influence metal dispersion and metal–support interactions.
Overall, the XPS analysis confirms that the introduction of melamine leads to nitrogen functionalization of the catalyst surface while largely preserving the chemical states of Fe, Co, and Ni. The main effect of melamine is therefore associated with surface modification and partial coverage of metal sites rather than with changes in the metal oxidation states [28].

3.6.2. Raman Spectroscopy

Raman spectroscopy was utilized to characterize the structural properties of the carbon supports and the synthesized catalysts. The degree of graphitization, crystallinity, and defects was assessed from the intensity ratios of the characteristic carbon bands. The pure carbon supports were studied first to establish a baseline; pure melamine was also analyzed using this technique, but it revealed no peaks in the typical carbon regions: neither between 1570 cm−1 and 1600 cm−1 (where the graphitic G band, corresponding to the stretching of sp2 C–C bonds is located), nor in the 1330–1360 cm−1 range (where the disorder-induced D band appears). This absence was expected, as melamine lacks the conjugated sp2 C–C bonds typical of graphitic networks. However, as shown in the subsequent results, the presence of melamine within the catalyst matrix profoundly modifies the ID/IG ratios [35].
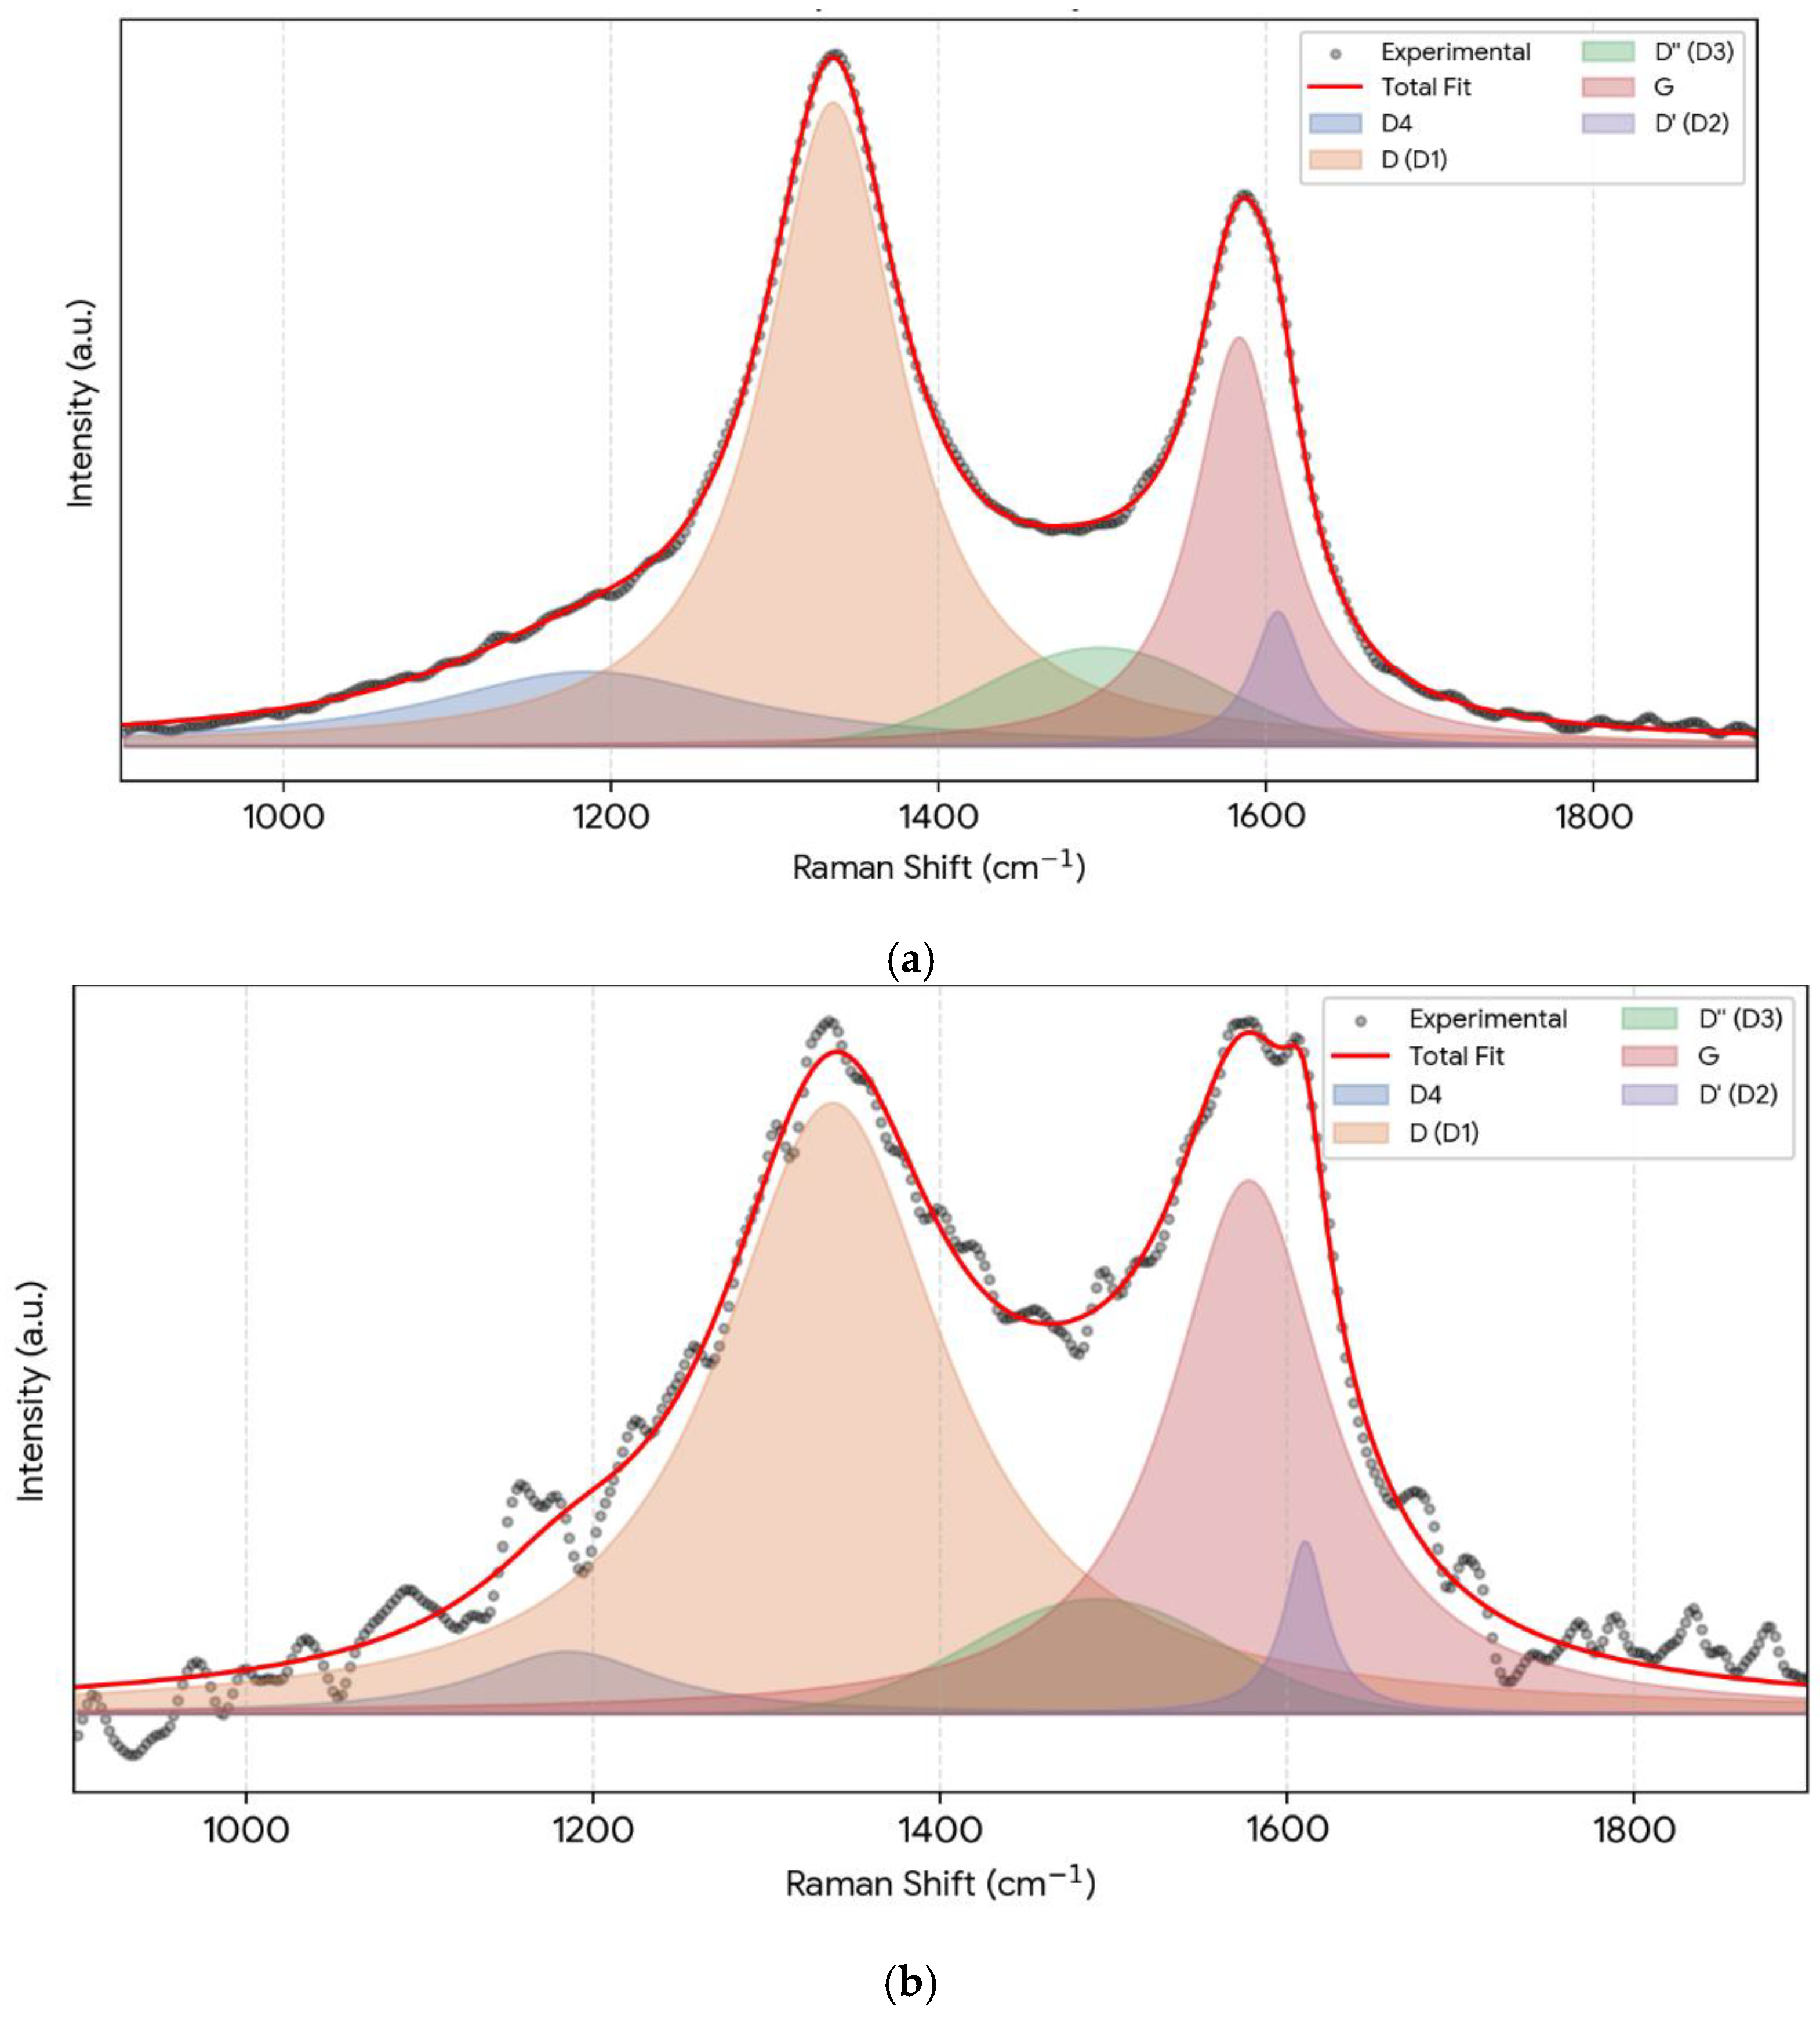
To assure a robust physical and mathematical deconvolution of the highly overlapped spectra typical of these highly disordered carbons, a hybrid fitting model was employed. The D4, D1 (D), G, and D2 (D′) bands were fitted using Lorentzian functions (accounting for homogeneous phonon broadening). Conversely, the D″ (or D3) band, located near 1500 cm−1, was fitted with a Gaussian function. The D″ band is independent of the excitation laser wavelength and is widely reported to be associated with amorphous sp2 bonded carbon forms and interstitial defects [36,37].
The results present both intensity ratios, ID/IG and ID″/IG, for both carbon supports, in Figure 9 and Table 5.
The obtained spectra are typical of carbon blacks. Based on the calculated intensity ratios, Vulcan XC72R presents a higher crystallinity, whereas Ketjenblack exhibits a much more defective and amorphous micro-structure (ID/IG and ID″/IG). This difference is consistent with the exceptionally high porosity and surface area displayed by Ketjenblack. [38].
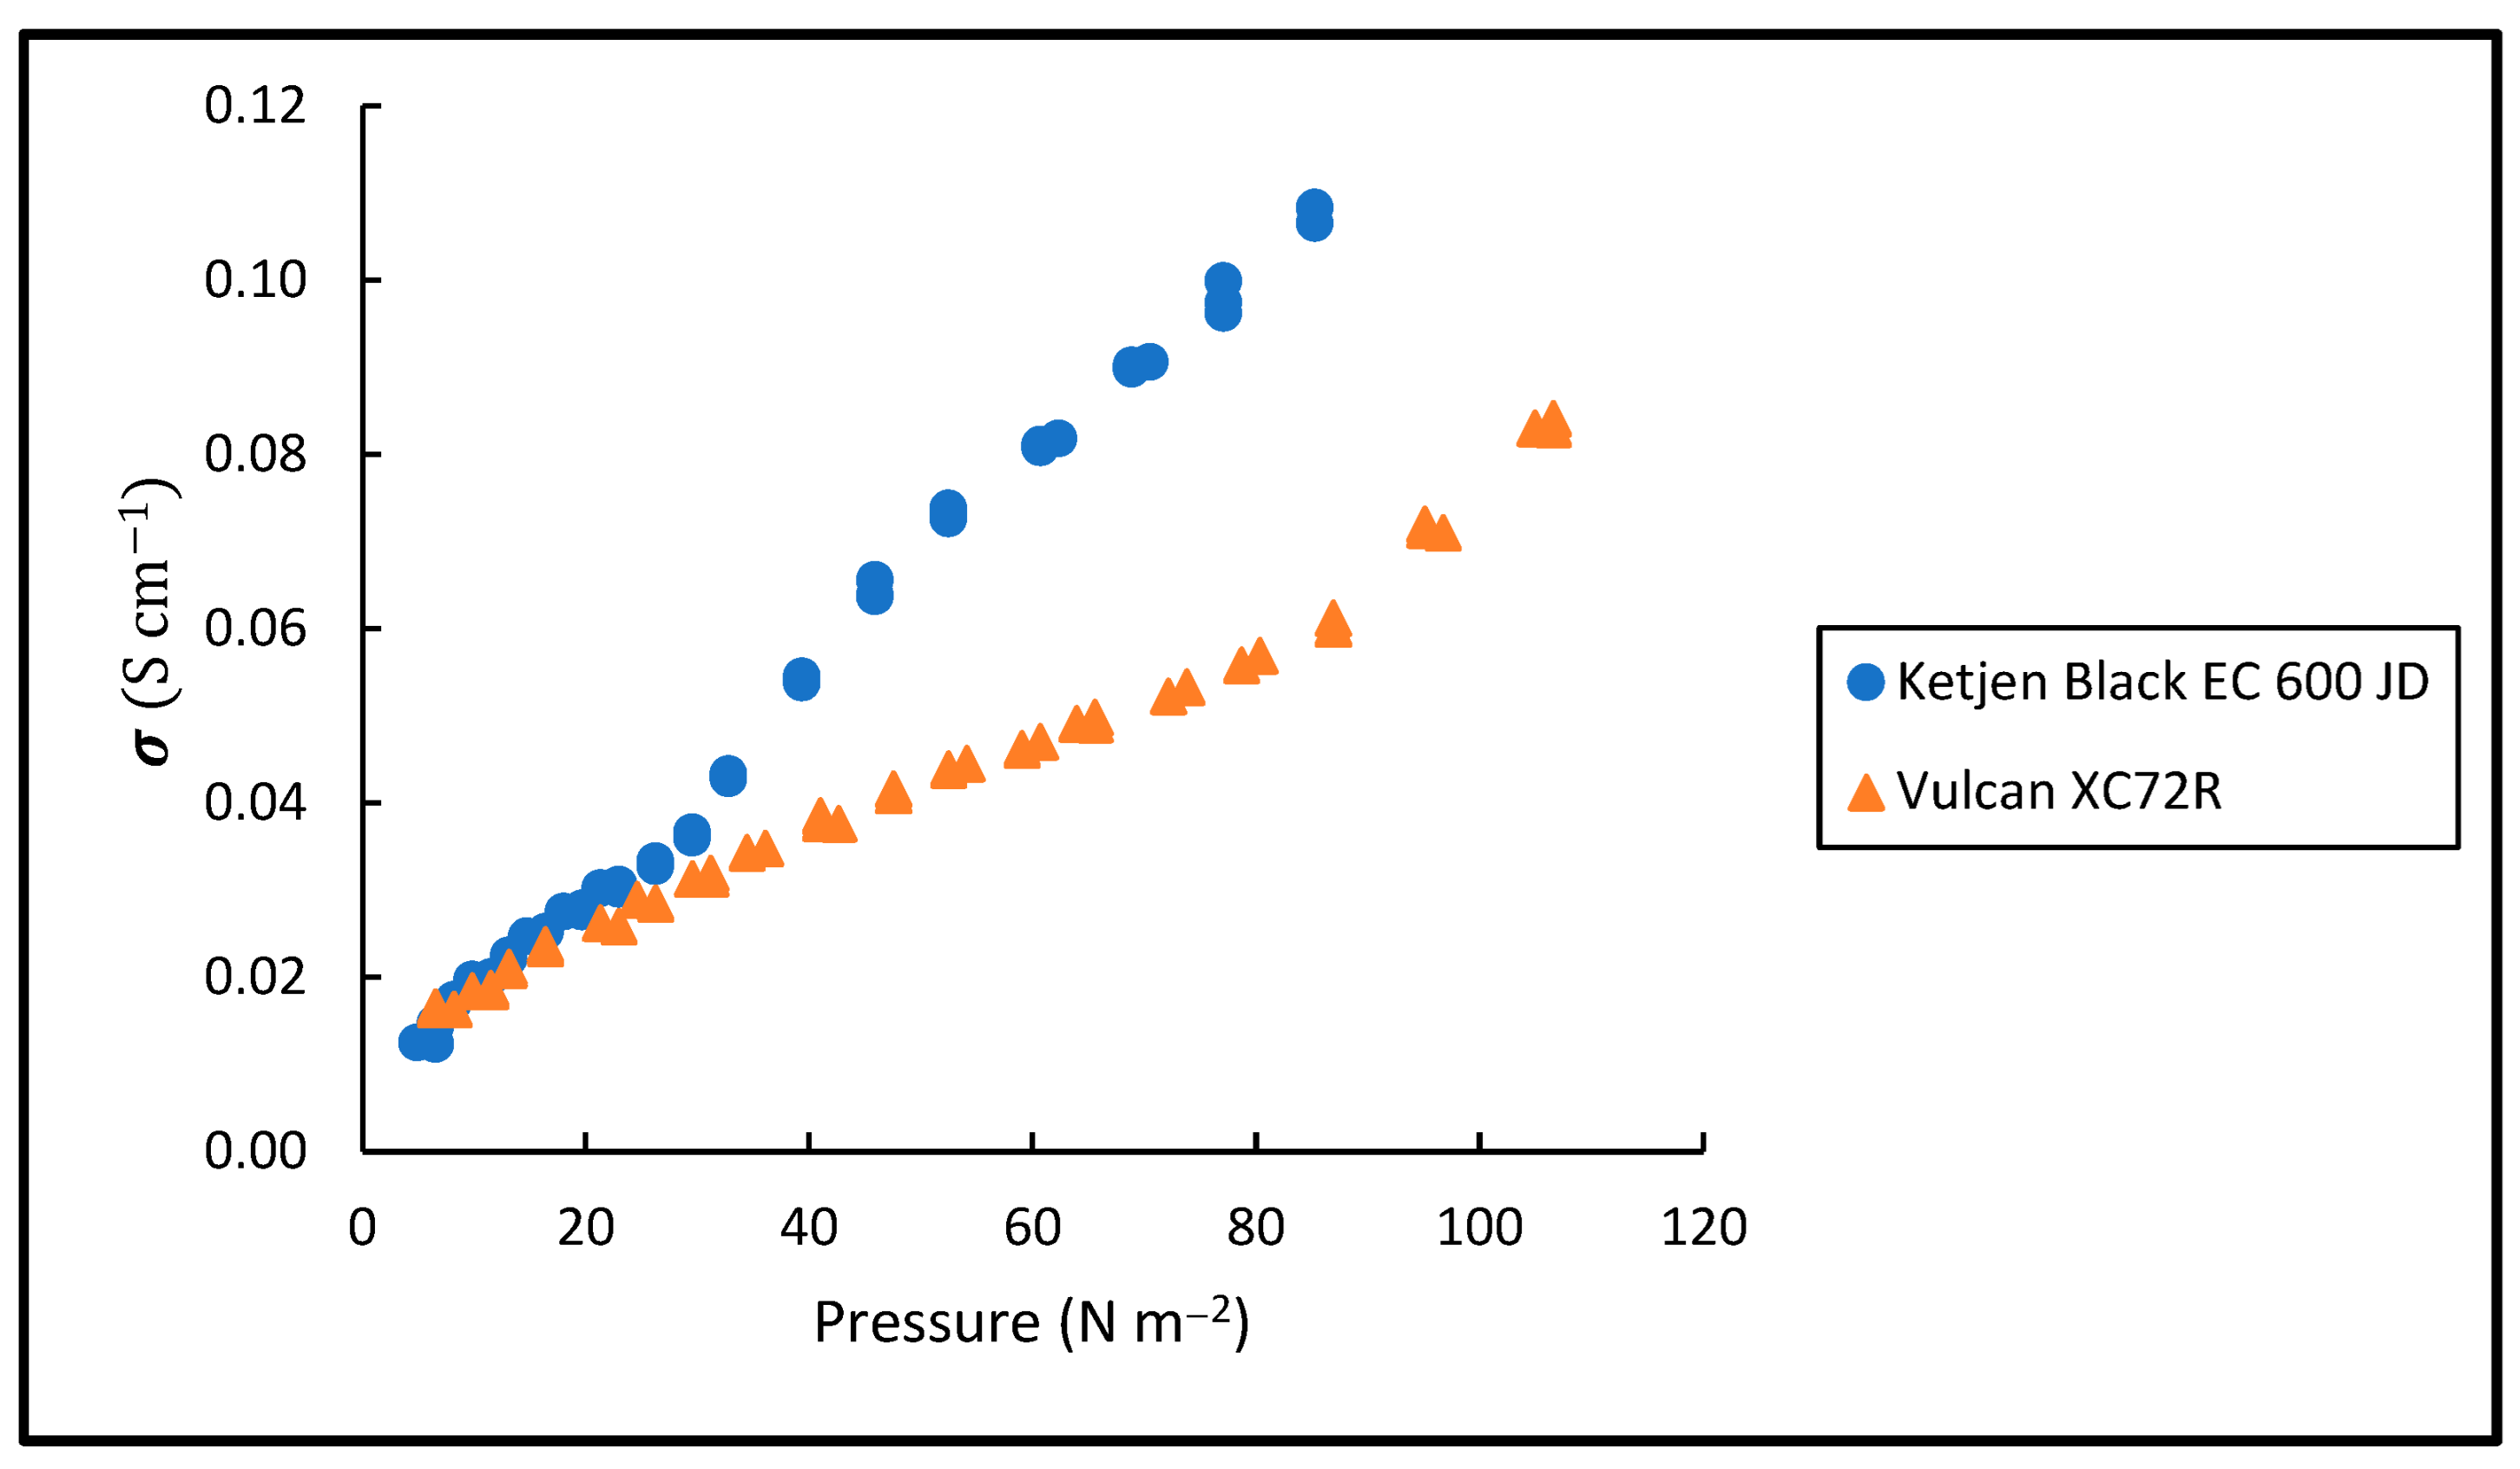
Generally, higher carbon crystallinity results in higher electronic conductivity, which is crucial for running electrochemical reactions. Conversely, a more amorphous, defective material can provide a higher density of active sites to host the metal catalysts, thereby improving catalytic reactivity. To evaluate macroscopic electron transport, the electrical conductivity of both pure carbon blacks was measured as a function of the applied specific force. The results are presented in Figure 10.
The results in Figure 10 show that Ketjenblack is significantly more conductive than Vulcan XC72R, which aligns with previous reports [38].
Raman analysis reveals that Ketjenblack has a more defective, amorphous microstructure at the atomic level [39]. While such microstructural disorder typically hinders intra-particle electron transport, the superior bulk conductivity of Ketjenblack highlights the critical role of mesoscale morphology [40]. Specifically, Ketjenblack forms highly branched “high-structure” aggregates that facilitate an extremely efficient 3D percolation network, effectively minimizing inter-particle contact resistance [41,42]. Therefore, Raman spectroscopy provides crucial insights into the intrinsic atomic-level disorder, which, when combined with the macroscopic aggregate morphology, explains the complex bulk electrical behavior of these carbon supports.
To investigate the effect of nitrogen doping (N-doping), Raman spectroscopy was performed on the catalysts synthesized with and without melamine. Table 6 summarizes the variation of ID/IG and ID″/IG across the different catalysts.
As shown in Table 6, melamine incorporation significantly increases the amorphous and defective character of the carbon support. This is evidenced by the prominent rise in both the ID/IG and ID″/IG ratios upon melamine addition, reflecting a structural transition from a graphitic lattice to a highly disordered framework. The Raman analysis agrees with the XPS C 1s results, which independently show a reduction in the (C=C) contribution; together, these techniques indicate a severe disruption of the conjugated carbon network. Therefore, Raman spectroscopy confirms that nitrogen doping significantly increases the structural disorder of the carbon framework.

3.7. XRD

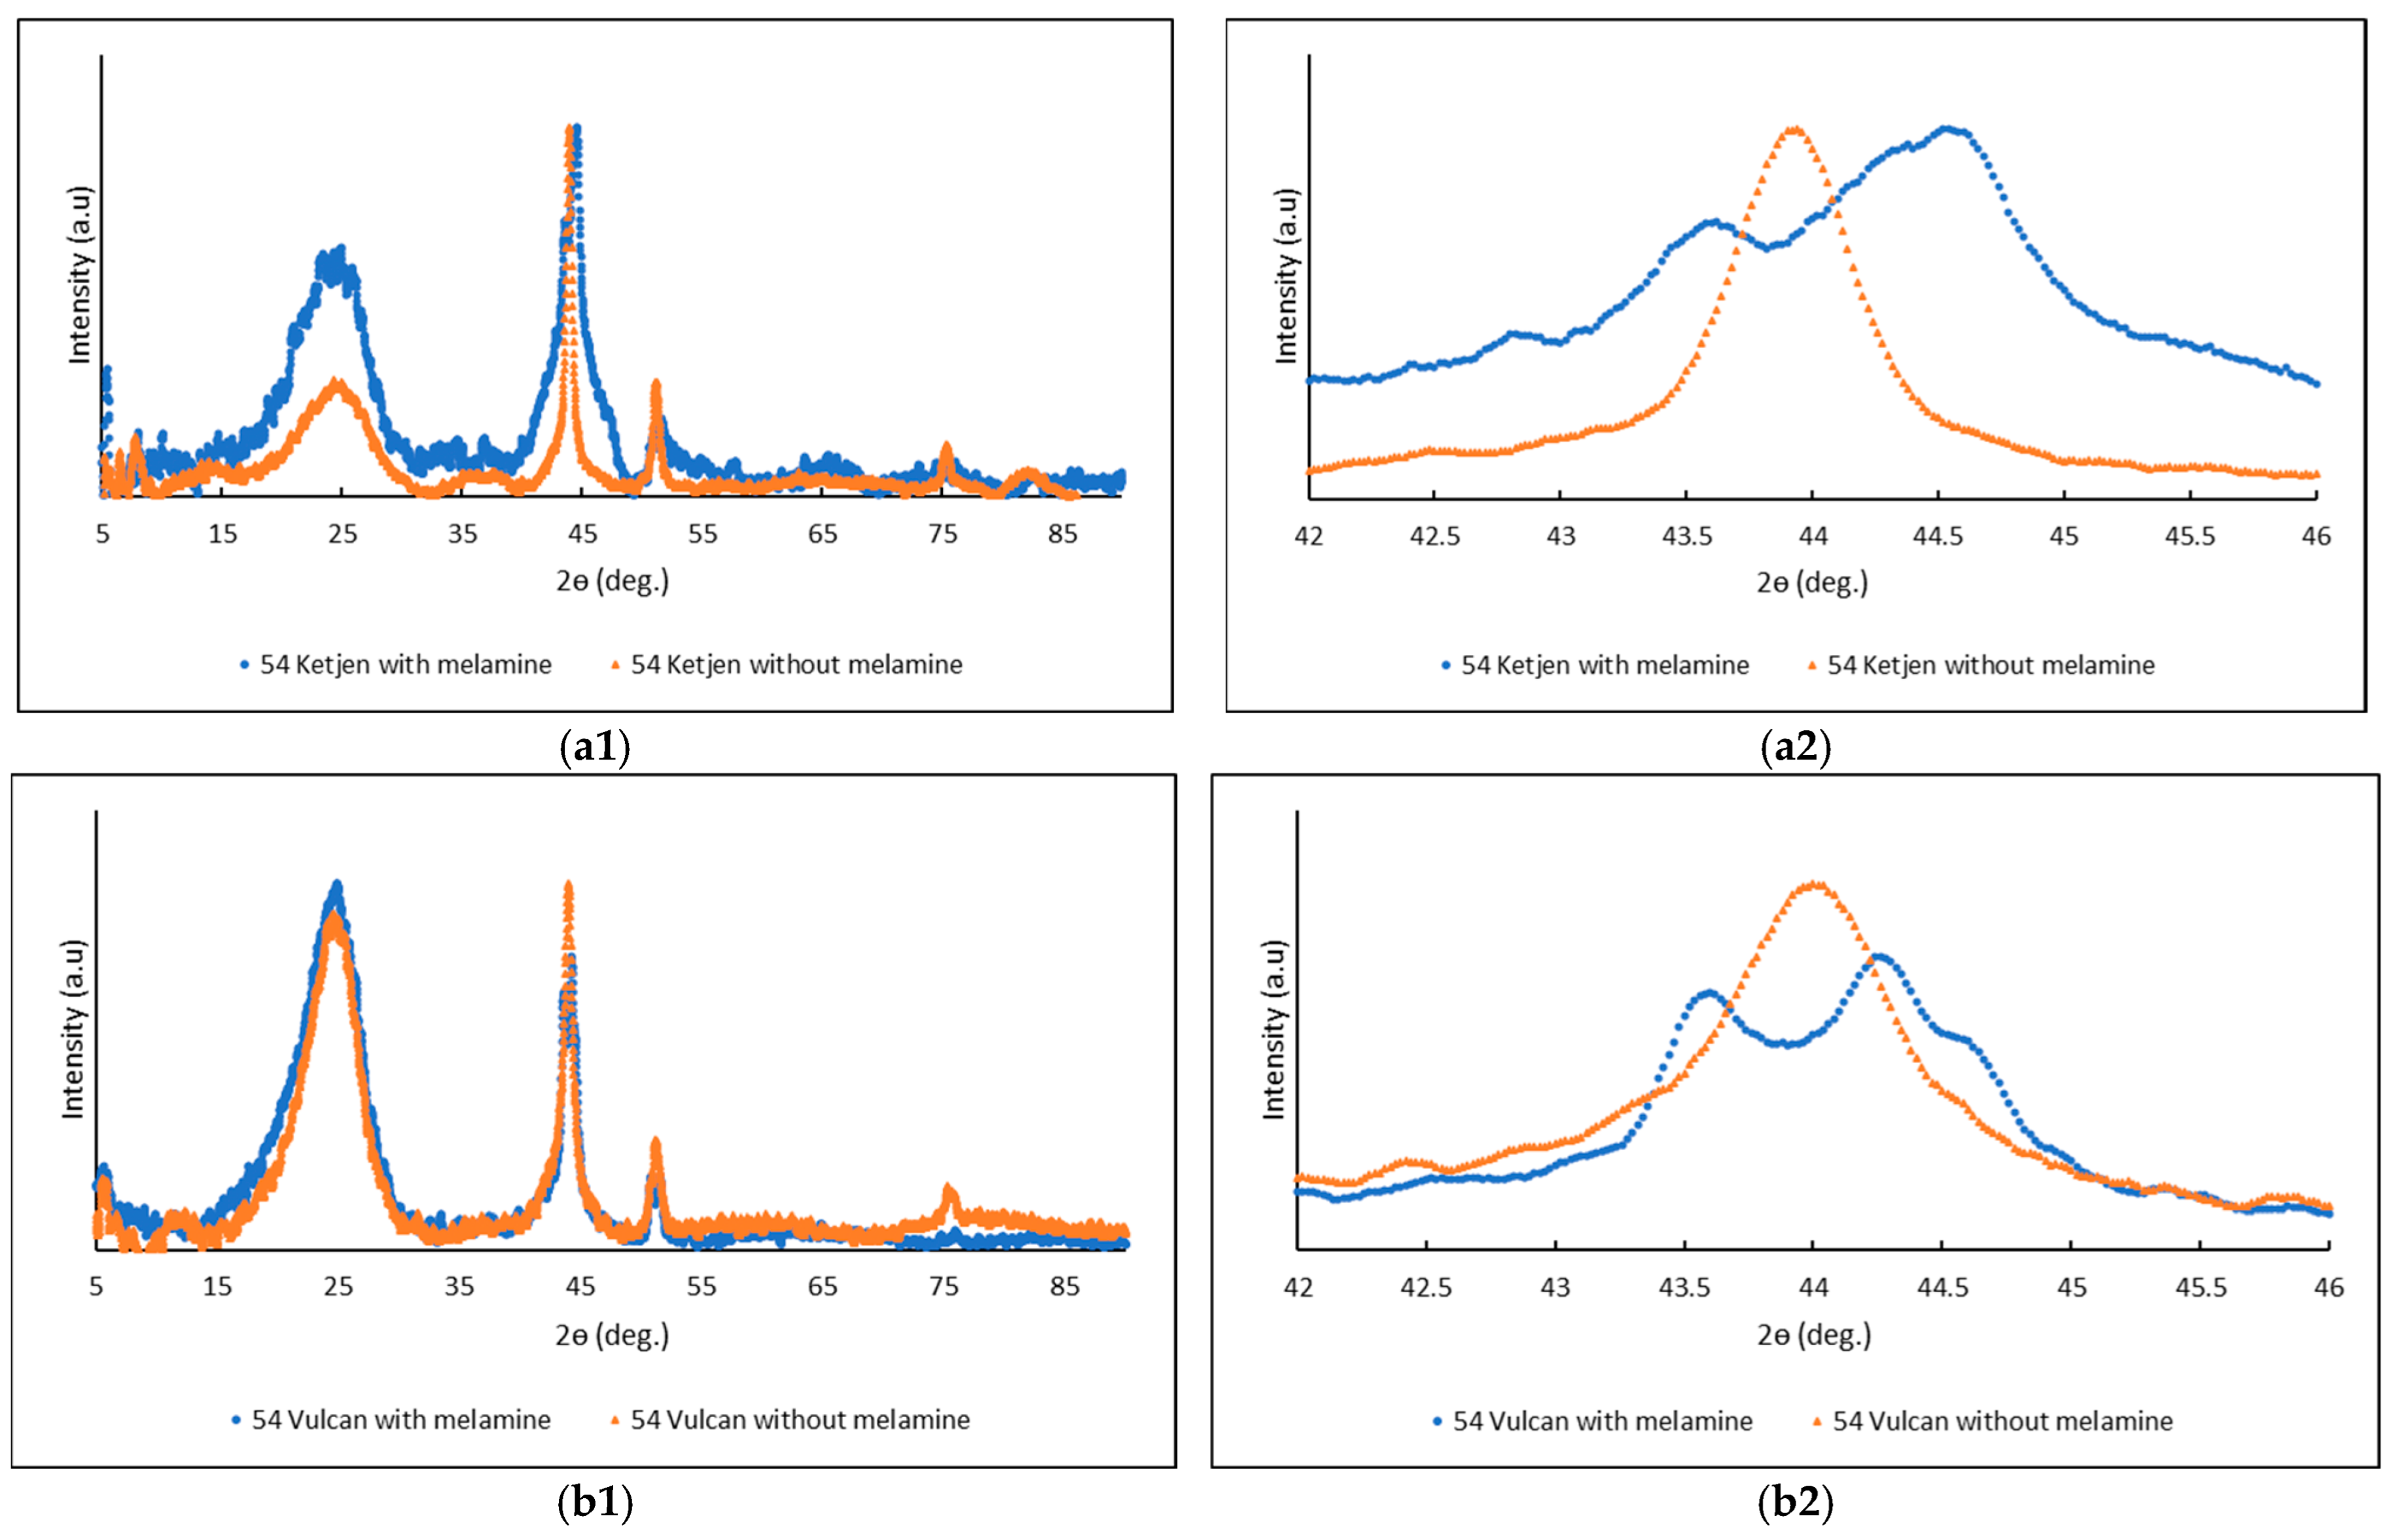
XRD analysis was performed to characterize the crystalline structure of the Fe-Ni–Co–carbon catalysts using Cu Kα radiation (λ = 1.5406 Å). The diffractograms reveal a complex multi-phase composition. Face-centered cubic (FCC) nickel is identified by its principal (111) reflection a ~44.5°, alongside secondary reflections for the (200) plane at ~51.8° and the (220) plane at ~76.4° [43]. Cobalt may crystallize in either FCC or hexagonal close-packed (HCP) structures; the FCC phase diffracts at ~44.2°, (overlapping with Ni), while the HCP phase presents distinct reflections for the (100) and (101) planes at approximately 41.7°and 47.5°, respectively, in addition to the (002) reflection at 44.5° [44]. Iron (BCC α-Fe), exhibits its main (110) reflection at ~44.7°, confirmed by higher-order reflections at ~65.0° (200) and 82.3° (211) [45]. Additionally, the presence of nickel stabilizes face-centered cubic γ-Fe (FCC) iron, which exhibits a (111) reflection at between 43.5° and 44.0°.
Consequently, the intense diffraction band observed near 44° results from the extensive convolution of FCC Ni, FCC/HCP Co, BCC Fe, and potentially FCC γ-Fe reflections. This severe overlap strongly suggests either the formation of a complex ternary alloy or the coexistence of multiple metallic domains.
Regarding the carbon support, a dominant graphitic (002) reflection appears at ~26.5°. In N-doped samples, nitrogen incorporation disrupts long-range order, generating a broad turbostratic halo between 20° and 30° [45]. Crucially, this confirms that N-doping occurs via matrix integration rather than forming isolated phases, causing only peak broadening or shifting instead of distinct nitrogen reflections [46].
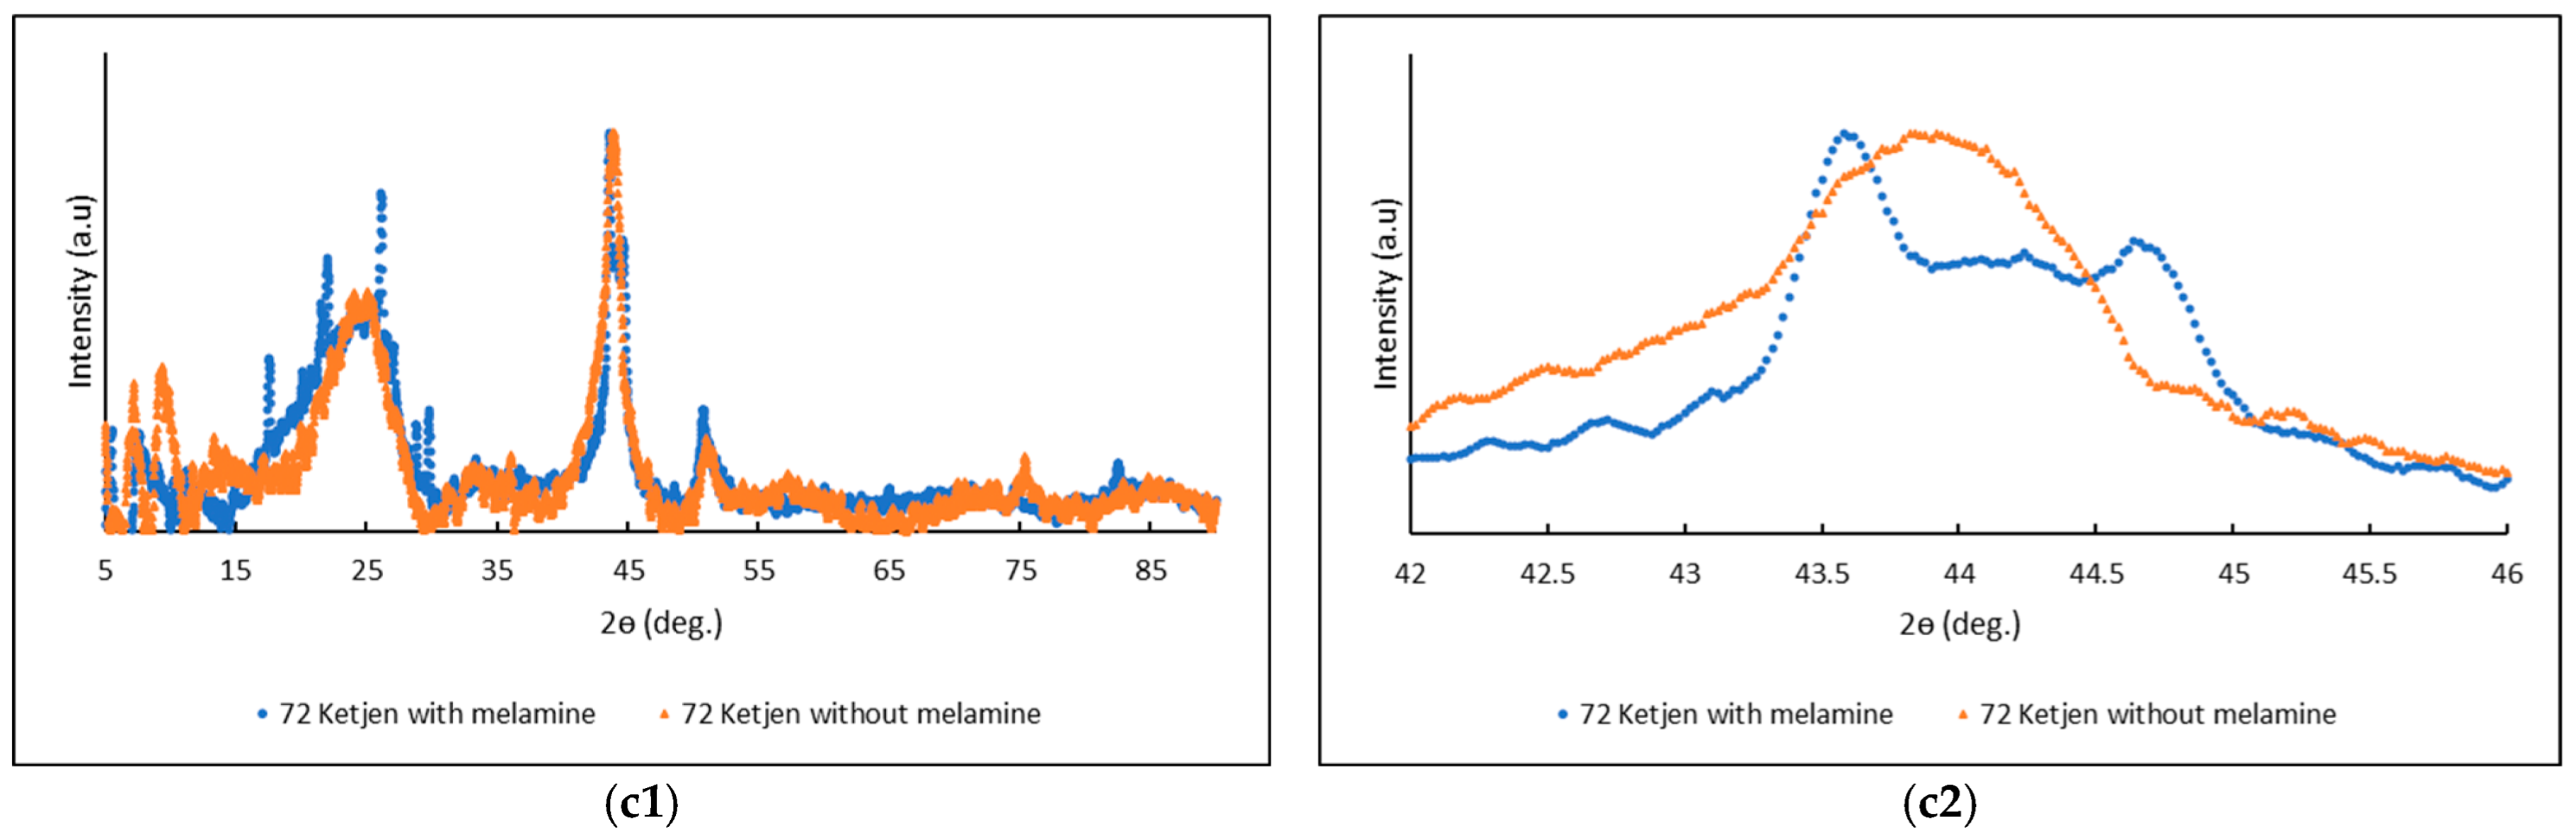
Figure 11 shows the complete diffractogram (5° to 90°) for the three pairs of catalysts, as well as an insight into the range between 42° and 46°.
Graphitic crystals (at ca. 26.2°, ICDD 00-058-1638) were observed in all samples. However, the XRD patterns of the samples synthesized with and without melamine exhibit clear differences in the metallic region ~44°. The catalyst prepared without melamine shows a sharper and more intense peak, suggesting larger crystallites and a higher degree of structural ordering. Conversely, the N-doped catalyst exhibits a broader, more asymmetric peak. This pattern indicates that melamine decomposition supplies nitrogen and modifies the local chemical environment, inhibiting crystallite growth and promoting lattice strain. The peak asymmetry and inability to match a single JCPDS reference confirm the coexistence of multiple phases–likely ternary alloy domains alongside segregated metallic or oxide regions—contributing to the material’s overall heterogeneity.
The catalyst prepared without melamine shows a sharper and more intense peak near ~44°, suggesting larger crystallites and/or a higher degree of structural ordering. Conversely, the N-doped catalyst displays a broader and more asymmetric peak, which can be attributed to reduced crystallite size, increased lattice strain, and the formation of additional nanostructured phases promoted by nitrogen incorporation during melamine decomposition. As melamine decomposes, it supplies nitrogen and modifies the local chemical environment, promoting the formation of nitrogen-doped carbon and influencing the dispersion of Ni, Fe, and Co. This favors the stabilization of smaller alloyed domains and inhibits the growth of larger crystallites, in agreement with the observed peak broadening.
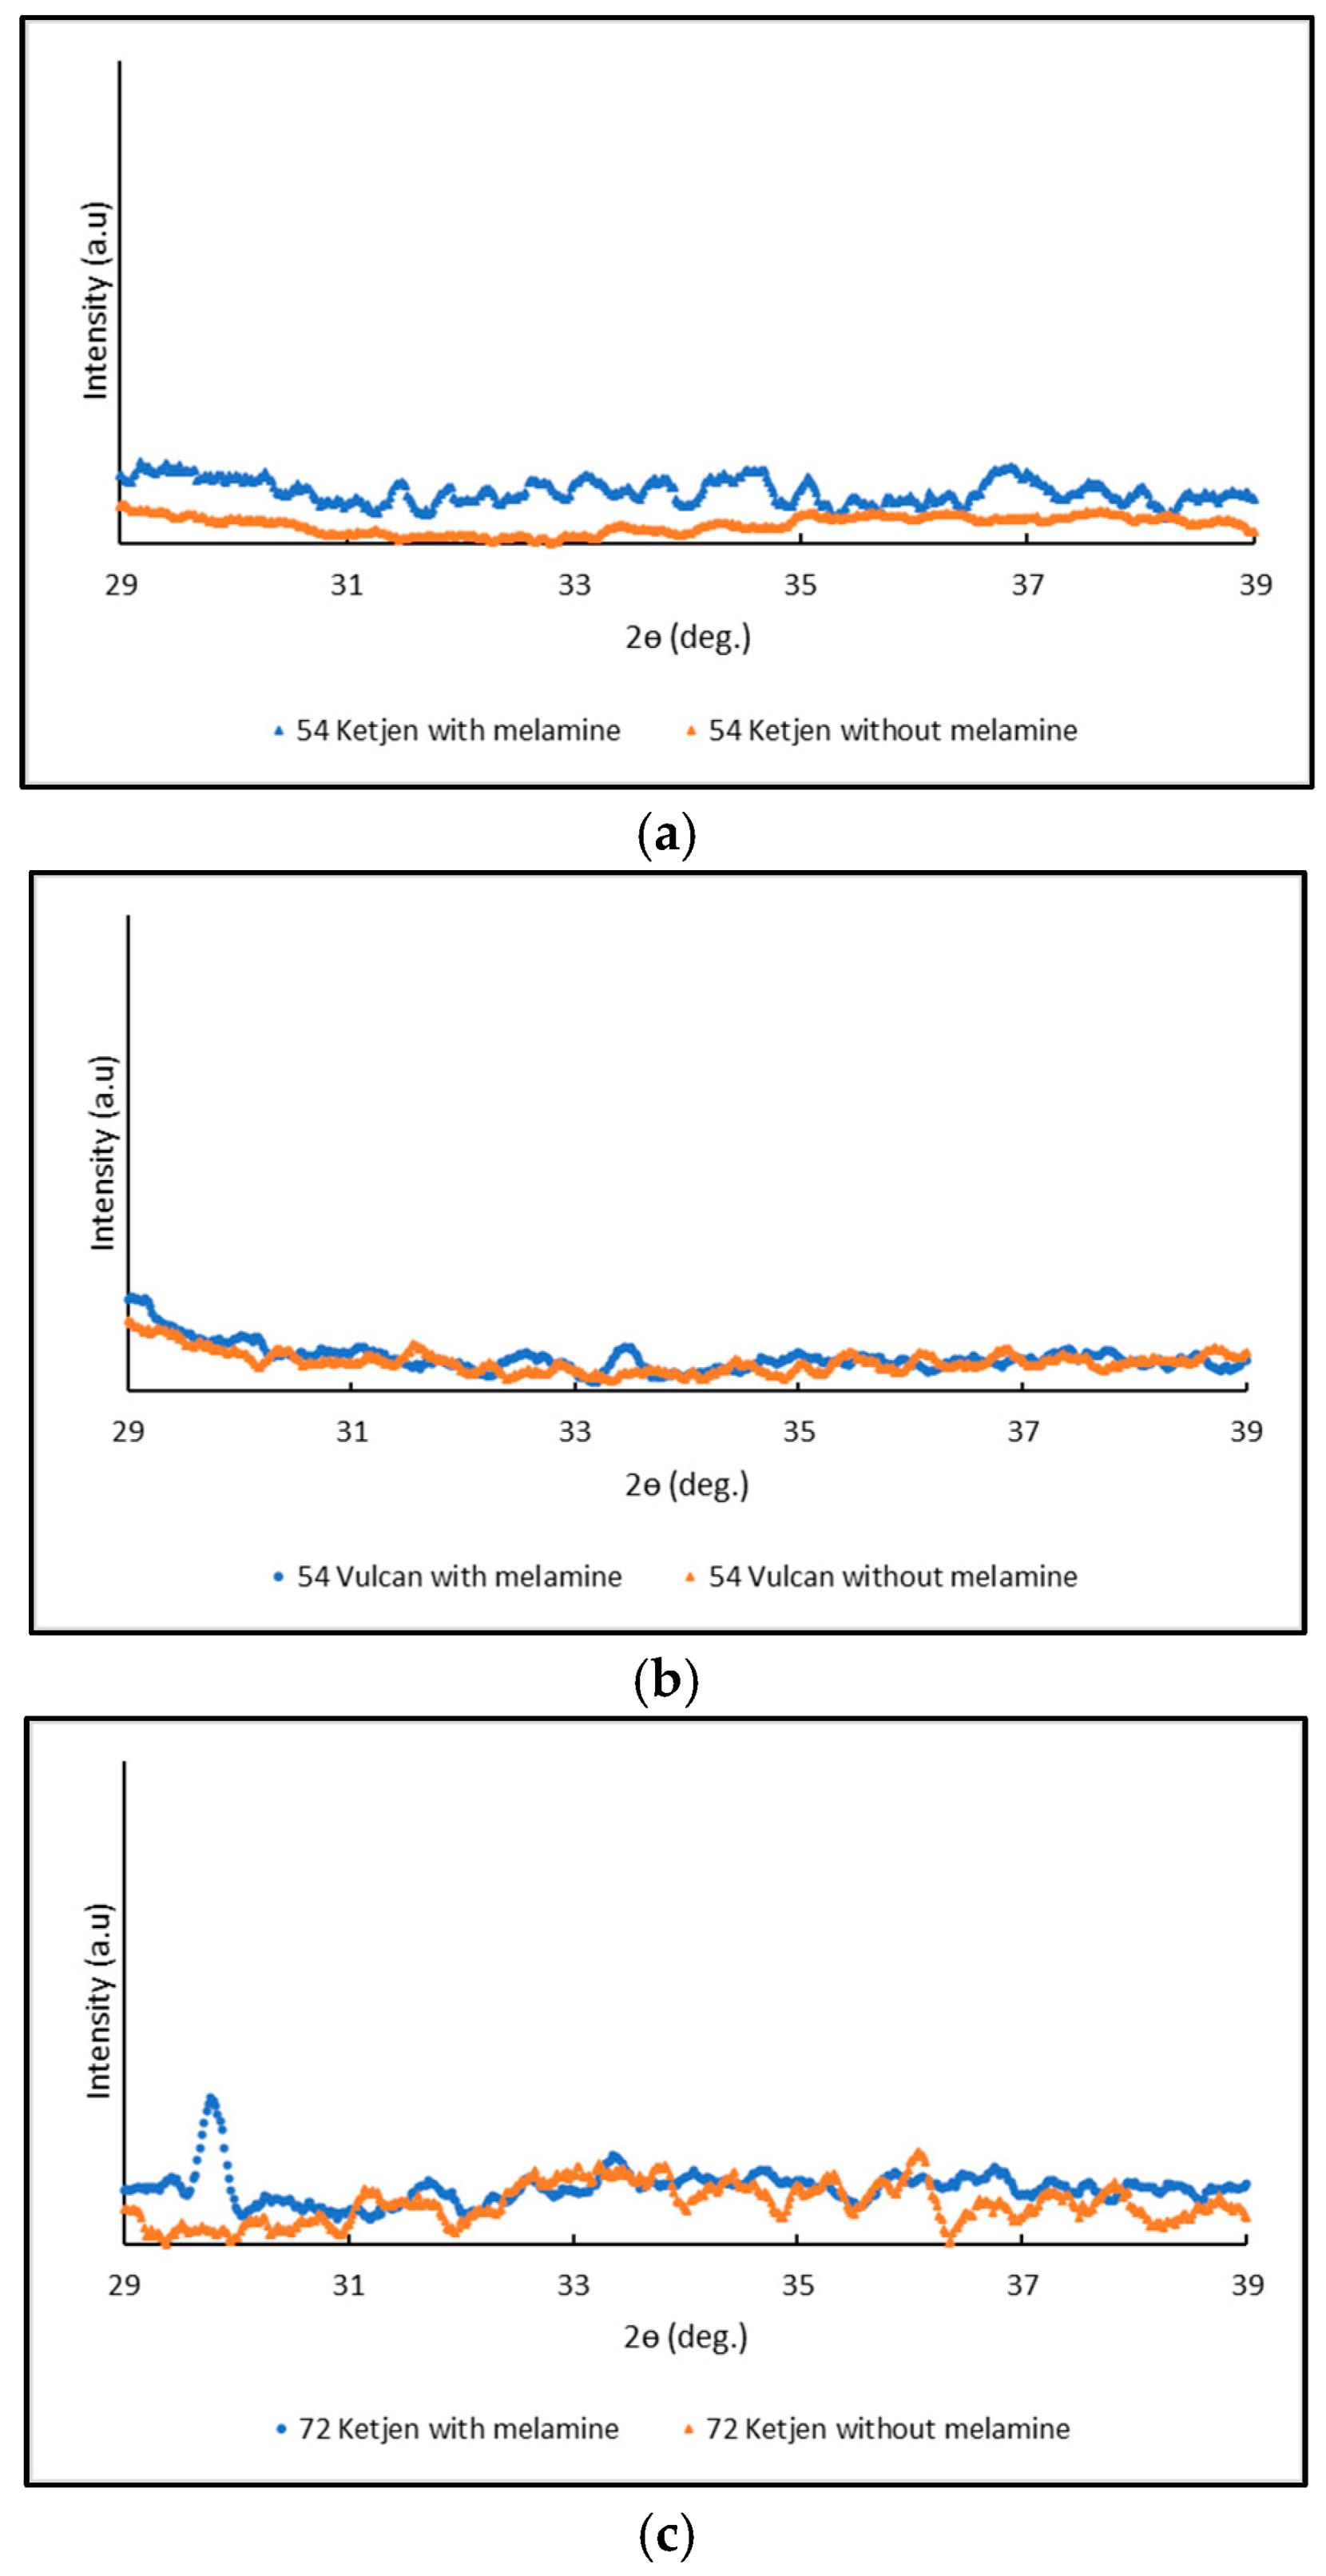
The potential formation of a magnetite (Fe3O4) phase was specifically investigated by examining the diffraction patterns at 35.4° (Figure 12).
This assessment was motivated by reports stating that nitrogen precursors can modulate local charge density and influence the speciation of iron oxides [47]. However, in this study, no characteristic magnetite peaks were detected, nor were there significant spectral differences in this region between the catalysts synthesized with and without melamine.
In summary, the XRD analysis confirms that melamine significantly alters crystallinity and phase distribution within the Ni–Fe–Co–carbon system, producing a more dispersed but structurally more complex catalyst. However, this increased structural refinement does not enhance performance, highlighting that nitrogen doping is not universally beneficial and that its effect strongly depends on the coordination chemistry and phase behavior of the specific metallic system.

4. Conclusions

The Fe-Ni-Co carbon-supported catalysts synthesized in this work rank among the best performing PGM-free materials reported in the literature for OER in alkaline media, achieving overpotentials as low as 300 mV for 10 mA cm−2, obtained using a RTE.
Regarding the tested carbon black supports—Vulcan Black XC72R GP-3909 and Ketjenblack EC-600JD—Vulcan outperformed Ketjenblack in terms of OER activity and stability. This superior performance was assigned to Vulcan’s higher resistance to electrochemical oxidation and its ability to foster more stable interactions with the Fe, Ni, and Co active species during operation.
Increasing the metal loading was detrimental to OER activity, as evidenced by the performance decline observed between the FeNiCo 54 Ketjen and FeNiCo 72 Ketjen catalysts. This trend appears to correlate with the structural differences observed in the XRD patterns. Specifically, in the FeNiCo 54, which exhibits a sharp (in the 42° to 46° range), singular reflection characteristic of a homogenous alloy, the FeNiCo 72 counterpart displays a broadened and split peak profile. These features suggest that excessive precursor loading likely induced phase segregation rather than increasing the density of accessible active sites, underscoring the importance of optimizing the metal-to-support ratio.
In contrast to the typically reported performance enhancement of nitrogen-doped carbon materials, under the synthesis conditions used in this study, the introduction of melamine led to a decline in all electrochemical parameters. These results suggest that this decline is linked to the reduced surface area and pore volume in the melamine-modified samples. Furthermore, melamine promoted the formation of carbon nanotubes via a tip-growth mechanism, which appears to have physically displaced or isolated active metal fragments, thereby reducing catalytic efficiency. To mitigate this, future synthesis strategies could decouple the process by N-doping the carbon support before adding metal precursors and seeking an optimization of melamine addition.

Supplementary Materials

The following supporting information can be downloaded at: https://www.mdpi.com/article/10.3390/app16073310/s1, Figure S1: On the left side, the working electrode has a gold tip without a catalyst. On the right, the deposition of 10 µL of the ink on the working electrode. Figure S2: The accelerated stress test scheme used had a duration of approximately 19 h and 27 min. Figure S3: White powder at the end of the calcination process. Figure S4: TGA compares the melamine used in the catalyst synthesis and the powder collected in the furnace, using oxygen as a drag gas. Figure S5: TGA of melamine uses nitrogen as a drag gas. Figure S6. Infrared Spectrum obtained by two different catalysts, one that had melamine in the synthesis formulation (orange line) and the other that did not have melamine in the synthesis formulation (Blue line). ss—Very strong; s—Strong; m—Moderate. Figure S7. Raman fit for FeNiCo 54 Ketjen without Melamine. Figure S8. Raman fit for FeNiCo 54 Ketjen with Melamine. Figure S9. Raman fit for FeNiCo 54 Vulcan without Melamine. Figure S10. Raman fit for FeNiCo 54 Vulcan with Melamine. Figure S11. Raman fit for FeNiCo 72 Ketjen without Melamine. Figure S12. Raman fit for FeNiCo 72 Ketjen with Melamine. Table S1. Results of ICP for FeNiCo 54 Ketjen without melamine (measurements were performed in triplicate). Table S2. Results of ICP for FeNiCo 54 Ketjen with melamine (measurements were performed in quadruplicate). Table S3. Results of ICP for FeNiCo 54 Vulcan without melamine (measurements were performed in quadruplicate). Table S4. Results of ICP for FeNiCo 54 Vulcan with melamine (measurements were performed in quadruplicate). Table S5. Results of ICP for FeNiCo 72 Ketjen without melamine (measurements were performed in quadruplicate). Table S6. Results of ICP for FeNiCo 72 Ketjen with melamine (measurements were performed in quadruplicate). Table S7: Overpotential at 10 mA cm−2 of the catalyst, considering the thermoneutral voltage of 1.48 V, and the onset potential for the catalysts FeNiCo 54 ketjen. Table S8: Overpotential at 10 mA cm−2 of the catalyst, considering the thermoneutral voltage of 1.48 V, and the onset potential for the catalysts FeNiCo 72 ketjen. Table S9: Overpotential at 10 mA cm−2 of the catalyst, considering the thermoneutral voltage of 1.48 V, and the onset potential for the catalysts FeNiCo 54 Vulcan.

Author Contributions

Conceptualization, A.M., S.V. and J.T.; methodology, J.T., S.V. and A.M.; software, J.T.; visualization, J.T.; formal analysis, J.T.,A.M. and S.V.; investigation, J.T.; resources, A.M., S.V. and F.F.; data curation, J.T.; writing—original draft preparation, J.T.; writing—review and editing, S.V., J.T., A.M. and F.F.; supervision, S.V. and A.M.; project administration, J.T.; funding acquisition, J.T., F.F. and A.M. All authors have read and agreed to the published version of the manuscript.

Funding

This work was financially supported by FCT- Fundação para a Ciência e Tecnologia under the program Doctoral Program in Refining, Petrochemical and Chemical Engineering (SFRH/BD/151392/2021) with DOI identifier 10.54499/SFRH/BD/151392/2021 attributed to Jorge Teixeira. National funds also supported this work through FCT/MECI: LEPABE, UID/00511/2025 (https://doi.org/10.54499/UID/00511/2025) and UID/PRR/00511/2025 (https://doi.org/10.54499/UID/PRR/00511/2025), ALiCE, LA/P/0045/2020 (https://doi.org/10.54499/LA/P/0045/2020) and UID/50006/2023 of the Associate Laboratory for Green Chemistry—LAQV REQUIMTE.

Institutional Review Board Statement

Not applicable.

Informed Consent Statement

Not applicable.

Data Availability Statement

The data presented in this study are available upon reasonable request, as they are part of ongoing research.

Acknowledgments

Sofia Teixeira de Sousa Delgado and Eva Filipa Ferreira de Sousa are acknowledged for their assistance with experimental procedures.

Conflicts of Interest

Filipa Franco was employed by company Bondalti Chemicals, The authors declare no conflicts of interest.

Abbreviations

The following abbreviations are used in this manuscript:
AEMWEAnion Exchange Membrane Water Electrolysis
ASTAccelerated Stress Test
ATRAttenuated Total Reflectance
BCCBody Centered Cubic
BET Brunauer-Emmett-Teller
BJHBarrett Joyner Halenda
BoLBeginning of life
BSEBack-scattered Electron Detector
BWFBreit Wigner Fano
CPEConstant Phase Element
CVCyclic Voltammetry
ECSAElectrochemical surface area
EDS Energy Dispersive spectroscopy
EIS Electrochemical Impedance Spectroscopy
EoL End of life
FCCFace Centred Cubic
FTIRFourier Transform Infrared
HCPHexagonal Closed Packed
HER Hydrogen Evolution Reaction
ICP Inductively Coupled Plasma
IEC Ion Exchange Capacity
LSVLinear Sweep Voltammetry
MEAMembrane Electrode Assembly
OEROxygen Evolution Reaction
ORROxygen Reduction Reaction
PEMProton Exchange Membrane
PGMPlatinum Group Metals
RDERotating Disk Electrode
RHERHE–Reversible Hydrogen Electrode
SCESaturated Calomel Electrode
SEDSecondary Electron Detector
SEMScanning Electron Microscopy
STPStandard Temperature and Pressure
TEMTransmission electron microscopy
TOFTurnover frequency
UORUrea Oxidation Reactions
WEWorking Electrode

Appendix A. Characterization Methods

Appendix A.1. Automated Physisorption Flow Analyzer
For the gas adsorption calculation was chosen the BET calculation model for surface area determination, by following Equation (A1) [23].
p p 0 n ( 1 p p 0 ) = 1 n m C + C 1 n m C ( p p 0 )
where n is the specific amount adsorbed at the relative pressure p p 0 and n m is the specific monolayer capacity, and C is exponentially related to the energy of monolayer adsorption.
The BET equation strictly describes a linear plot of 1/[(n p p 0 ) − 1] vs. p p 0 , which for most solids, using nitrogen as the adsorbate, is restricted to a limited region of the adsorption isotherm, usually in the p p 0 range of 0.05 to 0.35 [48]. The quantity of C should be positive; a negative interception on the ordinate of the BET plot is the first indication that one is outside the appropriate range. C can be determined by the following Equations: (A2), (A3) and (A4).
s l o p e = C 1 W m C
i n t e r c e p t i o n = C 1 W m C
W m = 1 s l o p e + i n t e r c e p t i o n
The second stage in applying the BET method is calculating the BET area from the monolayer capacity. This requires a knowledge of the average area, σ m (molecular cross-sectional area), occupied by the adsorbate molecule in the complete monolayer. The Equation (A5) comes:
a s   B E T =   n m · L · σ m m
where a s   (BET) is the BET specific area of the adsorbent (of mass m), L is the Avogadro constant σ m is the molecular cross-sectional area (assumed to be 0.162 nm2 para N2) [49].
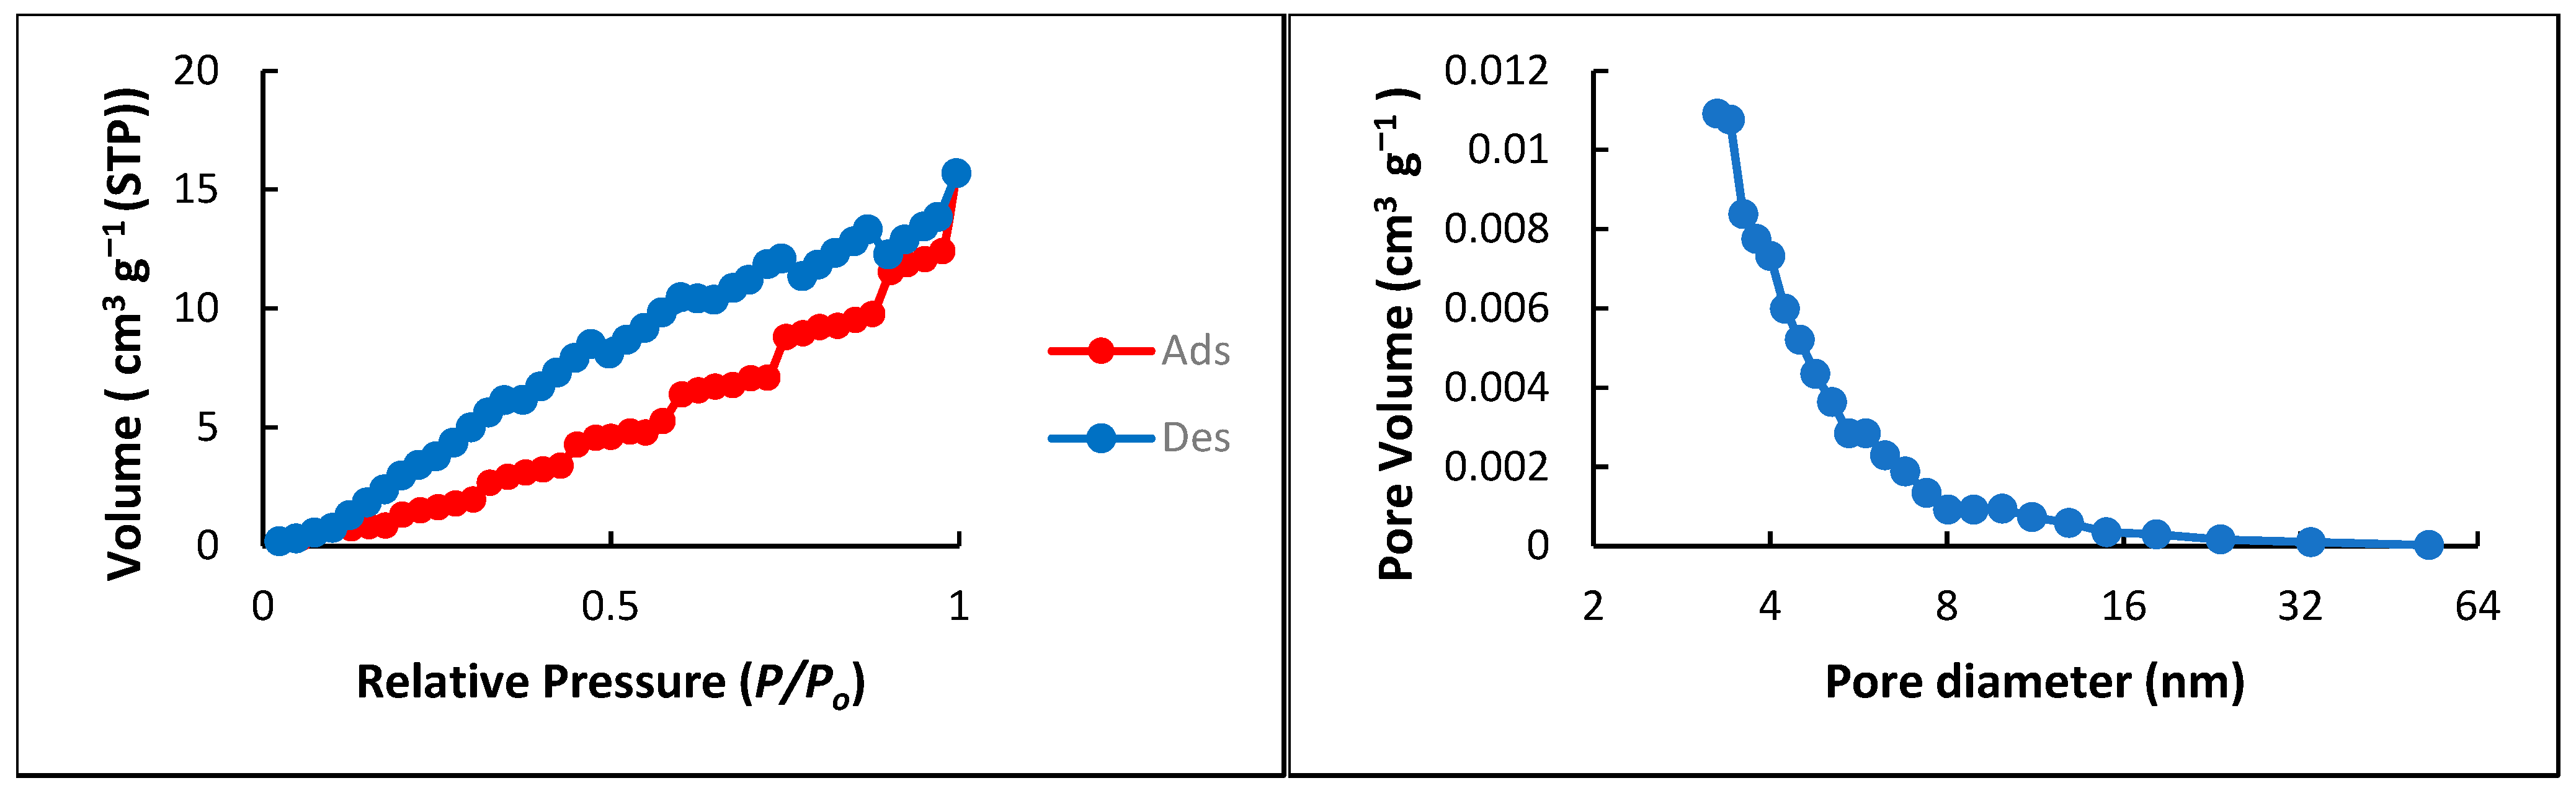
In Figure A1, Figure A2 and Figure A3, it is possible to observe the isothermal curves obtained for melamine and the different pairs of catalysts.
Figure A1. Nitrogen adsorption/desorption isotherms and pore size distribution of melamine. STP = Standard Temperature and Pressure.
Applsci 16 03310 g0a1
The nitrogen adsorption–desorption isotherm Figure A1 exhibits the characteristic shape of a Type III isotherm according to the IUPAC classification. The adsorption branch shows a continuous concave increase with relative pressure (P/P0), without the appearance of a distinct plateau, indicating the absence of a well-defined monolayer formation. This behavior suggests weak interactions between the adsorbate (N2) molecules and the surface, while adsorbate–adsorbate interactions predominate at higher relative pressures.
The calculated BET surface area should be interpreted with caution, as the BET model is not ideally applicable to Type III isotherms. Overall, this isotherm type is typically associated with nonporous or macroporous materials with low surface energy or hydrophobic character, in which multilayer adsorption occurs mainly through adsorbate–adsorbate interactions rather than strong surface binding.
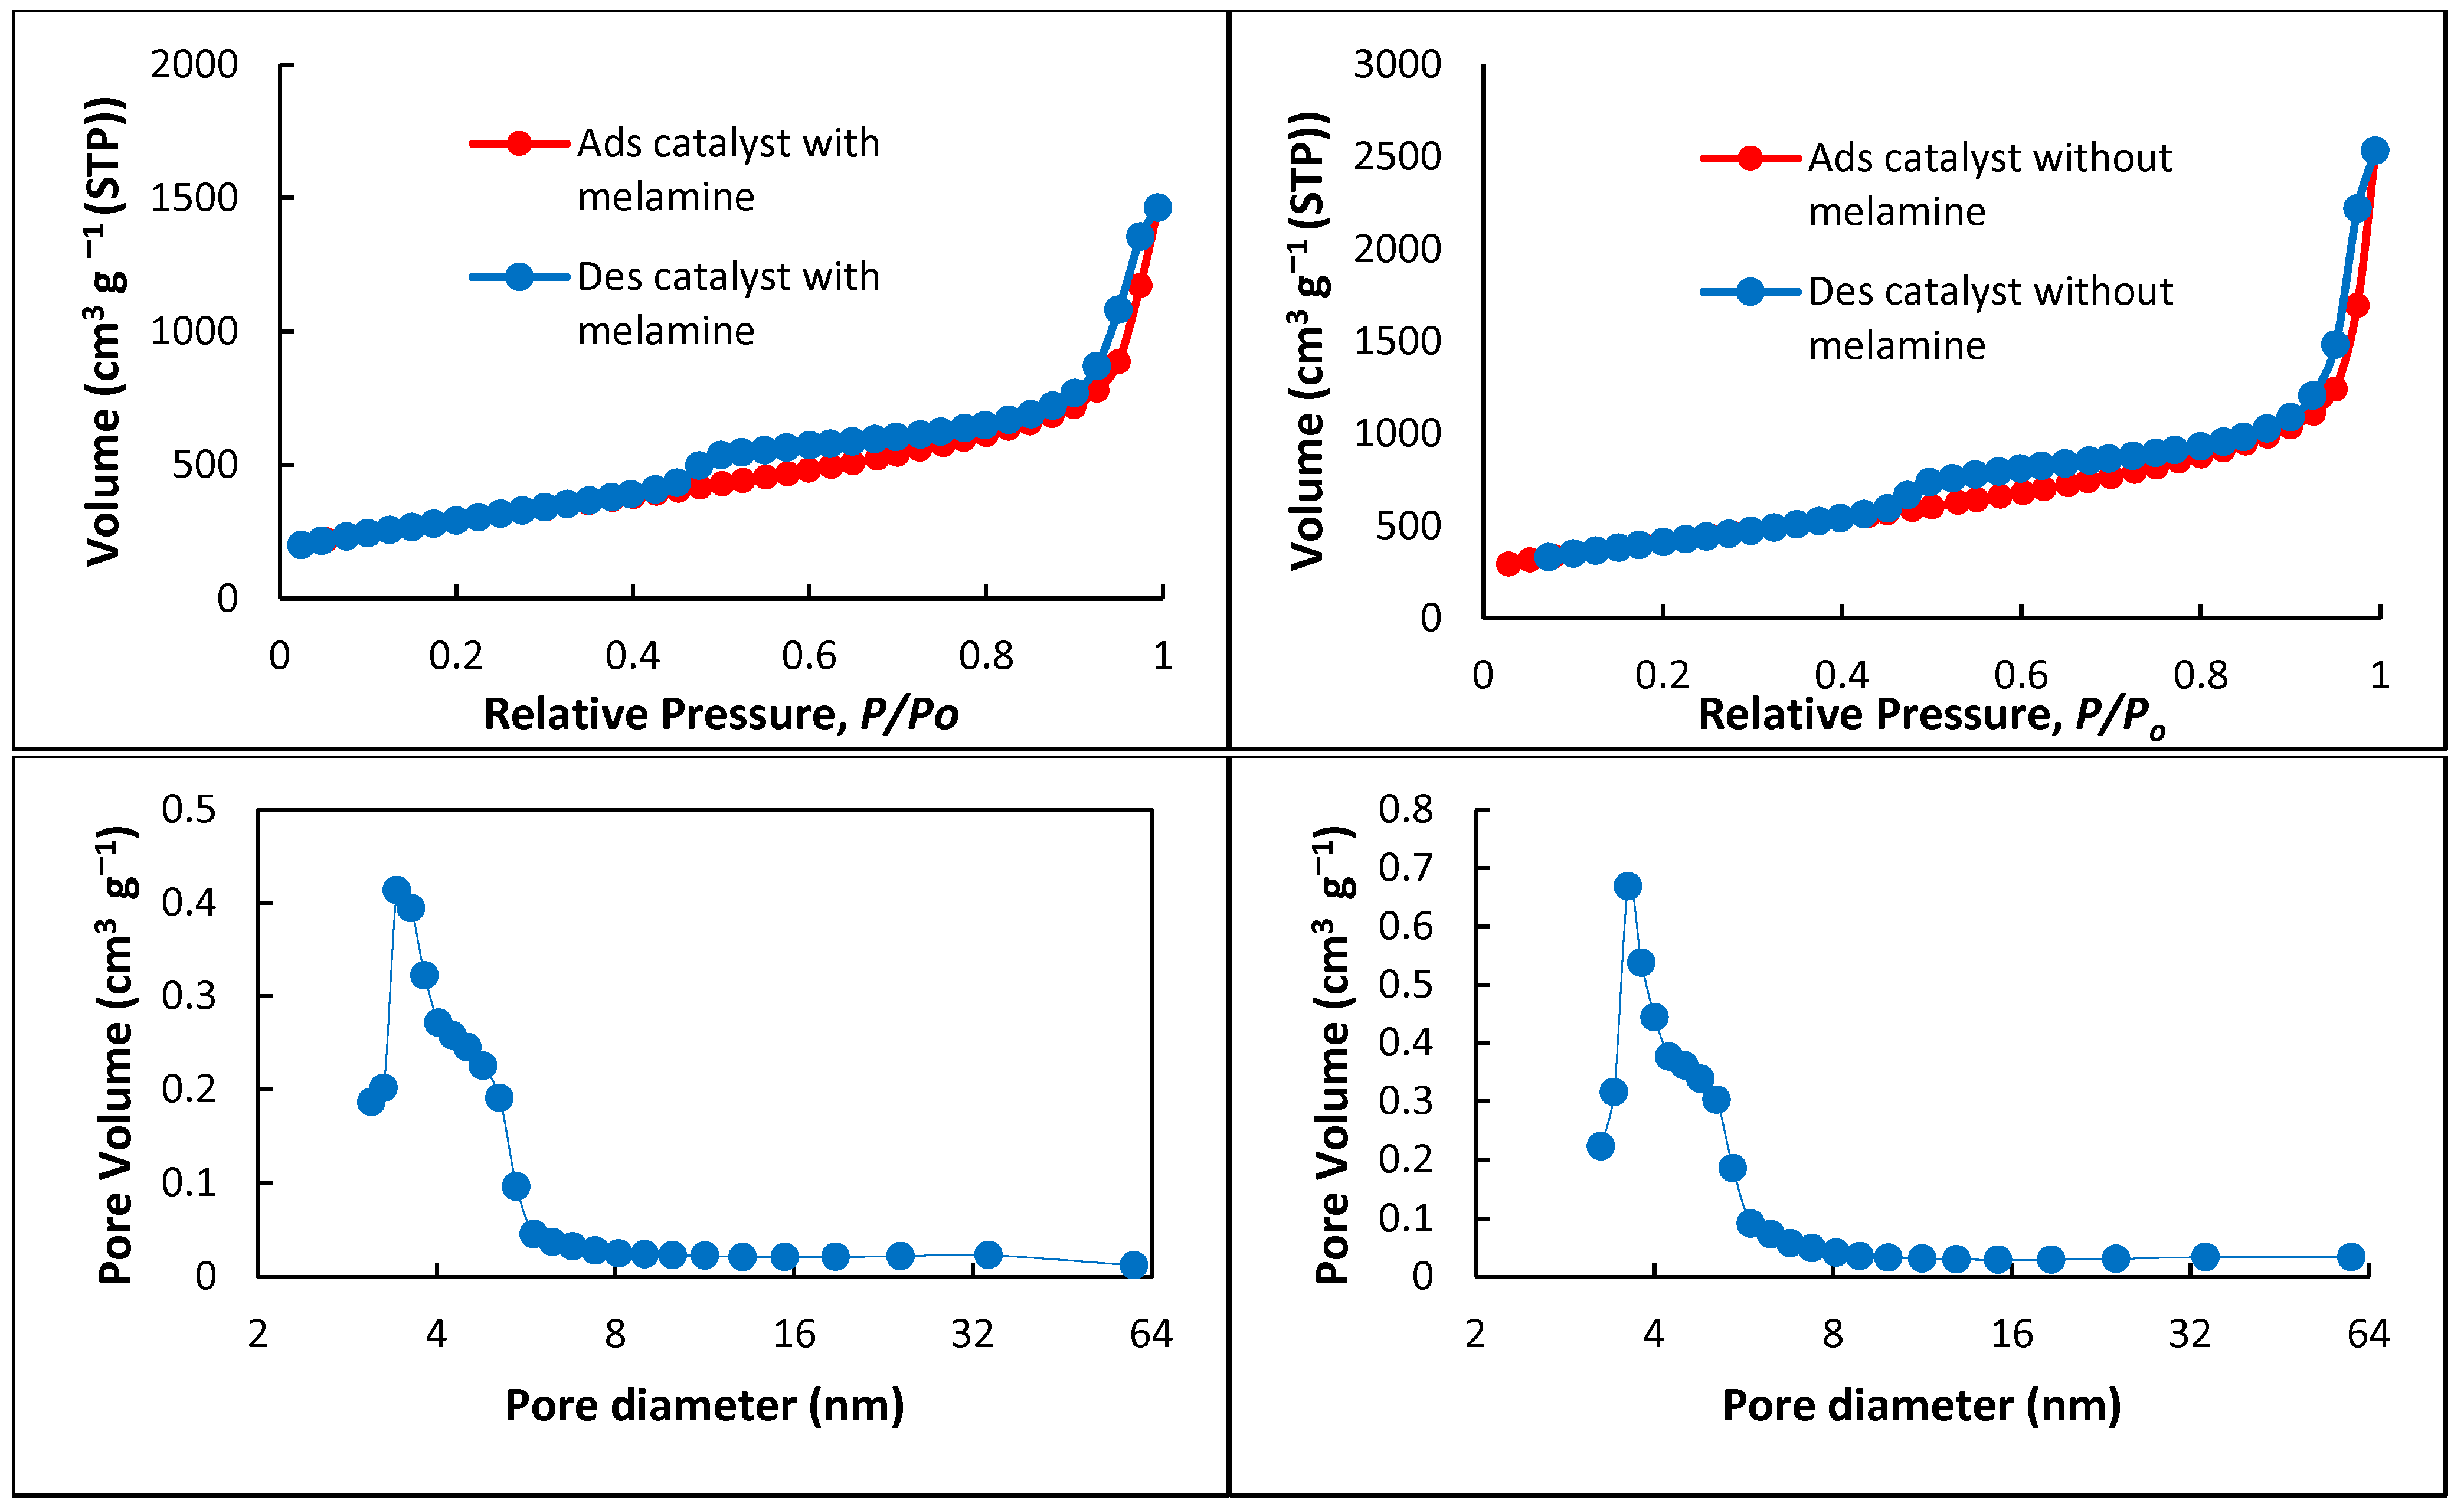
Figure A2 shows the results of the catalyst with Vulcan as support, with and without melamine.
Figure A2. Nitrogen adsorption/desorption isotherms and pore size distribution comparison of catalyst FeNiCo 54 with Vulcan. Ads–Adsorption; Des-Desorption.
Applsci 16 03310 g0a2
Regarding the observed pattern, both graphs exhibit similar behavior, resembling a typical type III isotherm. In this type of isothermal process, adsorbate-adsorbate interactions dominate, enabling multilayer adsorption. This behavior often indicates the use of non-porous or macroporous materials with hydrophobic or inert surfaces.
Figure A3 shows the results of the catalyst with Ketjen as support, with and without melamine.
Figure A3. Nitrogen adsorption/desorption isotherms and pore size distribution comparison of catalyst FeNiCo 72 with Ketjen.
Applsci 16 03310 g0a3
The graphs presented in Figure A3 both show a hysteresis loop type H4. The H4 loop is somewhat similar across the catalysts; however, the adsorption branch is now a composite of Types I and II, with the more pronounced uptake at low P/P0 associated with micropore filling. H4 loops are often found with aggregated crystals of zeolites, some mesoporous zeolites, and micro-mesoporous carbons. As already indicated, the common feature of H3, H4, and H5 loops is the sharp step-down of the desorption branch. Generally, this is within a narrow range of P/P0 for the particular adsorbate and temperature (e.g., at P/P0 ~ 0.4–0.5 for nitrogen at 77 K).
In both catalyst samples, the volume adsorbed is consistently higher in the samples without melamine.

Appendix A.2. Scanning Electron Microscope
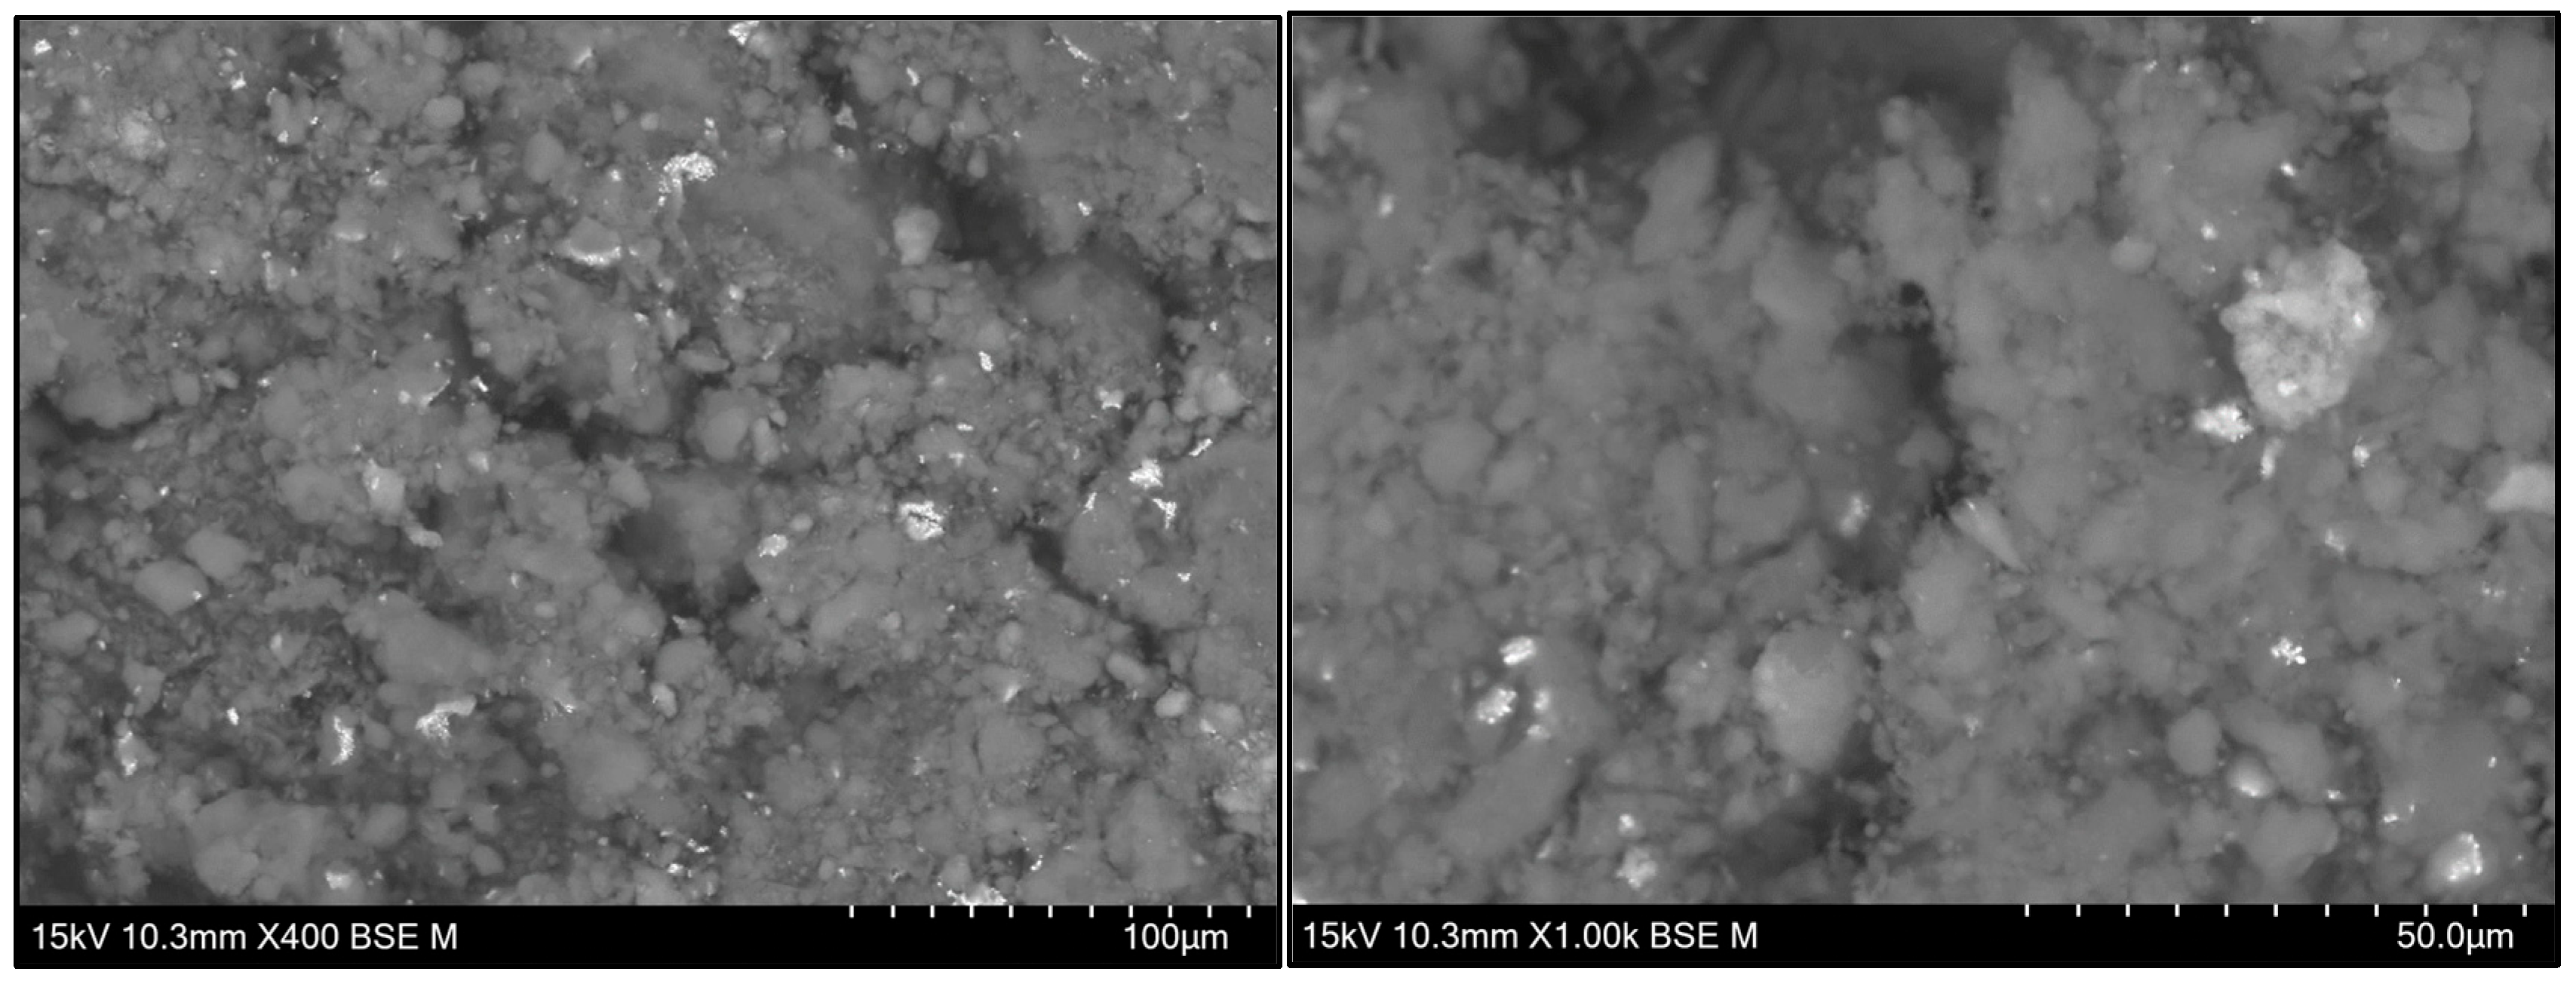
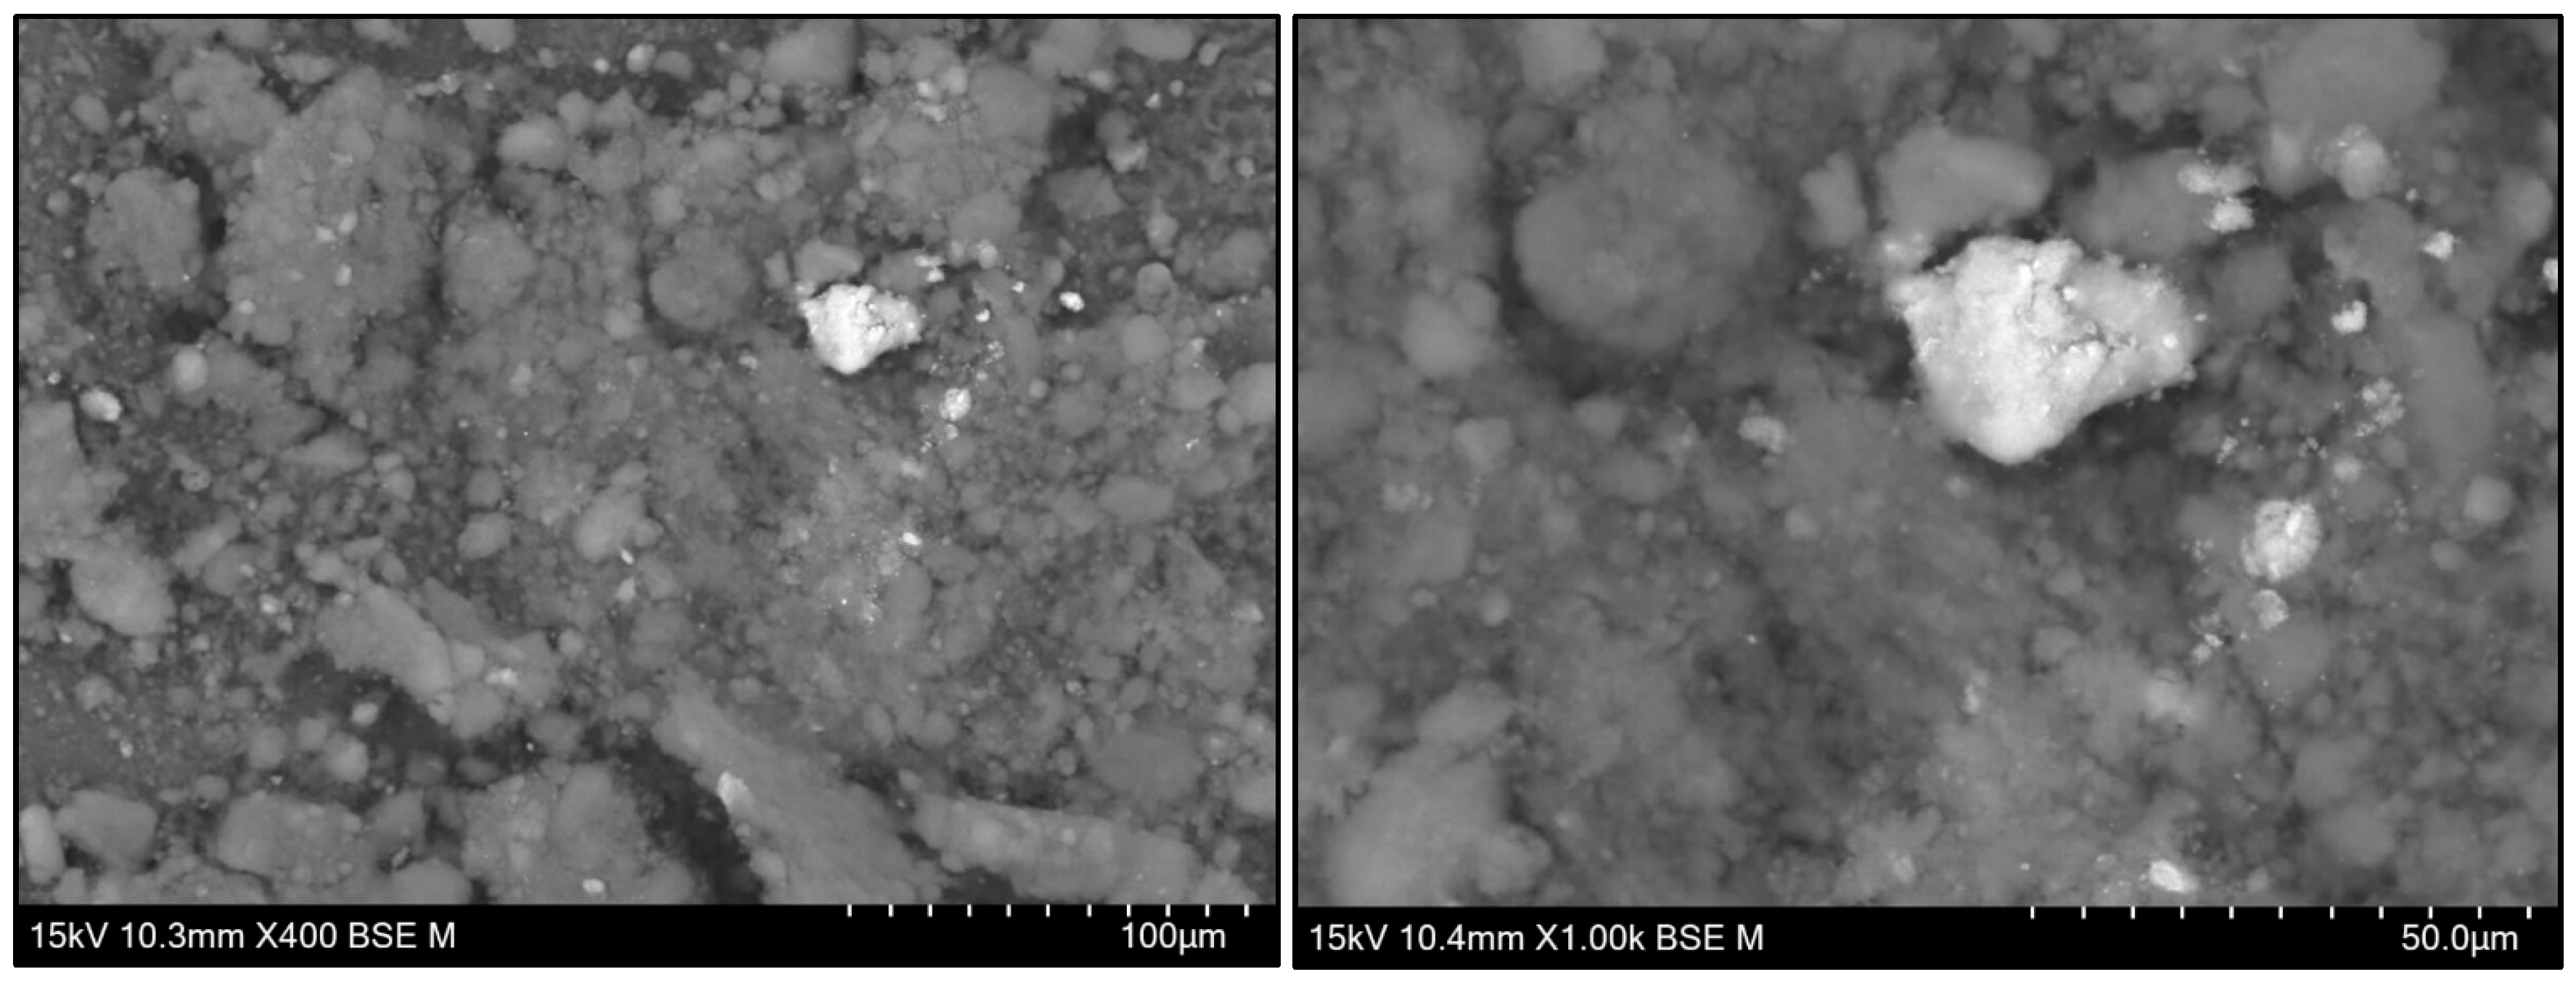
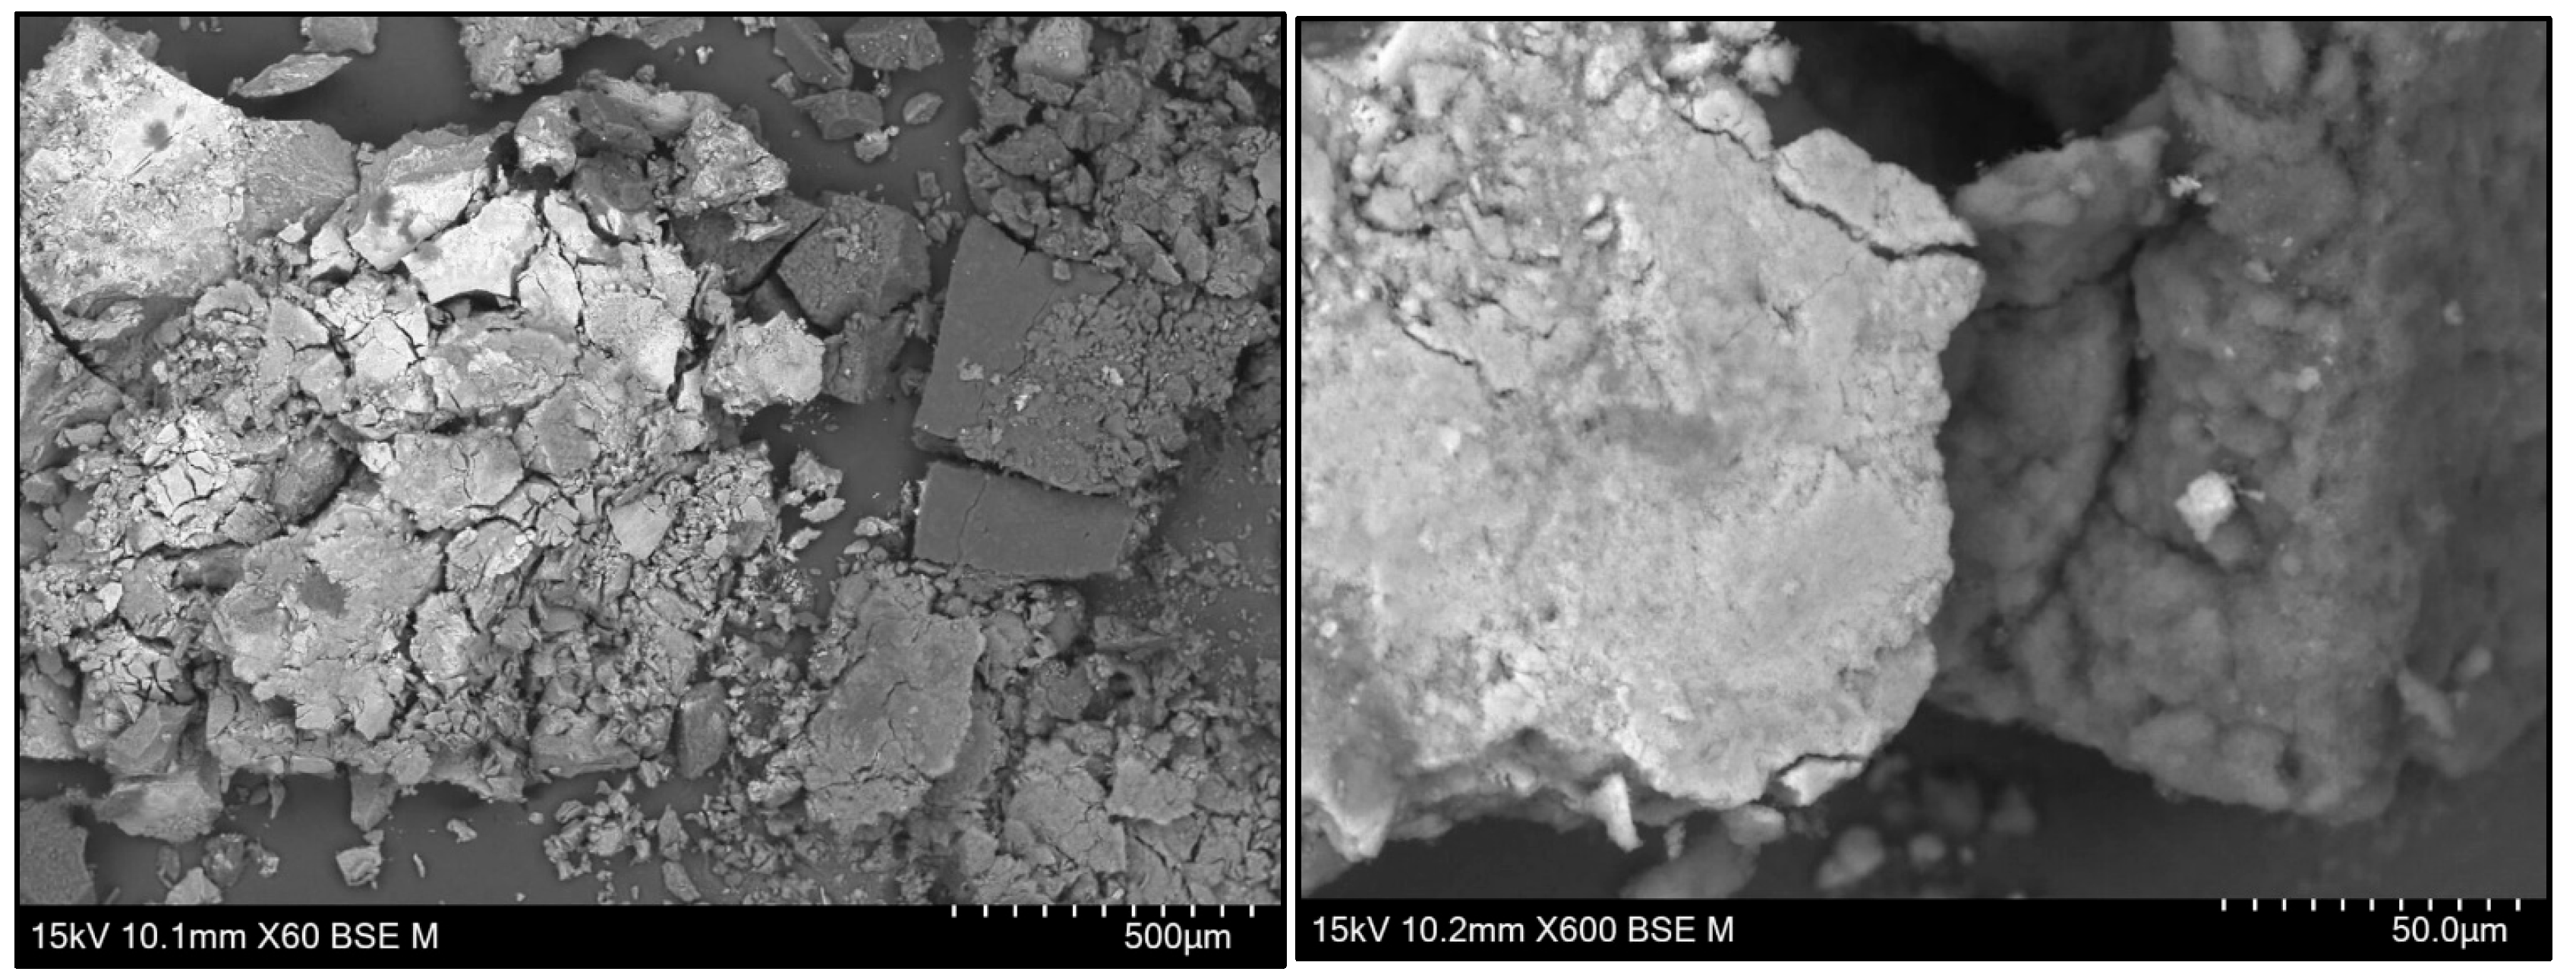
To assess the influence of metal loading, SEM analyses were performed to determine whether there were visible and homogeneous differences in the sample.
Figure A4. SEM micrographs of the FeNiCo 54 Ketjen melamine catalyst: (left) 400× magnification and (right) 1000× magnification.
Applsci 16 03310 g0a4
Figure A5. SEM micrographs of the FeNiCo 54 Ketjen catalyst without melamine: (left) 400× magnification and (right) 1000× magnification.
Applsci 16 03310 g0a5
Figure A6. SEM images of the FeNiCo 54 Vulcan melamine catalyst: (left) 60× magnification and (right) 600× magnification.
Applsci 16 03310 g0a6

References

  1. Alia, S.M.; Danilovic, N. Rotating Disk Electrode Standardization and Best Practices in Acidic Oxygen Evolution for Low-Temperature Electrolysis. Front. Energy Res. 2022, 10, 857663. [Google Scholar] [CrossRef]
  2. U.S Department of Energy. Basic Research Needs for Catalysis Science. 2017. Available online: https://science.energy.gov/bes/community (accessed on 23 January 2026).
  3. Wang, L.; Liu, X.; Lai, C.; Liu, J.; Wang, W.; Wang, X.; Bo, X.; Cheng, T.; Li, J.; Wang, Z.; et al. Recent Advances in the Design and Structure–Activity Relationships of Oxygen Evolution Catalysts for Alkaline Water Electrolysis. Molecules 2025, 30, 4350. [Google Scholar] [CrossRef] [PubMed]
  4. IRENA. Green Hydrogen Cost Reduction: Scaling up Electrolysers to Meet the 1.5 °C Climate Goal; IRENA: Abu Dhabi, United Arab Emirates, 2020. [Google Scholar]
  5. Lide, D.R.; Baysinger, G.; Berger, L.I.; Goldberg, R.N.; Kehiaian, H.V.; Kuchitsu, K.; Roth, D.L.; Zwillinger, D. CRC Handbook of Chemistry and Physics Editor-in-Chief; CRC Press: Boca Raton, FL, USA, 2005. [Google Scholar]
  6. McCrory, C.C.L.; Jung, S.; Peters, J.C.; Jaramillo, T.F. Benchmarking heterogeneous electrocatalysts for the oxygen evolution reaction. J. Am. Chem. Soc. 2013, 135, 16977–16987. [Google Scholar] [CrossRef]
  7. Anderson, G.C.; Pivovar, B.S.; Alia, S.M. Establishing Performance Baselines for the Oxygen Evolution Reaction in Alkaline Electrolytes. J. Electrochem. Soc. 2020, 167, 044503. [Google Scholar] [CrossRef]
  8. Cao, F.; Yang, X.; Shen, C.; Li, X.; Wang, J.; Qin, G.; Li, S.; Pang, X.; Li, G. Electrospinning synthesis of transition metal alloy nanoparticles encapsulated in nitrogen-doped carbon layers as an advanced bifunctional oxygen electrode. J. Mater. Chem. A Mater. 2020, 8, 7245–7252. [Google Scholar] [CrossRef]
  9. Liu, W.; Niu, X.; Tang, J.; Liu, Q.; Luo, J.; Liu, X.; Zhou, Y. Energy-efficient anodic reactions for sustainable hydrogen production via water electrolysis. Chem. Synth. 2023, 3, 44. [Google Scholar] [CrossRef]
  10. Derouana, E.G.; Parmon, V.; Lemos, F.; Ribeiro, F.R. Principles and Methods for Accelerated Catalyst Design and Testing; Springer: Dordrecht, The Netherlands, 2002. [Google Scholar] [CrossRef]
  11. Wang, L.; Lee, C.Y.; Schmuki, P. Solar water splitting: Preserving the beneficial small feature size in porous α-Fe2O3 photoelectrodes during annealing. J. Mater. Chem. A Mater. 2013, 1, 212–215. [Google Scholar] [CrossRef]
  12. Garcia, A.C.; Koper, M.T.M. Effect of Saturating the Electrolyte with Oxygen on the Activity for the Oxygen Evolution Reaction. ACS Catal. 2018, 8, 9359–9363. [Google Scholar] [CrossRef]
  13. Ioroi, T.; Nagai, T.; Siroma, Z.; Yasuda, K. Effect of rotating disk electrode conditions on oxygen evolution reaction activity of Ir nanoparticle catalysts and comparison with membrane and electrode assemblies. Int. J. Hydrogen Energy 2022, 47, 38506–38516. [Google Scholar] [CrossRef]
  14. Tesch, M.F.; Neugebauer, S.; Narangoda, P.V.; Schlögl, R.; Mechler, A.K. The rotating disc electrode: Measurement protocols and reproducibility in the evaluation of catalysts for the oxygen evolution reaction. Energy Adv. 2023, 2, 1823–1830. [Google Scholar] [CrossRef]
  15. Sakata, Y.; Tamaura, Y.; Imamura, H.; Watanabe, M. Preparation of a New Type of CaSiO 3 with High Surface Area and Property as a Catalyst Support. In Studies in Surface Science and Catalysis; Elsevier: Amsterdam, The Netherlands, 2006; Volume 162, pp. 331–338. [Google Scholar]
  16. Qiao, Z.; Wang, C.; Zeng, Y.; Spendelow, J.S.; Wu, G. Advanced Nanocarbons for Enhanced Performance and Durability of Platinum Catalysts in Proton Exchange Membrane Fuel Cells. Small 2021, 17, 2006805. [Google Scholar] [CrossRef] [PubMed]
  17. Liu, J.; Lai, Z.; Shang, Z.; Zhang, Y.; Xu, B.; Shen, L.; Zhao, L.; Wang, G.; Wang, Z. Graphitized carbon support for enhanced durability and mitigation of reversal degradation in proton exchange membrane fuel cells. Carbon 2025, 243, 120599. [Google Scholar] [CrossRef]
  18. Murthy, R.; Neelakantan, S.C. Immobilization of molecular complexes on graphitized carbon cloth as stable and hybrid electrocatalysts for enhanced hydrogen evolution reaction and oxygen evolution reaction. Mater. Adv. 2022, 3, 8201–8210. [Google Scholar] [CrossRef]
  19. Mohanta, P.K.; Regnet, F.; Jörissen, L. Graphitized Carbon: A promising stable cathode catalyst support material for long term PEMFC applications. Materials 2018, 11, 907. [Google Scholar] [CrossRef]
  20. Rufer, S.; Nitzsche, M.P.; Garimella, S.; Lake, J.R.; Varanasi, K.K. Hierarchically conductive electrodes unlock stable and scalable CO2 electrolysis. Nat. Commun. 2024, 15, 9429. [Google Scholar] [CrossRef]
  21. Mao, Z.; Fu, Y.; Long, X.; Li, C.; Li, M.; Zhu, F.; Ye, W.; Fan, Z.; Yao, X. Carbon-based materials for electrocatalytic energy conversion: From understanding to designing. Chem. Synth. 2025, 5, 68. [Google Scholar] [CrossRef]
  22. International Labour Organization. International Chemical Safety Cards (ICScs). 2014. Available online: https://chemicalsafety.ilo.org/dyn/icsc/showcard.display?p_card_id=0457&p_edit=&p_version=2&p_lang=en (accessed on 23 January 2026).
  23. Thommes, M.; Kaneko, K.; Neimark, A.V.; Olivier, J.P.; Rodriguez-Reinoso, F.; Rouquerol, J.; Sing, K.S.W. Physisorption of gases, with special reference to the evaluation of surface area and pore size distribution (IUPAC Technical Report). Pure Appl. Chem. 2015, 87, 1051–1069. [Google Scholar] [CrossRef]
  24. Wang, Y.; Suo, B.; Shi, Y.; Yuan, H.; Zhu, C.; Chen, Y. General Fabrication of 3D Hierarchically Structured Bamboo-like Nitrogen-Doped Carbon Nanotube Arrays on 1D Nitrogen-Doped Carbon Skeletons for Highly Efficient Electromagnetic Wave Energy Attenuation. ACS Appl. Mater. Interfaces 2020, 12, 40692–40701. [Google Scholar] [CrossRef]
  25. Wang, Y.; Qiu, L.; Zhang, L.; Tang, D.-M.; Ma, R.; Ren, C.-L.; Ding, F.; Liu, C.; Cheng, H.-M. Growth mechanism of carbon nanotubes from Co-W-C alloy catalyst revealed by atmospheric environmental transmission electron microscopy. Sci. Adv. 2022, 8, eabo5686. [Google Scholar] [CrossRef] [PubMed]
  26. Bates, M.K.; Jia, Q.; Doan, H.; Liang, W.; Mukerjee, S. Charge-Transfer Effects in Ni-Fe and Ni-Fe-Co Mixed-Metal Oxides for the Alkaline Oxygen Evolution Reaction. ACS Catal. 2016, 6, 155–161. [Google Scholar] [CrossRef]
  27. Wu, D.; Zhao, Y.; Xia, Q.; Fan, X.; Li, Y.; Zhang, G.; Zhang, F.; Peng, W. Bamboo-like nitrogen-doped carbon nanotubes on iron mesh for electrochemically-assisted catalytic oxidation. J. Hazard. Mater. 2021, 408, 124899. [Google Scholar] [CrossRef]
  28. Lyu, Y.; Wang, P.; Liu, D.; Zhang, F.; Senftle, T.P.; Zhang, G.; Zhang, Z.; Wang, J.; Liu, W. Tracing the Active Phase and Dynamics for Carbon Nanofiber Growth on Nickel Catalyst Using Environmental Transmission Electron Microscopy. Small Methods 2022, 6, 2200235. [Google Scholar] [CrossRef] [PubMed]
  29. Ritter, U.; Scharff, P.; Grechnev, G.E.; Desnenko, V.A.; Fedorchenko, A.V.; Panfilov, A.S.; Prylutskyy, Y.I.; Kolesnichenko, Y.A. Structure and magnetic properties of multi-walled carbon nanotubes modified with cobalt. Carbon 2011, 49, 4443–4448. [Google Scholar] [CrossRef]
  30. Friebel, D.; Louie, M.W.; Bajdich, M.; Sanwald, K.E.; Cai, Y.; Wise, A.M.; Cheng, M.J.; Sokaras, D.; Weng, T.C.; Alonso-Mori, R.; et al. Identification of highly active Fe sites in (Ni,Fe)OOH for electrocatalytic water splitting. J. Am. Chem. Soc. 2015, 137, 1305–1313. [Google Scholar] [CrossRef]
  31. Wang, X.; Dai, Y.; Wang, P.; Yue, D. Melamine intercalation approach for the synthesis of C, N codoped net-like NiCo oxides composites and Its Application towards oxygen evolution reaction in alkaline solution. Int. J. Hydrogen Energy 2024, 51, 1407–1416. [Google Scholar] [CrossRef]
  32. Yan, X.L.; Li, H.F.; Wang, C.; Jiang, B.B.; Hu, H.Y.; Xie, N.; Wu, M.H.; Vinodgopal, K.; Dai, G.P. Melamine as a single source for fabrication of mesoscopic 3D composites of N-doped carbon nanotubes on graphene. RSC Adv. 2018, 8, 12157–12164. [Google Scholar] [CrossRef]
  33. Biesinger, M.C. X-Ray Photoelectron Spectrocopy (XPS) Reference Pages. 2021. Available online: https://www.xpsfitting.com/ (accessed on 23 January 2026).
  34. Thermo Fisher Scientific. Nitrogen | XPS Periodic Table. Available online: https://www.thermofisher.com/pt/en/home/materials-science/learning-center/periodic-table.html (accessed on 23 January 2026).
  35. Brubaker, Z.E.; Langford, J.J.; Kapsimalis, R.J.; Niedziela, J.L. Quantitative analysis of Raman spectral parameters for carbon fibers: Practical considerations and connection to mechanical properties. J. Mater. Sci. 2021, 56, 15087–15121. [Google Scholar] [CrossRef]
  36. Choi, Y.C.; Min, K.I.; Jeong, M.S. Novel method of evaluating the purity of multiwall carbon nanotubes using raman spectroscopy. J. Nanomater. 2013, 2013, 615915. [Google Scholar] [CrossRef]
  37. Sadezky, A.; Muckenhuber, H.; Grothe, H.; Niessner, R.; Pöschl, U. Raman microspectroscopy of soot and related carbonaceous materials: Spectral analysis and structural information. Carbon 2005, 43, 1731–1742. [Google Scholar] [CrossRef]
  38. Amin, A.S.; Caidi, A.; Lange, T.; Radev, I.; Sandbeck, D.J.S.; Philippi, W.; Kräenbring, M.A.; Öztürk, M.; Peinecke, V.; Lerche, D.; et al. Key Control Characteristics of Carbon Black Materials for Fuel Cells and Batteries for a Standardized Characterization of Surface Properties. Part. Part. Syst. Charact. 2025, 42, 2400069. [Google Scholar] [CrossRef]
  39. Ferrari, A.C.; Robertson, J. Interpretation of Raman Spectra of Disordered and Amorphous Carbon; American Physical Society: College Park, MD, USA, 2000. [Google Scholar] [CrossRef]
  40. Antolini, E. Carbon supports for low-temperature fuel cell catalysts. Appl. Catal. B 2009, 88, 1–24. [Google Scholar] [CrossRef]
  41. Donnet, J.-B.; Bansal, R.C.; Wang, M.-J. Carbon Black: Science and Technology; Dekker: Albuquerque, NM, USA, 1993. [Google Scholar]
  42. Lux, F. Models proposed to explain the electrical conductivity of mixtures made of conductive and insulating materials. J. Mater. Sci. 1993, 28, 285–301. [Google Scholar] [CrossRef]
  43. Cullity, B.D.; Stock, S.R. Elements of X-Ray Diffraction, 3rd ed.; Pearson New International Edition; Pearson: London, UK, 2014. [Google Scholar]
  44. Huang, Y.; He, J.; Zhu, Z.; Xu, G.; Qi, Q.; Luo, J.; Shang, Z.; Gu, X. Cyclic HCP<->FCC Phase Transformation Crystallography in Pure Cobalt. Metals 2025, 15, 947. [Google Scholar] [CrossRef]
  45. Porter, D.A.; Easterling, K.E.E.; Sherif, M.Y. Phase Transformations in Metals and Alloys; CRC Press: Boca Raton, FL, USA, 2009. [Google Scholar]
  46. Figueiredo, J.L.; Pereira, M.F.R. The role of surface chemistry in catalysis with carbons. Catal. Today 2010, 150, 2–7. [Google Scholar] [CrossRef]
  47. Ribeiro, R.S.; Florent, M.; Delgado, J.J.; Pereira, M.F.R.; Bandosz, T.J. Converting carbon black into an efficient and multi-site ORR electrocatalyst: The importance of bottom-up construction parameters. Nanoscale 2023, 15, 18592–18602. [Google Scholar] [CrossRef]
  48. Brunauer, S.; Emmett, P.H.; Teller, E. Adsorption of gases in multimolecular layers. J. Am. Chem. Soc. 1938, 60, 309–319. [Google Scholar] [CrossRef]
  49. Lowell, S.; Shields, J.E.T.; Martin, A.; Thommes, M. Characterization of Porous Solids and Powders: Surface Area, Pore Size and Density; Springer: Berlin/Heidelberg, Germany, 2004. [Google Scholar]
Figure 1. Schematic representation of the catalyst synthesis process. The procedure consists of six main sequential steps: (1) heating of ultra-pure water on a heating plate, followed by the addition of (2) melamine (if intended to have melamine), (3) specific metal precursors (nitrates of Fe, Ni, and Co), and (4) the catalyst support. After drying in the heating plate, the resulting mixture is then (5) mechanically homogenized using a pestle and mortar and finally subjected to (6) thermal treatment up to 750 °C to yield the final catalyst.
Applsci 16 03310 g001
Figure 2. Polarization curves- LSV (1.2 V to 2.0 V) results in studying the influence of melamine on the catalyst FeNiCo Ketjen 54. BoL—Beginning of “life,” represented by open triangles; EoL—End of “life,” represented by closed circles.
Applsci 16 03310 g002
Figure 3. Polarization curves- LSV (1.2 V to 2.2 V) results for studying the influence of melamine on the catalyst FeNiCo 72 with Ketjen support. BoL—Beginning of “life,” represented by open triangles; EoL—End of “life,” represented by closed circles.
Applsci 16 03310 g003
Figure 4. Polarization curves- LSV (1.2 V to 2.2 V) results in studying the influence of melamine for catalyst 54 and Vulcan support. BoL—Beginning of “life,” represented by open triangles; EoL—End of “life,” represented by closed circles.
Applsci 16 03310 g004
Figure 5. Representative TEM micrographs: (a,c): FeNiCo 72 Ketjen with melamine of nanocarbon produced in a Catalyst having melamine. (b,d): FeNiCo 72 Ketjen without melamine. Scale bars: 50 nm.
Applsci 16 03310 g005
Figure 6. Representative TEM micrographs of the synthesized monometallic catalysts: (A,B) Fe, (C,D) Ni, and (E,F) Co, demonstrating their distinct carbon growth mechanisms. Scale bars: 50 nm (A,B), 20 nm (C,D,F) and 10 nm (E).
Applsci 16 03310 g006
Figure 7. EDS elemental mapping of FeNiCo catalysts supported on Ketjen and Vulcan carbons, with and without melamine. From left to right: Fe (green color), Ni (blue color), and Co (orange color). Scale bars: 20 µm (FeNiCo Ketjen 54 without melamine), 50 µm (FeNiCo Ketjen 54 with melamine, FeNiCo Vulcan 54 without melamine, FeNiCo Vulcan 54 with melamine, FeNiCo Ketjen 72 without melamine), and 100 µm (FeNiCo Ketjen 72 with melamine).
Applsci 16 03310 g007aApplsci 16 03310 g007b
Figure 8. XPS spectra (C 1s) of the six catalyst samples: (a1) 54 Ketjen without melamine; (a2) 54 Ketjen with melamine; (b1) 54 Vulcan without melamine; (b2) 54 Vulcan with melamine; (c1) 72 Ketjen without melamine; (c2) 72 Ketjen with melamine.
Applsci 16 03310 g008aApplsci 16 03310 g008b
Figure 9. Results of Raman spectroscopy for: (a) Ketjen Black EC600JD and (b) Vulcan XC72R a hybrid Lorentzian-Gaussian fitting model.
Applsci 16 03310 g009
Figure 10. Electrical conductivity of the investigated carbon blacks as a function of the specific force.
Applsci 16 03310 g010
Figure 11. XRD diffractograms of catalyst samples (ac): (a1)—complete diffractogram of 54 Ketjen without and with melamine. (a2)—focus on principal peaks of the metals (between 42° and 46° on the catalyst of 54 Ketjen without and with melamine. (b1)—complete diffractogram of 54 Vulcan without and with melamine. (b2)—focus on principal peaks of the metals (between 42° and 46° on the catalyst of 54 Vulcan without and with melamine. (c1)—complete diffractogram of 72 Ketjen without and with melamine (c2)—focus on principal peaks of the metals (between 42° and 46° on the catalyst of 72 Ketjen without and with melamine. Characteristic peaks are represented by Applsci 16 03310 i001 Catalyst with melamine; Applsci 16 03310 i002 Catalyst without melamine.
Applsci 16 03310 g011aApplsci 16 03310 g011b
Figure 12. XRD diffractograms of catalyst samples between 29° and 39° (ac): (a) complete diffractogram of 54 Ketjen without and with melamine. (b) diffractogram of 54 Vulcan without and with melamine. (c) diffractogram of 72 Ketjen without and with melamine. Characteristic peaks are represented by Applsci 16 03310 i003 Catalyst with melamine; Applsci 16 03310 i004 Catalyst without melamine.
Applsci 16 03310 g012
Table 1. Metal mass concentration obtained by ICP-OES.
SampleMetalswt% Within the Metal Catalystwt% of Metals on the Catalyst
FeNiCo 54
Ketjen
Without
melamine
Co3810.0 ± 0.1
Fe24
Ni39
With
melamine
Co348.5 ± 0.2
Fe31
Ni35
FeNiCo 54
Vulcan
Without
melamine
Co359.4 ± 0.1
Fe26
Ni39
With
melamine
Co388.4 ± 0.1
Fe28
Ni34
FeNiCo 72
Ketjen
Without
melamine
Co3912.2 ± 0.1
Fe25
Ni36
With
melamine
Co3310.5 ± 0.5
Fe42
Ni24
Table 2. Automated physisorption flow analyzer results.
SampleAs–Multi-PointBET
(m2 g−1)
BJH Pore
Volume (cm3 g−1)
BJH Pore
Diameter (nm)
C Value of the BET Equation
Melamine *110.033.252.7
FeNiCo 54 VulcanWithout
melamine
1430.683.50174.5
With
melamine
1170.513.1069.8
FeNiCo 72 KetjenWithout
melamine
14853.283.62118.8
With
melamine
10511.993.4397.6
* Used as received.
Table 3. XPS binding energies (BE), full width at half maximum (FWHM), and atomic percentages of FeNiCo 54 Vulcan catalyst with and without melamine.
FeNiCo 54 VulcanWithout MelamineWith Melamine
BE (eV)FWHM (eV)Atomic %BE (eV)FWHM (eV)Atomic %
N 1sND398.80.71.41
Fe 2p711.03.10.52716.70.20.38
Co 2p780.94.60.62778.90.40.46
Ni 2p3 metal852.70.80.02853.11.70.04
Ni 2p3 Ni–O855.53.10.23855.33.50.18
Ni 2p3 metal Ni–O satellite861.23.50.14860.73.50.09
ND = Not detected; Ni–O satellite peaks correspond to shake-up features characteristic of oxidized Ni species. Atomic percentages refer to surface composition derived from XPS survey spectra.
Table 4. XPS binding energies (BE), full width at half maximum (FWHM), and atomic percentages of FeNiCo 72 Ketjen catalyst with and without melamine.
FeNiCo 72 KetjenWithout MelamineWith Melamine
BE (eV)FWHM (eV)Atomic %BE (eV)FWHM (eV)Atomic %
N 1s (Peak 1)ND398.72.01.23
N 1s (Peak 2)400.82.00.51
Fe 2p711.22.80.34713.02.60.25
Co 2p780.93.90.40778.51.60.26
Ni 2p3 metalND852.91.30.03
Ni 2p3 Ni-O855.63.50.14854.93.50.15
Ni 2p3 metal Ni-O satellite861.63.50.09862.33.50.04
ND = Not detected; Ni–O satellite peaks correspond to shake-up features characteristic of oxidized Ni species; Atomic percentages refer to surface composition derived from XPS survey spectra.
Table 5. Results of Raman spectroscopy for Ketjen Black EC600JD and Vulcan XC72R, with Lorentzian fits applied to D, G, D′, and D4, and a Gaussian fit applied to D″.
CatalystBandCenterID/IGID″/IGR2
KetJen Black EC600JDD(D1)1335 ± 0.2 1.57 ± 0.090.24 ± 0.020.999
G1583.3 ± 1
D″ (D3)1498.3 ± 5.1
D′ (D2)1606.8 ± 0.9
D41185 ± 3
Vulcan XC72RD(D1)1337.6 ± 2.8 1.15 ± 0.070.22 ± 0.020.985
G1577.6 ± 3.4
D″ (D3)1490 ± 6.5
D′ (D2)1610.2 ± 1.4
D41185 ± 10.7
Table 6. Results of Raman spectroscopy for catalysts supported on Ketjen Black EC600JD and Vulcan XC72R, with and without melamine, with Lorentzian fits for D, G, D′, and D4 and a Gaussian fit for D″. The graphics can be consulted in Supplementary Information (Figures S7–S12).
CatalystBandCenterID/IGID″/IGR2
FeNiCo 54
Ketjen without
melamine
D(D1)1341.4 ± 0.51.30 ± 0.080.12 ± 0.010.978
G1589.4 ± 2.7
D″ (D3)1490 ± 6.9
D′ (D2)1610.9 ± 2.9
D41215 ± 5.6
FeNiCo 54
Ketjen with
melamine
D (D1)1343 ± 1.51.48 ± 0.130.25 ± 0.020.937
G1586.9 ± 4.8
D″ (D3)1510 ± 16.8
D′ (D2)1617.9 ± 6.1
D41185 ± 11.2
FeNiCo 54
Vulcan without
melamine
D (D1)1347.6 ± 3.21.08 ± 0.070.34 ± 0.030.974
G1594.5 ± 3.1
D″ (D3)1510 ± 16.8
D′ (D2)1627.8 ± 8.7
D41185 ± 11.8
FeNiCo 54
Vulcan with
melamine
D (D1)1342.7 ± 1.81.28 ± 0.100.55 ± 0.050.977
G1591.9 ± 18.5
D″ (D3)1510 ± 5.5
D′ (D2)1608 ± 9.8
D41185 ± 11.7
FeNiCo 72
Ketjen without
melamine
D (D1)1340.5 ± 0.21.39 ± 0.080.24 ± 0.020.996
G1594.6 ± 1
D″ (D3)1497.3 ± 4.6
D′ (D2)1619.4 ± 1.6
D41206.7 ± 3.8
FeNiCo 72
Ketjen with
melamine
D (D1)1341.7 ± 0.42.00 ± 0.150.33 ± 0.030.990
G1590.3 ± 2.1
D″ (D3)1510 ± 10.1
D′ (D2)1614.4 ± 1.8
D41185 ± 12.3
Disclaimer/Publisher’s Note: The statements, opinions and data contained in all publications are solely those of the individual author(s) and contributor(s) and not of MDPI and/or the editor(s). MDPI and/or the editor(s) disclaim responsibility for any injury to people or property resulting from any ideas, methods, instructions or products referred to in the content.