Article

Bicarbonate-Based Cultivation of Chlorella vulgaris: Growth Enhancement, Carbon Losses and Metabolic Trade-Offs


1
LEPABE, ALiCE, Faculty of Engineering, University of Porto, Rua Dr. Roberto Frias s/n, 4200-465 Porto, Portugal
2
LAQV-REQUIMTE, Faculty of Pharmacy, University of Porto, Rua de Jorge de Viterbo Ferreira 228, 4050-313 Porto, Portugal
*
Author to whom correspondence should be addressed.
Appl. Sci. 2026, 16(7), 3279; https://doi.org/10.3390/app16073279
Submission received: 10 March 2026 / Revised: 25 March 2026 / Accepted: 26 March 2026 / Published: 28 March 2026

Abstract

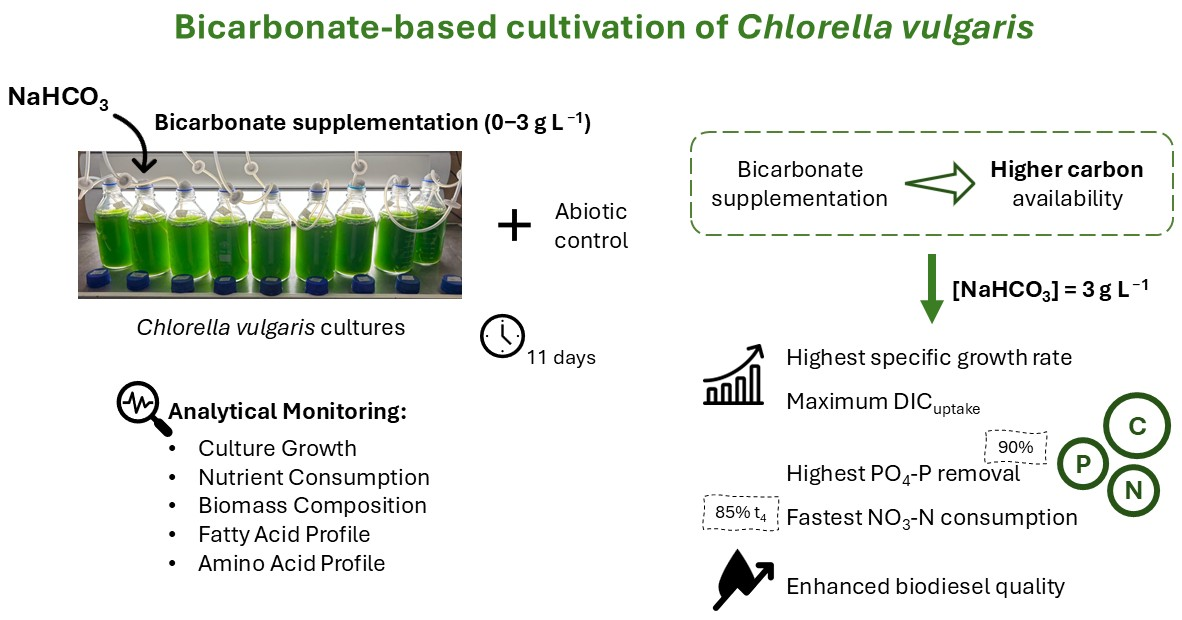
Microalgae are photosynthetic microorganisms with high biotechnological potential, though optimising inorganic carbon supply remains a critical challenge to enhance growth, biomass quality, and carbon use efficiency. To address this, this study evaluated the impact of sodium bicarbonate supplementation (0, 0.5, 1.5, and 3.0 g L−1) on Chlorella vulgaris growth, carbon dynamics, biochemical composition, and metabolism over 11 days. Higher carbon availability (3.0 g L−1 NaHCO3) increased the specific growth rate to 0.472 ± 0.004 d−1, accelerated nitrogen removal (85% by day 4), enhanced phosphorus removal (up to 90% by the end of cultivation), and increased dissolved inorganic carbon uptake (93 ± 6 mg L−1). Carbohydrate and lipid contents were not significantly affected by bicarbonate concentration, whereas protein and pigment levels were higher in non-supplemented conditions due to prolonged exponential growth. Bicarbonate supplementation enhanced MUFA content, improving biodiesel quality. Amino acid profiles were similar across conditions, with glutamic acid as the predominant amino acid (up to 17 mg g−1 DW) and higher values under moderate bicarbonate supplementation (1.5 g L−1). Overall, bicarbonate supplementation enhanced microalgal growth, nutrient removal efficiency, and fatty acid composition, highlighting its potential to improve carbon availability for C. vulgaris cultivation.

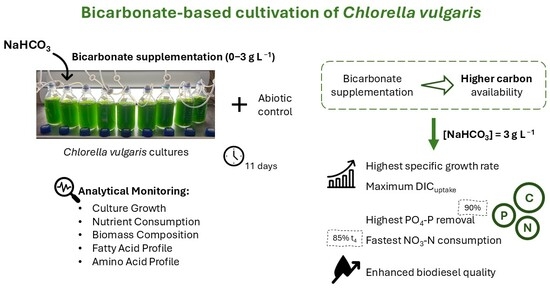
Graphical Abstract

1. Introduction

The growing interest in sustainable biotechnological solutions has driven the research and development of microalgae-based production systems. Microalgae comprise a diverse group of photosynthetic microorganisms that use inorganic carbon sources, like CO2, to produce biomass rich in valuable compounds, including proteins, pigments, and lipids [1,2]. Furthermore, these microorganisms have high growth and productivity rates, do not require arable land, and can remediate various types of wastewaters [3,4]. Due to all these characteristics, microalgae have attracted significant attention across multiple sectors, including energy, pharmaceuticals, biotechnology, cosmetics, food science, aquaculture, and wastewater treatment [5]. However, the effectiveness and sustainability of microalgal cultivation are limited by the availability of carbon supply [6].
Microalgae require nutrients, light, and inorganic carbon for growth [7]. Since inorganic carbon is directly involved in photosynthesis and the biosynthesis of carbohydrates, lipids, proteins, pigments, and vitamins, its adequate supply is essential to prevent carbon limitation and ensure optimal growth. Consequently, inorganic carbon is commonly supplied to the culture medium as gaseous CO2 [3,8]. In fact, when compared to cultures exposed only to ambient air, experimental evidence reported by Eloka-Eboka and Inambao [9] demonstrated that supplementation with 1% (v/v) of CO2 increased microalgal growth by up to 60%, emphasising the crucial need for effective inorganic carbon delivery methods. Nevertheless, supplementation with gaseous CO2 is inefficient, as a significant fraction of the supplied CO2 escapes into the atmosphere due to its low solubility in water and limited gas–liquid mass transfer efficiency [1,8]. In addition, the high costs of CO2 purification, transportation, and storage increase overall production expenses. To address these limitations, alternative approaches based on the use of bicarbonate as an inorganic carbon source have been investigated [6].
Bicarbonate (HCO3) supplementation offers several advantages for microalgal cultivation: (i) reduced operational costs and energy requirements; (ii) improved carbon use efficiency due to the increased solubility of bicarbonate; (iii) decreased carbon losses to the atmosphere; (iv) buffering capacity that helps maintain culture pH; and (v) prevention of bacterial contamination when used in high concentrations [4,10,11]. Microalgae can use bicarbonate due to their CO2-concentrating mechanisms (CCM), which evolved as a biological adaptation to low inorganic carbon availability in the environment [12,13]. These mechanisms enhance intracellular CO2 concentrations by facilitating bicarbonate uptake and its subsequent conversion to CO2 by carbonic anhydrase, which is then assimilated by ribulose 1,5-bisphosphate carboxylase oxygenase (RuBisCo). As bicarbonate is converted to CO2, hydroxyl ions (OH) are released, increasing the pH of the culture medium, making pH control a critical operational parameter when bicarbonate is used as a carbon source [5,13,14]. In fact, the availability of inorganic carbon species is strongly influenced by pH, with CO2 and carbonic acid predominating at acidic pH values, bicarbonate prevailing in neutral to low alkaline conditions, and carbonate (CO32−) becoming the dominant species at higher pH levels [15]. Consequently, high pH levels can limit microalgal growth due to their incapacity to use carbonate ions and the reduced availability of CO2 or bicarbonate [13].
Several studies have investigated how bicarbonate supplementation affects the growth and biomass composition of microalgae. Srinivasan et al. [16] discovered that the addition of 100 mM (8.4 g L−1) sodium bicarbonate (NaHCO3) to Dunaliella salina cultures under nitrate-deficient conditions enhanced biomass production and increased the accumulation of carotenoids, especially β-carotene (192.8 µg/100 mg), and lipids (53.9%). Moreover, bicarbonate supplementation significantly reduced the oxidative stress caused by reactive oxygen species (ROS). Similarly, bicarbonate availability affected pigment biosynthesis in Chlorella pyrenoidosa. Compared to cultures without bicarbonate addition, lutein concentration increased 3.3-fold at 100 mM (8.4 g L−1) bicarbonate, followed by a decrease at higher concentrations (150–200 mM; 12.6–16.8 g L−1) [17]. Another study evaluated the use of NaHCO3 for carbon capture and the production of high-value compounds in five microalgal species. The supplementation of 6 g L−1 NaHCO3 resulted in the highest carbon removal efficiency (>85%) and biomass productivity for Parachlorella kessleri, Vischeria cf. stellata, and Porphyridium purpureum. In contrast, Phaeodactylum tricornutum exhibited optimal performance at a lower concentration of 1 g L−1 NaHCO3. Biomass composition varied significantly depending on both species and bicarbonate concentration, with P. tricornutum showing the highest lipid content. In addition, C16 and C18 fatty acids were predominant, with P. purpureum and P. tricornutum exhibiting the highest levels of polyunsaturated fatty acids, ranging from 14 to 30% [2]. From an operational perspective, Tu et al. [10] observed that adding sodium bicarbonate to a non-sterile cultivation of the saline–alkaline-tolerant microalga Chlorella sp. LPF reduced bacterial growth without negatively affecting microalgal development. Furthermore, Shen et al. [11] reported that a CO2-inorganic carbon system, including NaHCO3, maintained the culture pH within the range of 6.5–8.5, highlighting the buffering role of bicarbonate in the cultivation medium. Overall, these studies demonstrate that bicarbonate can improve microalgal growth and biomass composition while reducing contamination and helping maintain pH stability in the culture medium. Nevertheless, the benefits are strongly dependent on the microalgal species and the bicarbonate concentration used.
Although several studies have demonstrated the effectiveness of bicarbonate as an inorganic carbon source for enhancing microalgal growth and biomass composition, particularly lipid or pigment accumulation, there remains a lack of integrated studies comprehensively addressing biomass composition. A simultaneous evaluation of carbohydrates, pigments, lipids, and proteins, both in terms of total content and detailed compositional profiles, including fatty acids and amino acids, remains limited. Moreover, the assessment of potential inorganic carbon losses to the atmosphere in aerated systems is essential for an accurate evaluation of carbon consumption when bicarbonate is employed as a carbon source.
Therefore, the present study aims to address this gap by performing an integrated analysis of the growth, inorganic carbon consumption, and biomass composition of the microalga Chlorella vulgaris. Specifically, the main objectives of this work were to: (a) evaluate the effect of bicarbonate supplementation on growth rates and biomass productivity; (b) analyse the impact of bicarbonate on nutrient consumption; (c) quantify inorganic carbon losses through abiotic controls and carbon consumption in microalgal cultures; (d) assess the impact of bicarbonate on the biochemical composition of biomass, including lipids, proteins, carbohydrates, and pigments; (e) analyse changes in the fatty acid and amino acid profiles; and (f) discuss the implications of bicarbonate-based strategies for microalgal cultivation.

2. Materials and Methods

2.1. Microorganism and Culture Conditions

The microalga C. vulgaris CCAP 211/11B was obtained from the Culture Collection of Algae and Protozoa (CCAP, Scotland, UK). The inoculum was prepared in 100 mL Erlenmeyer flasks using a modified OECD (Organisation for Economic Co-operation and Development) growth medium [18]. Cultures were maintained at room temperature under continuous illumination provided by light-emitting diodes (LEDs) at an intensity of 50 μmol m−2 s−1. Agitation was ensured by an orbital shaker operating at 120 rpm.

2.2. Experimental Design and Bicarbonate Supplementation

The growth of C. vulgaris was monitored for 11 days under four different sodium bicarbonate supplementation conditions: B0 (0 g L−1), B0.5 (0.5 g L−1), B1.5 (1.5 g L−1), and B3.0 (3.0 g L−1). All experiments were performed in triplicate. Abiotic controls, consisting of flasks containing only culture medium and NaHCO3, were prepared for each bicarbonate concentration.
The experiments were conducted in 1 L flasks with modified OECD medium under continuous light (199 ± 13 µmol m−2 s−1) provided by white LED light panels (35 W, 4000 K). To start the cultures, biomass was centrifuged using an Avanti J-25 centrifuge (Beckman, Brea, CA, USA) at 9800× g (8000 rpm) and 20 °C for 10 min and subsequently inoculated at an initial biomass concentration of 138 ± 3 mg L−1. Throughout the experimental period, cultures were maintained under continuous aeration using air pumps (Airlight 3300, Sicce, Pozzoleone, Italy) at a flow rate of 1.7 L min−1 to ensure both agitation and CO2 supply. The injected air was previously filtered through 0.22-μm cellulose acetate syringe filters. Additionally, evaporation losses were compensated daily with distilled water, while the pH was adjusted to 7.8 using H2SO4 and NaOH solutions to ensure that bicarbonate remained the predominant inorganic carbon species. The temperature was monitored through the experiment, with an average value of 23.4 ± 0.2 °C. The same maintenance protocol, including daily pH adjustment, was applied to the abiotic controls to ensure that the chemical equilibrium and the driving force for CO2 removal remained consistent across all conditions.

2.3. Growth Monitoring and Kinetic Parameters

Microalgal growth was monitored daily by measuring the optical density (OD) at 680 nm in a UNICAM Helios Y spectrophotometer (Thermo Fisher Scientific, Cambridge, UK). Biomass concentration (X, mg L−1) was calculated using the biomass calibration curve shown in Equation (1).
O D = 0.0041 ± 0.0001 × X + 0.06 ± 0.01 ;   R 2 = 0.996
The specific growth rate (µ, d−1) was calculated during the exponential growth phase according to Equation (2), using biomass concentrations at the beginning (X0) and end (X1) of this phase and the corresponding cultivation times.
μ = ln X 1 / X 0 t 1 t 0
Daily biomass productivity (PX, mg L−1 d−1) was calculated between consecutive sampling points (Xz and Xz+1) using Equation (3). Maximum daily productivity (PX,max) was defined as the highest PX value obtained, and the average productivity (Pavg) was calculated over the entire cultivation period according to Equation (4), where Xi and Xf correspond to the biomass concentrations at the beginning and end (tf) of the experiment, respectively.
P X = X z + 1 X z t z + 1 t z
P a v g = X f X i t f

2.4. Nutrient and Carbon Analyses

Nitrate–nitrogen (NO3-N) and phosphate–phosphorus (PO4-P) concentrations in the culture medium were measured at the beginning (t0), mid-point (t4), and end (t11) of the cultivation period, while dissolved organic carbon (DOC) and dissolved inorganic carbon (DIC) were quantified at t0 and t11. For this purpose, samples were collected at the specified times and centrifuged at 5000× g (4000 rpm) for 10 min at 20 °C using a 5810 R centrifuge (Eppendorf, Hamburg, Germany). The supernatants were then filtered through 0.22 µm cellulose acetate syringe filters (Avantor, Radnor, PA, USA) and stored at −20 °C until analysis.
Nitrogen was quantified spectrophotometrically following the method of Collos et al. [19], based on the UV absorbance at 220 nm in filtered and diluted samples using a T80 UV/VIS spectrophotometer (PG Instruments, Leicestershire, UK). Phosphorus was determined by the ammonium molybdate colourimetric method according to Lee et al. [20]. Briefly, inorganic phosphate reacts with ammonium molybdate in the presence of ascorbic acid (reducing agent) to form a phosphomolybdate complex. The resulting stable blue-coloured complex was then measured at 820 nm using a Synergy HT 96-well microplate reader (Biotek Instruments, Inc., Winooski, VT, USA). Pre-prepared calibration curves were used to calculate PO4-P and NO3-N concentrations.
To assess nutrient consumption during the cultivation period, the removal efficiency (RE, %) of nitrate and phosphorus was calculated using Equation (5), where S0 and Sf correspond to the nutrient concentration at the beginning and end of the assay, respectively.
R E = S 0 S f S 0 × 100
Dissolved total carbon, DOC, and DIC were quantified from the filtered supernatant using a TOC-L organic carbon analyser (Shimadzu, Kyoto, Japan). The amount of dissolved inorganic carbon consumed by the microalgae (DICconsumed, mg L−1) was calculated using Equation (6):
D I C c o n s u m e d = D I C t 0 D I C t 11 D I C l o s t
where D I C t 0 and D I C t 11 correspond to the dissolved inorganic carbon present in the medium at the beginning and at the end of the experiment, respectively, and D I C l o s t represents the amount of inorganic carbon lost to the environment, as determined from the abiotic control assays.

2.5. Biochemical Characterisation of Biomass

In this work, C. vulgaris biomass was recovered by centrifugation (8000 rpm, 10 min, 20 °C), stored at −80 °C and later lyophilised. The biomass was manually ground, and the content of carbohydrates, lipids, proteins, and photosynthetic pigments (chlorophylls and carotenoids) was evaluated as described elsewhere [21], at t 0 and t 11 . Carbohydrate content was determined using the phenol–sulfuric acid assay. Absorbance was measured at 490 nm in duplicate using a Spectroquant Prove 300 spectrophotometer (Merck, Darmstadt, Germany). The carbohydrate concentration was determined using a calibration curve prepared with a standard glucose solution. Protein content was extracted and quantified following a modified Lowry method. The absorbance was measured at 500 and 750 nm using a Spectroquant Prove 300 spectrophotometer (Merck, Darmstadt, Germany). Calibration curves for low- and high-concentration ranges were prepared with bovine serum albumin standards. Total lipid content was assessed using a modified version of the Bligh and Dyer extraction method. The lipid fraction was weighed on an analytical scale (Pioneer PX125, Ohaus, Parsippany, NJ, USA). Photosynthetic pigments, namely chlorophylls a and b and total carotenoids, were extracted with methanol (90% v/v). The supernatants were analysed spectrophotometrically at 665 nm, 652 nm and 470 nm (Spectroquant Prove 300, Merck, Darmstadt, Germany). Concentrations were calculated using Lichtenthaler’s [22] specific equations.

2.6. Biochemical Profiles of Biomass

Amino acids were extracted and quantified by high-performance liquid chromatography (HPLC) following the methodology described by Pinto et al. [23]. Fatty acid methyl esters (FAMEs) were obtained through direct in situ transesterification based on Pagels et al. [24], with slight modifications. Briefly, freeze-dried biomass was reacted with methanol:acetyl chloride (95:5, v/v) at 80 °C for 1 h, using triundecanoin as internal standard and BHT as antioxidant. After the addition of NaCl solution and hexane, phase separation was achieved by centrifugation, and the organic phase was collected and dried over anhydrous sodium sulphate. FAMEs were analysed by gas chromatography (GC-FID; CP-3800, Varian, Palo Alto, CA, USA) equipped with a Select FAME column (50 m × 0.25 mm i.d.), using helium as carrier gas at a flow rate of 1 mL min−1. The injector and detector were operated at 250 °C and 270 °C, respectively. The oven temperature started at 140 °C, was held for 5 min, and then gradually increased to 210 °C at a rate of 2 °C min−1. A 1.5 µL sample was injected under split conditions (1:25). Fatty acids were identified by comparison with commercial standards and a certified reference mixture (Supelco 37 Component FAME Mix, Supelco, Bellefonte, PA, USA).

2.7. Statistical Analysis

All experimental assays were performed in independent biological triplicates, with chemical analyses conducted in technical duplicates for each replicate (n ≥ 3) to ensure analytical precision and reproducibility.
Results are reported as mean ± standard deviation. Statistical analyses were performed using GraphPad Prism (version 8.0, GraphPad Software, San Diego, CA, USA). The effects of the different conditions were analysed through analysis of variance (ANOVA). A one-way ANOVA was applied to growth parameters (Xmax, µ, PX,max and Pavg) and carbon dynamics, considering bicarbonate concentration as the single factor. A two-way ANOVA was used for nutrient removal datasets and biochemical composition to assess the simultaneous effects of bicarbonate concentration and cultivation time. Pairwise comparisons were carried out using Tukey’s post hoc procedure. A significance threshold of 0.05 was applied.

3. Results and Discussion

3.1. Effect of Bicarbonate Supplementation on Microalgal Growth

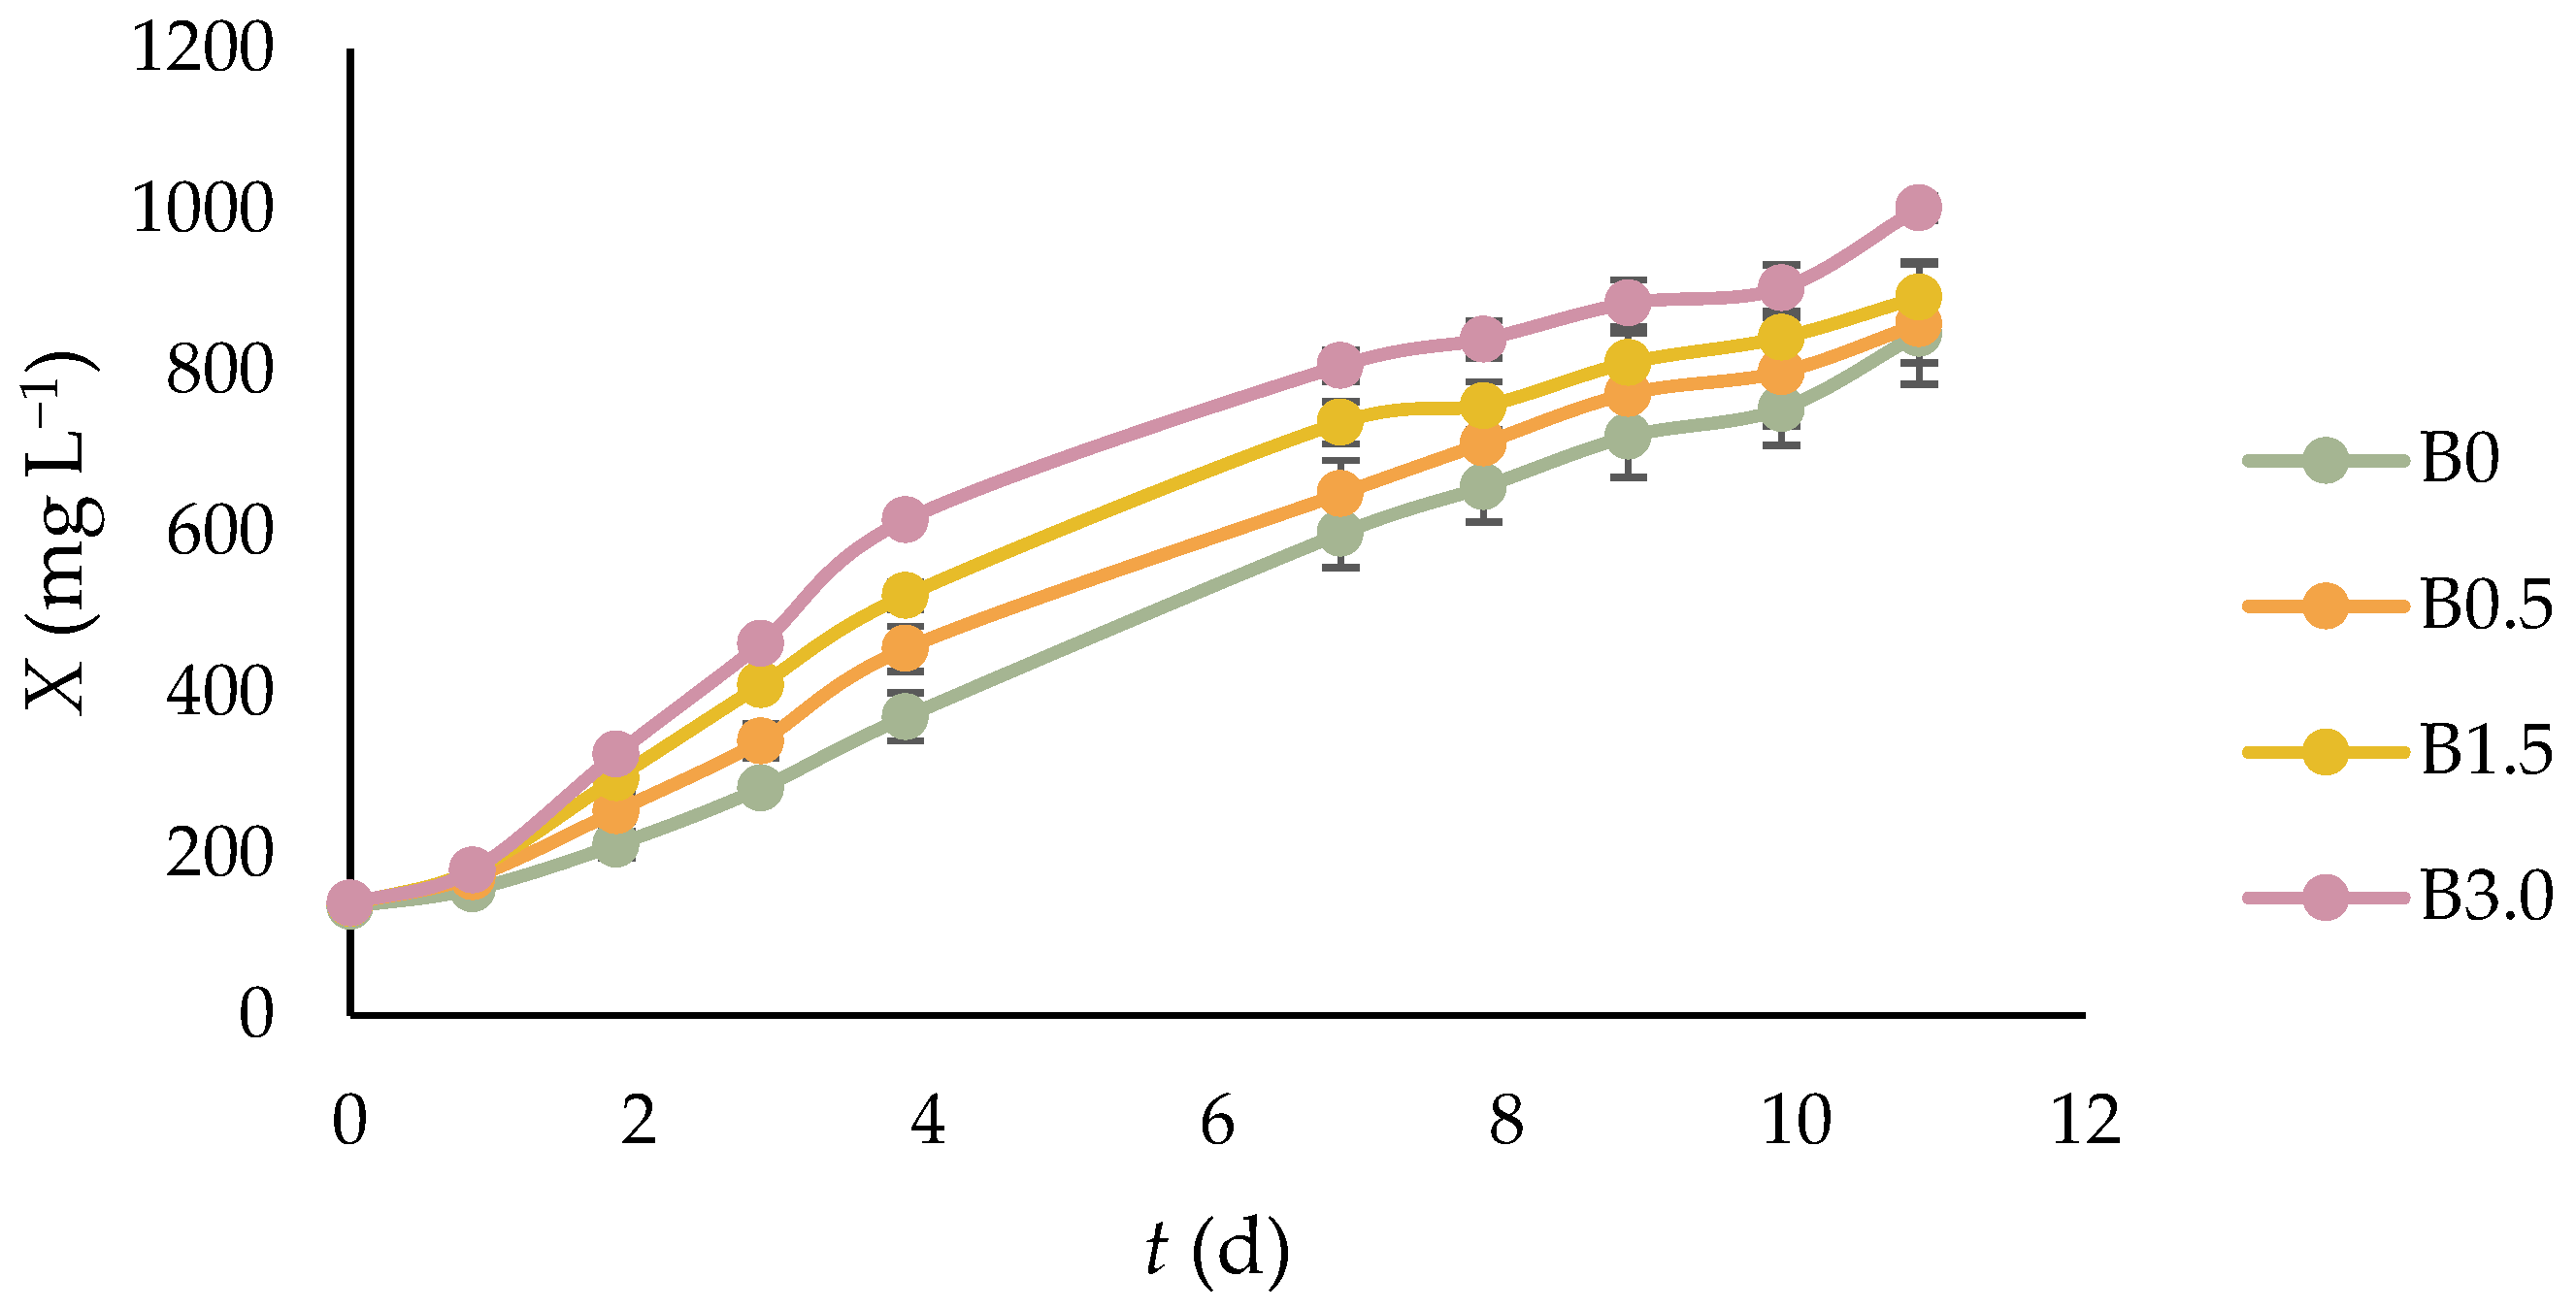
Since inorganic carbon is essential for photosynthesis and biomass production in microalgae [25], the effect of bicarbonate concentration on the growth of C. vulgaris was evaluated. As shown in Figure 1, increasing bicarbonate concentration accelerated microalgal growth and promoted higher biomass accumulation. In addition, according to Figure S1, obtained from the datasets provided in Table S1 (in Supplementary Materials), cultures supplemented with the highest NaHCO3 concentration (B3.0) reached the stationary phase earlier than the control ones (B0). This enhancement in microalgal growth and shorter transition from the exponential to the stationary phase indicate that carbon availability was a limiting factor and that bicarbonate supplementation decreased carbon limitation, thereby facilitating microalgal growth.
Analysing in more detail the results obtained through Table 1, it is possible to verify that the maximum biomass concentration at day 11 ranged from 847 ± 36 mg L−1 in the control (B0) to 1003 ± 15 mg L−1 in B3.0, corresponding to an increase of approximately 18% (p < 0.05). Similarly, the specific growth rate increased with bicarbonate concentration, reaching a maximum value of 0.472 ± 0.004 d−1 in B3.0 (p < 0.05), corresponding to an increase of approximately 78% relative to the control. Biomass productivity, both maximum and average, followed the same increasing trend, reaching the highest values of 153 ± 3 mg L−1 d−1 and 80 ± 1 mg L−1 d−1, respectively, at the highest bicarbonate concentration (B3.0), thus confirming the positive effect of NaHCO3 supplementation on microalgal biomass production.
This positive effect of bicarbonate supplementation on biomass growth is consistent with the findings of Mokashi et al. [26], who examined the influence of bicarbonate addition (0.25, 0.5, and 1 g L−1) on the growth of the microalga C. vulgaris. In fact, the highest specific growth rate (0.653 d−1) was obtained at the highest bicarbonate concentration tested. Furthermore, biomass concentration and productivity followed the same trend, reaching significantly higher values with the addition of 1 g L−1 bicarbonate, attaining 1.54 g L−1 and 0.996 g L−1 d−1, respectively, when compared to the lower bicarbonate concentrations studied. This response was associated with enhanced inorganic carbon uptake promoted by bicarbonate addition, which reduced carbon limitation and maximised overall biomass production rates. Nevertheless, it is important to note that excessive sodium bicarbonate supplementation may lead to the accumulation of Na+ ions in the culture medium, which can result in enzyme inactivation and, consequently, growth inhibition [27].

3.2. Effect of Bicarbonate Supplementation on Nutrient Consumption

The concentrations of NO3-N and PO4-P were monitored throughout the experimental period to relate the availability of these macronutrients to the growth of C. vulgaris. In the abiotic controls, no significant variations in either nutrient were detected.
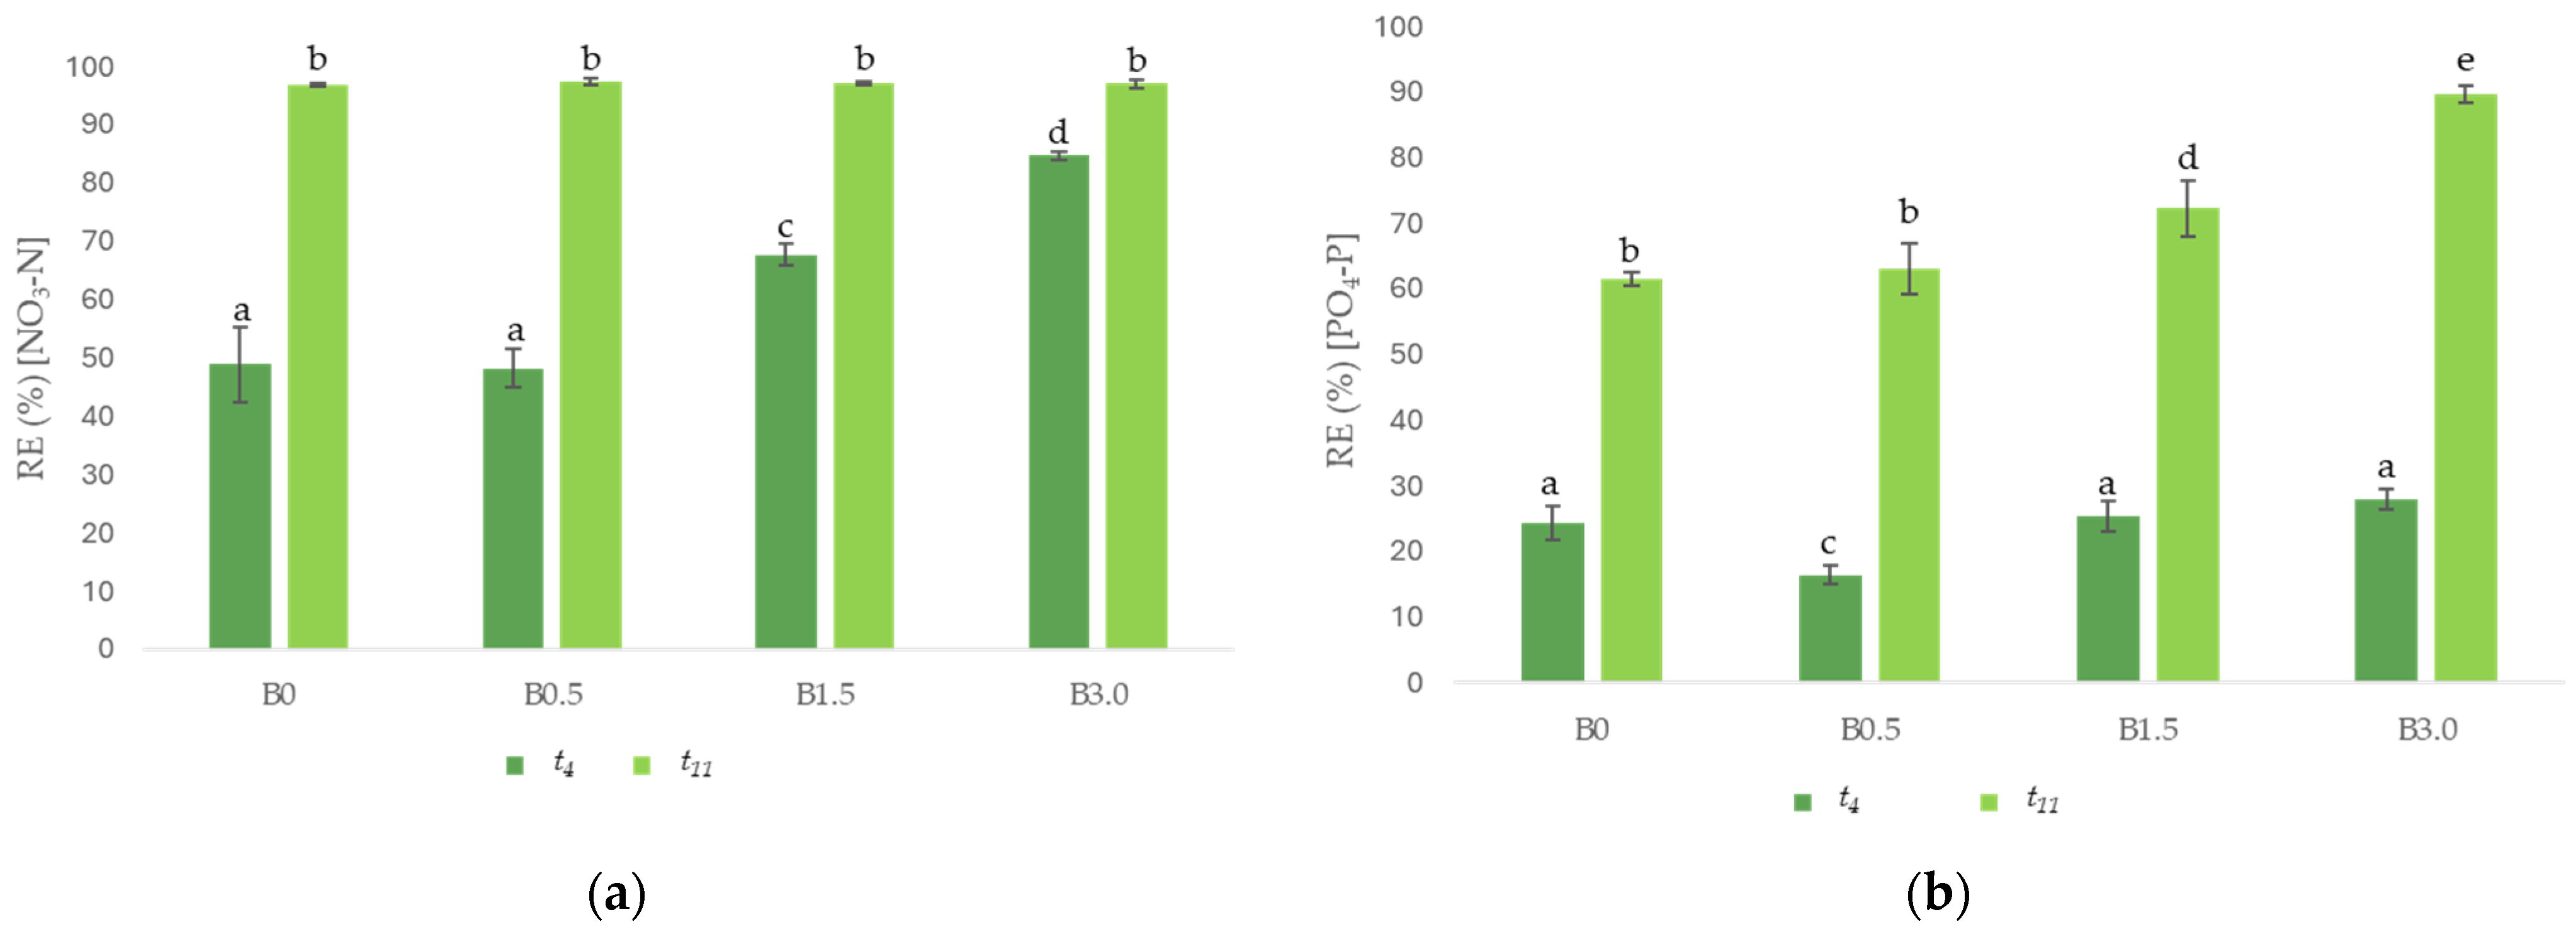
In the case of NO3-N (Figure 2a), the experiment started with an initial concentration of 41 ± 2 mg L−1. Significant nitrogen removal was observed by day 4 in all experimental conditions. However, in the supplemented assays, the reduction was faster, especially for B3.0, with concentrations dropping to 6.2 ± 0.3 mg L−1 by t4, corresponding to a removal efficiency of 84.8 ± 0.7%. This rapid nitrogen uptake is consistent with the enhanced growth observed under bicarbonate supplementation, as increased biomass accumulation during the exponential phase led to a higher cellular nitrogen demand. By the end of the cultivation period (t11), nitrogen removal exceeded 95% in all conditions, indicating that final residual concentrations did not differ substantially among treatments (p > 0.05). These results indicate that, although nitrate removal was nearly complete in all assays after 11 days, bicarbonate supplementation, especially at higher concentrations, accelerated nitrogen uptake during the early stages of cultivation, causing B3.0 cultures to enter the stationary phase earlier than the non-supplemented control.
Regarding phosphorus uptake (Figure 2b), similar removal levels were observed across all experimental conditions after 4 days of cultivation, with less than 30% of the initial phosphate concentration (9.4 ± 0.2 mg L−1) being removed, indicating limited phosphorus uptake during the early stages of growth. After 11 days, phosphorus removal was more pronounced in the bicarbonate-supplemented cultures, particularly in B3.0, where phosphorus concentrations approached zero. Thus, the highest phosphorus removal efficiency was observed in B3.0 (90 ± 1%), whereas the lowest removal was observed in the control (B0), reaching only 62 ± 1% (p < 0.05).
The enhanced nutrient assimilation observed at higher bicarbonate concentrations is consistent with the increased availability of inorganic carbon, which supports faster biomass growth and consequent cellular demand for nitrogen and phosphorus. Indeed, these findings are in agreement with those reported by Liu et al. [28], who demonstrated that enhanced carbon availability promotes faster microalgal growth and accelerates nitrogen and phosphorus removal. Overall, beyond its positive effect on microalgal growth, the present results highlight the potential of C. vulgaris for bioremediation applications, as biomass production was accompanied by effective nutrient removal.

3.3. Inorganic and Organic Carbon Dynamics During Cultivation

Since carbon is an essential element for microalgal growth [29], analysing its variation throughout cultivation is crucial. Accordingly, Table 2 summarises the results obtained for inorganic carbon consumption, carbon losses to the atmosphere, and the release of organic carbon into the culture medium.
Starting with DIC, the analysis of abiotic controls allowed the quantification of the maximum carbon losses to the environment. As shown in Table 2, part of the inorganic carbon present in the medium was lost under all experimental conditions, most likely due to CO2 mass transfer from the liquid phase to the atmosphere. Indeed, Rodriguez-Maroto et al. [30] demonstrated, using simulation models, that in bicarbonate-enriched media aerated with air, CO2 is removed from the culture medium into the rising air bubbles, which subsequently leave the cultivation vessel without significant transfer of CO2 from the bubbles back into the liquid phase. A closer examination of Table 2 shows that DIClost increased with increasing bicarbonate supplementation, reaching up to 270 ± 1 mg L−1 in the B3.0 condition. However, these values should be interpreted as a conservative upper-bound estimate. Since C. vulgaris continuously consumes inorganic carbon, the actual driving force for CO2 removal is lower in the biological cultures than in the abiotic controls. Therefore, the value of DIClost is likely overestimated for the biotic cultures. Although higher bicarbonate supplementation led to increased DIClost, a larger proportion of inorganic carbon remained available in the culture medium at higher bicarbonate concentrations.
Once the amount of DIClost was quantified, it was possible to determine the fraction of inorganic carbon effectively consumed by the microalgal cultures under the different bicarbonate supplementation conditions. The results indicate that DIC consumption increased with cellular growth and, consequently, with higher bicarbonate concentrations in the culture medium. Specifically, DICconsumed increased from 25 ± 3 mg L−1 in B0.5 to 71 ± 5 mg L−1 in B1.5, reaching a maximum of 93 ± 6 mg L−1 in B3.0. These results suggest that as more inorganic carbon became available, the microalgae consumed more, which is consistent with the faster growth observed under these conditions. This trend aligns with the findings reported by Kusi et al. [2], who also observed an increase in inorganic carbon removal from the medium with higher NaHCO3 concentrations, linking this effect to microalgal growth.
Simultaneously, the concentrations of DOC in the culture media were analysed. Initially, DOC was either undetected or remained below 3 mg L−1 throughout all experimental settings, indicating negligible background organic carbon in the medium. Thus, the increase observed at t11 can be entirely attributed to microalgal growth during cultivation. In fact, DOC concentrations increased in all experimental conditions due to the release of extracellular polymeric substances (EPS) during microalgae cultivation [31]. This effect was particularly pronounced under conditions of higher bicarbonate supplementation, where intensified growth led to a greater accumulation of biomass and, consequently, to higher DOC concentrations, reaching 79 ± 3 mg L−1 and 92 ± 12 mg L−1 in B1.5 and B3.0, respectively (p < 0.05).

3.4. Effect of Bicarbonate on Biochemical Composition of the Biomass

To investigate the influence of carbon availability on the metabolism of C. vulgaris, the biochemical composition of the biomass was evaluated, including carbohydrates, lipids, proteins, and pigments (chlorophyll a + b and carotenoids). The corresponding results are summarised in Table 3.
Starting by analysing the carbohydrate content, a statistically significant increase of approximately 44–55% was observed between t0 and t11 in all experimental conditions (p < 0.05). Nonetheless, no significant variations were detected among the different bicarbonate supplementation conditions at t11 (p > 0.05), suggesting that bicarbonate concentration did not directly affect carbohydrate accumulation. A similar pattern was observed for lipid content, which increased from 4 ± 1% dry cell weight (DCW) at t0 to values between 8 and 9% DCW at t11, regardless of bicarbonate supplementation. These results suggest that the increase in carbohydrate and lipid content was associated with culture age and the growth phase, rather than with differences in inorganic carbon availability. Since higher bicarbonate concentrations increased biomass productivity, it can be inferred that the supplied inorganic carbon was preferentially allocated to cell growth rather than to storage pathways, such as lipid or carbohydrate production, under the conditions observed at t11. In fact, Kumari et al. [32] reported that the lipid content in C. vulgaris was not significantly affected by the increased availability of inorganic carbon supplied as 5% CO2. Although CO2 enrichment promoted higher growth rates and biomass productivity, lipid accumulation increased only in cultures simultaneously subjected to additional stress conditions, specifically nitrogen and phosphorus limitation. These findings therefore indicate that substantial accumulation of reserve compounds requires the presence of secondary stress factors, such as nutrient limitation, alongside carbon enrichment.
Looking again at Table 3, the analysis of protein content shows that no statistically significant variation was observed between t0 and t11 in the culture supplemented with the highest bicarbonate concentration (B3.0), with protein levels remaining at approximately 11% DCW. In contrast, the remaining conditions exhibited a clear increase in protein content by t11, with the highest value (20 ± 1% DCW) obtained in the control condition (B0), followed by B0.5 (14 ± 1% DCW) and B1.5 (13.6 ± 0.6% DCW), revealing a trend opposite to that observed for biomass growth. This inverse relationship can be explained by differences in nitrogen availability and growth phase progression. As nitrogen is a key element of proteins, higher protein synthesis is typically associated with the exponential growth phase, during which nitrogen availability is higher. Conversely, as cultures enter the stationary phase, nitrogen becomes depleted, leading to reduced protein synthesis and slower growth [33]. Consistent with the growth and nutrient consumption results discussed previously, B3.0 cultures reached the stationary phase earlier and exhibited faster nutrient depletion, which is the most likely factor contributing to the lower protein content observed at t11. In contrast, the slower growth and delayed nutrient uptake in B0 enabled sustained protein accumulation, resulting in the highest protein content among all conditions.
Finally, pigment content was analysed, revealing that both chlorophyll a + b and carotenoids followed the same overall trend, increasing from t0 to t11 and reaching their highest levels in cultures without bicarbonate supplementation. Additionally, chlorophyll concentrations were consistently higher than carotenoid concentrations across all experimental conditions. Focusing on chlorophyll a + b, its content increased from 0.348 ± 0.008% DCW at t0 to 0.63 ± 0.03% DCW (B3.0), 0.87 ± 0.03% DCW (B1.5), and 1.01 ± 0.04% DCW (B0.5), reaching a maximum of 1.32 ± 0.06% DCW in the control condition (B0) at t11 (p < 0.05). Similar to the trend observed for protein content at t11, chlorophyll content dropped as bicarbonate concentration increased. This behaviour can be attributed to nutrient availability and growth phase. Chlorophyll biosynthesis requires both nitrogen and phosphorus: nitrogen is directly incorporated into the chlorophyll molecule, while phosphorus is essential for ATP production, which supports multiple cellular processes, including pigment synthesis [34]. As previously discussed, cultures supplemented with higher bicarbonate concentrations exhibited faster growth and nutrient uptake, leading to an earlier transition into the stationary phase. Consequently, by day 11, reduced nitrogen and phosphorus availability limited chlorophyll synthesis, resulting in lower pigment contents in these conditions. Carotenoid content also increased substantially between t0 (0.06 ± 0.01% DCW) and t11 across all experimental conditions, with increases exceeding 400% (p < 0.05). As observed for chlorophylls, the highest carotenoid concentration at the end of the cultivation period was obtained in the control condition, B0 (0.44 ± 0.03% DCW), followed by B0.5 (0.40 ± 0.01% DCW), B1.5 (0.36 ± 0.01% DCW), and B3.0 (0.32 ± 0.01% DCW) (p < 0.05).
In summary, the biochemical analysis showed that although all biomass constituents increased over time, their final composition was influenced by the concentration of NaHCO3. Protein and pigment contents were higher in cultures without bicarbonate supplementation, which exhibited slower growth and nutrient consumption, allowing the cultures to remain longer in the exponential phase and sustain the synthesis of these compounds. In contrast, cultures supplemented with higher bicarbonate concentrations entered the stationary phase earlier and therefore revealed decreased protein and pigment contents at the fixed sampling point, while carbohydrate and lipid levels at the time of harvest remained stable under all conditions. These results indicate that, under the tested conditions, NaHCO3 supplementation primarily affected growth kinetics rather than inducing the final accumulation of stress-related storage compounds, reinforcing its applicability as a simple strategy to enhance microalgal productivity.

3.5. Effect of Bicarbonate Supplementation on Biochemical Profiles

3.5.1. Fatty Acid Profile

Given the growing interest in microalgal biomass as a renewable feedstock for biodiesel production, evaluating fatty acid composition is crucial. Indeed, the structural characteristics of fatty acids, such as carbon chain length, degree of unsaturation, and number of double bonds, directly influence biodiesel properties. Therefore, assessing the impact of bicarbonate supplementation on fatty acid (FA) profiles becomes particularly relevant, given that the fuel properties of biodiesel, such as viscosity, cetane number, oxidative stability, and cold flow properties, are strongly affected by fatty acid composition [29,35]. Table 4 presents the fatty acid profile (% DCW) obtained under the different bicarbonate supplementation conditions. When comparing these values with the gravimetrically determined total lipid content, higher total fatty acid levels were observed. This discrepancy has been previously observed and arises from methodological variations, as solvent-based extraction techniques, like the Bligh and Dyer method, may result in incomplete recovery of all lipid fractions, whereas transesterification methods enable direct conversion and quantification of esterified fatty acids, typically yielding higher amounts of fatty acids [36,37].
Analysis of Table 4 demonstrates that C16 and C18 fatty acids were predominant in C. vulgaris, while all other fatty acids were present at levels below 1.5% DCW under all conditions studied. The principal fraction consisted mostly of C16:0 (palmitic acid), C18:1 (oleic acid), C18:2 (linoleic acid), and C18:3 (linolenic acid). This fatty acid profile is consistent with previous reports for C. vulgaris and resembles that commonly found in vegetable oils, which are widely used as biodiesel feedstocks [15]. Based on the sampling points, fatty acid accumulation was particularly pronounced under B3.0, with most compounds showing significantly higher levels at t11 compared to t0 (p < 0.05). When examining the impact of bicarbonate concentration on the fatty acid profile at t11, it was observed that, apart from C16:4 and C18:3, whose levels remained relatively constant across all conditions, the content of the remaining fatty acids increased with bicarbonate supplementation, reaching the highest values under B3.0. This effect was particularly pronounced for C18:1, which showed a progressive and significant increase with bicarbonate concentration, reaching up to a 5-fold increase under B3.0 (6.0 ± 0.1% DCW) compared to B0 (p < 0.05). Similar behaviour was reported by Lam and Lee [15], who also described an increase in oleic acid (C18:1) in C. vulgaris with rising bicarbonate concentrations. Additionally, Lohman et al. [14] observed that C. vulgaris cultures subjected to nitrogen depletion but without additional inorganic carbon supplementation produced approximately half the amount of C18:1 compared to cultures supplemented with 50 mM NaHCO3. These authors concluded that a substantial fraction of C18:1 synthesis was promoted by elevated DIC concentrations.
Finally, it can also be observed that total FA content increased with higher bicarbonate supplementation, reaching 22.1 ± 0.5% DCW in the B3.0 condition, since these cultures had already reached the stationary phase by day 11. Although this increase might appear to contrast with the stable total lipid content reported in Section 3.4, the discrepancy lies in the distinct nature of these two analytical approaches. In addition to polar lipids (glycolipids and phospholipids), microalgal extracts contain a significant fraction of neutral lipids, which are further classified into saponifiable (acylglycerols and free fatty acids) and unsaponifiable compounds (such as waxes, hydrocarbons, sterols, and pigments). Although these unsaponifiable components are co-extracted by organic solvents and contribute to the gravimetrically determined lipid content, they cannot be converted into FAMEs [38,39]. As a result, in non-supplemented conditions, higher levels of pigments likely contributed to maintaining a high total lipid content, despite lower fatty acid synthesis. Conversely, bicarbonate supplementation is consistent with an increase in the saponifiable fraction of the lipid pool, favouring the accumulation of transesterifiable fatty acids. Therefore, the different trends observed in total lipids and fatty acids reflect variations in lipid composition rather than a direct quantitative correspondence between the two measurements.
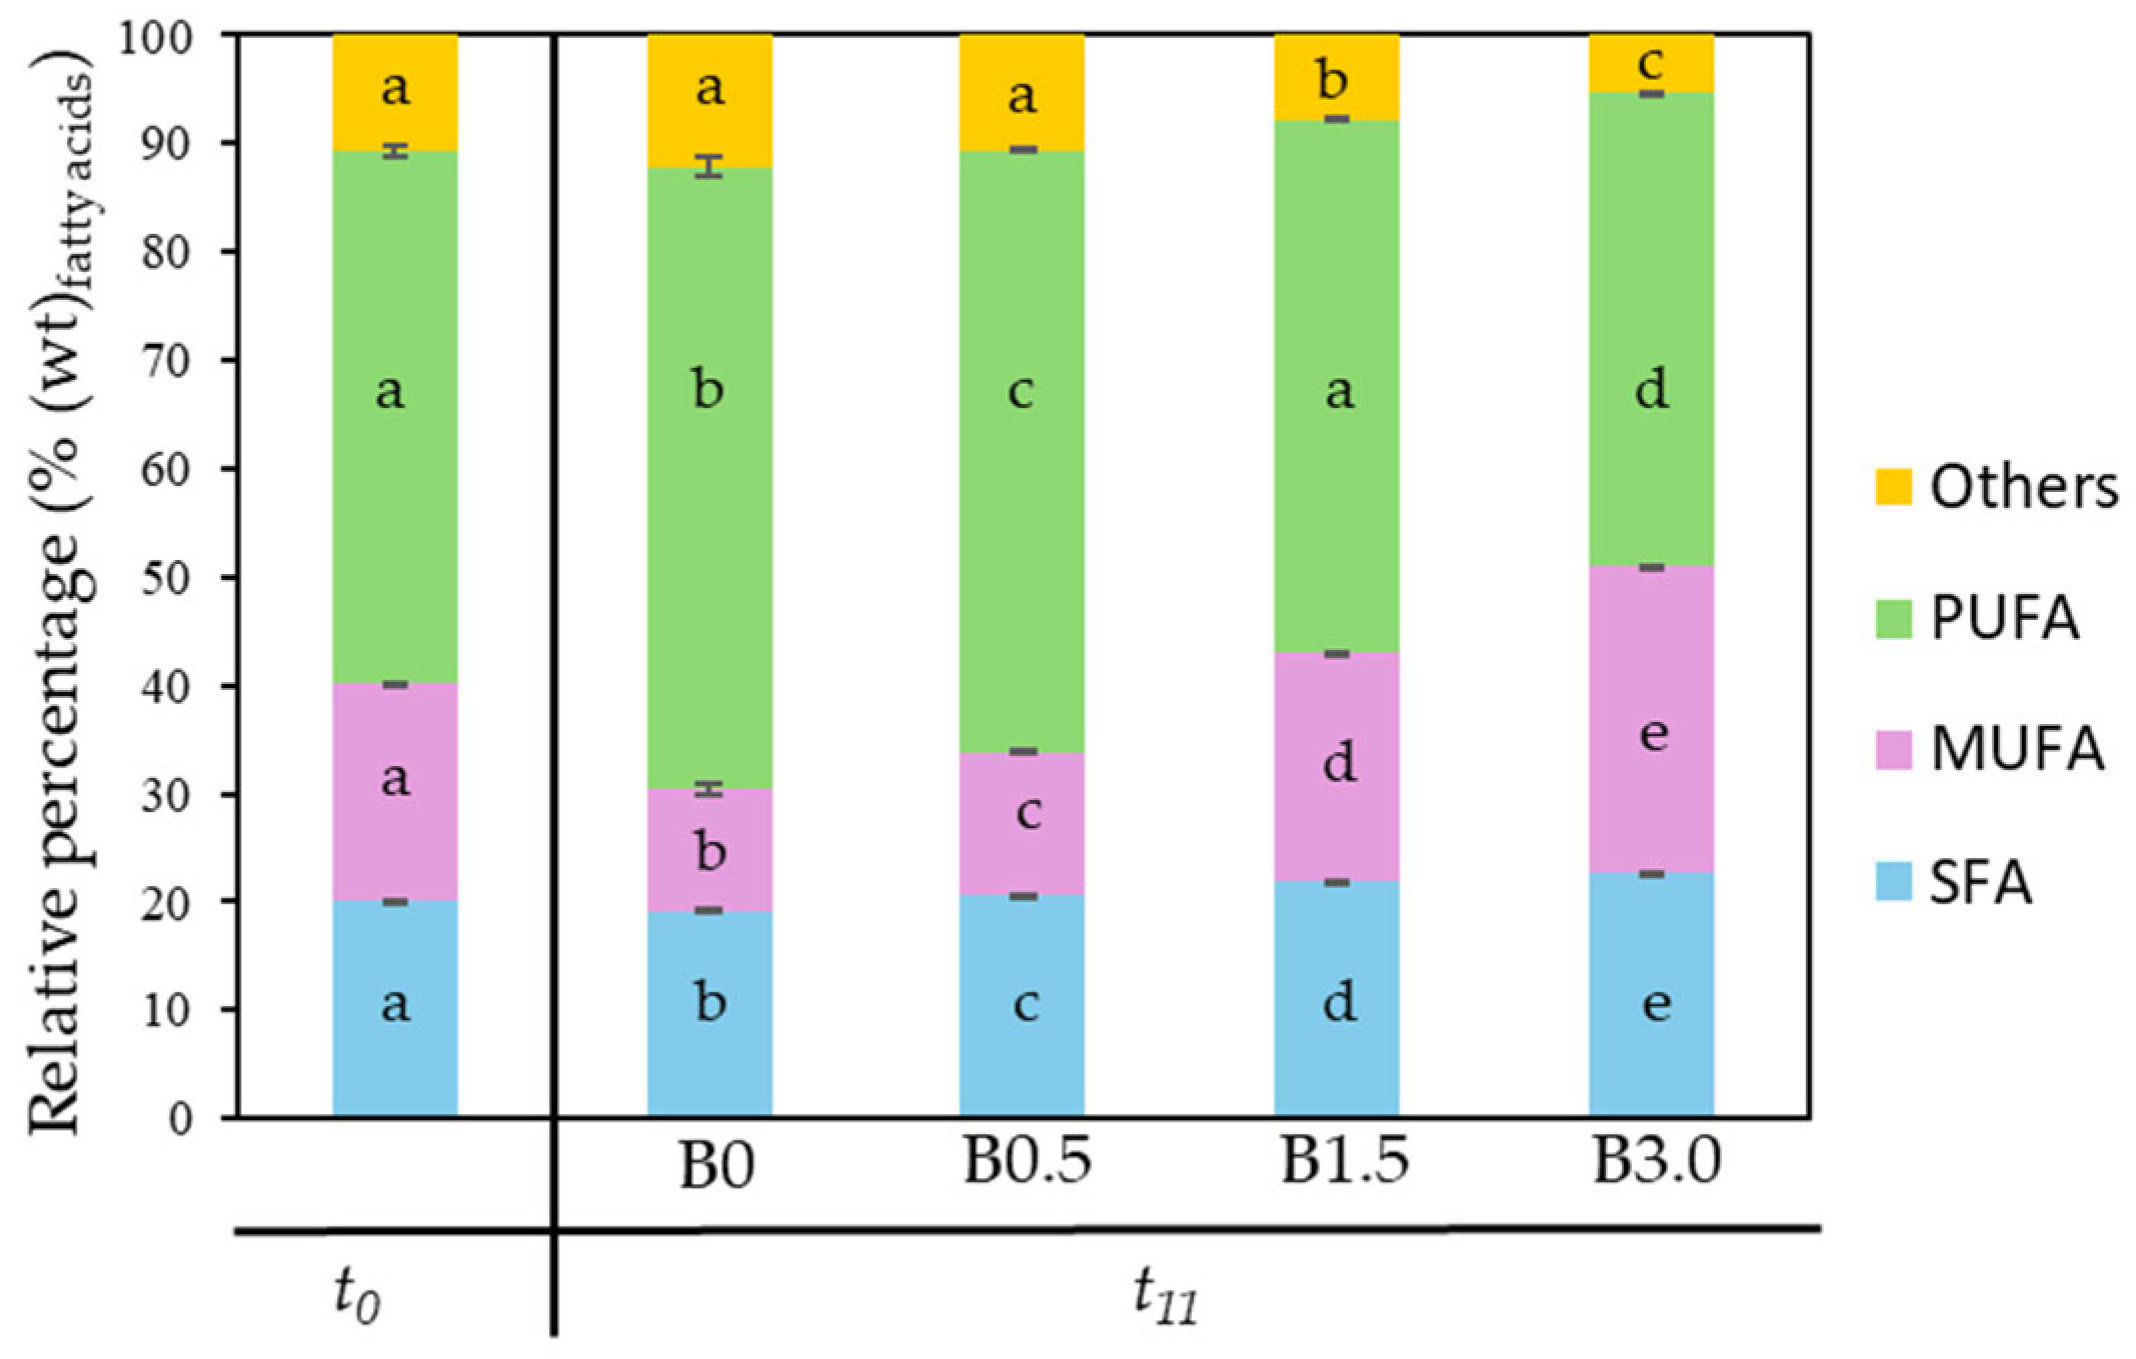
To further assess the potential use of the microalgal biomass for biodiesel production, fatty acids were classified according to their degree of saturation into saturated fatty acids (SFA), monounsaturated fatty acids (MUFA), and polyunsaturated fatty acids (PUFA), and the corresponding results are summarised in Figure 3. The degree of saturation strongly influences biodiesel performance. A higher proportion of SFA and MUFA is often associated with improved biodiesel properties, including higher cetane number, improved oxidative stability, enhanced combustion characteristics, and reduced emissions of hydrocarbons, carbon monoxide, nitric oxide and smoke. Conversely, although PUFA may improve cold flow properties, high levels of polyunsaturation compromise oxidative stability and energy yield, negatively affecting the combustion properties of biodiesel [3,35].
As shown in Figure 3, increasing bicarbonate supplementation led to a progressive decrease in the proportion of PUFA and a simultaneous increase in SFA and MUFA at t11. While PUFA proportion declined significantly from 57.5 ± 0.8% in B0 to 43.60 ± 0.05% in B3.0, SFA and MUFA showed the opposite trend, reaching 22.58 ± 0.04% and 28.45 ± 0.04% in B3.0, respectively, compared to 19.18 ± 0.05% and 11.2 ± 0.6% in B0 (p < 0.05). The observed shift towards a lower unsaturated fatty acid composition can be attributed to metabolic modifications in response to increased inorganic carbon availability and the physiological state of the culture at the time of harvest. Given that higher proportions of SFA and MUFA are generally associated with improved biodiesel quality, these results suggest that bicarbonate supplementation may enhance the suitability of the harvested C. vulgaris biomass for biodiesel production.

3.5.2. Amino Acid Profile

Microalgae are widely recognised for their high protein and nutritionally valuable amino acid (AA) profile [40]. Therefore, to evaluate the effect of different sodium bicarbonate concentrations on the protein composition of C. vulgaris, the amino acid profile was determined and is presented in Table 5.
As shown in Table 5, C. vulgaris biomass contained nine essential amino acids (EAA) and seven non-essential amino acids (NEAA), indicating its potential as a valuable protein source. Leucine (Leu), alanine (Ala), aspartic acid (Asp), and glutamic acid (Glu) were the most abundant amino acids detected, with Glu exhibiting the highest concentration overall, reaching 17.2 mg gdw−1 in B3.0 after 11 days of cultivation. Similar findings were reported by Kumar et al. [41], who also identified Asp, Glu, and Ala as the predominant amino acids in C. vulgaris. Examining the effect of cultivation time, most quantified amino acids showed significantly higher concentrations at t11 compared to their initial levels. The most notable exception was arginine (Arg), which remained statistically unchanged between t0 and t11 in B0.5, B1.5, and B3.0 (p > 0.05), while a slight decrease was observed in B0. For Glu and lysine (Lys), significant increases at t11 were observed only in B1.5 and B3.0, while Asp showed a statistically significant increase starting from B0.5. Regarding the effect of bicarbonate concentration, supplementation with 1.5 g L−1 bicarbonate (B1.5) resulted in higher contents of valine (Val), methionine (Met), isoleucine (Ile), and Leu compared to B0. For threonine (Thr), the increase was observed in B0.5 and B1.5, while Glu showed higher levels in B1.5 and B3.0 (p < 0.05). In contrast, proline (Pro) decreased in B3.0 compared to B0. Since Pro is synthesised from Glu and its production depends on nitrogen availability [40], its synthesis was largely limited in B3.0, where nitrogen was nearly depleted at t11, which consequently contributed to the observed increase in Glu. The total contents of both EAA and NEAA increased from t0 to t11, reaching their highest levels in B1.5 (54 ± 2 mg gdw−1 for EAA and 79 ± 2 mg gdw−1 for NEAA). Nevertheless, under the conditions tested, bicarbonate supplementation did not significantly affect their overall contents (p > 0.05).
C. vulgaris exhibited a nutritionally rich amino acid profile, with bicarbonate supplementation at 1.5 g L−1 (B1.5) promoting an increase in the content of several amino acids. However, the absence of a further increase in B3.0 at the time of sampling may be related to the growth phase of the culture. As previously discussed, microalgae in B3.0 entered the stationary phase earlier than those under the remaining conditions and exhibited lower nutrient availability at t11, which potentially triggered metabolic adjustments independent of bicarbonate concentration prior to harvest.
Future research should focus on the biochemical characterisation of biomass as a function of time throughout different growth stages (exponential and stationary). Investigating the dynamics of storage compounds (lipids and carbohydrates), as well as proteins and pigments, across these distinct stages will be essential to further elucidate the transient metabolic shifts and carbon partitioning triggered by bicarbonate supplementation, thereby providing a more robust understanding of microalgal physiological responses.

4. Conclusions

Sodium bicarbonate supplementation proved to be an effective strategy to mitigate inorganic carbon limitation, thereby enhancing the growth and biomass productivity of Chlorella vulgaris. In fact, increased inorganic carbon availability stimulated microalgal growth, accelerated nutrient removal, and promoted higher dissolved inorganic carbon uptake, leading to an earlier entry into the stationary phase at the highest bicarbonate concentration. From a biochemical perspective, under the conditions and sampling points of this study, bicarbonate supplementation did not result in a higher final content of carbohydrate and lipid. Instead, cultures supplemented with higher bicarbonate concentrations exhibited reduced protein and pigment levels at the end of the trial, consistent with a faster transition to the stationary phase. These findings indicate that under the tested conditions, bicarbonate supports balanced growth rather than triggering classical stress responses, such as the accumulation of reserve compounds. Nevertheless, bicarbonate supplementation modulated the metabolic profile, increasing monounsaturated fatty acids, particularly C18:1, thereby improving potential biodiesel quality. Additionally, moderate supplementation (1.5 g L−1) resulted in higher levels of some amino acids, reaching 54 ± 2 mg gdw−1 for EAA and 79 ± 2 mg gdw−1 for NEAA, reinforcing the impact of the growth phase on the final biochemical composition of the microalgae. Overall, the results underline the importance of inorganic carbon availability in C. vulgaris cultivation and demonstrate that bicarbonate supplementation is a viable approach to enhance biomass productivity, improve nutrient removal, and refine fatty acid quality for biotechnological applications.

Supplementary Materials

The following supporting information can be downloaded at: https://www.mdpi.com/article/10.3390/app16073279/s1, Table S1: Average biomass concentration (X, mg L−1) and corresponding ln(X/X0) values for Chlorella vulgaris cultivated under different sodium bicarbonate concentrations (B0 to B3.0) over 11 days; Figure S1: Semi-logarithmic growth curves of Chlorella vulgaris (ln(X/X0) vs time) cultivated under different bicarbonate concentrations (0 g L−1 (B0), 0.5 g L−1 (B0.5), 1.5 g L−1 (B1.5), and 3.0 g L−1 (B3.0)) over 11 days. Data represent mean ± standard deviation (n ≥ 3).

Author Contributions

Conceptualisation, A.F.E.; methodology, A.F.E.; validation, C.M., J.O. and A.F.E.; formal analysis, C.M., J.O. and A.F.E.; investigation, C.M., M.C., J.O. and A.F.E.; resources, S.C., T.G.T., J.C.M.P. and A.F.E.; data curation, C.M. and A.F.E.; writing—original draft preparation, C.M.; writing—review and editing, J.O., S.C., T.G.T., J.C.M.P. and A.F.E.; visualisation, C.M. and A.F.E.; supervision, A.F.E.; project administration, A.F.E.; funding acquisition, S.C., T.G.T., J.C.M.P. and A.F.E. All authors have read and agreed to the published version of the manuscript.

Funding

This work was financially supported by national funds through FCT/MECI: (i) project LightSound4Bio—Innovative Synergistic Stimuli for Microalgal Cultivation and Biomass Valorisation: Integrating Light, Acoustics, and AI-Driven Process Optimisation (ref.: 2024.13604.PEX), with DOI https://doi.org/10.54499/2024.13604.PEX; (ii) project SMART&GREEN: Towards Climate-Neutral Cities”, with operation code, at the Funds Platform (Balcão dos Fundos), NORTE2030-FEDER-02696100, co-financed by the European Union through the NORTE 2030 Regional Program of Portugal 2030; (iii) LEPABE, UID/00511/2025 (https://doi.org/10.54499/UID/00511/2025) and UID/PRR/00511/2025 (https://doi.org/10.54499/UID/PRR/00511/2025); (iv) ALiCE, LA/P/0045/2020 (https://doi.org/10.54499/LA/P/0045/2020), and (v) LAQV-REQUIMTE, UID/50006/2025 (https://doi.org/10.54499/UID/50006/2025). C. Maia and J. Oliveira thank FCT for the financial support of their work through the FCT PhD Research Scholarships 2023.04096.BD (DOI: 10.54499/2023.04096.BD) and 2025.00462.BD.

Institutional Review Board Statement

Not applicable.

Informed Consent Statement

Not applicable.

Data Availability Statement

The dataset is available upon request from the authors.

Conflicts of Interest

The authors declare no conflicts of interest.

Abbreviations

The following abbreviations are used in this manuscript:
AAAmino acid
AlaAlanine
ANOVAAnalysis of variance
ArgArginine
ATPAdenosine triphosphate
AspAspartic acid
CCMCO2-concentrating mechanisms
DCWDry cell weight
DICDissolved inorganic carbon
DOCDissolved organic carbon
EAAEssential amino acids
FAFatty acid
FAMEsFatty acid methyl esters
GluGlutamic acid
GlyGlycine
HisHistidine
HPLCHigh-performance liquid chromatography
IleIsoleucine
LEDsLight-emitting diodes
LeuLeucine
LysLysine
MetMethionine
MUFAMonounsaturated fatty acids
NEAANon-essential amino acids
ODOptical density
OECDOrganisation for Economic Co-operation and Development
PhePhenylalanine
ProProline
PUFAPolyunsaturated fatty acids
ROSReactive oxygen species
RuBisCoRibulose 1,5-bisphosphate carboxylase oxygenase
SerSerine
SFASaturated fatty acids
ThrThreonine
TyrTyrosine
ValValine

References

  1. Huang, W.-M.; Leong, Y.K.; Chen, J.-H.; Latagan, M.J.D.; Chen, C.-Y.; Lee, D.-J.; Chang, J.-S. Bicarbonate-based cultivation of Chlorella sorokiniana SU-1: Optimizing culture conditions and utilizing bicarbonate from flue gas chemical absorption. Chem. Eng. J. 2025, 503, 158651. [Google Scholar] [CrossRef]
  2. Kusi, P.A.; McGee, D.; Tabraiz, S.; Ahmed, A. Bicarbonate concentration influences carbon utilization rates and biochemical profiles of freshwater and marine microalgae. Biotechnol. J. 2024, 19, 2400361. [Google Scholar] [CrossRef]
  3. Bhandari, M.; Kharkwal, S.; Prajapati, S.K. Bicarbonate-assisted microalgae cultivation for drinking water RO reject recycling and bioproduct generation. Bioresour. Technol. Rep. 2024, 25, 101756. [Google Scholar] [CrossRef]
  4. White, D.; Pagarette, A.; Rooks, P.; Ali, S. The effect of sodium bicarbonate supplementation on growth and biochemical composition of marine microalgae cultures. J. Appl. Phycol. 2013, 25, 153–165. [Google Scholar] [CrossRef]
  5. Latagan, M.J.D.; Nagarajan, D.; Huang, W.-M.; de Luna, M.D.G.; Chen, J.-H.; Rollon, A.P.; Ng, I.-S.; Lee, D.-J.; Chang, J.-S. Bicarbonate-based microalgal cultivation technologies: Mechanisms, critical strategies, and future perspectives. Chem. Eng. J. 2024, 502, 157998. [Google Scholar] [CrossRef]
  6. Zhu, C.; Chen, S.; Ji, Y.; Schwaneberg, U.; Chi, Z. Progress toward a bicarbonate-based microalgae production system. Trends Biotechnol. 2022, 40, 180–193. [Google Scholar] [CrossRef] [PubMed]
  7. Ratomski, P.; Hawrot-Paw, M.; Koniuszy, A. Utilisation of CO2 from sodium bicarbonate to produce Chlorella vulgaris biomass in tubular photobioreactors for biofuel purposes. Sustainability 2021, 13, 9118. [Google Scholar] [CrossRef]
  8. Kim, G.-Y.; Heo, J.; Kim, K.; Chung, J.; Han, J.-I. Electrochemical pH control and carbon supply for microalgae cultivation. Chem. Eng. J. 2021, 426, 131796. [Google Scholar] [CrossRef]
  9. Eloka-Eboka, A.C.; Inambao, F.L. Effects of CO2 sequestration on lipid and biomass productivity in microalgal biomass production. Appl. Energy 2017, 195, 1100–1111. [Google Scholar] [CrossRef]
  10. Tu, Z.; Liu, L.; Lin, W.; Xie, Z.; Luo, J. Potential of using sodium bicarbonate as external carbon source to cultivate microalga in non-sterile condition. Bioresour. Technol. 2018, 266, 109–115. [Google Scholar] [CrossRef]
  11. Shen, Y.; Liao, L.; Wu, W.; Zhang, H.; Ran, X.; Xie, T.; Zhang, Y.; Yao, C. CO2-inorganic carbon auto-buffering system for efficient ammonium reclamation coupled with valuable biomass production in a euryhaline microalga Tetraselmis subcordiformis. Water 2023, 15, 1671. [Google Scholar] [CrossRef]
  12. Moroney, J.V.; Ynalvez, R.A. Proposed carbon dioxide concentrating mechanism in Chlamydomonas reinhardtii. Eukaryot. Cell 2007, 6, 1251–1259. [Google Scholar] [CrossRef]
  13. Kim, G.-Y.; Roh, K.; Han, J.-I. The use of bicarbonate for microalgae cultivation and its carbon footprint analysis. Green Chem. 2019, 21, 5053–5062. [Google Scholar] [CrossRef]
  14. Lohman, E.J.; Gardner, R.D.; Pedersen, T.; Peyton, B.M.; Cooksey, K.E.; Gerlach, R. Optimized inorganic carbon regime for enhanced growth and lipid accumulation in Chlorella vulgaris. Biotechnol. Biofuels 2015, 8, 82. [Google Scholar] [CrossRef] [PubMed]
  15. Lam, M.K.; Lee, K.T. Effect of carbon source towards the growth of Chlorella vulgaris for CO2 bio-mitigation and biodiesel production. Int. J. Greenh. Gas Control 2013, 14, 169–176. [Google Scholar] [CrossRef]
  16. Srinivasan, R.; Mageswari, A.; Subramanian, P.; Suganthi, C.; Chaitanyakumar, A.; Aswini, V.; Gothandam, K.M. Bicarbonate supplementation enhances growth and biochemical composition of Dunaliella salina V-101 by reducing oxidative stress induced during macronutrient deficit conditions. Sci. Rep. 2018, 8, 6972. [Google Scholar] [CrossRef]
  17. Sampathkumar, S.J.; Gothandam, K.M. Sodium bicarbonate augmentation enhances lutein biosynthesis in green microalgae Chlorella pyrenoidosa. Biocatal. Agric. Biotechnol. 2019, 22, 101406. [Google Scholar] [CrossRef]
  18. Esteves, A.F.; Gonçalves, A.L.; Vilar, V.J.; Pires, J.C. Comparative assessment of microalgal growth kinetic models based on light intensity and biomass concentration. Bioresour. Technol. 2024, 394, 130167. [Google Scholar] [CrossRef]
  19. Collos, Y.; Mornet, F.; Sciandra, A.; Waser, N.; Larson, A.; Harrison, P. An optical method for the rapid measurement of micromolar concentrations of nitrate in marine phytoplankton cultures. J. Appl. Phycol. 1999, 11, 179–184. [Google Scholar] [CrossRef]
  20. Lee, B.-H.; Park, S.-Y.; Heo, Y.-S.; Yea, S.-S.; Kim, D.-E. Efficient colorimetric assay of RNA polymerase activity using inorganic pyrophosphatase and ammonium molybdate. Bull. Korean Chem. Soc. 2009, 30, 2485–2488. [Google Scholar] [CrossRef]
  21. Esteves, A.F.; Pardilho, S.; Gonçalves, A.L.; Vilar, V.J.; Pires, J.C. Unravelling the impact of light spectra on microalgal growth and biochemical composition using principal component analysis and artificial neural network models. Algal Res. 2025, 85, 103820. [Google Scholar] [CrossRef]
  22. Lichtenthaler, H.K. [34] Chlorophylls and carotenoids: Pigments of photosynthetic biomembranes. In Methods in Enzymology; Elsevier: Amsterdam, The Netherlands, 1987; Volume 148, pp. 350–382. [Google Scholar]
  23. Pinto, A.S.; Maia, C.; Sousa, S.A.; Tavares, T.; Pires, J.C. Amino acid and carotenoid profiles of Chlorella vulgaris during two-stage cultivation at different salinities. Bioengineering 2025, 12, 284. [Google Scholar] [CrossRef]
  24. Pagels, F.; Amaro, H.M.; Tavares, T.G.; Casal, S.; Malcata, F.X.; Sousa-Pinto, I.; Guedes, A.C. Effects of irradiance of red and blue: Red LEDs on Scenedesmus obliquus M2-1 optimization of biomass and high added-value compounds. J. Appl. Phycol. 2021, 33, 1379–1388. [Google Scholar] [CrossRef]
  25. Pancha, I.; Chokshi, K.; Ghosh, T.; Paliwal, C.; Maurya, R.; Mishra, S. Bicarbonate supplementation enhanced biofuel production potential as well as nutritional stress mitigation in the microalgae Scenedesmus sp. CCNM 1077. Bioresour. Technol. 2015, 193, 315–323. [Google Scholar] [CrossRef]
  26. Mokashi, K.; Shetty, V.; George, S.A.; Sibi, G. Sodium bicarbonate as inorganic carbon source for higher biomass and lipid production integrated carbon capture in Chlorella vulgaris. Achiev. Life Sci. 2016, 10, 111–117. [Google Scholar] [CrossRef]
  27. Kim, G.-Y.; Heo, J.; Kim, H.-S.; Han, J.-I. Bicarbonate-based cultivation of Dunaliella salina for enhancing carbon utilization efficiency. Bioresour. Technol. 2017, 237, 72–77. [Google Scholar] [CrossRef]
  28. Liu, X.; Ying, K.; Chen, G.; Zhou, C.; Zhang, W.; Zhang, X.; Cai, Z.; Holmes, T.; Tao, Y. Growth of Chlorella vulgaris and nutrient removal in the wastewater in response to intermittent carbon dioxide. Chemosphere 2017, 186, 977–985. [Google Scholar] [CrossRef] [PubMed]
  29. Agbebi, T.V.; Ojo, E.O.; Watson, I.A. Towards optimal inorganic carbon delivery to microalgae culture. Algal Res. 2022, 67, 102841. [Google Scholar] [CrossRef]
  30. Rodriguez-Maroto, J.; Jiménez, C.; Aguilera, J.; Niell, F. Air bubbling results in carbon loss during microalgal cultivation in bicarbonate-enriched media: Experimental data and process modeling. Aquac. Eng. 2005, 32, 493–508. [Google Scholar] [CrossRef]
  31. Zhang, Y.; Ai, S.; Chen, X.; Zhao, Y.; Zhang, Y.; Wu, C.; Ma, C.; Tang, Z.; Yu, D.; Yao, C. The accumulation and inhibition mechanism of extracellular polymeric substances of Chlorella vulgaris during cycling cultivation under different light qualities. J. Environ. Manag. 2024, 371, 123176. [Google Scholar] [CrossRef]
  32. Kumari, K.; Samantaray, S.; Sahoo, D.; Tripathy, B.C. Nitrogen, phosphorus and high CO2 modulate photosynthesis, biomass and lipid production in the green alga Chlorella vulgaris. Photosynth. Res. 2021, 148, 17–32. [Google Scholar] [CrossRef]
  33. Sui, Y.; Muys, M.; Vermeir, P.; D’Adamo, S.; Vlaeminck, S.E. Light regime and growth phase affect the microalgal production of protein quantity and quality with Dunaliella salina. Bioresour. Technol. 2019, 275, 145–152. [Google Scholar] [CrossRef]
  34. da Silva Ferreira, V.; Sant’Anna, C. Impact of culture conditions on the chlorophyll content of microalgae for biotechnological applications. World J. Microbiol. Biotechnol. 2017, 33, 20. [Google Scholar] [CrossRef]
  35. Pekkoh, J.; Ruangrit, K.; Aurepatipan, N.; Duangjana, K.; Sensupa, S.; Pumas, C.; Chaichana, C.; Pathom-aree, W.; Kato, Y.; Srinuanpan, S. CO2 to green fuel converter: Photoautotrophic-cultivation of microalgae and its lipids conversion to biodiesel. Renew. Energy 2024, 222, 119919. [Google Scholar] [CrossRef]
  36. Kumar, V.; Muthuraj, M.; Palabhanvi, B.; Ghoshal, A.K.; Das, D. Evaluation and optimization of two stage sequential in situ transesterification process for fatty acid methyl ester quantification from microalgae. Renew. Energy 2014, 68, 560–569. [Google Scholar] [CrossRef]
  37. Griffiths, M.; Van Hille, R.; Harrison, S. Selection of direct transesterification as the preferred method for assay of fatty acid content of microalgae. Lipids 2010, 45, 1053–1060. [Google Scholar] [CrossRef]
  38. Callejón, M.J.J.; Medina, A.R.; Sánchez, M.D.M.; Peña, E.H.; Cerdán, L.E.; Moreno, P.A.G.; Grima, E.M. Extraction of saponifiable lipids from wet microalgal biomass for biodiesel production. Bioresour. Technol. 2014, 169, 198–205. [Google Scholar] [CrossRef]
  39. Egesa, D.; Plucinski, P. Efficient extraction of lipids from magnetically separated microalgae using ionic liquids and their transesterification to biodiesel. Biomass Convers. Biorefin. 2024, 14, 419–434. [Google Scholar] [CrossRef]
  40. León-Vaz, A.; Giráldez, I.; Moreno-Garrido, I.; Varela, J.; Vigara, J.; León, R.; Canavate, J.P. Amino acids profile of 56 species of microalgae reveals that free amino acids allow to distinguish between phylogenetic groups. Algal Res. 2023, 74, 103181. [Google Scholar] [CrossRef]
  41. Kumar, A.; Rajeshwaree, B.; Sharma, A.; Majumder, P.; Vishal, V.; Dutta, A. Carbon dioxide to bicarbonate conversion using synthetic zinc-based metal complex for improved carbon fixation and biomass productivity in Chlorella vulgaris. J. Environ. Chem. Eng. 2025, 13, 119016. [Google Scholar] [CrossRef]
Figure 1. Growth curves of C. vulgaris cultivated under different bicarbonate concentrations over 11 days. Data represent mean ± standard deviation (n ≥ 3).
Applsci 16 03279 g001
Figure 2. Impact of bicarbonate concentration (g L−1) on the removal efficiency (RE) of: (a) NO3-N and (b) PO4-P after 4 (t4) and 11 (t11) days of cultivation. For each nutrient, values sharing the same letter are not statistically different from one another (p > 0.05).
Applsci 16 03279 g002
Figure 3. Relative distribution (%) of saturated (SFA), monounsaturated (MUFA) and polyunsaturated fatty acids (PUFA) in Chlorella vulgaris lipids, cultivated under different bicarbonate concentrations at t0 and t11. Others: cumulative sum of non-identified fatty acids and identified fatty acids whose relative percentage is below 1.0% of the total fatty acid content. In bars of the same colour, different letters indicate significant differences (p < 0.05).
Applsci 16 03279 g003
Table 1. Chlorella vulgaris growth parameters obtained with the different bicarbonate concentrations supplemented.
AssayXmax (mg L−1)µ (d−1)PX,max (mg L−1 d−1)Pavg (mg L−1 d−1)
B0847 ± 36 a0.27 ± 0.02 a93 ± 3 a66 ± 4 a
B0.5859 ± 75 a0.34 ± 0.03 b114.6 ± 0.9 b66 ± 7 a
B1.5892 ± 44 a0.41 ± 0.01 c116 ± 2 b70 ± 4 a
B3.01003 ± 15 b0.472 ± 0.004 d153 ± 3 c80 ± 1 b
μ: specific growth rate; Pavg: average biomass productivity; PX,max: maximum daily biomass productivity; Xmax: maximum biomass concentration. Data represent mean ± SD (n ≥ 3). The numbers in the same column that share the same letter (a, b, c and d) are not statistically different from one another (p > 0.05).
Table 2. Dissolved inorganic carbon (DIC) and dissolved organic carbon (DOC) concentrations at the beginning (t0) and end (t11) of cultivation, including DIClost (abiotic control) and DICconsumed attributed to microalgal activity.
B0B0.5B1.5B3.0
D I C t 0 (mg L−1)2.65 ± 0.07 a54 ± 4 b199 ± 7 c399 ± 3 d
D I C t 11 (mg L−1)3.9 ± 0.1 a8.4 ± 0.6 b17 ± 1 c35 ± 3 d
D I C l o s t (mg L−1)-19.8 ± 0.1 a111.7 ± 0.6 b270 ± 1 c
D I C c o n s u m e d (mg L−1)-25 ± 3 a71 ± 5 b93 ± 6 c
D O C t 0 (mg L−1)2.5 ± 0.21.80 ± 0.05NDND
D O C t 11 (mg L−1)55 ± 1 a46 ± 4 a79 ± 3 b92 ± 12 c
ND: not detected. For each parameter, values that share the same letter are not statistically different from one another (p > 0.05).
Table 3. Biochemical composition of Chlorella vulgaris biomass under different bicarbonate concentrations at t0 and t11.
Content (% DCW)Assayt0t11
CarbohydratesB014.4 ± 0.5 a21.1 ± 0.7 b
B0.522 ± 2 b
B1.522.3 ± 0.4 b
B3.021.96 ± 0.05 b
LipidsB04 ± 1 a9.4 ± 0.4 b
B0.58.7 ± 0.1 b
B1.58.2 ± 0.4 b
B3.08.0 ± 0.4 b
ProteinsB011.0 ± 0.3 a20 ± 1 b
B0.514 ± 1 c
B1.513.6 ± 0.6 c
B3.011.8 ± 0.7 a
Chlorophyll a + bB00.348 ± 0.008 a1.32 ± 0.06 b
B0.51.01 ± 0.04 c
B1.50.87 ± 0.03 d
B3.00.63 ± 0.03 e
CarotenoidsB00.06 ± 0.01 a0.44 ± 0.03 b
B0.50.40 ± 0.01 c
B1.50.36 ± 0.01 d
B3.00.32 ± 0.01 e
For each biomass compound, values that share the same letter are not statistically different from one another (p > 0.05).
Table 4. Fatty acid profile of Chlorella vulgaris biomass cultivated under different bicarbonate concentrations at t0 and t11.
Fatty AcidFatty Acid Content (% DCW)
t0t11
B0B0.5B1.5B3.0
C162.6 ± 0.1 a2.31 ± 0.02 a2.5 ± 0.2 a3.18 ± 0.07 b4.5 ± 0.1 c
C16:10.34 ± 0.01 a0.165 ± 0.009 b0.17 ± 0.01 b0.197 ± 0.003 b0.267 ± 0.002 c
C16:20.49 ± 0.03 a,b0.468 ± 0.004 a0.57 ± 0.03 b0.75 ± 0.02 c1.00 ± 0.02 d
C16:40.23 ± 0.008 a1.13 ± 0.07 b1.04 ± 0.06 b0.91 ± 0.02 c1.08 ± 0.02 b
C18NDND0.132 ± 0.006 a0.277 ± 0.002 b0.48 ± 0.01 c
C18:12.2 ± 0.1 a1.18 ± 0.06 b1.55 ± 0.09 c3.10 ± 0.07 d6.0 ± 0.1 e
C18:22.8 ± 0.1 a1.54 ± 0.09 b1.82 ± 0.11 b2.56 ± 0.05 a3.57 ± 0.08 c
C18:32.8 ± 0.1 a3.78 ± 0.09 b,c3.8 ± 0.2 b,c3.53 ± 0.07 b4.00 ± 0.09 c
Others1.38 ± 0.04 a,b1.46 ± 0.06 b1.37 ± 0.09 a,b1.22 ± 0.03 a,c1.19 ± 0.02 c
Total12.9 ± 0.5 a12.0 ± 0.1 a12.9 ± 0.8 a15.7 ± 0.3 b22.1 ± 0.5 c
ND: not detected; Others: cumulative sum of non-identified fatty acids and identified fatty acids whose relative percentage is below 1.0% of the total fatty acid content. For each fatty acid, values that share the same letter are not statistically different from one another (p > 0.05).
Table 5. Amino acid profile of Chlorella vulgaris biomass cultivated under different bicarbonate concentrations at t0 and t11.
Amino AcidAmino Acid Content (mg gdw−1)
t0t11
B0B0.5B1.5B3.0
Essential
His1.7 ± 0.1 a2.37 ± 0.08 b2.6 ± 0.3 b2.7 ± 0.1 b2.42 ± 0.07 b
Thr4.1 ± 0.2 a5.31 ± 0.07 b5.7 ± 0.5 c6.2 ± 0.2 c5.6 ± 0.2 b
Pro4.4 ± 0.4 a7.2 ± 0.1 b7.5 ± 0.9 b6.7 ± 0.4 b,c6.1 ± 0.2 c
Val5.3 ± 0.5 a7.19 ± 0.09 b7.7 ± 0.7 b,c8.5 ± 0.4 c8.0 ± 0.4 b,c
Met1.5 ± 0.1 a2.1 ± 0.3 b2.7 ± 0.3 b,c2.8 ± 0.3 c2.4 ± 0.2 b,c
Lys5.6 ± 0.6 a6.4 ± 0.3 a,b6.7 ± 0.6 a,b7.6 ± 0.3 b7.8 ± 0.2 b
Ile3.4 ± 0.3 a4.67 ± 0.05 b5.1 ± 0.5 b,c5.6 ± 0.3 c5.3 ± 0.2 b,c
Leu8.0 ± 0.7 a10.7 ± 0.1 b12 ± 1 b,c12.6 ± 0.6 c11.8 ± 0.5 b,c
Phe4.7 ± 0.4 a6.7 ± 0.2 b7.4 ± 0.9 b7.6 ± 0.2 b6.8 ± 0.2 b
Non-essential
Asp9.0 ± 0.9 a9.9 ± 0.3 a,b10.3 ± 0.9 b11.3 ± 0.4 b11.9 ± 0.6 b
Ser3.9 ± 0.3 a5.2 ± 0.1 b5.6 ± 0.5 b6.2 ± 0.2 b5.6 ± 0.2 b
Glu12 ± 1 a13.7 ± 0.7 a15 ± 1 a,b17.1 ± 0.5 b17.2 ± 0.7 b
Gly5.5 ± 0.3 a7.6 ± 0.1 b8.3 ± 0.9 b8.7 ± 0.4 b8.0 ± 0.3 b
Arg8.6 ± 0.6 a6.97 ± 0.02 b7.7 ± 0.6 a,b8.1 ± 0.3 a,b7.6 ± 0.2 a,b
Ala10.3 ± 0.7 a13.2 ± 0.3 b14 ± 1 b15.0 ± 0.4 b14.5 ± 0.9 b
Tyr3.3 ± 0.2 a5.2 ± 0.3 b,c5.5 ± 0.7 b,c5.6 ± 0.2 b4.8 ± 0.2 c
Total EAA35 ± 2 a45.5 ± 0.6 b49 ± 6 b,c54 ± 2 c51 ± 1 b,c
Total NEAA58 ± 4 a69 ± 1 b74 ± 7 b79 ± 2 b77 ± 2 b
EAA—essential amino acids; NEAA—non-essential amino acids. For each amino acid, values that share the same letter are not statistically different from one another (p > 0.05).
Disclaimer/Publisher’s Note: The statements, opinions and data contained in all publications are solely those of the individual author(s) and contributor(s) and not of MDPI and/or the editor(s). MDPI and/or the editor(s) disclaim responsibility for any injury to people or property resulting from any ideas, methods, instructions or products referred to in the content.