1. Introduction
Augmented reality (AR) is rapidly emerging as a core capability for intelligent transportation systems, offering not only immersive infotainment but also cooperative perception and advanced driver assistance. The usage of AR head-up displays (ARHUDs) [
1,
2] enables new possibilities, such as showing safety-critical emergency messages, road accidents and condition alerts, and advertisements of nearby shops and services such as restaurants, cafes, bookshops, and banks to the drivers and passengers of the passing vehicles. This increases the immersive user experience of drivers and passengers without sacrificing focus on the road. Yet deploying AR in vehicular settings remains challenging. Unlike traditional content, AR overlays demand high reliability and strict spatial relevance i.e., the content must match vehicles current location. These requirements are difficult to meet when vehicles move quickly through network coverage areas, experience unstable channels, or generate diverse traffic loads [
3].
A promising way to address these challenges is by moving computation closer to vehicles. Multi-access edge computing (MEC) at roadside units (RSUs), supported by UAV-mounted MEC servers deployed on demand, enables reduced end-to-end delays, stronger service continuity, and more context-aware scheduling decisions [
4,
5]. Such architectures allow proactive assignments, where vehicles can be linked to RSUs or UAV nodes based on predicted trajectories. This ensures that both emergency messages and AR resources arrive before their relevance expires. This integration of terrestrial and aerial MEC infrastructure establishes a dynamic computing environment capable of adapting to rapid vehicular movements and fluctuating traffic demands. Moreover, by exploiting vehicle mobility prediction, these MEC entities can prefetch time-critical or location-specific AR contents before vehicles enter their coverage zones. This minimizes transmission latency and backhaul load. Consequently, it lays the foundation for intelligent, delay-sensitive service delivery crucial for next-generation AR-based vehicular applications.
The coexistence of heterogeneous content types complicates resource management further. Emergency traffic typically consists of short but time-critical alerts, sometimes followed by supplementary images or sensor readings, and must be delivered within hundreds of milliseconds to avoid accidents [
6]. In contrast, AR services—such as point-of-interest overlays or targeted advertisements—require the transfer of larger data [
7] with more flexible deadlines. Balancing these diverse demands is challenging. Ensuring proper transmission of safety traffic can harm the quality of AR services. On the other hand prioritizing AR may compromise road safety.
Although a large body of work on scheduling in vehicular and UAV-assisted MEC systems exists, most solutions are specialized—either focusing on latency guarantees for emergency traffic [
8,
9,
10] or maximizing throughput for infotainment and AR services [
11,
12]. Only recently have researchers started to investigate integrated frameworks that jointly consider mobility, deadlines, and RSU/UAV coverage in heterogeneous traffic environments [
13]. Recent studies have also explored joint scheduling and resource coordination in vehicular networks, including joint V2I/V2V scheduling, reinforcement-learning-based joint resource allocation in UAV-assisted V2X systems, and game-theoretic vehicle selection with channel scheduling in vehicular edge networks [
14,
15,
16]. This motivates the development of adaptive, priority-aware scheduling frameworks capable of handling both safety-critical and AR workloads simultaneously.
In this paper, we propose a multi-server, multi-user MEC-enabled vehicular network architecture that integrates RSUs. We formulate joint RSU assignment and transmission scheduling as an NP-hard optimization problem and design efficient solutions. Specifically, we introduce a penalty-minimizing RSU selection (PMRS) algorithm for assigning requested content (hereafter referred to as ‘content’) to RSUs. And one scheduling scheme, deadline-aware priority scheduling (DAPS), that prioritizes emergency traffic while opportunistically serving AR content. The basic objective of this work is to jointly decide where each content should be served and in what order the assigned contents should be transmitted, so that emergency traffic can satisfy strict deadline requirements while AR traffic is delivered efficiently.
The PMRS algorithm assigns each content to the RSU that yields the lowest penalty value. The penalty reflects both deadline violations and coverage duration violations associated with that content at a given RSU. For each content, the algorithm evaluates the penalty across all candidate RSUs and selects the RSU that minimizes this value. The DAPS algorithm operates in two phases. In the first phase, emergency short messages are scheduled using the earliest-deadline-first strategy to ensure that the most time-critical traffic is transmitted properly. In the second phase, a simulated annealing-based approach is applied to schedule AR contents and supplementary emergency messages. Through this two-phase process, DAPS guarantees low runtime latency for short emergency messages with the shortest deadlines, while simultaneously achieving near-optimal performance for AR and supplementary contents.
To benchmark the performance of the proposed algorithms, metaheuristic and heuristic approaches are employed. The metaheuristic methods include genetic algorithm and simulated annealing, while the heuristic baselines consist of a greedy-based algorithm called heuristic scored scheduler (HSS), earliest-deadline-first (EDF), shortest job first (SJF), and shortest transmission first (STxF). Through extensive simulations, it is observed that the proposed approach substantially improves the timeliness of emergency messages while enhancing the delivery quality of AR services.
The main contributions of this work are summarized as follows:
A joint optimization framework is developed for RSU assignment and transmission scheduling in MEC-enabled vehicular networks with heterogeneous traffic, including emergency short messages, supplementary emergency contents, and AR data with different sizes, priorities, and deadline requirements.
The RSU assignment problem is modeled by jointly considering deadline violations and coverage duration violations. Based on this formulation, the PMRS algorithm is proposed to assign each content to the most suitable RSU by minimizing the associated penalty.
A two-phase deadline-aware priority scheduling algorithm, DAPS, is proposed for transmission scheduling. In the first phase, emergency short messages are served using earliest-deadline-first scheduling. In the second phase, AR contents and supplementary emergency messages are scheduled using a simulated annealing-based search to improve queue ordering.
Extensive simulation results show that the proposed PMRS + DAPS framework achieves higher deadline hit ratios and lower delays than conventional heuristic and metaheuristic baseline methods under realistic vehicular mobility and traffic conditions.
The remaining part of this paper is organized as follows:
Section 2 discusses related works. The system model and problem formulation are studied in
Section 3 and
Section 4, respectively.
Section 5 presents the proposed algorithms. The performance of the proposed algorithms is demonstrated through simulation in
Section 6. Finally,
Section 7 concludes this paper.
2. Related Work
Augmented reality (AR) services and emergency message dissemination are increasingly intertwined in connected vehicular systems, shaping both safety and quality of experience (QoE). Modern AR head-up displays (HUDs) and windshield overlays promise richer situational awareness, navigation aids, and infotainment, but they impose tight constraints on end-to-end delay and jitter to avoid perceptual artifacts and motion discomfort [
17,
18]. At the same time, emergency short messages (e.g., ETSI CAM and DENM) has strict delivery-time requirements and reliability requirements, since stale or missing messages can have a significant safety impact [
19]. Beyond short messages, deployments increasingly attach context (e.g., video frames or sensor snippets) after the initial warning, creating mixed traffic comprised of ultra-short, deadline-critical control messages plus follow-up large payloads [
20]. Finally, vehicular video/AR streaming itself has grown more prevalent, amplifying throughput and caching pressure around hotspots such as intersections and urban canyons [
21].
To improve timeliness, MEC-equipped RSUs place compute, storage, and scheduling intelligence at the roadside, cutting round-trip latency and enabling locality-aware control for safety and AR services [
22]. Moreover, RSUs can pre-cache large AR assets (e.g., 3D tiles, landmarks, scene overlays) and prefetch along predicted routes, which reduces misses during handovers and peak demand times [
23,
24]. Multi-RSU installments increase these benefits but require seamless handover and coordination, especially when vehicles travel through overlapping coverage areas; recent work explores RSU-centric, multi-agent coordination for handovers and content placement to keep the latency low, even under high mobility [
25].
A rich body of literature addresses RSU assignment, resource allocation, and scheduling for vehicular traffic. On deployment planning, Zeng and He [
26] cast RSU placement as a stochastic optimization that explicitly incorporates RSU failure probabilities within a mixed-traffic equilibrium, trading off coverage and reliability under cost constraints; León et al. [
27] target urban IEEE 802.11p [
28] networks and optimize RSU locations using traffic and propagation characteristics to maximize connectivity and coverage given a budget; and Deng et al. [
29] formulate a multi-objective model for intelligent expressways that adapts RSU placement to time-varying traffic, solving for Pareto-optimal trade-offs between cost, coverage quality, and adaptability. In vehicular edge computing, da Costa et al. [
30] design a mobility- and deadline-aware task scheduling/offloading mechanism that couples predicted vehicle trajectories with queue-aware deadlines to reduce deadline misses, while Jamil et al. [
31] learn online, priority- and deadline-aware resource allocation via deep reinforcement learning (actor–critic), shaping rewards around latency and drops to meet strict QoS. More recent studies have moved toward joint scheduling-oriented vehicular designs. For example, joint content-prefetching, transmission scheduling, and rate adaptation have been investigated for delay-sensitive vehicular content delivery [
32]; joint relay selection and transmission scheduling have been studied in UAV-aided mmWave vehicular networks [
33]; and joint vehicle platooning with data transmission scheduling has been considered in MEC-enabled cooperative vehicle–infrastructure systems [
34]. Complementing these point solutions, surveys and frameworks synthesize MEC-enabled designs across heterogeneous networks, offloading, and radio/computation resource management: Liu et al. [
22] review VEC architectures and task-offloading models; Noor-A-Rahim et al. [
35] and Nair-Tanwar [
36] systematize resource allocation strategies and open challenges in V2X; and Akter et al. [
37] illustrate joint optimization across trajectory planning, offloading, and resource allocation in emergency/mission-critical settings, highlighting the benefits of MEC-enabled systems.
Despite this progress, joint, priority-aware multi-RSU assignment and scheduling for coexisting AR and emergency traffic remains underexplored. Most studies optimize one service class at a time (e.g., safety messages or video/AR) or treat them with independent schedulers. Thus, missing cross-traffic couplings such as preemptive emergency messages colliding with sustained AR overlays and their cached asset fetches [
35,
36,
38]. While several works are deadline-aware or mobility-aware, they often stop short of co-optimizing the (i) RSU association set (possibly multi-RSU), and (ii) priority-conscious scheduling that determine whether AR continuity and emergency deadlines can both be guaranteed under rapid handovers [
30]. Moreover, recent joint scheduling studies mainly emphasize content distribution efficiency, transmission coordination, or broader resource allocation rather than explicitly handling mixed emergency and AR traffic with differentiated urgency, content sizes, and service deadlines [
15,
32,
33]. These gaps motivate algorithms that explicitly couple RSU assignment with priority-aware, deadline-constrained scheduling, to preserve AR continuity without compromising the ultra-low latency requirements of emergency alerts.
3. System Model
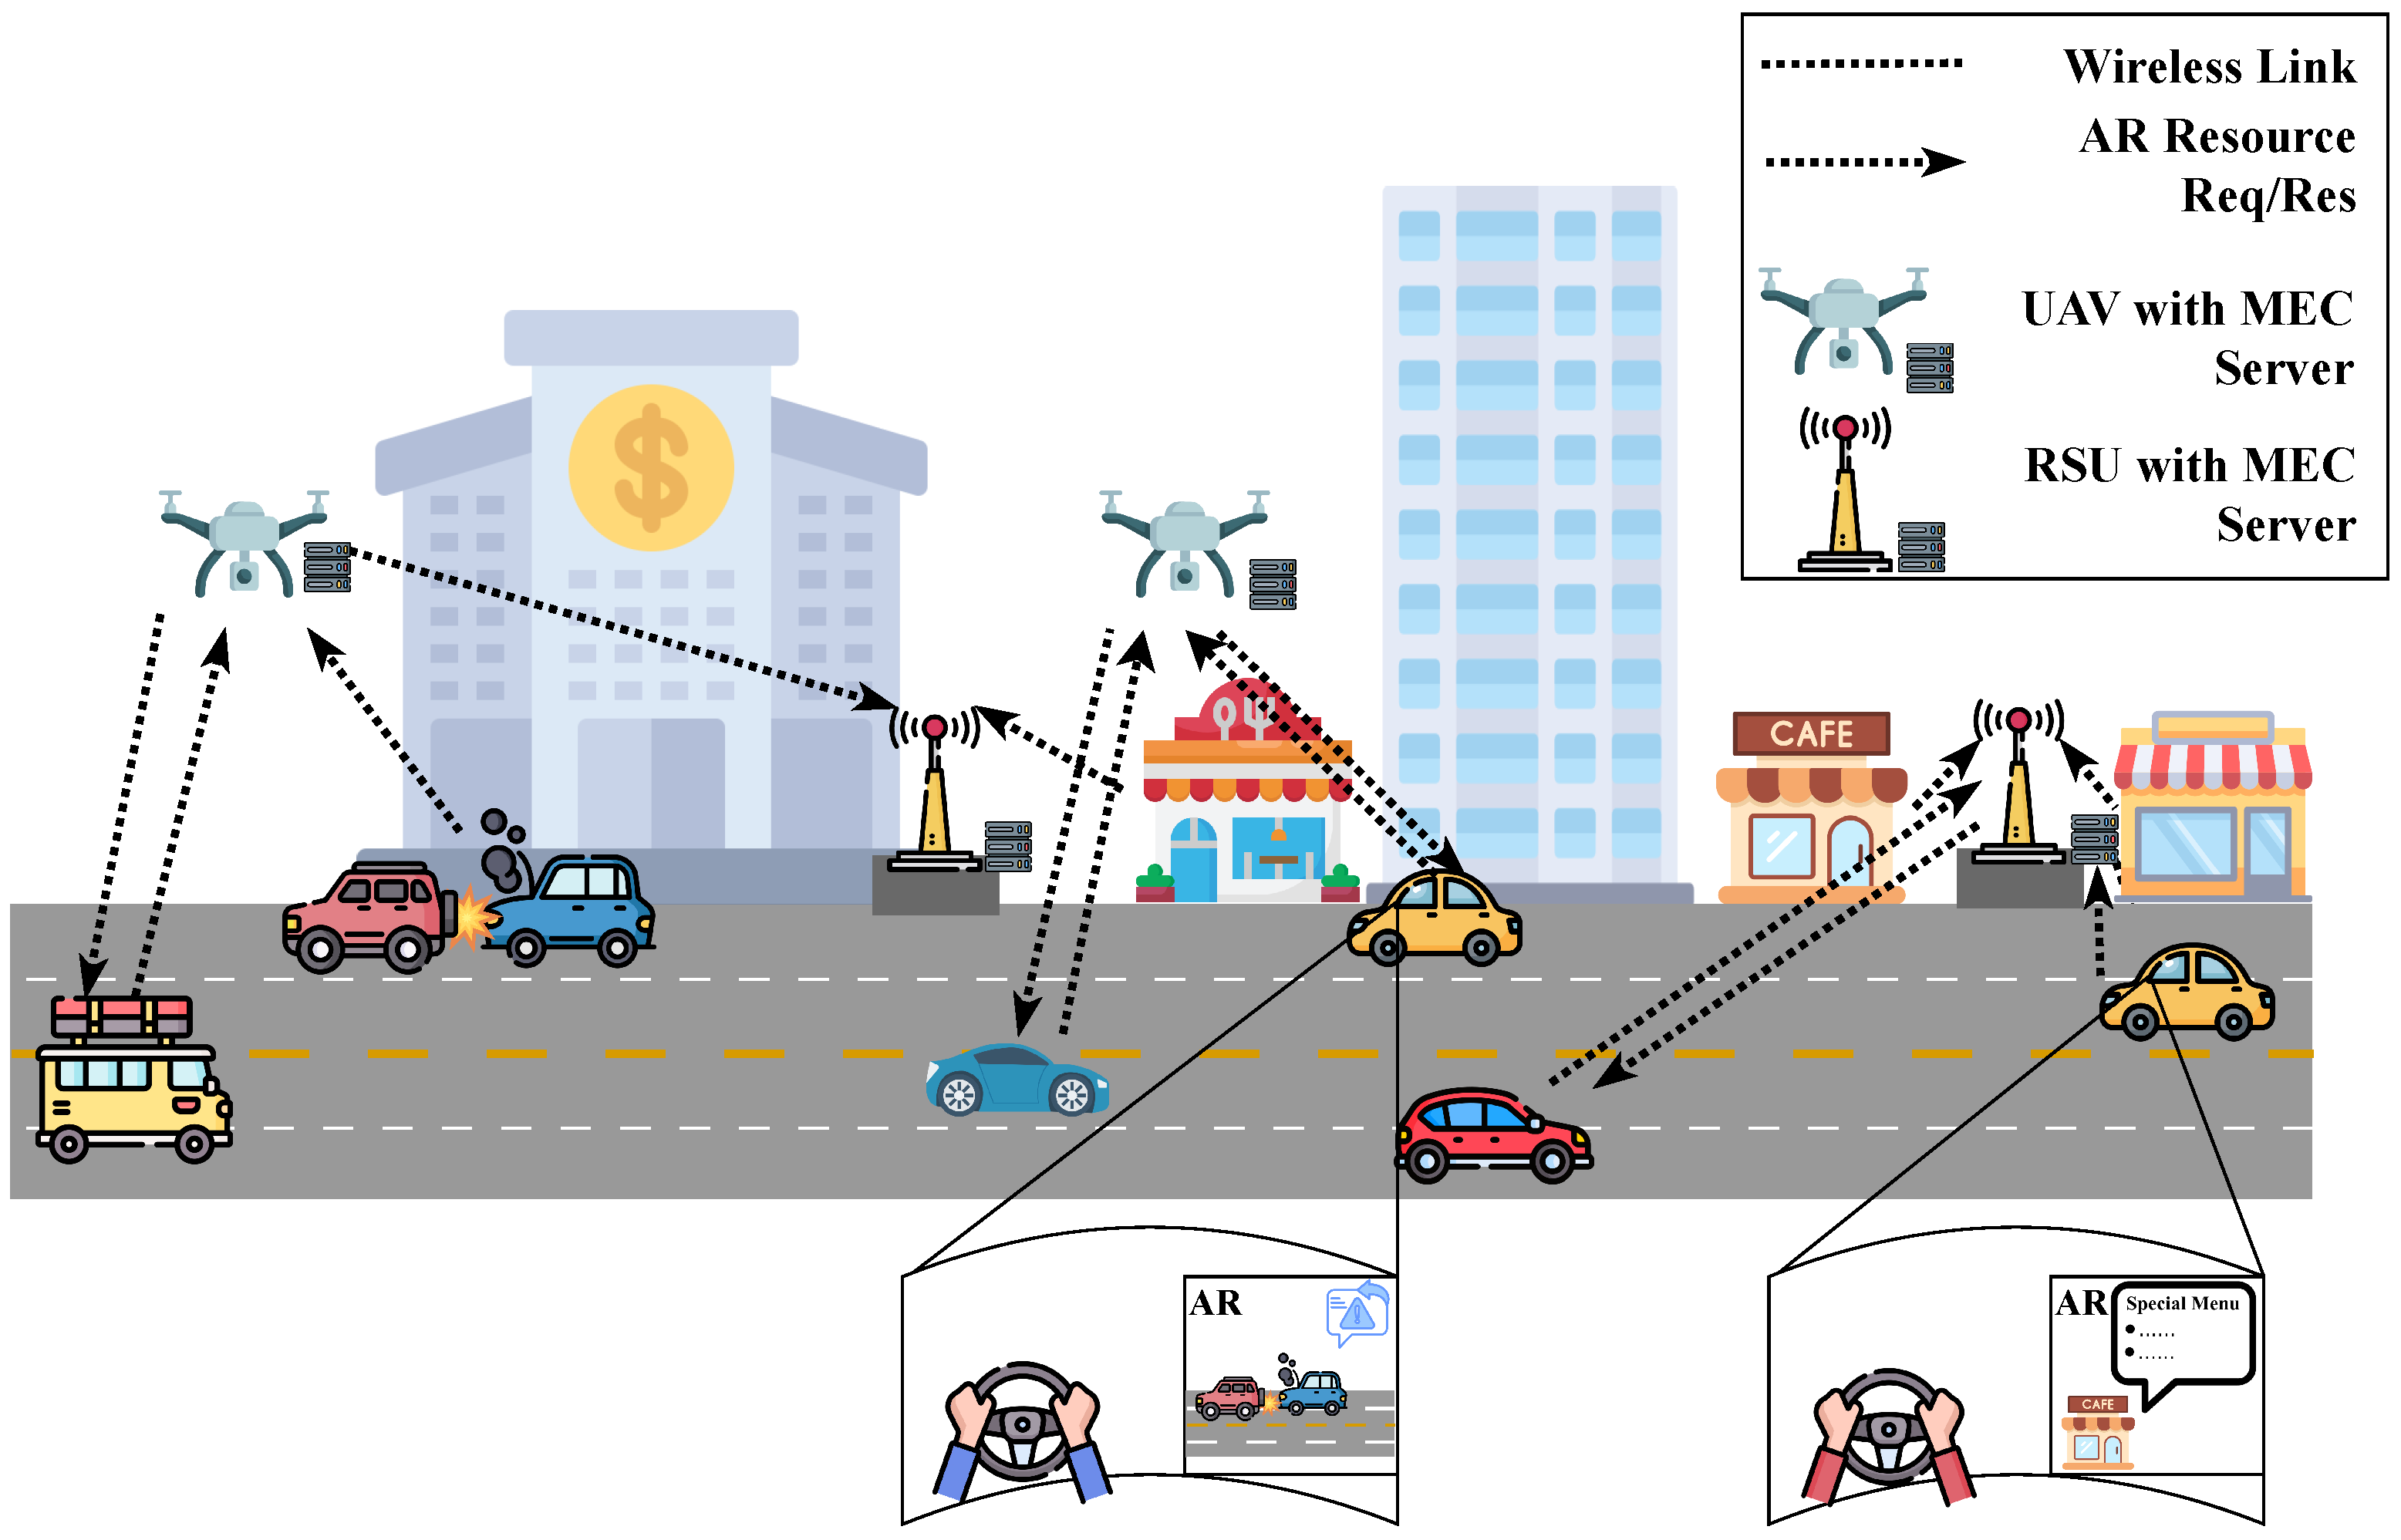
We consider a multi-server, multi-user MEC system-enabled vehicular network, as shown in
Figure 1, in which RSUs equipped with MEC servers provide emergency messages and AR content to the users. At locations on the road network, where setting up RSUs is not feasible or for temporary requirements, UAVs equipped with MEC servers can also be deployed to provide a service similar to RSUs. The road network is modeled with a set of points of interest (POIs), denoted as
. Each POI corresponds to a local shop or service provider that delivers augmented reality (AR) advertisements and is associated with a specific topic category. For instance, if a vehicle subscribes to the topic ‘RES’, representing ‘restaurant’ it will receive AR content from all POIs classified as restaurants along its route.
We assume all vehicles on the road network are equipped with AR capable devices and are capable of receiving AR content from the RSUs and are subscribed to at least one topic (emergency messages). That means all vehicles on the road network will receive emergency messages when necessary. If any emergency events happen, then the RSUs send the emergency message to all the vehicles within their communication range. Further, the emergency messages are divided into two parts, ‘emergency short message’ and ‘emergency supplementary messages’. The ‘emergency short message’ is like a text notification that is sent to all the vehicles within the communication range of the RSU. The ‘emergency supplementary messages’ is the detailed information about the emergency event that may contain images of the emergency incident.
We assume that is the set of RSUs and is the set of vehicles. If any MEC-enabled UAVs are deployed to assist the RSUs then the set represents the set of UAVs. The system offers a set of topics that the vehicles can subscribe to. Each vehicle has a set of subscribed topics for which they are interested in receiving AR content.
When a vehicle enters the communication range of an RSU for the first time, it sends a request to it. Each vehicle request is characterized by the tuple of multiple parameters, . Here is the current position of the vehicle, is the speed of the vehicle, is the acceleration of the vehicle, is the set of topics for which the vehicle is interested in receiving AR content, is the route of the vehicle, and is the destination of the vehicle on the road network.
Each RSU is connected to a central network through a high-speed link. The central network is responsible for collecting the AR content from the content providers and distributing it to the RSUs. The central network is also responsible for collecting the emergency messages from the emergency services and distributing them to the RSUs. The RSUs can also communicate with each other through the central network and decide which RSU should transmit content to a particular vehicle. We assume all the contents are already cached in the RSUs.
When a vehicle sends a request, the RSU schedules content transmission for each POI on the road for each subscribed topic of the vehicle. Each content should be transmitted only once during a vehicle’s journey, regardless of encountering multiple RSUs by the vehicle. The RSU assignment algorithm determines the most suitable RSU for that transmission. The decision is based on the content’s deadline and the vehicle’s sojourn time within the assigned RSU’s coverage range. Furthermore, when an emergency event occurs, the RSU enqueues emergency short messages and if required, emergency supplementary messages, for each vehicle within its range. Then the RSU decides based on the scheduling algorithm the transmission order of the enqueued contents.
A list of all the notations used in the system model and problem formulation are available in
Table 1.
3.1. Communication Model
If a vehicle v sends a request to the nearest RSU, the total time or delay includes the processing time, the waiting time in the queue, and the transmission time. Since the size of the requests sent by the vehicles are negligible, only the transmission time of the content from RSU to the vehicles is considered.
In this paper, a single communication channel is assumed between the RSU and the vehicle or the UAV and the vehicle, with a bandwidth of
B. For RSU, communication model adopts the UMi (Urban Microcell)-Street Canyon path loss model by ETSI [
39]. This pathloss model is widely recognized for modeling vehicular scenarios where RSUs are typically mounted at heights of 8–10 m and vehicles have antenna heights of approximately 2–3 m, forming line of sight (LOS) or non-line-of-sight (NLOS) links within street canyons bordered by buildings.The probablity of LOS or NLOS depends on the distance between the two nodes and is defined as:
Here,
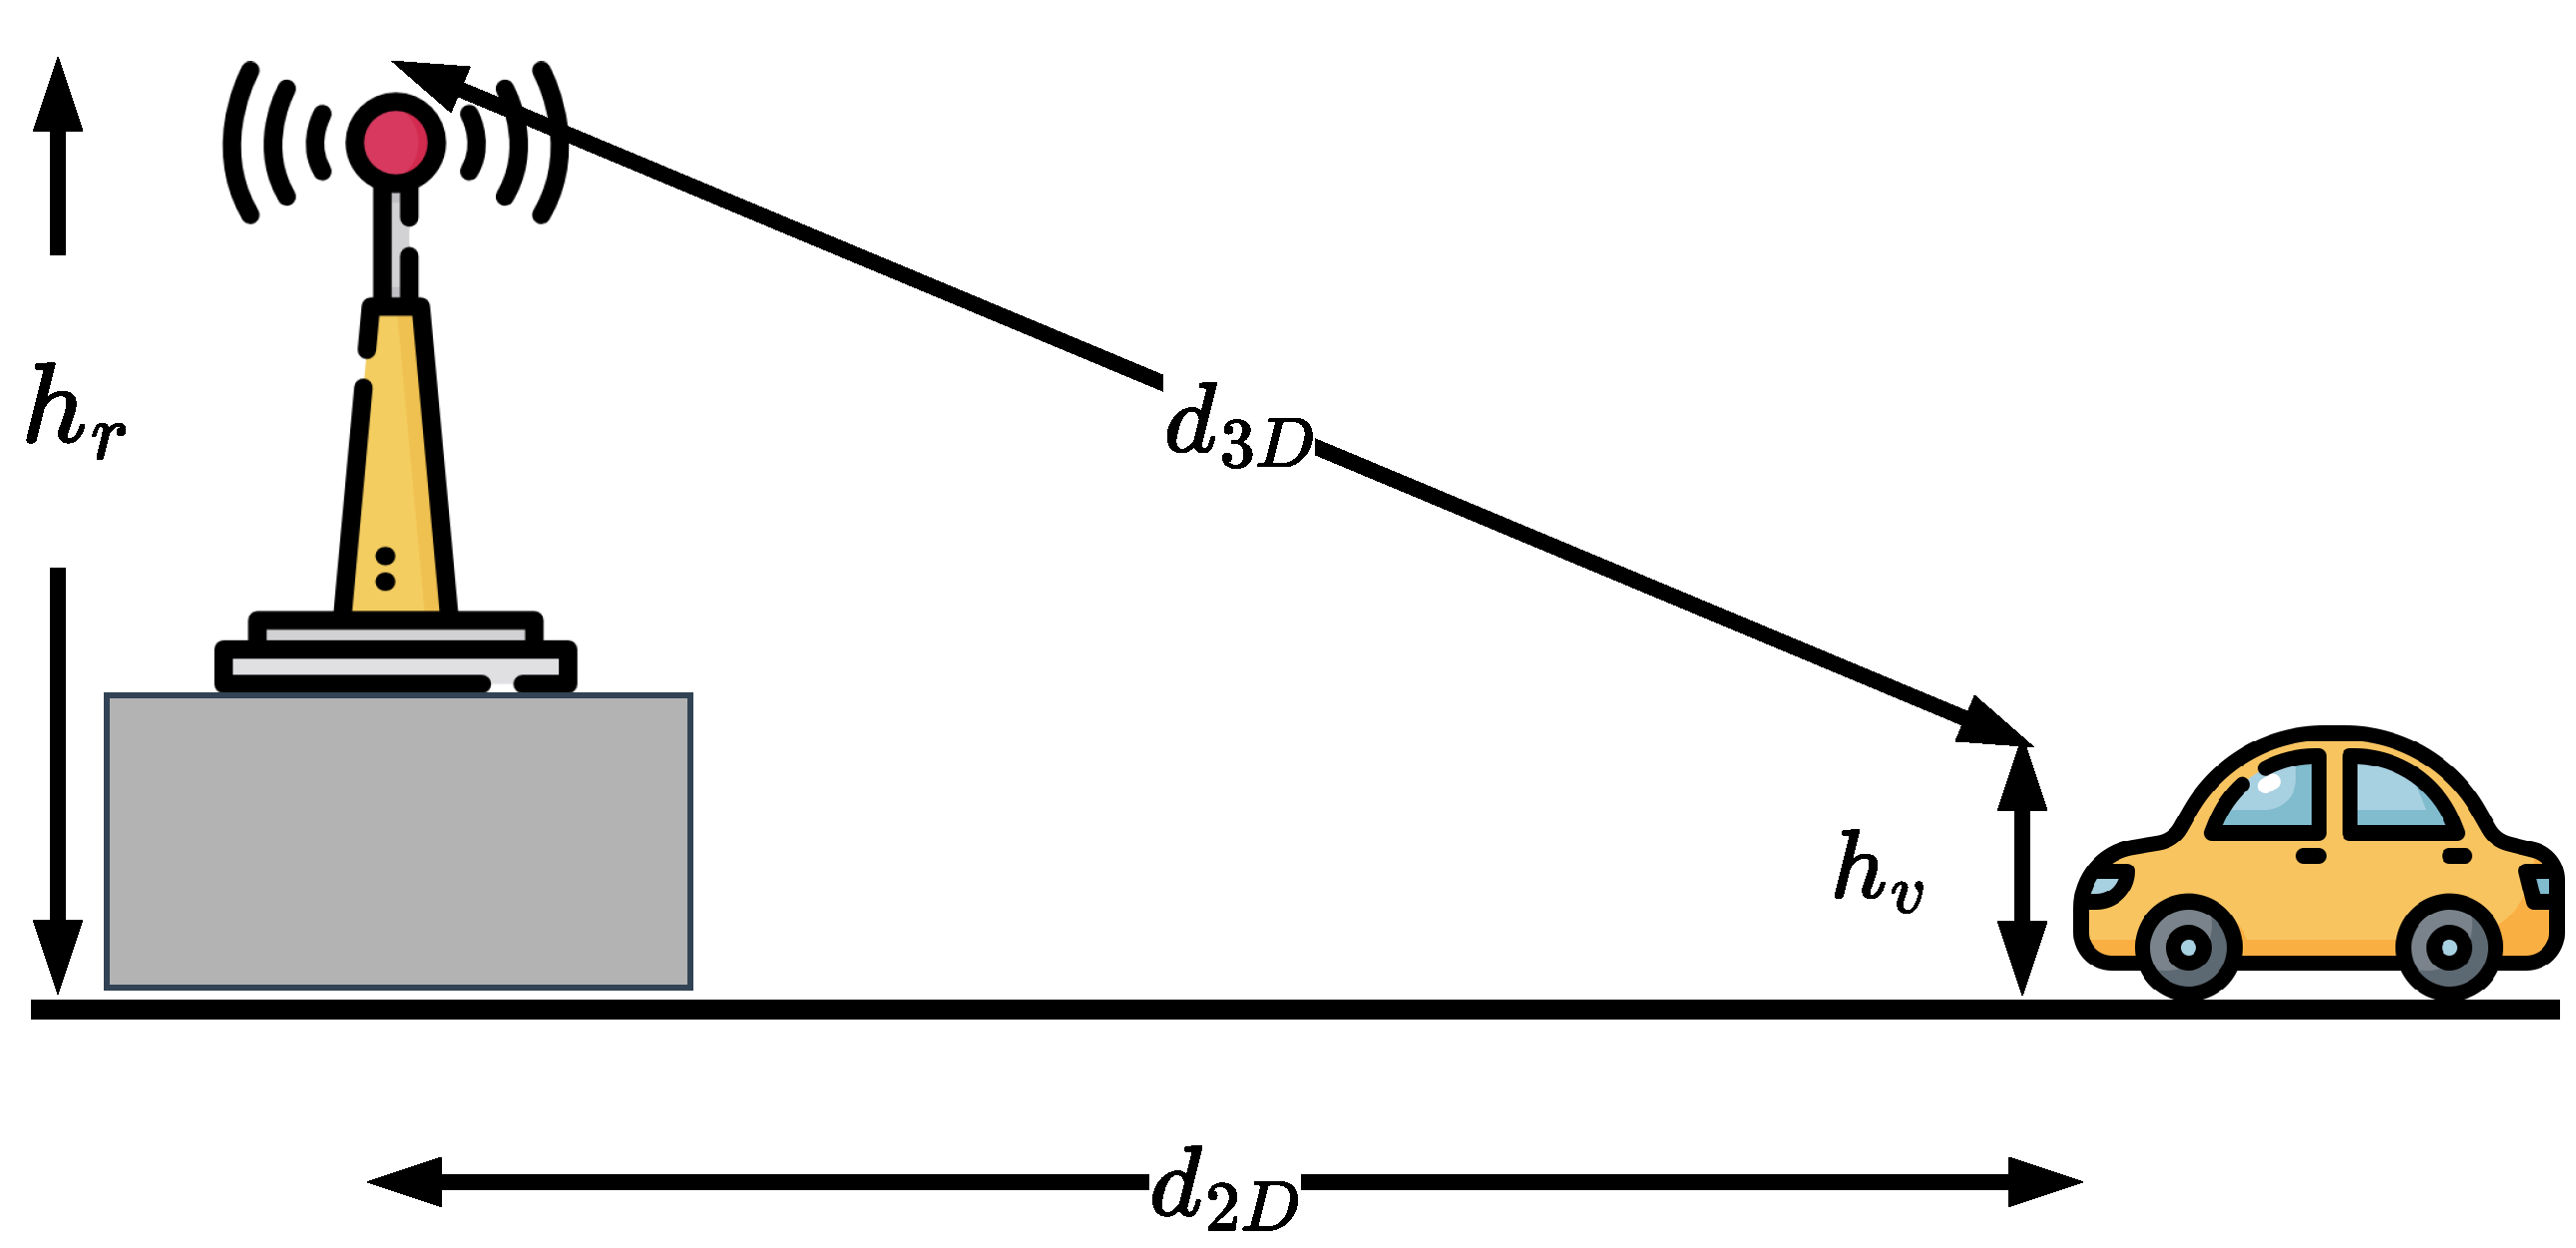
denotes the horizontal (ground-plane) Euclidean distance between the transmitter and receiver antenna bases, and
denotes the corresponding three-dimensional distance. All distances are measured in meters, and the geometry is illustrated in
Figure 2.
The distance dependent pathloss (in dB) for LOS condition is given as follows:
where
is defined as the break-point distance between the transmitter and the receiver, and it is measured using (
3).
Here,
and
denote the effective antenna heights of RSU
r and vehicle
v, respectively. Here
and
are the actual antenna heights of the RSU and vehicle, and
is the effective environmental height. For the UMi scenario,
m. The
and
are defined as follows,
The distance dependent pathloss (in DB) for NLOS condition is given as:
In addition to distance-dependent pathloss, lognormal shadow fading is incorporated. In the dB domain, the total large-scale loss for a given link type
is modeled as
where
denotes a zero-mean Gaussian random variable (in dB) with standard deviation
, representing lognormal shadow fading.
The received power in dBm for link type
x is then given by
where
is the transmit power of RSU, and
and
denote the transmit (RSU) and receive antenna (vehicle) gains, respectively. The corresponding received power in the linear scale (watts) is obtained by
Assuming an additive white Gaussian noise (AWGN) channel with one-sided noise spectral density
, the noise power is
The instantaneous signal-to-noise ratio (SNR) for link type
x is then
Finally, the achievable data rate (Shannon capacity) of the RSU-vehicle link is expressed as
The time required to transmit content for topic
k from RSU
r to vehicle
v can be calculated as:
where
is the size of the content for topic
k.
When considering deployment of UAVs for aiding RSUs to disseminate contents, the channel follows the free-space path loss model. This choice was made because UAVs typically hover over the streets and ensures line of sight with the vehicles. Therefore, the channel gain
, between UAV
and vehicle
v can be formulated as follows:
where
is the distance between UAV
u and vehicle
v, and
is the power gain with the reference distance
m. Then the achievable bit rate
can be measured as:
where
is the transmission power of UAV
u and
is the noise power. The time required to transmit content for topic
k from UAV
u to vehicle
v can be calculated like before as:
3.2. Deadline Model
The deadline for each content for each POI on the road is designed to reflect the actual time available for content delivery. The deadline must account for both vehicle motion dynamics and delays introduced by signalized road intersections encountered by the vehicle before reaching the POI. For a content
j, the deadline
is defined as:
where
denotes the distance between vehicle
v and the POI associated with content
j,
and
represent the current speed and acceleration of the vehicle, respectively.
is a small positive constant ensuring numerical stability. The term
denotes the number of signalized intersections encountered by the vehicle
v before reaching the POI. The first term in (
18) captures the instantaneous free-flow travel time of the vehicle. The second term represents the cumulative control delay introduced by signalized intersections along the vehicle’s path. In this work, the intersections are assumed to be under-saturated and for under-saturated intersections, the delay incurred at intersection
i, denoted as
, is modeled based on the classical Webster delay formulation [
40] according to [
41], expressed as
where
is the traffic signal cycle length,
is the green signal time ratio and
is the degree of saturation at the intersection
i. The green signal time ratio is calculated as
where
denotes the effective green signal duration at intersection
i. Also, the saturation rate
is defined as
here,
is the observed traffic flow and
is the saturation flow rate of intersection
i. An intersection is considered under-saturated when the incoming traffic volume is lower than its capacity, allowing vehicles to clear the intersection within a single signal cycle.
4. Problem Formulation
Based on the system model, in this section the RSU assignment and transmission scheduling problem is formulated as an optimization problem. We assume that all the contents for the subscribed topics from all the vehicles are stored in a set , where . Here, is the set of all the vehicles and is the set of topics subscribed by the vehicle . Since multiple POIs may belong to the same subscribed topic but are located at different positions along the road, a vehicle can receive more than one content for the same topic, each with a distinct deadline. Each content along with the data, also contains its specification like the required transmission time and deadline of that particular content.
The binary optimization variable used in the problem formulation is defined as:
So, the problem can be formulated as
subject to
Equation (
23) focuses on minimizing the total time for all the transmissions in the system with respect to the priorities of the content. As one content can be transmitted at a time, the other transmissions must wait in the transmission queue. Here,
is the transmission time and
is the priority of content
j. The priority of each content
is a non-zero positive integer, i.e.,
. The value of the priority depends on the type of content. Higher priority contents have lower value of
.
Equation (24) refers to the binary decision variable. Equations (25) and (26) enforce that one content is scheduled for transmission only once and from only one RSU. Equation (27) ensures that the scheduling of contents at each RSU starts from a dummy content. The size of the dummy content is set to 0 and the deadline is set to ∞. Equations (28) and (29) together eliminate formation of any sub-tours in the order of the transmissions in a way similar to Miller–Tucker–Zemlin (MTZ) sub-tour elimination of the traveling salesman problem [
42]. Equations (30) and (31) ensure that the contents are transmitted before their deadlines or before the vehicle leaves the transmitting RSU’s communication range. Here,
is the deadline for content
j and
is the coverage duration of content
j within the range of RSU
r.
The main problem is formulated as a scheduling problem with deadlines, this problem is an NP-hard problem.
5. Algorithms
According to the problem formulation, the objective of the proposed algorithms is to minimize the overall system time while guaranteeing deadline satisfaction for all content transmissions. To achieve this, an RSU assignment algorithm called PMRS and a transmission scheduling algorithm, based on simulated annealing called DAPS is proposed. When a new vehicle enters the transmission range of any RSU for the first time during its travel, it sends a subscription request to that RSU. The subscription request contains the list of vehicle’s subscribed topics. For each subscribed topic of the vehicle the contents are determined. The number and size of these contents depend on the number of POIs that are available along the upcoming route of the vehicle.
5.1. PMRS
The PMRS (penalty-minimizing RSU selection) algorithm assigns each content to the best RSU by considering both the deadline constraint and RSU coverage limitation. The pseudocode of the algorithm is presented in Algorithm 1.
For each content the algorithm iteratively evaluates each candidate RSU (step 3–18). At first for each content the latency as the sum of the RSU’s current queue time and the content’s transmission time (step 10) is estimated. Then a penalty based on the sum of the ratio of latency to the deadline and the ratio of latency to the coverage duration (step 11–13) is measured. Finally, the content is assigned to the RSU that yields the minimum penalty (step 19). This ensures that the content is assigned to the RSU that minimizes the risk of violating the deadline or coverage constraints. After assigning the content to a specific RSU, that RSU’s queue time is updated to reflect the added load, ensuring that subsequent decisions are made with awareness of cumulative scheduling effects. Although the approach is heuristic and order-dependent, it provides a computationally efficient mechanism for practical deployment in dynamic vehicular environments.
After PMRS finishes RSU assignment, each RSU locally orders its own queue with the scheduling algorithm before starting transmission.
| Algorithm 1 PMRS—Algorithm |
input: Set of content , set of RSUs R output: Set of content assigned to RSU - 1:
Initialize - 2:
Initialize queue time - 3:
for each content do - 4:
selected best rsu, - 5:
minimum penalty, - 6:
for each RSU do - 7:
transmission time of j - 8:
deadline of j - 9:
coverage duration for j at RSU r - 10:
latency, - 11:
deadline violation penalty, - 12:
coverage violation penalty, - 13:
total penalty, - 14:
if then - 15:
- 16:
- 17:
end if - 18:
end for - 19:
Assign content j to selected rsu: - 20:
update queue time, - 21:
end for
|
5.2. DAPS
The deadline-aware priority scheduling (DAPS) is a hybrid scheduling algorithm based on earliest deadline first and simulated annealing [
43]. In other words, the proposed DAPS algorithm works in two distinct phases to construct the transmission queue
Q. The pseudocode of the algorithm is presented in Algorithm 2.
5.2.1. Phase 1
In the first phase, the algorithm gives absolute priority to emergency short messages, reflecting their time-critical nature. The set of all contents is partitioned into two subsets: , containing only emergency short messages and , containing all other types of content (step 2–4). The subset is then sorted in ascending order of deadline to minimize the risk of late deliveries, and the sorted list is directly appended to the transmission queue (step 5–6). This way the first phase follows the EDF (earliest deadline first) approach to schedule the deadline critical emergency short messages. After the initial phase the RSU starts transmitting the emergency short messages while asynchronously executing phase 2. This is designed in such a way as to meet the strict deadlines of the short emergency messages.
5.2.2. Phase 2
In the second phase, the algorithm schedules the remaining content
, using simulated annealing (SA) [
44] approach (step 7–26).
| Algorithm 2 DAPS |
input: content set , and their specifications output: transmission queue Q - 1:
- 2:
Partition into: - 3:
- 4:
Part I: Scheduling of Emergency Short Messages - 5:
▹ Sort in ascending order of deadline - 6:
Part II: Scheduling of Other Contents - 7:
Set initial temperature, , cooling rate, , minimum temperature, , number of neighbors, , number of initial solutions, - 8:
▹ Create n random initial solutions - 9:
- 10:
for m ∈ do - 11:
- 12:
while do - 13:
▹ Generate k neighbor solutions by using swap operator - 14:
▹ Select the neighbor with the best fitness - 15:
if then - 16:
- 17:
else if random(0,1) < then - 18:
- 19:
end if - 20:
- 21:
end while - 22:
- 23:
- 24:
end for - 25:
▹ Select the solution with the best fitness - 26:
Append all elements of to the end of Q, preserving order - 27:
return Q
|
Initialization and Solution Representation
This phase begins with the initialization of parameters such as temperature, cooling rate, and number of initial solutions (step 7). Then, followed by the generation of random initial solutions from (step 8). The initial parameters were selected empirically through preliminary pilot runs to provide a practical balance between search quality and execution time. The algorithm starts with a high initial temperature and a slow temperature decay (cooling rate, ). The high initial temperature allows the acceptance of some inferior solutions during the early search stage, which helps the algorithm avoid poor local optima. The slow cooling schedule enables a gradual shift from exploration to exploitation. The algorithm starts with more than one initial solution and explores the neighborhood of each one, where each solution examines one neighbor at a time to find a near optimal or optimal solution. This approach increases the search space while reducing the required iteration counts to find a better solution. As the algorithm execution time has direct impact on meeting the deadlines, these settings were found to provide stable behavior for the considered scheduling problem while keeping the computational cost manageable.
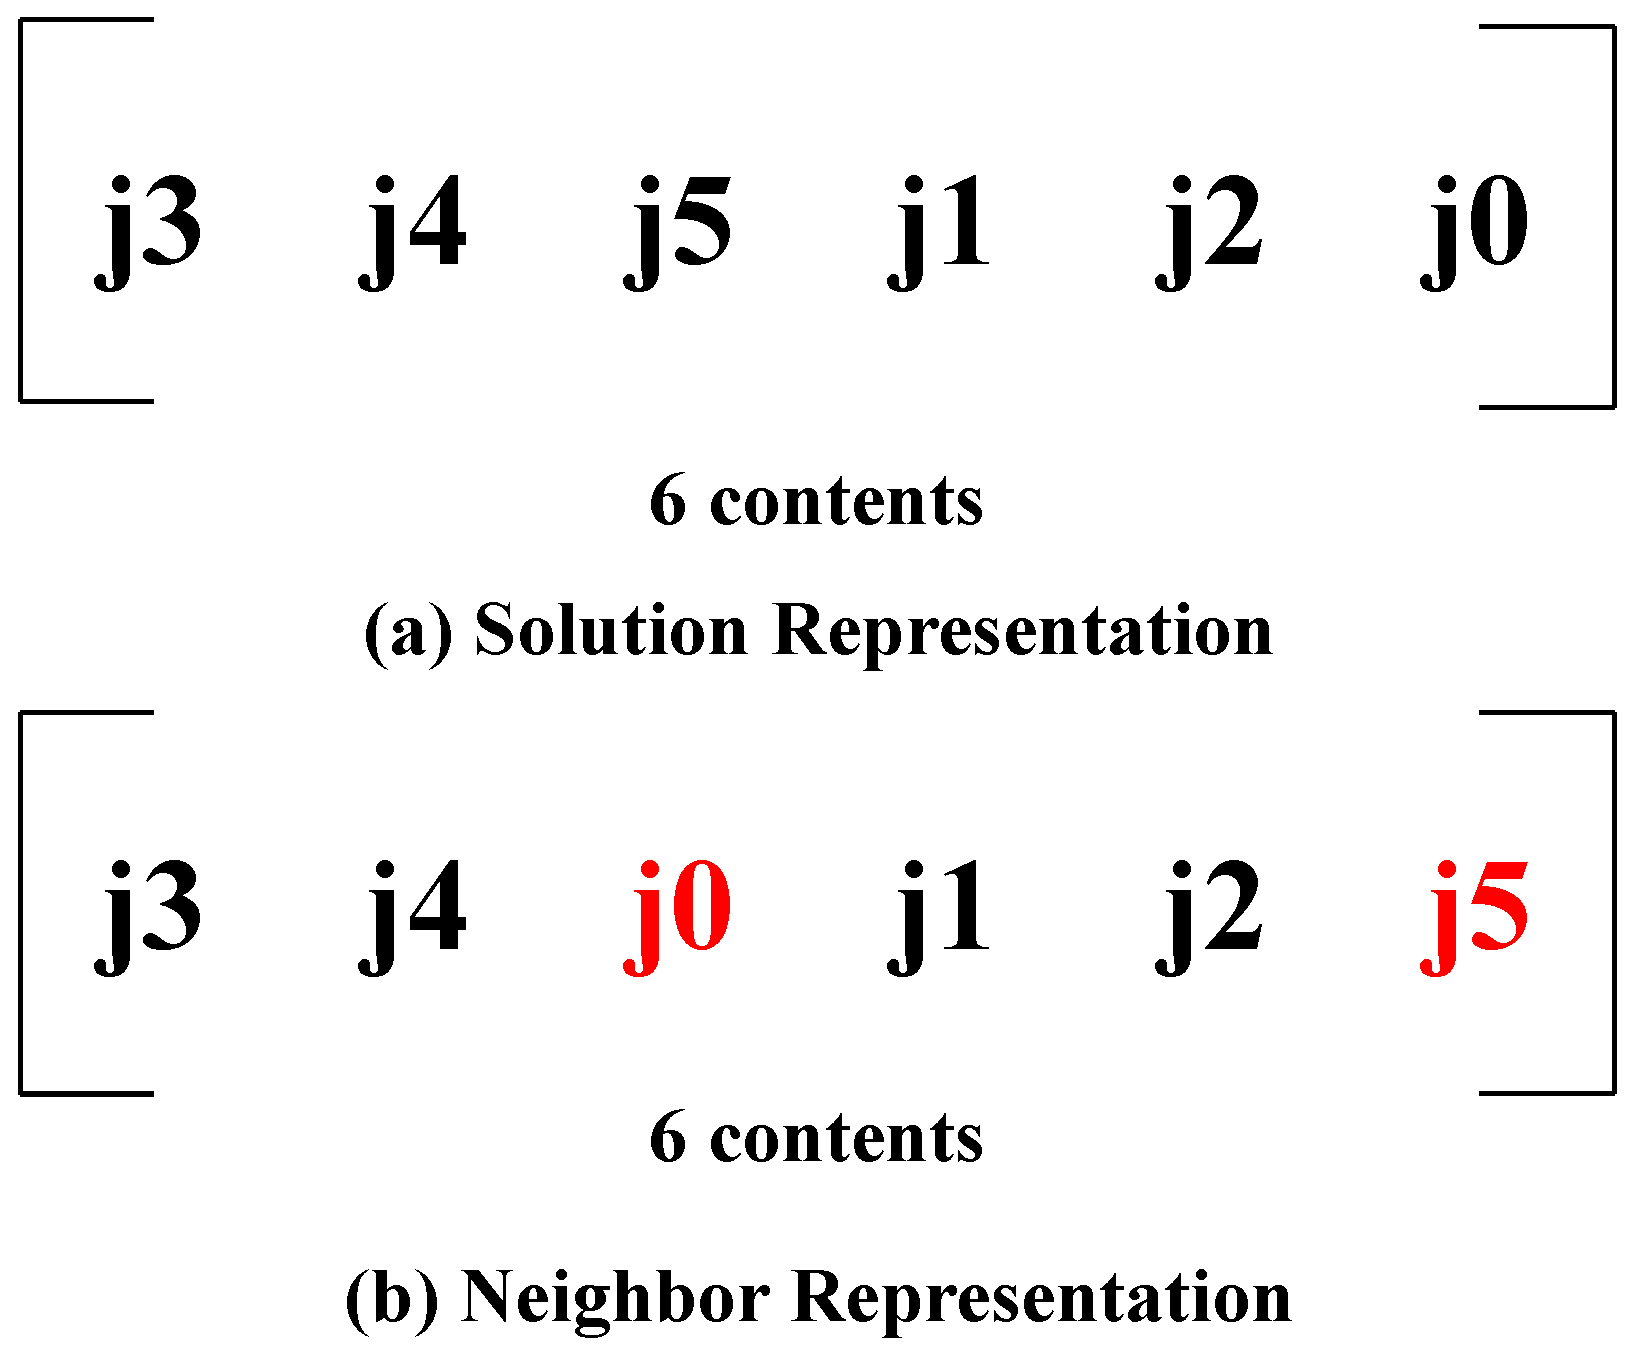
Figure 3 illustrates the solution and neighbor representation. Here, the solution itself represents the transmission queue and each element of the solution is the content that needs to be transmitted. The neighbor is generated by using the swap operator, i.e., choosing two random positions in the solution and swapping the elements of those two positions. For example, the content j0 and j5 have been swapped to generate the neighbor solution.
Fitness Evaluation
For each candidate solution, neighboring solutions are iteratively generated by swapping the order of two contents in the queue, and their fitness values are evaluated (step 11–14) using (
32). The main purpose of defining the fitness in this form is to make the proposed algorithm prefer solutions that are both feasible and efficient. In (
32),
S is a magnifying coefficient,
is the penalty for constraint violation, and
is the waiting time penalty. By scaling
with
S, the search is pushed away from schedules that violate constraints and is guided toward schedules that satisfy deadlines and coverage limitations first. After that,
helps the algorithm further improve the queue order by reducing the waiting time among feasible solutions.
is measured as the sum of deadline constraint violations. When a content is already assigned to an RSU, the deadline of that content is either the time required for the vehicle to reach the POI’s location (if the POI is within the range of the assigned RSU) or the sojourn time of the vehicle within the assigned RSU. Therefore, the deadline violation penalty in the fitness function also covers the coverage duration constraint violation.
is the cumulative waiting time penalty of a solution and is measured using (
33).
This penalty enforces ordering the transmissions in such a way that yields the minimal waiting time, while assigning a higher cost to contents that experience longer delays.
If a neighbor solution shows improved fitness, it is accepted directly (step 16); otherwise, it may still be accepted with a probability defined by the Boltzmann criterion [
45] (step 17–18), allowing occasional uphill moves to escape local optima. The temperature is gradually decreased at each step according to the cooling rate (step 20), and the process continues until the minimum temperature is reached. Once all iterations are complete, the best solution among the evaluated candidate solutions is selected (step 25) and appended to the end of the existing transmission queue
Q (step 26). This hybrid design ensures that DAPS achieves the strict deadline compliance for emergency messages while leveraging metaheuristic optimization to efficiently schedule the remaining contents.
6. Performance Evaluation
In this section, the methods of evaluating the performance of the proposed algorithms are introduced. The performance is evaluated using simulated vehicular mobility and transmission medium.
6.1. Simulation Setup
For the vehicular mobility simulation, SUMO (Simulation of Urban Mobility) [
46] is used. SUMO is an open-source, highly portable, microscopic and continuous road traffic simulation package designed to handle large road networks. The simulation is performed on a road network of size 2500 m × 1100 m. The street map of the ‘Jung-gu’ area of Seoul, Republic of Korea, from the OpenStreetMap (OSM) [
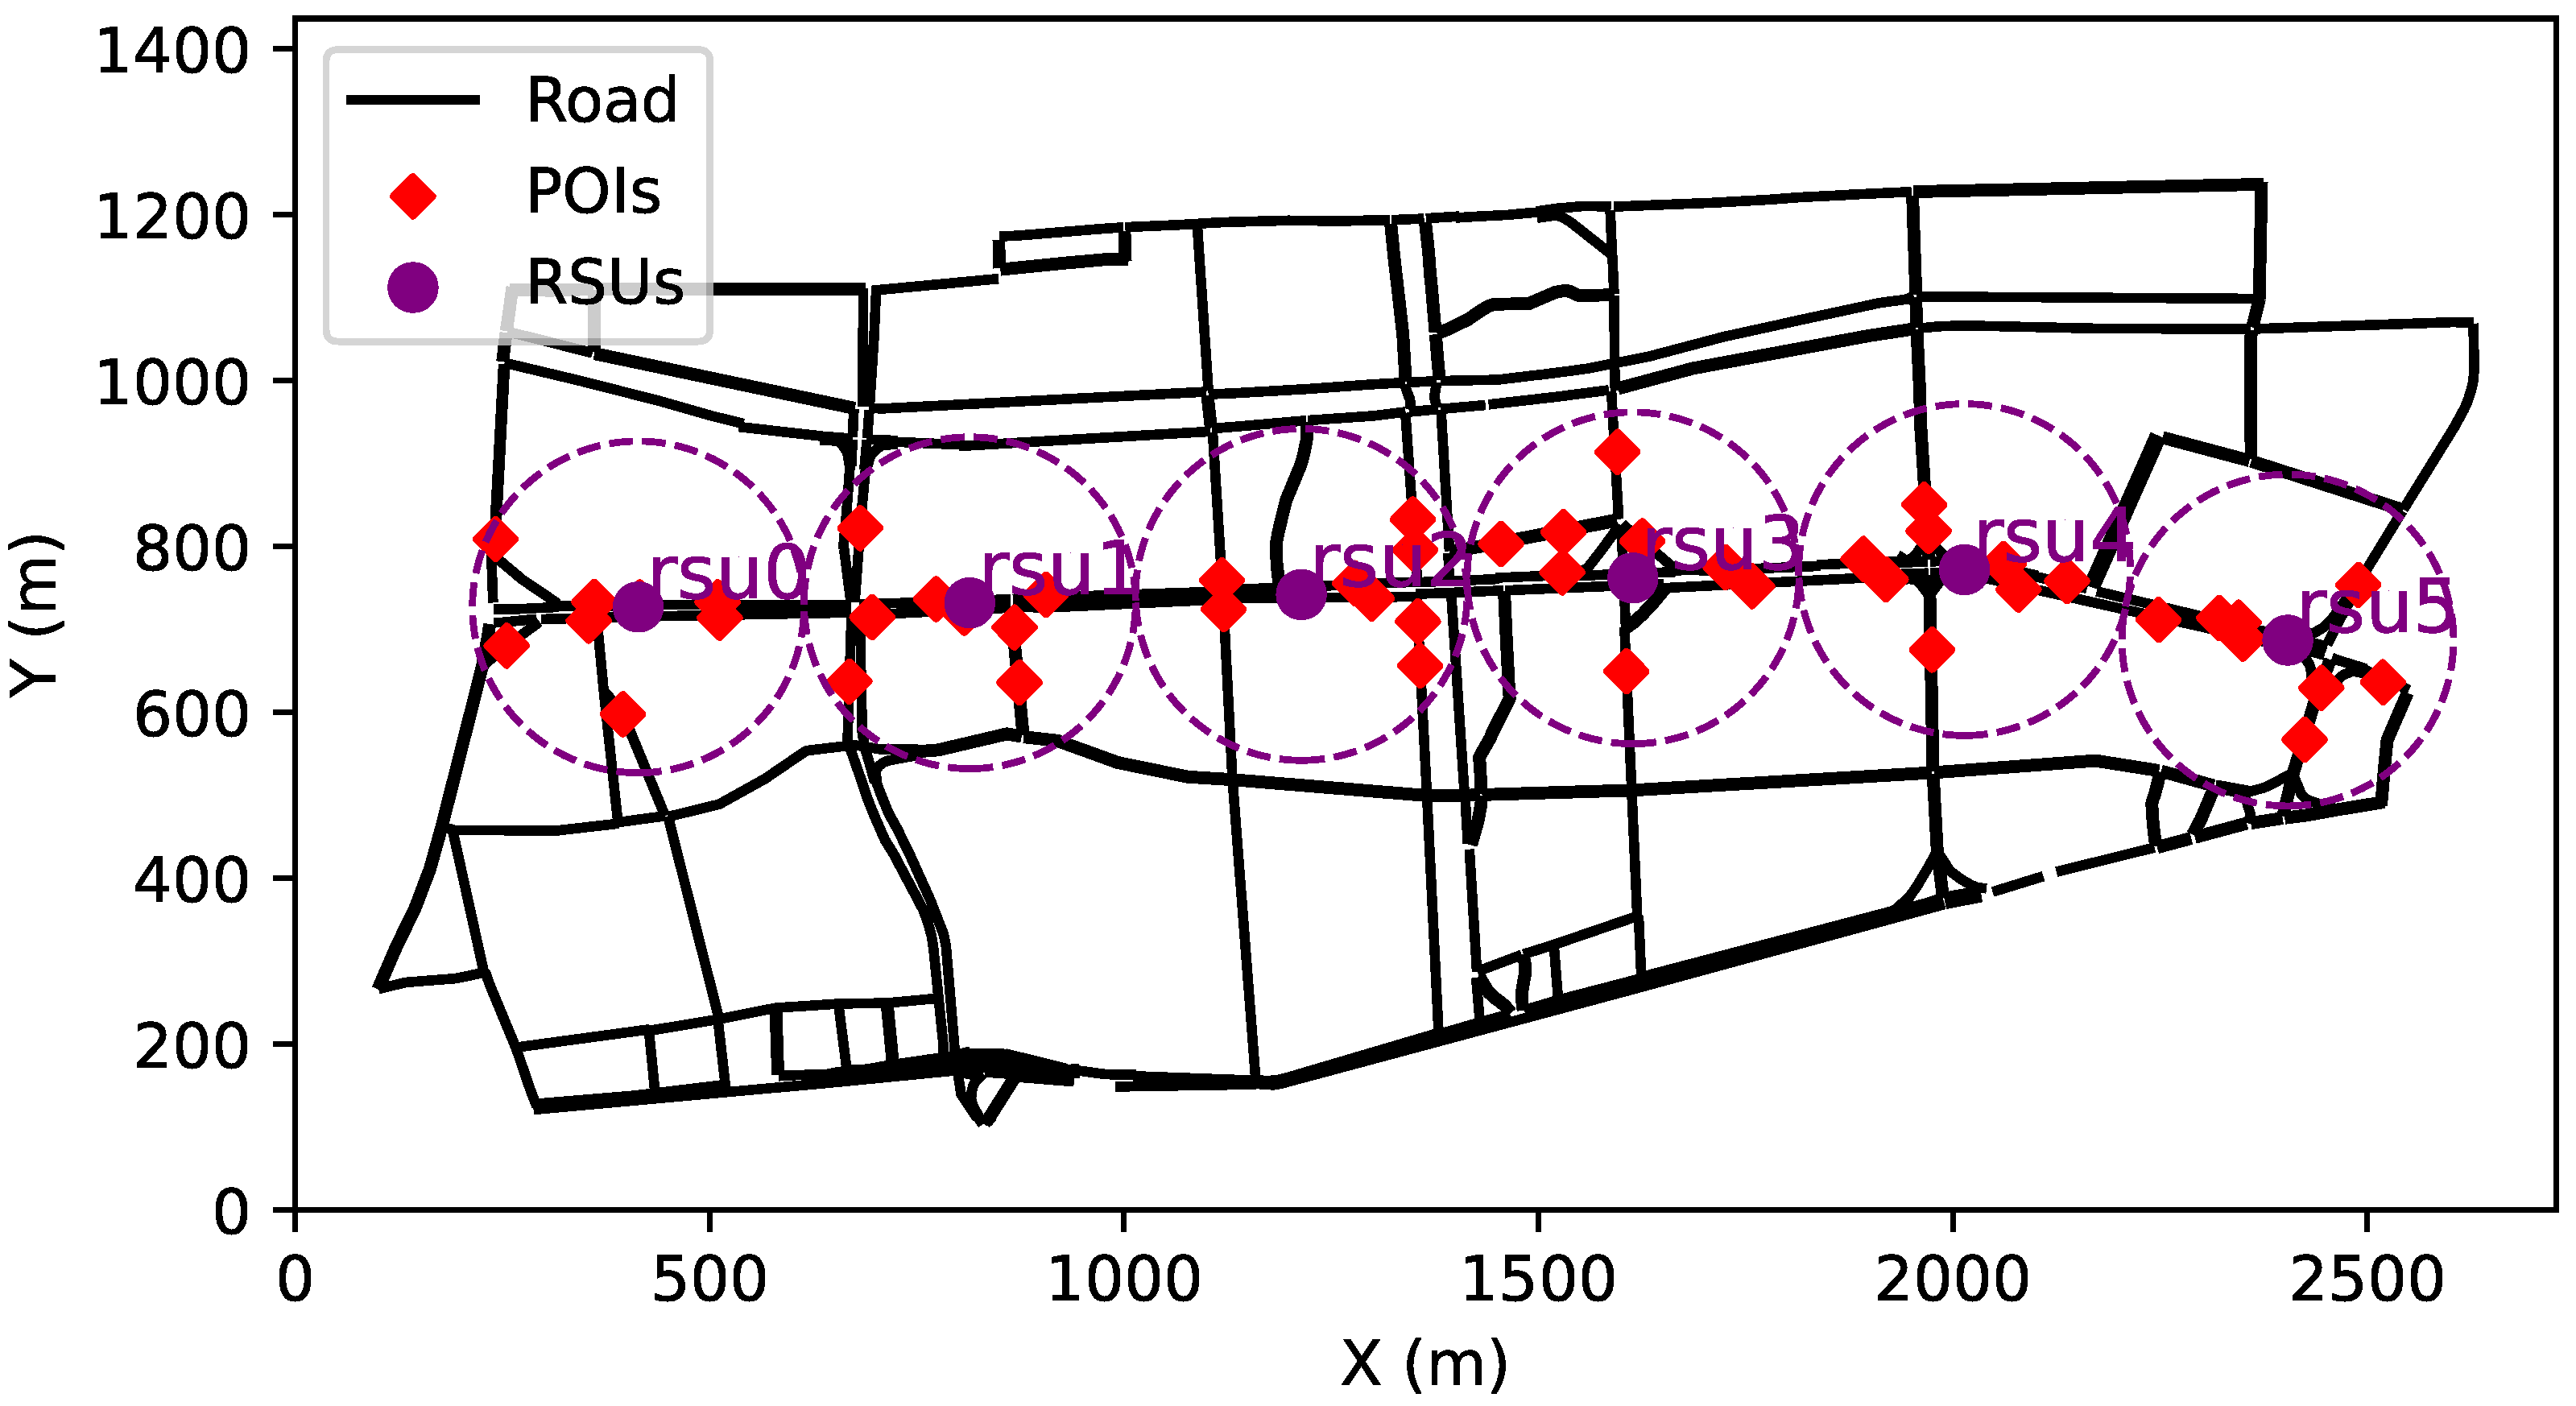
47] is collected to use with SUMO. The road network contains six RSUs and [50, 100, 150, 200, 250] number of vehicles. The RSUs are placed at the center of the road network along the ‘Eulji-ro’ road network. The road network is visualized in
Figure 4.
During each simulation, the vehicles are randomly spawned on the road network. Each vehicle follows a designated route and travels from the spawned position to the destination. Each simulation runs till all the vehicles on the road network have reached their destination. The vehicles randomly subscribe to a set of AR topics when they first enter within the communication range of an RSU. The RSU has to ensure that the vehicles receive the AR content before they reach the upcoming POIs; thus, the deadline for a specific AR content relies on the vehicle’s distance from the POI and the vehicle’s speed.
During the simulation, emergency events are generated at different locations within the coverage area of the RSUs, following a Poisson [
48] process with an intensity of
. Each emergency event triggers transmission of emergency short messages to all the vehicles that are affected by the event, i.e., the vehicles whose route contains the location where the emergency event occurred. Furthermore, the event may require additional information sent to the vehicles which are denoted as emergency supplementary messages. Emergency short messages differ from supplementary messages mainly in terms of data size and timing requirements. Short messages require minimal data transfer but have strict timing constraints, as they support real-time decision-making by drivers. In contrast, emergency supplementary messages may include additional media, such as images, which increase data volume and transmission time. These supplementary messages have more flexible deadlines since they serve as supporting information for the primary emergency short messages and are considered valid as long as they reach the vehicle before it arrives at the location of the event. The parameters that are used for the simulation are presented in
Table 2 and
Table 3.
6.2. Baselines
To evaluate the performance of the proposed algorithms, some heuristic and metaheuristic algorithms are considered. The heuristic algorithms include a greedy based scheduler called heuristic scored scheduler (HSS), shortest job first (SJF), earliest deadline first (EDF), and shortest transmission time first (STxF). Two metaheuristic algorithms, genetic algorithm (GA) and a simulated annealing (SA), are also considered as baselines. The GA and SA algorithms utilize the same fitness function as DAPS.
6.2.1. HSS
The heuristic scored scheduler (HSS) operates by iteratively prioritizing contents assigned to an RSU according to a computed score that balances transmission time, waiting time, and content priority. At each iteration, a score value is calculated for every content in the current scheduling set, reflecting its relative urgency and computational weight. The content with the lowest score—indicating the most favorable trade-off between delay and priority—is selected and placed into the transmission queue. After each selection, the waiting time is updated to account for the newly scheduled transmission, and the process continues until all contents are ordered. This iterative scoring mechanism allows HSS to construct an efficient transmission sequence that favors time-sensitive or high-priority contents while maintaining overall scheduling simplicity.
6.2.2. Genetic Algorithm
The genetic algorithm (GA) applies evolutionary principles to optimize the scheduling of contents assigned to an RSU. Each individual solution represents a complete transmission queue composed of multiple contents, and its quality is evaluated using a fitness function that measures overall scheduling efficiency and priority satisfaction. The algorithm begins with an initial population generated according to content deadlines and priorities, with random variations introduced to promote diversity. Through successive generations, high-fitness individuals are selected as parents using a tournament selection strategy, and new offspring are produced through order crossover and swap mutation operations. These operators allow the algorithm to balance exploration and exploitation by combining characteristics of strong candidates while introducing controlled randomness to avoid premature convergence. After each generation, only the fittest individuals are retained, ensuring continuous improvement in solution quality. Upon completion of the evolution process, the best individual—representing the optimal transmission queue—is selected as the final scheduling outcome.
6.2.3. Simulated Annealing
The simulated annealing (SA) algorithm employs a probabilistic local search strategy to iteratively improve an initial scheduling solution. Each solution represents a transmission queue, and the objective is to identify a near-optimal ordering by exploring neighboring configurations. Starting from a randomly generated initial solution, the algorithm evaluates neighboring solutions and probabilistically accepts new candidates based on their fitness and a temperature-dependent acceptance criterion. Initially, a high temperature allows occasional acceptance of inferior solutions, promoting extensive exploration of the solution space and helping to avoid premature convergence to local optima. As the temperature gradually decreases according to a controlled cooling schedule, the acceptance probability for worse solutions declines, allowing the algorithm to focus on exploiting the best-performing configurations. This balance between exploration and exploitation enables SA to converge toward a near-optimal transmission queue that effectively minimizes scheduling delay and satisfies content priority constraints.
6.3. Simulation Result Analysis
In this subsection, the performance results of the proposed methods are presented and analyzed. To evaluate the effectiveness of the RSU assignment algorithm (PMRS), a baseline assignment approach is implemented for comparison. In the baseline method, each vehicle’s contents are assigned to the RSU that first receives its subscription request. That is, all contents of a vehicle are transmitted by the first RSU whose coverage area, the vehicle enters. The primary performance metric considered is the deadline hit ratio, defined as the percentage of content transmissions completed within their respective deadlines. Additionally, the total delay—measured from the time a content request is generated to the time it is received—is evaluated and compared across all algorithms.
The simulations were executed on a Dell Precision 3640 Tower equipped with an Intel Core i9-10900 CPU and 64 GB of RAM. The runtime of each algorithm was included in the performance evaluation to accurately reflect real-world operational conditions. For every combination of vehicle count and emergency event generation intensity, ten independent simulation runs were conducted, resulting in a total of 150 runs. In each run, vehicle mobility patterns and content subscriptions were randomly generated to emulate realistic traffic and service demand conditions. In the current simulation setup, the results from these 10 runs were averaged internally, and only the final average outputs for each scenario are retained. Therefore, the results reported in this paper represent average values over the simulation runs.
6.3.1. Emergency Short Messages
Emergency short messages are the smallest in size [
49] and are subject to the strictest deadlines [
6] (refer to
Table 3).
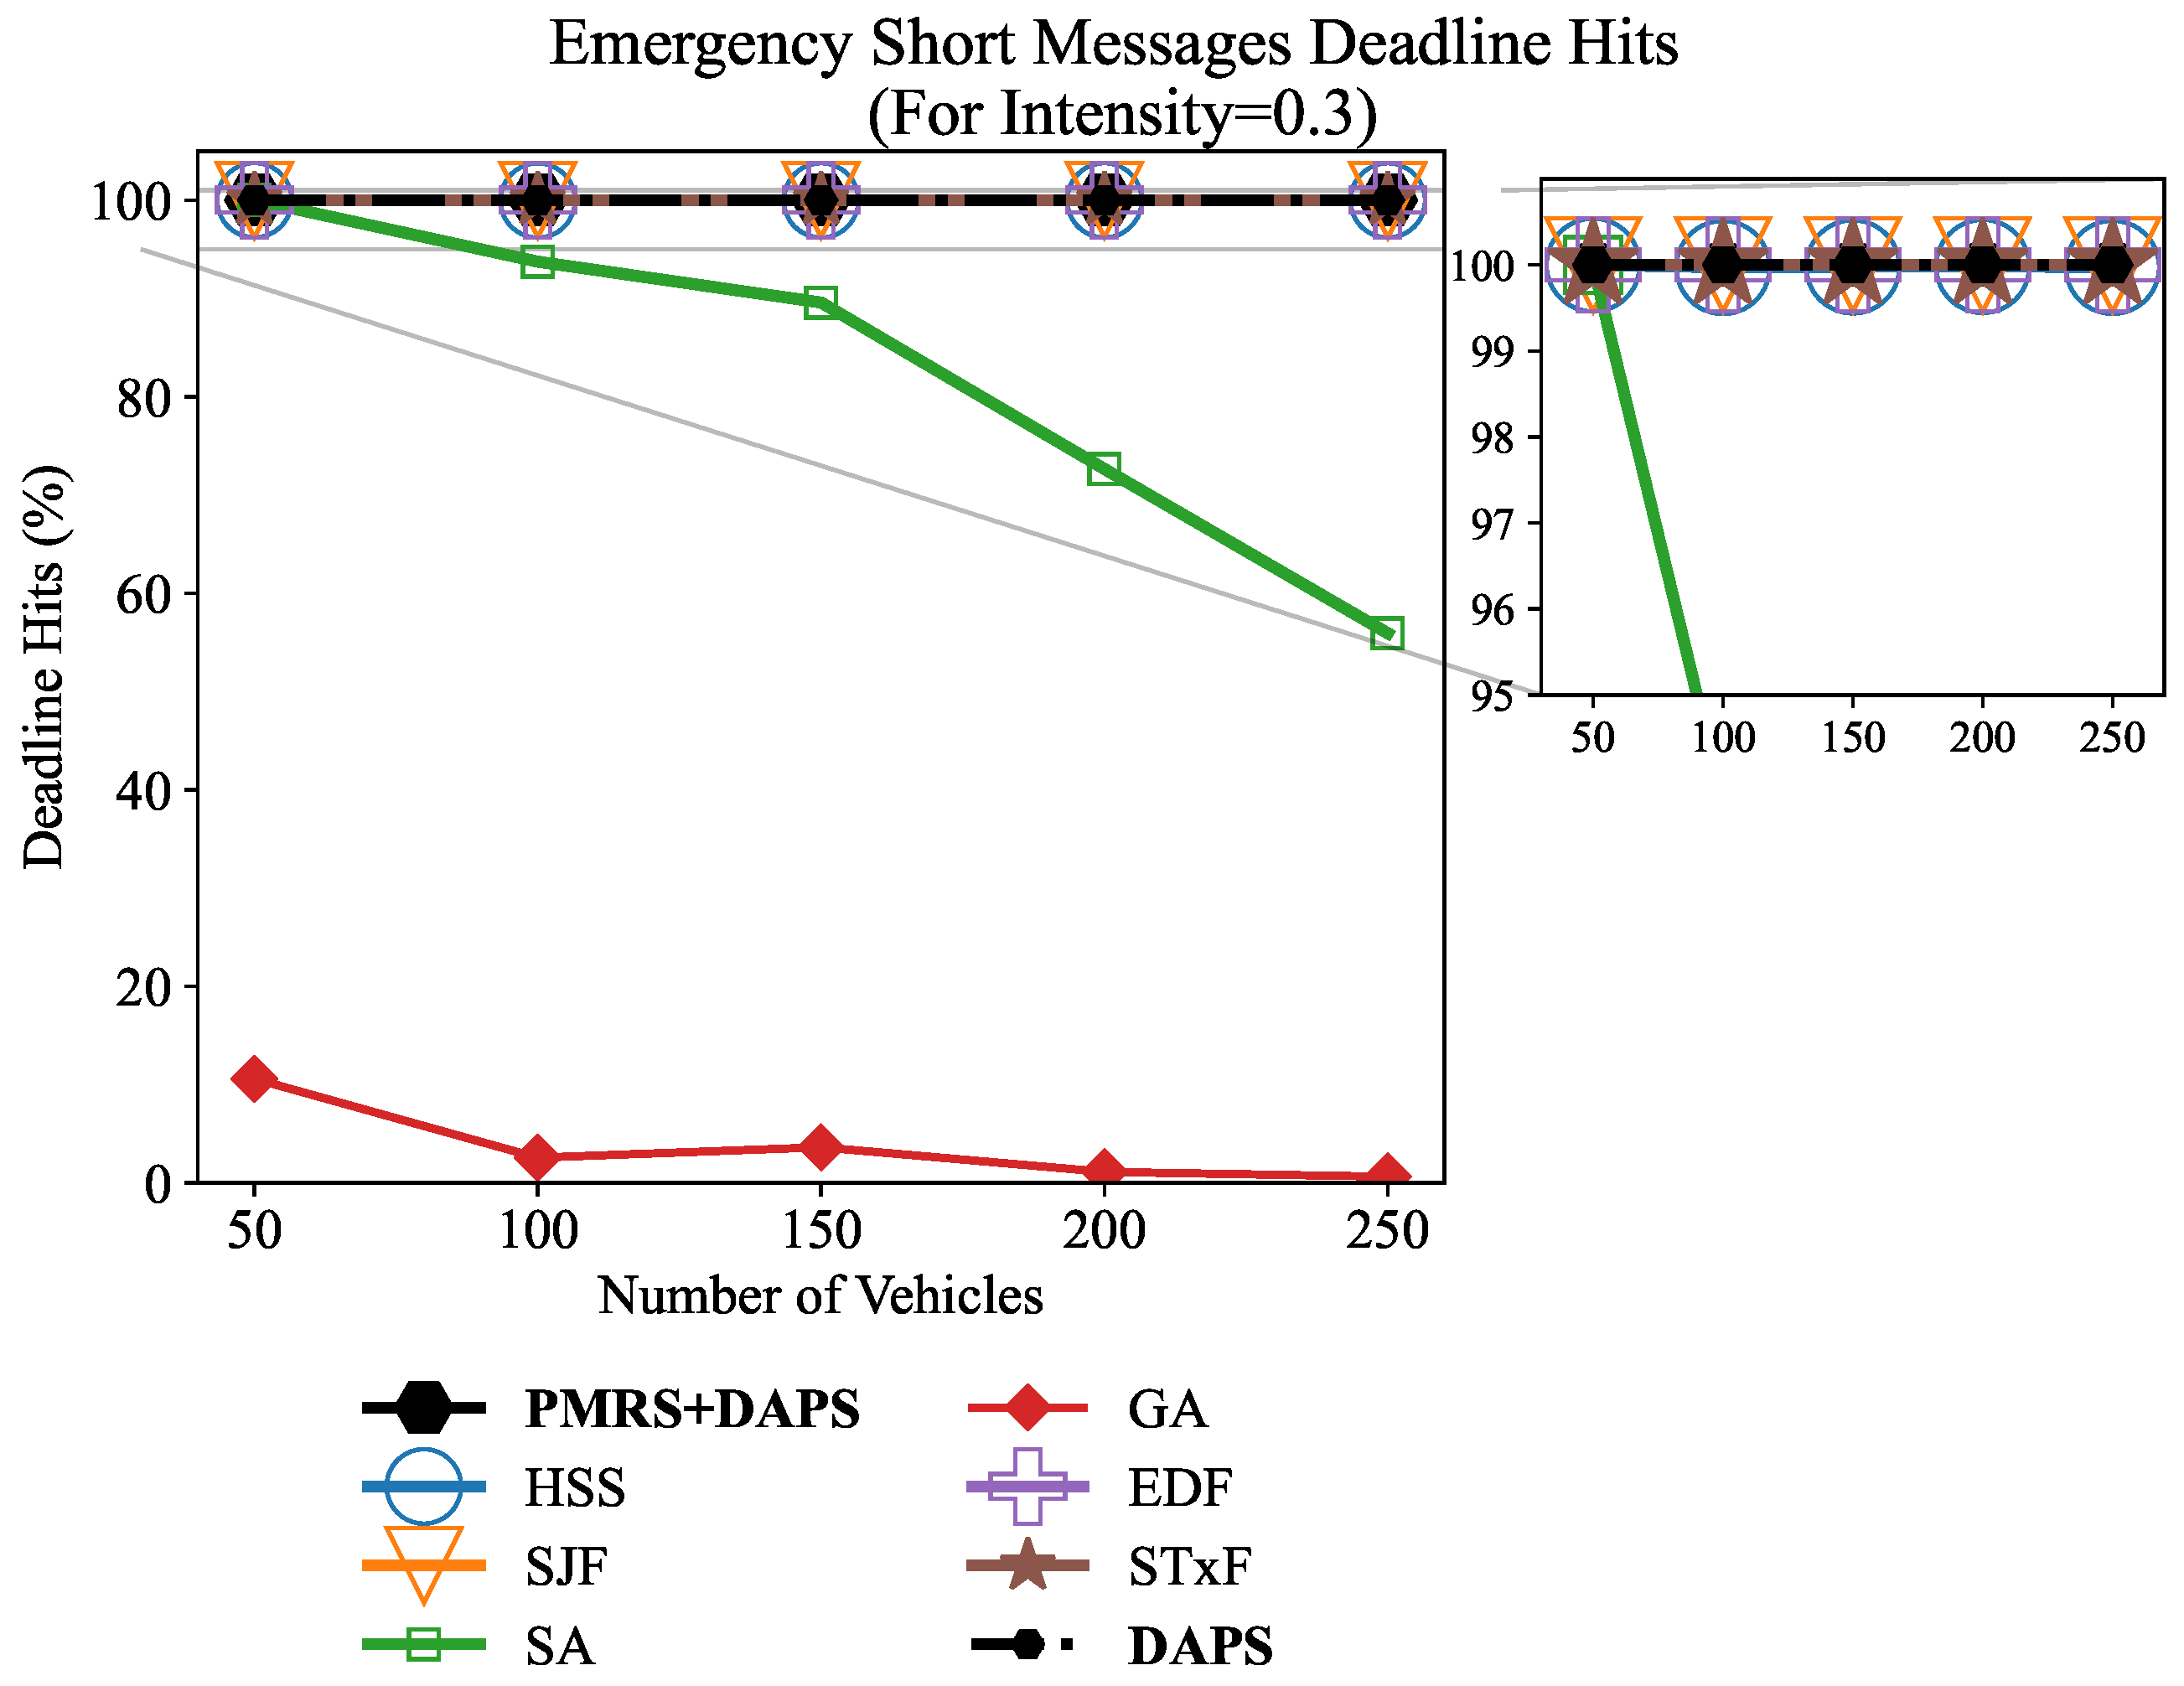
Figure 5 presents the average deadline hit ratio of emergency short messages for varying numbers of vehicles under an emergency event generation intensity of
. The proposed PMRS + DAPS framework achieves perfect deadline satisfaction across all vehicle densities, demonstrating its ability to prioritize and transmit time-critical safety information with minimal delay. Even without PMRS, DAPS performed well because it always schedules the emergency short messages first. The same 100% success rate is also observed for most baseline algorithms (HSS, SJF, EDF, and STxF) because emergency short messages are small in size and can be transmitted quickly within their tight deadlines.
In contrast, the GA algorithm performs extremely poorly, with its deadline hit ratio dropping close to zero percent across all vehicle densities. This degradation results from the high computational complexity and delayed convergence of the genetic algorithm, which significantly increases processing time and leads to extensive deadline violations. GA exhibits a runtime between 20 and 300 ms, frequently surpassing the emergency deadline by itself. The SA algorithm performs slightly better but still fails to meet the deadlines consistently due to similar iterative overhead.
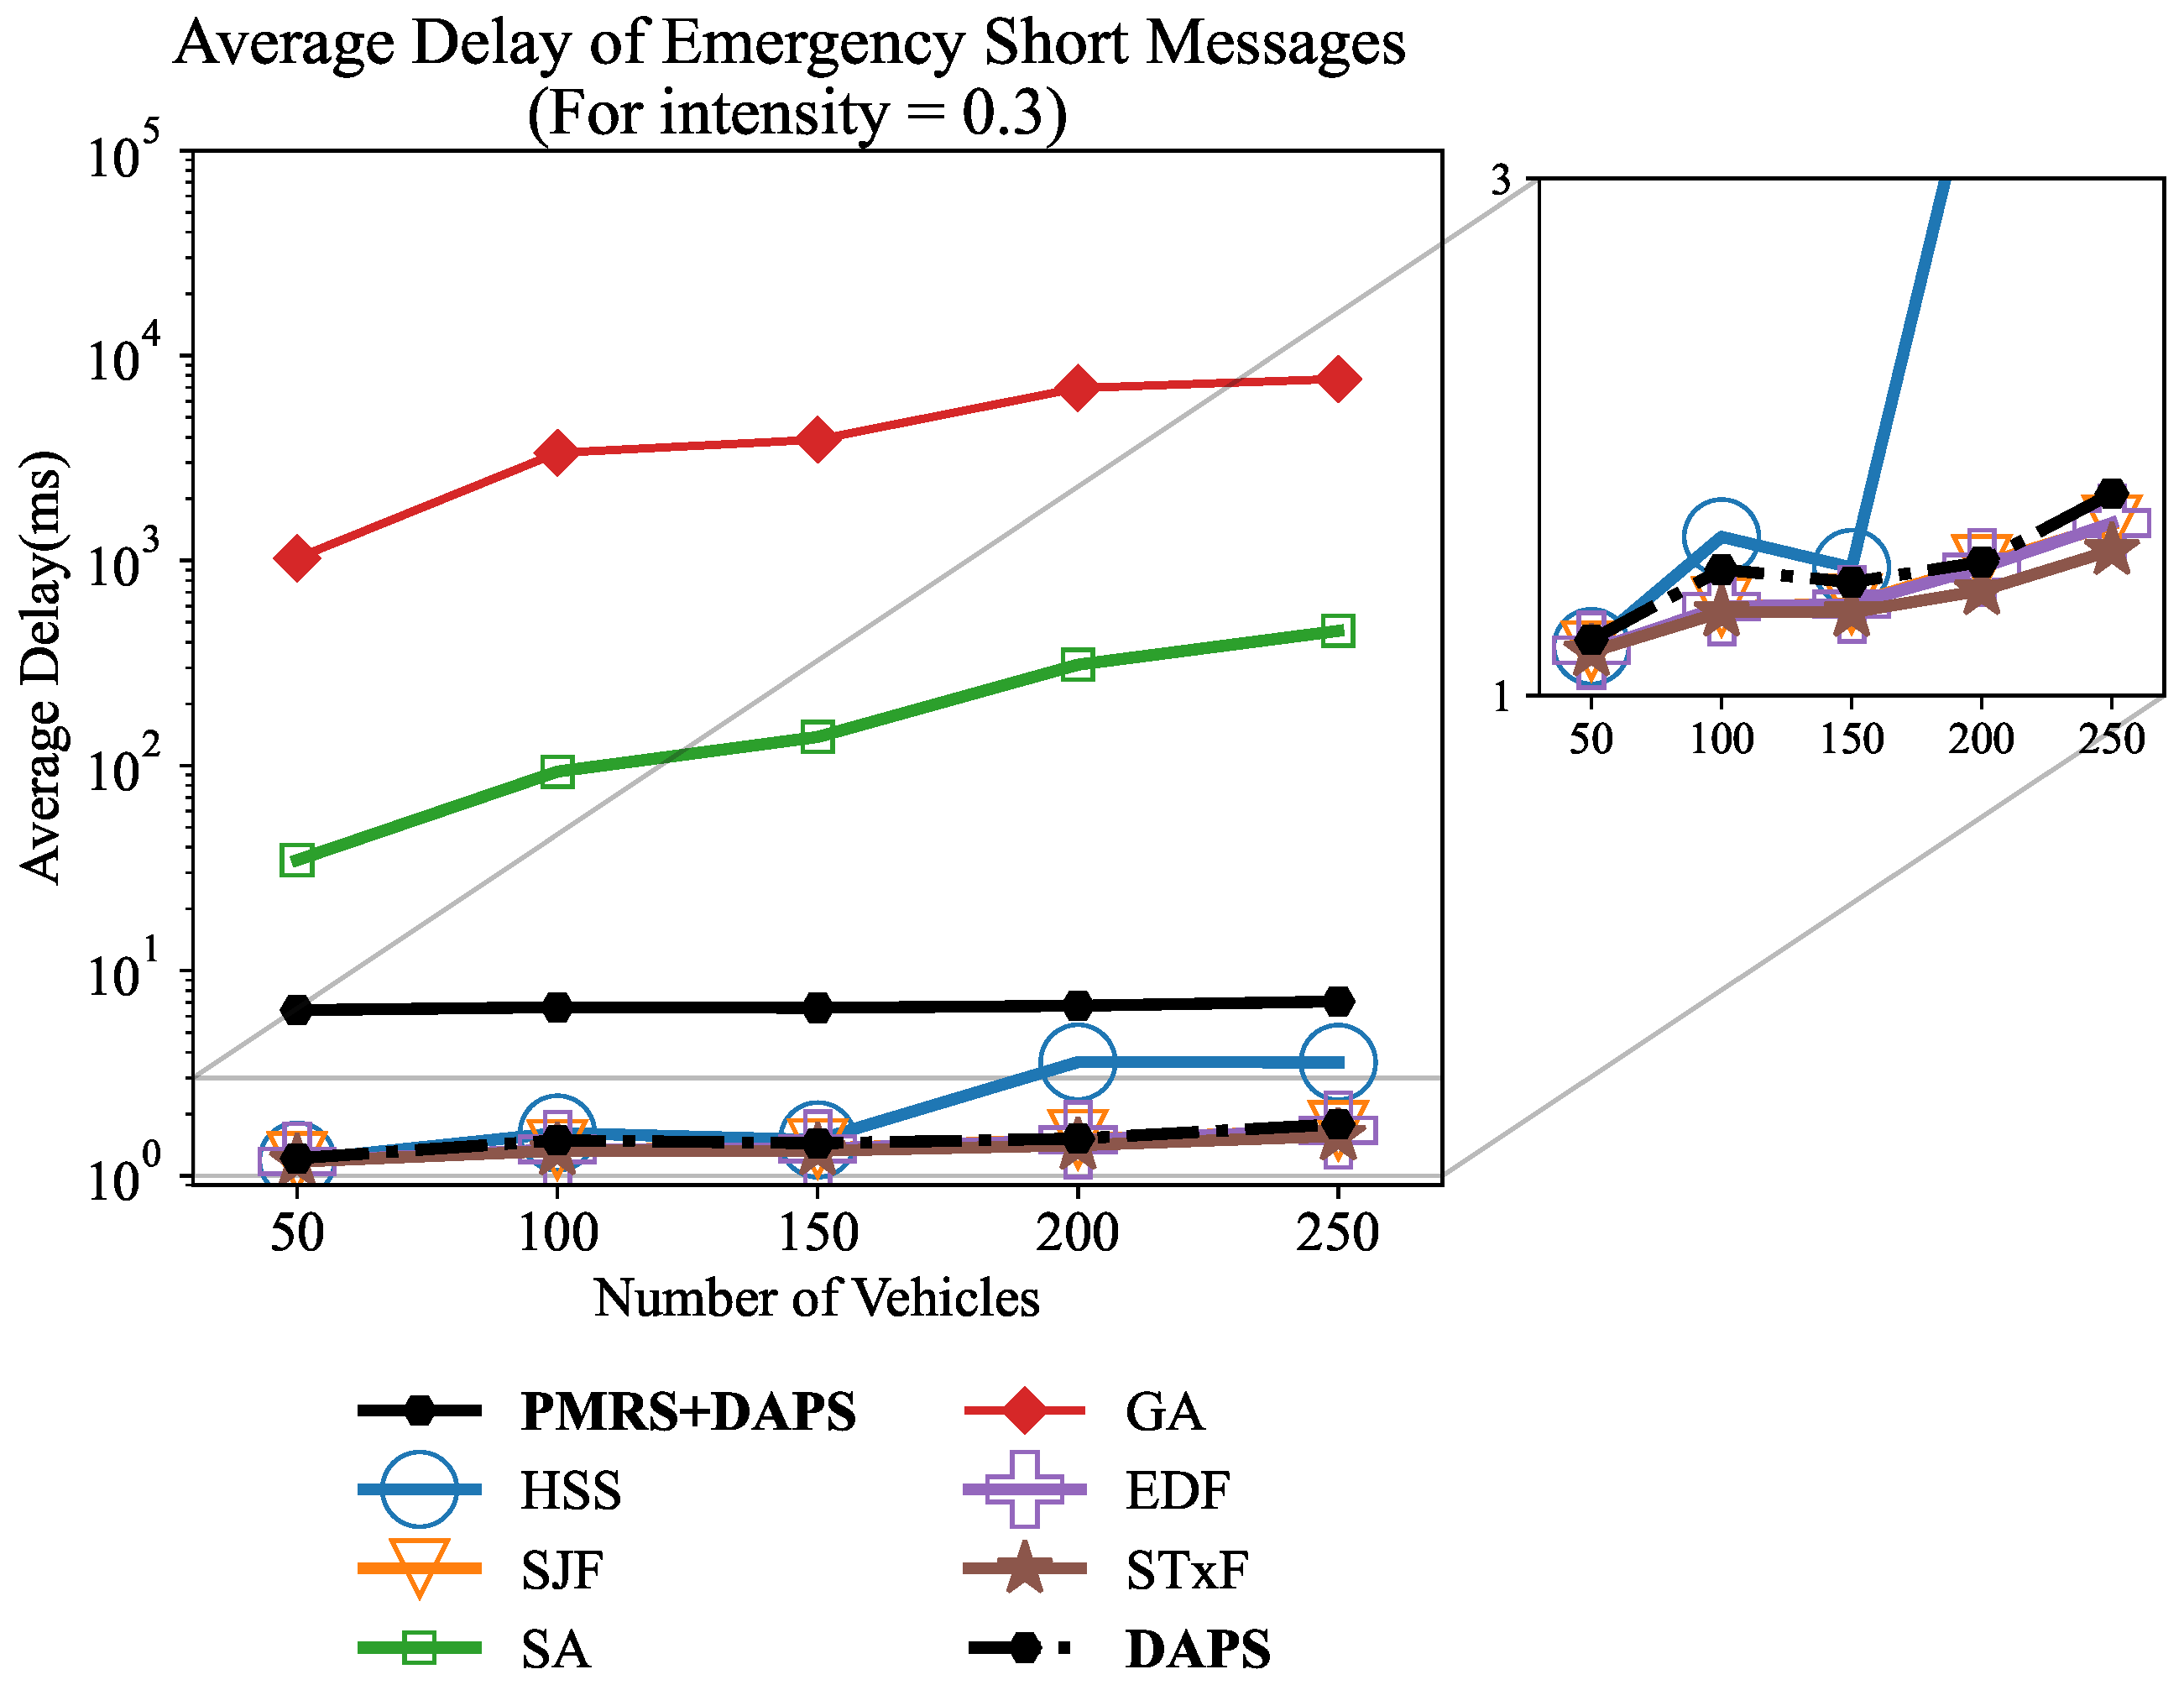
Figure 6 presents the end-to-end average delay of emergency short messages, which accounts for transmission time, queue time, and the algorithm runtimes, under varying vehicle densities at
. The proposed PMRS + DAPS consistently achieves low latency, maintaining an average delay between 6.41 ms and 7.00 ms across all loads. The standalone DAPS exhibits even lower delays, ranging from 1.21 ms to 1.78 ms, confirming its high efficiency in deadline-aware prioritization. The PMRS algorithm adds a minor overhead to the DAPS algorithm but it is still acceptable. Among the baseline methods, HSS, SJF, EDF, and STxF record comparable delays of approximately 1.1–3.5 ms, while SA grows significantly with load, reaching up to 450 ms at 250 vehicles. The GA algorithm performs the poorest, with average delays escalating from 1028.65 ms at 50 vehicles to 7686.87 ms at 250 vehicles, far exceeding the 100 ms emergency deadline.
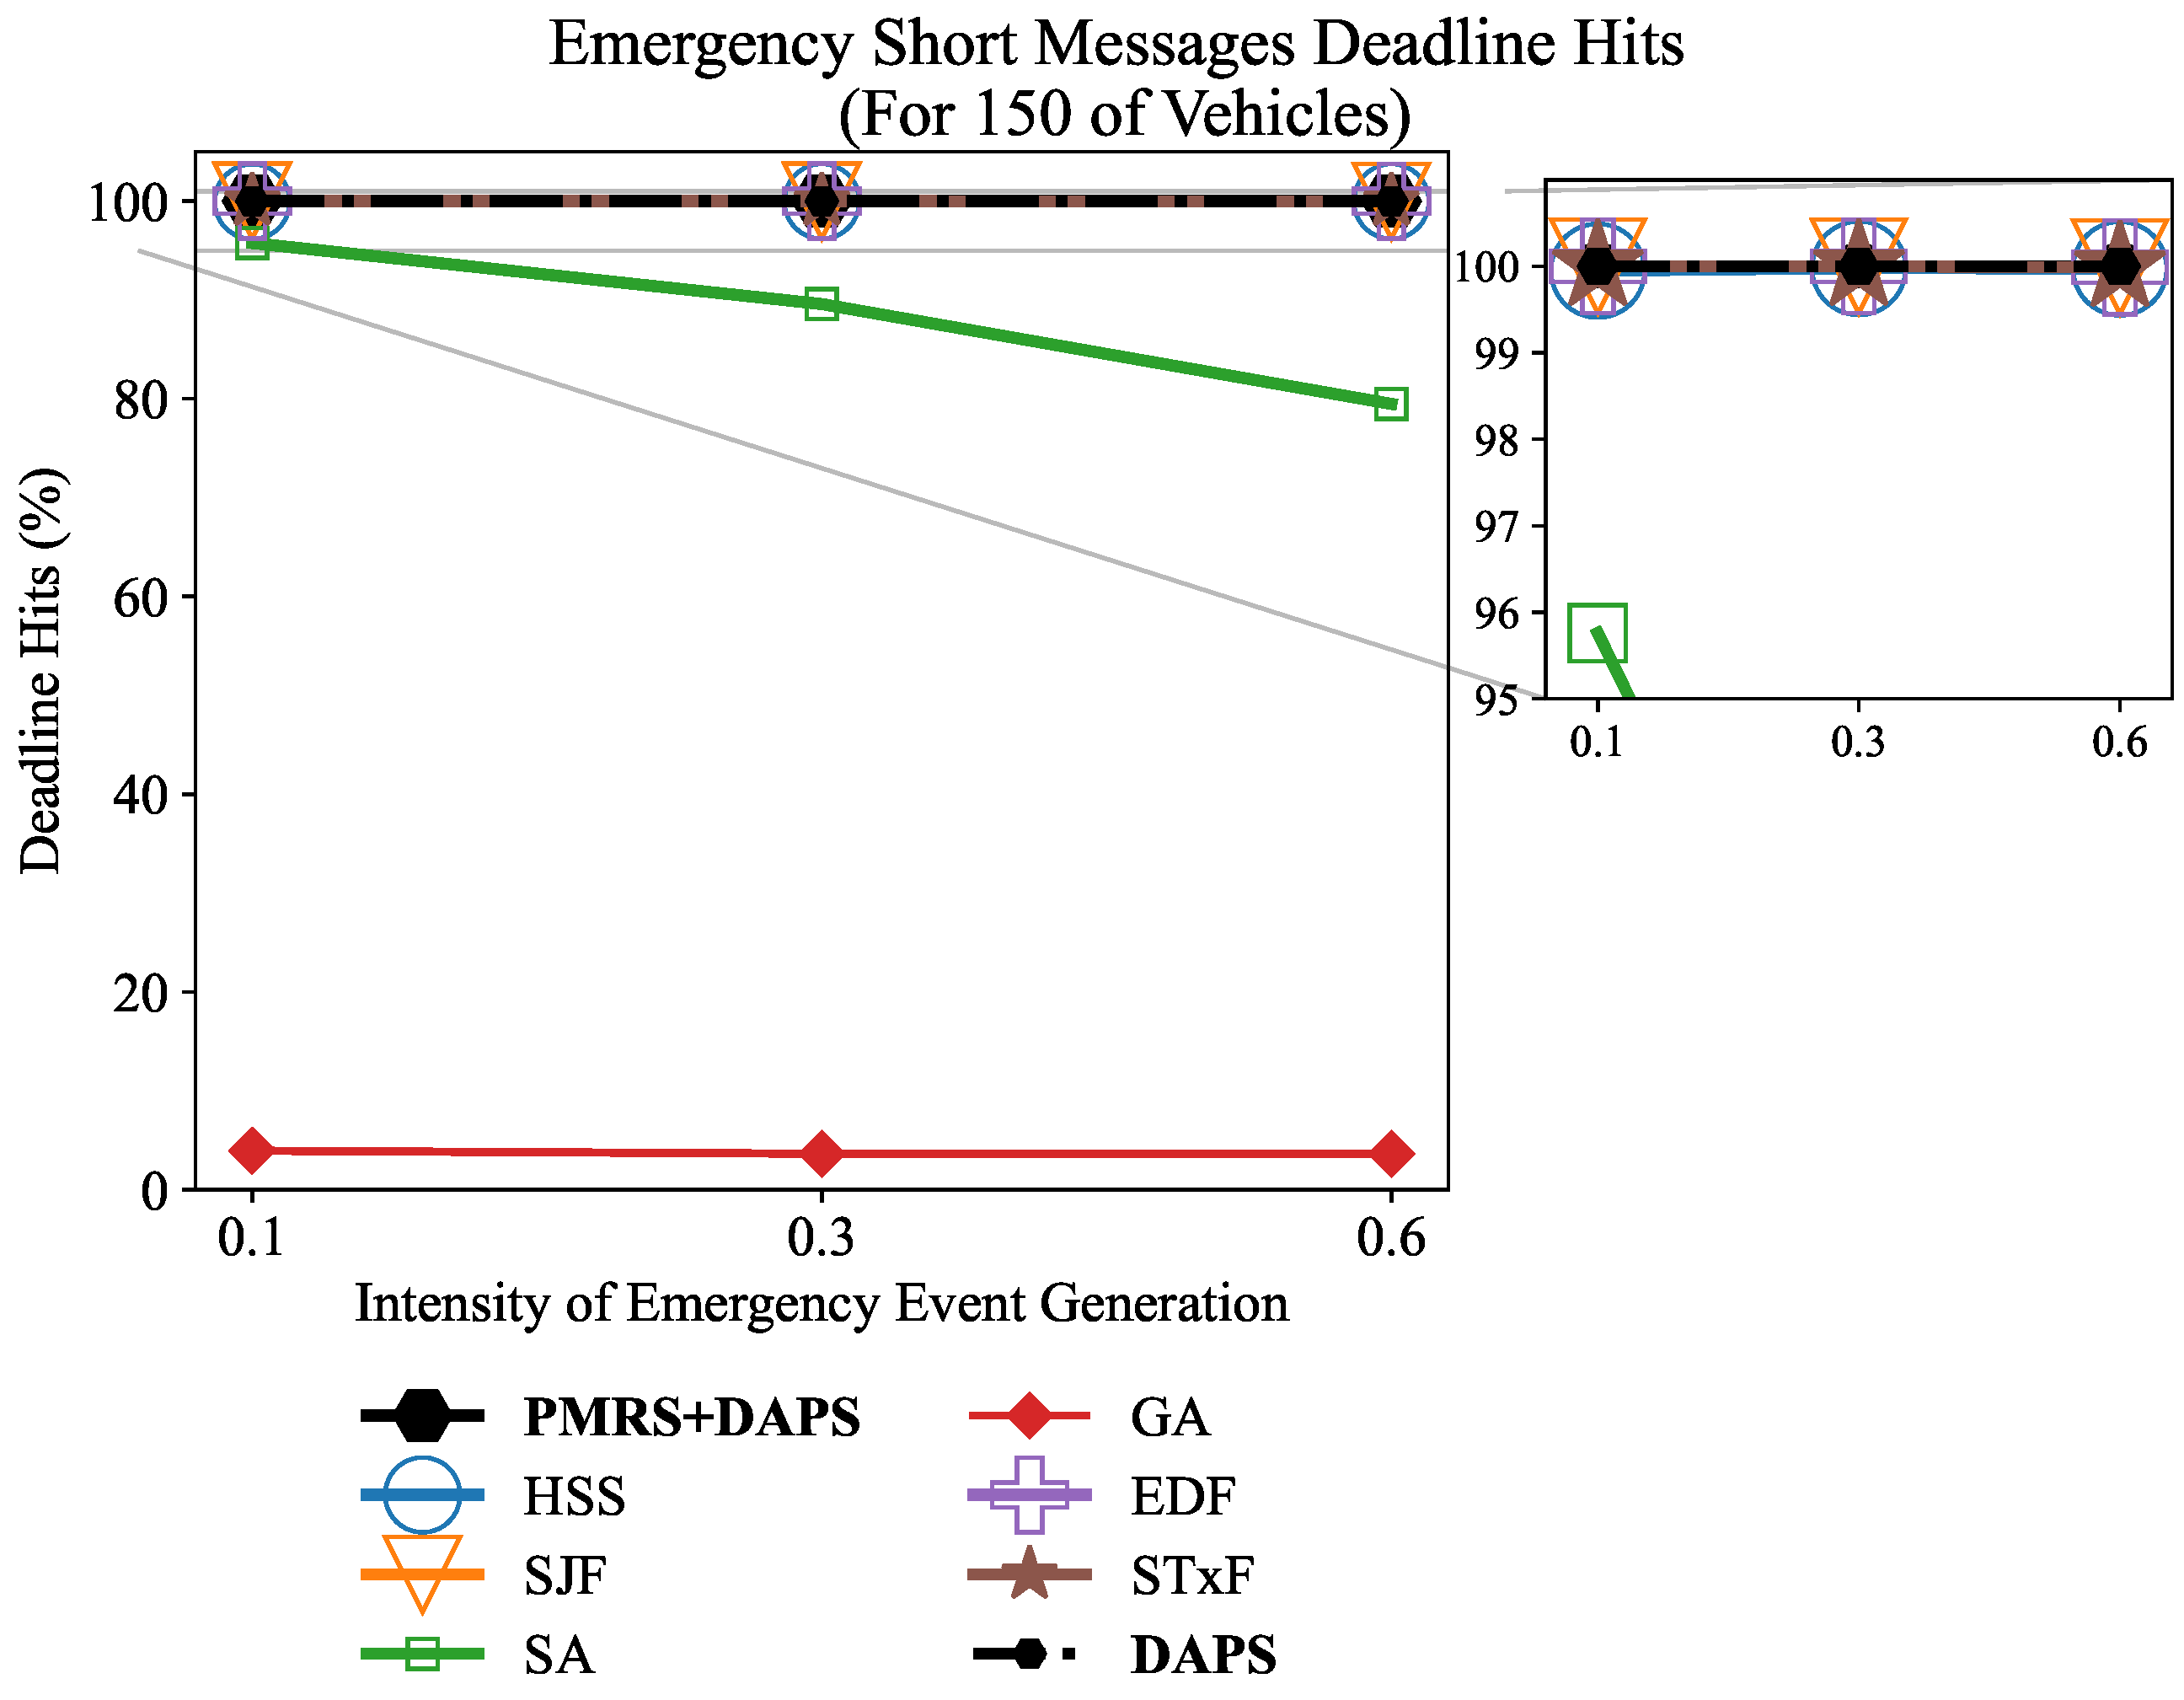
Figure 7 compares the average deadline hit ratios of emergency short messages for 150 vehicles under different emergency generation intensities (
). The proposed PMRS + DAPS consistently achieves 100% deadline satisfaction across all intensities, demonstrating its strong adaptability to varying emergency traffic levels. The standalone DAPS achieves identical performance, also maintaining 100% average deadline compliance, owing to its two-phase separation and priority handling mechanism. All heuristic schedulers—HSS, SJF, EDF, and STxF—also maintain 100% average hit ratios, confirming that their deterministic selection mechanisms can handle moderate network loads effectively. However, the metaheuristic baselines exhibit clear degradation. The SA algorithm experiences a decline from around 95.75% at
to around 79.48% at
, reflecting the impact of its iterative convergence time under high emergency intensity. The GA algorithm performs the worst, ranging in between 3.9% and 3.6%, showing that its long computation time severely restricts its responsiveness to tight emergency deadlines.
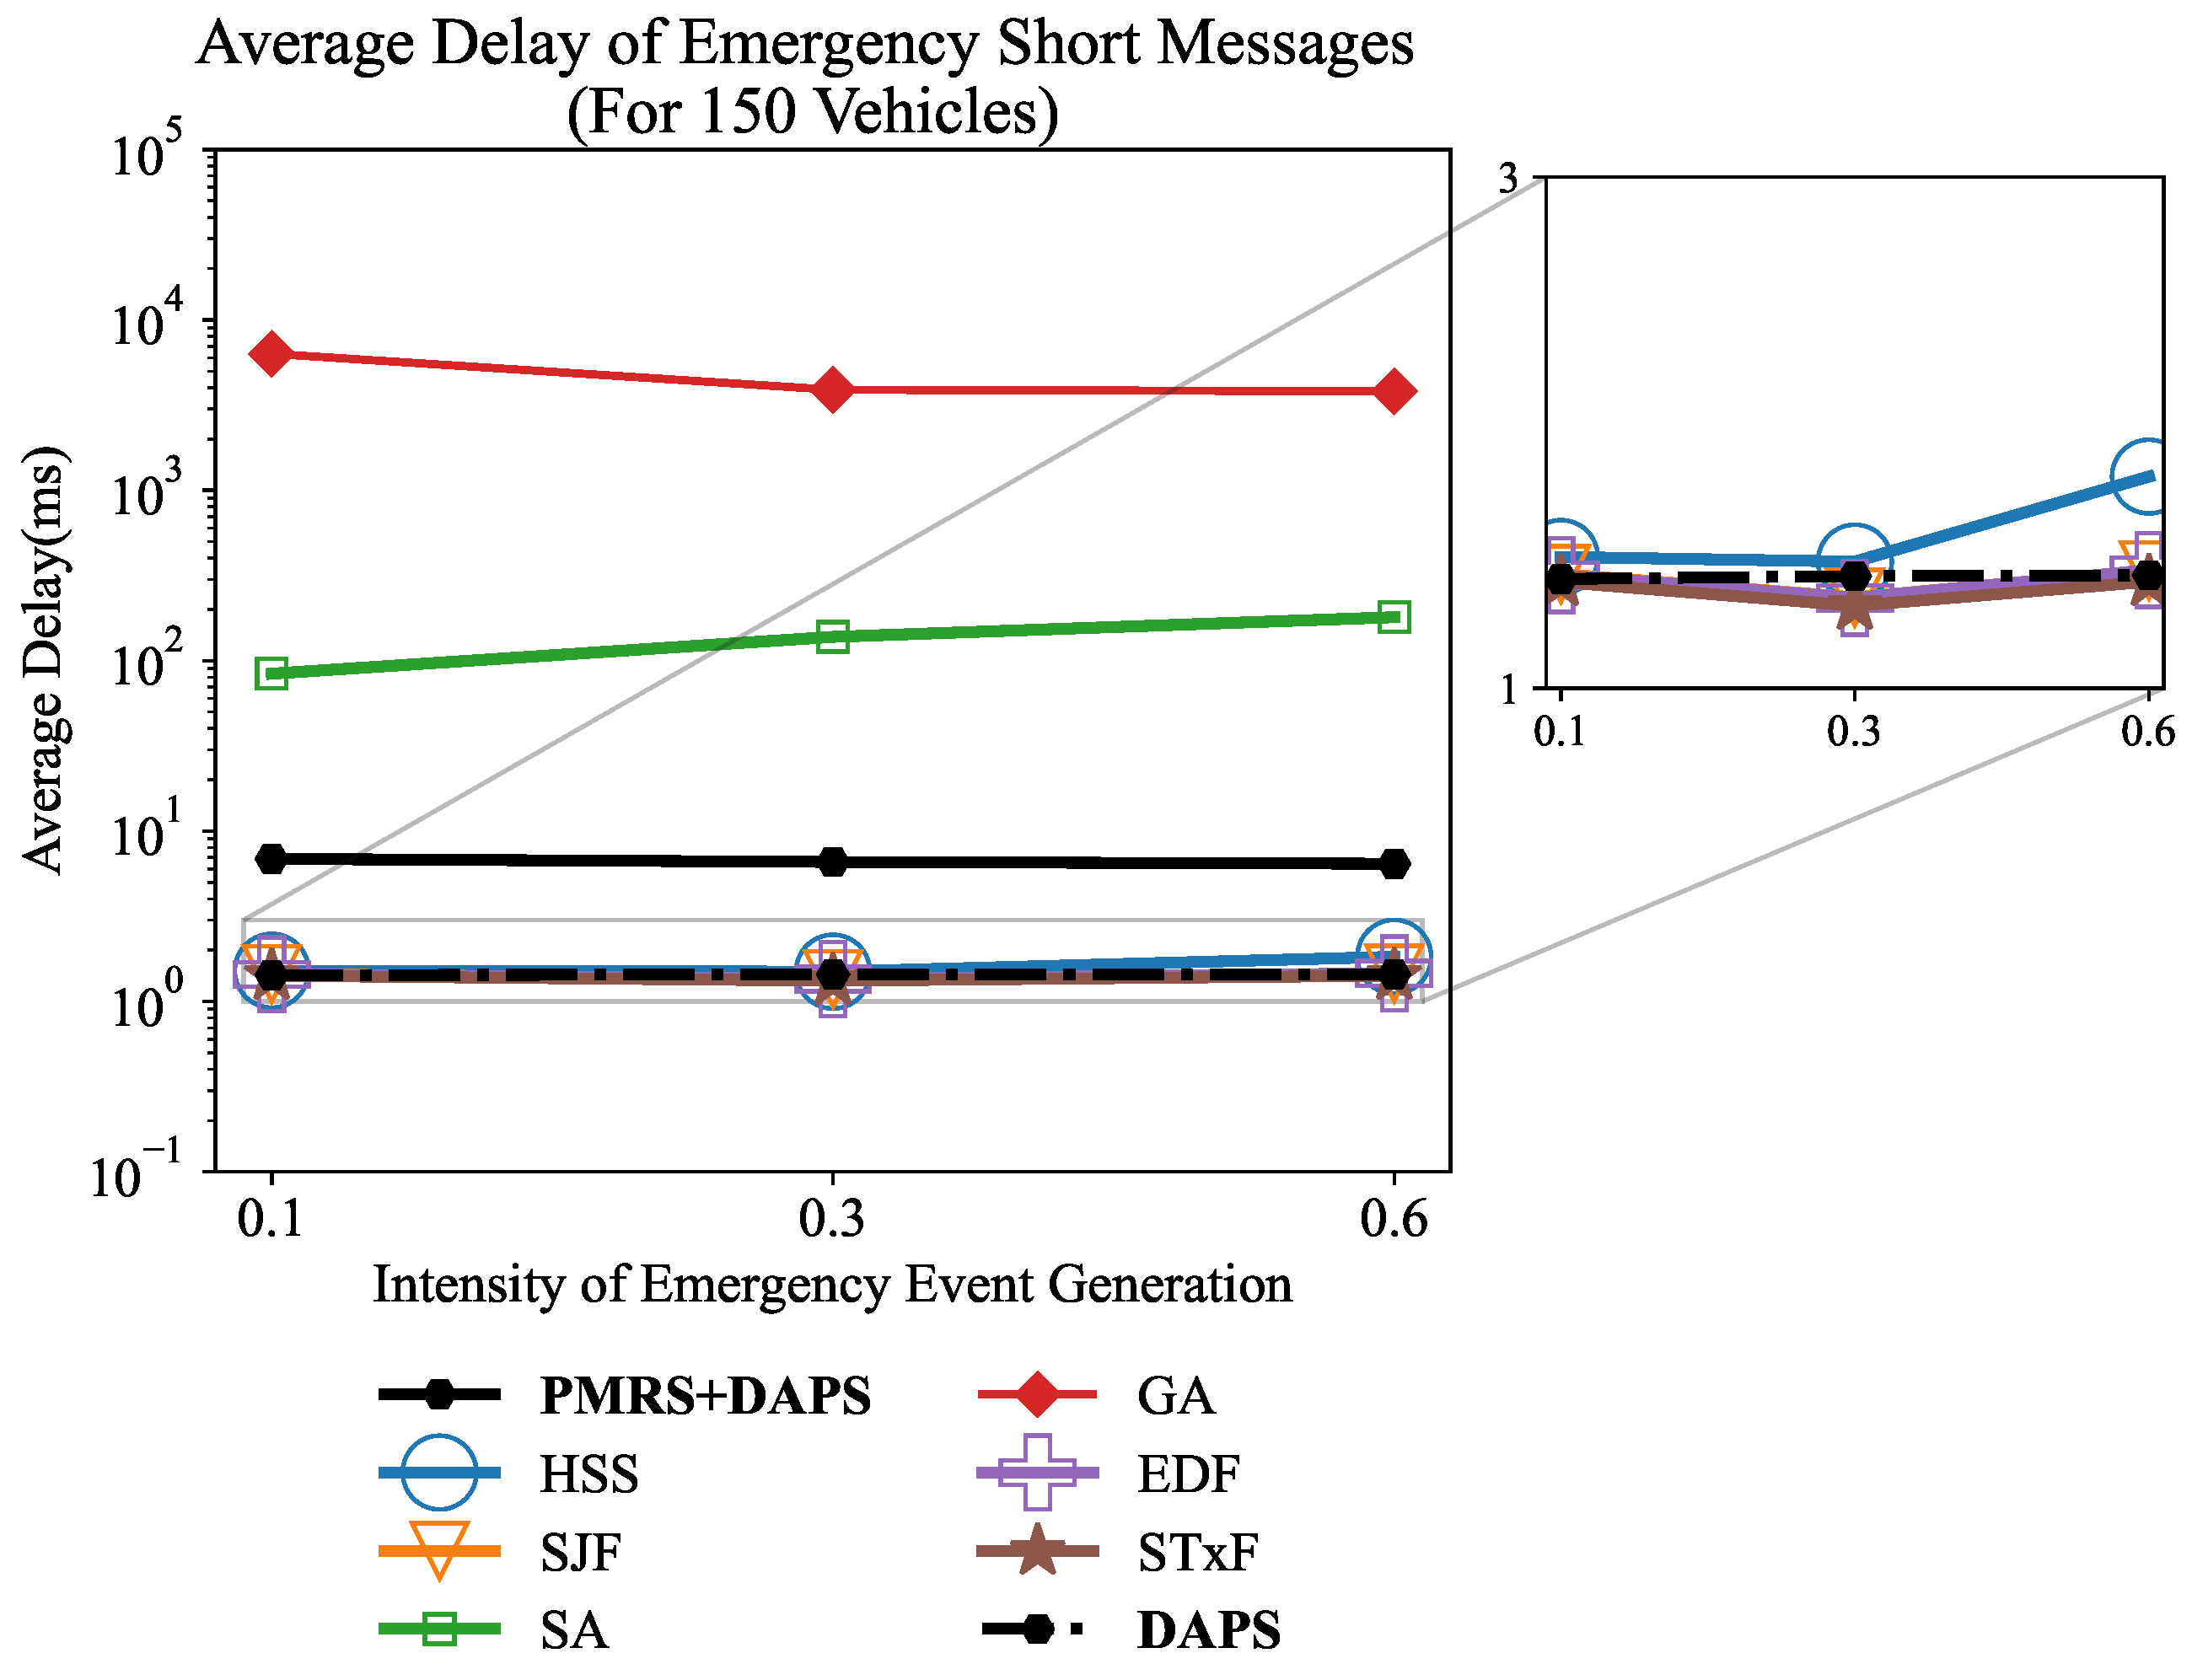
Figure 8 presents the average end-to-end delay of emergency short messages for 150 vehicles under different emergency generation intensities (
). The proposed PMRS + DAPS achieves highly stable ultra-low latency, maintaining average delay of around 6.86 ms across all intensity levels. The standalone DAPS produces the minimum delay overall, varying slightly from 1.42 ms to 1.44 ms, demonstrating its precise deadline-aware prioritization.
All heuristic baselines—HSS, SJF, EDF, and STxF—also show consistent average delays in the narrow band of 1.3–1.8 ms, confirming their ability to handle moderate emergency load deterministically. In contrast, the metaheuristic methods exhibit substantial delay escalation as increases. The SA algorithm has an average of delay between 83.9 ms and 179.9 ms, while the GA reaches extreme delays, averaging more than 4500 ms, more than an order of magnitude beyond real-time limits.
6.3.2. Emergency Supplementary Messages
Emergency events sometimes have supplementary contents (e.g., images of accidents and/or road conditions) that better illustrates the event to the passengers via ARHUD. These supplementary messages containing images for AR have larger data size [
50] (refer to
Table 3) and have dynamic deadlines. That is to say the deadline of these messages depends on the vehicle’s current position and the location where the event has occurred.
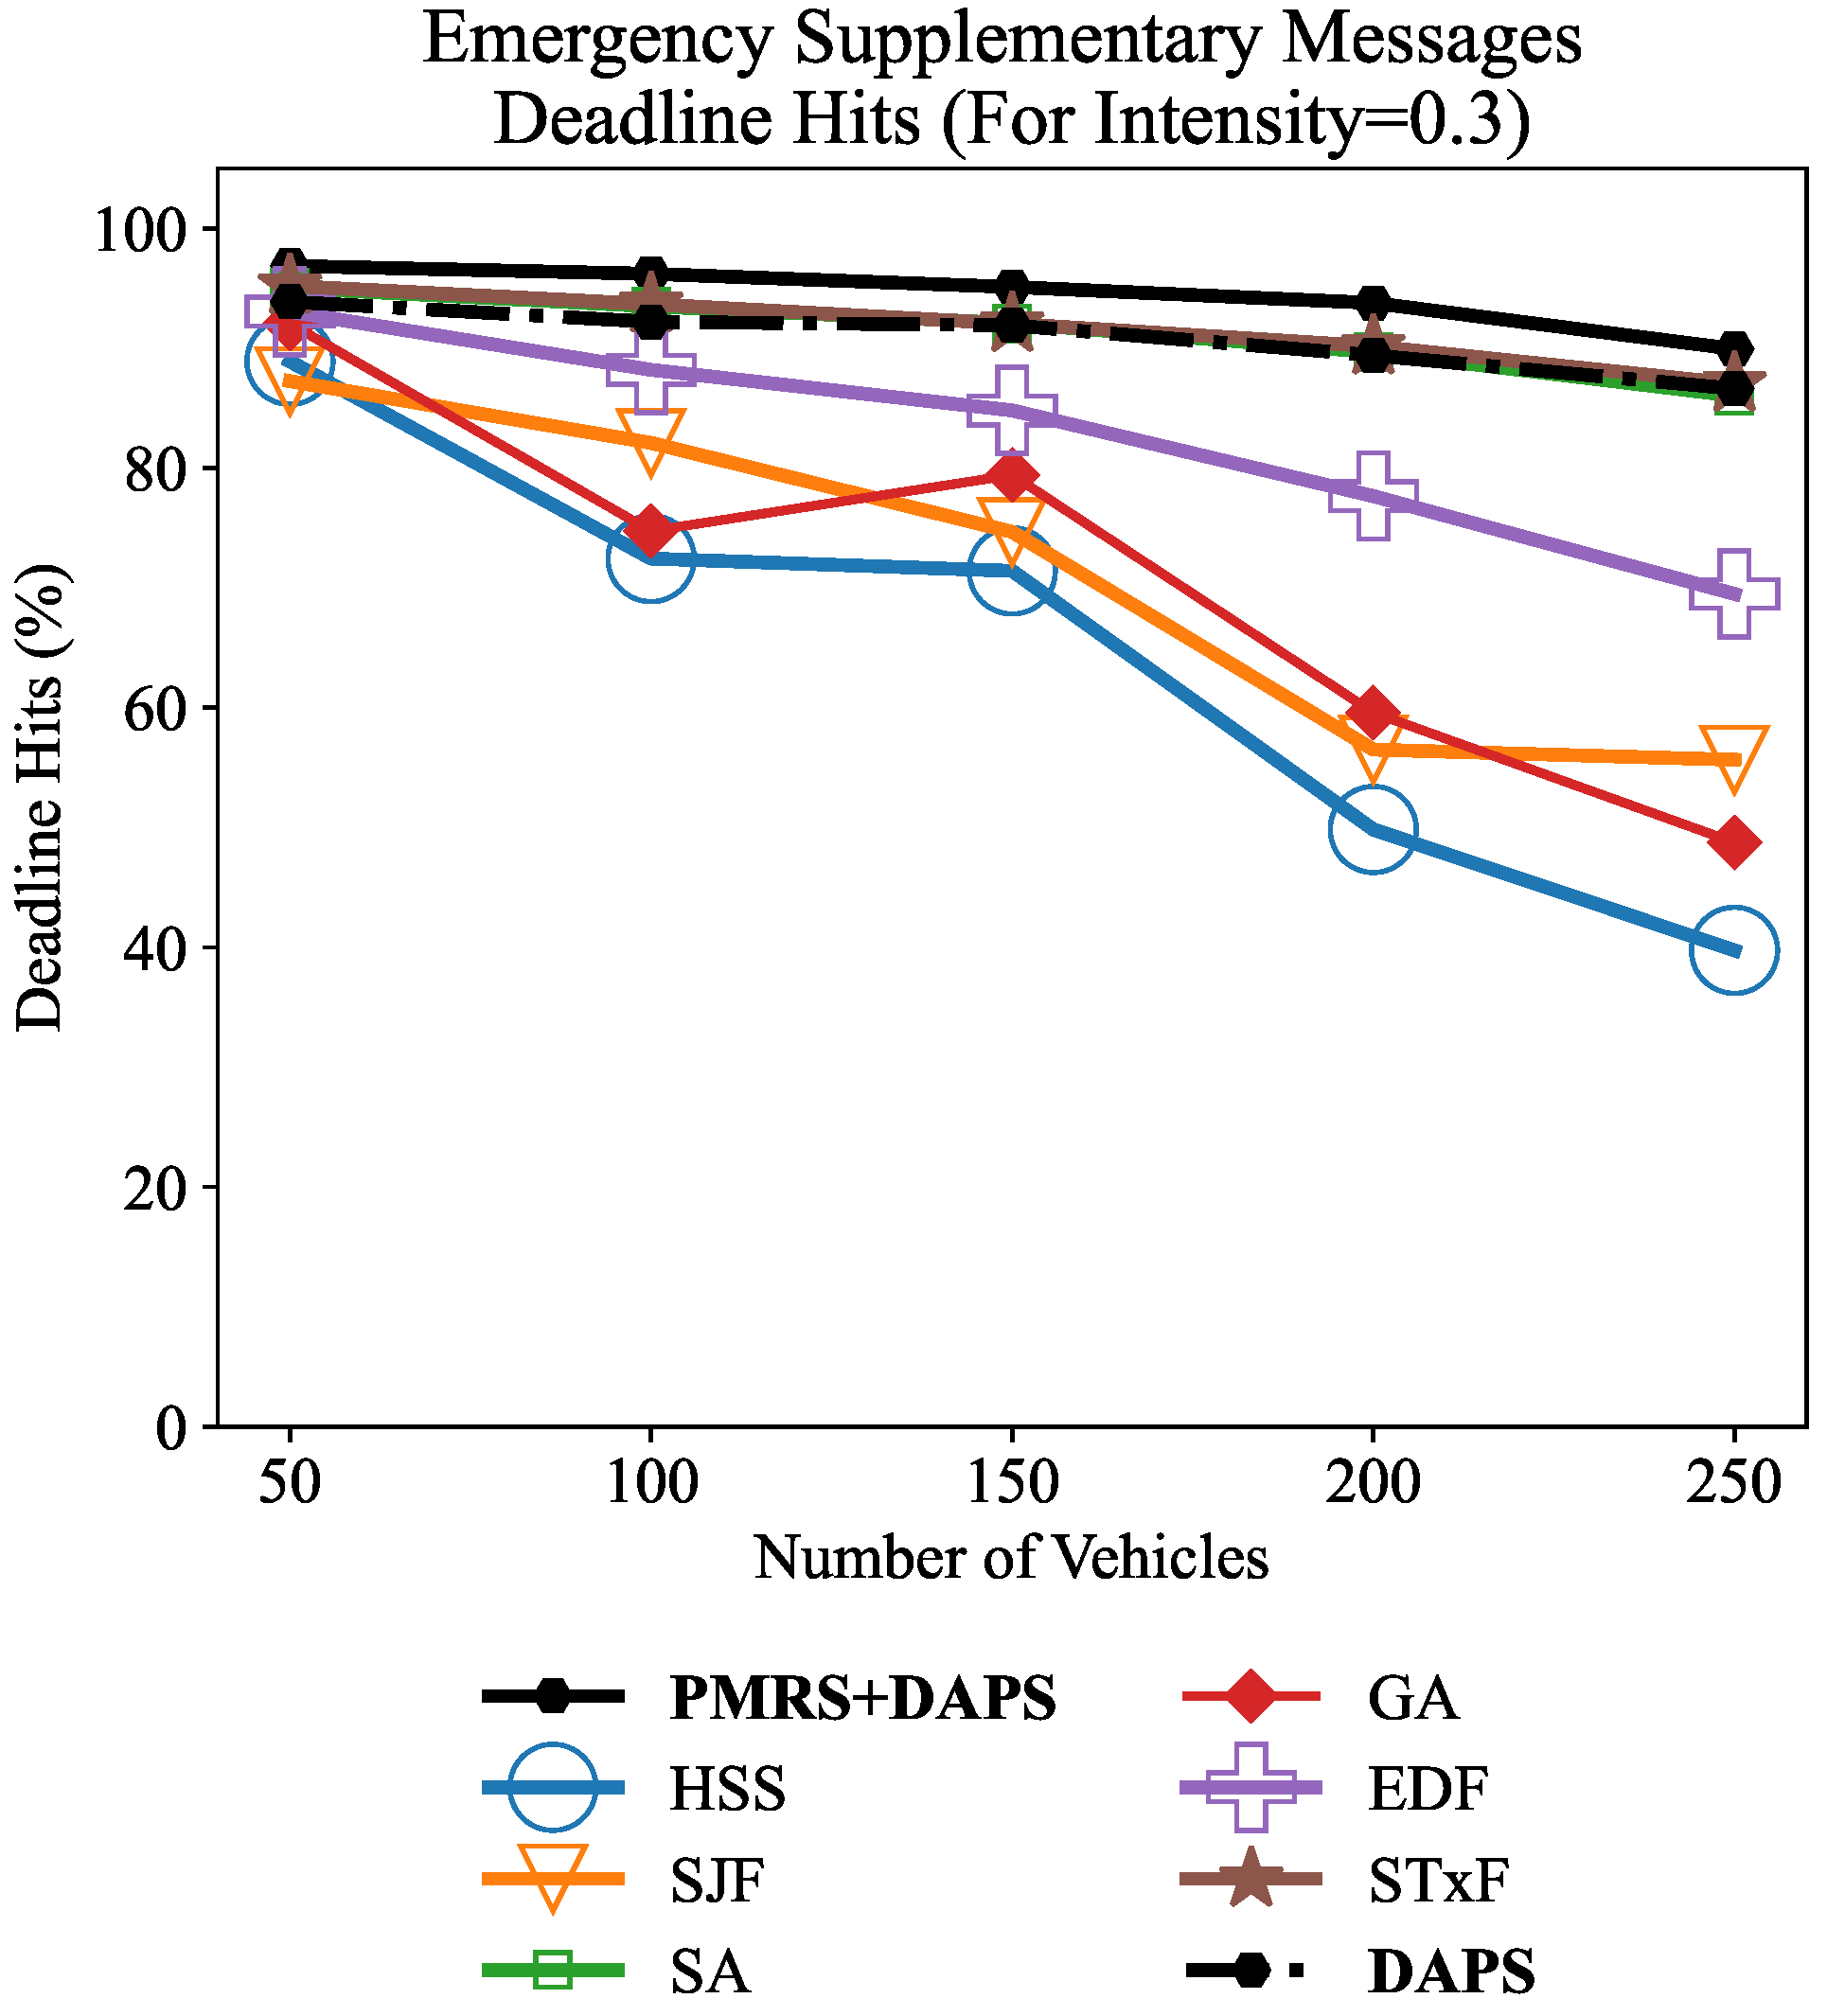
Figure 9 presents the average deadline hit ratio of emergency supplementary messages under varying vehicle densities at
. These messages differ from emergency short messages in both size and timing: they typically range between 5 MB and 10 MB and are associated with dynamic deadlines depending on the distance between the vehicles and the location where the events have occurred. The proposed PMRS + DAPS achieves the most stable and superior performance, showing a slight drop from 96.87% to 89.94% as the density of vehicles increases. The standalone DAPS also demonstrates similar behavior, dropping from 93.87% to 86.62%, owing to its effective priority and deadline-aware scheduling. Among the baseline methods, EDF, SJF, and STxF sustain high performance at lower densities (around 87–95%) but gradually decline to (55–70)% as the number of vehicles rises. Only the deadline hit ratio for STxF remains above acceptable rate at around 87% as the load increases. The SA experiences a similar performance like the STxF and DAPS, while GA performs the weaker overall, falling from 92.05% to 48.74%. HSS shows the most significant decrease of performance as the deadline hit ratio drops from 88.90% to 39.74%, reflecting its limited adaptability to heavy-load conditions with large payloads.
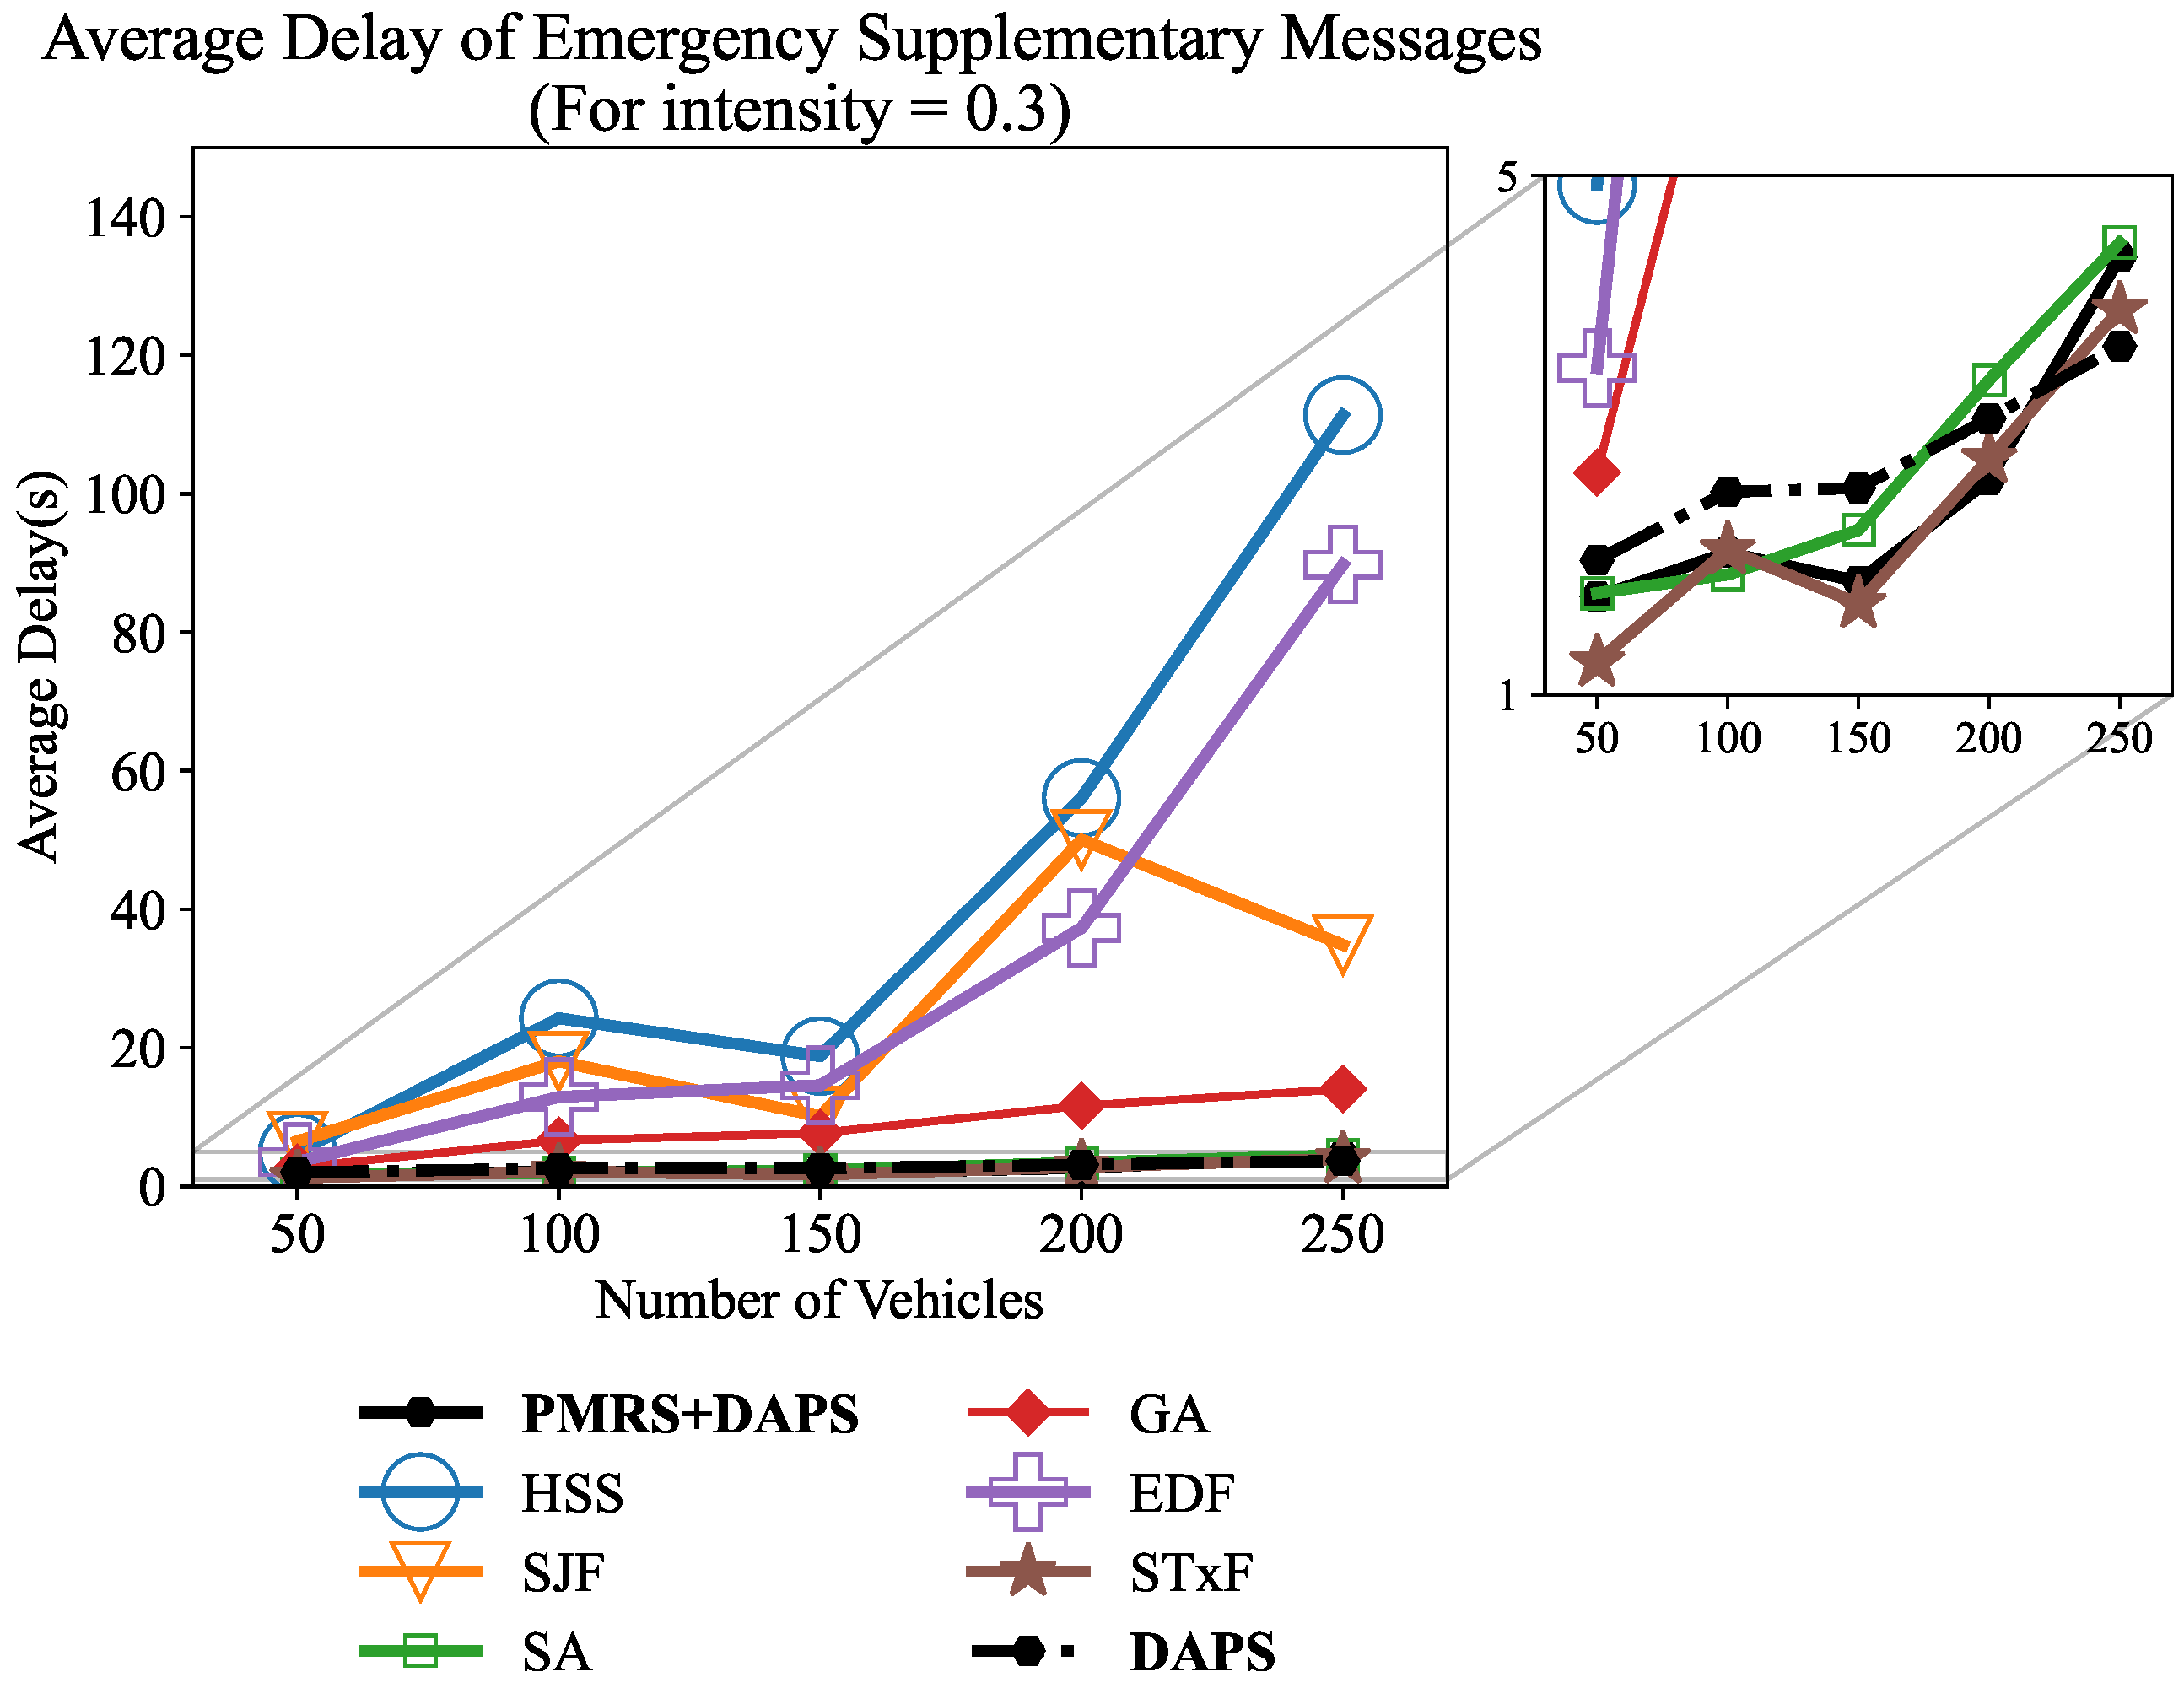
Figure 10 illustrates the average end-to-end delay of emergency supplementary messages for different numbers of vehicles when
. Because these messages are substantially larger, their transmission delay is naturally higher than that of emergency short messages. The proposed PMRS + DAPS delivers the most consistent low-latency performance, maintaining average delays between 1.75 s and 4.36 s as the number of vehicles grows from 50 to 250. The standalone DAPS follows a similar trend from 2.03 s to 3.68 s; this is because they have very similar deadline hit ratios. The heuristic baselines, STxF as well as the metaheuristic SA, exhibit comparable average delays, generally within the 1–4 s range, but experience slight increases at higher densities due to queue buildup. In contrast, the heuristic EDF and SJF and the metaheuristic GA showed longer delays. EDF’s average delay increases as far as 89.78 s when there are 250 vehicles in the system. The SJF also performs poorly like EDF reaching maximum delay of 50 s. The GA algorithm’s average value also rise well above the flexible-deadline thresholds, occasionally extending beyond 14 s, as iterative convergence and population-based search introduce computational latency that compounds with transmission and queuing times. Lastly, the HSS performed very poorly demonstrating a delay of as high as 111.35 s. This is due to it always opting for the local best instead of finding a global best solution.
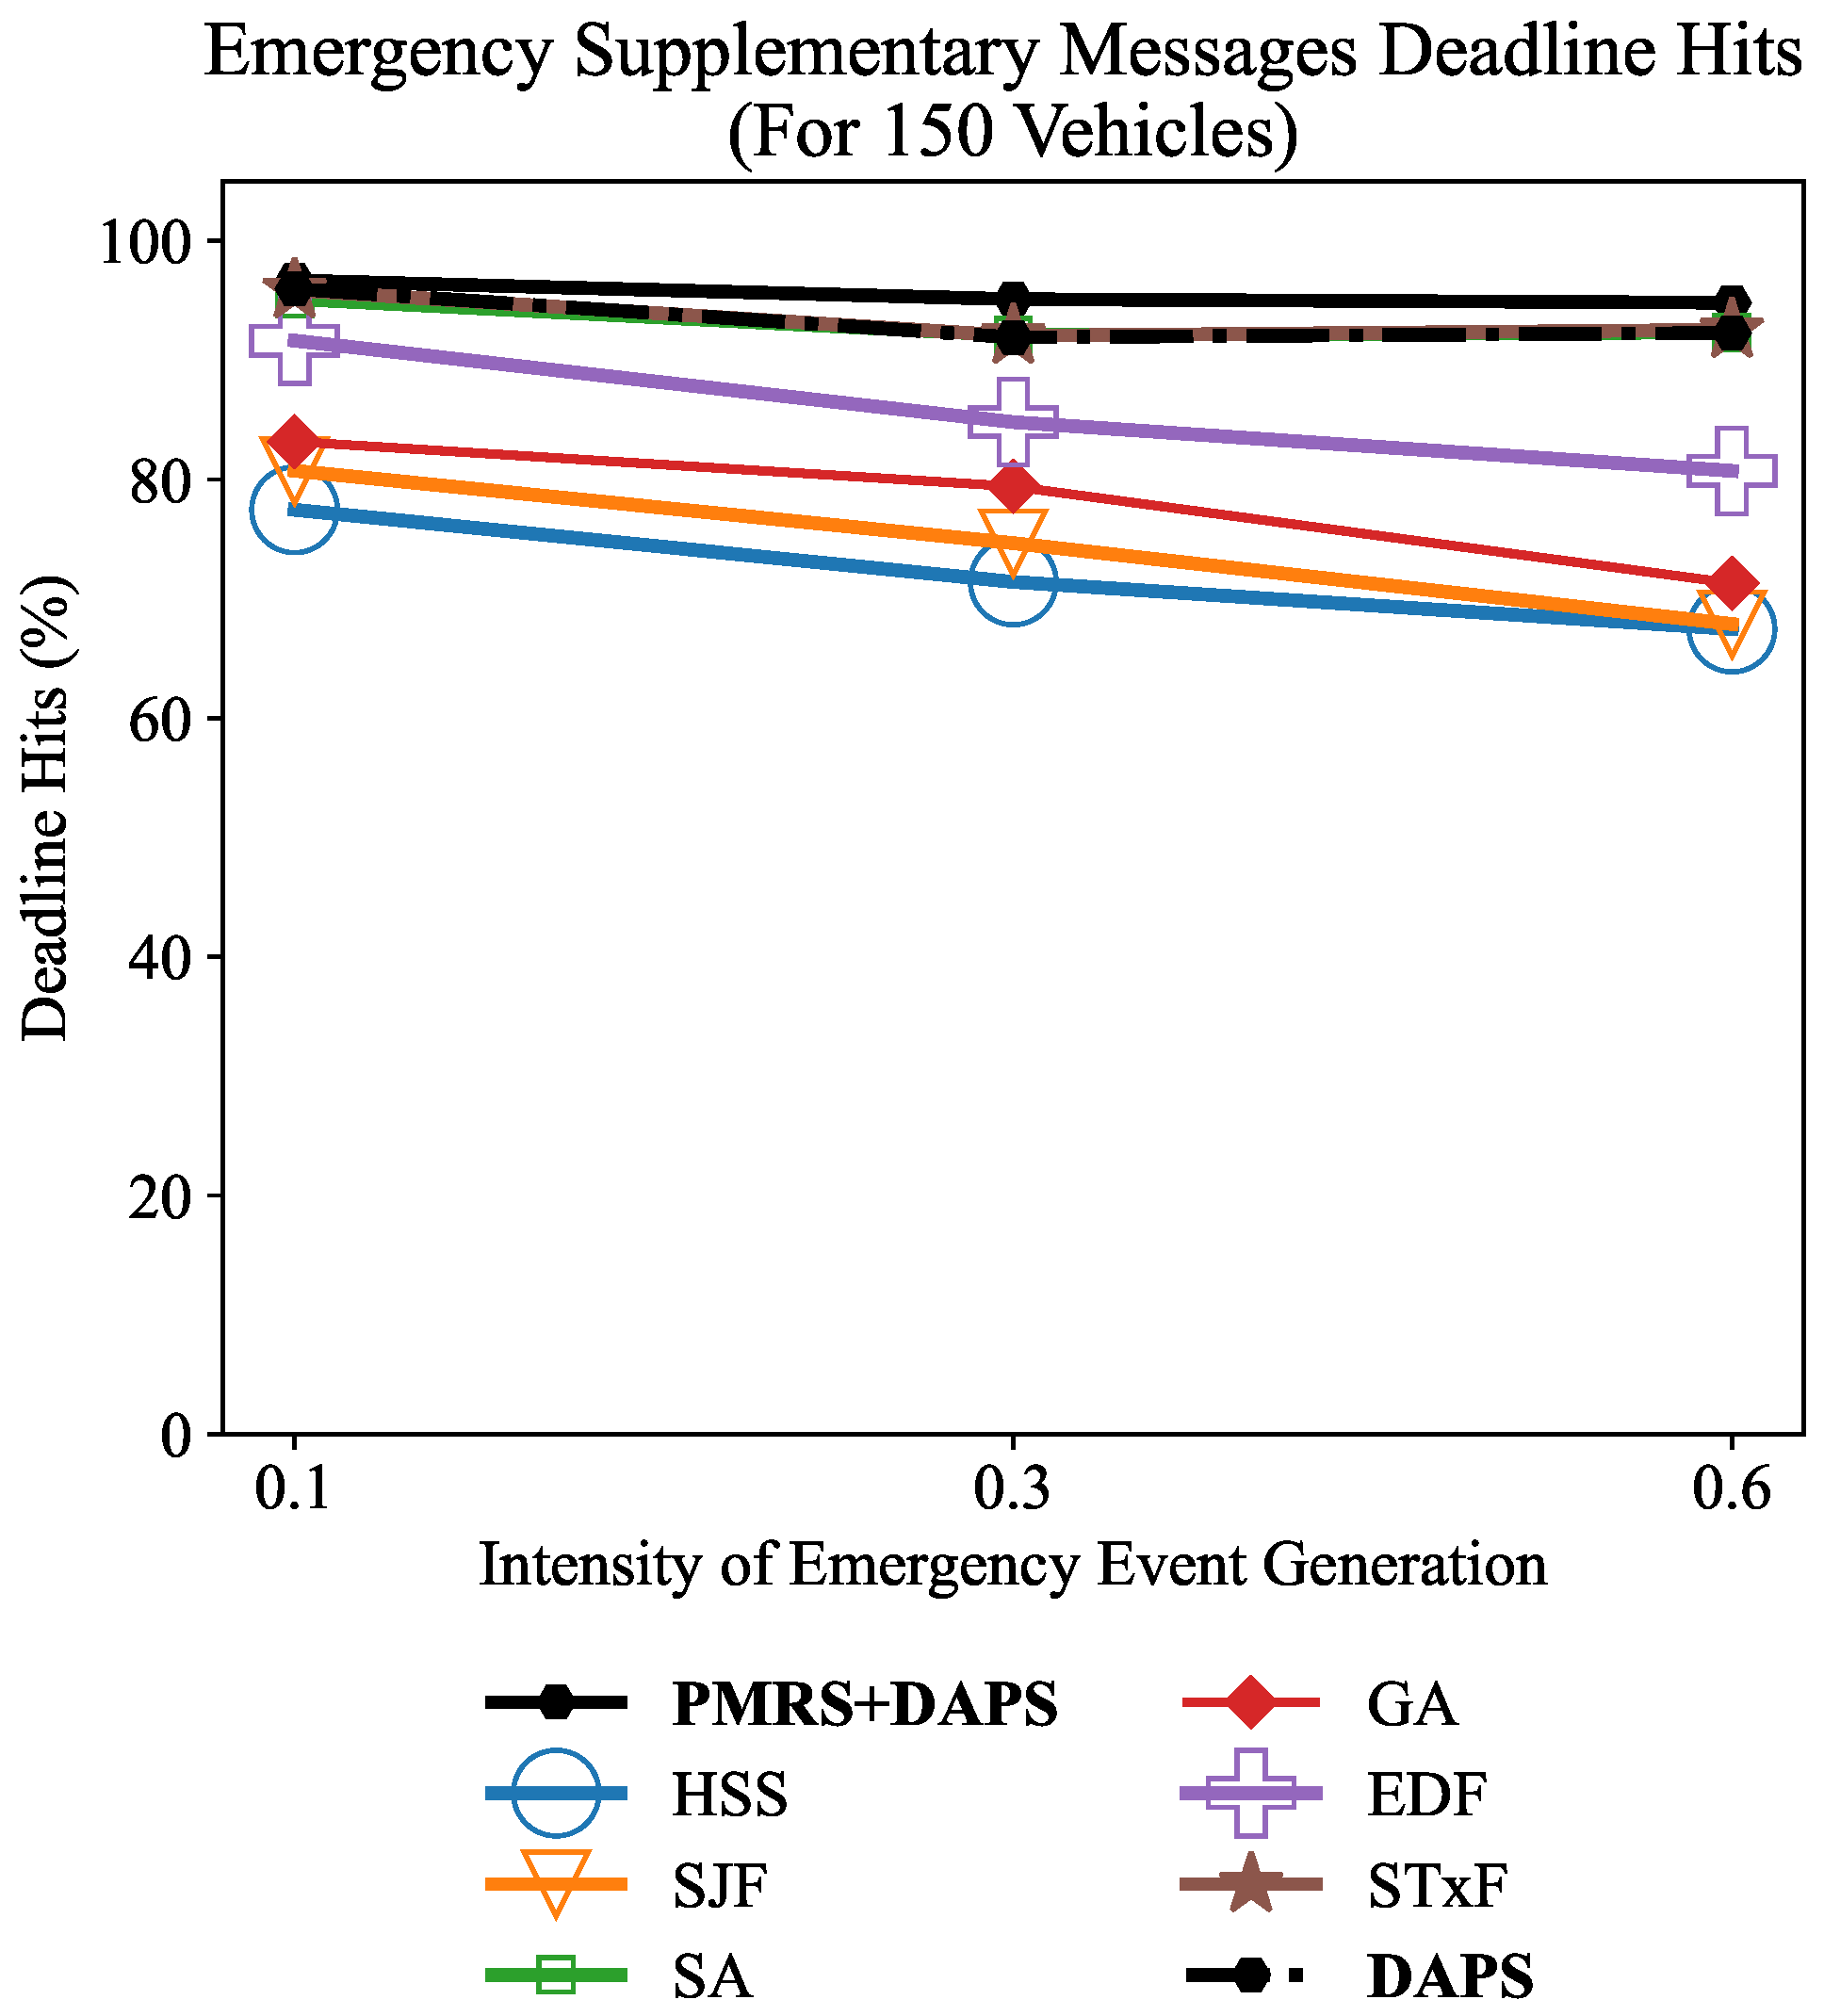
Figure 11 shows the average deadline-hit ratios of emergency supplementary messages for 150 vehicles at
. The proposed PMRS + DAPS sustains the highest reliability, achieving 96.67%, 95.11% and 94.81% deadline hits. The performance of the standalone DAPS and baseline SA and STxF are very close with the proposed algorithms. The performance of EDF, SJF, and HSS drops significantly under 80% demonstrating the weakness of the local optimization nature of the heuristic baselines. The performance of GA demonstrates the iterative nature failed to find optimal solution due to increased search space.
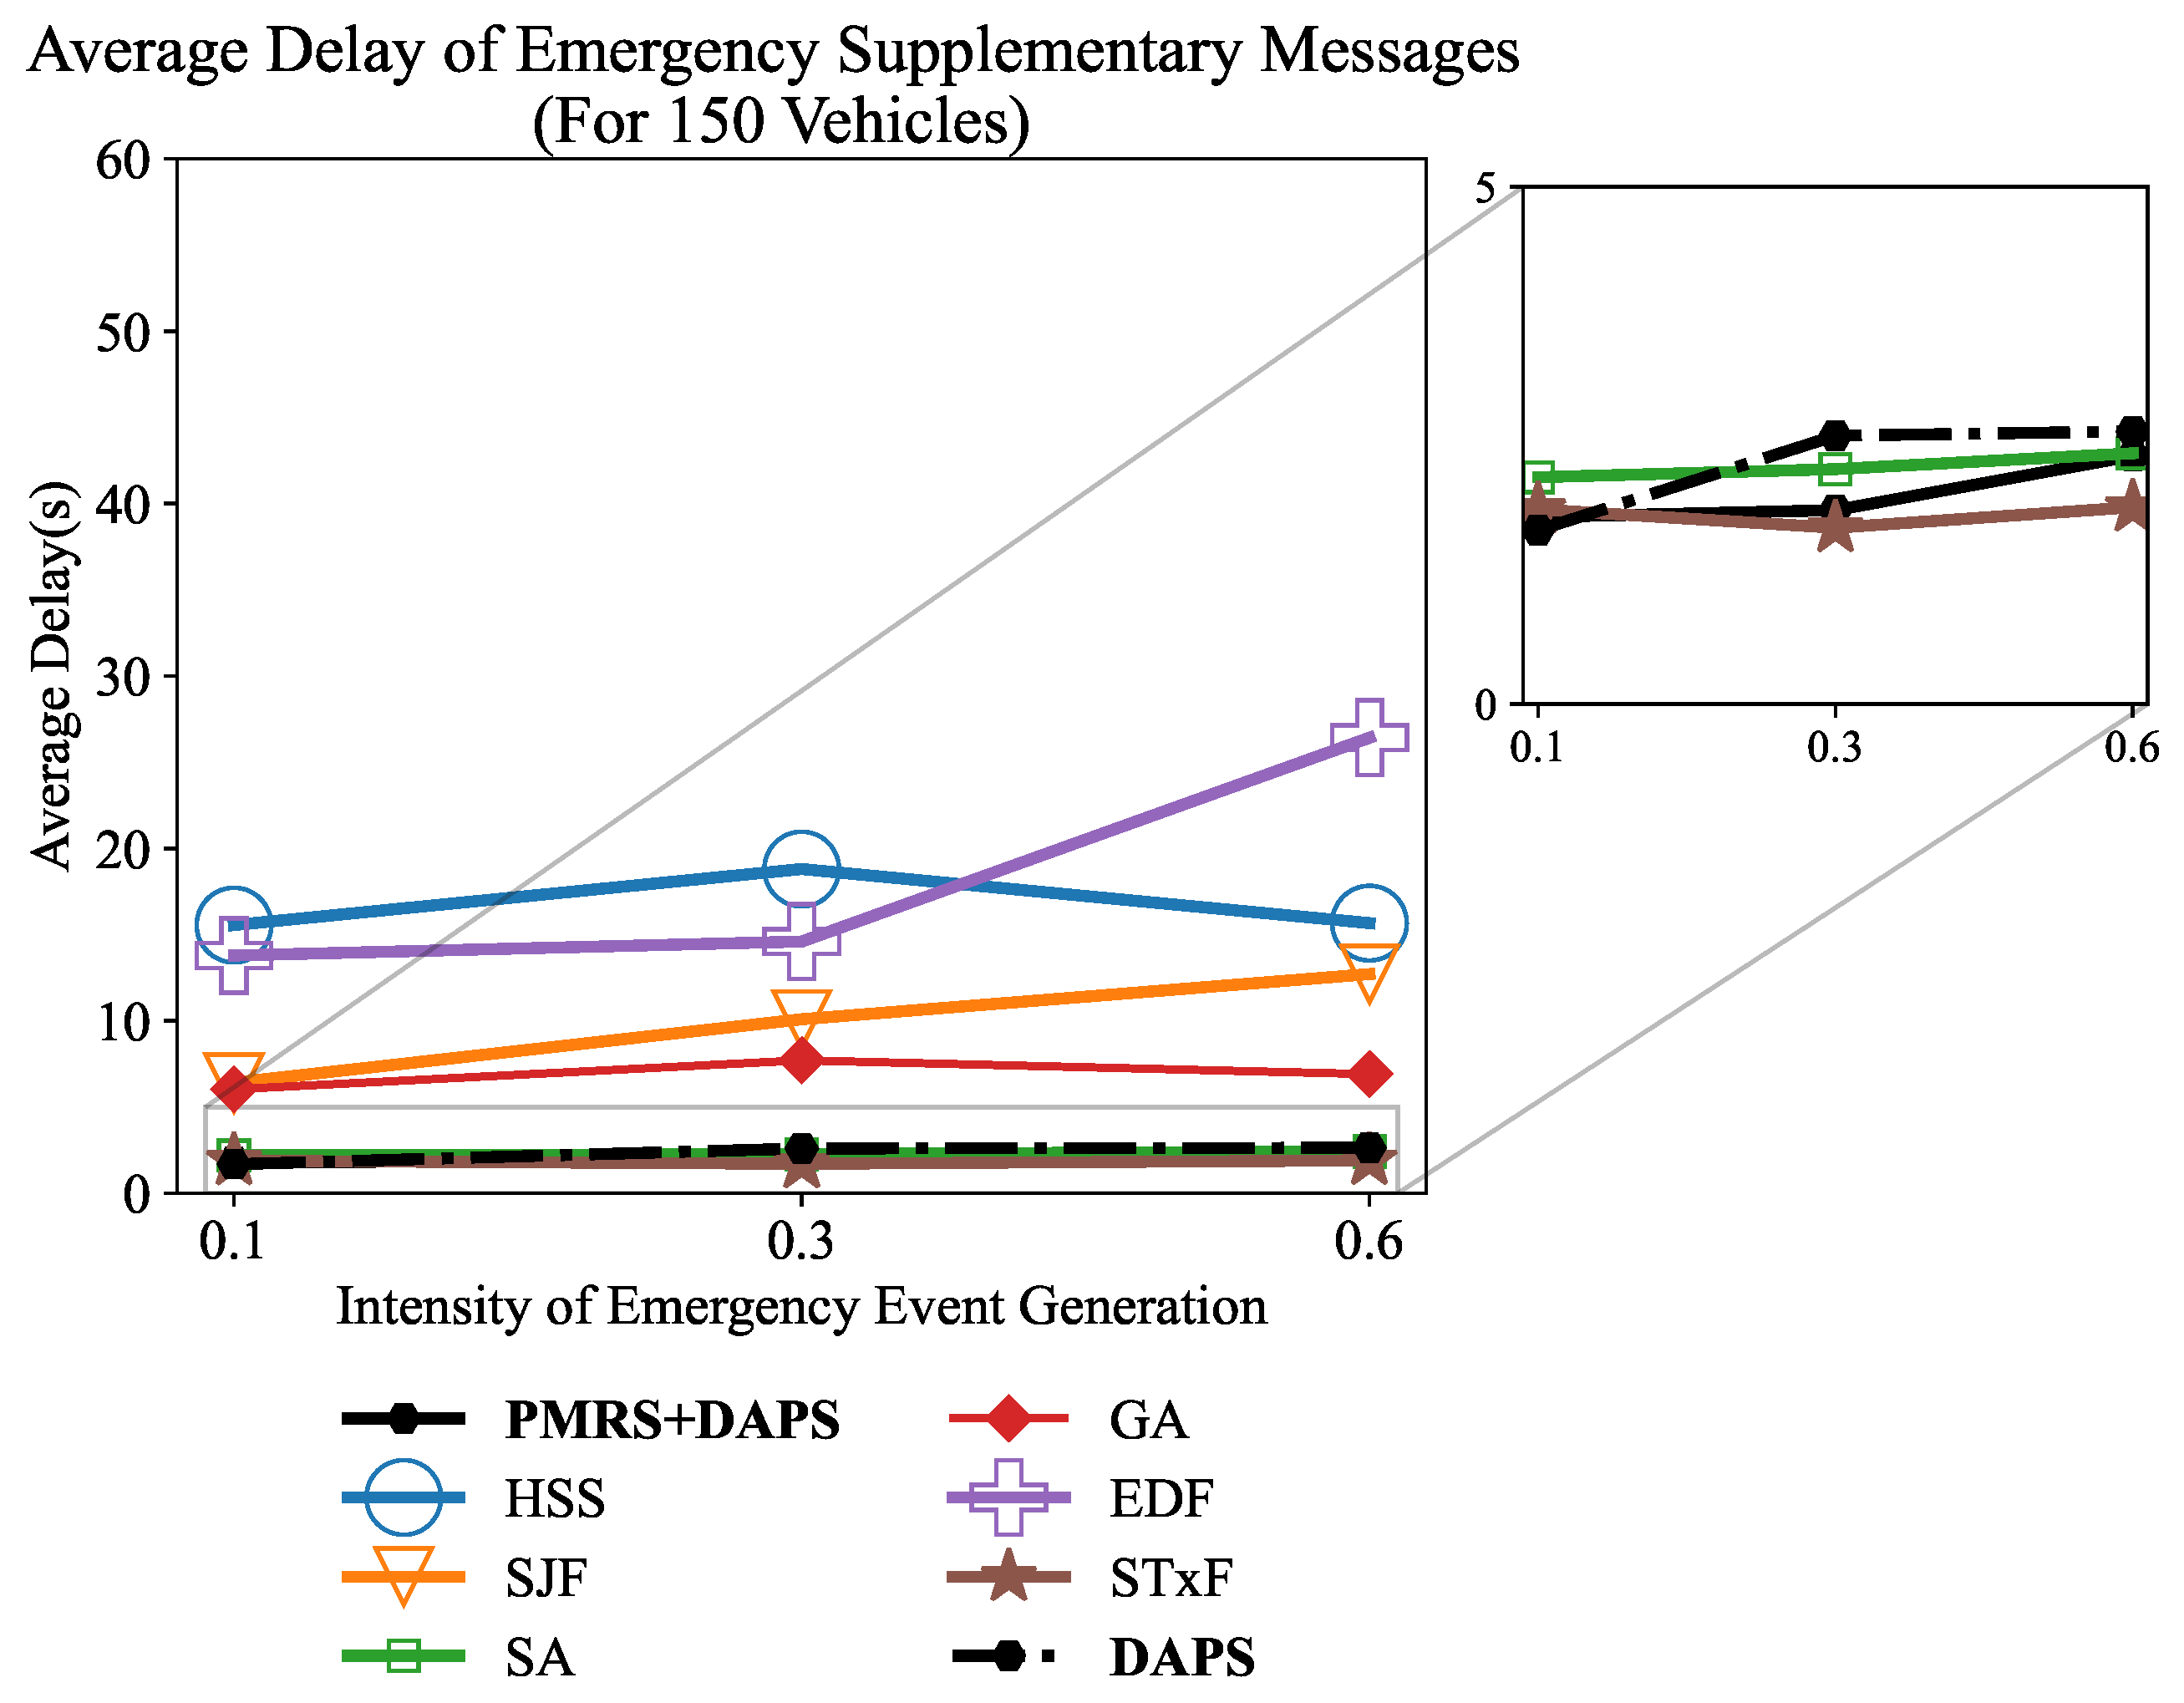
Figure 12 depicts the average end-to-end delay of emergency supplementary messages at
. The proposed PMRS + DAPS achieves the lowest and most consistent results 1.80 s, 1.87 s, and 2.39 s, while DAPS records 1.68 s, 2.59 s, and 2.63 s. Their stability arises from two complementary factors: PMRS reduces RSU contention by optimally distributing requests, and DAPS’ deadline-aware partitioning prevents low-priority advertisements from blocking supplementary content. SA and STxF stay within the 1.7–2.42 s range. The HSS, SJF, and GA show mid to high delay growth (6 to 18 s) with higher intensities. The EDF performs the poorest (maximum delay of 26.4 s) when the
value is higher because it schedules advertisements with lower deadlines first even though the emergency messages have higher priority.
6.3.3. Advertisements
Advertisements offered by the nearest shops and services are transmitted as AR artifacts to the vehicles. These artifacts can be 3D models, images or augmented animations or videos that can be shown on the ARHUD of vehicles. These artifacts have larger data size [
50]. Also, these advertisements are only relevant if the vehicle is near the location where they are offered, so they need to be transmitted to the vehicle right before the vehicles are passing those places. So, the deadline of these contents are also longer depending on the vehicle’s position and distance from the vehicle to that relevant POI.
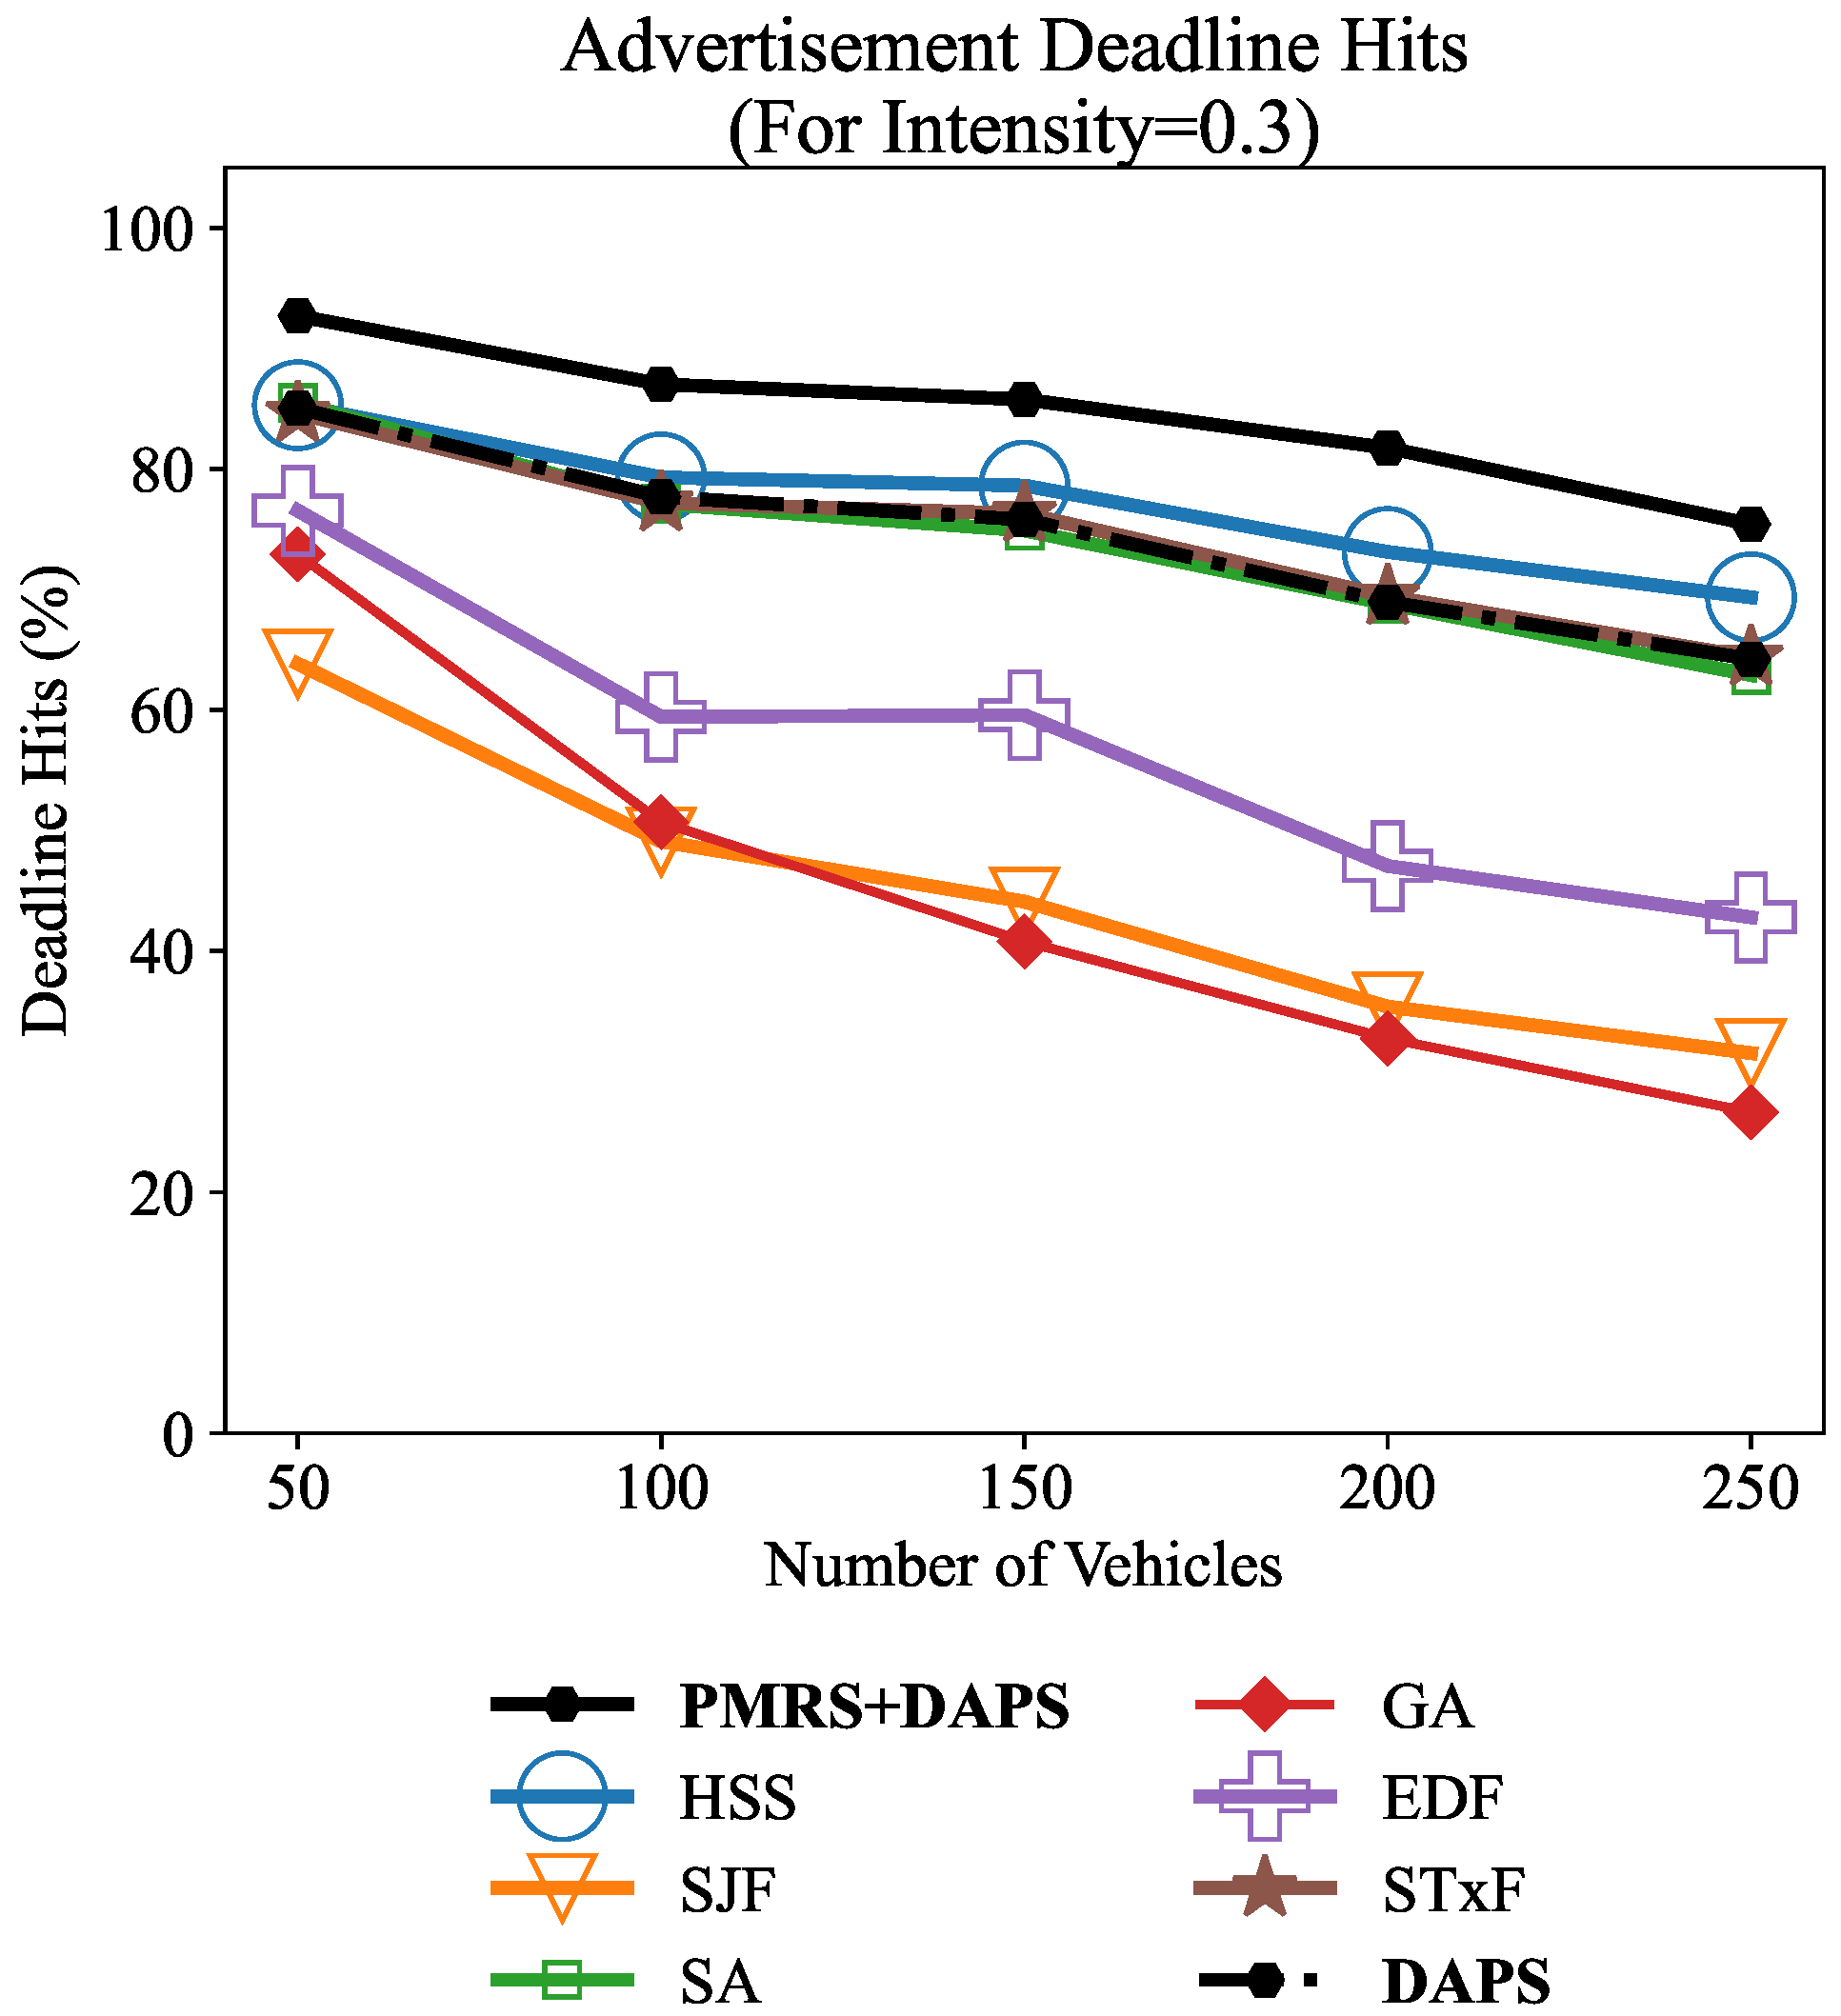
Figure 13 demonstrates the effects of different number of vehicles on the average deadline hit ratio of advertisements for (
). The proposed PMRS+DAPS algorithm outperforms all the baselines when scheduling advertisements with an average gap of 11% with the baselines. Even without the PMRS assignment algorithm, the scheduling algorithm performs better than SJF, SA, GA, EDF, and very similar to the STxF algorithms. It is also observed that effective RSU assignment plays a very vital role in achieving better deadline hits. The HSS performs better than the standalone DAPS, only because advertisements have longer deadlines. But HSS fails to perform better for emergency messages which is vital for road safety. More vehicles mean more advertisement content in the solution space, but GA’s fixed sized search space fails to find a better solution. This is why the performance of GA drops significantly as the number of vehicles increases, dropping from near 80% to only 34.18%, giving it the title of the poorest performing among all the algorithms.
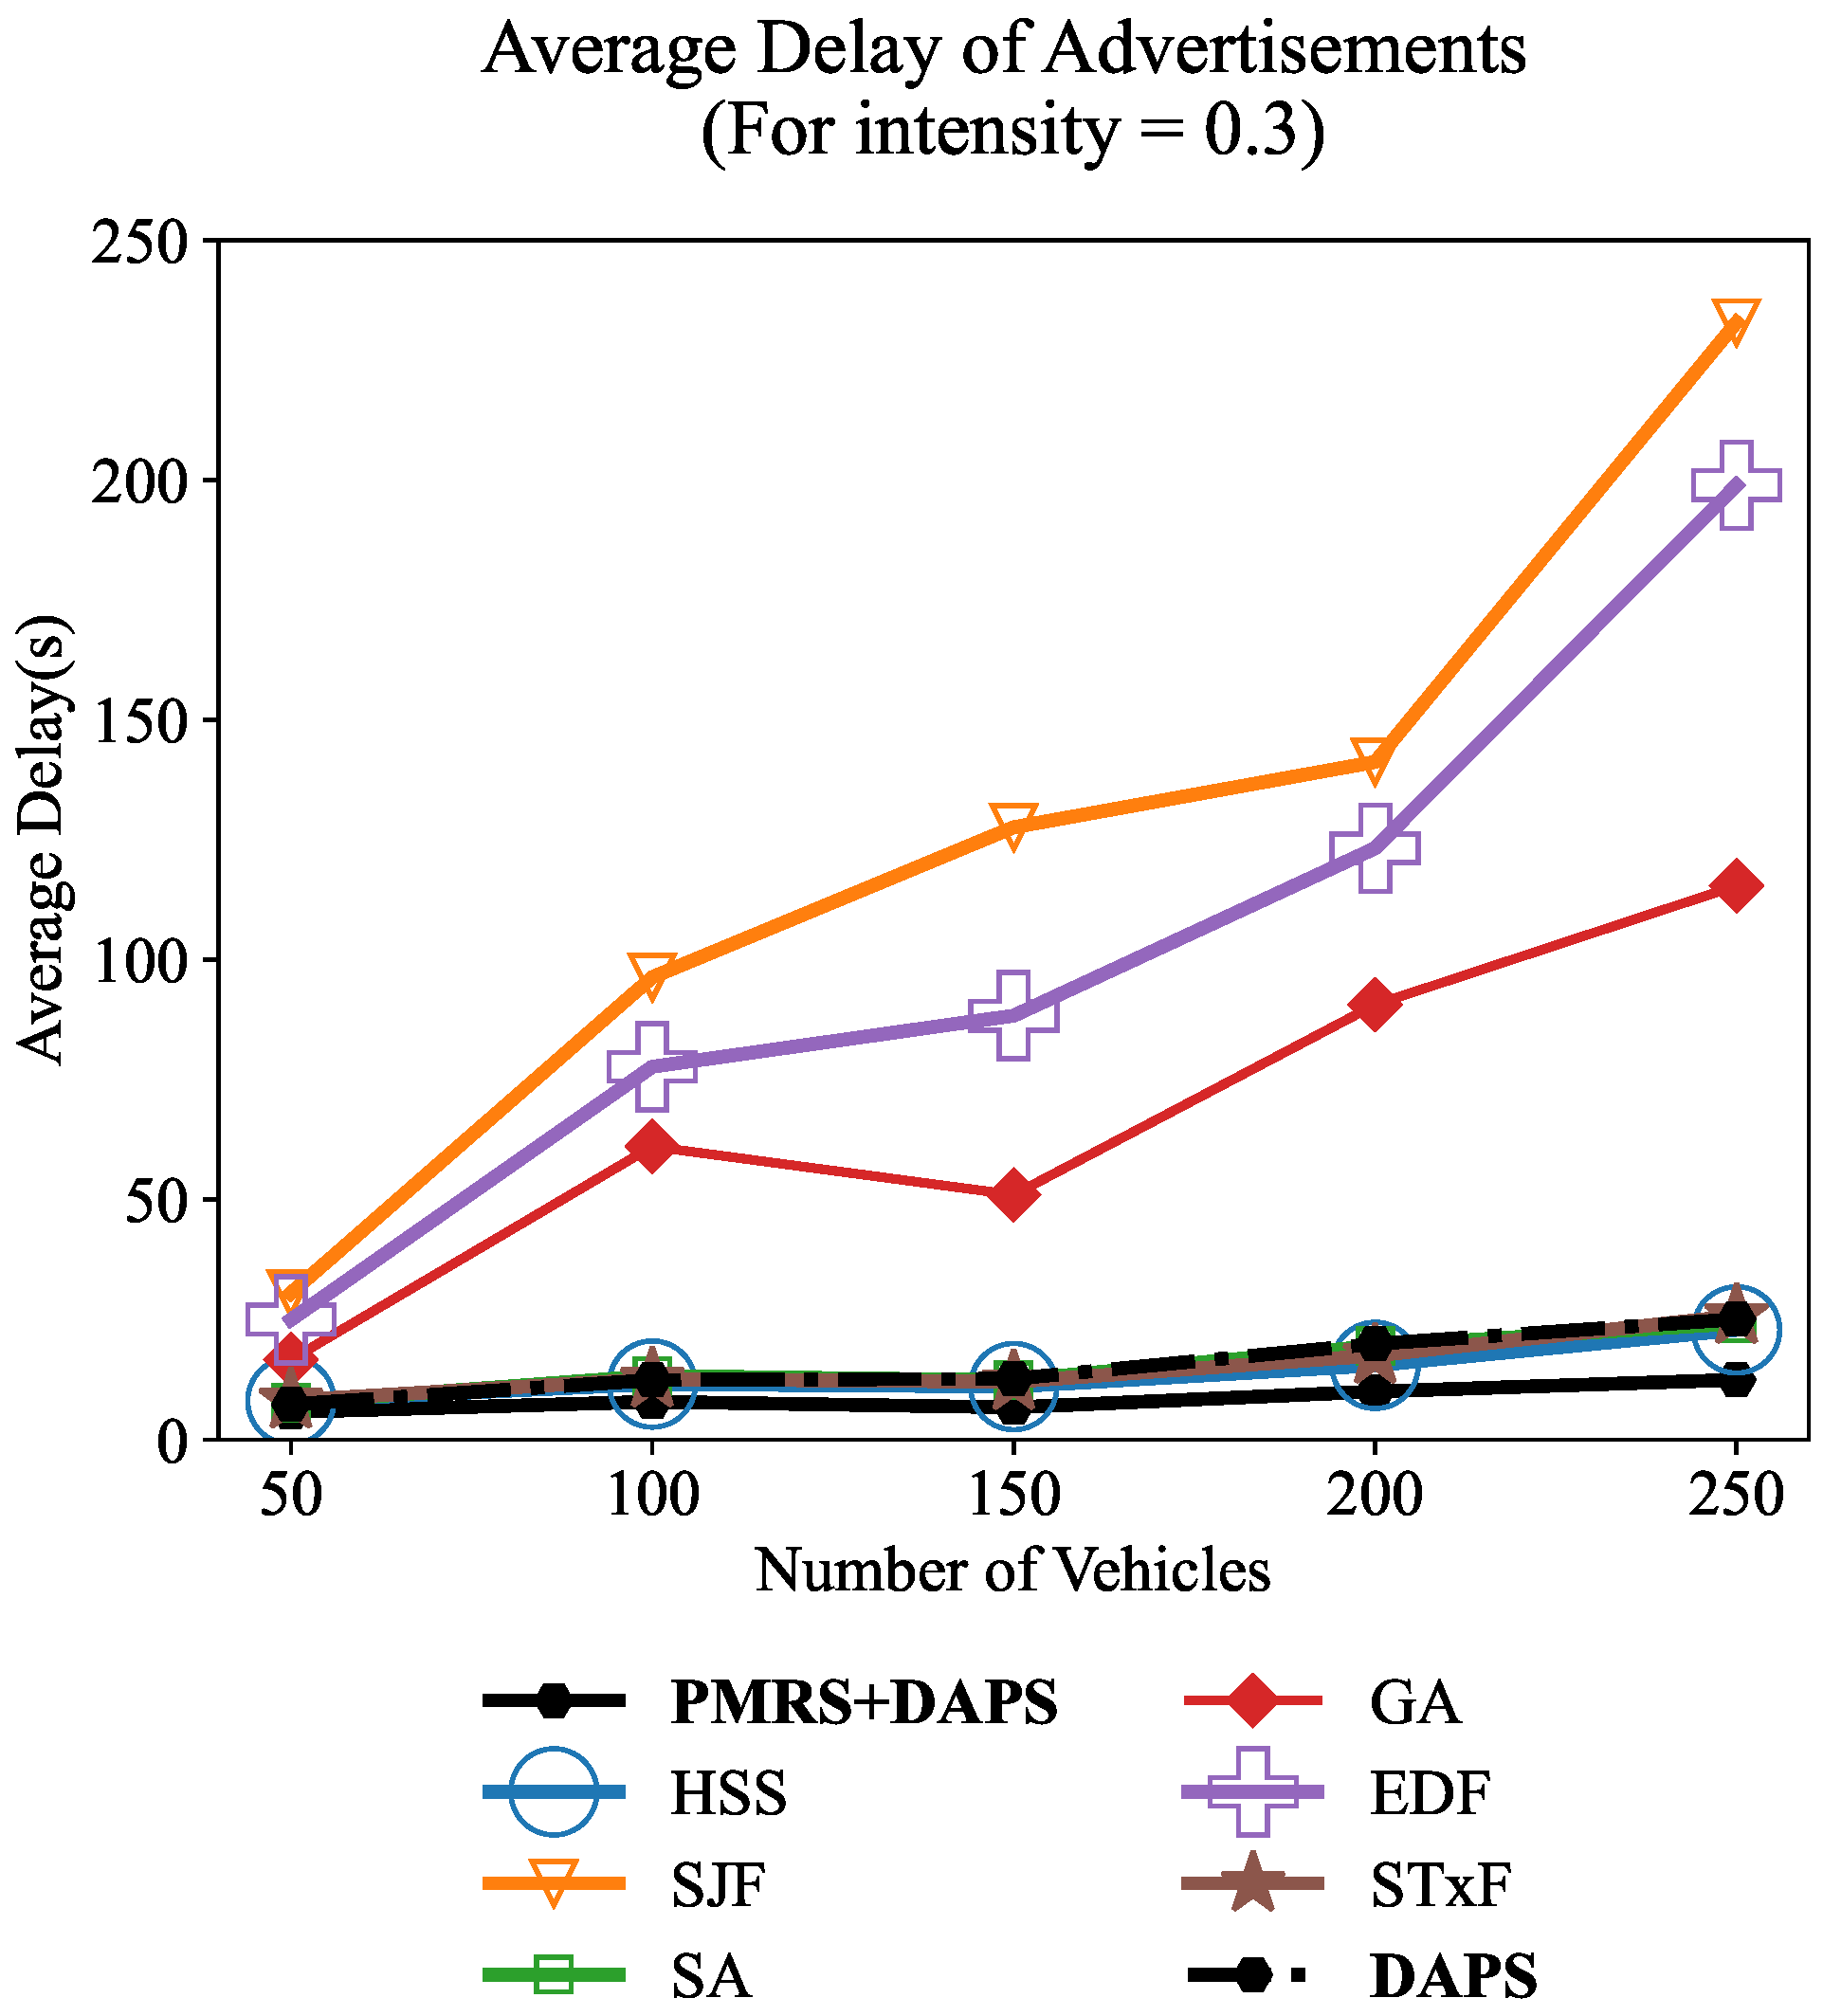
Figure 14 illustrates the average end-to-end delay of advertisement contents under the same vehicle counts. PMRS+DAPS achieves the lowest and most stable delays, ranging from 5.75 s to 12.47 s. In contrast, standalone DAPS and the baseline schemes (STxF, SA, and HSS) exhibit comparable delay trends, with average delays ranging from 7.04 s to 24.5 s, approaching nearly twice that of PMRS + DAPS when the number of vehicles reaches 250. This further proves the effectiveness of our proposed framework for proper assignment of RSUs and also proper scheduling of transmission queue in each RSU. Since GA, SJF, and EDF fail to schedule advertisement contents effectively, the queue waiting time increases substantially, leading to much higher delays, with SJF reaching a maximum of 232.83 s.
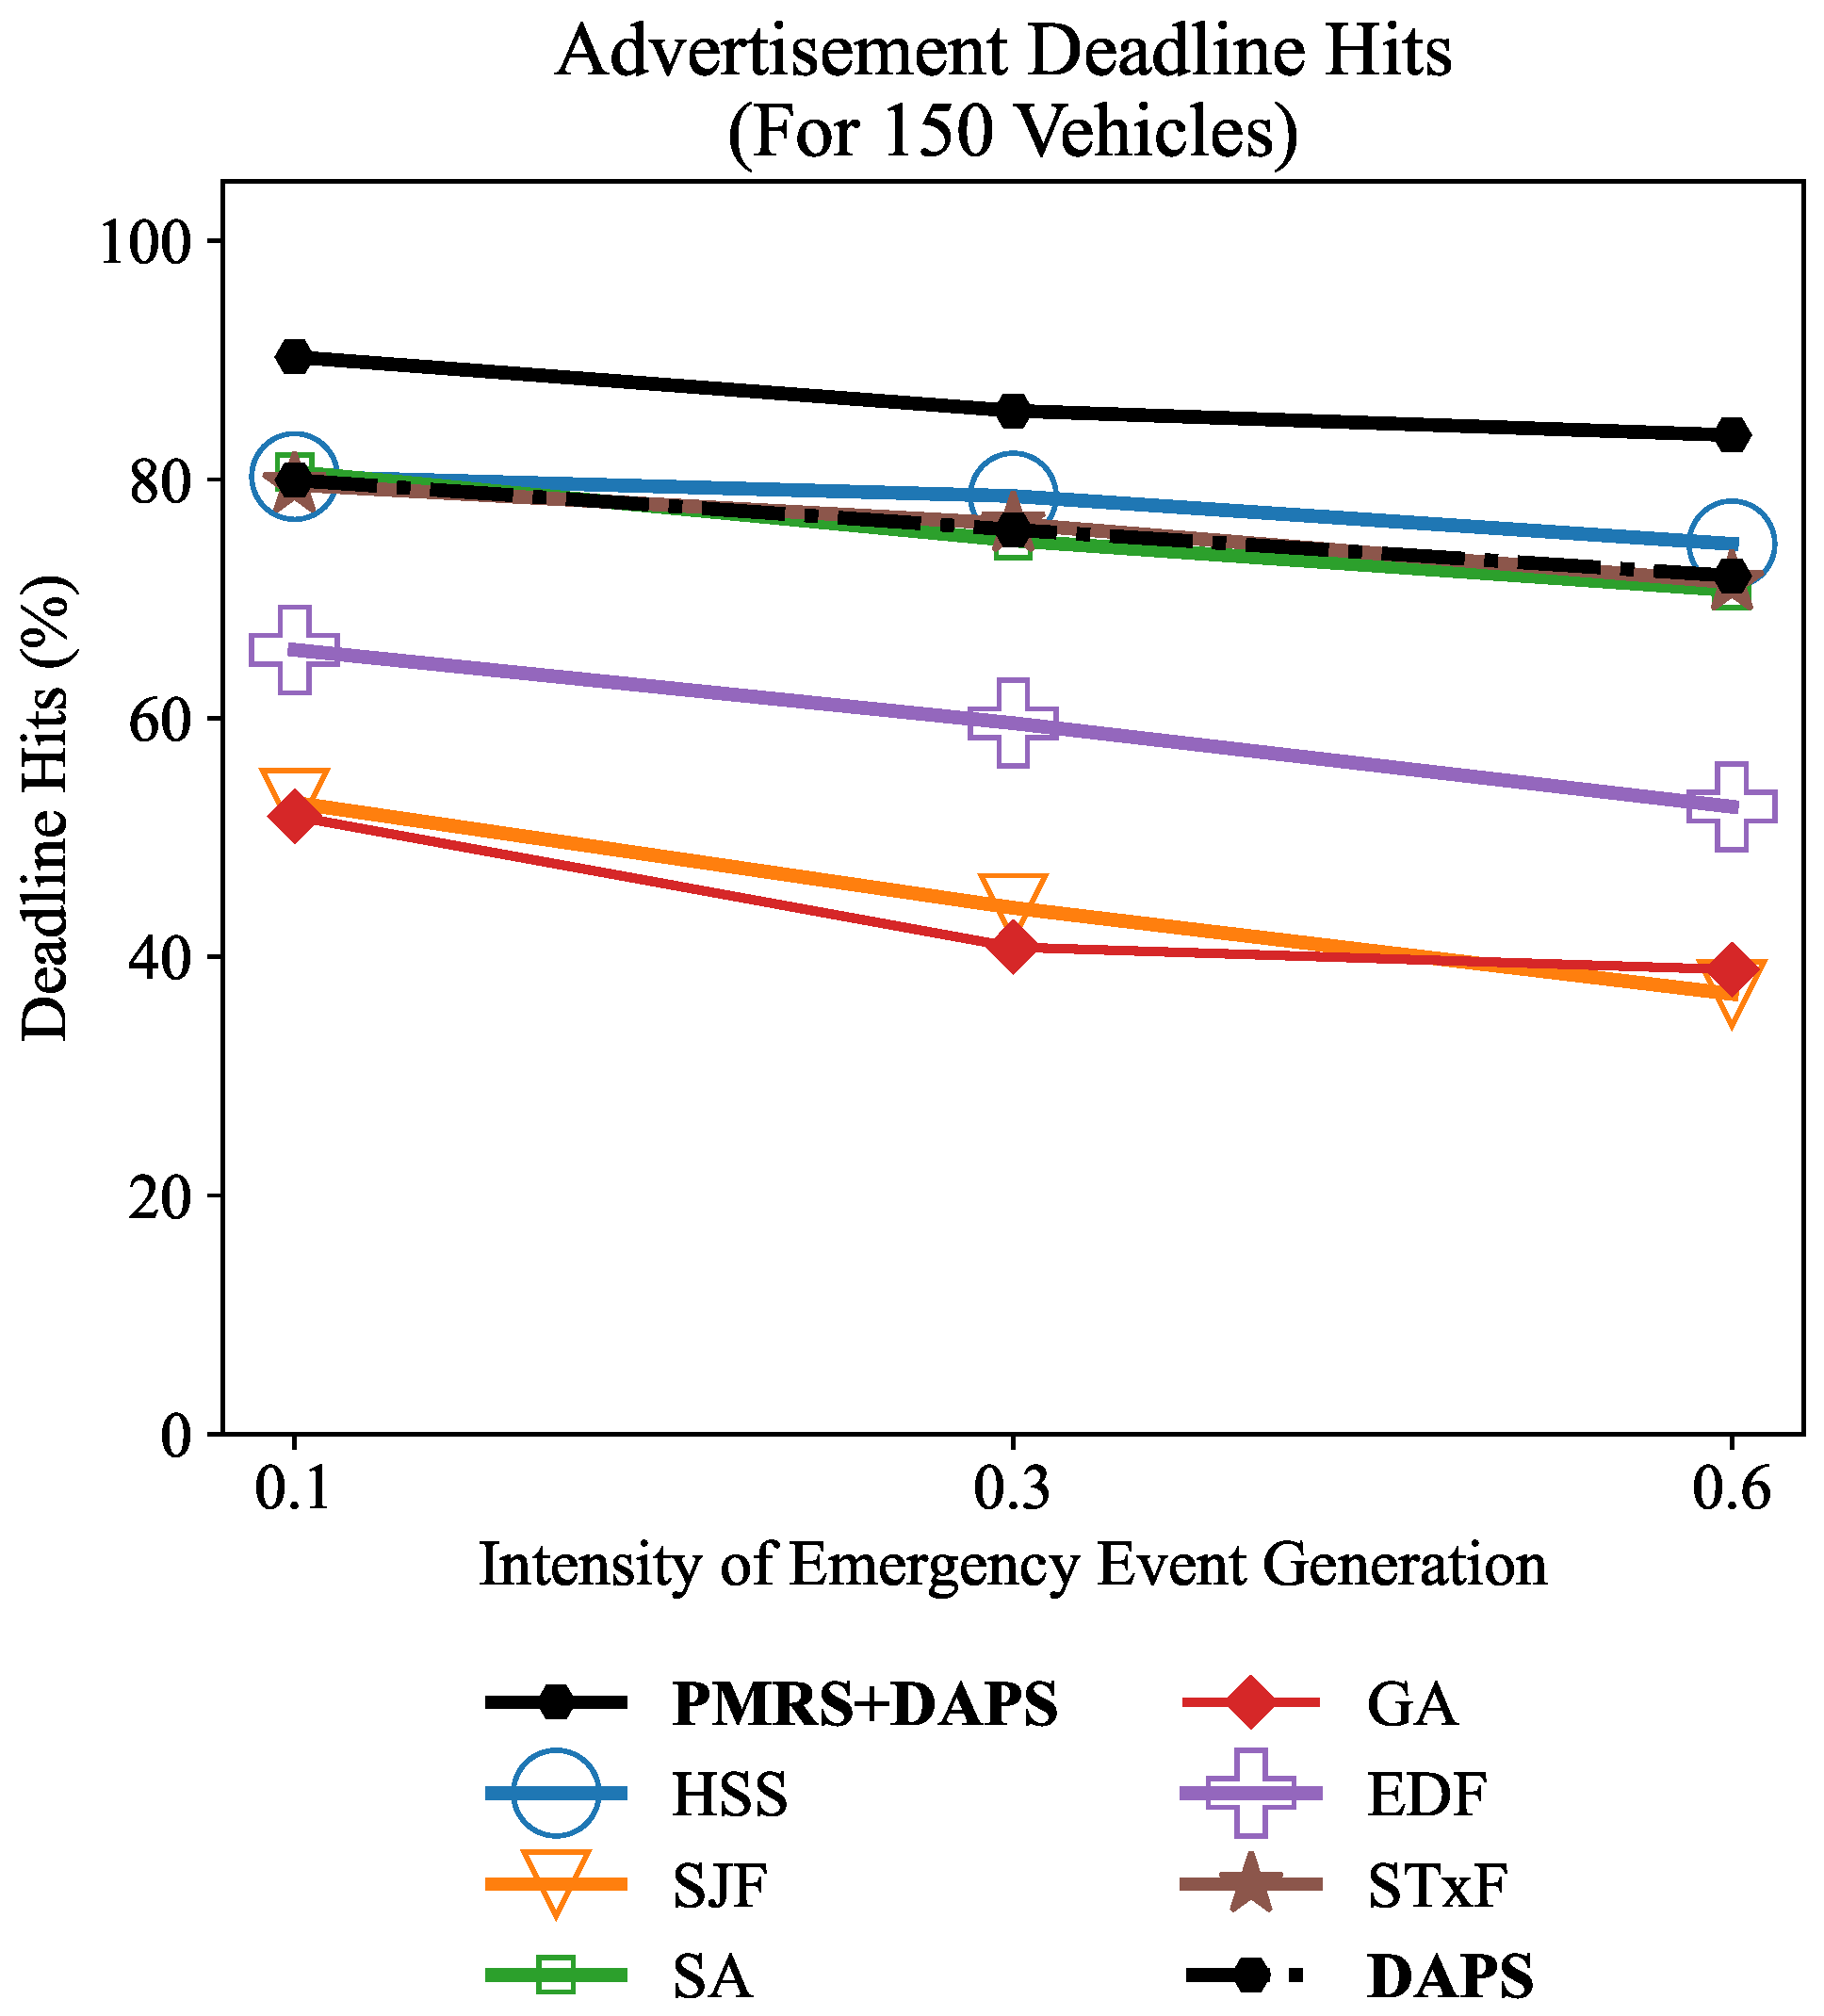
Figure 15 presents the average advertisement deadline-hit ratios for 150 vehicles under different emergency intensities (
). Advertisements are large, delay-tolerant contents generated according to vehicle topic subscriptions, not
, which leads to stochastic variation in their number per simulation run. The proposed PMRS + DAPS achieves the highest reliability across all cases, maintaining 90.27%, 85.76%, and 83.72% for
, respectively. The standalone DAPS performs competitively similar to the HSS, STxF, and SA with 79.94%, 75.79%, and 71.92% deadline hits. All the algorithms demonstrate a gradual decrease as more and more emergency events occur due to the increase in the intensity value. The GA and SJF perform poorly overall among all the baselines with performance dropping to around 37% at
.
Finally,
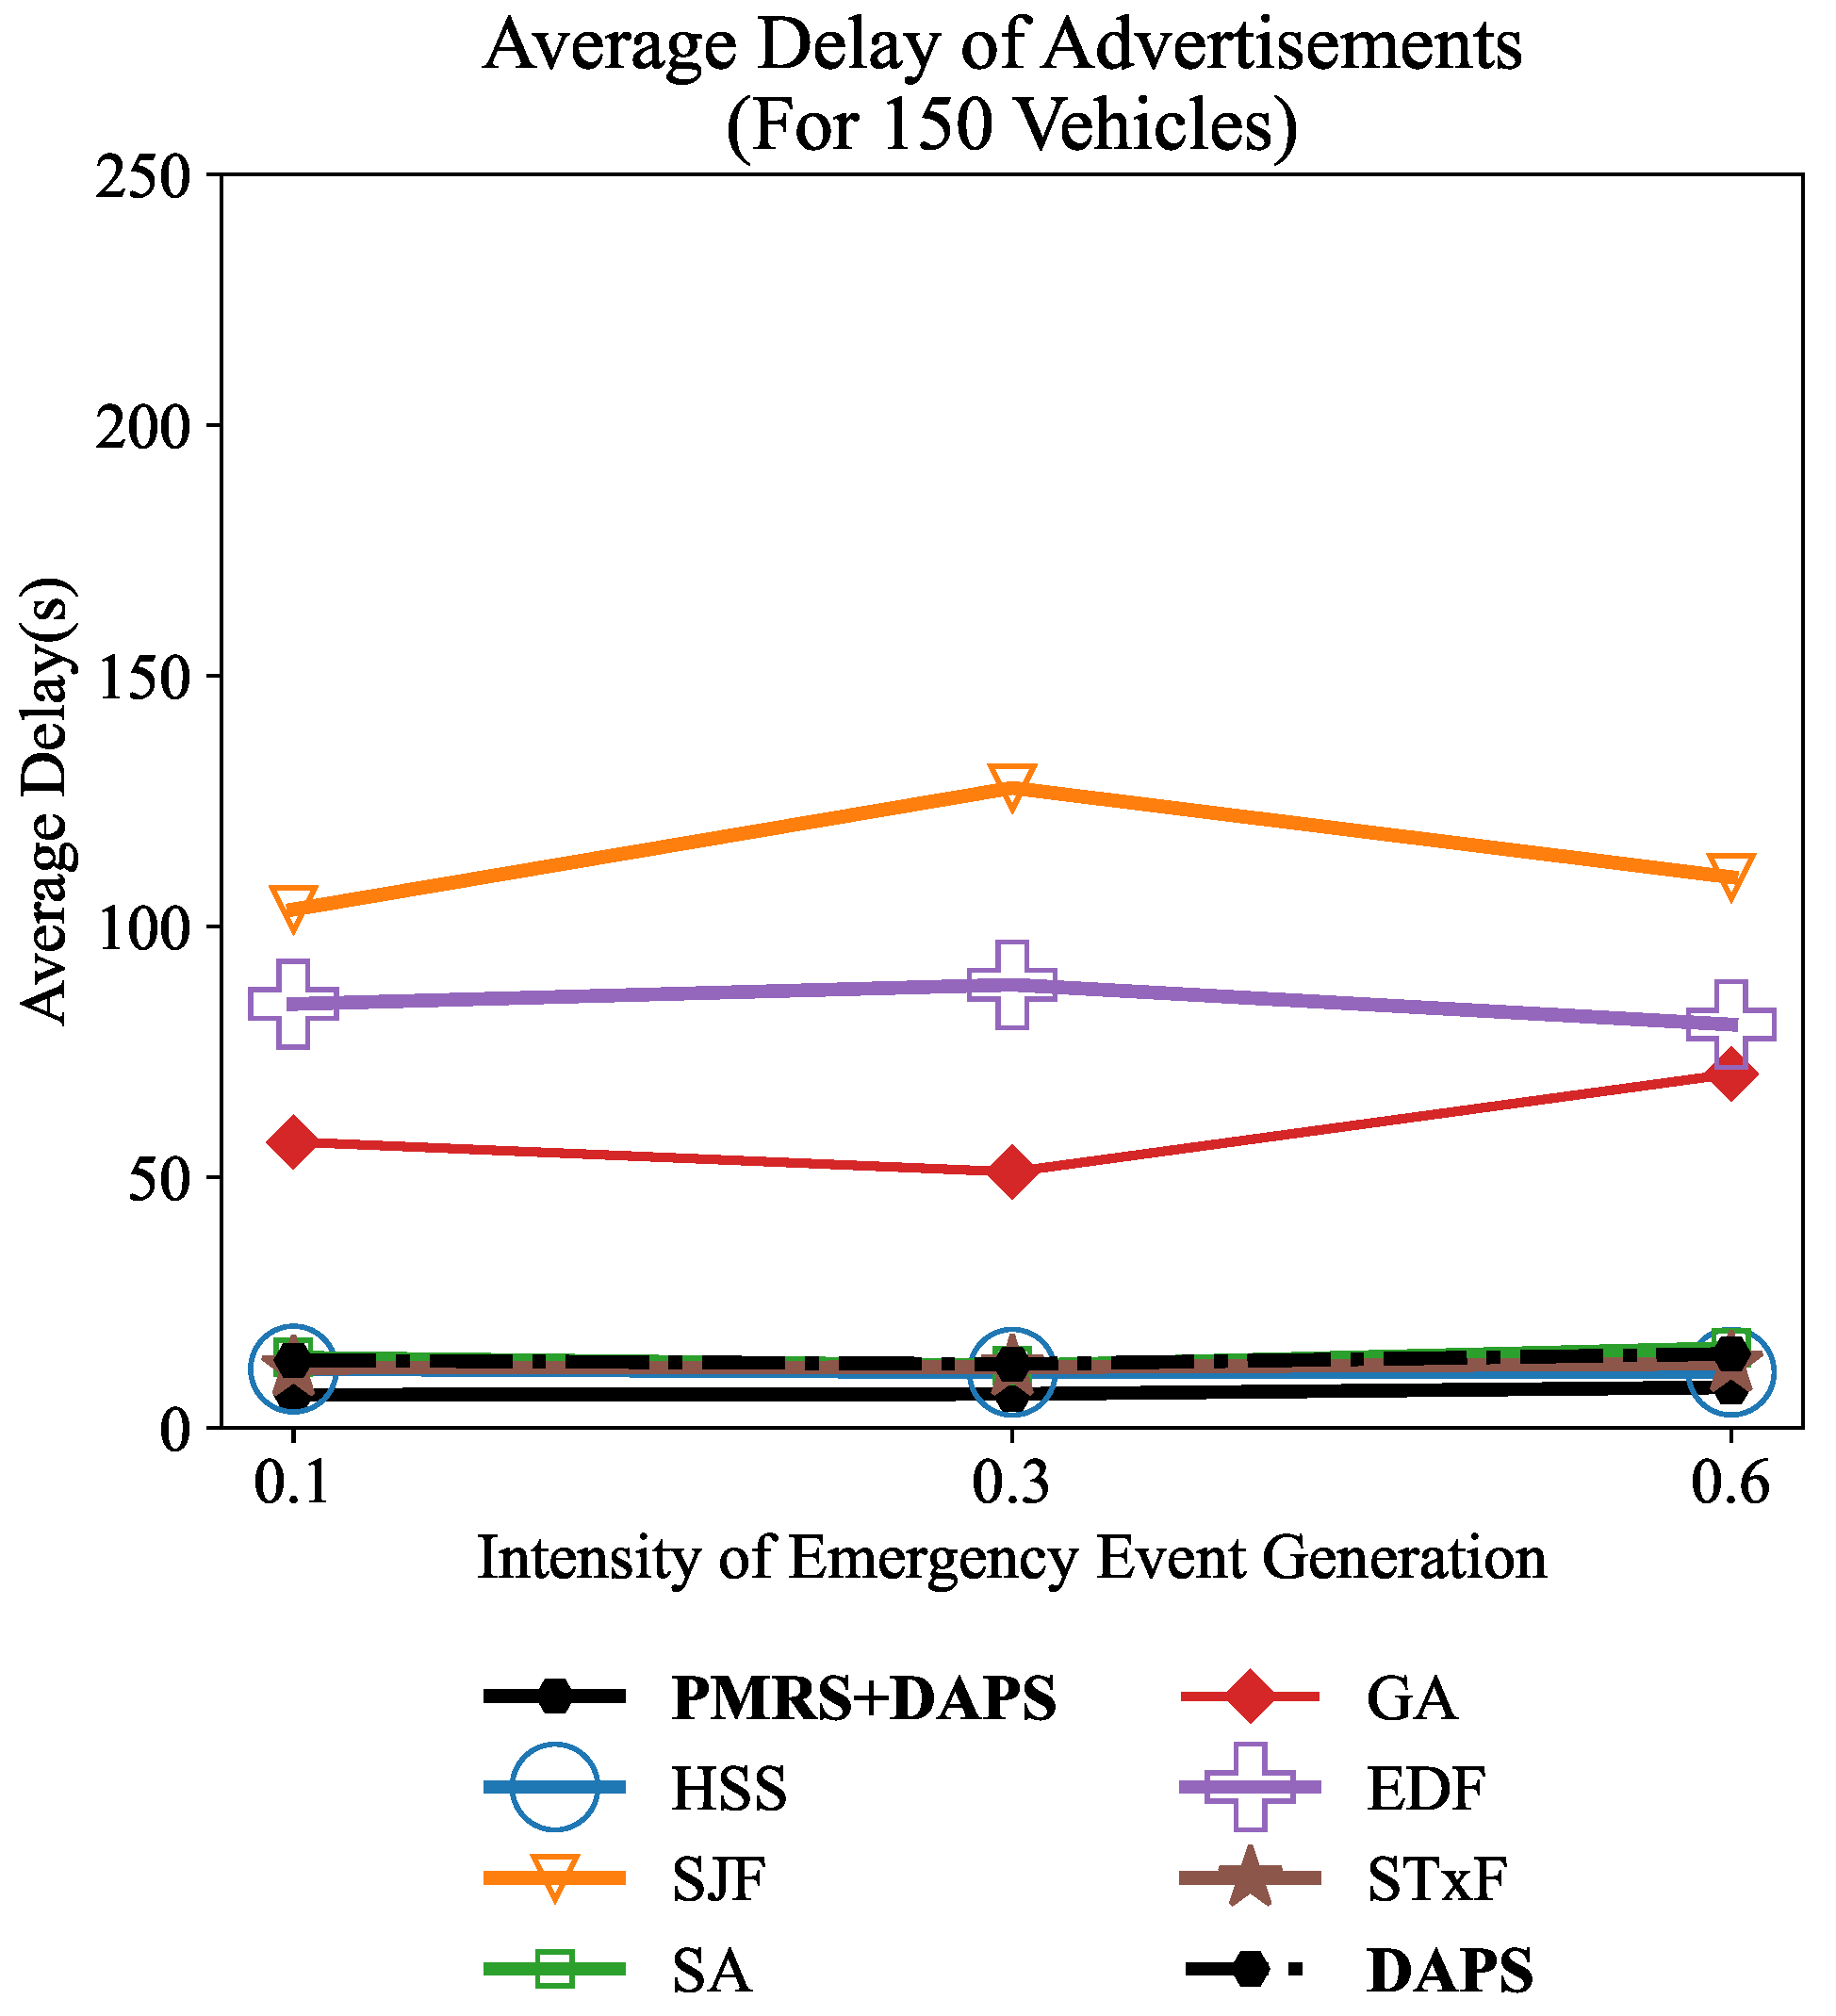
Figure 16 shows the average end-to-end delay of advertisement transmissions for 150 vehicles across different emergency intensities (
). Because advertisement data sizes are typically several megabytes and have longer deadlines, delays are measured in seconds. The proposed PMRS+DAPS attains the lowest and most stable delays of 6.56 s, 6.72 s, and 8.06 s as
increases. The SJF, EDF, and GA suffers in the overwhelmed RSUs and perform poorly, with SJF performing the worst among all the algorithms with the highest amount of delay.
Overall, across all traffic categories including emergency short messages, emergency supplementary contents, and advertisements, the proposed PMRS + DAPS framework consistently outperforms all baseline algorithms in both deadline satisfaction and delay reduction. The influence of algorithm runtime is minimal and largely dependent on the underlying hardware platform. By integrating an efficient RSU assignment mechanism (PMRS) with a lightweight, deadline-aware scheduler (DAPS) for time-critical messages and a robust metaheuristic component for delay-tolerant, large-payload data, the framework achieves a balanced trade-off between computational efficiency and scheduling accuracy. Even on moderately powered systems, the algorithm runtime contributes negligibly to the overall end-to-end delay, confirming that the proposed framework is both computationally scalable and practical for real-world vehicular MEC deployments.
7. Conclusions
In this paper, the challenge of jointly managing heterogeneous vehicular traffic, consisting of safety-critical emergency messages and bandwidth-intensive AR content, in MEC-enabled vehicular networks was investigated. First, the RSU assignment and scheduling problem was formulated as an optimization problem with the objective of minimizing the total system time. To address this problem, the PMRS algorithm was proposed for efficient RSU assignment, together with the DAPS scheduler to prioritize emergency messages while still accommodating AR content.
Extensive simulations under realistic vehicular mobility and traffic conditions showed that the PMRS + DAPS framework consistently achieved higher deadline hit ratios and lower delays across all content types than traditional heuristics and metaheuristics, while also demonstrating computational efficiency for practical implementation. In addition, the evaluation under different emergency event intensities provided a partial robustness assessment of the proposed framework under varying urgent-traffic loads.
The current study is limited to transmission-side RSU assignment and scheduling under the adopted MEC-enabled vehicular architecture, simulation assumptions, and single-city SUMO scenario. Future work will extend the evaluation to broader settings, including different numbers of RSUs, UAV deployment positions, multiple SUMO city maps with similar and different traffic topologies, and more detailed run-wise statistical reporting such as variance, standard deviation, and confidence intervals.