Article

Improving Document Layout Analysis Using Synthetic Data Generation and Convolutional Models

1
Department of Computer Science, Pryazovskyi State Technical University, 49044 Dnipro, Ukraine
2
Collaborative Innovation Center for Advanced Steels, Wuhan University of Science and Technology, Wuhan 430065, China
3
Division of Metallic Systems, Institute of Materials Research of the Slovak Academy of Sciences, Watsonova Str. 47, 04001 Kosice, Slovakia
*
Authors to whom correspondence should be addressed.
Appl. Sci. 2026, 16(6), 3089; https://doi.org/10.3390/app16063089
Submission received: 23 January 2026 / Revised: 16 March 2026 / Accepted: 17 March 2026 / Published: 23 March 2026
(This article belongs to the Section Computing and Artificial Intelligence)

Featured Application

The proposed approach delivers fast, accurate, and scalable document structure recognition in data-scarce regimes by utilizing lightweight architectures that minimize computational overhead. It is particularly well-suited for real-world applications, including advanced OCR, intelligent document processing systems, knowledge extraction frameworks, and layout-aware chunking for search-augmented generation in large language models.

Abstract

Document Layout Analysis (DLA) is a critical step in intelligent document processing and is essential for accurately reconstructing the hierarchical structure of pages. While modern convolutional neural networks exhibit high performance, their effectiveness heavily depends on the quality and representativeness of training data, limiting their application in scenarios where labeled datasets are scarce. This paper proposes a method for enhancing DLA through synthetic generation of training data. A formalized mathematical model for generating document layouts has been developed, allowing control over element placement density, sizes, and spatial distribution. An experimental study investigated the impact of various data generation strategies on the training of the YOLO11m model, including median and threshold-based element splitting as well as different block sampling schemes. The experiments showed that employing median element splitting combined with random sampling from a large shuffled pool of synthetic data yields consistent improvements of 2–4% across all key metrics: precision, recall, mAP@50, and mAP@50:95, as compared with simple data generation strategies. These results demonstrate that targeted optimization of the data preparation process can enhance the performance of convolutional models in DLA tasks without increasing architectural complexity. The practical applicability of the method is validated through integration into the MinerU system. Future research will focus on extending the proposed model to complex layouts in scientific journals, technical reports, and handwritten documents.

1. Introduction

The rapid advancement of large language models (LLMs) and the widespread adoption of search optimization techniques have created a pressing need to represent documents, articles, textbooks, and other printed materials in text format. Accurately capturing this hierarchical organization is essential [1,2,3,4], as the progress of LLMs is increasingly driven by knowledge bases operating on the principle of retrieval-augmented generation (RAG) [5,6,7]. Despite this, document layout recognition remains an open challenge; optimal results are currently achieved only through narrow specialization on specific document types. This necessitates both specialized methodologies and accelerated fine-tuning on application-specific data [6,8,9]. Furthermore, there is still a significant need to retrain models on data featuring different writing styles or types of layout elements, such as historical architectural records [2], financial statements [9], medical reports [10], or documents in low-resource languages like Mongolian [11].
At present, automated document processing has gained significant relevance due to the exponential increase in digital information. Artificial intelligence methods, widely applied for automated recognition, analysis, and interpretation of documents [12], play an important role in managing this process.
The traditional approach to automated document processing is Optical Character Recognition (OCR), which primary converts the text documents images into machine-readable text [13]. While OCR methods effectively recognize characters and words, they typically do not account for structural organization or the spatial relationships between elements. Consequently, the extracted text is presented as a linear sequence, restricting subsequent semantic analysis and the extraction of structured information.
Document Layout Analysis (DLA) constitutes a fundamental stage in intelligent document processing, relying on computer vision and machine learning algorithms [1,4,14,15]. The necessity for DLA arises from requirements in information compression, search, business analytics, as well as contemporary approaches based on retrieval-augmented generation (RAG) in large language models [16,17]. DLA facilitates the visual extraction of spatial arrangements to enable semantic interpretation and the accurate prediction of reading order.
Advancements in hardware capabilities and the availability of extensive datasets have provided a significant impetus to the field of machine learning, particularly through the use of convolutional neural networks (CNNs) [18,19,20,21]. These networks have substantially improved model accuracy by automating the extraction of statistical features [22,23]. Consequently, the vast majority of modern document recognition methods are either entirely based on CNNs or incorporate them at specific stages of the processing pipeline [24,25,26].
Further development of CNNs led to the emergence of specialized architectures for object detection tasks. Among these, the R-CNN (Region-based Convolutional Neural Networks) family was one of the first and most influential [27]. This method serves as a crucial preprocessing step in numerous tasks involving the analysis of handwritten document images [28] and remains relevant for various writing styles and languages [29].
To mitigate the high computational cost inherent in R-CNN architectures [28], SSD and YOLO methods are widely employed. These approaches utilize a reduced number of sliding windows with optimized strides while predicting window offsets for precise object localization [30]. Research has also introduced end-to-end architectures [31] that integrate advancements from related in machine intelligence tasks. Various strategies have been proposed to enhance model performance, including models versioning for accuracy maximization [32], parameter scaling within the limits of available computational resources [30], and feature compression via encoding layers [14,33]. A separate challenge remains the finite temporal inconsistency of algorithms during model outputs correction. To address this, high-level contextual feature extraction is performed using recurrent networks and attention-based approaches for encoding the spatial image grid [34]. The resulting structured representations are then integrated into query engines for large language models, enabling semantic analysis and intelligent information access [31].
Thus, contemporary DLA research focuses on the following key areas: block extraction (text, tables, images, headings, etc.) via CNN-based approaches [26,28,29,32], the creation of labeled corpora for training and evaluating models [3], extraction of structure and information without a dedicated OCR stage [31,33], and reducing dependency on labeled data [4,19,20] through transformer architectures and multimodal learning [14,33,34,35,36,37]. Additionally, current trends emphasize the integration of search engines with large language models [5,16,38,39] and the expansion of training samples using synthetic data generation [39,40,41,42,43].
The primary challenges in document layout analysis can be categorized into three groups: structural recognition accuracy, computational complexity and model efficiency, and the structural variability of layouts. Each of these groups is further detailed in Table 1.
To address the shortage of labeled data and the high cost of manual annotation, various strategies for dataset creation and automated labeling have been proposed. These include introducing multimodal historical datasets [3], utilizing synthetic financial data to improve model robustness of models [9], and semi-automated labeling for scientific PDF documents [46,47]. Synthetic generation and advanced data augmentation serve as viable alternatives to manual labeling [39,41], while unsupervised DLA [4], supervised pre-training [19,20], and self-supervised methods [34,35] further reduce dependence on large annotated corpora. Moreover, the limitations of “naive” augmentation are being overcome through structure-oriented synthetics [9], supervised pre-training [19], generative methods [42], and specialized synthetic generation [39,41]. To accelerate model convergence on small samples from new domains, researchers suggest self-supervised pre-training [34,35], transfer learning [20], domain-oriented pre-training [19], the integration of LLMs [16], and approaches for low-resource languages [8].
The issues of low structural variability and the tendency of models to favor typical spatial patterns, such as the “central concentration” of blocks, are addressed through multi-scale and global analysis mechanisms. Notable solutions include multi-scale YOLO architectures [7,43], grid-based transformers [14], global attention mechanisms [36], and the unification of structural and semantic layout analysis [17,26].
Finally, the high computational load associated with heavy architectures is mitigated by lightweight and optimized models, such as direction-aware [11] or end-to-end transformer architectures [36]. However, a significant trend remains the adaptation of YOLO frameworks [7,9,12,21,30,44,45,46] to achieve an optimal balance between accuracy and inference speed.
The analysis revealed that various YOLO architectures [30] have been employed to address the aforementioned challenges, including YOLOLayout [7], Enhanced YOLOv11 [9,44], YOLOv8 [12,45], YOLOv8–YOLOv11 [21], and YOLO-DLA [43]. In this study, the YOLO model was selected for further research. Unlike the R-CNN family, YOLO models minimize frame search, significantly accelerating the processing. Furthermore, recent YOLO versions support conditional branching during recognition and offer model size selection with various scaling operations. Consequently, YOLO11m [47] was chosen as the basis for this study, representing the most effective compromise between computational complexity and accuracy. While YOLO architectures incorporate multi-scale feature aggregation and hierarchical context modeling, they remain distribution-driven learners optimized under the empirical training distribution.
In document layout analysis, the strong correlation between semantic roles, page position, and element frequency often induces positional priors and sensitivity to class imbalance. Consequently, detection performance depends not only on architectural capacity but also on the structural properties of the training dataset. In the present study, this relationship is investigated primarily in the context of structured scientific document layouts similar to those represented in the DocBank dataset. Despite ongoing research, challenges such as labeled data scarcity and high annotation costs persist. Furthermore, current synthetic generation approaches frequently suffer from low structural variability and reproduce typical “central concentration” patterns. These limitations reduce the diversity of training distributions, thereby hindering the model’s ability to generalize when applied to heterogeneous real-world documents. To address these gaps, this study proposes a mathematically formalized model for synthetic document layout generation, enabling controlled variation in block density, dimensional ratios, and spatial distribution.
Therefore, the main objective of this work is to improve document layout analysis methods by developing and validating a mathematical model for synthetic data generation that optimizes the input training set to improve model performance (using YOLO11m as an example) in the context of limited real data. To achieve this goal, the article presents the two-stage approach consisting of a (a) developing of a mathematical model for controlled synthetic document layout generation and (b) experimental validation of its effectiveness through YOLO11m-based document layout detection. The article follows a structured progression, moving from a consecutive description of the methodological approaches used to the experimental stages and a discussion of the obtained results.

2. Materials and Methods

2.1. Data and Tools

This study follows a data-centric experimental design aimed at evaluating the impact of structurally controlled synthetic layout generation on document object detection performance. The methodological pipeline consists of:
formalization of a mathematical layout generation model;
synthetic dataset construction under controlled parameter configurations;
spatial diagnostic analysis of generated layouts;
pre-training of a YOLO11m detector on synthetic data;
comparative evaluation of generation strategies;
fine-tuning on a reduced real-world dataset for an example of practical integration.
The implementation of algorithms and data transformation tools was carried out using publicly available Python v. 3.12 libraries including albumentations, cv2, itertools, json, magic-pdf, multiprocessing, numpy, pandas, pathlib, PIL, random, shutil, torch, tqdm, and ultralytics. The DocBank dataset [39] was selected for investigation, as it enables the extraction of representative samples from a large-scale corpus even when using relatively small subsets.
The selected DocBank dataset comprises 400,000 images with a total size of approximately 50 GB. Initially, an attempt was made to train on the full dataset to establish baseline performance metrics using an NVIDIA GeForce GTX 1080 Ti (11 GB VRAM) (NVIDIA, Santa Clara, CA, USA). However, preliminary experiments showed that a full pass through all records was not feasible with the available computational resources. Additionally, storage capacity constraints limited the ability to maintain multiple dataset iterations on solid-state drives. Consequently, the raw dataset was randomly subsampled to 50,000 images for training and 10,000 for testing and validation, reducing the total size to 7 GB.

2.2. Mathematical Model of Data Generation

In this study, a mathematical model was developed to generate a synthetic document layout while accounting for the underlying data distribution. The model is theoretically motivated by the observation that convolutional detectors internalize spatial and categorical biases of the training distribution. By explicitly parameterizing spatial density, bounding-box variability, and class balance, the proposed framework reshapes the empirical training distribution and reduces positional priors learned by the detector.
The generation of random document layouts is implemented as an algorithmic greedy approximation to achieve diverse combinations. A resource-efficient approach involves the random selection of elements, followed by their combination based on the Cartesian product of possible positions. A sufficiently large initial dataset ensures minimal overlap among the resulting combinations. To achieve balanced placement, elements are categorized into two “large” and “small” subsets, using either a fixed threshold or the median element size as the criterion.
For a set of elements (E) consisting of individual fragments (e), the assignment to subsets {Esmall, Elarge} is determined by the function f(e), Equation (1):
E = E s m a l l E l a r g e e E s m a l l f e = 1 e E l a r g e f e = 0
Within the framework of this work, it is advisable to investigate the influence of the fragment distribution point on the function f(e), which for the normalized width we and normalized height he of element e will be defined by Equation (2):
( w e < w m e d i a n ) ( h e < h m e d i a n ) , i f   t h e   m e d i a n ( w e < 0.05 ) ( h e < 0.05 ) ,   i f   constantа
The definition of the function for extracting the number of fragments Nsm and Nlg of the layout g(E) from the set of read elements E = EsmElg with size Ne = Ne,sm + Ne,lg elements will be studied for the probability distribution of the number of elements in the final dataset in the following variants Equation (3):
g E = N s m =   N e , s m , N l g = N e , l g ,   i f   m i x i n g   N s m = 0.01 N e , N l g = 0.99 N e   o t h e r  
The input parameters of the generation algorithm are:
the sets of rectangular elements Esmall and Elarge;
the number of candidate fragments Nc;
a set of read elements e∈E, each characterized by width w(e) and height h(e) parameters normalized relative to the pages on which they were found.
Let S = [0,1] × [0,1] is defined as a normalized two-dimensional coordinate space, represented as a unit square S, serves as an abstract plane for placing the bounding boxes of document fragments, and P = {e0} is the list of placed elements. All coordinates and dimensions of elements (width w and height h) are expressed in relative units in the range from 0 to 1 relative to the boundaries of this space. This allows the algorithm to work independently of the absolute resolution of the final digital images.
Then the first element e0 should be placed in such a way that its center (cx, cy) is chosen at random within Equation (4):
c x , c y w e 0 2 , 1 w e 0 2 × h e 0 2 , 1 h e 0 2 ,
where we0 and he0 denote the normalized width and height of the first element e0, respectively.
These boundaries are established to ensure that for any randomly selected center within the specified range, the entire rectangular block remains fully contained within the coordinate space.
To add fragments to the coordinate space, follow these steps:
  • The list of placed elements is supplemented with randomly selected elements having the bounding box [x1, y1, x2, y2] from the set of read elements E after applying the functions f(e) and g(e) such as Equation (5):
c x w e 2 , x 2 = c x + w e 2 ,   y 1 = c y h e 2 , y 2 = c y + h e 2
2.
Coordinate lists are compiled to determine the intersection points for a new grid, with cells generated via their Cartesian product. The intersection between the newly formed cells and existing elements is then calculated, retaining only those with zero overlap (IoU = 0);
3.
The candidate maximizing the occupied site metric (F) is selected, accounting for the element area Ae and cell area Ac, as defined in Equation (6):
F = A e A c ,     A e = w e h e ,     A g = ( x 2 x 1 ) ( y 2 y 1 ) w e x 2 x 1   ( h e y 2 y 1 )
4
A decision regarding the next action is made. The algorithm terminates if no valid cells remain for placement, no further elements can be fitted onto the grid, or the predefined limit for small elements has been reached. Otherwise, the selected element is added to the list (P) and removed from the set (E), after which the algorithm returns to step 1.
The described model does not perform explicit global maximization of packing density; instead, it employs a greedy placement strategy for a limited subset of elements based on a local occupied space metric. The computational complexity of the algorithm can be expressed as O(Np NE Nc), where Np is the number of already placed fragments, NE is the number of remaining elements to be attempted for placement, and Nc is the number of cells formed by already placed fragments.
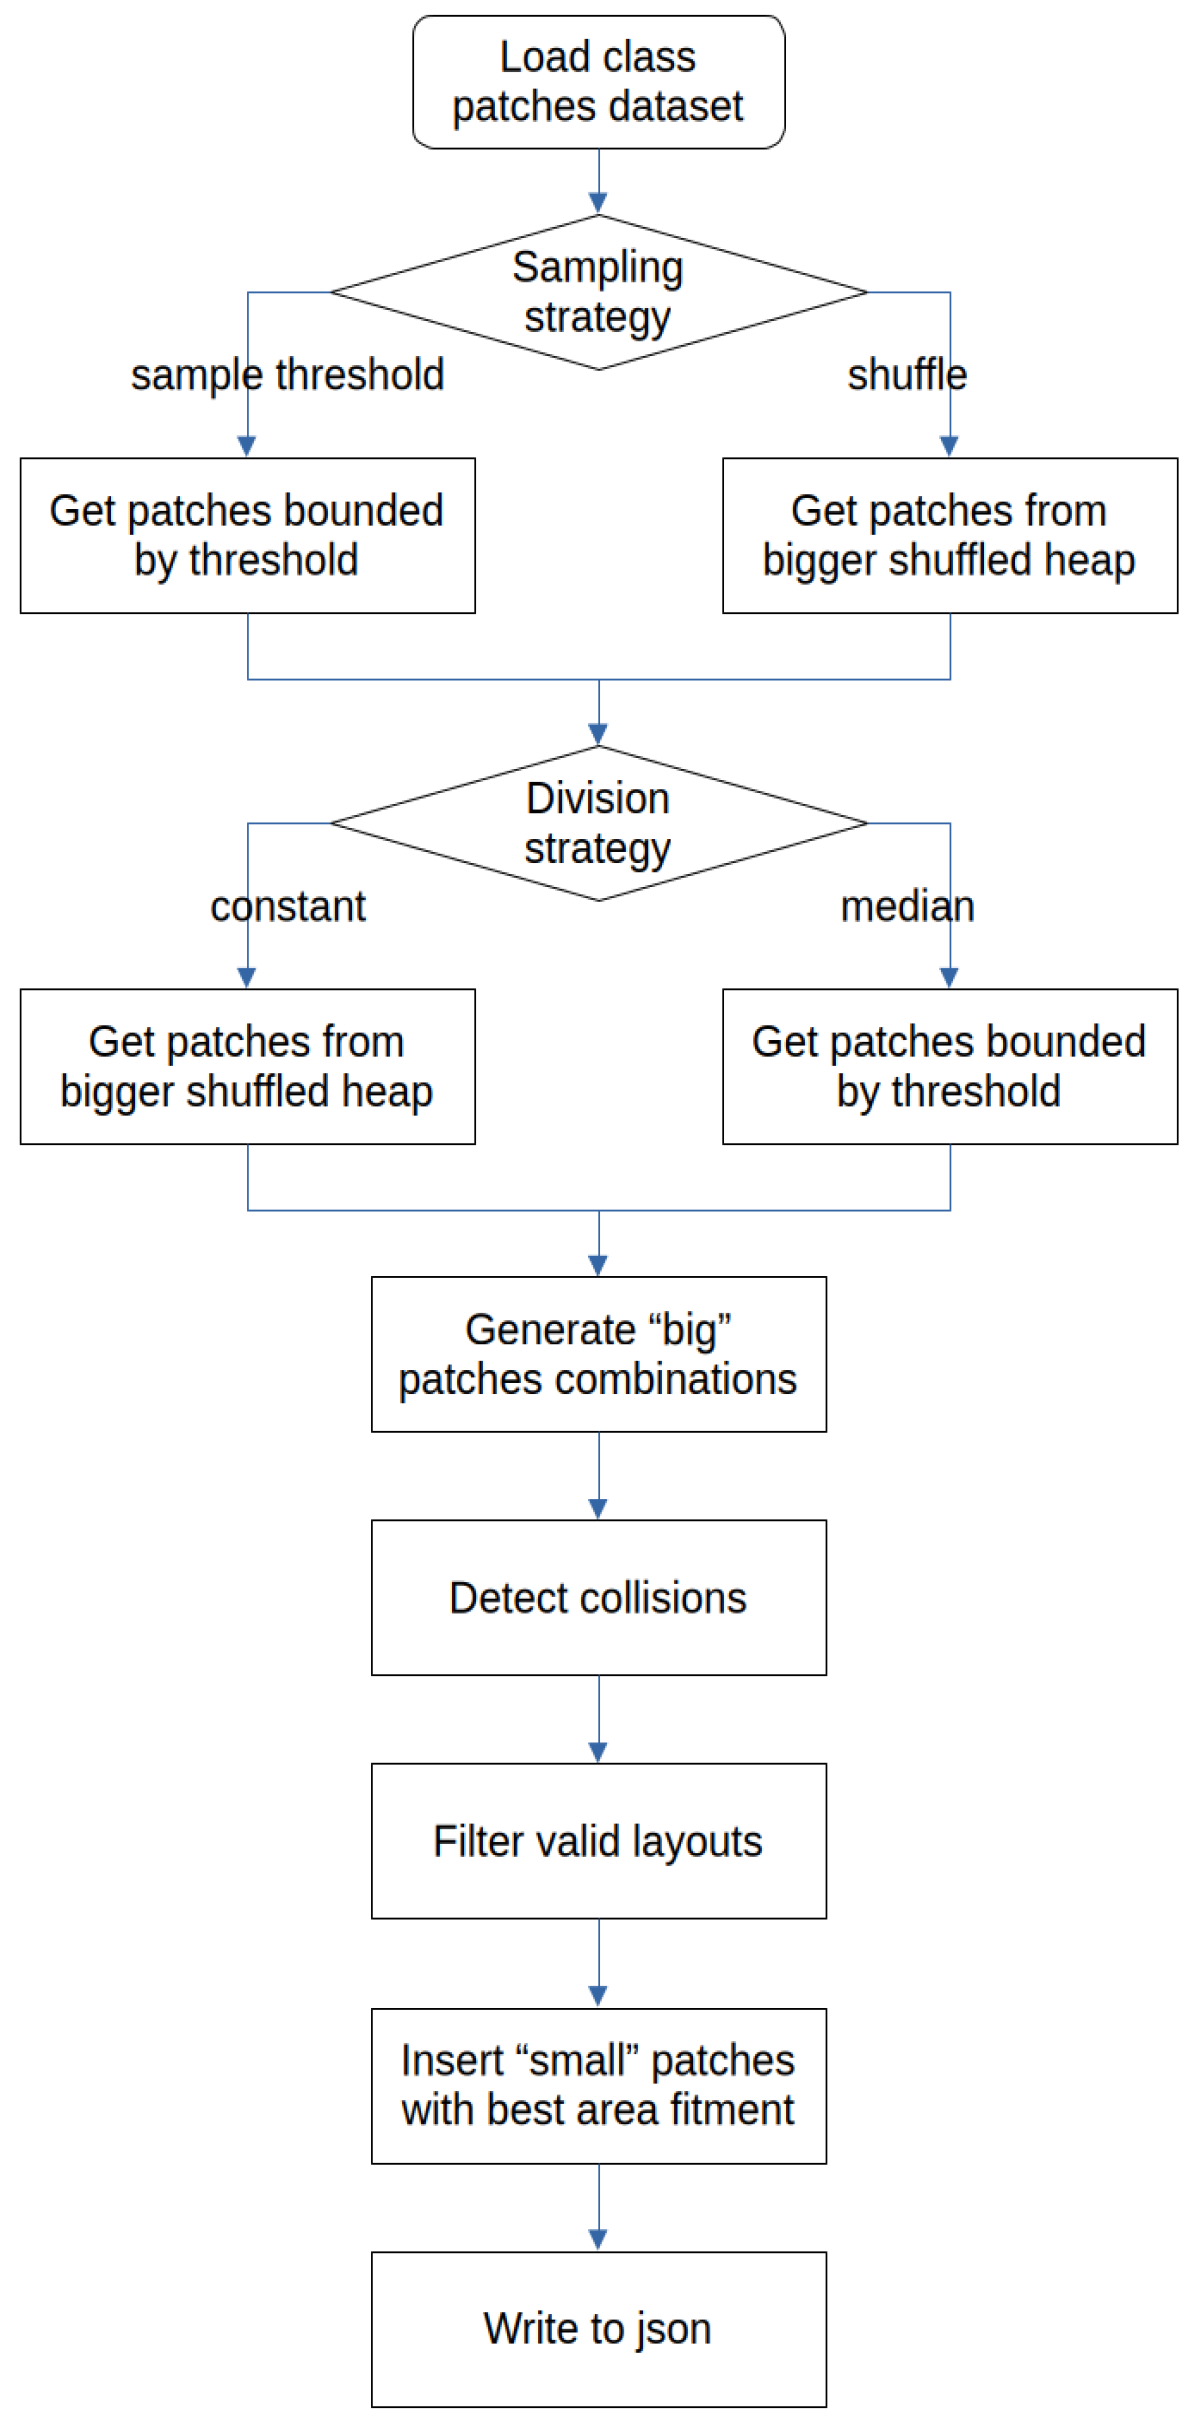
Figure 1 presents a procedural flowchart of the synthetic layout generation algorithm and the data sampling strategies, incorporating the studied parameterization of layout class sampling for subsequent recognition. The flowchart covers:
choice of organization method: threshold-based vs. shuffling pool;
element classification: dividing blocks into “large” and “small” using median values or constant thresholds;
placement process: combinatorial block arrangement, starting with large elements and filling voids with small ones, while maintaining the no-overlap condition.
Figure 1 illustrates the sequence of stages in the training sample formation algorithm. The first stage involves determining the data sampling strategy, with two approaches considered: equalizing class frequency representation by selecting images up to a specified threshold, and sequential selection from a larger, randomly shuffled pool.
The next stage involves dividing image blocks into “small” and “large” categories for differentiated processing. In this case, two demarcation strategies are investigated: one based on a fixed threshold (set at 0.05 of the page width and height) and another based on median values dynamically calculated from the dataset. Subsequently, random combinations of “large” blocks are formed, after which the voids between them are filled with “small” blocks. This approach ensures a more uniform and structurally consistent representation of elements in the generated images.

2.3. Generating Synthetic Datasets Based on the Proposed Model

Based on the proposed model, four data generation strategies were implemented by combining various parameters:
constant division with threshold-based extraction;
constant division with sampling from a shuffled pool;
median-based division with threshold-based extraction;
median-based division with sampling from a shuffled pool.
These combinations collectively influence spatial and class distribution mechanisms. Following these strategies, four datasets were generated, each containing 10,000 layouts, with consistent overall sample sizes to ensure comparability. For each dataset, augmented pre-training sets were created, consisting of 8000 images for training, 1000 for testing, and 1000 for validation.
To verify structural differences between generation strategies, spatial heatmaps of normalized block centers were computed. Additionally, bounding box size distributions and density statistics were analyzed.

2.4. Model Architecture and Training Protocol

All experiments were conducted using the Ultralytics implementation of the YOLO11m architecture. Due to GPU memory constraints (NVIDIA GeForce GTX 1080 Ti with 11 GB VRAM), the batch size was set to 16 with an input resolution of 640 × 640 pixels. The model was trained for 20 epochs using the Stochastic Gradient Descent (SGD) optimizer. The initial learning rate was set to 0.002, followed by a cosine decay schedule reaching 0.0001 by the end of training. A weight decay coefficient of 5 × 10⁻⁴ was applied, consistent with the default YOLO configuration. All other hyperparameters were kept at their default Ultralytics values to ensure standardization and comparability.
To illustrate practical application and integration into MinerU v. 0.6.1, the pre-trained YOLO model was adapted to a reduced set of target classes, as detailed in the subsequent sections.

2.5. Evaluation Metrics

Since layout analysis algorithms must ensure high reliability and stability across diverse document types, a formal mathematical framework for evaluating accuracy is a critical component of this research. Such a model enables an objective comparison of different approaches, facilitates tracking of training dynamics, and determines how specific data generation parameters influence the final results. Therefore, it is essential to formalize the metrics for measuring recognition effectiveness before conducting experiments.
To evaluate the performance of object detection models in modern computer vision systems, standard quantitative metrics are employed to provide a comprehensive assessment of accuracy and completeness. The primary metrics include Precision (P), as defined in Equation (7), Recall (R) from Equation (8), and various forms of mean Average Precision (mAP) following Equation (10). These metrics account for both correct and erroneous classifications based on true positives (TP), false positives (FP), true negatives (TN), and false negatives (FN), as well as the threshold value (Equation (9)) used to determine successful detection. Their detailed definitions are as follows:
P =   T P T P + F P
R = T P T P + F N
r = t h r e s h o l d
A P = 0 1 P r d r = 1 n i = 1 n P ( r i )
The mAP metric evaluates the quality of object detection tasks and is calculated as the average of Average Precision (AP) across all classes, where AP represents the area under the precision–recall curve for a specific class. In Equation (11), mAP@50 is employed, where the value 50 indicates that the calculation is performed at a fixed Intersection over Union (IoU) threshold of 0.5. This implies that a predicted object is considered correctly detected if the overlap between the predicted and ground-truth bounding boxes is at least 50% of their union area. The mAP@50 value for K classes is the average of the AP calculated separately for each of the K classes, providing a generalized evaluation of model quality under a relatively lenient matching criterion. The variable r in Equation (11) refers to the number of recall thresholds used for averaging.
The mAP@50:95 metric, presented in Equation (12), is more stringent and informative as it is computed by averaging AP across IoU thresholds ranging from 0.50 to 0.95 with a 0.05 step. This metric reflects both the model’s detection capability and its localization accuracy under varying levels of IoU strictness.
m A P @ 50 = 1 K k = 1 K A P k r = 0.50
m A P @ 50 : 95 = 1 10 t = 0.50 0.95 1 K k = 1 K A P k ( r )
In this study, the detection performance was evaluated using: Precision, Recall, mAP@50, mAP@50:95. Training dynamics were analyzed via: box_loss, cls_loss, dfl_loss.
All metrics were calculated using the standard Ultralytics v 8.3.24 evaluation protocol.

2.6. Comparative Experiments and Practical Integration

These metrics were used in experimental comparisons of the results of the four data generation strategies. The experimental study was conducted by training the model on the target dataset and four generated datasets.
Subsequently, testing was conducted on a small set of real scientific articles to verify their practical applicability. In document processing pipelines, traditional recurrent and multi-module approaches can be replaced by convolutional ones, as demonstrated by the MinerU system [48], which supports the use of pre-trained YOLO weights [44,45]. The model architecture and training tools are available in the official repository [46].
Integrating the proposed approach into the MinerU system requires no explicit model conversion or architectural transformation. MinerU relies on the Ultralytics YOLO framework, which supports dynamic adaptation of the detection head to varying numbers of output classes while preserving the backbone and feature extraction layers.
Pre-training was conducted on synthetic data using an extended set of layout classes. During this stage, YOLO automatically embeds relevant metadata—including the class count and model configuration—within the generated weight file. To integrate these results into MinerU, the pre-trained weights are directly loaded into the YOLO-based detection module. If the target dataset contains a different number of classes than the original, the final detection layer is re-initialized to match the required output dimensionality. In this process, only the final classification heads are replaced with randomly initialized parameters corresponding to the new classes, while all other layers are preserved. While all backbone and intermediate layers retain the weights from the synthetic pre-training stage; consequently, the need for weight conversion is entirely eliminated.

3. Results

3.1. Spatial Distribution Analysis

This experiment involved isolated balancing of the total class instances within the dataset. For this purpose, the dataset was constructed by removing elements whose frequency exceeded a predefined threshold during a sequential pass through the images.
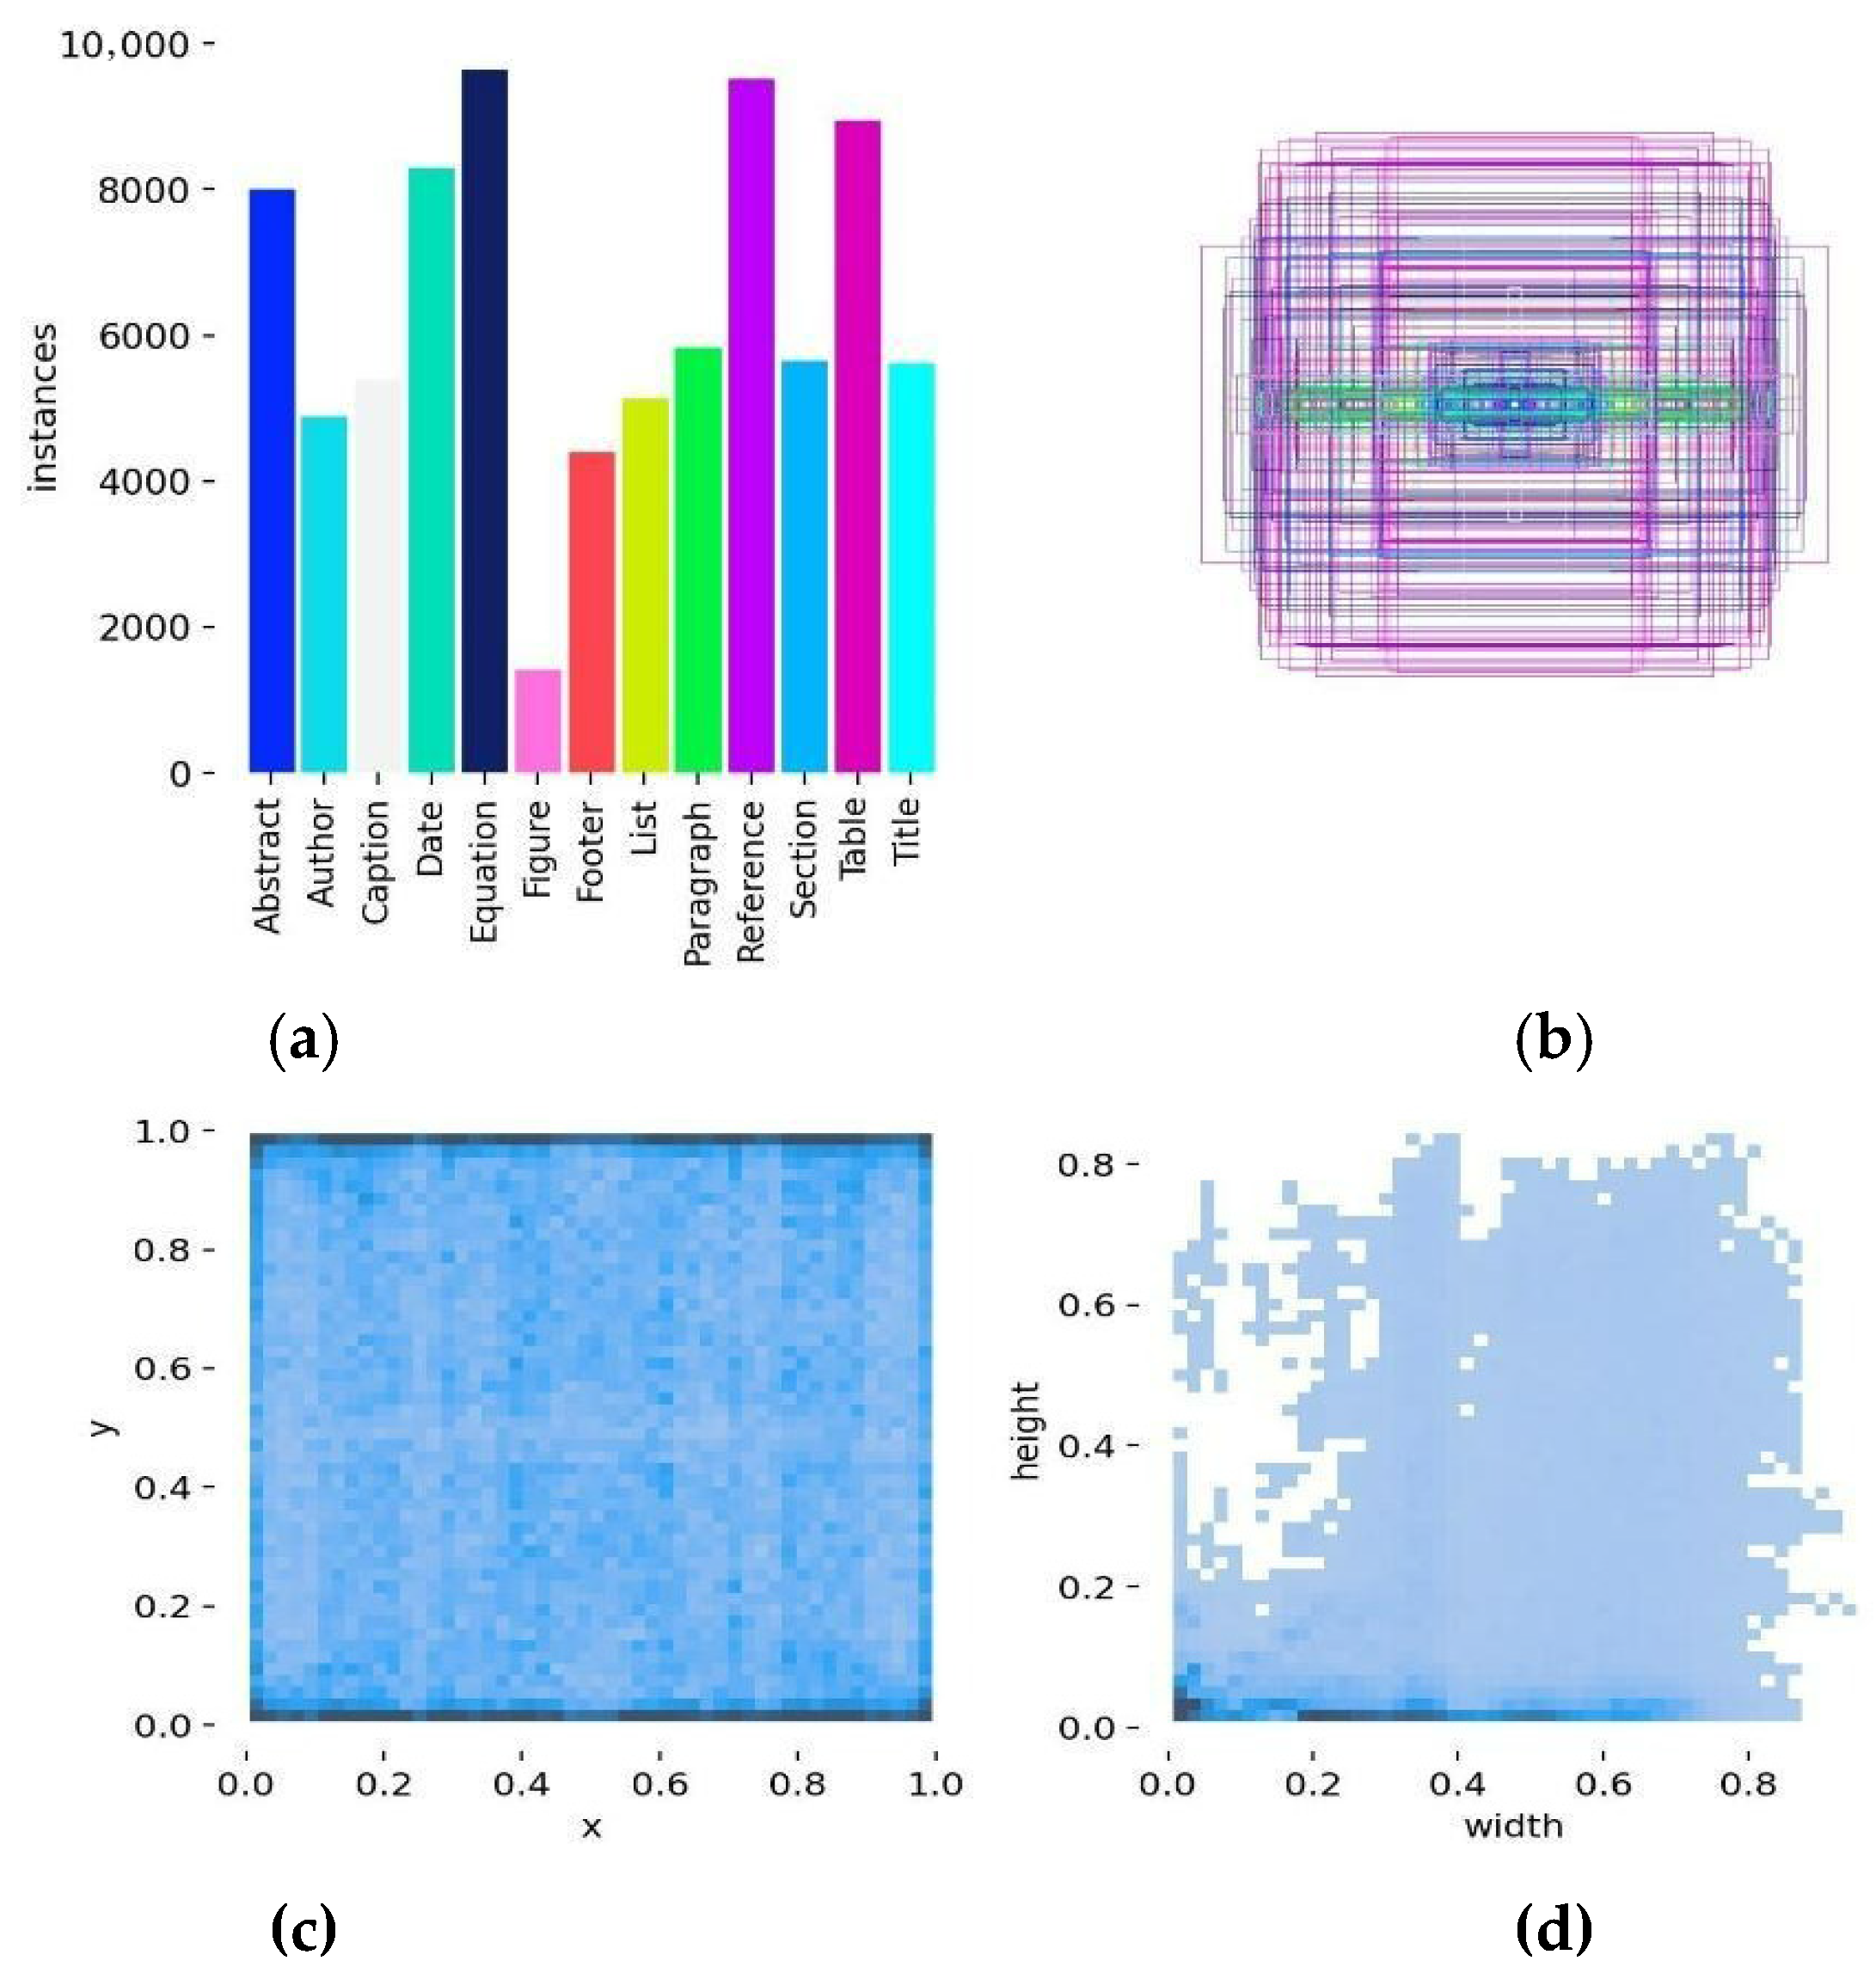
Using raw annotated layout images for pre-training often leads to suboptimal performance and a consistent deviation from the convergence path due to early overfitting. The class frequency distribution in such data is severely imbalanced, with certain classes appearing several orders of magnitude more frequently than others. By applying frequency-based filtering to the recognition classes, it is possible to eliminate redundant markup blocks (Figure 2). Notably, this approach preserves the original spatial arrangement of the remaining blocks.
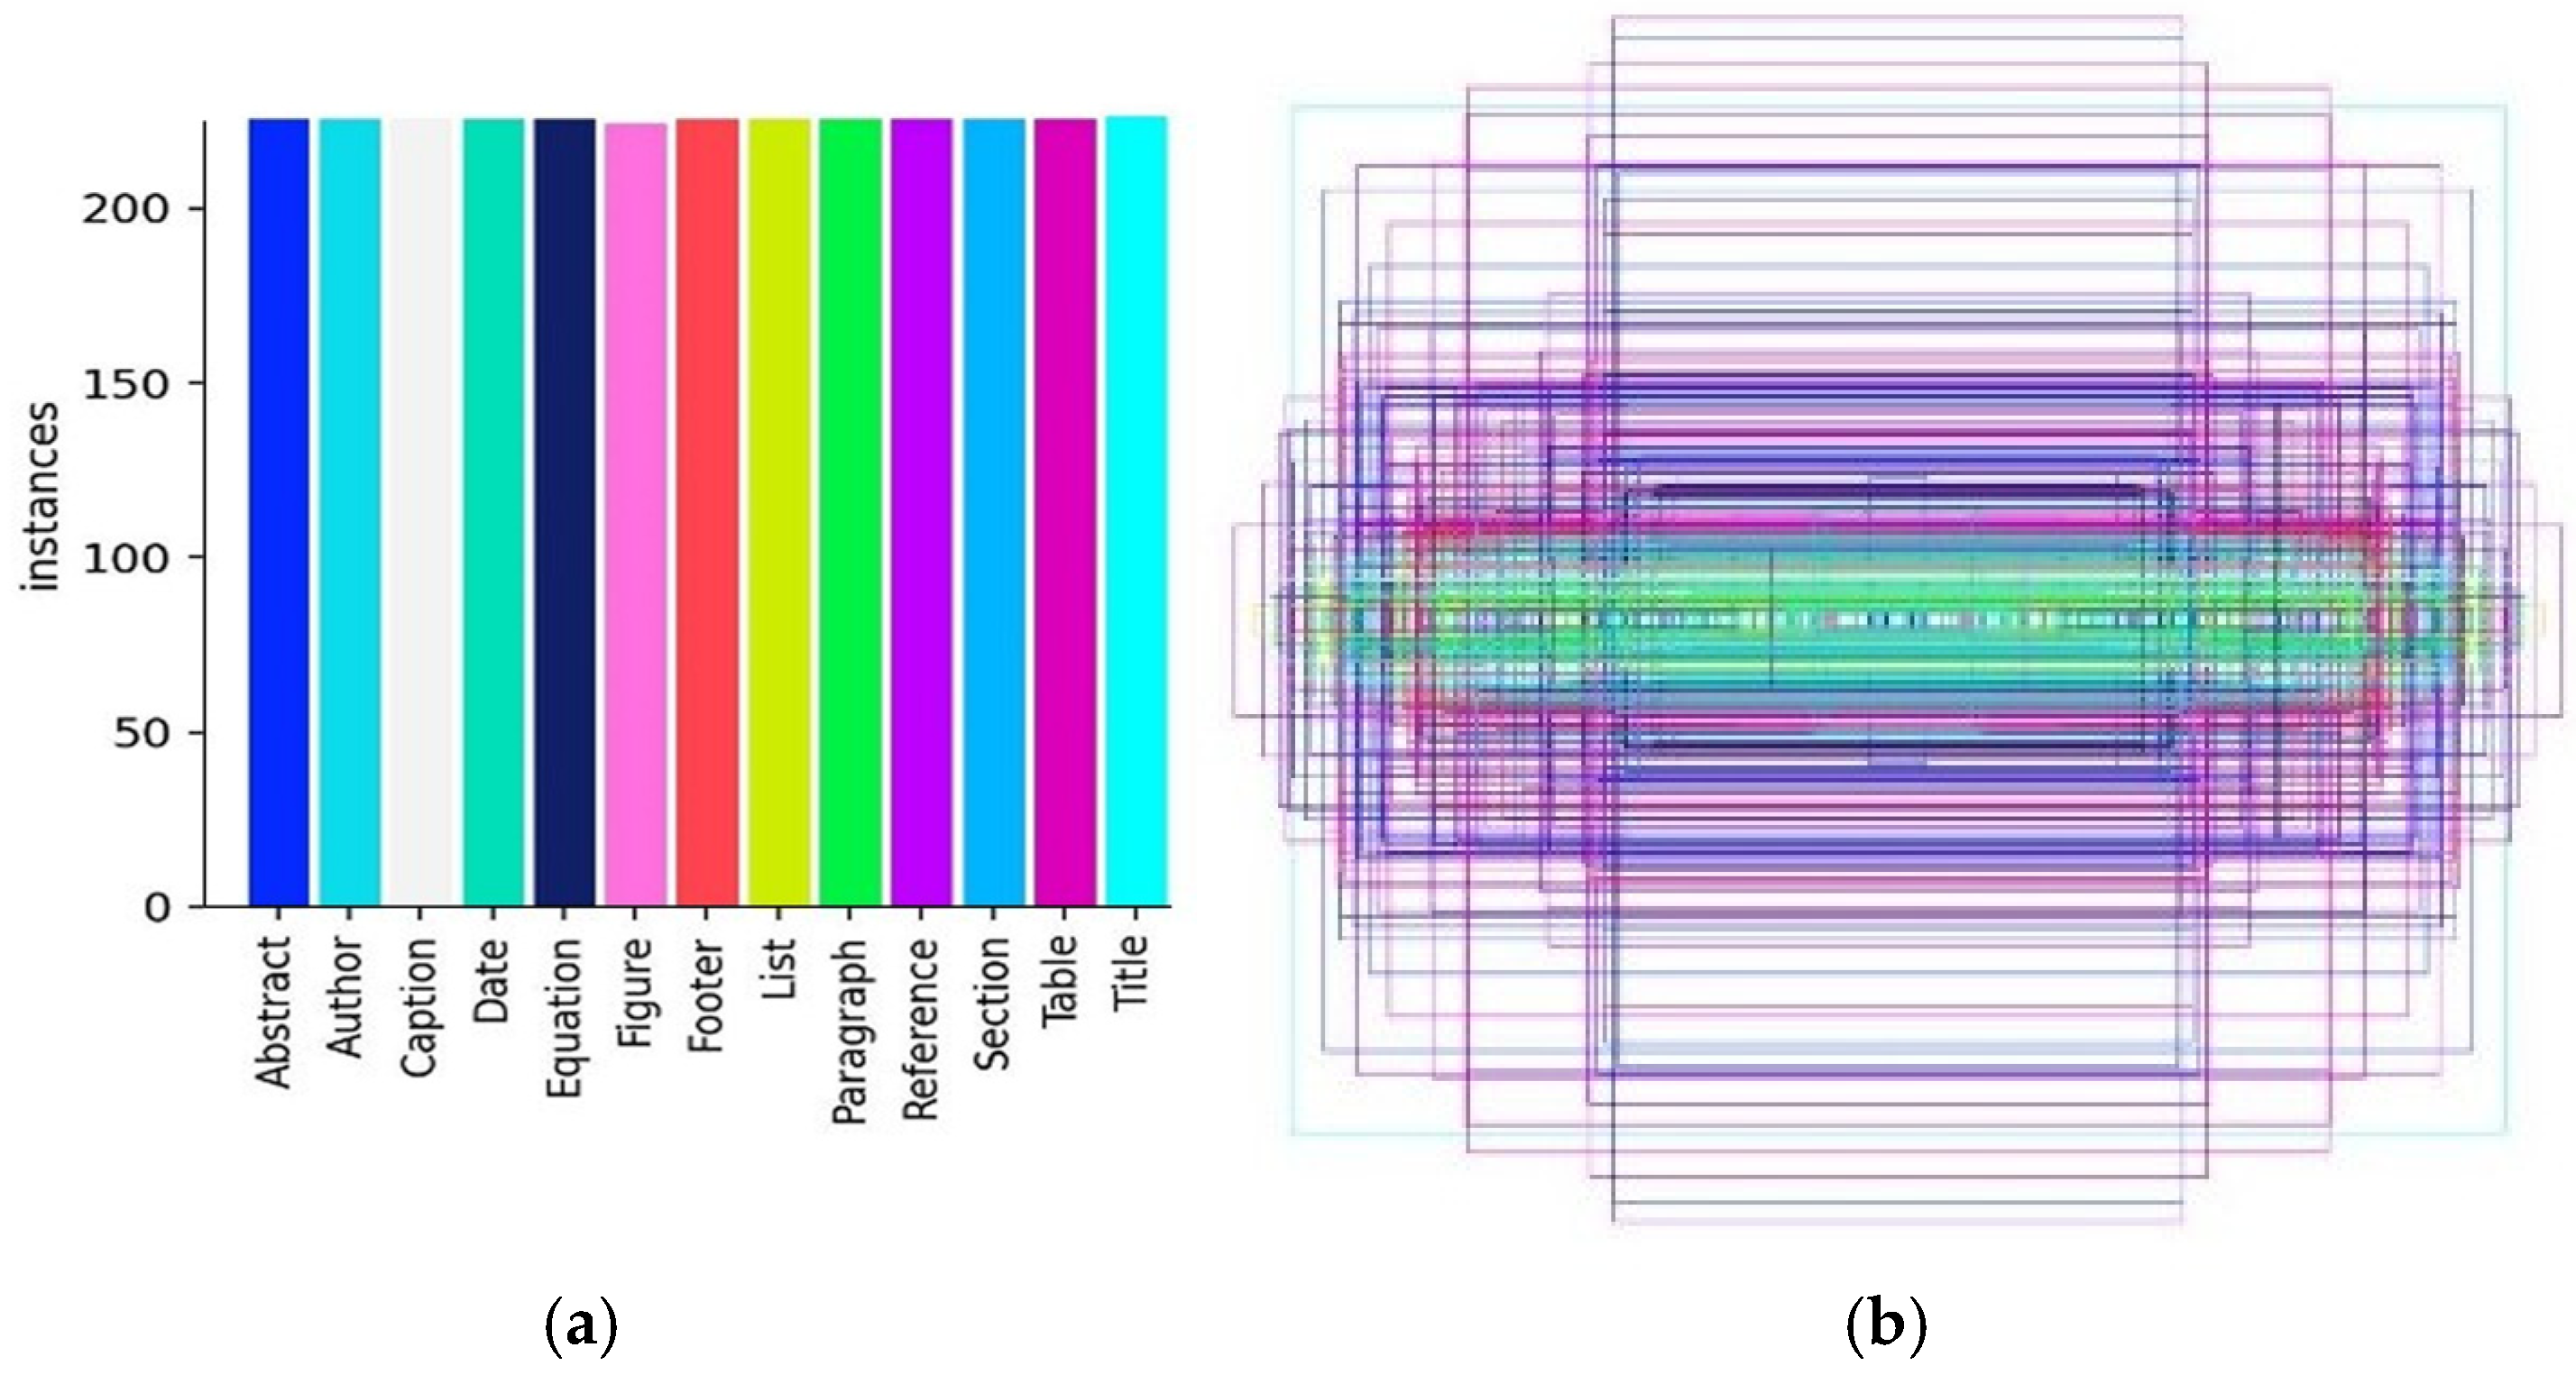
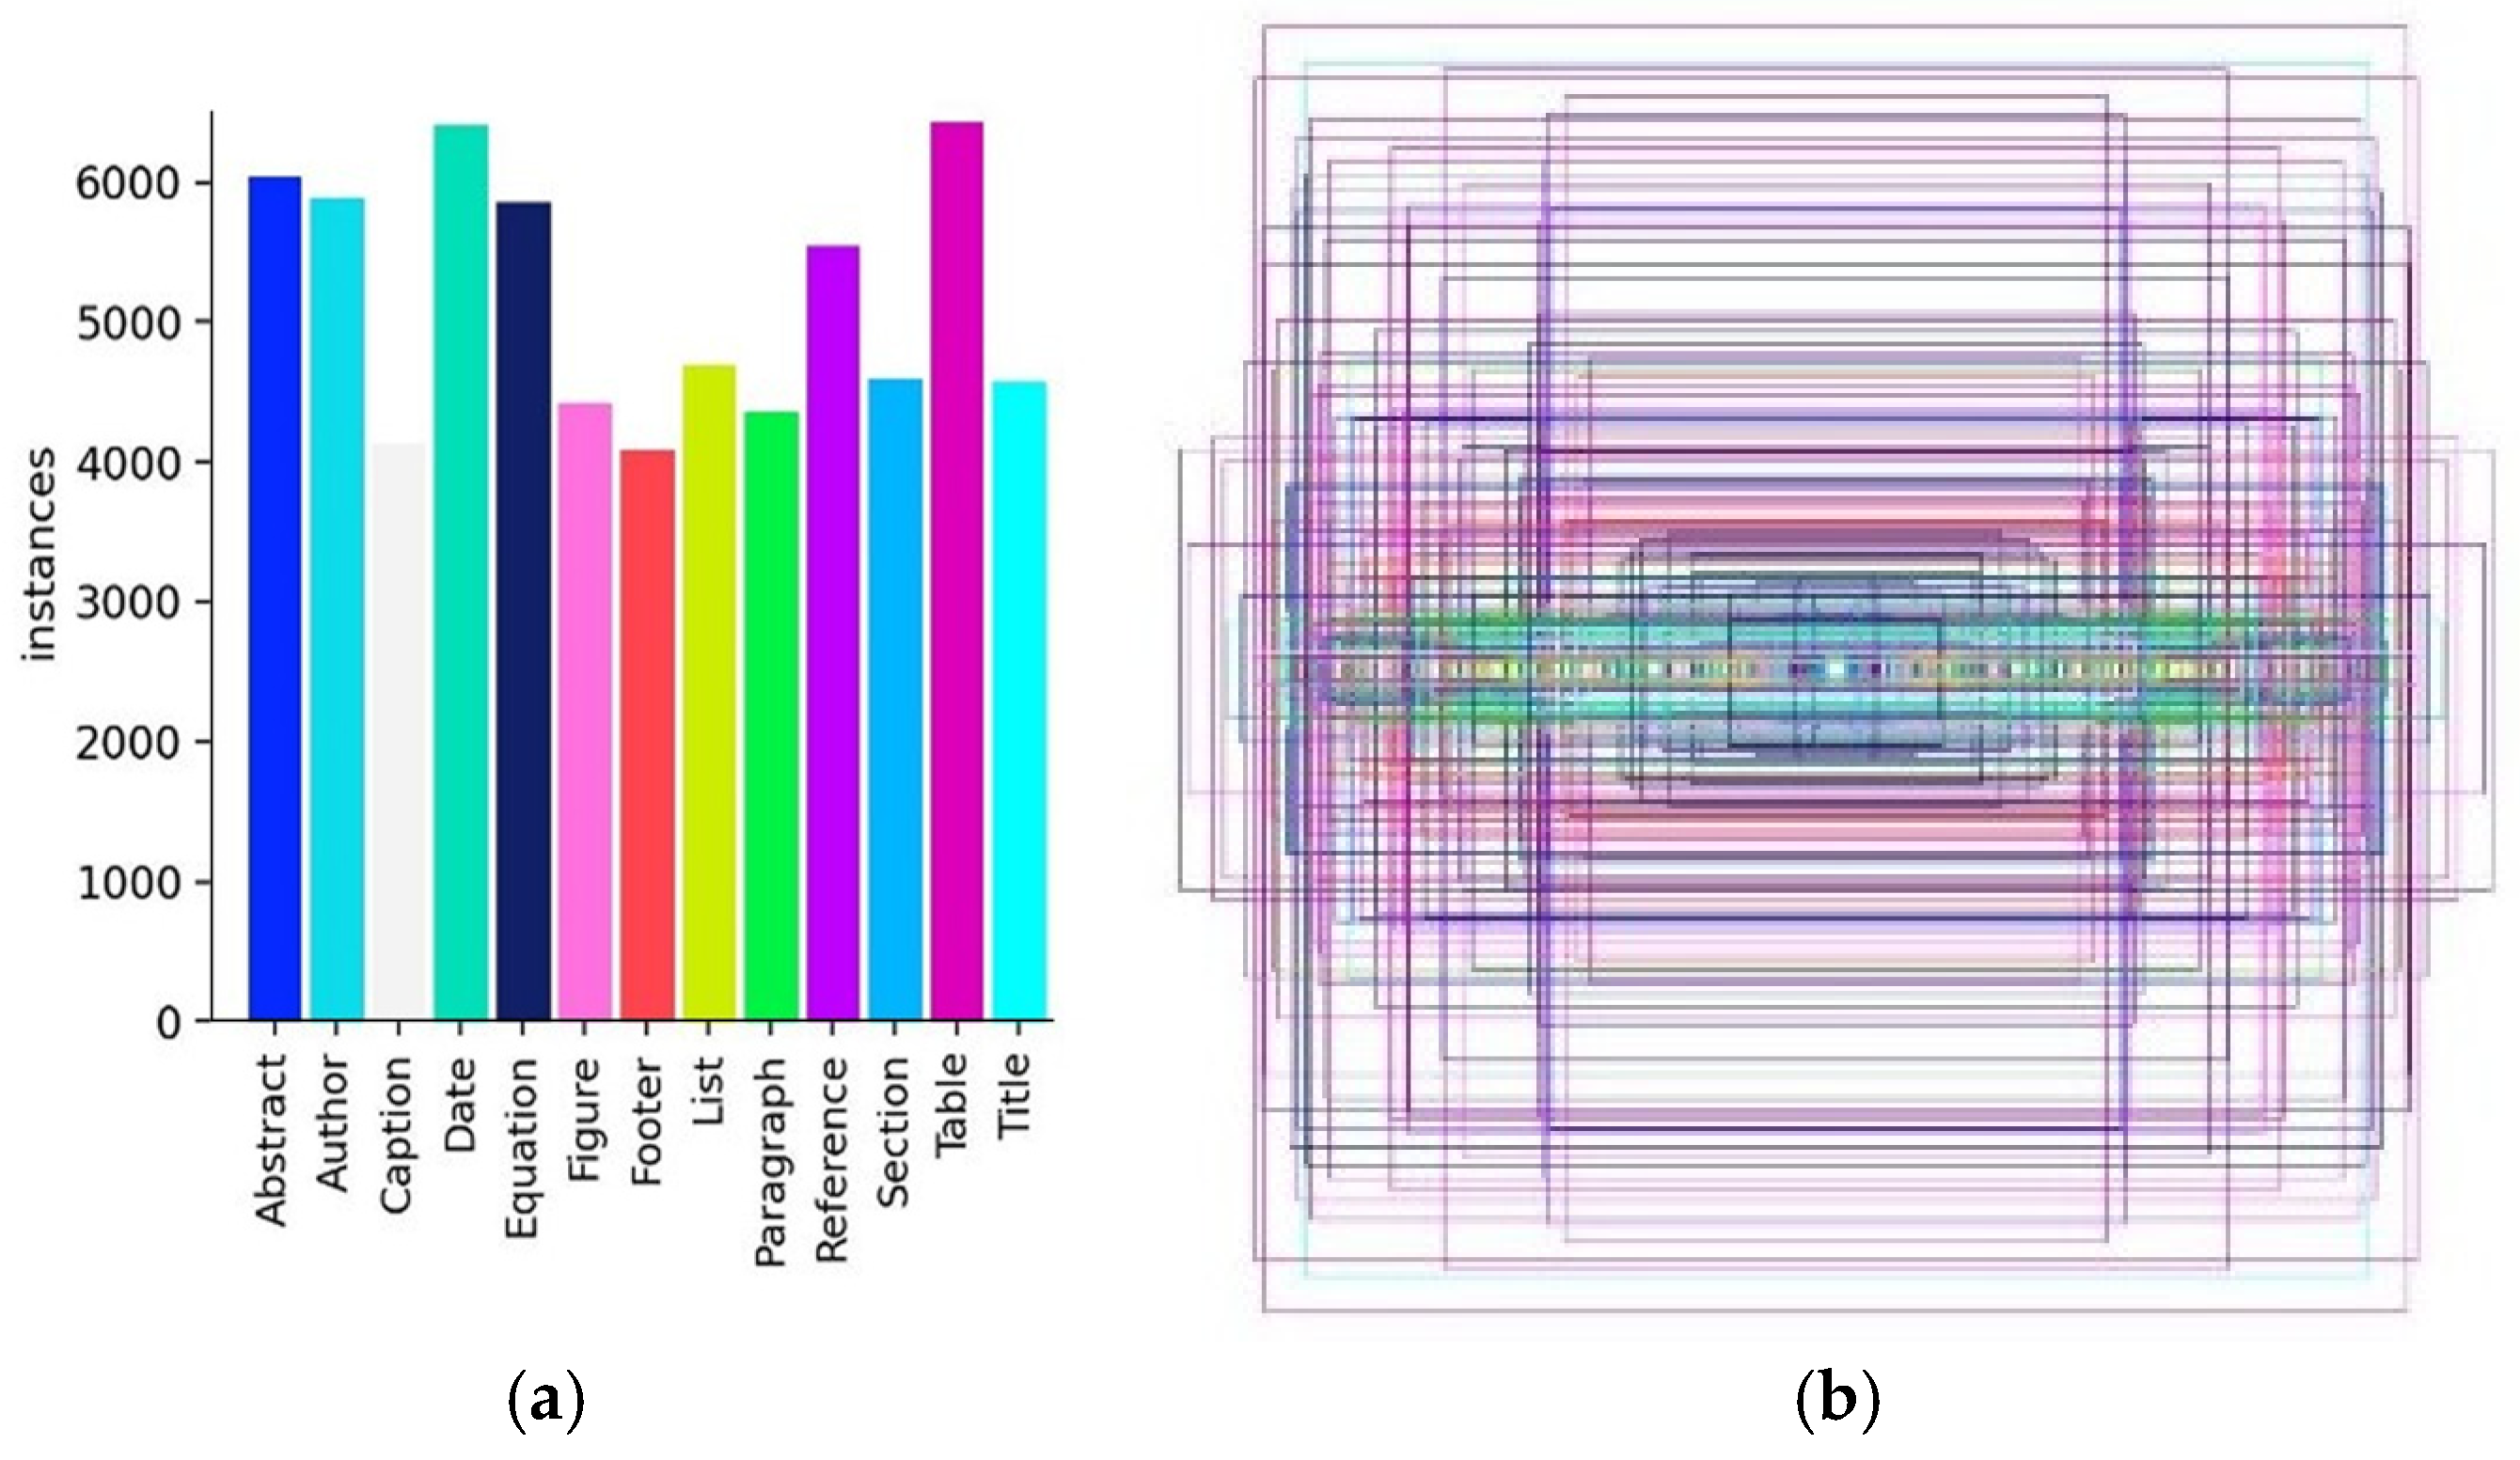
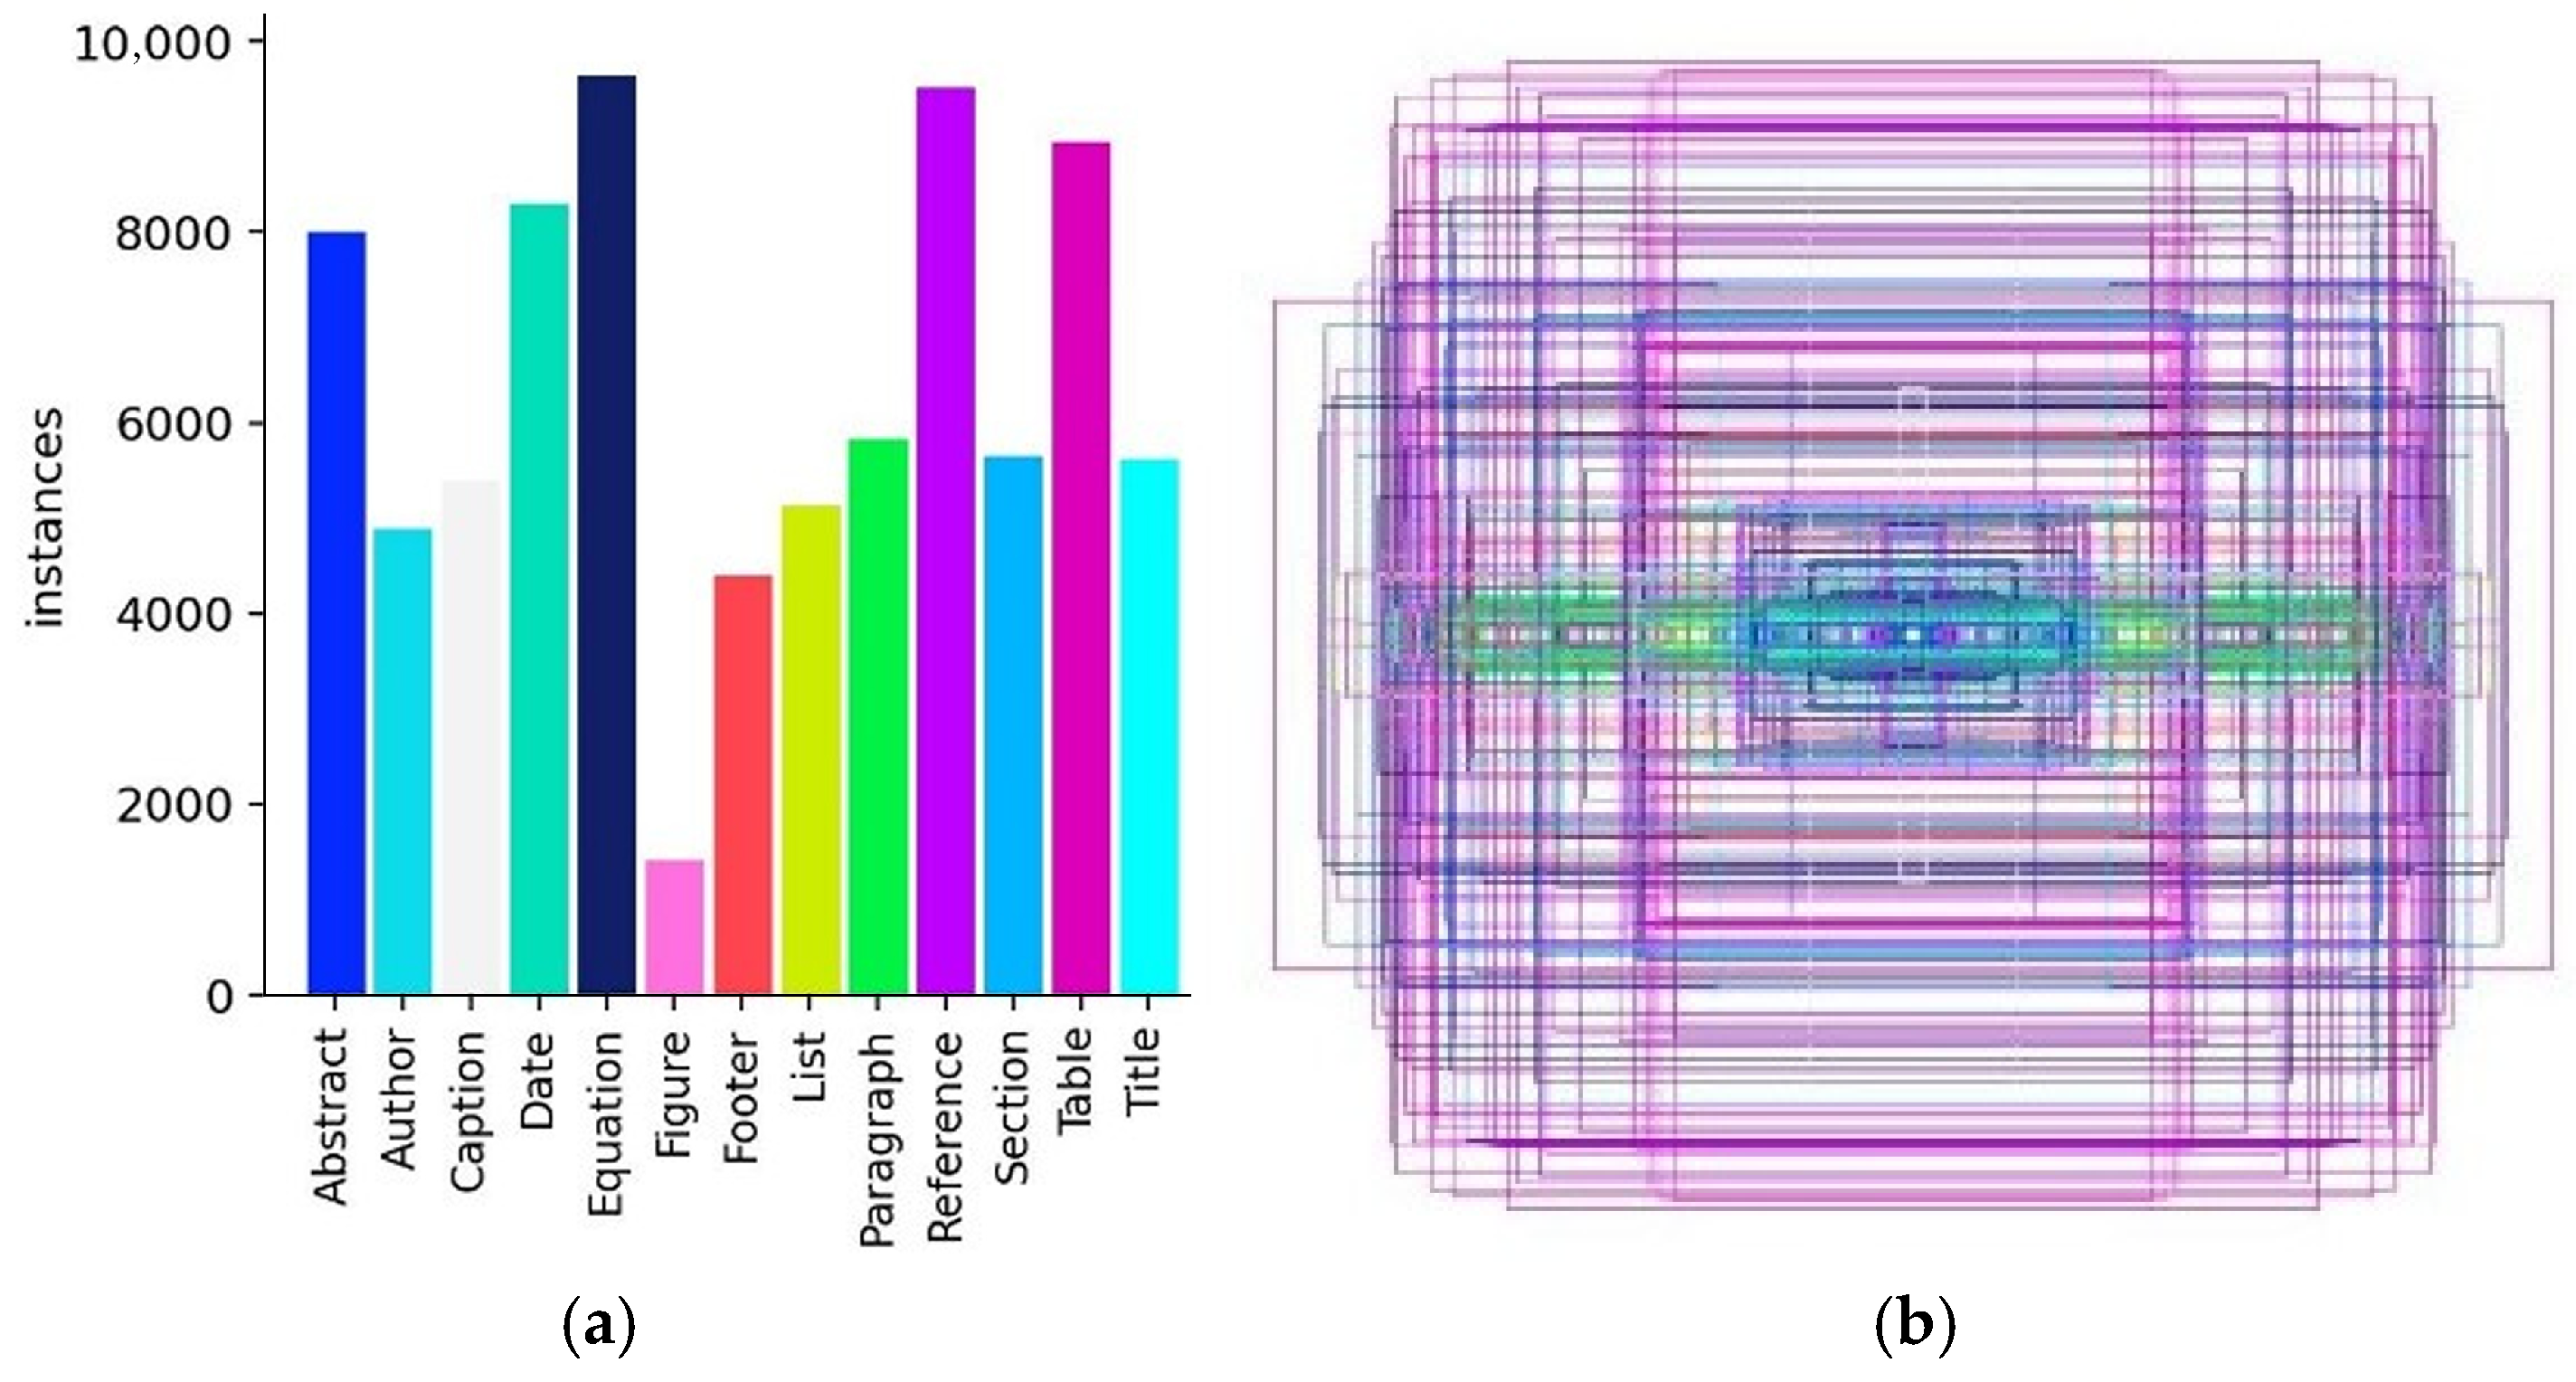
In this way, it becomes possible to balance the frequency representation of the recognition classes (Figure 3a). The horizontal axis (X) represents document layout classes, i.e., types of structural elements in a document. The vertical axis (Y) represents the number of instances (Instances), indicating the count of each class in the dataset.
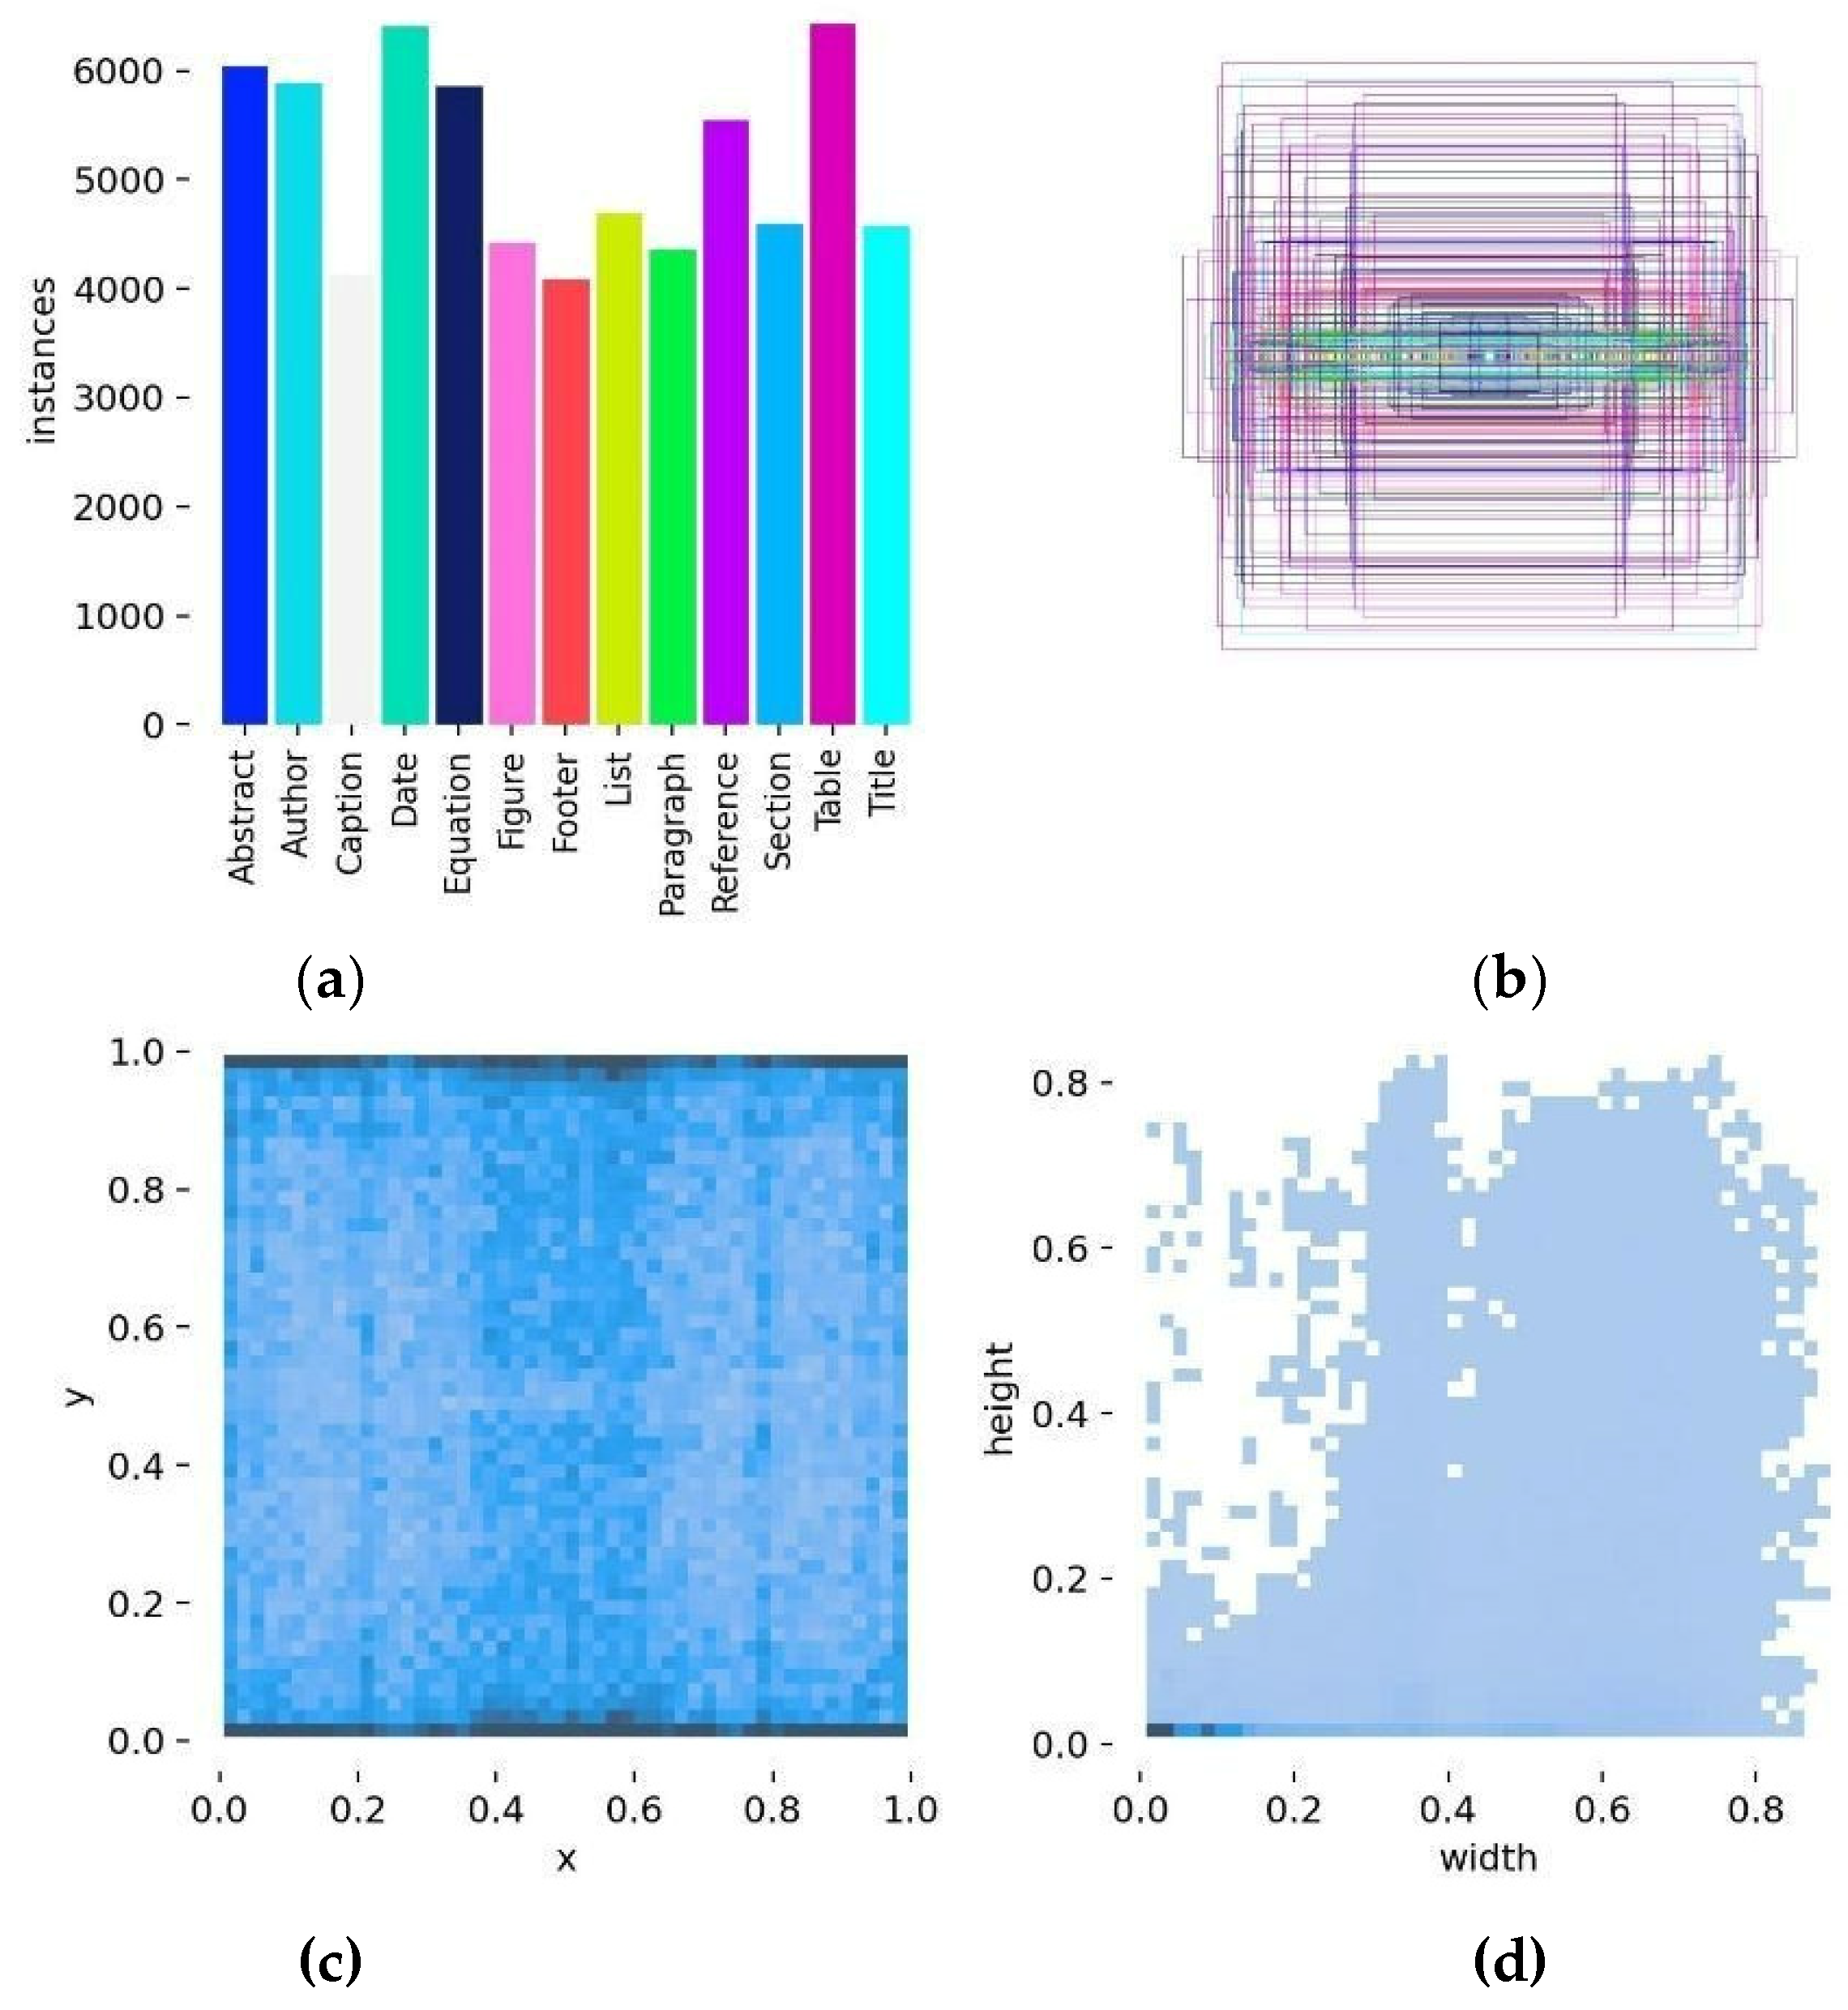
Figure 3a shows that the number of instances across different classes is approximately equal, indicating that the dataset is balanced. This distribution leads to the spatial representation of blocks illustrated in the resulting dataset.
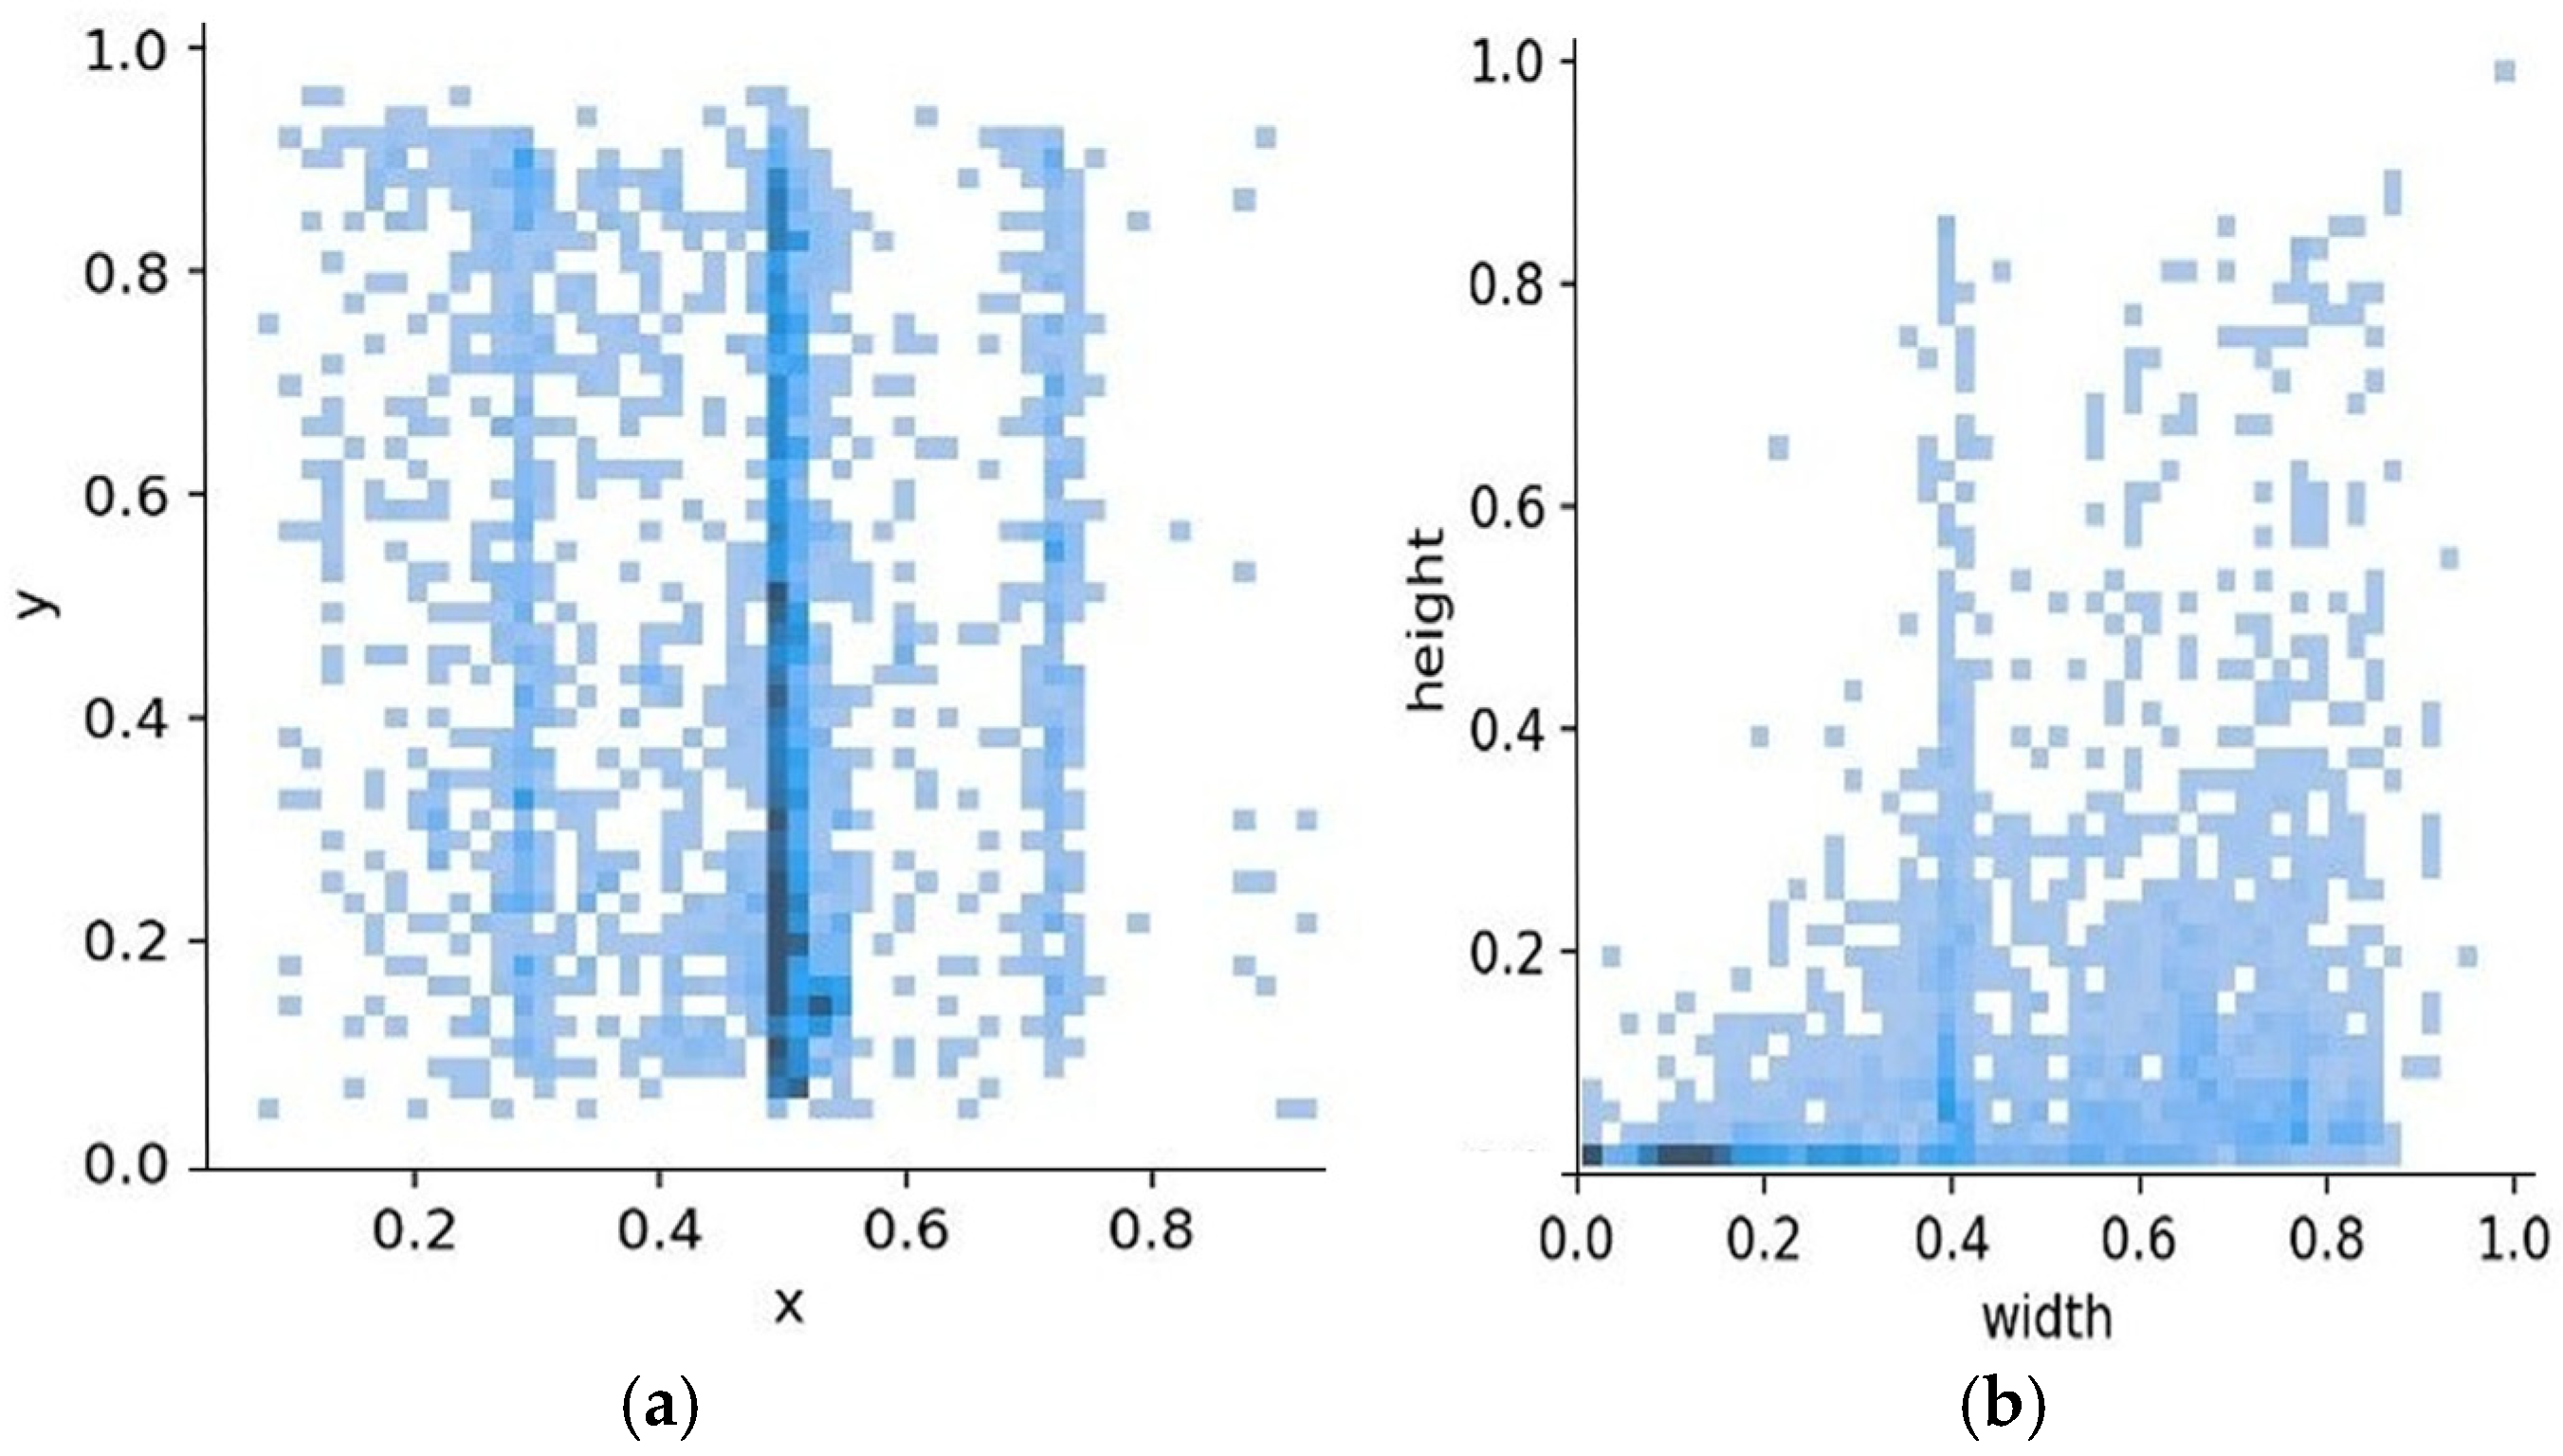
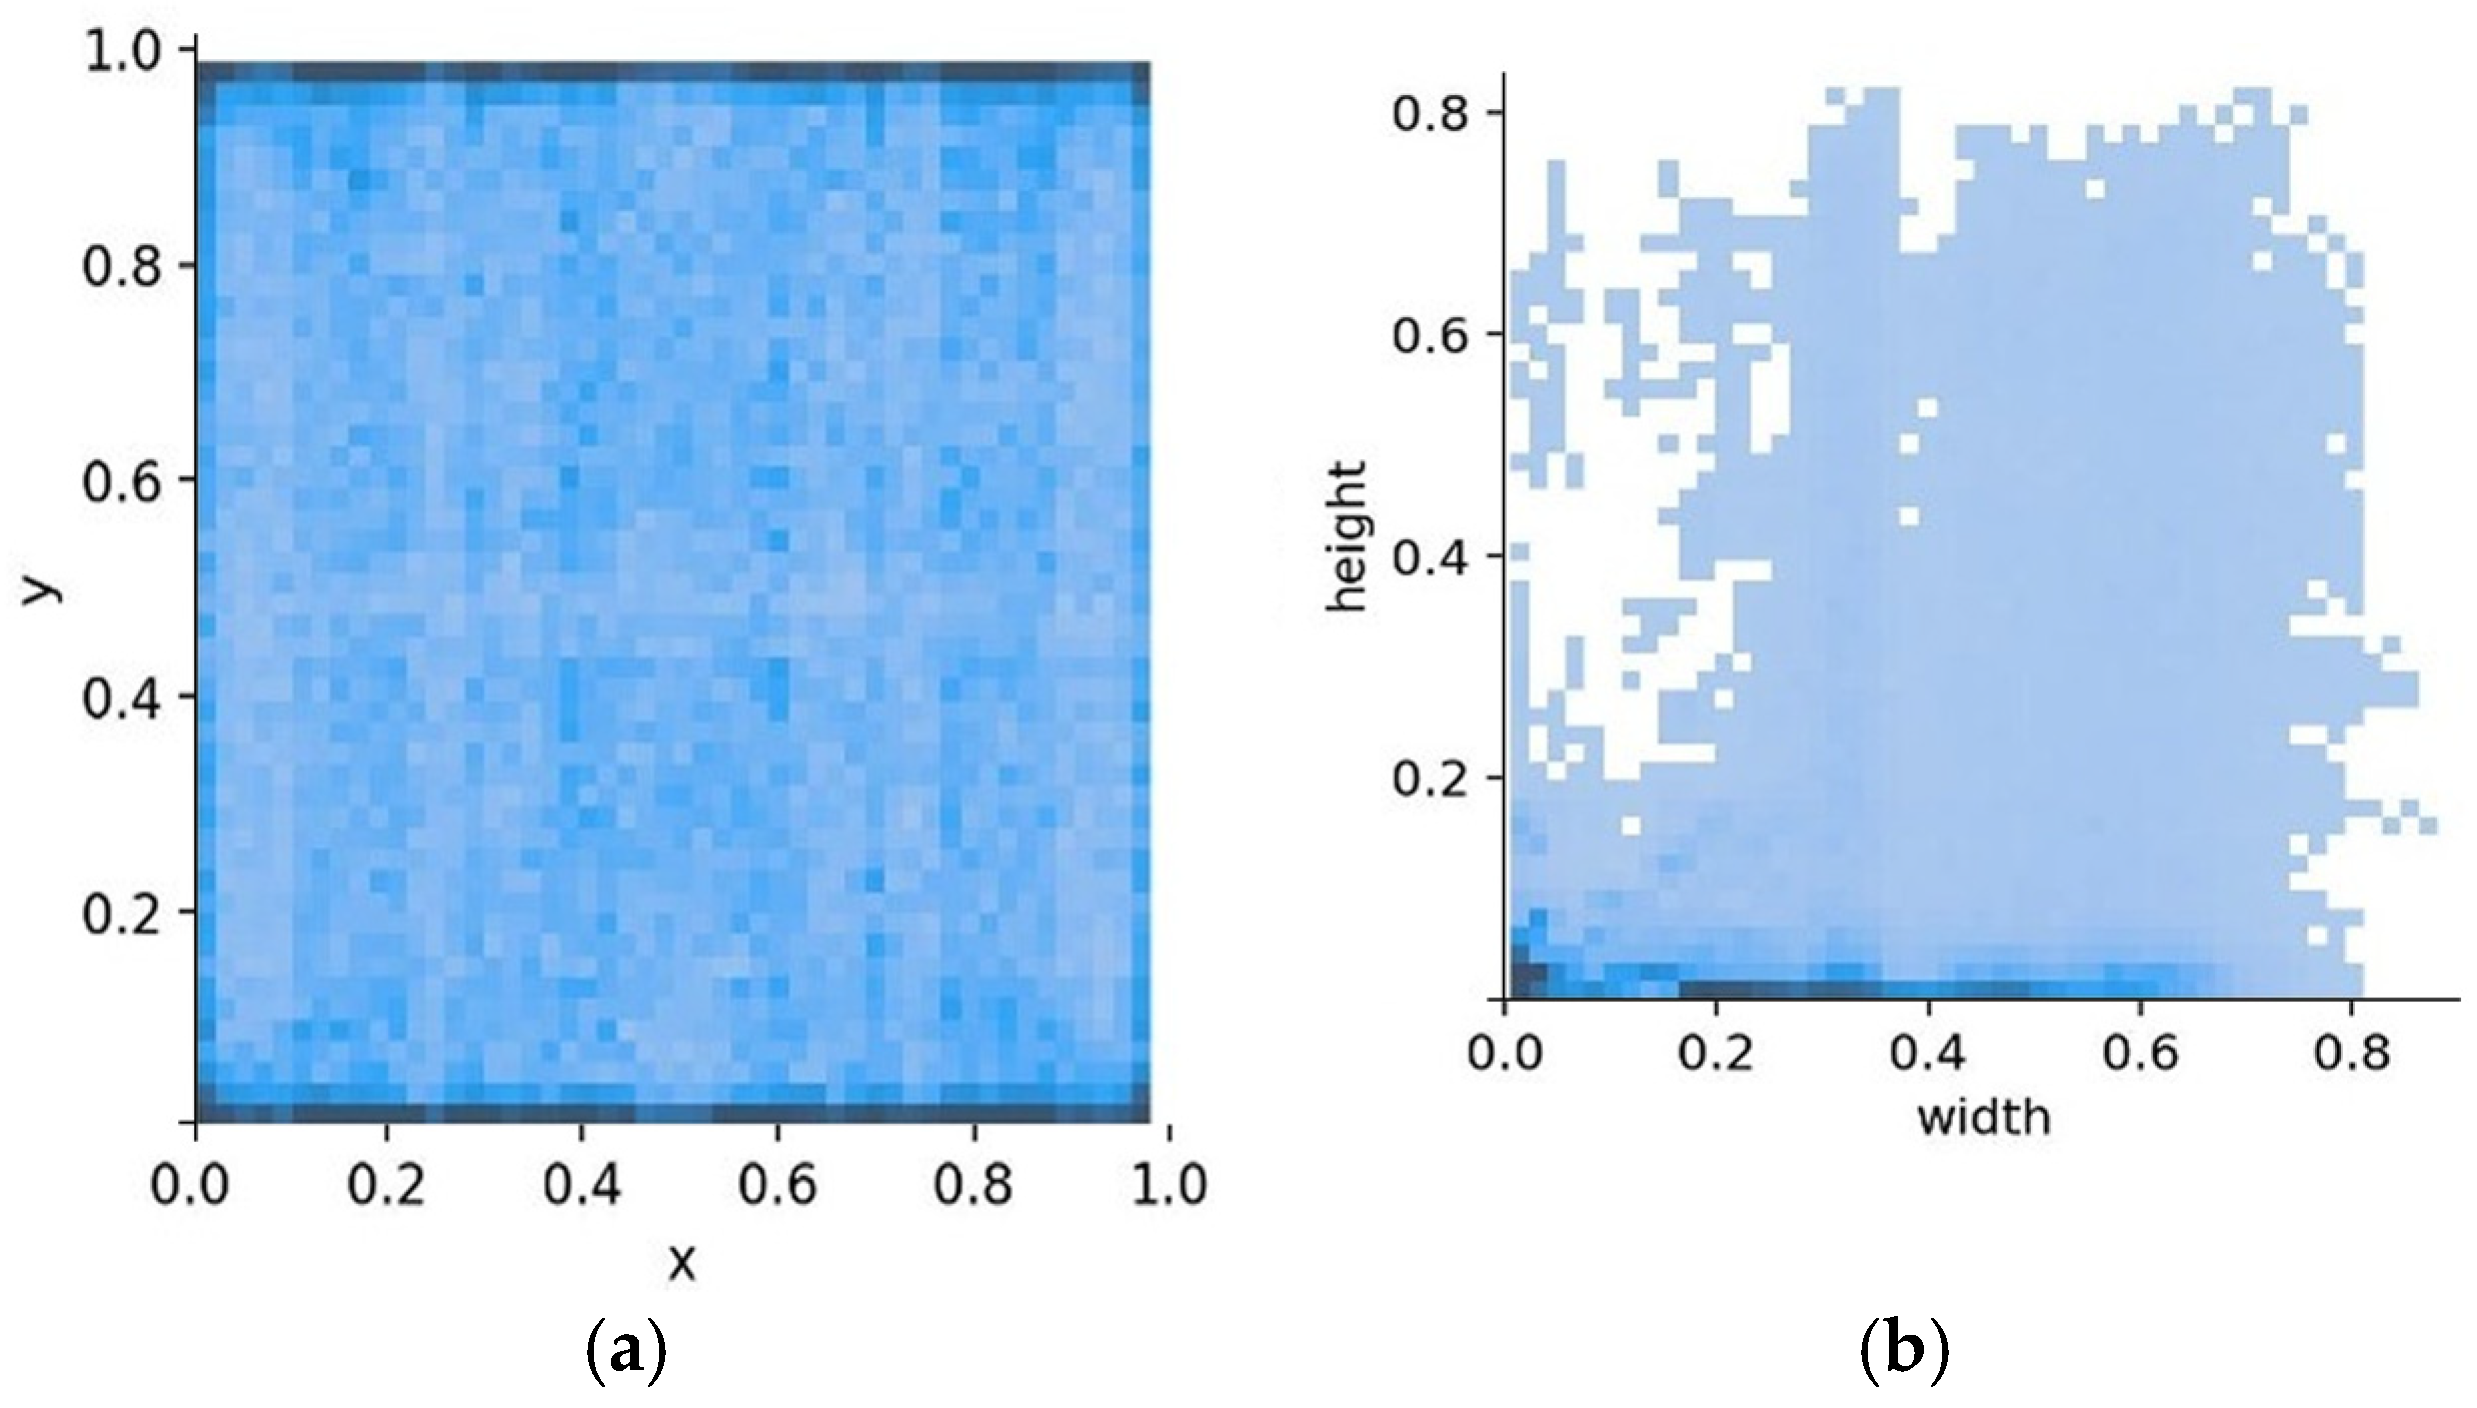
Figure 4 demonstrates the spatial and dimensional patterns of document elements. As is typical for document layout blocks, most are centered at specific fixed page widths (Figure 4a). A similar pattern is observed for block sizes (Figure 4b): a high concentration of small blocks exists with specific heights or average widths.
Figure 4a shows the distribution of the starting points of bounding boxes on the document page. The X and Y axes represent the normalized horizontal and vertical coordinates of the elements, respectively. The clustering of points along vertical bands indicates a typical columnar or aligned arrangement of elements, such as body text, formulas, or tables.
Figure 4b illustrates the size distribution of element bounding boxes. The X-axis represents the normalized width, while the Y-axis represents the normalized height relative to the page dimensions. The plot demonstrates a high concentration of small elements (low height values) and specific classes with characteristic fixed widths or heights.
Training on such data is ineffective because the low density of block occurrences prevents convergence within a reasonable timeframe. Furthermore, removing empty pages fails to resolve the issue, as it leads to early overfitting due to the reduced dataset size and insufficient variability in block positioning.

3.2. Comparative Evaluation of Generation Strategies

The influence of generation parameters on page appearance and training metrics is investigated. By combining two available parameters, each with two possible values, four configurations were derived. Although experiments were conducted for all four parameter combinations, this paper focuses on the best and worst-performing configurations. The spatial distributions and learning curves of all configurations are detailed in Appendix A (Figure A1, Figure A2, Figure A3, Figure A4, Figure A5, Figure A6, Figure A7 and Figure A8).
The analysis emphasizes these extreme configurations to define the lower and upper performance bounds of the proposed framework. The constant-splitting strategy with threshold extraction represents a naive baseline, whereas median-based splitting combined with shuffled pooling illustrates the maximum performance achievable within the proposed structural formulation. This contrast highlights the practical impact of transitioning from rigid linear extraction to spatially distributed and statistically balanced generation.
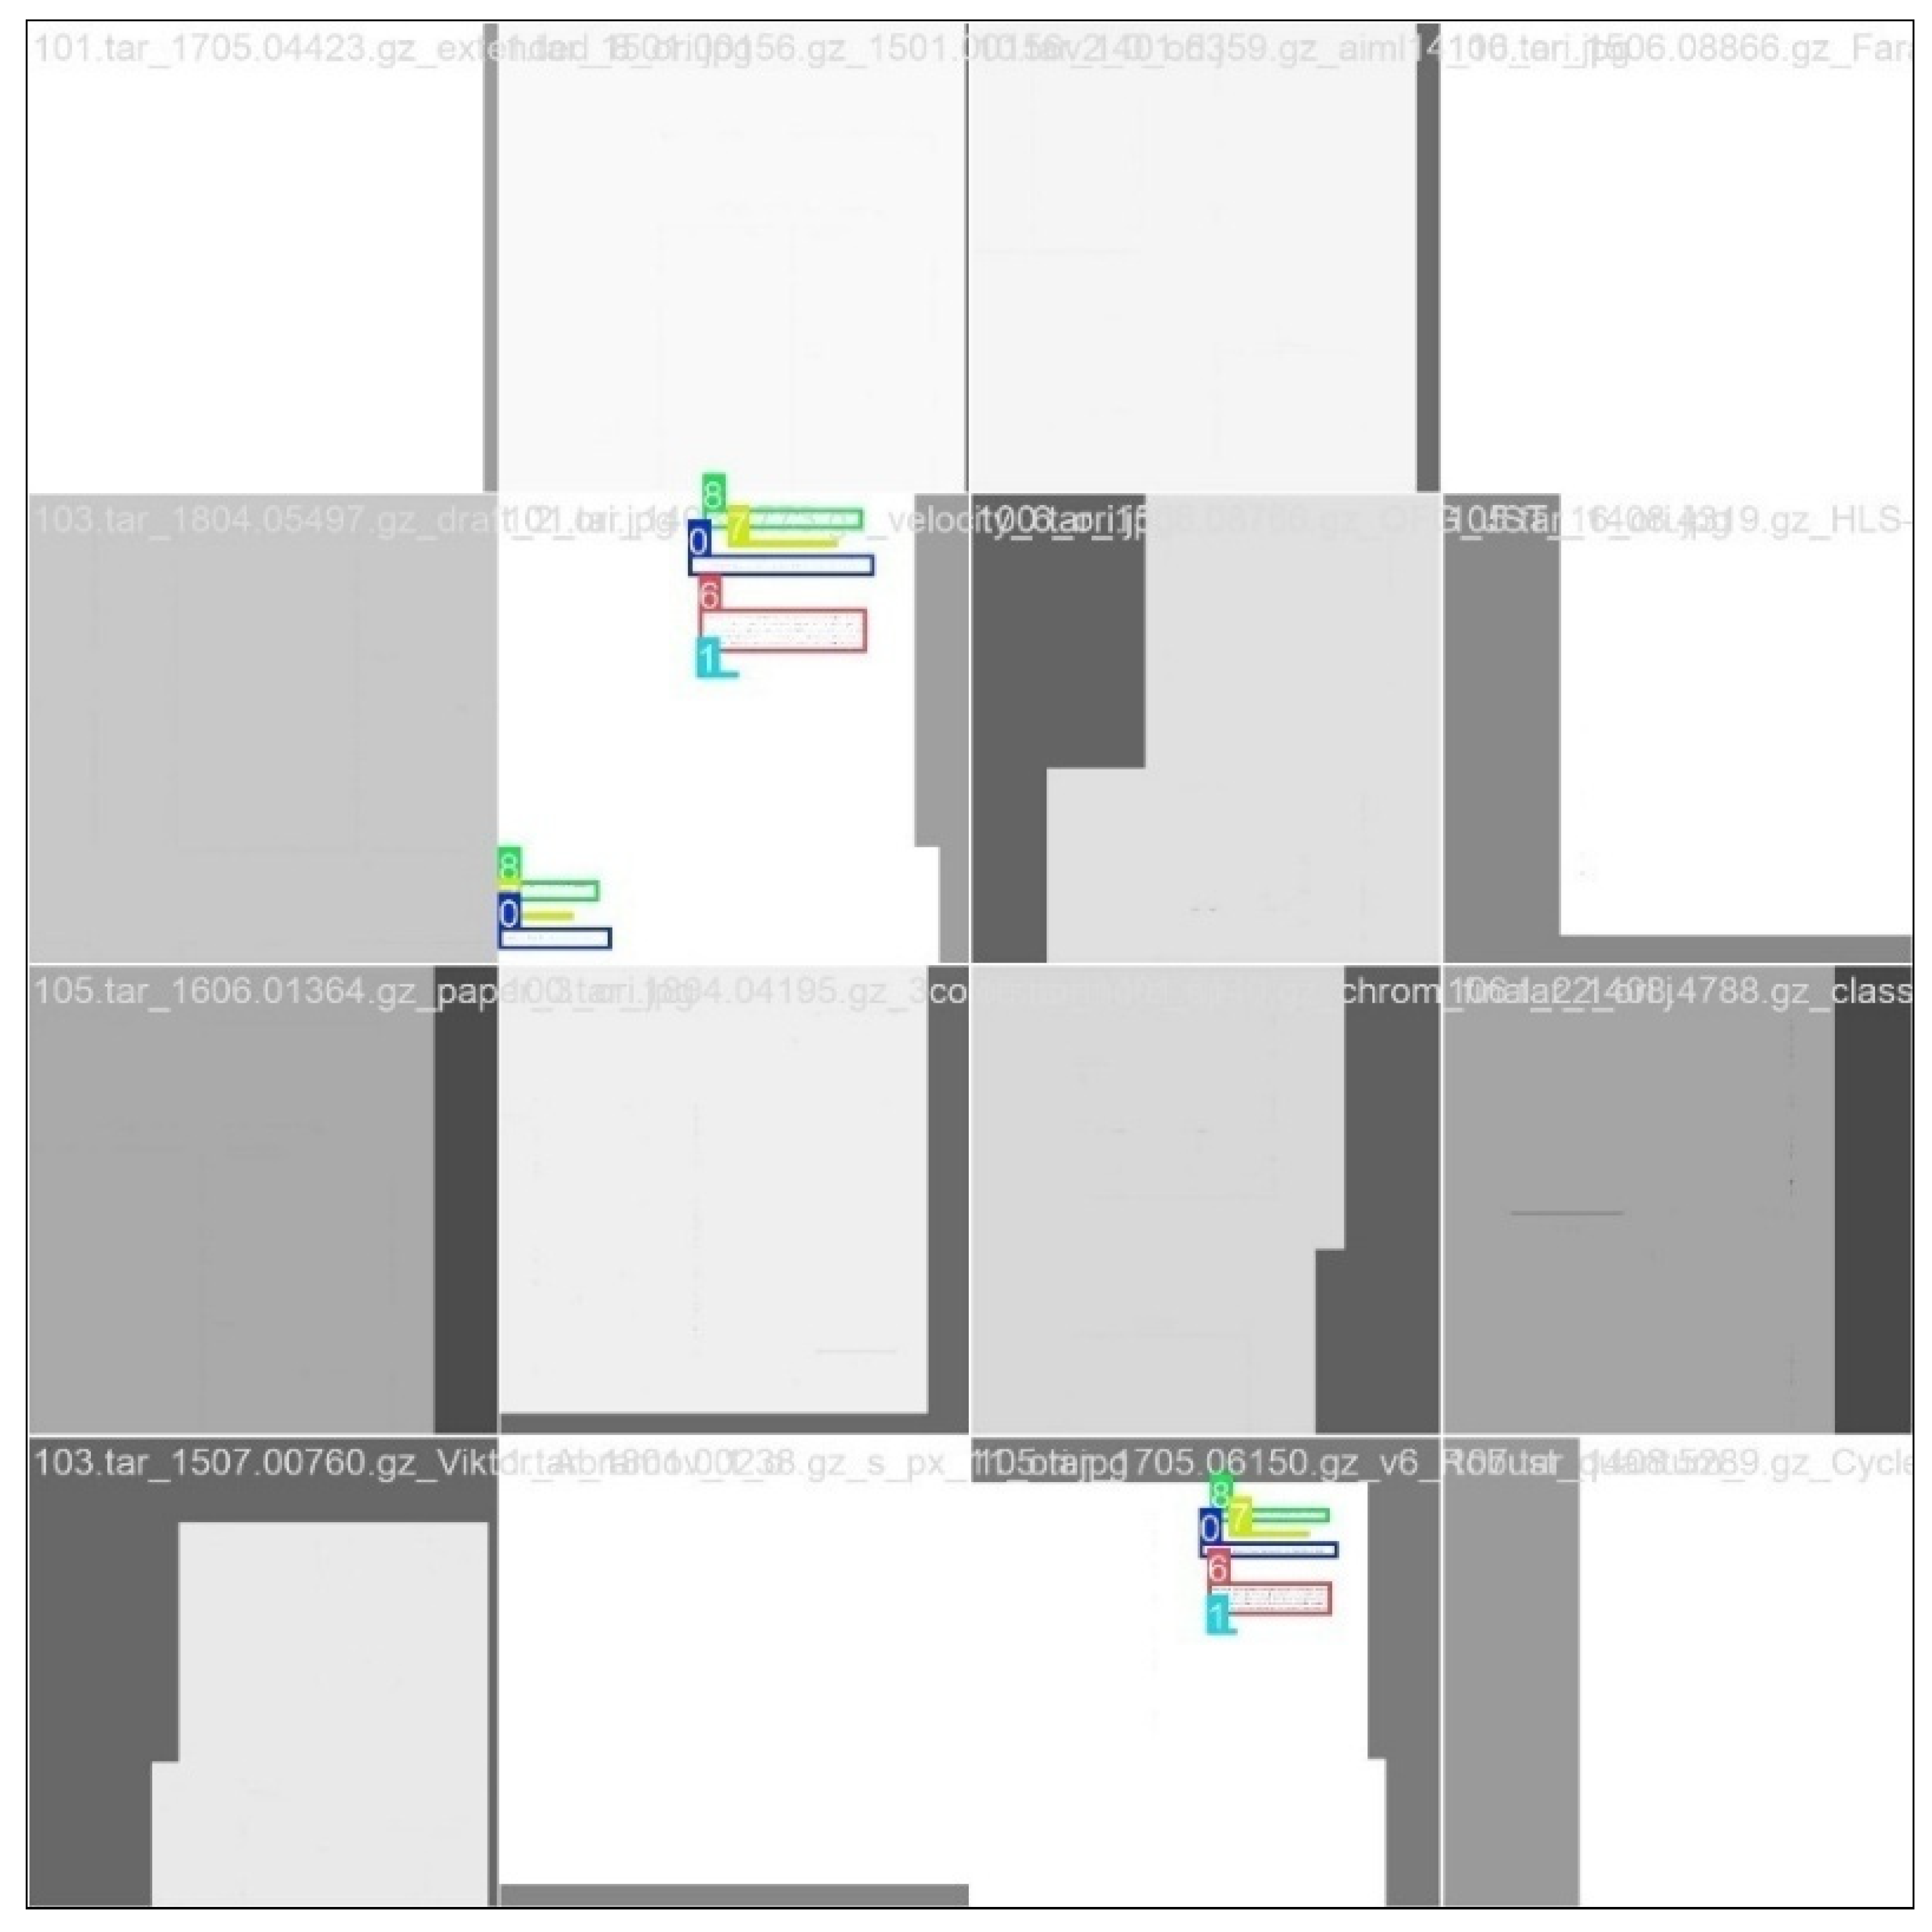
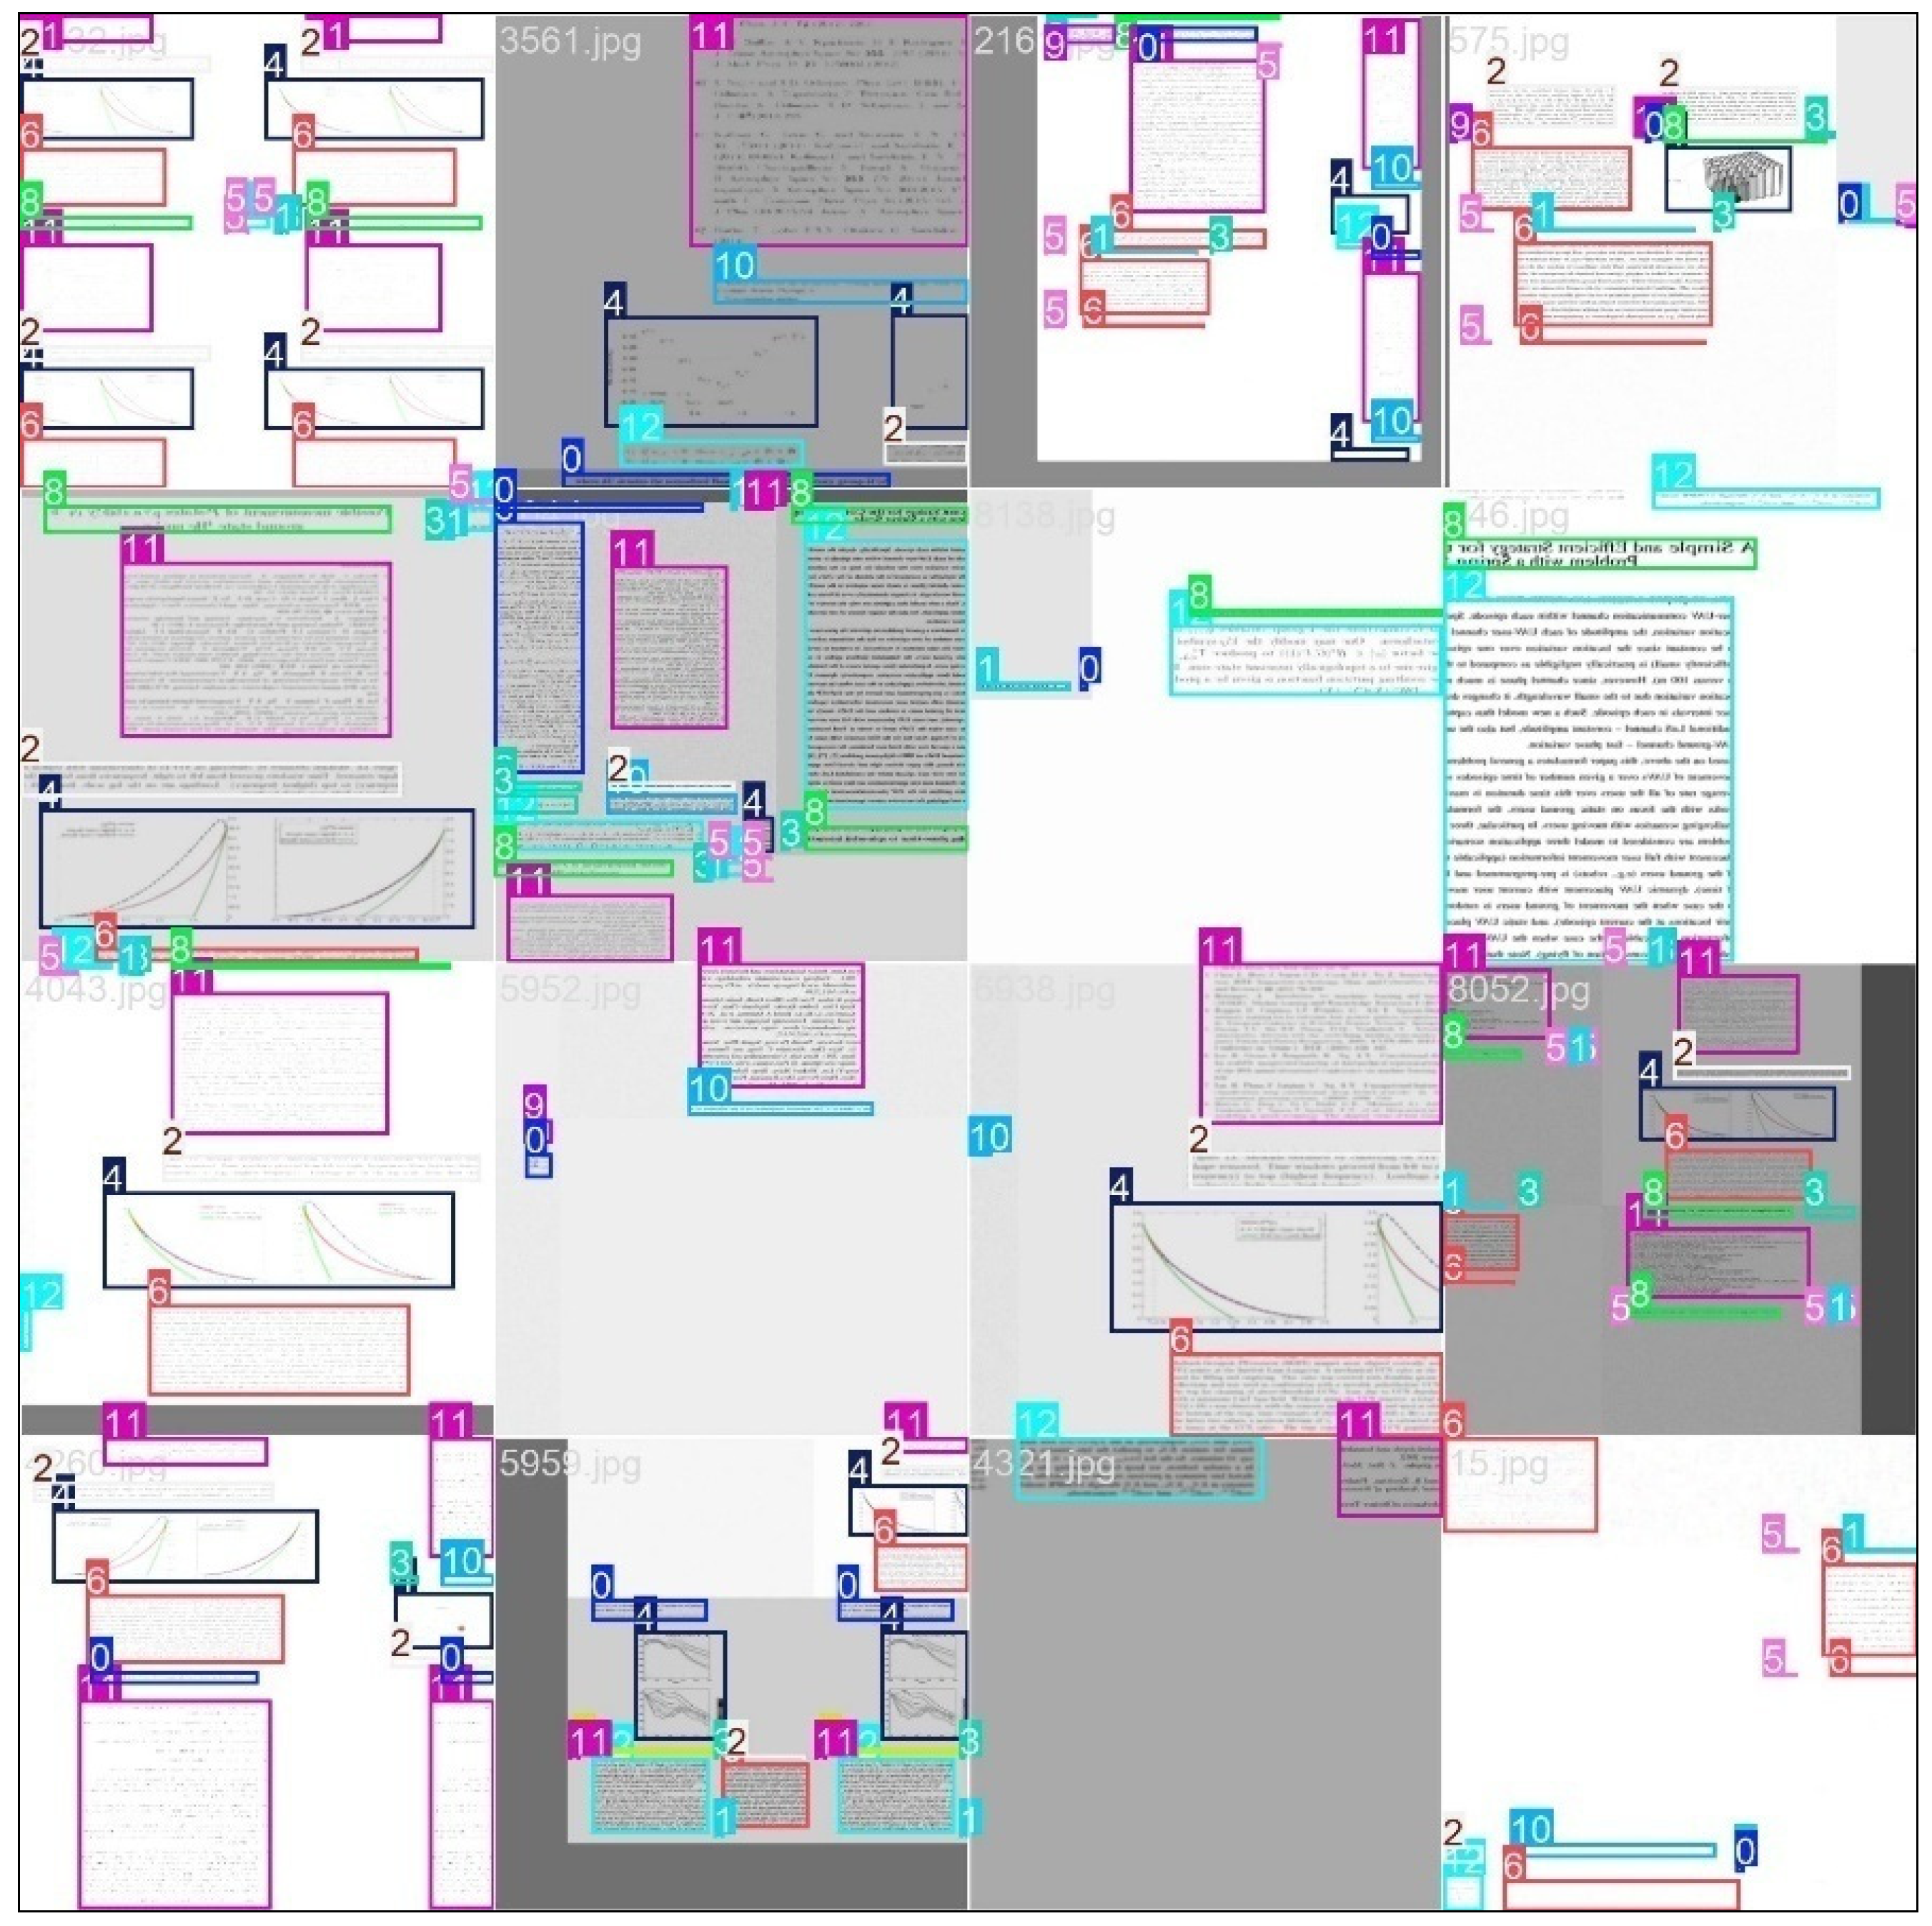
The least effective combination proved to be the strategy of consistently dividing images into “large” and “small” groups, paired with class-based threshold extraction from the small group obtained by linear dataset reading. Examples of pages from the resulting dataset are shown in Figure 5.
In this approach, the most balanced representation of recognition classes is observed (Figure 6a). The density of blocks with identical dimensions is significantly reduced, as evidenced by the distribution of all block sizes, although clusters of equal-sized elements remain present (Figure 6b).
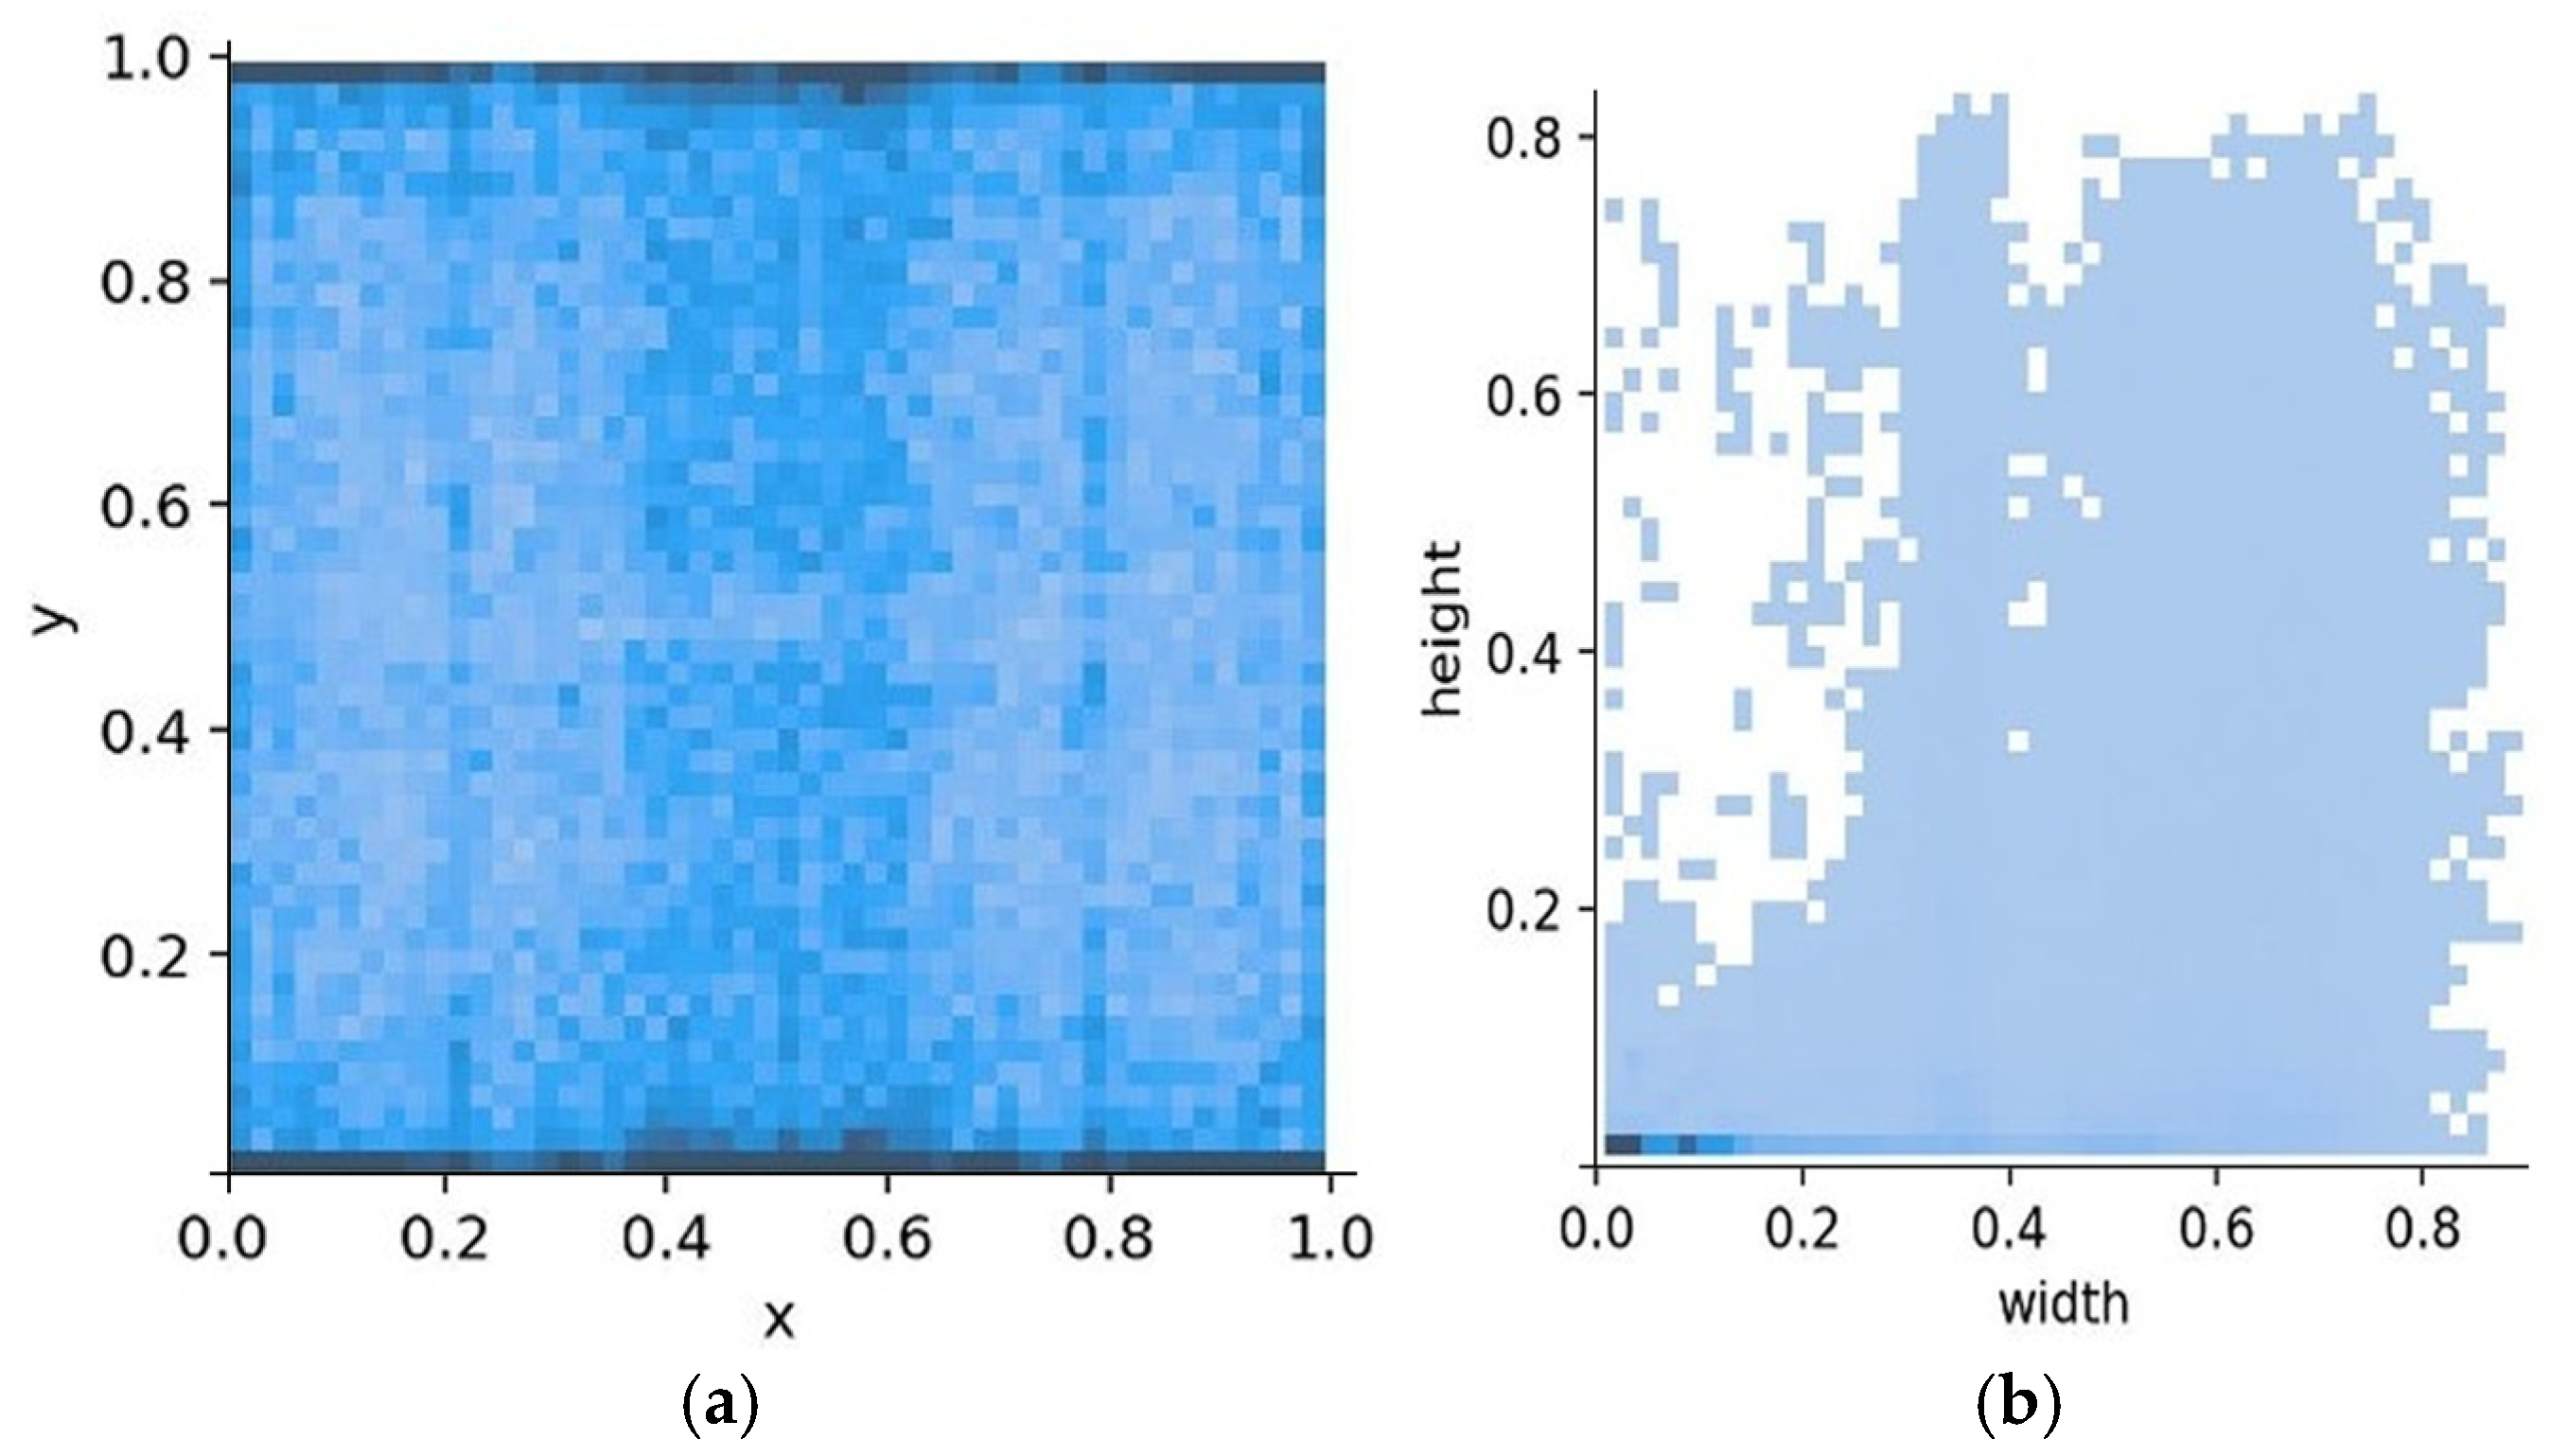
This results in a fairly uniform distribution of block positions (Figure 7a) and their sizes (Figure 7b). Figure 7 presents heatmaps reflecting the spatial distribution of object centers (x, y) and their normalized dimensions (width, height). Analyzing these characteristics allows for an evaluation of the detection model’s features. The X-axis and Y-axis represent the normalized width and height of the bounding boxes, respectively. All data are given relative to the image size, normalized within the range [0; 1].
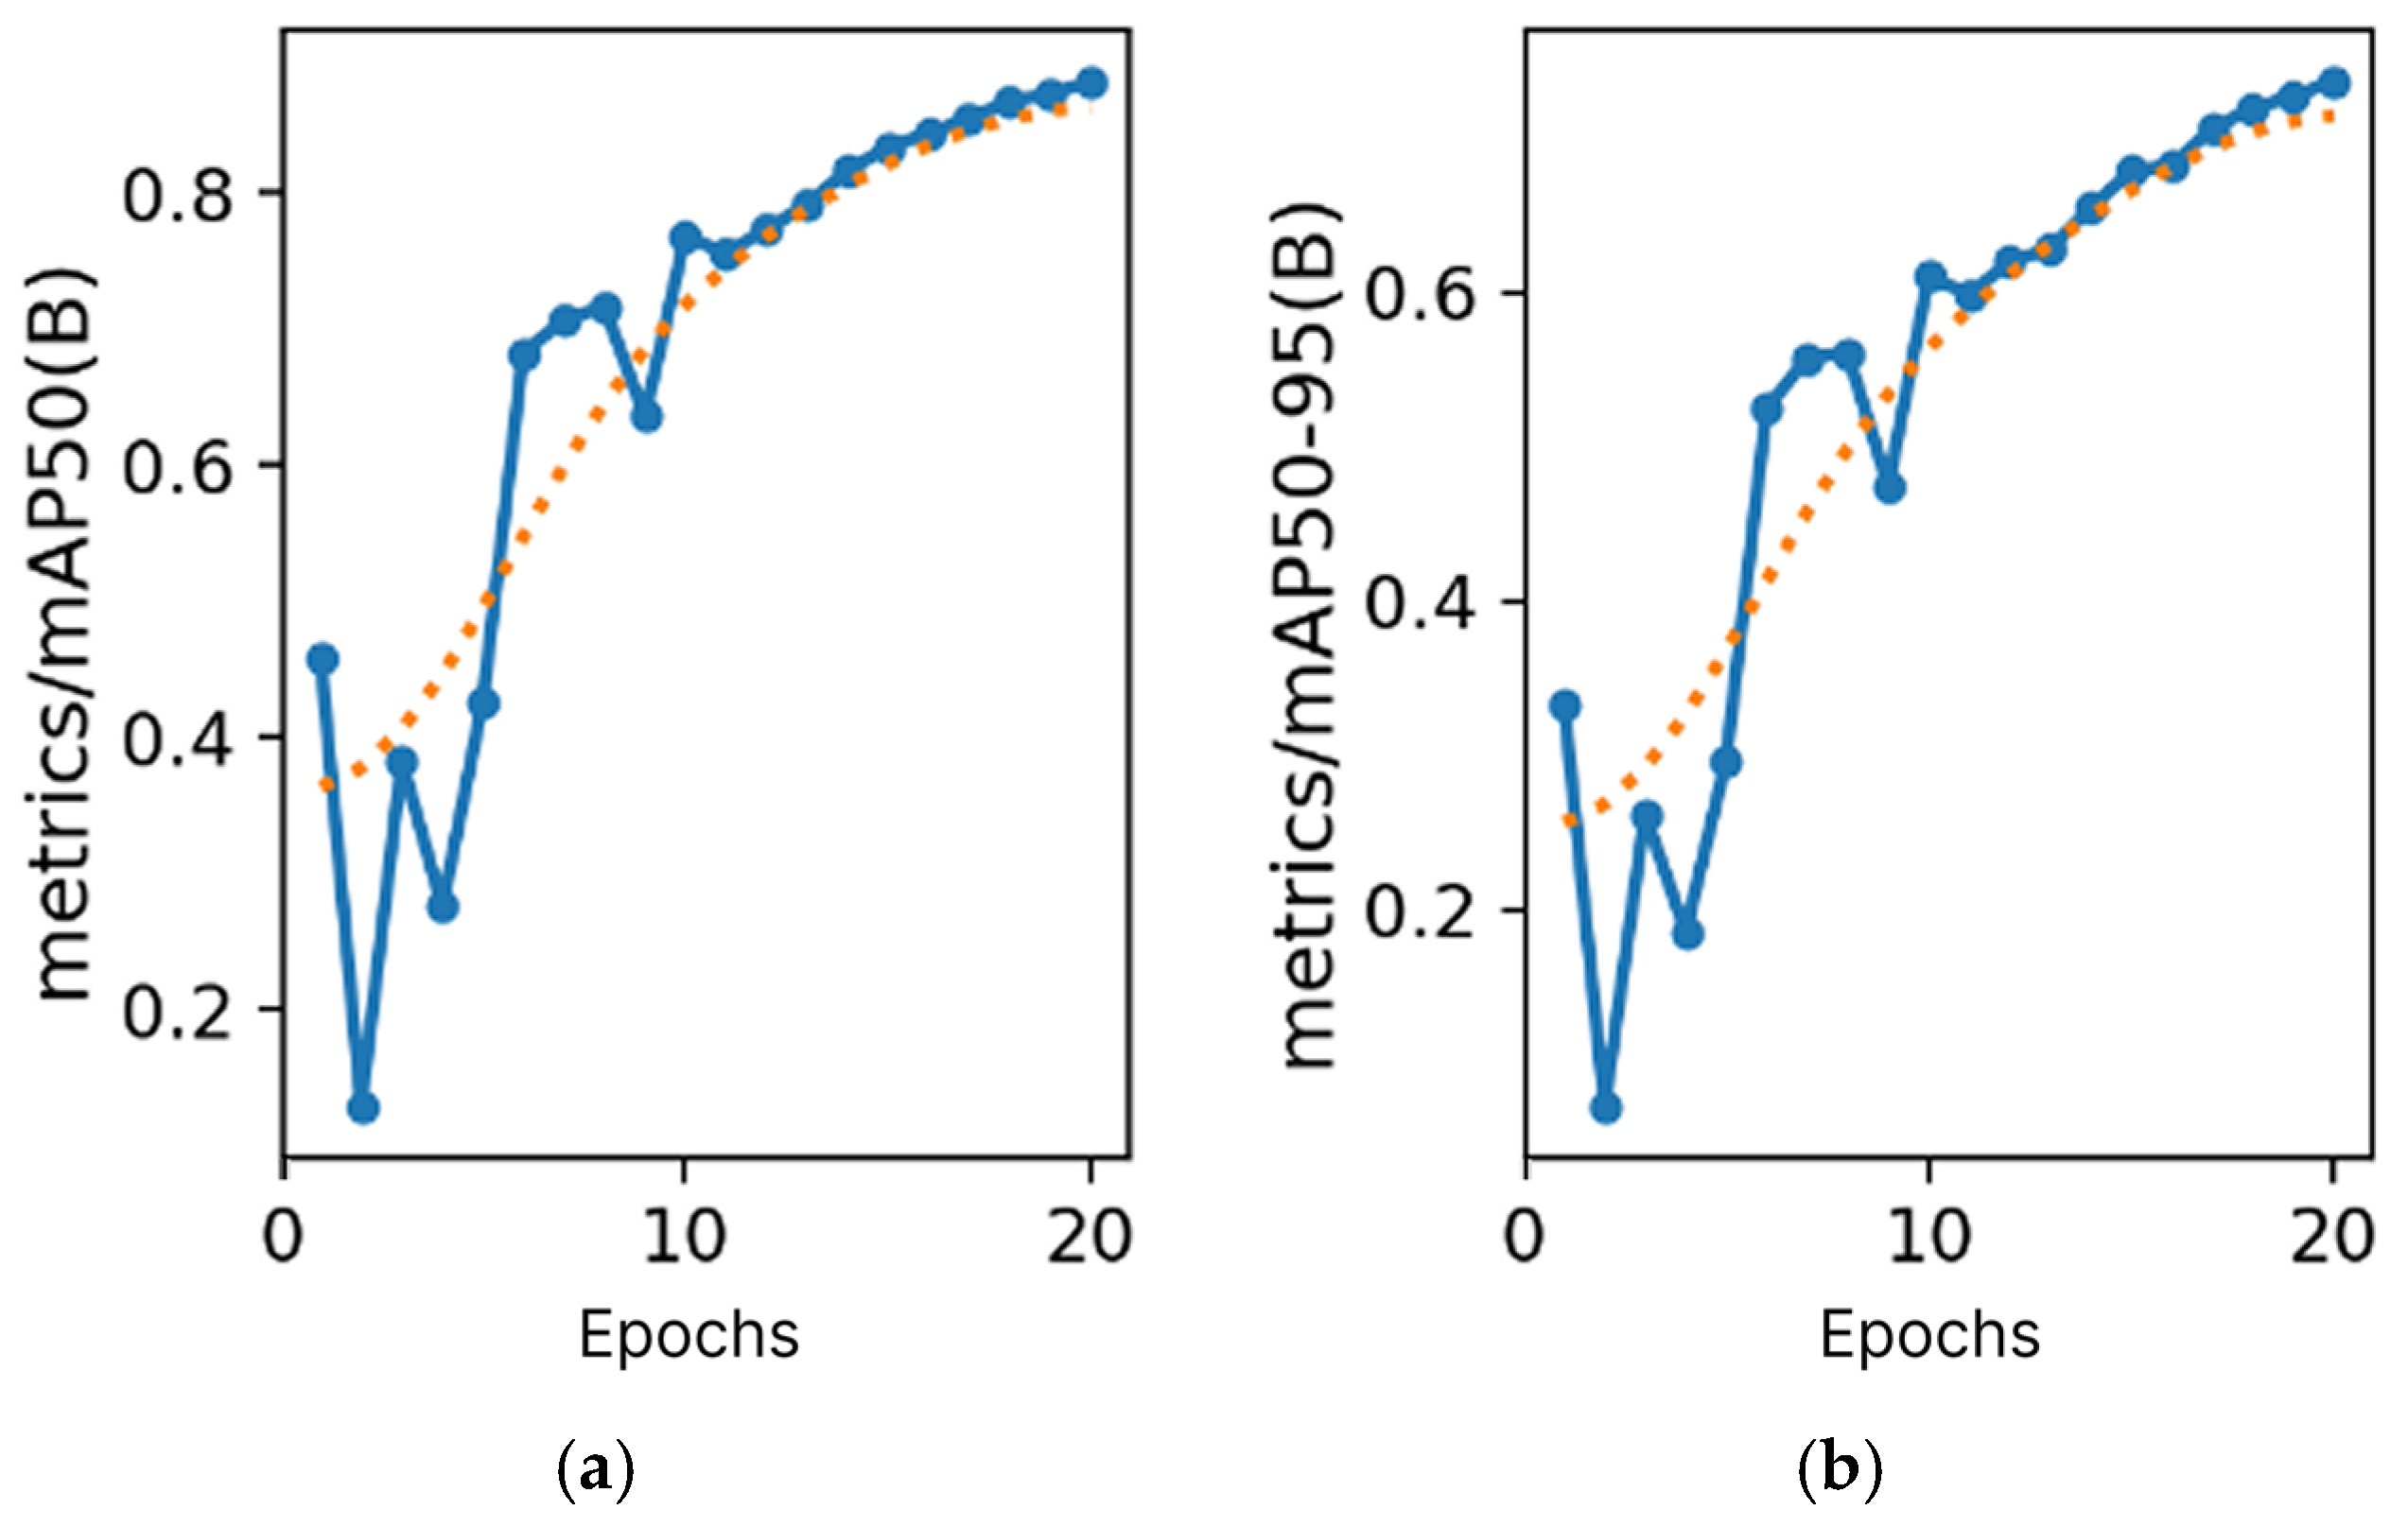
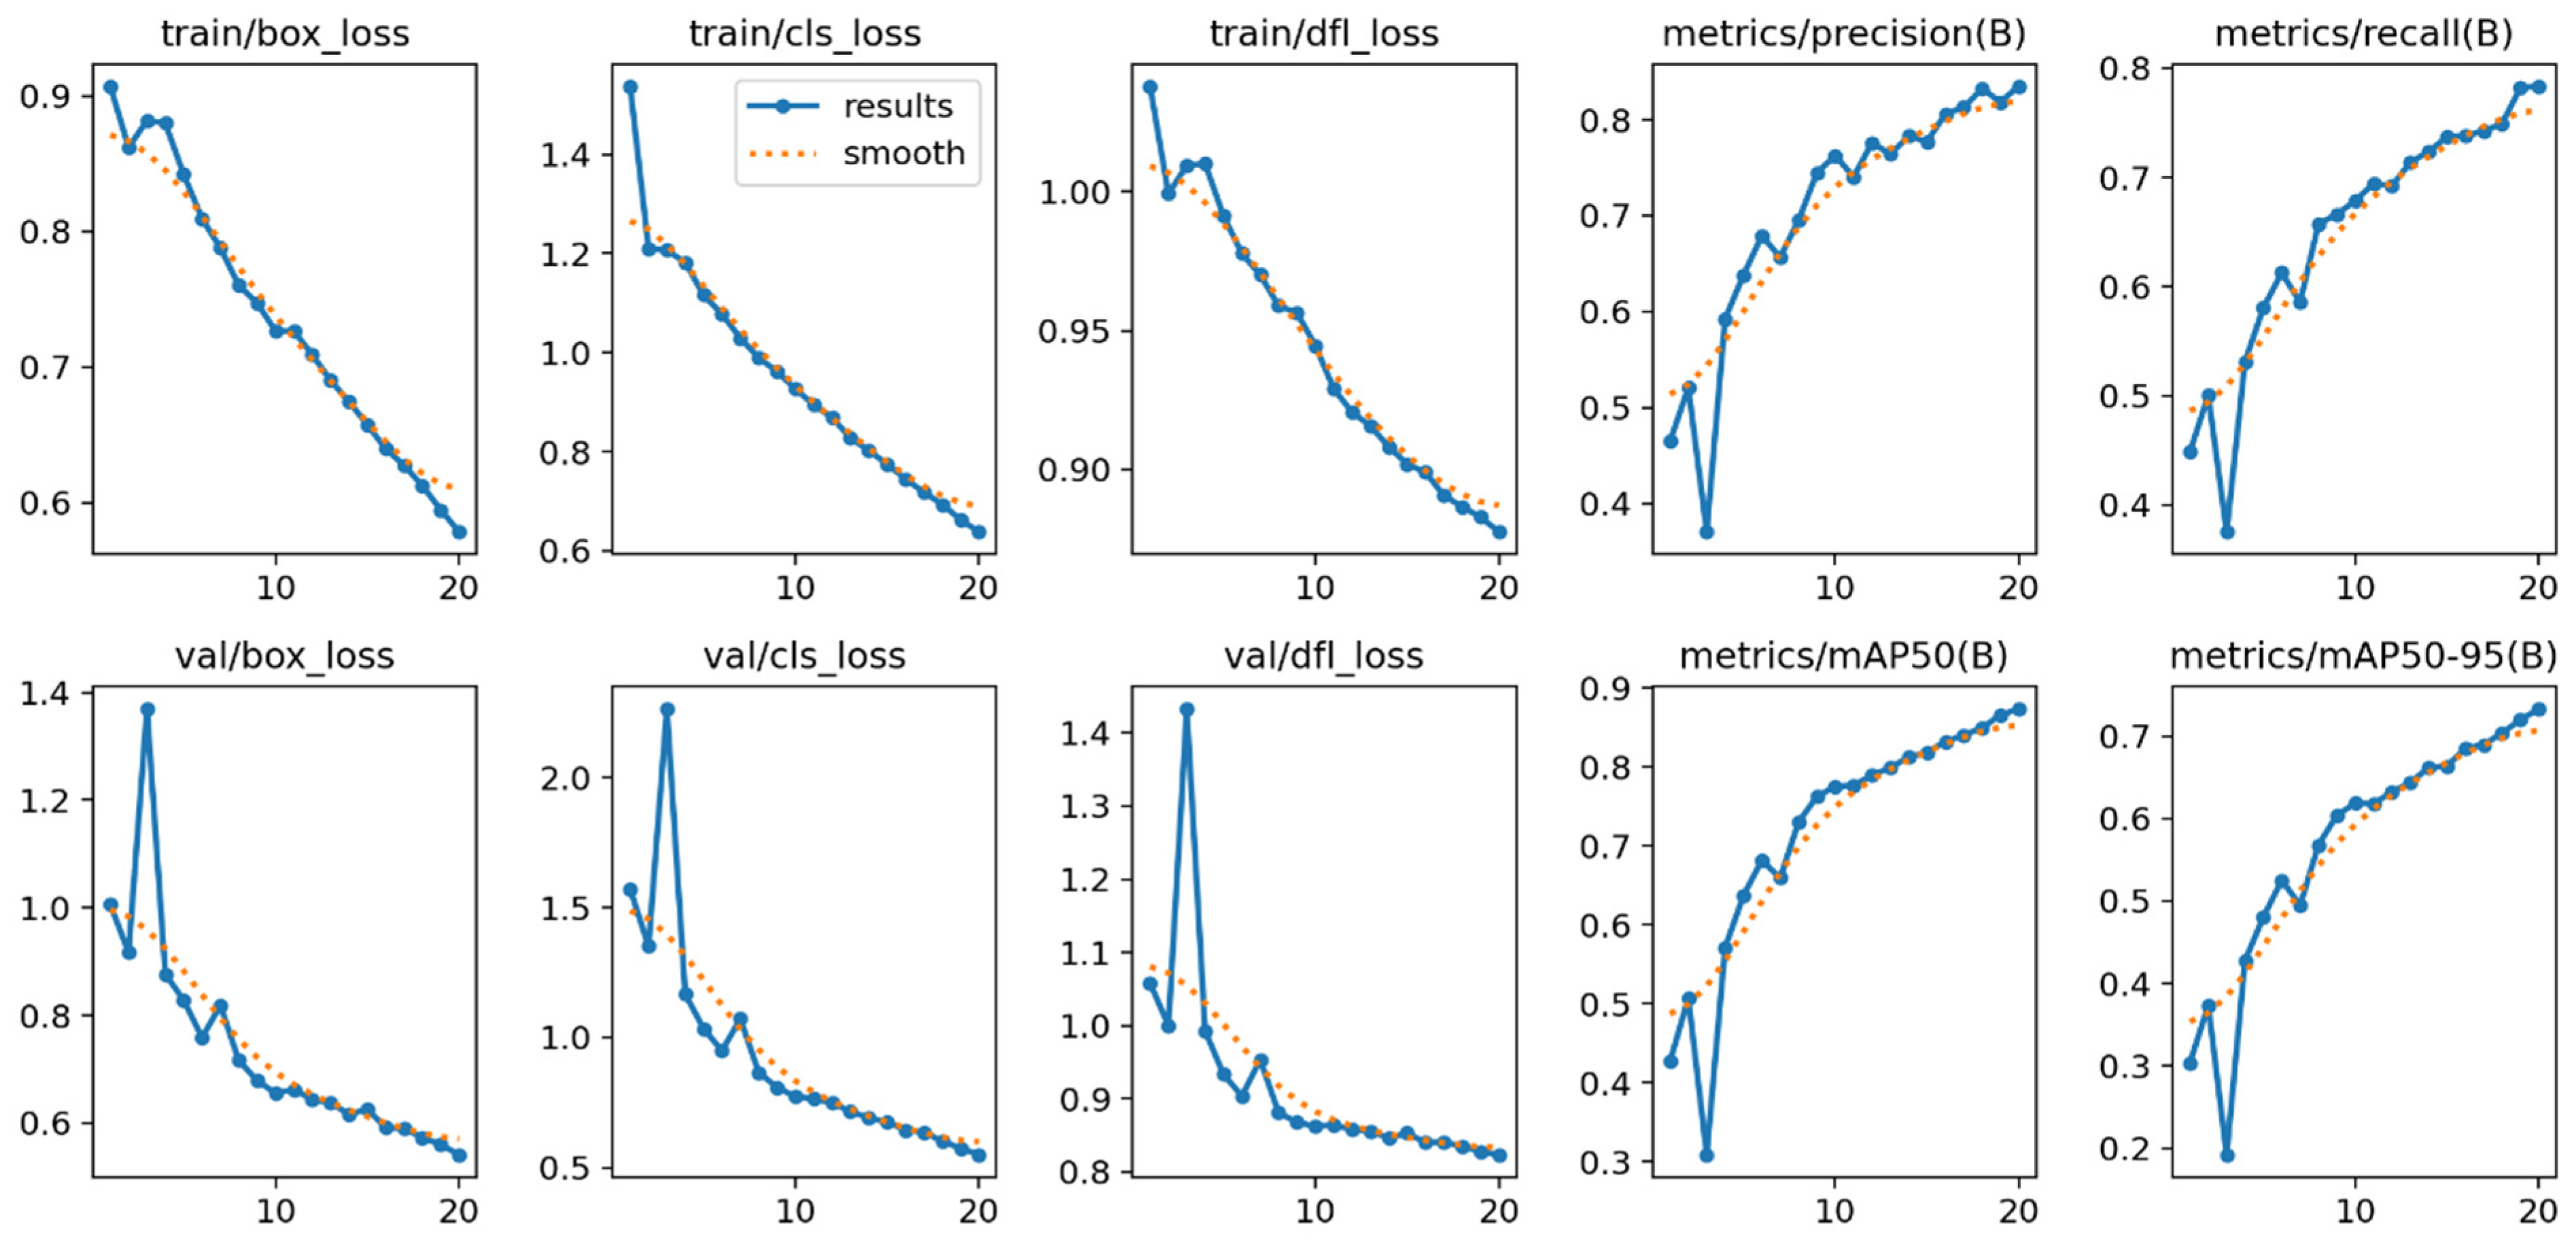
The training dynamics, including precision, recall, mAP@50, and mAP@50:95, were analyzed over several epochs using the constant-distribution dataset with threshold-based extraction. Figure 8 and Figure 9 illustrate the learning curves of these evaluation metrics. The presented curves reflect the stochastic optimization trajectory of the network during training.
Based on the training results, it is possible to achieve precision of 0.8229 (Figure 8a), recall of 0.7551 (Figure 8b), mAP@50 of 0.8502 (Figure 9a), and mAP@50:95 of 0.6968 (Figure 9b). These metrics stabilize upon reaching overfitting, representing a significant improvement in the convergence of the solution to the problem. Despite initial fluctuations, the overall trend shows a steady increase in accuracy, indicating an enhanced ability to reduce false positive detections during training.
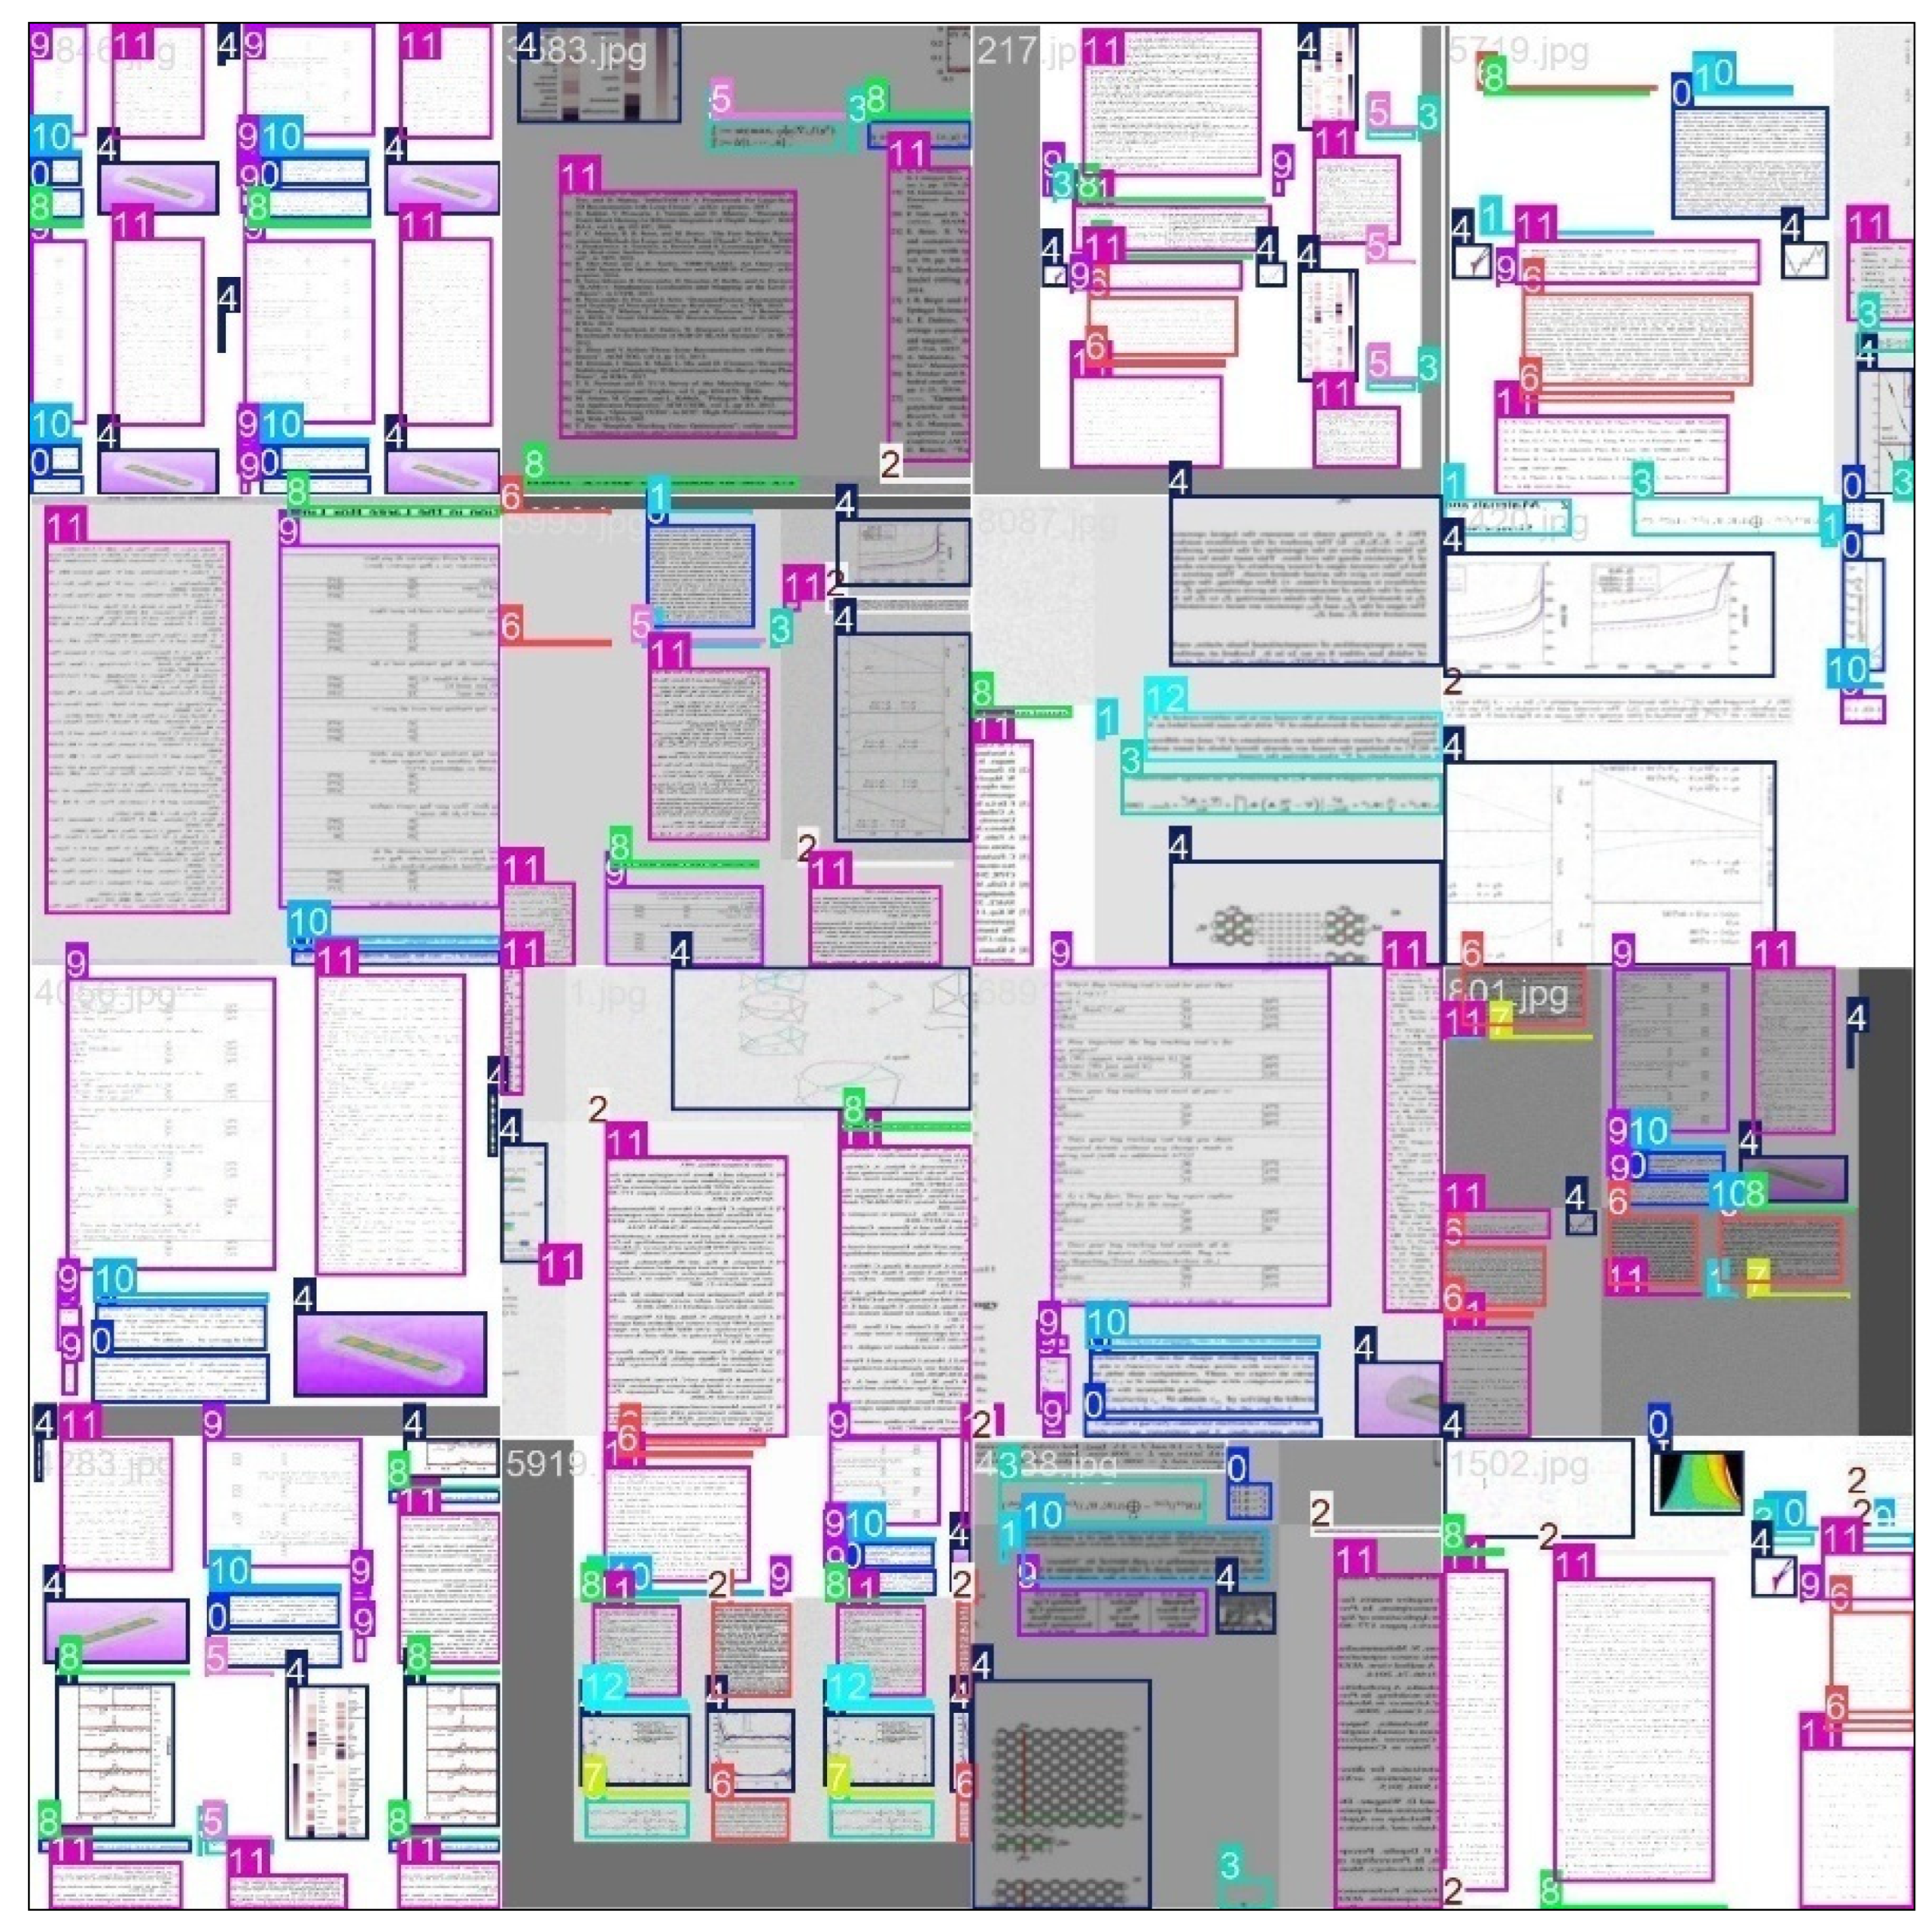
The optimal configuration utilized median-based division of images into “large” and “small” groups, combined with a strategy of extracting arbitrary layout classes in random quantities with shuffling. Example pages from the resulting dataset are shown in Figure 10.
The second experiment aligns with the mathematical model by balancing the frequency and spatial occupancy of class instances, while investigating the impact of parameters f and g on training. This required four separate experiments to identify the optimal combination of the element extraction strategy (“large” vs. “small” groups) and the categorization method (constant threshold vs. median-based).
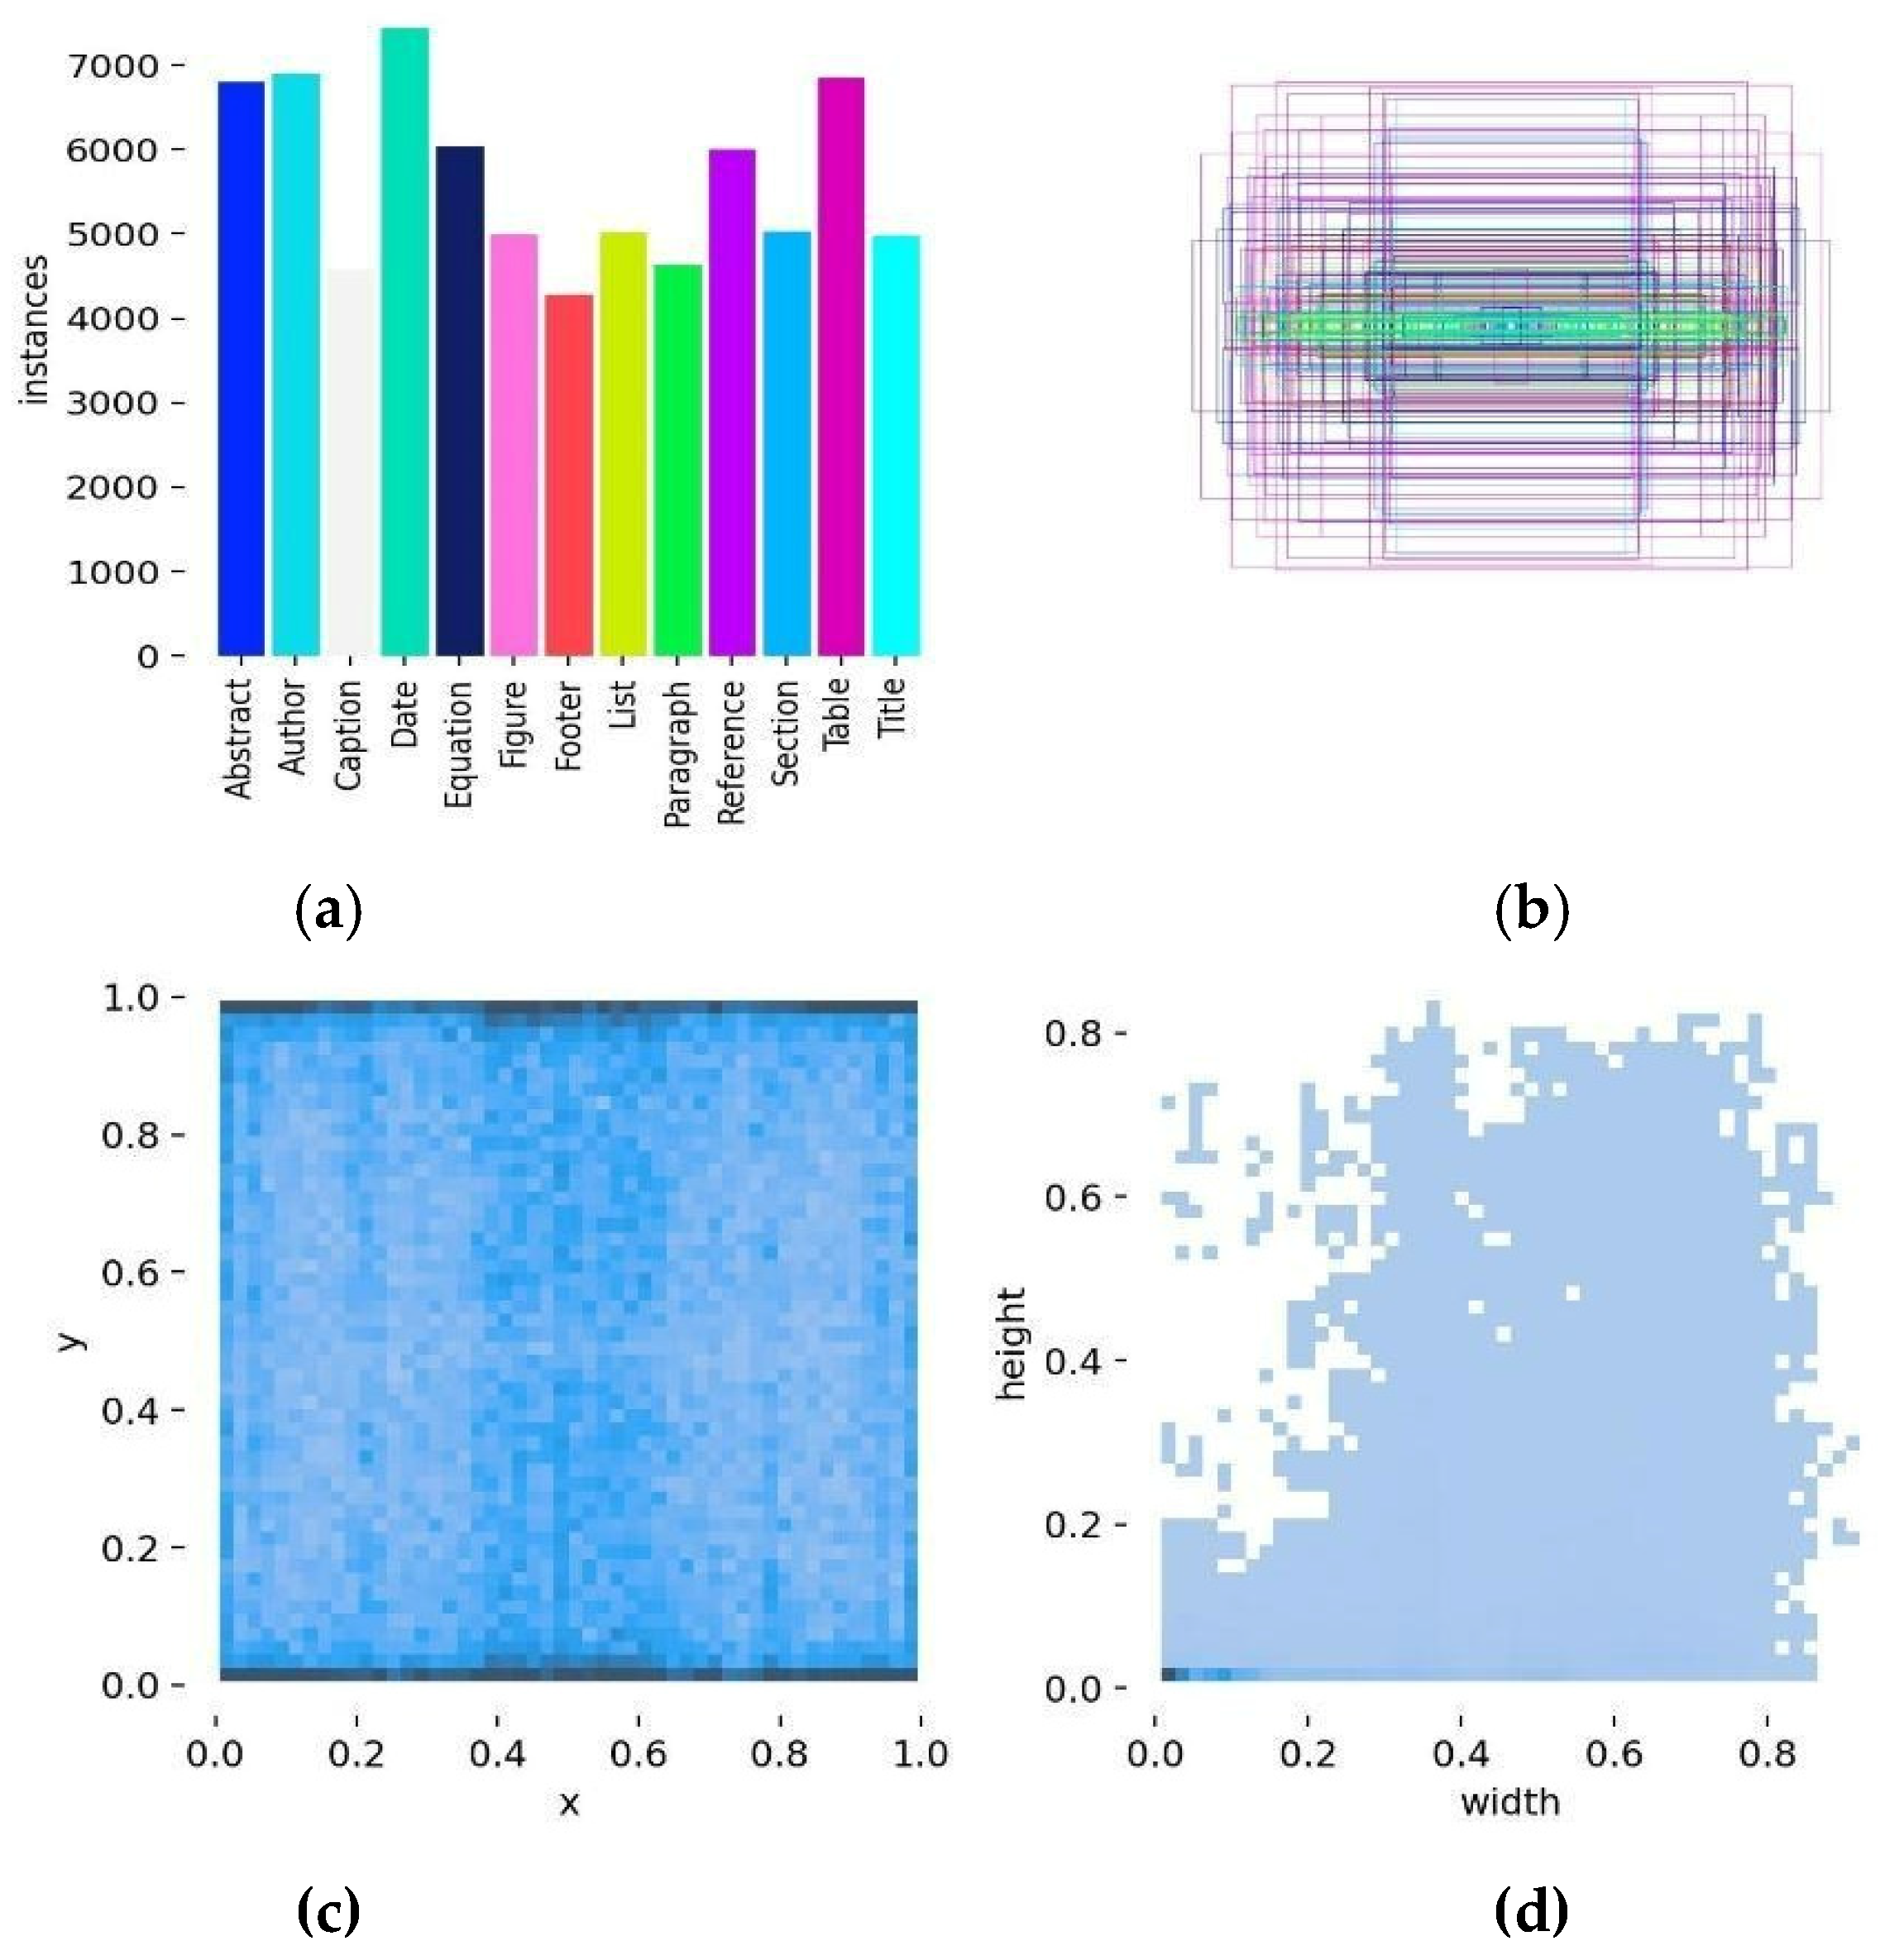
This optimal configuration maximizes the density of generated layouts. Additional visualizations for the remaining parameter combinations, including spatial distributions and metric curves, are presented in Appendix A. Although it results in less uniform class representation (Figure 11a), it improves the uniformity of block size distribution (Figure 11b). Furthermore, it eliminates the minor central concentration of blocks observed in less effective strategies (Figure 12a) and significantly increases the variability of horizontally oriented large blocks (Figure 12b).
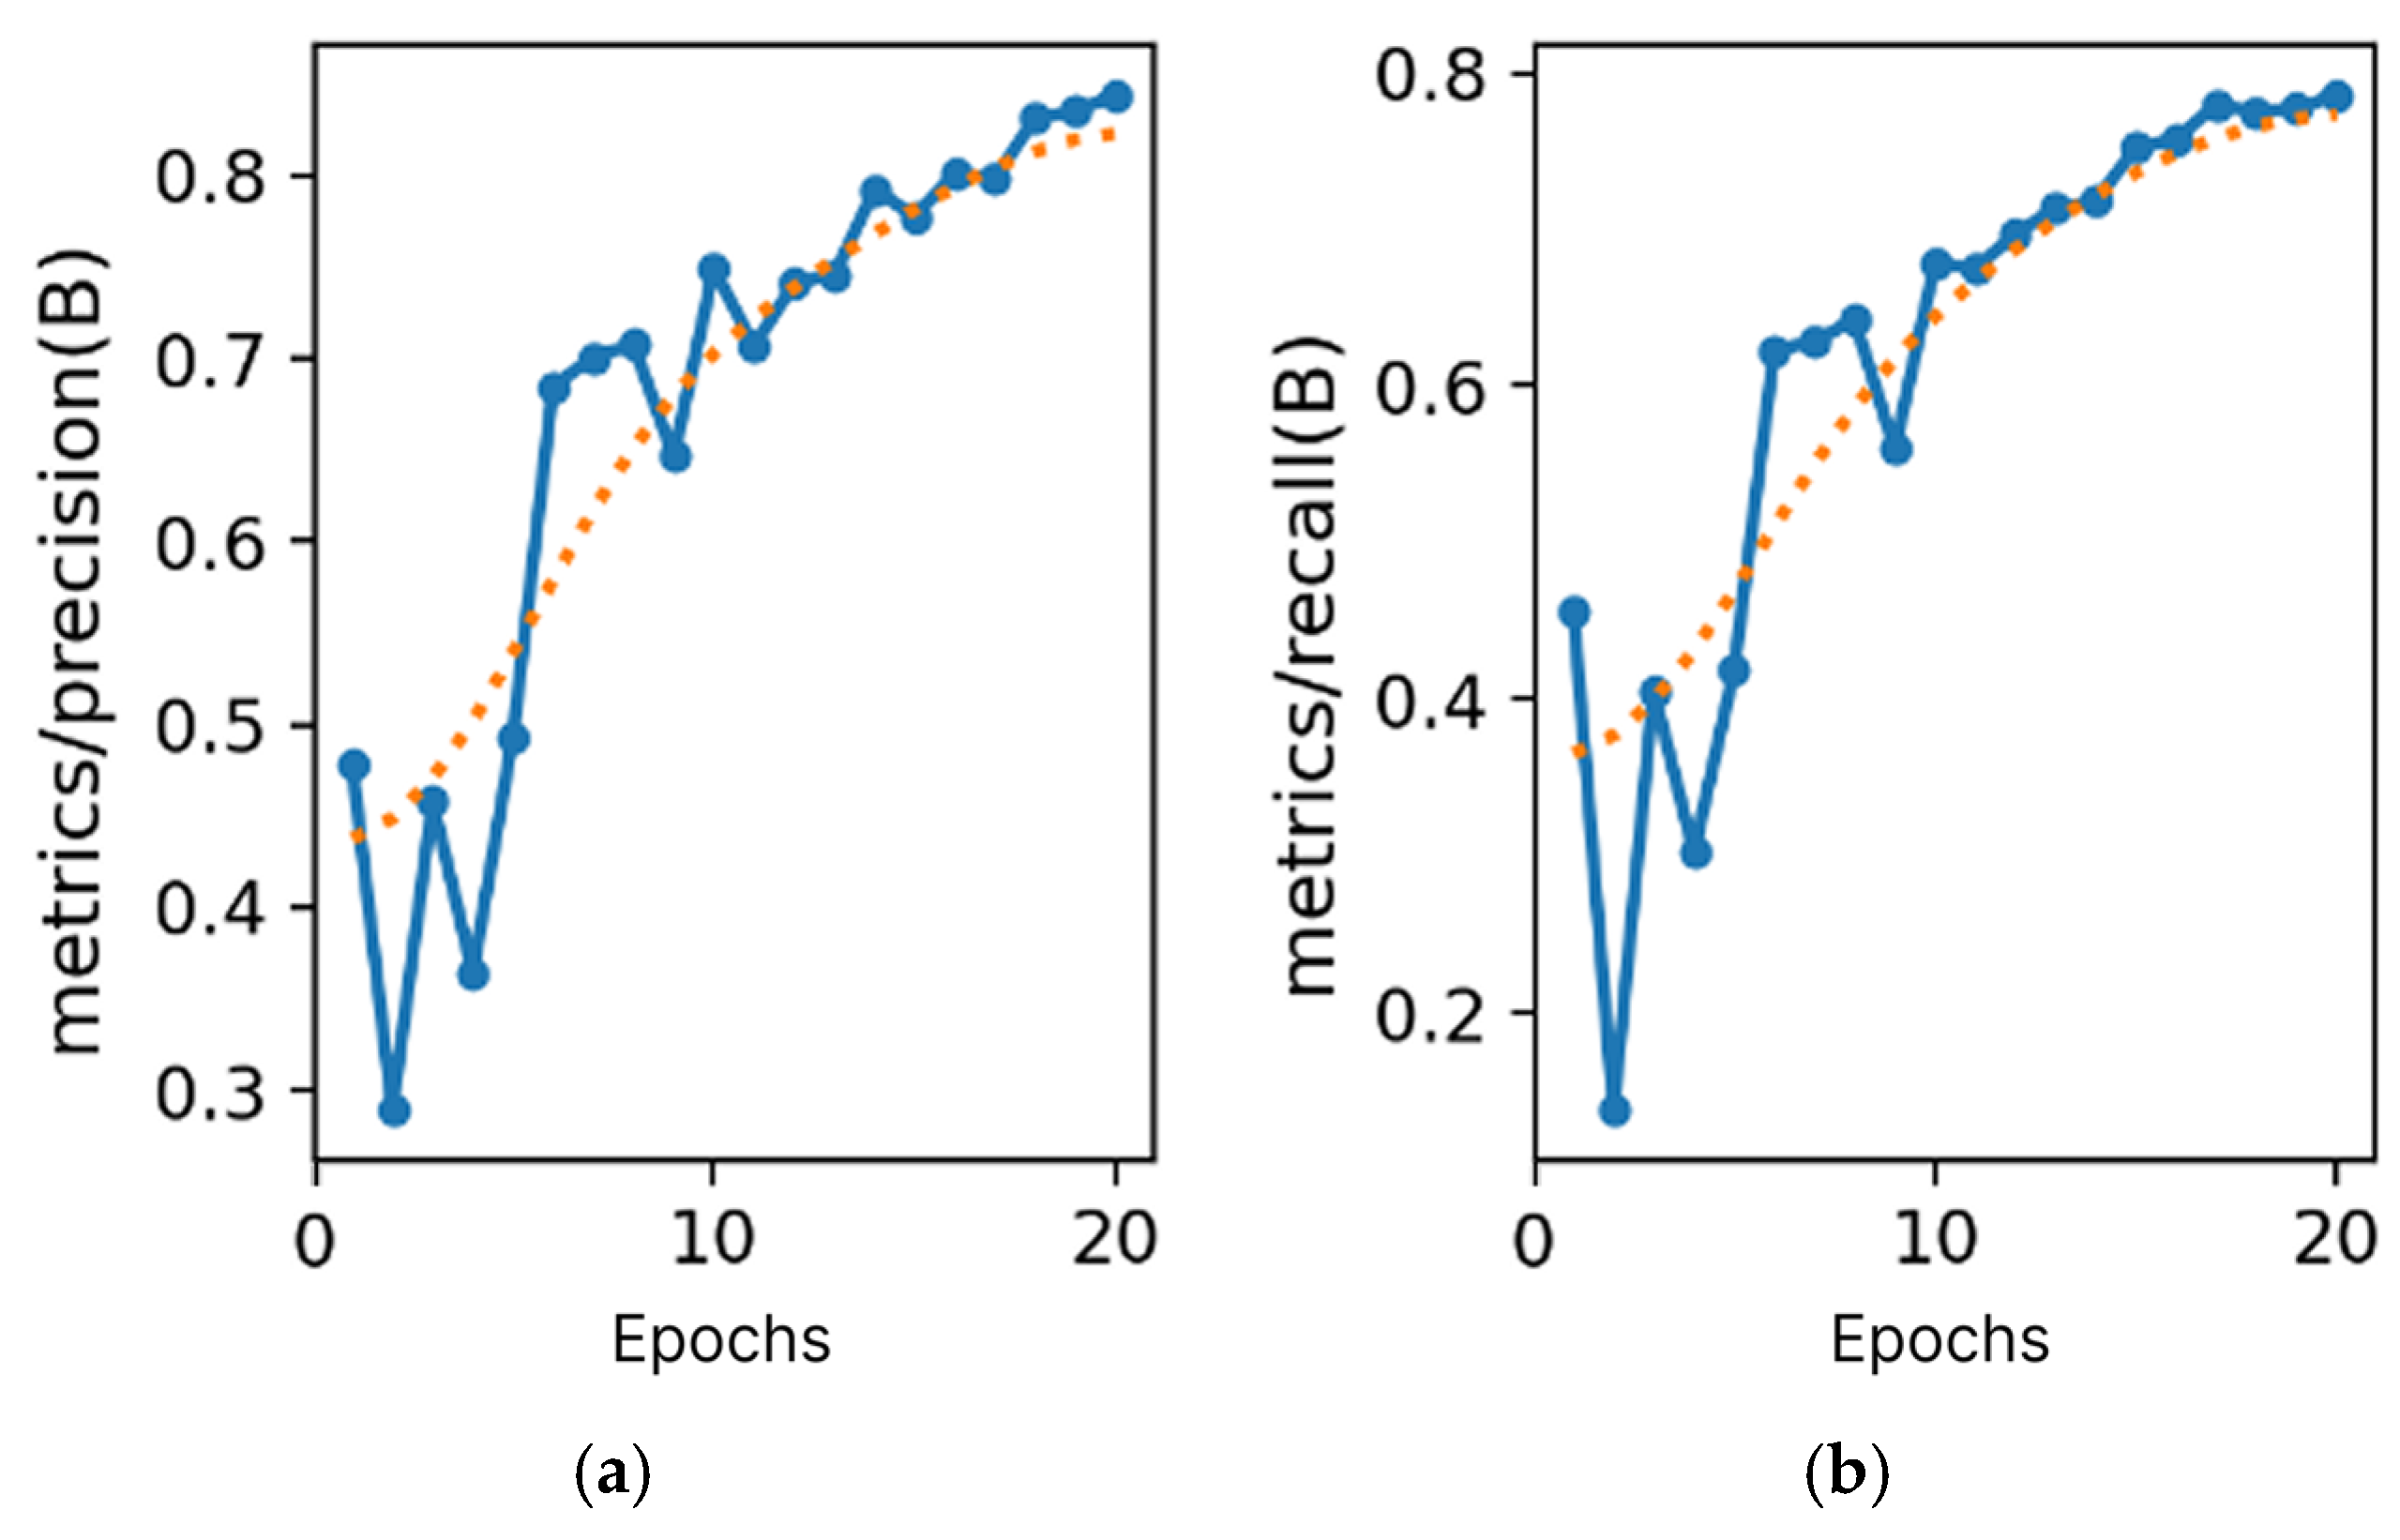
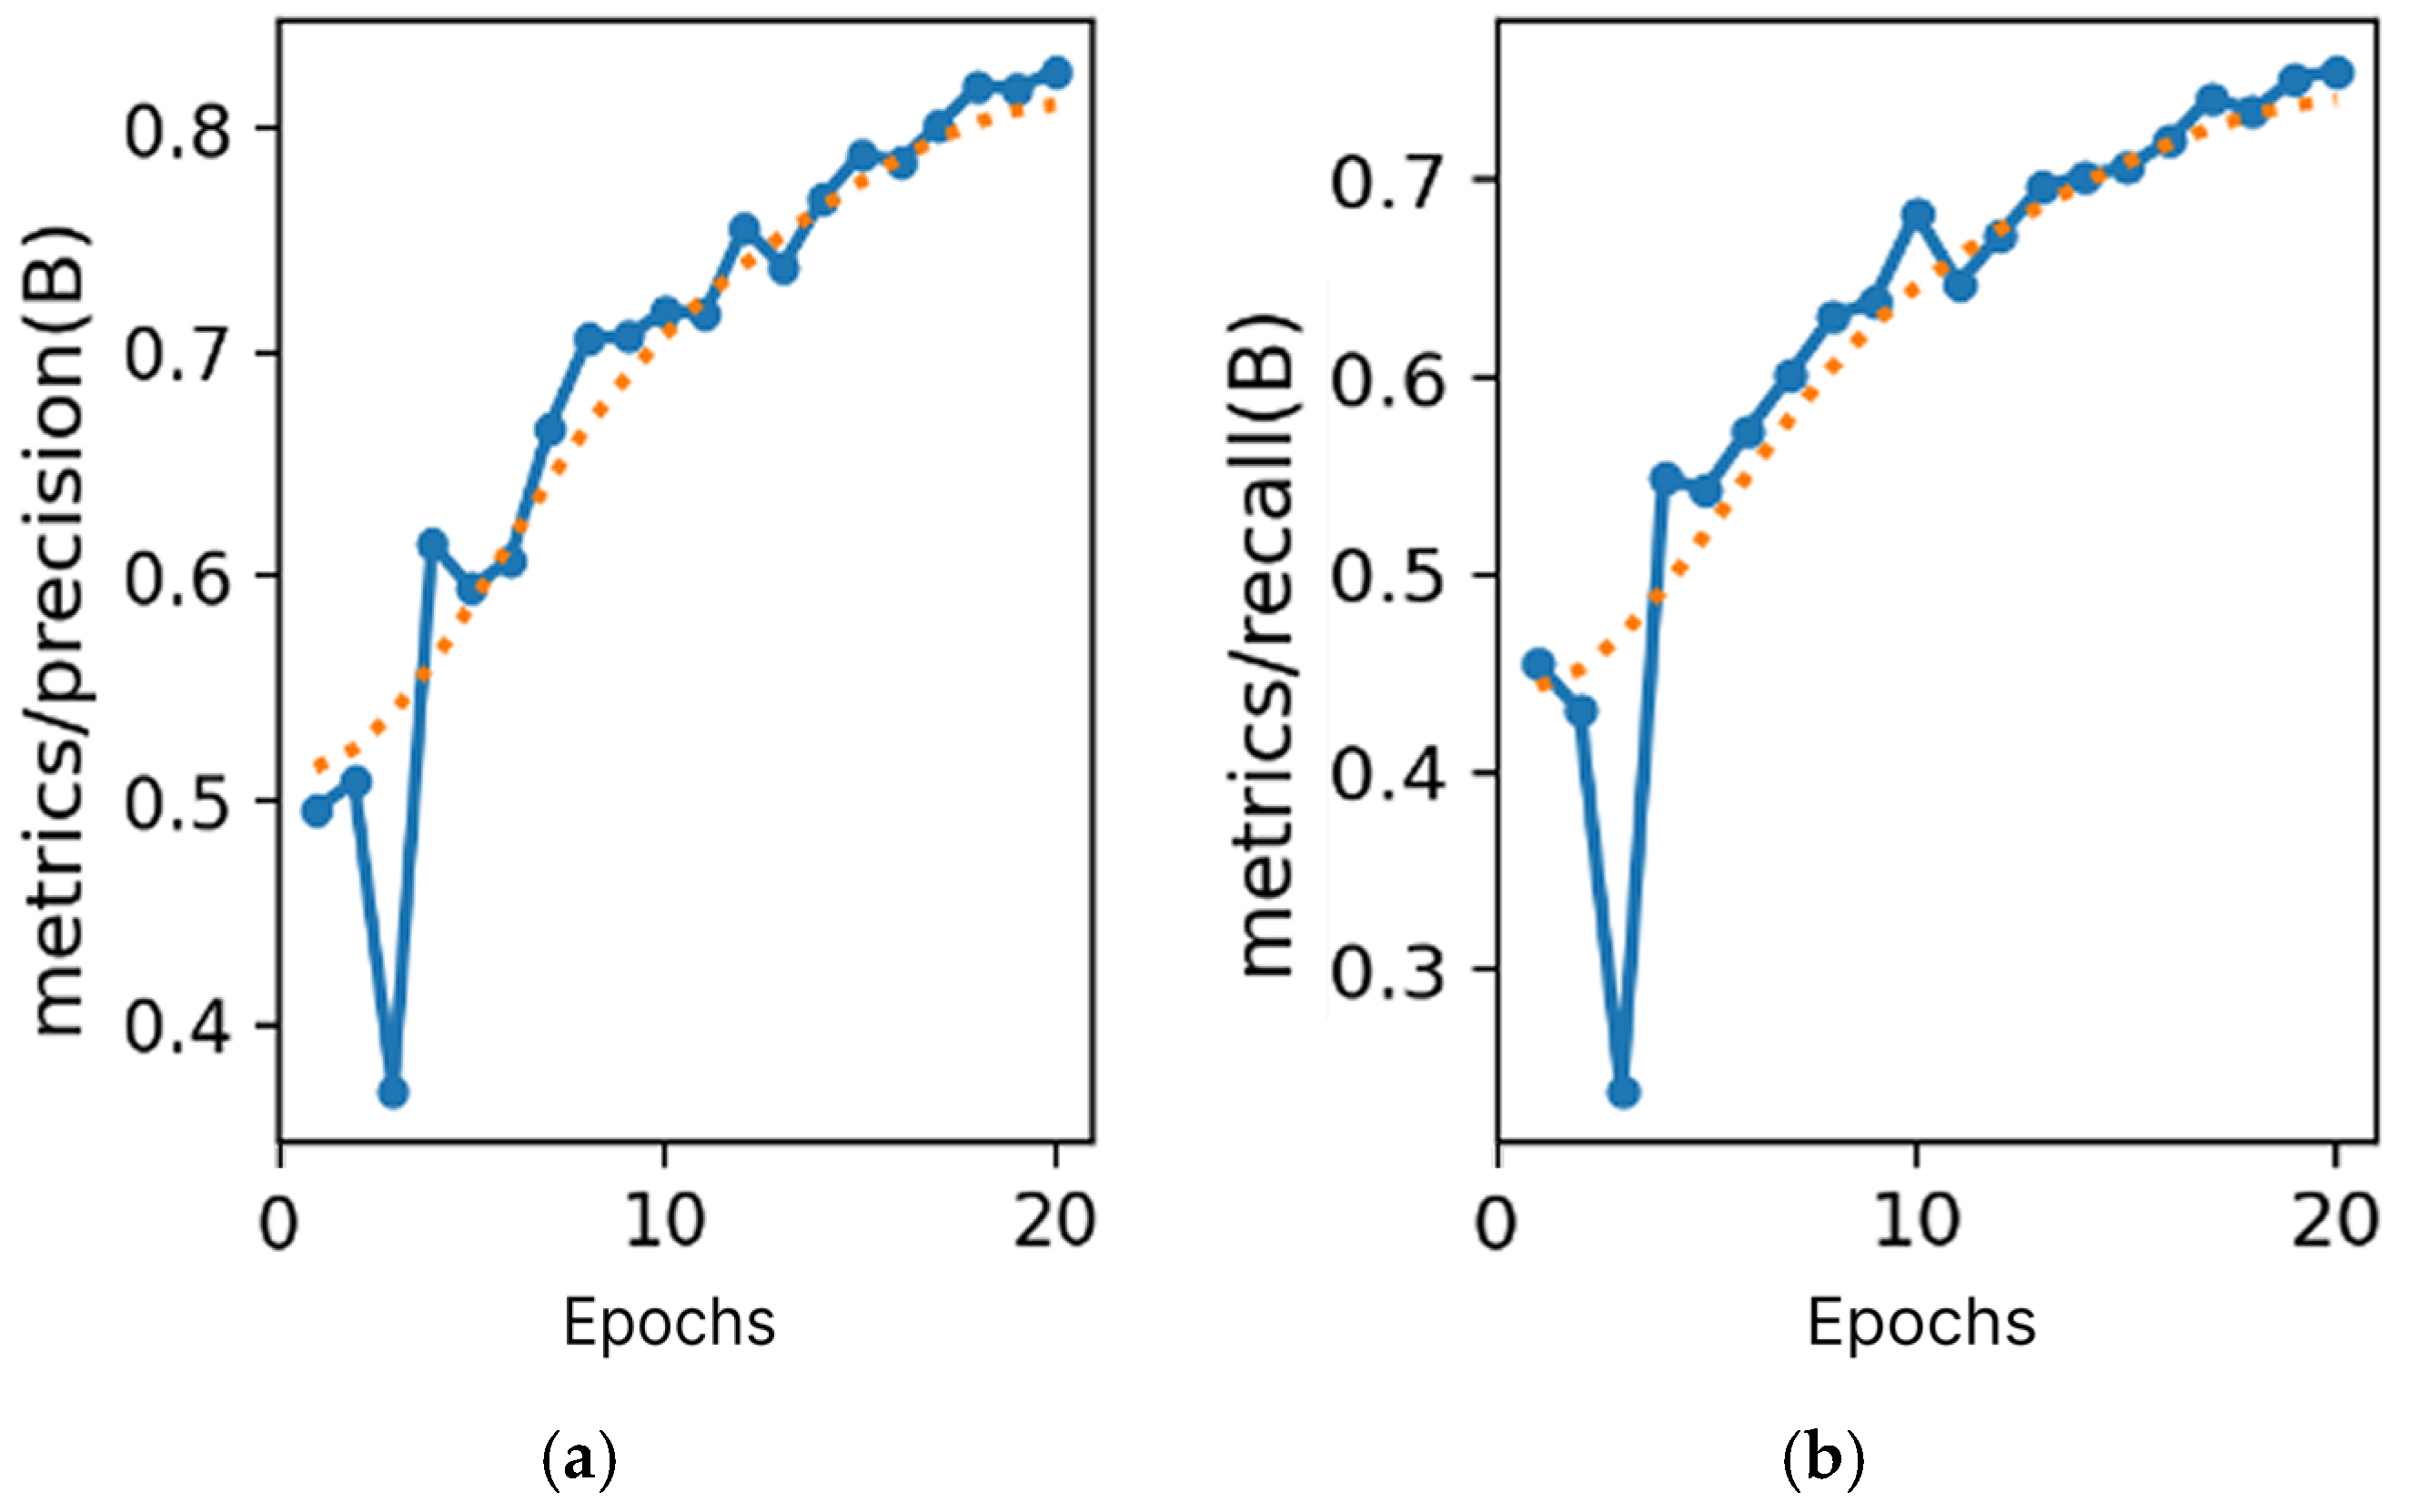
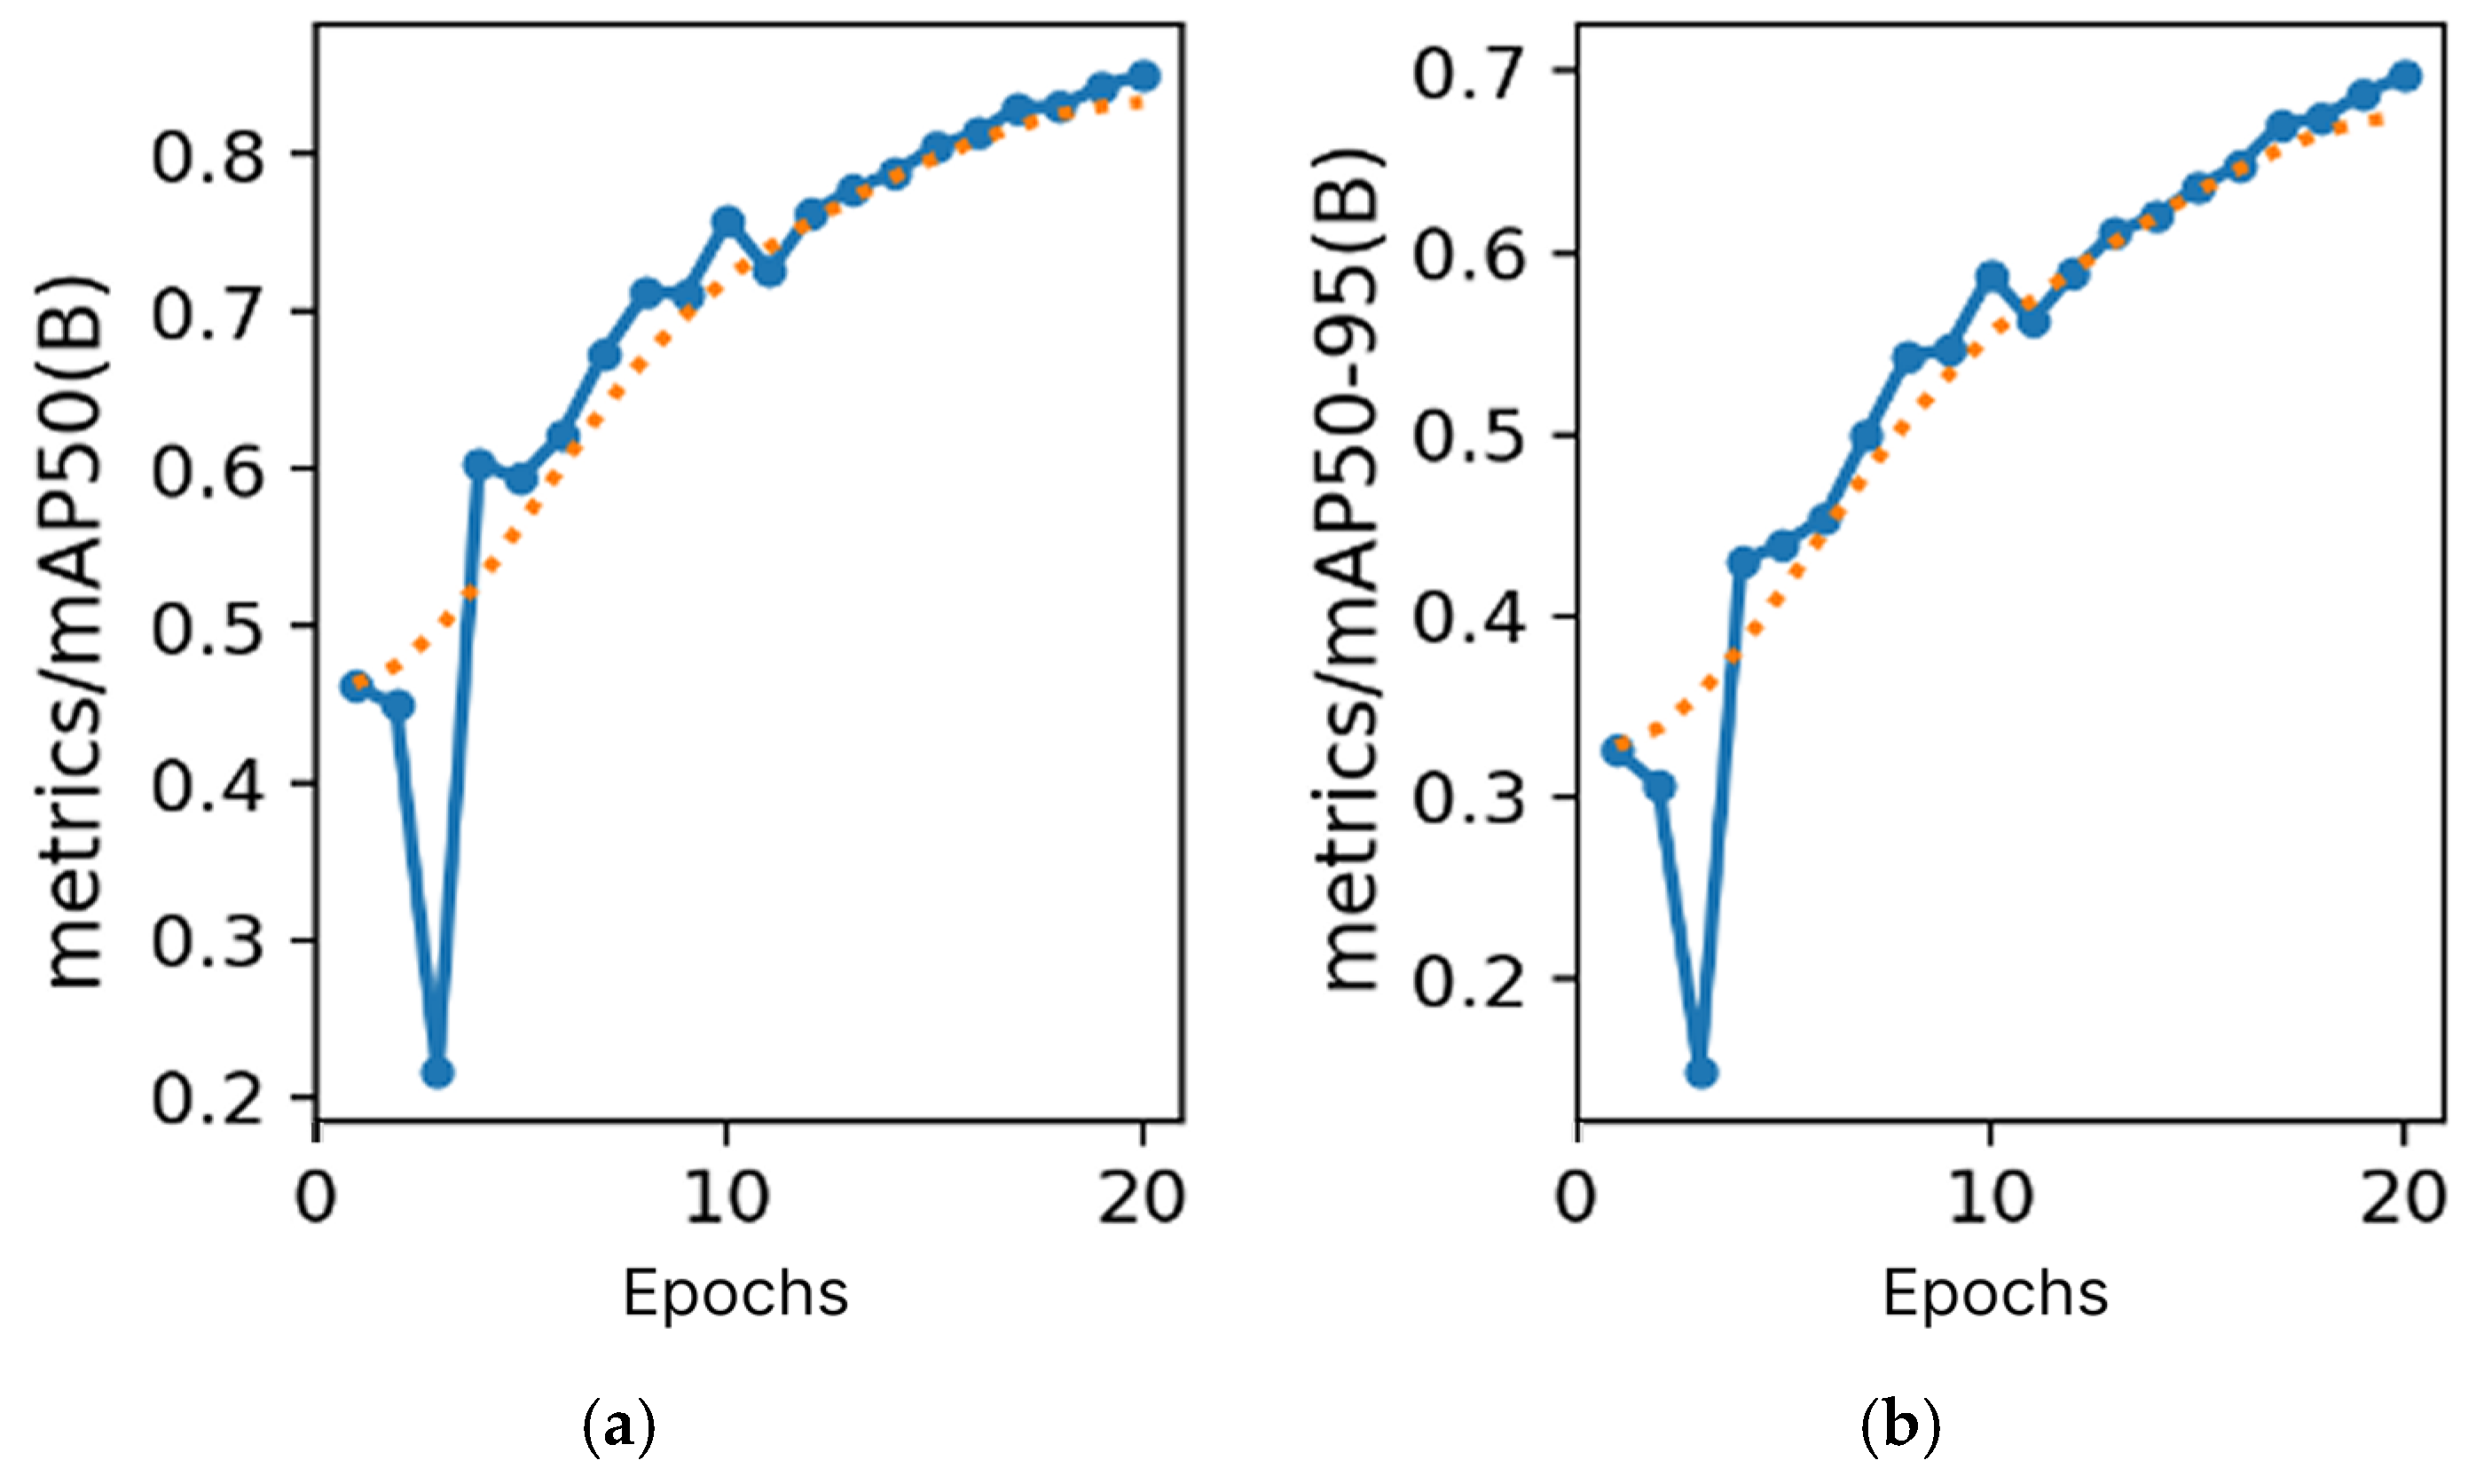
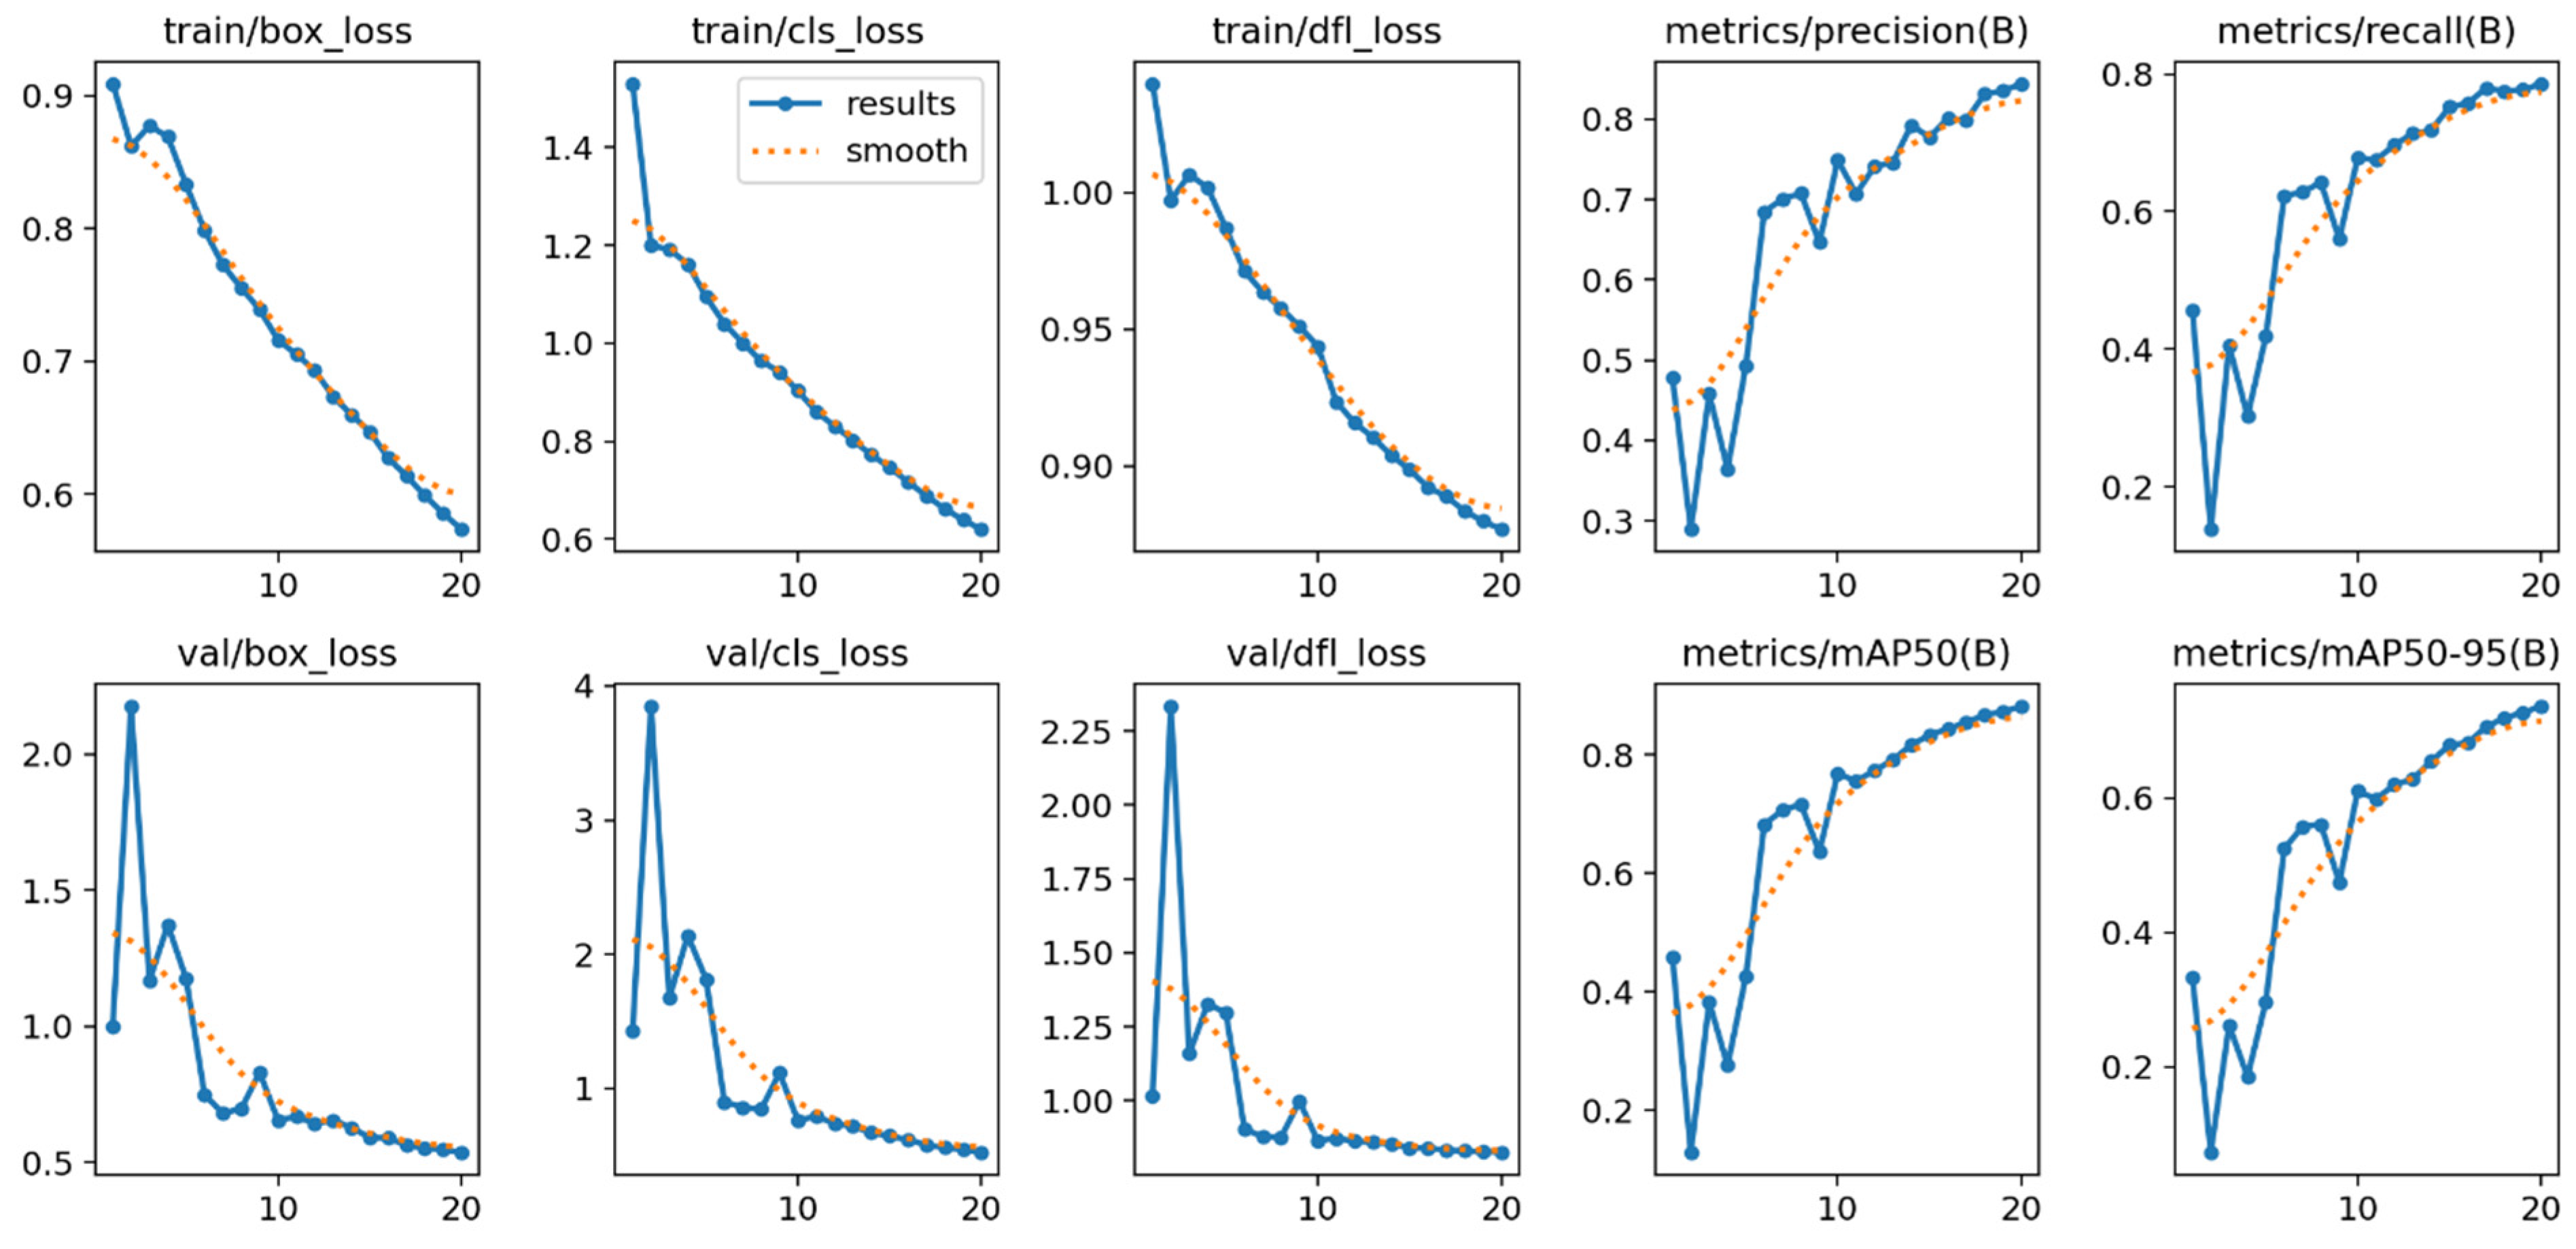
Despite the reduced uniformity in class frequency, all training metrics improved by approximately 2–4%. With this strategy, the model achieved a precision of 0.8429 (Figure 13a), recall of 0.7879 (Figure 13b), mAP@50 of 0.8836 (Figure 14a), and mAP@50:95 of 0.7351 (Figure 14b).
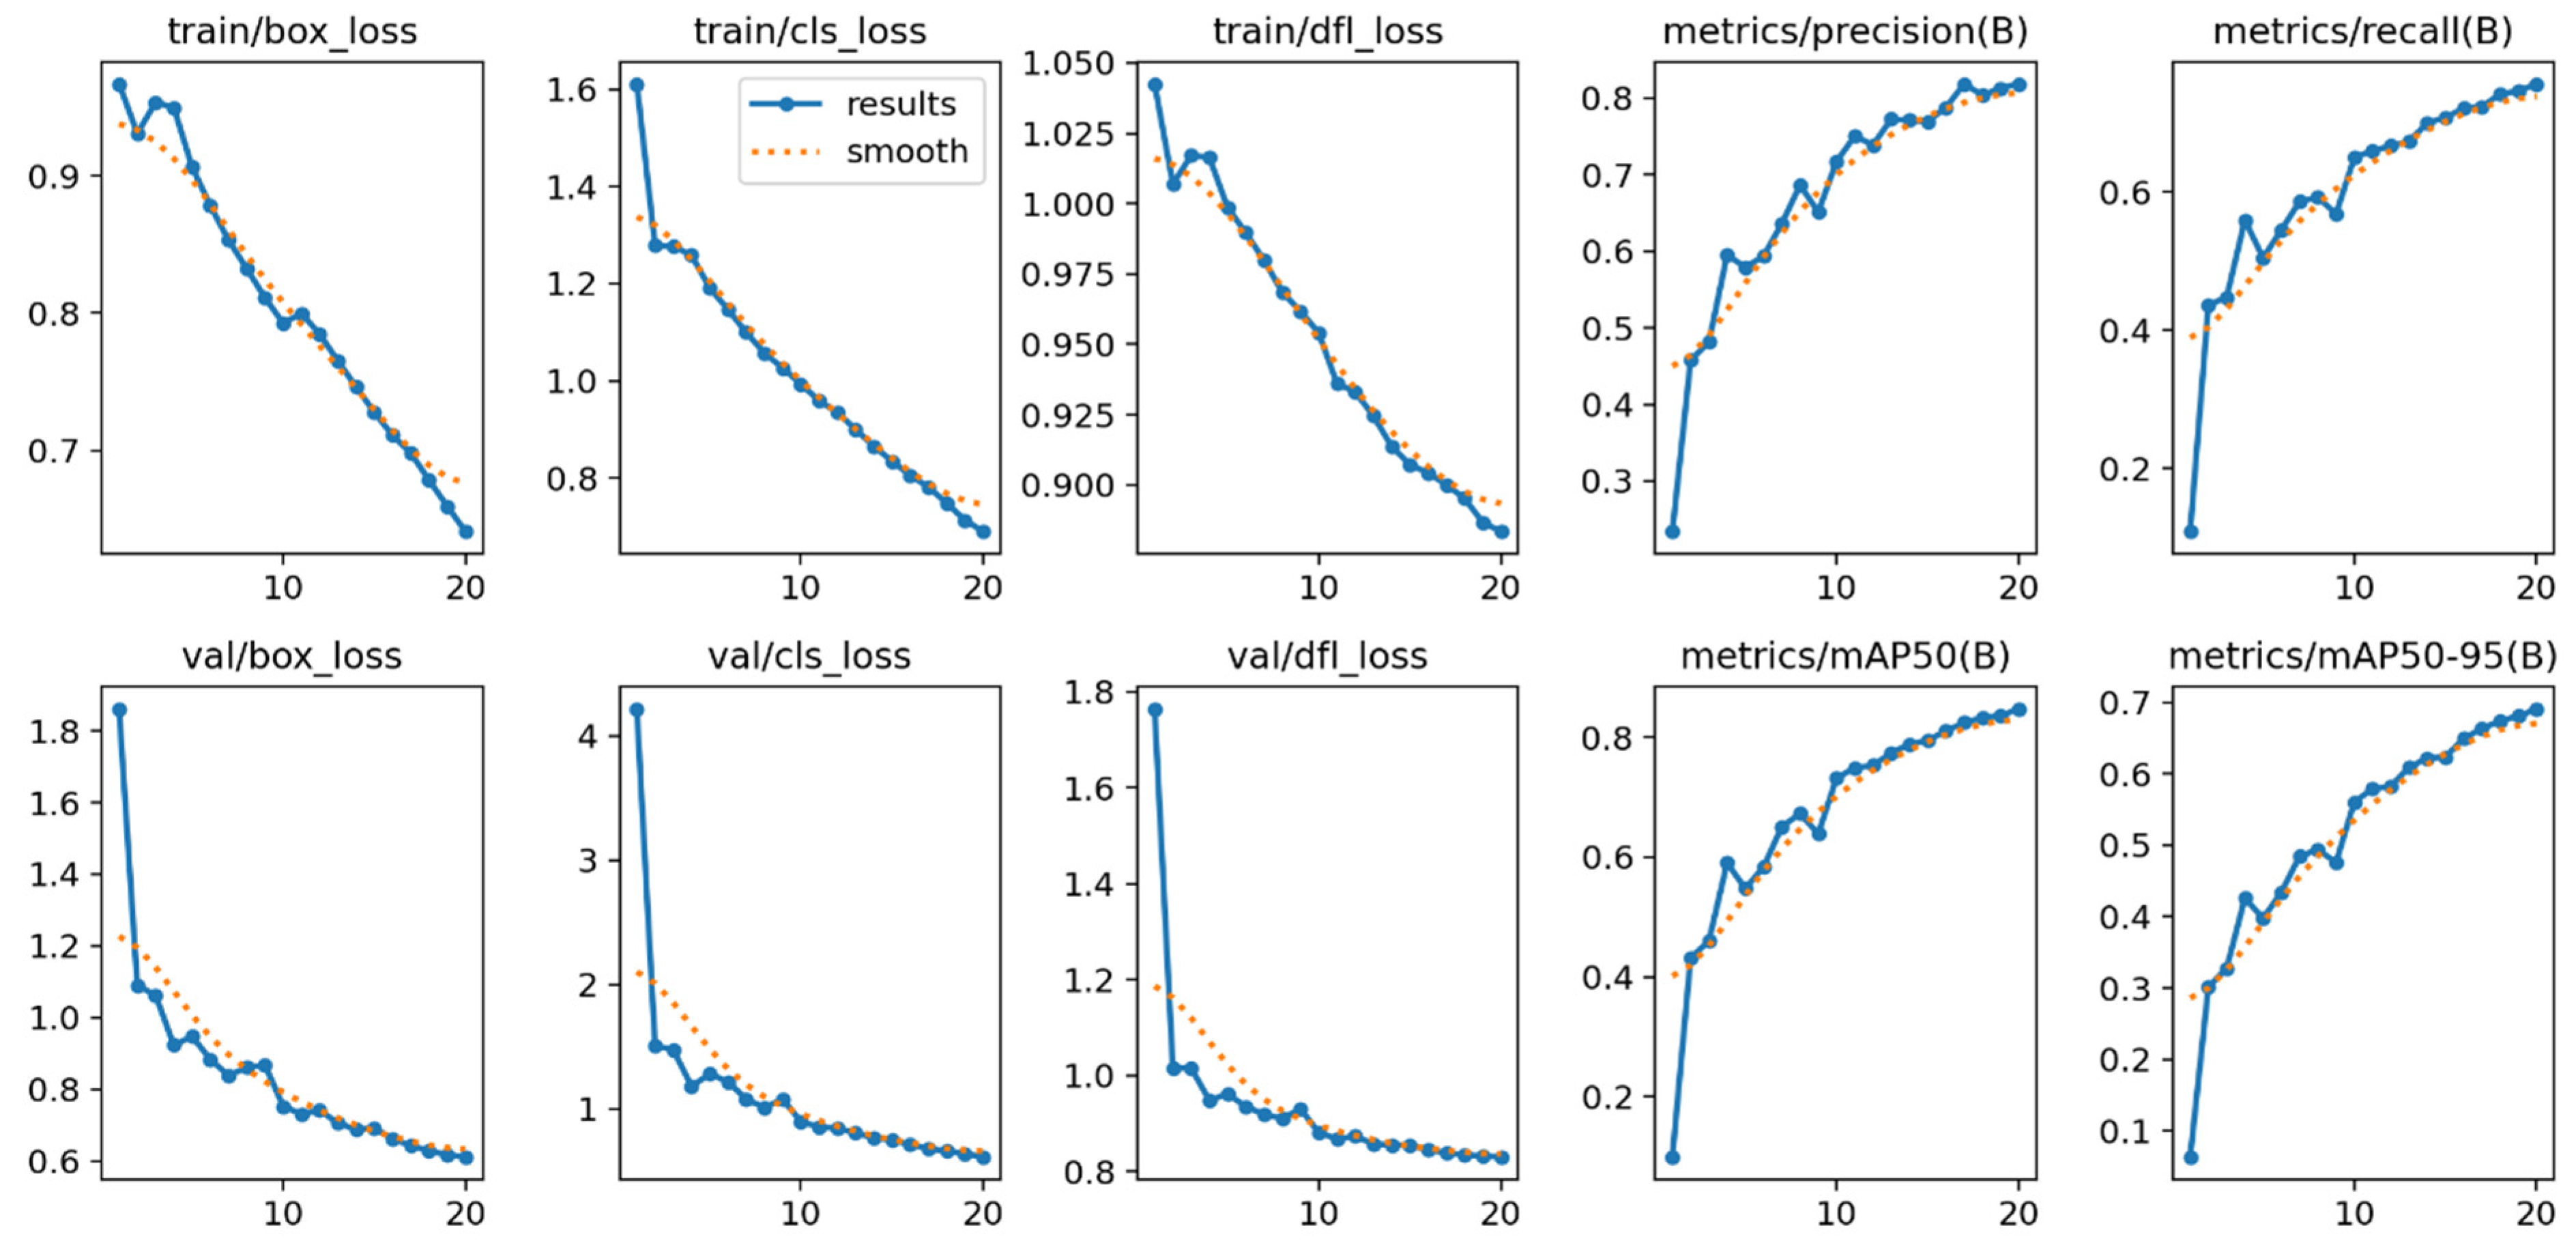
As a result of the second experiment, a 2–4% increase across all training metrics was observed when using median-based element separation and shuffled pool extraction, compared to the baseline parameters. We hypothesize that these improvements are driven by increased layout density and structural variability. Although intermediate parameter combinations were not analyzed in a full factorial manner, this boundary comparison provides insight into the stability and convergence behavior of YOLO11m under structurally constrained versus diversified training distributions. For completeness, Appendix A provides the corresponding spatial distributions and training curves for all generation strategies considered in this study.

3.3. Domain Adaptation and MinerU Validation

The integration into MinerU consists of the following steps:
loading the pre-trained YOLO weight file into the MinerU YOLO module;
automatically redefining the detection head to match the target class configuration;
performing fine-tuning on the target dataset, allowing the backbone weights to adapt further while learning new output layer parameters.
For this process, synthetic data from the previous stage was used for pre-training with an elevated learning rate. The most effective pre-trained weights were then integrated into the MinerU document processing pipeline, replacing the default YOLO weights. Since YOLO models store architecture and class metadata internally, MinerU automatically recognizes the structure of the loaded model. The final deployment step involves replacing the default YOLO weight file in the MinerU configuration with the fine-tuned file obtained after domain-specific training. This approach ensures seamless integration, preserves feature representations learned from synthetic pre-training, and significantly accelerates convergence during fine-tuning on real document datasets.
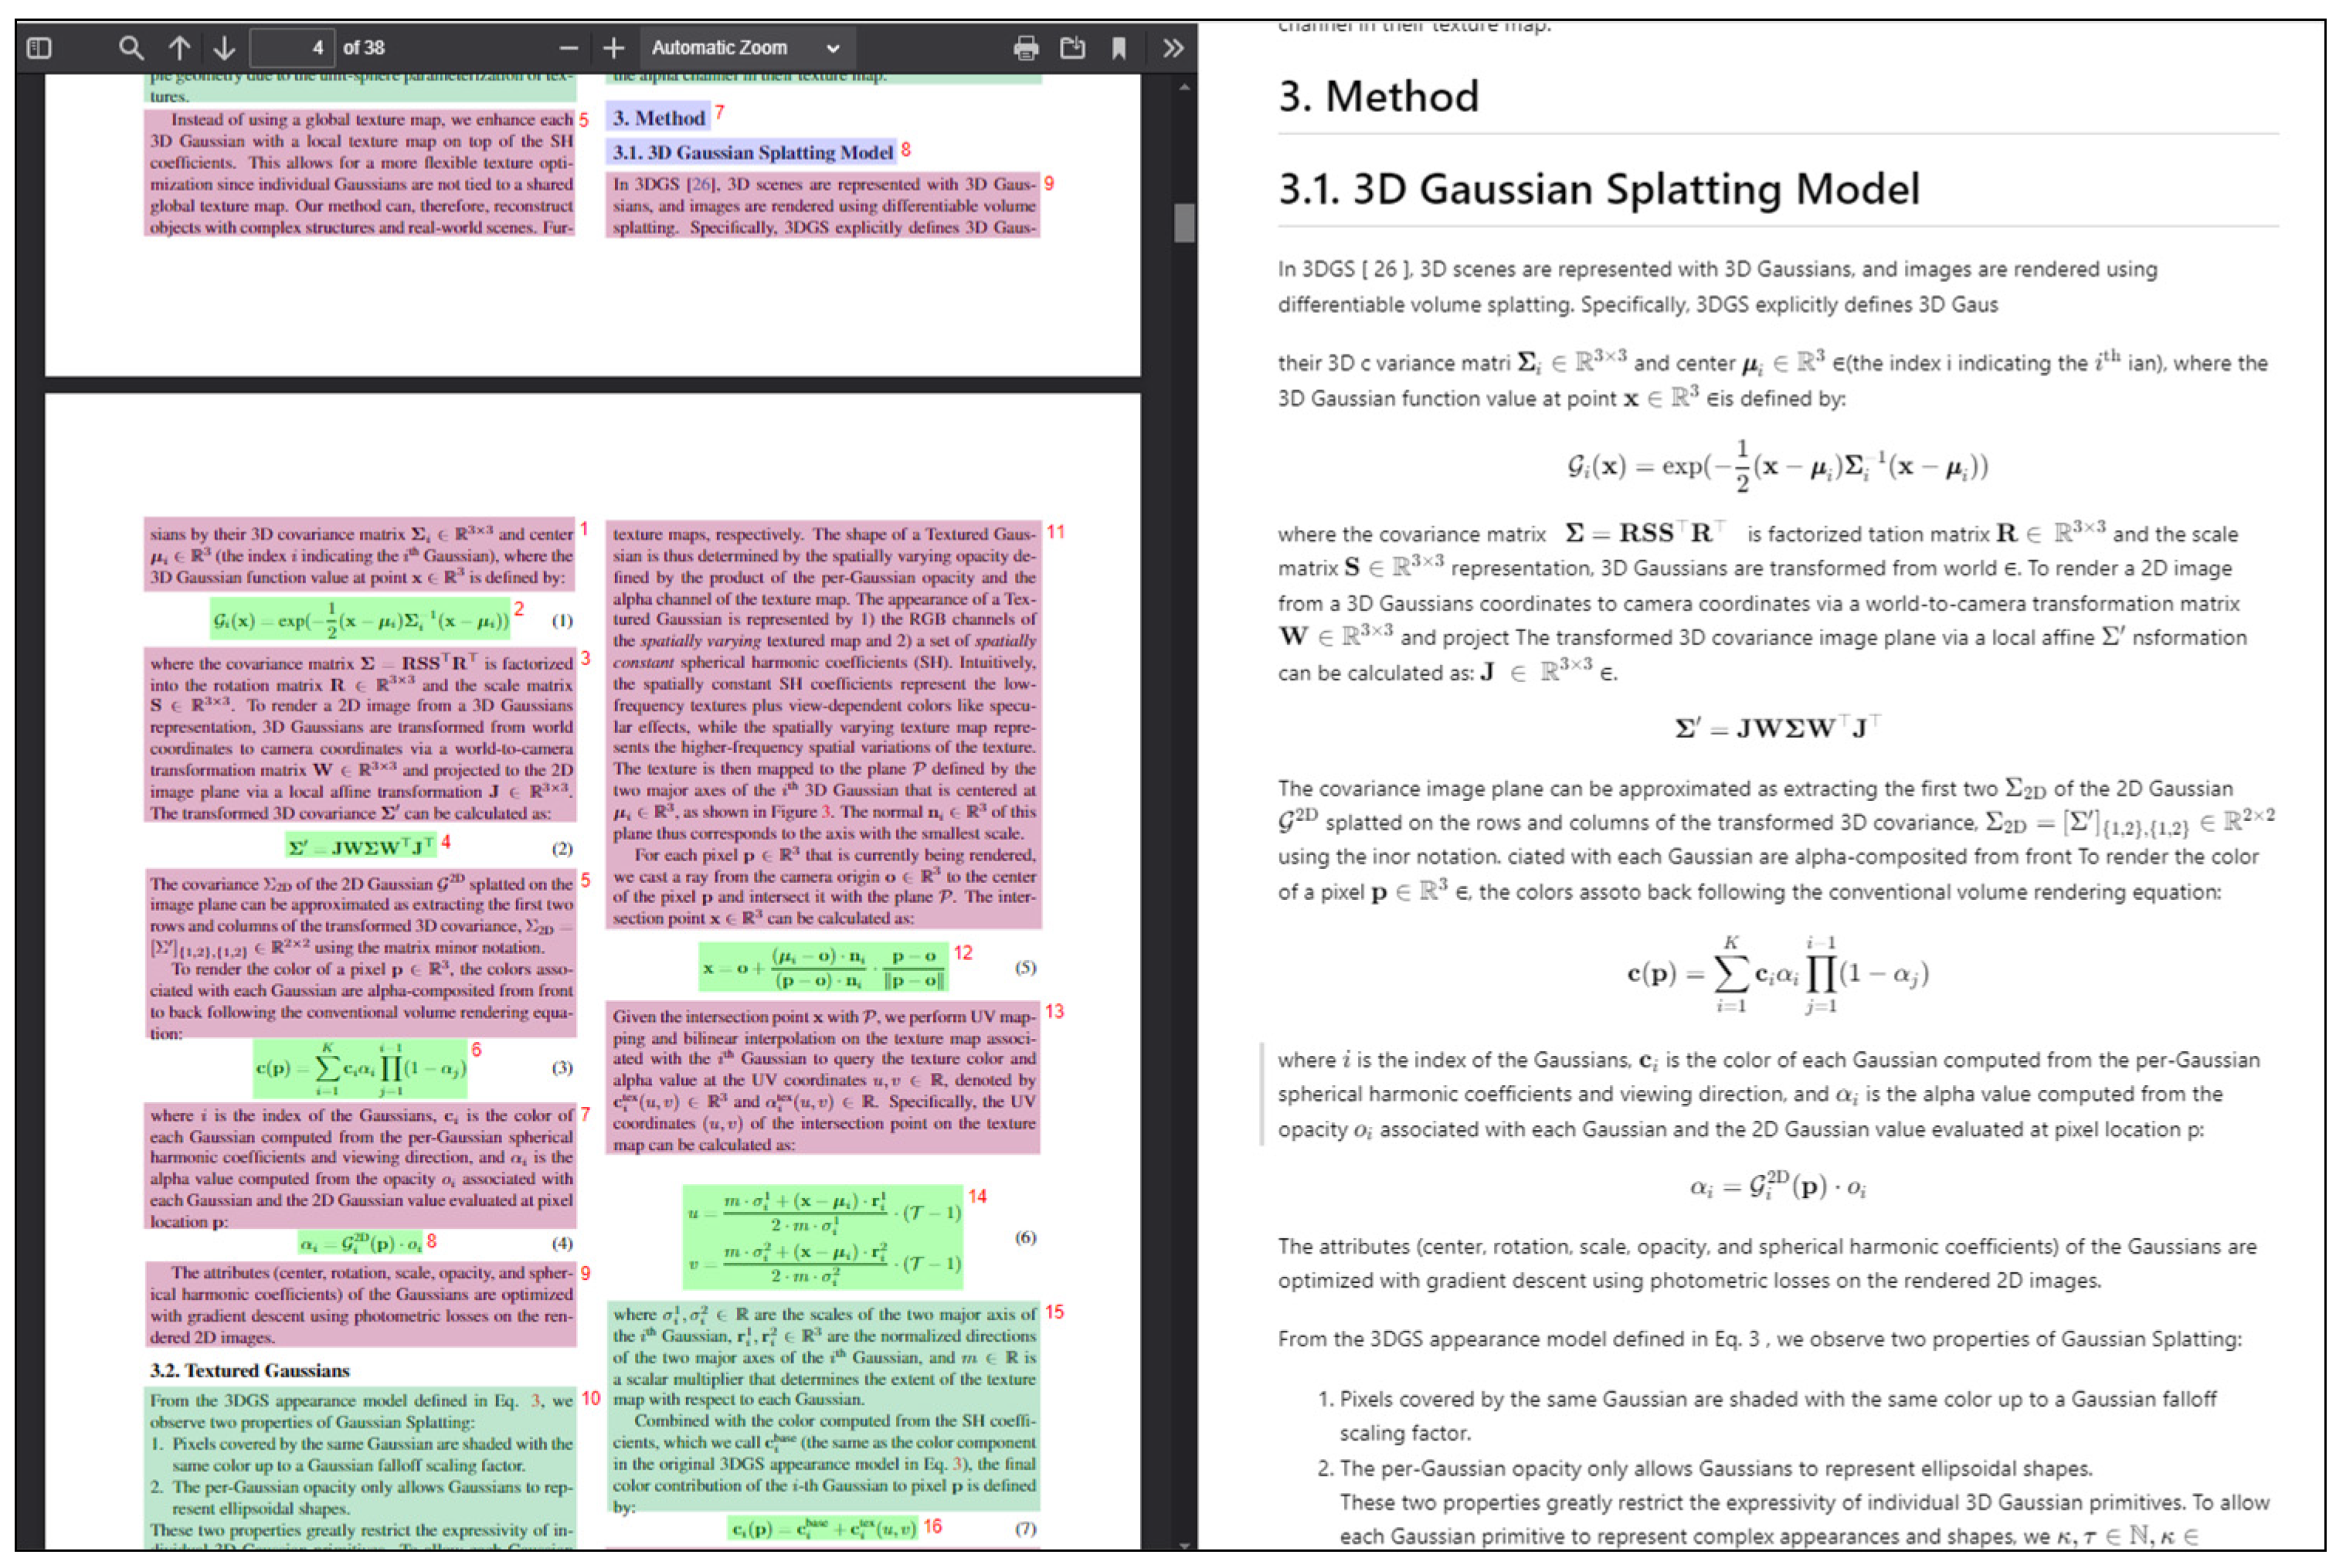
To integrate into MinerU, the model needs to be further trained on the target data. To facilitate this, the names and order of the dataset classes were extracted from the PDF-Extract-Kit documentation [49]. The fine-tuning dataset was formed from ten recently published research papers from the open arXiv archive: five were manually annotated using Roboflow platform tools (serving as ground truth), and the remaining five were used for system testing. Fine-tuning was performed on 83 training images, 12 test images, and 24 validation images. This limited, manually annotated dataset was intentionally used to demonstrate that, following robust synthetic pre-training, a small number of real annotated pages is sufficient to specialize the model for a specific domain.
The YOLO model was adapted to a reduced set of target classes by re-initializing the main detection node while preserving the remaining weights. Additional fine-tuning was performed with an initial learning rate of 0.05 (decreasing to 0.0001) and a batch size of 1. Despite the limited dataset, overfitting was mitigated through prior large-scale synthetic pre-training, a low learning rate schedule, weight decay regularization, and continuous validation monitoring. The resulting integration and model performance are illustrated in Figure 15.
The validation on real documents was not intended to provide exhaustive testing across all document types. Instead, the objective was to illustrate the practical applicability of the method and its capacity to accelerate model adaptation using a very limited amount of manual labeling. This confirms the effectiveness of synthetic pre-training in reducing costs for real-world scenarios.

4. Discussion

In this study, an analysis of document structure recognition processes identified four key structural factors affecting model accuracy: block density (element count and area coverage), dimensional variability (size and aspect ratio), spatial distribution of block centers, and class balance. These parameters define the statistical structure of the synthetic corpus, which is critical for enhancing the model’s generalization ability and layout recognition accuracy for structured scientific documents of the type examined in this study. Since YOLO-based detectors are optimized within the empirical distribution of training data, they implicitly internalize its spatial and categorical statistics. Consequently, spatial concentration and class frequency imbalances can negatively bias the learned positional priors.
The developed mathematical model formalizes synthetic layout generation as a controlled optimization process, allowing for systematic adjustments to spatial density, size ratios, and class balance. This framework determines the statistical properties of the pre-training data and, subsequently, shapes the feature learning dynamics within the detection network.
The proposed distribution-aware generation model is particularly relevant for YOLO-based detectors, as their dense prediction mechanism directly reflects the spatial statistics of the training set. By modifying the empirical distribution of the layout during pre-training, the model reduces positional bias and stabilizes bounding box regression across diverse page structures.
For comparative analysis, four synthetic document generation strategies were implemented based on the proposed mathematical model. Spatial sampling included constant and median-based separation, along with selection mechanisms based on threshold values and a mixed pool. To confirm structural differences between the resulting four datasets, spatial heatmaps of normalized block centers and bounding box size distributions were analyzed. Subsequently, the YOLO11m model was trained on these sets using identical parameters. The full set of visualizations supporting this analysis is provided in Appendix A.
In the process of training models using the data generation methods proposed in this work, the theoretically expected accuracy indicators for the YOLO11m architecture were achieved. The experiments demonstrated that training metrics converged to mAP@50 values of 0.8502–0.8836. This performance was achieved using a smaller number of classes and a more compact sample size than the baseline 0.50–0.52 mAP@50 reported by Ultralytics for YOLO11m when trained on extensive multi-class datasets [46]. These results suggest that optimized data preparation can compensate for the inherent limitations of convolutional neural networks in perceiving high-level context.
Furthermore, compared to models trained on the full DocBank dataset—such as LayoutLM, which achieves a precision of 0.7677 and recall of 0.8195 [38]—the model in this study achieved a precision of 0.8429 and recall of 0.7879. This was accomplished using a significantly smaller sample set structured according to the proposed generation model. Synthetic datasets provide greater variability in layout components, enabling the model to better distinguish page elements and maintain high predictive accuracy within the class of structured scientific document layouts considered in this work.
The developed approach for generating synthetic layouts, which incorporates real-world document statistics and provides control over element density, size, and combinations, demonstrated a significant accuracy increase of 2–4% on the examined datasets. This is a remarkable result for models of this class; for comparison, previous studies reported improvements of 2.1% on financial documents [9] and a 3.6% increase in mAP [11].
The paper further demonstrates the practical applicability of the proposed method through its integration into the MinerU system. This stage was intended to demonstrate the model’s rapid adaptation to a specific domain following large-scale synthetic pre-training. The YOLO11m model, trained on structurally controlled synthetic data, achieved rapid convergence during fine-tuning on a small target dataset derived from 10 real scientific articles. Despite the limited size of the real-world sample, the model successfully generalized the studied structural features and accurately reconstructed page layouts.
The described process of creating synthetic data for preliminary training makes it possible to generate specialized datasets adapted to specific subject areas of documents, which helps further use only fine-tuning of the model for a specific task.
In general, this study demonstrates that the structural quality and statistical composition of pre-training data are crucial for accelerating model convergence in real-world scenarios where access to large, specialized datasets is limited.
The contribution of this study to the field can be evaluated by comparing it with existing developments, as summarized in Table 2. As illustrated in the table, current research in Document Layout Analysis is evolving across several interconnected areas: architectural innovations (YOLO modifications, CNN/R-CNN, and Transformers), data preparation methodologies, and domain-specific adaptation. Despite the results achieved in previous research, mentioned above approaches face certain systemic limitations. For instance, heavy-duty Transformer and complex deep learning models provide high accuracy but require significant computational resources, hindering adaptation to new document types. Furthermore, the shortage of labeled data and the high cost of annotation remain persistent challenges. While this encourages the use of transfer learning and pre-training, these methods do not completely eliminate the dependence on high-quality labeling. Additionally, existing synthetic layout generation approaches often suffer from low structural variability and reproduce typical “central concentration” patterns, limiting model generalization. Finally, transferring to new domains often results in slow convergence and requires extensive weight tuning.
The approach proposed in the present study, as summarized in Table 2, systematically addresses these limitations via:
using an optimized YOLO11m framework to maintain a balance between accuracy and computational efficiency;
implementing a mathematical model for supervised synthetic layout generation and a greedy density-controlled placement algorithm to increase structural variability;
integrating synthetic pre-training into a practical pipeline (including MinerU) to accelerate adaptation to real documents and reduce reliance on manual annotation.
Taken together, these improvements result in a more robust and computationally efficient DLA strategy focused on scalability and domain portability.
Despite the positive results obtained, several limitations of this study should be noted. The experimental validation was primarily conducted on the DocBank dataset, which predominantly contains structured scientific documents. Consequently, the generalizability of the proposed synthetic layout generation framework to more heterogeneous document domains—such as handwritten, multilingual, or highly irregularly structured documents—requires further investigation. Furthermore, the evaluation was limited to standard object detection metrics (precision, recall, mAP@50, mAP@50:95), without assessing structural coherence or reading order reconstruction. In this paper, multivariate variance analysis and formal statistical significance testing were not performed. Further studies will include repeated runs and statistical evaluation for a more rigorous quantitative assessment of the variance and stability of the obtained results. Therefore, while improvements in detection accuracy were demonstrated, the impact of the proposed approach on deeper document understanding tasks requires further study.
The experimental validation was conducted using a unified convolutional detection architecture, YOLO11. Future research could extend the proposed synthetic data generation strategy to transformer-based architectures for creating even more realistic document pages. Other potential directions include generating synthetic styles for different languages and writing systems, integrating semantic context into the generation process, and extending the algorithm to model complex layouts of scientific journals, technical reports, and handwritten materials. Implementing these directions will enable the development of universal recognition systems capable of efficiently processing large datasets, accelerating LLM-based searches, automating structured knowledge base creation, and reducing dataset preparation costs in both scientific and industrial projects.
The primary contribution of this study is a formalized mathematical model for synthetic document layout generation that controls spatial density, block ratios, and class distribution. Its scientific novelty lies in treating layout synthesis as a controllable probabilistic process rather than a heuristic augmentation procedure. Unlike existing pipelines based on random placement, this framework defines structural parameters that directly shape the empirical training distribution. This approach allows for the systematic manipulation of spatial and categorical statistics to mitigate positional priors and class frequency biases inherent in convolutional detectors like YOLO, pertaining specifically to the categories of structured layouts addressed herein. Furthermore, the work establishes a distribution-aware perspective on data preparation, demonstrating that controlled structural modifications lead to a 2–4% improvement in detection metrics. The novelty thus extends beyond empirical gains, elevating synthetic generation to a parameter-driven mechanism for enhancing generalization. The practical significance lies in reducing dependency on large annotated datasets. By enabling YOLO-based detectors to adapt to new domains using minimal real-world data, this approach proves particularly valuable for low-resource document environments.

5. Conclusions

In this work, document layout analysis methods are improved through the development and validation of a mathematically formalized model for synthetic data generation, leading to the following conclusions:
  • A mathematical model for synthetic layout synthesis was developed, that formalizes data synthesis as a controllable probabilistic process. By utilizing a greedy placement algorithm to manage block density and spatial distribution, the model effectively eliminates positional priors and “central concentration” bias, improving generalization performance within the specific scope of the structured scientific and technical layouts addressed in this study.
  • A data preparation strategy is optimized, experimentally proving that median-based element splitting combined with shuffled pool sampling is the most effective approach. This configuration yields a 2–4% metric improvement (precision 0.8429, mAP@50 0.8836), confirming that structural quality and statistical balance are more critical for convergence than raw data volume.
  • Domain adaptation is accelerated, reducing the dependency on manual annotation. Pre-training on optimized synthetic layouts enables the YOLO11m model to successfully specialize using as few as 83 real-world images, demonstrating the method’s efficiency for document segments with scarce labeled data.
  • Practical significance of the findings is validated through seamless integration into the MinerU system. The proposed methodology allows for the dynamic adaptation of the detector to new target classes without architectural changes or weight conversion, providing a scalable solution for industrial-grade document analysis.

Author Contributions

Conceptualization, O.P. (Olha Pronina) and T.X.; methodology, O.P. (Olha Pronina), T.X., O.P. (Olena Piatykop) and K.S.; software, K.S. and E.B.; validation, V.E. and O.P. (Olena Piatykop); formal analysis, O.P. (O.Pronina) and K.S.; investigation, O.P. (Olha Pronina), T.X., K.S., O.P. (Olena Piatykop) and E.B.; resources, O.P. (Olena Piatykop), T.X., and V.E.; data curation, K.S.; writing—original draft preparation, O.P. (Olha Pronina), T.X. and V.E.; writing—review and editing, O.P. (Olena Piatykop), O.P. (Olha Pronina), T.X. and V.E.; visualization, K.S., and E.B.; supervision, V.E.; project administration, O.P. (Olena Piatykop); funding acquisition, V.E. and T.X. All authors have read and agreed to the published version of the manuscript.

Funding

This research received no external funding.

Institutional Review Board Statement

Not applicable.

Informed Consent Statement

Not applicable.

Data Availability Statement

The original contributions presented in this study are included in the article. Further inquiries can be directed to the corresponding author.

Conflicts of Interest

The authors declare no conflicts of interest.

Abbreviations

The following abbreviations are used in this manuscript:
CNNConvolutional Neural Networks
DiTDocument Image Transformer
DIRDocument Image Retrieval
DLADocument Layout Analysis
DocBankDocument Bank Dataset
FNFalse Negatives
FPFalse Positives
GiTGraph Transformer
IoUIntersection Over Union
JSONJavaScript Object Notation
LLMlarge language Model
mAPMean Average Precision
OCROptical Character Recognition
R-CNNRegion-based Convolutional Neural Networks
SDLASemantic Document Layout Analysis
TNTrue Negatives
TPTrue Positives
ViTVision Transformer
VGTVision-and-Graph Transformer

Appendix A

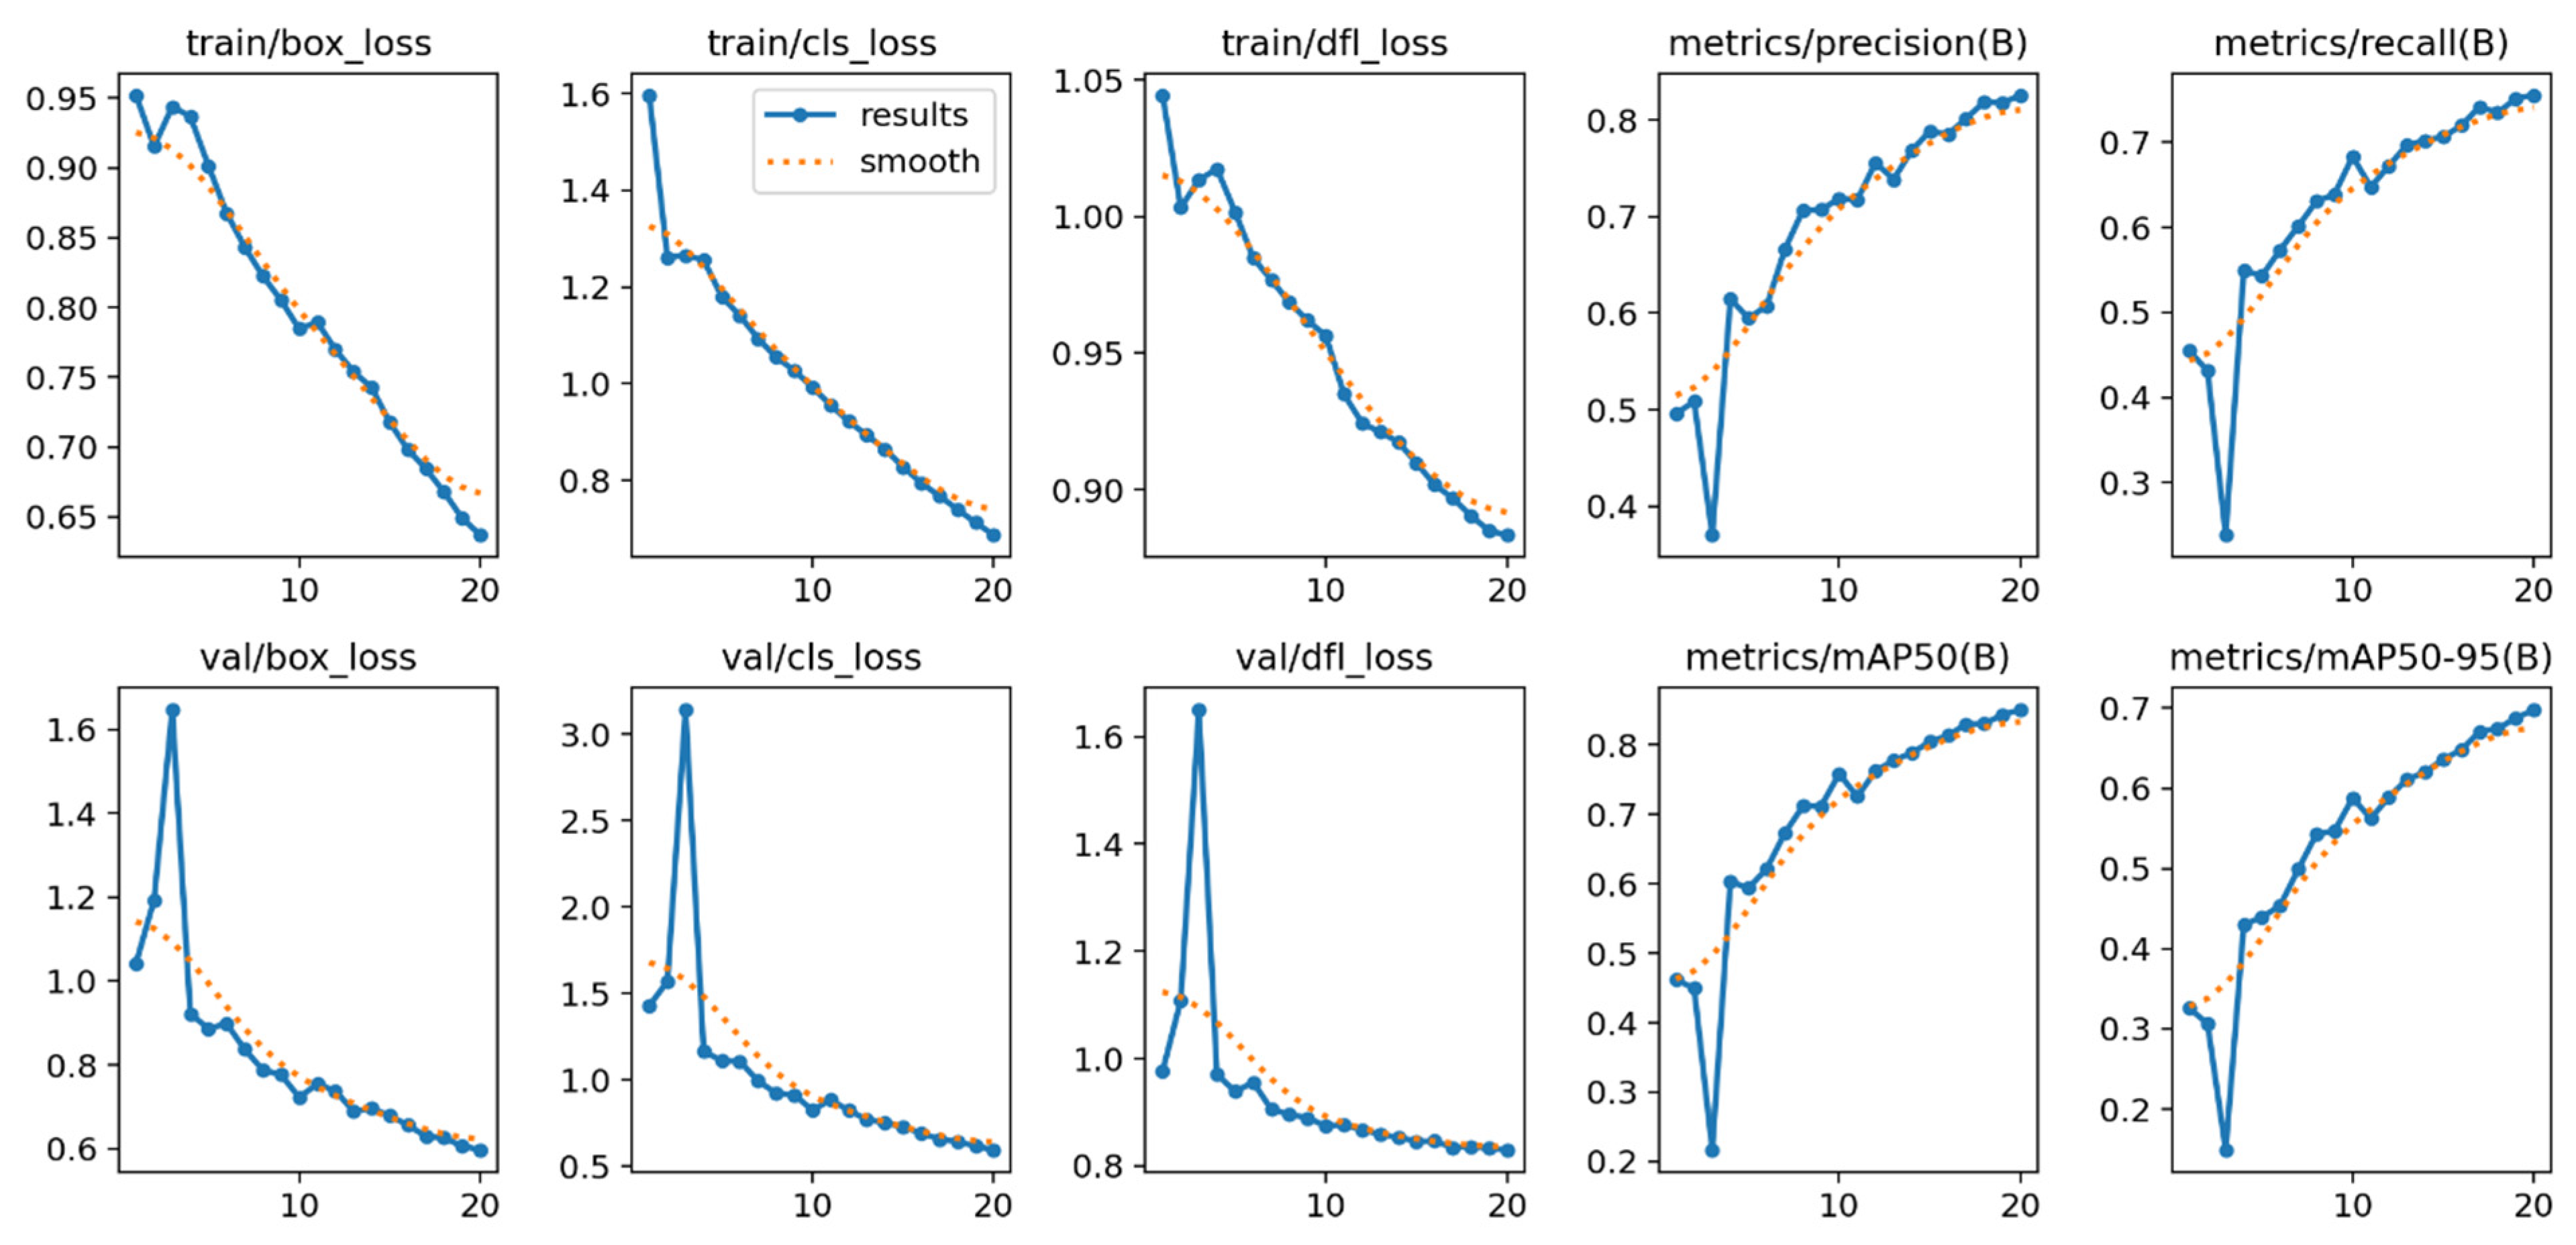
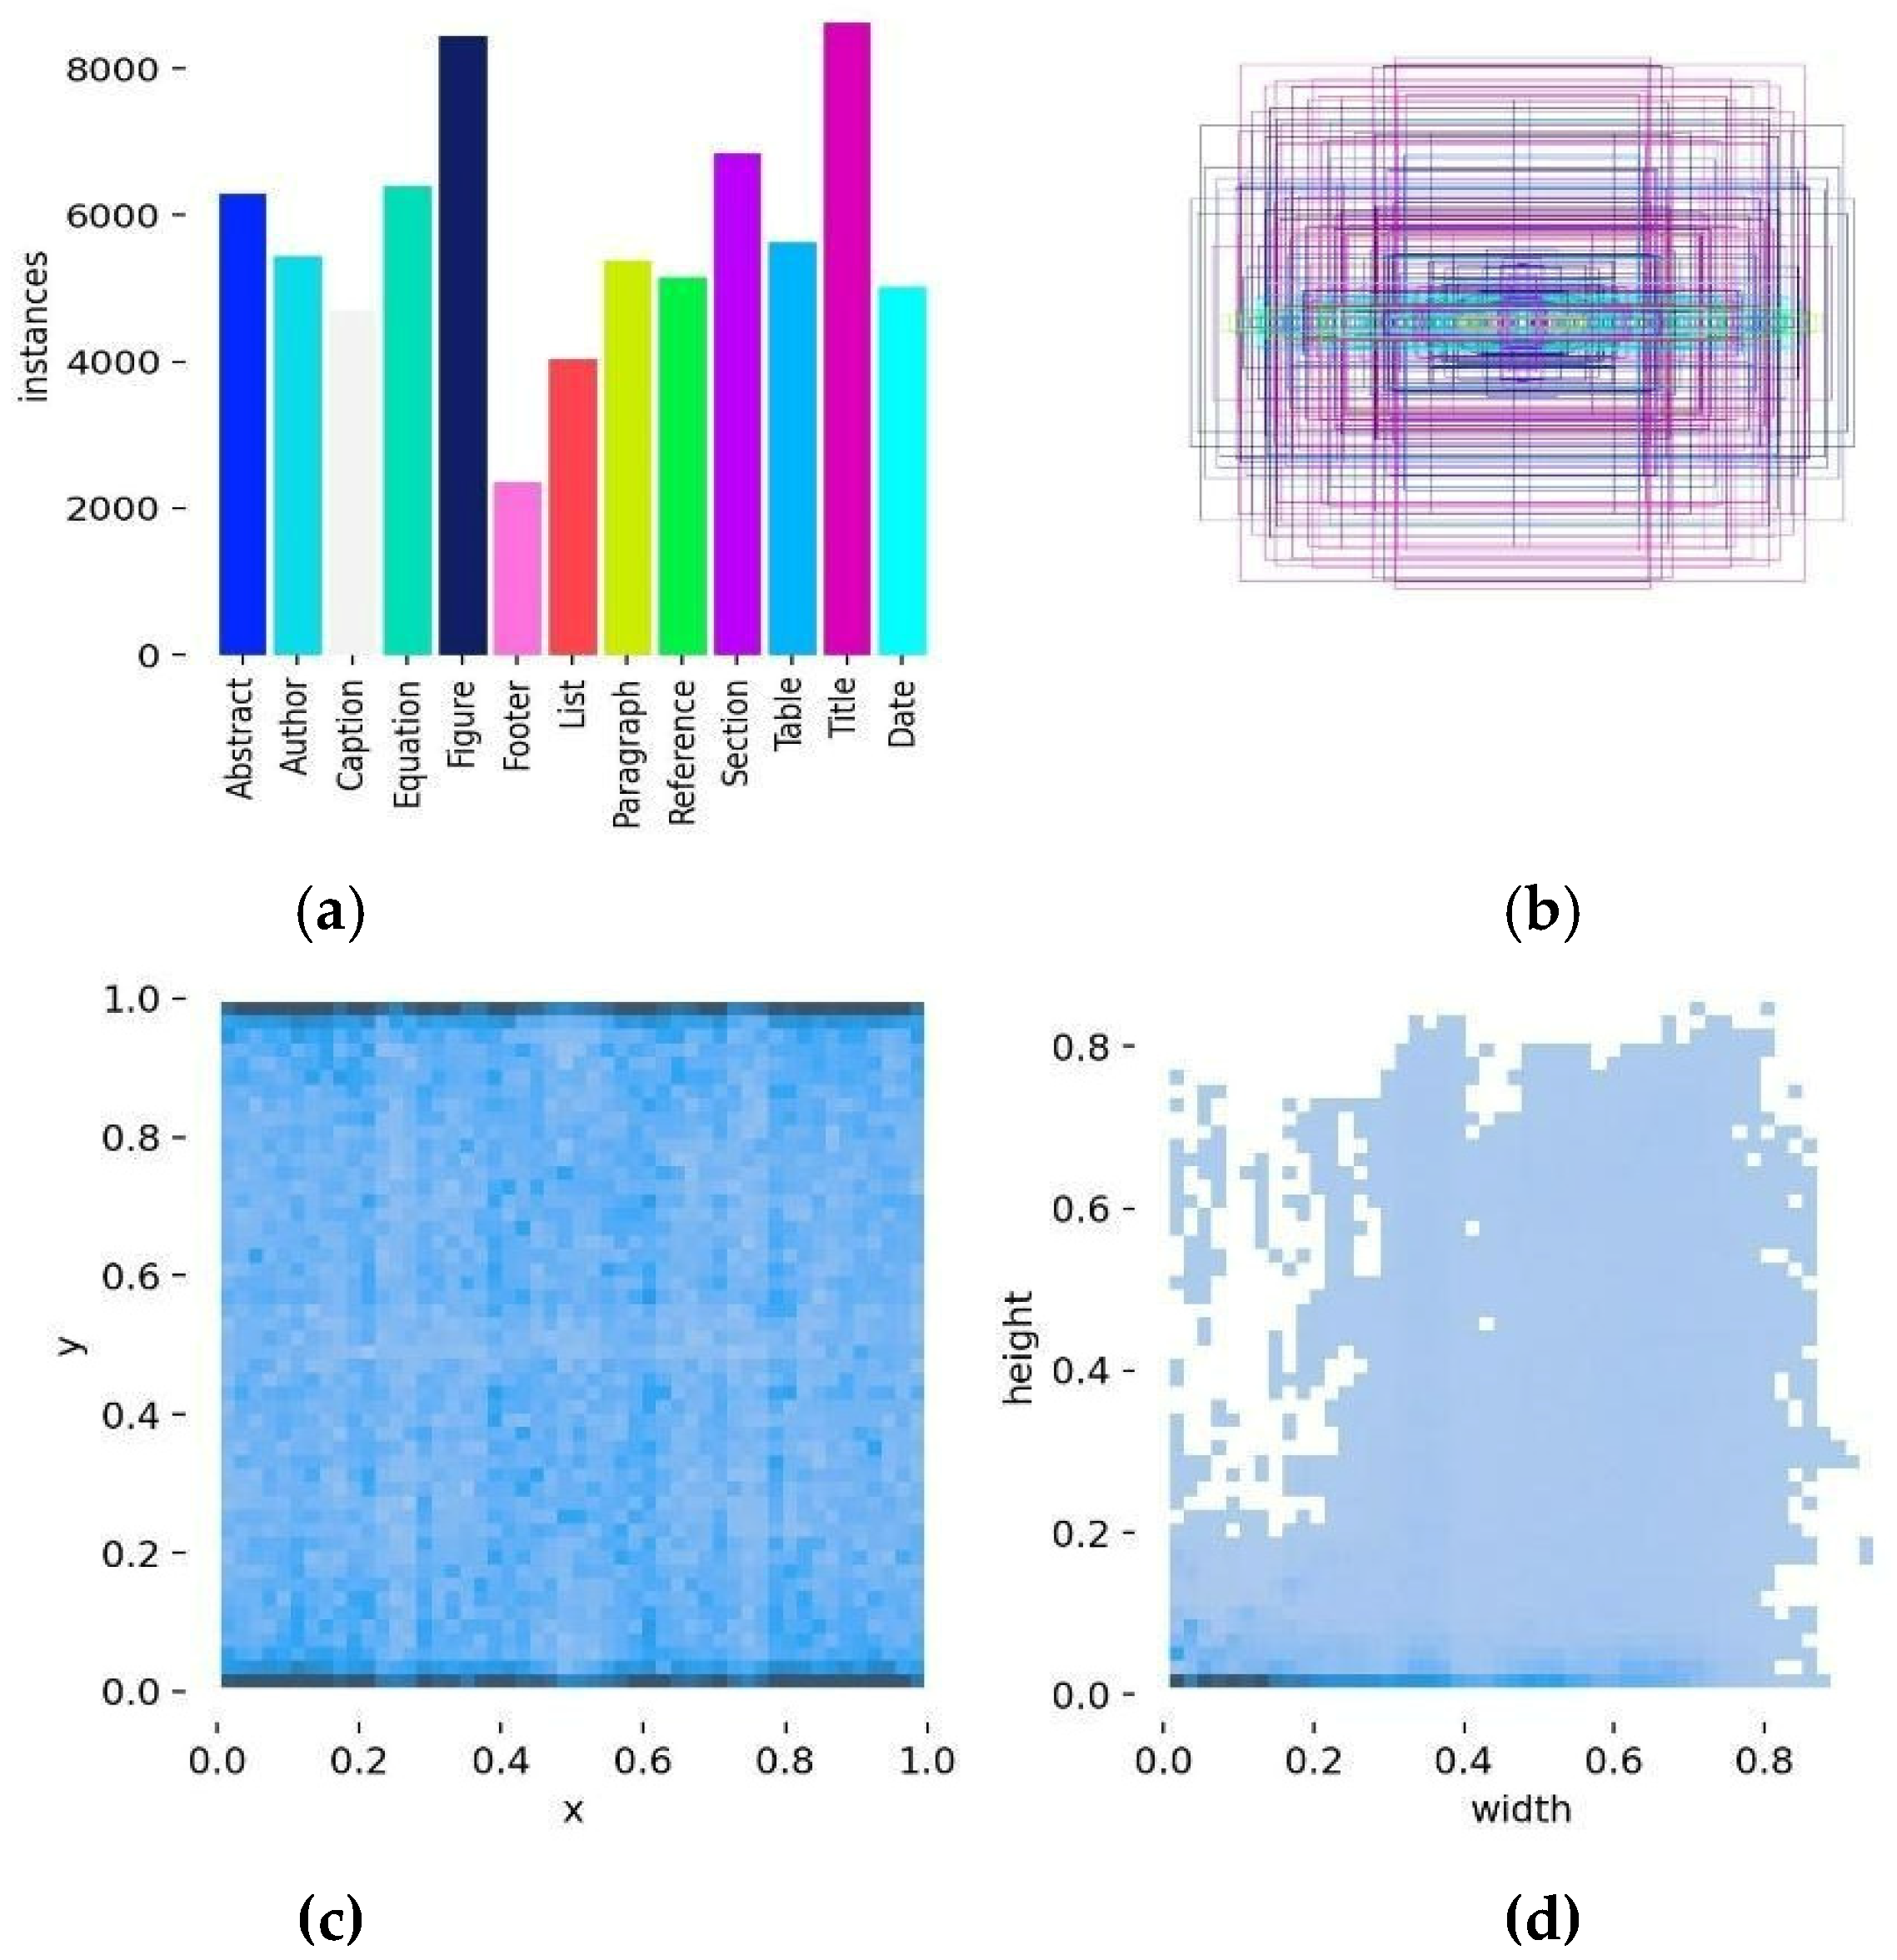
Figure A1. Quantitative and spatial representation of classes in dataset with constant distribution and a threshold on the number of extracted blocks. In (a,b) colors represent different object classes and are not associated with numerical frequency values; in (c,d) colors indicate normalized spatial density of bounding box centers, with intensity levels reflecting the local concentration of elements.
Applsci 16 03089 g0a1
Figure A2. Learning curves on dataset with constant distribution and a threshold on the number of extracted blocks. (Blue dots: metric values per training epoch; the dashed line: the smoothed learning trend (moving average) to highlight training dynamics.)
Applsci 16 03089 g0a2
Figure A3. Quantitative and spatial representation of classes in dataset with median distribution and a threshold on the number of extracted blocks. In (a,b) colors represent different object classes and are not associated with numerical frequency values; in (c,d) colors indicate normalized spatial density of bounding box centers, with intensity levels reflecting the local concentration of elements.
Applsci 16 03089 g0a3
Figure A4. Learning curves on dataset with median distribution and a threshold on the number of extracted blocks. Blue dots: metric values per training epoch; the dashed line: the smoothed learning trend (moving average) to highlight training dynamics. B indicates bounding boxes used for precision calculation in object detection.
Applsci 16 03089 g0a4
Figure A5. Quantitative and spatial representation of classes in dataset with constant distribution and block extraction from a large shuffled group. In (a,b) colors represent different object classes and are not associated with numerical frequency values; in (c,d) colors indicate normalized spatial density of bounding box centers, with intensity levels reflecting the local concentration of elements.
Applsci 16 03089 g0a5
Figure A6. Learning curves on dataset with constant distribution and block extraction from a large shuffled group. Blue dots: metric values per training epoch; the dashed line: the smoothed learning trend (moving average) to highlight training dynamics. B indicates bounding boxes used for precision calculation in object detection.
Applsci 16 03089 g0a6
Figure A7. Quantitative and spatial representation of classes in dataset with median distribution and block extraction from a large shuffled group. In (a,b) colors represent different object classes and are not associated with numerical frequency values; in (c,d) colors indicate normalized spatial density of bounding box centers, with intensity levels reflecting the local concentration of elements.
Applsci 16 03089 g0a7
Figure A8. Learning curves on dataset with median distribution and block extraction from a large shuffled group. Blue dots: metric values per training epoch; the dashed line: the smoothed learning trend (moving average) to highlight training dynamics. B indicates bounding boxes used for precision calculation in object detection.
Applsci 16 03089 g0a8

References

  1. Soto, C.; Yoo, S. Visual Detection with Context for Document Layout Analysis. In Proceedings of the 2019 Conference on Empirical Methods in Natural Language Processing and the 9th International Joint Conference on Natural Language Processing (EMNLP-IJCNLP); Association for Computational Linguistics: Hong Kong, China, 2019; pp. 3464–3470. [Google Scholar] [CrossRef]
  2. Oliaee, A.H.; Tripp, A.R. Layout Analysis of Historic Architectural Program Documents. In Proceedings of the ACM Symposium on Document Engineering 2023 (DocEng ’23); Association for Computing Machinery: New York, NY, USA, 2023; pp. 1–4. [Google Scholar] [CrossRef]
  3. Baloun, J.; Honzík, V.; Lenc, L.; Martínek, J.; Král, P. Heimatkunde: Dataset for Multi-Modal Historical Document Analysis; ScitePress: Setúbal, Portugal, 2024. [Google Scholar] [CrossRef]
  4. Sheikh, T.U.; Shehzadi, T.; Hashmi, K.A.; Stricker, D.; Afzal, M.Z. UnSupDLA: Towards Unsupervised Document Layout Analysis. In Document Analysis Systems (DAS 2024); Lecture Notes in Computer Science; Springer: Cham, Switzerland, 2024; Volume 14994. [Google Scholar] [CrossRef]
  5. Lewis, P.; Perez, E.; Piktus, A.; Petroni, F.; Karpukhin, V.; Goyal, N.; Küttler, H.; Lewis, M.; Yih, W.-T.; Rocktäschel, T.; et al. Retrieval-Augmented Generation for Knowledge-Intensive NLP Tasks. In Proceedings of the 34th International Conference on Neural Information Processing Systems (NeurIPS 2020); Curran Associates, Inc.: Red Hook, NY, USA, 2020; pp. 9459–9474. [Google Scholar]
  6. Rajan, R.; Devasena, M.S.G. Deep Learning-Based Optimization Model for Document Layout and Text Recognition. Ain Shams Eng. J. 2025, 16, 103587. [Google Scholar] [CrossRef]
  7. Gao, Z.; Li, S. YOLOLayout: Multi-Scale Cross Fusion Former for Document Layout Analysis. Int. J. Emerg. Technol. Adv. Appl. 2024, 1, 8–15. [Google Scholar] [CrossRef]
  8. Akanda, M.M.B.A.N.; Ahmed, M.; Rabby, A.K.M.S.A.; Rahman, F. Optimum Deep Learning Method for Document Layout Analysis in Low Resource Languages. In Proceedings of the 2024 ACM Southeast Conference (ACMSE ’24); ACM: New York, NY, USA, 2024; pp. 199–204. [Google Scholar] [CrossRef]
  9. Qiao, M.; Li, L.; Chu, X.; Shang, Z.; Zhang, W.; Luo, Z. Synthetic Dataset and Enhanced YOLOv11 for Robust Financial Document Layout Analysis. In Proceedings of the 2025 International Conference on Artificial Intelligence and Digital Finance (AIDF 2025); Association for Computing Machinery: New York, NY, USA, 2025; pp. 99–104. [Google Scholar] [CrossRef]
  10. Tu, H.-J.; Hsu, J.-L. Enhancing Medical Diagnosis Document Analysis with Layout-Aware Multitask Models. Diagnostics 2025, 15, 3039. [Google Scholar] [CrossRef]
  11. Zhou, C.; Ha, M.; Wu, L. Direction-Aware Lightweight Framework for Traditional Mongolian Document Layout Analysis. Appl. Sci. 2025, 15, 4594. [Google Scholar] [CrossRef]
  12. Wang, T.W. Document Layout Classification and Analysis Using YOLOv8. In Proceedings of the 3rd IEEE International Conference on Image Processing and Computer Applications (ICIPCA 2025); IEEE: Shenyang, China, 2025; pp. 630–635. [Google Scholar] [CrossRef]
  13. Li, D.L.; Lee, S.K.; Liu, Y.T. Printed Document Layout Analysis and Optical Character Recognition System Based on Deep Learning. Sci. Rep. 2025, 15, 23761. [Google Scholar] [CrossRef]
  14. Da, C.; Luo, C.; Zheng, Q.; Yao, C. Vision Grid Transformer for Document Layout Analysis. In Proceedings of the IEEE/CVF International Conference on Computer Vision (ICCV 2023); IEEE: New York, NY, USA, 2023. [Google Scholar] [CrossRef]
  15. Binmakhashen, G.M.; Mahmoud, S.A. Document Layout Analysis: A Comprehensive Survey. ACM Comput. Surv. 2020, 52, 109. [Google Scholar] [CrossRef]
  16. Ke, W.; Zheng, Y.; Li, Y.; Xu, H.; Nie, D.; Wang, P.; He, Y. Large Language Models in Document Intelligence: A Comprehensive Survey, Recent Advances, Challenges, and Future Trends. ACM Trans. Inf. Syst. 2026, 44, 18. [Google Scholar] [CrossRef]
  17. Yes, E. Comparative Semantic Document Layout Analysis for Enhanced Document Image Retrieval. IEEE Access 2024, 12, 150451–150467. [Google Scholar] [CrossRef]
  18. Pronina, O.; Piatykop, O.; Levytska, T.; Fedosova, I. Research on the Use of the Convolutional Neural Network for Speech Impairment Detection. In Digitalisation and Digital Transformation; Communications in Computer and Information Science; Springer: Cham, Switzerland, 2026; Volume 2647. [Google Scholar] [CrossRef]
  19. Rahal, R.; Habash, I.; Slimani, I.; Kessentini, Y.; Alimi, A.M. Historical Document Image Analysis Using Controlled Data for Pre-Training Neural Networks. Int. J. Doc. Anal. Recognit. 2023, 26, 241–254. [Google Scholar] [CrossRef]
  20. De Nardin, A.; Zottin, S.; Piciarelli, C.; Foresti, G.L.; Colombi, E. In-Domain versus Out-of-Domain Transfer Learning for Document Segmentation in the Wild. Int. J. Doc. Anal. Recognit. 2024, 28, 161–175. [Google Scholar] [CrossRef]
  21. Júnior, E.S.d.S.; Paixão, T.; Alvarez, A.B. Comparative Performance of YOLOv8, YOLOv9, YOLOv10, and YOLOv11 for Layout Analysis of Historical Document Images. Appl. Sci. 2025, 15, 3164. [Google Scholar] [CrossRef]
  22. Krichen, M. Convolutional Neural Networks: A Survey. Computers 2023, 12, 151. [Google Scholar] [CrossRef]
  23. Pronina, O.; Piatykop, O. Recognition of Violations of Individual Labor Protection Rules Using a Convolutional Neural Network. In Proceedings of the International Scientific and Technical Conference on Computer Sciences and Information Technologies (CSIT 2022); IEEE: New York, NY, USA, 2022; pp. 69–72. [Google Scholar] [CrossRef]
  24. Mukovoz, V.; Vakaliuk, T.; Semerikov, S. Road Sign Recognition Using Convolutional Neural Networks. In Information Technology for Education, Science, and Technics; Lecture Notes on Data Engineering and Communications Technologies; Springer: Cham, Switzerland, 2024; Volume 222. [Google Scholar] [CrossRef]
  25. Pronina, O.; Levytska, T.; Fedosova, I.; Piatykop, O. Analysis of X-Ray Images of the Lungs Using a Neural Network. In New Technologies, Development and Application IV; Lecture Notes in Networks and Systems; Springer: Cham, Switzerland, 2021; Volume 233. [Google Scholar] [CrossRef]
  26. Hou, L.; Pan, Z.; Li, Y.; Zhang, X.; Zheng, X.; Wang, Y. An Efficient Deep Learning Approach for Document Layout Extraction and Semantic Recognition. Math. Probl. Eng. 2024, 2024, 2797320. [Google Scholar] [CrossRef]
  27. Bharati, P.; Pramanik, A. Deep Learning Techniques—R-CNN to Mask R-CNN: A Survey. In Computational Intelligence in Pattern Recognition; Advances in Intelligent Systems and Computing; Das, A., Nayak, J., Naik, B., Pati, S., Pelusi, D., Eds.; Springer: Singapore, 2020; Volume 999, pp. 657–668. [Google Scholar] [CrossRef]
  28. Droby, A.; Kurar Barakat, B.; Alaasam, R.; Madi, B.; Rabaev, I.; El-Sana, J. Text Line Extraction in Historical Documents Using Mask R-CNN. Signals 2022, 3, 535–549. [Google Scholar] [CrossRef]
  29. Aljiffry, L.; Al-Barhamtoshy, H.; Abukhodair, F.; Jamal, A. Arabic Historical Documents Layout Analysis Using Mask R-CNN. Procedia Comput. Sci. 2024, 244, 453–460. [Google Scholar] [CrossRef]
  30. Yeerjiang, A.; Wang, Z.; Huang, X.; Zhang, J.; Chen, Q.; Qin, Y.; He, J. YOLOv1 to YOLOv10: A Comprehensive Review of YOLO Variants and Their Application in Medical Image Detection. J. Artif. Intell. Pract. 2024, 7, 112–122. [Google Scholar] [CrossRef]
  31. Carta, S.; Giuliani, A.; Piano, L.; Tiddia, S.G. An End-to-End OCR-Free Solution for Identity Document Information Extraction. Procedia Comput. Sci. 2024, 246, 453–462. [Google Scholar] [CrossRef]
  32. Kumar, A.; Lehal, G.S. Faster CNN-Based Layout Analysis of Punjabi Newspapers Using the Custom Dataset. In Human-Centric Smart Computing; Springer: Singapore, 2024; Volume 376, pp. 117–127. [Google Scholar] [CrossRef]
  33. Kim, G.; Hong, T.; Yim, M.; Nam, J.; Park, J.; Yim, J.; Hwang, W.; Yun, S.; Han, D.; Park, S. OCR-Free Document Understanding Transformer. In Computer Vision—ECCV 2022; Lecture Notes in Computer Science; Springer: Cham, Switzerland, 2022; Volume 13688. [Google Scholar] [CrossRef]
  34. Li, J.; Xu, Y.; Lv, T.; Cui, L.; Zhang, C.; Wei, F. DiT: Self-Supervised Pre-Training for Document Image Transformer. In Proceedings of the 30th ACM International Conference on Multimedia (MM ’22); Association for Computing Machinery: New York, NY, USA, 2022; pp. 3530–3539. [Google Scholar] [CrossRef]
  35. Huang, Y.; Lv, T.; Cui, L.; Lu, Y.; Wei, F. LayoutLMv3: Pre-Training for Document AI with Unified Text and Image Masking. In Proceedings of the ACM International Conference on Multimedia; Association for Computing Machinery: New York, NY, USA, 2022; pp. 4083–4091. [Google Scholar] [CrossRef]
  36. Wang, J.; Hu, K.; Huo, Q. DLAFormer: An End-to-End Transformer for Document Layout Analysis. In Lecture Notes in Computer Science; Springer: Cham, Switzerland, 2024. [Google Scholar] [CrossRef]
  37. Li, S.; Ma, X.; Pan, S.; Hu, J.; Shi, L.; Wang, Q. VTLayout: Fusion of Visual and Text Features for Document Layout Analysis. In Trends in Artificial Intelligence; PRICAI 2021; Pham, D.N., Theeramunkong, T., Governatori, G., Liu, F., Eds.; Lecture Notes in Computer Science; Springer: Cham, Switzerland, 2021; Volume 13031, pp. 308–322. [Google Scholar] [CrossRef]
  38. Xu, Y.; Li, M.; Cui, L.; Huang, S.; Wei, F.; Zhou, M. LayoutLM: Pre-Training of Text and Layout for Document Image Understanding. In Proceedings of the 26th ACM SIGKDD International Conference on Knowledge Discovery & Data Mining (KDD ’20); ACM: New York, NY, USA, 2020; pp. 1192–1200. [Google Scholar] [CrossRef]
  39. Nguyen, H.G.; Bründl, P.; Franke, J. Synthetic Image Data Generation for Wiring Harness Component Detection Using Machine Learning. Eng. Proc. 2025, 89, 30. [Google Scholar] [CrossRef]
  40. Miletic, M.; Sariyar, M. Challenges of Using Synthetic Data Generation Methods for Tabular Microdata. Appl. Sci. 2024, 14, 5975. [Google Scholar] [CrossRef]
  41. Mumuni, A.; Mumuni, F.; Gerrar, N.K. A Survey of Synthetic Data Augmentation Methods in Machine Vision. Mach. Intell. Res. 2024, 21, 831–869. [Google Scholar] [CrossRef]
  42. Silva, K.; Can, B.; Sarwar, R.; Blain, F.; Mitkov, R. Text Data Augmentation Using Generative Adversarial Networks—A Systematic Review. J. Comput. Appl. Linguist. 2023, 1, 6–38. [Google Scholar] [CrossRef]
  43. Qi, H.; Meng, X.; Du, Z. YOLO-DLA: A YOLO-Based Unified Framework for Multi-Scale Document Layout Analysis. Expert Syst. Appl. 2026, 299, 129981. [Google Scholar] [CrossRef]
  44. Deng, Q.; Ibrayim, M.; Hamdulla, A.; Zhang, C. The YOLO Model That Still Excels in Document Layout Analysis. Signal Image Video Process. 2024, 18, 1539–1548. [Google Scholar] [CrossRef]
  45. Xu, K.; Xiao, L.; Shi, C.; Zhang, Y. YOLOv8’s Layout Analysis Algorithm Integrates Multiscale Features. In Proceedings of SPIE 13521, International Conference on Computer Vision and Image Processing (CVIP 2024); SPIE: Bellingham, WA, USA, 2025; p. 1352103. [Google Scholar] [CrossRef]
  46. Ultralytics. YOLO11: State-of-the-Art Object Detection Model. GitHub Repository. Available online: https://github.com/ultralytics/ultralytics (accessed on 11 December 2025).
  47. Li, M.; Xu, Y.; Cui, L.; Huang, S.; Wei, F.; Li, Z.; Zhou, M. DocBank: A Benchmark Dataset for Document Layout Analysis. arXiv 2020, arXiv:2006.01038. [Google Scholar] [CrossRef]
  48. Wang, B.; Xu, C.; Zhao, X.; Ouyang, L.; Wu, F.; Zhao, Z.; Xu, R.; Liu, K.; Qu, Y.; Shang, F.; et al. MinerU: An Open-Source Solution for Precise Document Content Extraction. arXiv 2024, arXiv:2409.18839. [Google Scholar]
  49. OpenDataLab. PDF-Extract-Kit: A Powerful Open-Source Toolkit Designed to Efficiently Extract High-Quality Content from Complex and Diverse PDF Documents. Available online: https://github.com/opendatalab/PDF-Extract-Kit (accessed on 17 December 2025).
Figure 1. Procedural flowchart of the algorithm for generating synthetic layouts and data sampling strategies.
Applsci 16 03089 g001
Figure 2. Example of dataset pages with naive removal of overly frequent classes.
Applsci 16 03089 g002
Figure 3. Characteristics of the dataset with naive removal of frequent classes: (a) class frequency distribution; (b) density plot of block dimensions. (Colors represent different object classes and are not associated with numerical frequency values).
Applsci 16 03089 g003
Figure 4. Analysis of block distributions in the dataset with naive removal of frequent classes: (a) spatial distribution of bounding box centers; (b) correlation between normalized width and height of blocks. (Colors indicate normalized spatial density of bounding box centers, with intensity levels reflecting the local concentration of elements.)
Applsci 16 03089 g004
Figure 5. Example pages from a dataset generated using constant distribution and small-item extraction strategies. (The colored bounding boxes indicate different object classes, with each color corresponding to a specific layout category. The numbers next to each box denote class identifiers assigned based on the dataset annotation scheme.)
Applsci 16 03089 g005
Figure 6. (a) Frequency distribution of layout classes for the constant-distribution dataset with threshold-based extraction; (b) Density plot of block dimensions for the constant-distribution dataset with threshold-based extraction. (Colors represent different object classes and are not associated with numerical frequency values).
Applsci 16 03089 g006
Figure 7. (a) Spatial distribution of block center coordinates (x, y) for the constant-distribution dataset with threshold-based extraction; (b) Joint distribution of block widths and heights for the constant-distribution dataset with threshold-based extraction. (Colors indicate normalized spatial density of bounding box centers, with intensity levels reflecting the local concentration of elements.)
Applsci 16 03089 g007
Figure 8. Learning curves of (a) precision and (b) recall over training epochs for the constant-distribution dataset with threshold-based extraction. (Blue dots: metric values per training epoch; the dashed line: the smoothed learning trend (moving average) to highlight training dynamics.)
Applsci 16 03089 g008
Figure 9. Learning curves of (a) mAP@50 metric and (b) mAP@50:95 metric over training epochs for the constant-distribution dataset with threshold-based extraction. (Blue dots: metric values per training epoch; the dashed line: the smoothed learning trend (moving average) to highlight training dynamics.)
Applsci 16 03089 g009
Figure 10. Example pages from a dataset generated using median-based distribution and large-item extraction strategies. (The colored bounding boxes indicate different object classes, with each color corresponding to a specific layout category. The numbers next to each box denote class identifiers assigned based on the dataset annotation scheme.)
Applsci 16 03089 g010
Figure 11. (a) Frequency distribution of layout classes for the median-based dataset with shuffled pool extraction; (b) Density plot of block dimensions for the median-based dataset with shuffled pool extraction. (Colors represent different object classes and are not associated with numerical frequency values).
Applsci 16 03089 g011
Figure 12. (a) Spatial distribution of block center coordinates (x, y) for the median-based dataset with shuffled pool extraction; (b) Joint distribution of block widths and heights for the median-based dataset with shuffled pool extraction. (Colors indicate normalized spatial density of bounding box centers, with intensity levels reflecting the local concentration of elements.)
Applsci 16 03089 g012
Figure 13. Learning curves of (a) precision and (b) recall for the median-based dataset with shuffled pool extraction. (Blue dots: metric values per training epoch; the dashed line: the smoothed learning trend (moving average) to highlight training dynamics.)
Applsci 16 03089 g013
Figure 14. Learning curves of (a) mAP@50 and (b) mAP@50:95 for the median-based dataset with shuffled pool extraction. (Blue dots: metric values per training epoch; the dashed line: the smoothed learning trend (moving average) to highlight training dynamics.)
Applsci 16 03089 g014
Figure 15. Visualization of recognized blocks and the corresponding generated Markdown file markup. (The numbers represent the sequence of the detected blocks; the color of the area indicates its corresponding layout class.)
Applsci 16 03089 g015
Table 1. Classification of challenges in Document Layout Analysis.
Problem Group Key Challenges
Data and markup (labeling)Lack of labeled datasets [3,4,9,19,20,39,41]
High cost and significant time required for manual annotation [4,19,34,35,39,41]
Strong dependence of model performance on annotation quality [4,16,19,20,33,34,35]
Limitations of standard augmentation techniques [9,19,39,41,42]
Slow convergence when training on small datasets [4,8,16,19,20,34,35]
Computational complexity and model efficiencyHigh computing power requirements for heavy architectures [11,12,14,33,35,36,44]
Necessity for optimization and development of lightweight architectures [7,11,12,43,45]
Structural limitations of modelsLow structural variability in existing training layouts [7,14,17,26,36,43]
Typical patterns of “central concentration” of blocks leading to spatial bias [7,14,36,43]
Difficulty in adapting models to new document types [2,8,10,11,13,19,20,29,32]
Table 2. Constructs, previous research and its limitations, and contributions of the present study.
ConstructsPrevious ResearchLimitationsContributions
Recognition architecturesYOLO and modifications [7,8,9,12,21,30,44,45,46,47]
CNN/R-CNN/Mask R-CNN [1,17,22,23,24,27,28,29,32]
Transformer architectures [14,33,34,35,36]
OCR-Free/End-to-End [13,31]
Complex DL models (DLA) [4,6,11,26,37]
Heavy models require significant computing power; difficulty adapting to new document typesUsing efficient YOLO11m with input data optimization to achieve mAP 0.85–0.90
Training data preparationDatasets and benchmarks [3,39,46]
Controlled/Pre-training [19]
Transfer learning methods [47,48]
Lack of labeled data; high cost and time of manual annotationMathematical model of controlled generation of synthetic layouts
Synthetic model quality“Naive” methods for augmentation and removal of frequent classes [9]
Synthetic data generation [40,43]
Synthetic data problems [41,42]
Low structural variability; typical “central concentration” patterns of blocksA greedy placement algorithm with density control and dynamic median splitting of elements
Practical adaptationLow-Resource Languages [8,11]
Domain Adaptation [20]
Application Systems [2,6,10,13]
LLM Integration [5,16]
Slow convergence of models on small samples of new domainsMinerU Integration: Accelerating Weight Correction for Real Documents via Synthetic Pre-training
Disclaimer/Publisher’s Note: The statements, opinions and data contained in all publications are solely those of the individual author(s) and contributor(s) and not of MDPI and/or the editor(s). MDPI and/or the editor(s) disclaim responsibility for any injury to people or property resulting from any ideas, methods, instructions or products referred to in the content.