Article

Evolution Mechanism and Cyclic Degradation Model of Ultimate Bearing Capacity for Suction Caissons Under Inclined Combined Loading

1
School of Civil Engineering, Southeast University, Nanjing 210096, China
2
Major Scientific and Technological R & D Projects of CCCC, Beijing 100010, China
*
Authors to whom correspondence should be addressed.
Appl. Sci. 2026, 16(6), 3017; https://doi.org/10.3390/app16063017
Submission received: 15 February 2026 / Revised: 15 March 2026 / Accepted: 18 March 2026 / Published: 20 March 2026

Abstract

In the marine environment, the suction caisson foundation (SCF) is often subjected to combined inclined and cyclic loading from wind and waves, which may significantly affect its ultimate bearing capacity. Under combined loading conditions, the evolution of ultimate bearing capacity is influenced by multiple factors, and the corresponding bearing capacity envelopes have become key issues that urgently need to be addressed. In this study, a series of model tests and numerical simulations were conducted considering the effects of load inclination angle, loading position, aspect ratio, soil undrained shear strength, and interface friction coefficient. The results show that under static loading conditions, as the loading depth increases, the load inclination angle corresponding to the maximum bearing capacity decreases from 45° to 0°. As the cyclic load ratio and static load ratio increase, cyclic loading significantly intensifies displacement accumulation and the degradation of ultimate bearing capacity. As the loading depth increases, the failure mechanism transitions from rotation-dominated to translation-dominated behavior. In addition, the ultimate bearing capacity increases monotonically with increasing aspect ratio, interface friction coefficient, and soil undrained shear strength. A normalized V–H bearing capacity envelope was established, which shows good agreement with the experimental and numerical results. By introducing a cyclic bearing capacity degradation coefficient, a modified envelope was proposed to describe the evolution of ultimate bearing capacity under cyclic loading conditions. The bearing capacity evolution patterns and envelope method proposed in this study provide a useful reference for the engineering design of SCF.

1. Introduction

As one of the core pillars of the global clean energy transition, offshore wind power is developing toward more distant seas, larger capacities, and greater scale [1,2,3,4]. Suction caisson foundations have been widely applied in offshore engineering due to their convenient installation, suitability for deep water conditions, and strong compatibility with soft clay seabed [5,6]. In the marine environment, SCF is typically subjected to long-term inclined loading and cyclic loading induced by the combined effects of wind, waves, and ocean currents [7,8,9]. Therefore, design approaches that consider only static bearing capacity are insufficient to fully reflect the actual service conditions of the foundation. At present, the evolution of ultimate bearing capacity under combined loading and the degradation of bearing capacity induced by cyclic loading have become key issues in the safety assessment of SCF.
In recent years, extensive research has been conducted on the ultimate bearing capacity of SCF [10,11]. These studies have examined the effects of factors such as foundation geometry [12], embedment depth, and soil strength on vertical, horizontal, and ultimate bearing capacities [13,14], and various evolution laws and empirical formulas for ultimate bearing capacity have been proposed [15,16,17]. Allersma et al. [18] conducted centrifuge model tests of SCF in Dutch sand and kaolin clay to investigate the influence of soil conditions, horizontal loading points, soil strength, and caisson aspect ratio on the static bearing capacity of the foundation. Supachawarote [19] employed the finite element method to analyze the effects of anchor aspect ratio, loading direction, mooring point location, and soil conditions on the ultimate bearing capacity of the foundation. Rao et al. [20], Luke [21], Mana et al. [22,23], Byrne and Finn [24], Li et al. [25,26], Li et al. [27,28,29,30], Mistri and Singh [31], Ninomiya et al. [32], and Dai et al. [33] conducted numerous model tests to investigate the influence of loading modes, aspect ratio, and drainage conditions on the failure modes of SCF. These studies also conducted valuable analyses of the working behavior and mechanical mechanisms of SCF, including the bearing capacity composition and corresponding calculation methods. In addition, cyclic loading in the marine environment has also attracted considerable research attention. Andersen et al. [34] conducted one static loading test and three cyclic loading field tests in clay with overconsolidation ratios of 3.3 and 7.3. Their results indicated that under cyclic loading, the ultimate bearing capacity of SCF decreased to approximately 66–82% of that under monotonic uplift loading. Iskander et al. [35] carried out model tests on SCF under cyclic loading conditions. The results showed that the cyclic bearing capacity decreased to 78–90% of the monotonic uplift capacity and that the cyclic capacity was related to the number of cycles, loading frequency, and loading direction. Regarding combined loading, several studies have established V–H or V–H–M bearing capacity envelope models to characterize the ultimate state of foundations in multidimensional load space [36,37]. Meanwhile, for cyclic loading in a marine environment, existing studies have shown that the number of cycles, cyclic amplitude, and static load level significantly influence deformation accumulation and bearing capacity degradation of the foundation [38,39,40]. However, most current studies focus on single influencing factors or specific loading paths. From an engineering application perspective, SCF is typically loaded at specific mooring points. Factors such as loading depth, aspect ratio, friction coefficient, and undrained shear strength of the soil can significantly affect the ultimate bearing capacity and failure mode of the foundation [41,42,43]. In addition, studies on envelope expressions for ultimate bearing capacity under cyclic loading remain relatively limited.
This study investigates SCF in soft clay foundation and systematically examines the evolution of bearing capacity characteristics under inclined static and cyclic loading by combining model test results with numerical simulations. The effects of several key factors, including loading inclination, aspect ratio, undrained shear strength of the soil, friction coefficient, and loading position, on the ultimate bearing capacity are comprehensively analyzed. Subsequently, V–H ultimate bearing capacity envelopes are constructed using multiple loading control paths and comparatively validated. Based on normalization, an envelope-fitting formula related to structural parameters is proposed. Furthermore, a cyclic bearing capacity degradation coefficient is introduced to establish a normalized ultimate bearing capacity envelope method under cyclic loading conditions. This study provides a reference for evaluating the bearing capacity of SCF under combined loading conditions.

2. Model Test of Suction Caisson Foundation

2.1. Test Device

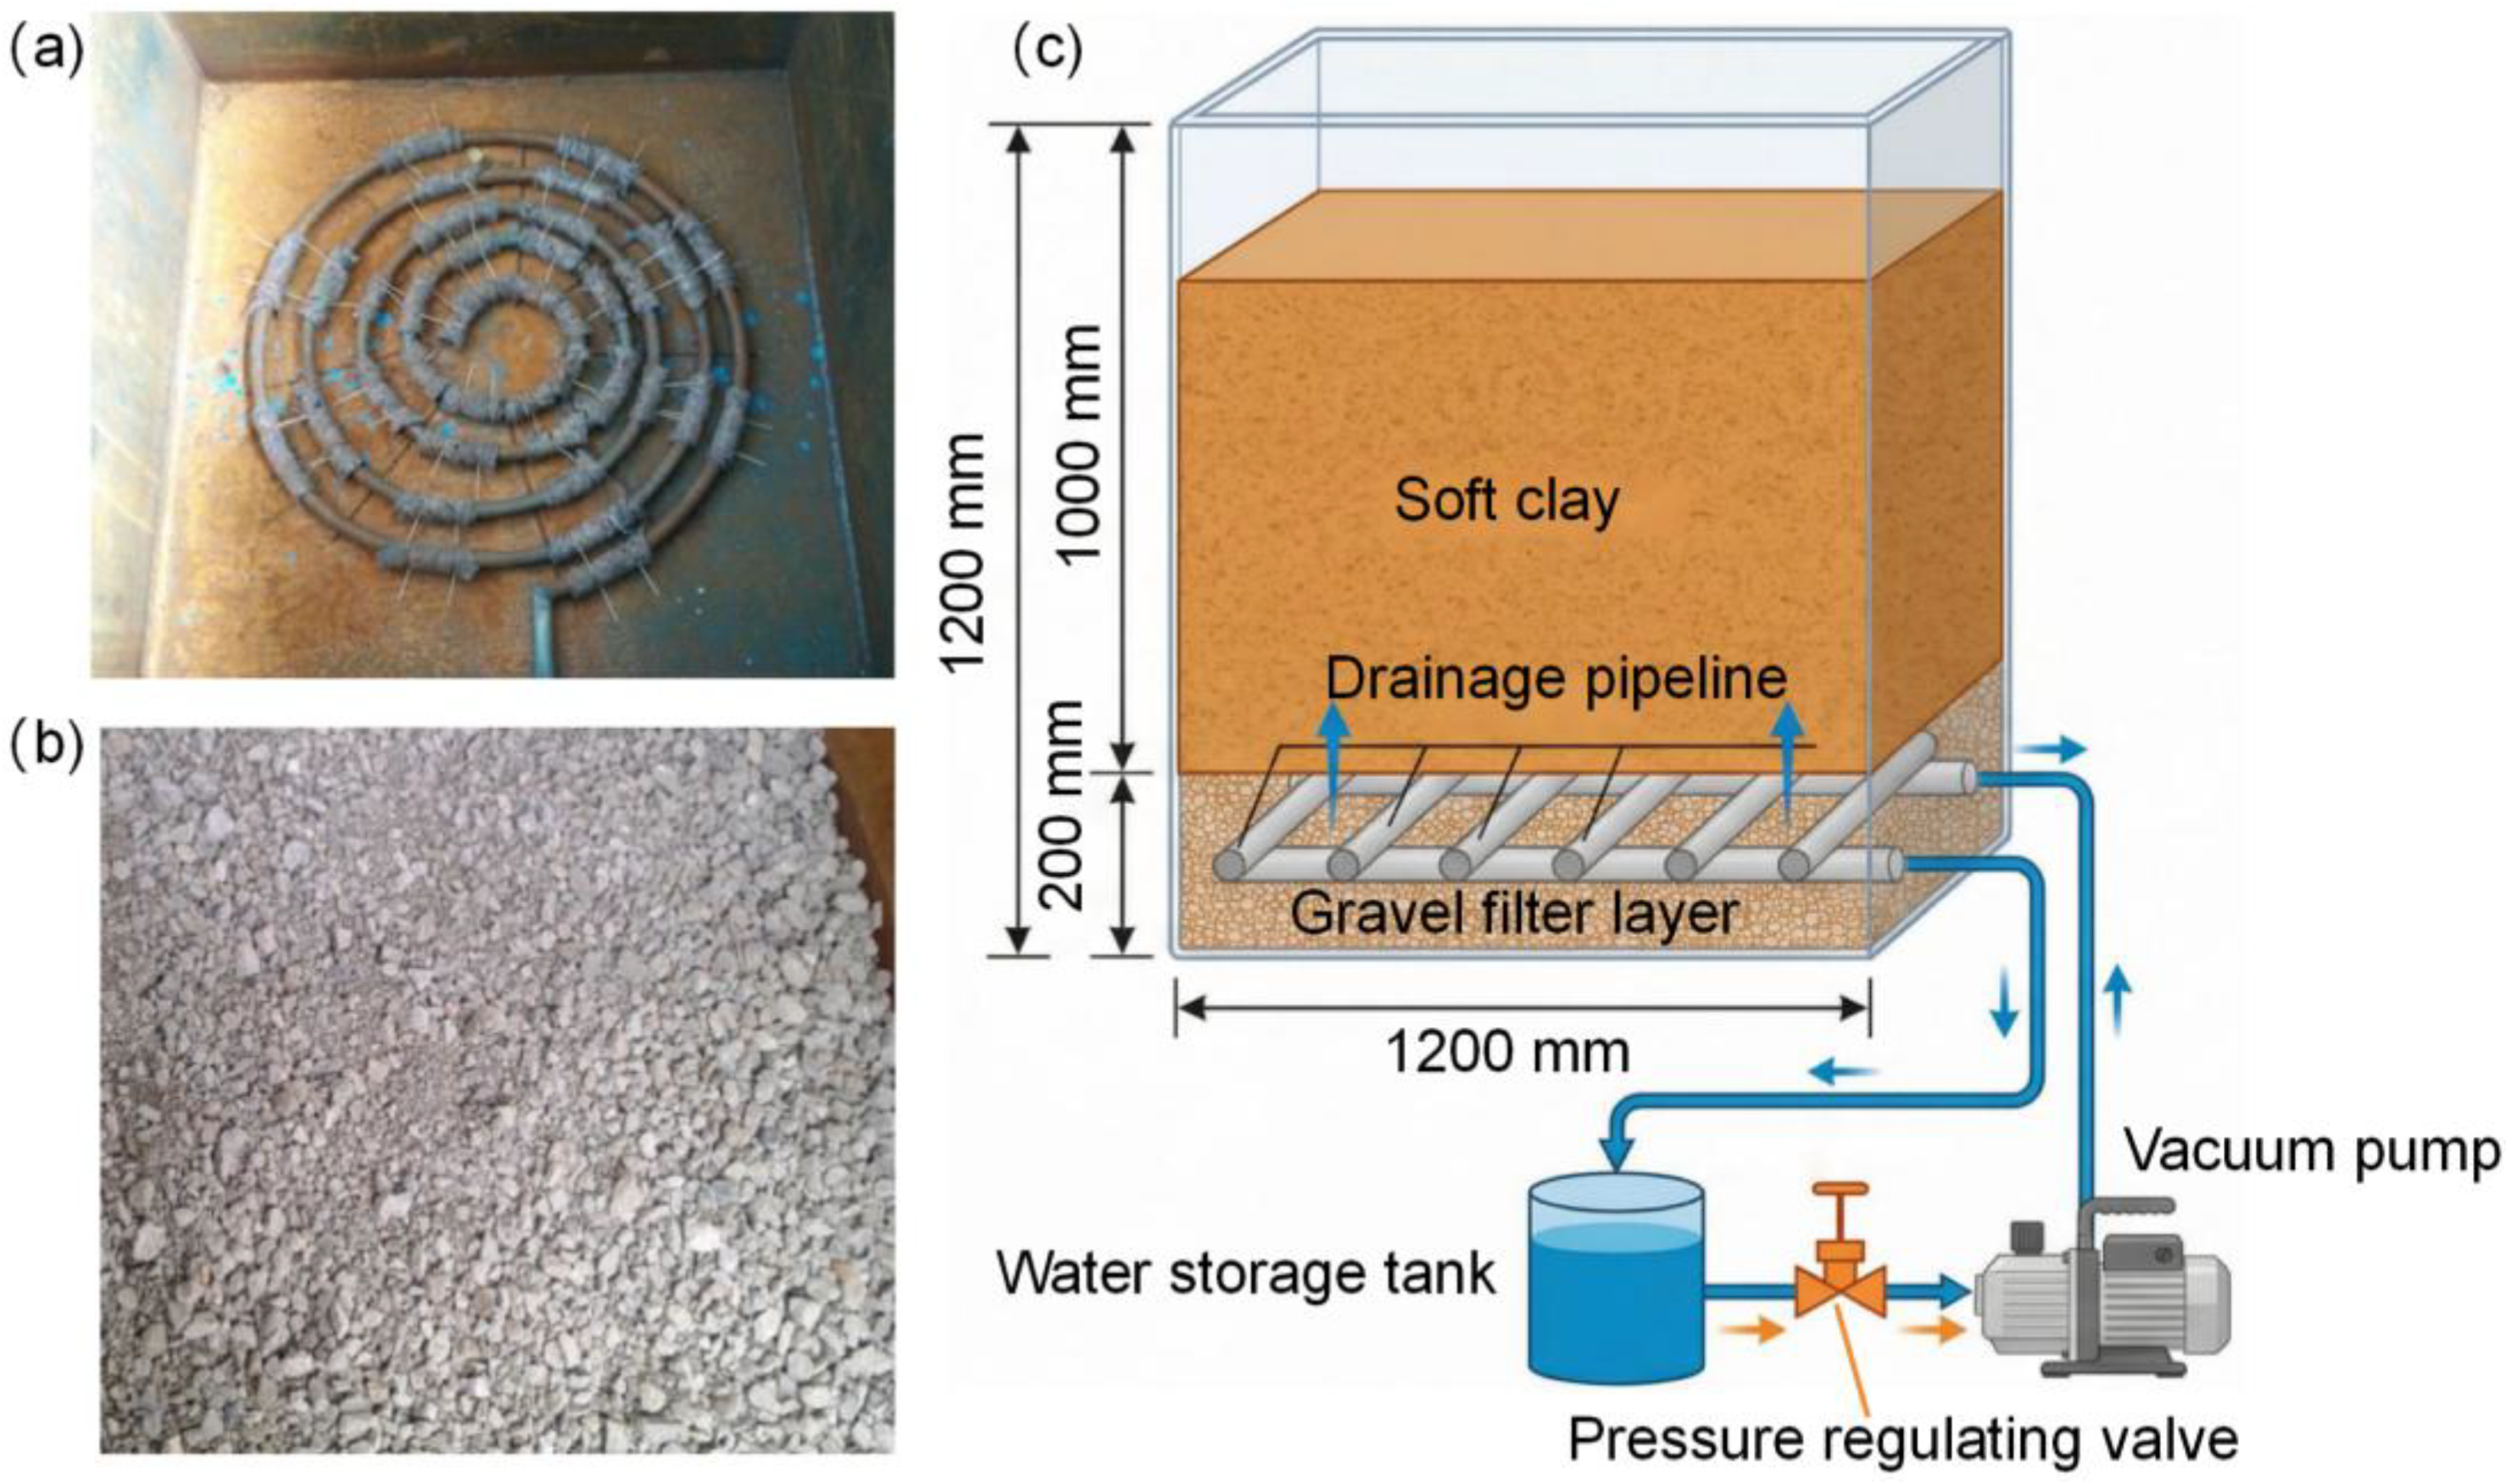
The dimensions of the model test chamber are 1.2 m × 1.2 m × 1.2 m (length × width × height), and a single-sided bottom drainage system is used to ensure uniform soil strength at a given depth. First, a drainage pipe network is installed at the bottom, and 5 mm diameter holes are drilled and wrapped with geotextile to prevent the loss of fine particles (Figure 1a). Subsequently, a 0.5 t crushed stone layer is placed to form a 20 cm thick filter layer (Figure 1b). Finally, geotextile is laid on top of the filter layer, and water is added until saturated. Simultaneously, the drainage valve is connected to a water storage tank and a vacuum pump (Figure 1c).
The SCF model has an aspect ratio of 3.0, with a diameter of 150 mm and a height of 450 mm, and is fabricated from organic glass with a density of 1.18 g/cm3. To investigate the influence of loading position on the inclined bearing behavior, holes are drilled along the sidewall at depths of 0.0, 0.5, 0.75, and 1.0 times the foundation height from the top to serve as mooring points, and 2 mm diameter steel wires are used for load application. It is worth noting that the friction coefficient between SCF and soil significantly influences the ultimate bearing capacity of the foundation. Therefore, vertical pull-out tests are performed using a plate with material, wall thickness, and surface roughness identical to those of the model to determine the interface friction coefficient.
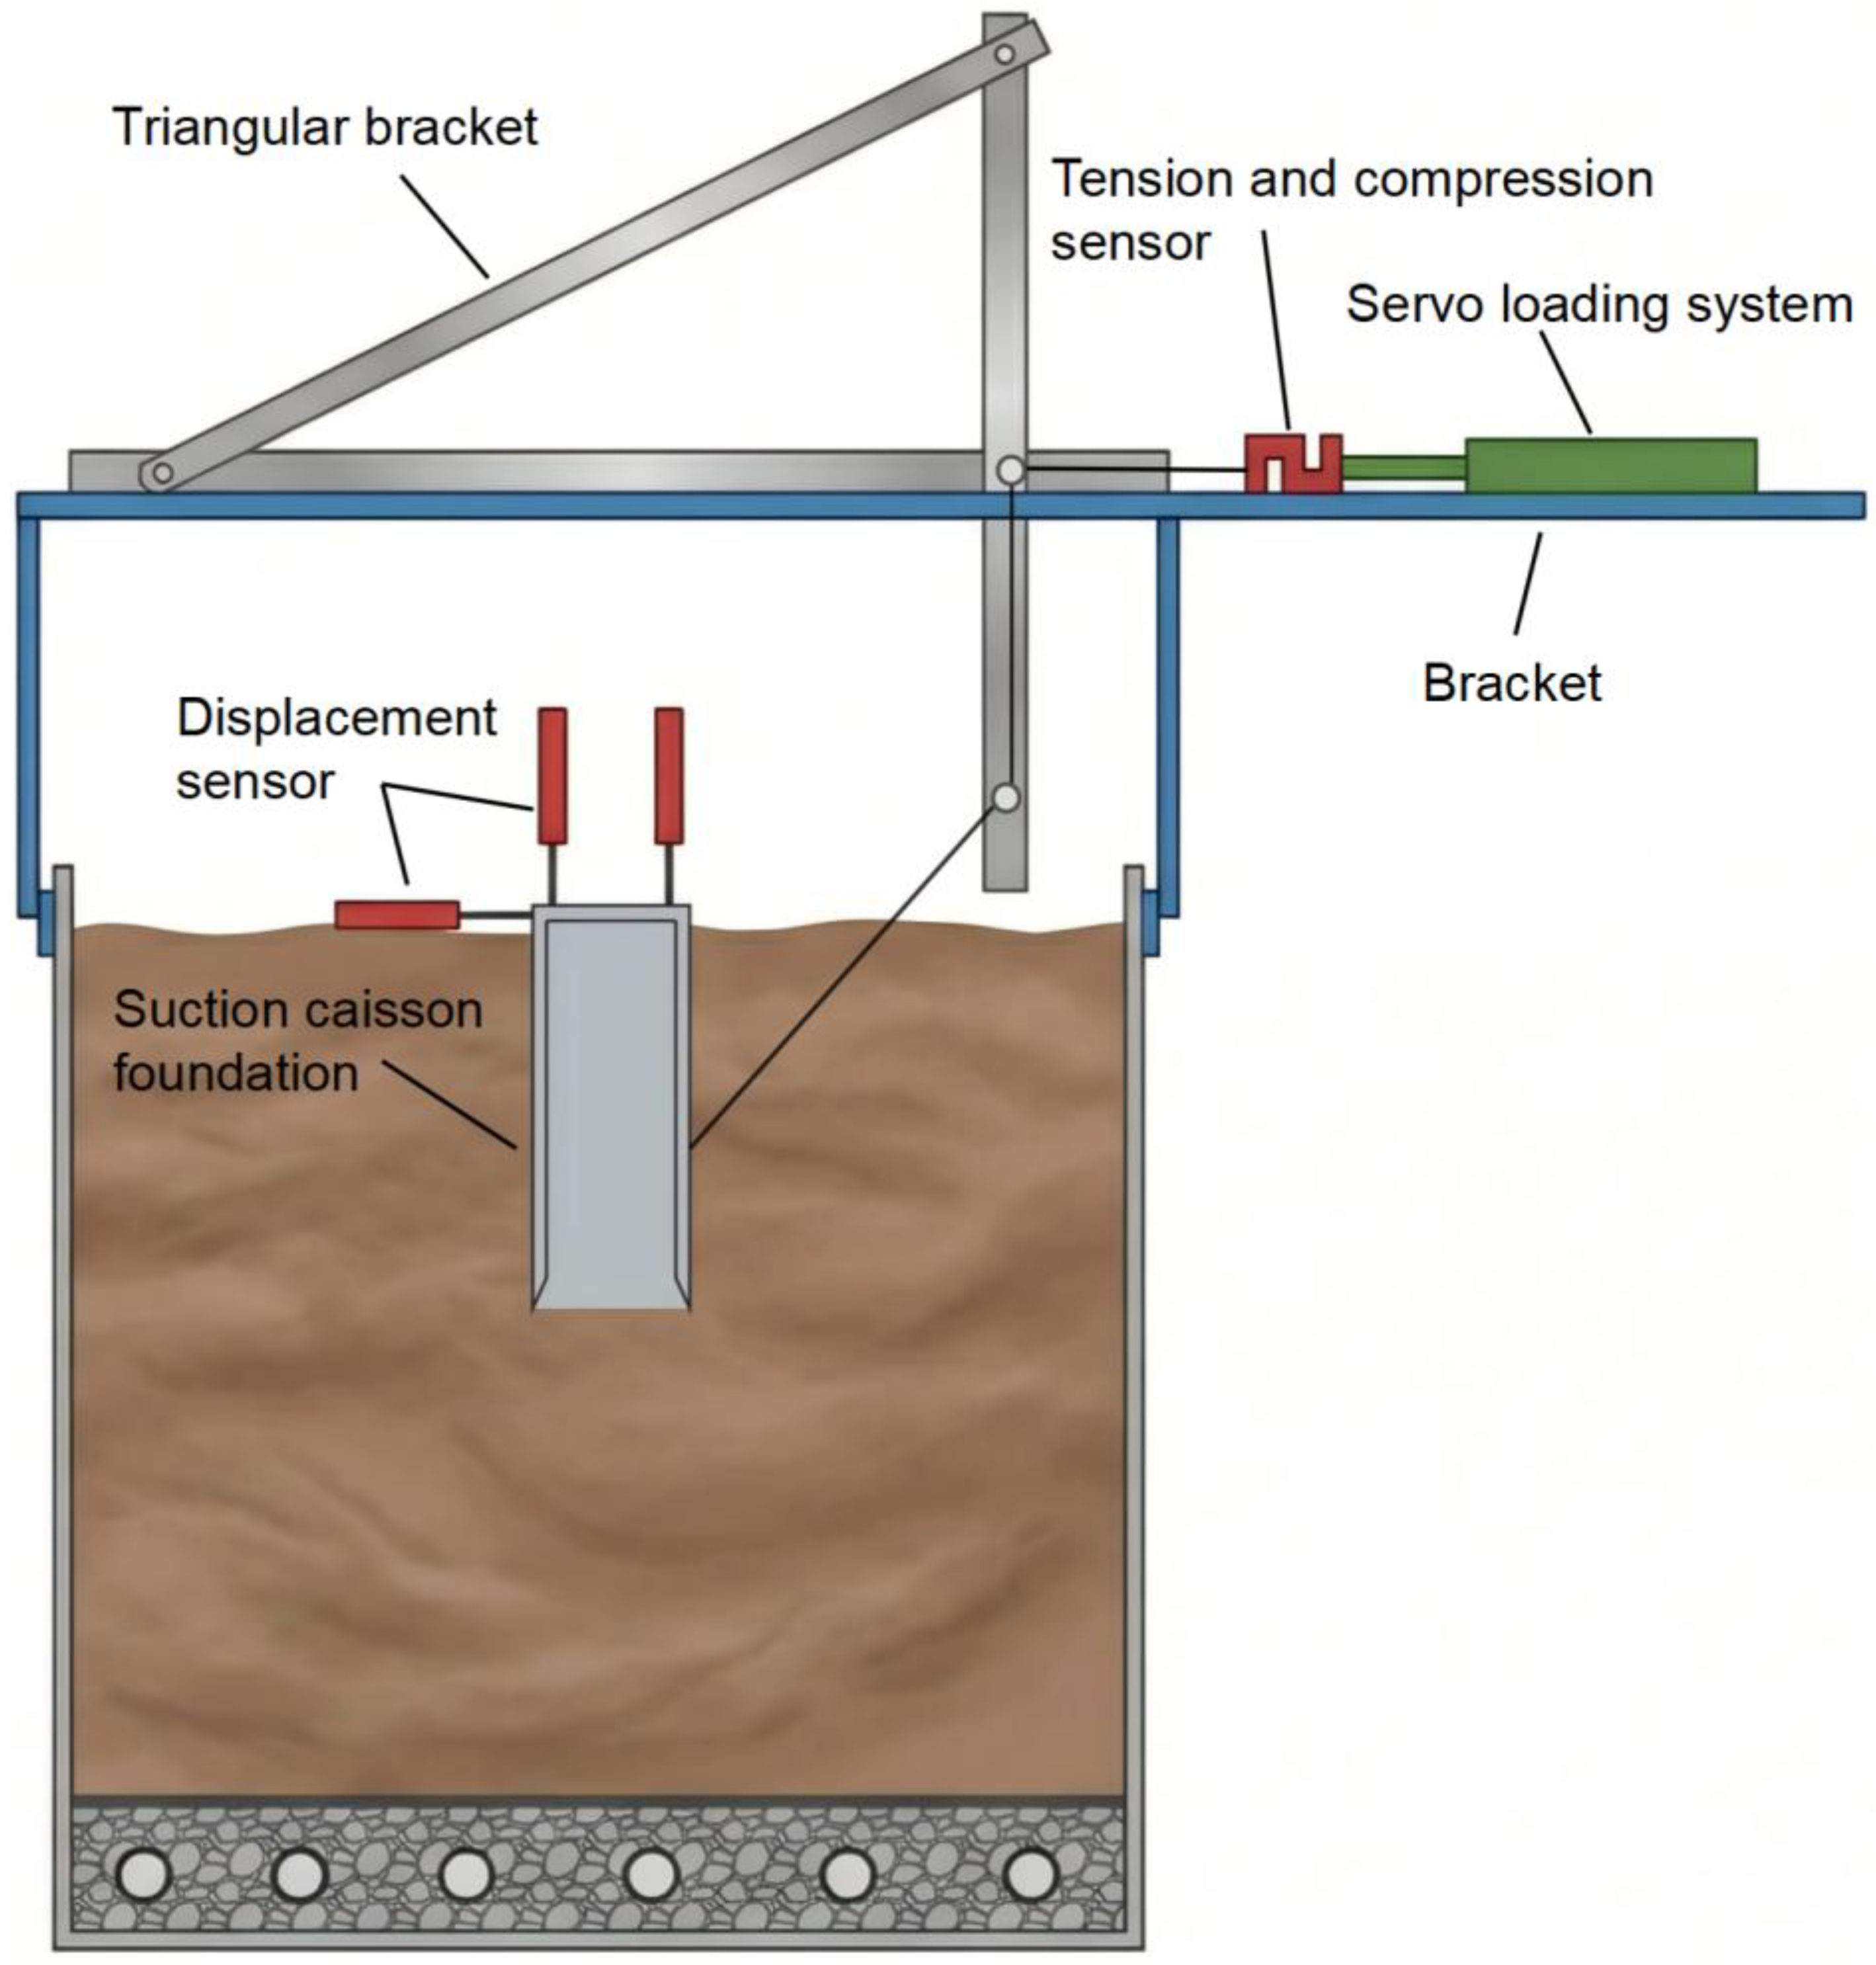
In the model tests, pore water pressure is measured using a BWMK-type pore pressure transducer with a range of −50 to 50 kPa and a resolution of 0.01 kPa. Earth pressure is monitored using a BW-type earth pressure cell with a 28 mm diameter, 6.5 mm thickness, and a maximum capacity of 0.05 MPa. Displacement is measured using a YWC-type strain-based displacement sensor with a 0–150 mm measurement range. Load is measured using a DYLY-103 tension–compression sensor with a capacity range of −1000 to 1000 N. All measuring devices are connected to a DH3826 static and dynamic strain data acquisition system, and the caisson model test setup is illustrated in Figure 2. In addition, the experimental system includes a computer control system and a servo control system.

2.2. Preparation of Soft Clay

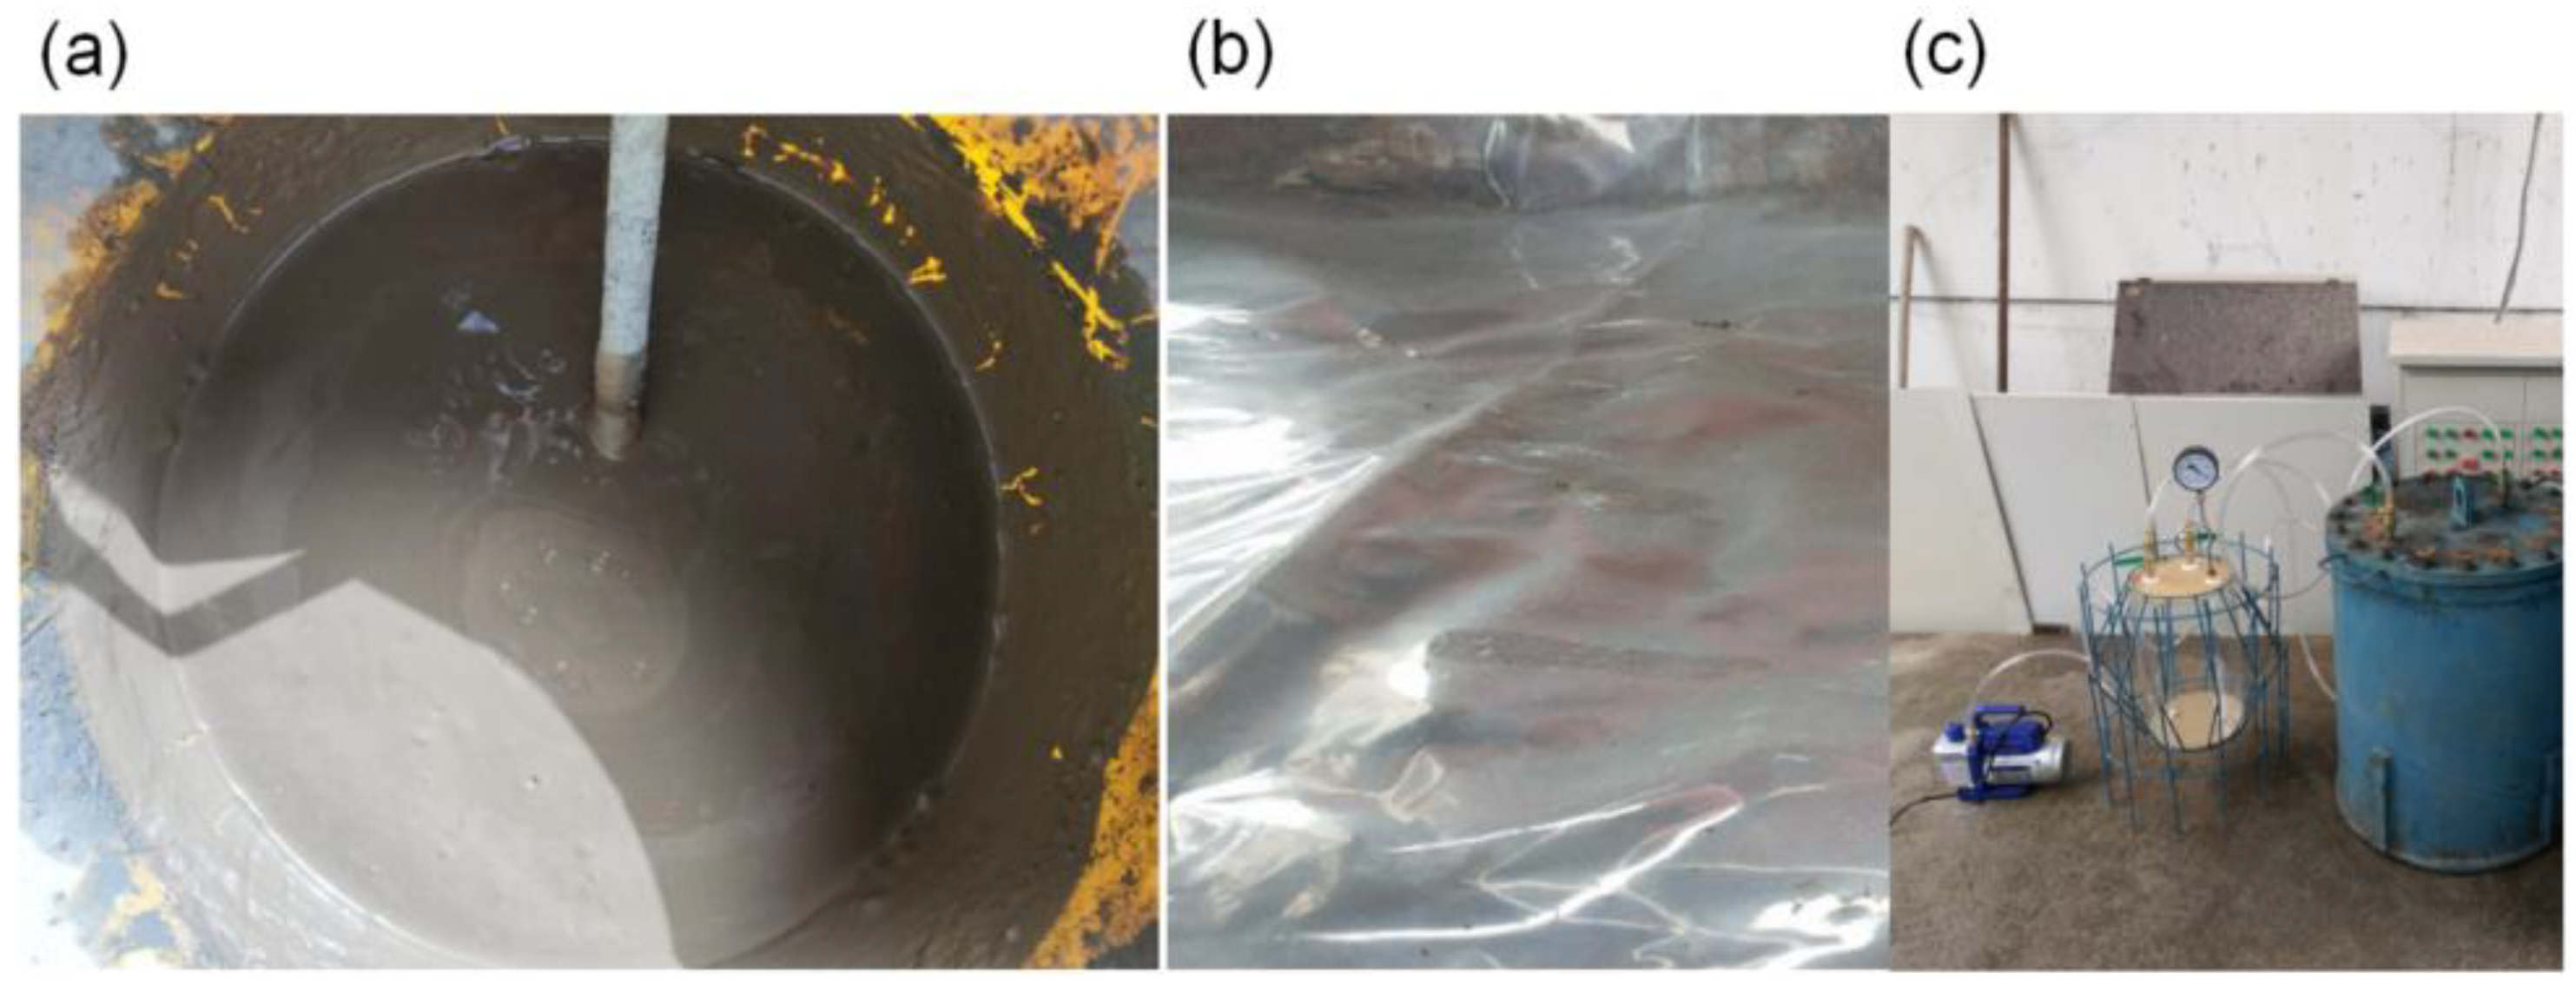
Figure 3 illustrates the preparation process of soft clay, in which a slurry with a moisture content of 50–60% is thoroughly mixed and poured into the model chamber, and the top surface is sealed with geotextile and plastic film. To ensure uniformity of soil properties at the same depth, vacuum preloading is applied for 20 days, followed by surcharge preloading for further treatment. During surcharge preloading, vane shear tests are periodically conducted at multiple locations within the soil until the undrained shear strength at the depth reaches 8–12 kPa [44]. The geotechnical parameters obtained from laboratory tests are listed in Table 1. In the table, w denotes water content, γ represents the unit weight of soil, wL and wP denote the liquid and plastic limits, respectively, and IP is the plasticity index.

2.3. Test Program

2.3.1. Static Loading Test

The primary objective of the static loading tests is to investigate the influence of loading position and loading direction on the inclined bearing behavior of SCF. Considering 20 working conditions, with loading positions located at 0, 0.5, 0.75, and 1.0 times the foundation height from the top along the sidewall, and loading angles relative to the horizontal direction set at 0°, 30°, 45°, 60°, and 90°, the main procedure of the static model tests is as follows:
(1)
Before each test, vane shear tests are conducted within 600 mm below the installation position of SCF to determine the undrained shear strength of the soil at intervals of 10 cm.
(2)
Static model tests are carried out under displacement-controlled loading with a loading rate of 10 mm/h, and the test is terminated when the load tends to stabilize.
(3)
After each test, the soil surface is leveled, and the next test is conducted after resting for 3 days or when more than 95% of the excess pore water pressure has dissipated.

2.3.2. Cyclic Loading Test

The cyclic loading tests are conducted under load-controlled conditions [45] to investigate the effects of the static load ratio, cyclic load ratio, and number of cycles on the inclined cyclic bearing behavior of SCF. The static load ratio Fa/Ff is defined as the ratio of the applied static load Fa to the static ultimate bearing capacity Ff of the foundation prior to the application of cyclic loading [46]. Fa simulates the static load transmitted by the mooring line after installation, while Ff is determined from the static loading tests. The cyclic load ratio Fcyc/Ff is defined as the ratio of the cyclic load amplitude Fcyc to the static ultimate bearing capacity Ff [47]. The SCF is first loaded to the target static load level, after which cyclic loading is applied. The cyclic loading scheme is presented in Table 2. According to the preliminary test, the horizontal ultimate bearing capacity is the largest when the loading position is 0.75 times the foundation height (0.75L). However, under inclined loading with large angles, the embedment depth of the loading point has a relatively minor influence on the ultimate bearing capacity. Therefore, in the cyclic tests, the loading position is set at 0.75L along the foundation sidewall. In addition, to simulate wave loading encountered in engineering, the cyclic loading frequency is set to 0.1 Hz [48].

3. Test Results

3.1. Static Loading Tests

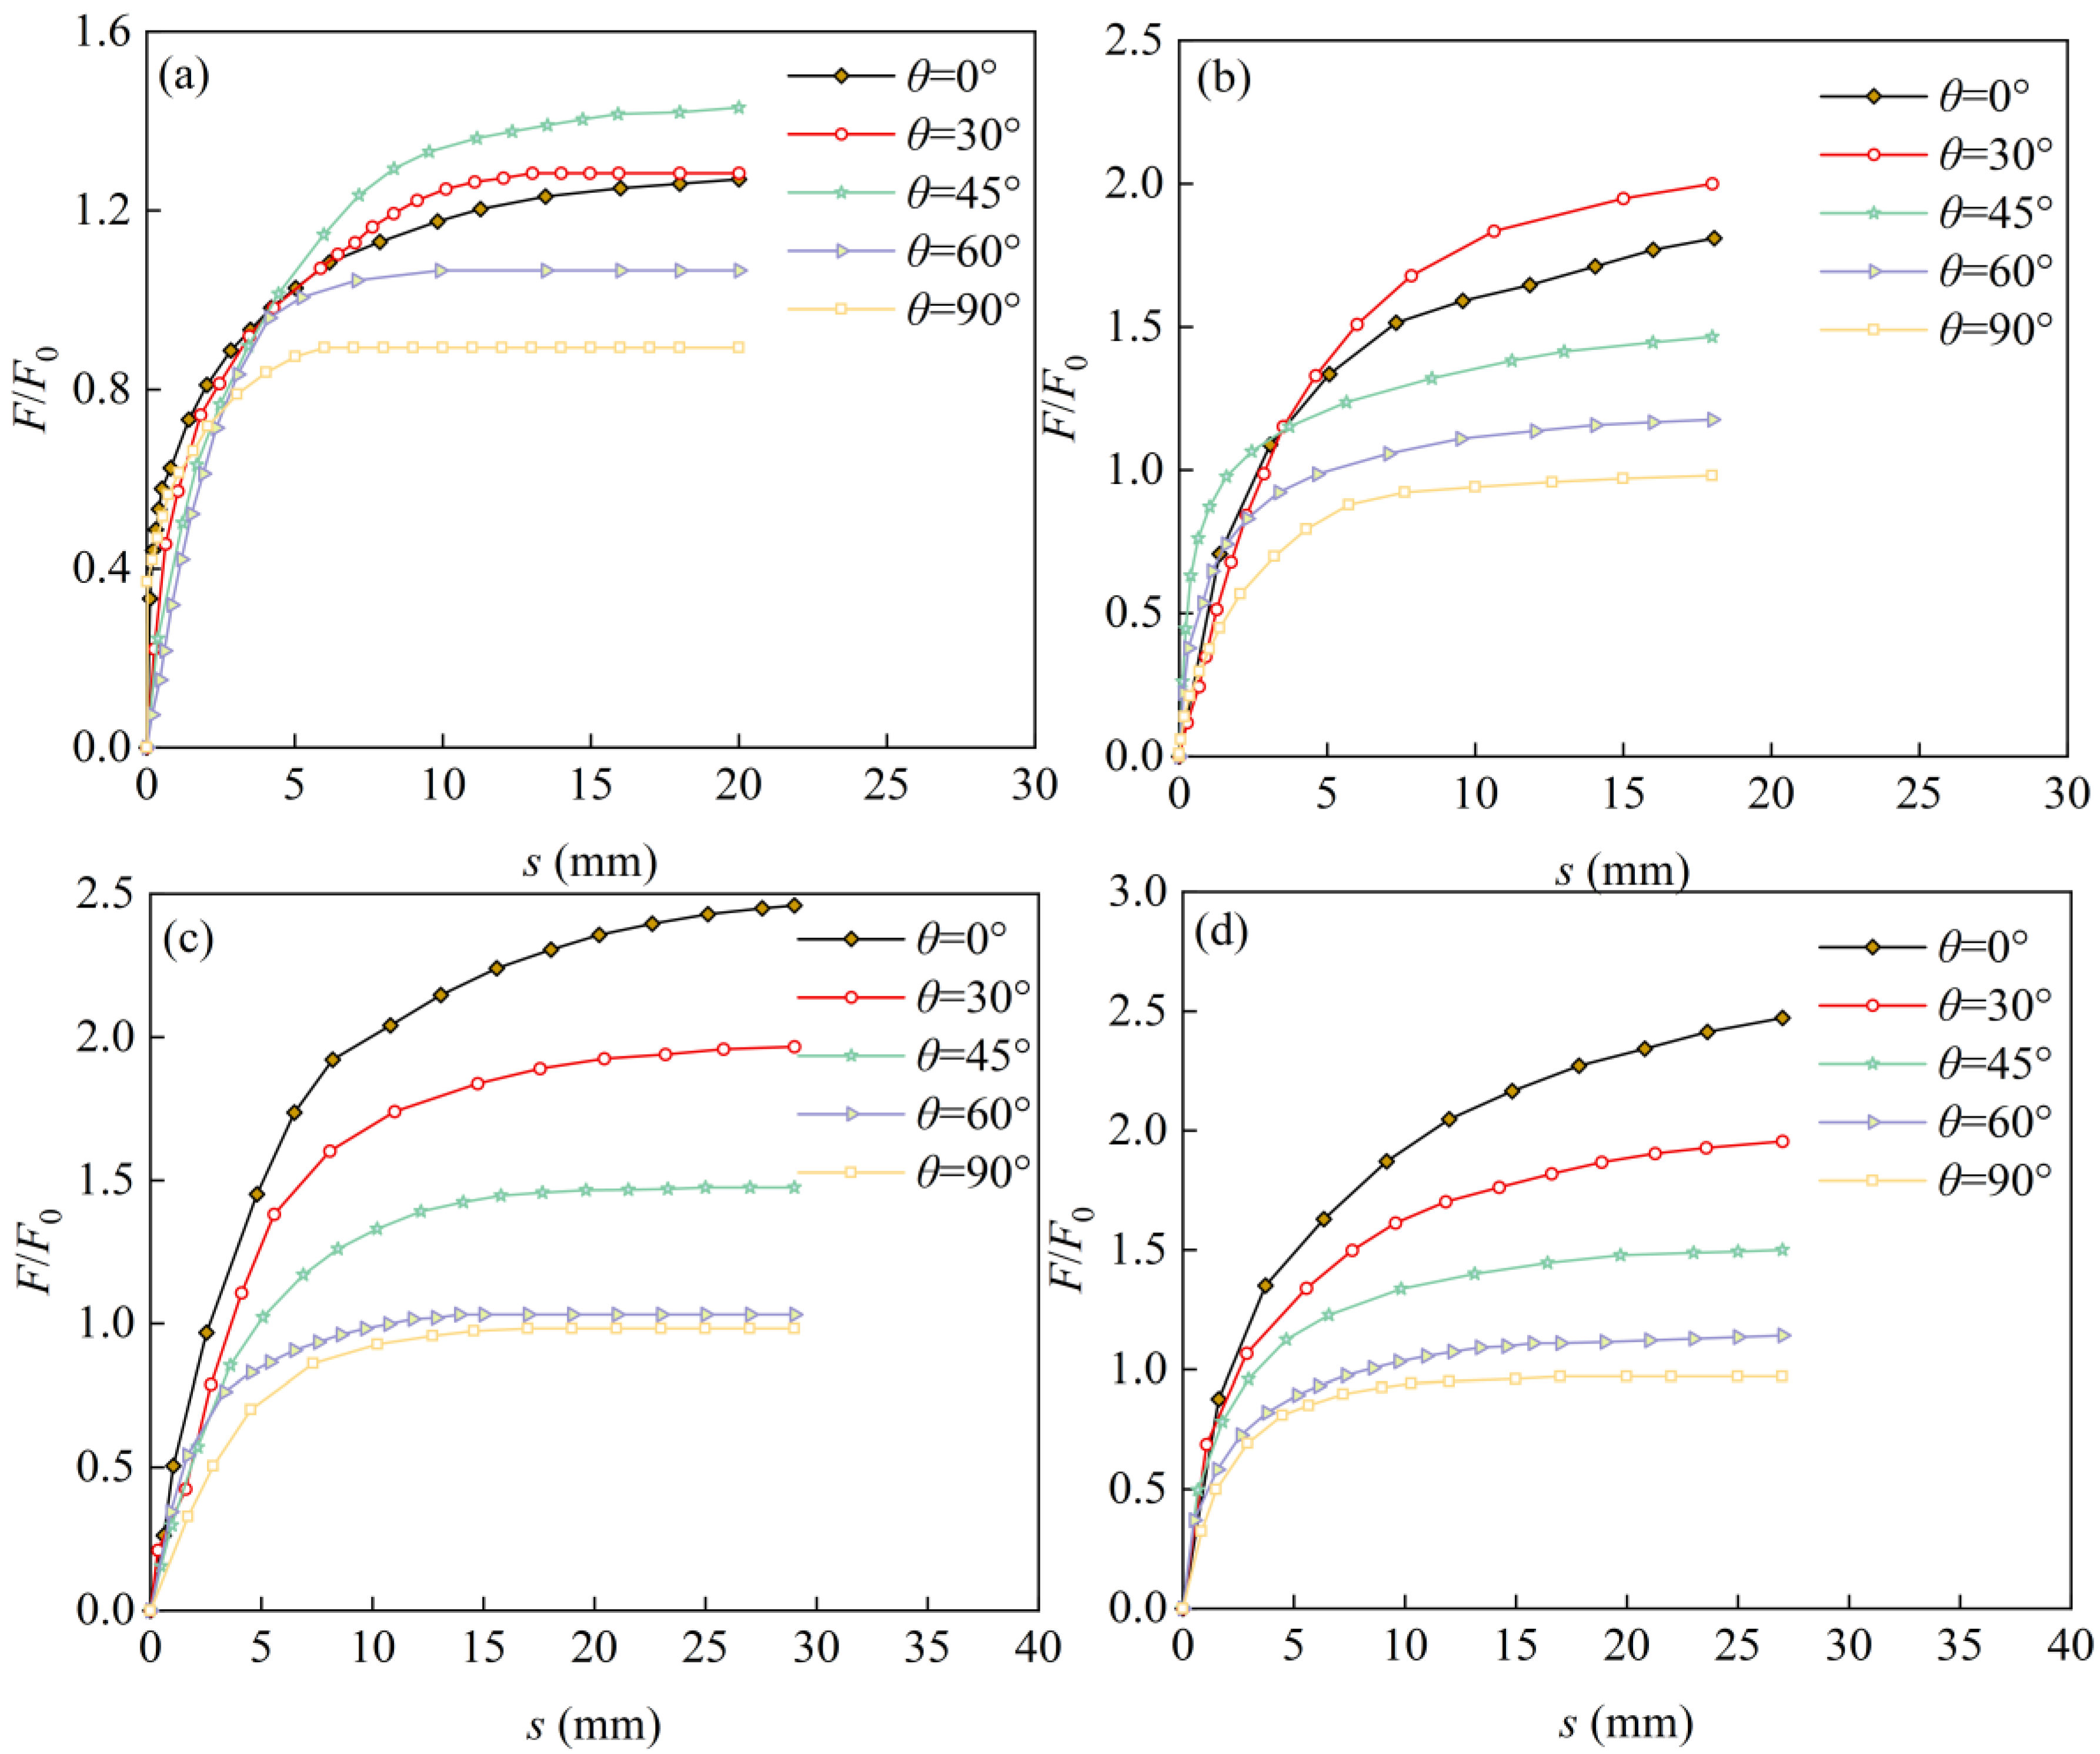
Inclined loads of 0°, 30°, 45°, 60°, and 90° are applied at different embedment depths along the sidewall of SCF. The displacement curves in the mooring direction are presented in Figure 4. The loads are normalized according to the method proposed in [49], with a reference load F0 of 400 N. During the tests, the load corresponding to a displacement of 0.05D, the inflection point, or the onset of displacement instability under a certain load level is defined as the static ultimate bearing capacity. Zp denotes the depth of the loading point measured from the top surface of SCF.
When loading is applied at the top of the foundation sidewall, the ultimate bearing capacity reaches its maximum under a 45° load (Figure 4a). This may be attributed to the eccentric distance between the loading position and the foundation center. A purely vertical load generates an additional counterclockwise moment, whereas a purely horizontal load induces an additional clockwise moment. When vertical and horizontal loads act simultaneously, the additional moments in opposite directions restrain the rotation of the foundation, thereby enhancing its bearing capacity. As shown in Figure 4b–d, when loading is applied at embedment depths of 0.5L, 0.75L, and 1.0L along the sidewall, the bearing capacity decreases with increasing load inclination angle. The bearing capacity is the largest at a loading angle of 0° and the smallest at 90°.
The bearing capacities of the suction caisson foundation under different load combinations are summarized in Table 3. Under a 0° load, the bearing capacity is the smallest at ZP/L = 0, where rotational failure occurs, and the surrounding soil provides relatively low resistance. The maximum bearing capacity occurs at ZP/L = 0.75, where the foundation response approaches translational movement and mobilizes greater soil resistance. In this case, the maximum bearing capacity exceeds the minimum value by 78%, indicating that for an anchored foundation subjected to horizontal loading, placing the loading point at the optimal position is reasonable. Under a 30° load, the maximum bearing capacity also occurs at ZP/L = 0.75, exceeding the minimum value by 51%. Under loading angles of 45°, 60°, and 90°, the differences in bearing capacity among various loading positions are relatively small. In these cases, uplift failure predominates, and the influence of loading position on bearing capacity is limited. In practical engineering, to ensure the safety of the superstructure, the mooring point is generally selected at the location corresponding to the maximum bearing capacity.

3.2. Cyclic Loading Tests

3.2.1. Displacement Under 0° Loading Inclination Angle

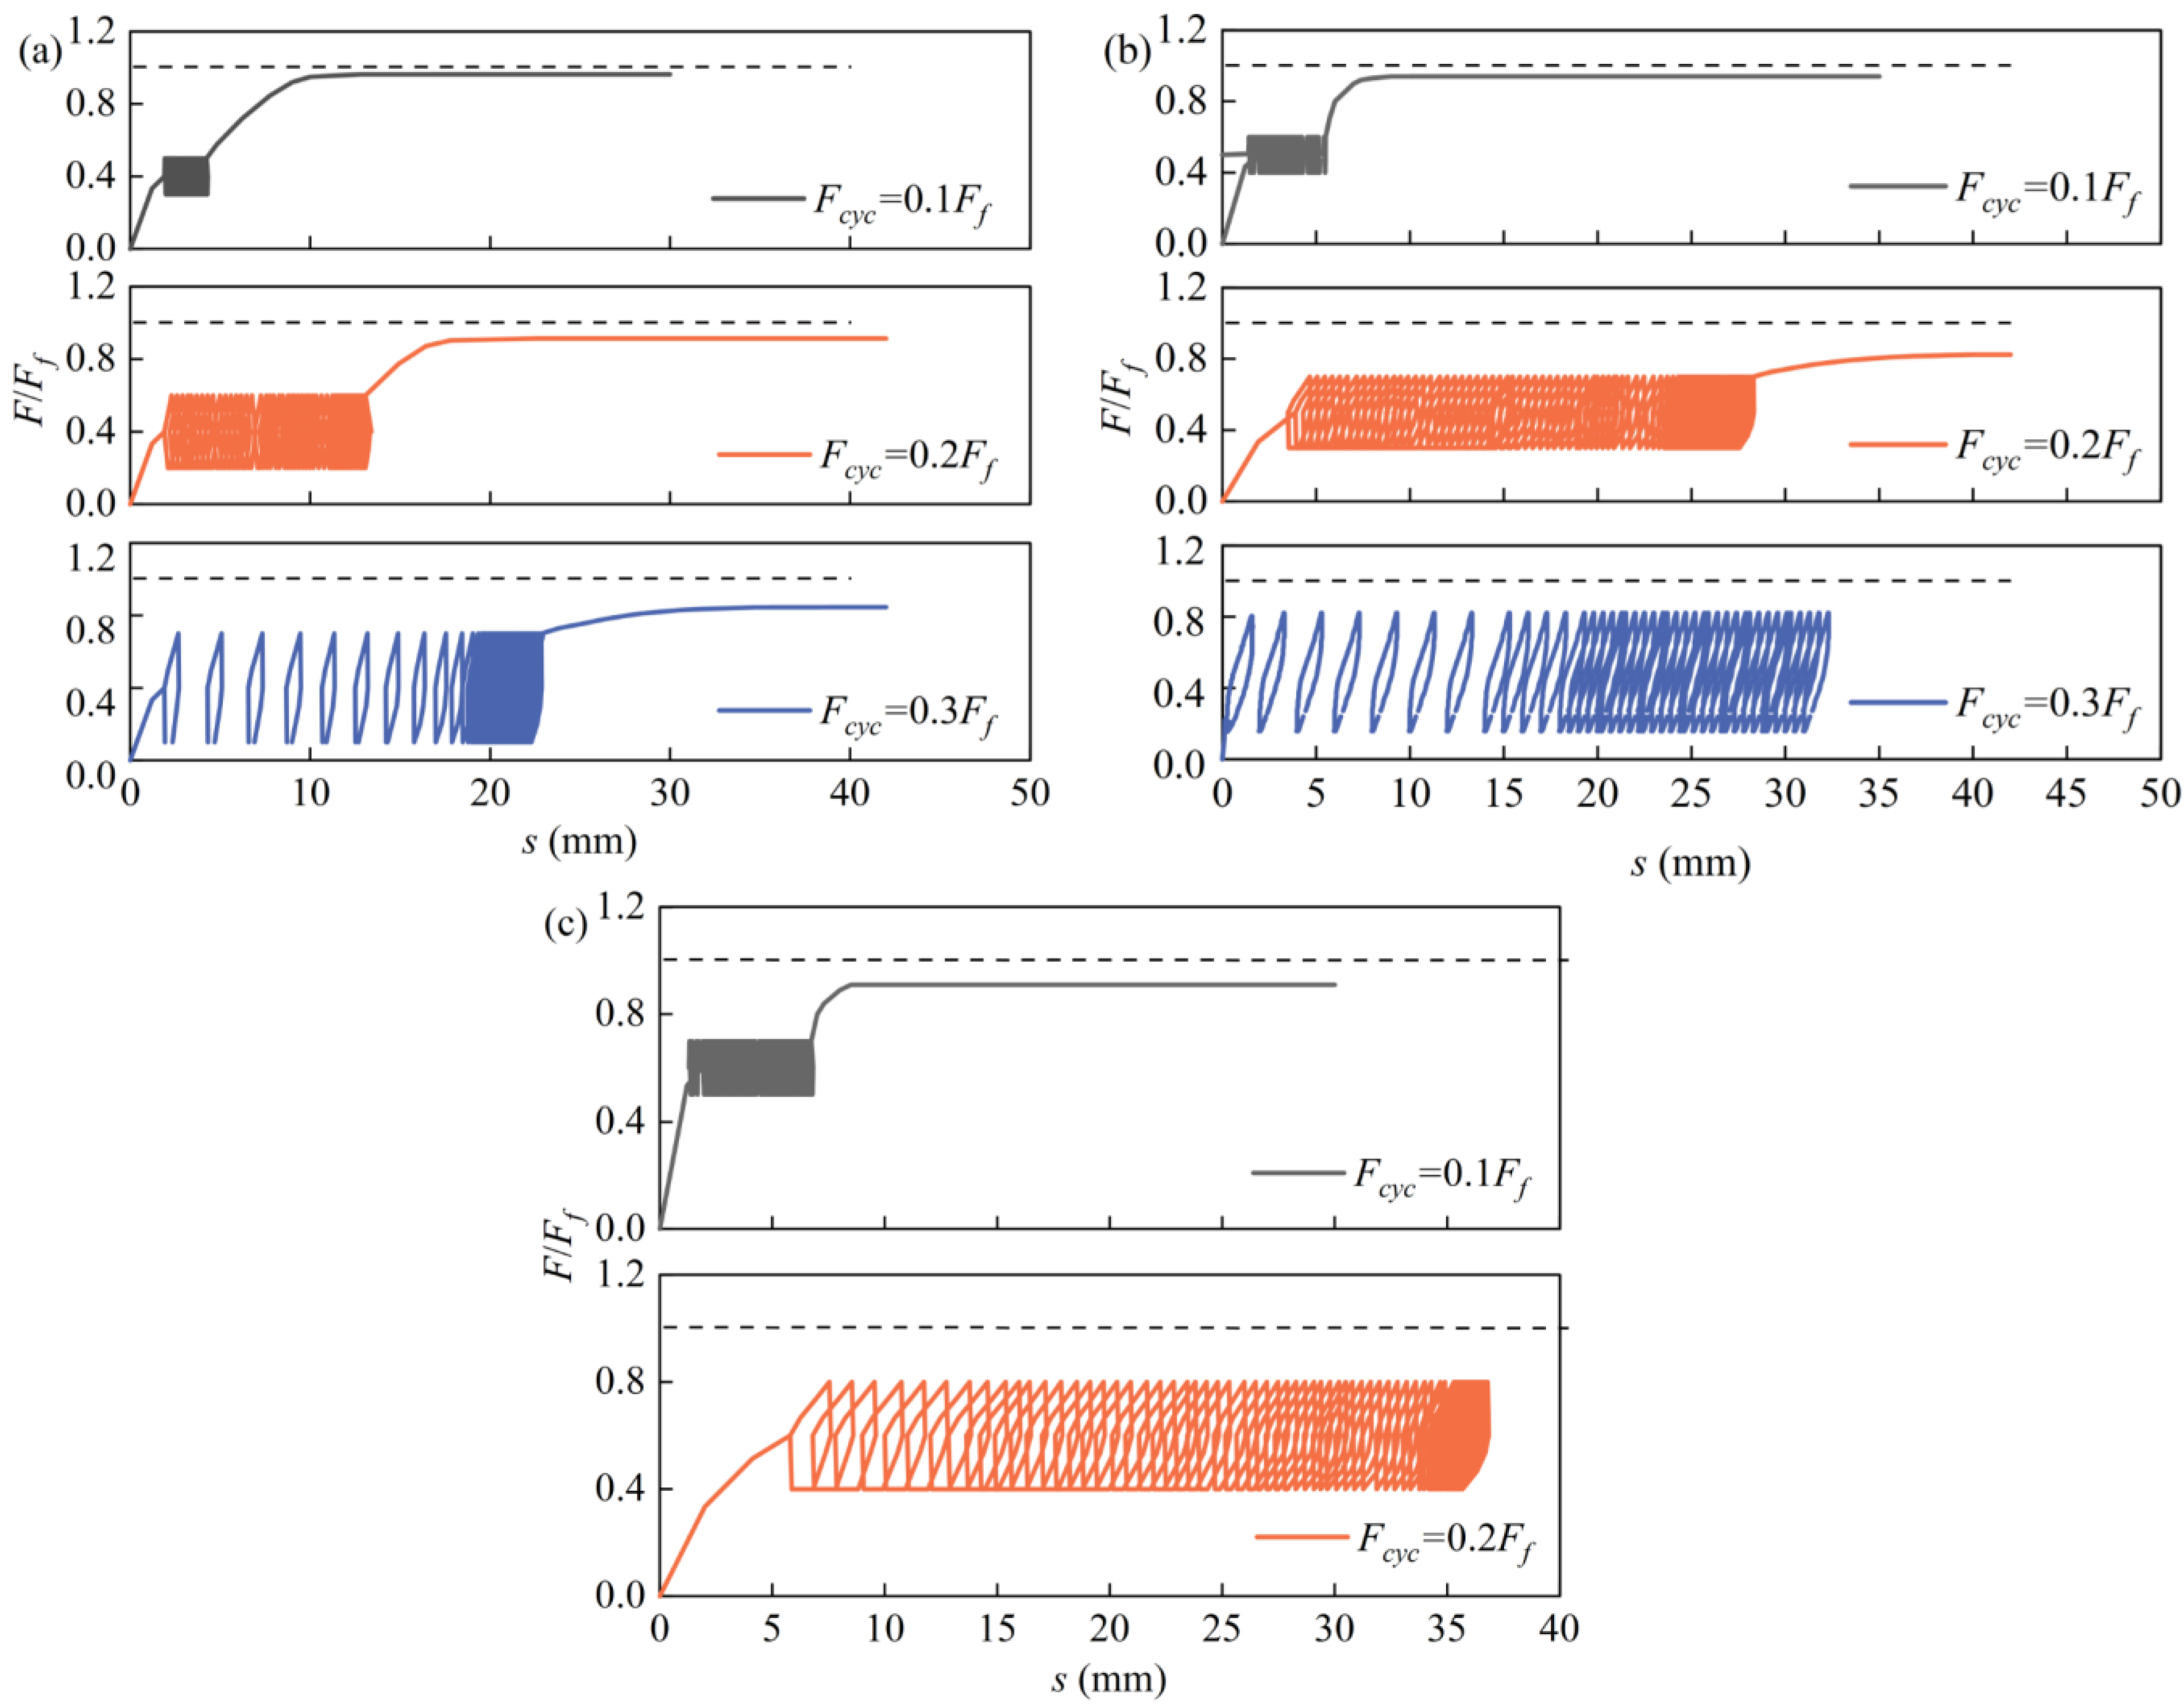
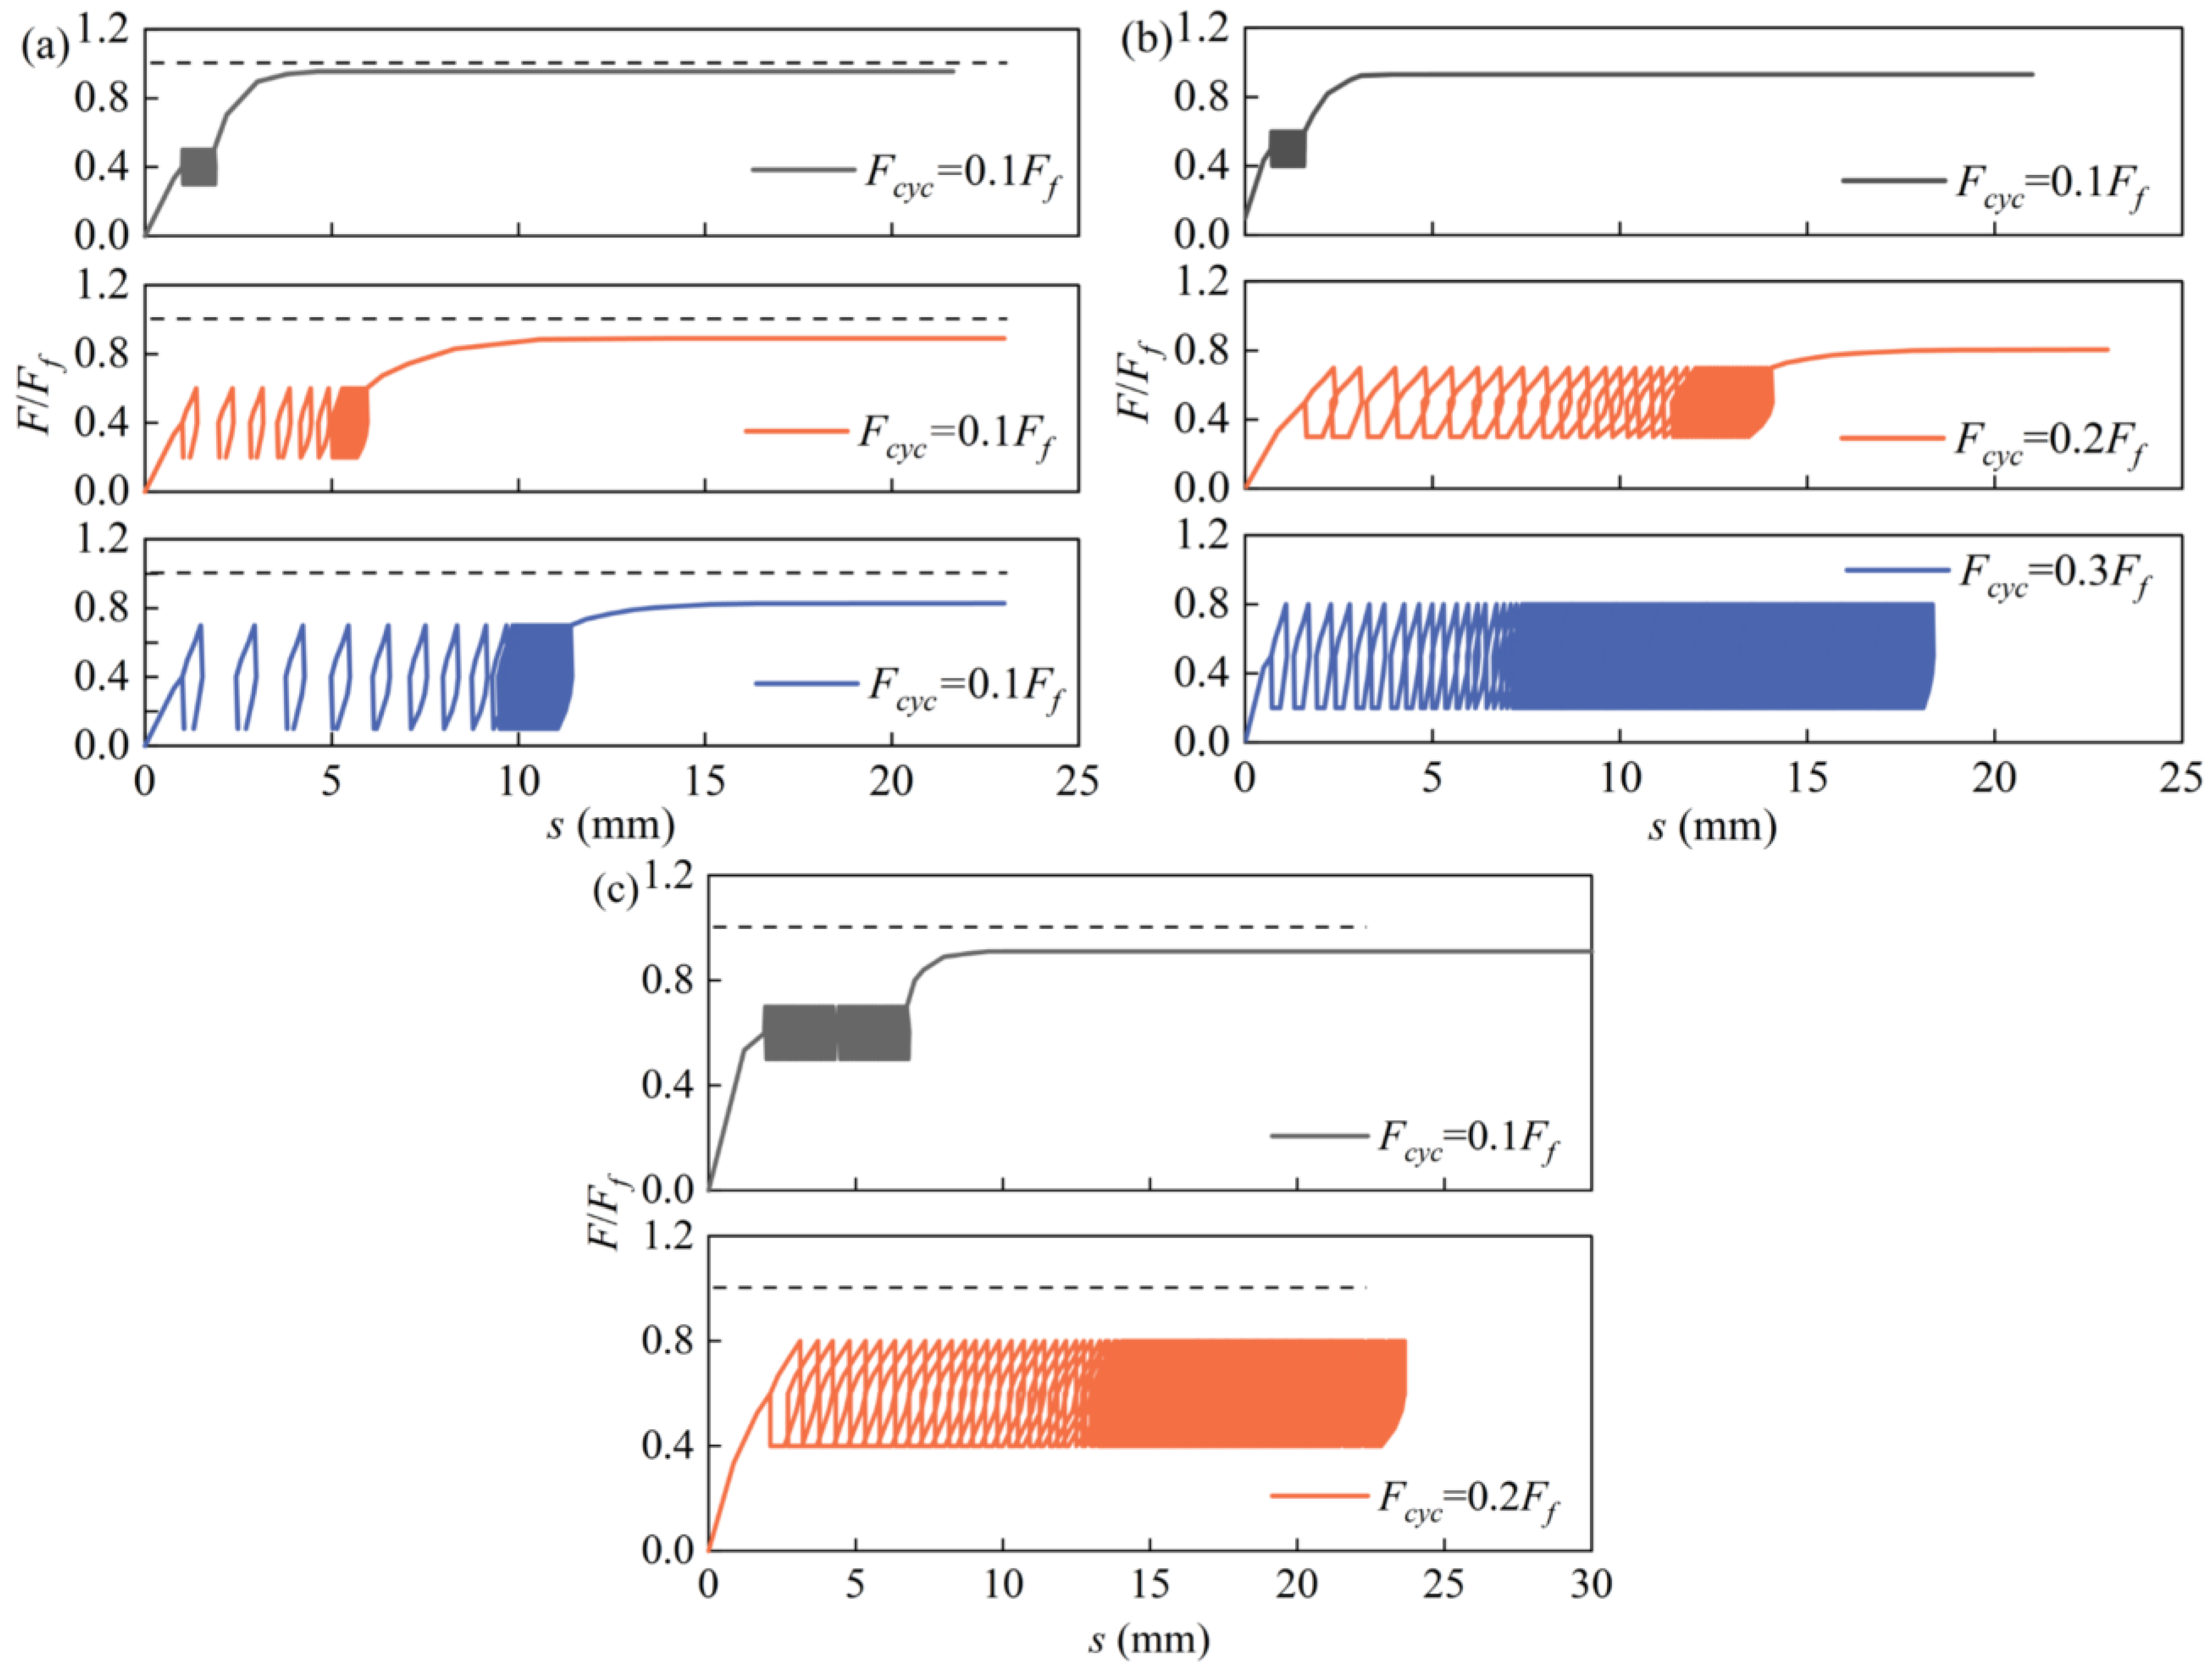
In the cyclic tests, the loading position is located at an embedment depth of 0.75L along the foundation sidewall. Under the 0° loading inclination angle, test groups with static load ratios Fa/Ff = 0.4, 0.5, and 0.6 are subjected to 2000 loading cycles followed by monotonic loading to failure, with the corresponding displacement curves shown in Figure 5. As Fcyc/Ff increases from 0.1 to 0.3, when Fa = 0.4Ff, the accumulated displacement after cyclic loading increases from 4.5 mm to 22.5 mm, while the ultimate bearing capacity decreases from 682 N to 604 N. When Fa = 0.5Ff, the accumulated displacement increases from 6.2 mm to 32.2 mm, and the corresponding post-cyclic ultimate bearing capacity decreases to 672 N and 577 N. Finally, when Fa = 0.6Ff and Fcyc/Ff = 0.1, the post-cyclic displacement is 7.6 mm, and the ultimate bearing capacity reaches 662 N; when Fcyc/Ff = 0.2, the accumulated displacement increases to 35.5 mm, and the ultimate bearing capacity decreases to a minimum of 518 N. From the curve characteristics, under medium to high cyclic load ratios (Fcyc ≥ 0.2Ff), displacement increases rapidly at the initial stage and then gradually slows down and stabilizes, exhibiting a distinct staged accumulation behavior. In contrast, under low cyclic load ratios, the curves remain relatively smooth, and the post-cyclic loading stage maintains higher stiffness and reserve bearing capacity.
It is noteworthy that under the same static load ratio, the post-cyclic ultimate bearing capacity decreases continuously with increasing cyclic load ratio. The higher the load ratio, the more significant the degradation (Figure 5). Meanwhile, under the same cyclic load ratio, the post-cyclic bearing capacity decreases with increasing static load ratio (Figure 5b,c), indicating that a higher static load level amplifies the adverse effects of cyclic loading. The displacement evolution is consistent with the bearing capacity degradation trend, with relatively small displacement observed under low static and low cyclic load ratios. As the cyclic load ratio increases, cumulative displacement grows significantly. Under high static load ratios, displacement typically increases rapidly at the initial stage and then gradually stabilizes. When both the static and cyclic load ratios are at high levels, displacement accumulation becomes most pronounced. Overall, the static and cyclic load ratios exhibit a superimposed amplification effect on the post-cyclic bearing performance and deformation response.

3.2.2. Displacement Under 90° Loading Inclination Angle

Under 90° loading, SCF specimens with Fa/Ff = 0.4, 0.5, and 0.6 were subjected to 2000 loading cycles followed by monotonic loading to failure. The corresponding displacement curves are shown in Figure 6. Overall, cyclic loading leads to varying degrees of displacement accumulation and ultimate bearing capacity degradation, and the extent of degradation increases with higher cyclic and static load ratios. As Fcyc/Ff increases from 0.1 to 0.3, when Fa = 0.4Ff, the accumulated displacement after cycling increases from 3.4 mm to 13.5 mm, while the ultimate bearing capacity decreases from 306 N to 273 N. When Fa = 0.5Ff, the accumulated displacement increases from 2.3 mm to 18.7 mm, and the corresponding post-cyclic ultimate bearing capacities decrease to 292 N and 238 N, respectively. When Fa = 0.6Ff and Fcyc/Ff increases from 0.1 to 0.2, displacement development becomes most pronounced (8.1–24.5 mm), and the ultimate bearing capacity decreases to a minimum of 219 N. Under medium to high cyclic load ratios (Fcyc ≥ 0.2Ff), displacement increases rapidly during the initial stage of cycling and then gradually stabilizes. In contrast, under low cyclic load ratios, the curves remain relatively smooth, and a higher bearing capacity is maintained during the post-cyclic loading stage. The results indicate that under 90° loading, cyclic load amplitude and static load level exert significant amplification effects on bearing capacity degradation and deformation accumulation.
Under the same number of loading cycles, the post-cyclic ultimate bearing capacity decreases continuously with increasing cyclic load ratio, and the reduction becomes more pronounced at higher cyclic load levels. At a constant cyclic load ratio, the bearing capacity decreases with increasing static load ratio, indicating that a higher static load level amplifies the degradation effect induced by cyclic loading. In terms of displacement, deformation remains limited under the combined condition of low static and low cyclic load ratios. As the cyclic load ratio increases, cumulative displacement grows significantly. Under high static load ratios, displacement typically increases rapidly at the initial stage, and then the growth rate gradually decreases. Under coupled high static and high cyclic load ratios, displacement continues to accumulate and is difficult to stabilize. It should be noted that under 30°, 45°, and 60° loading inclination angles, the influence of cyclic load ratio on post-cyclic ultimate bearing capacity and cumulative displacement is generally consistent with that observed under 0° and 90° conditions and is therefore not elaborated further.

3.2.3. The Effect of the Number of Cycles on the Ultimate Bearing Capacity

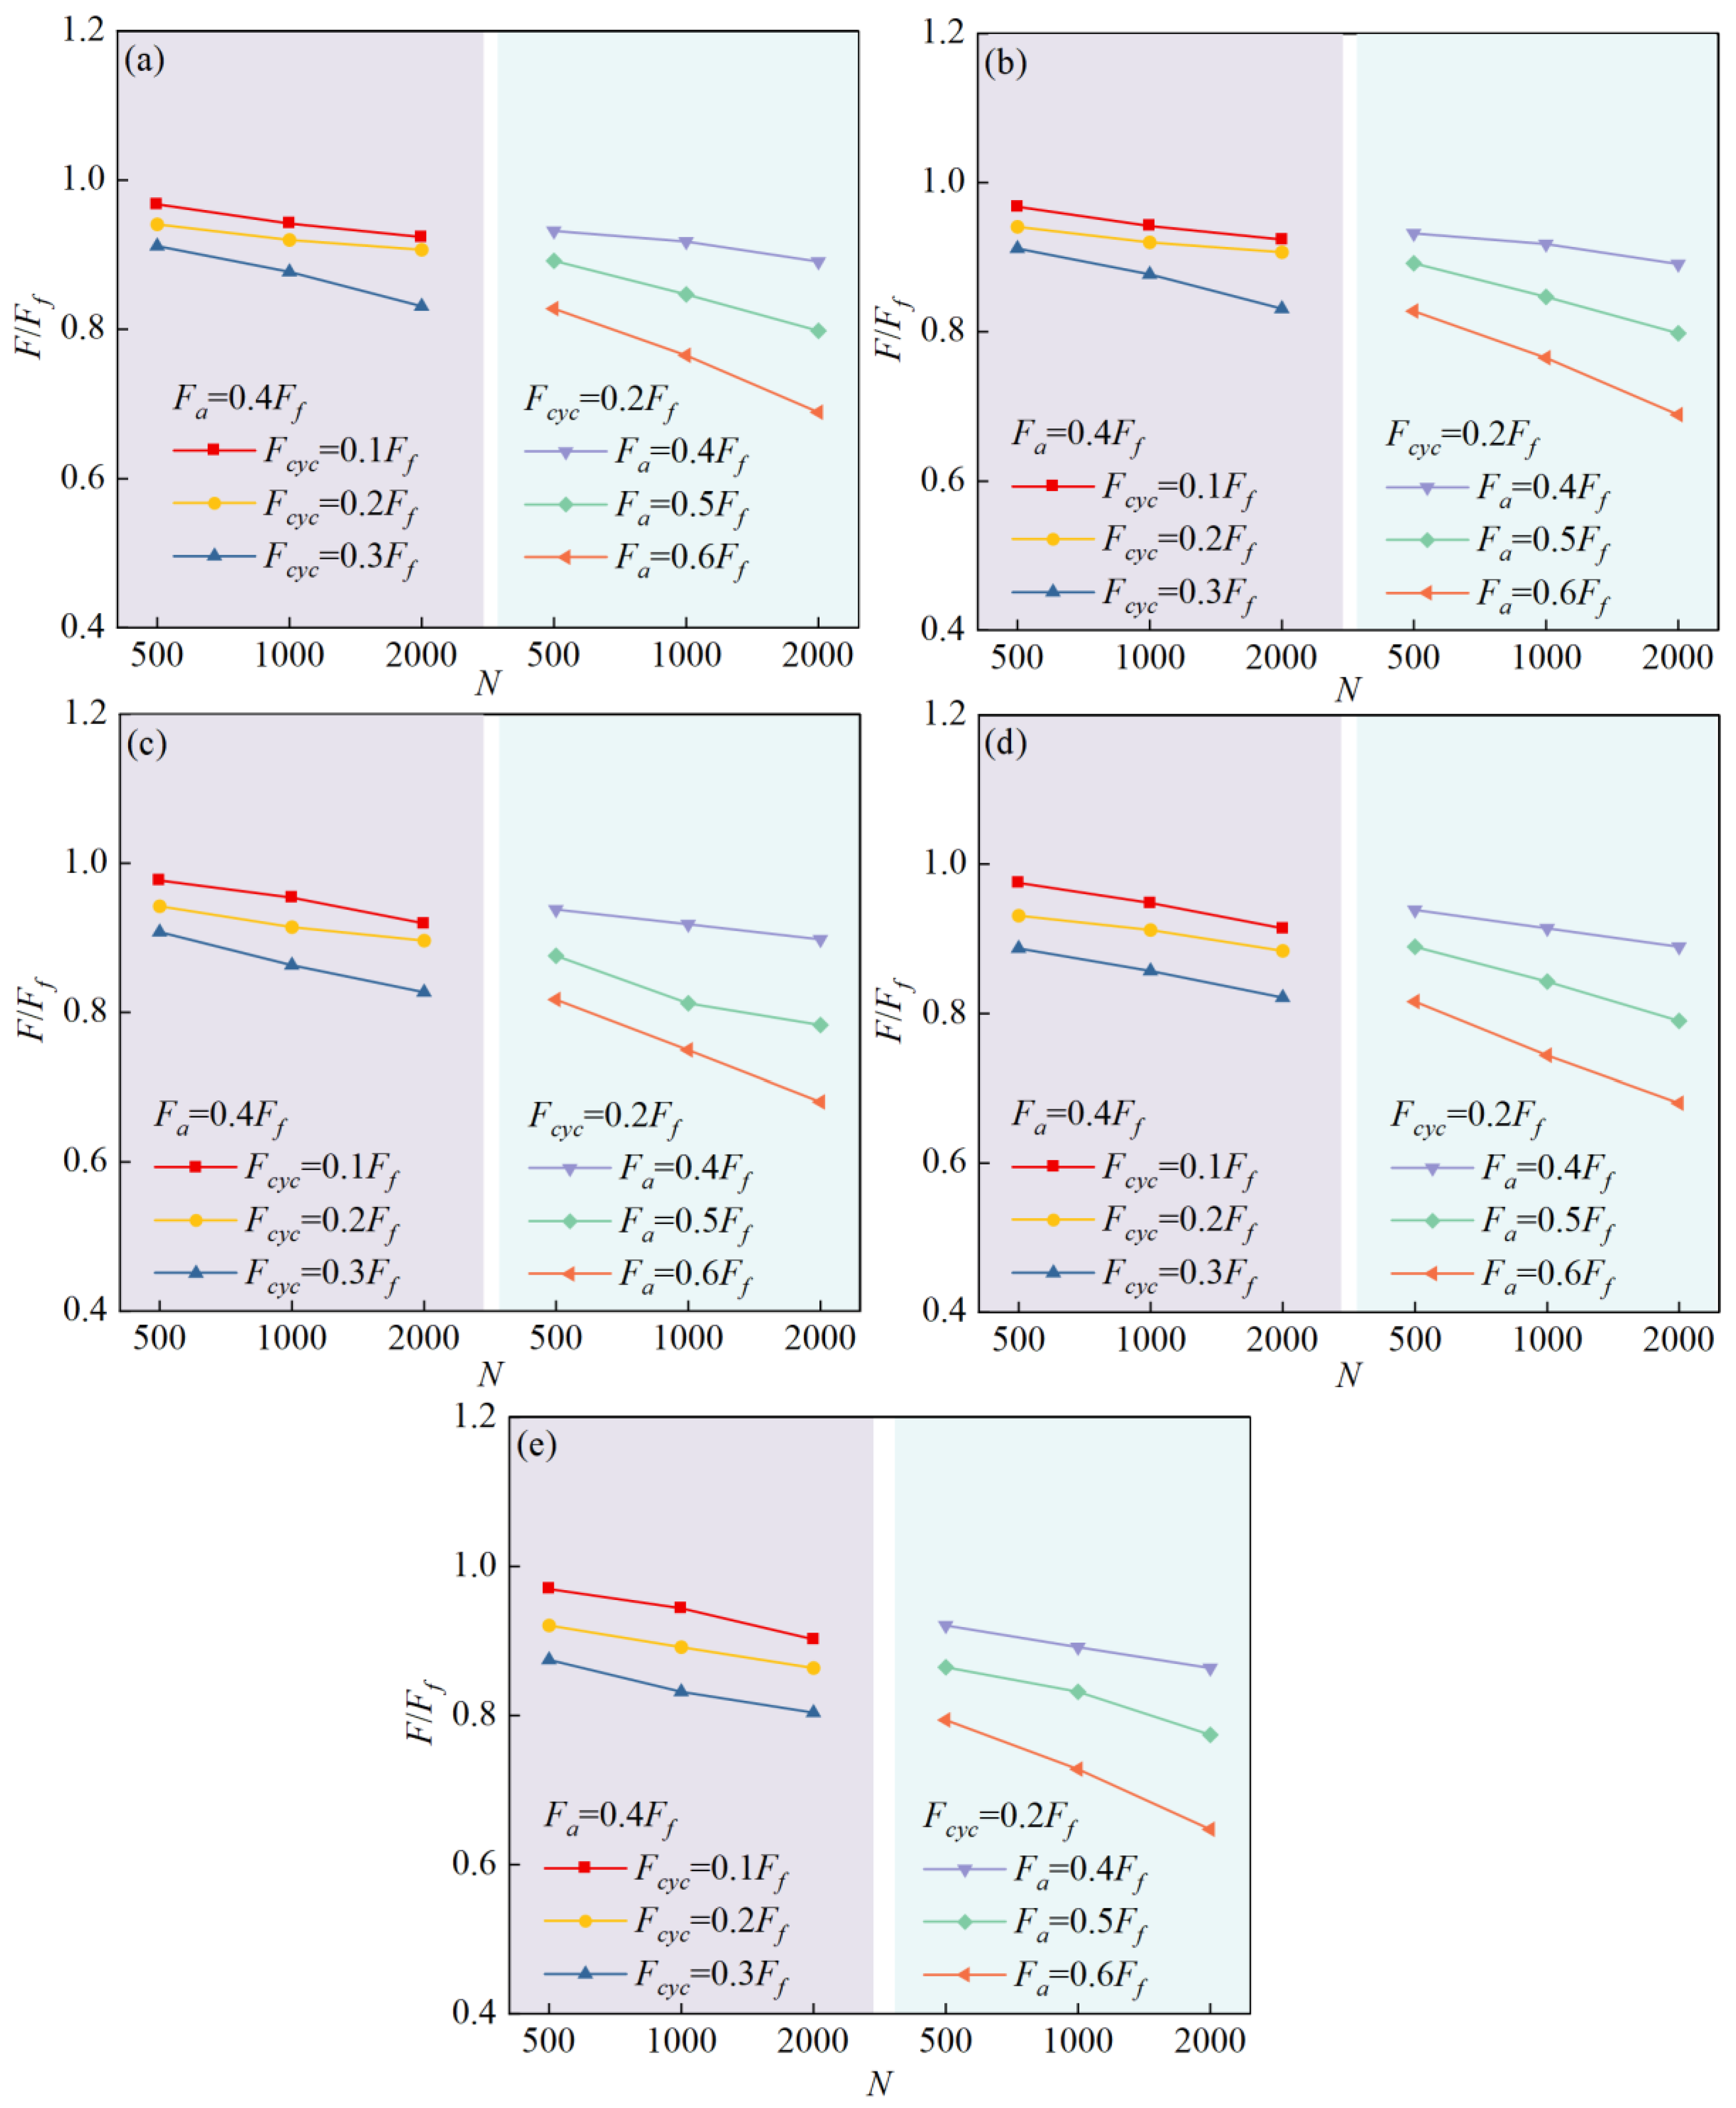
Figure 7 presents the variation in normalized ultimate bearing capacity after 500, 1000, and 2000 cycles under different loading inclination angles and combinations of static and cyclic load ratios. Under all loading inclination angles, the post-cyclic ultimate bearing capacity exhibits a consistent trend of continuous reduction with increasing number of cycles, demonstrating typical cyclic softening behavior. Taking the 0–45° loading cases as representative (Figure 7a–c), when Fa/Ff = 0.4 and Fcyc/Ff increases from 0.1 to 0.3, the normalized bearing capacity after 2000 cycles decreases from 0.924 to 0.912 (0°), from 0.918 to 0.815 (30°), and from 0.922 to 0.822 (45°). When Fa/Ff increases to 0.6, under 0° and 30° loading with Fcyc/Ff = 0.2, the bearing capacity after 2000 cycles decreases to 0.689 and 0.704, respectively, indicating that a higher static load level significantly amplifies cyclic degradation effects. Although slight numerical differences exist among loading angles, the overall distribution range and variation magnitude remain generally consistent. The degradation of cyclic bearing capacity is primarily associated with soil structure disturbance and pore pressure accumulation induced by cyclic loading. Repeated cyclic shear stress causes continuous rotation of the principal stress direction and disrupts the original soil structure [50], and in saturated soft clay, it may also induce pore pressure development, both of which contribute to the reduction in strength and stiffness.
Under all loading inclination angles, when the number of cycles is relatively small, the post-cyclic ultimate bearing capacity decreases rapidly. As the number of cycles increases, the rate of reduction in post-cyclic ultimate bearing capacity gradually becomes moderate. The influence of static load ratio on post-cyclic ultimate bearing capacity is generally stronger than that of cyclic load ratio, and increasing the static load level not only reduces the initial bearing reserve but also accelerates the cyclic softening process. The variation patterns under 60° and 90° loading inclination angles are consistent with the aforementioned trends and are therefore not discussed separately.
Table 4 summarizes the post-cyclic ultimate bearing capacity Qcyc and its relative reduction with respect to the static ultimate bearing capacity after 500, 1000, and 2000 cycles under different loading inclination angles. The results indicate that under most loading combinations, the reduction in bearing capacity across different inclination conditions primarily ranges between 9% and 35%. Only under low static load ratios (Fa/Ff = 0.4) combined with low cyclic load ratios (Fcyc/Ff = 0.1–0.2) does the bearing capacity reduction remain relatively limited due to the low cyclic peak levels. Overall, the ultimate bearing capacity of suction caisson foundations in clay typically decreases by approximately 10–39% after cyclic loading. Although the experimental conditions in this study differ from previous research in terms of loading angle and loading position, the magnitude of bearing capacity reduction remains at a comparable level, demonstrating good consistency in observed trends and comparability of results.

4. Numerical Model

4.1. Parameters of Suction Caisson Foundation and Soil

This study establishes a three-dimensional model of the suction caisson foundation using ABAQUS 2022, with a wall thickness of 2 mm, an outer diameter of 150 mm, an aspect ratio of 3.0, and a foundation height of 450 mm. In addition, foundation models with aspect ratios of 0.5, 1.0, 3.0, and 6.0 are developed to investigate the influence of aspect ratio on the bearing capacity of SCF, corresponding to foundation heights of 75 mm, 150 mm, 450 mm, and 900 mm, respectively. Since the density of the SCF used in the model tests is close to that of the soil, the foundation density in the finite element model is set equal to that of the soil to reduce computational scale, and gravity is applied directly to the entire system. For saturated soft clay, an ideal elastic–plastic constitutive model following the Mohr–Coulomb failure criterion is adopted for simulation [51,52,53], in which the yield criterion is governed by shear failure, and the yield surface function is expressed as follows:
F = R mc q p tan φ c = 0
where q is the deviatoric stress; p represents the mean stress; φ is the slope of the Mohr–Coulomb yield locus in the qp stress plane; c is the material cohesion; Rmc is related to the Lode angle Θ and the friction angle φ, as expressed by the following equation:
R mc ( Θ , φ ) = 1 3 cos φ sin ( Θ + π 3 ) + 1 3 cos ( Θ + π 3 ) tan φ
The Lode angle Θ can be calculated from the third invariant of deviatoric stress r as follows:
cos ( 3 Θ ) = r 3 q 3
The Mohr–Coulomb yield surface exhibits an irregular hexagonal shape with sharp corners in the π-plane. Only by adopting a non-associated flow rule, in which the plastic potential surface differs from the yield surface, can a unique plastic flow direction be ensured at the corners. The plastic potential function adopted in ABAQUS is expressed as follows:
G = ( ε c | 0 tan ψ ) 2 + ( R mw q ) 2 p tan ψ
R mw = 4 ( 1 e 2 ) cos 2 Θ + ( 2 e 1 ) 2 2 ( 1 e 2 ) cos Θ + ( 2 e 1 ) 4 ( 1 e 2 ) ( cos Θ ) 2 + 5 e 2 4 e R mc ( π 3 , φ )
R mc ( π 3 , φ ) = 3 sin φ 6 cos φ
e = 3 sin φ 3 + sin φ
where c|0 is the initial cohesion of the soil; ψ represents the dilation angle; ε and e are the eccentricities in the meridional plane and the π-plane, respectively, which are used to control the shape of the plastic potential surface.
In this study, a load-controlled method is employed to apply loading to the SCF model. In the analysis step, the external load is defined to increase linearly with time, and the proportional relationship between the vertical and horizontal components is determined according to the target loading angle. Corresponding load components are applied synchronously during the calculation to ensure that the SCF reaches the ultimate state at the end of the analysis. To achieve stable application of the inclined concentrated load, a reference point is established at the loading position and coupled to the structural elements of the caisson foundation through a rigid body constraint, allowing the external load to be applied directly to the reference point and transferred to the entire foundation.

4.2. Boundary Conditions and Mesh Discretization

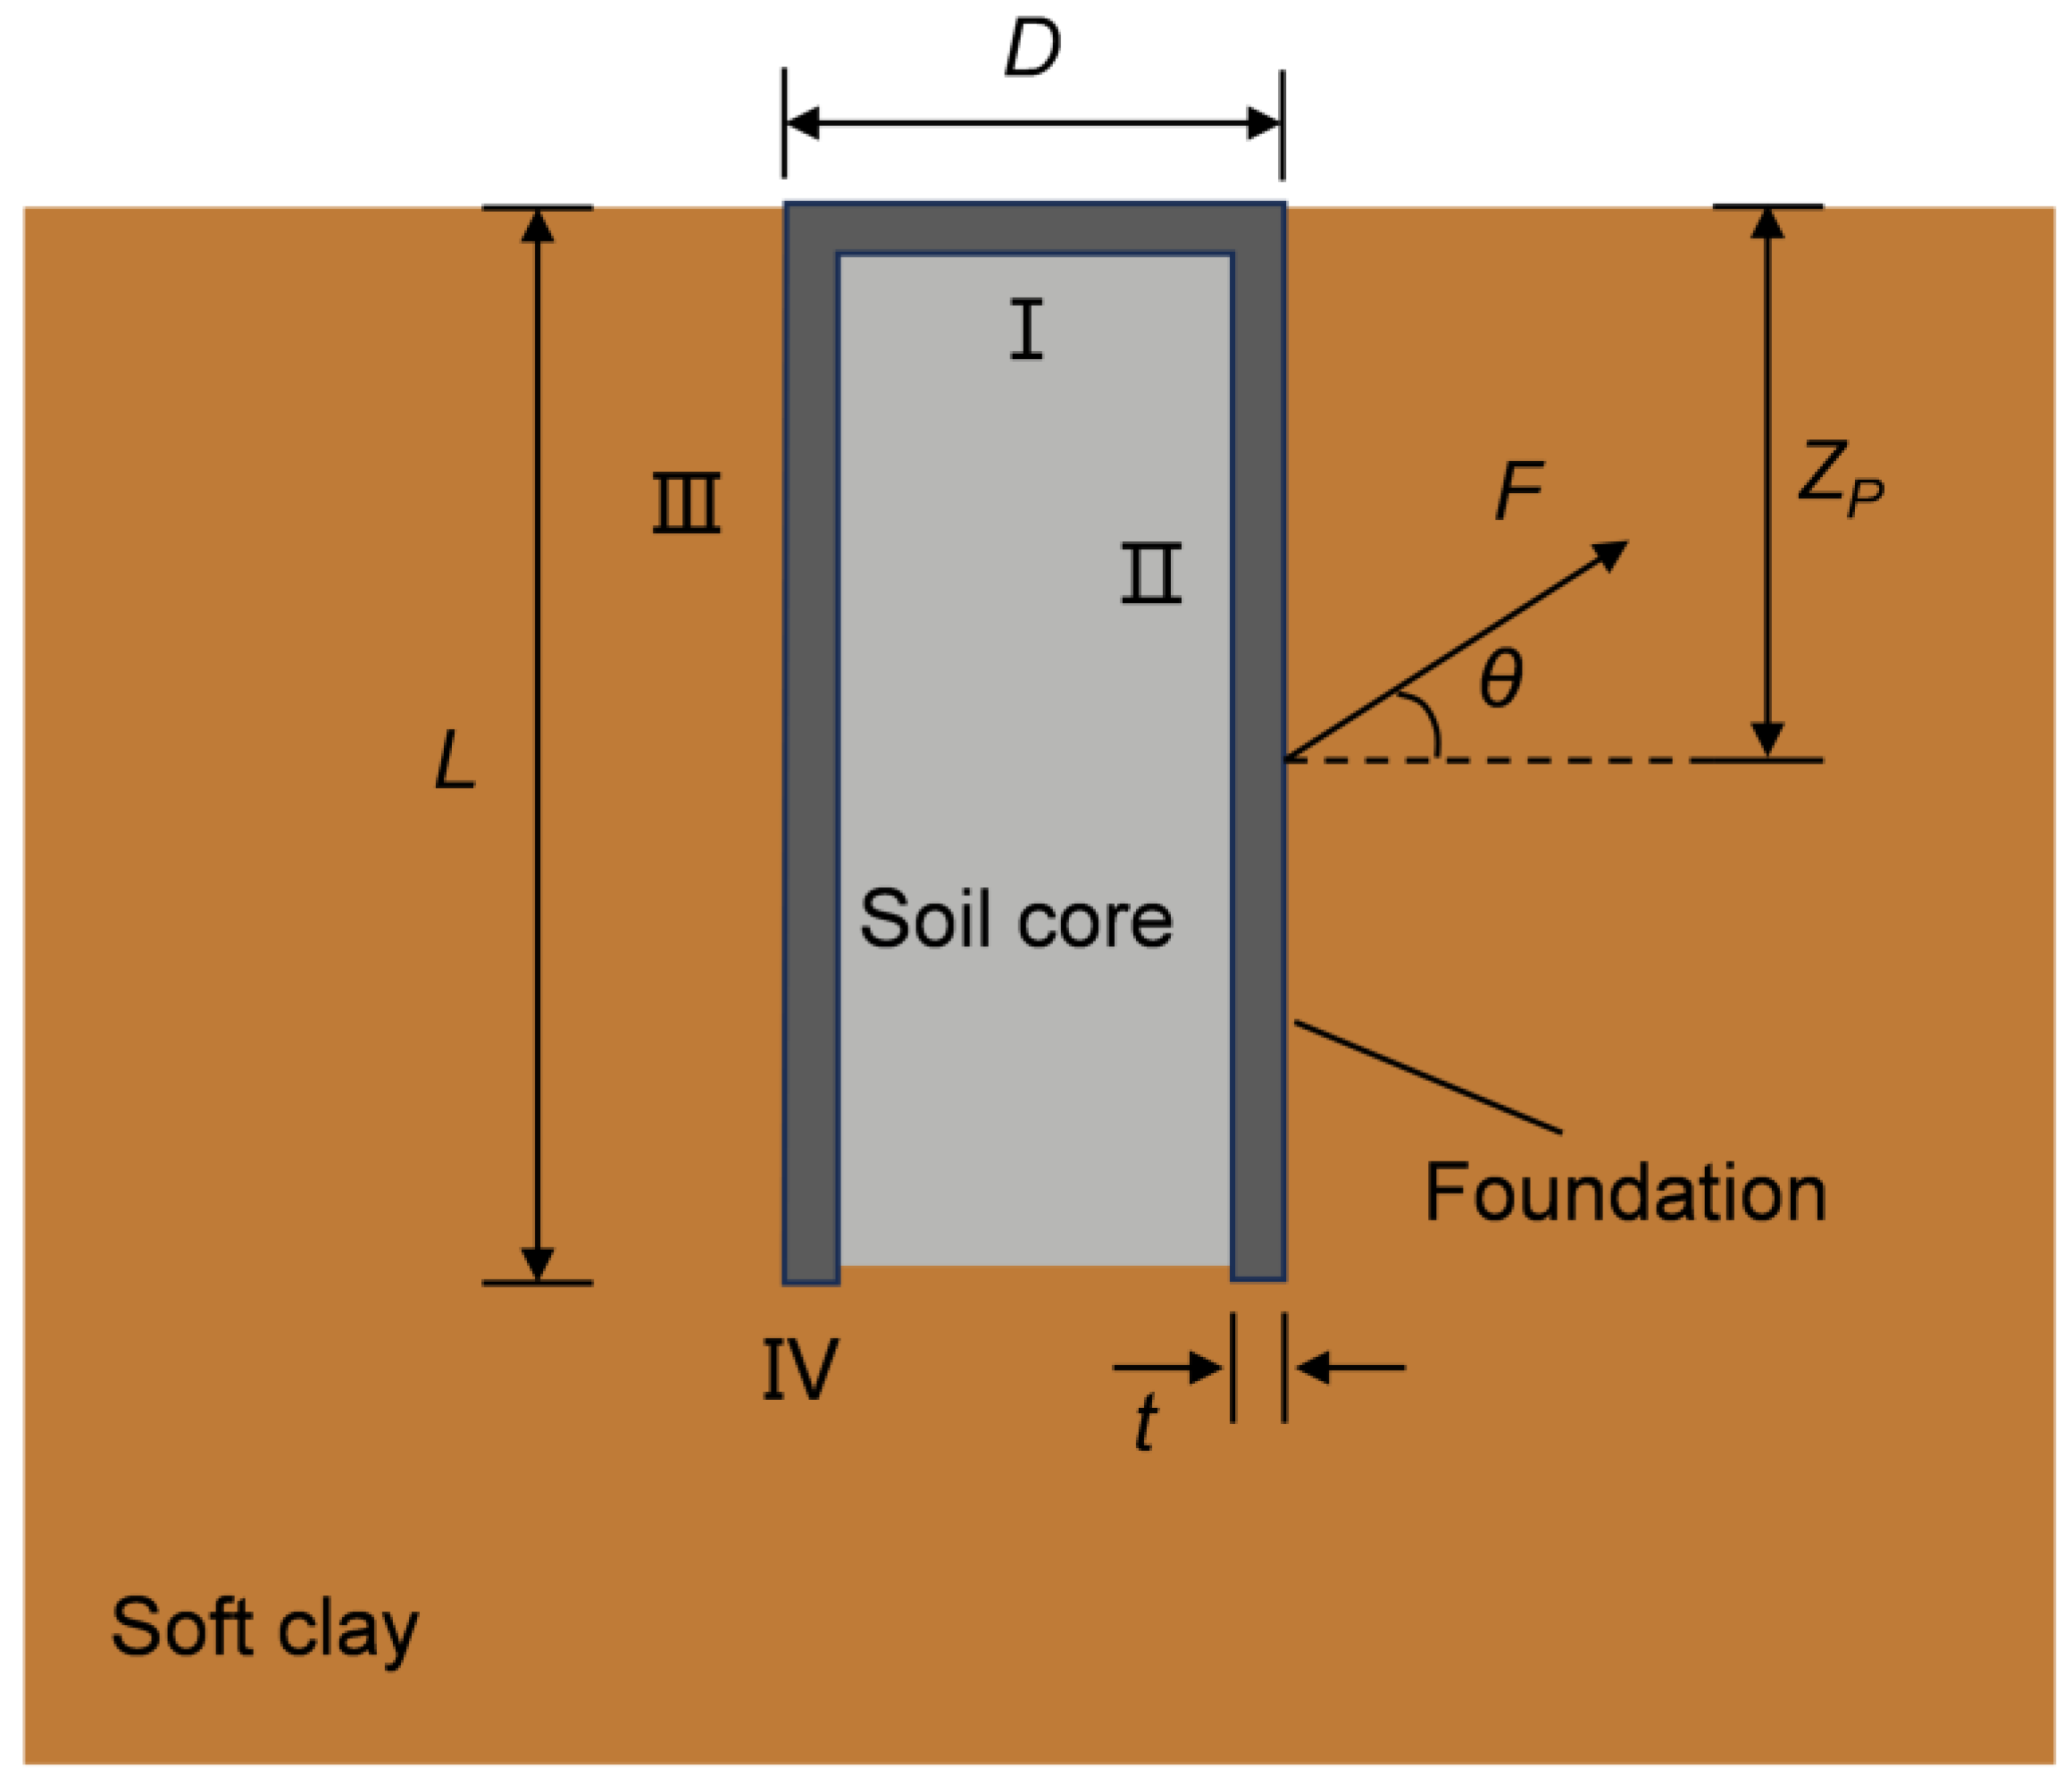
The interaction between the SCF and the surrounding soil is defined by specifying contact and constraint conditions. The model includes four contact pairs, as illustrated in Figure 8. Contact pair I represents the interaction between the inner surface of the foundation top and the soil core. Contact pair II denotes the interaction between the inner wall of the foundation and the soil core. Contact pair III corresponds to the contact between the outer wall of the foundation and the surrounding soil. Contact pair IV refers to the interaction between the annular bottom surface of the foundation and the soil. Since the foundation is modeled as a rigid body and the soil as a deformable body in the finite element model, the foundation surfaces are defined as the master surfaces and the soil surfaces as the slave surfaces for all four contact pairs.
Model tests indicate that no separation occurred between the soil core and the inner surface of the top or the inner wall of the SCF during loading. Therefore, contact pairs I and II were defined using binding constraints to ensure deformation continuity across the contact interfaces. For contact pairs III and IV, the normal mechanical behavior was defined as hard contact, meaning that compressive normal pressure is transmitted when the surfaces are in contact, while the normal pressure vanishes when separation occurs. The tangential mechanical behavior of contact pairs III and IV was modeled using the Coulomb friction model with a penalty stiffness algorithm, allowing limited relative slip in the bonded state to improve numerical convergence.
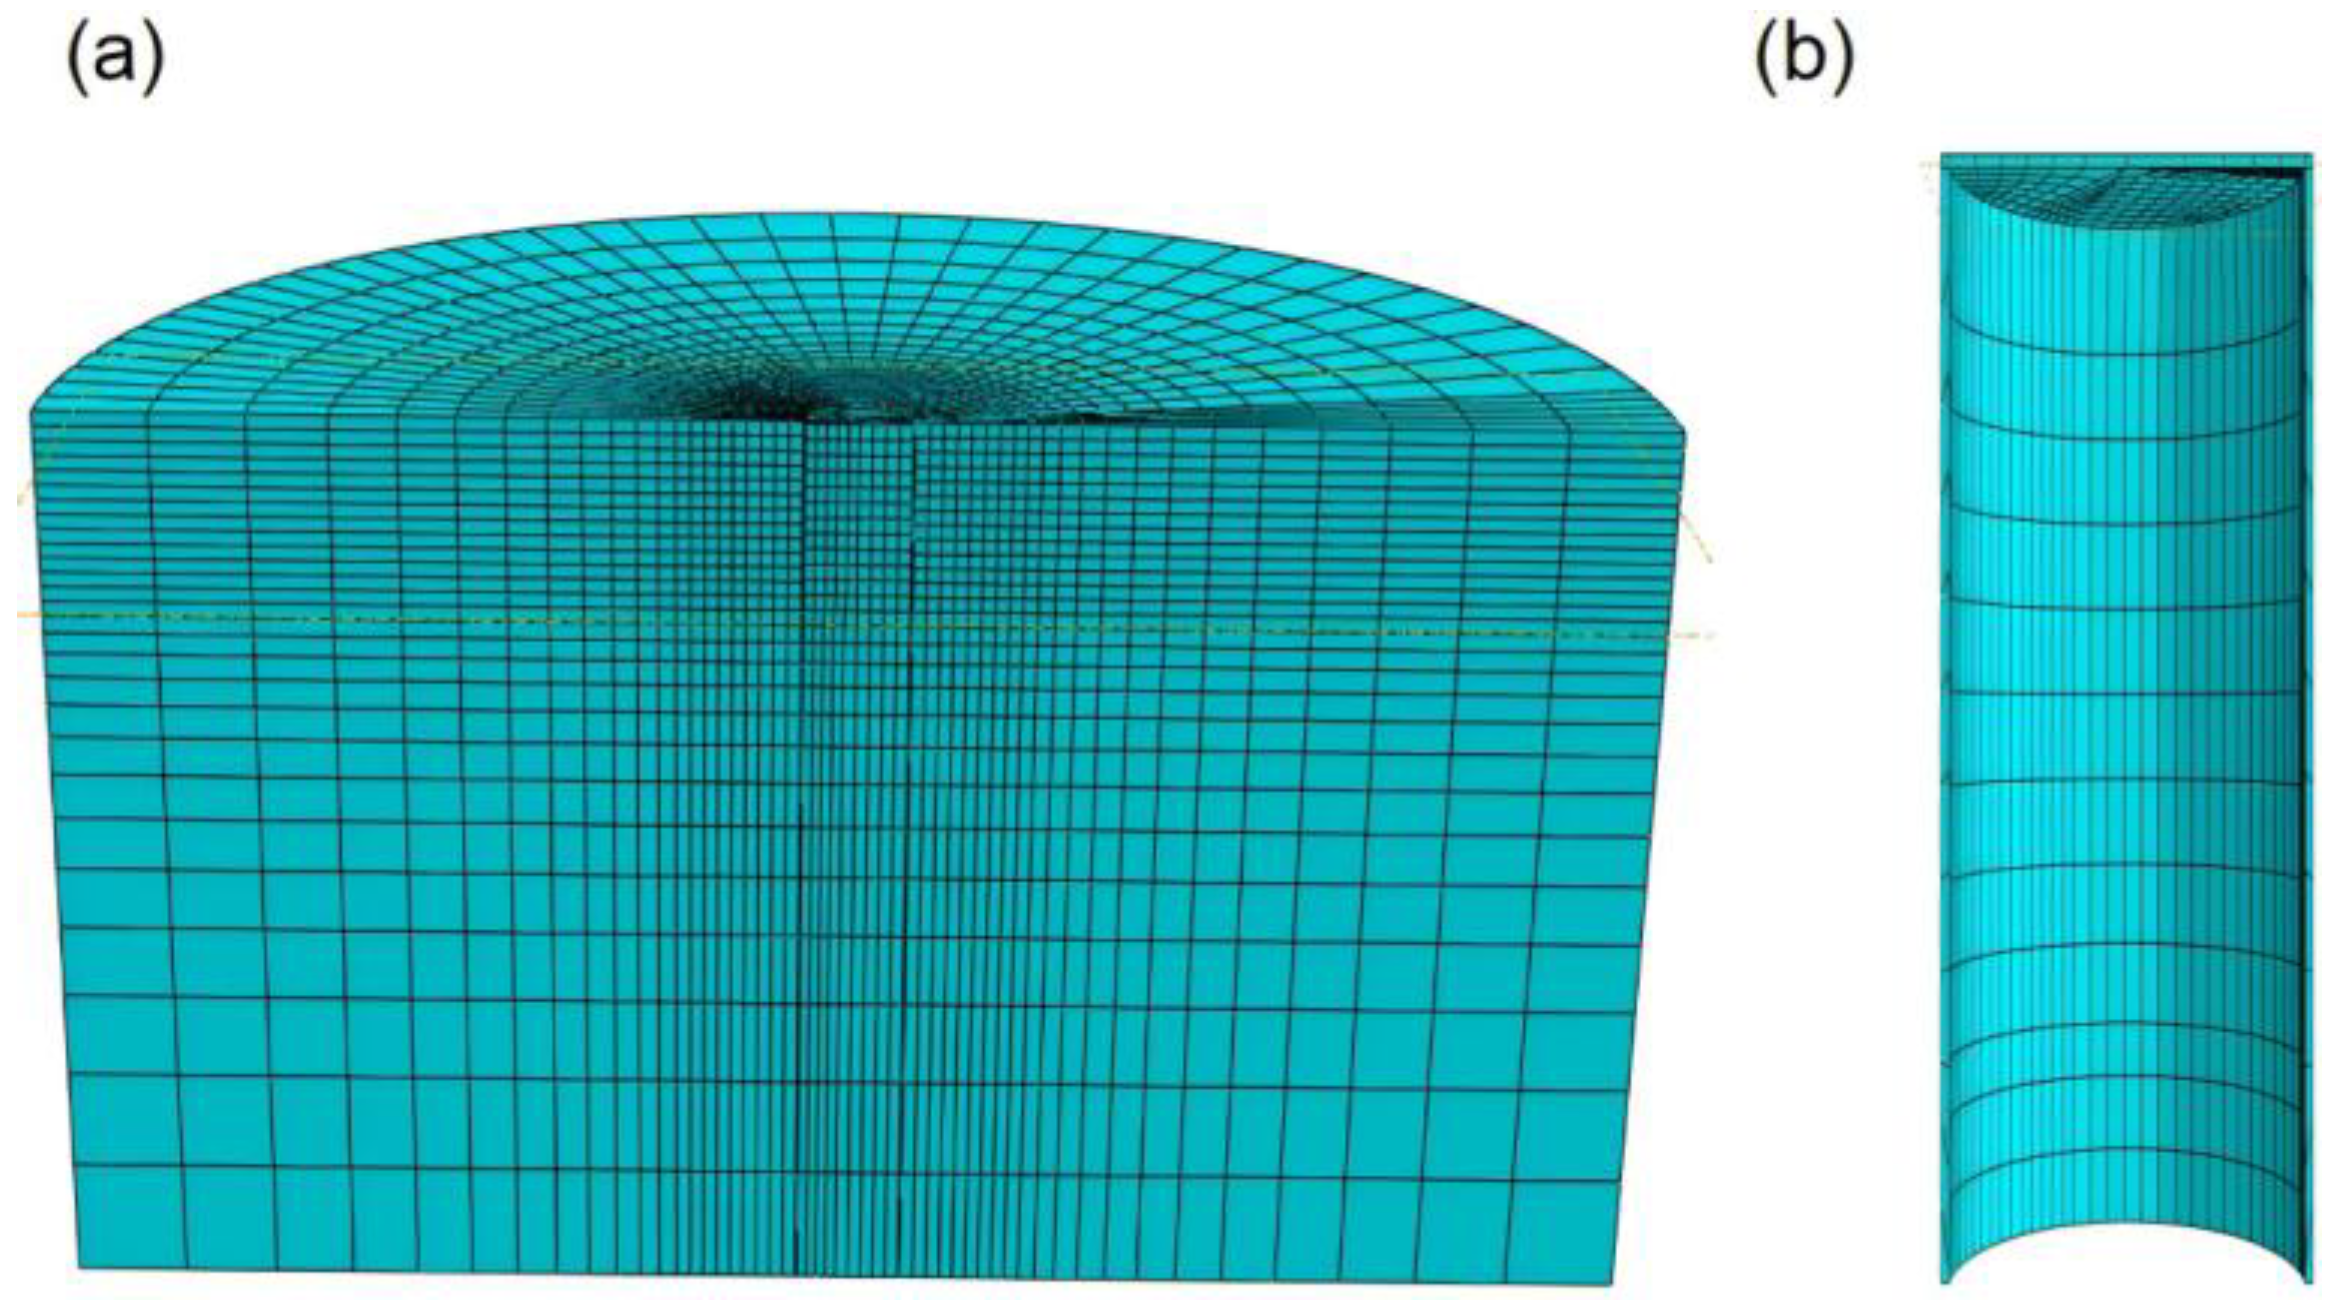
In the numerical model, the foundation–soil domain is modeled as a semi-cylindrical body, with zero normal displacement imposed on the plane of symmetry and full fixation applied at the bottom boundary. In addition, both radial and tangential displacements at the far-field outer boundary are constrained to zero to minimize boundary disturbance effects. To ensure reasonable force and displacement responses, rotational constraints are imposed at the reference point of the suction caisson foundation when defining the mooring point location. To reduce boundary effects, the horizontal dimension of the model is set to 10.0 times the foundation diameter, and the vertical dimension is set to 6.0 times the foundation height. The model employs three-dimensional eight-node reduced integration elements (C3D8R) [9] to alleviate numerical convergence issues associated with the near-incompressibility of soil under undrained conditions. A partition-based mesh refinement strategy is adopted, in which the soil element size remains uniform in the vertical direction while gradually coarsening horizontally from the vicinity of the foundation toward the far field. The element size along the caisson sidewall is uniformly arranged, and the element shape and size in the top cap region are kept as regular and consistent as possible. The mesh configuration of the foundation–soil model with an aspect ratio of 3.0 is shown in Figure 9.

4.3. Numerical Model Validation

To verify the rationality of the selected material constitutive model, contact and constraint settings, and mesh discretization in the aforementioned finite element model, the numerically simulated bearing capacities were compared with the model test results under consistent parameters and static loading conditions (Table 5). Among the 20 sets of data compared between numerical simulation and model tests, the relative errors are all less than 25%, with 14 sets below 10%.
It is worth noting that the numerical simulation achieved geostatic stress equilibrium, thereby ensuring consistency between the initial stress field and that of the tests. However, the soil in the experiments may have experienced microstructural disturbances, whereas the numerical model assumes a homogeneous and continuous material. In addition, an idealized Coulomb friction model was adopted in the finite element analysis, without accounting for contact stiffness degradation or slip localization. These factors contribute to discrepancies between the numerical and test results; nevertheless, in geotechnical numerical simulations, an error range of 20–30% in ultimate bearing capacity is generally considered acceptable. Therefore, the finite element modeling approach adopted in this study is considered reasonable, and the conclusions derived from the numerical simulations based on this model are regarded as reliable.

5. Numerical Simulation Results

5.1. Failure Modes

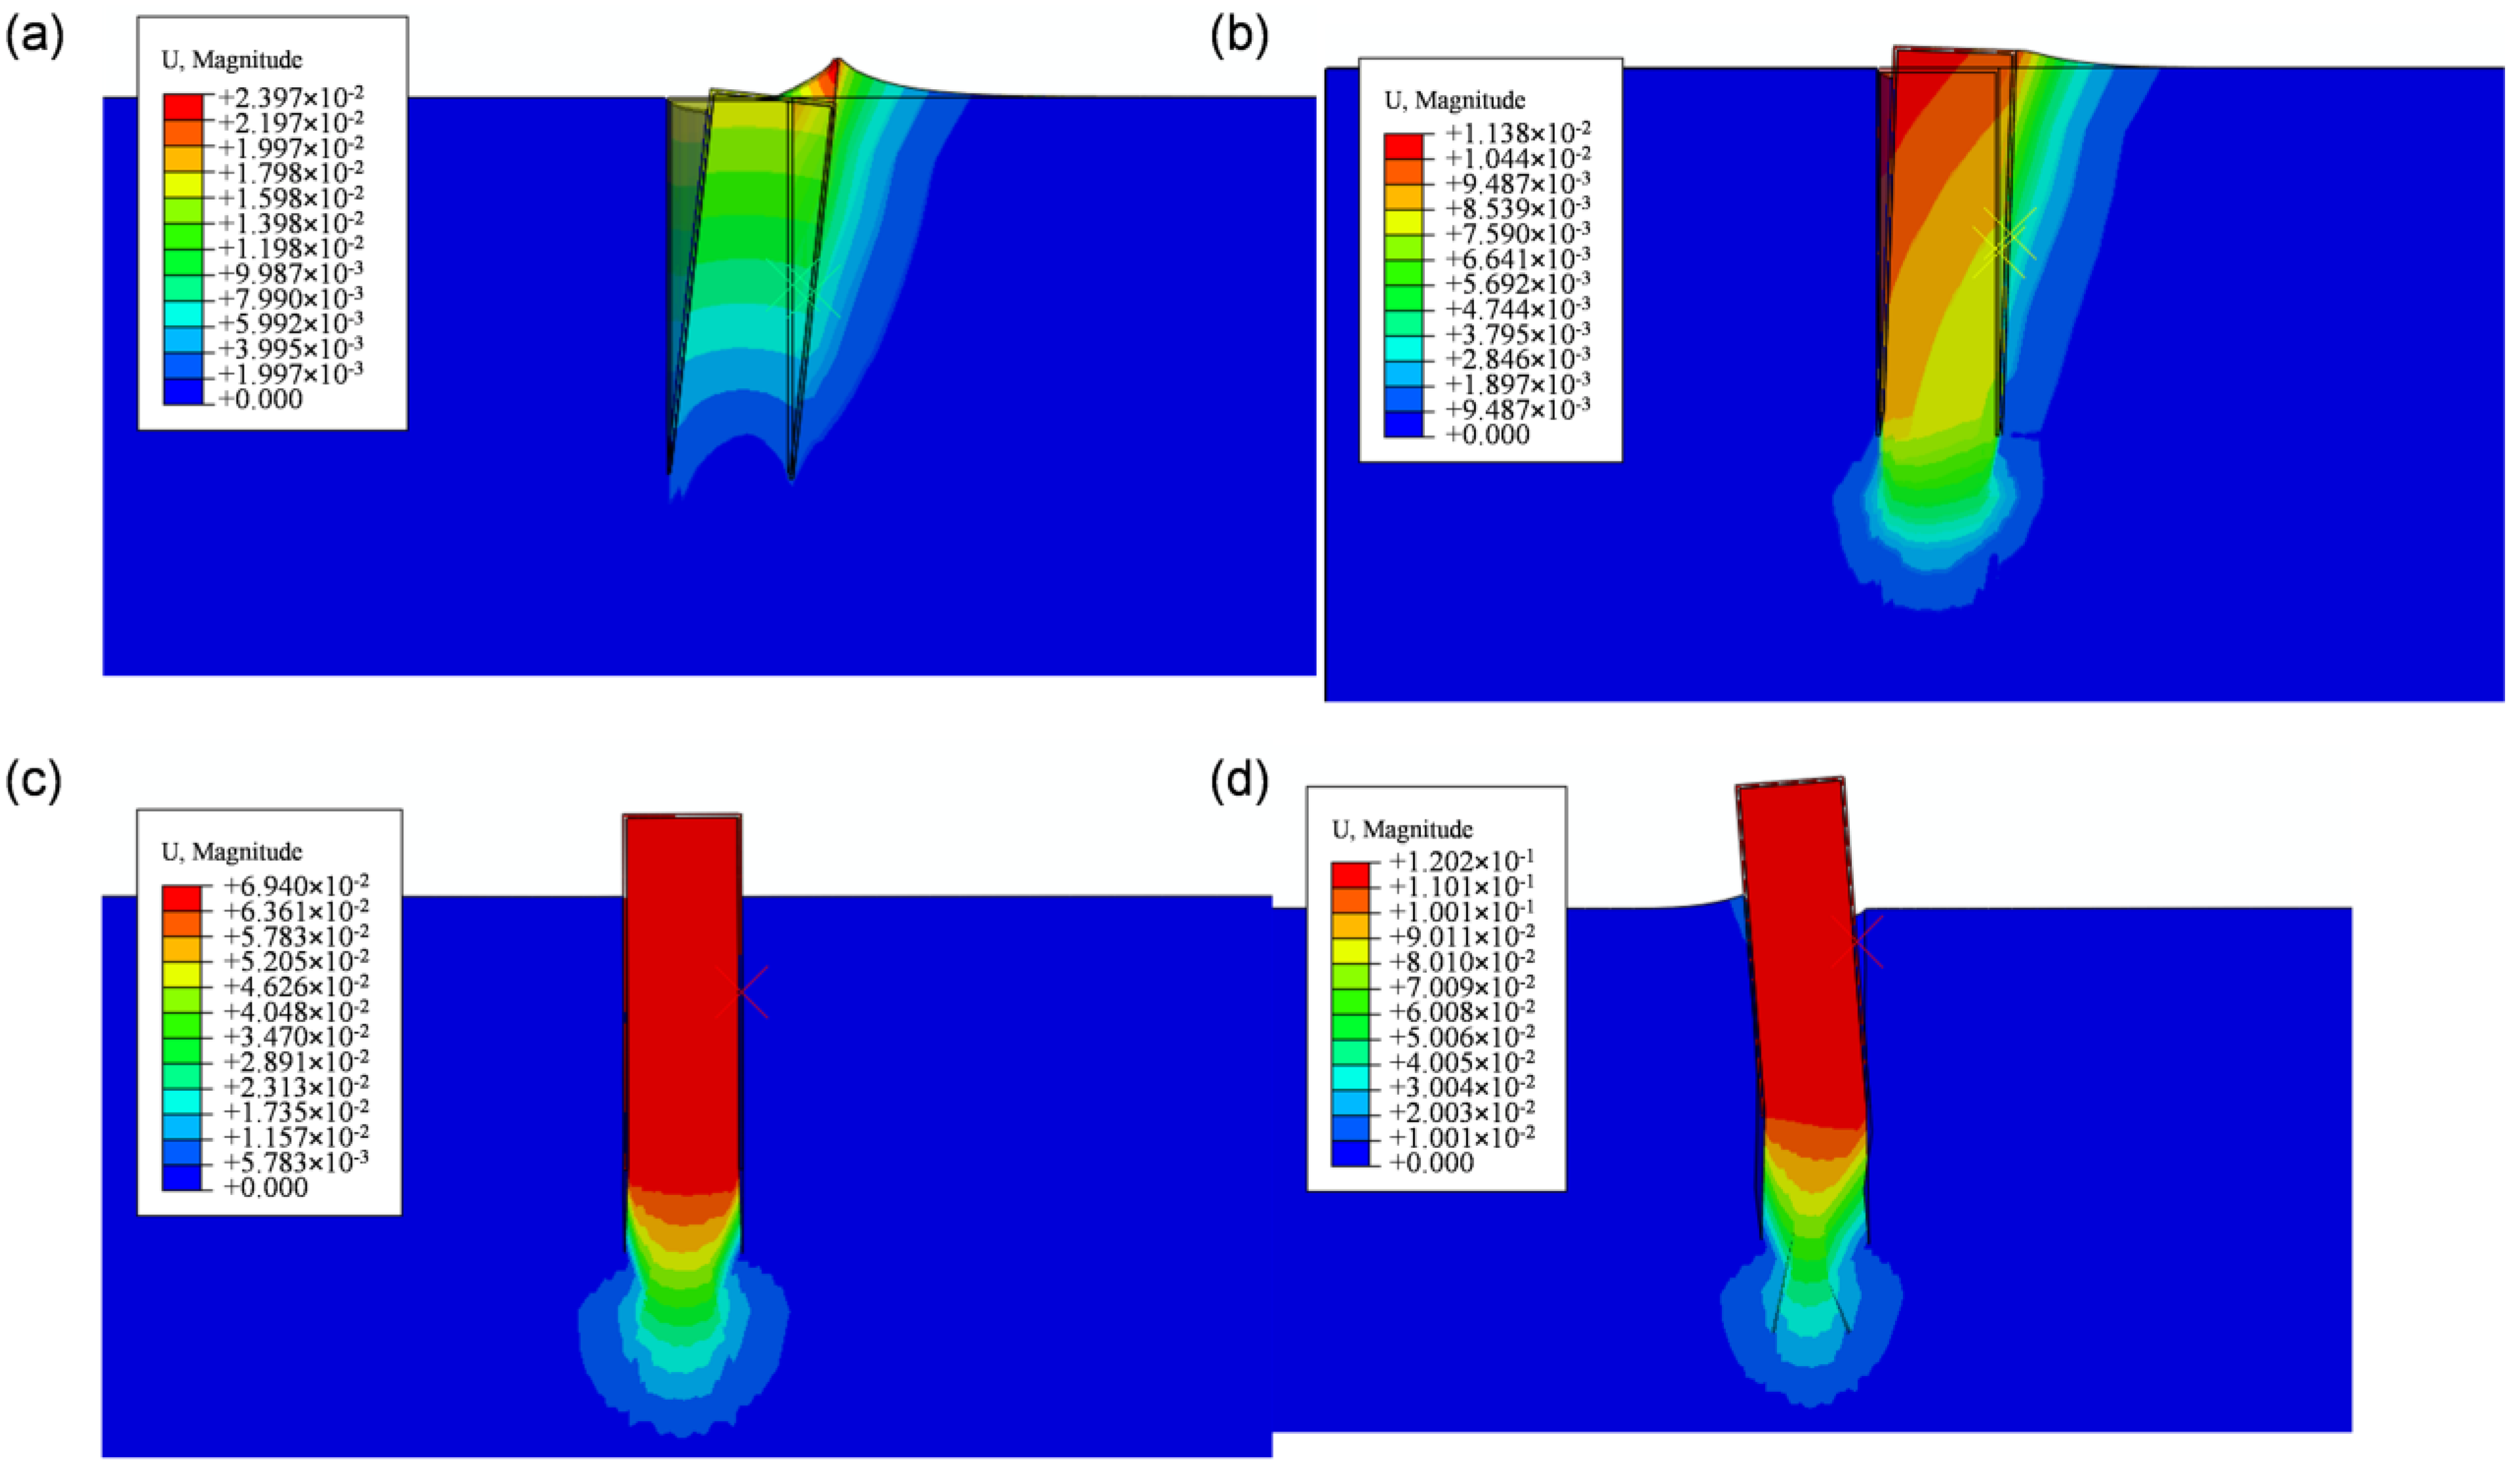
Taking the suction caisson foundation with an aspect ratio of 3.0, subjected to inclined loading at embedment depths of 0.5L and 1.0L along the sidewall as examples, displacement contours at the ultimate state were extracted from the finite element results to analyze the evolution of failure modes. When the suction caisson foundation with L/D = 3.0 is subjected to inclined loading at a sidewall embedment depth of 0.5L (Figure 10), the failure mode exhibits a distinct staged transition as the load inclination angle increases. Under horizontal loading (0°), the foundation demonstrates an overall overturning failure mechanism with clockwise rotation. The rotation center is located near the base and close to the vertical central axis of the foundation. Cracking develops in the active zone on the unloaded side, while significant soil extrusion and heave occur in the passive zone on the loaded side. When the load inclination increases to 30°, the failure mode transforms into a coupled rotation–translation mechanism. The rotational amplitude decreases, and both the cracking in the active zone and the heave in the passive zone are reduced. As the inclination further increases to 45°, foundation rotation weakens further, and vertical displacement increases significantly. The internal soil plug moves upward together with the foundation, and the failure mode gradually transitions toward an uplift-dominated mechanism. Under 60° and 90° loading, the foundation response is dominated by vertical uplift displacement accompanied by only slight rotation, with overall uplift failure becoming the governing mode.
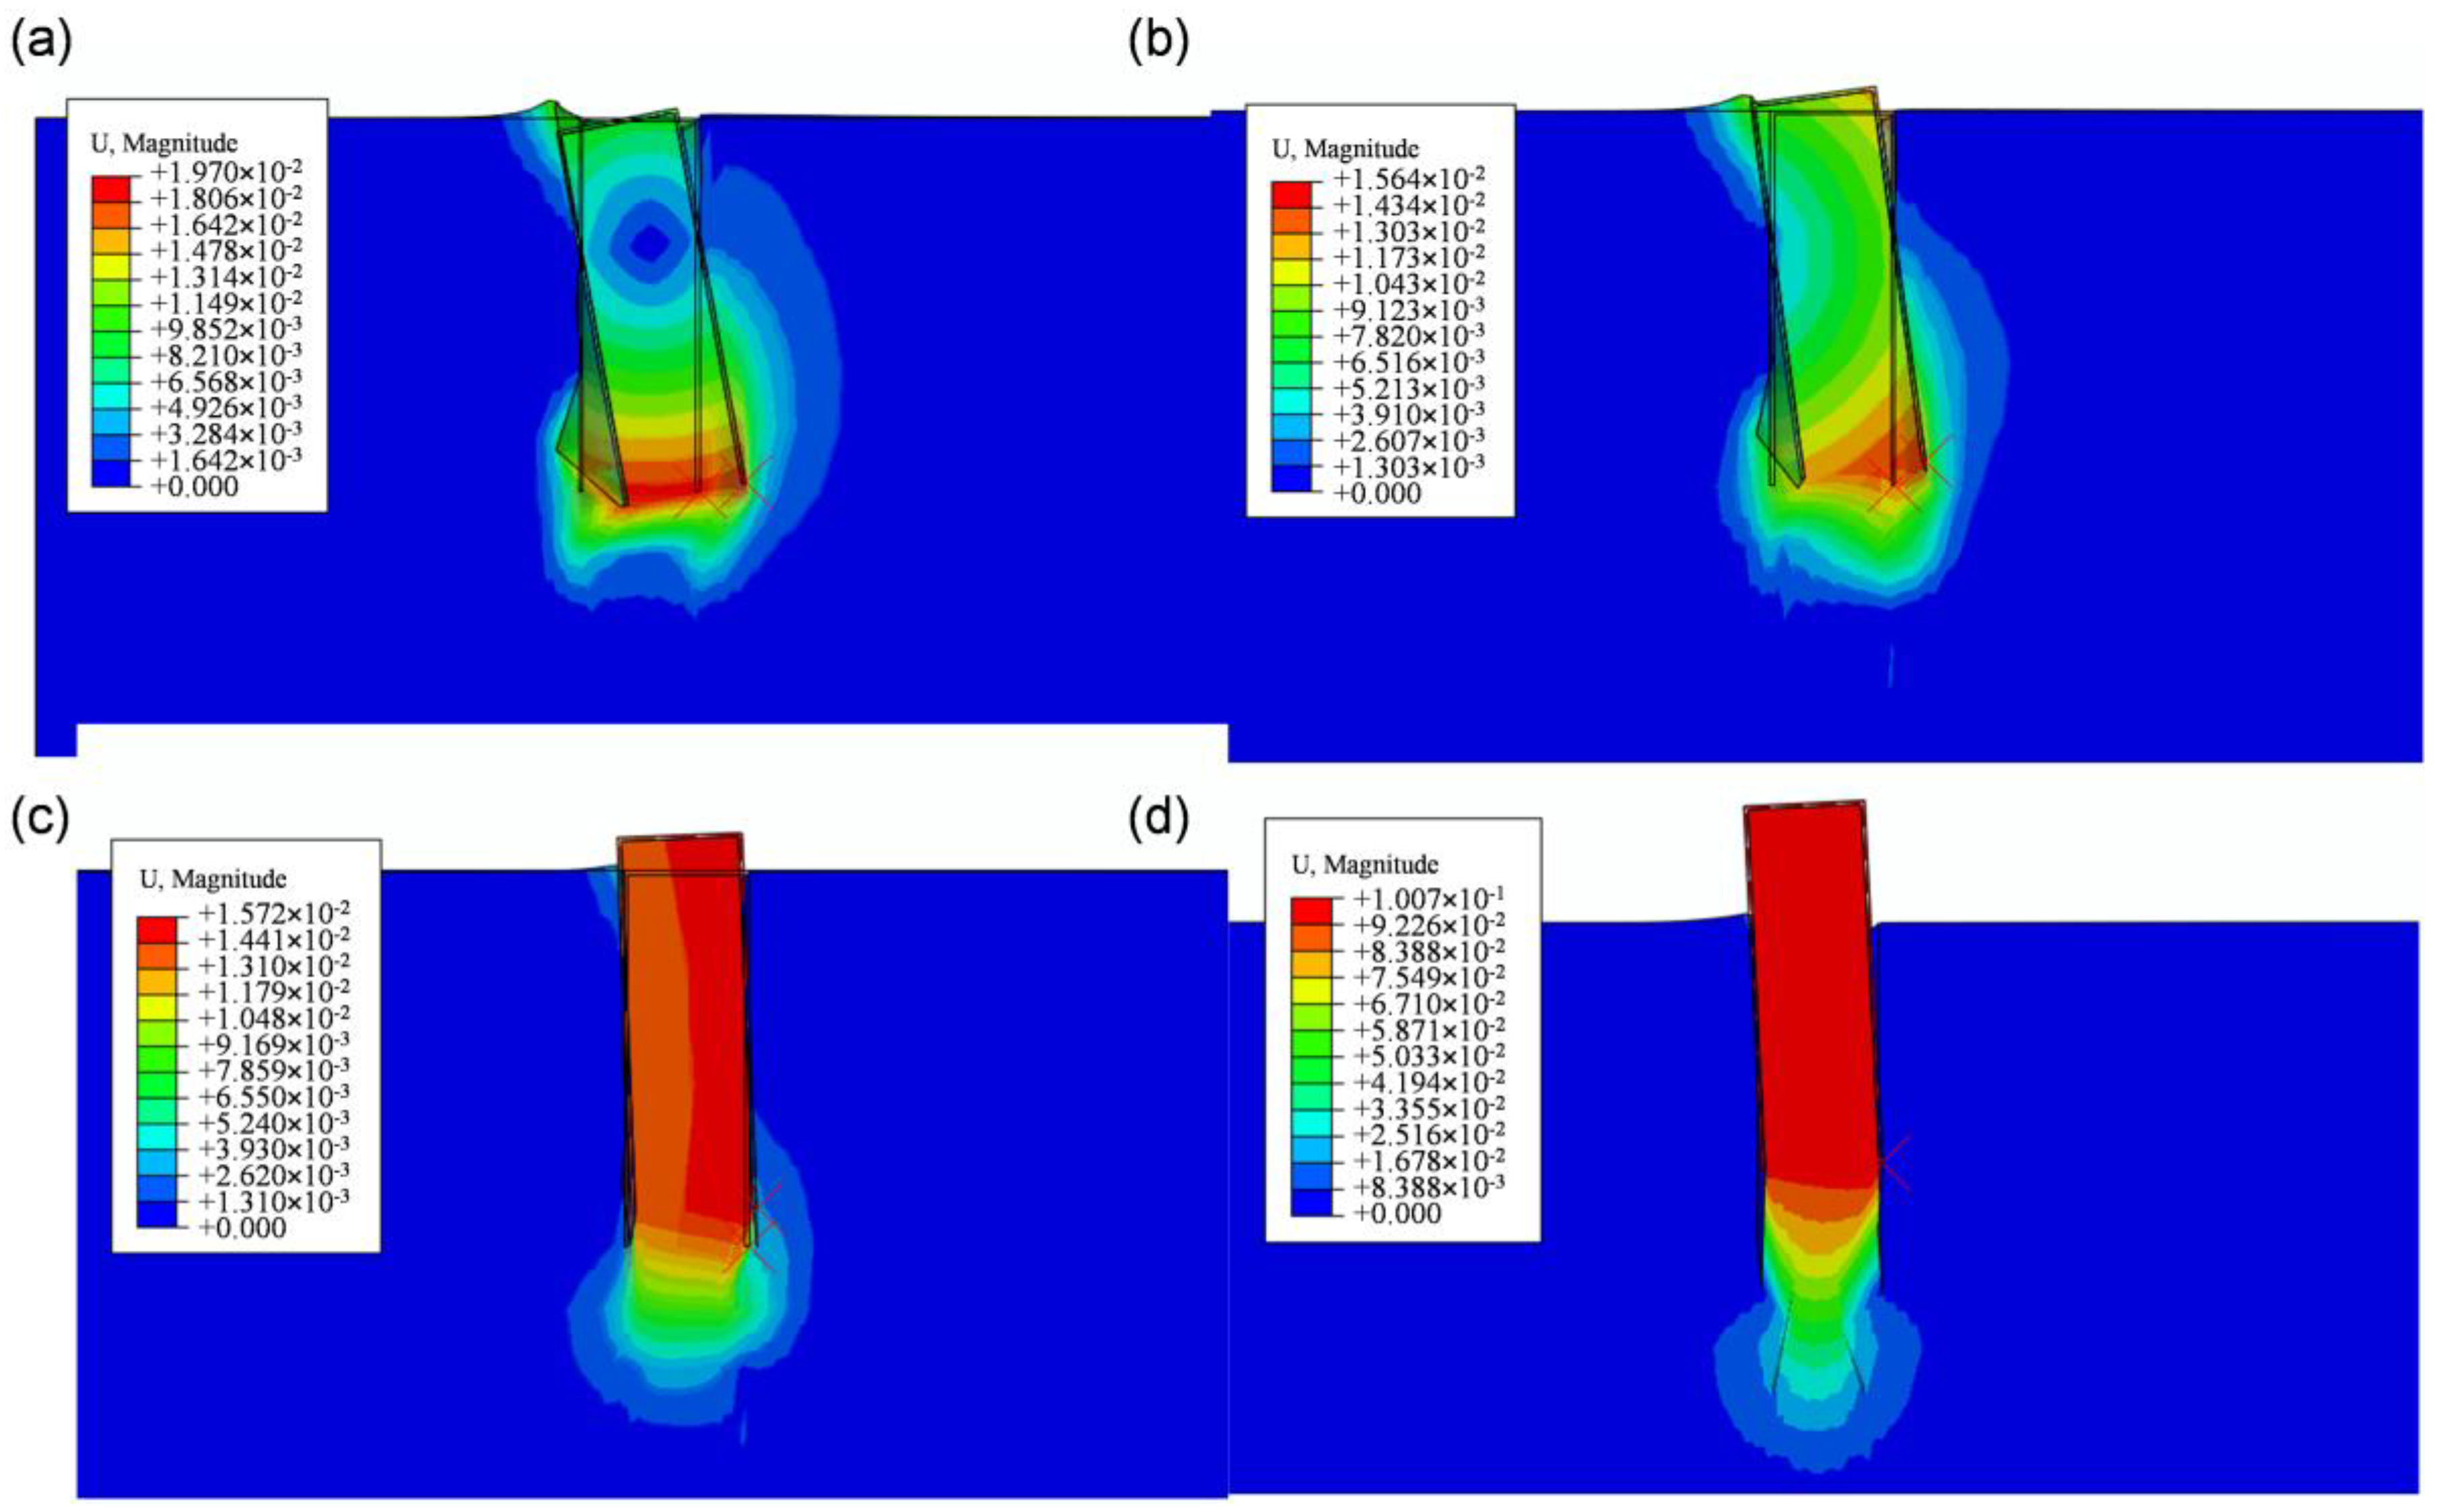
When the load is applied at the bottom of the sidewall (ZP/L = 1.0) (Figure 11), the failure mode exhibits different characteristics. Under 0° loading, the foundation still shows overall overturning failure, the rotation direction changes to counterclockwise, and the maximum displacement is concentrated near the base. In this case, the rotation center is located in the lower–middle part of the foundation, close to the central axis. As the load inclination increases from 30° to 45°, the foundation exhibits a coupled rotation–translation failure mode. At the same time, the rotational amplitude continues to decrease, and the extent of soil cracking and extrusion deformation gradually reduces. When the load inclination reaches 60° and above, the foundation response is dominated by vertical displacement, and the failure mechanism transforms into an overall uplift failure accompanied by slight counterclockwise rotation. Overall, the embedment depth of the loading point has a significant influence on the failure mode of the foundation. The deeper the loading position, the smaller the overturning moment generated by the horizontal load component, leading to weaker rotational effects and a greater tendency for the failure mode to shift toward uplift-dominated behavior. Meanwhile, a change in rotation direction may also occur. These findings indicate that the loading position not only affects the magnitude of bearing capacity but also alters the governing failure mechanism at the ultimate state.

5.2. Effect Factors

5.2.1. Effect of Interface Friction Coefficient on Ultimate Bearing Capacity

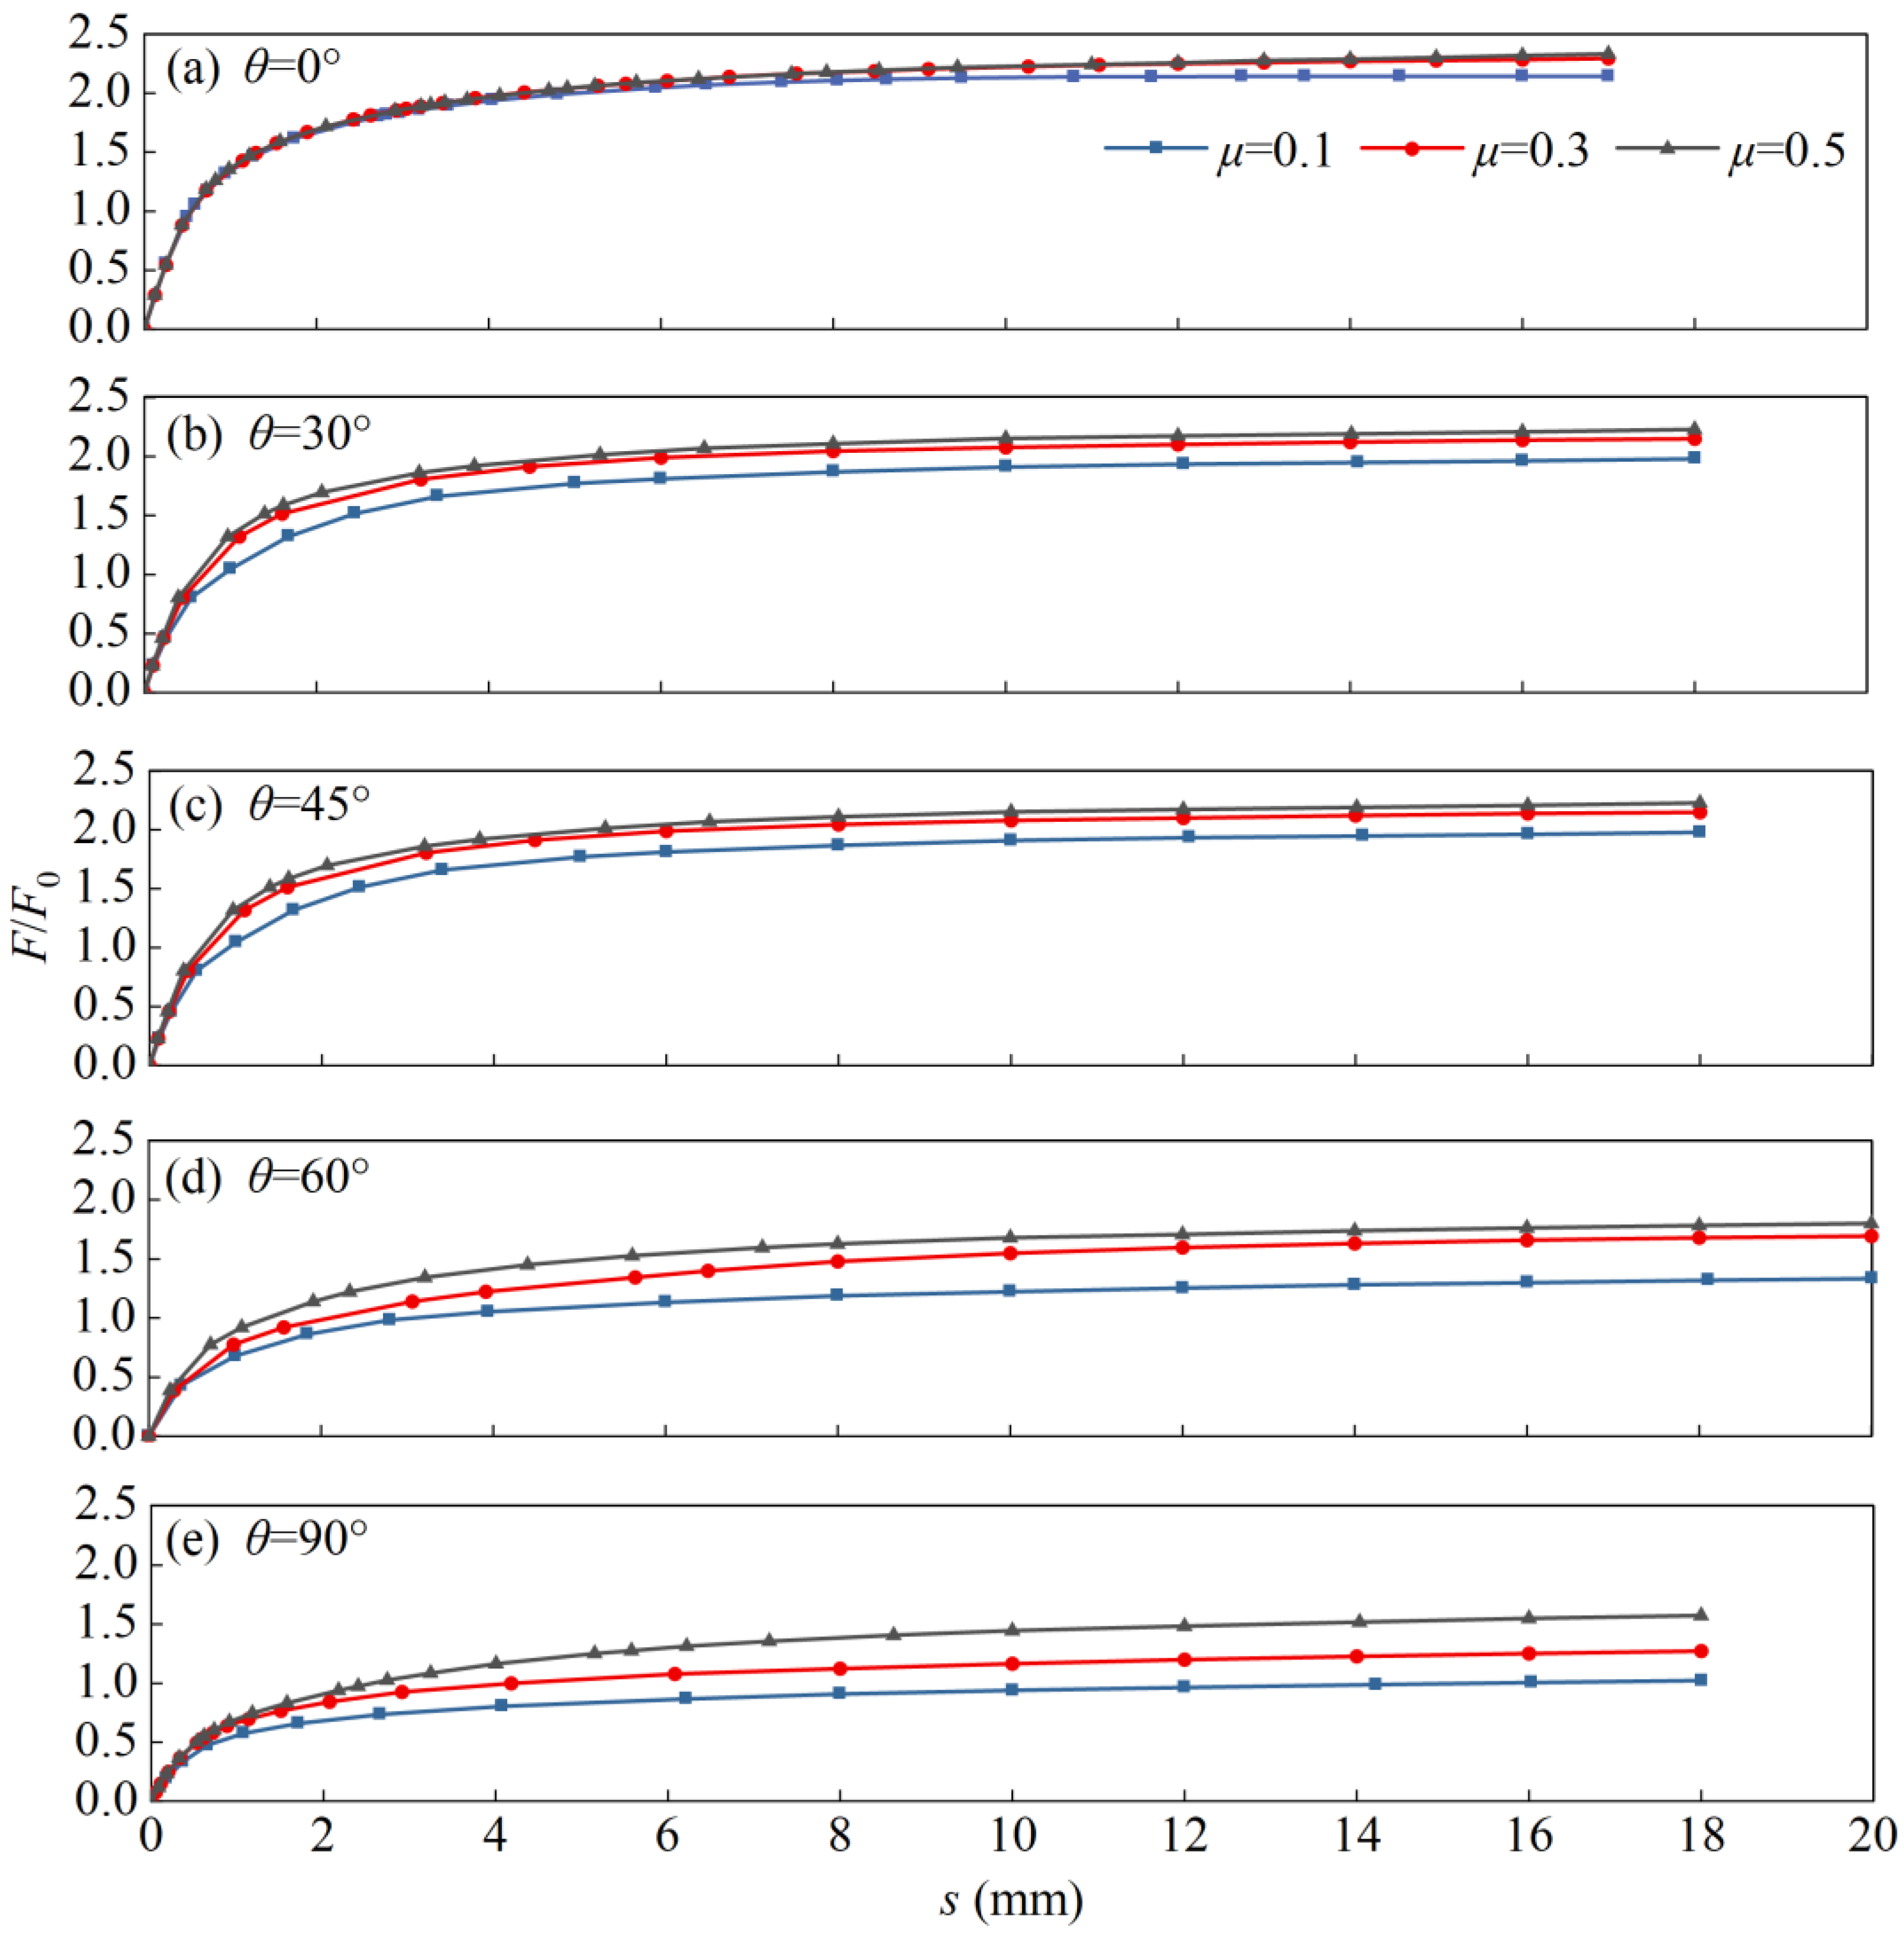
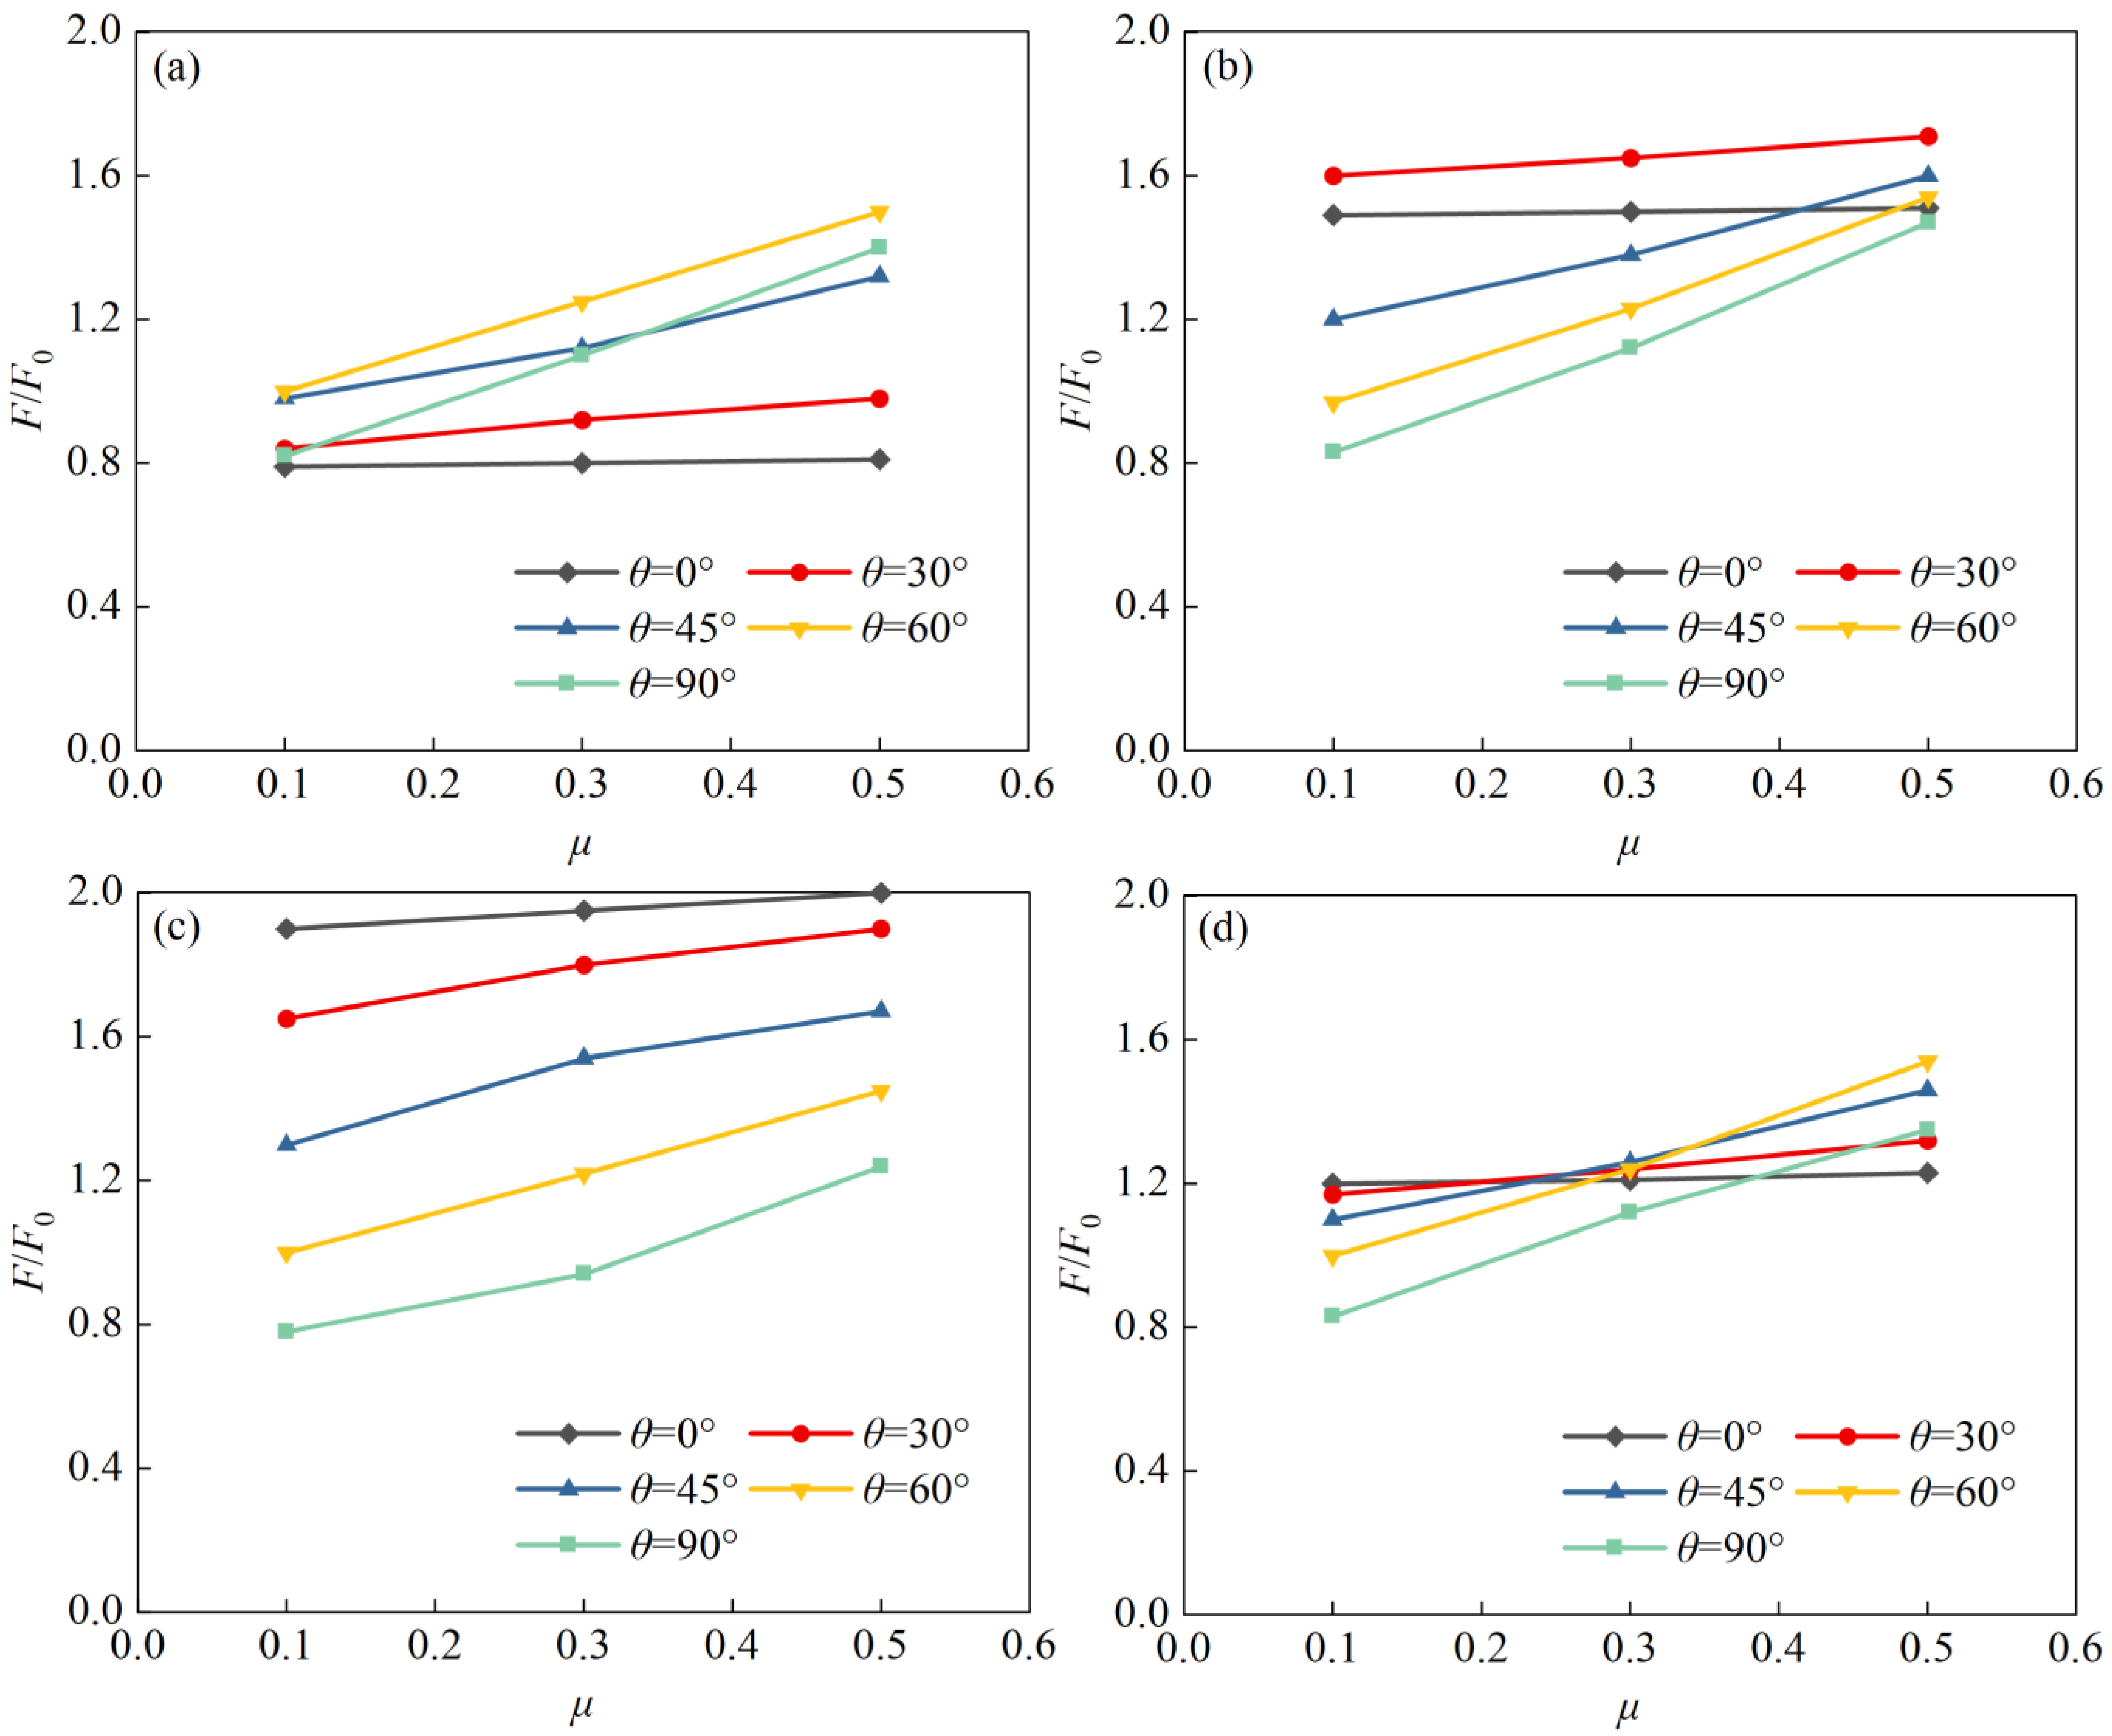
To evaluate the influence of the foundation–soil interface friction coefficient on the inclined ultimate bearing capacity of SCF, numerical analyses were conducted on a foundation model with an aspect ratio of L/D = 3.0 using friction coefficients μ = 0.1, 0.3, and 0.5. The loading point was located at 0.75L along the sidewall, the undrained shear strength of the soil was taken as 10.6 kPa, and the displacement curves under different loading inclinations are presented in Figure 12. The results indicate that increasing the interface friction coefficient enhances the ultimate bearing capacity under all loading inclinations. However, the degree of influence is closely related to the loading direction. Under horizontal loading (0°), the normalized ultimate bearing capacity increases slightly from 1.9 to 2.0, indicating that interface friction contributes minimally to horizontal resistance. In contrast, under vertical uplift loading (90°), the normalized ultimate bearing capacity increases significantly from 0.78 to 1.24, demonstrating that sidewall interface friction is a key component of uplift resistance. Figure 13 further shows that this influence becomes more pronounced as the load inclination increases. Within the range of 0–30°, the ultimate bearing capacity is relatively insensitive to variations in the friction coefficient. In the range of 45–60°, a noticeable increase in ultimate bearing capacity occurs when the friction coefficient increases from 0.1 to 0.3. The greatest increase is observed under the 90° loading condition. Overall, as the proportion of the vertical load component increases, the contribution of interface friction to the bearing mechanism becomes increasingly significant, thereby amplifying the controlling effect of the friction coefficient on the ultimate bearing capacity.

5.2.2. Effect of Aspect Ratio on Ultimate Bearing Capacity

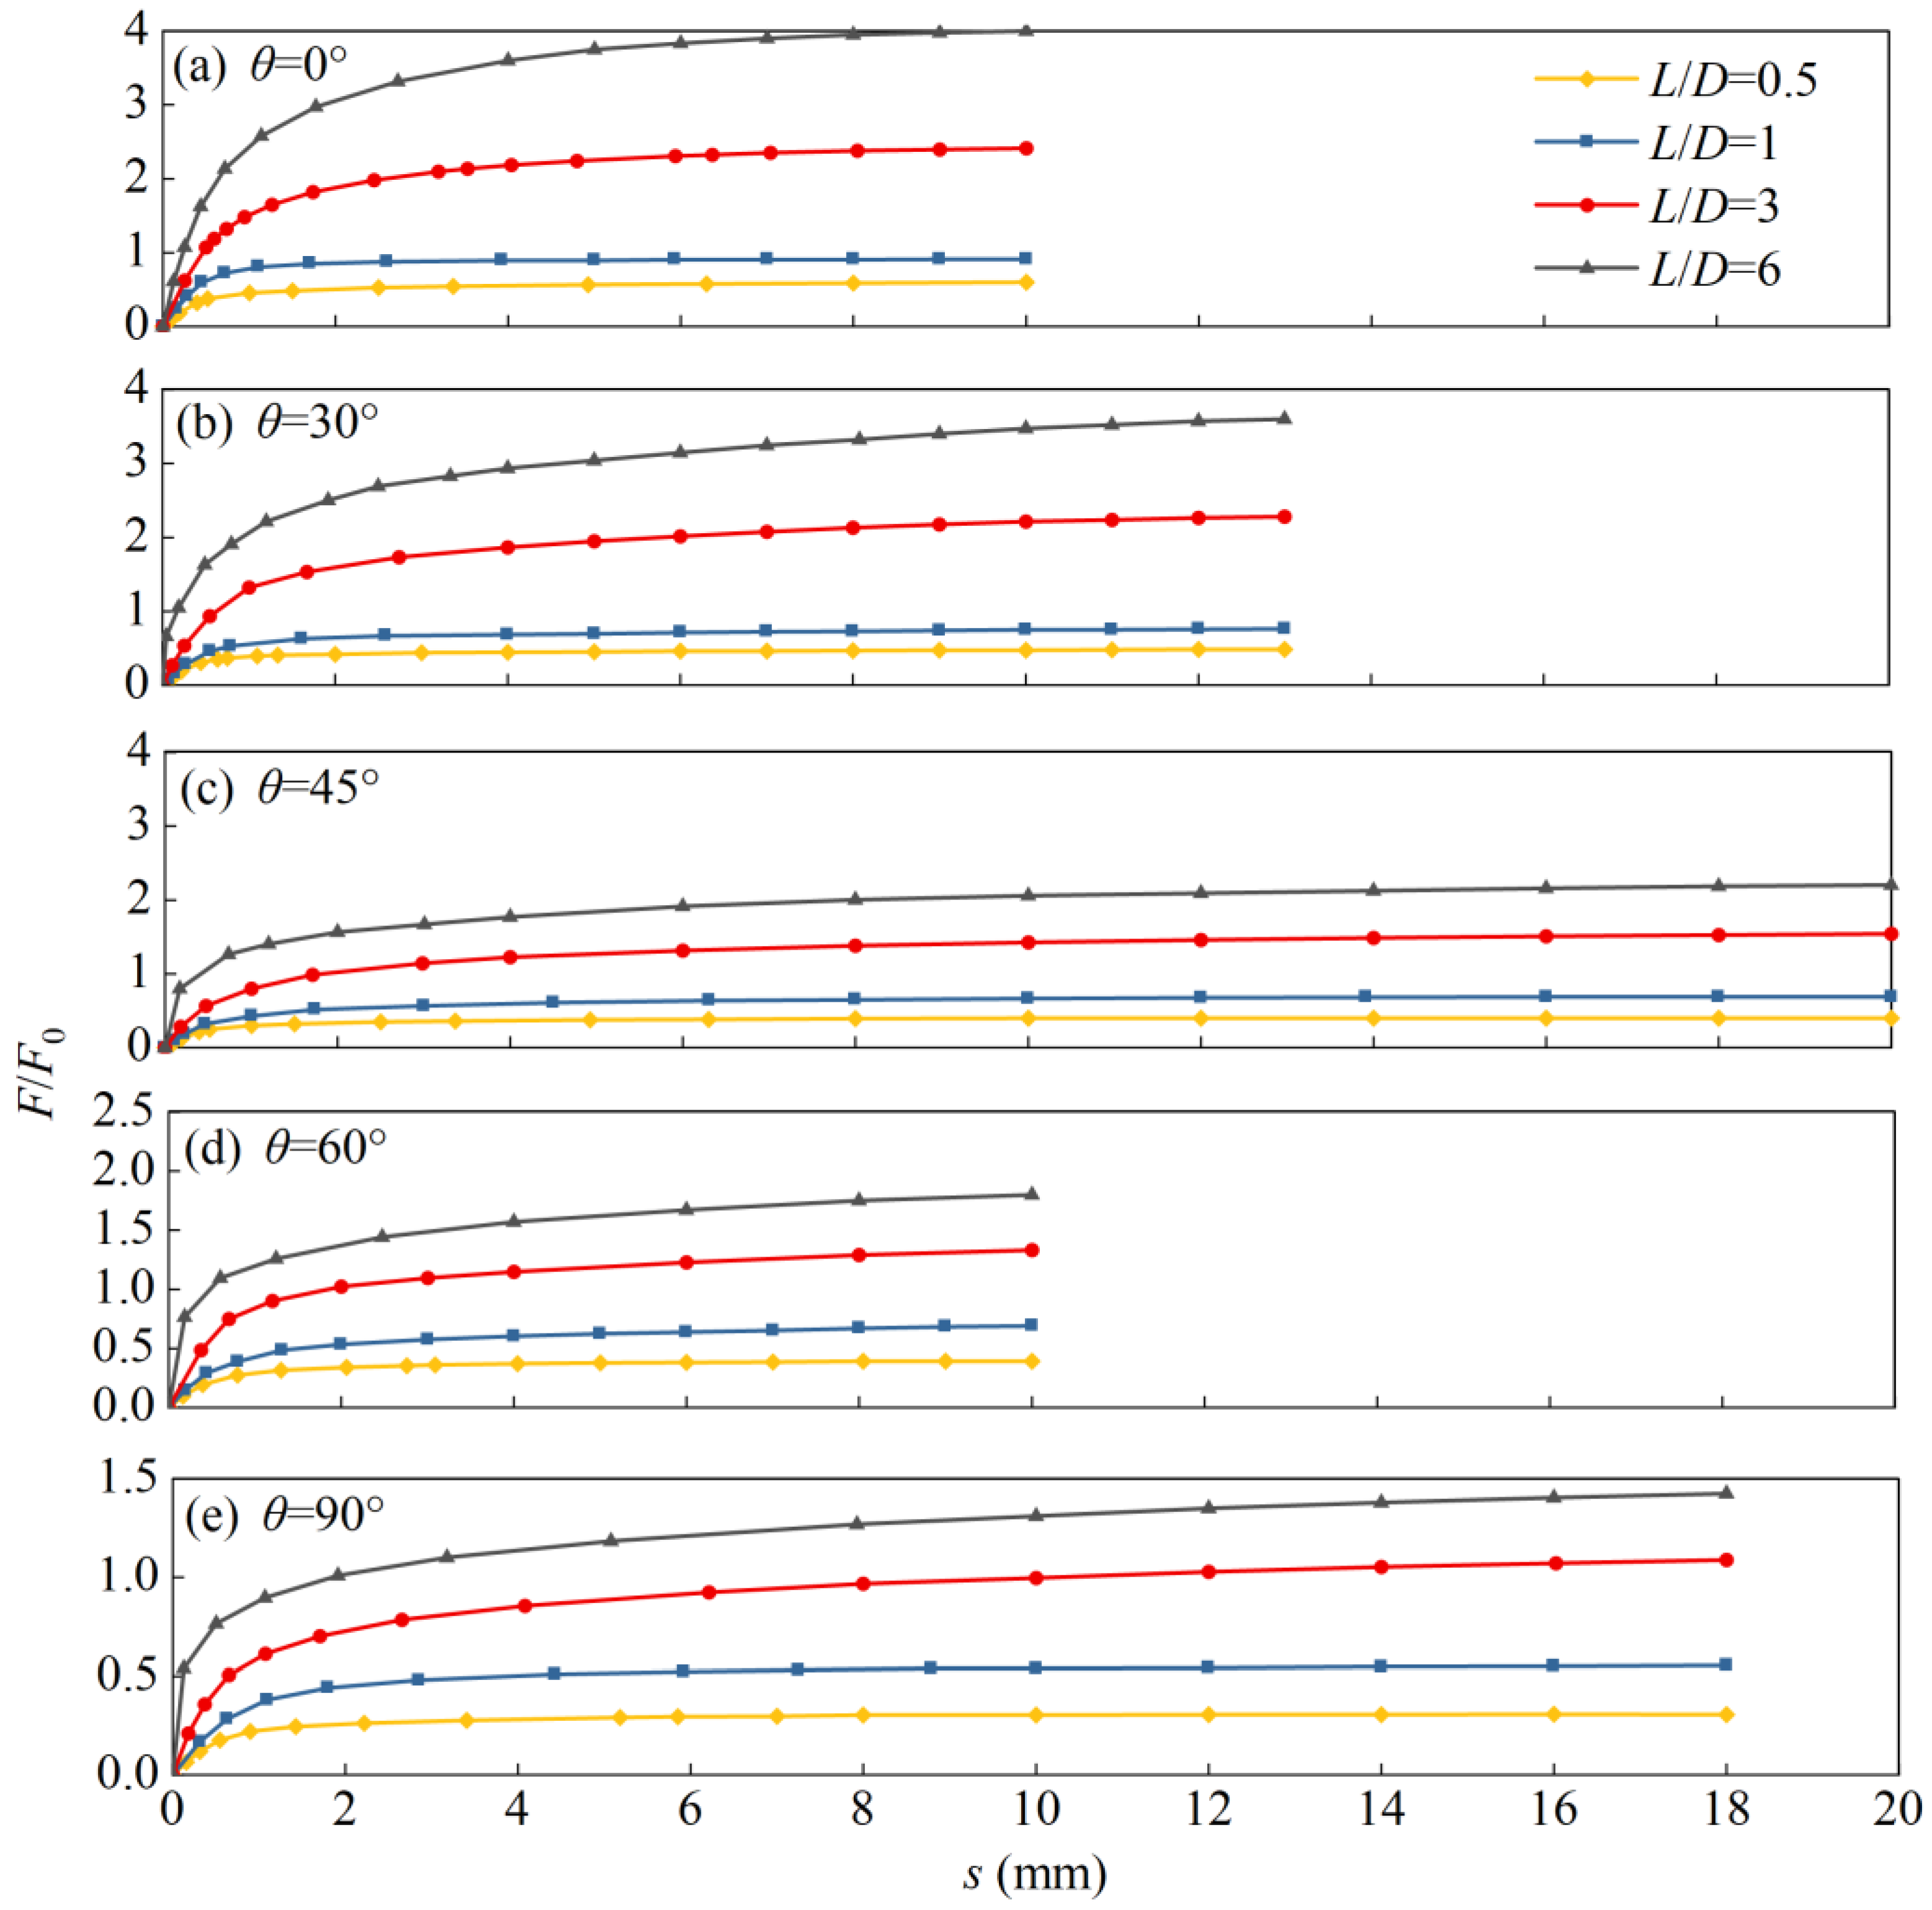
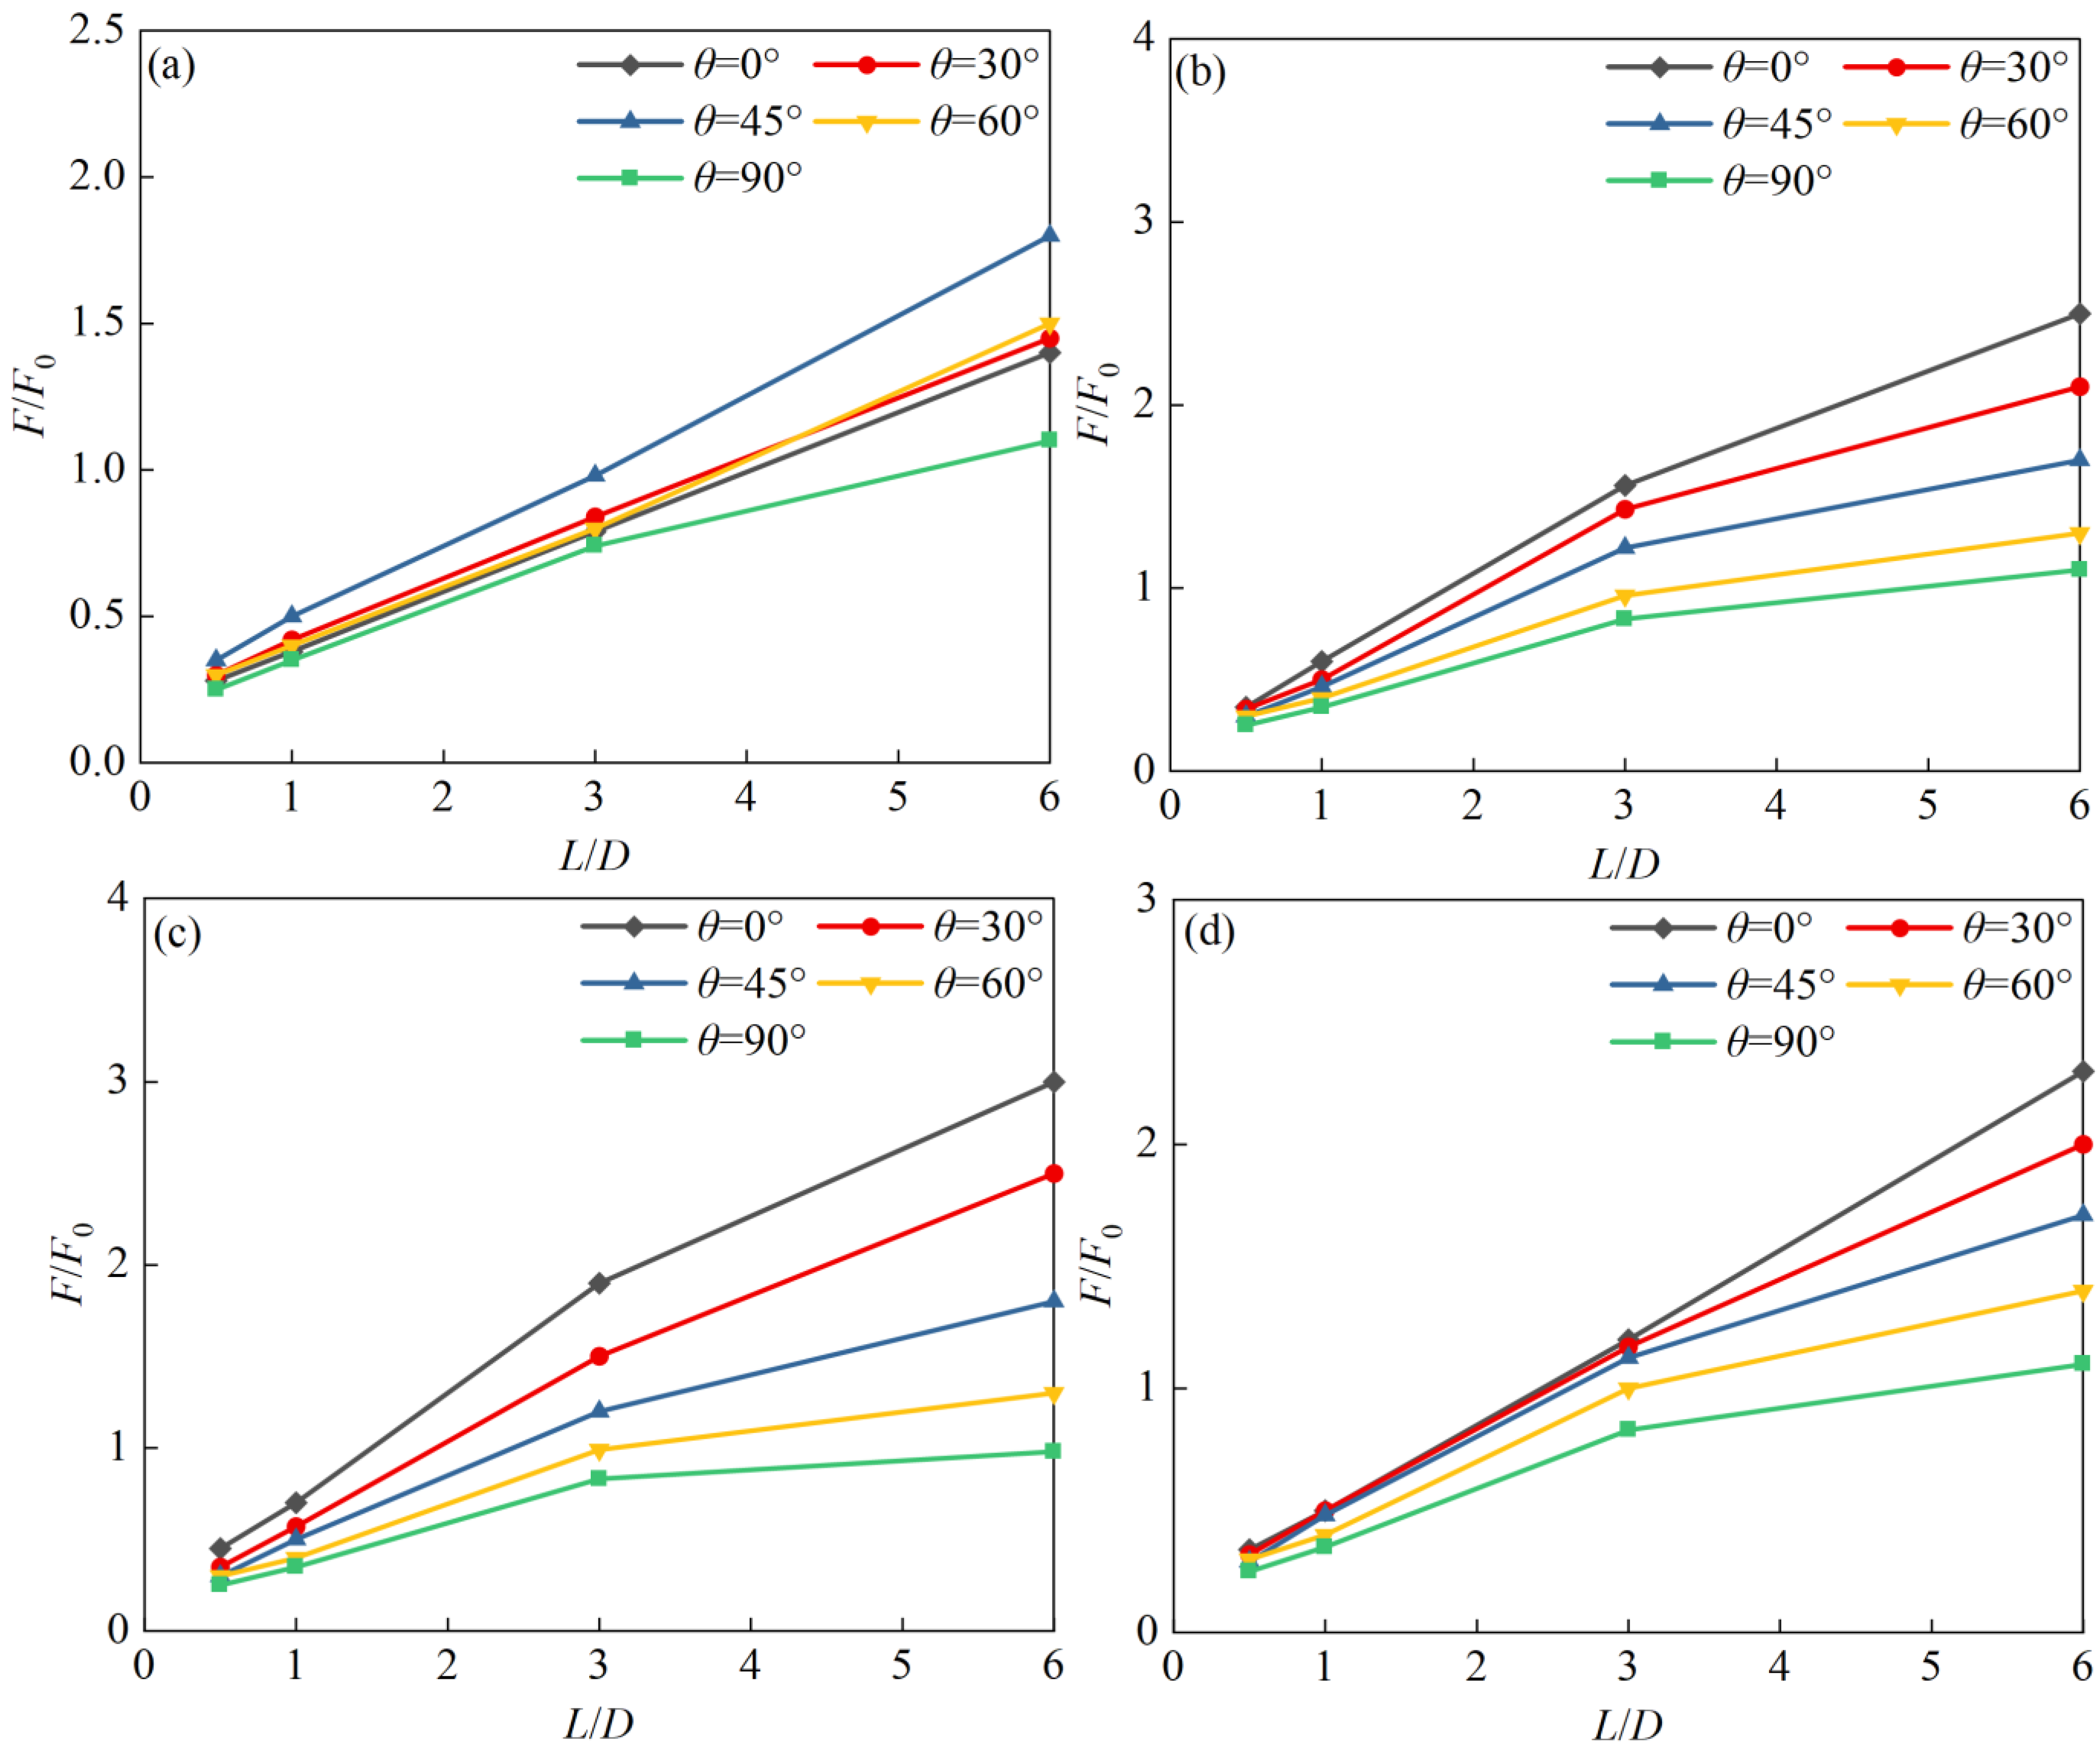
To investigate the influence of the aspect ratio on the inclined ultimate bearing capacity of SCF, numerical models with aspect ratios L/D = 0.5, 1.0, 3.0, and 6.0 were established for bearing capacity analysis. In the models, the interface friction coefficient was set to μ = 0.1, the loading point was located at 0.75L, and the undrained shear strength of the soil was taken as 10.6 kPa. Figure 14 shows that the ultimate bearing capacity increases monotonically with increasing aspect ratio, although the magnitude of increase varies with loading direction. Under horizontal loading (0°), as L/D increases from 0.5 to 6.0, the normalized ultimate bearing capacity increases from 0.45 to 3.0. Under vertical uplift loading (90°), the corresponding value increases from approximately 0.25 to 0.98, indicating an overall increasing trend but with a relatively smaller growth rate, suggesting that the aspect ratio has a more pronounced effect on the horizontal bearing component.
Figure 15 further illustrates the variation in ultimate bearing capacity with aspect ratio under different loading positions and load inclination angles. As the aspect ratio increases from 1.0 to 6.0, the ultimate bearing capacity increases continuously under all loading inclinations, with larger increments at smaller inclinations. Under the 90° loading condition, the ultimate bearing capacity also increases with the aspect ratio, although at a lower rate. This trend is primarily attributed to increased sidewall embedment depth and interface contact area resulting from a larger aspect ratio. On the one hand, a larger sidewall area can mobilize greater lateral soil resistance, thereby significantly enhancing horizontal and inclined bearing capacities. On the other hand, under uplift loading, the sidewall frictional resistance increases with embedment depth, leading to a corresponding increase in vertical bearing capacity. Overall, for loading directions ranging from 0° to 90°, increasing the aspect ratio effectively improves the bearing capacity of the suction caisson foundation, with the strengthening effect being more pronounced under loading conditions dominated by horizontal components.

5.2.3. Effect of Soil Undrained Shear Strength on Ultimate Bearing Capacity

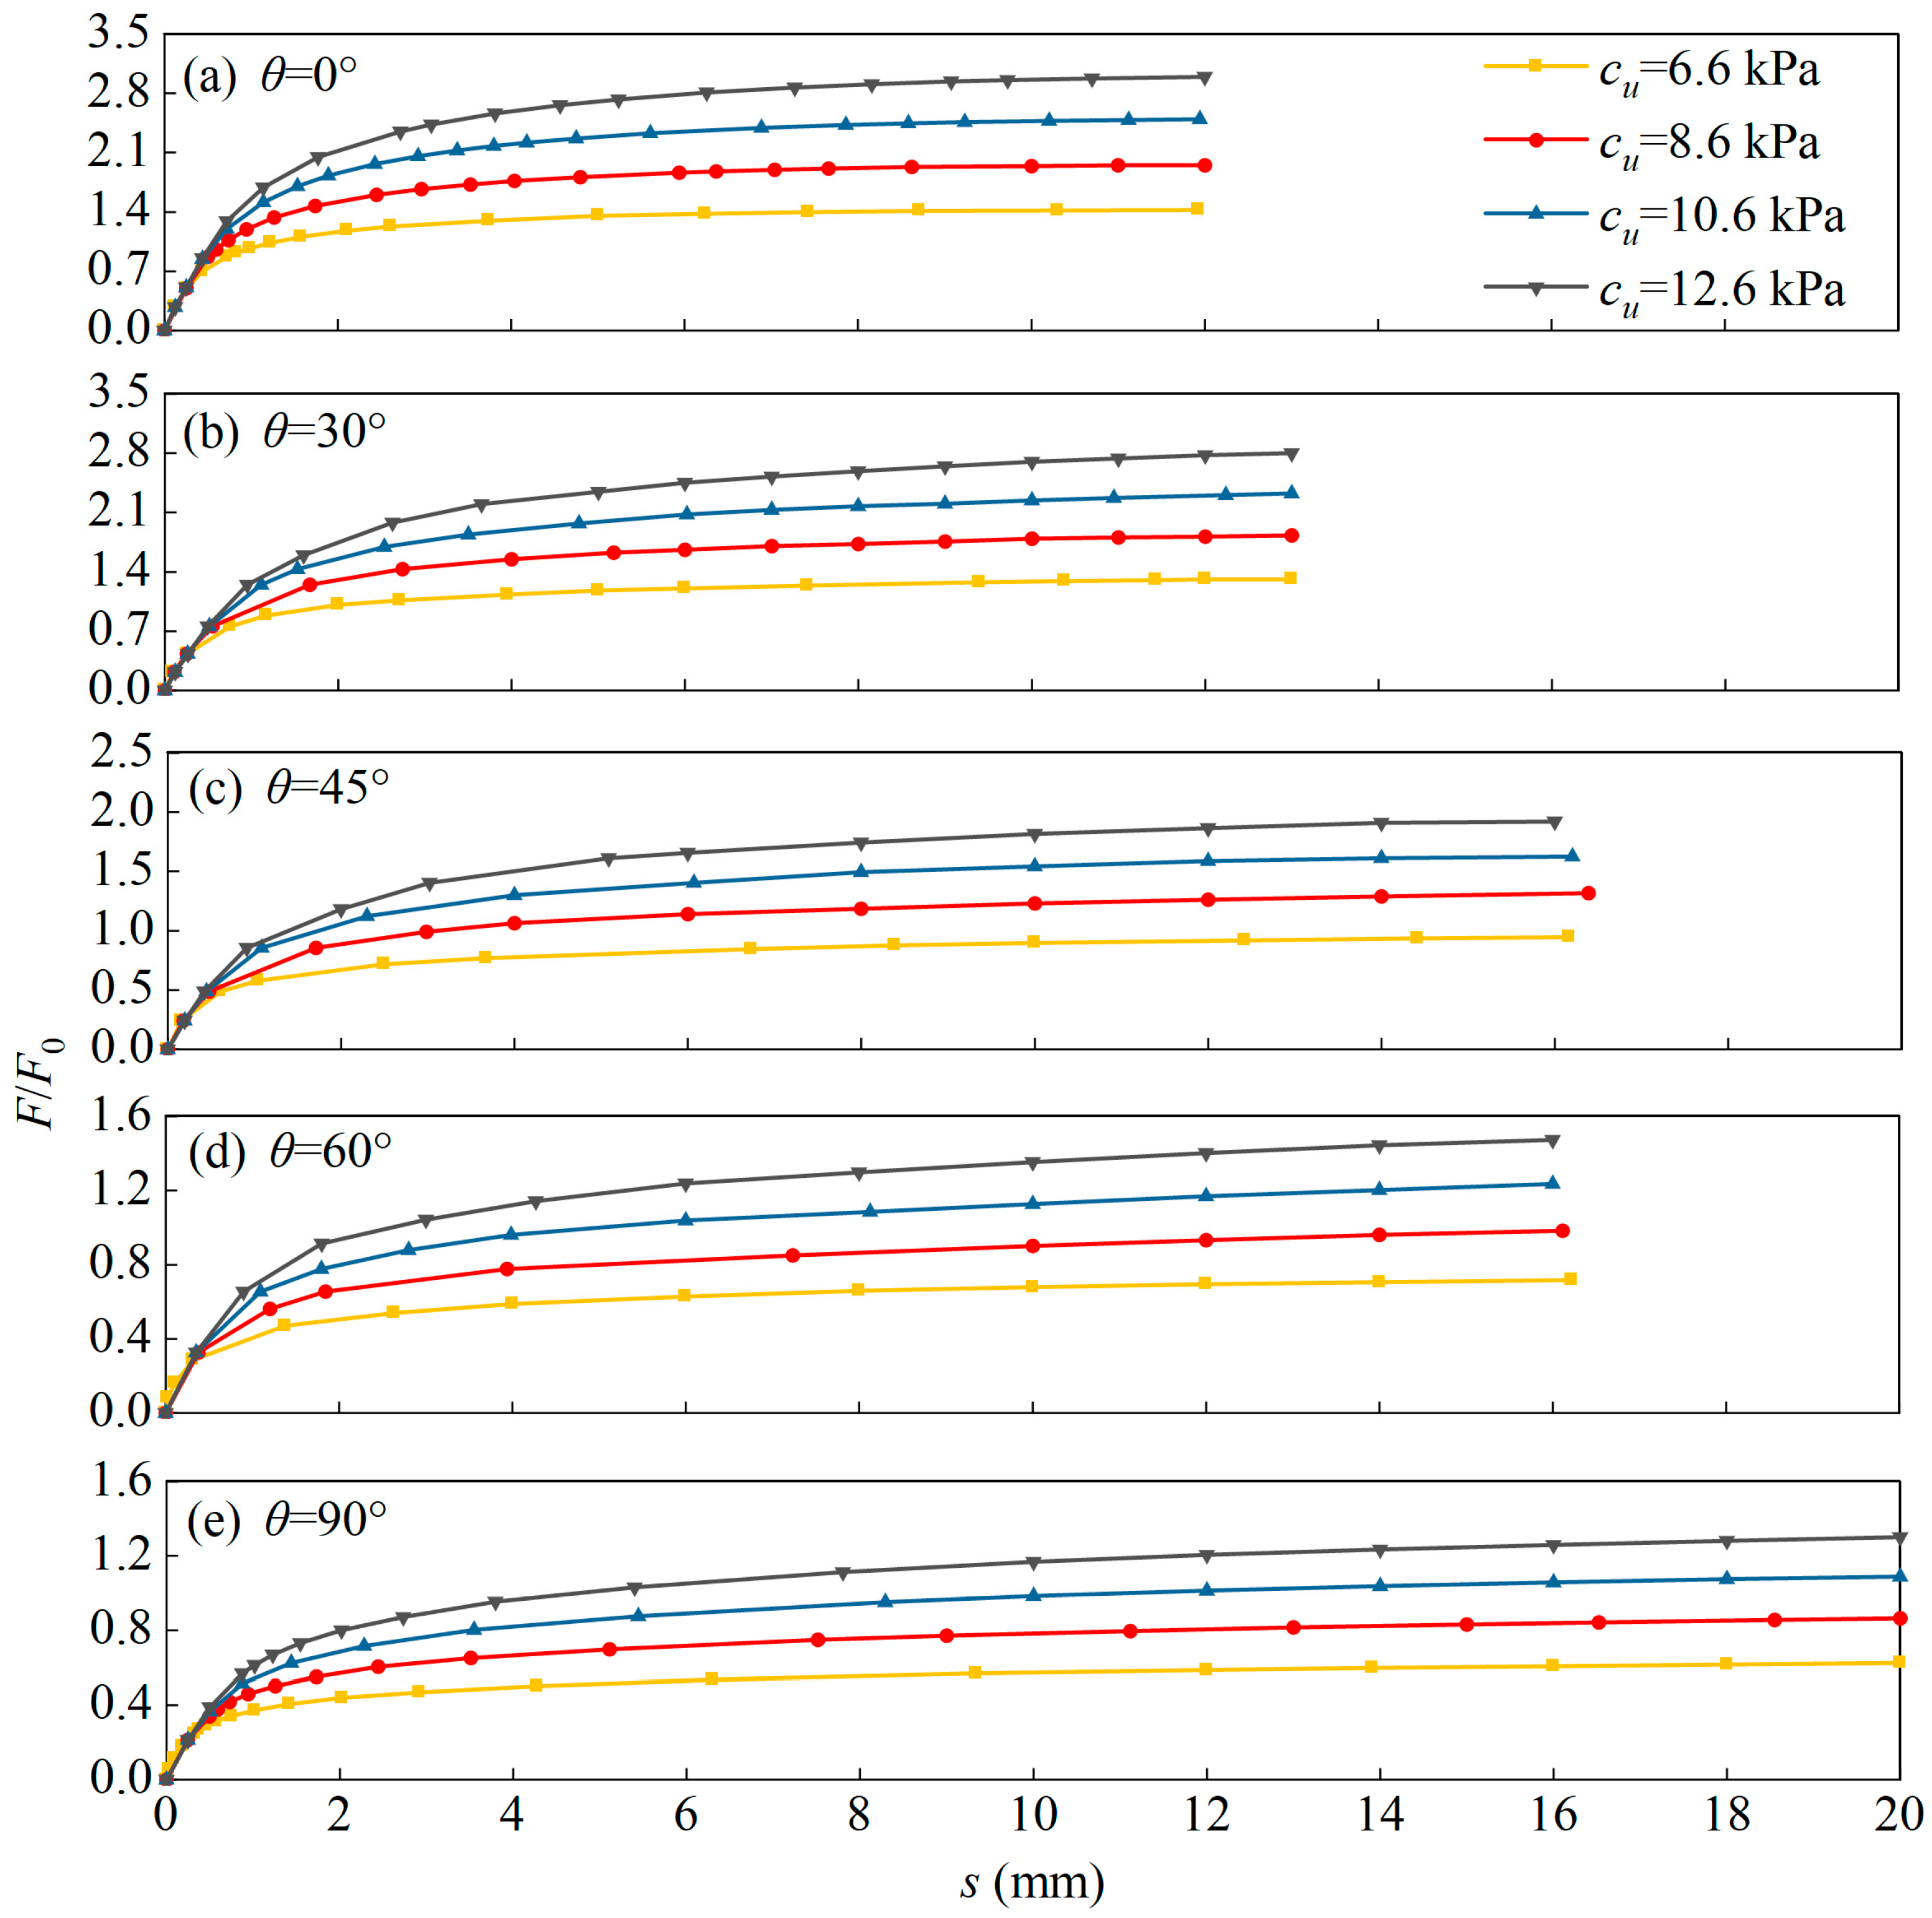
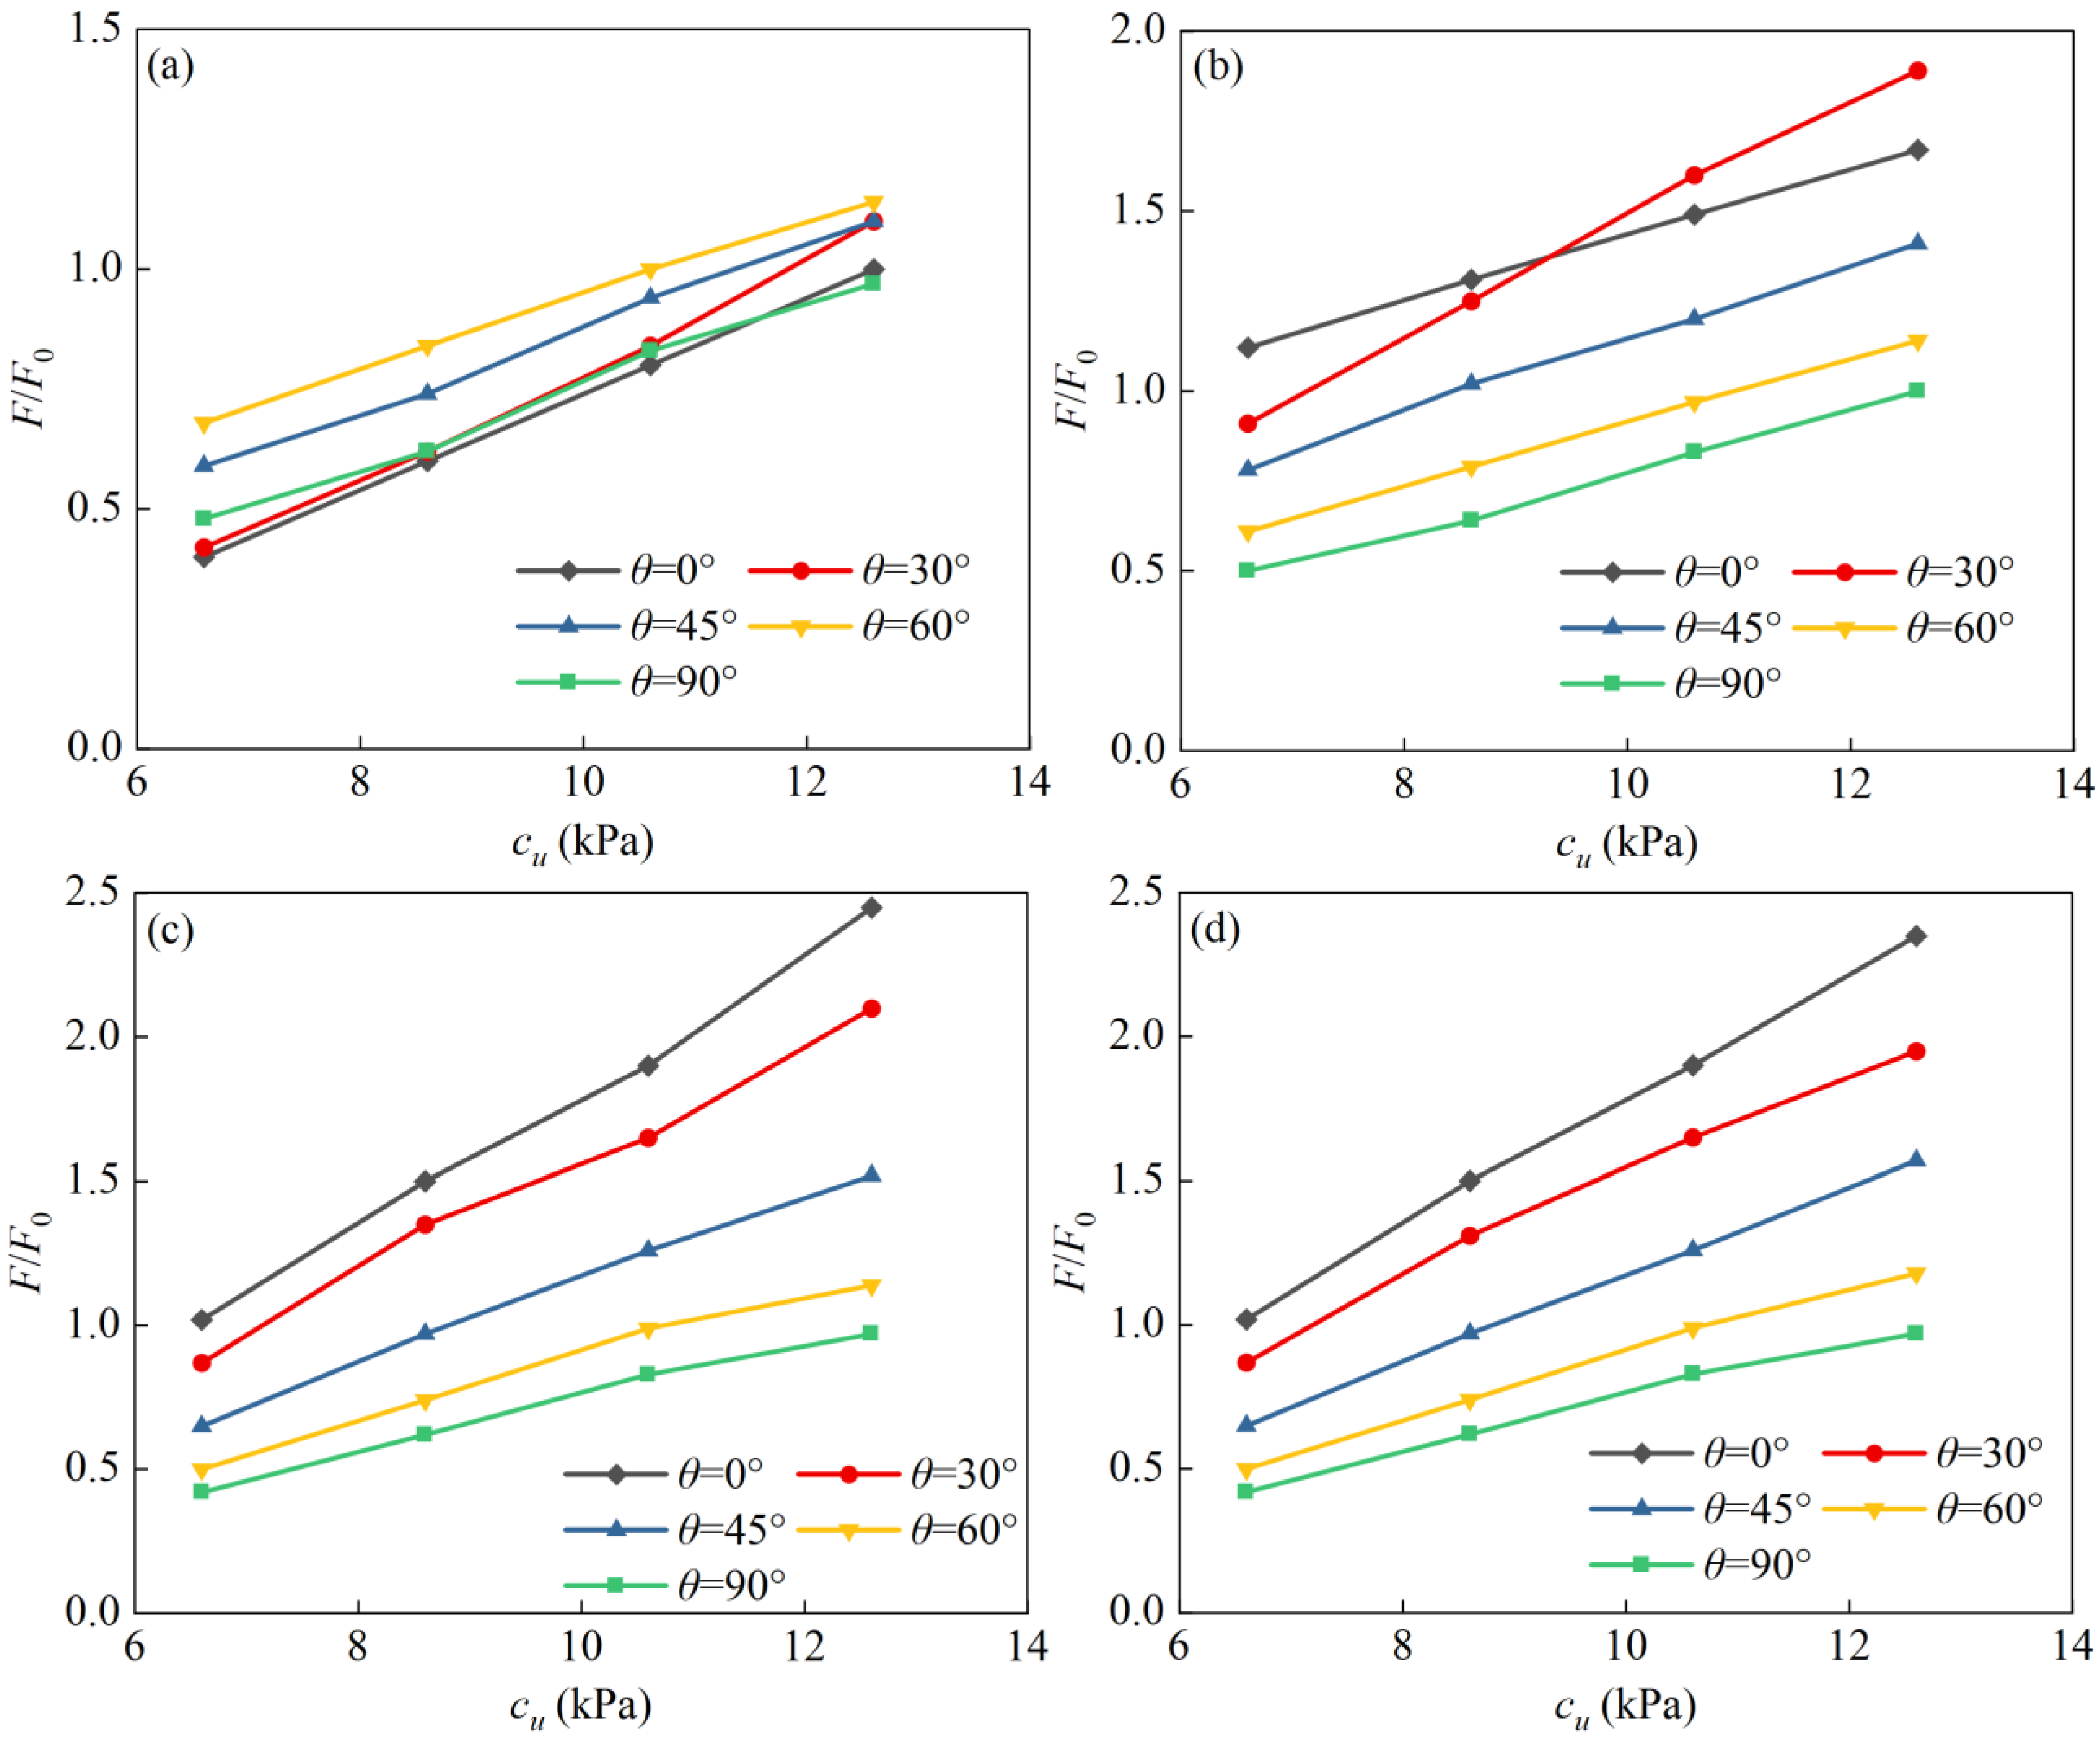
To investigate the effect of soil undrained shear strength on the ultimate bearing capacity of the SCF, numerical simulations were conducted with undrained shear strengths of cu = 6.6, 8.6, 10.6, and 12.6 kPa. The foundation aspect ratio was L/D = 3.0, the interface friction coefficient was μ = 0.1, and the loading point was located at 0.75L. Figure 16 shows that under all loading inclination angles, the ultimate bearing capacity increases monotonically with increasing soil undrained shear strength. Under horizontal loading (0°), when cu increases from 6.6 kPa to 12.6 kPa, the normalized ultimate bearing capacity rises from 1.02 to 2.45; under vertical uplift loading (90°), it increases from 0.42 to 0.97. Evidently, whether the loading condition is dominated by horizontal or vertical components, soil strength exerts a significant controlling effect on the ultimate bearing capacity of the foundation.
Figure 17 further presents the relationship between bearing capacity and soil strength under different loading point positions and loading inclination angles. Overall, for loading directions ranging from 0° to 90°, the ultimate bearing capacity exhibits an approximately linear increase with increasing undrained shear strength, and similar trends are observed at different loading positions. As the undrained shear strength increases, the mobilized shear resistance and lateral confinement capacity of the surrounding soil are enhanced simultaneously, thereby increasing the contributions of side resistance and end bearing resistance, ultimately leading to an overall improvement in bearing capacity in all directions.

6. Ultimate Bearing Capacity Envelope of the Suction Caisson Foundation

6.1. The V–H Ultimate Bearing Capacity Envelope of the Suction Caisson Foundation

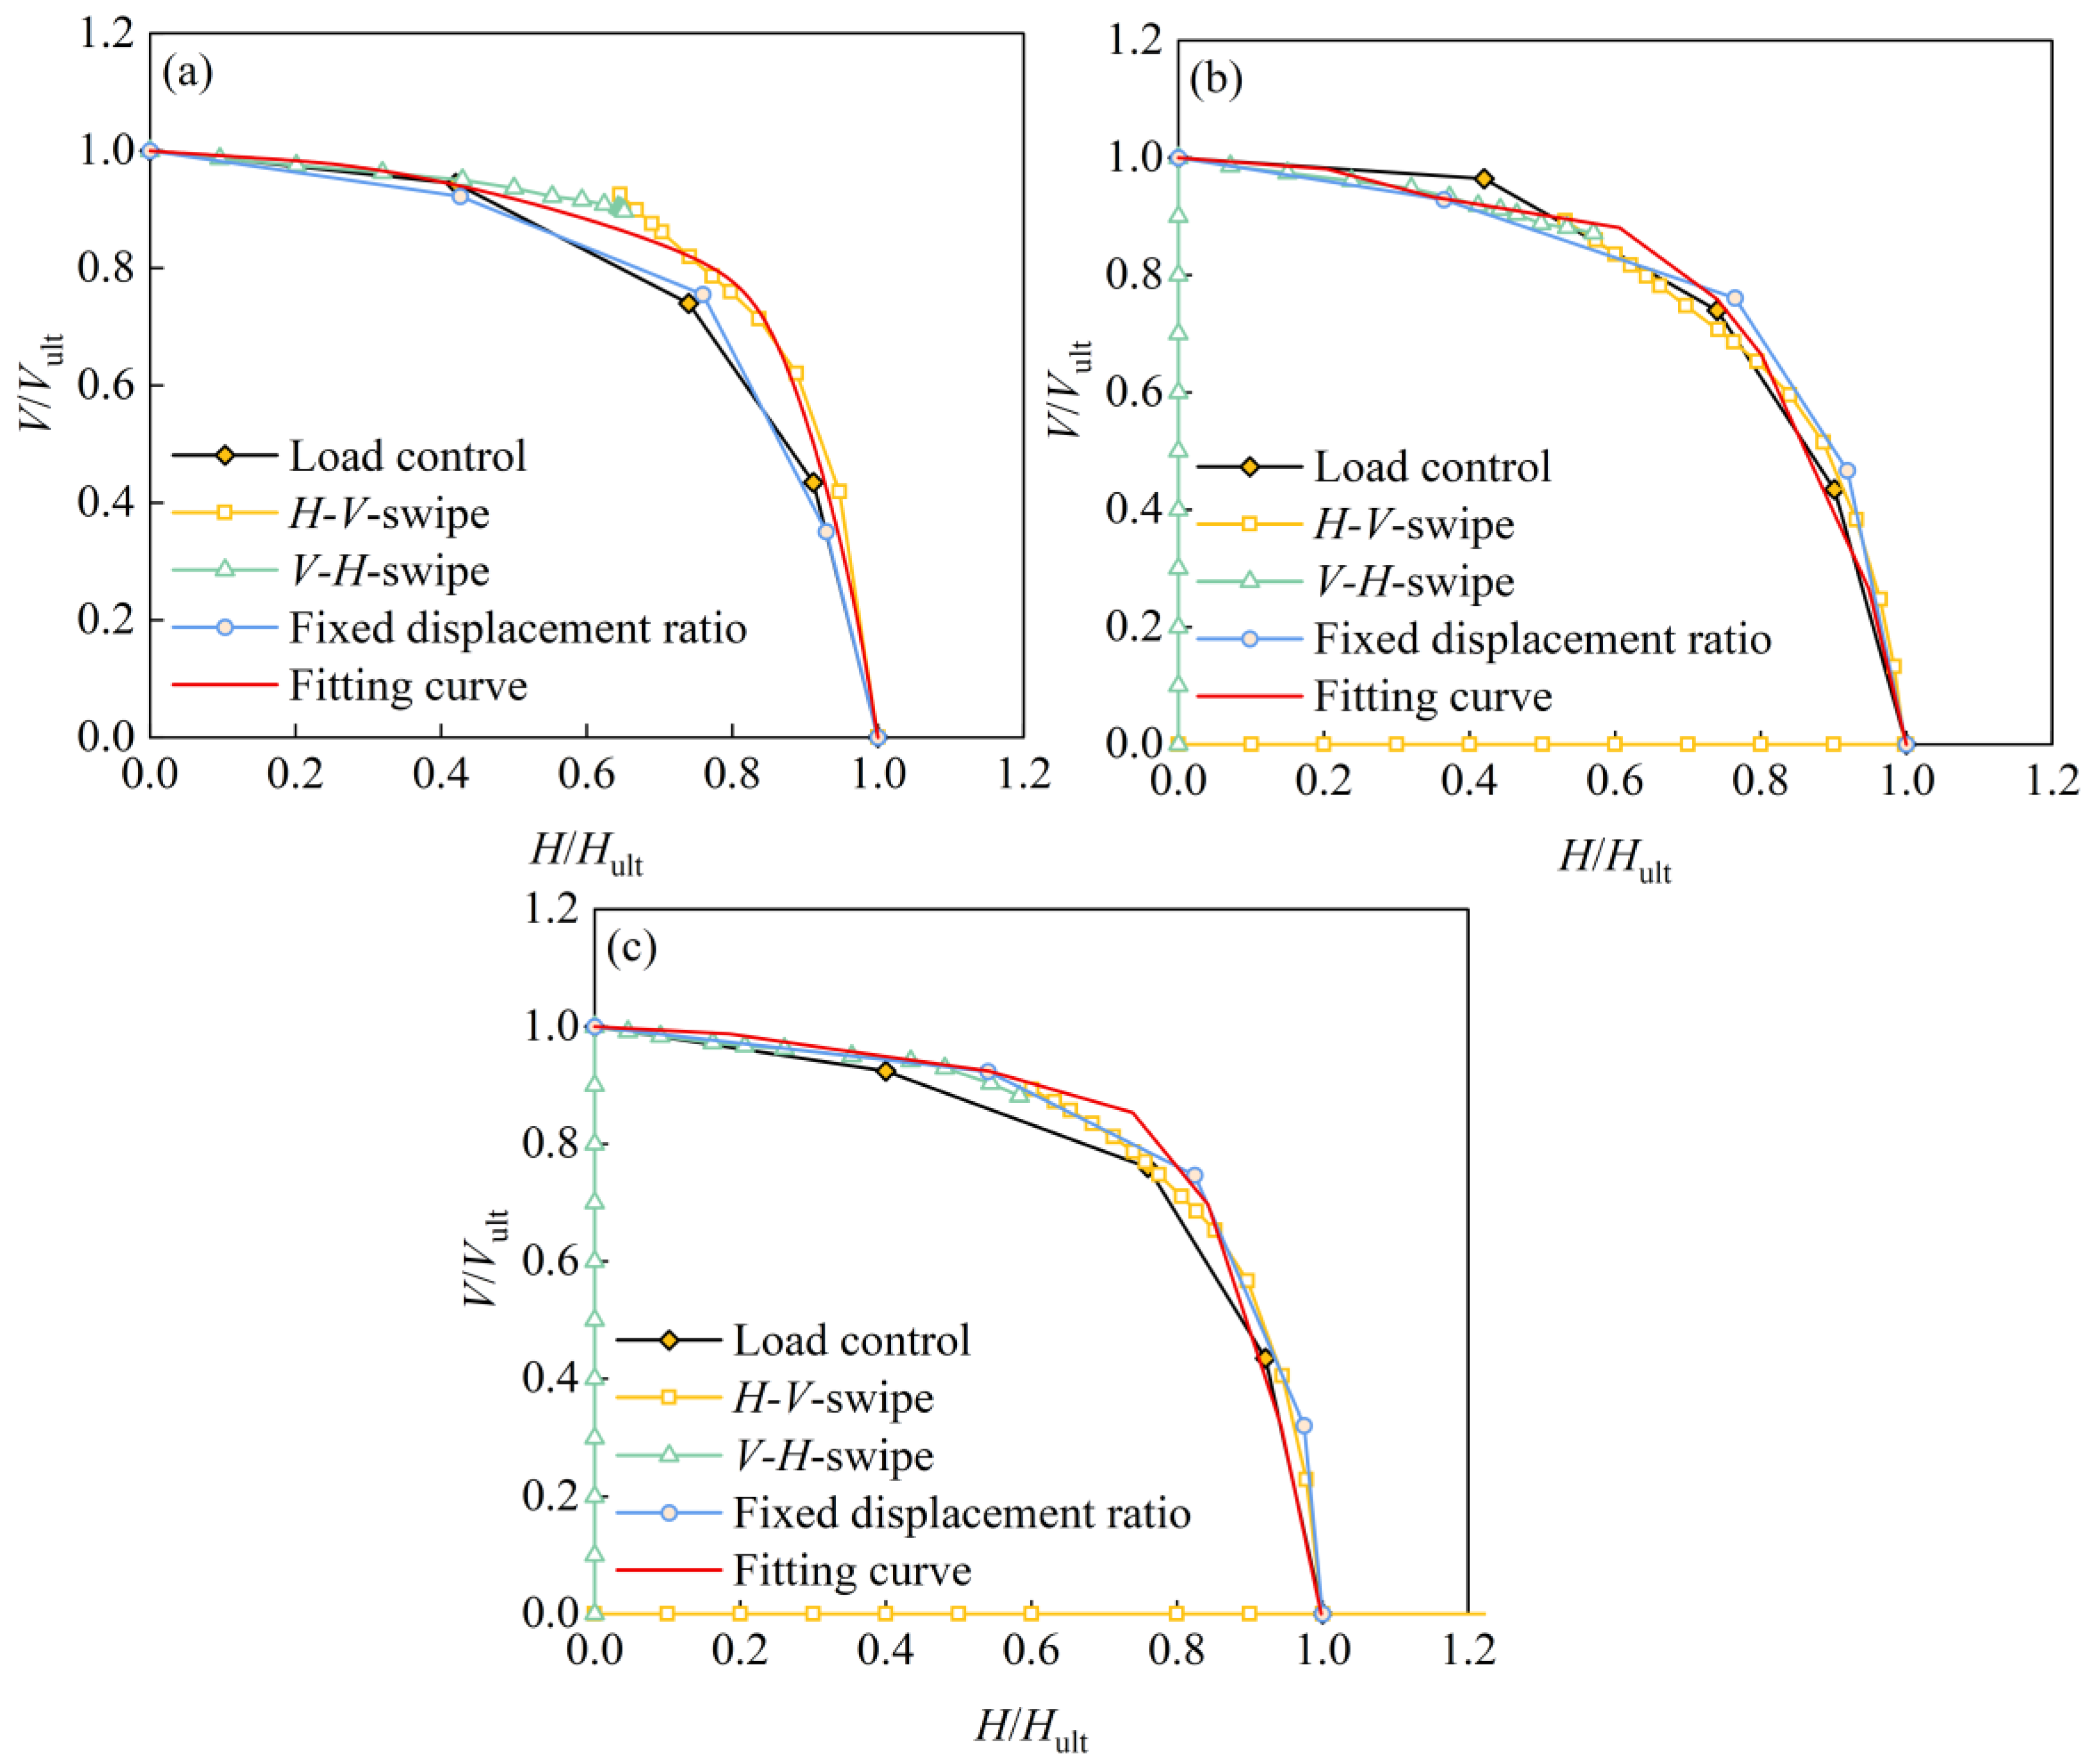
In practical engineering, when a suction caisson foundation is used as a mooring anchor, the anchor eye is typically installed at the mooring point location [54]. Therefore, the ultimate bearing capacity envelope at this location is of significant importance for structural design. For foundations with different aspect ratios (L/D = 1.0, 3.0, and 6.0), numerical analyses were conducted at a loading depth of ZP/L = 0.75 using load-controlled loading mode [55], swipe displacement loading mode [56], and fixed displacement ratio loading mode [57], and the corresponding V–H ultimate bearing capacity envelopes were constructed.
Figure 18 presents the V–H bearing capacity envelopes for different aspect ratios. Under the load-controlled loading mode, since the incremental ratio between vertical and horizontal components remains constant during loading, the reaction force paths in the V–H plane appear as straight lines, and the ultimate points determined from different loading angles are enveloped to form the bearing capacity envelope. The swipe displacement loading mode includes both H–V swipe and V–H swipe paths. The results indicate that this method can approximate the failure boundary in most cases, although discontinuities or local deficiencies of the envelope may occur in certain regions. This phenomenon is mainly attributed to unstable plastic zone development under path-controlled loading and the path dependency of numerical convergence. Under the fixed displacement ratio loading mode, the foundation–soil system initially remains in an approximately elastic response stage, and the reaction force path develops linearly in the V–H space. As displacement continues to increase, the soil gradually enters the plastic state. The reaction force path then begins to curve and progressively approaches the failure boundary, ultimately forming a complete envelope curve. Compared with the load-controlled results, this method provides a more continuous distribution of ultimate points.
The bearing capacity envelopes obtained from the load-controlled mode and the fixed displacement ratio mode agree well, showing high consistency in envelope shape and ultimate boundary position, demonstrating their mutual validation for ultimate bearing capacity evaluation. From the overall trends for different aspect ratios, increasing the aspect ratio causes the V–H bearing capacity envelope to expand outward, indicating a simultaneous enhancement of the foundation’s load-carrying capacity in the combined load space. Meanwhile, outward expansion in regions with high vertical components is relatively limited. In contrast, the increase is more pronounced in regions with high horizontal components, reflecting the increasingly significant contributions of sidewall friction and embedment depth to combined bearing capacity as the aspect ratio increases.
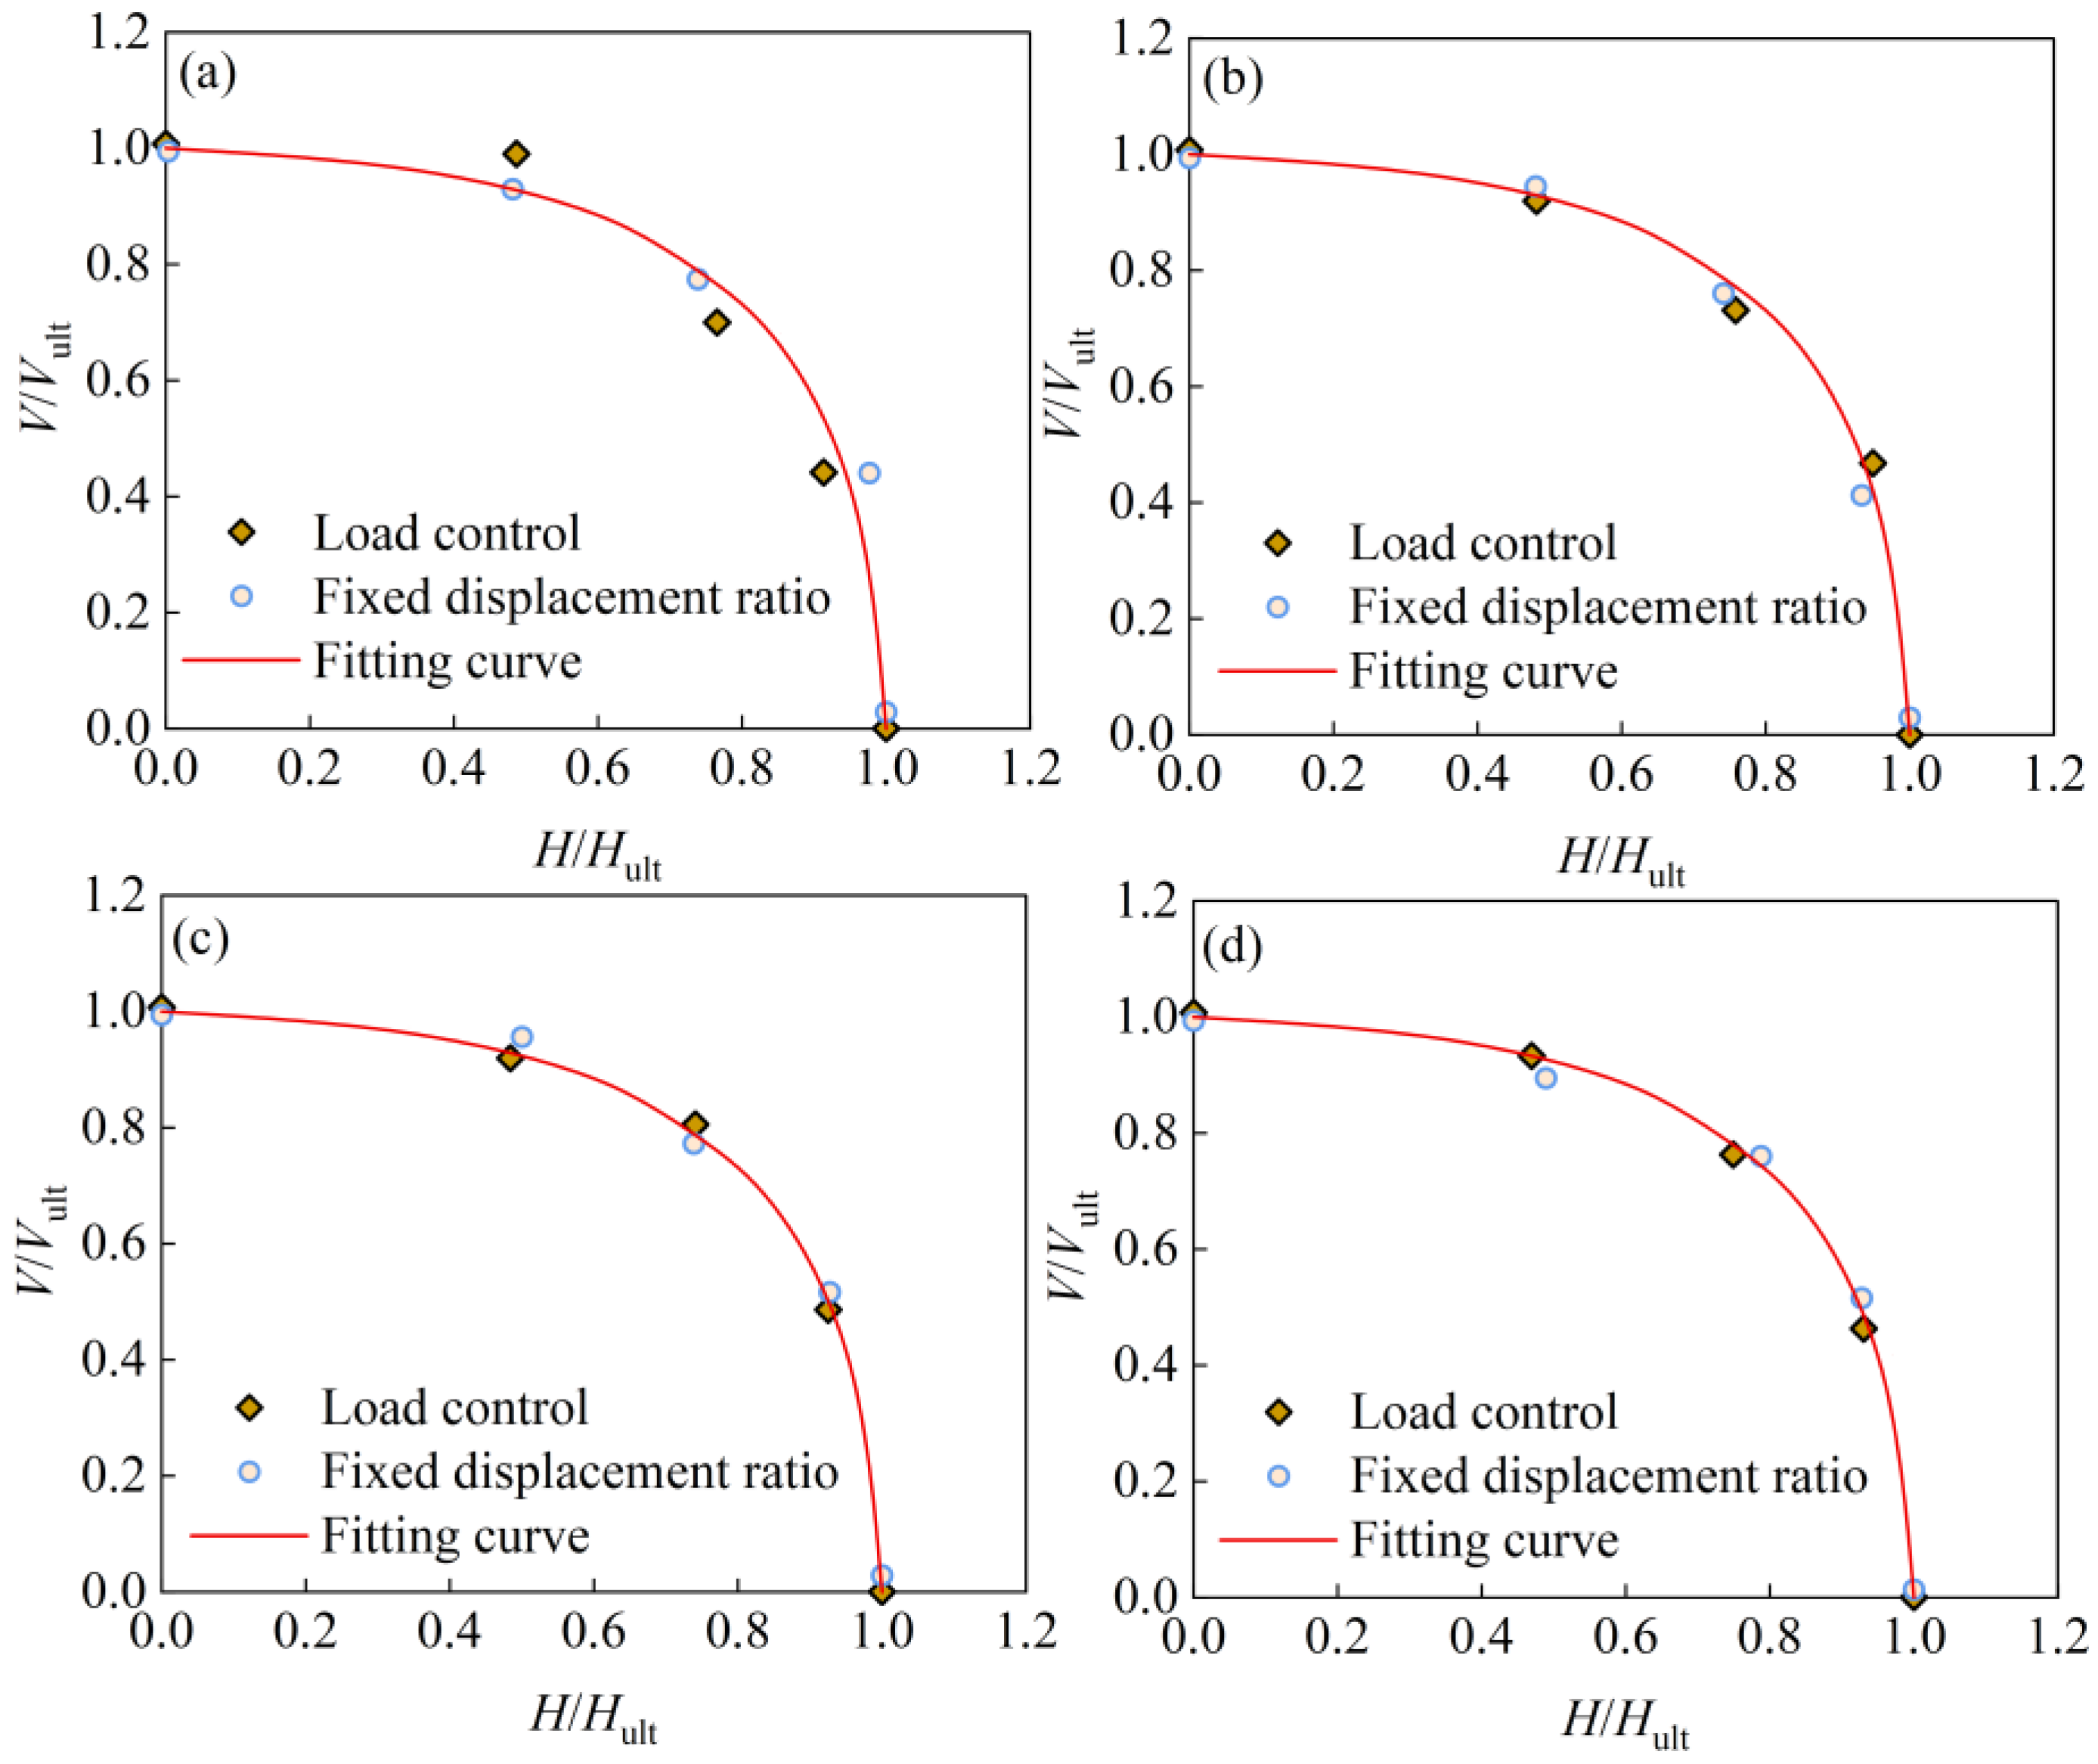
The horizontal and vertical components of the data points on the envelope were normalized by dividing them by the horizontal ultimate bearing capacity Hult and the vertical ultimate bearing capacity Vult, respectively. The envelopes of suction caisson foundations with different aspect ratios and soil strengths at the loading point Zp/L = 0.75 were thereby normalized and subsequently fitted using the elliptical Equation (8). The fitted parameter values are listed in Table 6.
H H ult m + V V ult n = 1
As shown in Table 6, the fitting parameters m and n in the elliptical equation exhibit an approximately linear increase with increasing aspect ratio. Therefore, linear functions were employed to fit the relationships between parameters m and n and the aspect ratio L/D, yielding the corresponding correlations between m, n, and L/D.
m = 0.16 1 0.1 c u 10 0.85 17.9 + 0.5 L / D 0.98
n = 0.16 1 0.1 c u 10 0.85 14.8 + 0.3 L / D 0.94
By substituting Equations (9) and (10) into Equation (8), the normalized envelope equation applicable to foundations with different aspect ratios can be obtained. Under inclined loading with an inclination angle θ, the horizontal component Hf and vertical component Vf of the inclined ultimate bearing capacity Ff are expressed as follows:
H f = F f cos θ
V f = F f sin θ
For the convenience of subsequent investigation into the calculation method of inclined cyclic ultimate bearing capacity, Equations (11) and (12) are substituted into Equation (8), resulting in a normalized envelope equation incorporating the inclined static ultimate bearing capacity Ff.
F f cos θ H ult m + F f sin θ V ult n = 1
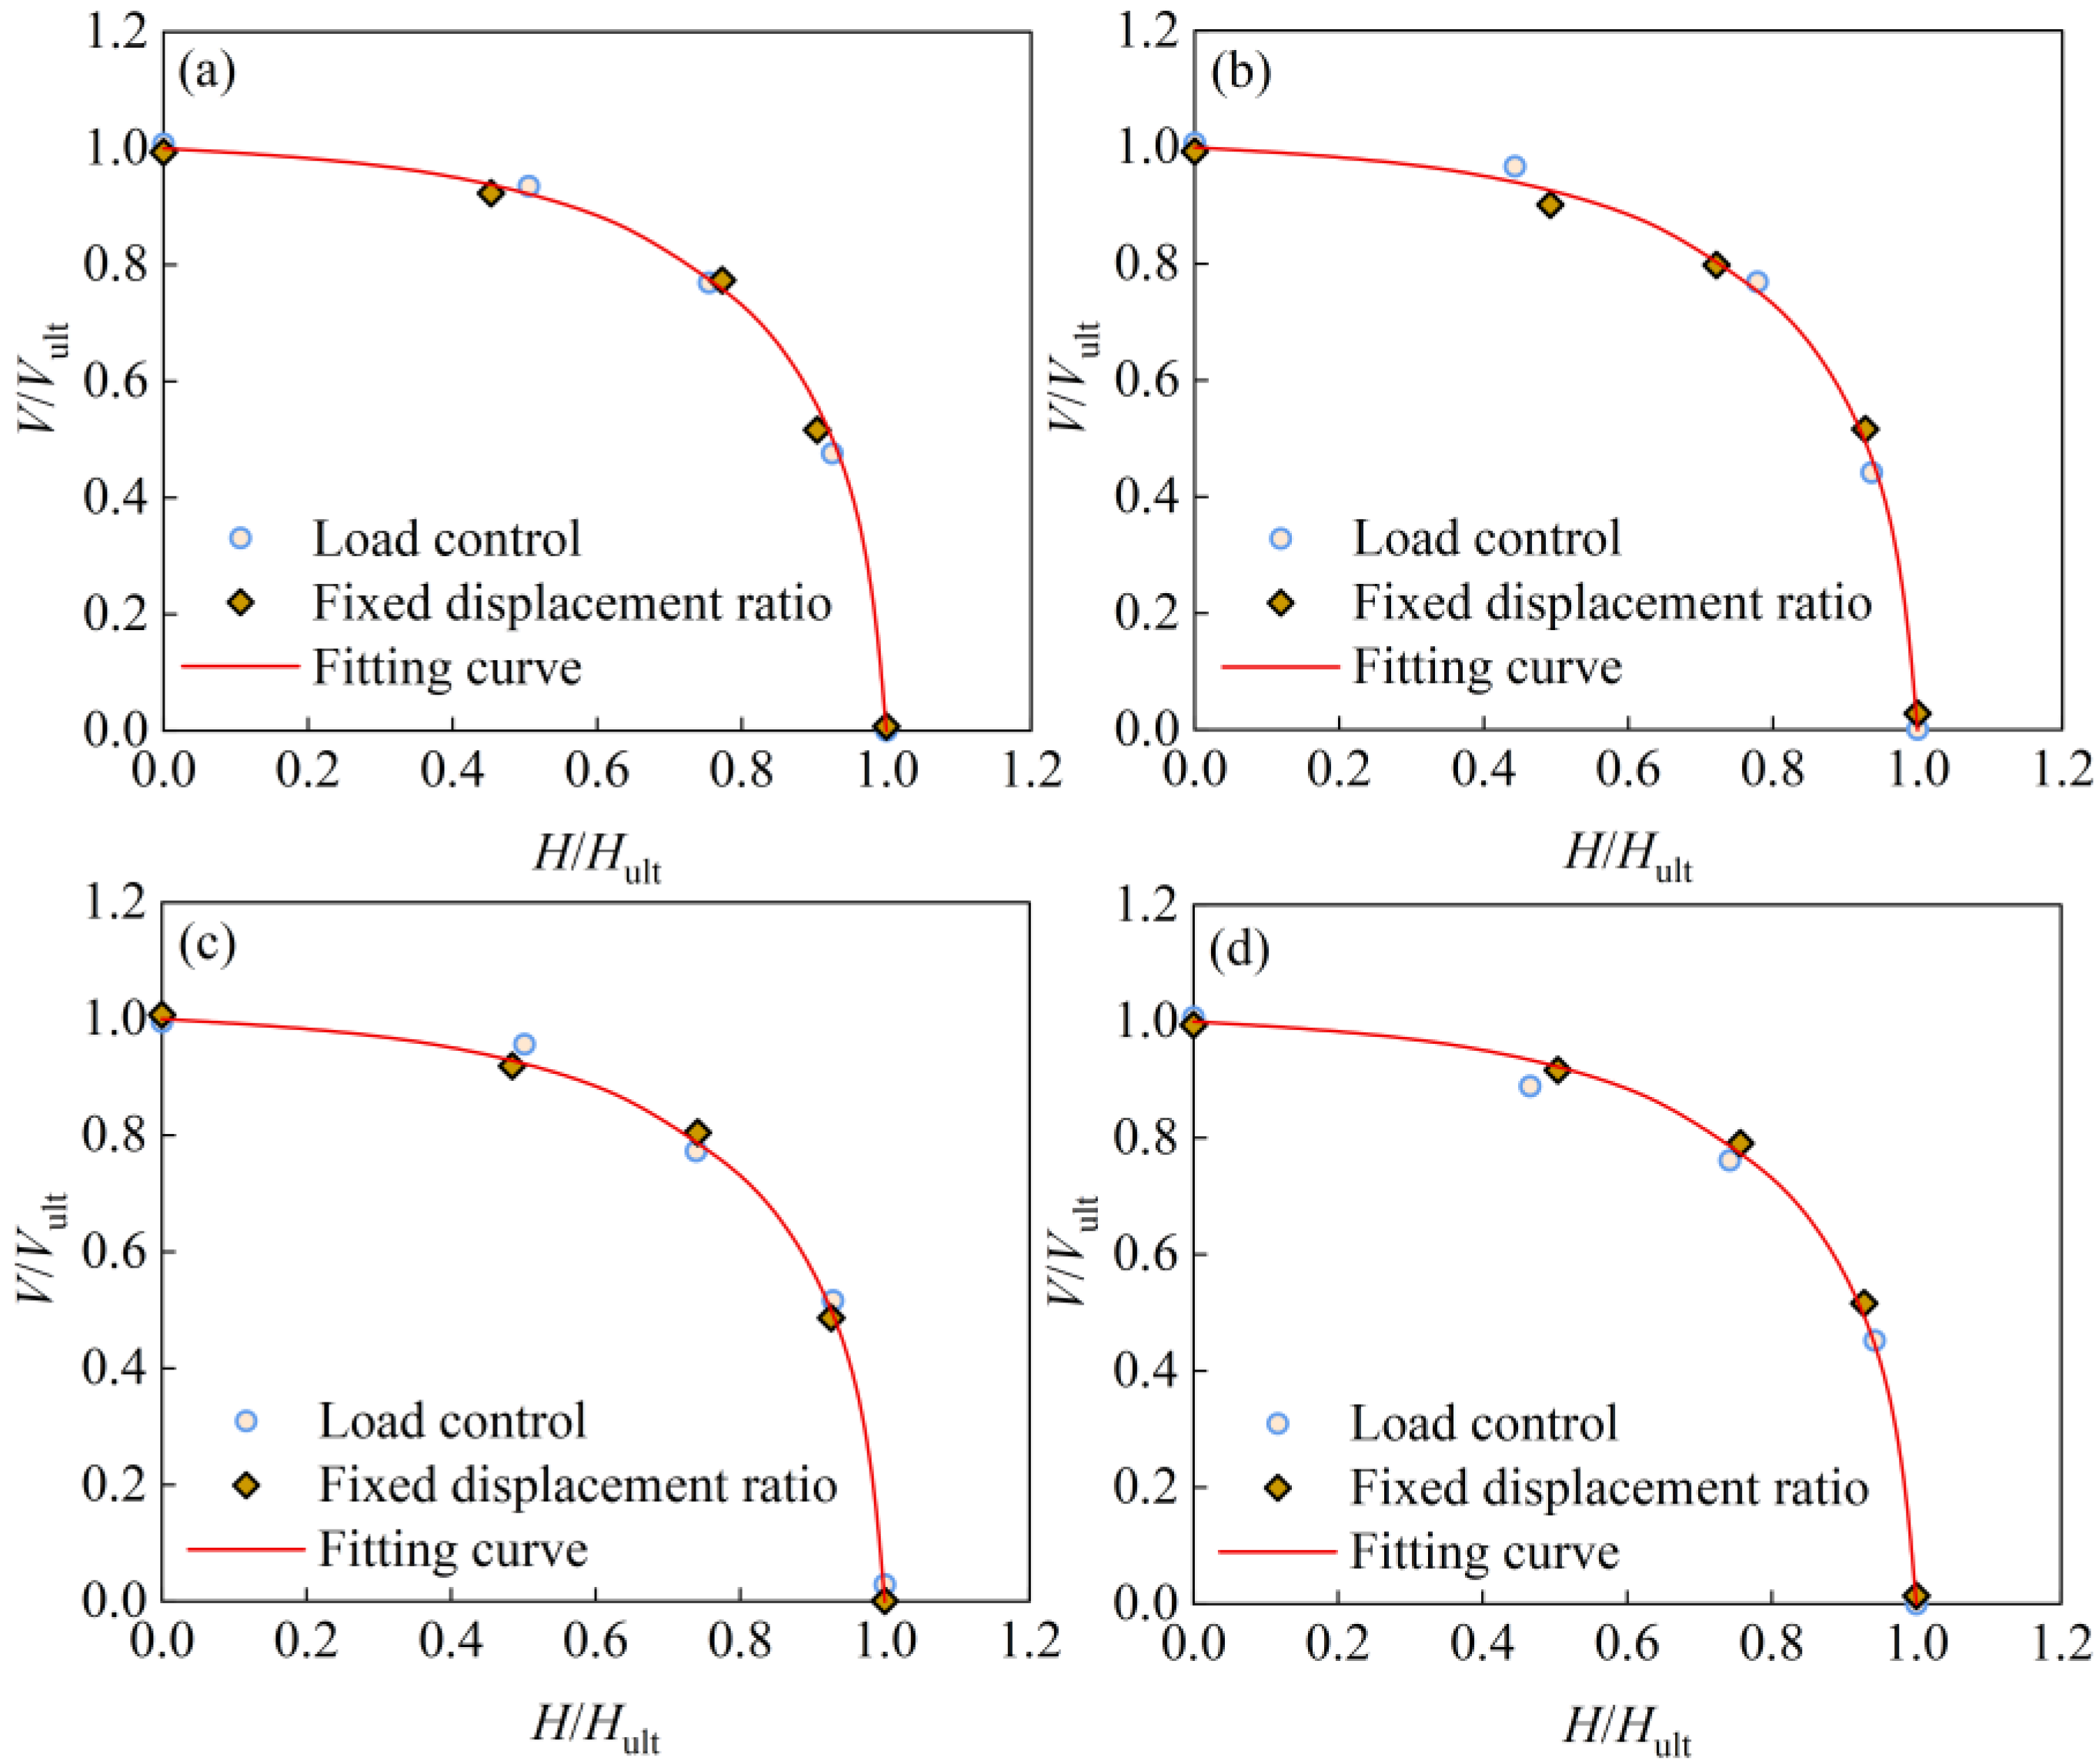
An equation for the ultimate bearing capacity envelope of SCF was established considering the aspect ratio and Undrained shear strength of soil, and was validated through comparison with finite element simulation results. Figure 19 and Figure 20 present the fitted bearing capacity envelopes for different aspect ratios and undrained soil strengths, respectively, at a loading point depth of 0.75L. The proposed normalized envelope shows good agreement with that obtained from finite element simulations. These results provide a reference for analyzing the ultimate bearing capacity of SCF under combined loading conditions.

6.2. Cyclic Bearing Capacity Degradation Model

For suction caisson foundations, when the cyclic load ratio and the number of cycles remain constant, a larger static load ratio leads to a greater reduction in ultimate bearing capacity after cyclic loading. Similarly, when the static load ratio and the number of cycles remain constant, a larger cyclic load ratio also results in a more pronounced reduction in ultimate bearing capacity after cyclic loading. Under the combined action of static and cyclic loads, the post-cyclic ultimate bearing capacity decreases with increasing number of cycles, with a relatively significant reduction in the initial stage and a gradual stabilization in the later stage. The above conclusions are qualitative in nature; therefore, to quantitatively characterize the effects of static load ratio, cyclic load ratio, and number of cycles on the ultimate bearing capacity of the foundation, a cyclic bearing capacity degradation coefficient δ is introduced, which is defined as follows:
δ = Q c y c / F f
where Qcyc denotes the ultimate bearing capacity of the foundation after cyclic loading.
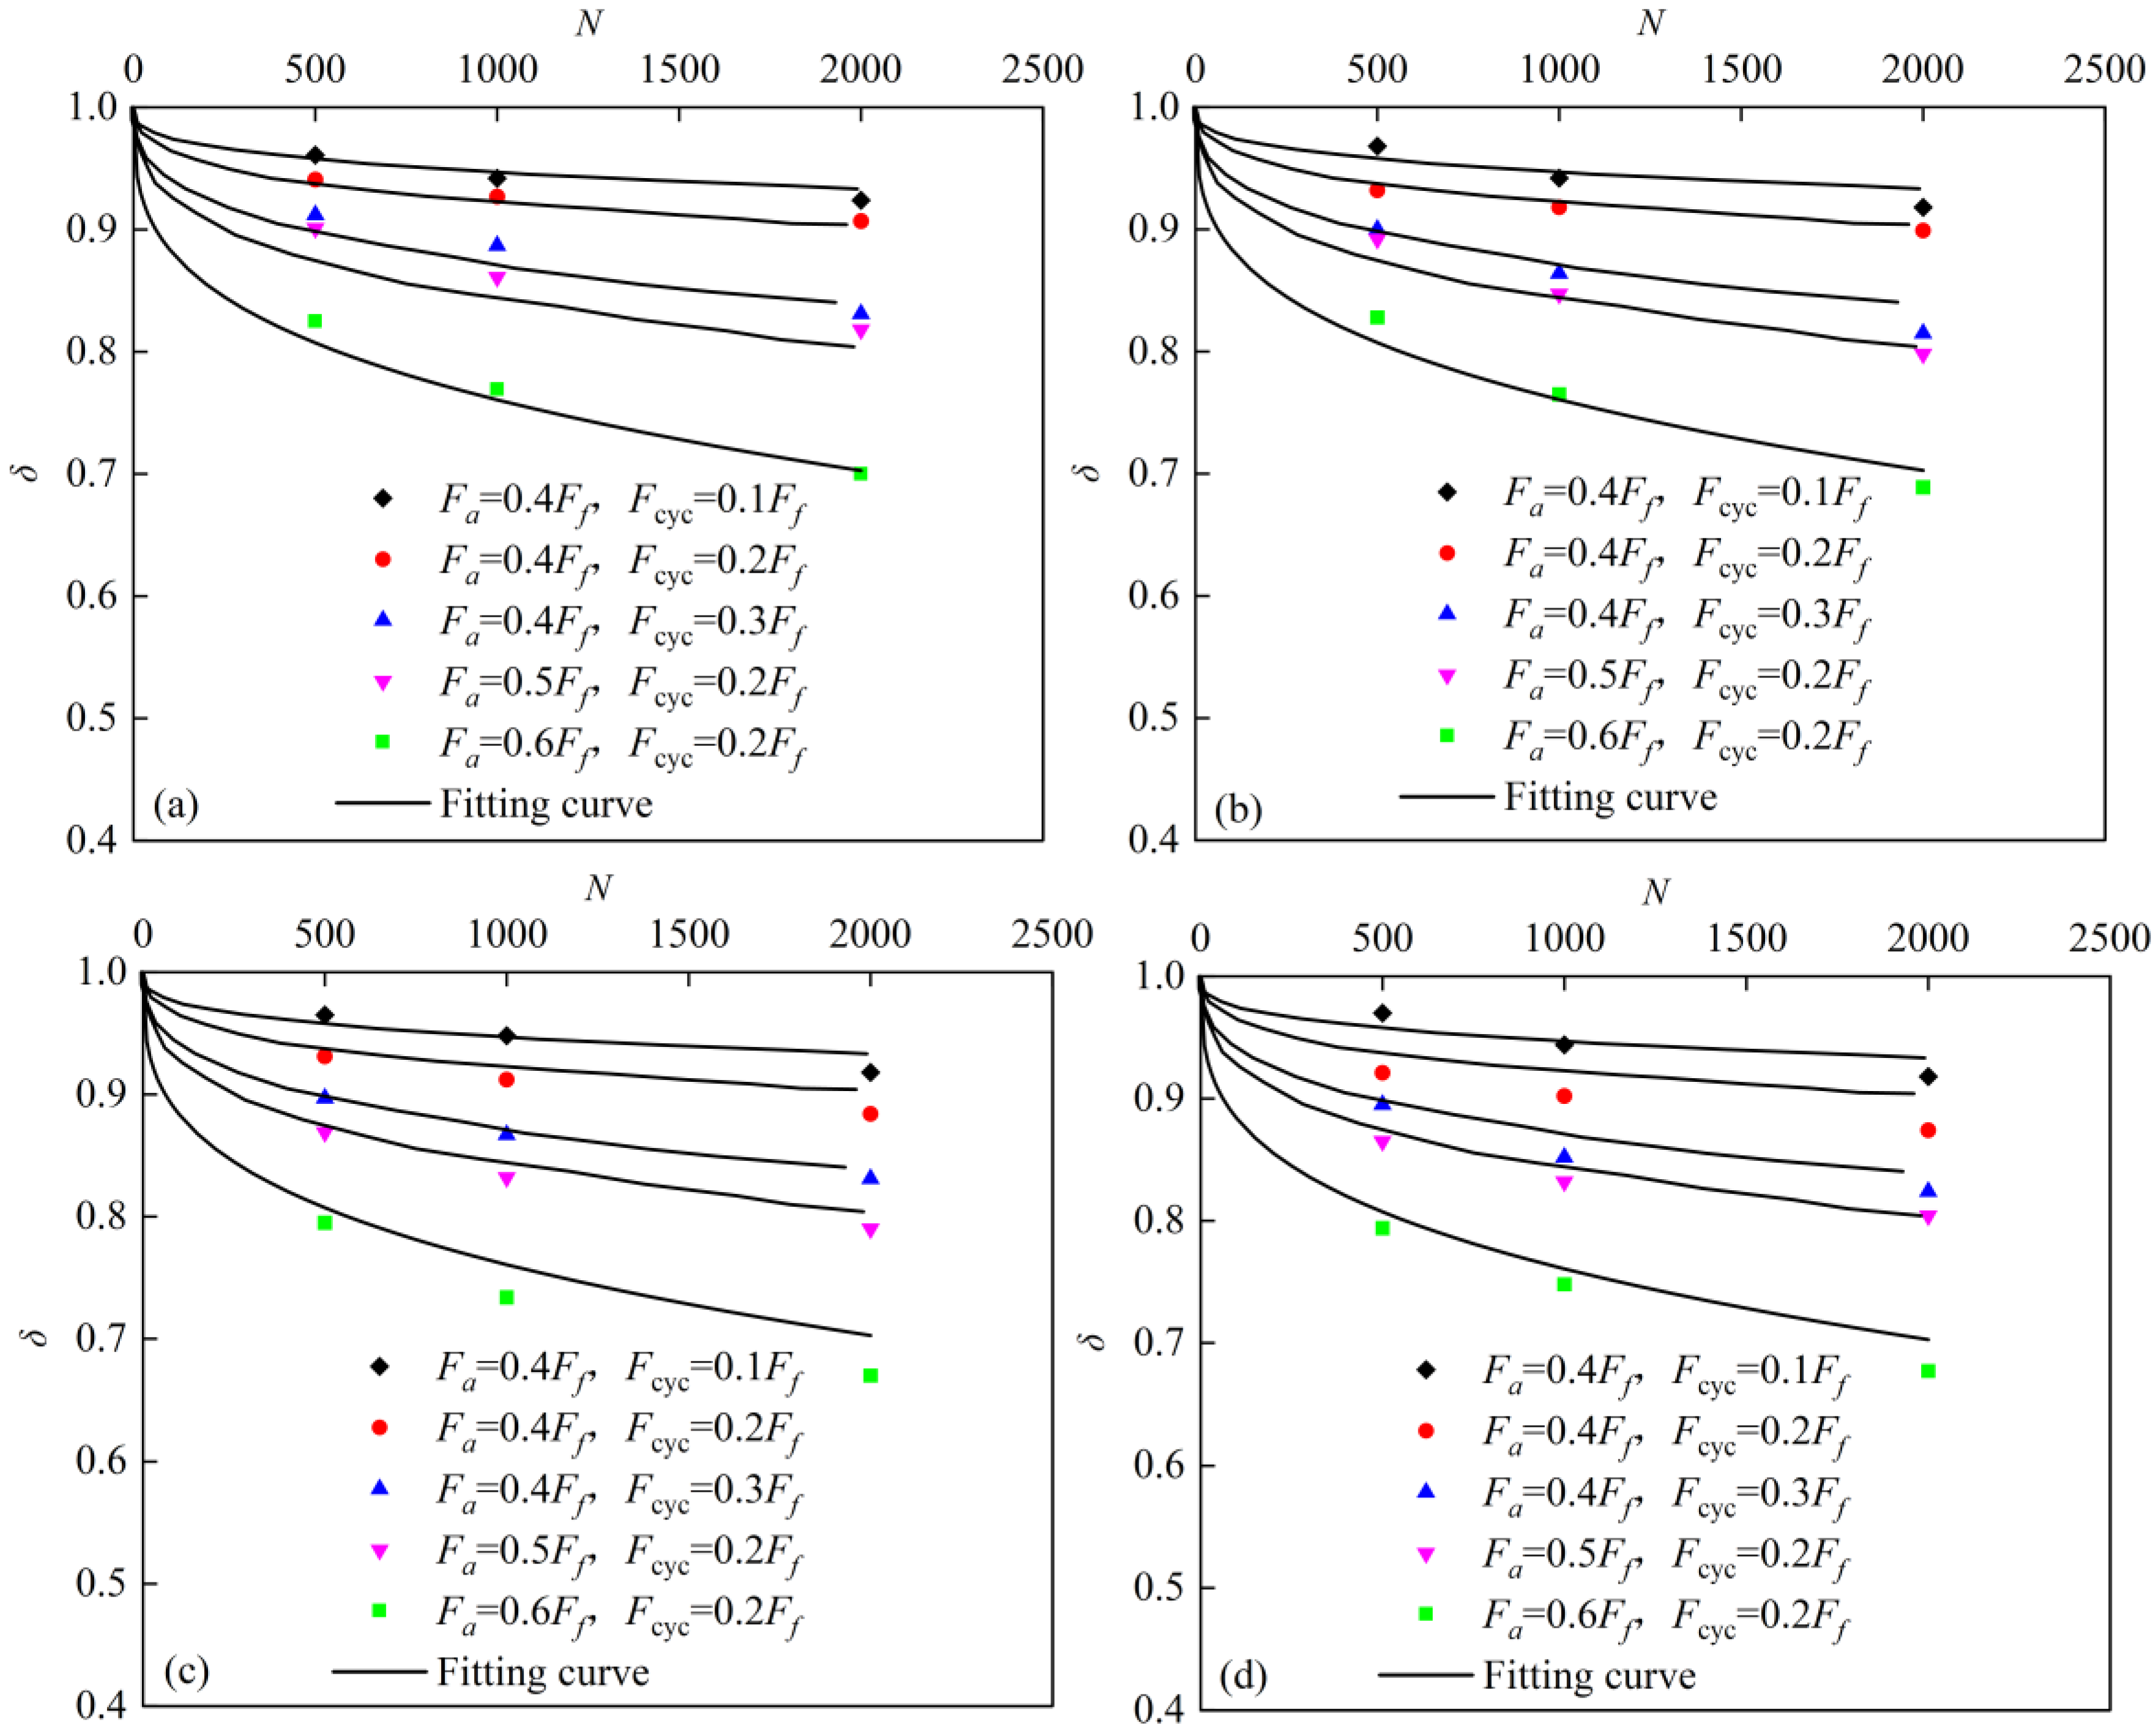
The cyclic bearing capacity degradation coefficient δ corresponding to inclined loads at different inclination angles was fitted based on the experimental data, and the fitting formula is expressed as follows:
δ = 1 F a F f n 1 F c y c F f n 2 N n 3
where n1, n2, and n3 are fitting parameters.
As shown in Table 7, for inclined loads at different inclination angles, the correlation coefficients of the fitted cyclic bearing capacity degradation coefficient δ are all greater than 0.95, indicating good fitting performance. Under loading angles ranging from 0° to 90°, the parameter n1 varies from 2.832 to 2.868, n2 ranges from 1.356 to 1.401, and n3 ranges from 0.323 to 0.378, with relatively small variations observed for all three parameters. To simplify the calculation procedure, the average values of n1, n2, and n3 corresponding to loading angles from 0° to 90° in Table 7 were adopted, and the final expression for the cyclic bearing capacity degradation coefficient δ was determined as follows:
δ = 1 F a F f 2.85 F c y c F f 1.38 N 0.35
The comparison between the degradation coefficient calculated from Equation (16) and the experimental results is presented in Figure 21, demonstrating good agreement between the fitted and experimental data.
By substituting the definition of the cyclic bearing capacity degradation coefficient in Equation (16) into the normalized envelope equation (Equation (13)) for the SCF under static loading, the normalized envelope equation under cyclic loading can be obtained.
Q cyc cos θ δ H ult m + Q cyc sin θ δ V ult n = 1
where m = 0.16 1 0.1 c u 10 0.85 17.9 + 0.5 L / D 0.98 , n = 0.16 1 0.1 c u 10 0.85 14.8 + 0.3 L / D 0.94 .
The horizontal component of the post-cyclic ultimate bearing capacity Qcyc is Hcyc = Qcyccosθ, and the vertical component is Vcyc = Qcycsinθ. An alternative form of the normalized envelope equation for the foundation under cyclic loading can thus be derived.
H c y c δ H ult m + V c y c δ V ult n = 1
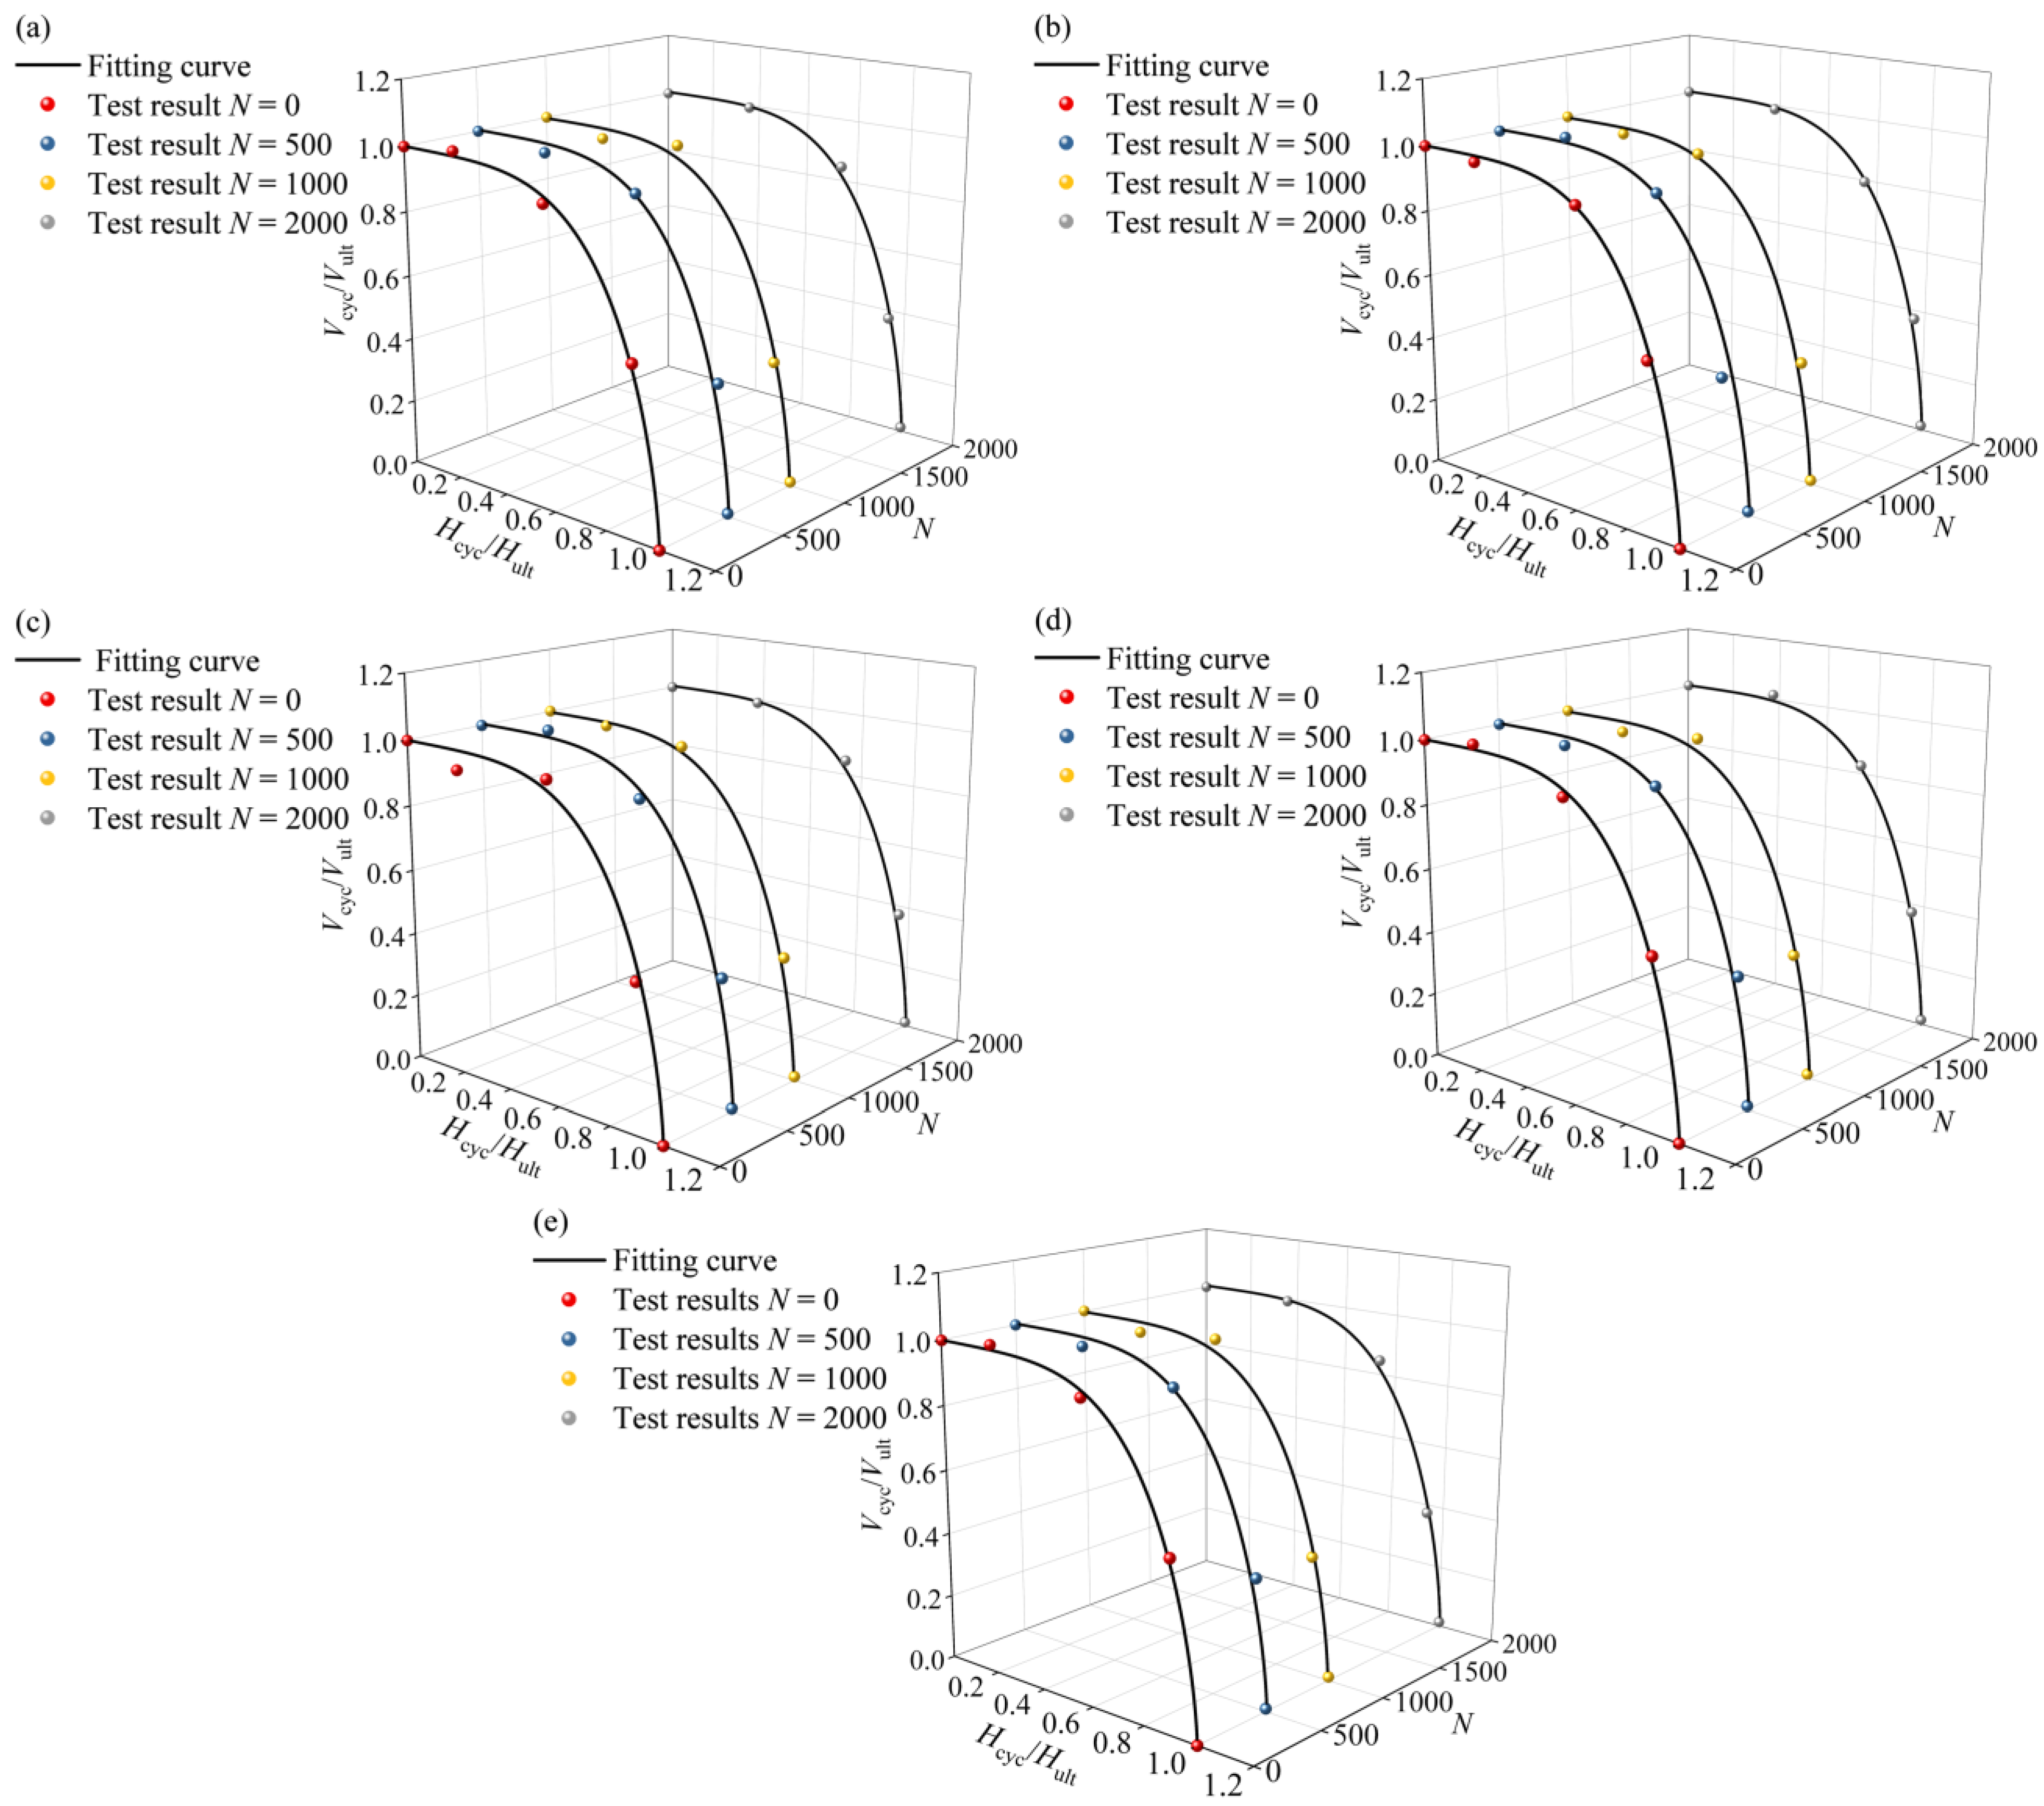
Figure 22 compares the test data with the fitted curve of Equation (18); the test data correspond to the normalized cyclic ultimate bearing capacity of SCF with an aspect ratio of 3.0. According to the fitting results, the proposed normalized envelope equation for SCF under cyclic loading effectively captures the test behavior, with a maximum error of 12.52%.

7. Conclusions

This study investigates the evolution of ultimate bearing capacity, failure modes, and ultimate bearing capacity envelopes of SCF under inclined static and cyclic loading. The main conclusions are as follows:
(1)
Under static loading conditions, the influence of load inclination angle on the bearing capacity varies with different loading positions. When the load is applied at the top of the foundation, the maximum bearing capacity occurs at a 45° inclination. As the loading depth increases, the inclination angle corresponding to the maximum bearing capacity gradually decreases until it reaches 0°. The load inclination angle has a relatively minor influence on the post-cyclic ultimate bearing capacity and cumulative displacement. Increasing the cyclic load ratio and static load ratio both intensify the degradation of ultimate bearing capacity and the accumulation of displacement.
(2)
Under inclined loading, the failure mode of the foundation is influenced by both the load inclination angle and the embedment depth of the loading point. At low inclination angles, failure is mainly caused by rotational movement and overall overturning of the foundation. In contrast, at high inclination angles, heave-dominated failure becomes predominant, and a critical loading depth range exists that leads to a transition from rotation-dominated behavior to translation-dominated behavior.
(3)
The ultimate bearing capacity of the foundation increases monotonically with increasing aspect ratio, interface friction coefficient, and soil undrained shear strength. Among these factors, the aspect ratio has the most significant influence on the horizontal bearing component, while the interface friction coefficient mainly governs the uplift resistance of the foundation.
(4)
The V–H ultimate bearing capacity envelopes established based on the load control and fixed displacement ratio method show good agreement with the experimental and numerical results. The normalized envelope proposed in this study can effectively describe the combined bearing capacity boundary of SCF under varying structural and soil parameters.
(5)
By introducing a cyclic bearing capacity degradation coefficient, a modified normalized envelope model under cyclic loading conditions is established. The simulation fitting results show good agreement with the experimental results.
It should be noted that this study analyzes the ultimate bearing capacity characteristics of SCF under inclined cyclic loading through a combination of model test and numerical simulation, yet several limitations remain. The soil behavior was modeled using the Mohr–Coulomb constitutive model, which can reasonably describe the basic strength characteristics of soil but cannot fully capture the complex cyclic deformation accumulation in soft clay under long-term cyclic loading. In addition, this study primarily focuses on idealized, homogeneous soft clay conditions, without fully accounting for the influence of complex seabed environments. Future research should incorporate more advanced cyclic constitutive models to further reveal the long-term cyclic response and bearing capacity evolution of SCF.

Author Contributions

Conceptualization, B.L. and G.D.; Software, L.H. and G.D.; Validation, K.H.; Formal analysis, K.H., B.Y., H.D. and G.D.; Investigation, B.Y., H.D. and G.D.; Resources, L.H., W.Z. and G.D.; Data curation, K.H., L.H., W.Z. and G.D.; Writing—original draft, K.H., B.Y. and W.Z.; Writing—review & editing, K.H., B.Y. and W.Z.; Visualization, K.H., B.Y., B.L., H.D. and W.Z.; Supervision, K.H., B.L., L.H., H.D., W.Z. and G.D.; Project administration, K.H., B.Y., L.H., H.D., W.Z. and G.D.; Funding acquisition, B.L., L.H., H.D., W.Z. and G.D. All authors have read and agreed to the published version of the manuscript.

Funding

This work was supported by the National Natural Science Foundation of China (No. 52508371, 52578392, 52378328), Research Fund for Advanced Ocean Institute of Southeast University (Key Program KP202404; Major Program GP202403), Jiangsu Funding Program for Excellent Postdoctoral Talent (2025ZB120); Basic Research Program of Jiangsu (BK20251312); Major Scientific and Technological R & D Projects of CCCC (2023-ZJKJ-01).

Data Availability Statement

Data will be made available on request.

Conflicts of Interest

Bo Liu, Liji Huang, and Huiyuan Deng were employed by Major Scientific and Technological R & D Projects of CCCC. The remaining authors declare that the research was conducted in the absence of any commercial or financial relationships that could be construed as a potential conflict of interest. This research was partially funded by Major Scientific and Technological R&D Projects of CCCC. The funder provided financial support for the present study. All authors declare no other conflicts of interest.

References

  1. Li, C.; Mogollón, J.M.; Tukker, A.; Dong, J.N.; Terzi, D.; Zhang, C.B.; Steubing, B. Future material requirements for global sustainable offshore wind energy development. Renew. Sustain. Energy Rev. 2022, 164, 112603. [Google Scholar] [CrossRef] [Scilit]
  2. Jung, C.; Sander, L.; Schindler, D. Future global offshore wind energy under climate change and advanced wind turbine technology. Energy Convers. Manag. 2024, 321, 119075. [Google Scholar] [CrossRef] [Scilit]
  3. Park, J.; Kim, B. An analysis of South Korea’s energy transition policy with regards to offshore wind power development. Renew. Sustain. Energy Rev. 2019, 109, 71–84. [Google Scholar] [CrossRef] [Scilit]
  4. Houlsby, G.T. Interactions in offshore foundation design. Geotechnique 2016, 66, 791–825. [Google Scholar] [CrossRef] [Scilit]
  5. Byrne, B.; Houlsby, G.; Martin, C.; Fish, P. Suction caisson foundations for offshore wind turbines. Wind Eng. 2002, 26, 145–155. [Google Scholar] [CrossRef] [Scilit]
  6. Zhu, B.; Zhang, W.L.; Ying, P.P.; Chen, Y.M. Deflection-based bearing capacity of suction caisson foundations of offshore wind turbines. J. Geotech. Geoenviron. Eng. 2014, 140, 04014013. [Google Scholar] [CrossRef] [Scilit]
  7. Randolph, M.; Gourvenec, S. Offshore Geotechnical Engineering; CRC Press: Boca Raton, FL, USA, 2017. [Google Scholar]
  8. Fazeres-Ferradosa, T.; Chambel, J.; Taveira-Pinto, F.; Rosa-Santos, P.; Taveira-Pinto, F.V.; Giannini, G.; Haerens, P. Scour protections for offshore foundations of marine energy harvesting technologies: A review. J. Mar. Sci. Eng. 2021, 9, 297. [Google Scholar] [CrossRef] [Scilit]
  9. Bai, Y.; Li, D.Y.; Zhang, Y.K.; Mao, D.W. Bearing behavior and earth pressure distribution for modified suction caissons in sand under inclined loading. Mar. Georesour. Geotechnol. 2021, 39, 1096–1106. [Google Scholar] [CrossRef] [Scilit]
  10. Li, B.; Zheng, X.; Gao, Y.F.; Sha, C.M.; Qiu, Y. Model tests on optimal load attachment point of suction caisson foundation in sands. Rock Soil Mech. 2013, 34, 2521–2526. [Google Scholar]
  11. Supachawarote, C.; Randolph, M.; Gourvenec, S. Inclined pull-out capacity of suction caissons. In ISOPE International Ocean and Polar Engineering Conference; ISOPE: Cupertino, CA, USA, 2004. [Google Scholar]
  12. Feng, X.; Pi, X.J.; Feng, S.L.; Bian, C. Research on the uplift bearing capacity of suction caisson foundation under local tensile failure. Procedia Eng. 2016, 166, 61–68. [Google Scholar] [CrossRef] [Scilit]
  13. Dai, G.L.; Zhu, W.B.; Zhai, Q.; Gong, W.M.; Zhao, X.L. Characteristic test study on bearing capacity of suction caisson foundation under vertical load. China Ocean Eng. 2020, 34, 267–278. [Google Scholar] [CrossRef] [Scilit]
  14. Wang, J.H.; Liu, J.L.; Chen, W.Q. Effects of loading direction on ultimate bearing capacity of suction anchors with taut mooring system. Chin. J. Geotech. Eng. 2012, 34, 385–391. [Google Scholar]
  15. Bagheri, P.; Son, S.W.; Kim, J.M. Investigation of the load-bearing capacity of suction caissons used for offshore wind turbines. Appl. Ocean Res. 2017, 67, 148–161. [Google Scholar] [CrossRef] [Scilit]
  16. He, B.; Yang, S.; Sturm, H. Case studies on suction caisson foundations in offshore wind farms in China. Int. J. Geotech. Eng. 2022, 16, 917–933. [Google Scholar] [CrossRef] [Scilit]
  17. Kim, Y.; Ahn, J.; Jung, J. Fuzzy modeling of holding capacity of offshore suction caisson anchors. Int. J. Numer. Anal. Methods Geomech. 2017, 41, 1038–1054. [Google Scholar] [CrossRef] [Scilit]
  18. Allersma, H.G.B.; Kirstein, A.A.; Brinkgreve, R.B.J.; Simon, T. Centrifuge and numerical modelling of horizontally loaded suction piles. In ISOPE International Ocean and Polar Engineering Conference; ISOPE: Cupertino, CA, USA, 1999. [Google Scholar]
  19. Supachawarote, C. Inclined Load Capacity of Suction Caisson in Clay. Ph.D. Thesis, University of Western Australia, Perth, Australia, 2006. [Google Scholar]
  20. Rao, S.N.; Ravi, R.; Prasad, B.S. Pullout behavior of suction anchors in soft marine clays. Mar. Georesour. Geotechnol. 1997, 15, 95–114. [Google Scholar] [CrossRef] [Scilit]
  21. Luke, A.M. Axial Capacity of Suction Caissons in Normally Consolidated Kaolinite. Ph.D. Thesis, University of Texas at Austin, Austin, TX, USA, 2002. [Google Scholar]
  22. Mana, D.S.; Gourvenec, S.; Randolph, M.F. Experimental investigation of reverse end bearing of offshore shallow foundations. Can. Geotech. J. 2013, 50, 1022–1033. [Google Scholar] [CrossRef] [Scilit]
  23. Mana, D.S.; Gourvenec, S.; Randolph, M.F. Numerical modelling of seepage beneath skirted foundations subjected to vertical uplift. Comput. Geotech. 2014, 55, 150–157. [Google Scholar] [CrossRef] [Scilit]
  24. Byrne, P.M.; Finn, W.L. Breakout of submerged structures buried to a shallow depth. Can. Geotech. J. 1978, 15, 146–154. [Google Scholar] [CrossRef] [Scilit]
  25. Li, B.; Zheng, X.; Gao, Y.F.; Qiu, Y.; Sha, C.M. Model tests on pull-out capacity of suction caisson foundation in sand. Chin. J. Geotech. Eng. 2013, 35, 902–907. [Google Scholar]
  26. Li, B.; Gao, Y.F.; Sha, C.M.; Dong, X.D. Calculation method for maximum bearing capacity of suction caisson foundation in sand. Chin. J. Geotech. Eng. 2012, 42, 1201–1205. [Google Scholar]
  27. Li, D.Y.; Feng, L.Y.; Zhang, Y.K. Model tests of modified suction caissons in marine sand under monotonic lateral combined loading. Appl. Ocean Res. 2014, 48, 137–147. [Google Scholar] [CrossRef] [Scilit]
  28. Li, D.Y.; Zhang, Y.K.; Feng, L.Y.; Guo, Y.X. Response of skirted suction caissons to monotonic lateral loading in saturated medium sand. China Ocean Eng. 2014, 28, 569–578. [Google Scholar] [CrossRef] [Scilit]
  29. Li, D.Y.; Zhang, Y.K.; Feng, L.Y.; Gao, Y. Capacity of modified suction caissons in marine sand under static horizontal loading. Ocean Eng. 2015, 102, 1–16. [Google Scholar] [CrossRef] [Scilit]
  30. Li, X.; Tian, Y.; Gaudin, C.; Cassidy, M.J. Comparative study of the compression and uplift of shallow foundations. Comput. Geotech. 2015, 69, 38–45. [Google Scholar] [CrossRef] [Scilit]
  31. Mistri, B.; Singh, B. Pullout behavior of plate anchors in cohesive soils. Electron. J. Geotech. Eng. 2011, 16, 1173–1184. [Google Scholar]
  32. Ninomiya, K.; Tagaya, K.; Murase, Y. A study of suction and scouring of bottom-sitting offshore structures. J. Pet. Technol. 1973, 25, 279–287. [Google Scholar] [CrossRef] [Scilit]
  33. Dai, G.L.; Zhu, W.B.; Guo, J.; Gong, W.M.; Zhao, X.L. Experiments on vertical uplift bearing capacity of suction caisson foundation in soft clay. Rock Soil Mech. 2019, 40, 119–126. [Google Scholar]
  34. Andersen, K.H.; Kleven, A.; Heien, D. Cyclic soil data for design of gravity structures. J. Geotech. Eng. 1988, 114, 517–539. [Google Scholar] [CrossRef] [Scilit]
  35. Iskander, M.; El-Gharbawy, S.; Olson, R. Performance of suction caissons in sand and clay. Can. Geotech. J. 2002, 39, 576–584. [Google Scholar] [CrossRef] [Scilit]
  36. Bai, Y.; Li, D.Y. Yield envelope and bearing capacity of the modified suction caisson subjected to inclined loading in sand. Ocean Eng. 2024, 307, 118118. [Google Scholar] [CrossRef] [Scilit]
  37. Chen, Y.; Dong, M.M.; Cheng, C.; Han, J.Y.; Zhao, Y.F.; Jia, P.J. Experimental and analytical study on the bearing capacity of caisson foundation subjected to V-H combined load. Mar. Georesour. Geotechnol. 2025, 43, 2423–2435. [Google Scholar] [CrossRef] [Scilit]
  38. Zhu, B.; Byrne, B.W.; Houlsby, G.T. Long-term lateral cyclic response of suction caisson foundations in sand. J. Geotech. Geoenviron. Eng. 2013, 9, 73–83. [Google Scholar] [CrossRef] [Scilit]
  39. Kourkoulis, R.S.; Lekkakis, P.C.; Gelagoti, F.M.; Kaynia, A.M. Suction caisson foundations for offshore wind turbines subjected to wave and earthquake loading: Effect of soil–foundation interface. Géotechnique 2014, 64, 171–185. [Google Scholar] [CrossRef] [Scilit]
  40. Byrne, B.; Byrne, B.W. Investigations of Suction Caissons in Dense Sand. Ph.D. Thesis, University of Oxford, Oxford, UK, 2000. [Google Scholar]
  41. Xie, S.L.; Sun, C.Y.; Liu, B.; Huang, L.J.; Deng, H.Y.; Zhu, M.X.; Li, X.J.; Dai, G.L. Numerical Simulation on Anchored Load-Bearing Characteristics of Suction Caisson for Floating Offshore Wind Power. J. Mar. Sci. Eng. 2025, 13, 1653. [Google Scholar] [CrossRef] [Scilit]
  42. Liu, Z.W.; Qin, C.R.; Wang, J.H. Study on numerical model for assessing cyclic bearing capacity of foundations in clay. Rock Soil Mech. 2004, 25, 405–408. [Google Scholar]
  43. Harireche, O.; Mehravar, M.; Alani, A.M. Soil conditions and bounds to suction during the installation of caisson foundations in sand. Ocean Eng. 2014, 88, 164–173. [Google Scholar] [CrossRef] [Scilit]
  44. Skempton, A.W.; Bishop, A.W. The measurement of the shear strength of soils. Geotechnique 1950, 2, 90–108. [Google Scholar] [CrossRef] [Scilit]
  45. Zhu, F.Y.; O’Loughlin, C.D.; Bienen, B.; Cassidy, M.J.; Morgan, N. The response of suction caissons to long-term lateral cyclic loading in single-layer and layered seabeds. Géotechnique 2018, 68, 729–741. [Google Scholar] [CrossRef] [Scilit]
  46. Guo, Z.; Jeng, D.S.; Guo, W.; Wang, L. Failure mode and capacity of suction caisson under inclined short-term static and one-way cyclic loadings. Mar. Georesour. Geotechnol. 2018, 36, 52–63. [Google Scholar] [CrossRef] [Scilit]
  47. Leblanc, C.; Byrne, B.W.; Houlsby, G.T. Response of stiff piles to random two-way lateral loading. Géotechnique 2010, 60, 715–721. [Google Scholar] [CrossRef] [Scilit]
  48. Rovere, M. Cyclic Loading Test Machine for Caisson Suction Foundations; Ecole Centrale de Lille/Politecnico di Milano: Lille, France; Milano, Italy, 2004. [Google Scholar]
  49. Gerolymos, N.; Zafeirakos, A.; Karapiperis, K. Generalized failure envelope for caisson foundations in cohesive soil: Static and dynamic loading. Soil Dyn. Earthq. Eng. 2015, 78, 154–174. [Google Scholar] [CrossRef] [Scilit]
  50. Chen, W.; Randolph, M.F. Uplift capacity of suction caissons under sustained and cyclic loading in soft clay. J. Geotech. Geoenviron. Eng. 2007, 133, 1352–1363. [Google Scholar] [CrossRef] [Scilit]
  51. Mehravar, M.; Harireche, O.; Faramarzi, A.; Alani, A.M. Modelling the variation of suction pressure during caisson installation in sand using FLAC3D. Ships Offshore Struct. 2017, 12, 893–899. [Google Scholar] [CrossRef] [Scilit]
  52. Li, X.Z.; Huang, M.S. A bounding surface model for creeping soft clays under cyclic loading. Chin. J. Geotech. Eng. 2007, 29, 249–254. [Google Scholar]
  53. Guo, L.; Cai, Y.Q.; Wang, J.; Gu, C. Long-term cyclic strain behavior of Wenzhou structural soft clay. Chin. J. Geotech. Eng. 2012, 34, 2249–2254. [Google Scholar]
  54. Tjelta, T.I. Suction piles: Their position and application today. In ISOPE International Ocean and Polar Engineering Conference; ISOPE: Cupertino, CA, USA, 2001. [Google Scholar]
  55. Wang, J.H.; Liu, J.L.; Zhou, Y.R. Model tests on bearing capacities of suction anchors with taut mooring systems under combined static and cyclic loads. Chin. J. Geotech. Eng. 2012, 34, 997–1004. [Google Scholar]
  56. Zhou, W.J.; Guo, Z.; Wang, L.Z.; Zhang, Y.R.; Rui, S.J. Numerical model for suction caisson under axial cyclic loadings. Ocean Eng. 2021, 240, 109956. [Google Scholar] [CrossRef] [Scilit]
  57. Koh, K.X.; Hossain, M.S.; Kim, Y. Installation and monotonic pullout of a suction caisson anchor in calcareous silt. J. Geotech. Geoenviron. Eng. 2017, 143, 04016098. [Google Scholar] [CrossRef] [Scilit]
Figure 1. Model test chamber: (a) drainage pipeline; (b) filter layer; (c) model test chamber composition.
Applsci 16 03017 g001
Figure 2. Suction caisson foundation model test device.
Applsci 16 03017 g002
Figure 3. Preparation of Soft Clay: (a) slurry preparation; (b) vacuum preloading; (c) Preloading system.
Applsci 16 03017 g003
Figure 4. Load–displacement under different loading inclination angles (static load): (a) ZP = 0; (b) ZP = 0.5L; (c) ZP = 0.75L; (d) ZP = 1.0L.
Applsci 16 03017 g004
Figure 5. Ultimate bearing capacity–displacement curves under different cyclic load ratios (0°): (a) Fa = 0.4Ff; (b) Fa = 0.5Ff; (c) Fa = 0.6Ff.
Applsci 16 03017 g005
Figure 6. Ultimate bearing capacity–displacement curves under different cyclic load ratios (90°): (a) Fa = 0.4Ff; (b) Fa = 0.5Ff; (c) Fa = 0.6Ff.
Applsci 16 03017 g006
Figure 7. The effect of the number of cycles on ultimate bearing capacity under different cyclic load ratios: (a) 0°; (b) 30°; (c) 45°; (d) 60°; (e) 90°.
Applsci 16 03017 g007
Figure 8. Contact between the suction caisson foundation and soil.
Applsci 16 03017 g008
Figure 9. Finite element model mesh division: (a) soil; (b) suction caisson foundation.
Applsci 16 03017 g009
Figure 10. Failure modes of the suction caisson foundation under different loading inclination angles (ZP/L = 0.5): (a) θ = 0°; (b) θ = 30°; (c) θ = 60°; (d) θ = 90°.
Applsci 16 03017 g010
Figure 11. Failure modes of the suction caisson foundation under different loading inclination angles (ZP/L = 1.0): (a) θ = 0°; (b) θ = 30°; (c) θ = 60°; (d) θ = 90°.
Applsci 16 03017 g011
Figure 12. Relationship between ultimate bearing capacity and displacement under different friction coefficients: (a) θ = 0°; (b) θ = 30°; (c) θ = 45°; (d) θ = 60°; (e) θ = 90°.
Applsci 16 03017 g012
Figure 13. Relationship between bearing capacity and friction coefficient under different loading inclination angles: (a) ZP/L = 0.0; (b) ZP/L = 0.5; (c) ZP/L = 0.75; (d) ZP/L = 1.0.
Applsci 16 03017 g013
Figure 14. Relationship between ultimate bearing capacity and displacement under different aspect ratio: (a) θ = 0°; (b) θ = 30°; (c) θ = 45°; (d) θ = 60°; (e) θ = 90°.
Applsci 16 03017 g014
Figure 15. Relationship between bearing capacity and aspect ratio under different loading inclination angles: (a) ZP/L = 0.0; (b) ZP/L = 0.5; (c) ZP/L = 0.75; (d) ZP/L = 1.0.
Applsci 16 03017 g015
Figure 16. Relationship between ultimate bearing capacity and displacement under different soil undrained shear strengths: (a) θ = 0°; (b) θ = 30°; (c) θ = 45°; (d) θ = 60°; (e) θ = 90°.
Applsci 16 03017 g016
Figure 17. Relationship between bearing capacity and soil undrained shear strength under different loading inclination angles: (a) ZP/L = 0.0; (b) ZP/L = 0.5; (c) ZP/L = 0.75; (d) ZP/L = 1.0.
Applsci 16 03017 g017
Figure 18. Ultimate bearing capacity envelope: (a) L/D = 1.0; (b) L/D = 3.0; (c) L/D = 6.0.
Applsci 16 03017 g018
Figure 19. Fitting curves of envelope for ultimate bearing capacity with different aspect ratios: (a) L/D = 0.5; (b) L/D = 1.0; (c) L/D = 3.0; (d) L/D = 6.0.
Applsci 16 03017 g019
Figure 20. Fitting curves of envelope for ultimate bearing capacity with different undrained shear strengths: (a) cu = 6.6 kPa; (b) cu = 8.6 kPa; (c) cu = 10.6 kPa; (d) cu = 12.6 kPa.
Applsci 16 03017 g020
Figure 21. Fitting results of the cyclic bearing capacity degradation coefficient: (a) θ = 0°; (b) θ = 30°; (c) θ = 60°; (d) θ = 90°.
Applsci 16 03017 g021
Figure 22. Normalized cyclic bearing capacity envelopes under different numbers of loading cycles: (a) Fa = 0.4Ff, Fcyc = 0.1Ff; (b) Fa = 0.4Ff, Fcyc = 0.2Ff; (c) Fa = 0.4Ff, Fcyc = 0.3Ff; (d) Fa = 0.5Ff, Fcyc = 0.1Ff; (e) Fa = 0.4Ff, Fcyc = 0.2Ff.
Applsci 16 03017 g022
Table 1. Soft clay parameters.
w (%)γ (kN/m3)wL (%)wP (%)IPcu (kPa)
39.116.846.628.817.810.6
Table 2. Cyclic Loading Scheme.
θ (°)Fa/FfFcyc/FfNHz
0/30/45/60/900.40.1500/1000/20000.1
0.40.2500/1000/20000.1
0.40.3500/1000/20000.1
0.50.1500/1000/20000.1
0.50.2500/1000/20000.1
0.50.3500/1000/20000.1
0.60.1500/1000/20000.1
0.60.2500/1000/20000.1
Table 3. Bearing capacity of suction caisson foundations under different loading inclination angles and positions.
Zp/L30°45°60°90°
F (N)F/F0F (N)F/F0F (N)F/F0F (N)F/F0F (N)F/F0
0.004121.034401.104721.184121.033560.89
0.506001.505801.454801.204121.033680.92
0.757361.846601.654841.213680.923400.85
1.006601.656001.504801.204041.013600.90
Table 4. Experimental results of post-cyclic ultimate bearing capacity.
θ (°)Ff (N)Fa/FfFcyc/FfNQcyc (N)Qcyc/FfDegradation Range (%)
07360.40.1500/1000/2000707/693/6800.961/0.942/0.9243.9/5.8/7.6
0.40.2500/1000/2000692/682/6670.941/0.927/0.9075.9/7.3/9.3
0.40.3500/1000/2000671/652/6040.912/0.887/0.8218.2/11.3/17.9
0.50.2500/1000/2000663/633/6020.901/0.861/0.8189.9/13.9/18.2
0.60.2500/1000/2000607/564/5180.825/0.767/0.70417.5/23.3/29.6
306600.40.1500/1000/2000638/621/6050.968/0.942/0.9183.2/5.8/8.2
0.40.2500/1000/2000615/605/5880.932/0.918/0.8916.8/8.2/10.9
0.40.3500/1000/2000594/570/5370.901/0.864/0.8159.9/13.6/19.5
0.50.2500/1000/2000588/559/5260.892/0.847/0.79810.8/15.3/20.2
0.60.2500/1000/2000546/504/4540.828/0.765/0.68917.2/23.5/31.1
454840.40.1500/1000/2000465/457/4460.962/0.945/0.9223.8/5.5/7.8
0.40.2500/1000/2000453/444/4340.938/0.918/0.8986.2/9.2/10.2
0.40.3500/1000/2000435/416/3980.900/0.861/0.82210.0/13.9/17.8
0.50.2500/1000/2000423/393/3780.876/0.812/0.78312.4/18.8/21.7
0.60.2500/1000/2000395/372/3280.817/0.769/0.67818.3/23.1/32.2
603680.40.1500/1000/2000358/348/3360.975/0.948/0.9142.5/5.2/8.6
0.40.2500/1000/2000342/335/3250.931/0.912/0.8846.9/9.8/11.6
0.40.3500/1000/2000326/315/3020.887/0.857/0.82111.3/14.3/17.9
0.50.2500/1000/2000312/298/2830.849/0.812/0.77015.1/18.8/23.0
0.60.2500/1000/2000296/270/2460.805/0.734/0.67019.5/26.6/33.0
903400.40.1500/1000/2000329/320/3060.970/0.944/0.9123.0/5.6/9.8
0.40.2500/1000/2000313/303/2930.921/0.892/0.8647.9/10.8/13.6
0.40.3500/1000/2000297/282/2730.875/0.832/0.80412.5/16.8/19.6
0.50.2500/1000/2000294/282/2630.865/0.832/0.77413.5/16.8/22.6
0.60.2500/1000/2000269/247/2190.794/0.728/0.64720.6/27.2/35.3
Table 5. Comparison of ultimate bearing capacities.
Zp (L)θ (°)Test (N)Numerical Simulation (N)Error (%)
0.000412316−23.30
30440339−22.95
45472395−16.31
60412406−1.45
90356329−7.58
0.500600598−0.33
3058064210.68
454804891.875
60412391−5.09
90368333−9.51
0.7507367623.53
30660638−3.33
454845064.54
603683998.42
90340333−2.05
1.000660511−22.57
30600468−22.00
45480450−6.25
60404402−0.49
90360332−7.77
Table 6. Fitting results of the normalized envelope.
L/DcuFitting FormulamnCoefficient of Determination (R2)
0.510.6 H H ult m + V V ult n = 1 2.481.830.975
1.010.62.521.880.987
3.010.62.641.950.991
6.010.62.832.050.993
3.06.62.772.020.987
3.08.62.701.980.957
3.010.62.641.950.991
3.012.62.581.900.987
Table 7. Fitting parameters of the cyclic bearing capacity degradation coefficient δ.
θ (°)n1n2n3R2
02.8651.3980.3580.956
302.8451.4010.3780.968
452.8551.3560.3230.984
602.8321.3680.3540.987
902.8681.3570.3380.978
Disclaimer/Publisher’s Note: The statements, opinions and data contained in all publications are solely those of the individual author(s) and contributor(s) and not of MDPI and/or the editor(s). MDPI and/or the editor(s) disclaim responsibility for any injury to people or property resulting from any ideas, methods, instructions or products referred to in the content.