1. Introduction
Population aging has led to a steady increase in the prevalence of neurodegenerative diseases such as Alzheimer’s and Parkinson’s disease, motivating the development of imaging-based biomarkers that can characterize brain aging at an early stage. Brain age estimation, which quantifies the degree of structural brain aging relative to chronological age, has emerged as a promising biomarker for assessing abnormal aging patterns and potential neurodegenerative risk [
1,
2,
3]. Structural magnetic resonance imaging (MRI), particularly T1-weighted MRI (T1w MRI), has been widely adopted for this task due to its ability to capture macroscopic anatomical changes associated with aging, including cortical thinning and volumetric alterations in gray matter (GM) and white matter (WM) [
4,
5].
Recent advances in deep learning have substantially improved brain age prediction performance. Convolutional neural network (CNN)–based approaches using 3D T1w MRI have demonstrated strong predictive accuracy across large cohorts [
3,
6,
7,
8,
9,
10,
11,
12,
13,
14,
15]. More recently, attention mechanisms and transformer-based models have been introduced to better capture long-range dependencies and region-specific relevance [
16,
17]. Despite these advances, a large portion of existing studies process 3D MRI volumes as collections of 2D slices, which may weaken inter-slice spatial continuity and limit the modeling of volumetric anatomical context. Furthermore, such slice-based formulations can introduce plane-dependent biases, potentially affecting the stability and interpretability of learned representations.
Recent studies have increasingly adopted 3D Vision Transformers and hybrid architectures to capture complex aging trajectories [
18,
19,
20]. However, directly extending massive multiscale 3D transformers to simultaneously process three distinct volumetric inputs (T1, GM, WM) imposes prohibitive GPU memory constraints. Therefore, our model preserves an efficient CNN extractor and utilizes a multi-head cross-attention bottleneck to circumvent the O(N
2) memory explosion.
Another important limitation of existing brain age prediction frameworks lies in the utilization of tissue-derived structural information. Gray matter and white matter exhibit distinct and complementary aging trajectories, providing valuable cues for brain age estimation [
4,
8,
11,
21]. However, in many prior studies, GM and WM information is either indirectly inferred from T1w MRI or incorporated as auxiliary covariates alongside the primary imaging input. As a result, tissue-specific aging patterns may not be fully exploited during model learning, particularly when global brain context and localized anatomical changes need to be considered jointly.
We propose a 3D Global–Patch Transformer framework for brain age prediction that directly operates on volumetric MRI data while explicitly integrating GM and WM structural maps as primary inputs to address these limitations. The proposed framework is designed to preserve full three-dimensional spatial continuity and to simultaneously model global brain structure and localized anatomical patterns. The model enables effective interaction between whole-brain context and region-level features by employing parallel global and patch pathways within a unified 3D architecture. GM and WM maps are combined with T1w MRI using a simple and stable fusion strategy, allowing tissue-specific aging signals to be incorporated without introducing additional fusion parameters.
The main contributions of this work are summarized as follows:
Fully 3D global–local modeling: We present a brain age prediction framework that processes MRI data entirely in three dimensions, preserving volumetric spatial continuity and reducing limitations associated with slice-based approaches.
Explicit use of tissue-specific structural information: GM and WM structural maps are incorporated as primary inputs rather than auxiliary features, enabling direct learning of tissue-specific aging patterns and their complementary roles in brain age estimation.
Global–patch transformer architecture: A parallel global and patch pathway design is adopted to jointly capture whole-brain structural characteristics and localized anatomical variations within a unified transformer-based framework.
Comprehensive empirical evaluation: The proposed method is evaluated on multiple public datasets using a unified preprocessing pipeline, and extensive ablation studies are conducted to analyze architectural choices and input configurations.
The remainder of this paper is organized as follows.
Section 2 reviews related work on brain age prediction and deep learning–based neuroimaging analysis.
Section 3 describes the proposed 3D Global–Patch Transformer framework in detail.
Section 4 presents the experimental setup, datasets, evaluation metrics, and comprehensive experimental analyses. Finally,
Section 5 concludes the paper by summarizing the findings and directions for future work.
3. Proposed Method
This section introduces the proposed 3D Global–Patch Transformer framework for brain age prediction from structural MRI. The proposed method is designed to address two key technical challenges in brain age estimation: (i) preserving three-dimensional spatial continuity when modeling volumetric brain anatomy and (ii) effectively integrating tissue-specific structural information that reflects heterogeneous aging patterns across gray matter (GM) and white matter (WM). To this end, the framework directly operates on 3D MRI volumes and jointly models global brain structure and localized anatomical patterns within a unified architecture.
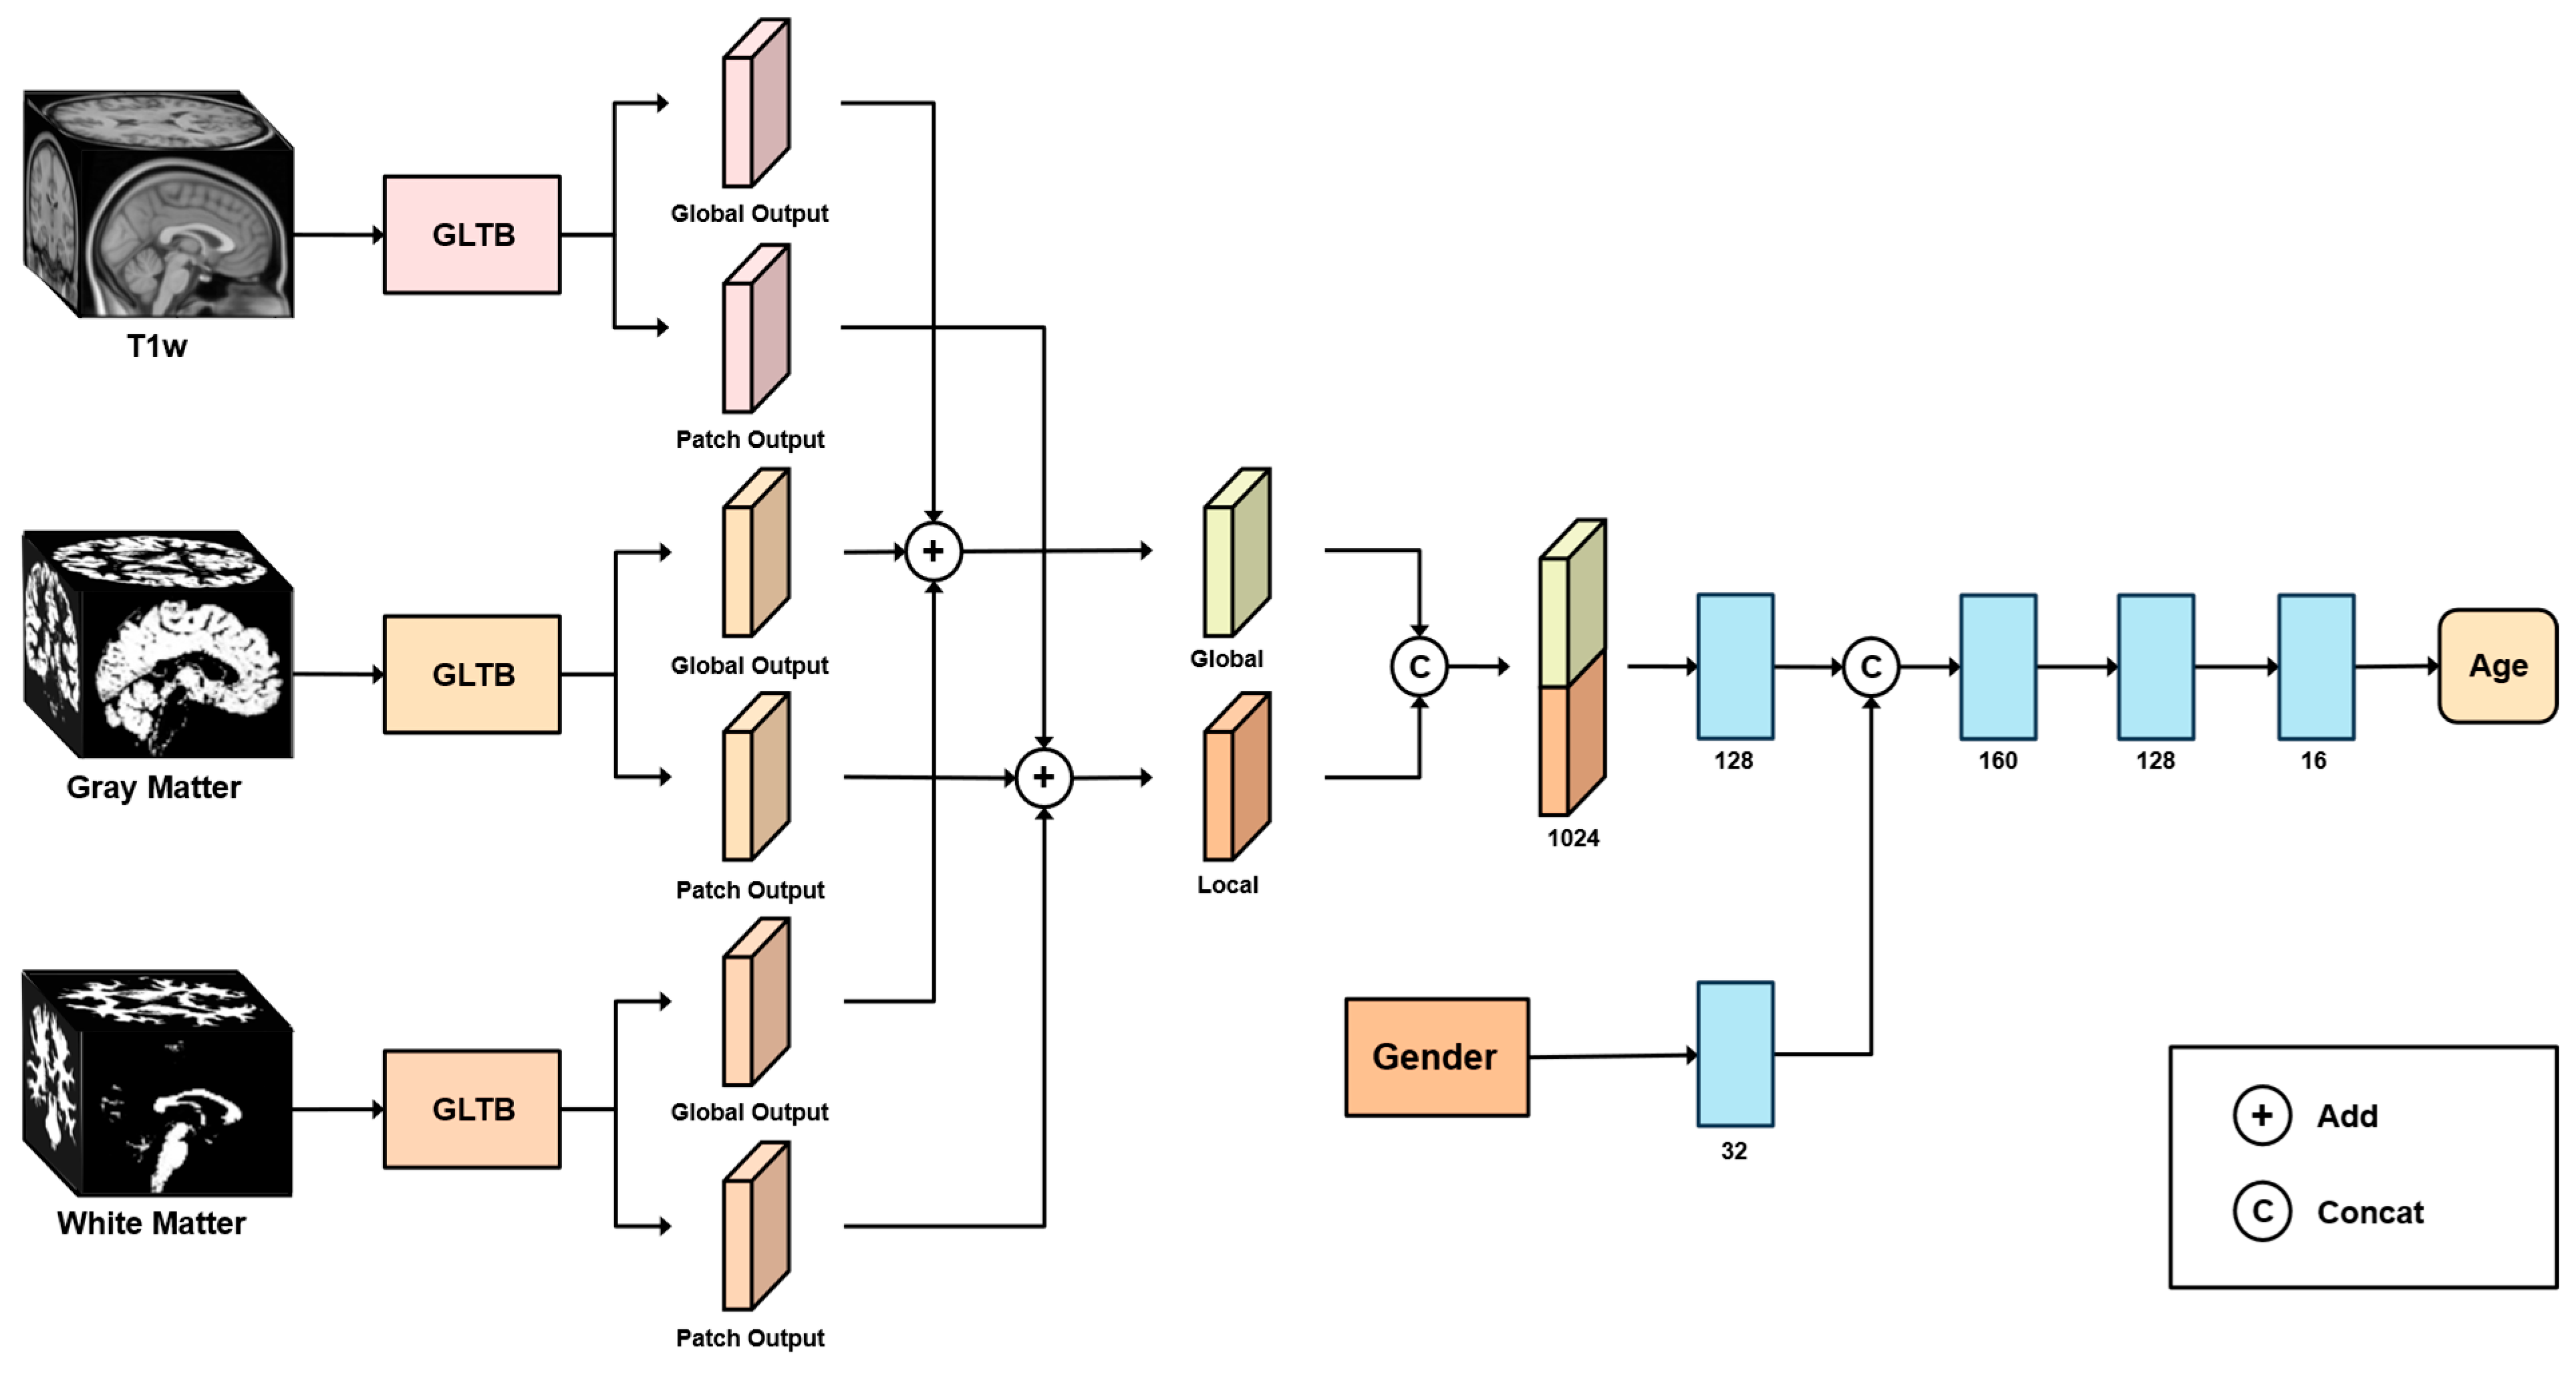
As illustrated in
Figure 1, the model takes T1-weighted MRI (T1w MRI) together with GM and WM structural maps as inputs. The proposed framework explicitly incorporates these tissue-derived maps as primary structural inputs, unlike conventional approaches that implicitly infer tissue information from raw intensity or treat GM/WM as auxiliary covariates. This design choice enables the model to directly capture tissue-specific aging characteristics while maintaining consistent representation and learning across different structural modalities.
The proposed framework adopts a global–patch strategy to capture complementary information at different spatial scales. A global representation encodes whole-brain anatomical context and long-range spatial dependencies, while patch-level representations focus on fine-grained local structural variations extracted from overlapping volumetric regions. These representations are coupled through transformer-based attention mechanisms, allowing localized features to be interpreted in the context of global brain structure. The overall architecture is optimized for stable training and computational efficiency in high-dimensional 3D settings, providing a practical and scalable solution for volumetric brain age prediction. The following subsections describe the individual components of the proposed framework in detail, including the 3D global–patch modeling strategy, the feature extraction and transformer design, and the integration of structural and demographic information together with the training objective.
3.1. 3D Global–Patch Modeling
The proposed framework adopts a 3D global–patch modeling strategy to jointly capture whole-brain structural context and localized anatomical variations from volumetric MRI data. Given that age-related brain changes manifest at multiple spatial scales, ranging from global volumetric atrophy to region-specific tissue degeneration, the model is designed to explicitly represent both global and local information within a unified three-dimensional architecture.
A global representation is first extracted to encode overall brain morphology and long-range spatial dependencies across the entire 3D field of view for each structural input volume. This global feature serves as a compact summary of whole-brain structure and provides contextual guidance for interpreting localized patterns. In parallel, the same input volume is partitioned into overlapping three-dimensional patches, enabling the model to focus on fine-grained anatomical details while preserving spatial continuity between neighboring regions.
Patch-level representations are obtained independently for each volumetric patch and subsequently refined through interaction with the global representation. Specifically, a transformer-based attention mechanism is employed to model global–local interactions, where patch features attend to the global feature to selectively incorporate whole-brain contextual information. Localized structural variations can be interpreted in relation to global anatomical trends, which is particularly important for disambiguating region-specific aging patterns that may appear similar in isolation.
This global–patch interaction is implemented in a fully 3D manner, avoiding slice-based processing and maintaining volumetric consistency throughout the network. By coupling global and patch representations within the transformer module, the proposed modeling strategy enables effective information exchange across spatial scales while retaining computational efficiency for high-dimensional MRI data. The resulting global–local representation forms the basis for subsequent feature refinement and structural integration stages described in the following subsections. This global–patch modeling is implemented as a unified Global–Local Transformer Block (GLTB).
3.2. Feature Extraction and Transformer Design
The proposed framework employs a 3D feature extraction backbone followed by a transformer-based global–patch attention module to effectively represent complex anatomical structures in volumetric MRI data. The design of this component is guided by two considerations: (i) preserving volumetric spatial context while capturing cross-channel interactions and (ii) enabling efficient global–local information exchange within a unified representation.
We adopt a 3D convolutional architecture inspired by ConvNeXt [
24] for feature extraction. While ConvNeXt was originally developed for 2D image recognition, its core design principles—including large receptive fields, hierarchical feature representation, and simplified block structure—are adapted to three-dimensional MRI data. In particular, depthwise convolutions are replaced with standard 3D convolutions to jointly model spatial and inter-channel relationships, which are critical for capturing volumetric anatomical patterns in brain MRI. The backbone consists of multiple stages with progressively increasing channel dimensions and receptive fields, allowing the network to encode both low-level structural details and higher-level anatomical abstractions.
The extracted volumetric features are subsequently processed by a transformer module designed to model interactions between global and patch-level representations. Therefore, the global feature serves as a contextual reference, while patch-level features act as localized descriptors. Patch features are treated as queries, and the global representation is used as keys and values within a multi-head attention mechanism.
The interaction within the GLTB is strictly based on a multi-head cross-attention mechanism, where localized patch features serve exclusively as queries (), and the global representation acts as keys () and values ().
Let
denote the sequence of localized patch features, where
is the number of patches and
is the feature dimension. Similarly, let
represent the global feature vector encapsulating the whole-brain context. These features are projected into query (
), key (
), and value (
) spaces through learnable linear projections:
where
,
,
∈
are the projection matrices, and
is the dimension of the key vectors. The cross-attention operation is then formalized as:
The dot product computes the relevance scores between each local patch and the global context. The scaling factor is applied to prevent gradient vanishing in the softmax function. By using the global feature as the key and value, each patch representation is refined by explicitly attending to the global anatomical structure, allowing the model to interpret localized aging signals (e.g., cortical thinning in a specific region) within the context of overall brain atrophy.
Multi-head attention extends this mechanism by performing the attention operation
times in parallel, allowing the model to jointly attend to information from different representation subspaces. The outputs of the attention heads are concatenated and linearly projected to form the final refined patch representations:
where
=
and
∈
is the output projection matrix.
The attention outputs are passed through position-wise feed-forward layers with residual connections and normalization to stabilize training and enhance representational capacity. Multiple transformer blocks are stacked to progressively refine the global–local representations, allowing iterative integration of contextual information across spatial scales. Importantly, all operations are performed in a fully three-dimensional manner, preserving volumetric consistency and avoiding the loss of inter-slice relationships inherent to slice-based approaches.
This module provides a flexible and expressive representation of brain structure that captures both distributed anatomical context and localized aging-related variations by combining a 3D convolutional backbone with a global–patch transformer design. The resulting features serve as the foundation for subsequent structural integration and regression stages described in the following subsection.
3.3. Structural Integration and Training Objective
Gray matter (GM) and white matter (WM) maps derived from T1-weighted MRI are integrated into the proposed framework as primary inputs to explicitly incorporate tissue-specific structural information. Each structural input, such as T1w MRI, GM, and WM, is processed independently through the same 3D feature extraction and global–patch transformer pipeline described in the previous subsections. This shared-parameter design ensures consistent representation learning across different structural modalities while avoiding modality-specific bias.
The resulting global–local representations from the T1w, GM, and WM streams are combined using an element-wise addition operation. This fusion strategy is intentionally chosen to provide a simple and stable mechanism for aggregating complementary tissue information without introducing additional trainable parameters. This fusion strategy does not introduce additional trainable parameters, thereby preserving computational efficiency and stable optimization when handling high-dimensional 3D volumetric features. Given the high dimensionality of volumetric MRI features, this design helps maintain computational efficiency and stable optimization while allowing tissue-specific aging signals to be directly integrated into a unified representation.
Demographic information is incorporated as auxiliary input to provide complementary contextual cues for brain age estimation in addition to imaging-derived features. Specifically, gender is encoded as a low-dimensional vector and concatenated with the fused global–local representation prior to the regression layers. This design allows demographic factors to contribute to the prediction while ensuring that structural MRI features remain the dominant source of information. The contribution of demographic information is further examined in the experimental analysis through feature-combination studies.
The fused representation is projected to a compact latent space via fully connected layers, resulting in a 128-dimensional feature embedding that summarizes both global and localized structural characteristics. The 128-dimensional feature embedding is concatenated with the encoded demographic information and further processed by a fully connected layer to produce a 160-dimensional representation for final brain age regression. A regression head is then applied to estimate brain age as a continuous scalar output. During training, the framework is optimized using a composite loss function designed to balance absolute prediction accuracy and relative ranking consistency across subjects. Mean squared error (MSE) is employed as the primary regression objective, minimizing the discrepancy between predicted brain age and chronological age. In addition, a rank-based loss inspired by Spearman’s rank correlation coefficient (SRCC) is incorporated to encourage consistent ordering of predictions. To enable gradient-based optimization, a differentiable approximation of the ranking operation is adopted following the SoDeep [
12] framework.
The Combined Loss function is mathematically defined as follows:
Let
denote the batch size during training. For the i-th subject in a batch, let
be the chronological age and
be the predicted brain age. The training objective consists of two components: a regression loss to minimize prediction error and a ranking loss to enforce ordinal consistency. The Mean Squared Error (MSE) loss is employed as the primary regression objective and is defined as:
This term ensures that the predicted brain age values are quantitatively close to the ground-truth chronological ages.
We incorporate a differentiable ranking loss to enforce ordinal consistency among predictions. We also utilize a pretrained proxy network (a continuously differentiable sorter) to approximate the ranks, following the approach proposed in [
12] since the standard rank operator is non-differentiable (due to the sorting operation). The proxy-based ranking objective was adopted to provide a differentiable approximation to the sorting operation, thereby enabling end-to-end optimization of relative age ordering within the proposed 3D framework. In contrast to conventional margin-based pairwise ranking formulations, this design is intended to preserve broader ordinal relationships among predicted ages without depending solely on a manually specified margin threshold. By incorporating the proxy network into the ranking formulation, the model can optimize age-order consistency jointly with the regression objective in a differentiable manner.
Let
T and
T denote the vectors of chronological ages and predicted brain ages in a batch, respectively. The differentiable ranking loss is defined as the mean absolute difference between the ground-truth ranks and the approximated predicted ranks:
where
represents the fixed ground-truth rank of the i-th subject within the batch, and
(⋅) denotes the output of the pre-trained proxy network that approximates the ranking operation. This formulation allows gradients to be back-propagated through the ranking step, encouraging the model to preserve the relative order of brain ages even when absolute values fluctuate.
The final objective function combines these two terms:
where
α is a hyperparameter balancing absolute error minimization and ranking consistency.
Although this formulation provides a practical approximation to the ranking objective, the present study did not systematically evaluate the sensitivity of final performance to the pre-training condition or initialization of the proxy network. Therefore, the robustness of the ranking component with respect to proxy-network configuration remains an important topic for future investigation.
4. Experiments and Analysis
This section presents the experimental evaluation of the proposed 3D Global–Patch Transformer for brain age prediction. Experiments are conducted using four publicly available brain MRI datasets under a unified preprocessing and training protocol. The proposed method is evaluated through quantitative comparison with representative convolutional neural network (CNN)–based and transformer-based approaches reported in prior brain age prediction studies.
4.1. Datasets, Preprocessing, and Experimental Setup
Experiments are conducted using four publicly available T1-weighted brain MRI datasets: ABIDE [
25], CoRR [
26], IXI [
27], and OASIS-3 [
28]. Only healthy subjects are included in all experiments. The number of samples, age ranges, and gender distributions for each dataset are summarized in
Table 1. For the multi-site datasets ABIDE and CoRR, site-wise dataset compositions are further reported in
Table 2 and
Table 3.
All MRI scans are processed using a unified preprocessing pipeline implemented with SPM [
29]. Each T1-weighted image is nonlinearly registered to the MNI152 template and resampled to a voxel resolution of 2 mm, resulting in standardized volumes of size 79 × 95 × 79. Gray matter (GM) and white matter (WM) structural maps are derived from the preprocessed T1-weighted images using tissue segmentation provided by SPM, following the same procedure across all datasets. This unified SPM-based preprocessing was adopted to ensure consistency across datasets; however, robustness to alternative preprocessing settings and more heterogeneous clinical acquisition protocols warrants further investigation.
Five-fold cross-validation is employed for all experiments unless otherwise specified. For datasets containing multiple scans per subject, such as OASIS-3, subject-level splitting is applied to ensure that images from the same subject do not appear in both training and evaluation sets.
All models are trained and evaluated using identical data splits and preprocessing settings to ensure a fair comparison. Model training follows the configuration described in
Section 3. The patch size was empirically set to 48 × 48 × 48 with a stride of 12. Optimization is performed using the Adam optimizer. To mitigate overfitting, we applied a dropout rate of 0.5 within the transformer modules, utilized strictly held-out validation sets for early stopping, and ensured no data leakage occurred during hyperparameter tuning. Mean absolute error (MAE) is used as the primary evaluation metric, and Pearson correlation coefficient (PCC) is additionally reported to assess the correlation between predicted and chronological age.
4.2. Quantitative Results and Comparison with Existing Methods
The quantitative performance of the proposed method is summarized in
Table 4. Experiments are conducted on the ABIDE, CoRR, IXI, and OASIS datasets using five-fold cross-validation under the same preprocessing and training protocol. Performance is evaluated using mean absolute error (MAE) and Pearson correlation coefficient (PCC).
The mathematical formulation of MAE is given as:
where
is the actual value,
is the predicted value, and
denotes the total number of samples in the test set.
PCC evaluates the strength and direction of the linear relationship between two variables, providing a measure of the correlation between predicted and actual values. The coefficient ranges from −1 to 1, where values closer to 1 indicate a stronger positive linear relationship.
The mathematical definition of PCC is as follows:
Here, and represent the mean of the actual and redicted values, respectively.
MAE was used to evaluate the model’s accuracy by quantifying the magnitude of absolute prediction errors, whereas PCC was employed to assess the strength of the linear relationship between the predicted and actual values. Together, these metrics offer complementary perspectives on model performance, encompassing both error magnitude and predictive correlation.
The proposed 3D Global–Patch Transformer consistently achieves lower MAE and comparable or higher PCC values across all four datasets compared with representative CNN-based and transformer-based baseline methods, including 3D CNN, 3D ResNet, 3D DenseNet, SFCN [
11], and GLTN [
16]. On the ABIDE dataset, the proposed method achieves an MAE of 2.28 ± 0.22 with a PCC of 0.86 ± 0.02. On the CoRR dataset, an MAE of 3.58 ± 0.23 and a PCC of 0.93 ± 0.03 are obtained. For the IXI dataset, the proposed model reports an MAE of 4.46 ± 0.25 with a PCC of 0.91 ± 0.01, while on the OASIS dataset, an MAE of 2.59 ± 0.16 and a PCC of 0.92 ± 0.01 are achieved.
The proposed method yields lower MAE across all datasets while maintaining similar levels of correlation compared to slice-based transformer approaches such as GLTN [
16]. Our proposed framework also shows consistent improvements in absolute prediction error, particularly on datasets with broader age distributions relative to conventional 3D CNN-based architectures, including ResNet and DenseNet variants.
In addition,
Table 4 reports the performance of global-only and local-only variants of the proposed architecture. While both variants achieve competitive results, neither matches the performance of the full global–patch configuration, indicating that jointly modeling global and localized anatomical information contributes to improved brain age estimation accuracy.
4.3. Computational Complexity
Regarding computational complexity, the proposed model contains approximately 1.58 billion parameters. Despite this massive scale, the cross-attention bottleneck effectively restricts the estimated peak GPU memory consumption per sample to approximately 9.95 GB. This O(N) attention complexity allows the model to be trained on standard high-end GPUs without the severe memory explosion typical of standard 3D self-attention mechanisms.
Although the overall model remains computationally demanding due to simultaneous processing of T1-weighted MRI, GM, and WM volumes, the asymmetric global-local cross-attention design constrains contextual interaction to global-guided local refinement and thereby avoids the severe growth in memory usage typically associated with dense volumetric self-attention.
4.4. Ablation and Structural Input Analysis
A series of ablation experiments are conducted to analyze the effects of architectural design choices and input configurations. The results are summarized in
Table 5 and
Table 6. Unless otherwise specified, all ablation experiments are performed on the IXI dataset using the same preprocessing and training protocol described in
Section 4.1.
Table 5 reports the effect of the loss-weight parameter α in the composite training objective. When α is set to 0.1, the proposed model achieves the lowest MAE of 4.46 ± 0.25 with a PCC of 0.91 ± 0.01. Increasing α to 0.5 or 1.0 results in higher MAE values and slightly reduced PCC, indicating that the rank-based loss term is most effective when used with a relatively small weight.
Table 6 presents the performance of different structural input combinations. When only T1-weighted MRI is used as input, the model shows the highest MAE across all datasets. Incorporating either GM or WM information improves prediction accuracy compared with the T1-only configuration. Among the single-tissue inputs, GM-only consistently yields lower MAE than WM-only. When both GM and WM are jointly used, the model achieves further improvements in MAE and PCC across datasets, reaching performance comparable to the full configuration that additionally includes demographic information.
The ablation results indicate that GM and WM maps carry a substantial proportion of the predictive signal for brain-age estimation. In particular, the strong performance of GM + WM-based configurations suggests that tissue-derived structural representations contain highly informative age-related features. However, this should not be interpreted as implying that T1-weighted MRI is redundant. Rather, T1-weighted MRI may provide complementary global anatomical context that is less directly encoded in tissue-specific maps. Accordingly, within the proposed framework, the role of T1-weighted MRI is interpreted as complementary rather than dominant.
4.5. Qualitative Analysis and Visualization
Qualitative analyses are conducted to examine the spatial characteristics of the learned representations and to support the quantitative results. Visualization results are obtained using Gradient-weighted Class Activation Mapping (Grad-CAM) applied to the proposed model. Representative examples are shown in
Figure 2,
Figure 3 and
Figure 4.
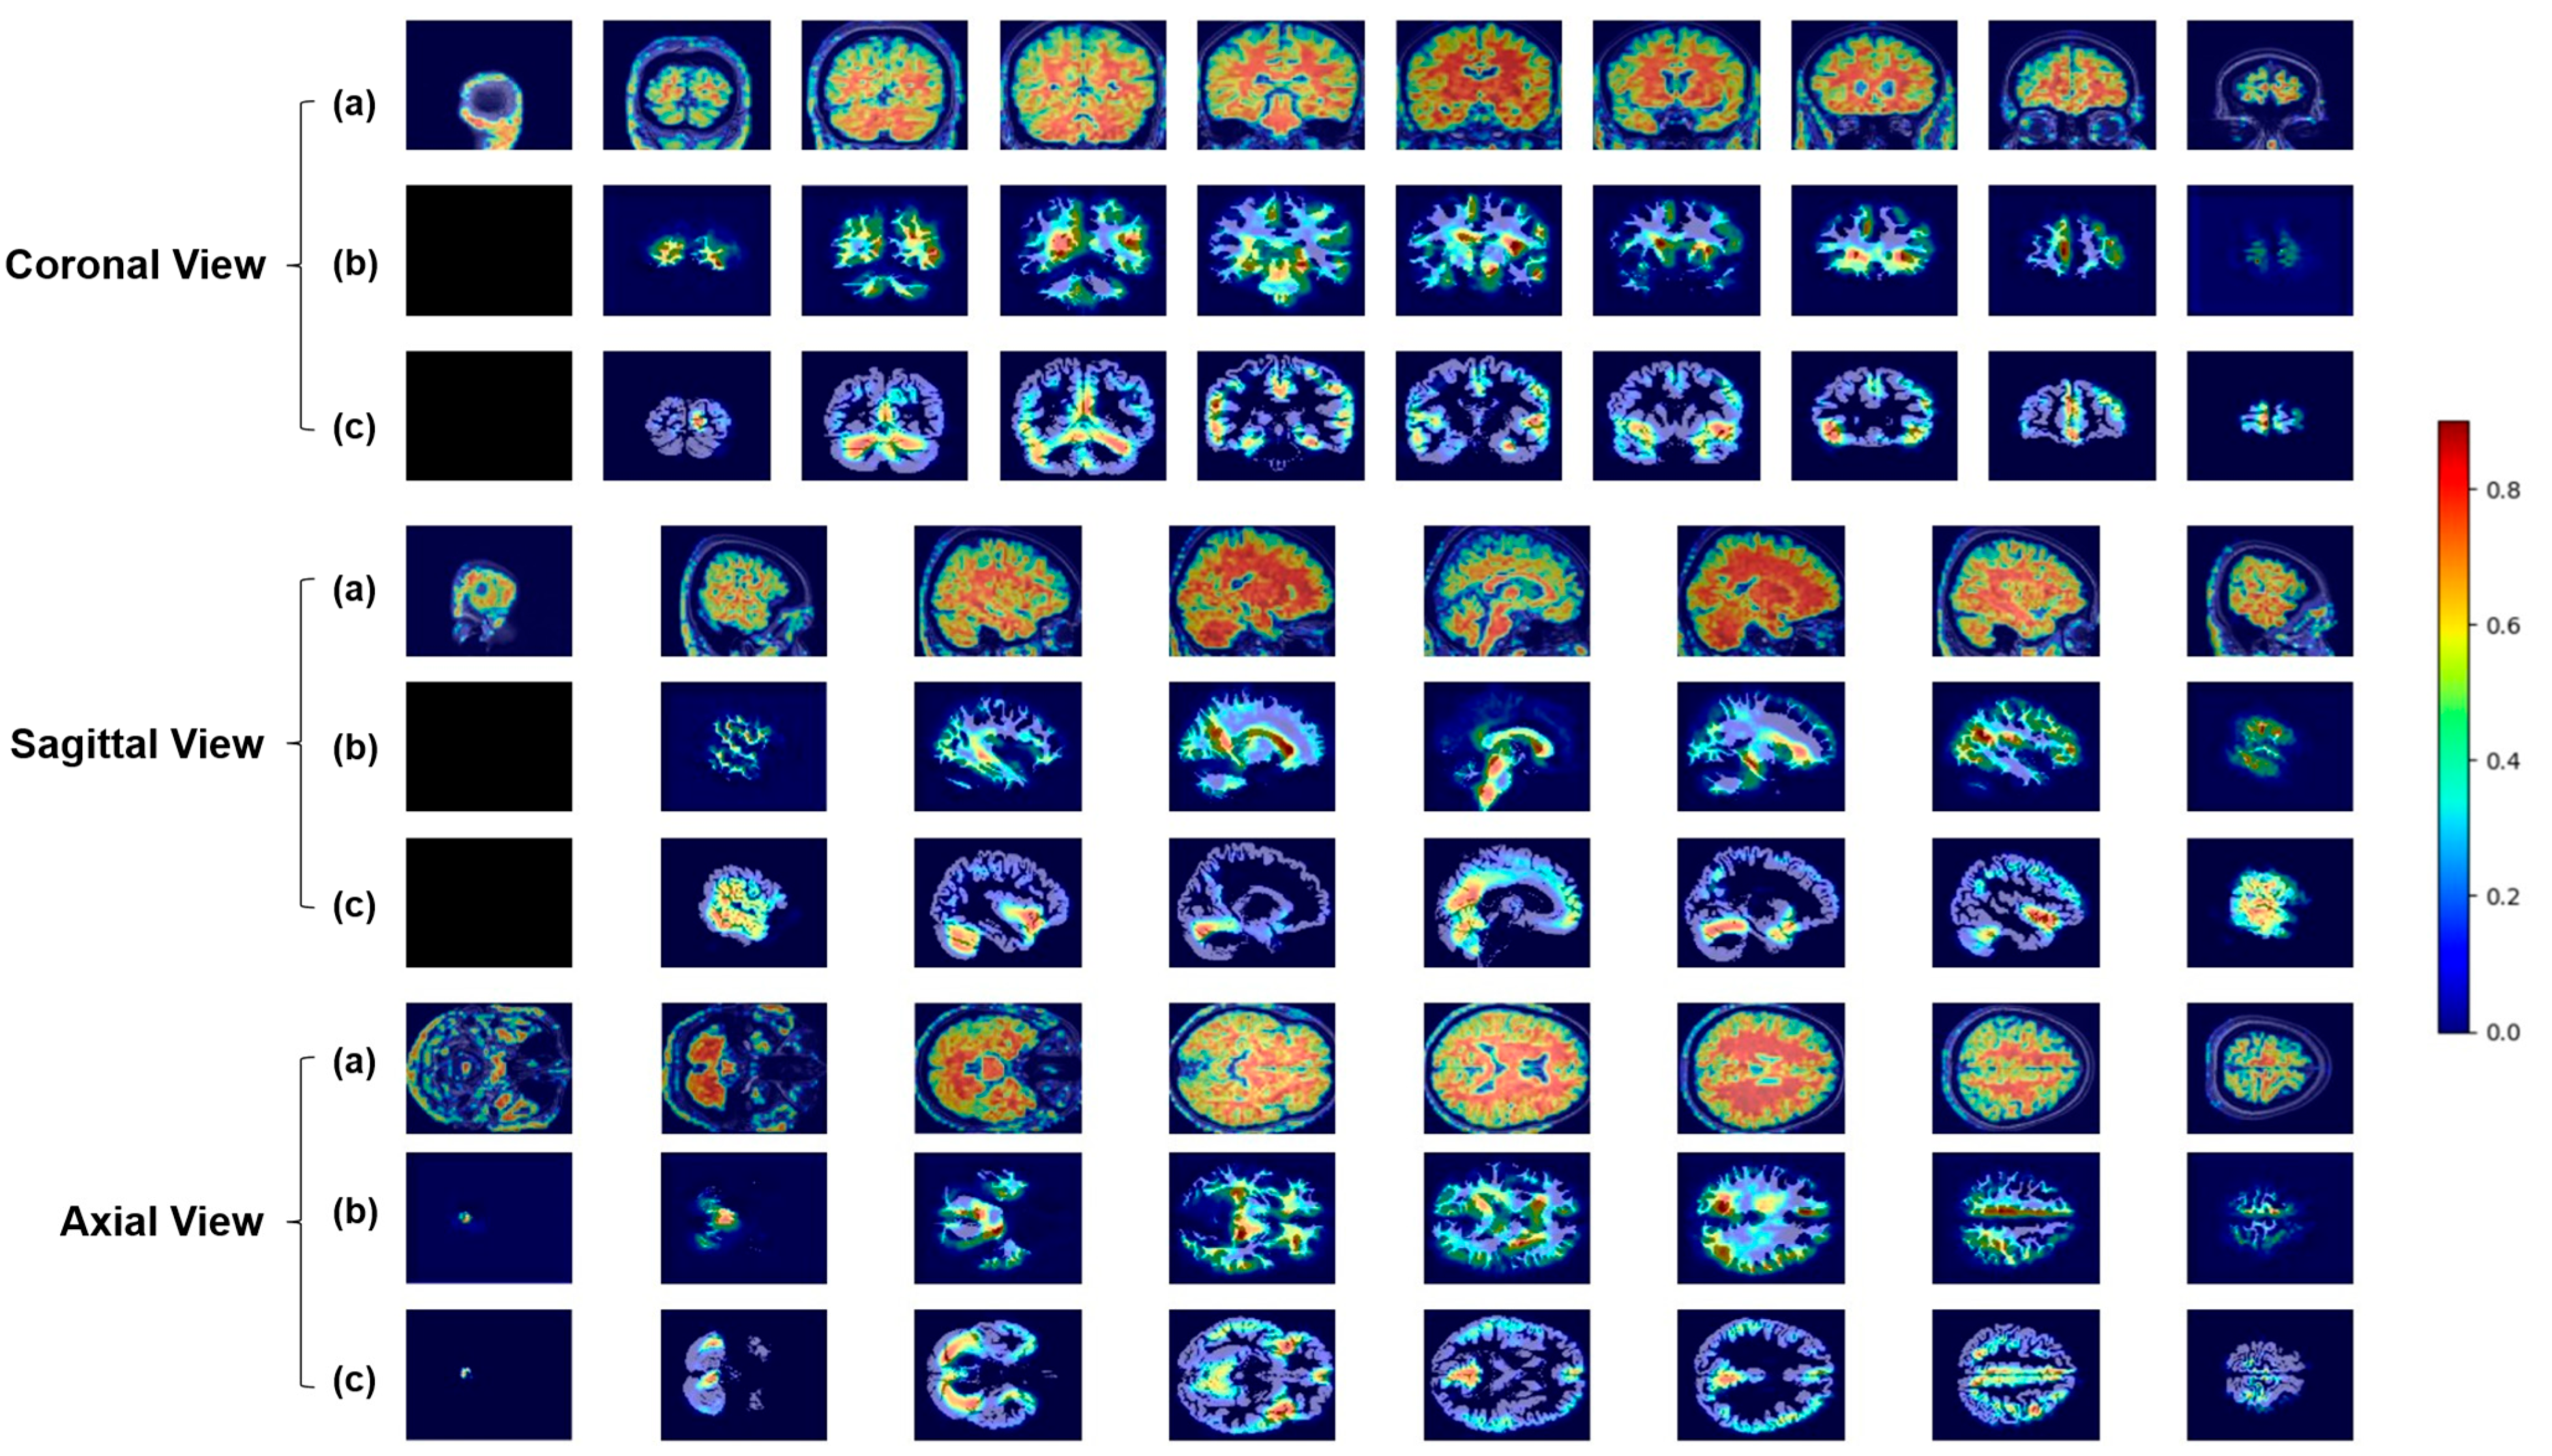
Figure 2 illustrates Grad-CAM activation maps overlaid on T1-weighted MRI, gray matter (GM), and white matter (WM) inputs for a representative subject. The activation patterns highlight central brain regions and areas associated with GM and WM structures, indicating that the model attends to spatial regions relevant to brain age estimation. Activation maps are observed consistently across different anatomical planes, including axial, sagittal, and coronal views.
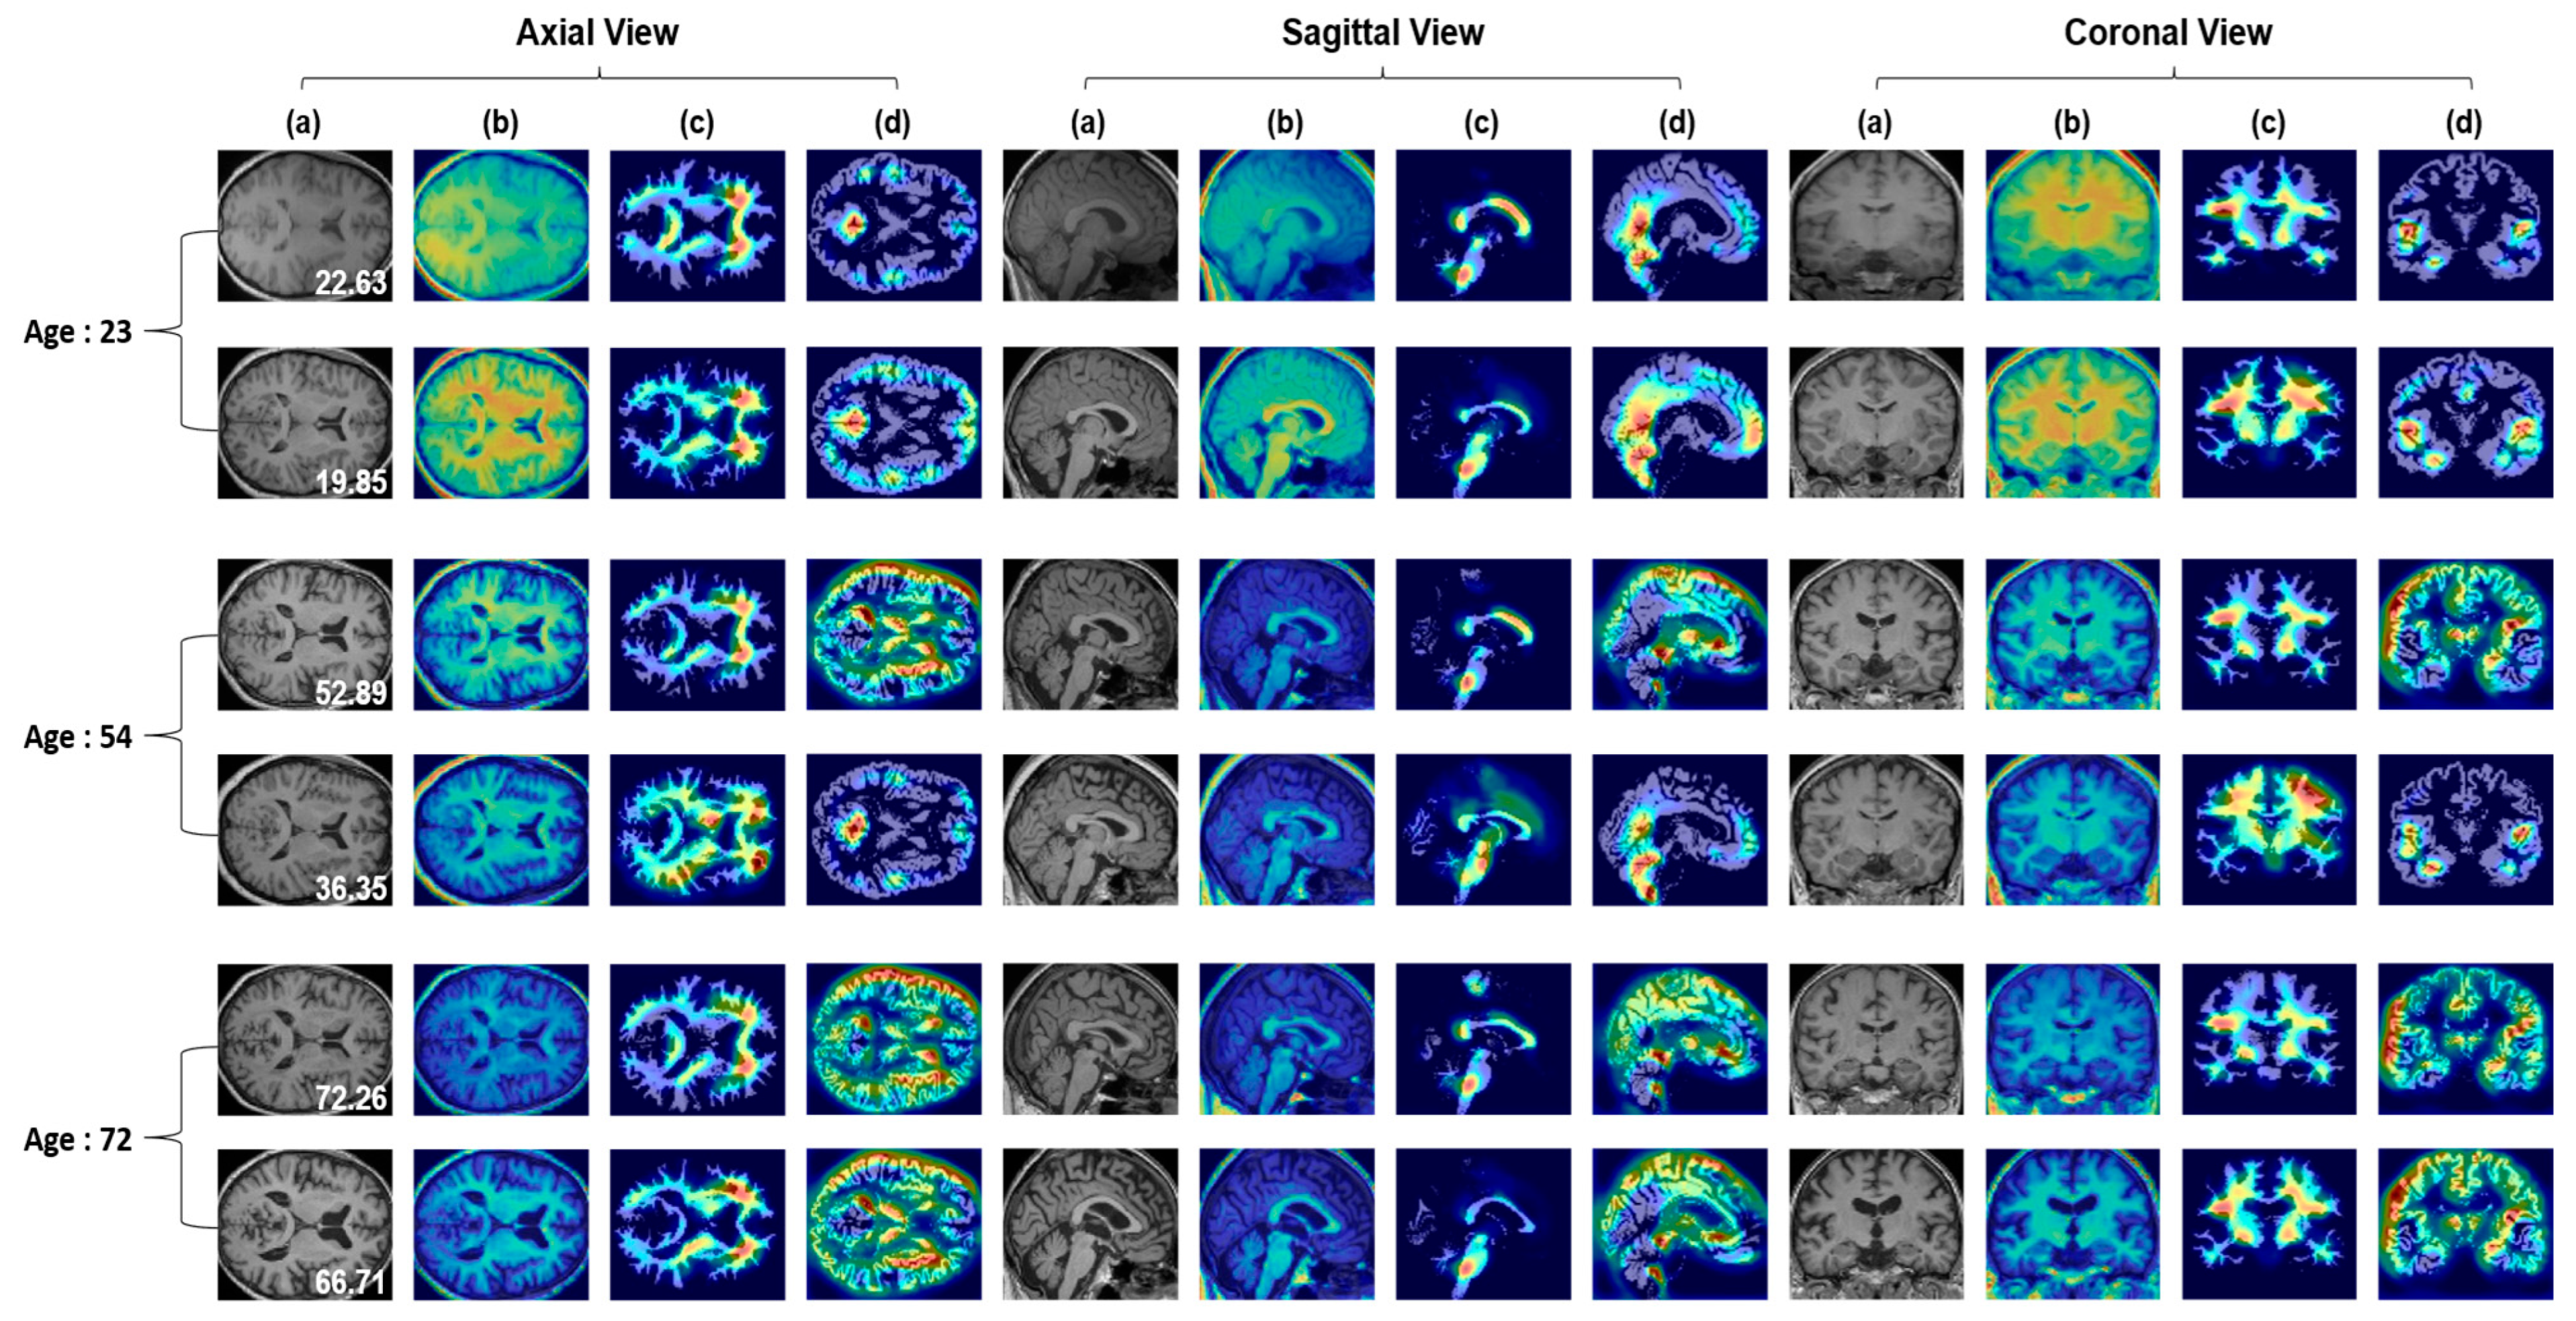
Figure 3 presents examples of brain age prediction results for subjects from different age groups (23, 54, and 72 years). For each age group, cases with accurate predictions and cases with larger prediction errors are visualized. In cases with lower prediction error, Grad-CAM activations tend to be more spatially focused, whereas in cases with higher prediction error, broader and less localized activation patterns are observed.
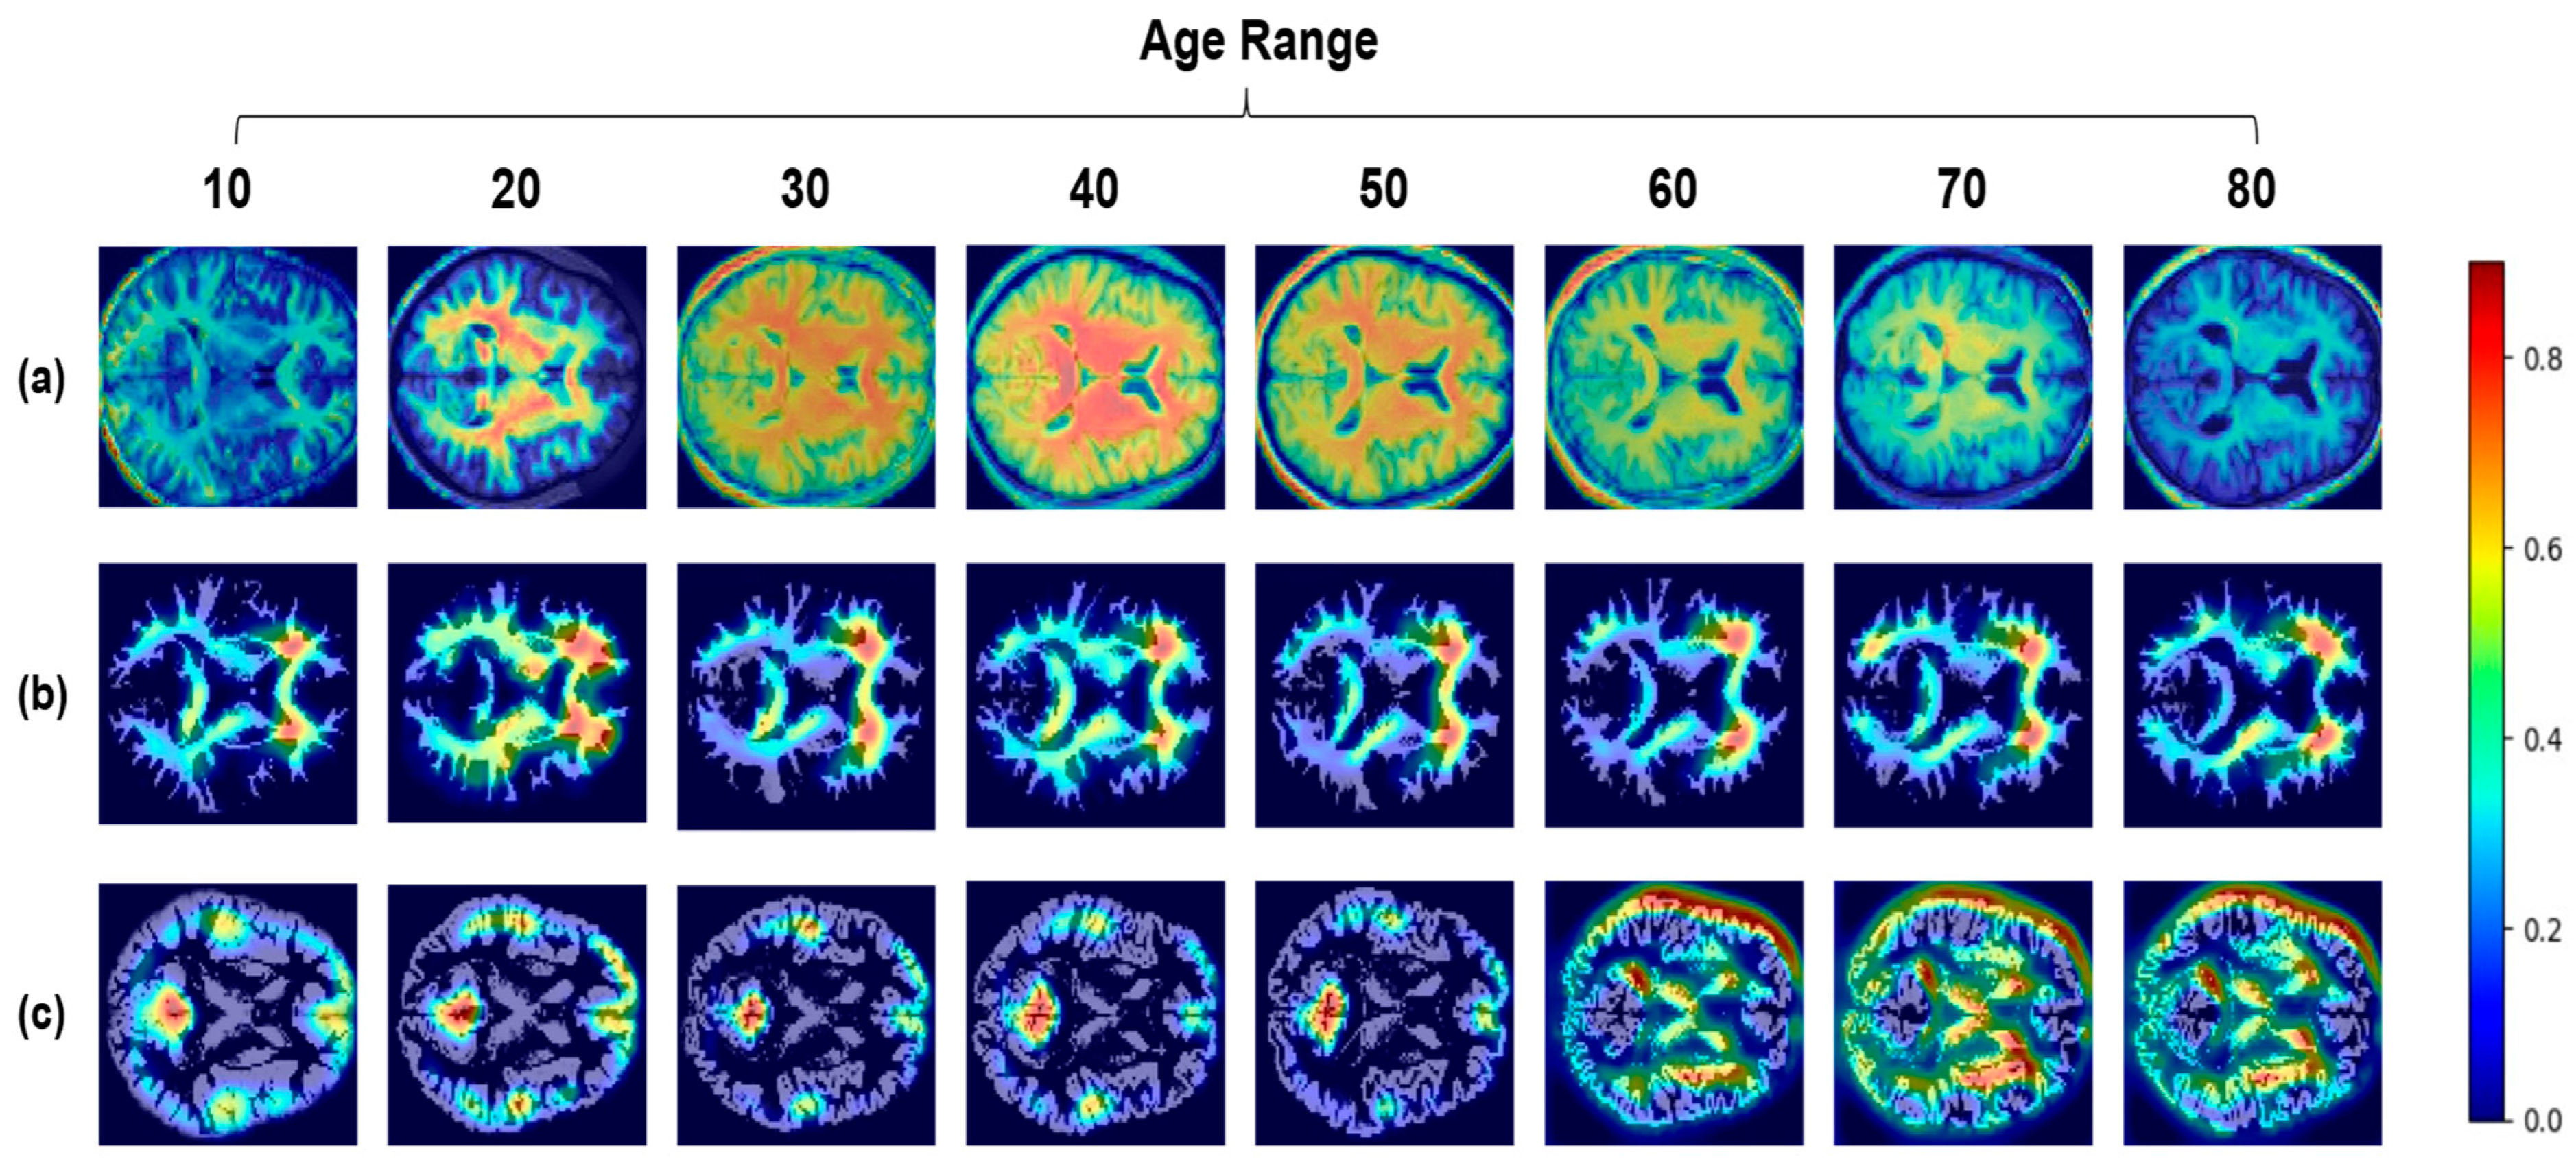
Figure 4 shows Grad-CAM visualizations across age ranges at 10-year intervals. As age increases, changes in activation patterns are observed across T1-weighted MRI, GM, and WM inputs. In particular, GM-related activations become more pronounced in older age groups, while WM-related activations show relatively less variation in the presented examples. These observations are consistent with the quantitative results and reflect age-dependent structural differences captured by the model.
5. Discussion
The present study showed that the proposed global–local transformer framework provided consistent performance improvements for multimodal brain-age estimation across multiple datasets. By combining whole-brain contextual information with local patch refinement, the model was designed to capture both global anatomical structure and tissue-specific variation from T1-weighted MRI, GM, and WM inputs. The ablation results suggested that GM and WM contributed substantially to prediction performance, whereas T1-weighted MRI played a complementary role by providing broader anatomical context. These results support the usefulness of jointly modeling global and local information in multimodal 3D neuroimaging.
The Grad-CAM results provided qualitative evidence that the model captured age-related structural patterns across tissue types and age groups. In particular, the activation maps suggested tissue-specific differences in salient regions, with stronger GM-related responses in older groups. However, these findings should be interpreted cautiously because the present study did not include atlas-level quantitative validation, cortical thinning correspondence analysis, or region-wise comparison with established neuroanatomical biomarkers. Therefore, the biological interpretation of the activation maps remains preliminary.
Several limitations should be noted. First, because the GM and WM maps were generated by automated segmentation, segmentation errors may have affected downstream prediction performance. Second, although the same SPM-based preprocessing pipeline was applied across datasets, residual inter-site and inter-scanner heterogeneity may still have influenced the learned representations, and harmonization methods were not examined. Third, although the proposed model showed consistent improvements under the same evaluation setting, formal post hoc statistical analyses were not performed. Fourth, the computational evaluation was incomplete because detailed training time and full runtime benchmarking against all baseline models were not systematically recorded. Finally, the sensitivity of the proxy-based ranking objective to the pre-training condition of the proxy network was not evaluated.
For future clinical application, improving parametric reliability and operational robustness will be important. In this regard, hybrid AI optimization strategies, such as the AI-Taguchi-ANOVA approach [
30,
31], may help improve hyperparameter tuning and system stability. Future work should address statistical uncertainty, interpretability validation, scanner harmonization, broader benchmarking, and optimization for more reliable clinical translation.
6. Conclusions
This study presented a 3D Global–Patch Transformer framework for brain-age prediction from structural MRI. The proposed model directly processes volumetric data and incorporates GM and WM structural maps within a unified architecture, enabling joint learning of whole-brain context and localized anatomical patterns.
Under a consistent preprocessing and training protocol, the proposed method achieved lower mean absolute error and comparable or higher correlation than representative baseline models. The ablation results further supported the contribution of multimodal tissue inputs and the global–patch design to prediction performance.
Overall, these findings suggest that combining global and local structural information in multimodal 3D MRI is an effective strategy for brain-age estimation and provides a useful foundation for future neuroimaging and clinical applications.