Review

Practical Guide to Fetal Functional Cardiac Assessment

1
Perinatal Imaging Research Group, Royal Hospital for Women, Barker St., Randwick, Sydney, NSW 2031, Australia
2
School of Clinical Medicine Level 0, Royal Hospital for Women, University of New South Wales, Barker St., Locked Bag 2000, Randwick, Sydney, NSW 2031, Australia
3
Department of Maternal Fetal Medicine, King Khalid University Hospital, Riyadh 12372, Saudi Arabia
4
Institute of Obstetrics and Gynaecological, Imaging and Fetal Therapy Sheba Medical Centre, Tel HaShomer, Tel Aviv 5590500, Israel
5
Barcelona Center for Maternal-Fetal and Neonatal Medicine, Hospital Clínic and Hospital Sant Joan de Deu, 08037 Barcelona, Spain
*
Author to whom correspondence should be addressed.
Appl. Sci. 2026, 16(6), 2972; https://doi.org/10.3390/app16062972
Submission received: 6 August 2025 / Revised: 1 March 2026 / Accepted: 3 March 2026 / Published: 19 March 2026

Abstract

Background: Recent evidence suggests the potential role of fetal cardiac function parameters in the assessment of different obstetrical conditions. Despite this evidence, the application of cardiac function parameters to routine fetal cardiac evaluation is limited. Among other reasons, the lack of accessibility to a simple, practical instrument offering tips on how to carry out a fetal cardiac functional assessment could explain this restricted application. Methods: A narrative review of the available literature on how to practically carry out a fetal cardiac function assessment was reviewed and summarized to offer an instrument to assess fetal cardiac function alongside the classical morphological evaluation. Results: The contents of this guide are focused exclusively on the practical details to carry out a fetal cardiac function assessment and voluntarily exclude the definition of and indications for the parameters assessed. The guide includes the assessment of fetal cardiac morphometry, valvular evaluation and cardiac contractility. Conclusions: The aim of this guide is to make fetal cardiac functional parameters more accessible to maternal and fetal medicine health professionals with a good background knowledge of fetal cardiology.

1. Introduction

The heart is a crucial organ in the fetal adaptation to an adverse environment. When the fetal heart is exposed to an insult, its adaptation produces modifications in its structure and shape, defined as cardiac remodeling [1]. If the insult persists, in addition to the morphological changes, the fetal heart can also be affected by functional changes.
Several maternal and fetal conditions have been indicated as associated with cardiac dysfunction, such as fetal growth restriction, diabetes, preeclampsia, fetal anemia, artificial reproduction techniques (ART), antiretroviral therapies for human immunodeficiency virus (HIV) and congenital heart diseases [2,3,4,5,6].
Although these cardiac morphological and functional changes could potentially affect the long-term health of the offspring, fetal cardiac functional evaluation is still not included in the routine obstetric clinical practice [2,4].
Among different reasons, the lack of accessibility to a clear, easy instrument to practically learn how to perform a fetal cardiac function assessment explains why health professionals still do not apply these parameters in their daily obstetrical practice.
This guide aims to make fetal cardiac functional parameters more accessible to maternal and fetal medicine health professionals.
The idea is to offer an instrument to professionals with good background knowledge and experience in fetal cardiology who are interested in independently assessing fetal cardiac function alongside the more classical morphological evaluation.
The contents of this guide are focused exclusively on the practical details to carry out a fetal cardiac function assessment and voluntarily exclude the definition of and indications for the parameters assessed.

2. Methods

A literature search was performed in EMBASE, Pubmed and the Cochrane Library to collect studies describing the methodology to carry out the most commonly applied fetal cardiac functional parameters.
Parameters describing fetal cardiac morphology, valvular function and cardiac contractility and their different abbreviations, were included in our search. The search was restricted to English-language published literature.
All the available studies explaining the techniques embraced in a fetal cardiac function assessment were retrieved, evaluated and included.
A narrative review of these techniques summarizes details on how to practically perform the assessment to enable obstetrical health professionals to carry out a functional assessment.

3. Fetal Cardiac Morphometry Evaluation

3.1. General Introduction

Fetal cardiac function evaluation is closely related to changes in heart size and shape (cardiac remodeling); thus, a comprehensive fetal cardiac evaluation includes morphometric assessment of the fetal heart.
The most common changes in fetal cardiac size and shape are cardiomegaly, myocardial hypertrophy, and a more globular shape of the heart. The parameters of the heart currently suggested to be measured are the following: heart/thorax area measurement, four heart chambers measurements, atrial and ventricular areas, ventricular and atrial sphericity indices, and myocardial septal and free walls thickness measurement [7].
The most frequently used technique for assessing these morphometric parameters is two-dimensional (2D) ultrasound, while myocardial wall thicknesses can be measured using motion mode (M-mode) ultrasound.
All measurements are taken at the end of diastole, except for atrial dimensions, which are measured at their maximum extension during systole [7]. Atrioventricular valve closure identifies the end of diastole, when the ventricles reach their largest size [8]. The end of systole is defined as the moment just before the atrioventricular valves open, when the atria are stretched to their maximum magnitude [7].

3.2. Cardiothoracic Area and Atrioventricular Areas

3.2.1. Cardiothoracic Area

Evaluating cardiac size is a crucial aspect of fetal cardiac screening. A normal heart, viewed at the level of the four-chamber, typically occupies no more than one-third of the chest area [9].
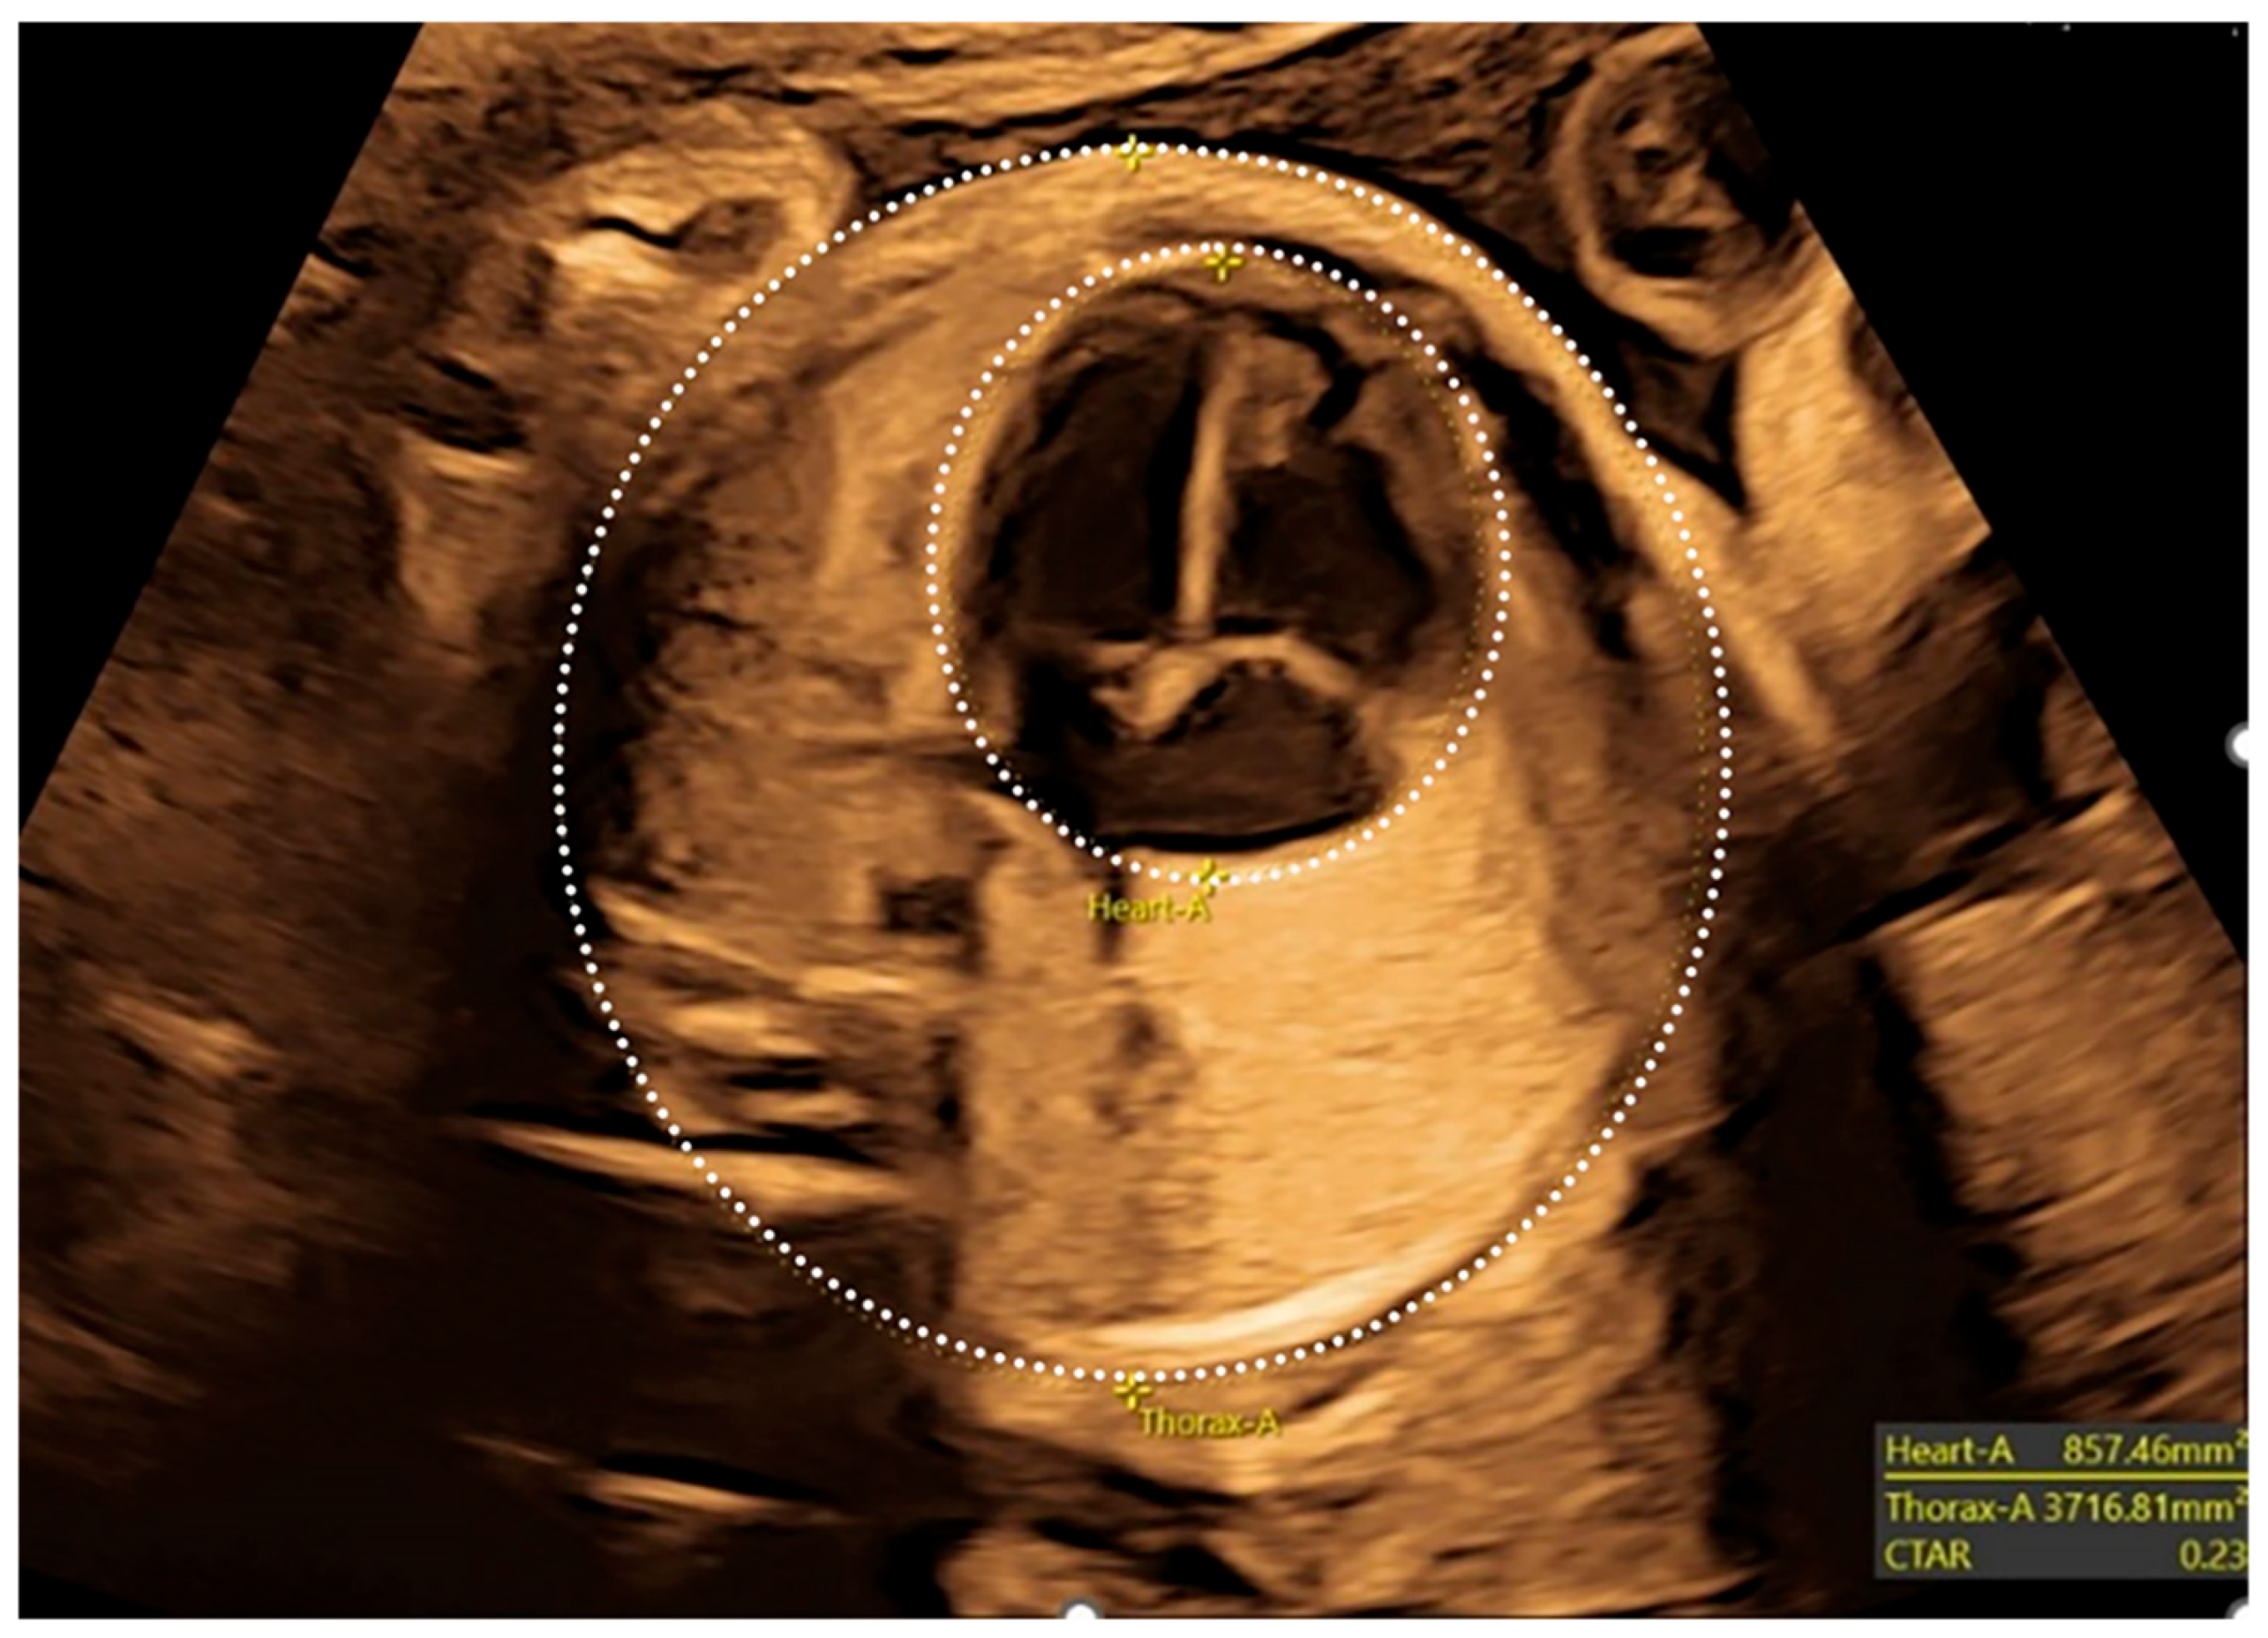
The cardiothoracic area can be measured using 2D ultrasound images. The heart and thorax are measured using the electronic ellipse method [10]. The method is based on the application of an ellipse drawn around the fetal heart. This includes the cardiac apex, the external epicardial borders and the superior edge of the atrial septum [10,11]. A second ellipse is drawn around the fetal chest. From anterior to posterior, it includes the chest wall without subdermal tissues, the ribs’ external borders, and the vertebrae’s posterior edge [10] (Figure 1). The cardiothoracic area ratio is calculated by dividing the cardiac area by the thoracic area using software installed on the ultrasound machine [12].

3.2.2. Atrial and Ventricular Areas

Measuring atrial and ventricular areas provides valuable insight into the disproportion between the two sides of the fetal heart.
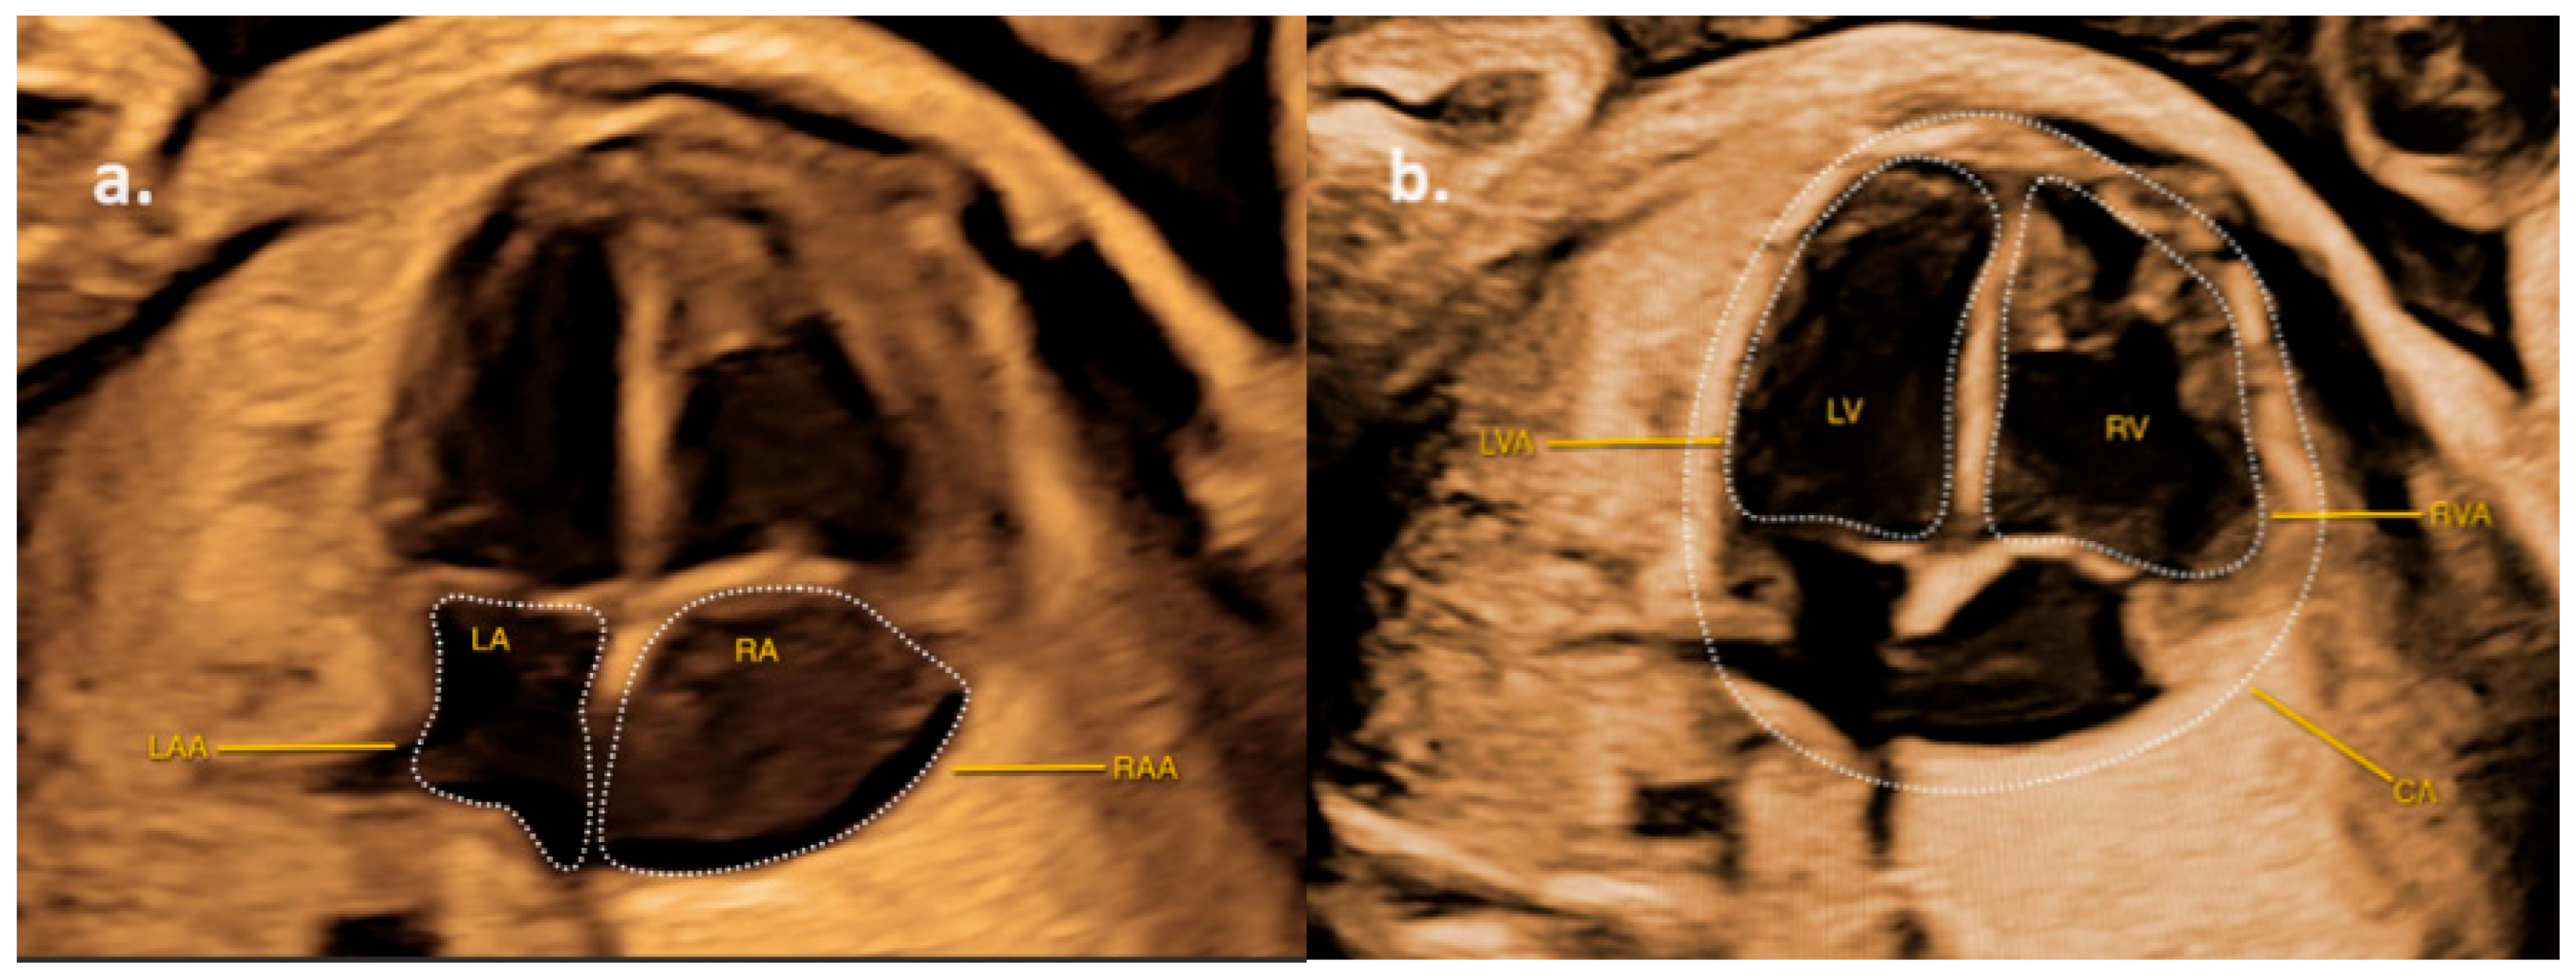
Atrial areas are typically measured using manual tracing on 2D images taken from an apical or basal four-chamber view at the end of systole [13]. When measuring atrial areas, it is essential to exclude the pulmonary veins and arteries, as well as the atrioventricular valve annulus [14,15]. Left and right atrial-to-heart area ratios are the proportions between left and right atrial areas and the total cardiac area (Figure 2a,b).
Ventricular areas are similarly measured on 2D images by manual tracing. The required image is an apical or basal four-chamber view at end-diastole [14]. Measurements for both left and right ventricular areas include the inner borders of the myocardium, the endocardium, the moderator band and any other muscular trabeculations. Left and right ventricular-to-heart area ratios are obtained as the proportions between the corresponding left and right ventricular areas and the cardiac area (Figure 2b).

3.3. Heart Chambers Measurement, Sphericity Indices and Septum/Wall Thickness

3.3.1. Heart Chambers Measurement

Heart chamber measurements are crucial for evaluating ventricular cavities and detecting potential disproportions.
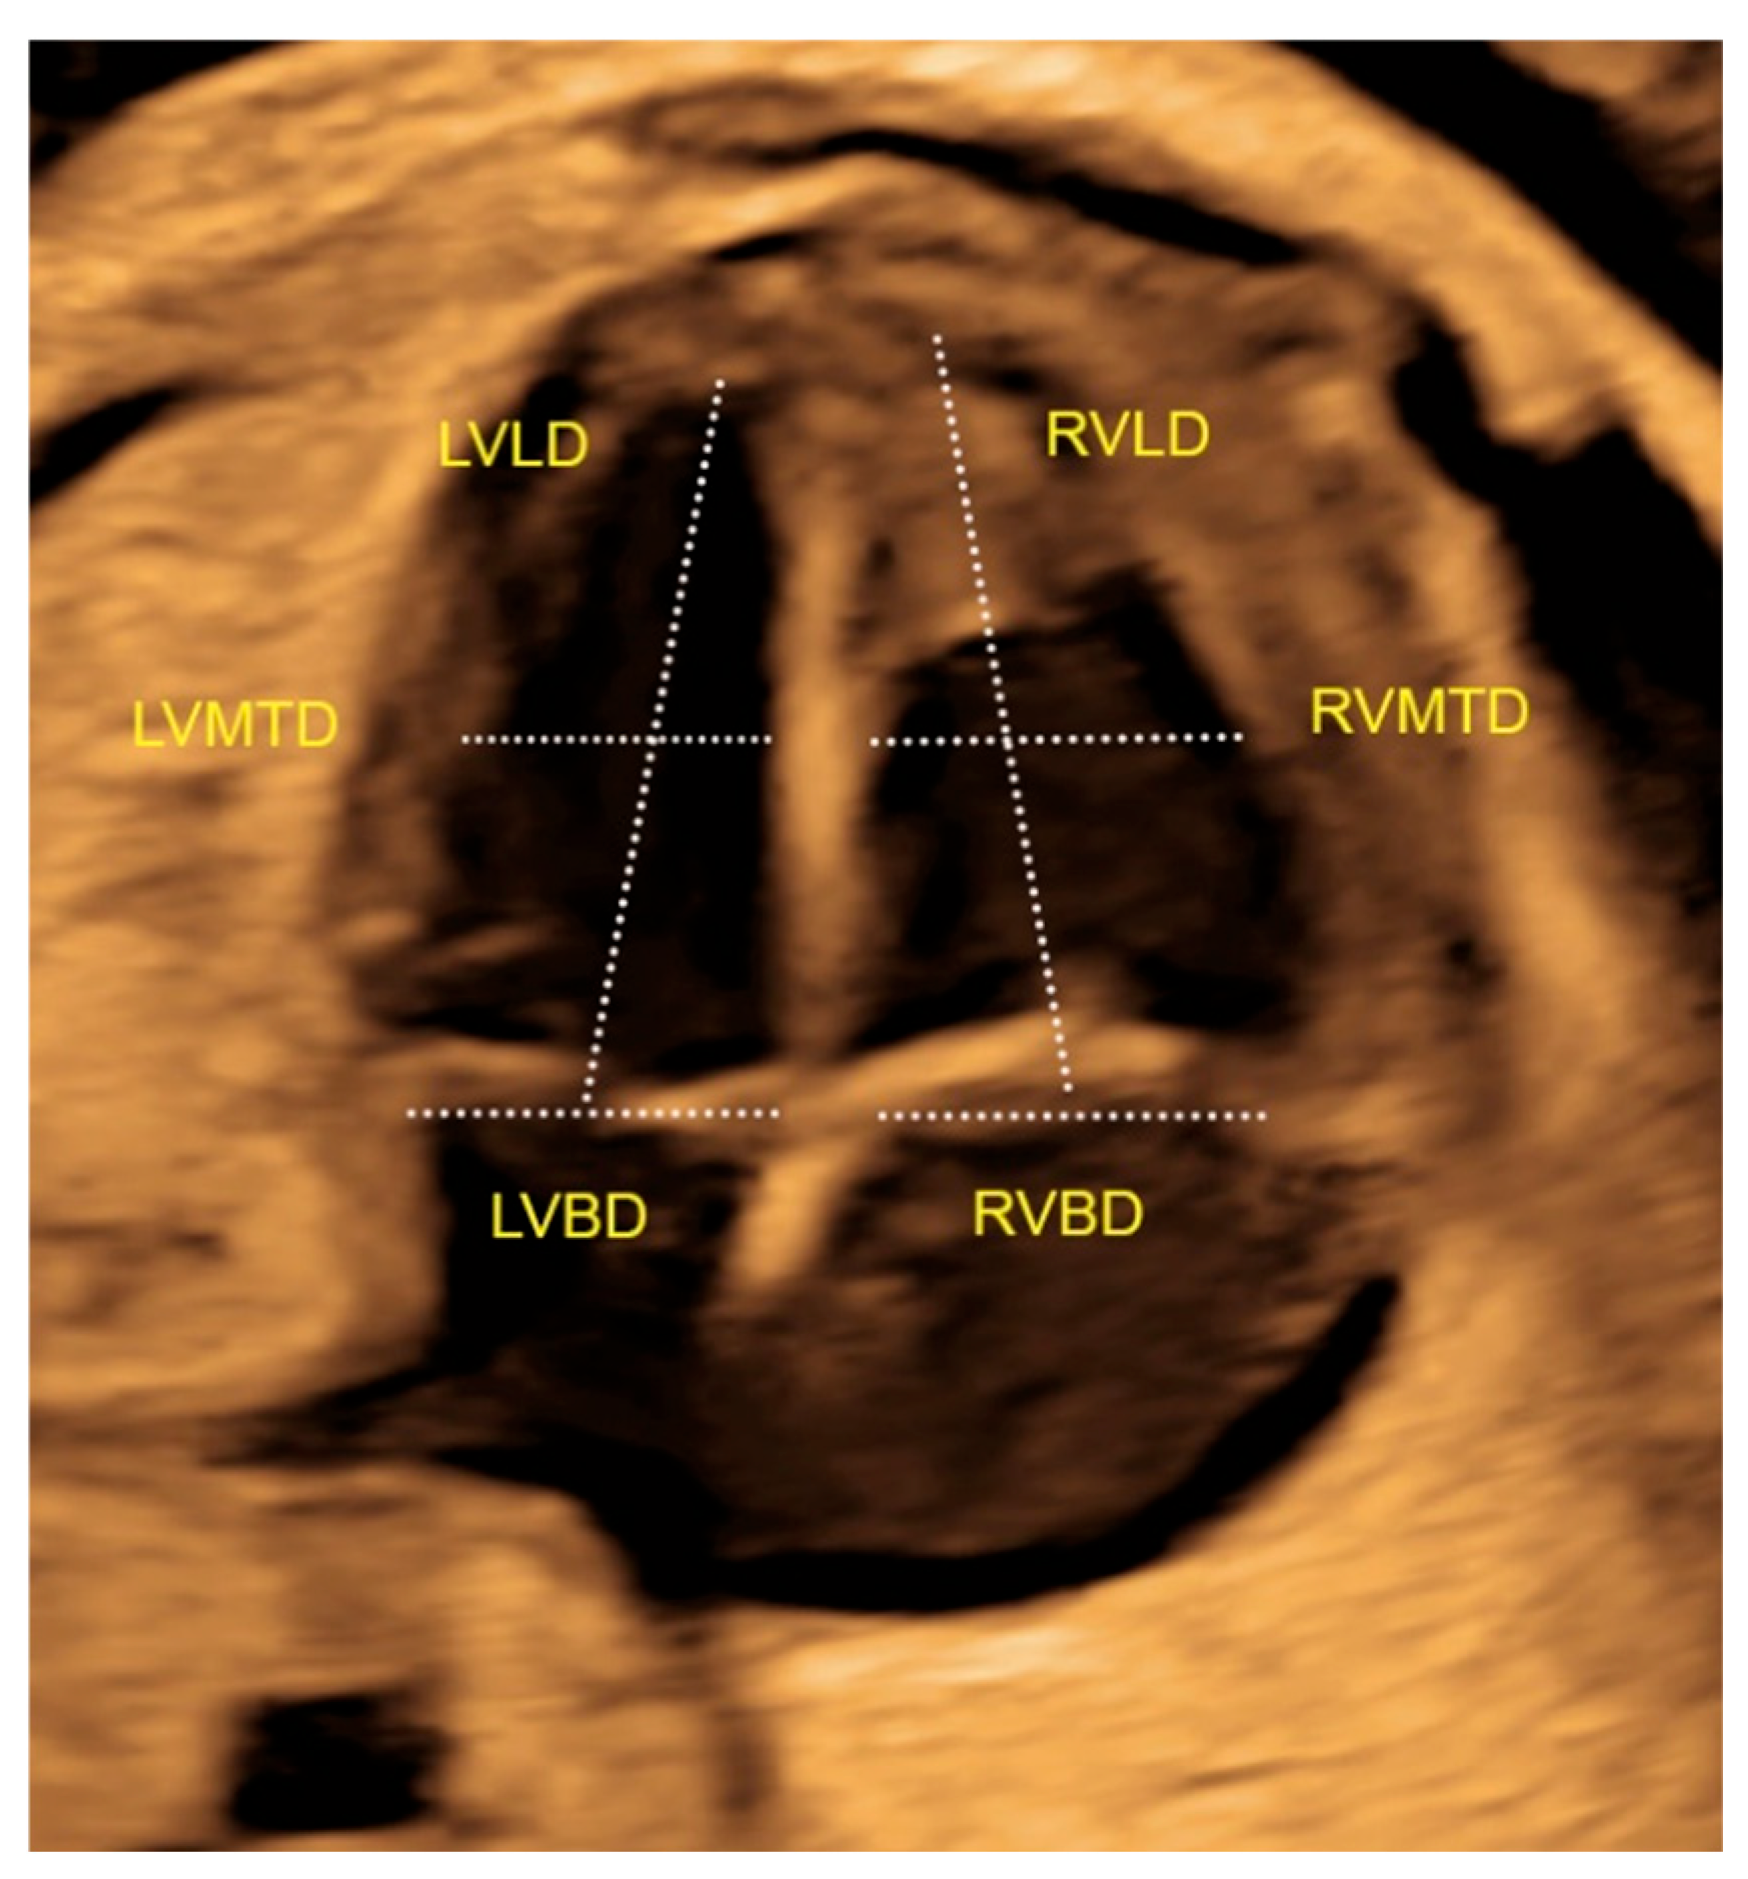
Ventricular diameters are measured using two-dimensional images [14], typically in an apical or basal four-chamber view at the end of diastole [14]. Transverse ventricular diameters can be traced at the level of the atrioventricular valves plane (left and right basal ventricular diameters) or in the more apical portion of the interventricular septum, below the ventricular valve leaflets (left and right mid-transverse ventricular diameters) [13]. Longitudinal ventricular diameters are traced from the midpoint of each corresponding basal diameter to the apex’s inner myocardium (left and right ventricular longitudinal diameters) [7,16] (Figure 3).
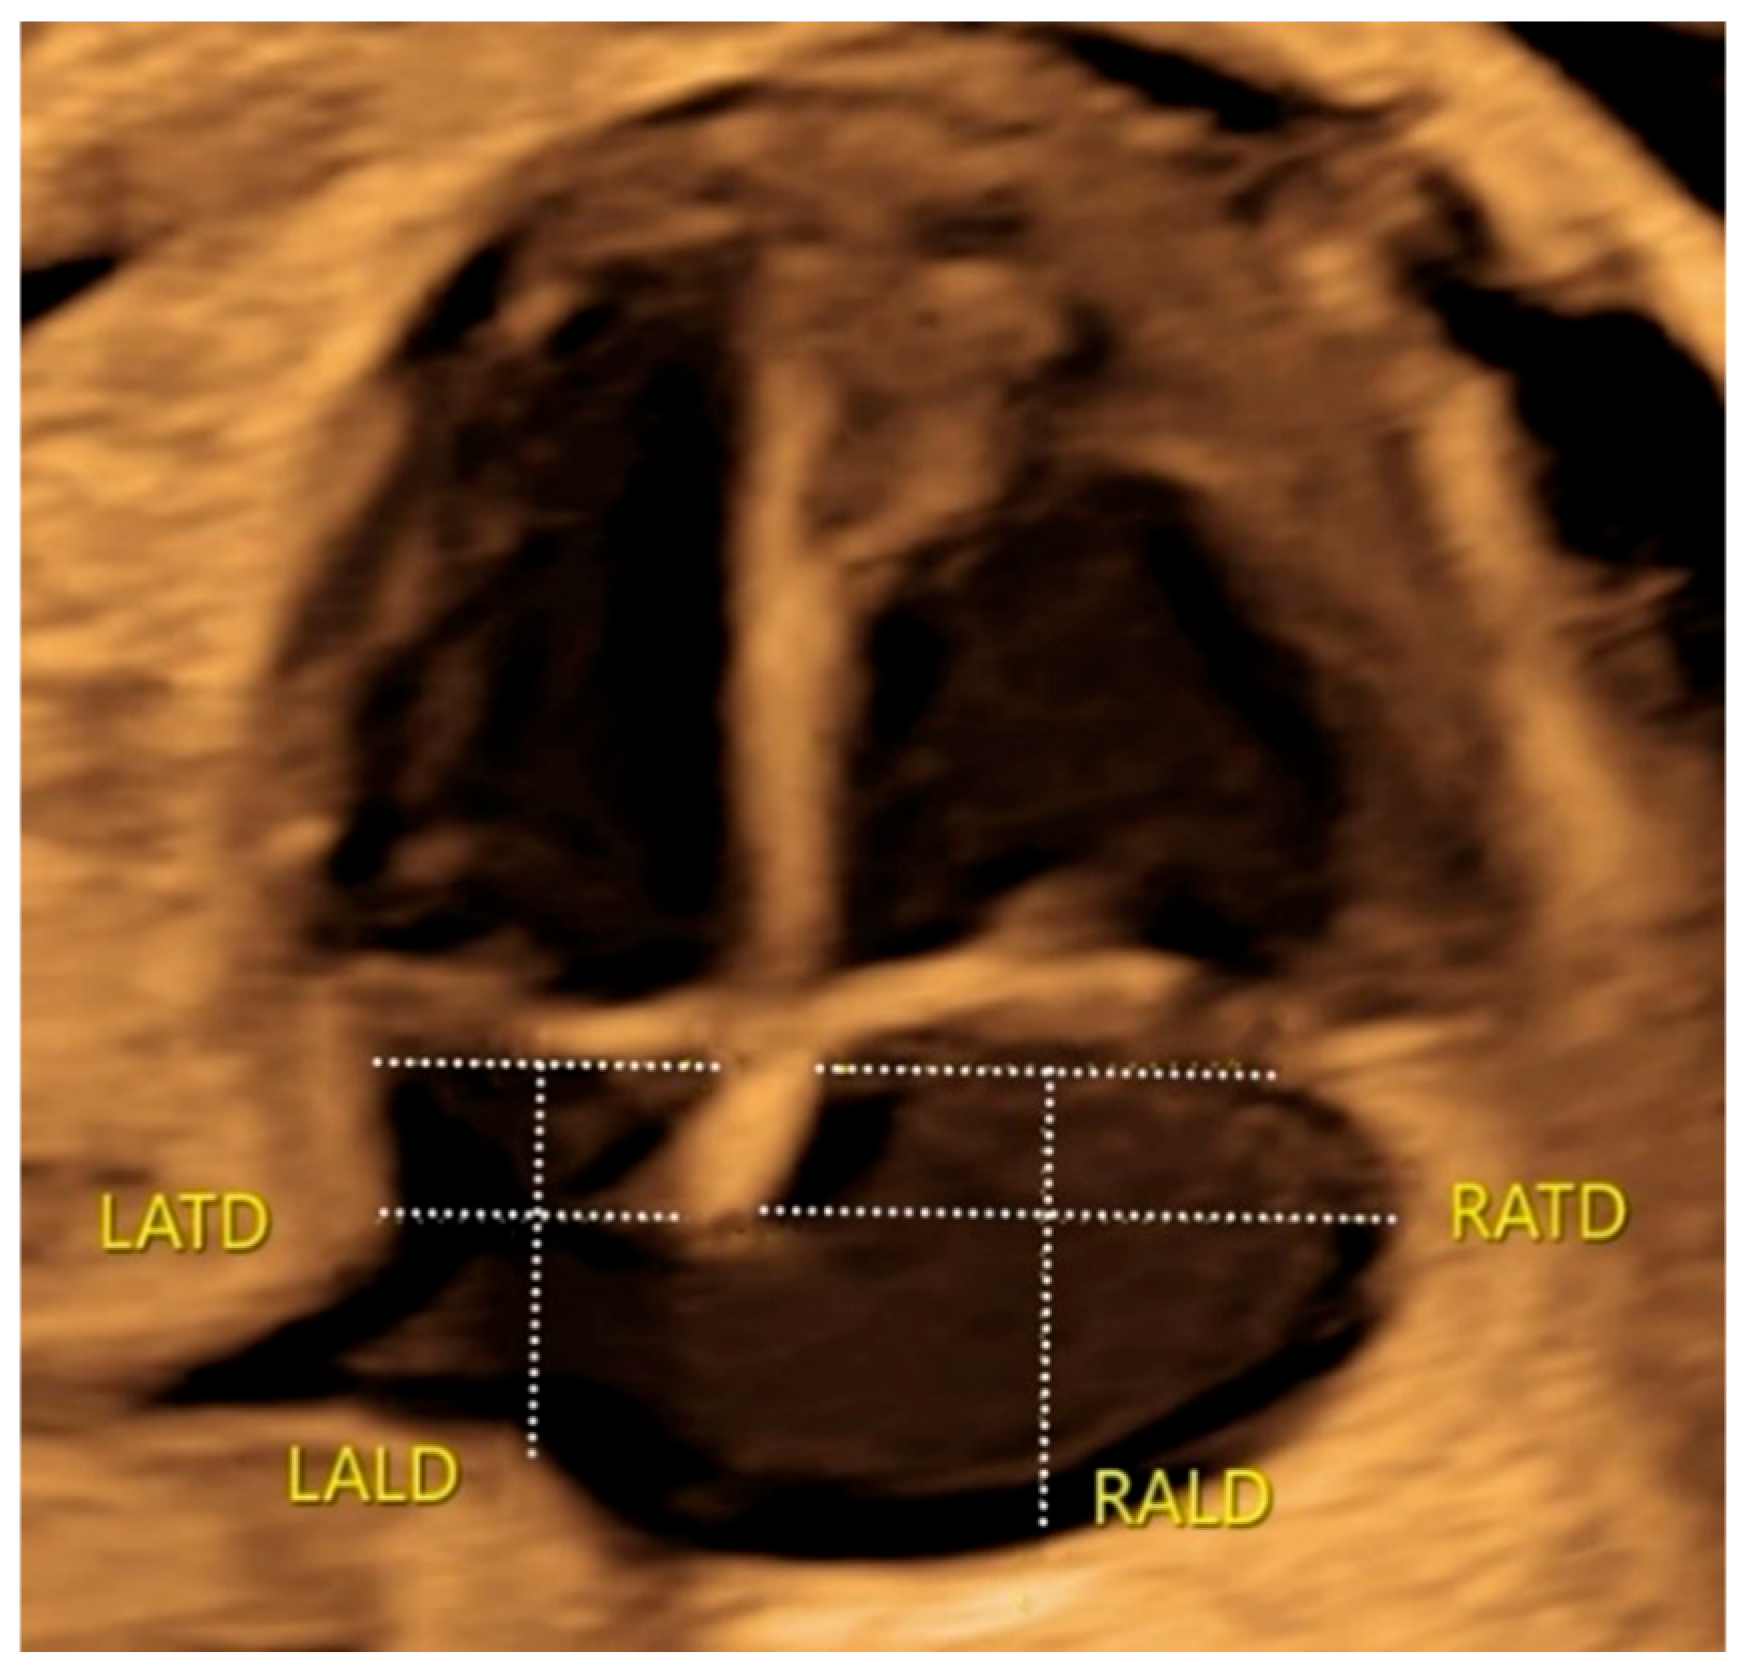
Atrial diameters are typically measured when the atria reach their maximal distension at the end of systole. A two-dimensional image of the fetal heart in an apical or basal four-chamber view is collected. Each atrial cavity is divided into four similar squares by one longitudinal diameter and two transverse diameters, one at the annular plane and the other touching the most caudal point of the primum septum [7] (Figure 4).
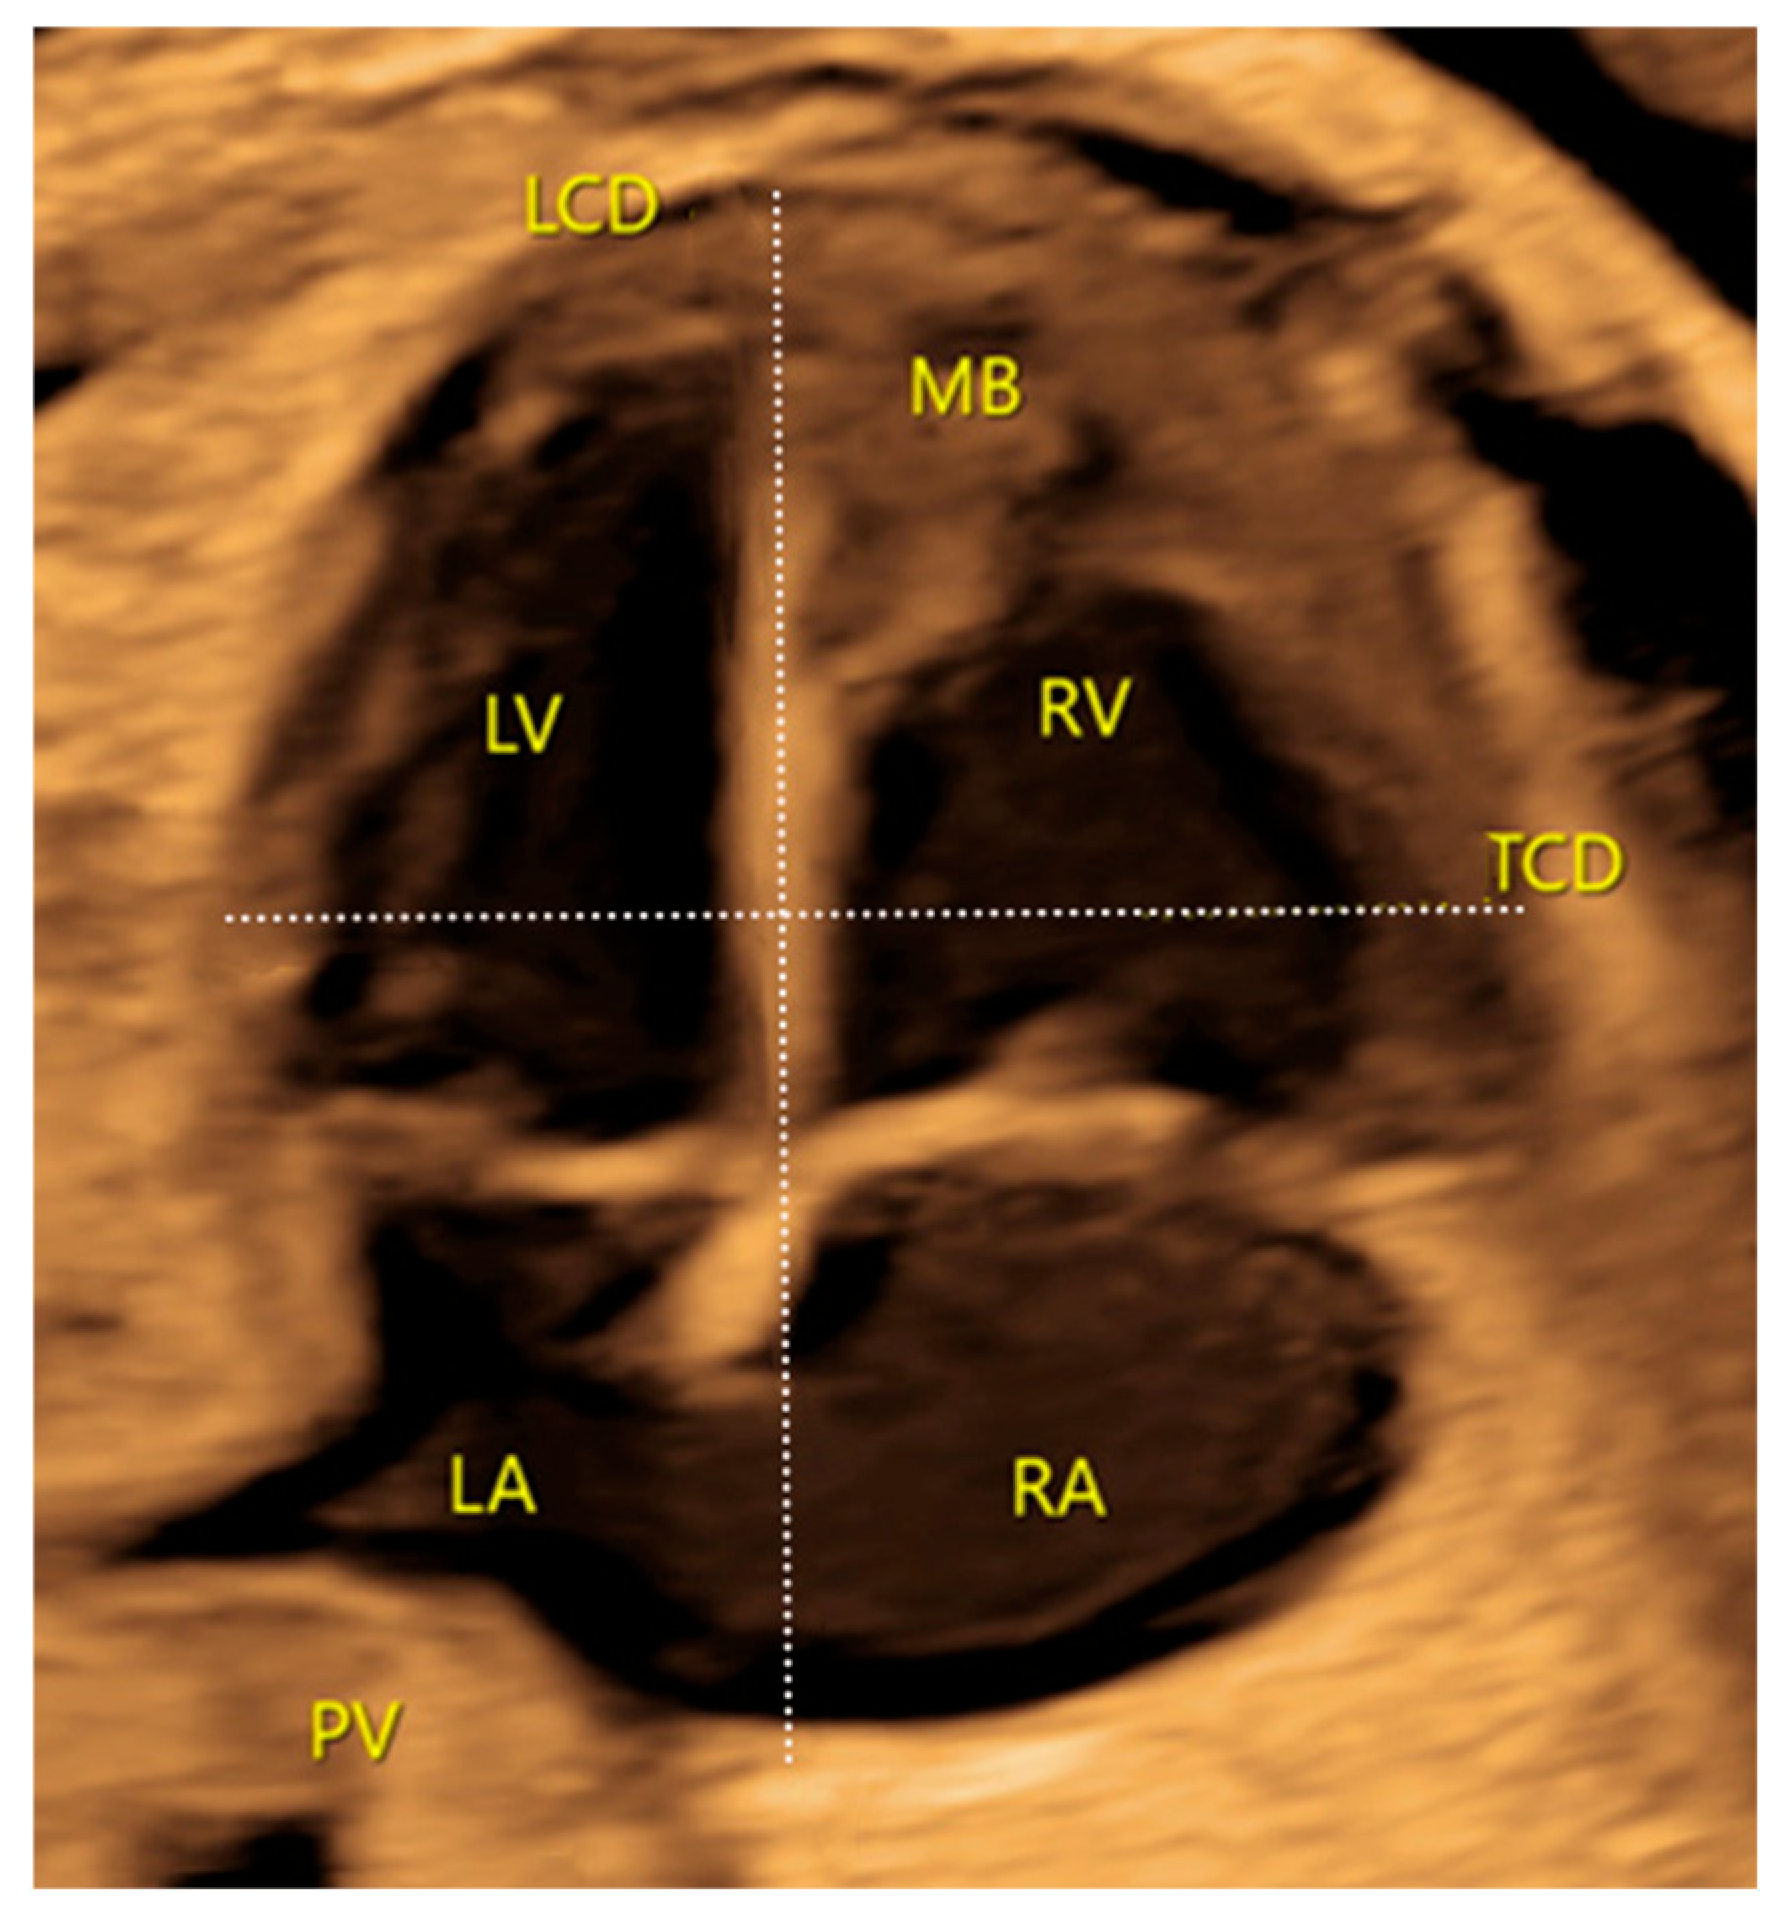
Cardiac longitudinal and transverse diameters are measured on 2D images in an apical or basal four-chamber view at the end of diastole [13]. The cardiac longitudinal diameter is drawn on the interventricular septum from the apex anteriorly to the most posterior inner border of the right atrium. The cardiac transverse diameter is drawn perpendicularly to the cardiac longitudinal diameter at its midpoint, measuring from the left ventricle’s outer epicardium to the right ventricle’s outer epicardium [7] (Figure 5).

3.3.2. Ventricular, Atrial and Cardiac Sphericity Indices

Ventricular and atrial sphericity indices are determined as ratios between ventricular and atrial diameters, which are measured as previously described in two-dimensional images [17].
The left and right ventricular sphericity indices are the ratios between the longitudinal ventricular dimension of the corresponding cardiac side and the homolateral transverse diameters. Therefore, the sphericity indices include the basal sphericity (left and right) and the midventricular sphericity (left and right), depending on the ventricular transverse diameter applied in the calculation (ventricular basal or mid-transverse diameters) [18] (Figure 3).
Similarly, left and right atrial sphericity indices are calculated by dividing the respective left and right longitudinal atrial diameters by the transverse atrial diameters (Figure 4).
The overall cardiac sphericity index is calculated as the ratio of the longitudinal cardiac diameter to the transverse cardiac diameter [7] (see Figure 5).

3.3.3. Myocardial Wall Thickness Measurements and Ratios

Measurements of myocardial wall thickness and ratios can provide a more accurate description of the endocardial borders, thereby enhancing their definition. These measurements are useful to assess hypertrophy of the cardiac walls [19,20].
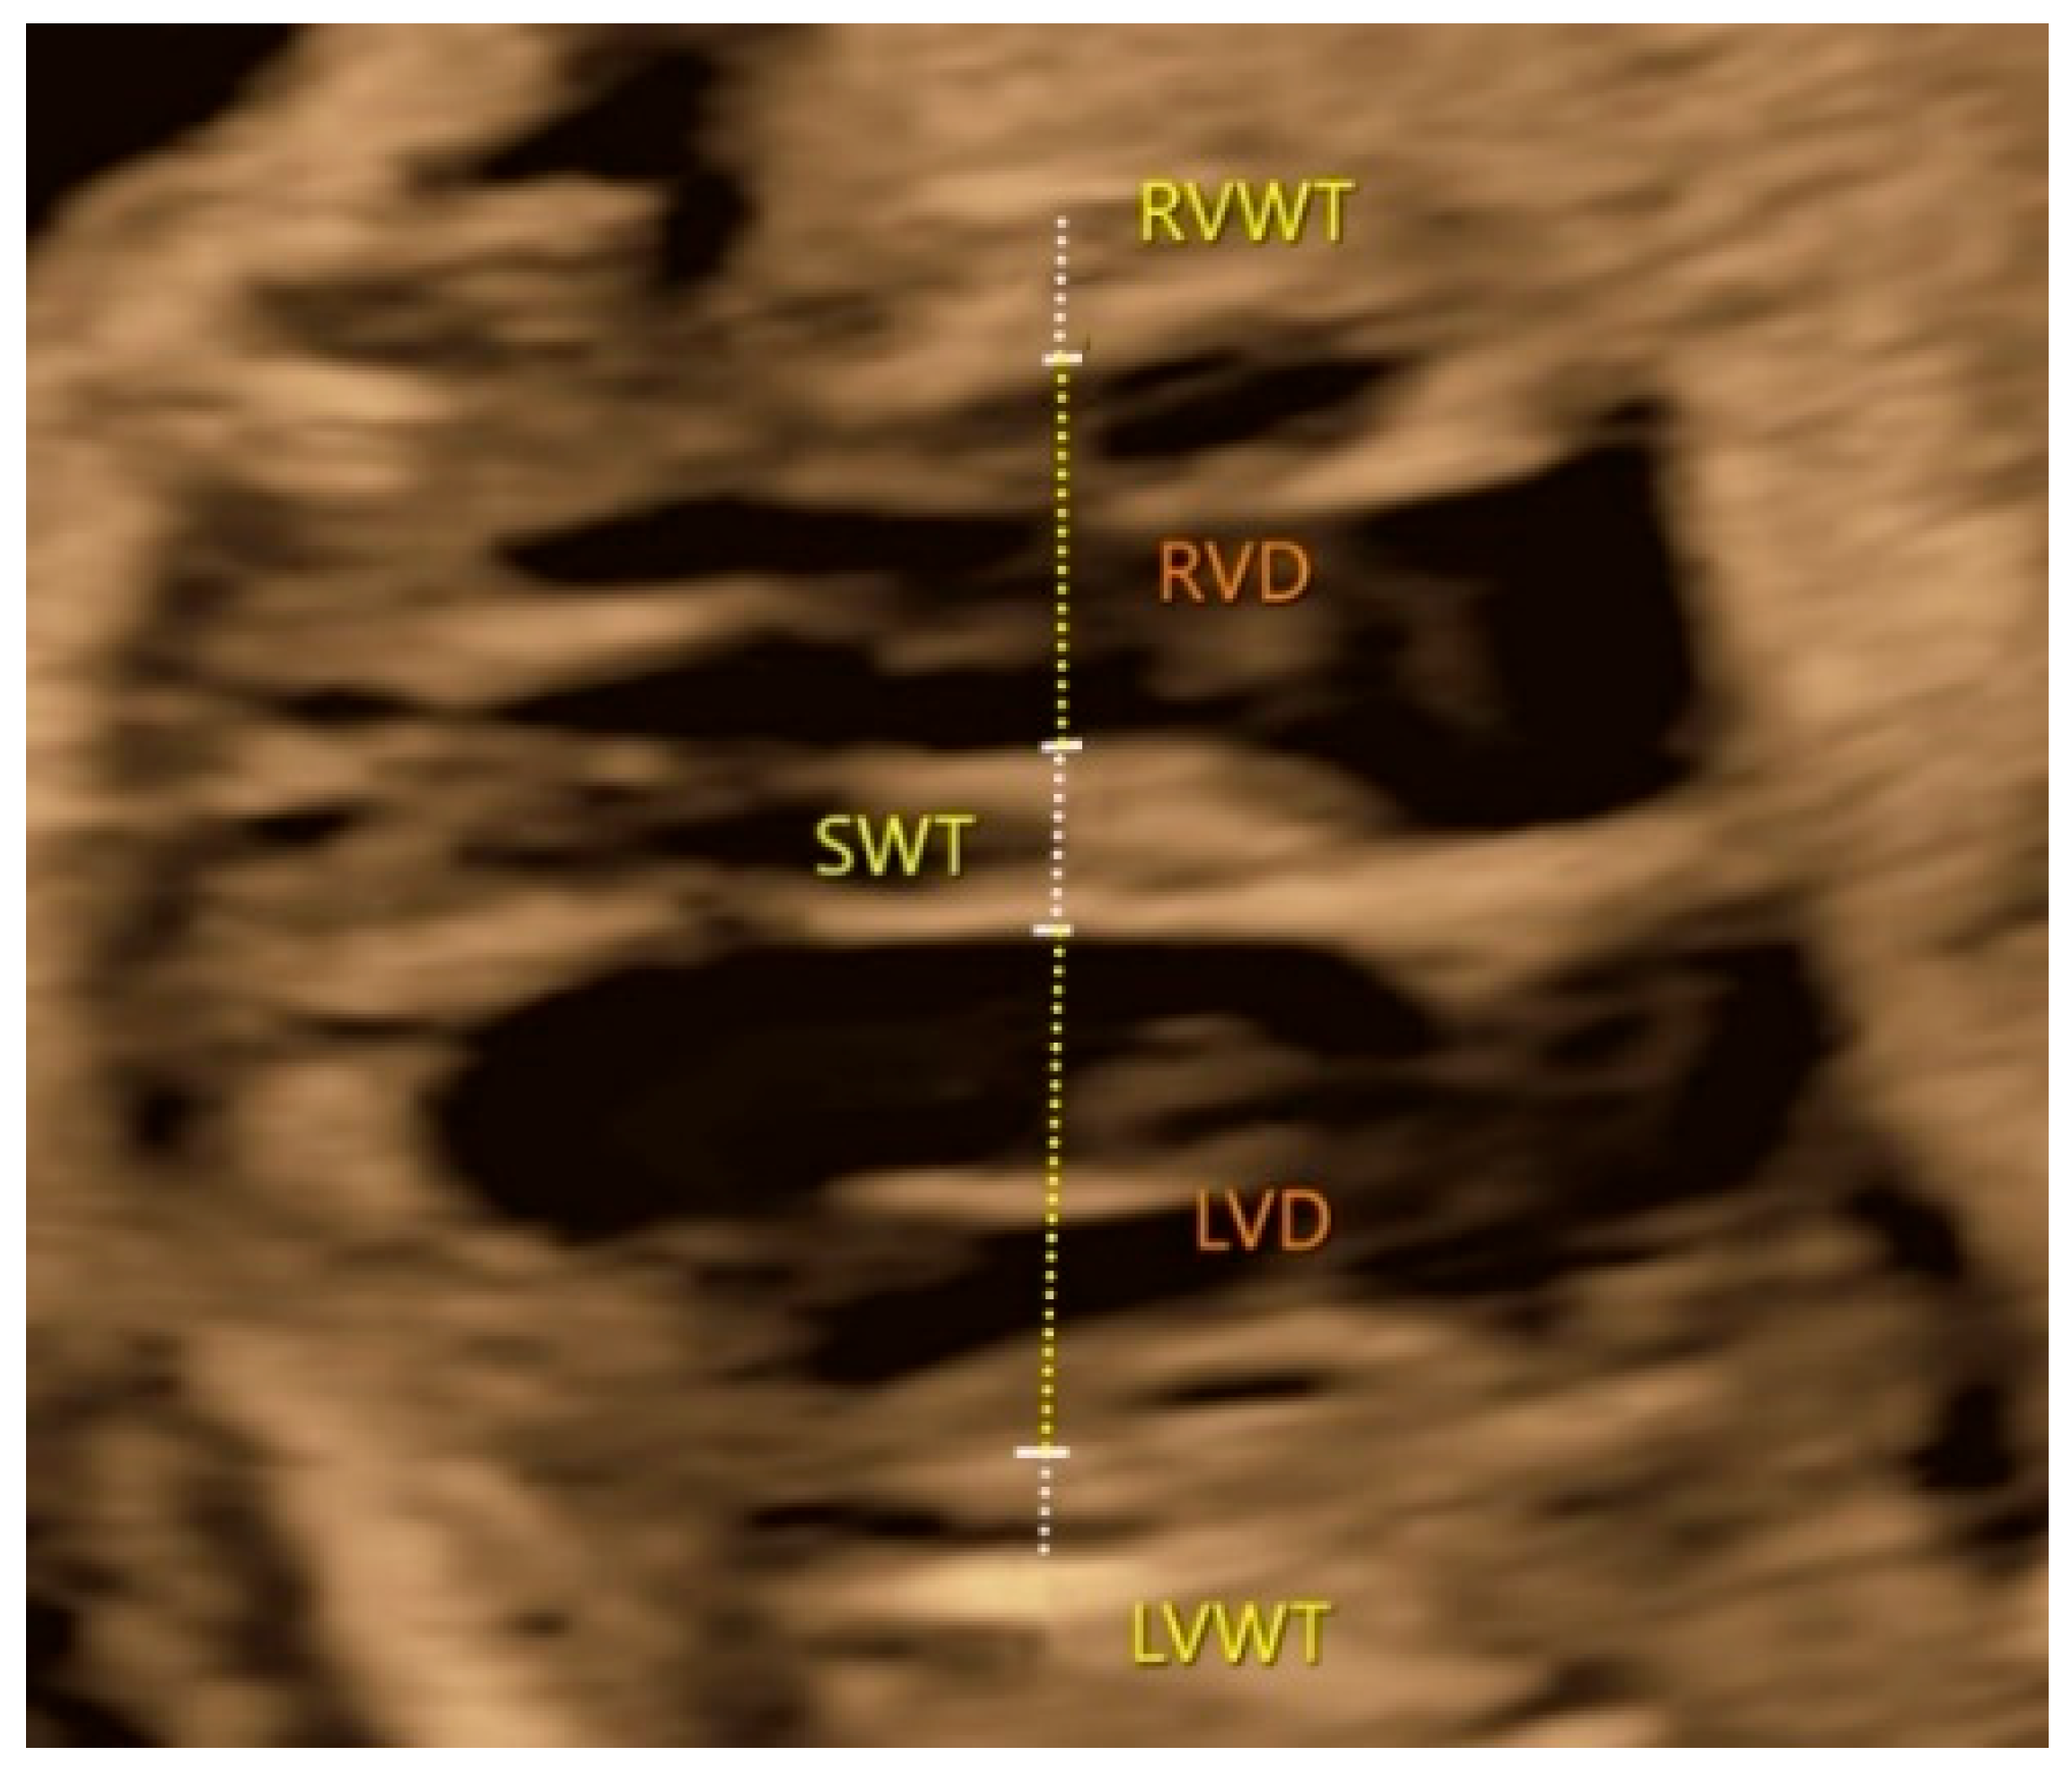
Myocardial wall thicknesses are assessed using a transverse 2D image of the fetal chest showing the septal four-chamber view at the end of diastole (Figure 6). Three different myocardial wall thicknesses can be measured. The septal wall thickness is assessed at the interventricular septum level, and the left and right ventricular free wall thicknesses at the level of the corresponding free walls [7].
To further describe these wall thicknesses, four different ratios can be calculated. The left septal-to-left ventricular free wall thickness ratio is the proportion between the thickness of the interventricular septal wall and the left ventricular free wall. Similarly, the right septal-to-right ventricular free wall thickness ratio is calculated as the proportion between the thickness of the septum and the right ventricular free wall [21].
The left relative wall thickness ratio is determined by the sum of the left ventricular free wall thickness to the septal wall thickness divided by the left ventricular transverse diameter. The right relative wall thickness ratio is calculated similarly for the right ventricle. These measurements and ratios provide valuable insights into myocardial health and function [21].

4. Fetal Cardiac Valvular Evaluation

4.1. General Introduction

The fetal cardiac valvular function assessment involves evaluating the atrioventricular (AV) and semilunar valves, as well as assessing the three-vessel and trachea views.
To explore atrioventricular function, the essential techniques applied are 2D ultrasound imaging to measure atrioventricular valves, color Doppler imaging to demonstrate anterograde flow without regurgitation and pulsed Doppler evaluations of left and right E/A ratios as well as filling time fraction [22,23].
The assessment of aortic and pulmonary valves includes 2D images of the left and right outflow tracts with measurements of the valves, color Doppler evaluation of aortic and pulmonary flow and pulsed Doppler peak velocity measurements of both semilunar valves as well as ejection time fraction [23].
The appraisal of the three vessels and trachea view includes color Doppler evaluation demonstrating anterograde flow throughout the arteries [24] and pulsed Doppler imaging to assess aortic isthmus and ductus arteriosus pulsatility indexes [22].

4.2. Atrioventricular Valves Evaluation

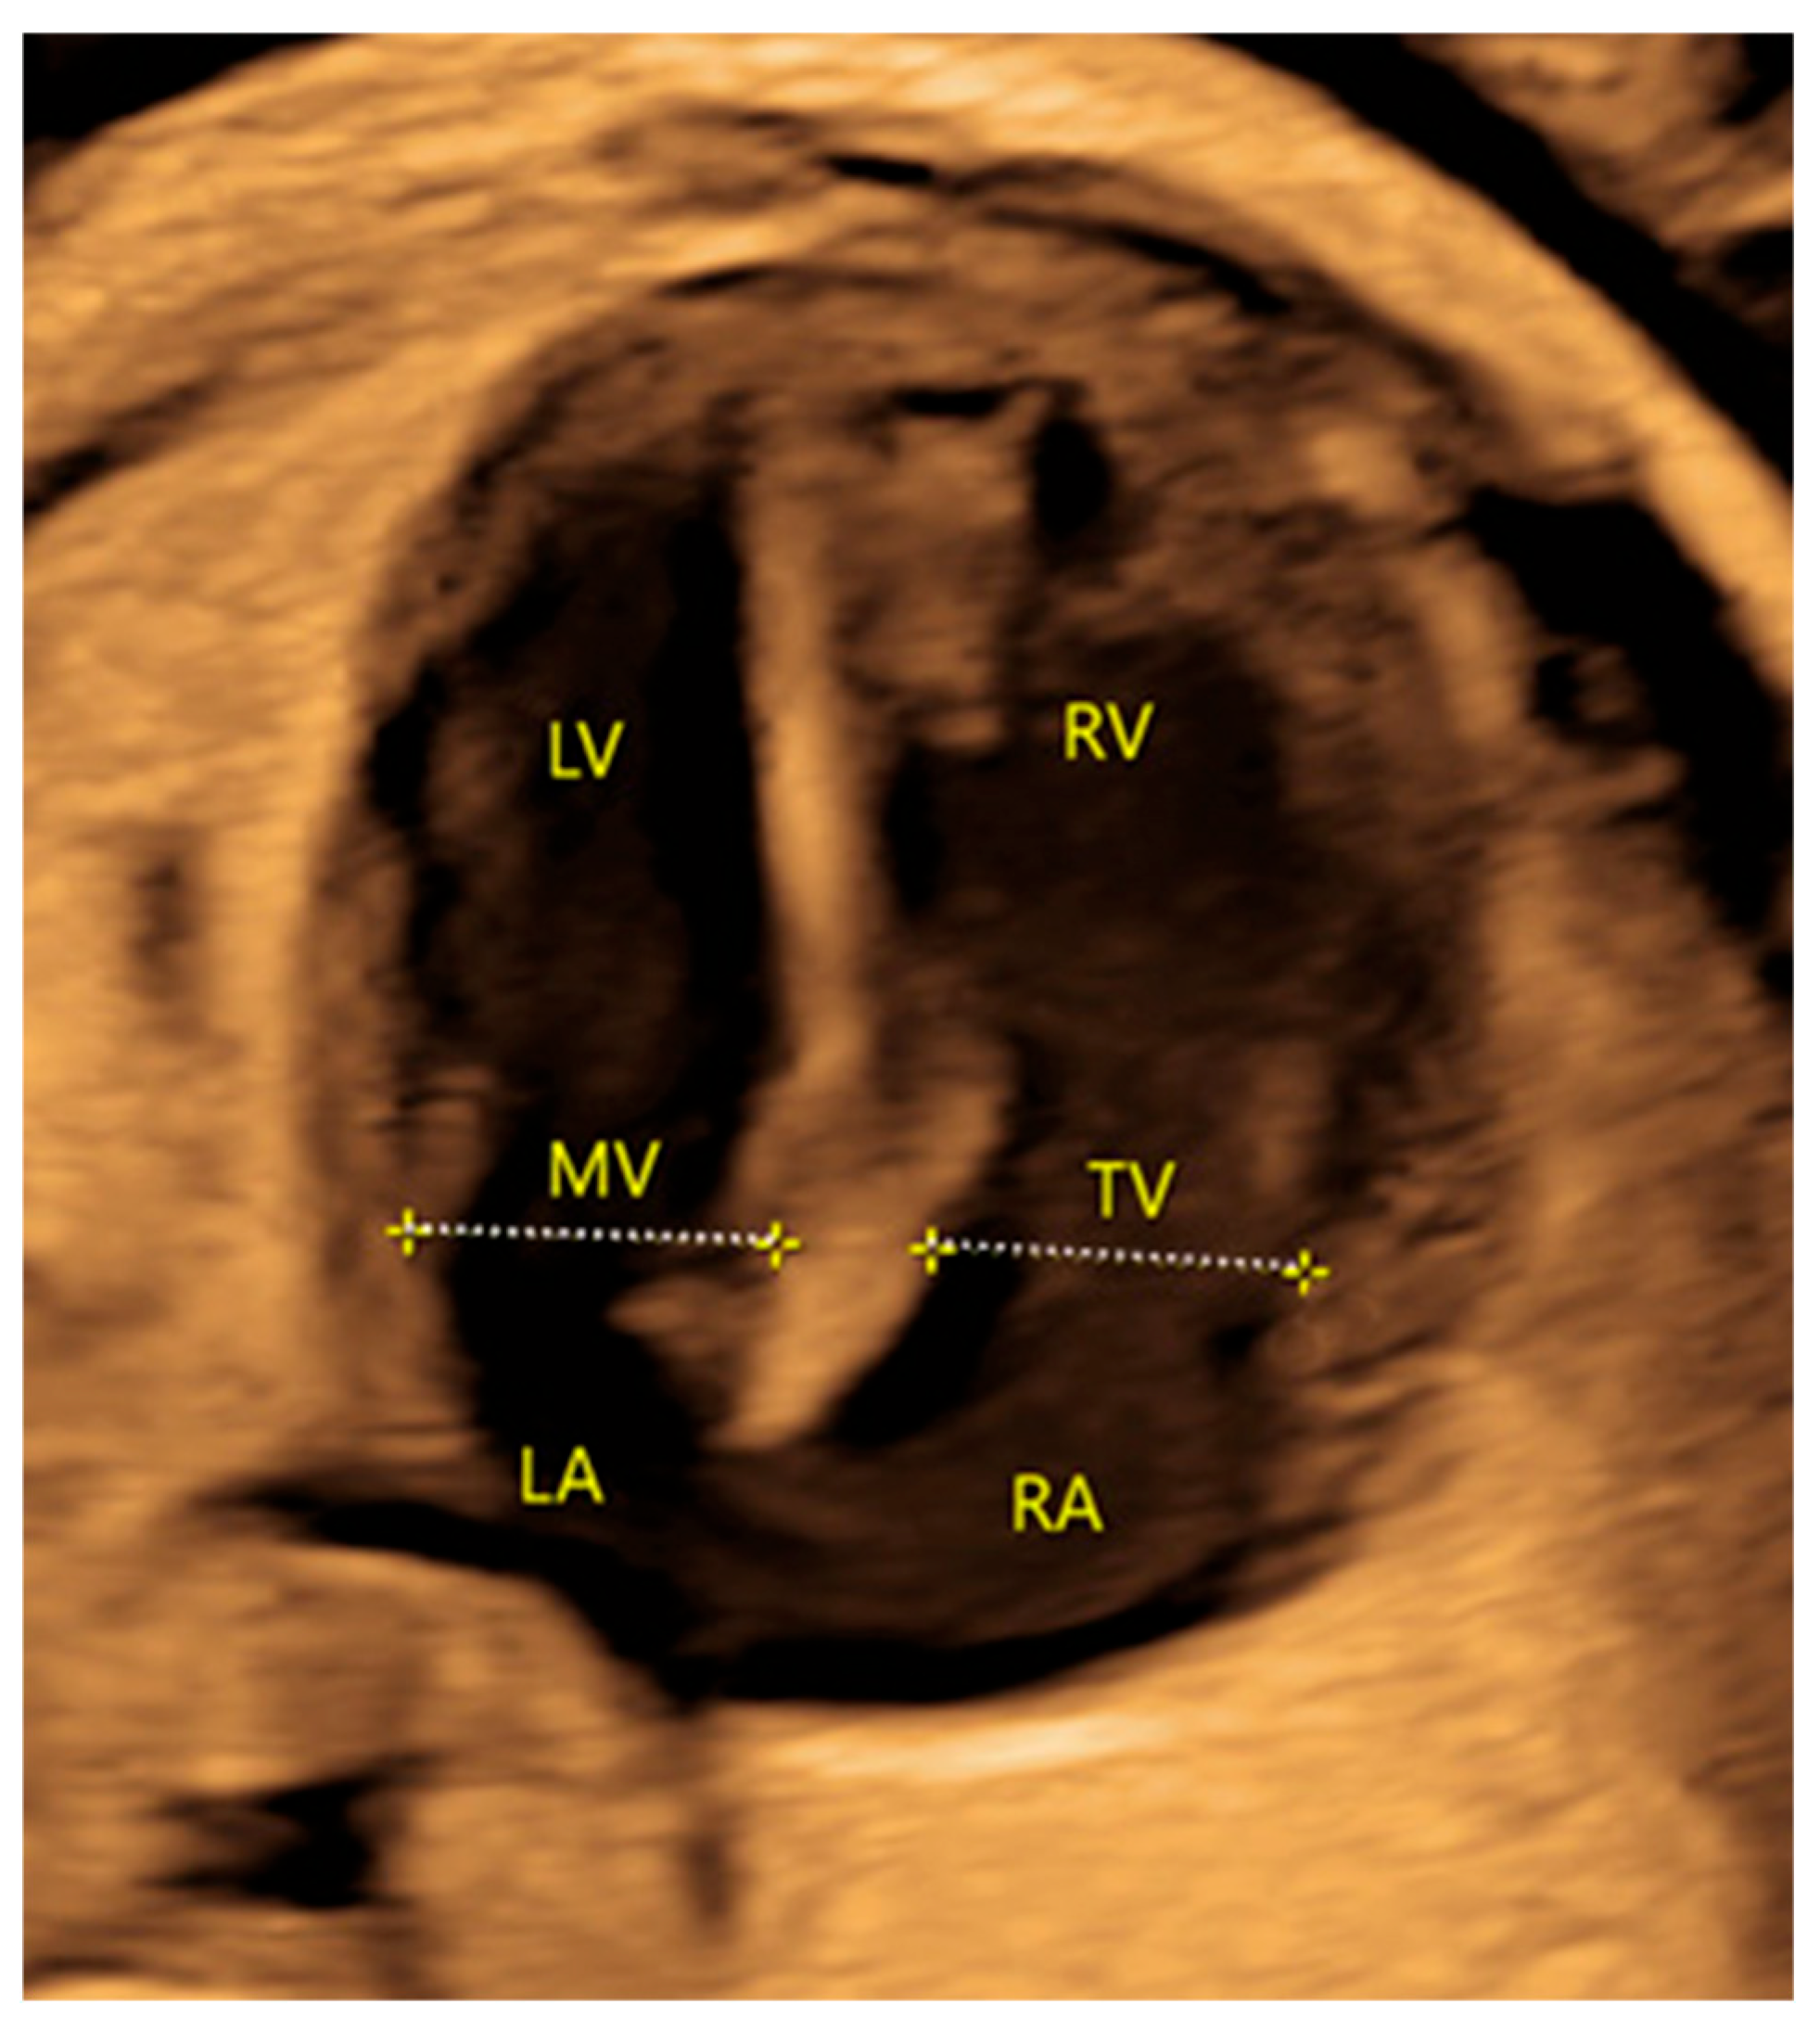
Correct assessment of the atrioventricular (AV) valves includes a cine-loop evaluation of the annular plane to demonstrate the correct/incorrect AV valves opening and closing. An apical four-chamber view image is required at the end of diastole to conduct measurements of the AV valves (Figure 7).
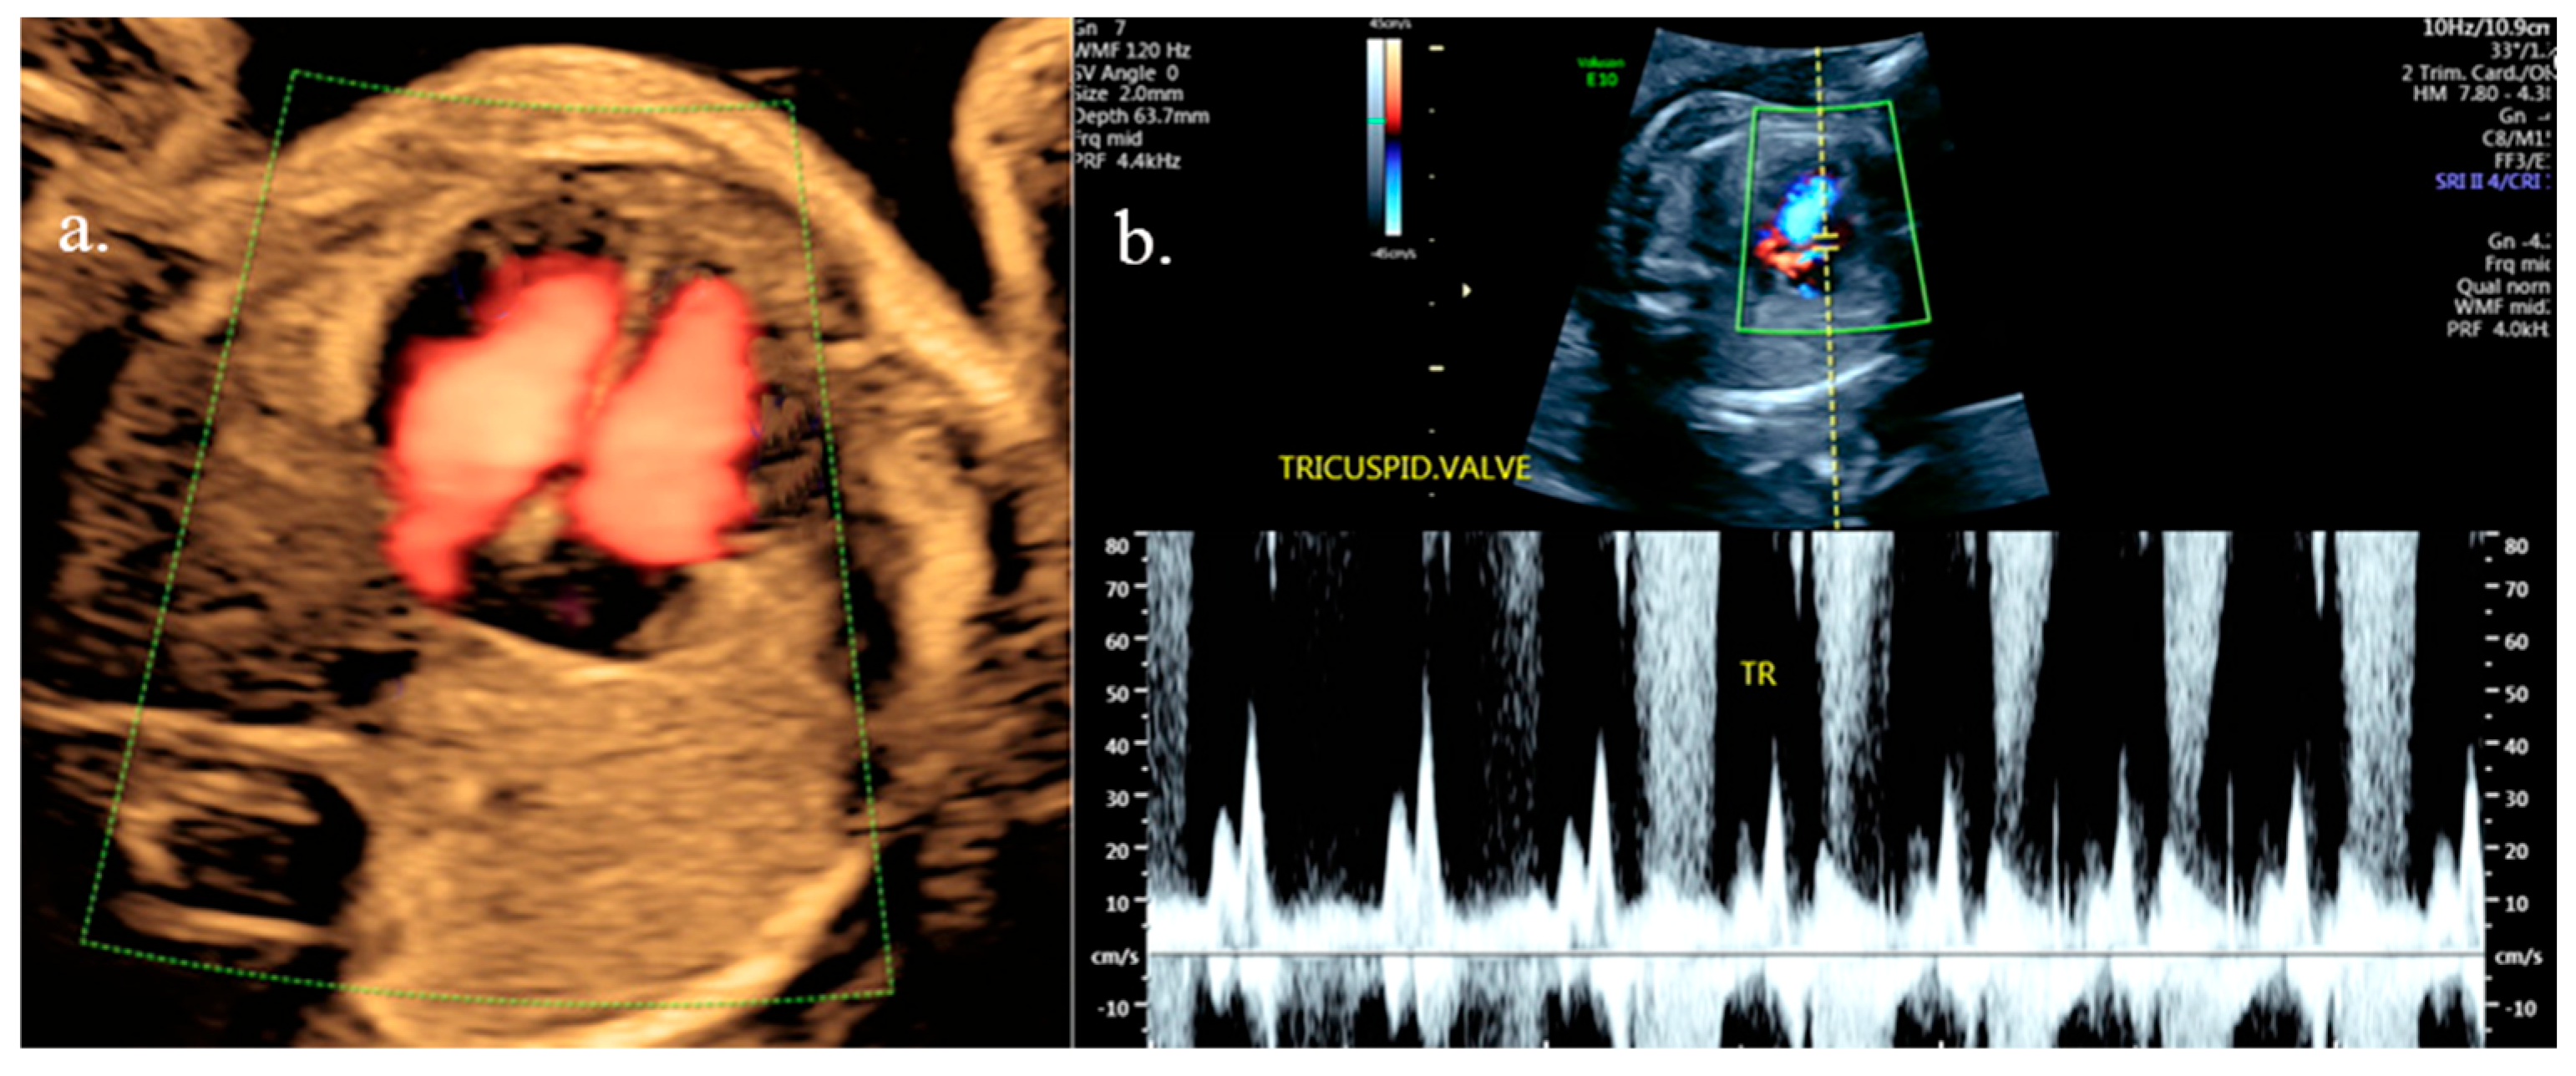
The application of color Doppler can demonstrate physiological anterograde blood flow, or it may identify retrograde regurgitation (Figure 8). Tricuspid or mitral regurgitation appears as a variable quantity of blood flowing opposite the main tricuspid/mitral flow on Doppler. If any tricuspid or mitral regurgitation is detected, its duration during systole and the peak velocity of the regurgitant jet should be described [25]. Tricuspid or mitral regurgitation can occur during the entire duration of systole (holosystolic), or the regurgitant jet could be limited to early or mid-systole (early systolic or mid-systolic, respectively) [25]. Descriptions such as ‘holosystolic’, ‘early systolic’ or ‘mid-systolic’ should be used. The peak systolic velocity of the regurgitant jet should be assessed (Figure 8) by applying a cursor to the maximum demonstrated velocity.
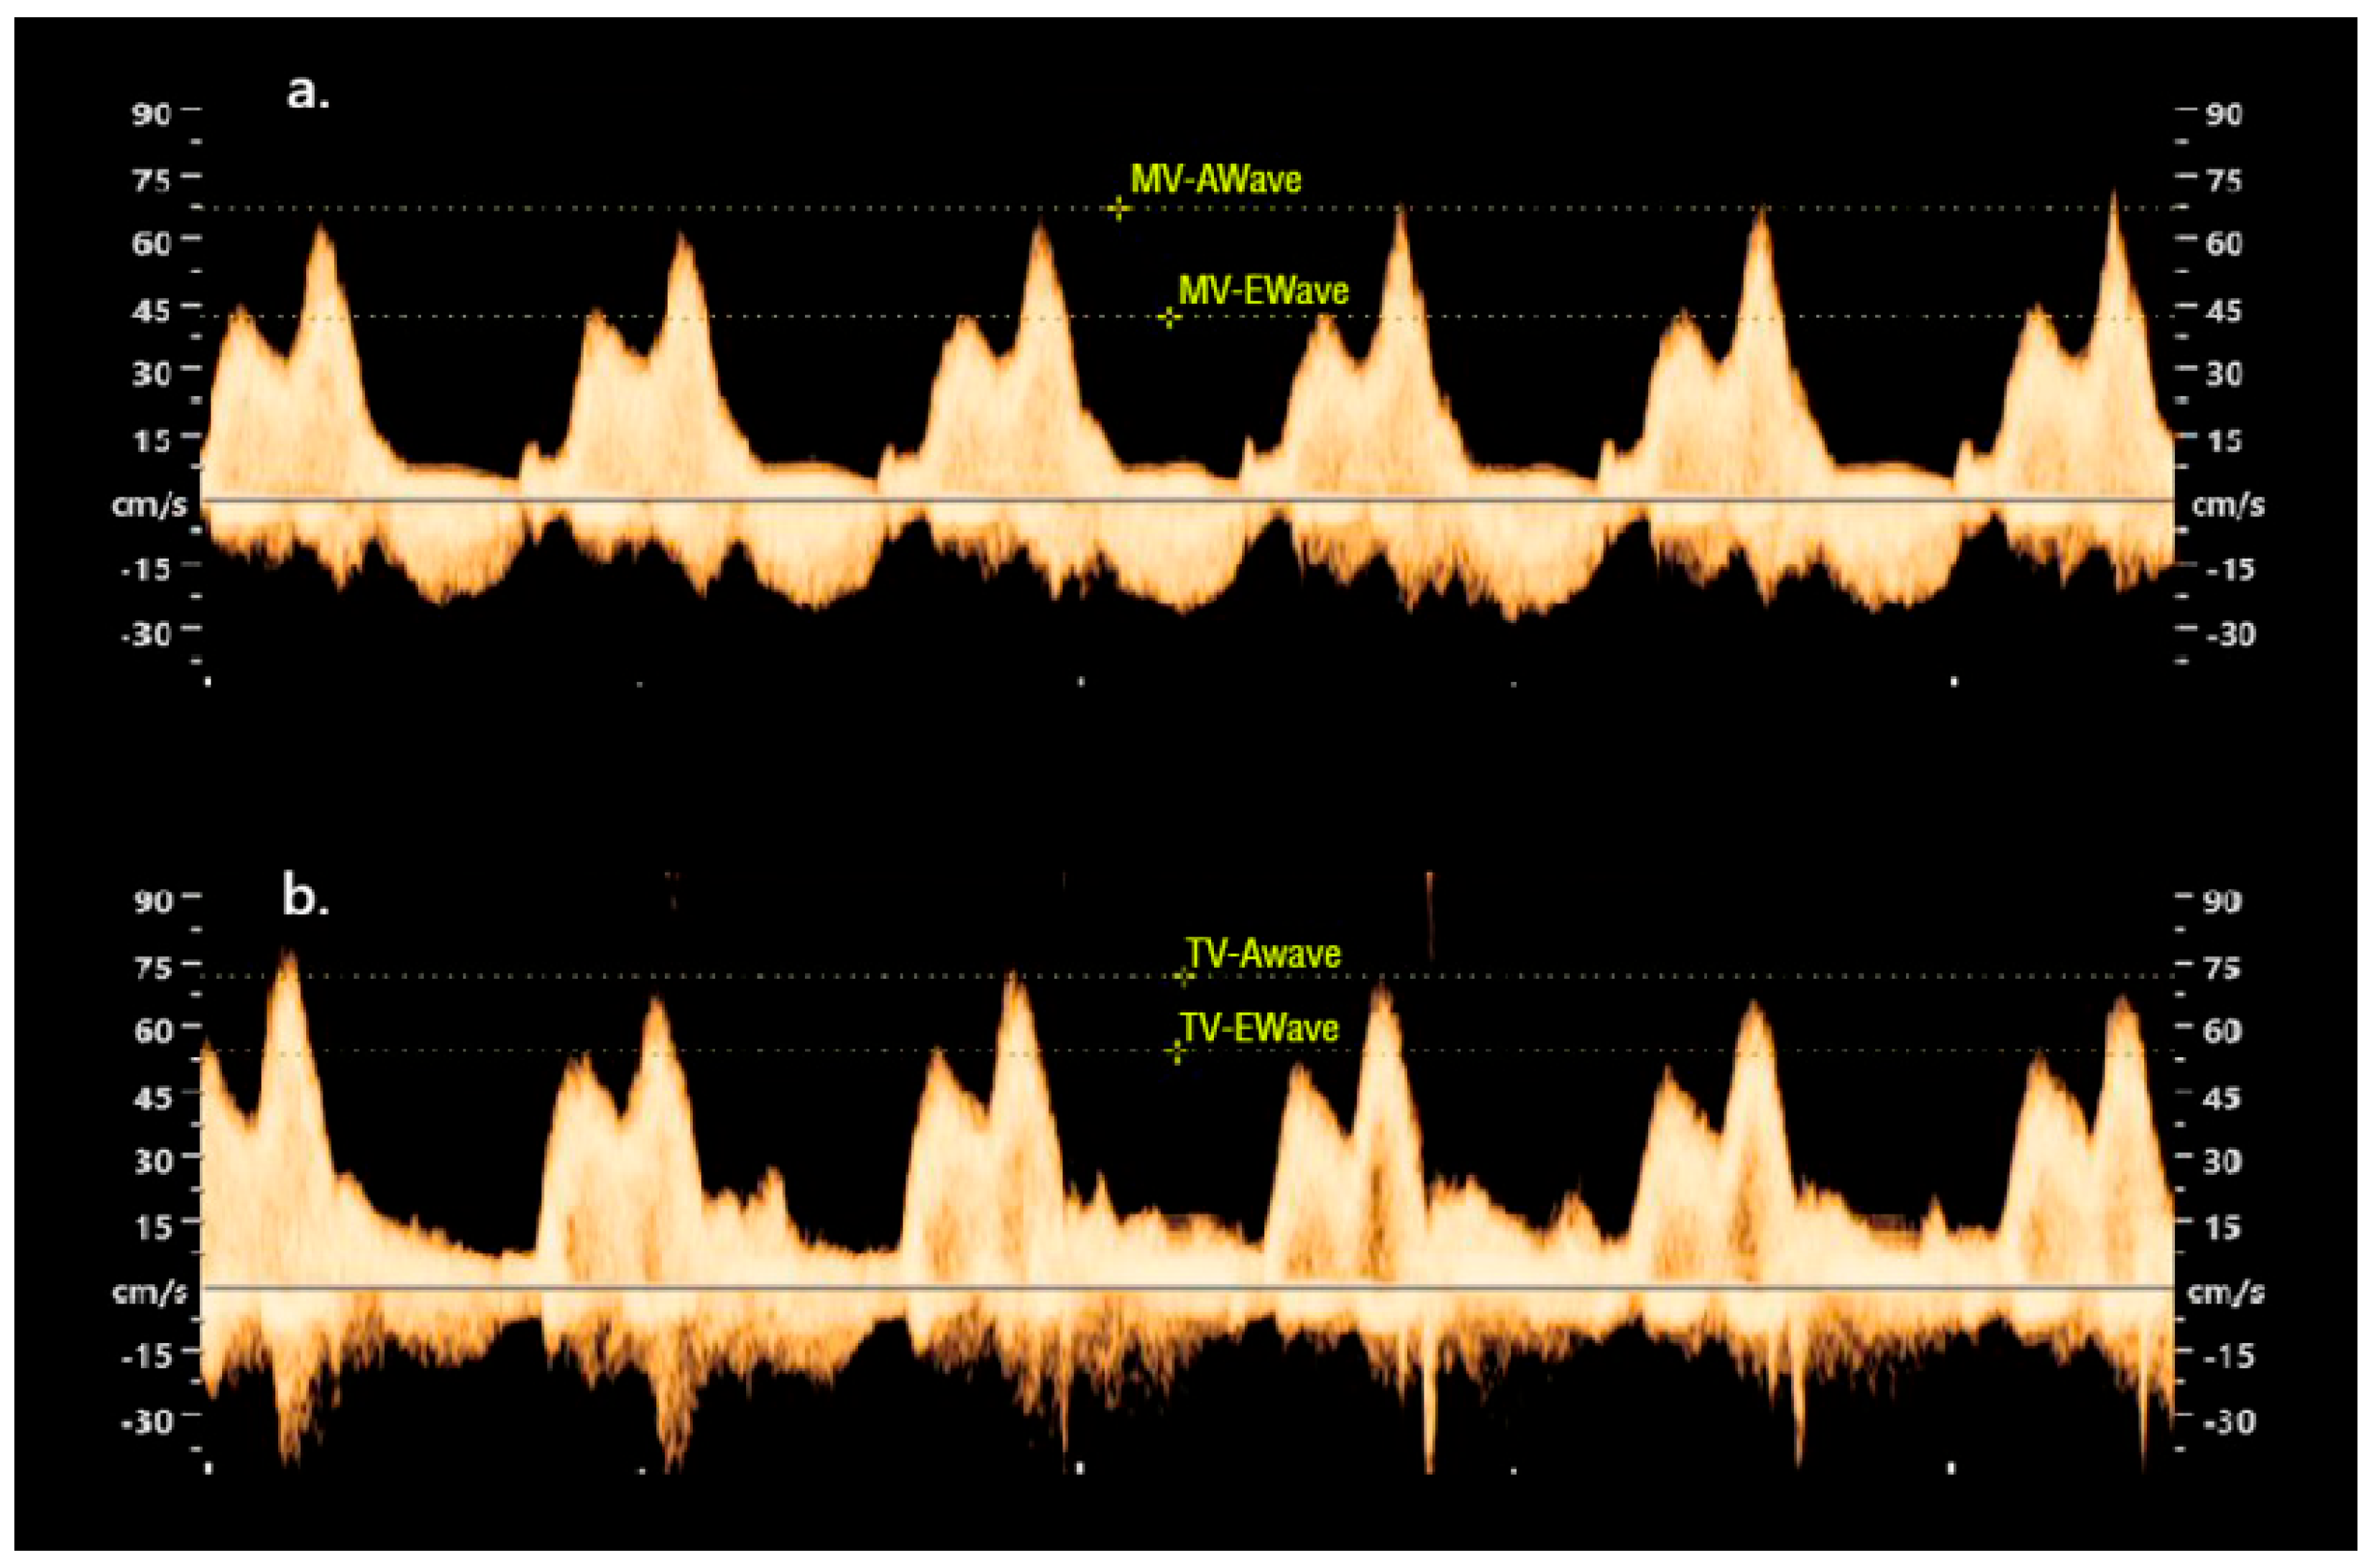
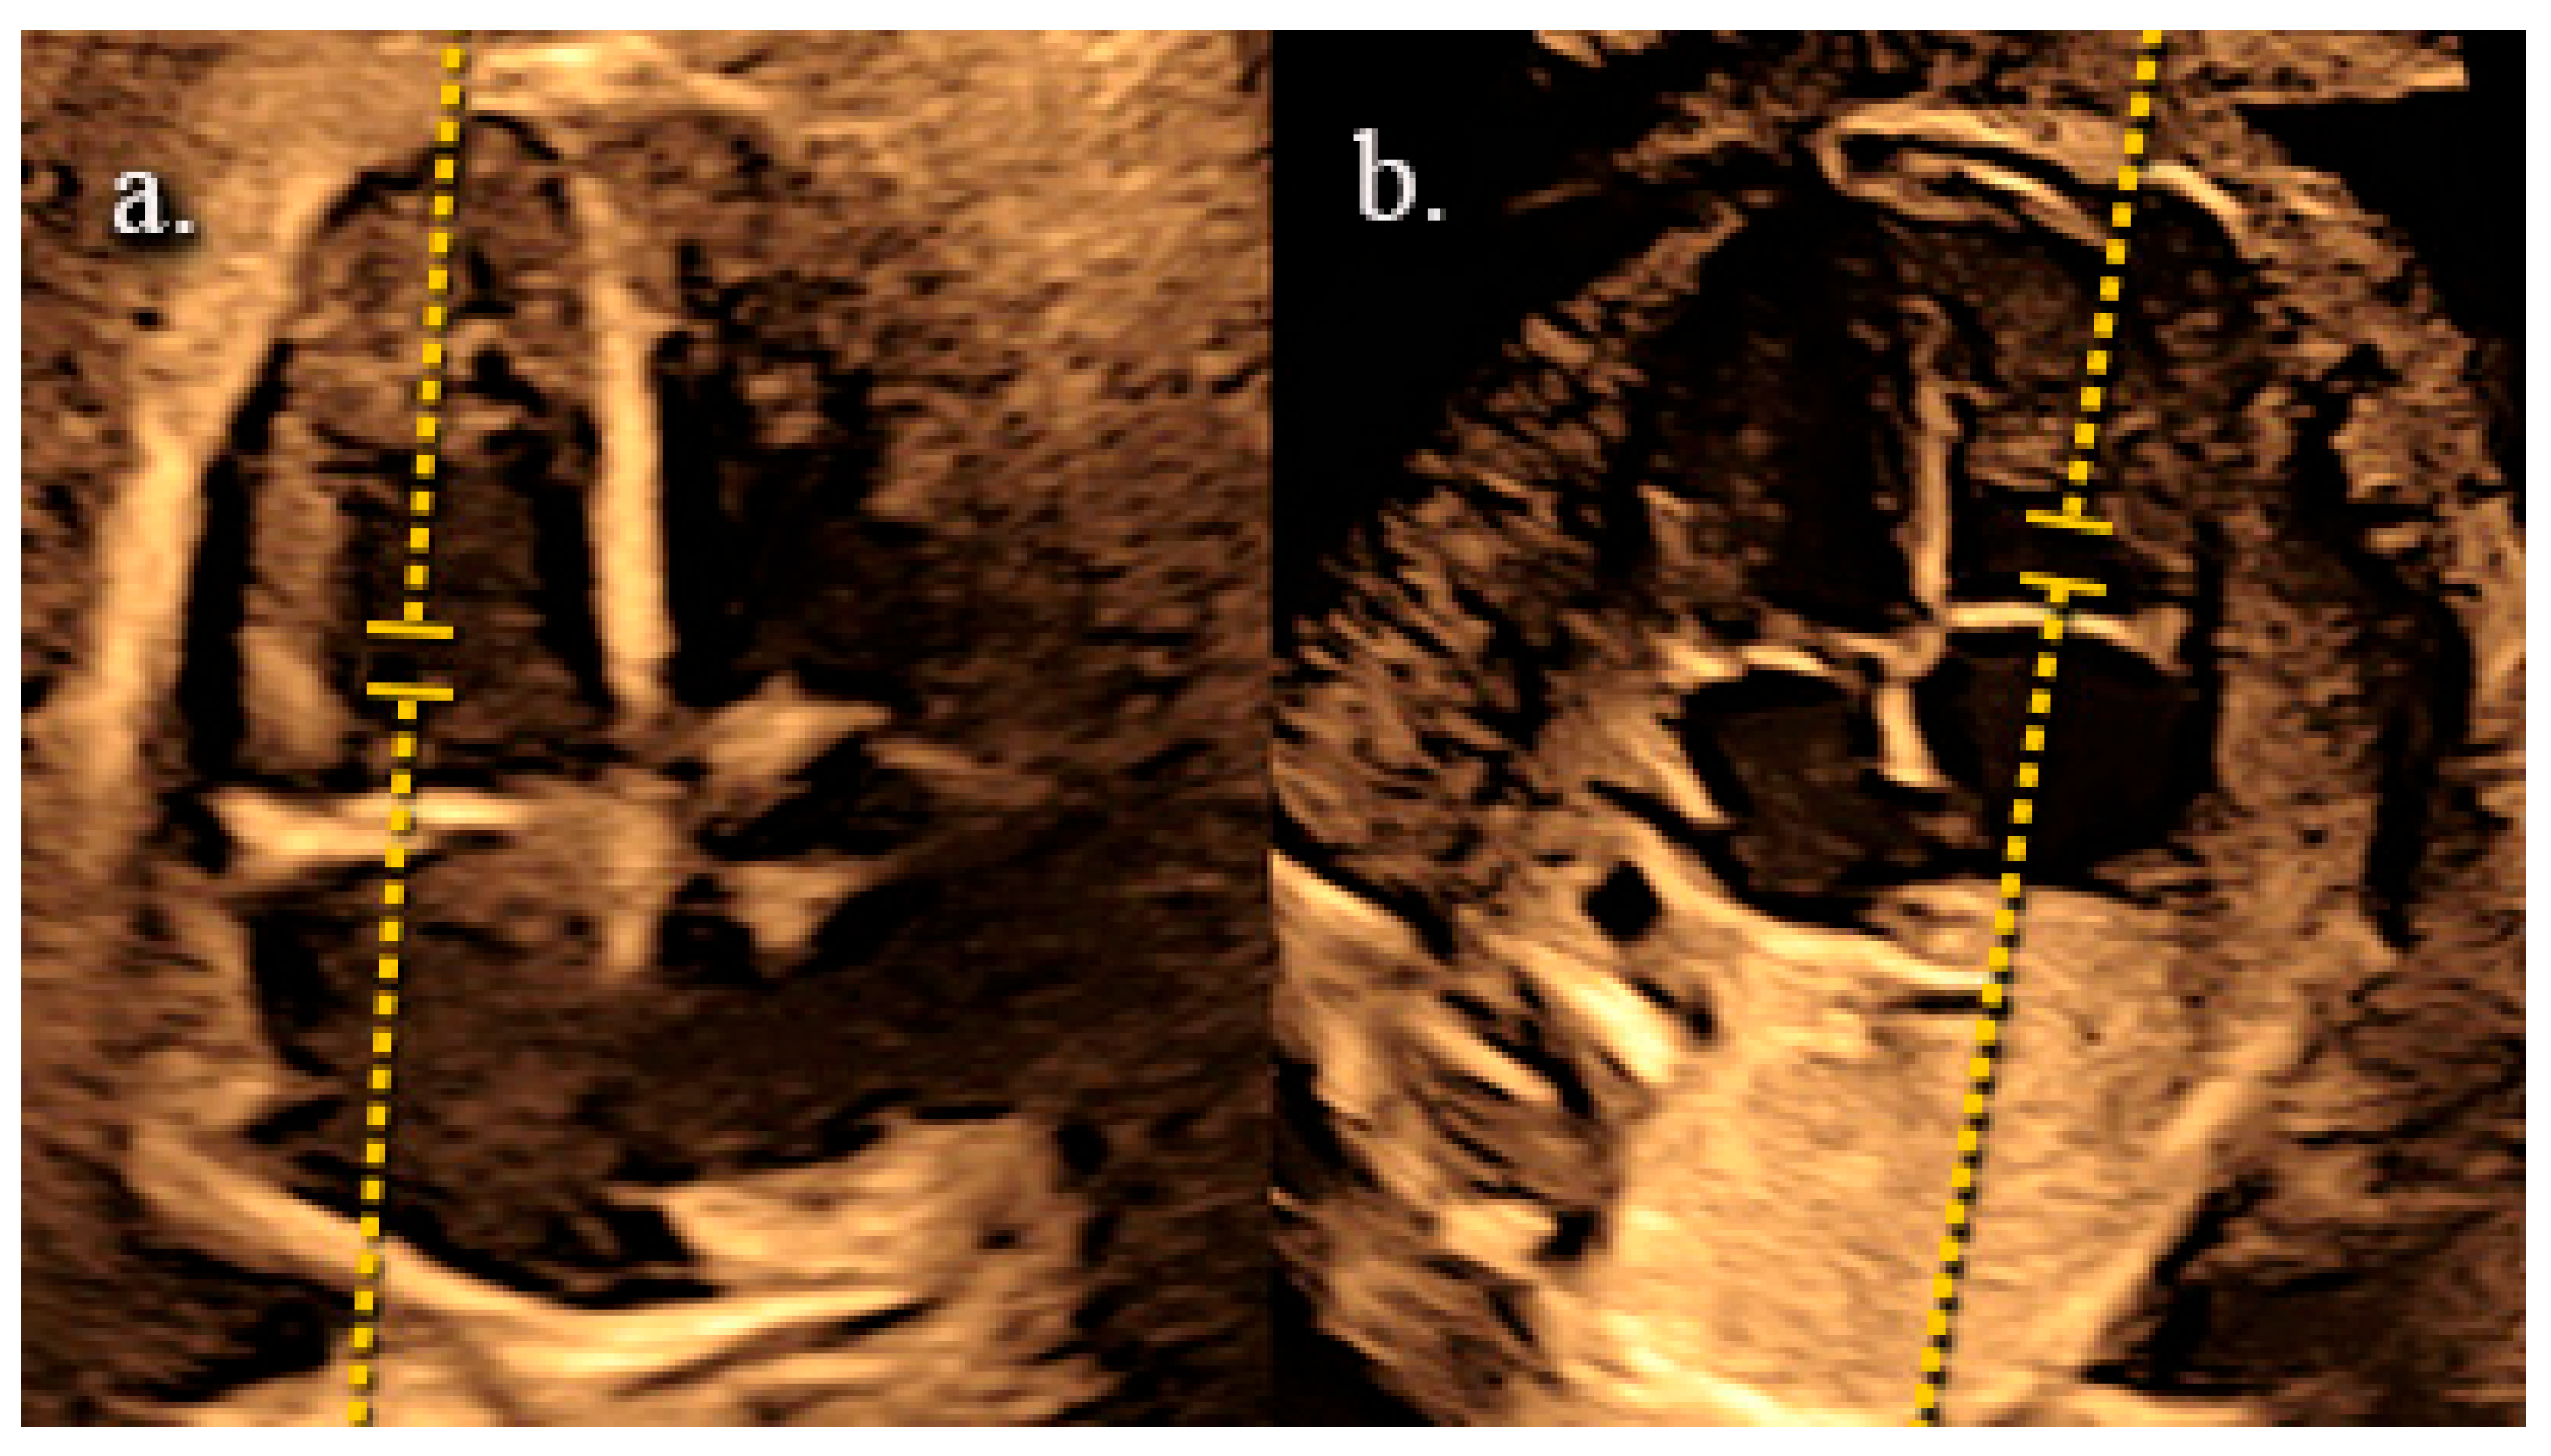
Pulsed Doppler can also be used to determine the fetal heart’s E/A ratio on both the left and right sides. The E/A ratio reflects the ventricular inflow pattern and assesses diastolic function, specifically ventricular relaxation [26]. The spectral Doppler sample volume is placed below the atrioventricular (AV) valves, where a biphasic wave is displayed in the normal fetus (Figure 9). The biphasic wave represents the blood flowing during the diastolic phase of the cardiac cycle. It is composed of two components, called E wave and A wave. E wave stands for the early diastolic phase, and it reflects the passive filling of the ventricle related to myocardial relaxation and the negative pressure generated in the ventricle. A wave stands for the active diastolic phase, and it reflects the atrial contraction during ventricular late filling. The E/A ratio is a parameter to assess blood flow velocities through the tricuspid and mitral valves during diastole. It is calculated as the ratio between the peak velocity of the E waveform and the peak velocity of the A waveform, and it is usually less than 1.28. E/A velocities increase as pregnancy progresses, with higher velocities in the tricuspid valve than in the mitral (Figure 10) [26,27,28].
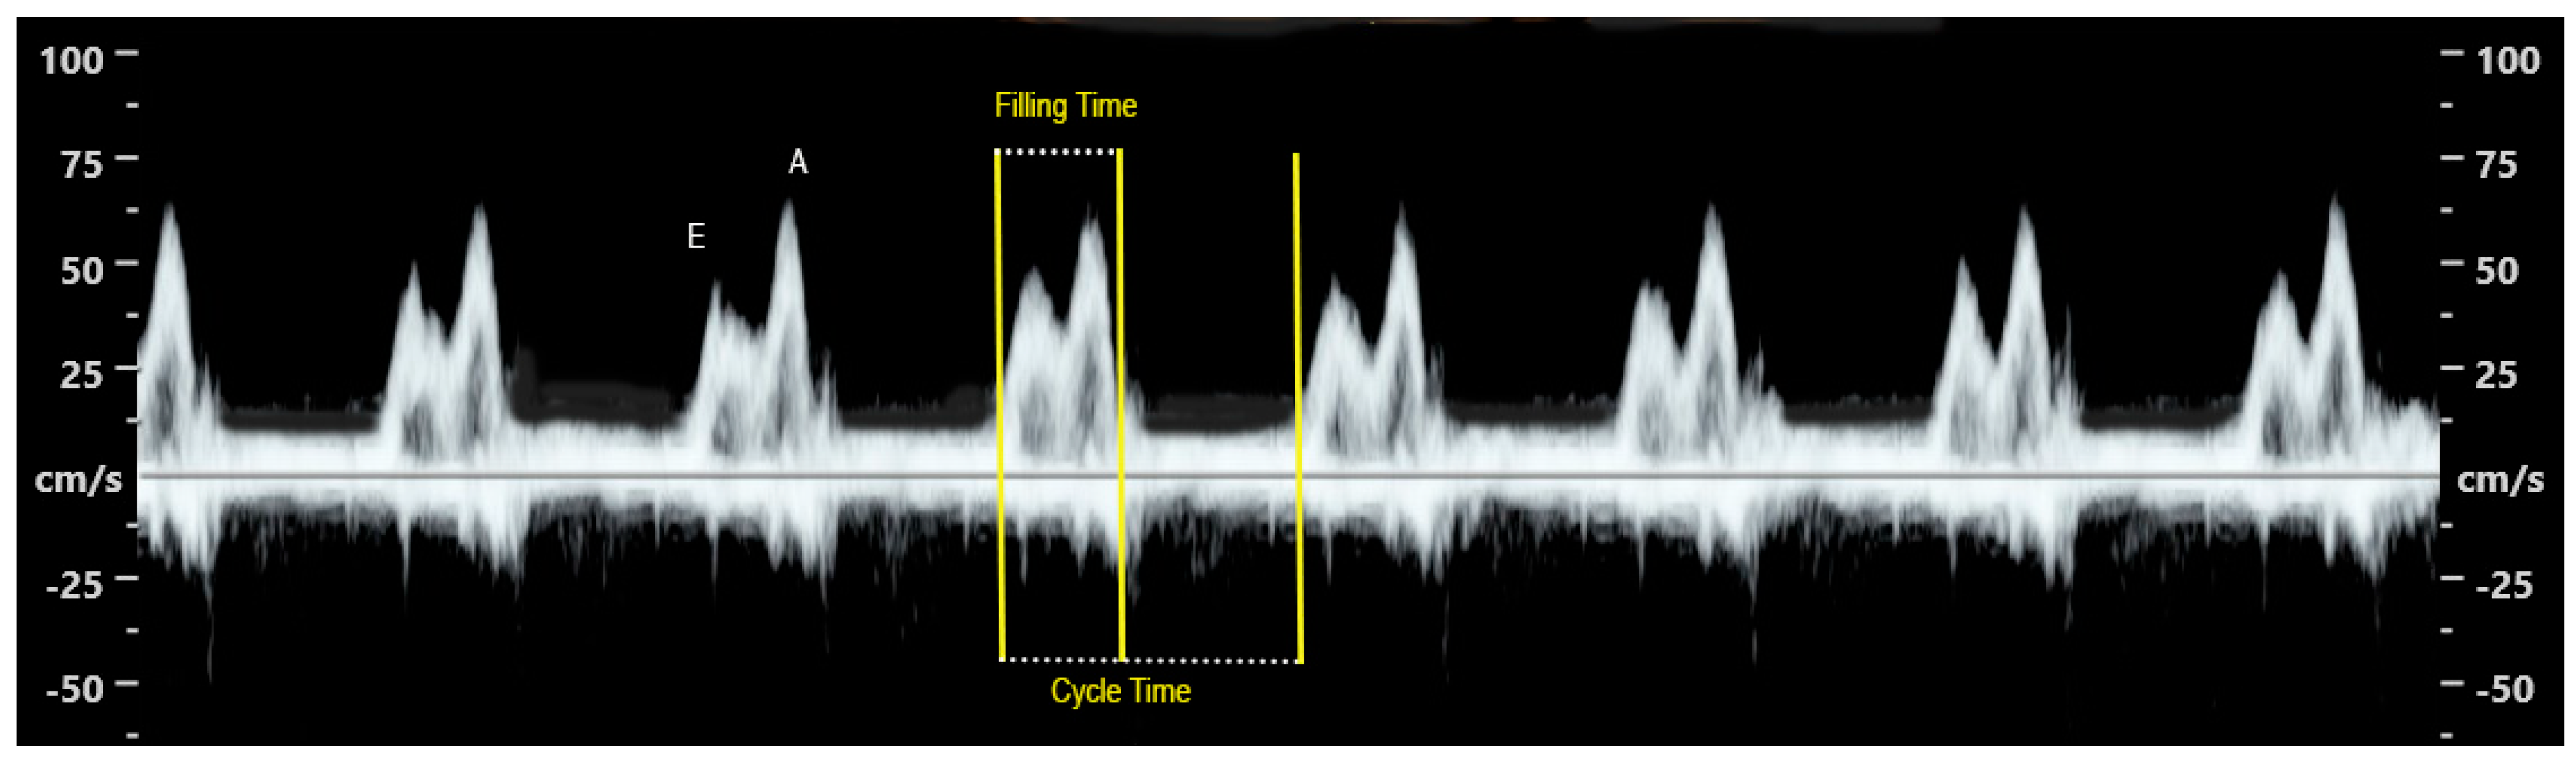
The cardiac cycle can be divided into two periods: diastolic (isovolumetric relaxation and filling) and systolic (isovolumetric contraction and ejection). Changes in the duration of these intervals can reflect impaired ventricular contractility or relaxation. Since the absolute duration of cardiac events depends on fetal heart rate, adjusting timing intervals for cardiac-cycle duration has been proposed. Filling time fraction (FTF) is the filling time during diastole as a proportion of cycle time [23]. It is calculated as the measurement of filling time divided by cycle time and multiplied by 100 (Figure 11).

4.3. Semilunar Valves Assessment

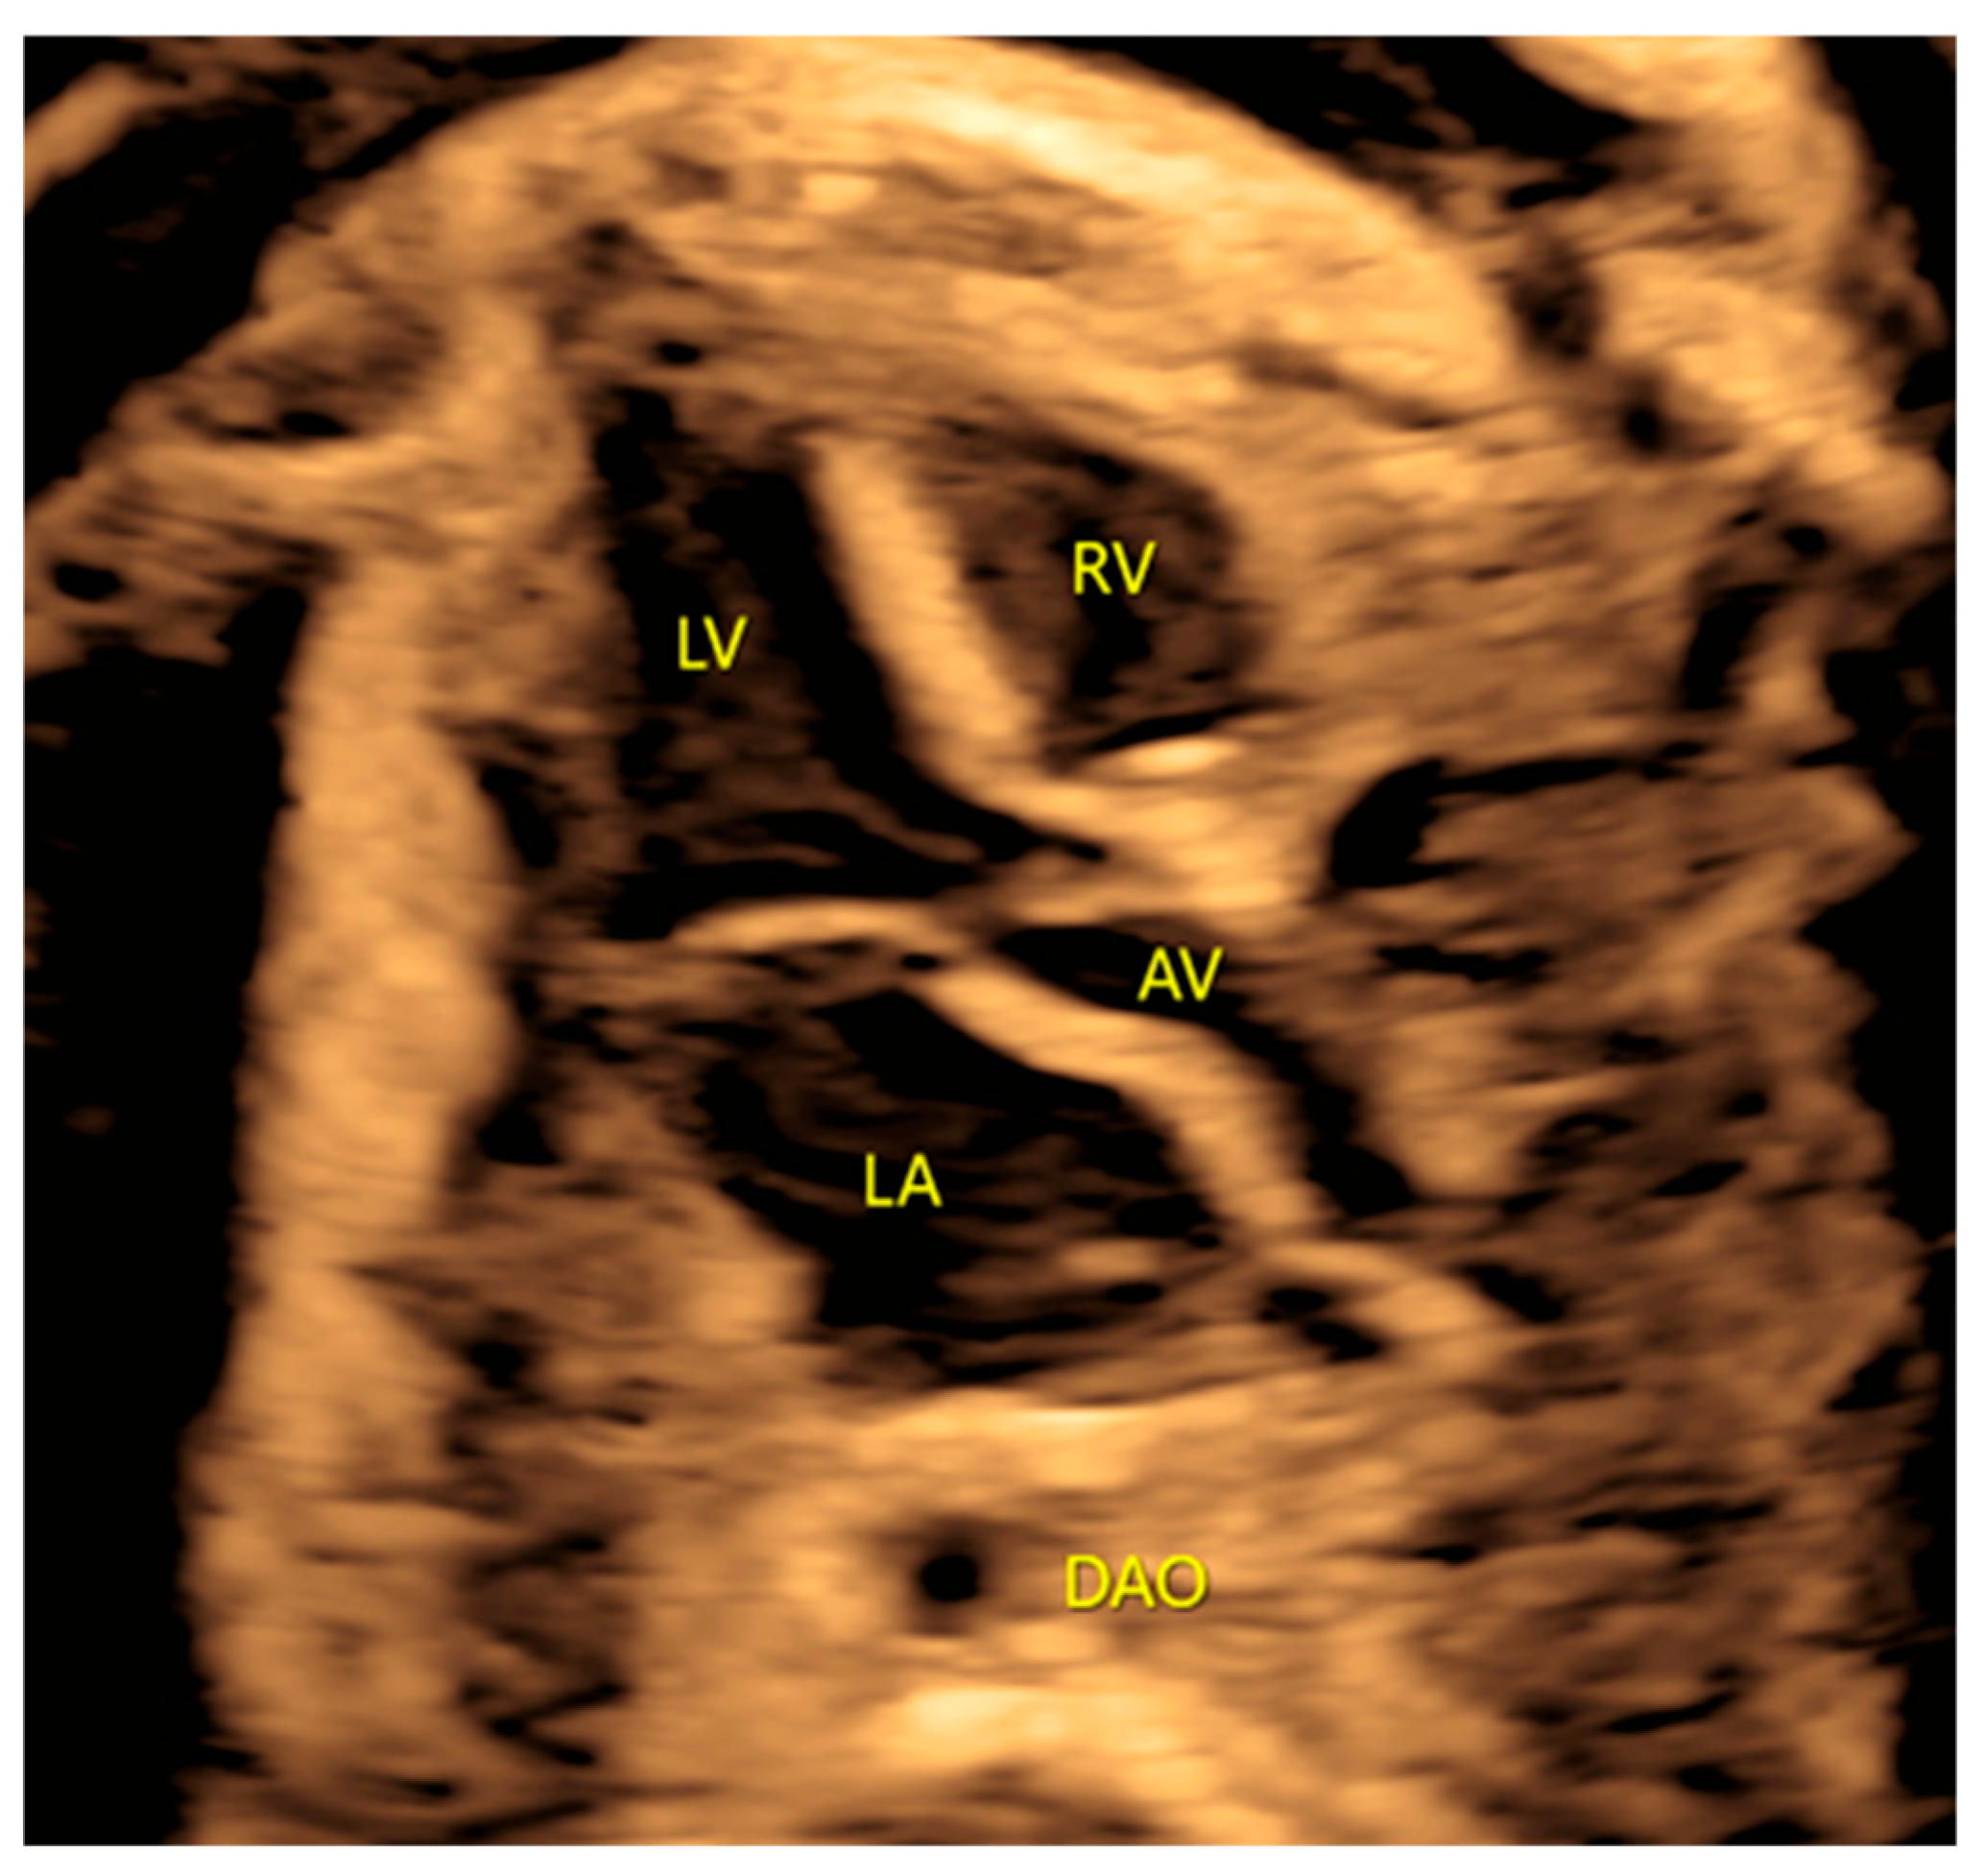
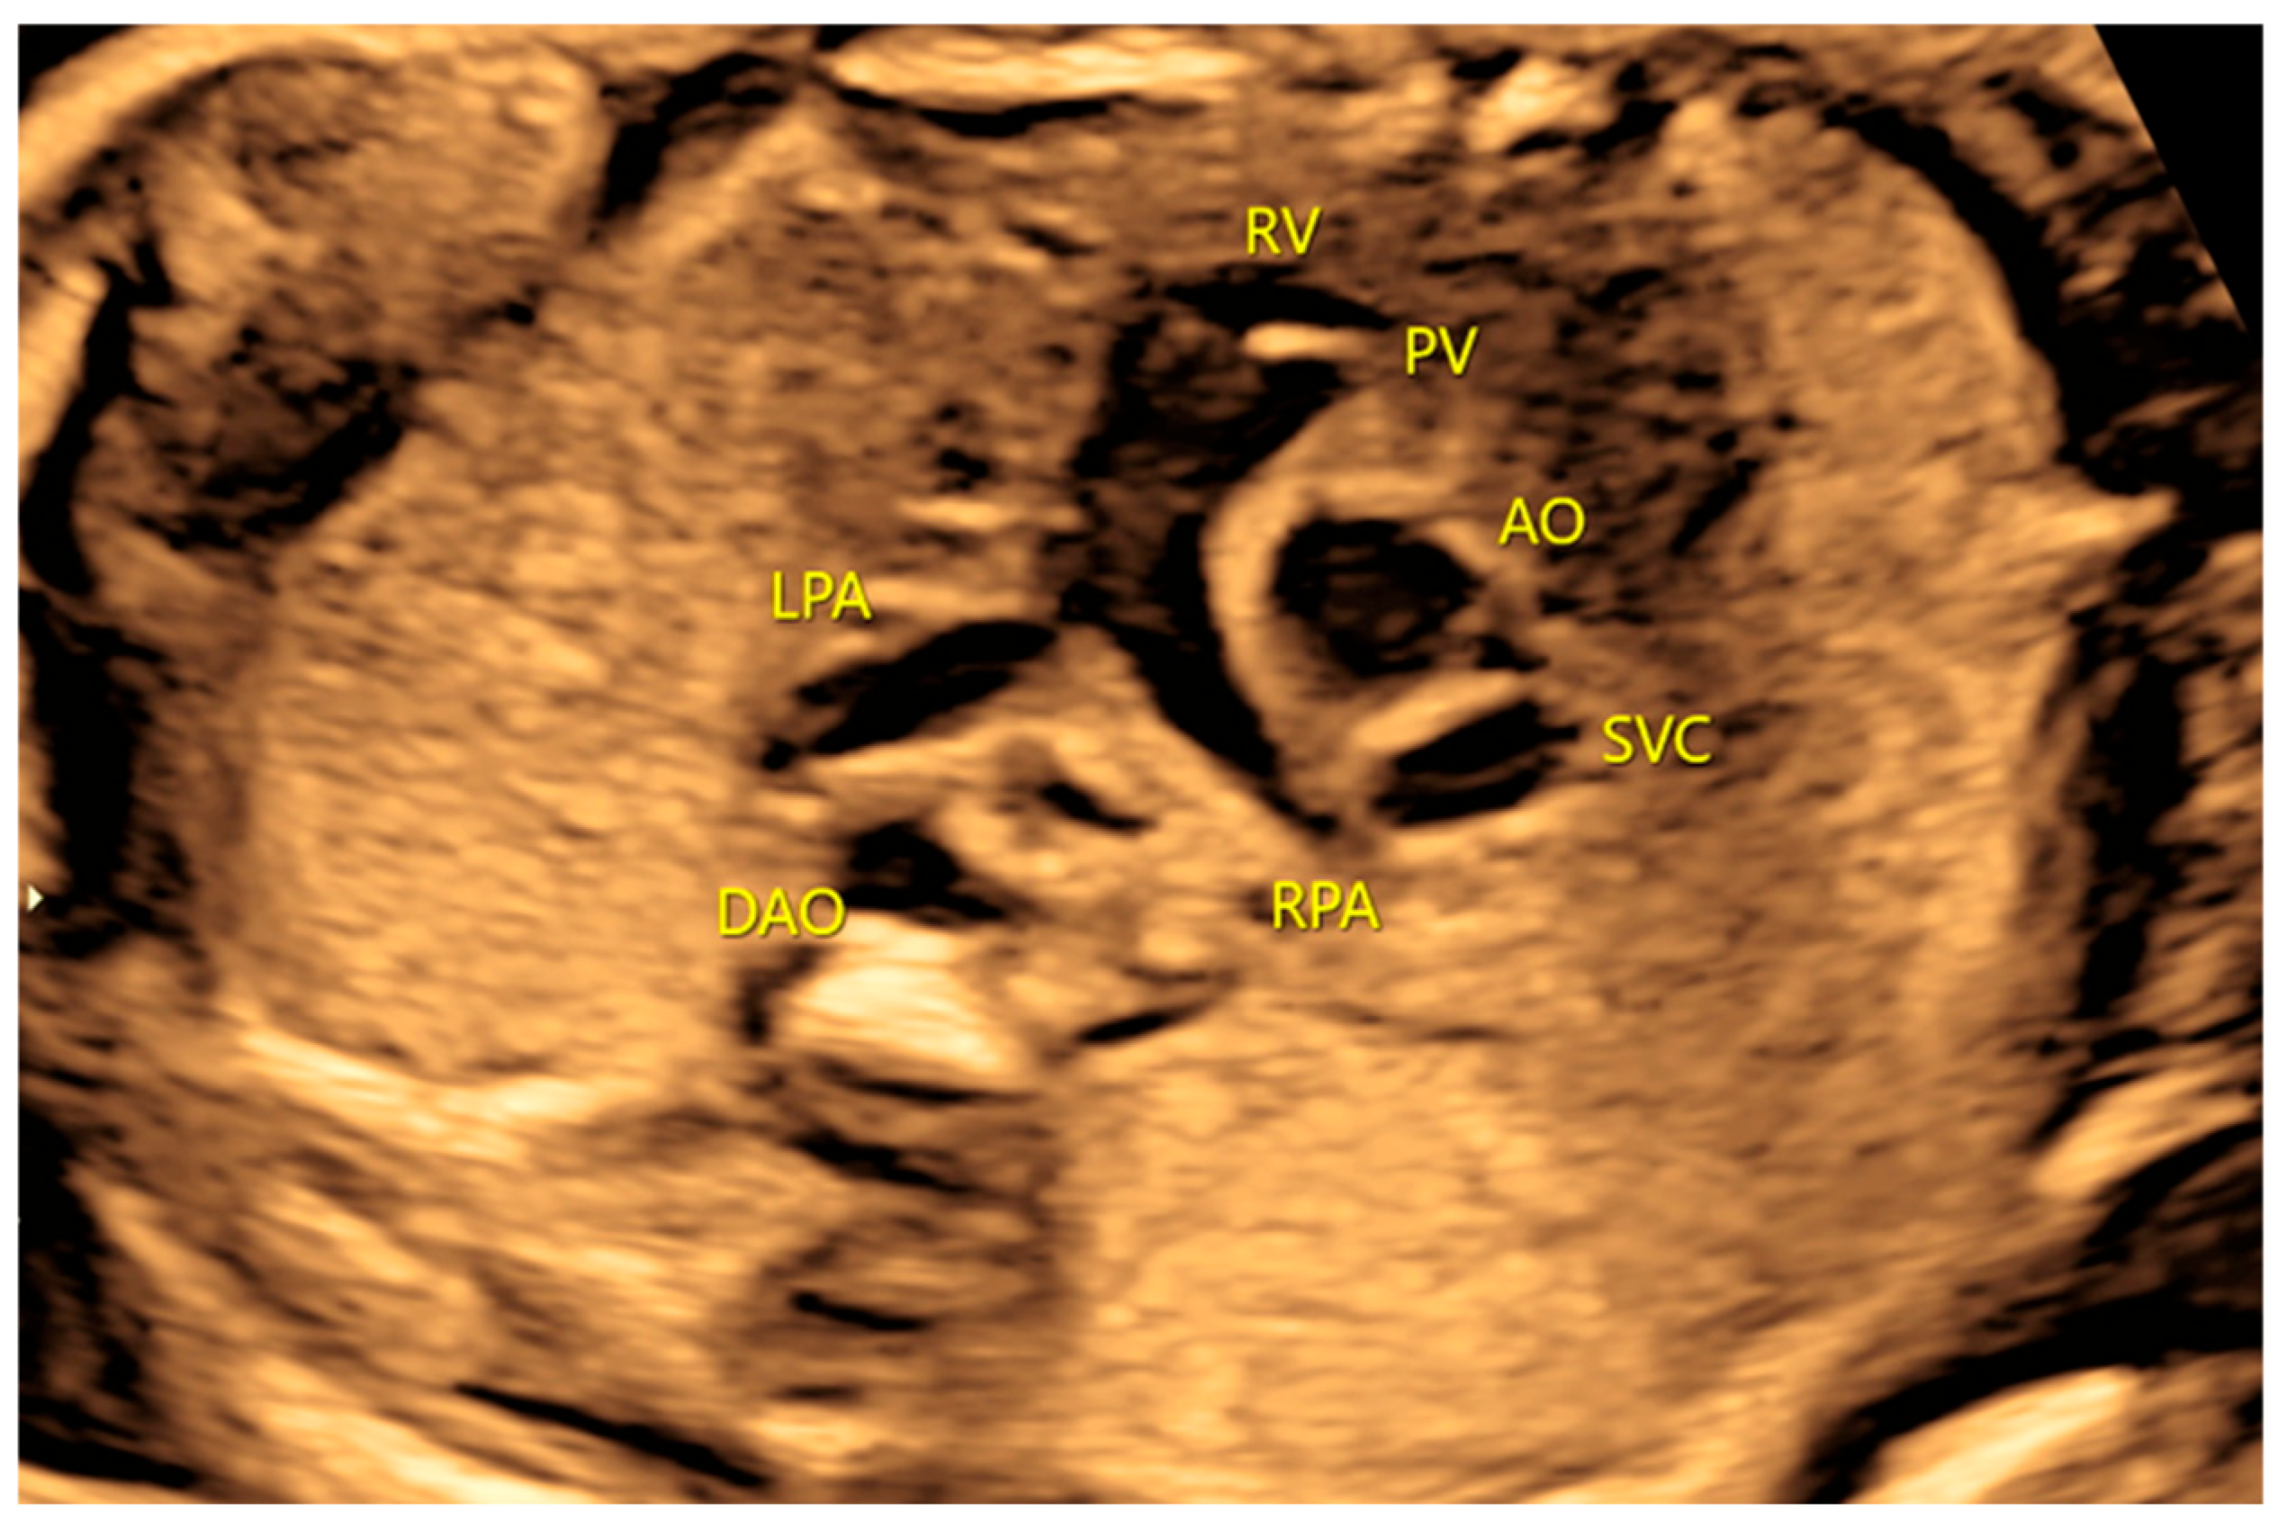
Assessment of the semilunar valves includes 2D imaging of the left and right outflow tracts. The left outflow tract image is useful for measuring the aorta at the level of the valvular ring in systole (Figure 12) [9]. The right outflow tract image is useful for measuring the pulmonary artery at the level of the valvular ring in systole (Figure 13) [9].
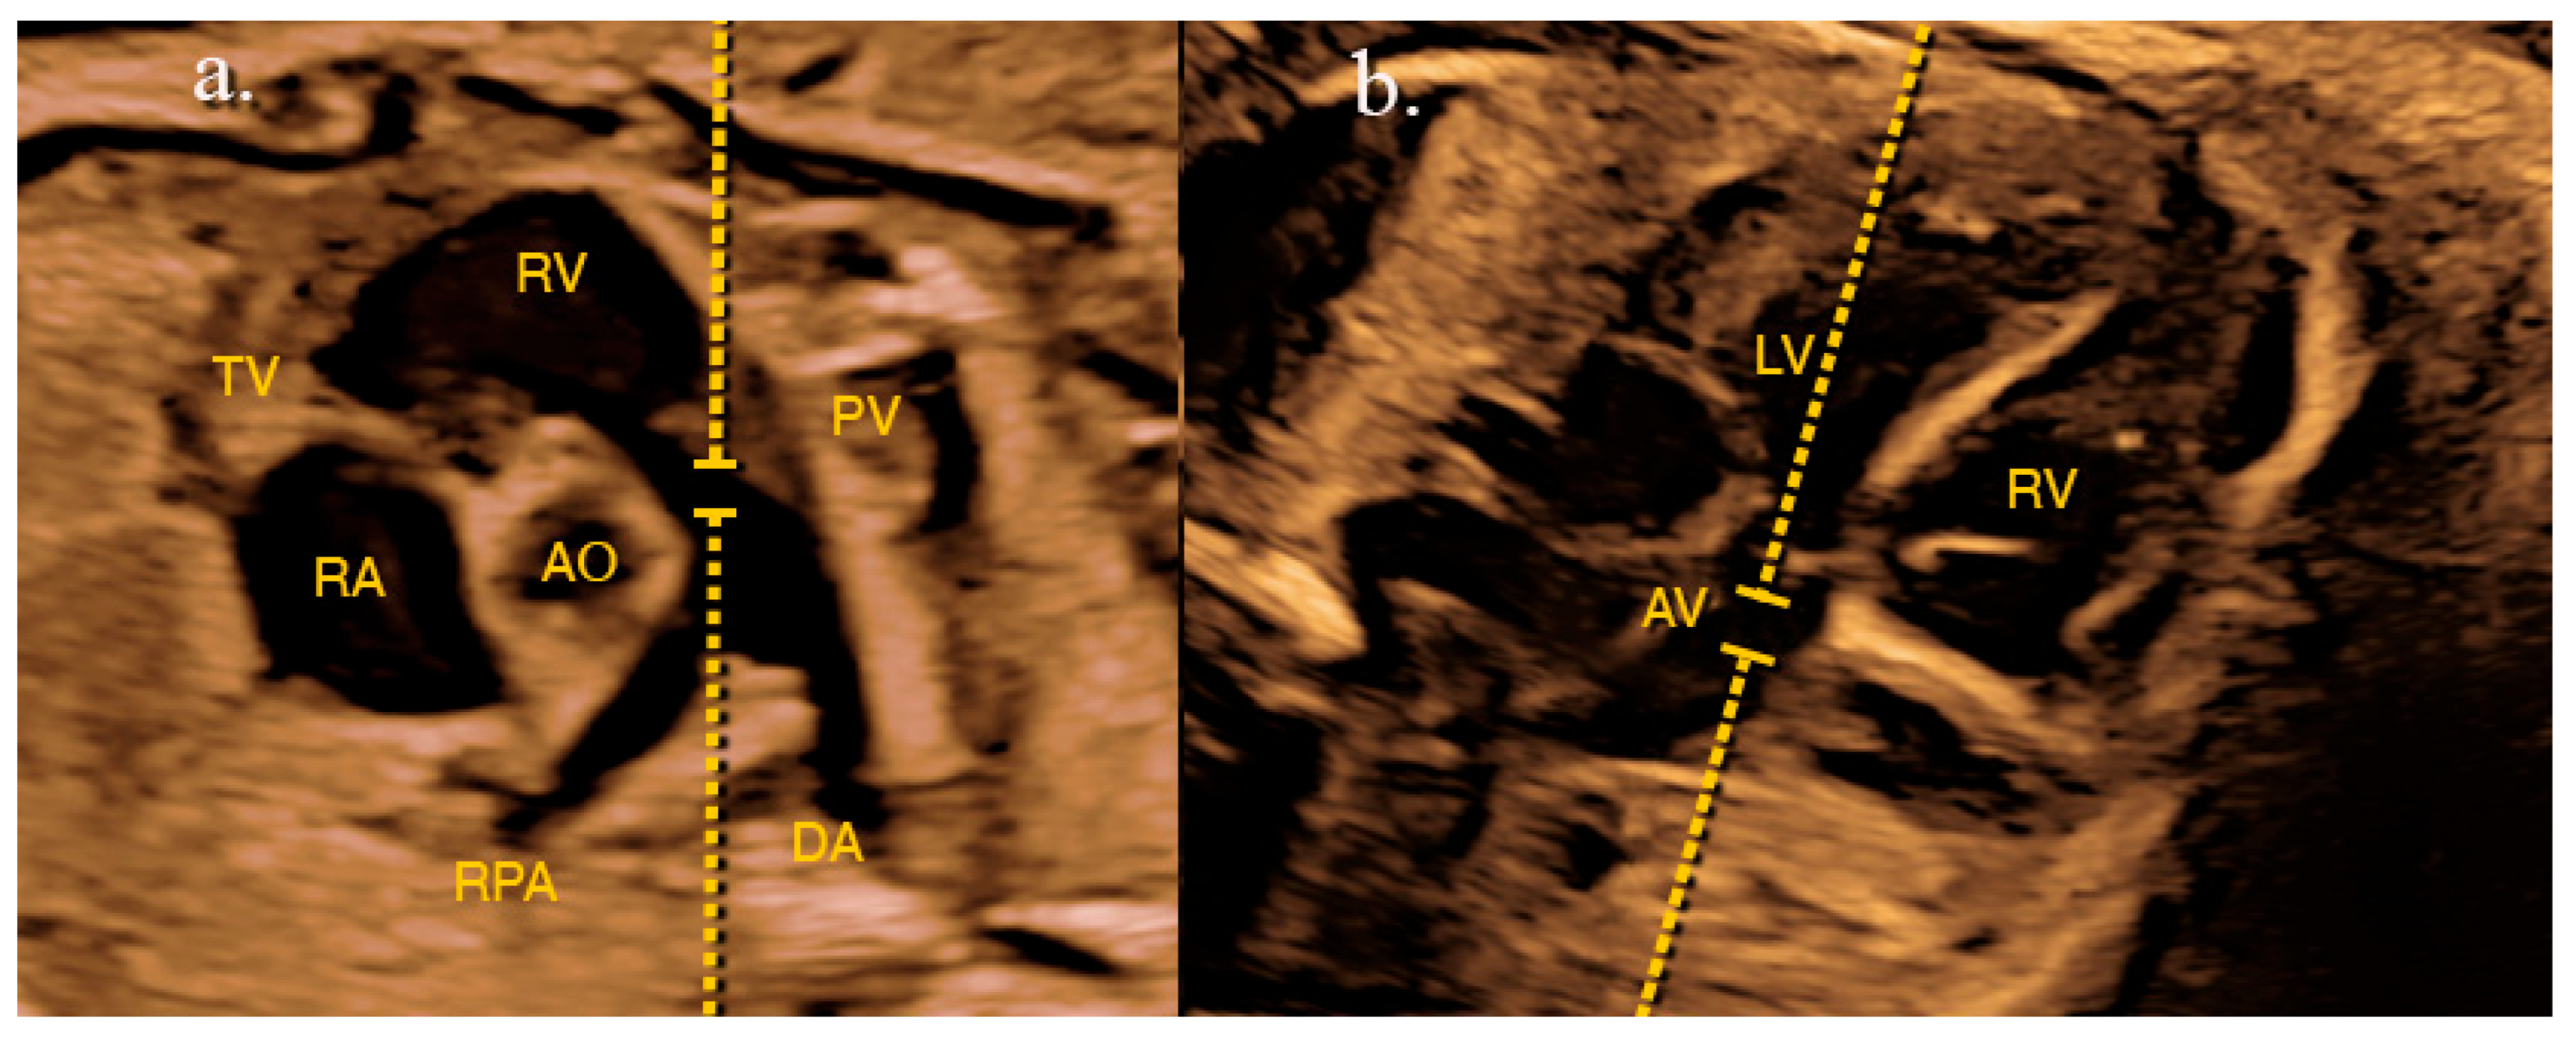
Pulsed Doppler can be applied to assess blood flow waveforms through the semilunar valves. The best approach involves positioning the pulmonary artery and the aorta as parallel to the ultrasound beam as possible, to record their respective Doppler waveforms accurately [29]. Ideally, the angle between the ultrasound beam and the direction of flowing blood should be less than 30 degrees [30].
The long axis of the five-chamber of the heart is the best view to obtain the aortic blood flow Doppler waveform at the ideal angle (Figure 14). A short-axis view of the heart is the common view for applying pulsed Doppler to the pulmonary artery. Alternatively, a transverse plane of the fetal chest above the five-chamber can be used to record the pulmonary Doppler waveforms (Figure 14) [30].
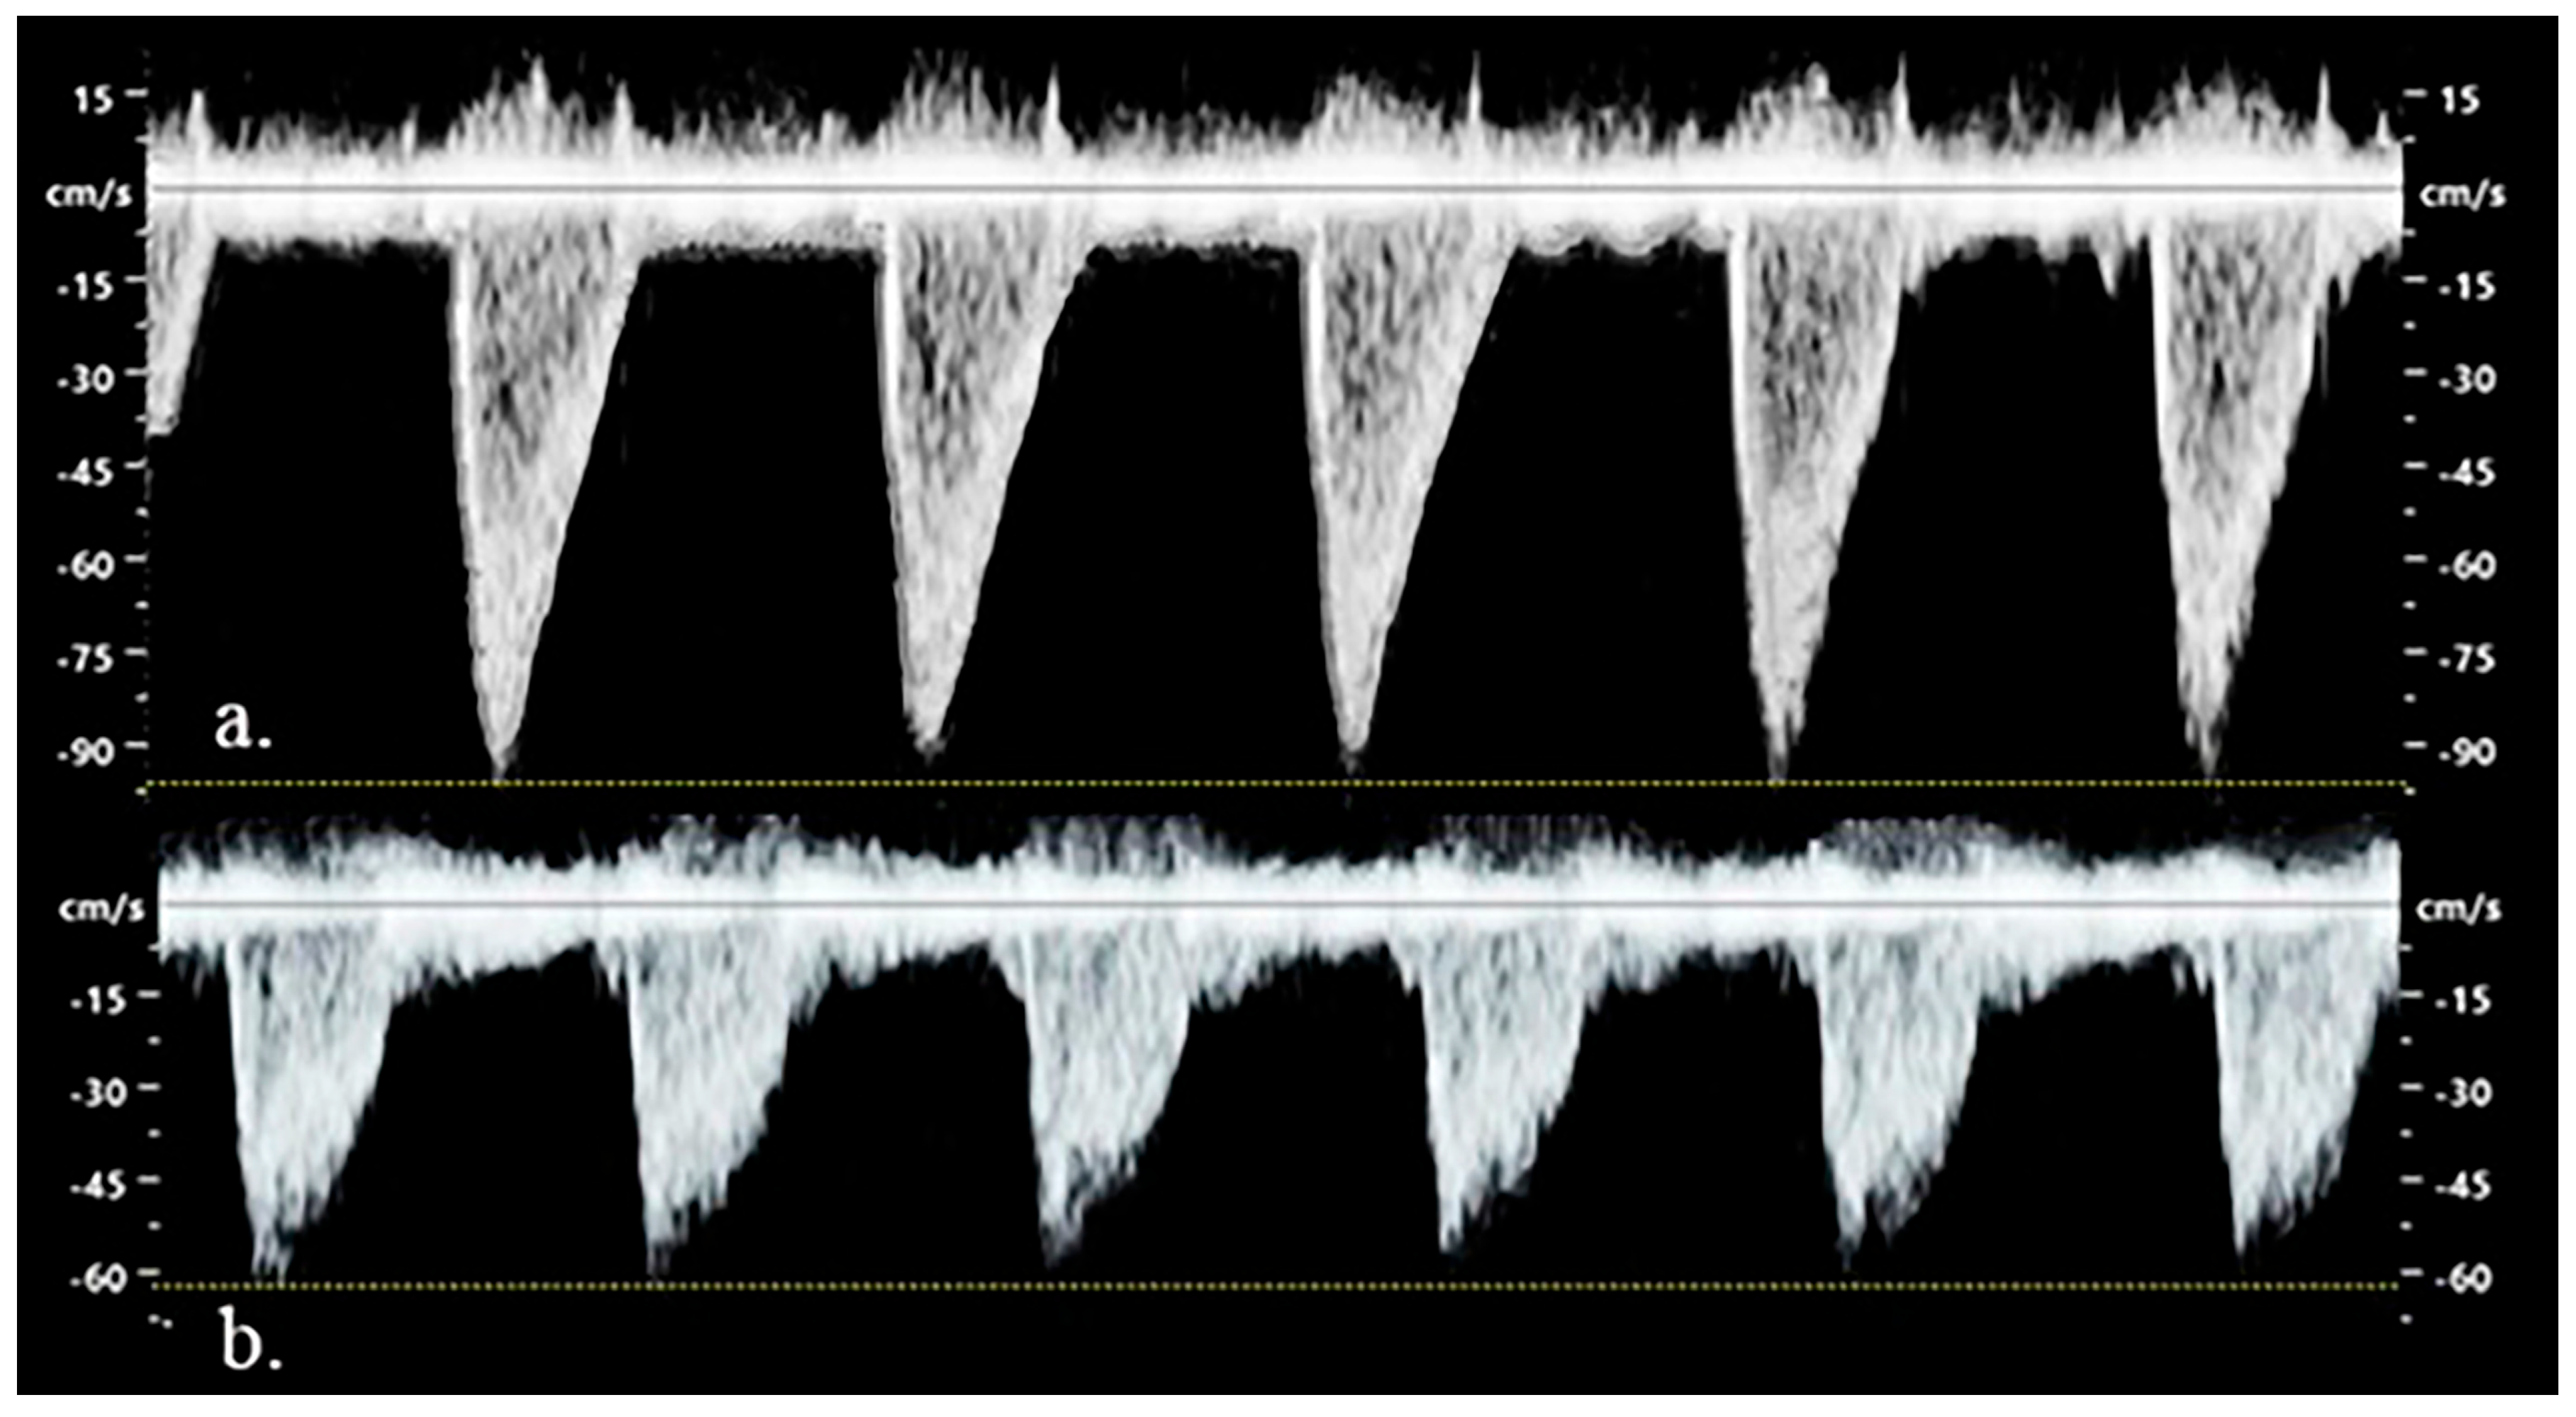
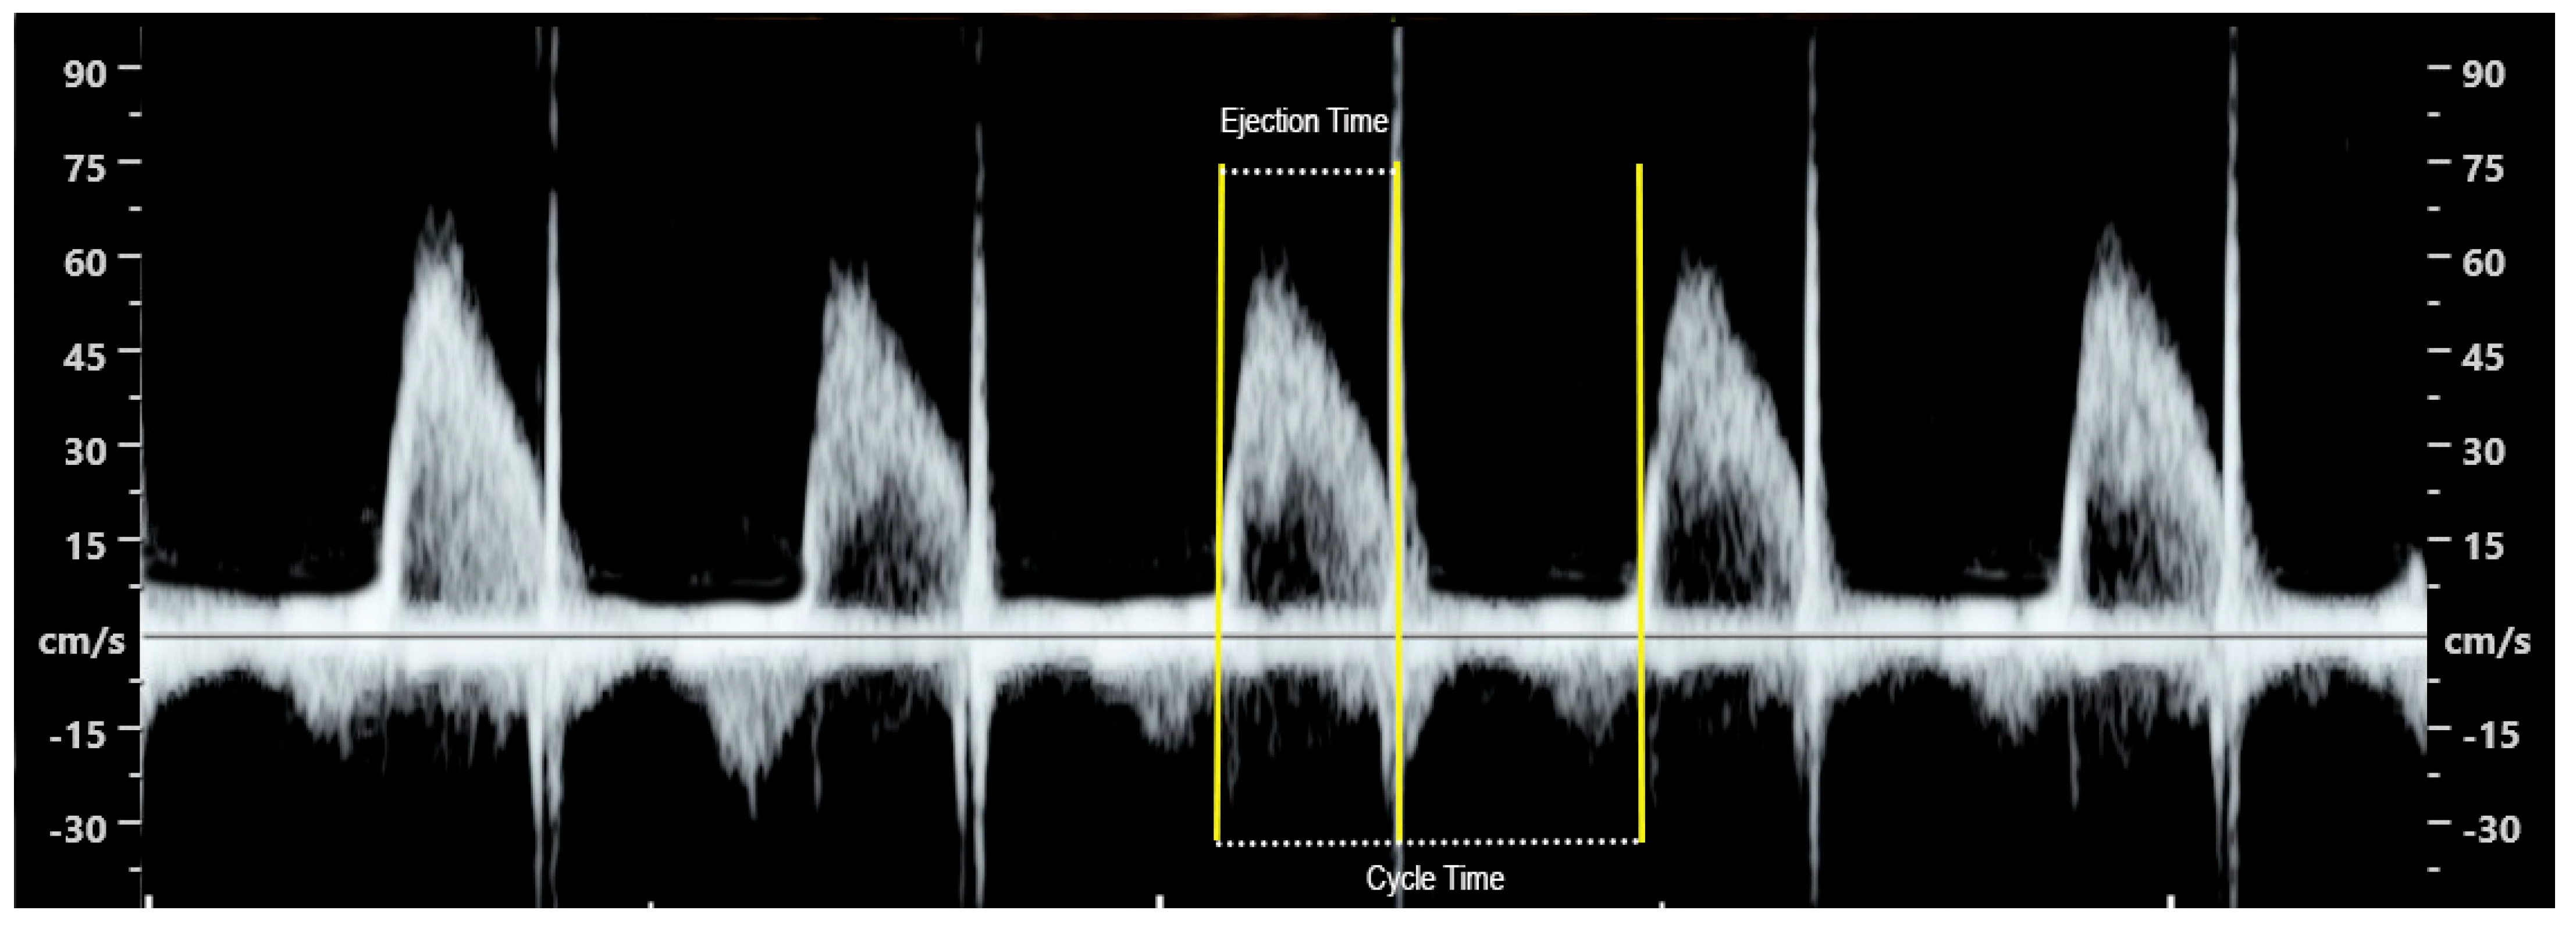
Applying pulsed-wave Doppler, flow velocity through the valves is measured, and aortic and pulmonary peak systolic velocities are assessed. The sample is positioned at the level of the ascending aorta and distal to the pulmonary valve (Figure 14 and Figure 15). Nomograms for aortic and pulmonary values, peak systolic velocities have been published [31,32]. Furthermore, the application of pulsed-wave Doppler allows the assessment of the ejection time fraction on either of the outflow wave tracings (pulmonary or aortic valve) [23]. Ejection time fraction (FTF) is the ejecting time during systole as a proportion of cycle time [23]. It is calculated as the measurement of ejection time divided by cycle time and multiplied by 100 (Figure 16).
Color Doppler can be used to evaluate blood flow through the valves, especially in cases of suspected critical stenosis or atresia.

4.4. Three Vessels and Trachea View Evaluation

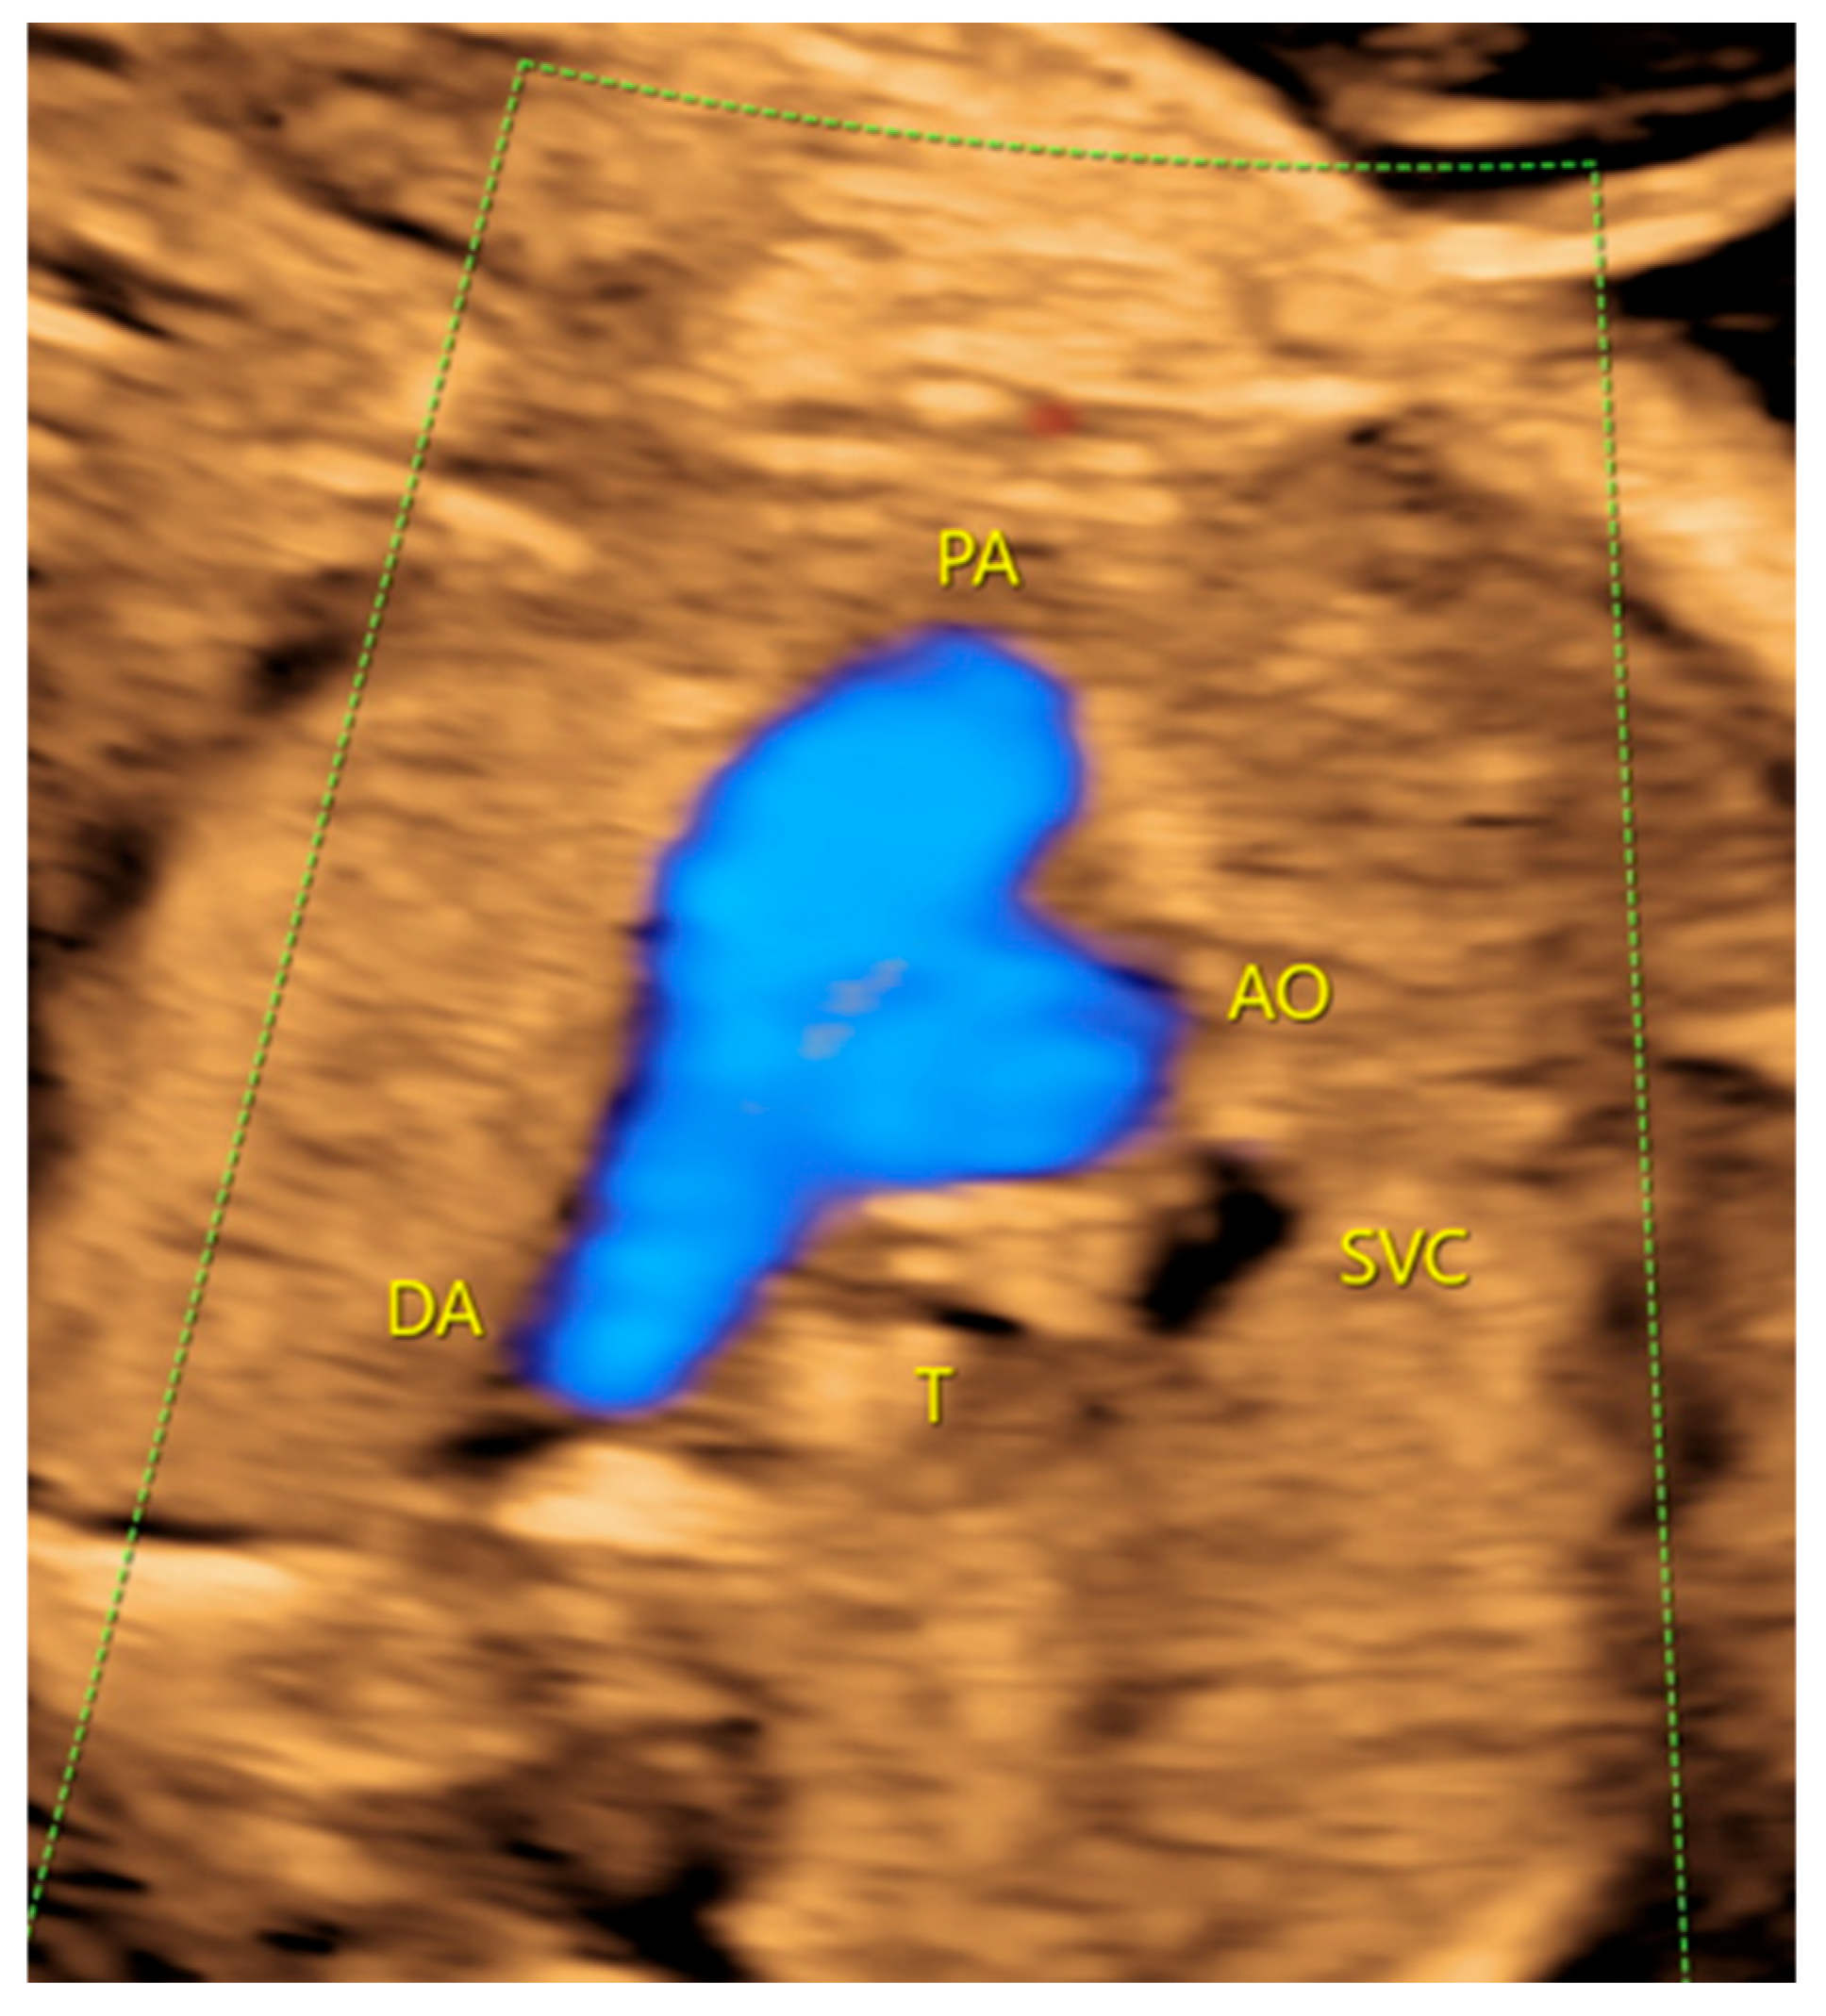
Confirmation of anterograde flow throughout the entire length of the aorta and pulmonary arteries can be obtained in the three vessels, and trachea view colour Doppler image (Figure 17).
Evaluating the blood flow through the aortic isthmus (AoI) and ductus arteriosus can offer indirect clues on the functionality of the proximal semilunar valves. Pulsatility indices of the aortic isthmus and ductus arteriosus are obtained through the application of pulsed Doppler imaging.
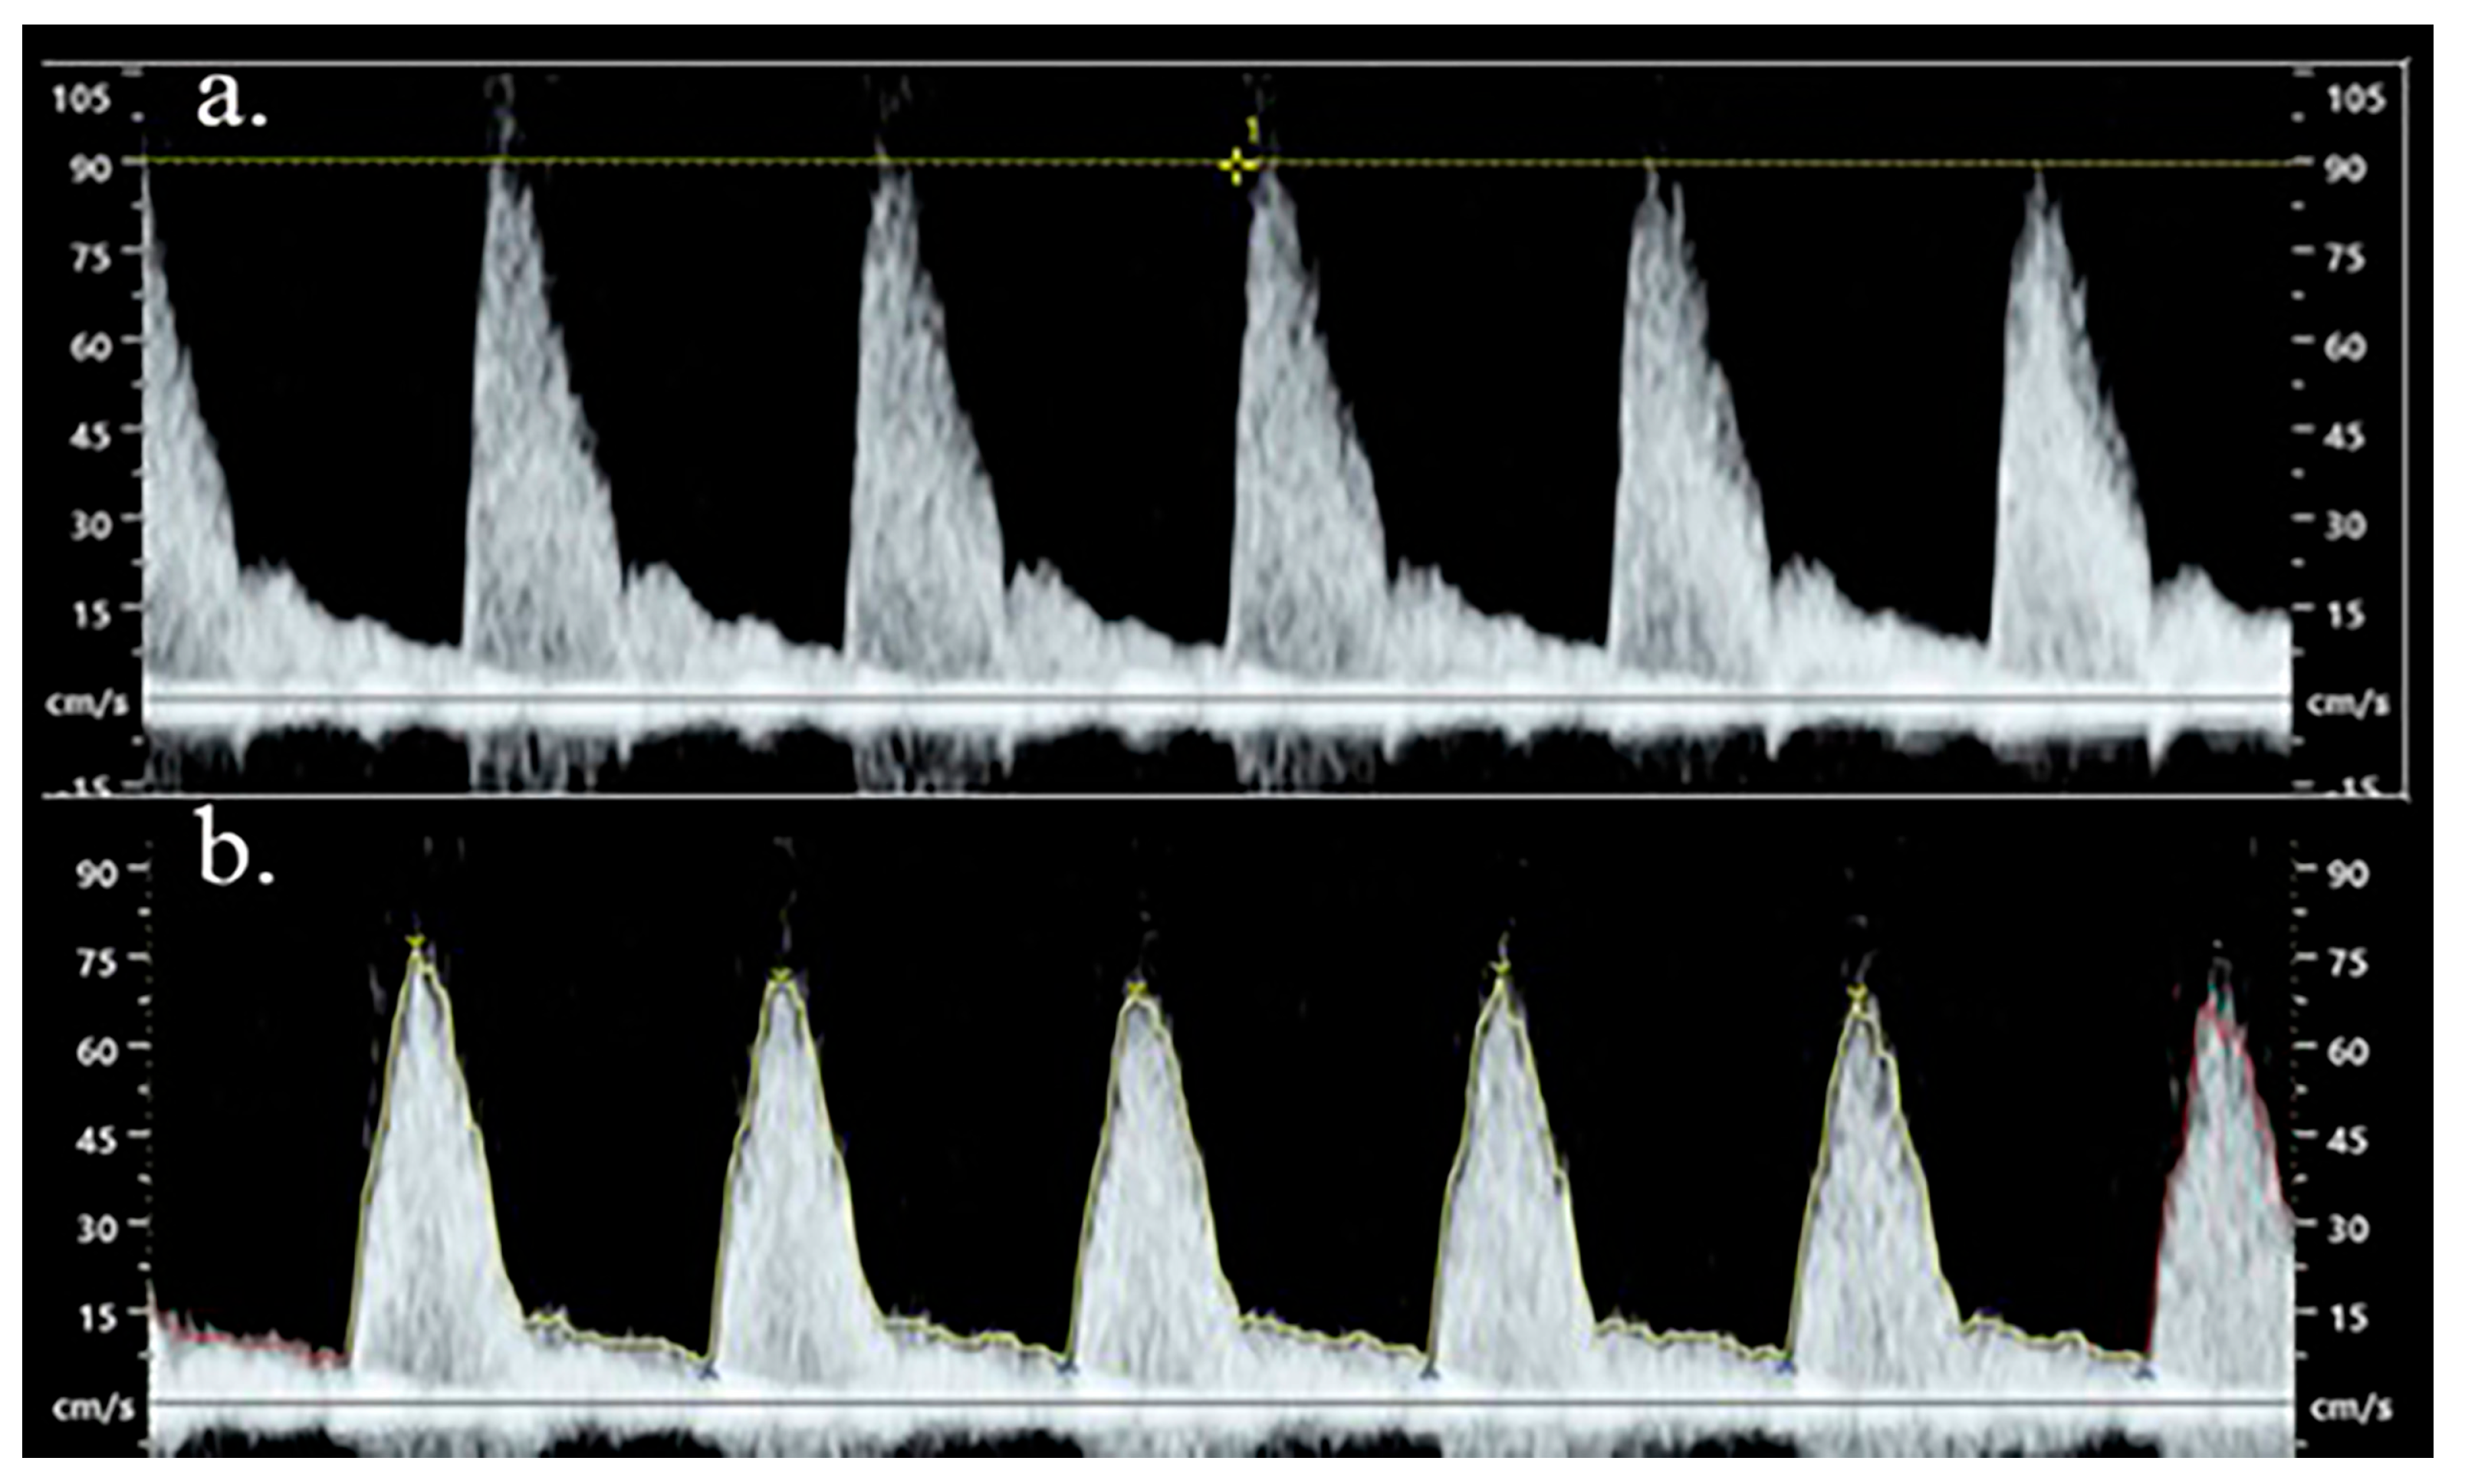
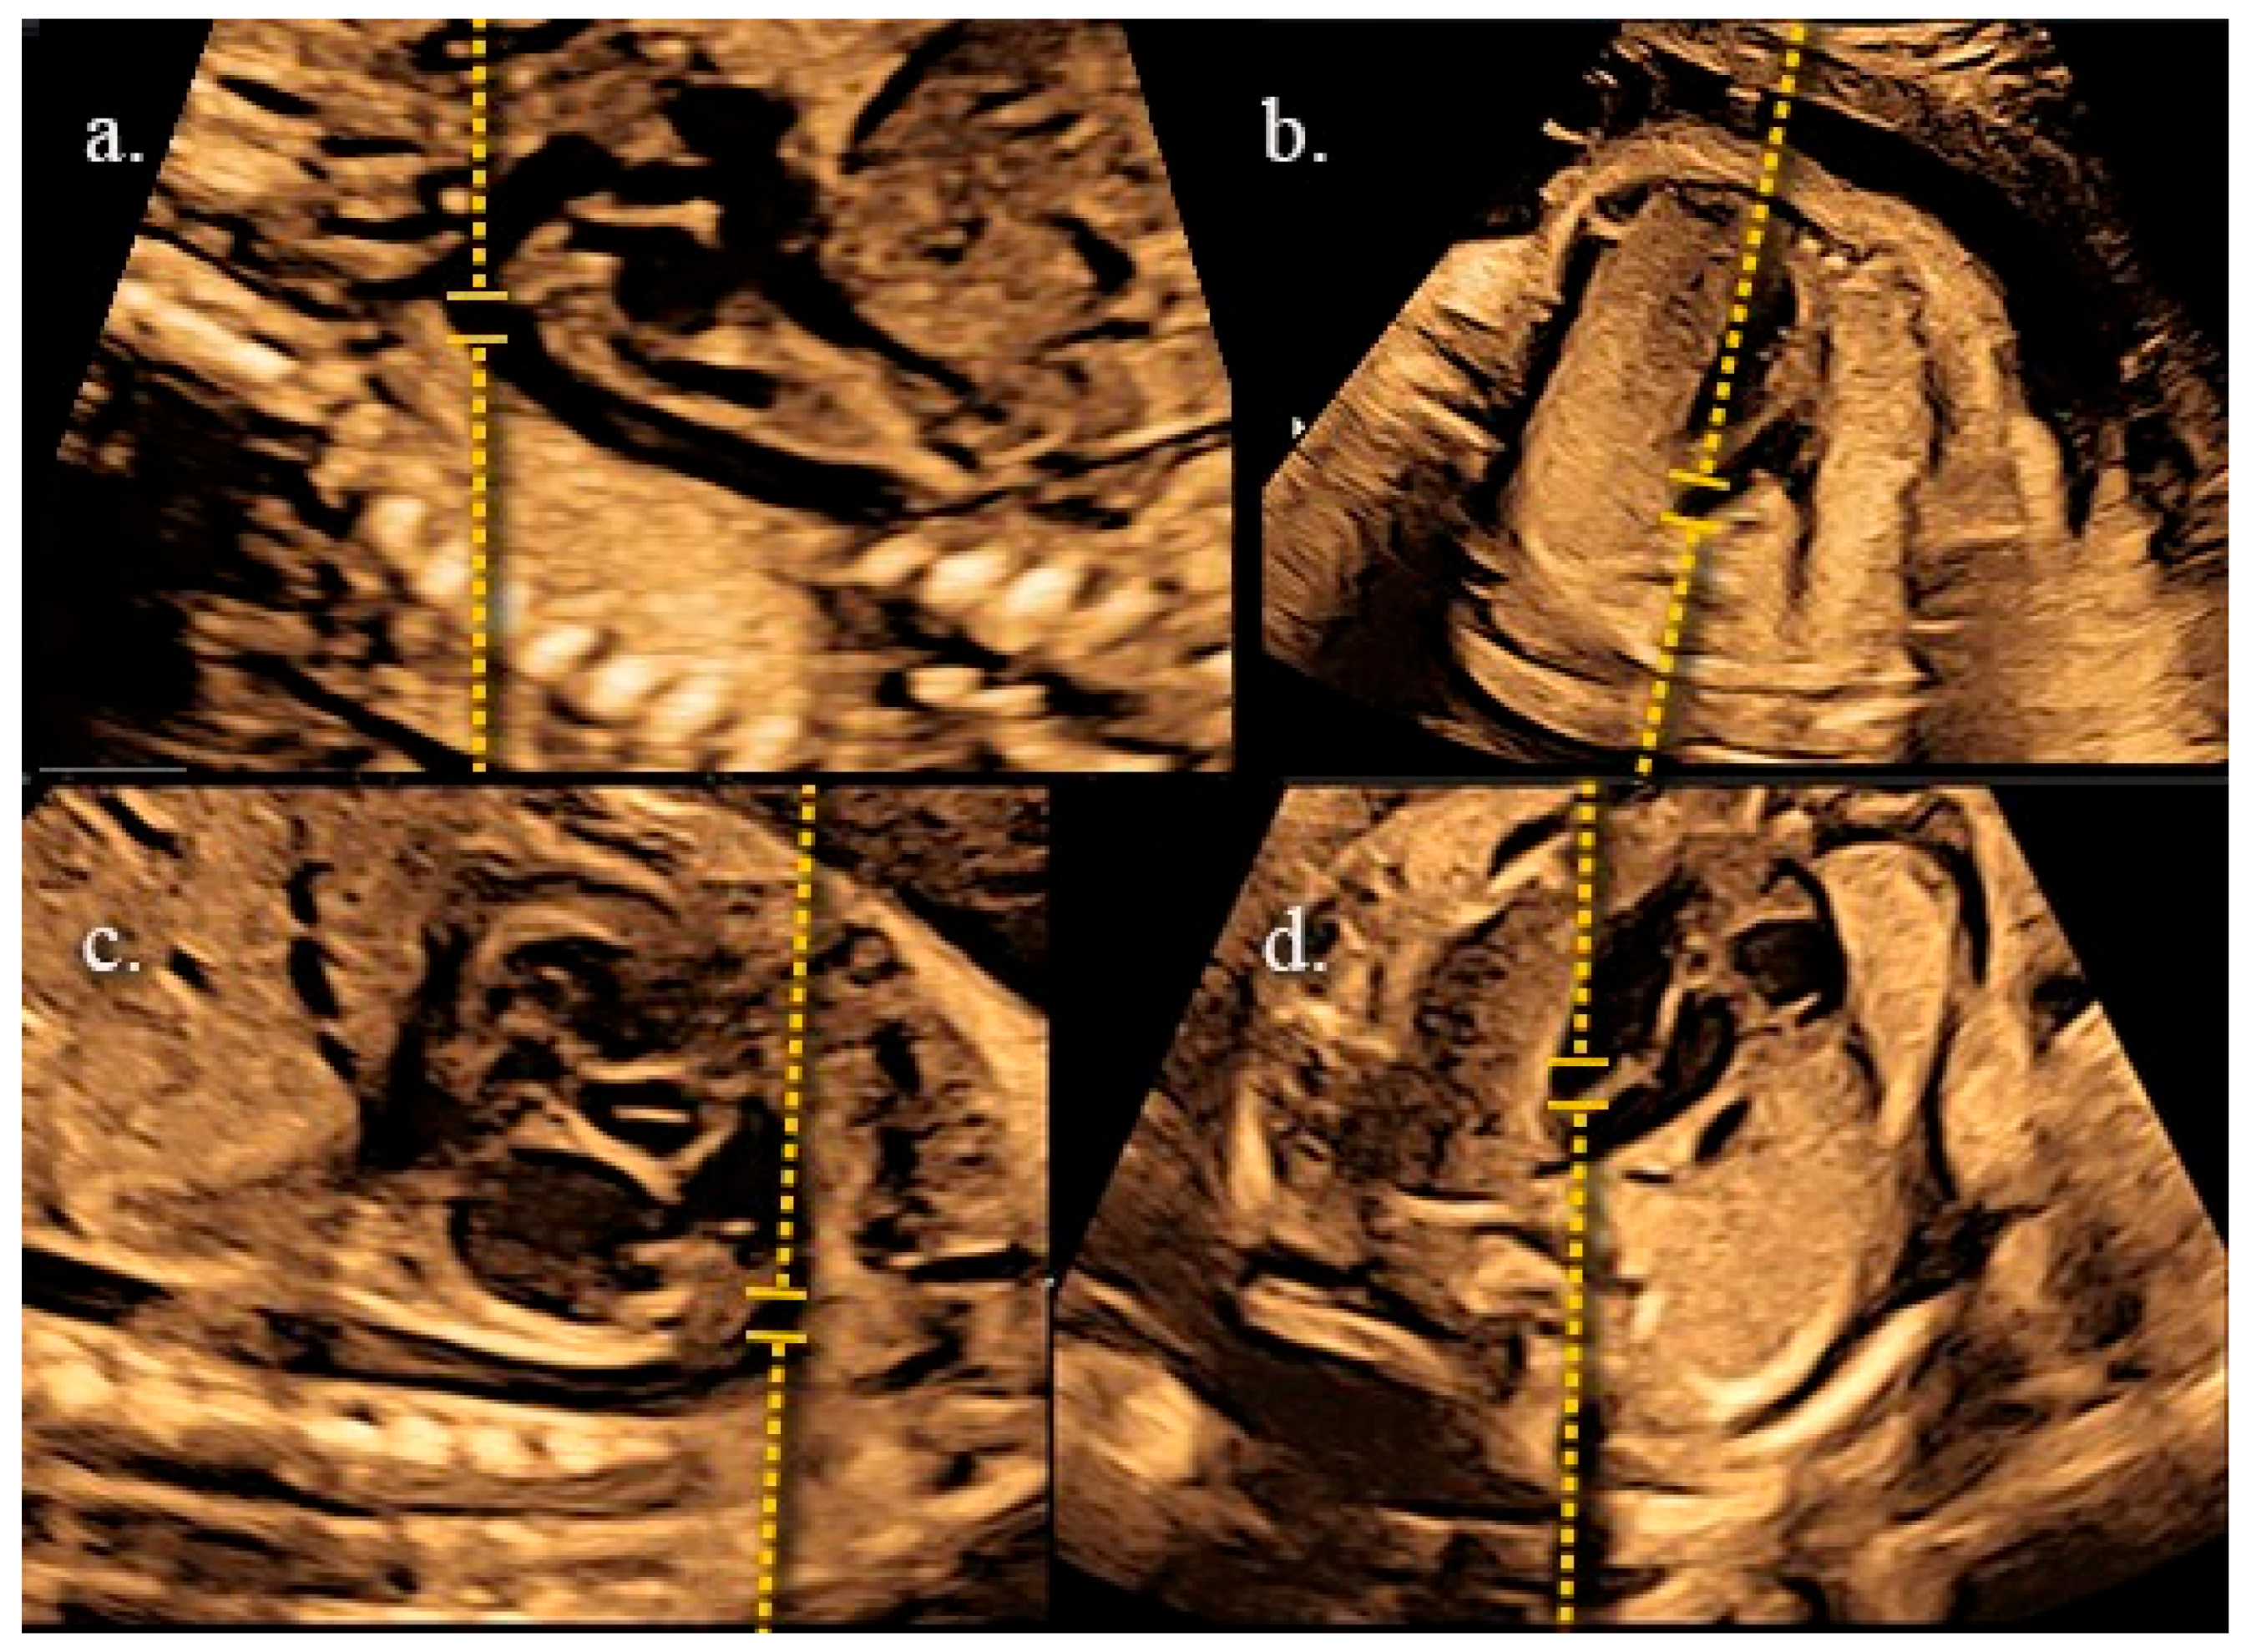
The aortic isthmus can be imaged in two different planes (Figure 18 and Figure 19). The traditional view of the aortic arch is a longitudinal plane showing the aortic arch and the three major branches arising from it: the brachiocephalic trunk, left common carotid artery, and left subclavian artery. The pulsed Doppler gate should be placed just beyond the origin of the left subclavian artery. The alternative view is the cross-sectional three-vessel and trachea view; in this case, the Doppler gate should be placed just before the point of convergence of the aortic isthmus into the ductus arteriosus [33].
To obtain adequate views of the ductal arch, aortic arch and relevant vessels, the application of color Doppler is recommended. Once the anatomical structures are clearly identified, pulsed-wave Doppler should be applied and velocity waveforms recorded, possibly during fetal quiescence [34].
The insonation angle should be kept as close as possible to 0° and always less than 30° [35]. The gate size should be modified accordingly to the aortic isthmus or ductus arteriosus diameters variation by gestational age to avoid recording signals from adjacent vessels [35].
Doppler velocity waveforms of the ductus arteriosus can be obtained in the three vessels and trachea view [36], placing the sample at the midpoint between the origin of the left pulmonary artery and the first tract of the descending aorta [37].
Doppler velocity waveforms of the aortic isthmus can be obtained in the three vessels and trachea view, placing the sample along the aortic arch close to the convergence of the aortic isthmus and the arterial duct in the characteristic V-shape [38].
The color Doppler maximal velocity setting should be adjusted to demonstrate high velocities, ensuring that the blood flow in the great vessels is homogeneous in color and shows no aliasing. The high-pass filter should be set at 50 Hz, and energy output levels should be lower than 50 mW/cm2 [35].

5. Fetal Cardiac Contractility Evaluation

5.1. Stroke Volume, Ejection Fraction, Shortening Fraction and Fractional Area Change (SV, EF, SF, FAC)

5.1.1. General Introduction

Motion mode (M-Mode) technique or Simpson’s planimetry (discussed later) can be applied to two-dimensional images to explore stroke volume and ejection fraction. The alternative is to apply the spatio-temporal image construction motion mode (STIC M-mode) technique to obtain the same information from STIC 3D volumes. Shortening fraction is estimated by M-Mode applied to 2D images or STIC M-Mode to 3D volumes. Fractional area change is assessed in 2D imaging.

5.1.2. Two-Dimensional Brightness Mode (B-Mode) and Motion Mode (M-Mode) SV, EF and FAC

Stroke volume (SV) can be assessed as the difference between the end-diastolic and the end-systolic ventricular volume [39].
Cardiac output is estimated as stroke volume multiplied by fetal heart rate [39].
Ejection fraction (EF) can be calculated as the ratio between stroke volume and the end-diastolic volume [39]. (Table 1).
To estimate stroke volume the ventricular volume at two different times during the cardiac cycle, at the end of diastole and at the end of systole, should be assessed.
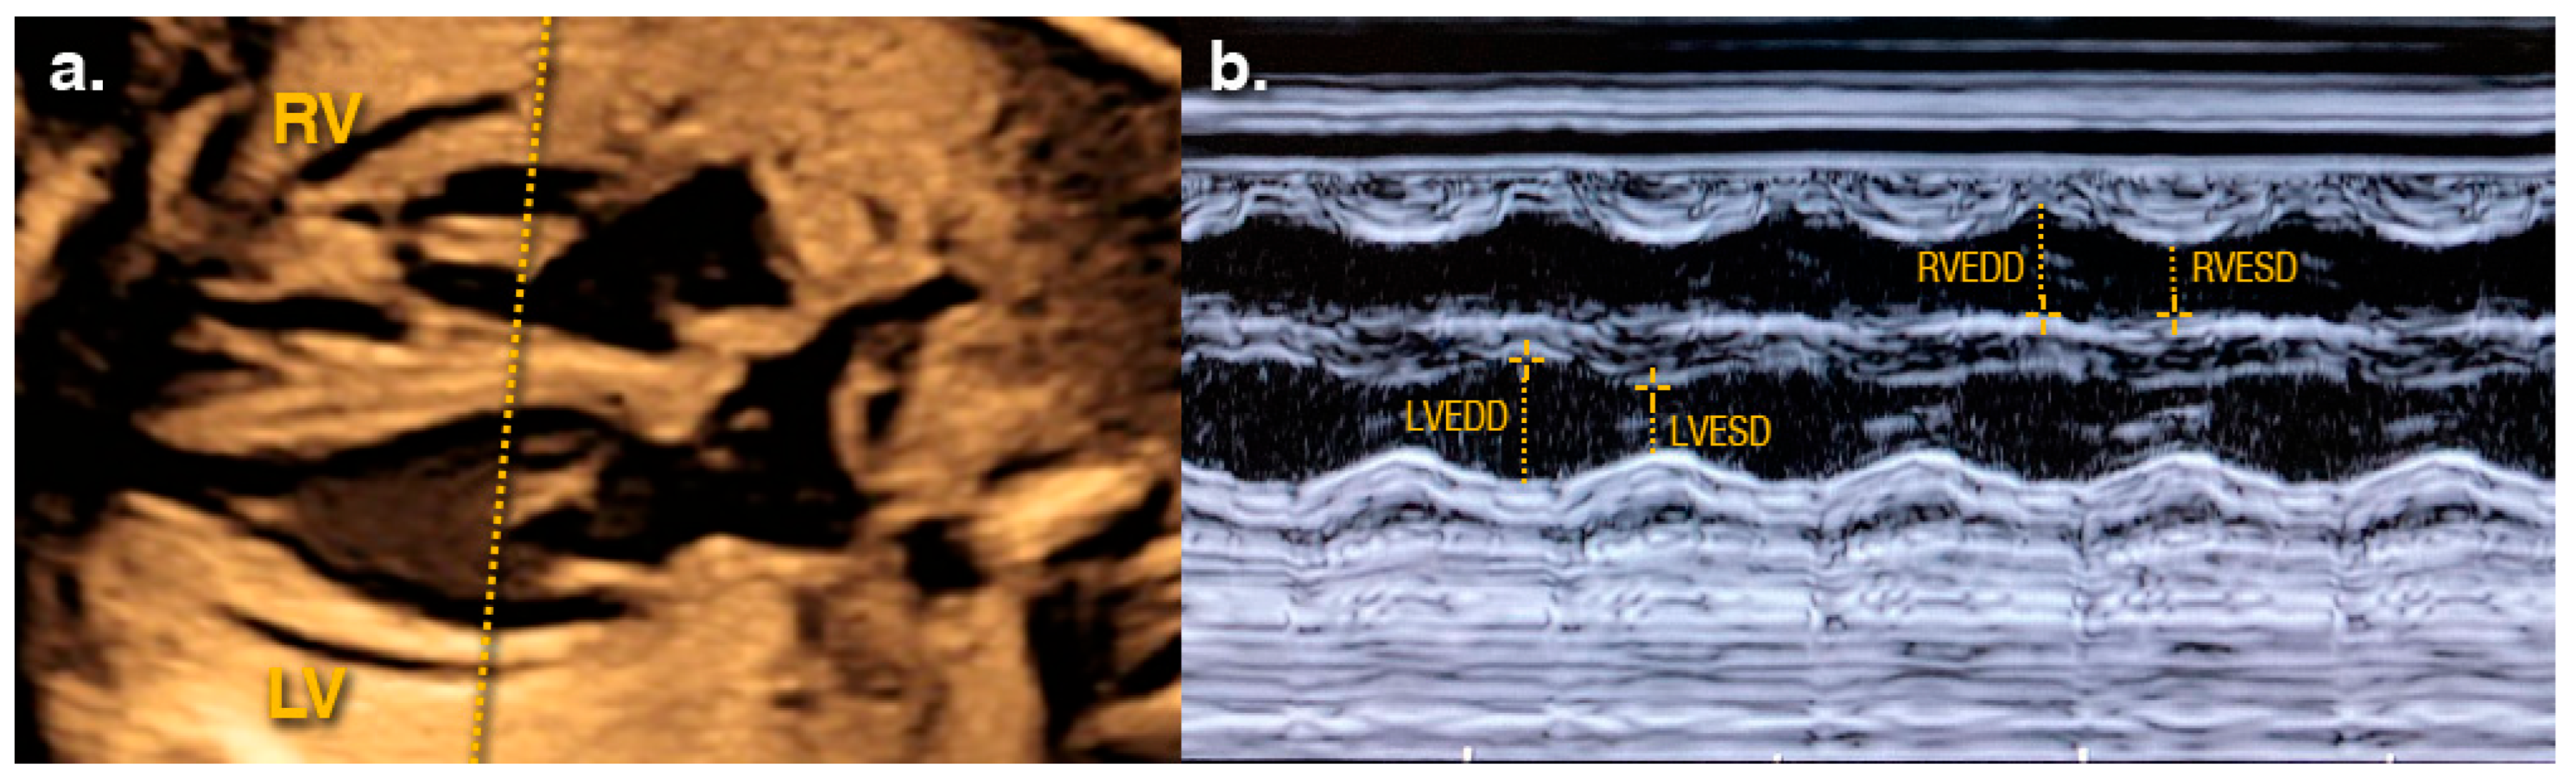
Both volumes can be calculated using formulae based on M-Mode measurements of the ventricular diameters. Ventricular diameters can be obtained by positioning the M-Mode cursor perpendicular to the interventricular septum, just below the atrioventricular valves (Figure 20) [39]. Once diameters are obtained, ventricular volumes can be calculated using either Dodge’s or Teichholz’s formulae [40,41]. These formulae are based on the assumptions of an ellipsoid shape of the ventricle and a fixed relationship between ventricular length and width.
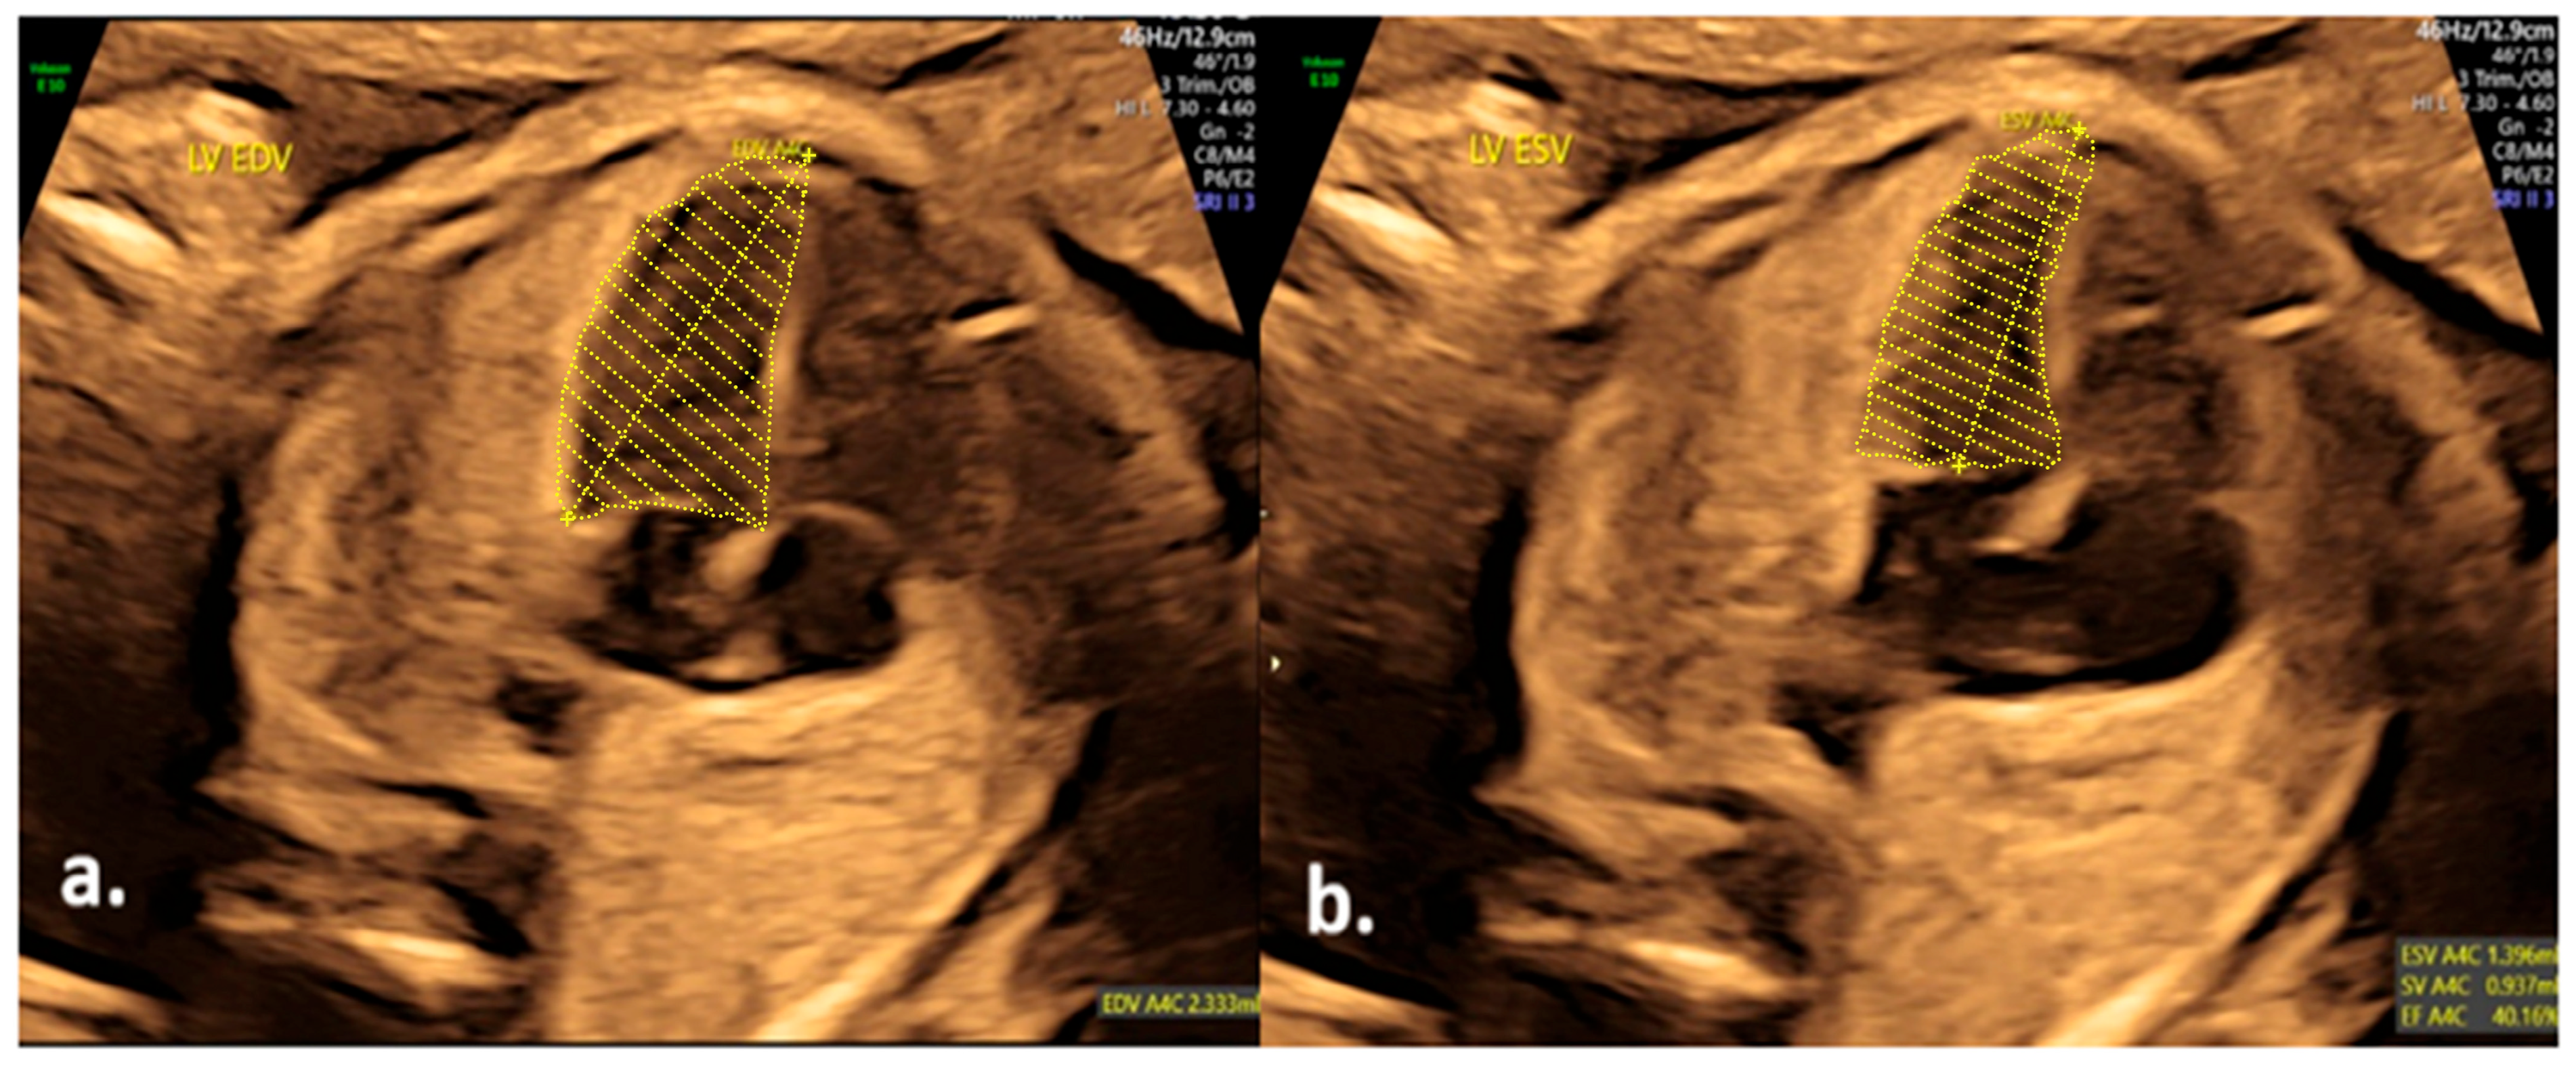
The alternative to M-Mode is the assessment of ventricular volumes in 2D imaging. Simpson’s biplane method is the most used two-dimensional method for estimating end-diastolic and end-systolic left ventricular volumes [42]. It is less dependent on the ventricle’s geometry than the M-Mode method [39]. Simpson’s biplane method was originally a postnatal technique later translated into fetal echocardiography. It does not rely on the fixed relationship between ventricular width and length anymore [43].
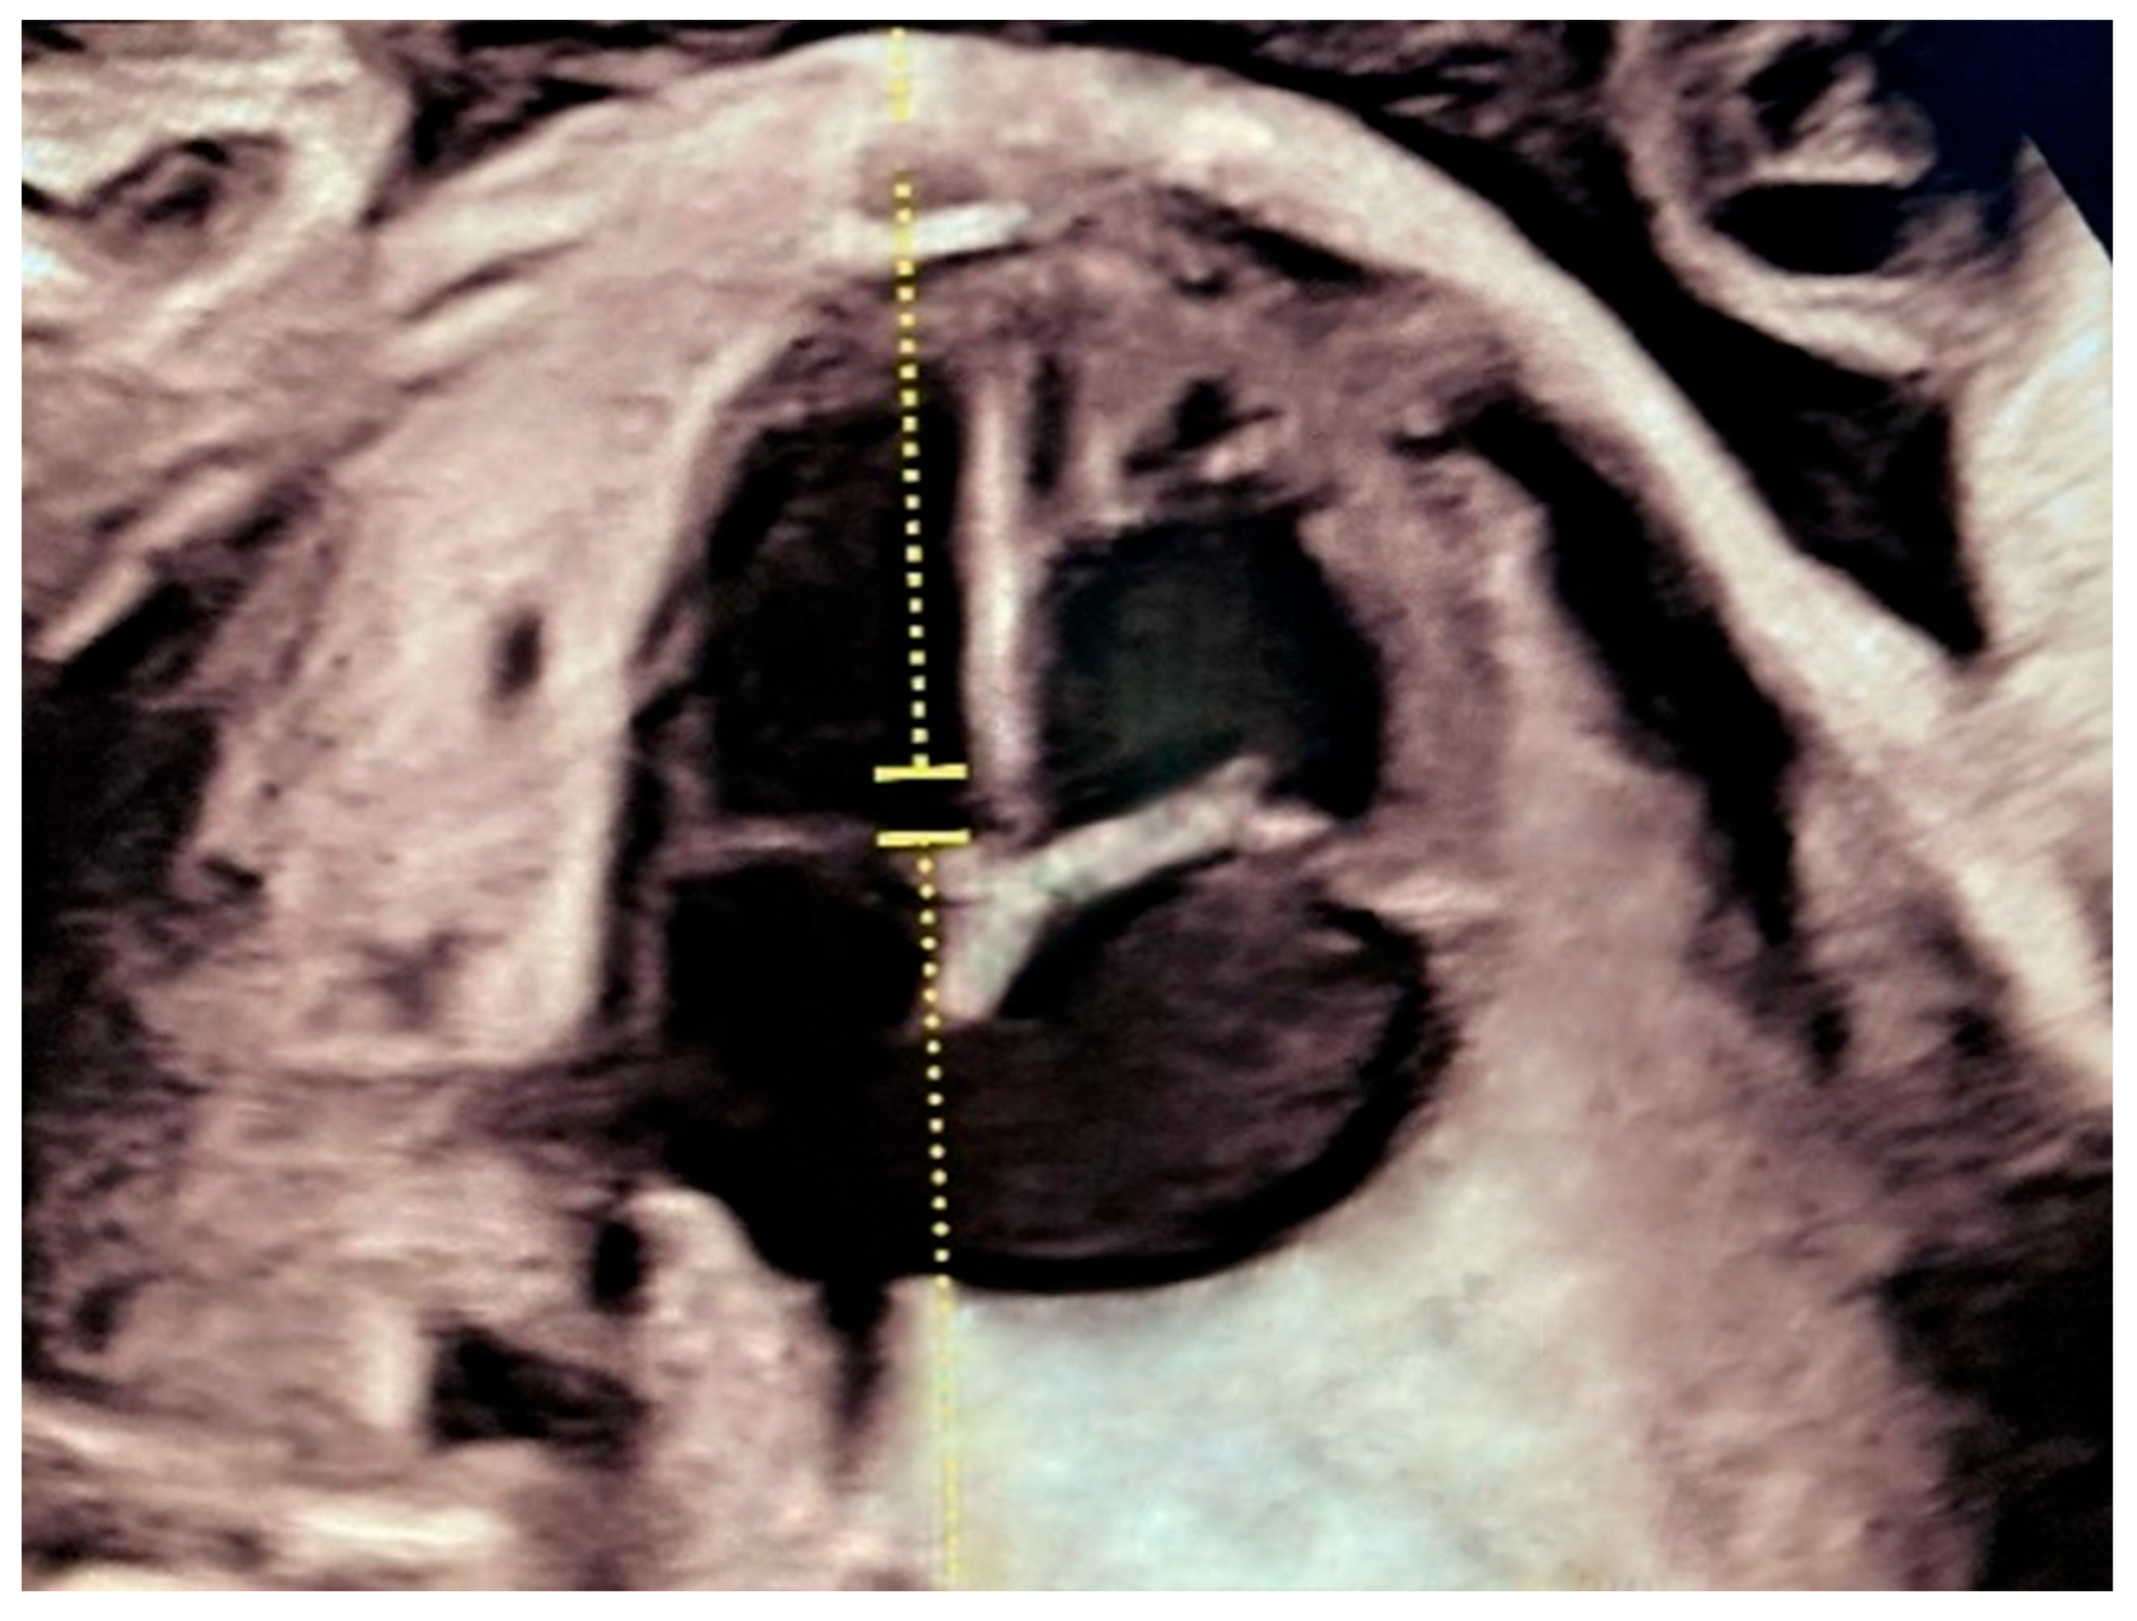
Simpson’s biplane method involves tracing the endocardium in both the apical four-chamber view and the apical two-chamber view in diastole and systole (Figure 21). The term biplane refers to the fact that measurements must be taken in two different perpendicular 2D B-mode imaging planes in postnatal echocardiography.
Estimation of ventricular volumes may be automated. The operator needs to identify a high-quality four-chamber view in diastole and systole. In each image, the entire endocardium should be traced (Figure 21). The ultrasound system then divides the area into several equal disks. The volume of each disk is subsequently calculated based on its diameter and height. The final ventricular volume is obtained by summing all individual disk volumes [28,44].
The technique’s limitations are its dependence on good resolution of the endocardial border and its geometric assumptions about the ventricular shape [28]. The method’s assumption of an ellipsoid form of the ventricle restricts the application to the left ventricle only. The complex geometric shape of the right ventricle impedes the technique’s application to the right side of the heart [39]. Therefore, the application of other echocardiographic parameters to assess the most challenging right ventricle [45].
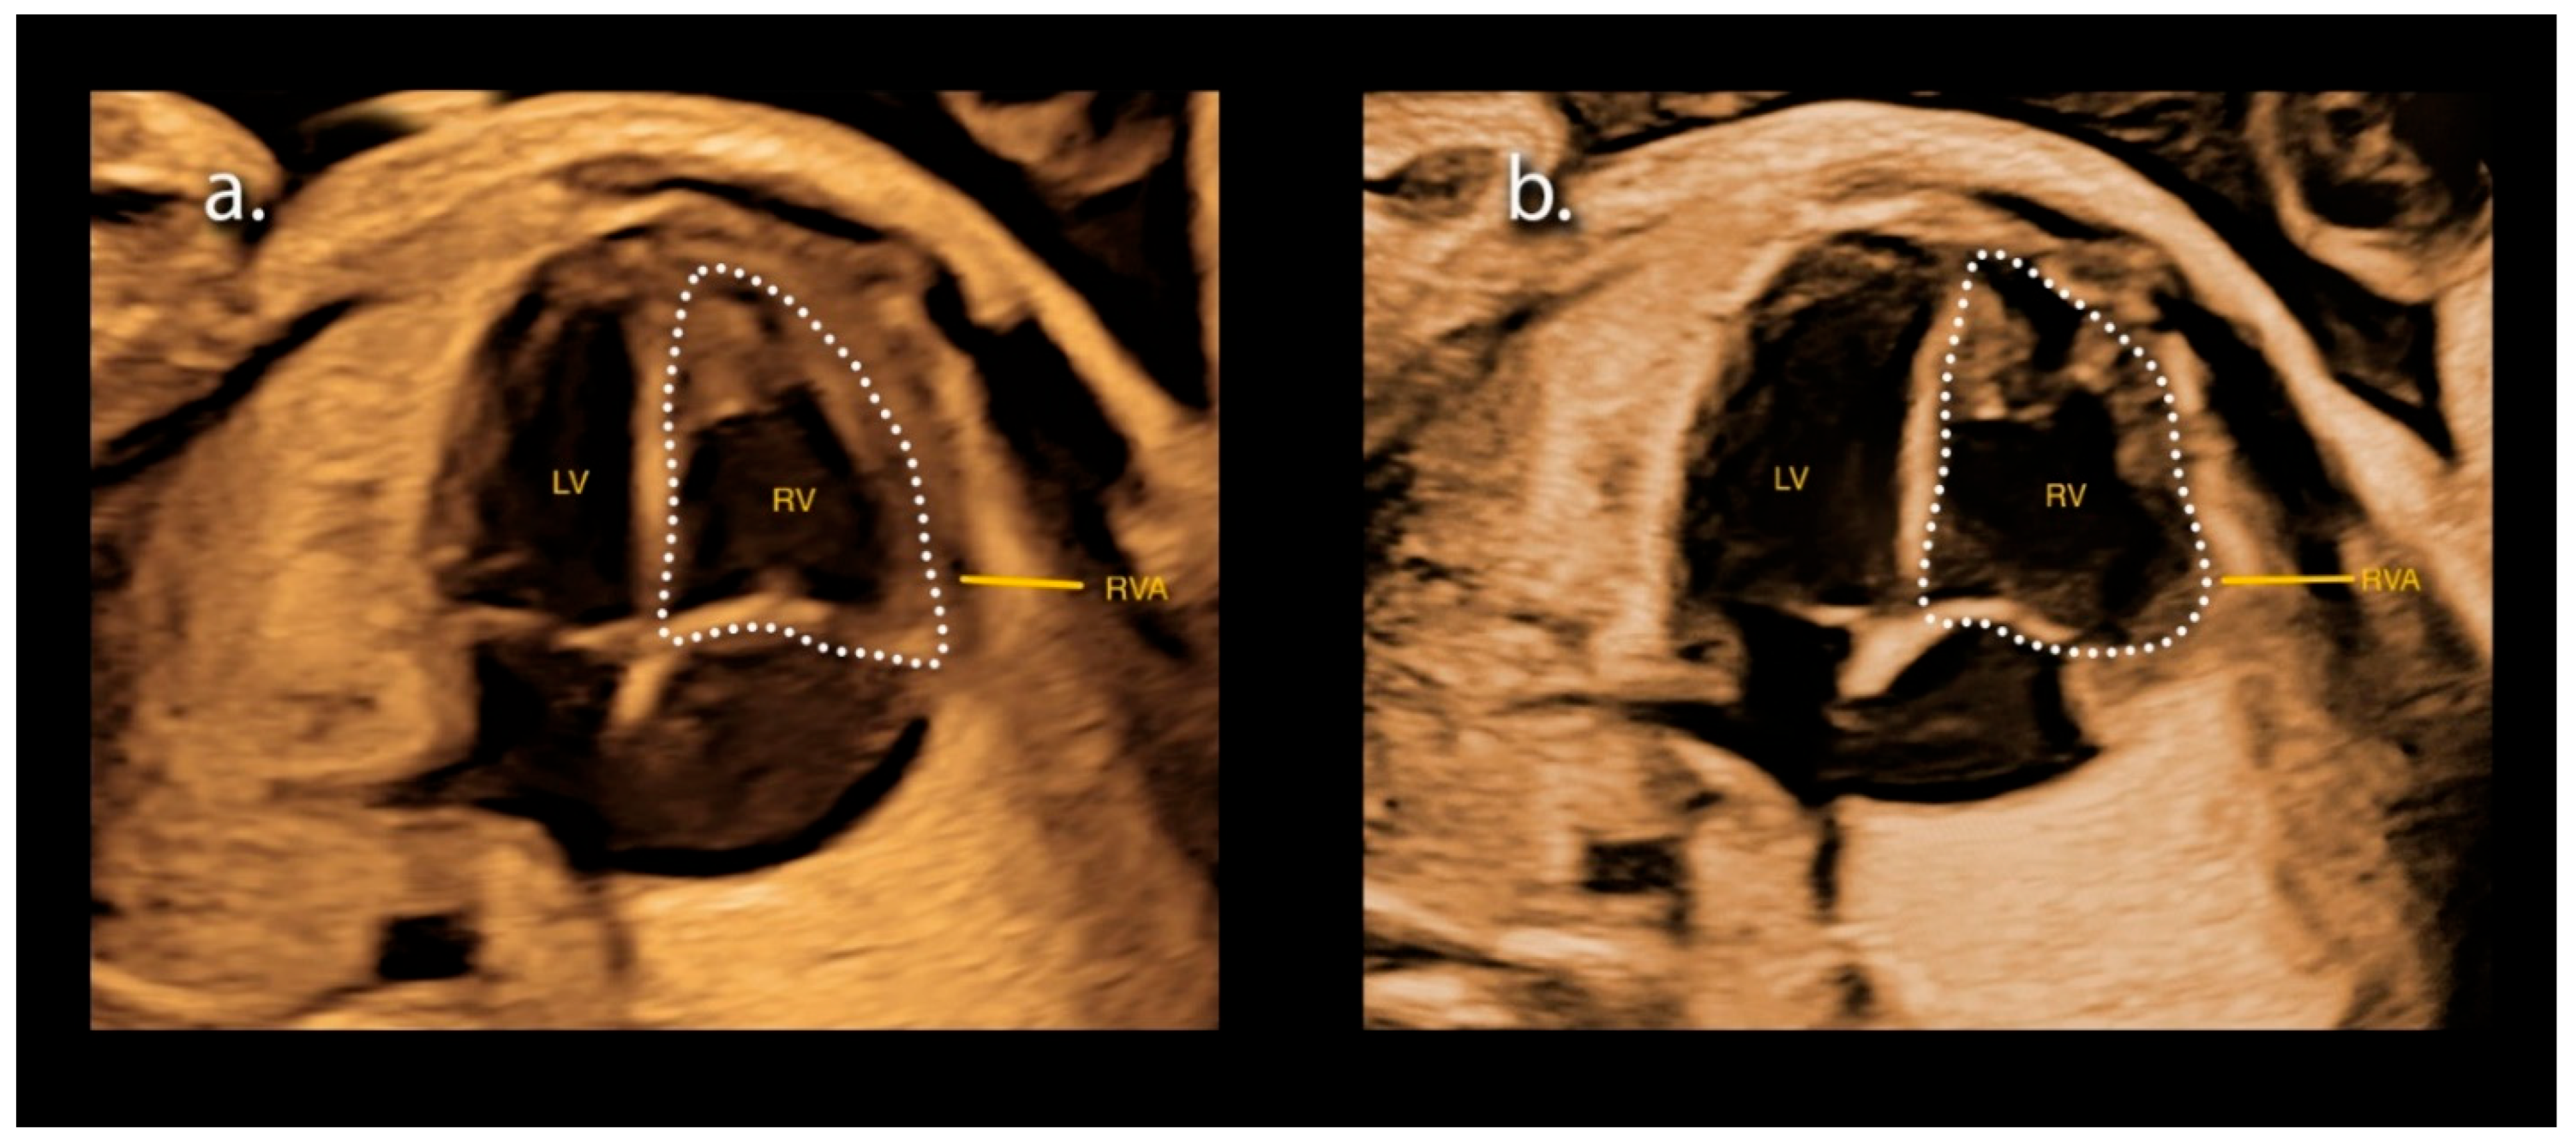
Fractional change area (FAC) is very useful when evaluating the right ventricle because the parameter is less dependent on the complexity of the ventricular shape [45]. Right ventricular fractional area change is a two-dimensional echocardiographic measurement of right ventricular function [46]. It illustrates the modification in the RV cavity area from diastole to systole in the four-chamber view [47].
Fractional change area is estimated from 2D cine-loops of the cardiac cycle. A 2D image of an apical or basal four-chamber view at the end-systole and end-diastole is identified. Ventricular areas are traced at both time points of the cardiac cycle. Tracing of the areas is carried out along the limit between the endocardium and myocardium, including the endocardium, muscular trabeculation and valve annulus into the ventricular area (Figure 22).

5.1.3. Two-Dimensional Motion Mode (M-Mode) Shortening Fraction

Shortening fraction (SF) can be calculated as the difference between the end-diastolic ventricular diameter and the end-systolic ventricular diameter, divided by the end-diastolic ventricular diameter [39].
Motion mode (M-mode) echocardiography can be applied to estimate the shortening fraction of both ventricles. The M-mode cursor should be placed perpendicular to the ventricular septal plane (Figure 20). The dimensions of the right and left ventricular cavities at the end-diastole and end-systole can be measured and entered into the formula to calculate the shortening fraction of both ventricles (Table 1) [28].

5.1.4. Spatio-Temporal Image Correlation Motion Mode (STIC M-Mode) SV, EF, SF

General
Three-dimensional (3D) echocardiography can calculate right and left ventricular volumes, as well as ejection and shortening fractions. STIC image acquisition is a significant technique for acquiring 3D data. It involves a sweep of ultrasound beam through the region of interest. The operator establishes the size of the acquired region of interest, the acquisition angle and the acquisition time. After acquisition, data are elaborated through the STIC algorithm, offering the visualization of a single cardiac cycle of 3D data [28]. Data can then be explored as transverse section slices or as a 3D-rendered image.
Volume Acquisition, Region of Interest, Acquisition Angle and Time
The fetal heart is scanned using the Spatio-Temporal Image Correlation mode. Volume acquisition is performed during fetal and maternal quiescence and apnea [48].
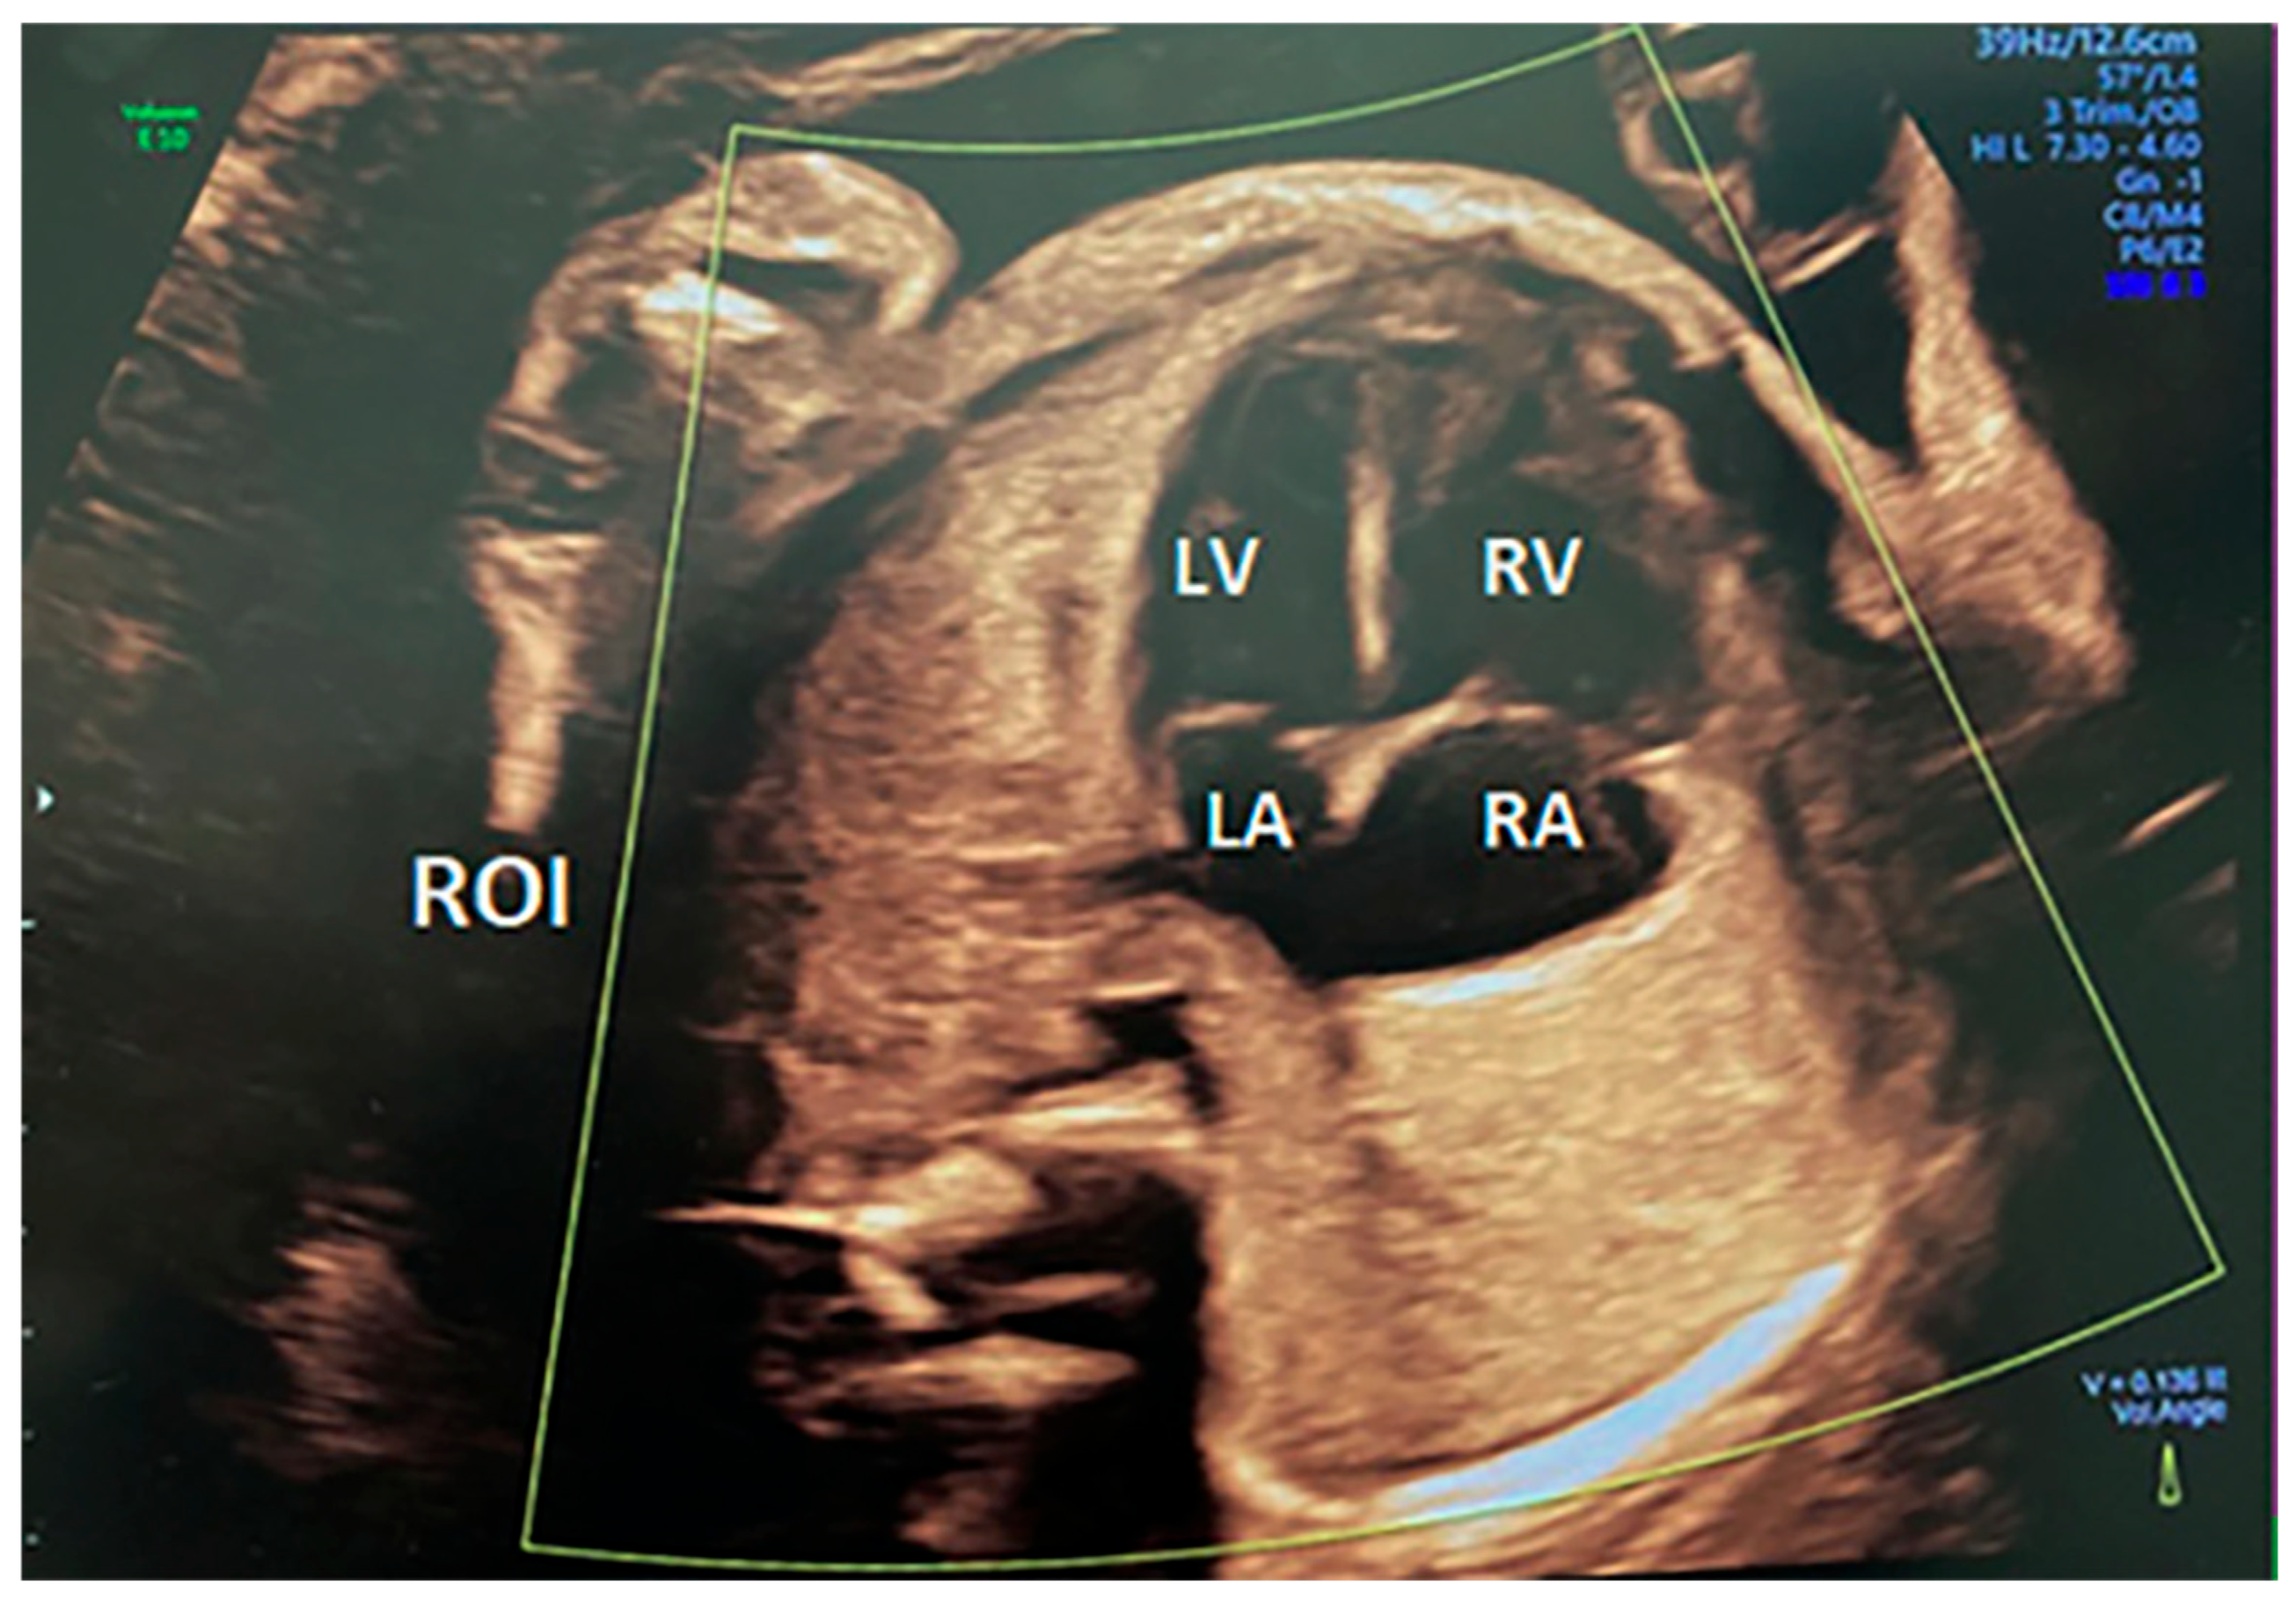
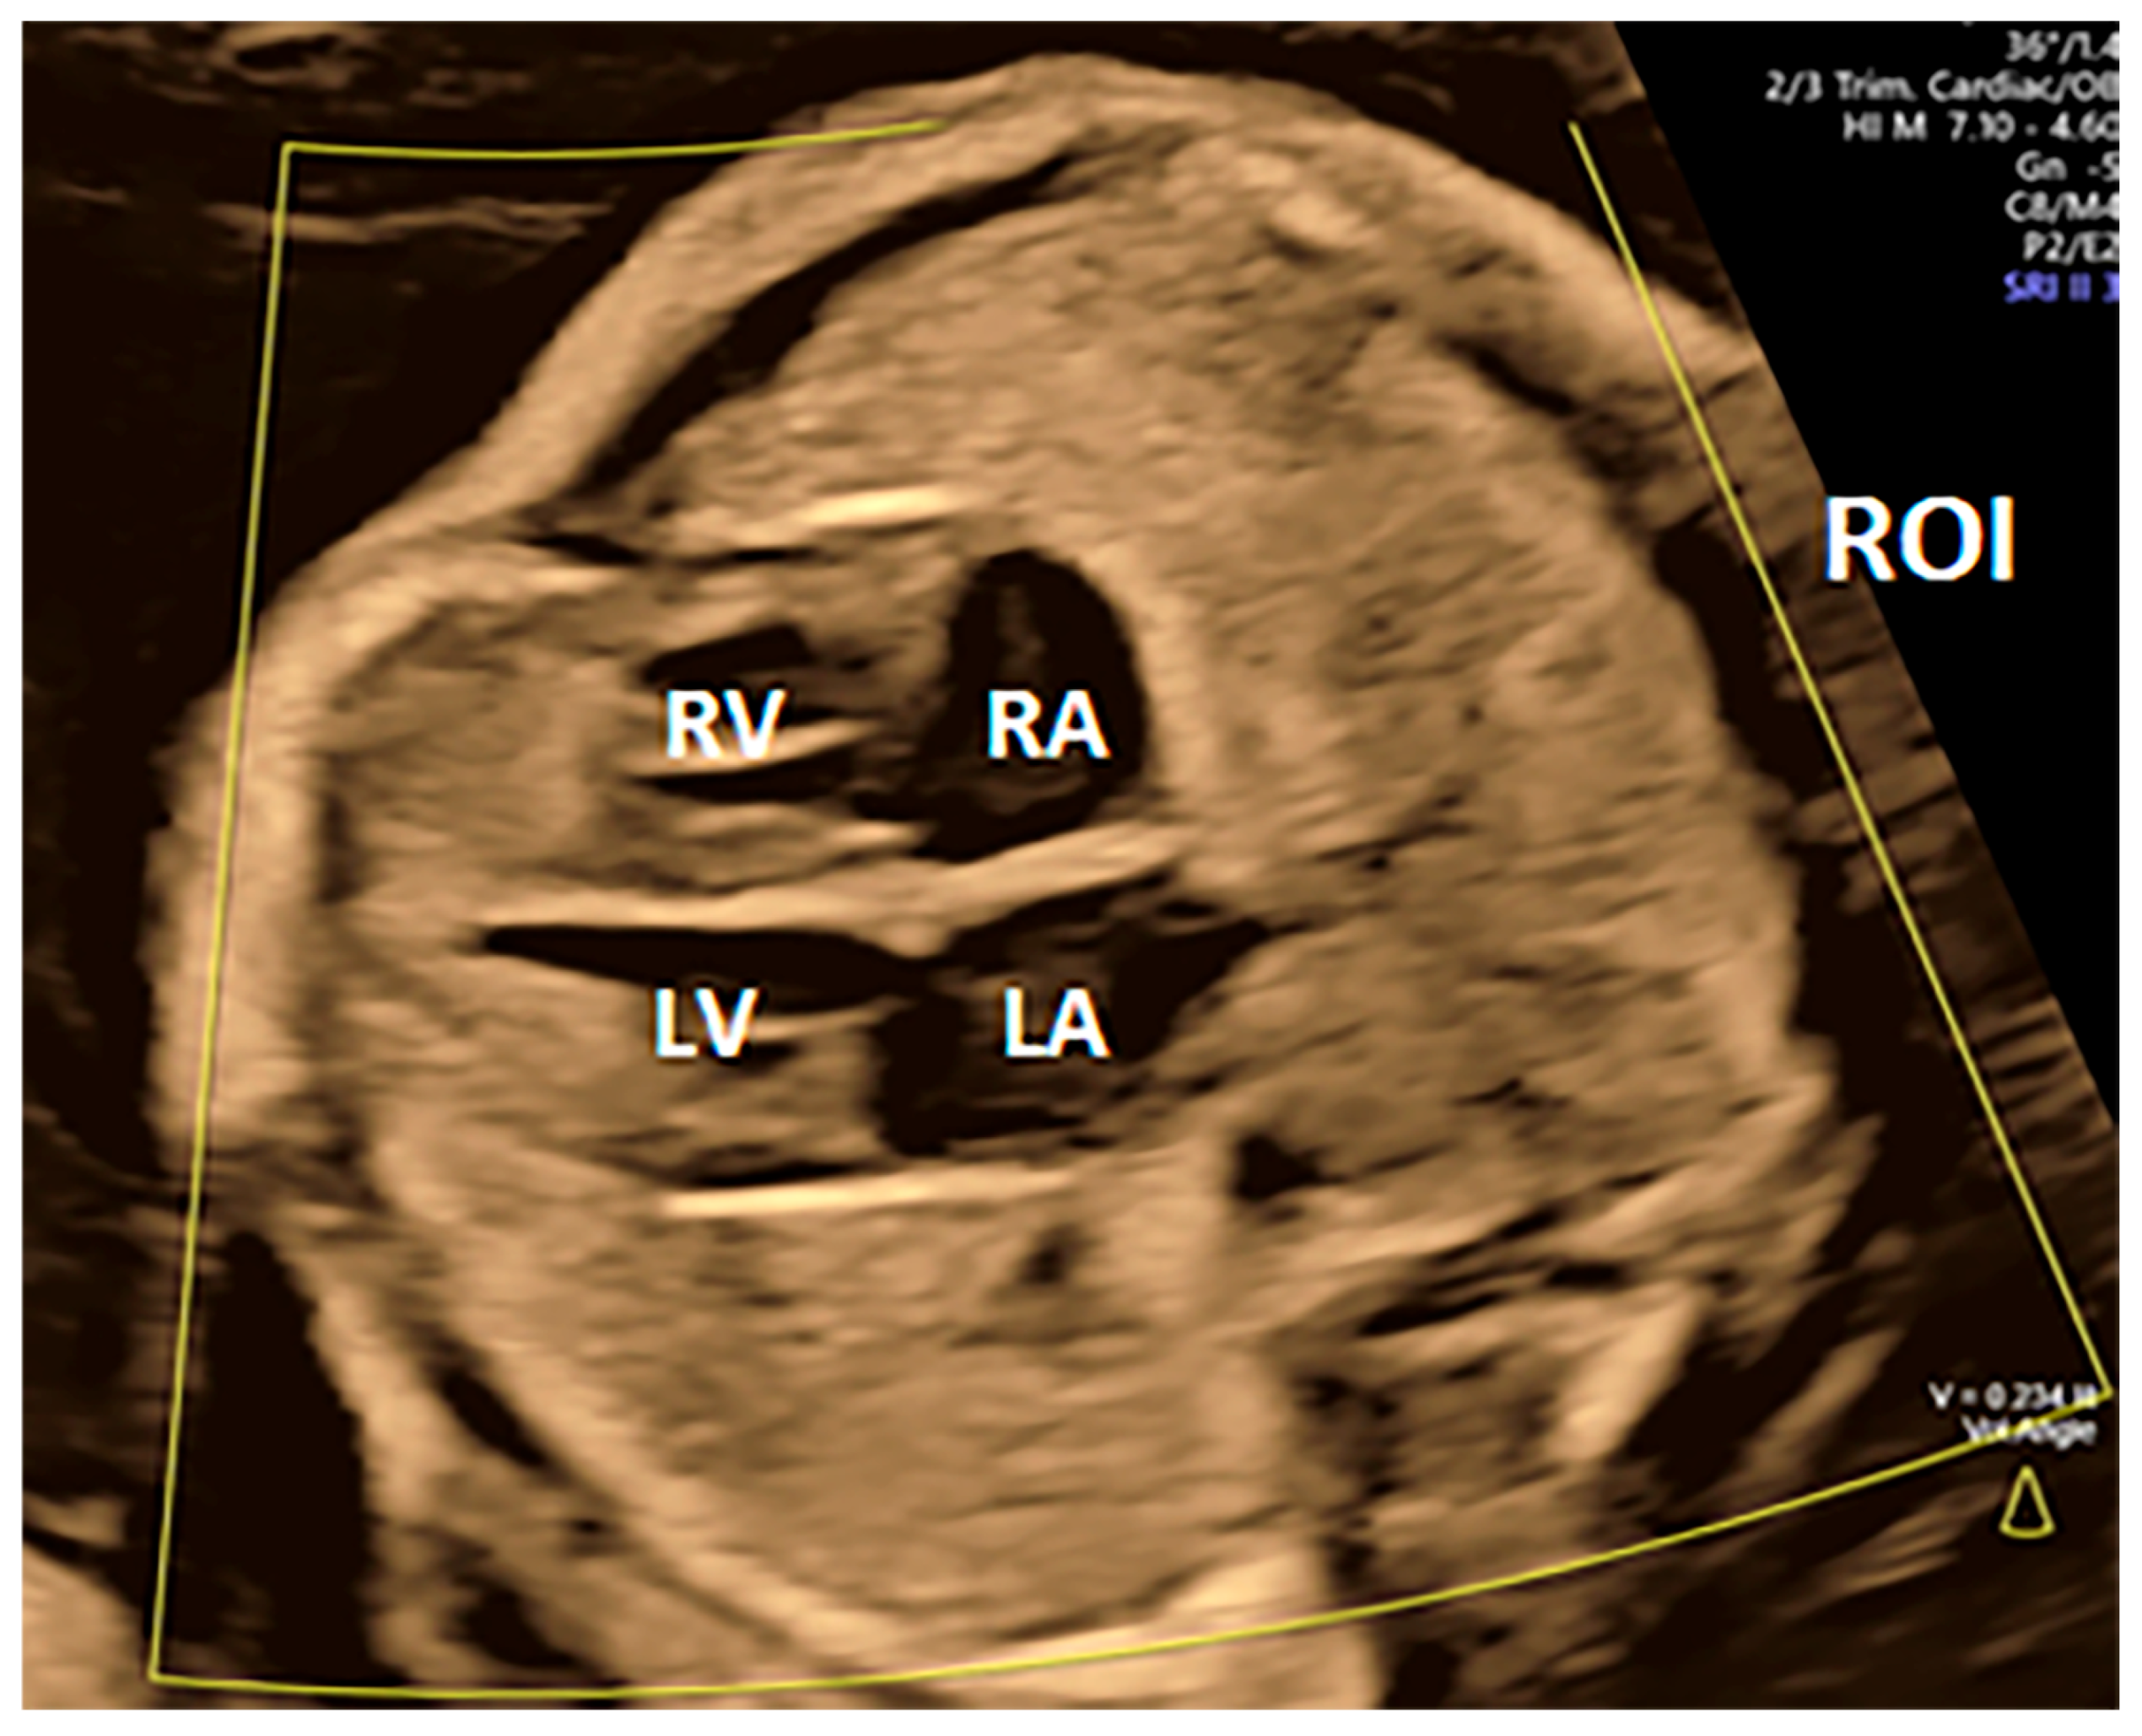
The region of interest (ROI) defines the width and height of the volume dataset in the x- and y-planes. The region of interest dimensions can vary based on the scope the operator needs to achieve. A larger ROI is useful when all structures surrounding the heart need to be assessed and indeed included. However, using a wide ROI decreases the frame rate, affecting the quality of the volume dataset, particularly when color or power Doppler is applied. Conversely, selecting a narrower ROI optimizes the frame rate and enhances temporal resolution, but it reduces the acquisition area [49].
The acquisition angle modifies the depth of the acquisition and, therefore, the amount of information acquired in the z-plane. A different acquisition angle can be applied depending on the gestational age, varying between 15 and 40 degrees [50]. During the second and third trimesters, acquisition angles of 20° and 25° are typically wide enough to encompass the heart, great vessels, and stomach. For fetuses at later gestations, acquisition angles between 35° and 40° may be necessary [49].
The acquisition time ranges from 7.5 to 15 s. It determines the speed at which the transducer sweeps the region of interest. Increasing the acquisition time enhances spatial resolution of the volume dataset. However, longer sweeps increase the probability of associated motion artifacts. Therefore, for active fetuses, the fastest possible acquisition time may be required [49].
Assessment of SV, EF, SF
To evaluate stroke volume and ejection fraction, an ideal apical fetal four-chamber view is obtained when the fetal spine is lying in a dorsal position (Figure 23). Only heart volumes without motion artifacts are suitable for further analysis. A clear visualization of the endocardial borders is necessary to proceed [48].
The optimal fetal position for acquiring the volume is when the fetus lies on its back, and the spine is positioned at 6 o’clock. However, appropriate volumes can also be obtained when the fetal spine is up, provided the acoustic shadowing of the spine does not limit the visualization of fetal structures [49].
STIC acquisition creates a volume set of the fetal heart through an entire cardiac cycle. This acquisition offers the opportunity to manipulate the volume both spatially and temporally. The volume successfully obtained is displayed in a multiplanar image format, demonstrating one cardiac cycle in the three orthogonal planes [50]. The user can explore the volume in any spatial direction or rotate the image along the x-, y- and z-axes. Furthermore, the volume dataset can be explored temporally. The user can determine different time points during the cardiac cycle, such as the end of systole and diastole, observing the opening and closure of the atrioventricular and semilunar valves [51].
In the post-processing phase, parameters such as left ventricular end-diastolic volume (LVEDV), left ventricular end-systolic volume (LVESV), stroke volume (SV) and ejection fraction (EF) can be determined. Stroke volume is calculated from the difference between LVEDV and LVESV, while ejection fraction is calculated as the ratio between stroke volume and LVEDV [48].
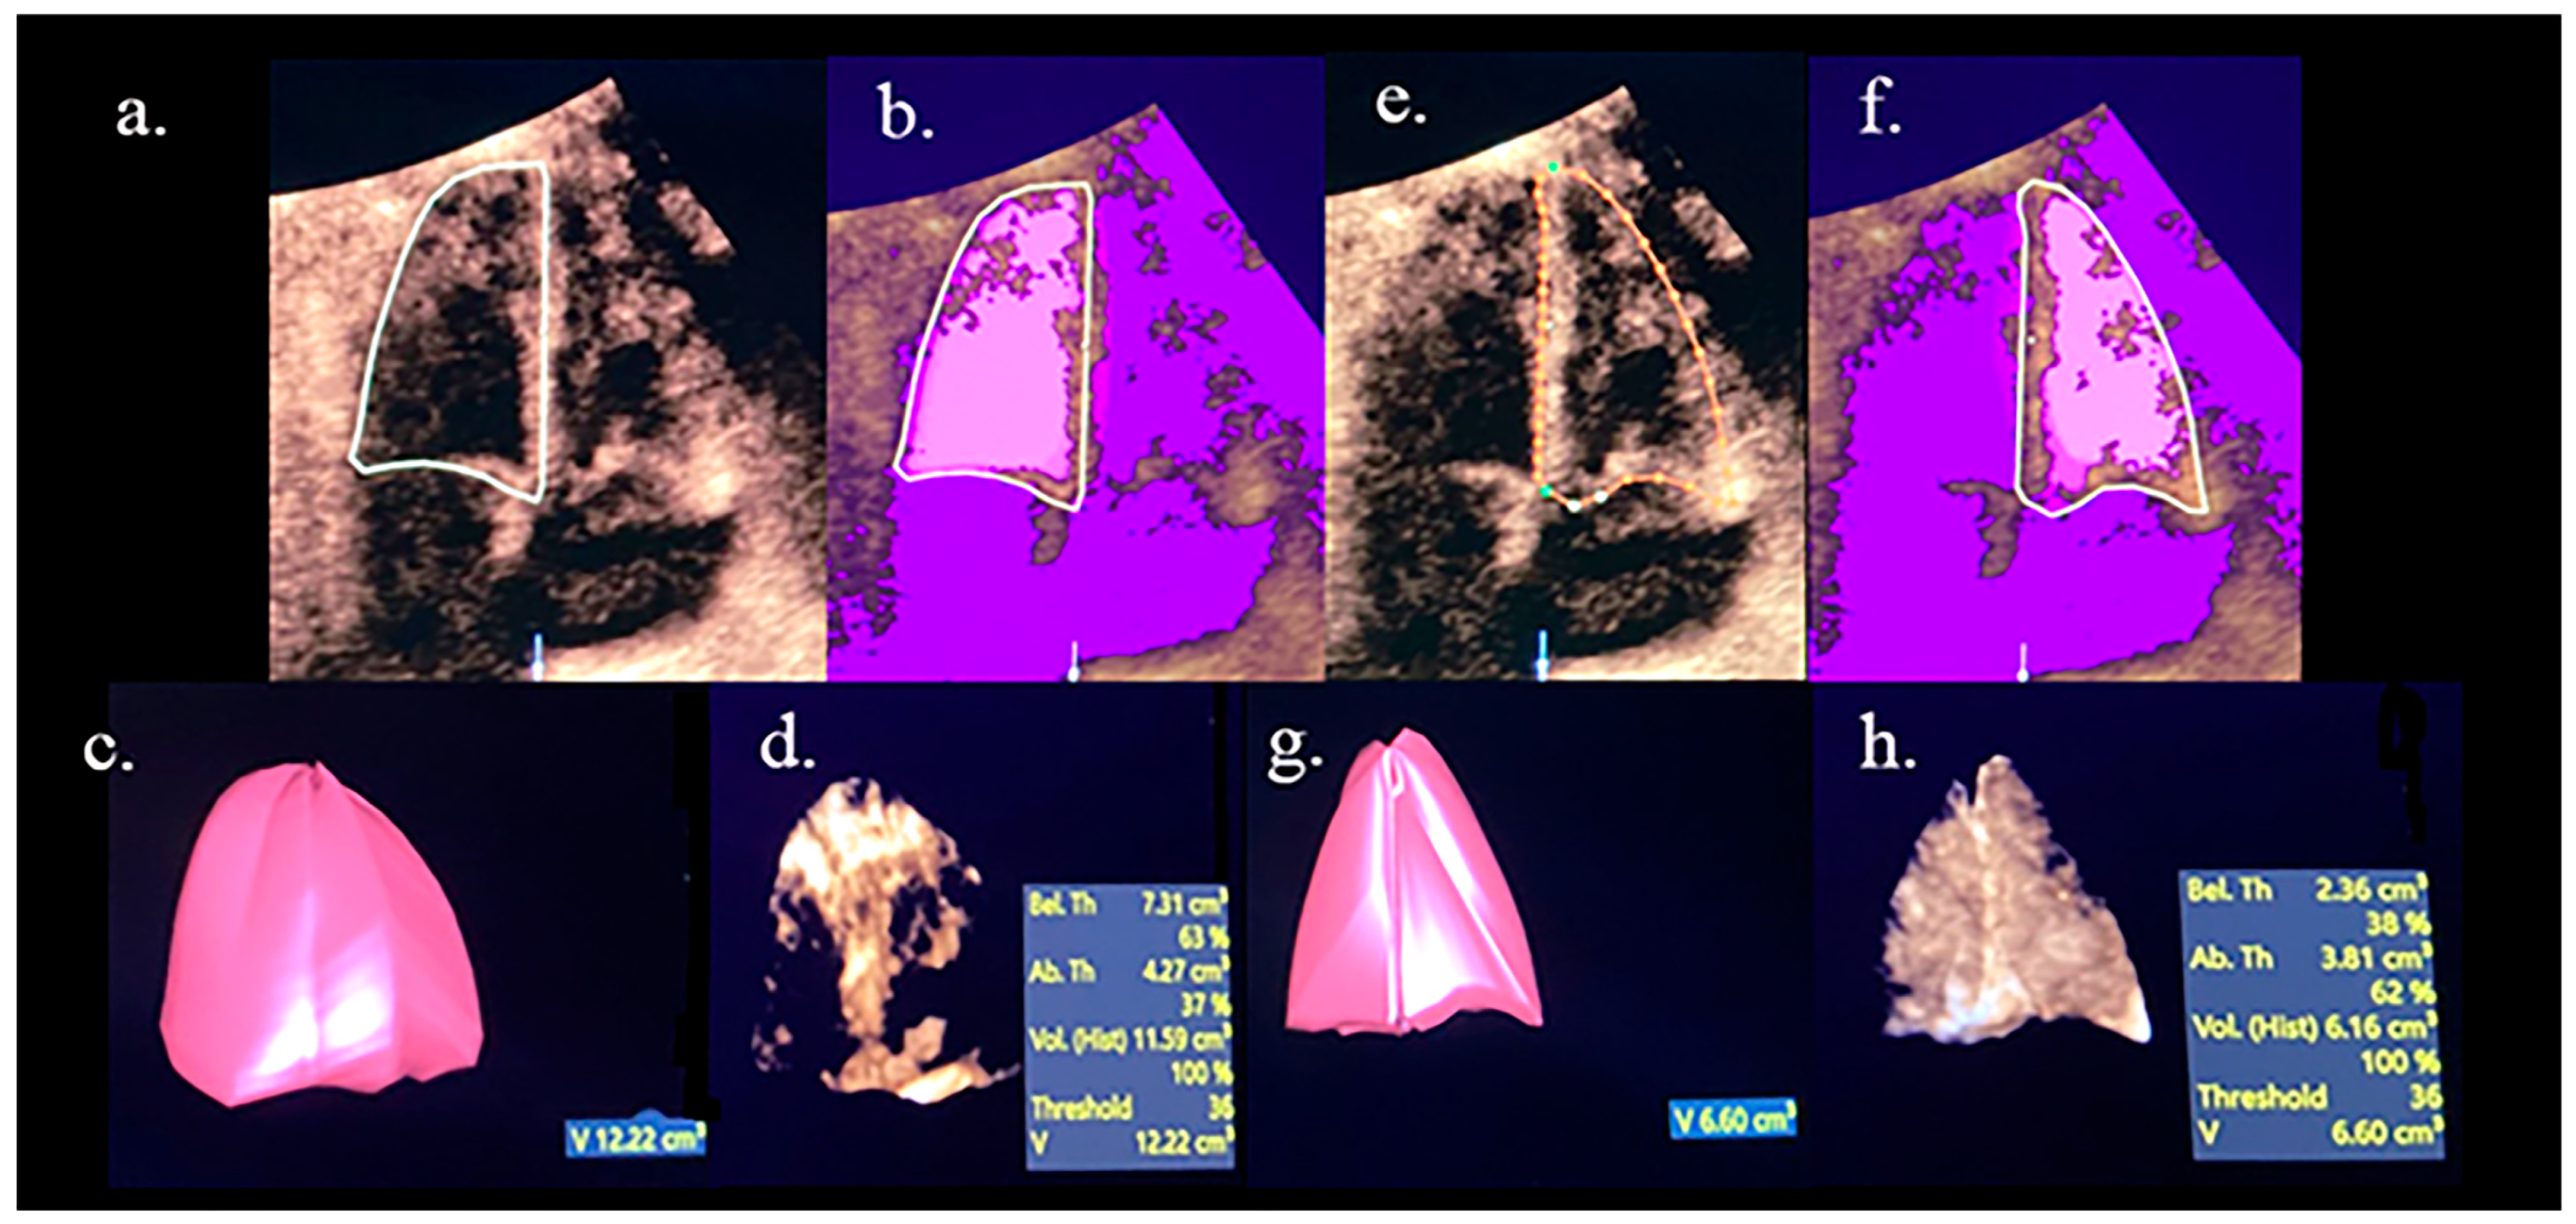
The post-processing techniques to acquire end-systolic and end-diastolic volumes for right and left ventricles require a combination of the application of STIC Virtual Organ Computer-aided Analysis (VOCAL) and Inversion mode [51]. Volume measurement begins with high-quality STIC acquisition.
Virtual Organ Computer-aided Analysis (VOCAL) mode may be used to reconstruct a virtual model of the ventricle. It is based on performing multiple measurements of the ventricular shape in different slices of the volume. The slices are visualized through a rotational movement of the volume. Once an angle of rotation is established, a consequent preset number of planes are available for measurement (for example, for a rotation angle of 15°, 12 planes are available for measurement) [51]. The dataset is rotated 180° about a fixed central axis through the preset number of rotational steps. In each plane, the VOCAL manual trace option of the ultrasound machine is applied, and the shape of the ventricle is manually drawn, including the myocardium. The system then reconstructs a silhouette model of the ventricle [51,52].
Inversion mode is a post-processing application capable of assessing tissue echogenicity and fluid-filled pixels in a volume and inverting their presentation [51]. The application of the inversion mode transforms anechoic structures into echogenic structures on the rendered image, as well as structures normally echogenic into anechoic [53,54,55]. The technique permits a superior demonstration of fluid-filled ventricular cavities and better segmentation than the standard technique alone.
The combination of VOCAL volume and inversion-mode thresholding allows identification of only the fluid-filled portion of the ventricle, creating a new intraventricular model (Figure 23 and Figure 24). The total and intraventricular volumes are measured and displayed. The process may be repeated for both right and left ventricles. Furthermore, the process can be repeated at different time points during the cardiac cycle, for example end-systole and end-diastole (Figure 24).
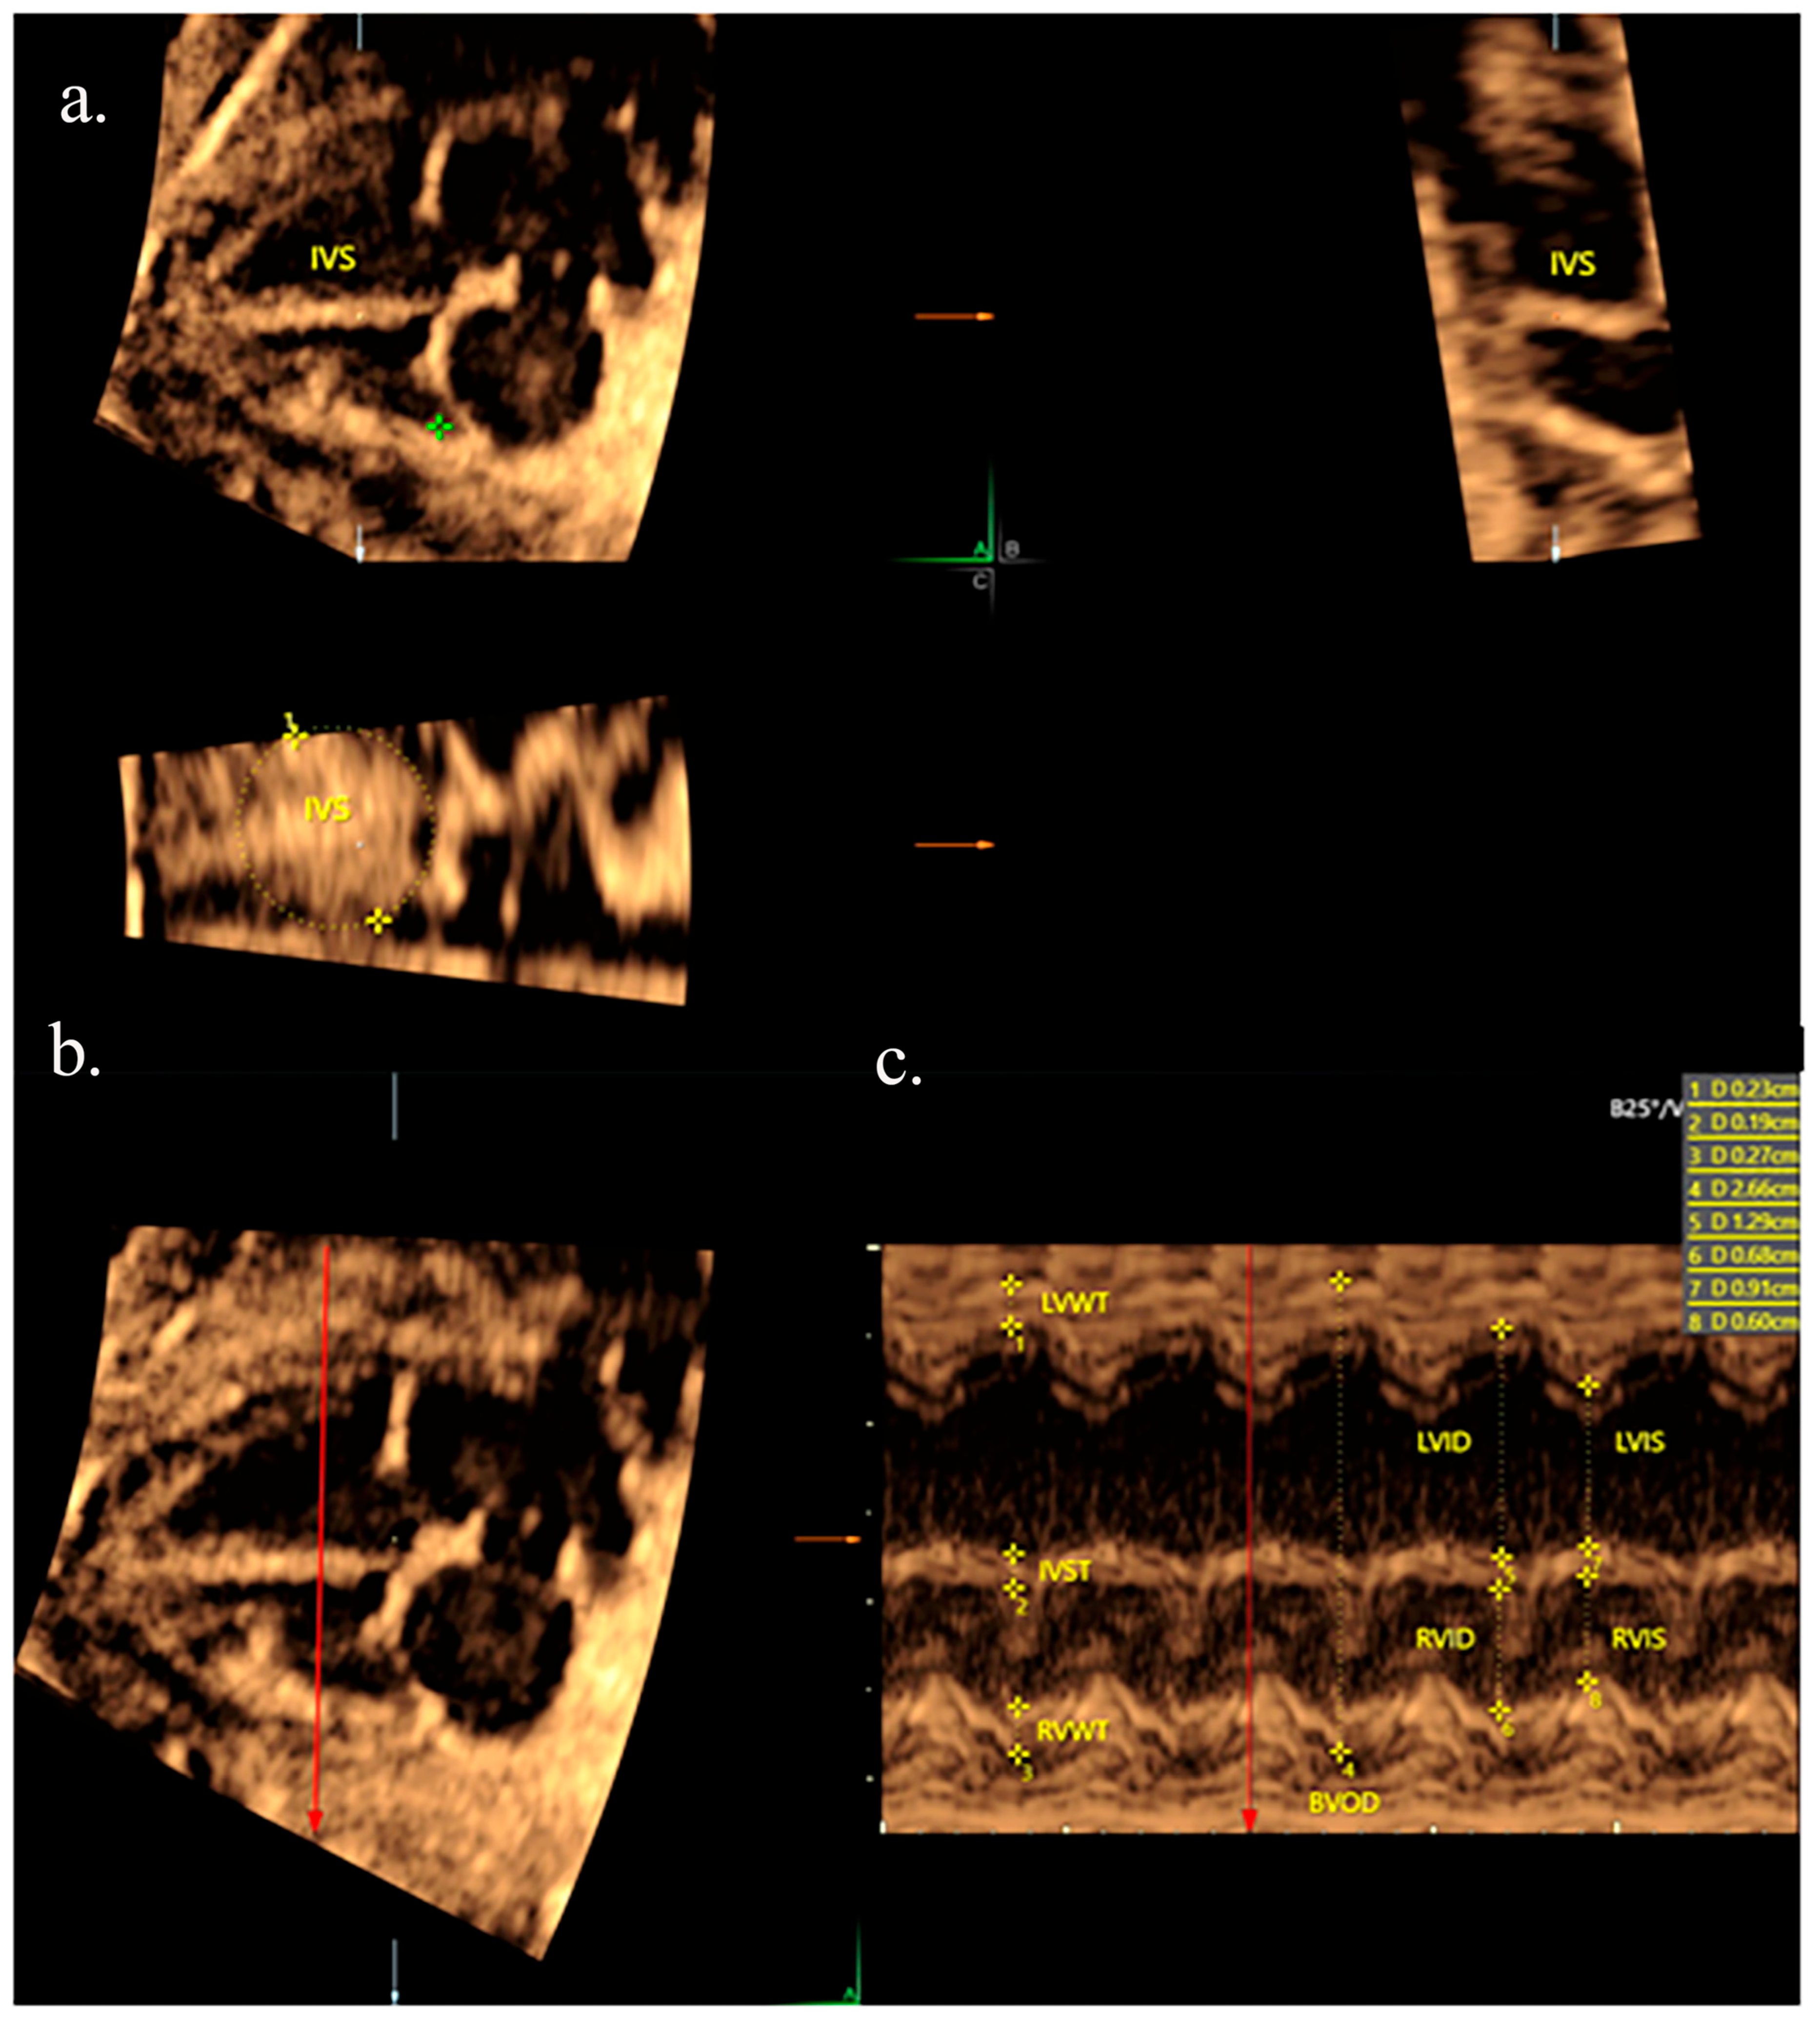
When the aim of the volume acquisition becomes the assessment of shortening fraction, the best two-dimensional image to start the acquisition is a septal four-chamber view. The orientation of the cardiac axis to estimate shortening fraction should be horizontal to permit a perpendicular orientation of the ultrasonographic beam to the interventricular septum. The virtual cardiac volume is stored for subsequent offline analysis (Figure 25) [56].
Offline analysis of the specific STIC volume is performed with cardio-spatial–temporal image correlation with M-Mode display to calculate left and right ventricular shortening fractions as the dimension at end-diastole minus the dimension at end-systole divided by the dimension at end-diastole for each side of the heart [56].
Multiplanar view application is used to calculate shortening fractions. Once the best four-chamber view image is identified, it is displayed on panel A. The image can usually be further improved by moving the reference dot and by rotating around the three perpendicular axes (x, y and z). These adjustments aim to precisely place the interventricular septum in the horizontal plane in the three panels (A, B and C).
In the appropriate multiplanar views for analysis, the interventricular septum should lie horizontally on the same line in panel A and B, which should be in total “en face” view in panel C (Figure 26).
Once the optimal view is obtained, STIC M-mode is applied in panel A by placing the M-Mode cursor perpendicular to the interventricular septum at the level of the maximal ventricular dimension, just below the atrioventricular plane. The measurements to calculate shortening fraction are carried out at end-diastole and end-systole by placing the M-mode cursor at the level of the greatest dimension [56].
The parameters are measured using the same tracing at the two different time points of the cardiac cycle (end of systole and diastole). To assess left cardiac dimensions, the distance from the endocardium of the left ventricular wall to the endocardium of the left side of the interventricular septum is measured. In the same way, the right ventricular dimensions are measured from the right ventricular wall endocardium to the right side of the interventricular septum endocardium.
As already mentioned, the left ventricle shortening fraction and right ventricle shortening fraction are calculated by subtracting the dimension of the ventricle at the end-systole from the ventricular dimension at the end-diastole and dividing it by the dimension at the end-diastole [56].

5.2. Left and Right Fetal Cardiac Event Timing

5.2.1. General Introduction

Fetal cardiac event timing can be assessed using different ultrasound techniques, originally using Pulse Wave Doppler and more recently tissue Doppler imaging (TDI). Tissue Doppler imaging shows the advantage of deriving the index on a single trace for both the right and left ventricles, while pulsed-wave Doppler requires two different planes from mid-gestation onwards to obtain the index on the right side of the heart.

5.2.2. Pulse Wave Doppler Left Fetal Cardiac Event Timing

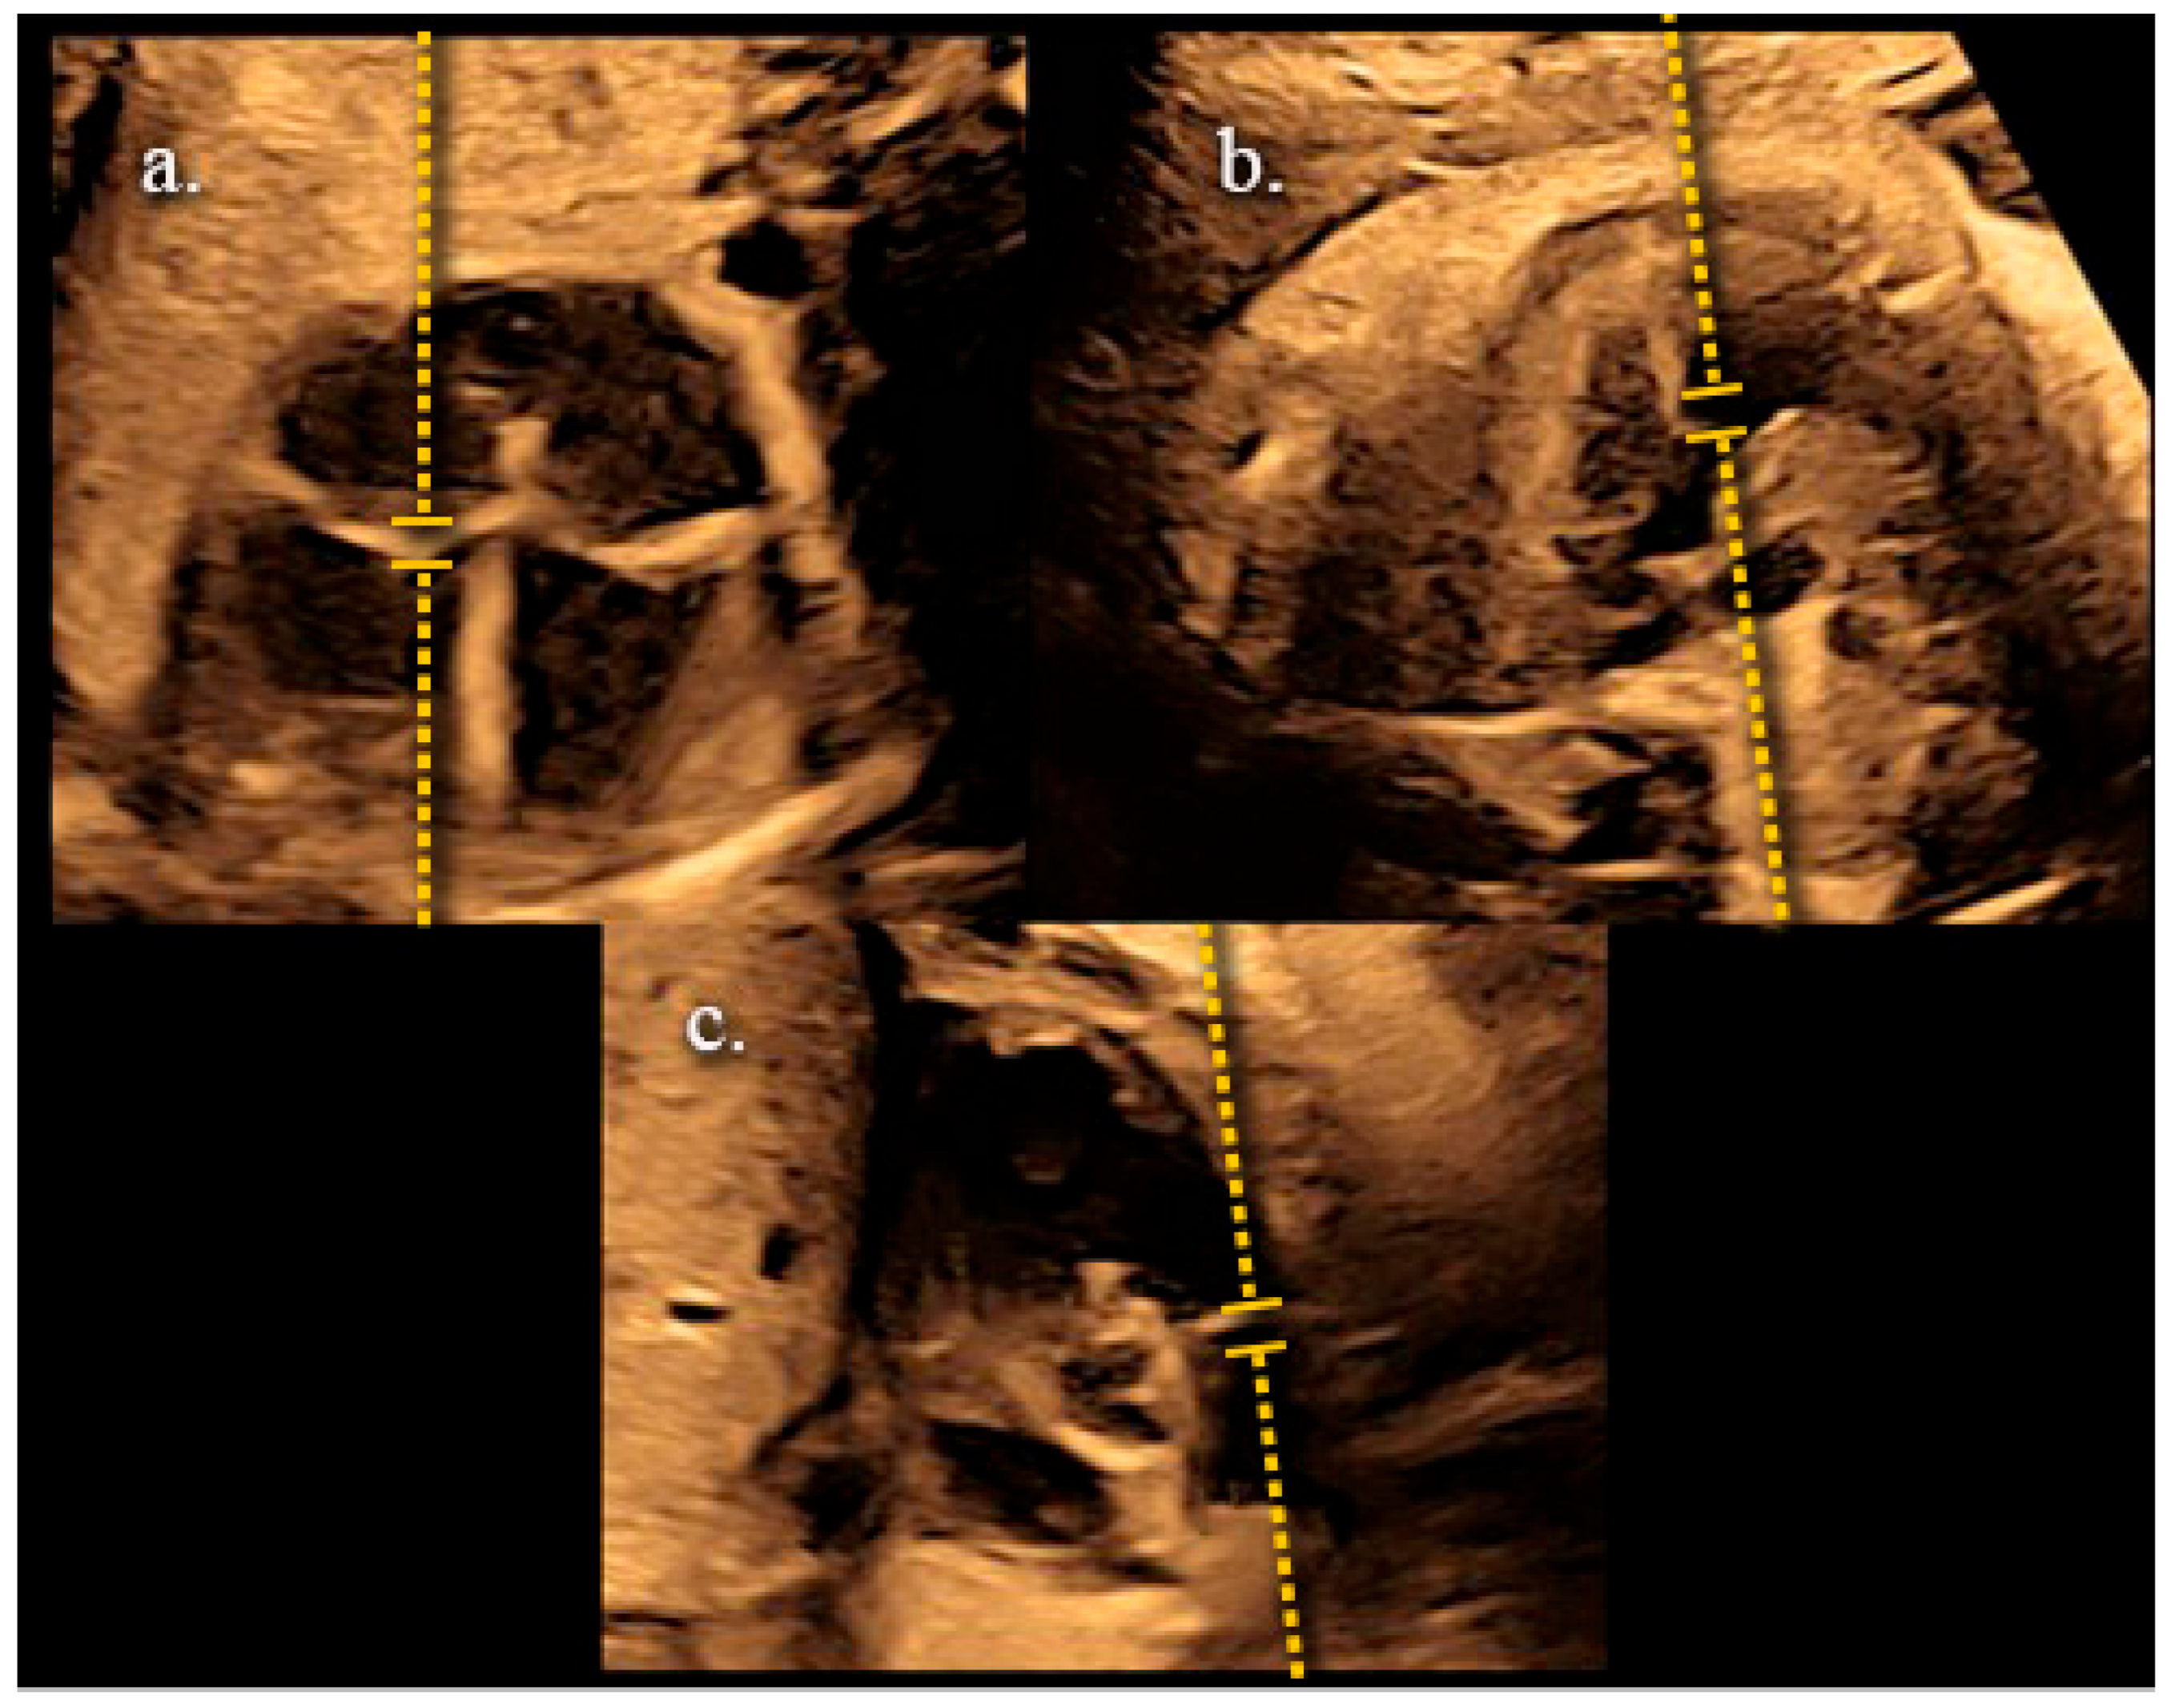
The ideal image to collect information for left fetal cardiac event timing starts from an apical four-chamber view, with the cardiac apex pointing up towards the ultrasound transducer [57]. A basal four-chamber view with the cardiac apex pointing down towards an angle of 180 degrees to the ultrasound transducer is also considered acceptable (Figure 27 and Figure 28).
The correct location to place the Doppler sample gate is on the ascending aorta’s lateral wall, just above the mitral valve and below the aortic valve. In the ideal image, both mitral and aortic valve should be visible, and the sample volume gate placed slightly cranially to the valves, towards the cardiac apex [58] (Figure 27).
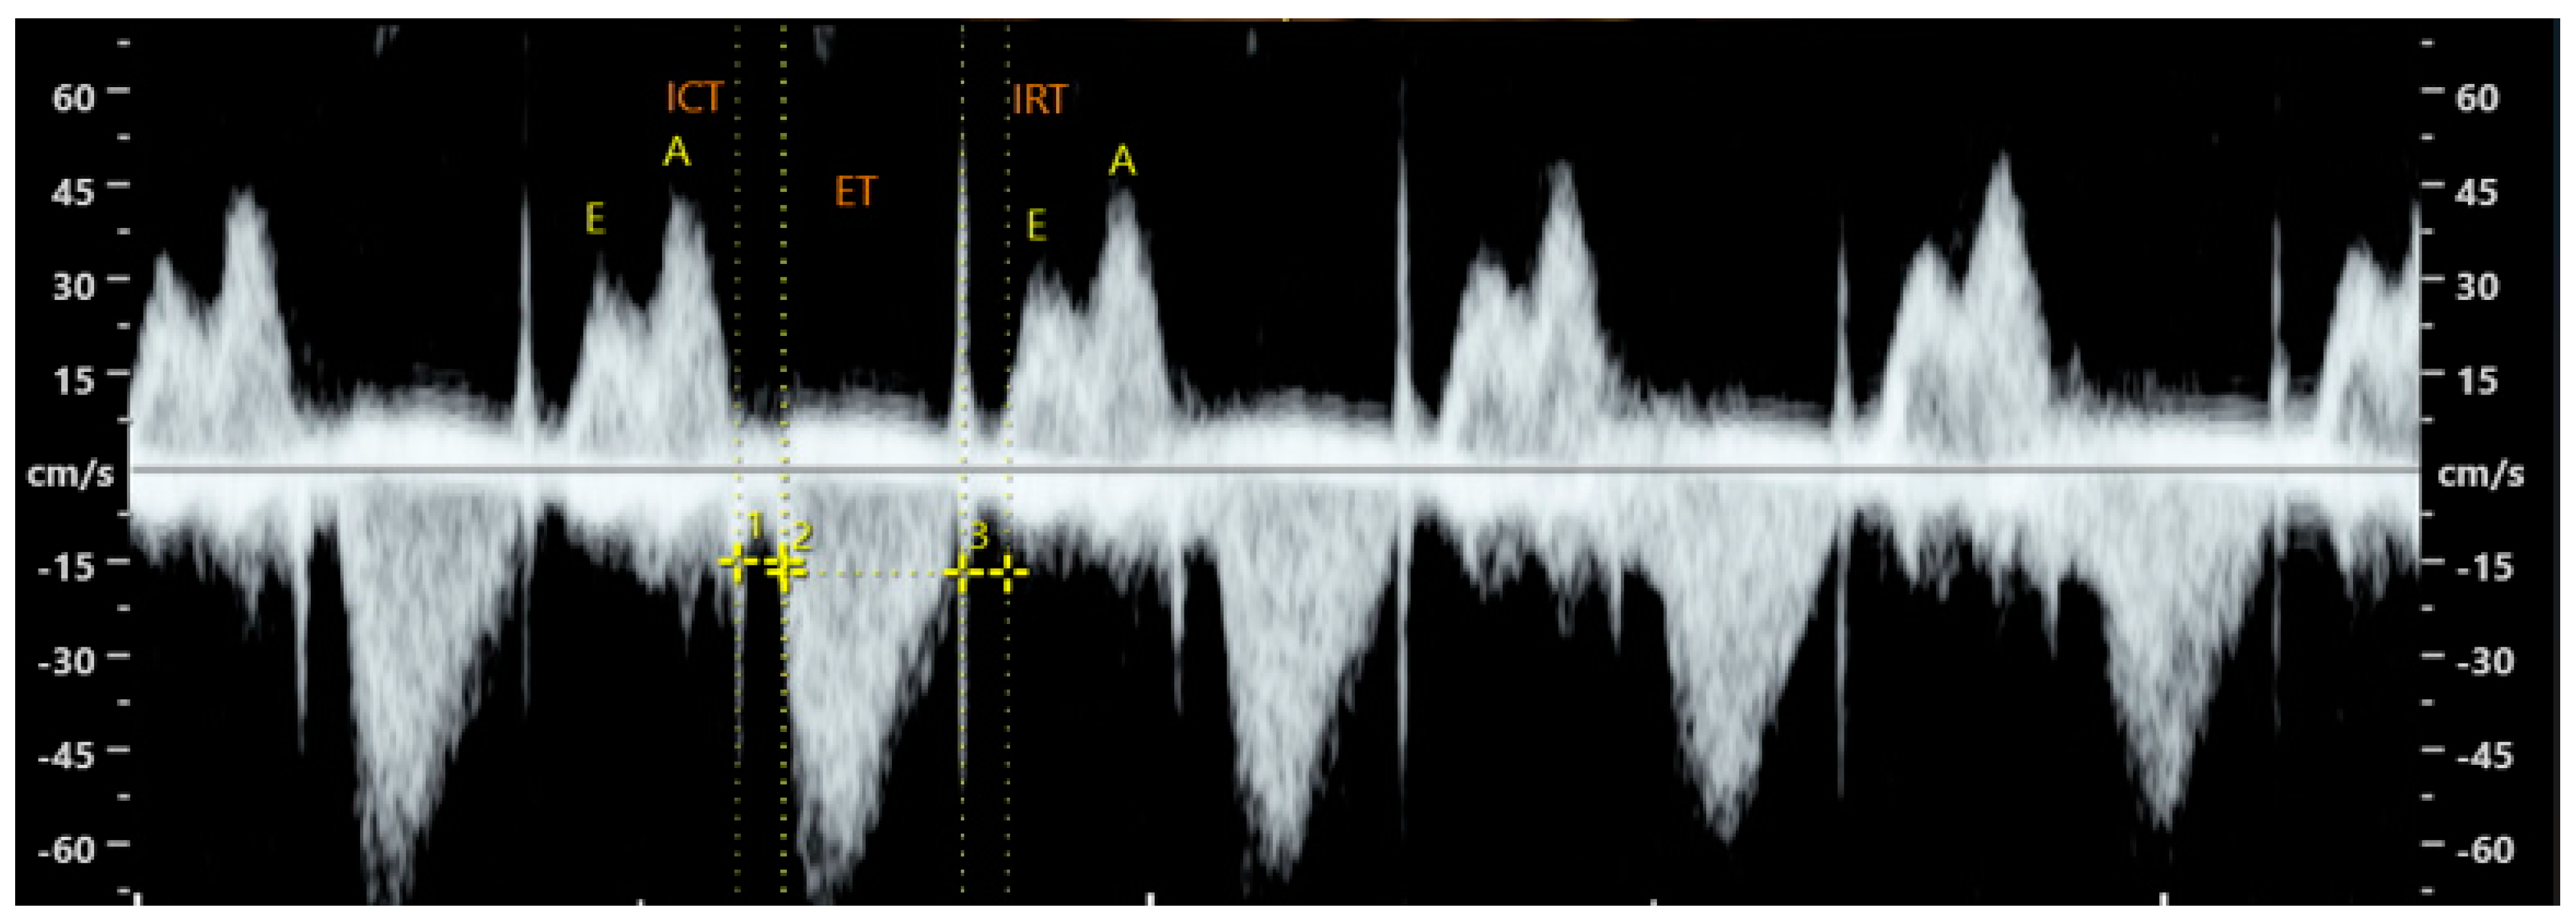
A precise estimation of the time intervals requires a correct placement of the time cursors and through obtaining clear valve clicks [58] (Figure 28). The estimation of left fetal cardiac events requires the correct measurements of the isovolumetric contraction time (ICT), the ejection time (ET), and the isovolumetric relaxation time (IRT). The modified myocardial performance index (Mod-MPI) is then calculated as (ICT + IRT)/ET [57].
The ICT represents the time when intraventricular pressure increases under the force of myocardial contraction, while the semilunar valve remains closed until the pressure is still insufficient [59]; for the left myocardial performance index (MPI), this is measured from the mitral valve closure click to the aortic valve opening click (Figure 28) [58]. The IRT reflects the time after systole when the semilunar valves are closed, and the pressure reduces (Figure 28). It is measured from the click corresponding to the aortic valve closure to the click of the mitral valve aperture [58]. The ET represents the ejection phase, during ventricular systole. It is measured as the time between the click corresponding to the aortic valve aperture and the click corresponding to the aortic valve closure (Figure 28) [58].

5.2.3. Pulse Wave Doppler Right Fetal Cardiac Event Timing

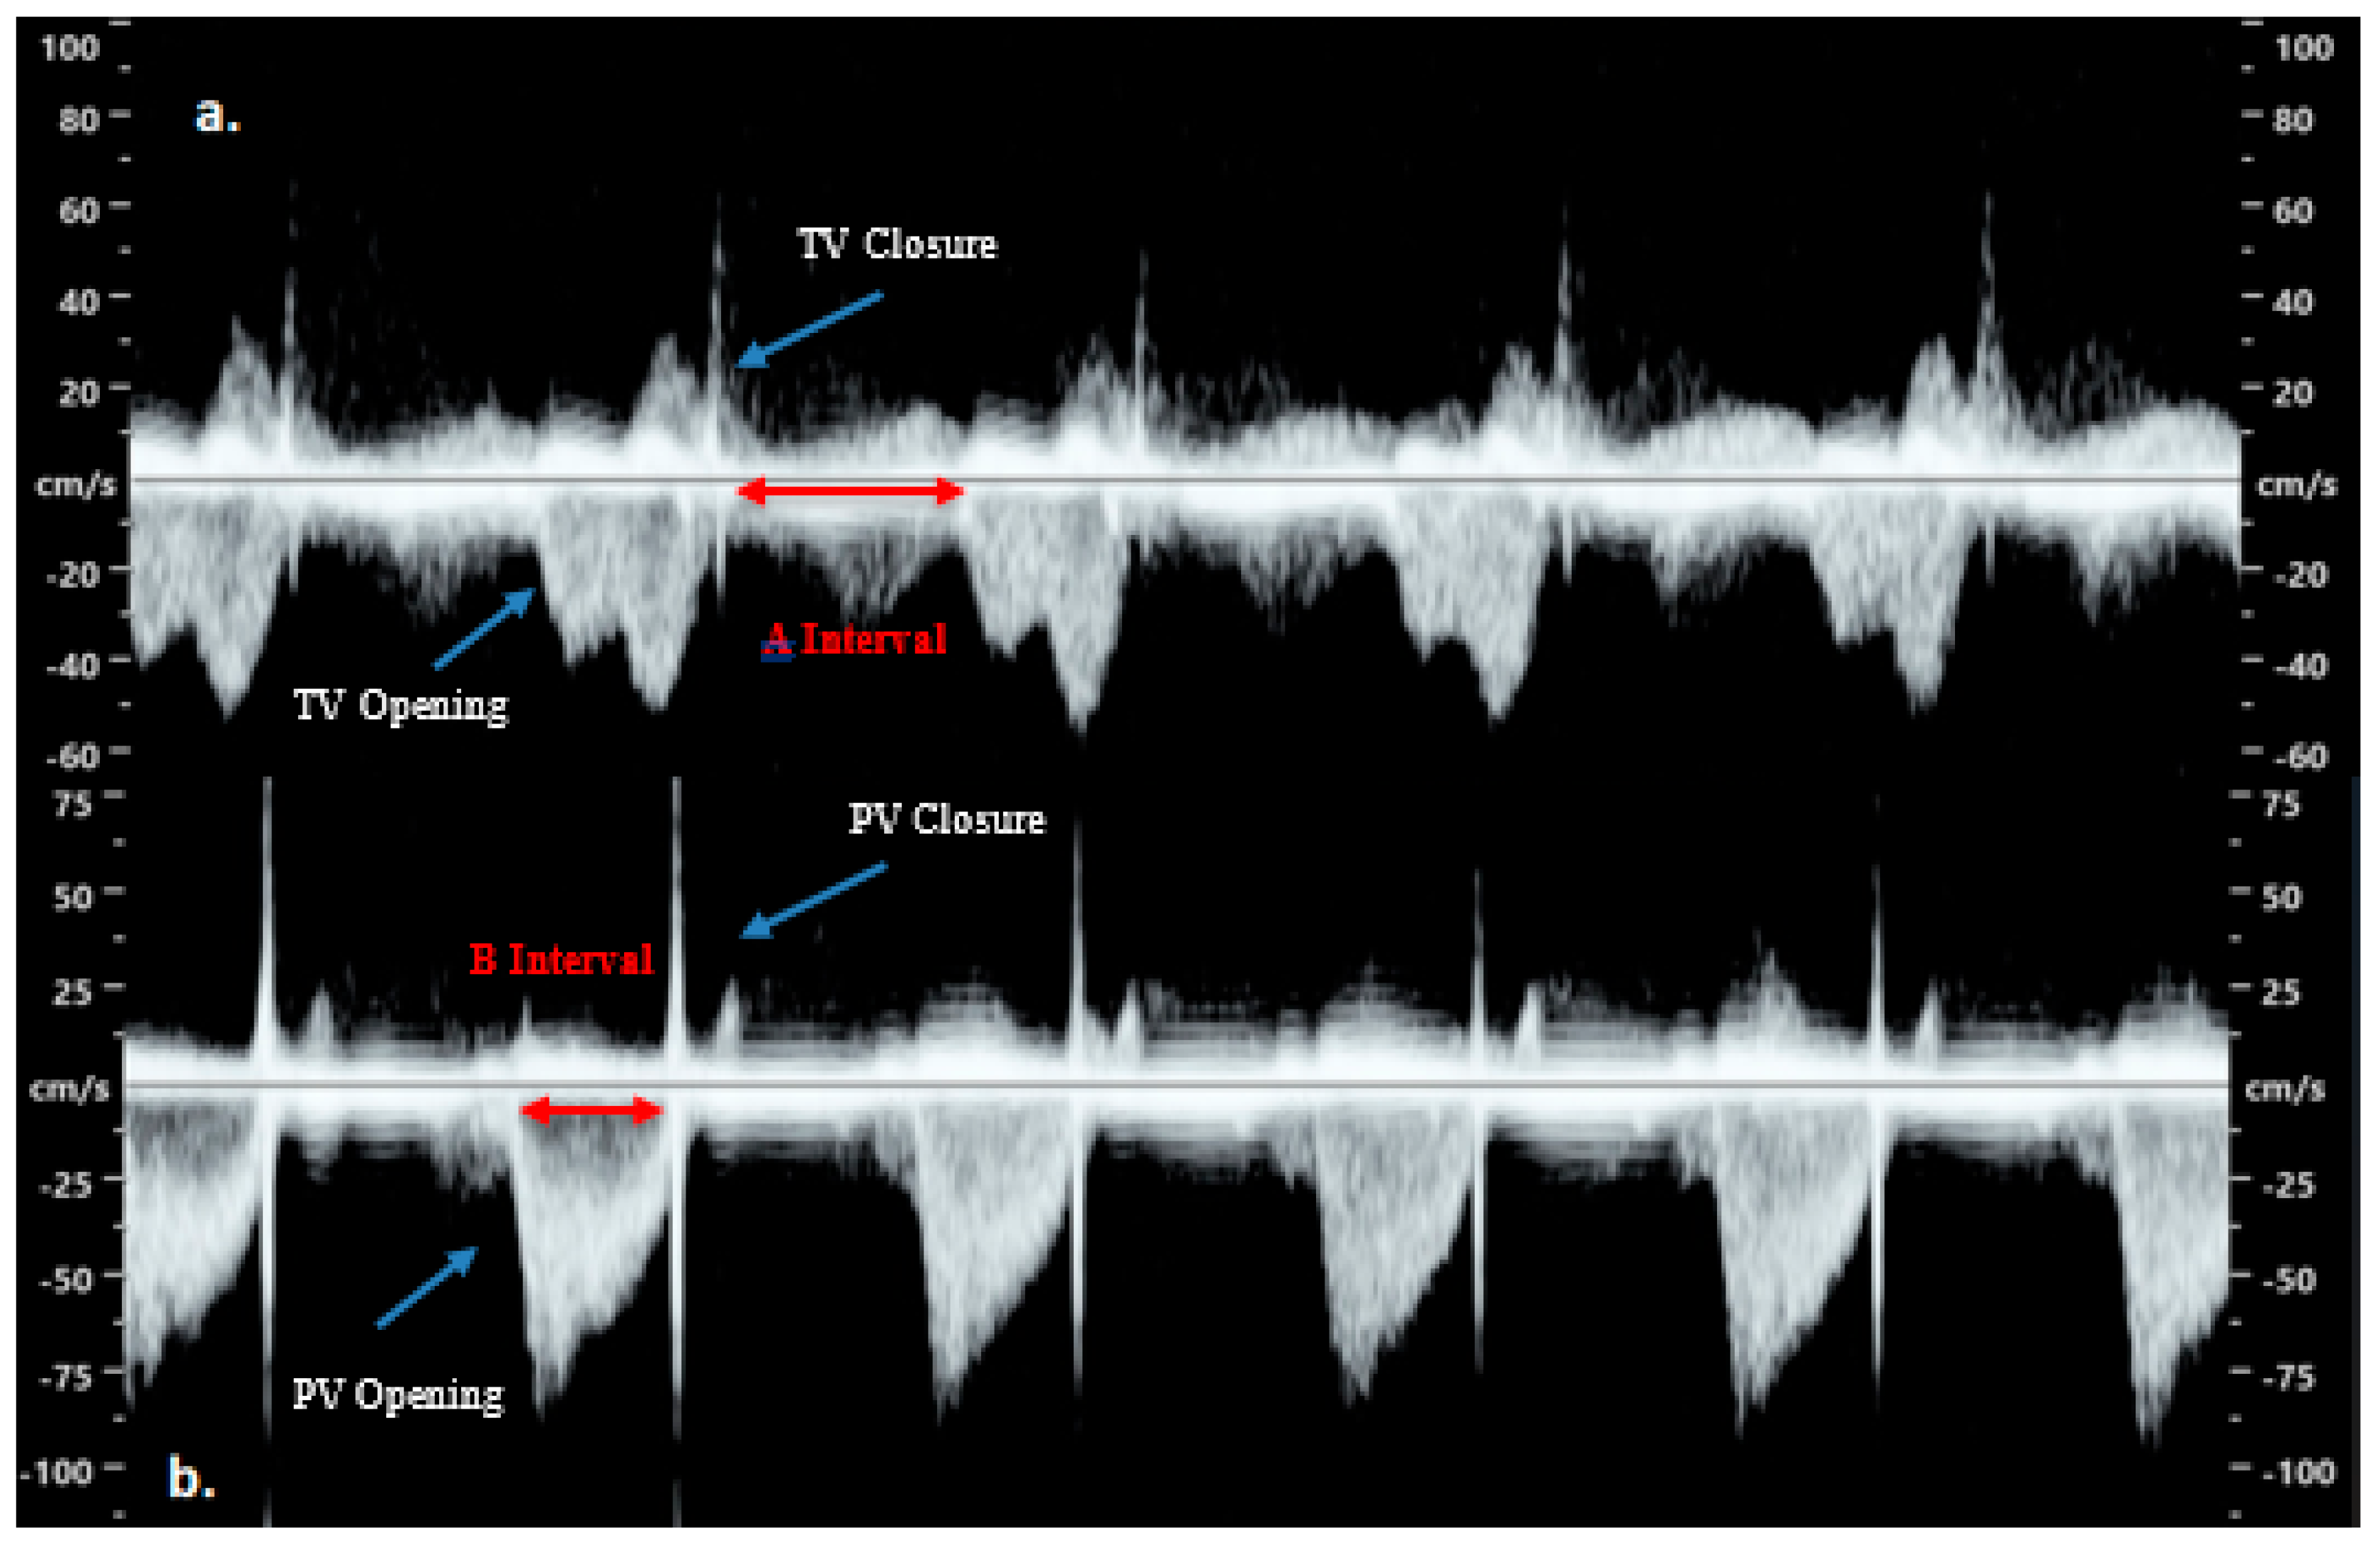
After 20 weeks of gestation, the right side of the heart shows an anatomical separation between the tricuspid and pulmonary valves [60]. As a consequence, the right fetal cardiac event timing is generally calculated from two different anatomical planes captured in two different cardiac cycles and then calculated as (a − b)/b as outlined below (Figure 29) [60]. Machine settings must be kept constant while obtaining both cycles [59].
All examinations should be performed using curvilinear transducers (3.5–7 MHz). Absence of fetal movements would be ideal. Doppler sweep velocity should be the fastest (15 cm/s) and wall motion filter should be 300 Hz. The angle of insonation is maintained below 15° and as close to 0° as possible [61]. Gain should be reduced to clearly differentiate the tricuspid and pulmonary valve clicks [58].
Although the right fetal cardiac event timing requires two different imaging planes in two cardiac cycles, it demonstrates comparable reproducibility to the left fetal cardiac event timing, with a wider standard deviation of reference interval means [62].
Two planes and, therefore, two corresponding images are required:
  • The ‘a’ interval is measured in an apical four-chamber view from the closure click to the aperture click of the tricuspid valve.
  • The ‘b’ interval is measured either in the short-axis view or sagittal plane from the aperture click to the closure click of the pulmonary valve (Figure 30).
First, the right ventricular inflow needs to be assessed to measure the ‘a’ time. In an apical four-chamber view, the Doppler sample is placed at the tips of the tricuspid valve and the ‘a’ time is measured between valve closure click and the following opening click (Figure 29).
Then, the right ventricular outflow for the ejection time is evaluated to measure the ‘b’ interval. The main pulmonary artery can be seen in the short-axis view of the fetal heart or in a transverse plane. Doppler sample should be placed at the pulmonary valve level. The ejection time or ‘b’ interval is measured between the valve opening click to the closure click (Figure 29).

5.2.4. Tissue Doppler Imaging Left and Right Fetal Cardiac Event Timing

Tissue Doppler imaging (TDI) expresses the velocity of motion of the myocardium rather than the velocity of the blood flow. Myocardial motion can be assessed placing a sample volume in the myocardium, similar to pulsed-wave Doppler interrogating the blood flow. This evaluation displays the myocardial velocity in early diastole (e’), late diastole (a’) and systole (s’) [63].
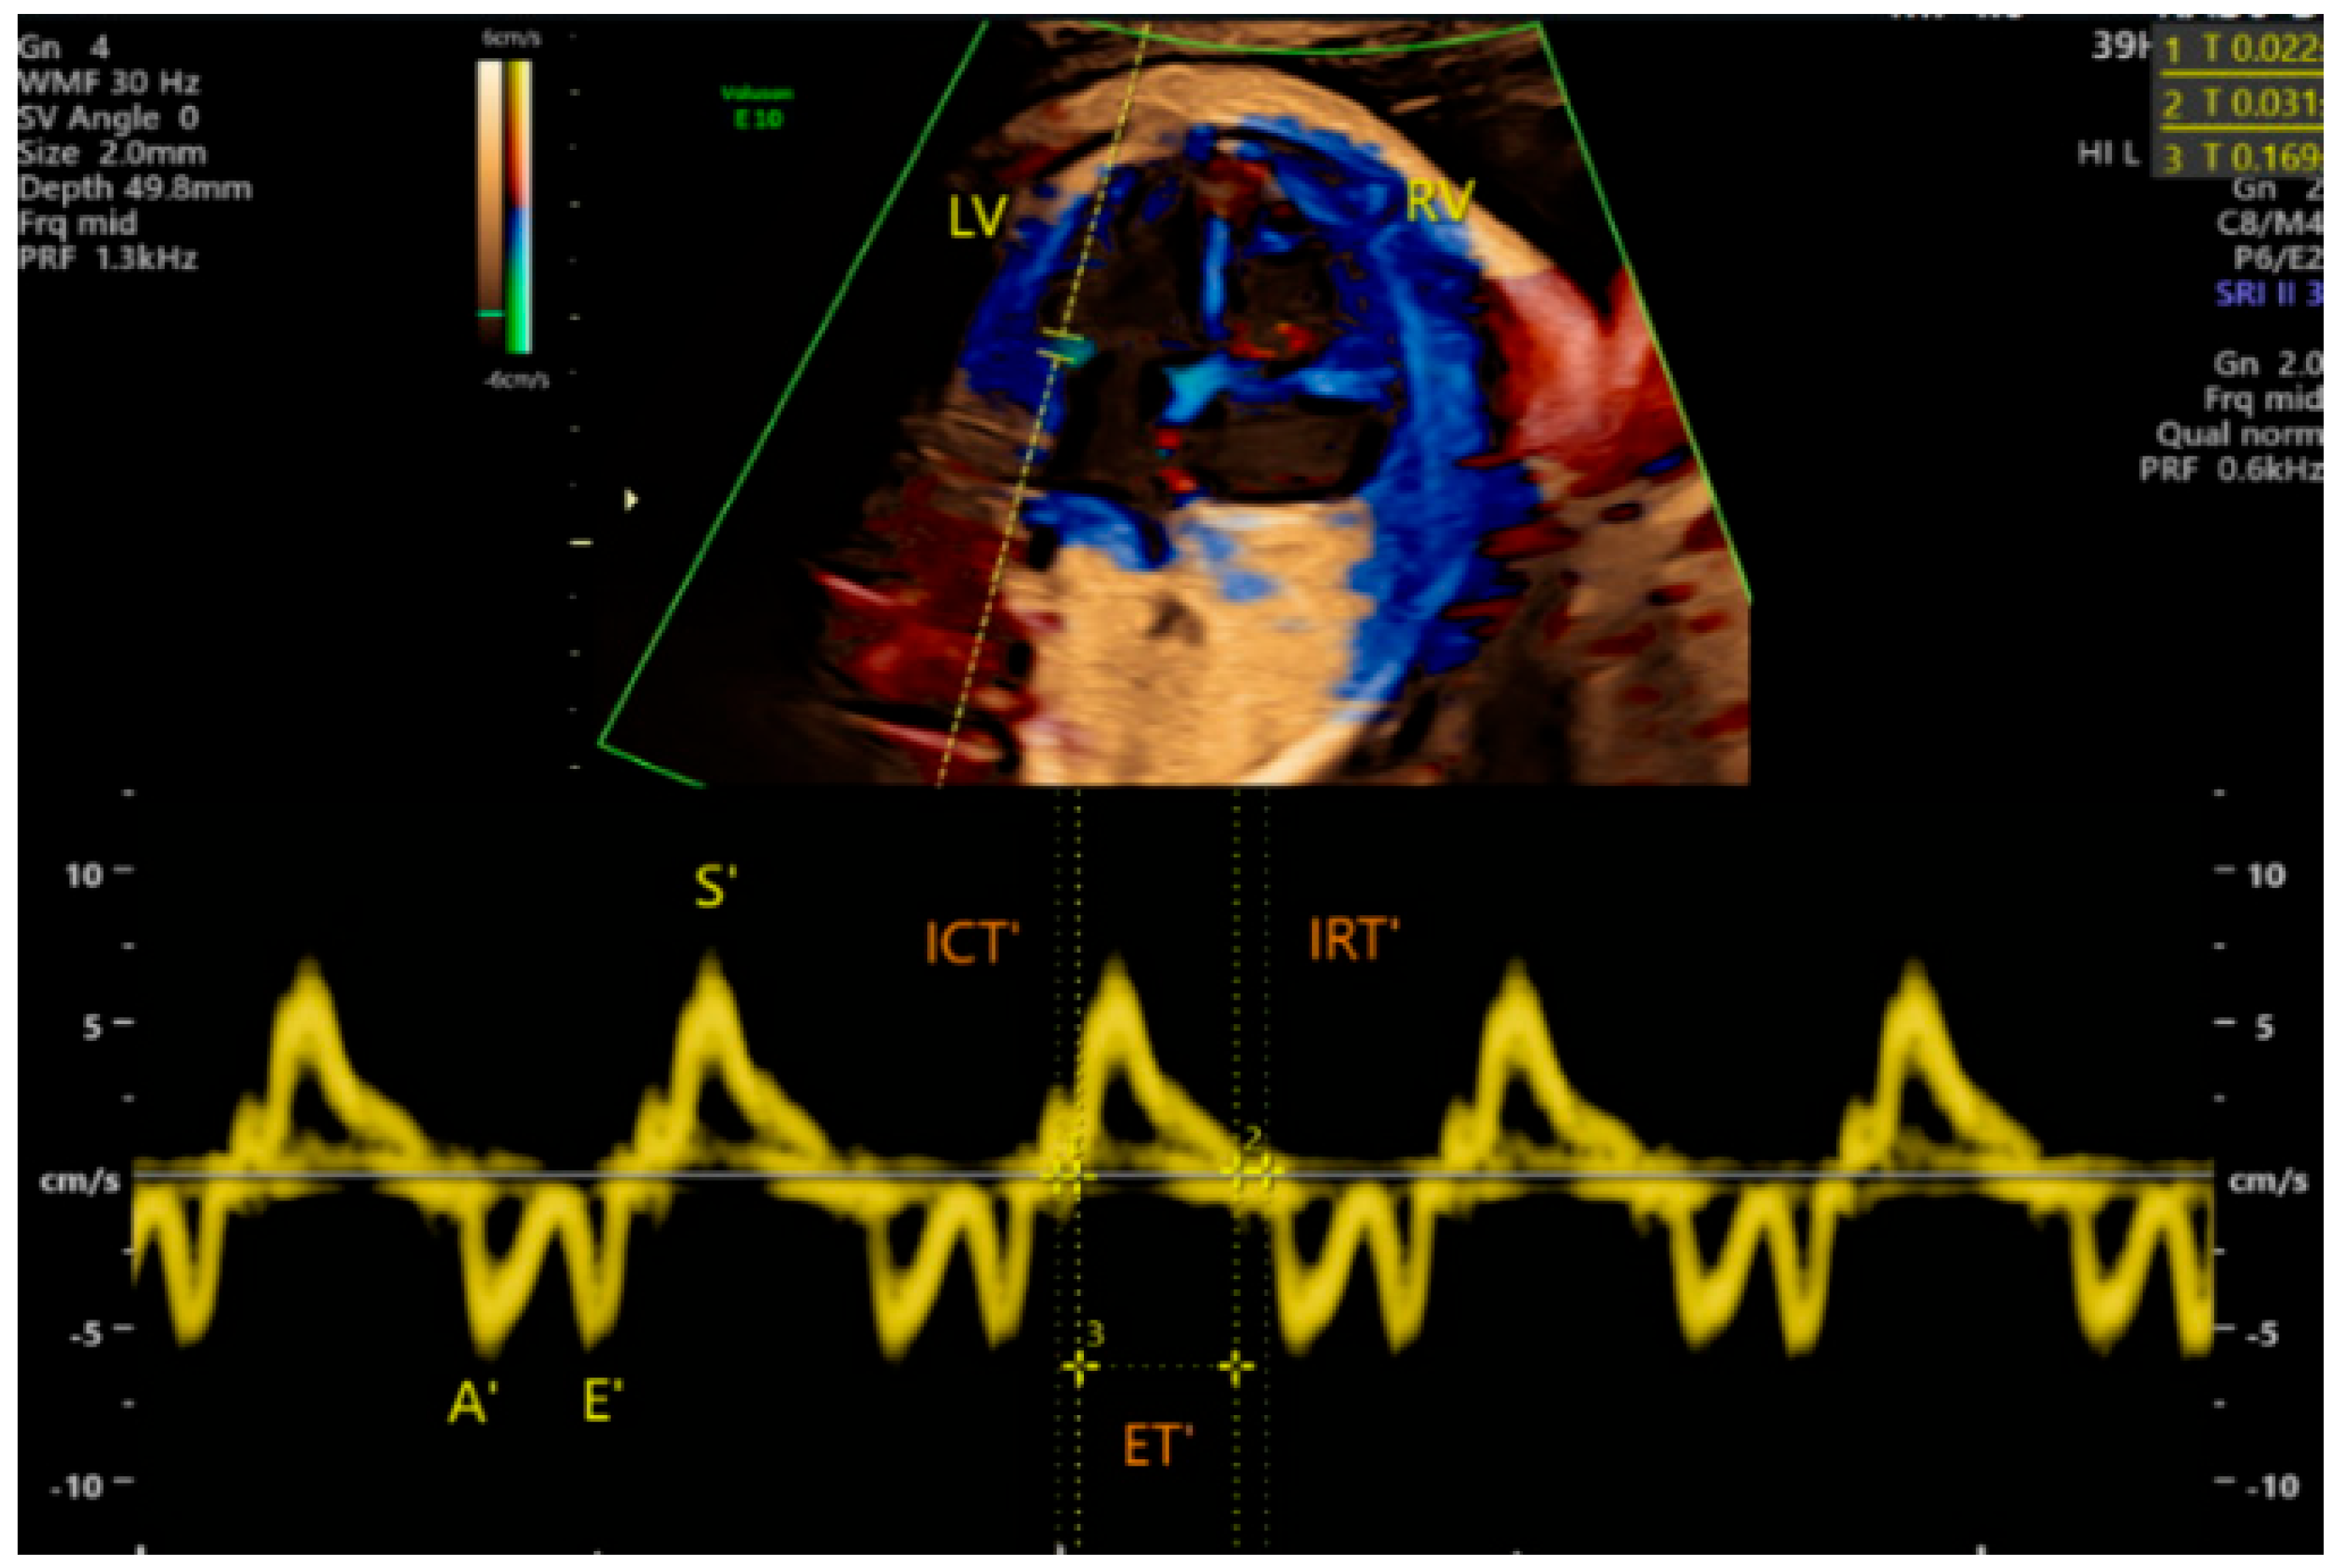
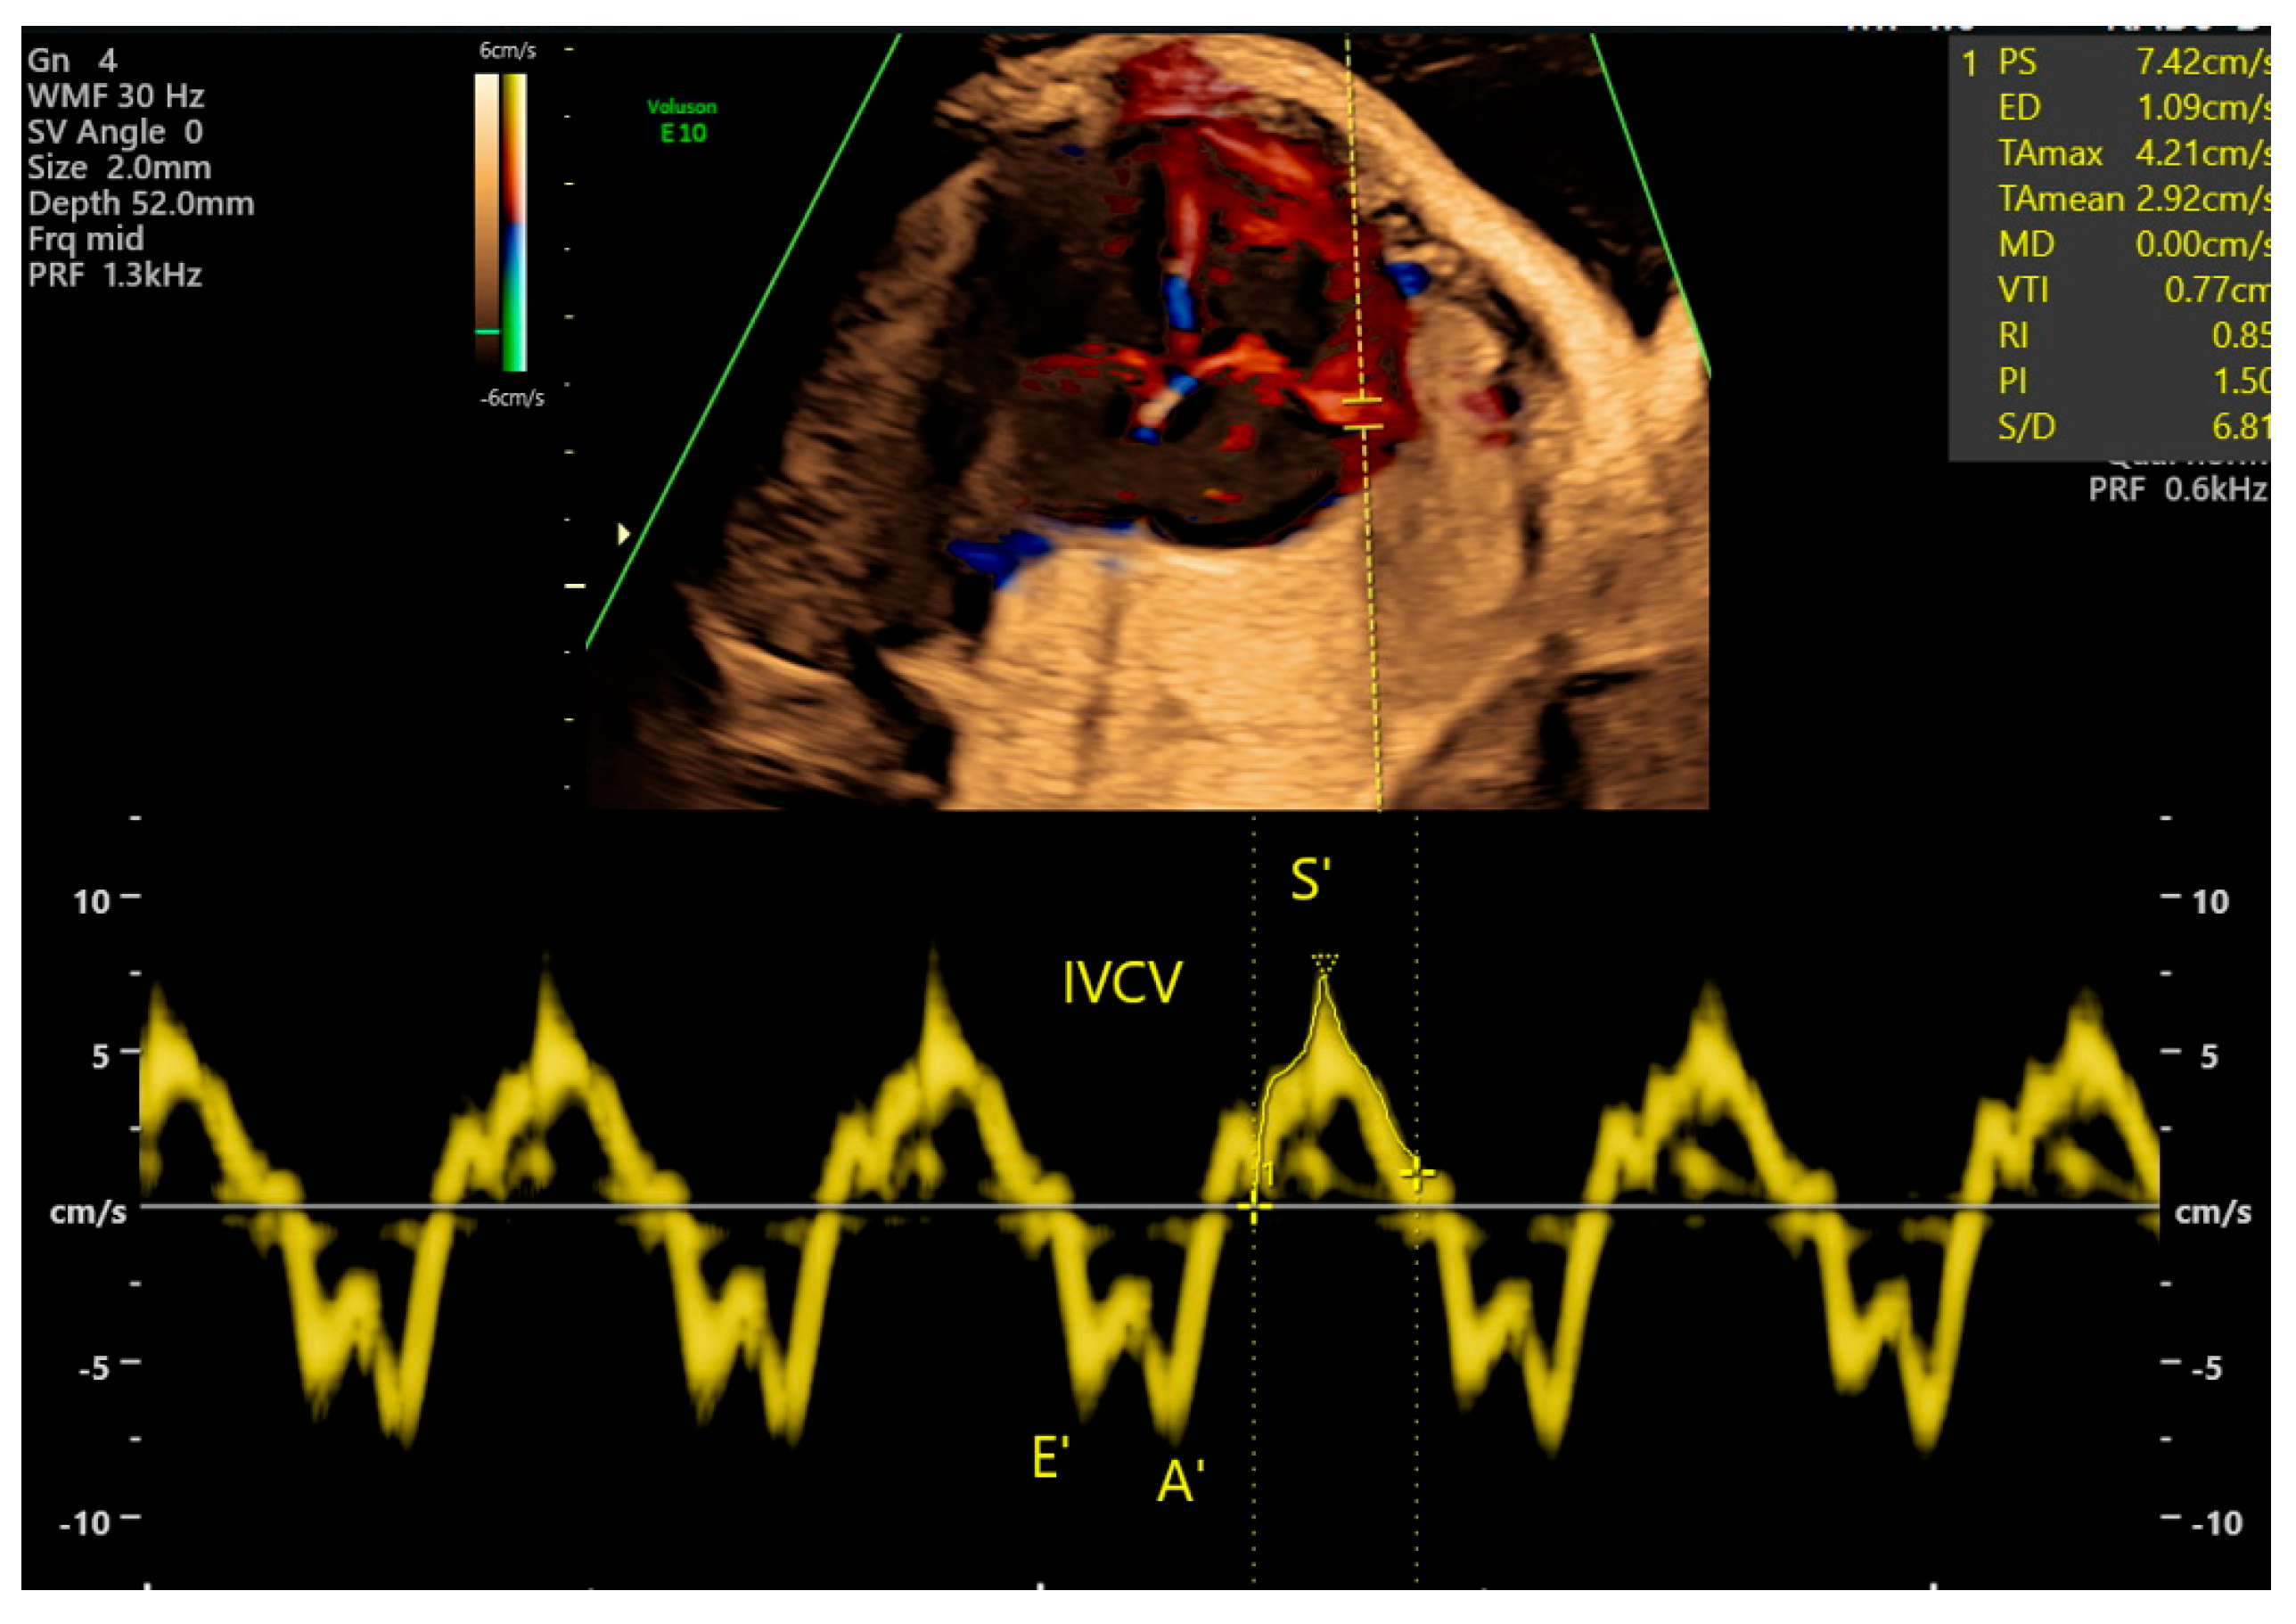
The ideal image to perform a tissue Doppler is an apical or basal four-chamber view of the fetal heart. The Doppler sample gate should be between 2 and 4 mm and be positioned at the atrioventricular valve’s annulus, at the basal segment of the right and left ventricle (Figure 31) [63,64].
The ultrasound beam should be positioned as parallel as possible to the interventricular septum or ventricular wall (insonation angle less than 30° without correction). The filter and gain setting should be low to prevent high-frequency signals [63,64].
Atrioventricular valve annulus longitudinal motility evaluation outputs three velocity waves (Figure 29). The S′ wave corresponds to the velocity during ventricular systole, and the E′ and A′ waves describe velocities during the ventricular diastolic phase. The E′ wave shows the velocity during passive filling, while the A′ wave during atrial contraction (active filling) [65].
Under physiological conditions, the E′ wave exhibits a smaller peak velocity compared to the A′ wave. As gestational age advances, changes in ventricular compliance determine a decreasing trend in the E′/A′ ratio. The patterns of velocity observed through mitral and tricuspid valves reflect these changes [63].
In addition, based on the spectral tissue Doppler waveform, it is possible to calculate the tissue myocardial performance index (MPI′) by applying the formula MPI′ = (ICT′ + IRT′)/ET′. The required time periods (tissue isovolumetric contraction time (ICT’), ejection time (ET′) and isovolumetric relaxation time (IRT′)) are calculated by analyzing the time periods of the velocity spectrum (Figure 31) [63]. In the assessment of MPI there are no technical differences between the left and right side of the fetal heart; when tissue Doppler imaging is applied only one image is required to assess the parameter on each side.

5.3. Tricuspid, Mitral and Septal Annular Plane Systolic Excursion (TAPSE, MAPSE, SAPSE)

5.3.1. General Introduction

Different ultrasound techniques can measure tricuspid, mitral, and septal annular plane systolic excursion (TAPSE, MAPSE, and SAPSE). Motion mode (M-Mode) and tissue Doppler imaging (TDI) can be applied to 2D images, while spatio-temporal image construction motion mode (STIC M-mode) can be used on STIC 3D volumes.

5.3.2. Motion Mode (M-Mode) TAPSE/MAPSE/SAPSE

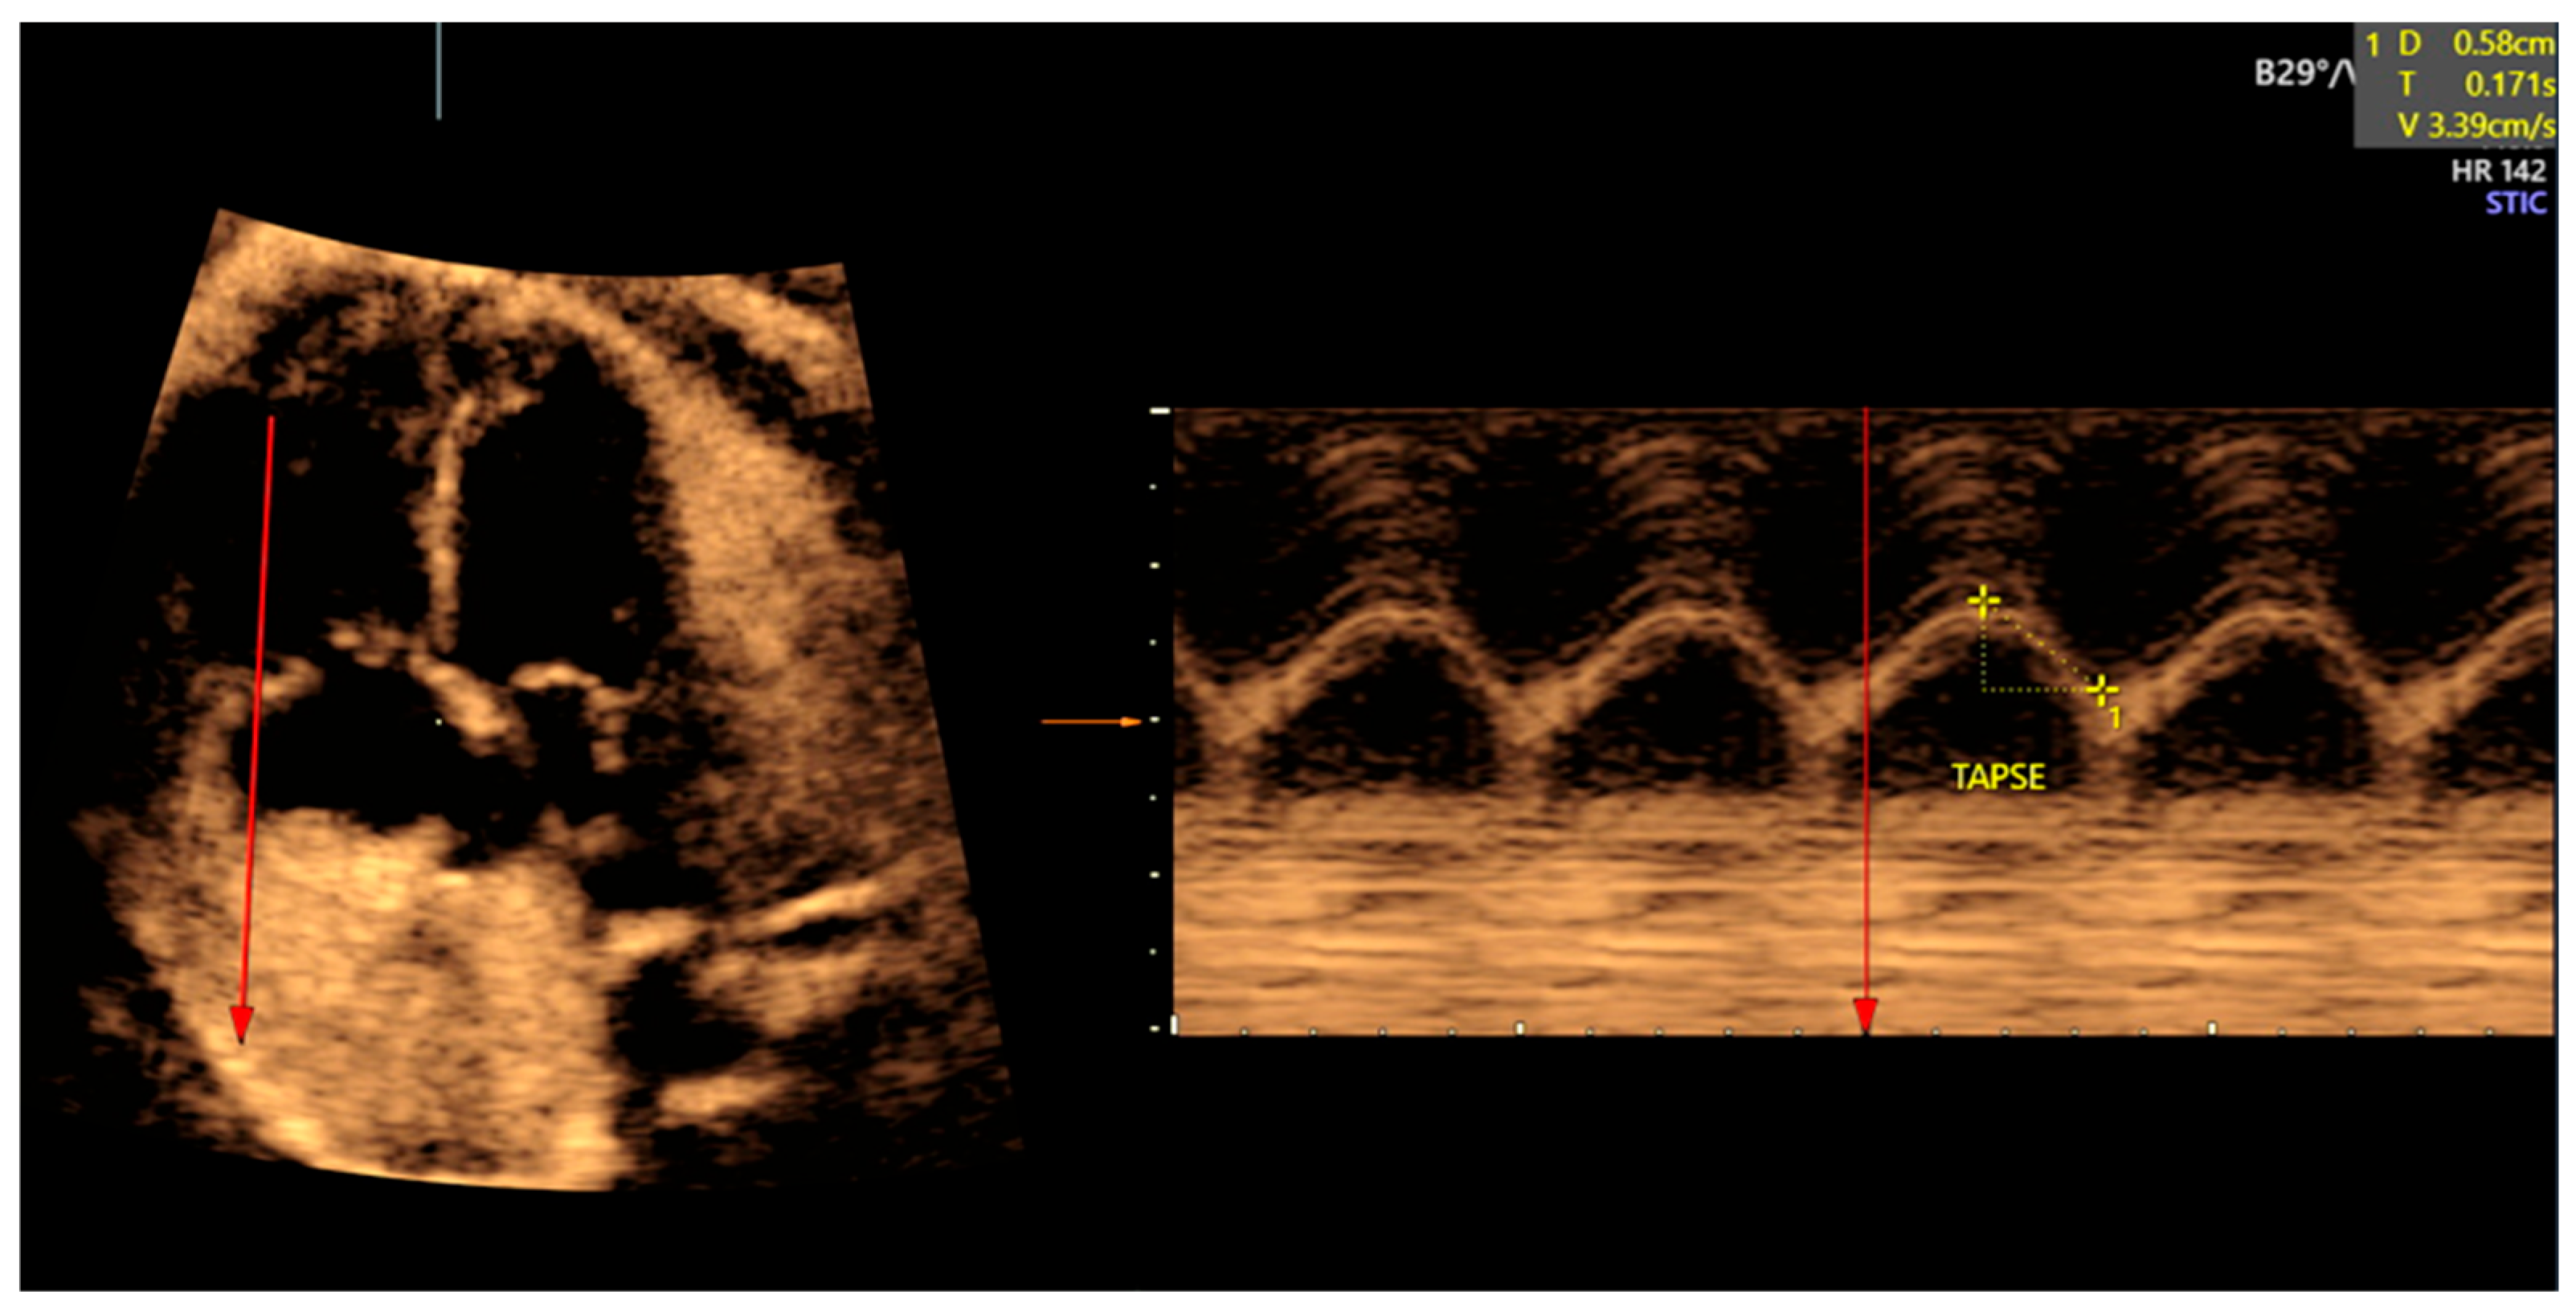
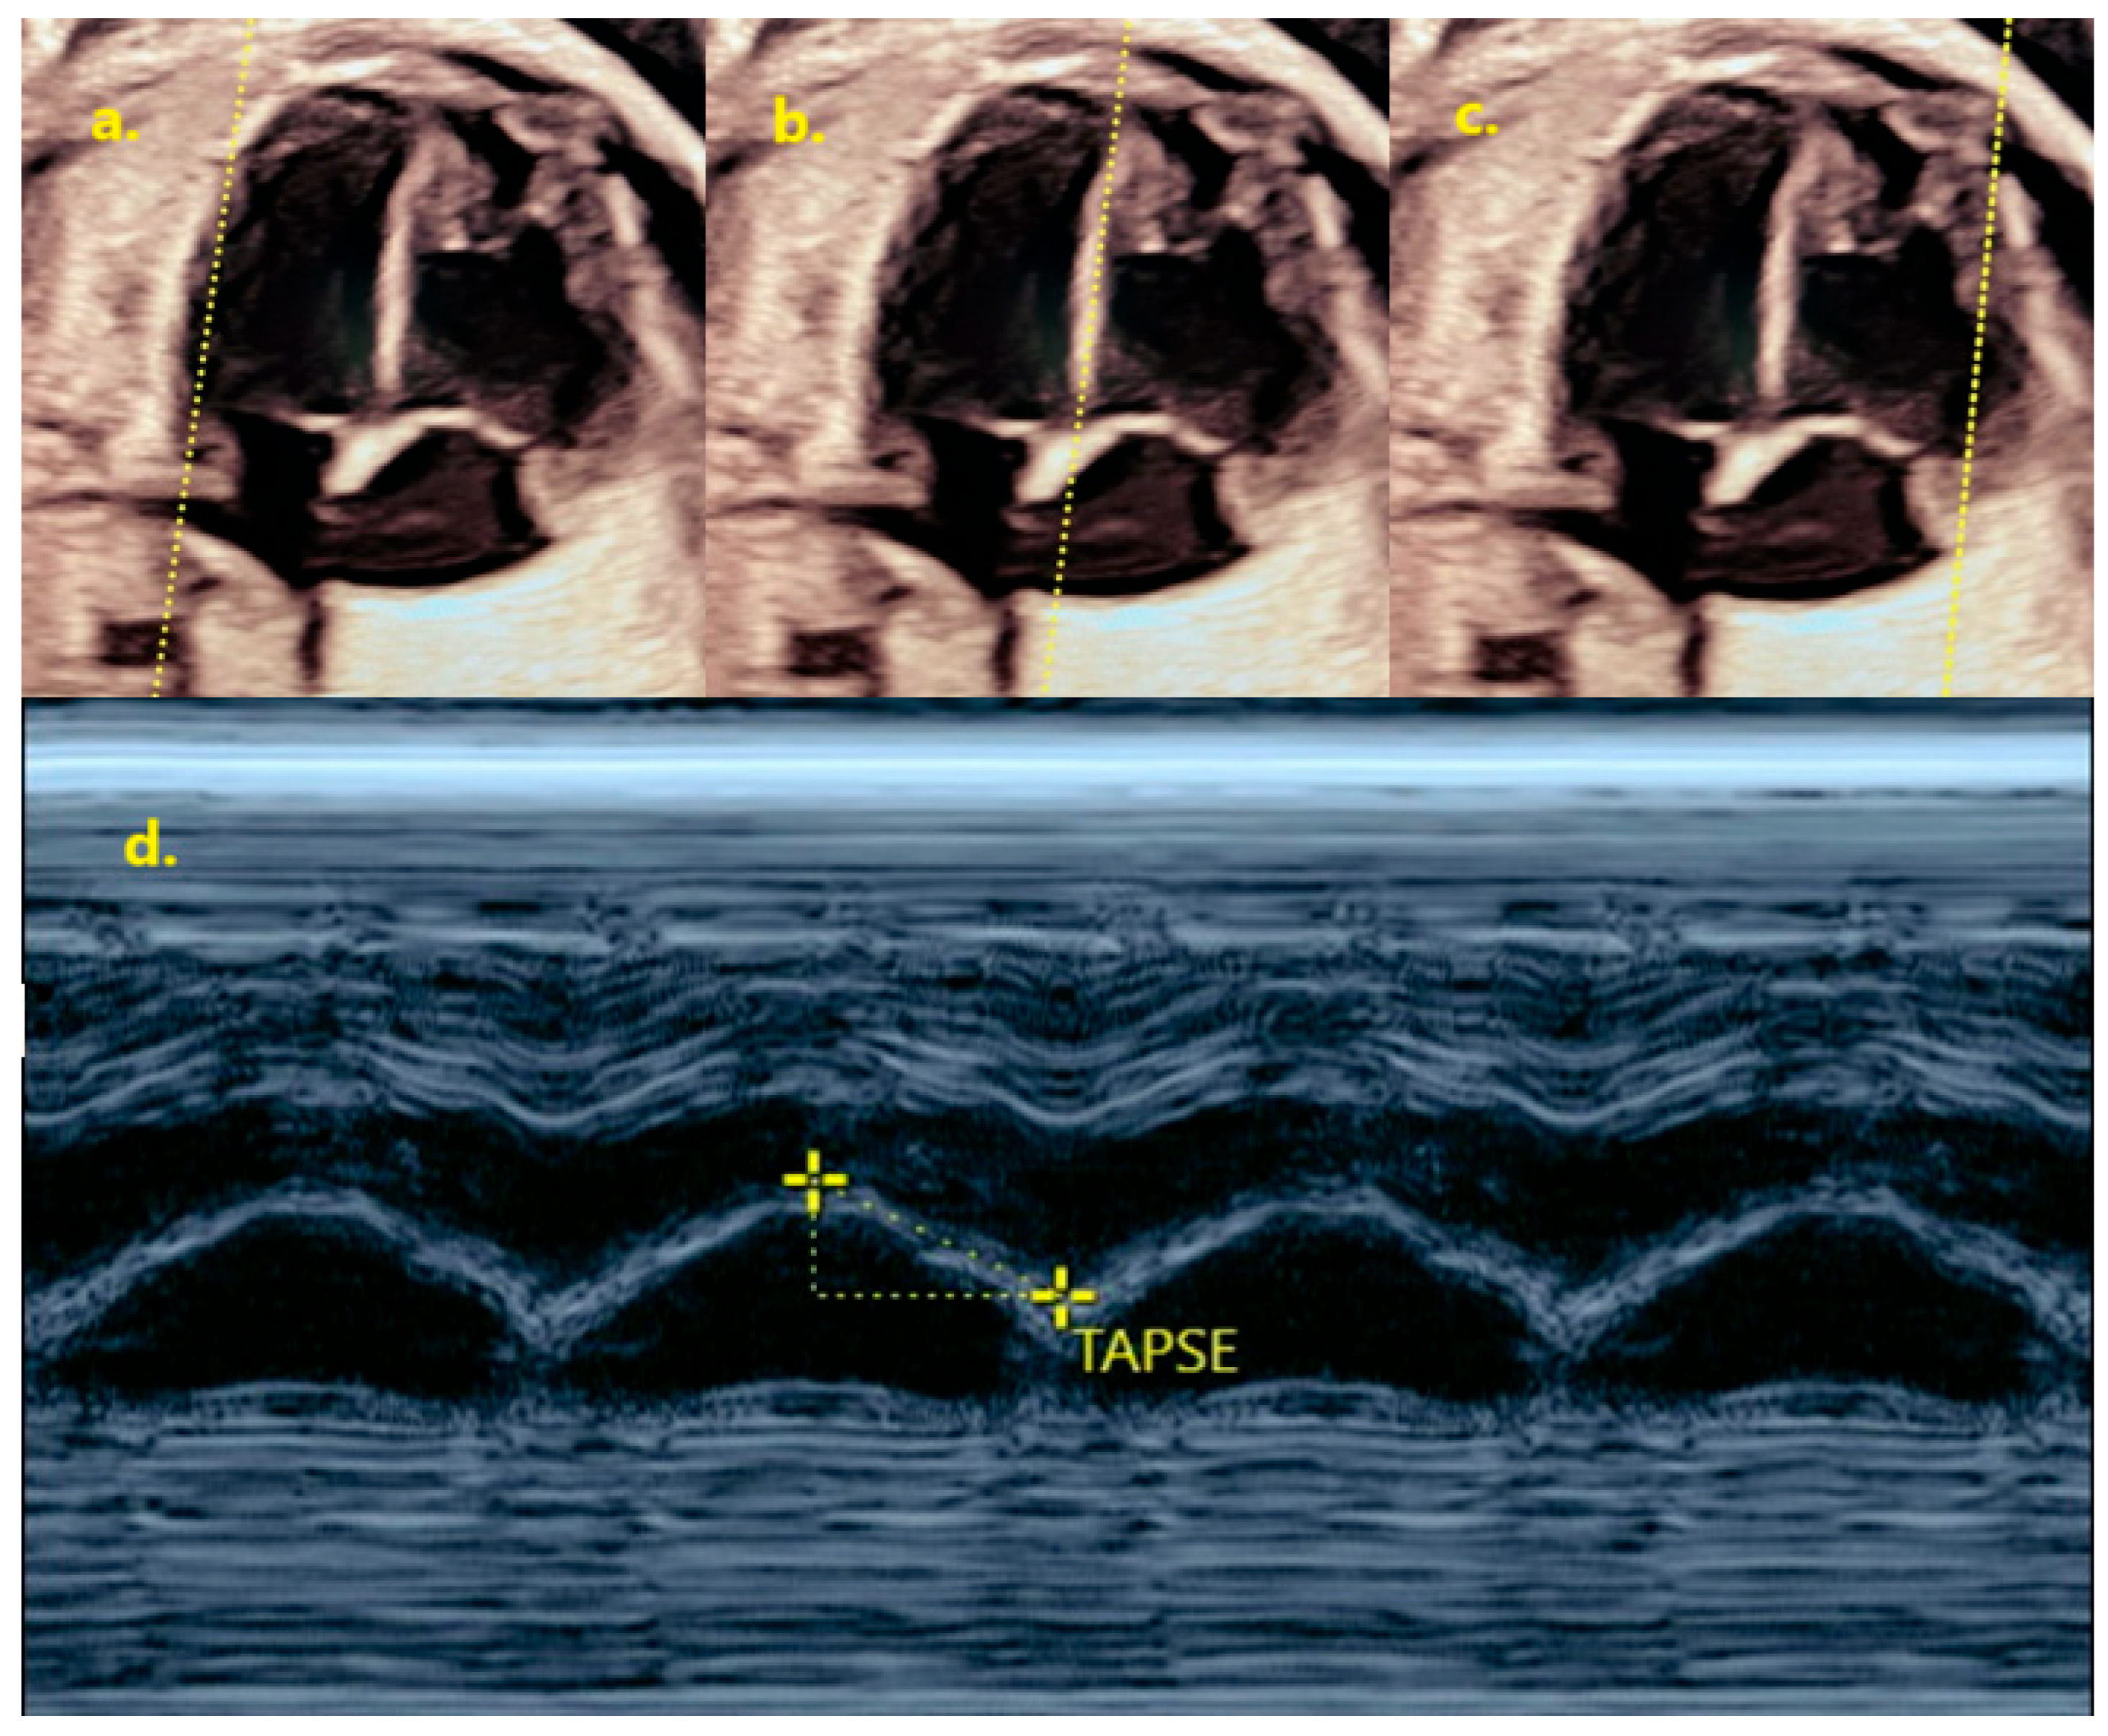
MAPSE, TAPSE, and SAPSE can be measured by motion mode (M-mode) applied to 2D images in real time [66]. The fetal heart should be placed in an apical or basal four-chamber view. The cursor should be positioned parallel to the atrioventricular septum and ventricular free walls. It crosses the annular plane perpendicularly at the basal septum and at the mitral and tricuspid valvular rings, respectively (Figure 32) [66].
The ultrasound beam is kept as parallel as possible to the ventricular wall or interventricular septum. The angle of insonation, with no angle corrections applied, should be less than 30° (Figure 31) [67].
The maximum amplitude of motion is measured as the extent of displacement of the annulus plane between the end of systole (peak of the curve) and the end of diastole (nadir of the curve), measured in mm [67].

5.3.3. Tissue Doppler Imaging (TDI) TAPSE/MAPSE/SAPSE

Atrioventricular annular plane displacement (AVPD) can be assessed by pulsed-wave tissue Doppler imaging (PW-TDI) [68]. To assess the displacement, myocardial and septal wall motion are assessed [69].
The technique is performed by placing a 1–2 mm sample at the level of the atrioventricular plane, where it crosses over the free ventricular walls and at the basal interventricular septum. The cursor should be lying as parallel as possible to the myocardial wall [69].
The angle at which the ultrasound beam enters the myocardial or septal wall, known as the insonation angle, should be less than 15 degrees. Velocity waveforms are recorded throughout the entire cardiac cycle, and data from three to six cardiac cycles are captured at a sweep speed of 100 mm/s [69].
S′ represents the myocardial velocity during systole. E′ and A′ represent the myocardial velocity during the two phases of diastole: early filling and atrial contraction phase of the cardiac cycle, respectively [70].
Atrioventricular annular plane displacement (AVPD) is measured as the velocity time integral of the systolic waveform (S’). The measurement is obtained (in cm) by evaluating the annular motion during ejection and its maximum velocity waveform (Figure 33) [68].

5.3.4. Spatio-Temporal Image Correlation (STIC) TAPSE/MAPSE/SAPSE

The fetal cardiac volume of interest (VOI) should be acquired in the four-chamber view with the fetal spine at the 6 o’clock posterior position. The best acquisition features rely on an angle between 20 and 40 degrees (depending on the size of the fetus), a period between 7.5 and 30 s and a frame rate of about 150 frames per second [49,71,72].
To measure fetal MAPSE and TAPSE, the STIC-M key is activated. The cursor is placed at the atrioventricular junction, marked by mitral and tricuspid valves, respectively (Figure 34 and Figure 35) [66,72]. To measure SAPSE, the cursor is placed at the atrioventricular junction crossing over the ventricular septum (Figure 36).
Once the STIC M-Mode trace is obtained as described, the maximum systolic excursion is assessed as the extent of displacement between end-systole and end-diastole (measured in mm) (Figure 33 and Figure 34).
The maximum systolic amplitude of motion is measured as the distance between the nadir and the zenith of the annular motion profile measured between the end-diastole (just after closing of the atrioventricular valves) and the end-systole (before opening of the atrioventricular valves) (23).
Nomograms, clinical significance and limitations of each functional parameter described in this practical guide are summarised in Table 2.

Author Contributions

Conceptualisation, A.E. and A.W.W.; writing—original draft preparation, A.E. and A.W.W.; writing—review and editing, A.E., A.W.W., H.A., N.M. and F.C. All authors have read and agreed to the published version of the manuscript.

Funding

This practical guide is part of Dr Anna Erenbourg’s PhD work, funded by UNSW and the Royal Hospital for Women Foundation (Sydney, Australia).

Institutional Review Board Statement

Not applicable.

Informed Consent Statement

Not applicable.

Data Availability Statement

No new data were created or analyzed in this study. Data sharing is not applicable to this article.

Conflicts of Interest

The authors declare no conflicts of interest.

Abbreviations

AAtrial contraction diastolic filling
A′Velocity during atrial contraction diastolic filling
AoIAortic isthmus
AVPDAtrioventricular annular plane displacement
AVAortic valve
AVAtrioventricular valves
B-ModeBrightness mode
BVODBiventricular outer dimension
CACardiac area
COCardiac output
CTARCardiothoracic area ratio.
2DTwo-dimensional
3DThree-dimensional
DADuctus arteriosus
DAODescending aorta
EEarly diastolic passive filling
E′Velocity during early diastolic passive filling
E/ARatio E wave and A wave ratio
EFEjection fraction
ETEjection time
ET′Tissue ejection time
ETFEjection time fraction
FACFractional area change
FHRFetal heart rate
FTFFilling time fraction
HzHertz
ICTIsovolumetric contraction time
ICT′Tissue isovolumetric contraction time
IRTIsovolumetric relaxation time
IRT′Tissue isovolumetric relaxation time
IVSTInterventricular septum thickness
IVCVIsovolumic contraction velocity
LALeft atrium
LAALeft atrial area
LALDLeft atrial longitudinal diameter
LATDLeft atrial transverse diameter
LCDLongitudinal cardiac diameter
LPALeft pulmonary artery
LVLeft ventricle
LVALeft ventricular area
LVBDLeft basal transverse diameter
LVDLeft ventricular diameter
LVEDDLeft ventricular end-diastolic dimension
LVESVLeft ventricular end-systolic dimension
LVEDVLeft ventricular end-diastolic volume
LVESVLeft ventricular end-systolic volume
LVIDLeft ventricular inner dimension
LVISLeft ventricular inner diameter at end-systole
LVLDLeft ventricular longitudinal diameter
LVMTDLeft mid-transverse diameter
LVWTLeft ventricular wall thickness
MAPSEMitral annular plane systolic excursion
MBModerator band
M-ModeMotion mode
Mod-MPIModified myocardial performance index
MPIMyocardial performance index
MPI′Tissue myocardial performance index
MVMitral valve
RARight atrium
RAARight atrial area
RALDRight atrial longitudinal diameter
RATDRight atrial transverse diameter
RPARight pulmonary artery
RVRight ventricle
RVARight ventricular area
RVBDRight basal transverse diameter
RVDRight ventricular diameter
RVIDRight ventricular inner dimension
RVISRight ventricular inner diameter at end-systole
RVLDRight ventricular longitudinal diameter
RVMTDRight mid-transverse diameter
RVWTRight ventricular wall thickness
PVPulmonary veins
PWPulsed-wave
PW-TDIPulsed-wave tissue Doppler imaging
S′Velocity during ventricular systole
SAPSESeptal annular plane systolic excursion
SVStroke volume
SFShortening fraction
STICSpatio-temporal image correlation
SVCSuperior vena cava
SWTSeptal wall thickness
TTrachea
TAPSETricuspid annular plane systolic excursion
TCDTransverse cardiac diameter
TDITissue Doppler imaging
TRTricuspid regurgitation
TVTricuspid valve
VDVentricular diameter
VOCALVirtual Organ Computer-aided Analysis
VVVentricular volume
VTIVelocity time integral

References

  1. Crispi, F.; Sepúlveda-Martínez, Á.; Crovetto, F.; Gómez, O.; Bijnens, B.; Gratacós, E. Main Patterns of Fetal Cardiac Remodeling. Fetal Diagn. Ther. 2020, 47, 337–344. [Google Scholar] [CrossRef] [Scilit]
  2. Depla, A.L.; De Wit, L.; Steenhuis, T.J.; Slieker, M.G.; Voormolen, D.N.; Scheffer, P.G.; De Heus, R.; Van Rijn, B.B.; Bekker, M.N. Effect of maternal diabetes on fetal heart function on echocardiography: Systematic review and meta-analysis. Ultrasound Obstet. Gynecol. 2021, 57, 539–550. [Google Scholar] [CrossRef] [Scilit]
  3. Youssef, L.; Miranda, J.; Paules, C.; Garcia-Otero, L.; Vellvé, K.; Kalapotharakos, G.; Sepulveda-Martinez, A.; Crovetto, F.; Gomez, O.; Gratacós, E.; et al. Fetal cardiac remodeling and dysfunction is associated with both preeclampsia and fetal growth restriction. Am. J. Obstet. Gynecol. 2020, 222, 79.e1–79.e9. [Google Scholar] [CrossRef] [Scilit]
  4. Kolding, L.; Eken, H.; Uldbjerg, N. Drug exposure during pregnancy and fetal cardiac function—A systematic review. J. Perinat. Med. 2020, 48, 199–208. [Google Scholar] [CrossRef] [Scilit]
  5. Huluta, I.; Wright, A.; Cosma, L.M.; Dimopoulou, S.; Nicolaides, K.H.; Charakida, M. Fetal cardiac function at midgestation and conception by in-vitro fertilization. Ultrasound Obstet. Gynecol. 2023, 61, 587–592. [Google Scholar] [CrossRef] [Scilit] [PubMed]
  6. Eckersley, L.; Hornberger, L.K. Cardiac function and dysfunction in the fetus. Echocardiography 2017, 34, 1776–1787. [Google Scholar] [CrossRef] [Scilit] [PubMed]
  7. García-Otero, L.; Soveral, I.; Sepúlveda-Martínez, Á.; Rodriguez-López, M.; Torres, X.; Guirado, L.; Nogué, L.; Valenzuela-Alcaraz, B.; Martínez, J.M.; Gratacós, E.; et al. Reference ranges for fetal cardiac, ventricular and atrial relative size, sphericity, ventricular dominance, wall asymmetry and relative wall thickness from 18 to 41 gestational weeks. Ultrasound Obstet. Gynecol. 2021, 58, 388–397. [Google Scholar] [CrossRef] [Scilit] [PubMed]
  8. Mada, R.O.; Lysyansky, P.; Daraban, A.M.; Duchenne, J.; Voigt, J.U. How to define end-diastole and end-systole? Impact of timing on strain measurements. JACC Cardiovasc. Imaging 2015, 8, 148–157. [Google Scholar] [CrossRef] [Scilit]
  9. International Society of Ultrasound in Obstetrics and Gynecology; Carvalho, J.S.; Allan, L.D.; Chaoui, R.; Copel, J.A.; DeVore, G.R.; Hecher, K.; Lee, W.; Munoz, H.; Paladini, D.; et al. ISUOG Practice Guidelines (updated): Sonographic screening examination of the fetal heart. Ultrasound Obstet. Gynecol. 2013, 41, 348–359. [Google Scholar] [CrossRef] [Scilit]
  10. Sompagdee, N.; Anuwutnavin, S.; Burapasikarin, C.; Ruangvutilert, P.; Thongkloung, P. Nomograms of fetal cardiothoracic ratio from 17 to 37 weeks’ gestation as assessed by three different measurement techniques and their correlation with gestational age. Prenat. Diagn. 2021, 41, 1658–1667. [Google Scholar] [CrossRef] [Scilit]
  11. DeVore, G.R.; Tabsh, K.; Polanco, B.; Satou, G.; Sklansky, M. Fetal Heart Size: A Comparison Between the Point-to-Point Trace and Automated Ellipse Methods Between 20 and 40 Weeks’ Gestation. J. Ultrasound Med. 2016, 35, 2543–2562. [Google Scholar] [CrossRef] [Scilit]
  12. Awadh, A.M.; Prefumo, F.; Bland, J.M.; Carvalho, J.S. Assessment of the intraobserver variability in the measurement of fetal cardiothoracic ratio using ellipse and diameter methods. Ultrasound Obstet. Gynecol. 2006, 28, 53–56. [Google Scholar] [CrossRef] [Scilit]
  13. García-Otero, L.; Gómez, O.; Rodriguez-López, M.; Torres, X.; Soveral, I.; Sepúlveda-Martínez, Á.; Guirado, L.; Valenzuela-Alcaraz, B.; López, M.; Martínez, J.M.; et al. Nomograms of Fetal Cardiac Dimensions at 18–41 Weeks of Gestation. Fetal Diagn. Ther. 2020, 47, 387–398. [Google Scholar] [CrossRef] [Scilit]
  14. Lang, R.M.; Badano, L.P.; Mor-Avi, V.; Afilalo, J.; Armstrong, A.; Ernande, L.; Flachskampf, F.A.; Foster, E.; Goldstein, S.A.; Kuznetsova, T.; et al. Recommendations for cardiac chamber quantification by echocardiography in adults: An update from the American Society of Echocardiography and the European Association of Cardiovascular Imaging. J. Am. Soc. Echocardiogr. 2015, 28, 1–39.e14. [Google Scholar] [CrossRef] [Scilit]
  15. Lopez, L.; Colan, S.D.; Frommelt, P.C.; Ensing, G.J.; Kendall, K.; Younoszai, A.K.; Lai, W.W.; Geva, T. Recommendations for quantification methods during the performance of a pediatric echocardiogram: A report from the Pediatric Measurements Writing Group of the American Society of Echocardiography Pediatric and Congenital Heart Disease Council. J. Am. Soc. Echocardiogr. 2010, 23, 465–495. [Google Scholar] [CrossRef] [Scilit] [PubMed]
  16. Vieira, M.F.; Bravo-Valenzuela, N.J.; Carvalho, F.H.C.; da Rocha Amorim, L.A.; Araujo Júnior, E. Reference Ranges and Z-Score Equations for 19 Fetal Cardiac Biometry Structures from 18 to 34 Weeks’ Gestation. J. Ultrasound Med. 2025, 44, 467–482. [Google Scholar] [CrossRef] [Scilit] [PubMed]
  17. Vasciaveo, L.; Zanzarelli, E.; D Antonio, F. Fetal cardiac function evaluation: A review. J. Clin. Ultrasound 2023, 51, 215–224. [Google Scholar] [CrossRef] [Scilit]
  18. DeVore, G.R.; Klas, B.; Satou, G.; Sklansky, M. 24-segment sphericity index: A new technique to evaluate fetal cardiac diastolic shape. Ultrasound Obstet. Gynecol. 2018, 51, 650–658. [Google Scholar] [CrossRef] [Scilit] [PubMed]
  19. Sjögren, A.L. Left ventricular wall thickness determined by ultrasound in 100 subjects without heart disease. Chest 1971, 60, 341–346. [Google Scholar] [CrossRef] [Scilit]
  20. Meller, J.; Herman, M.V.; Teichholz, L.E. Noninvasive assessment of left ventricular function. Adv. Intern. Med. 1979, 24, 331–357. [Google Scholar]
  21. Foppa, M.; Duncan, B.B.; Rohde, L.E. Echocardiography-based left ventricular mass estimation. How should we define hypertrophy? Cardiovasc. Ultrasound 2005, 3, 17. [Google Scholar] [CrossRef] [Scilit] [PubMed]
  22. Crispi, F.; Nogué, L.; Pérez, M.; Masoller, N.; Escobar-Díaz, M.C.; Bennasar, M.; Martínez, J.M.; Gómez, O. Protocolo Ecocardiografia Functional Fetal; BCNatal Fetal Medicine Research Center: Barcelona, Spain, 2014. [Google Scholar]
  23. Soveral, I.; Crispi, F.; Guirado, L.; García-Otero, L.; Torres, X.; Bennasar, M.; Sepúlveda-Martínez, Á.; Nogué, L.; Gratacós, E.; Martínez, J.M.; et al. Fetal cardiac filling and ejection time fractions by pulsed-wave Doppler: Reference ranges and potential clinical application. Ultrasound Obstet. Gynecol. 2021, 58, 83–91. [Google Scholar] [CrossRef] [Scilit] [PubMed]
  24. Quarello, E.; Bault, J.P.; Chaoui, R. Prenatal three-vessel and tracheal view: Normal features. Gynecol. Obstet. Fertil. 2014, 42, 185–193. [Google Scholar] [CrossRef] [Scilit]
  25. Abuhamad, A.Z.; Chaoui, R. (Eds.) A Practical Guide to Fetal Echocardiography: Normal and Abnormal Hearts; Wolters Kluwer: Philadelphia, PA, USA, 2009. [Google Scholar]
  26. Hernandez-Andrade, E.; Benavides-Serralde, J.A.; Cruz-Martinez, R.; Welsh, A.; Mancilla-Ramirez, J. Evaluation of conventional Doppler fetal cardiac function parameters: E/A ratios, outflow tracts, and myocardial performance index. Fetal Diagn. Ther. 2012, 32, 22–29. [Google Scholar] [CrossRef] [Scilit]
  27. Crispi, F.; Valenzuela-Alcaraz, B.; Cruz-Lemini, M.; Gratacós, E. Ultrasound assessment of fetal cardiac function. Australas. J. Ultrasound Med. 2013, 16, 158–167. [Google Scholar] [CrossRef] [Scilit]
  28. Simpson, J.; Zidere, V.; Miller, O. Fetal Cardiology: A Practical Approach to Diagnosis and Management; Springer: Cham, Switzerland, 2018. [Google Scholar]
  29. Gómez-Montes, E.; Herraiz, I.; Villalain, C.; Galindo, A. Second trimester echocardiography. Best Pract. Res. Clin. Obstet. Gynaecol. 2025, 100, 102592. [Google Scholar] [CrossRef] [Scilit]
  30. DeVore, G.R. Assessing fetal cardiac ventricular function. Semin. Fetal Neonatal Med. 2005, 10, 515–541. [Google Scholar] [CrossRef] [Scilit]
  31. Laudy, J.A.; Huisman, T.W.; de Ridder, M.A.; Wladimiroff, J.W. Normal fetal pulmonary venous blood flow velocity. Ultrasound Obstet. Gynecol. 1995, 6, 277–281. [Google Scholar] [CrossRef] [Scilit]
  32. van der Mooren, K.; Barendregt, L.G.; Wladimiroff, J.W. Fetal atrioventricular and outflow tract flow velocity waveforms during normal second half of pregnancy. Am. J. Obstet. Gynecol. 1991, 165, 668–674. [Google Scholar] [CrossRef] [Scilit] [PubMed]
  33. Gámez, F.; Rodríguez, M.J.; Tenías, J.M.; García, J.; Pintado, P.; Martín, R.; Pérez, R.; Ortiz-Quintana, L.; De León-Luis, J. Reference ranges for the pulsatility index of the fetal aortic isthmus in singleton and twin pregnancies. J. Ultrasound Med. 2015, 34, 577–584. [Google Scholar] [CrossRef] [Scilit]
  34. Gerards, F.A.; Twisk, J.W.; van Vugt, J.M. Doppler velocimetry of the ductus arteriosus in normal fetuses and fetuses suspected for pulmonary hypoplasia. Fetal Diagn. Ther. 2009, 26, 143–147. [Google Scholar] [CrossRef] [Scilit]
  35. Tynan, D.; Alphonse, J.; Henry, A.; Welsh, A.W. The Aortic Isthmus: A Significant yet Underexplored Watershed of the Fetal Circulation. Fetal Diagn. Ther. 2016, 40, 81–93. [Google Scholar] [CrossRef] [Scilit]
  36. Mielke, G.; Benda, N. Blood flow velocity waveforms of the fetal pulmonary artery and the ductus arteriosus: Reference ranges from 13 weeks to term. Ultrasound Obstet. Gynecol. 2000, 15, 213–218. [Google Scholar] [CrossRef] [Scilit]
  37. Gou, Z.; Zhang, J.; Yan, X.; Wang, Z.; Li, S.; Deng, X. Variations in ductus arteriosus Doppler parameters in different sonographic views during the second half of gestation. Exp. Ther. Med. 2019, 17, 502–506. [Google Scholar] [CrossRef] [Scilit]
  38. Del Río, M.; Martínez, J.M.; Figueras, F.; Bennasar, M.; Palacio, M.; Gómez, O.; Coll, O.; Puerto, B.; Cararach, V. Doppler assessment of fetal aortic isthmus blood flow in two different sonographic planes during the second half of gestation. Ultrasound Obstet. Gynecol. 2005, 26, 170–174. [Google Scholar] [CrossRef] [Scilit]
  39. Van Mieghem, T.; DeKoninck, P.; Steenhaut, P.; Deprest, J. Methods for prenatal assessment of fetal cardiac function. Prenat. Diagn. 2009, 29, 1193–1203. [Google Scholar] [CrossRef] [Scilit]
  40. Dodge, H.T.; Sandler, H.; Ballew, D.W.; Lord, J.D., Jr. The use of biplane angiocardigraphy for the measurement of left ventricular volume in man. Am. Heart J. 1960, 60, 762–776. [Google Scholar] [CrossRef] [Scilit] [PubMed]
  41. Teichholz, L.E.; Kreulen, T.; Herman, M.V.; Gorlin, R. Problems in echocardiographic volume determinations: Echocardiographic-angiographic correlations in the presence or absence of asynergy. Am. J. Cardiol. 1976, 37, 7–11. [Google Scholar] [CrossRef] [Scilit]
  42. Kim, W.C.; Beqiri, A.; Lewandowski, A.J.; Puyol-Antón, E.; Markham, D.C.; King, A.P.; Leeson, P.; Lamata, P. Beyond Simpson s Rule: Accounting for Orientation and Ellipticity Assumptions. Ultrasound Med. Biol. 2022, 48, 2476–2485. [Google Scholar] [CrossRef] [Scilit] [PubMed]
  43. Schmidt, K.G.; Silverman, N.H.; Hoffman, J.I. Determination of ventricular volumes in human fetal hearts by two-dimensional echocardiography. Am. J. Cardiol. 1995, 76, 1313–1316. [Google Scholar] [CrossRef] [Scilit] [PubMed]
  44. Schmidt, K.G.; Silverman, N.H.; Van Hare, G.F.; Hawkins, J.A.; Cloez, J.L.; Rudolph, A.M. Two-dimensional echocardiographic determination of ventricular volumes in the fetal heart. Validation studies in fetal lambs. Circulation 1990, 81, 325–333. [Google Scholar] [CrossRef] [Scilit]
  45. Guirado, L.; Crispi, F.; Soveral, I.; Valenzuela-Alcaraz, B.; Rodriguez-López, M.; García-Otero, L.; Torres, X.; Sepúlveda-Martínez, Á.; Escobar-Diaz, M.C.; Martínez, J.M.; et al. Nomograms of Fetal Right Ventricular Fractional Area Change by 2D Echocardiography. Fetal Diagn. Ther. 2020, 47, 399–410. [Google Scholar] [CrossRef] [Scilit] [PubMed]
  46. Levy, P.T.; Dioneda, B.; Holland, M.R.; Sekarski, T.J.; Lee, C.K.; Mathur, A.; Cade, W.T.; Cahill, A.G.; Hamvas, A.; Singh, G.K. Right ventricular function in preterm and term neonates: Reference values for right ventricle areas and fractional area of change. J. Am. Soc. Echocardiogr. 2015, 28, 559–569. [Google Scholar] [CrossRef] [Scilit]
  47. James, A.T.; Corcoran, J.D.; Franklin, O.; El-Khuffash, A.F. Clinical utility of right ventricular fractional area change in preterm infants. Early Hum. Dev. 2016, 92, 19–23. [Google Scholar] [CrossRef] [Scilit]
  48. Bravo-Valenzuela, N.J.; Peixoto, A.B.; Carrilho, M.C.; Siqueira Pontes, A.L.; Chagas, C.C.; Simioni, C.; Júnior, E.A. Fetal cardiac function by three-dimensional ultrasound using 4D-STIC and VOCAL—An update. J. Ultrason. 2019, 19, 287–294. [Google Scholar] [CrossRef] [Scilit]
  49. Gonçalves, L.F.; Lee, W.; Espinoza, J.; Romero, R. Examination of the fetal heart by four-dimensional (4D) ultrasound with spatio-temporal image correlation (STIC). Ultrasound Obstet. Gynecol. 2006, 27, 336–348. [Google Scholar] [CrossRef] [Scilit]
  50. Chaoui, R.; Hoffmann, J.; Heling, K.S. Three-dimensional (3D) and 4D color Doppler fetal echocardiography using spatio-temporal image correlation (STIC). Ultrasound Obstet. Gynecol. 2004, 23, 535–545. [Google Scholar] [CrossRef] [Scilit]
  51. Messing, B.; Cohen, S.M.; Valsky, D.V.; Rosenak, D.; Hochner-Celnikier, D.; Savchev, S.; Yagel, S. Fetal cardiac ventricle volumetry in the second half of gestation assessed by 4D ultrasound using STIC combined with inversion mode. Ultrasound Obstet. Gynecol. 2007, 30, 142–151. [Google Scholar] [CrossRef] [Scilit]
  52. Espinoza, J.; Gonçalves, L.F.; Lee, W.; Mazor, M.; Romero, R. A novel method to improve prenatal diagnosis of abnormal systemic venous connections using three- and four-dimensional ultrasonography and ‘inversion mode’. Ultrasound Obstet. Gynecol. 2005, 25, 428–434. [Google Scholar] [CrossRef] [Scilit] [PubMed]
  53. Yagel, S.; Cohen, S.M.; Shapiro, I.; Valsky, D.V. 3D and 4D ultrasound in fetal cardiac scanning: A new look at the fetal heart. Ultrasound Obstet. Gynecol. 2007, 29, 81–95. [Google Scholar] [CrossRef] [Scilit] [PubMed]
  54. Gonçalves, L.F.; Espinoza, J.; Lee, W.; Mazor, M.; Romero, R. Three- and four-dimensional reconstruction of the aortic and ductal arches using inversion mode: A new rendering algorithm for visualization of fluid-filled anatomical structures. Ultrasound Obstet. Gynecol. 2004, 24, 696–698. [Google Scholar] [CrossRef] [Scilit]
  55. Lee, W.; Gonçalves, L.F.; Espinoza, J.; Romero, R. Inversion mode: A new volume analysis tool for 3-dimensional ultrasonography. J. Ultrasound Med. 2005, 24, 201–207. [Google Scholar] [CrossRef] [Scilit] [PubMed]
  56. Tongsong, T.; Wanapirak, C.; Piyamongkol, W.; Sirichotiyakul, S.; Tongprasert, F.; Srisupundit, K.; Luewan, S. Fetal ventricular shortening fraction in hydrops fetalis. Obstet. Gynecol. 2011, 117, 84–91. [Google Scholar] [CrossRef] [Scilit] [PubMed]
  57. Hernandez-Andrade, E.; López-Tenorio, J.; Figueroa-Diesel, H.; Sanin-Blair, J.; Carreras, E.; Cabero, L.; Gratacos, E. A modified myocardial performance (Tei) index based on the use of valve clicks improves reproducibility of fetal left cardiac function assessment. Ultrasound Obstet. Gynecol. 2005, 26, 227–232. [Google Scholar] [CrossRef] [Scilit] [PubMed]
  58. Hernandez-Andrade, E.; Figueroa-Diesel, H.; Kottman, C.; Illanes, S.; Arraztoa, J.; Acosta-Rojas, R.; Gratacós, E. Gestational-age-adjusted reference values for the modified myocardial performance index for evaluation of fetal left cardiac function. Ultrasound Obstet. Gynecol. 2007, 29, 321–325. [Google Scholar] [CrossRef] [Scilit] [PubMed]
  59. Mahajan, A.; Henry, A.; Meriki, N.; Hernandez-Andrade, E.; Crispi, F.; Wu, L.; Welsh, A.W. The (Pulsed-Wave) Doppler Fetal Myocardial Performance Index: Technical Challenges, Clinical Applications and Future Research. Fetal Diagn. Ther. 2015, 38, 1–13. [Google Scholar] [CrossRef] [Scilit]
  60. Meriki, N.; Izurieta, A.; Welsh, A. Reproducibility of constituent time intervals of right and left fetal modified myocardial performance indices on pulsed Doppler echocardiography: A short report. Ultrasound Obstet. Gynecol. 2012, 39, 654–658. [Google Scholar] [CrossRef] [Scilit] [PubMed]
  61. Dénes, M.; Farkas, K.; Erdei, T.; Lengyel, M. Comparison of tissue Doppler velocities obtained by different types of echocardiography systems: Are they compatible? Echocardiography 2010, 27, 230–235. [Google Scholar] [CrossRef] [Scilit]
  62. Meriki, N.; Welsh, A.W. Technical considerations for measurement of the fetal left modified myocardial performance index. Fetal Diagn. Ther. 2012, 31, 76–80. [Google Scholar] [CrossRef] [Scilit]
  63. Peixoto, A.B.; Bravo-Valenzuela, N.J.; Rocha, L.A.; Araujo Júnior, E. Spectral Doppler, tissue Doppler, and speckle-tracking echocardiography for the evaluation of fetal cardiac function: An update. Radiol. Bras. 2021, 54, 99–106. [Google Scholar] [CrossRef] [Scilit]
  64. Comas, M.; Crispi, F. Assessment of fetal cardiac function using tissue Doppler techniques. Fetal Diagn. Ther. 2012, 32, 30–38. [Google Scholar] [CrossRef] [Scilit] [PubMed]
  65. Harada, K.; Tsuda, A.; Orino, T.; Tanaka, T.; Takada, G. Tissue Doppler imaging in the normal fetus. Int. J. Cardiol. 1999, 71, 227–234. [Google Scholar] [CrossRef] [Scilit]
  66. Peixoto, A.B.; Bravo-Valenzuela, N.J.; Martins, W.P.; Tonni, G.; Mattar, R.; Moron, A.F.; Pares, D.B.; Júnior, E.A. Reference ranges for the fetal mitral, tricuspid, and interventricular septum annular plane systolic excursions (mitral annular plane systolic excursion, tricuspid annular plane systolic excursion, and septum annular plane systolic excursion) between 20 and 36 + 6 weeks of gestation. J. Perinat. Med. 2020, 48, 601–608. [Google Scholar]
  67. Cruz-Lemini, M.; Crispi, F.; Valenzuela-Alcaraz, B.; Figueras, F.; Sitges, M.; Gómez, O.; Bijnens, B.; Gratacós, E. Value of annular M-mode displacement vs tissue Doppler velocities to assess cardiac function in intrauterine growth restriction. Ultrasound Obstet. Gynecol. 2013, 42, 175–181. [Google Scholar] [CrossRef] [Scilit]
  68. Acharya, G. Measurement of atrioventricular annular plane displacement has been revived: Will it prove to be useful in assessing fetal cardiac function? Ultrasound Obstet. Gynecol. 2013, 42, 125–129. [Google Scholar] [CrossRef] [Scilit]
  69. Zanardini, C.; D Antonio, F.; Hvingel, B.; Vårtun, Å.; Prefumo, F.; Flacco, M.E.; Manzoli, L.; Acharya, G. Agreement between anatomical M-mode and tissue Doppler imaging in the assessment of fetal atrioventricular annular plane displacement in uncomplicated pregnancies: A prospective longitudinal study. J. Obstet. Gynaecol. Res. 2019, 45, 2150–2157. [Google Scholar] [CrossRef] [Scilit]
  70. Roberson, D.A.; Cui, W. Tissue Doppler imaging measurement of left ventricular systolic function in children: Mitral annular displacement index is superior to peak velocity. J. Am. Soc. Echocardiogr. 2009, 22, 376–382. [Google Scholar] [CrossRef] [Scilit]
  71. Bravo-Valenzuela, N.J.M.; Peixoto, A.B.; Mattar, R.; Araujo Júnior, E. Fetal cardiac function by mitral and tricuspid annular plane systolic excursion using spatio-temporal image correlation M-mode and left cardiac output in fetuses of pregestational diabetic mothers. Obstet. Gynecol. Sci. 2021, 64, 257–265. [Google Scholar] [CrossRef] [Scilit]
  72. Tedesco, G.D.; de Souza Bezerra, M.; Barros, F.S.B.; Martins, W.P.; Nardozza, L.M.M.; Mattar, R.; Moron, A.F.; Rolo, L.C.; Júnior, E.A. Fetal Heart Function by Tricuspid Annular Plane Systolic Excursion and Ventricular Shortening Fraction Using STIC M-Mode: Reference Ranges and Validation. Am. J. Perinatol. 2017, 34, 1354–1361. [Google Scholar] [CrossRef] [Scilit] [PubMed]
  73. Schneider, C.; McCrindle, B.W.; Carvalho, J.S.; Hornberger, L.K.; McCarthy, K.P.; Daubeney, P.E. Development of Z-scores for fetal cardiac dimensions from echocardiography. Ultrasound Obstet. Gynecol. 2005, 26, 599–605. [Google Scholar] [CrossRef] [Scilit] [PubMed]
  74. Vigneswaran, T.V.; Akolekar, R.; Syngelaki, A.; Charakida, M.; Allan, L.D.; Nicolaides, K.H.; Zidere, V.; Simpson, J.M. Reference Ranges for the Size of the Fetal Cardiac Outflow Tracts from 13 to 36 Weeks Gestation: A Single-Center Study of over 7000 Cases. Circ. Cardiovasc. Imaging 2018, 11, e007575. [Google Scholar] [CrossRef] [Scilit]
  75. Peixoto, A.B.; Bravo-Valenzuela, N.J.M.; Martins, W.P.; Mattar, R.; Moron, A.F.; Araujo Júnior, E. Reference ranges for the left ventricle modified myocardial performance index, respective time periods, and atrioventricular peak velocities between 20 and 36 + 6 weeks of gestation. J. Matern.-Fetal Neonatal Med. 2021, 34, 456–465. [Google Scholar] [CrossRef] [Scilit] [PubMed]
  76. Mao, Y.K.; Zhao, B.W.; Zhou, L.; Wang, B.; Chen, R.; Wang, S.S. Z-score reference ranges for pulsed-wave Doppler indices of the cardiac outflow tracts in normal fetuses. Int. J. Cardiovasc. Imaging 2019, 35, 811–825. [Google Scholar] [CrossRef] [Scilit] [PubMed]
  77. Thanasuan, S.; Phithakwatchara, N.; Nawapan, K. Reference values for fetal aortic isthmus blood flow parameters at 24 to 38 weeks’ gestation. Prenat. Diagn. 2014, 34, 241–245. [Google Scholar] [CrossRef] [Scilit] [PubMed]
  78. Molina, F.S.; Faro, C.; Sotiriadis, A.; Dagklis, T.; Nicolaides, K.H. Heart stroke volume and cardiac output by four-dimensional ultrasound in normal fetuses. Ultrasound Obstet. Gynecol. 2008, 32, 181–187. [Google Scholar] [CrossRef] [Scilit]
  79. Simioni, C.; Nardozza, L.M.; Araujo Júnior, E.; Rolo, L.C.; Zamith, M.; Caetano, A.C.; Moron, A.F. Heart stroke volume, cardiac output, and ejection fraction in 265 normal fetus in the second half of gestation assessed by 4D ultrasound using spatio-temporal image correlation. J. Matern.-Fetal Neonatal Med. 2011, 24, 1159–1167. [Google Scholar] [CrossRef] [Scilit]
  80. Meriki, N.; Henry, A.; Sanderson, J.; Majajan, A.; Wu, L.; Welsh, A.W. Development of normal gestational ranges for the right myocardial performance index in the Australian population with three alternative caliper placements. Fetal Diagn. Ther. 2014, 36, 272–281. [Google Scholar] [CrossRef] [Scilit] [PubMed]
  81. Peixoto, A.B.; Bravo-Valenzuela, N.J.; Martins, W.P.; Mattar, R.; Moron, A.F.; Araujo Júnior, E. Reference ranges for left, right and interventricular septum indices at 20 to 36 + 6 weeks of gestation derived using spectral myocardial tissue Doppler on Voluson ultrasound machines. Med. Ultrason. 2019, 21, 279–287. [Google Scholar] [CrossRef] [Scilit]
  82. Messing, B.; Gilboa, Y.; Lipschuetz, M.; Valsky, D.V.; Cohen, S.M.; Yagel, S. Fetal tricuspid annular plane systolic excursion (f-TAPSE): Evaluation of fetal right heart systolic function with conventional M-mode ultrasound and spatiotemporal image correlation (STIC) M-mode. Ultrasound Obstet. Gynecol. 2013, 42, 182–188. [Google Scholar] [CrossRef] [Scilit]
Figure 1. Fetal cardiothoracic area ratio by automated ellipse method. Two-dimensional transverse view of the fetal thorax at the level of the four-chamber; the heart should be measured at the end of diastole. Heart A: cardiac area; Thorax A: thoracic area; CTAR: cardiothoracic area ratio.
Applsci 16 02972 g001
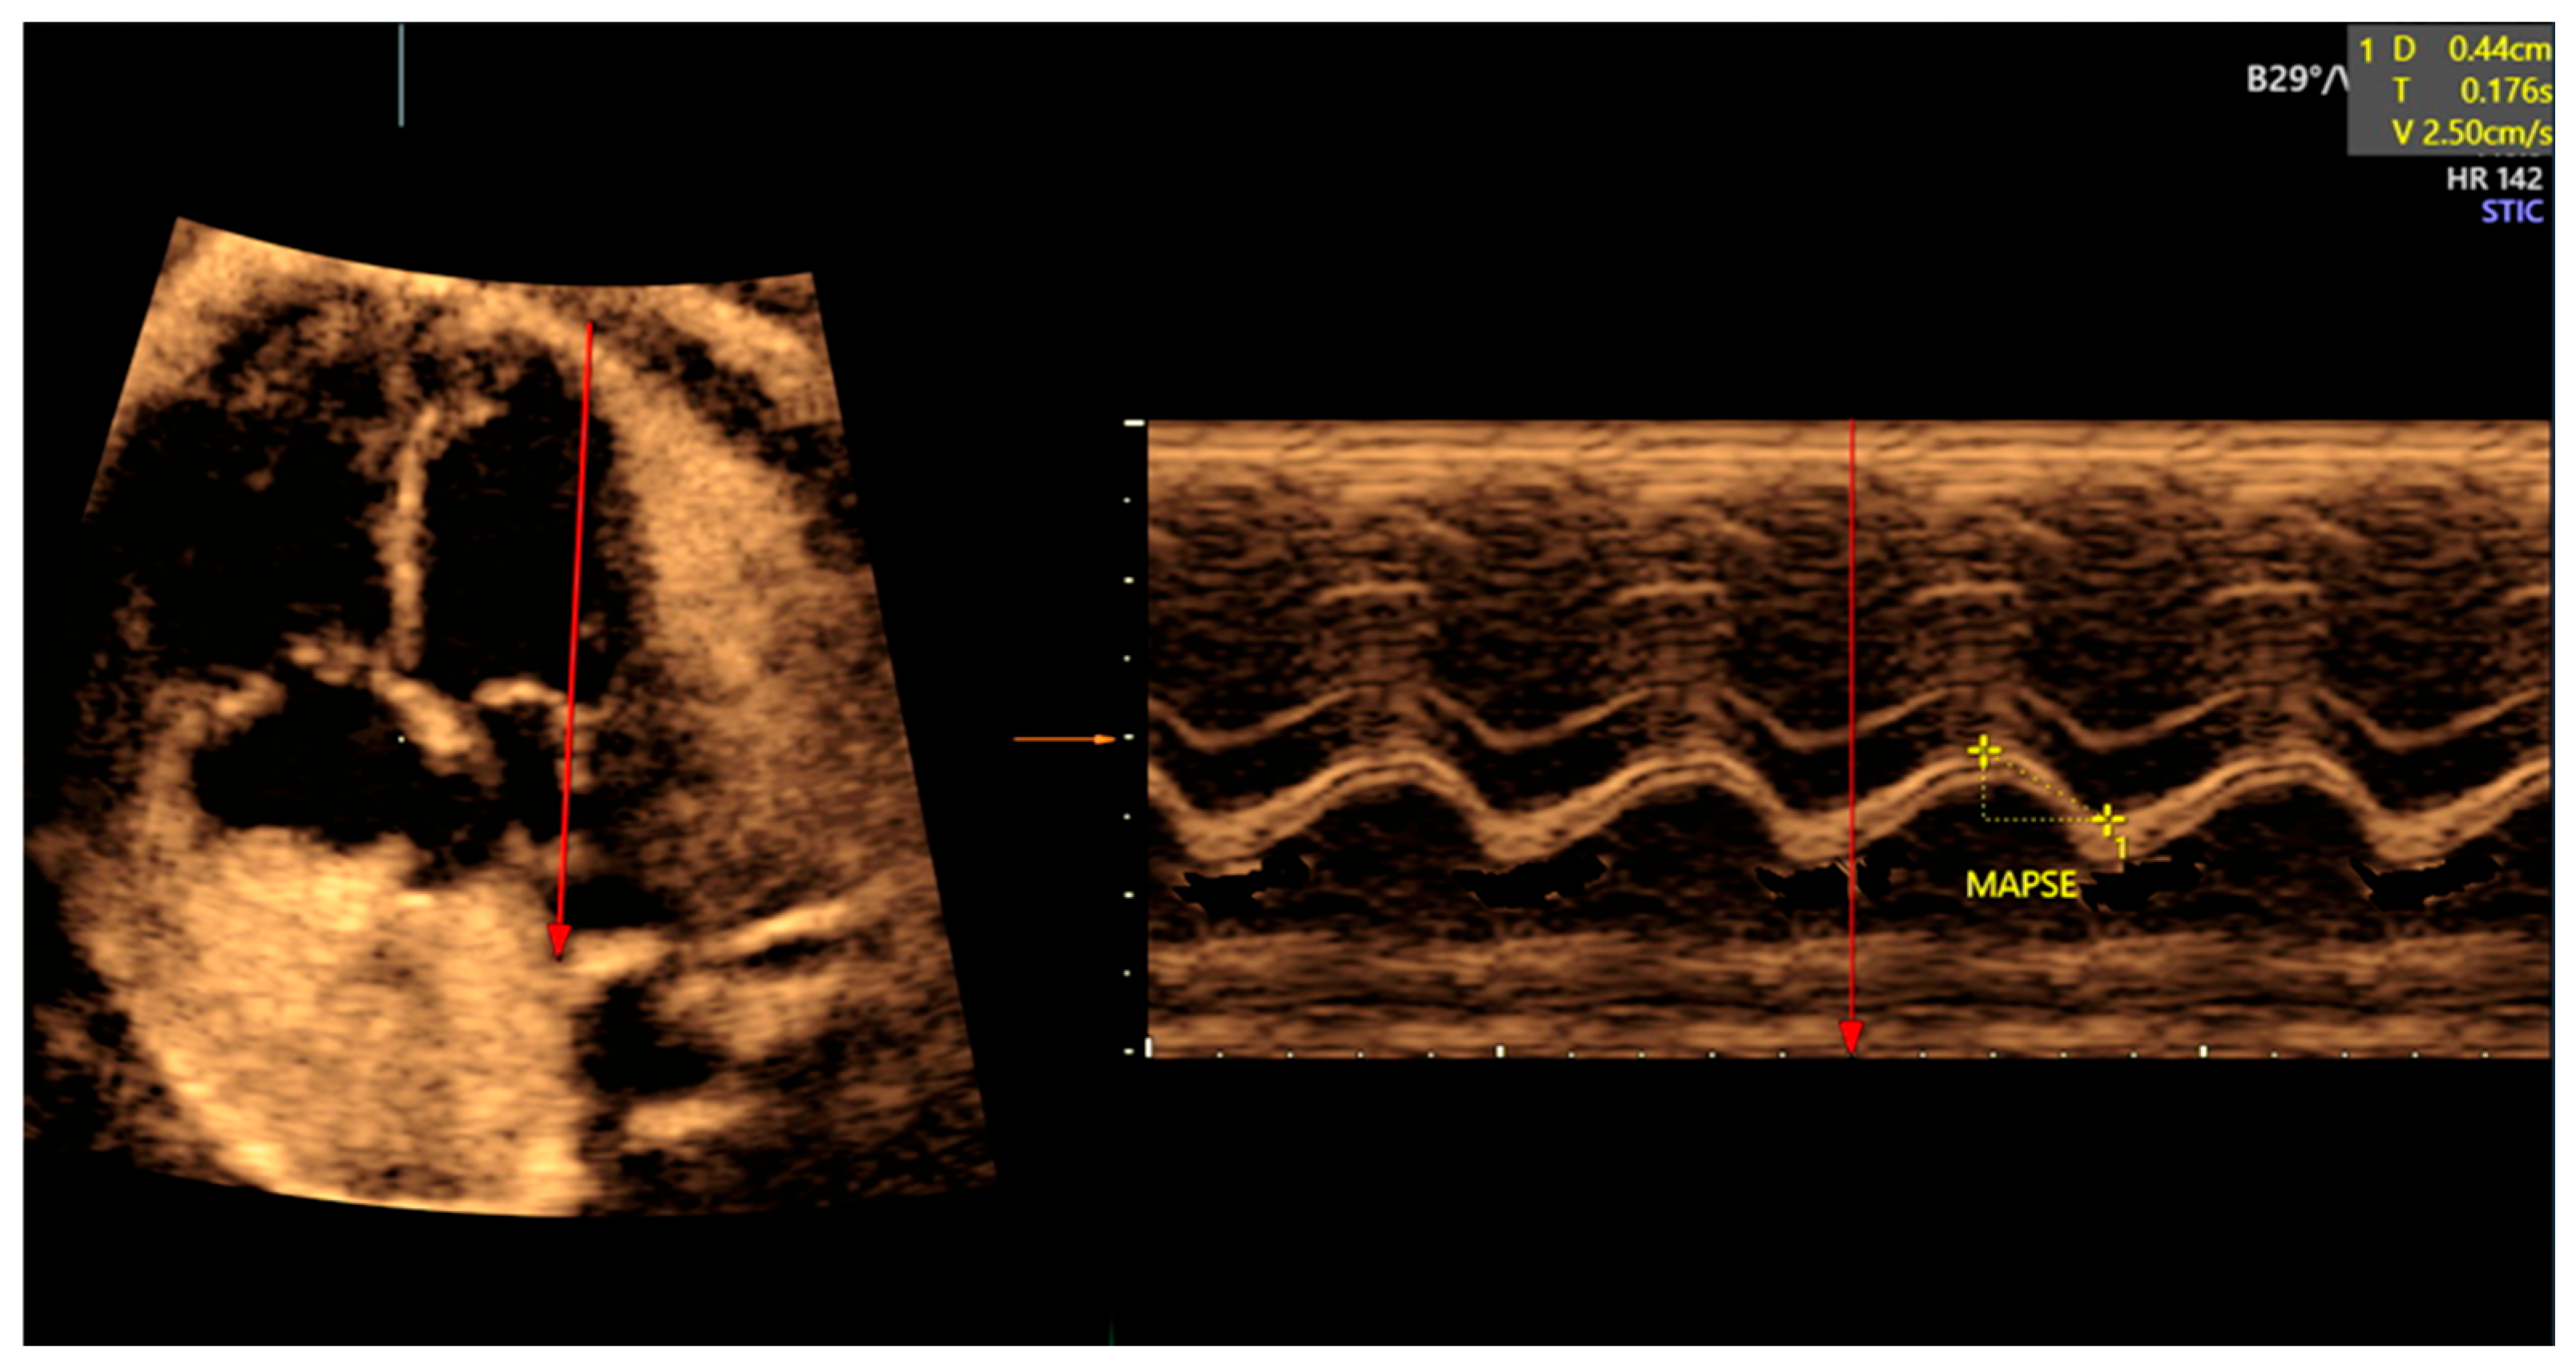
Figure 2. Measurement of atrial, ventricular and cardiac areas. (a) Measurement of left and right atrial areas at the end of systole and cardiac area at the end of diastole. (b) Measurement of left and right ventricular areas, and cardiac area at the end of diastole. LAA: left atrial area; RAA: right atrial area; CA: cardiac area; LVA: left ventricular area; RVA: right ventricular area.
Applsci 16 02972 g002
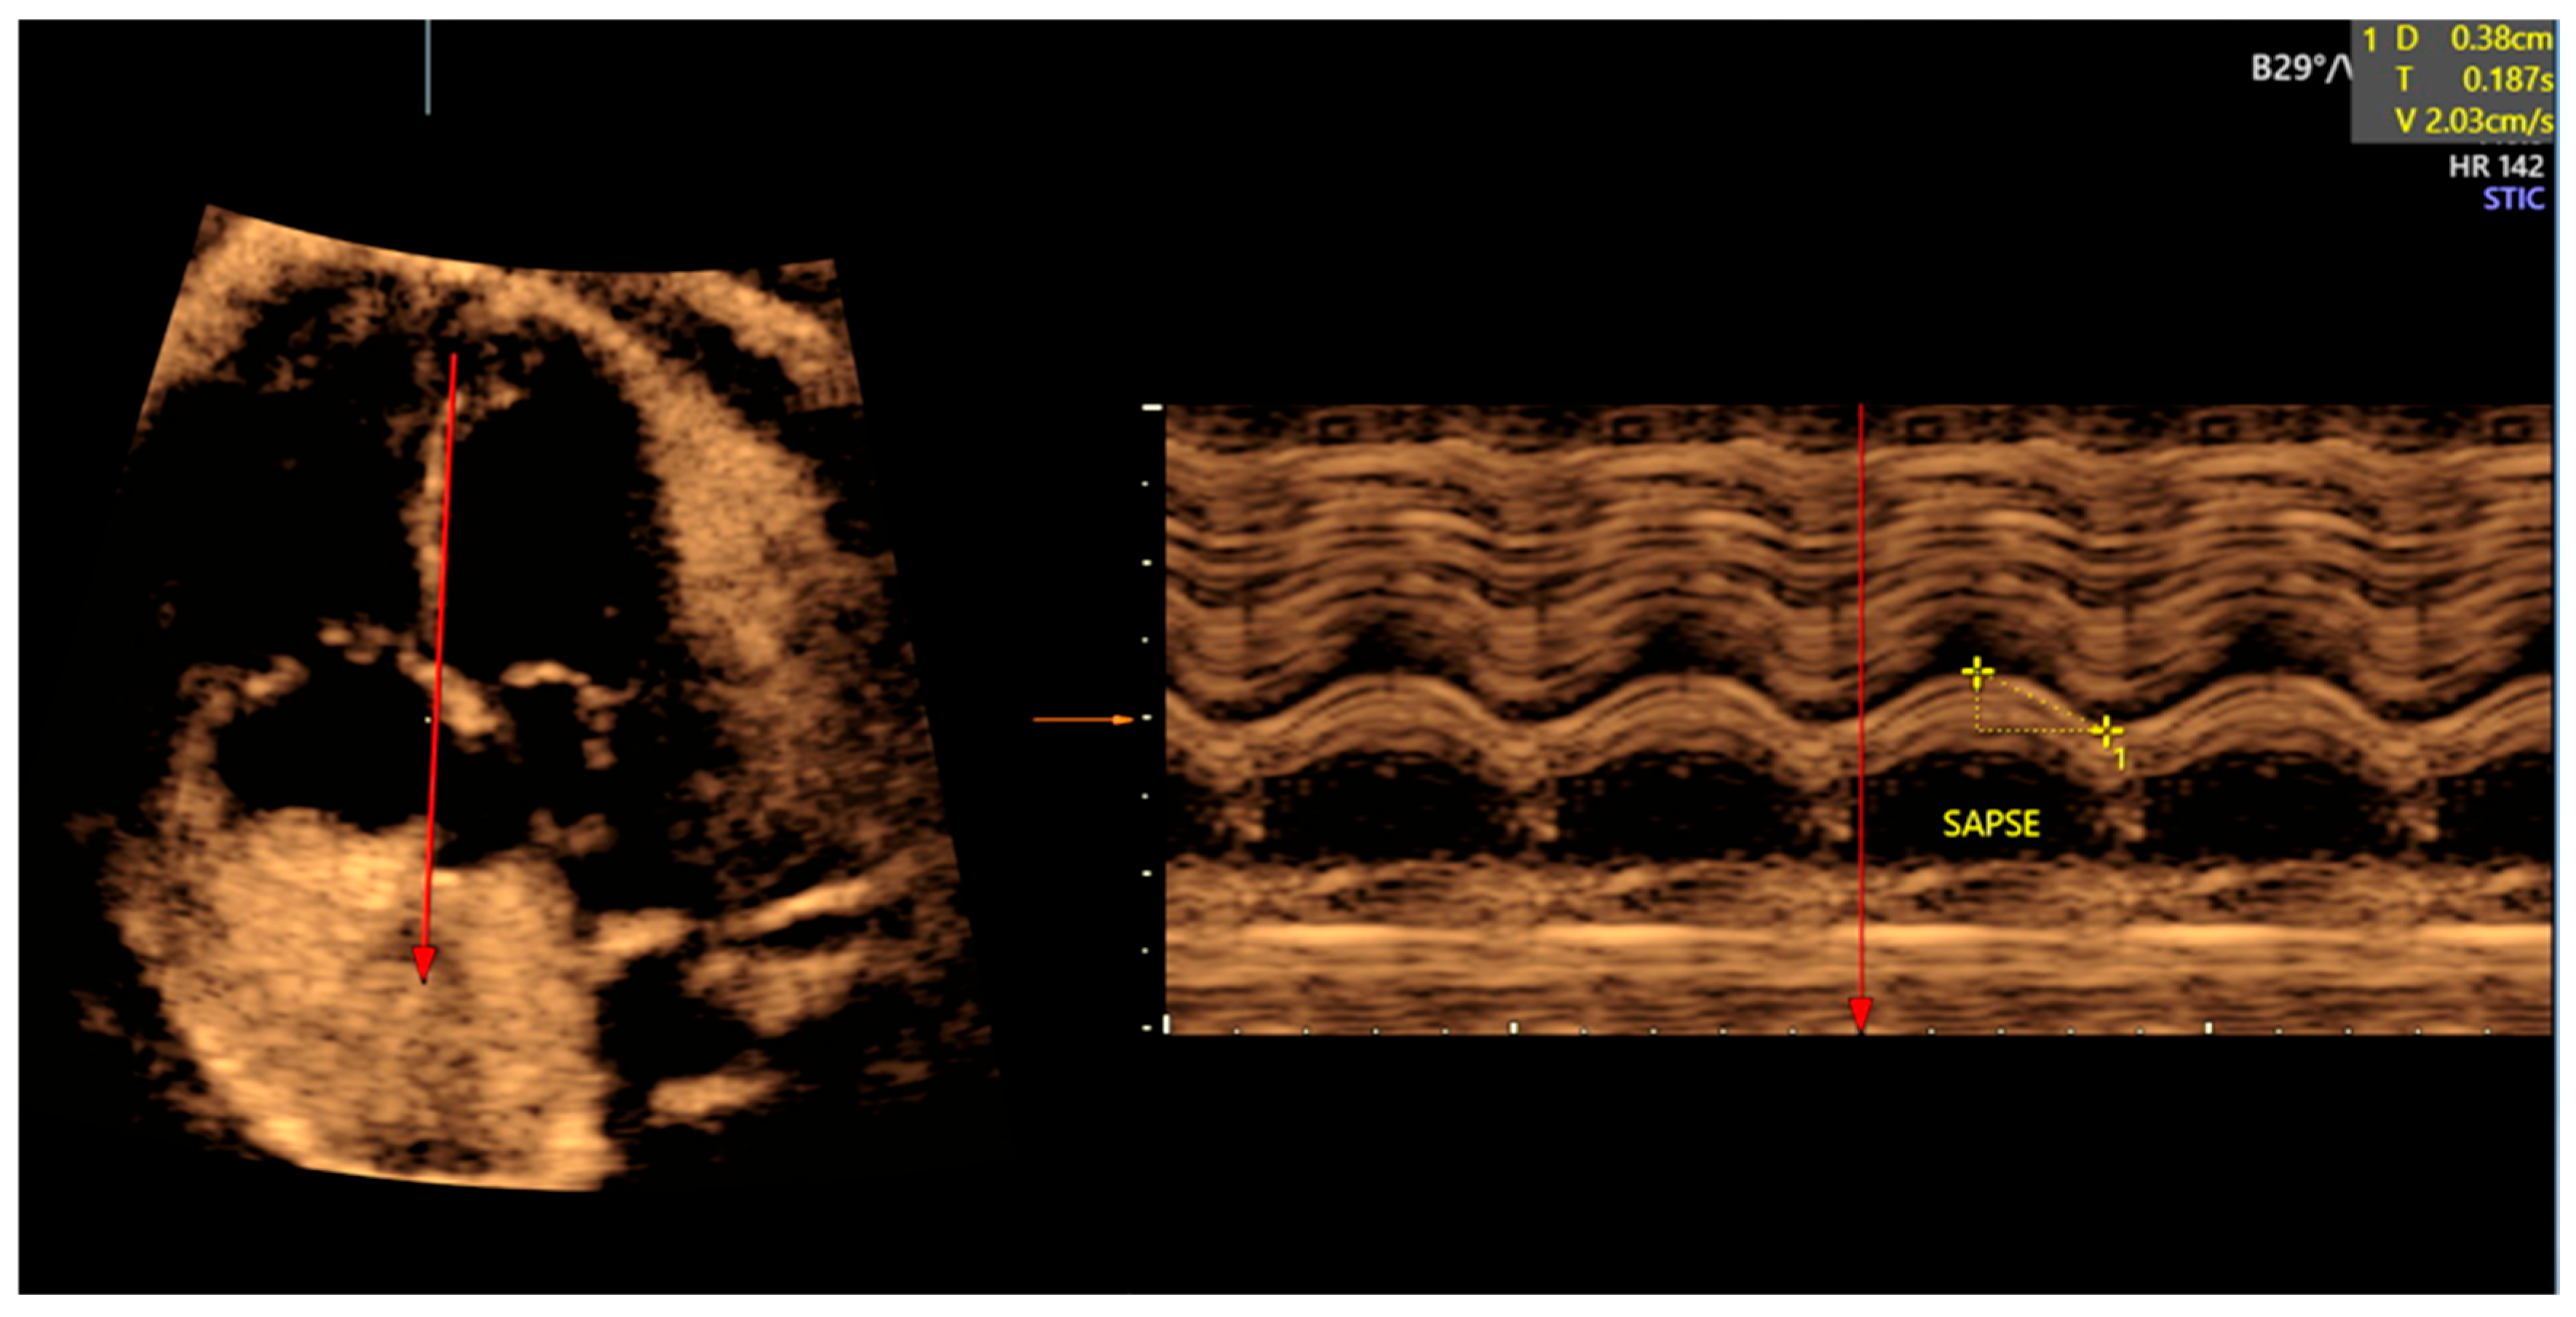
Figure 3. Left and right longitudinal and transverse ventricular diameters. LVLD: left ventricular longitudinal diameter; RVLD: right ventricular longitudinal diameter; LVMTD: left ventricular mid-transverse diameter; RVMTD: right ventricular mid-transverse diameter; LVBD: left ventricular basal diameter; RVBD: right ventricular basal diameter.
Applsci 16 02972 g003
Figure 4. Left and right atrial longitudinal and transverse diameters measured at the end of systole. LALD: left atrial longitudinal diameter; RALD: right atrial longitudinal diameter; LATD: left atrial transverse diameter; RATD: right atrial transverse diameter.
Applsci 16 02972 g004
Figure 5. Measurement of longitudinal and transverse cardiac diameters at the end of diastole. LA, left atrium; LV, left ventricle; MB, moderator band; PV, pulmonary veins; RA, right atrium; RV, right ventricle; LCD, longitudinal cardiac diameter; TCD, transverse cardiac diameter.
Applsci 16 02972 g005
Figure 6. Left and right ventricular wall thickness, septal wall thickness and left and right ventricular transverse diameters measurements at the end of diastole. LVWT: left ventricular wall thickness; RVWT: right ventricular wall thickness; SWT: septal wall thickness; LVD: left ventricular transverse diameter; RVD: right ventricular transverse diameter.
Applsci 16 02972 g006
Figure 7. Four-chamber view image at the end of diastole with atrioventricular valves opened to measure the valves. LV: left ventricle; RV: right ventricle; MV: mitral valve; TV: tricuspid valve; LA: left atrium; RA: right atrium.
Applsci 16 02972 g007
Figure 8. (a) Anterograde color Doppler without regurgitation. (b) Retrograde color Doppler with tricuspid regurgitation. TR: Tricuspid regurgitation.
Applsci 16 02972 g008
Figure 9. Spectral Doppler sample volume placement to obtain E/A waveforms for the left (a) and right (b) side of the heart.
Applsci 16 02972 g009
Figure 10. (a) Mitral E/A waveform. (b) Tricuspid E/A waveform.
Applsci 16 02972 g010
Figure 11. Pulsed-wave Doppler tracing of fetal ventricular inflow wave. Filling time fraction (FTF) was measured from E wave onset to A wave termination. Cycle time was measured between the onset of two consecutive E waves. E: E wave; A: A wave.
Applsci 16 02972 g011
Figure 12. Left outflow to measure the aortic valve at the level of the valvular annulus during systole. LV: Left ventricle; RV: right ventricle; LA: left atrium; DAO: descending aorta; AV: Aortic valve.
Applsci 16 02972 g012
Figure 13. Right outflow to measure pulmonary valve at the level of valvular ring in systole. RV: right ventricle; PV: pulmonary valve; AO: aorta; SVC: superior vena cava; LPA: left pulmonary artery; RPA: right pulmonary artery; DAO: descending aorta.
Applsci 16 02972 g013
Figure 14. (a) Sagittal short-axis view of the heart. The Doppler sample volume should be placed distal to the pulmonary valve. Alternatively, a transverse plane of the chest, cephalad to the five-chamber view, offers a correct image of the main pulmonary artery. (b) The transverse heart five-chamber view. The apex of the heart can be placed at 12 or 6 o’clock. The aorta lies parallel to the Doppler sample volume, positioned distal to the aortic valve. AV, aortic valve; LV, left ventricle; RV, right ventricle; RV, right ventricle; RA, right atrium; AO, aorta; DA, ductus arteriosus; TV, tricuspid valve; PV pulmonary valve; RPA right pulmonary artery.
Applsci 16 02972 g014
Figure 15. Aortic and pulmonary artery peak velocity assessments. (a) Ascending aorta waveform. (b) Main pulmonary artery waveform.
Applsci 16 02972 g015
Figure 16. Pulsed-wave Doppler tracing of fetal ventricular outflow wave. Ejection time is measured from the opening to the closure of one of the semilunar valves, either pulmonary or aortic. Cycle time is determined as the time between two consecutive valve clicks corresponding to aortic or pulmonary opening.
Applsci 16 02972 g016
Figure 17. Three vessels and trachea view evaluation showing anterograde flow. PA: pulmonary artery; DA: ductus arteriosus; AO: aorta; SVC: superior vena cava; T: trachea.
Applsci 16 02972 g017
Figure 18. Doppler velocity waveforms of peak velocity in the aortic isthmus in a sagittal aortic arch view (a) and of pulsatility index in the ductus arteriosus obtained in a transverse three vessels and trachea view (b).
Applsci 16 02972 g018
Figure 19. Doppler velocity waveforms and pulsatility index (PI) in the aortic isthmus and ductus arteriosus. Sagittal aortic (a) and ductal arches (c) views and transverse three-vessels view of the aortic isthmus (b) and ductus arteriosus (d).
Applsci 16 02972 g019
Figure 20. M-mode assessment of the left and right ventricular diameters at the end of diastole and systole. (a) In a transverse septal four-chamber view of the fetal chest, M-mode cursor is placed perpendicular to the interventricular septum at the tips of the atrioventricular valves. (b). M-Mode tracing measurement of left and right ventricular end-diastolic and end-systolic dimensions. LVEDD: left ventricular end-diastolic dimension; LVESD: left ventricular end-systolic dimension; RVEDD: right ventricular end-diastolic dimension; RVESD: right ventricular end-systolic dimension.
Applsci 16 02972 g020
Figure 21. Two-dimensional left ventricle ejection fraction and stroke volume assessment by semi-automated Simpson’s method. (a) Planimetry of the left ventricle at the end of diastole and automated division in equal-sized disks. (b) Planimetry of the left ventricle at the end of systole and automated division in equal-sized disks. The volume of the ventricle at the end-diastole and end-systole is calculated automatically to estimate the left ventricle ejection fraction and stroke volume. EDV: End-diastolic volume; ESV: end-systolic volume; SV: stroke volume; EF: ejection fraction.
Applsci 16 02972 g021
Figure 22. Two-dimensional assessment of right ventricle fractional change area (FAC). (a) Fractional change area of the right ventricle at the end of systole. (b) Fractional change area of the right ventricle at the end of diastole. LV: left ventricle; RV: right ventricle; RVA: right ventricle area.
Applsci 16 02972 g022
Figure 23. Placement of the region of interest (ROI) before acquiring the volume in a two-dimensional apical four-chamber view. The ROI defines the width and height of the volume dataset in the x- and y-planes. LA: left atrium; LV: left ventricle; RA: right atrium; RV: right ventricle.
Applsci 16 02972 g023
Figure 24. Post-processing assessment of left (a,c,e,g) and right (b,d,f,h) ventricular volumes at the end of diastole. The trace in the A-frame is placed in the four-chamber view with the inversion mode activated on the left (c) and right (d) sides of the heart and without inversion mode (a and b, respectively). Three-dimensional reconstructions via Virtual Organ Computer-aided Analysis, including the entire trace of the left (e) and right (f) ventricles at the end of diastole; the final intraventricular volume models of the left (g) and right (h) ventricles. The same can be repeated to measure the volumes at the end of systole.
Applsci 16 02972 g024
Figure 25. Positioning of the region of interest (ROI) in a two-dimensional image of the septal four-chamber view. The ROI defines the volume width and height in the x- and y-planes. LA: left atrium; LV: left ventricle; RA: right atrium; RV: right ventricle.
Applsci 16 02972 g025
Figure 26. (a). Septal four-chamber views showing the correct orientation of the interventricular septum on the multiplanar view of a cardiac STIC volume dataset (panel A, B and C). (b). Placement of cardiac STIC M-mode in the septal four-chamber view. (c). Cardiac STIC M-Mode trace to measure the cardiac dimensions at the end-diastole and systole. IVS: interventricular septum; BVOD: biventricular outer dimension; LVWT: left ventricular wall thickness; IVST: interventricular septum thickness; RVWT: right ventricular wall thickness; LVID: left ventricular inner dimension; RVID: right ventricular inner dimension; LVIS: left ventricular inner diameter at end-systole; RVIS: right ventricular inner diameter at end-systole.
Applsci 16 02972 g026
Figure 27. Caliper placement to evaluate left fetal cardiac event timing.
Applsci 16 02972 g027
Figure 28. Left fetal cardiac event timing waveform and measurement of the time periods. E wave: passive diastolic filling through the mitral valve; A wave: active diastolic filling by atrial contraction; ICT: isovolumetric contraction time (between mitral valve closure and aortic valve aperture); ET: ejection time (between aortic valve aperture and closure); IRT: isovolumetric relaxation time (between aortic closure and mitral aperture).
Applsci 16 02972 g028
Figure 29. Caliper placement to evaluate fetal cardiac event timing. (a) Tricuspid valve component. (b) Pulmonary valve component in transverse view. (c) Pulmonary valve component in sagittal view.
Applsci 16 02972 g029
Figure 30. The right fetal cardiac event timing Doppler waveforms: (a) tricuspid inflow waveform and a-interval; (b) pulmonary outflow waveform and b-interval. TV: tricuspid valve; PV: pulmonary valve.
Applsci 16 02972 g030
Figure 31. Left annulus peak velocities obtained by spectral tissue Doppler. Left ventricle tissue MPI′ measurement by the assessment of tissue ICT′, IRT′, and ET′. LV: left ventricle; MPI′: tissue myocardial performance index; ICT′: isovolumetric contraction time; IRT′: tissue isovolumetric relaxation time; ET′: tissue ejection time.
Applsci 16 02972 g031
Figure 32. Apical four-chamber view of the fetal heart. M-Mode image cursor placement to assess longitudinal annular motion measurements: (a) Mitral annular plane systolic excursion (MAPSE); (b) interventricular septum plane systolic excursion (SAPSE); (c) tricuspid annular plane systolic excursion (TAPSE); (d) M-mode longitudinal displacement measurement. The maximum amplitude of motion is measured as the annular displacement between the end of systole (peak of the curve) and the end of diastole (nadir of the curve) measured in mm.
Applsci 16 02972 g032
Figure 33. Measurement of atrioventricular annular plane displacement (AVPD) by pulsed-wave tissue Doppler imaging (PW-TDI). TAPSE is measured as the velocity time integral of the myocardial systolic waveform. The measurement does not include the isovolumic contraction velocity component. VTI: velocity time integral; S′: tissue myocardial systolic waveform; IVCV: tissue isovolumetric contraction velocity; E′: tissue myocardial velocity during early filling; A′: tissue myocardial velocity during atrial contraction.
Applsci 16 02972 g033
Figure 34. Measurement of the fetal tricuspid annular plane systolic excursion (TAPSE). STIC M-mode cursor is positioned parallel to the interventricular septum and adjacent to the tricuspid valve insertion into the free wall.
Applsci 16 02972 g034
Figure 35. Apical four-chamber view of the fetal heart. The STIC M-mode image cursor is positioned at the junction between the free ventricular wall and mitral valve for the calculation of mitral annular plane systolic excursion (MAPSE).
Applsci 16 02972 g035
Figure 36. In the apical four-chamber view of the fetal heart, the cursor is placed at the atrioventricular junction crossing over the ventricular septum to calculate the septal annular plane systolic excursion (SAPSE).
Applsci 16 02972 g036
Table 1. Formulae to calculate stroke volume, ejection fraction and shortening fraction. VV: ventricular volume; VD: ventricular diameter; SV: stroke volume; EF: ejection fraction; SF: shortening fraction; FAC: fractional area change; EDV area: end of diastole ventricular area; ESV area: end of systole ventricular area.
Fetal Cardiac Function IndicesUltrasound TechniqueFormulae
Stroke Volume (SV)M-mode/B-modeSV = end-diastolic volume − end-systolic volume
Ventricular volume (VV)–M-mode (Dodge)VV = (VD)3
Ventricular volume (VV)–M-mode (Teicholz)VV = (7 × VD3)/(2.4 + VD)
Ejection Fraction (EF) EF = SV/end-diastolic volume
Cardiac Output (CO) CO = EF × FHR (fetal heart rate)
Shortening Fraction (SF)M-ModeSF = (end-diastolic VD − end-systolic VD)/end-diastolic VD
Fractional Area Change2DFAC = [(EDV area − ESV area)/EDV area] × 100
Table 2. Fetal cardiac function parameters nomograms, clinical significance and limitations.
Ref.Fetal Cardiac Function
Parameter
GA (Weeks)Normal Values
(Mean)
Normal Values
(Standard Deviation)
Clinical SignificanceLimitation
Cardiac morphometry assessment
Relative size
[7]Cardiothoracic
ratio (%)
18–410.02182345 + (0.01324242 × GA) − (0.00017049 × GA2)0.00058419 × (GA + 0.01910969)Cardiomegaly
assessment
Challenging if oligohydramnios or thorax
compression
[7]Ln (left atrial-to-heart area ratio (%))18–41−1.9157120.251307Atrial pressure or
volume overload assessment (chamber-specific remodeling)
High reproducibility only if standardized landmarks applied
[7]Sqrt (right atrial-to-
heart area ratio (%))
18–410.3908910.047321Atrial pressure or
volume overload assessment (chamber-specific remodeling)
High reproducibility only if standardized landmarks applied
[7]Ln (left ventricular-to-heart area ratio (%))18–41−1.4445830.227938Ventricular pressure
or volume overload assessment (chamber-specific remodeling)
High reproducibility only if standardized landmarks applied
[7]Ln (right ventricular-to-heart area ratio (%))18–41−1.508580.250648Ventricular pressure
or volume overload assessment (chamber-specific remodeling)
High reproducibility only if standardized landmarks applied
Sphericity
[7]Ln (cardiac sphericity index)18–41(−0.00236225 × GA) + 0.255057410.10022312Pressure or
volume overload assessment (cardiac globularity)
High reproducibility only if standardized landmarks applied
[7]Left ventricular basal sphericity index18–412.437194 + (−0.014637 × GA) −
(84.976701 × GA−2)
0.341589Pressure or
volume overload assessment (cardiac globularity)
High reproducibility only if standardized landmarks applied
[7]Left midventricular sphericity index18–410.918842 + (0.022144 × GA) +
(301.961397 × GA−2)
0.297752Pressure or
volume overload assessment (cardiac globularity)
High reproducibility only if standardized landmarks applied
[7]Right ventricular basal sphericity index18–412.869158 + (−0.030220 × GA) −
(245.587912 × GA−2)
0.377144Pressure or
volume overload assessment (cardiac globularity)
High reproducibility only if standardized landmarks applied
[7]Right midventricular sphericity index18–411.321075 + (0.006002 × GA) +
(159.037735 × GA−2)
0.280295Pressure or
volume overload assessment (cardiac globularity)
High reproducibility only if standardized landmarks applied
Ventricular dominance
[7]Ln (right-to-left basal ventricular ratio)18–41(0.00198602 × GA) − 0.0380005950.11921652Ventricular asymmetry
evaluation (remodeling assessment)
High reproducibility only if standardized landmarks applied
[7]Ln (right-to-left midventricular ratio)18–41(0.002905809 × GA) − 0.0675688720.15119228Ventricular asymmetry
evaluation (remodeling assessment)
High reproducibility only if standardized landmarks applied
Wall thickness asymmetry
[7]Ln (septal-to-left ventricular free wall thickness ratio)18–410.0832360.158158Pattern of hypertrophy (remodeling assessment)High reproducibility only if standardized landmarks applied
[7]Ln (septal-to-right ventricular free wall thickness ratio)18–410.0793120.154903Pattern of hypertrophy (remodeling assessment)High reproducibility only if standardized landmarks applied
Relative wall thickness
[7]Ln (left relative wall thickness)18–41(−0.005063448 × GA) − 0.4494739140.21103708Pattern of hypertrophy (remodeling assessment)High reproducibility only if standardized landmarks applied
[7]Ln (right relative wall thickness)18–41(−0.007784408 × GA) − 0.3911862150.2116146Pattern of hypertrophy (remodeling assessment)High reproducibility only if standardized landmarks applied
Cardiac valvular assessment
Valvular measurement
[73]Ln (Mitral valve diameter)15–391.173 (Ln GA) + (−4.084)-Valvular morphometry -
[73]Ln (Tricuspid valve diameter)15–391.395 (Ln GA) + (−4.766)-Valvular morphometry-
[74]Aortic valve diameter (cm)13–363.21642 + 0.23062 (GA − 20) +
0.00612 (GA − 20)2
−0.07740 + (0.17950 × (EM)) + (−0.01889 × (EM)2)Valvular morphometry-
[74]Pulmonary valve diameter (cm)13–363.62029 + 0.27517 (GA − 20) +
0.00586 (GA − 20)2
0.06882 + 0.06978 × (EM)Valvular morphometry -
Valvular flow
[75]Left E/A ratio 20–36+60.45 + 0.01 × GA-Left ventricular diastolic function-
[75]Right E/A ratio 20–36+60.48 + 0.01 × GA-Right ventricular diastolic function-
[23]Left Filling time fraction (%)18–4116.42995632288723 + (3617.924450406454/HR)6.432068875340649 −(90.01780352881514522 × HR)Left ventricular diastolic functionDependency on heart rate
[23]Right Filling time fraction (%)18–4118.73327596623064 + (2889.916516631465/HR)6.148098683328987 −(0.0182699393831315 × HR)Right ventricular diastolic functionDependency on heart rate
[76]Aortic PSV (cm/s)18–4038.089 + 1.463 × GA4.227 + 0.239 × GAValvular competenceDependency on insonation angle
[76]Pulmonary PSV (cm/s) 18–4034.10 + 1.393 × GA5.634 + 0.121 × GAValvular competenceDependency on insonation angle
[23]Left Ejection time fraction (%)18–4129.692919 + (0.108611 × HR) −
(0.139257 × GA)
2.365145Left ventricular systolic functionDependency on heart rate
[23]Right Ejection time fraction (%)18–4126.748934 + (0.124522 × HR) −
(0.080492 × GA)
2.6371Right ventricular systolic functionDependency on heart rate
Aortic Isthmus
[77]Aortic Isthmus PSV (cm/s)24–38105.4 + 11.1 × (GA) − 0.2(GA2)17.6Both ventricles systolic functionLimited data
[77]Aortic Isthmus PI24–381.74 + 0.02 × (GA)0.53Both ventricles systolic functionLimited data
Cardiac contractility assessment
Inotropic ventricular status
[78]Ln Left STIC Stroke Volume12–32 −12.662 + (0.136 × GA) − (4.715 × 10⁻⁴ × GA2) − 5.597 × 10⁻⁷ × GA3) -Left global systolic function Significant intra- and inter-observer variability
[79]Left STIC Ejection Fraction 20–34+60.9047 − 0.007 × GA-Left global systolic function Significant intra- and inter-observer variability
[78]Ln Left STIC Cardiac Output 12–32−7.632 + (0.138 × GA) − (4.860 × 10⁻⁴ × GA2) + (5.936 × 10⁻⁷ × GA3)-Left global systolic function Significant intra- and inter-observer variability
[72]Left STIC Shortening Fraction 20–33+60.244 + 0.002 × GA0.011444Left global systolic function Significant intra- and inter-observer variability
[78]Ln Right STIC Stroke Volume12–32 −15.980 + (0.199 × GA) − (8.567 × 10⁻⁴ × GA2) + (1.329 × 10⁻⁶ × GA3)-Right global systolic function Significant intra- and inter-observer variability
[79]Right STIC Ejection Fraction 20–34+60.8367 − 0.007 × GA-Right global systolic function Significant intra- and inter-observer variability
[78]Ln Right STIC Cardiac Output 12–32 −10.950 + (0.201 × GA) − (0.001 × GA2) + (1.363 × 10⁻⁶ × GA3)-Right global systolic function Significant intra- and inter-observer variability
[72]Right STIC Shortening Fraction 20–33+60.370 − 0.004 × GA0.01989Right global systolic function Significant intra- and inter-observer variability
[45]RV Fractional Area Change (%) 18–4151.49005 + (−1.11488 × GA) + 0.01366 × GA28.57916Right global systolic functionPoor reproducibility unless strict ventricular area landmarks are applied
Cardiac event timing
[75]Left ICT (s)20–36+60.03 × exp (0.004 × GA)-Left isovolumetric contraction time
[75]Left ET (s)20–36+60.17 − 0.000002 × GA-Left ejection time
[75]Left IRT (s)20–36+60.04 + 0.0002 × GA-Left isovolumetric relaxation time
[75]Left Mod-MPI20–36+60.40 + 0.02 × GA-Left global cardiac systolic and diastolic functionSignificant intra- and inter-observer variability
[80]Right a-interval17–38225.571 + 1.084 × GA-Right isovolumetric contraction time-
[80]Right b-interval 17–38159.372 + 0.302 × GA-Right ejection time-
[80]Right Mod-MPI17–380.421 + 0.004 × GA-Right global cardiac systolic and diastolic functionSignificant intra- and inter-observer variability
[81]Left ICT′ (s)20–36+60.03 + 0.0004 × GA-Left isovolumetric contraction time-
[81]Left ET′ (s)20–36+60.17 + 0.0001 × GA-Left ejection time-
[81]Left IRT′ (s)20–36+60.05 − 0.0001 × GA-Left isovolumetric relaxation time-
[81]Left MPI′20–36+60.45 + 0.001 × GA-Left global cardiac systolic and diastolic function Significant intra- and inter-observer variability
[81]Right ICT′ (s)20–36+60.03 + 0.0003 × GA-Right isovolumetric contraction time-
[81]Right ET′ (s)20–36+60.17 + 0.0003 × GA-Right ejection time-
[81]Right IRT′ (s)20–36+60.04 − 0.00003 × GA-Right isovolumetric relaxation time-
[81]Right MPI′20–36+60.45 + 0.001 × GA-Right global cardiac systolic and diastolic function Significant intra- and inter-observer variability
Annular plane systolic excursion
[82]2D TAPSE 20–390.251 × GA − 1.251.38Right longitudinal systolic functionLimited by fetal position
[66]2D MAPSE20–36+6−0.4854 + 0.168 × GA(−0.954 + 0.2332 × GA)Left longitudinal
systolic function
Limited by fetal position
[66]2D SAPSE20–36+6−0.00957 + 0.1173 × GA (0.148 + 0.1463 × GA)Interventricular longitudinal
systolic function
Limited by fetal position
[82]STIC TAPSE20–390.245 × GA − 1.271.34Right longitudinal systolic function
GA gestational age, Ln Natural logarithm, Sqrt Square root, EM estimated mean, Left Mitral E/A ratio, Right Tricuspid E/A ratio, HR Heart rate, PSV Peak systolic velocity, PI Pulsatility index, STIC Spatiotemporal image correlation, Left Mitral E/A ratio, Right Tricuspid E/A ratio, Left FTF filling time fraction, Right FTF filling time fraction, SV stroke volume, EF ejection fraction, CO cardiac output, SF shortening fraction, Left ICT isovolumetric contraction time, Left ET ejection time, Left IRT isovolumetric relaxation time, Left Mod-MPI modified myocardial performance index, Right Tricuspid a interval, Right Pulmonary b interval, Right Mod-MPI modified myocardial performance index, Left ICT′ isovolumetric contraction time, Left ET′ tissue ejection time, Left IRT′ tissue isovolumetric relaxation time, Left MPI′ tissue myocardial performance index, Right ICT′ isovolumetric contraction time, Right ET′ tissue ejection time, Right IRT′ tissue isovolumetric relaxation time, Right MPI′ tissue myocardial performance index, TAPSE tricuspid annular plane systolic excursion, MAPSE Mitral annular plane systolic excursion, SAPSE interventricular septum plane systolic excursion.
Disclaimer/Publisher’s Note: The statements, opinions and data contained in all publications are solely those of the individual author(s) and contributor(s) and not of MDPI and/or the editor(s). MDPI and/or the editor(s) disclaim responsibility for any injury to people or property resulting from any ideas, methods, instructions or products referred to in the content.