Systematic Review

Carbohydrate and Electrolyte Supplementation Strategies to Enhance Sports Performance: A Systematic Review and Meta-Analysis


by
Alfredo Bravo-Sánchez
1,2,*,
María Ramírez-delaCruz
2,
Jorge Sánchez-Infante
1,3,
Pablo Abián
4 and
Javier Abián-Vicén
2,*
1
Faculty of Health Sciences, Universidad Francisco de Vitoria, Ctra. Pozuelo-Majadahonda km 1,800, 28223 Pozuelo de Alarcón, Spain
2
Performance and Sport Rehabilitation Laboratory, Faculty of Sports Sciences, University of Castilla-La Mancha, 45071 Toledo, Spain
3
Toledo Physiotherapy Research Group (GIFTO), Faculty of Physiotherapy and Nursing of Toledo, Universidad de Castilla-La Mancha, 45071 Toledo, Spain
4
Department of Biomedical Sciences, Area of Physical and Sports Education, Faculty of Medicine and Health Sciences, Universidad de Alcalá, 28871 Alcalá de Henares, Spain
*
Authors to whom correspondence should be addressed.
Appl. Sci. 2026, 16(6), 2967; https://doi.org/10.3390/app16062967
Submission received: 21 February 2026 / Revised: 13 March 2026 / Accepted: 16 March 2026 / Published: 19 March 2026
(This article belongs to the Special Issue Neuromuscular Performance Analysis in Sports)

Abstract

Fatigue and reduced energy availability significantly affect athletic performance, and nutritional strategies to maintain carbohydrate and electrolyte levels are critical for delaying fatigue and preserving endurance. This study aimed to evaluate the effects of carbohydrate and electrolyte (CHO-E) supplementation on sports performance in physically active individuals. A systematic review and meta-analysis of 26 studies, including randomised and observational designs, was conducted. Four separate analyses examined the impact of CHO-E supplementation on performance outcomes, metabolic biomarkers, blood mineral concentrations, and additional performance descriptors. The meta-analysis showed that CHO-E supplementation significantly increased time to exhaustion (Standard Mean Difference (SMD) 0.60; 95% confidence interval (CI): 0.17, 1.02; p = 0.006), blood glucose levels (SMD 0.82; 95% CI: 0.45, 1.19; p < 0.001), and blood sodium levels (SMD 0.22; 95% CI: 0.07, 0.36; p = 0.004) compared to placebo, while no significant effect was observed for time to finish (SMD −0.07; 95% CI: −0.28, 0.13; p = 0.49). These findings indicate that CHO-E supplementation during moderate-to-high intensity exercise can enhance performance by extending endurance and supporting metabolic and electrolyte balance. Overall, the results support the targeted use of CHO-E supplementation to maintain energy availability and physiological stability during prolonged physical activity, providing evidence-based guidance for athletes and practitioners.

1. Introduction

Sports performance is a multifactorial field influenced by various factors, including training level, years of experience, physical capacity, environmental conditions, and psychological state, all of which have been identified as key determinants by Yang et al. [1]. In endurance sports, where events are prolonged over time, performance is primarily defined by the onset of fatigue. The origin of fatigue may stem from repeated high-intensity efforts, glycogen depletion, and dehydration [2,3]. Consequently, a significant body of research has focused on identifying effective strategies to delay the onset of fatigue and mitigate its impact on performance. In line with this, one of the most rapidly growing areas of research in endurance disciplines (such as cycling, triathlon, athletics, and swimming) is the study of sports supplementation and its potential to delay fatigue and enhance endurance capacity [4,5,6].
Glycogen stores in the body are limited, so the demand for this energy substrate, combined with a lack of an exogenous carbohydrate supply, can lead to a decline in athletic performance [7]. In this regard, carbohydrate supplementation during exercise has been shown to improve performance by maintaining blood glucose levels and preserving muscle glycogen, which is key in endurance sports with high energy demands such as cycling, triathlon and running [4,8]. Other research has also highlighted its value in team sports such as football, where the actual duration of a match exceeds 90 min [9]. In his review, Jeukendrup [10] established recommendations for carbohydrate intake depending on the duration of the sporting event, with carbohydrate energy intake being recommended for sports lasting more than one-and-a-half hours and considered necessary to maintain performance when the duration exceeds two hours. The recommended amount of carbohydrates ranges from 60 g/h to 90 g/h, although in sports such as road cycling or long-distance triathlon, sporting benefits have been reported with intakes of 120 g/h; however, prior adaptation is recommended to avoid gastrointestinal problems [10].
Electrolytes, especially sodium (Na+), are essential for maintaining water balance, neuromuscular function and nutrient absorption [11]. Electrolyte loss through sweat can adversely affect performance, especially in hot conditions or prolonged exercise [12,13]. Excessive electrolyte loss during exercise may be associated with reduced thermoregulatory capacity, the occurrence of muscle cramps, and a decline in performance [14,15]. In this line of thought, dehydration exceeding 2% of body mass has been consistently associated with diminished cardiac output, impaired thermoregulatory capacity, and heightened ratings of perceived exertion, all of which can significantly attenuate exercise performance [16]. In order to mitigate the negative effects of dehydration on athletic performance, many researchers recommend the consumption of adequate fluids in conjunction with electrolytes to preserve plasma volume and sustain the concentration of key ions such as sodium and magnesium, which are essential for optimal musculoskeletal function. Thus, there has been an increase in studies using commercial energy drinks, which are a mixture of carbohydrates, approximately 6%, and essential electrolytes, sodium, magnesium and potassium. Tambalis [13] identified energy drinks as the most suitable option, although the author did not consider whether they could improve their effect when accompanied by a greater quantity of carbohydrates.
The nutritional strategies in endurance sports should not only be limited to carbohydrate intake to maintain blood glucose levels; they should also address the replenishment of electrolytes lost through sweat. Energy drinks containing some carbohydrate and electrolytes have been shown to be effective in promoting fluid homeostasis, preserving cardiovascular and thermoregulatory function and preventing disorders such as hyponatraemia [13]. The efficacy of these CHO-E solutions has been proven in a variety of contexts such as running, reporting better physical performance compared to placebo situations, although the carbohydrate intake they provide is well below the recommendations [17]. On the other hand, Rollo and Williams [18] reported that performance in a one-hour running test was equal in the CHO-E and placebo groups when the previous carbohydrate intake was similar, thus generating controversy about the real effect of this type of beverage on the performance of endurance athletes.
Due to the increasing interest in sports nutrition and nutritional strategies for endurance sports, it is necessary to understand what type of in-competition supplementation is most appropriate to enhance performance. The aim of the present study was to examine whether carbohydrate and electrolyte supplementation has a beneficial effect on sports performance and causes an adaptation in biomarkers and blood mineral concentrations.

2. Materials and Methods

The present study was conducted following the Preferred Reporting Items for Systematic Reviews and Meta-Analyses (PRISMA) guidelines [19] and was registered in the international Prospective Register of Systematic Reviews (PROSPERO) (CRD42024618630). A systematic search was conducted from June 2024 to the 30 September 2024. The consulted databases were PubMed, Scopus and Web of Science using the following terms: Carbohydrate; electrolyte; sodium; potassium; sport performance; time to exhaustion; cycling; running; swimming. These concepts were applied using the search operator ‘AND’ in title and abstract. Bibliographies of relevant papers were screened, and authors were contacted for missing outcomes if necessary.

2.1. Selection Criteria

Publications were included if they showed the effects of CHO-E ingestion on sports performance. To be included in the present systematic review, studies had to have satisfied the following inclusion criteria: (1) randomised or observational studies; (2) outcomes that include some type of sports performance measurement; (3) articles that give data on mean and standard deviation of the sports performance measurements; (4) studies carried out with physically active people; and (5) studies written or translated into English. We excluded articles that (1) were systematic review articles, meta-analyses or editorials/letters to the editor; (2) were performed on animals or with children; and (3) did not provide data on physical performance.

2.2. Study Selection

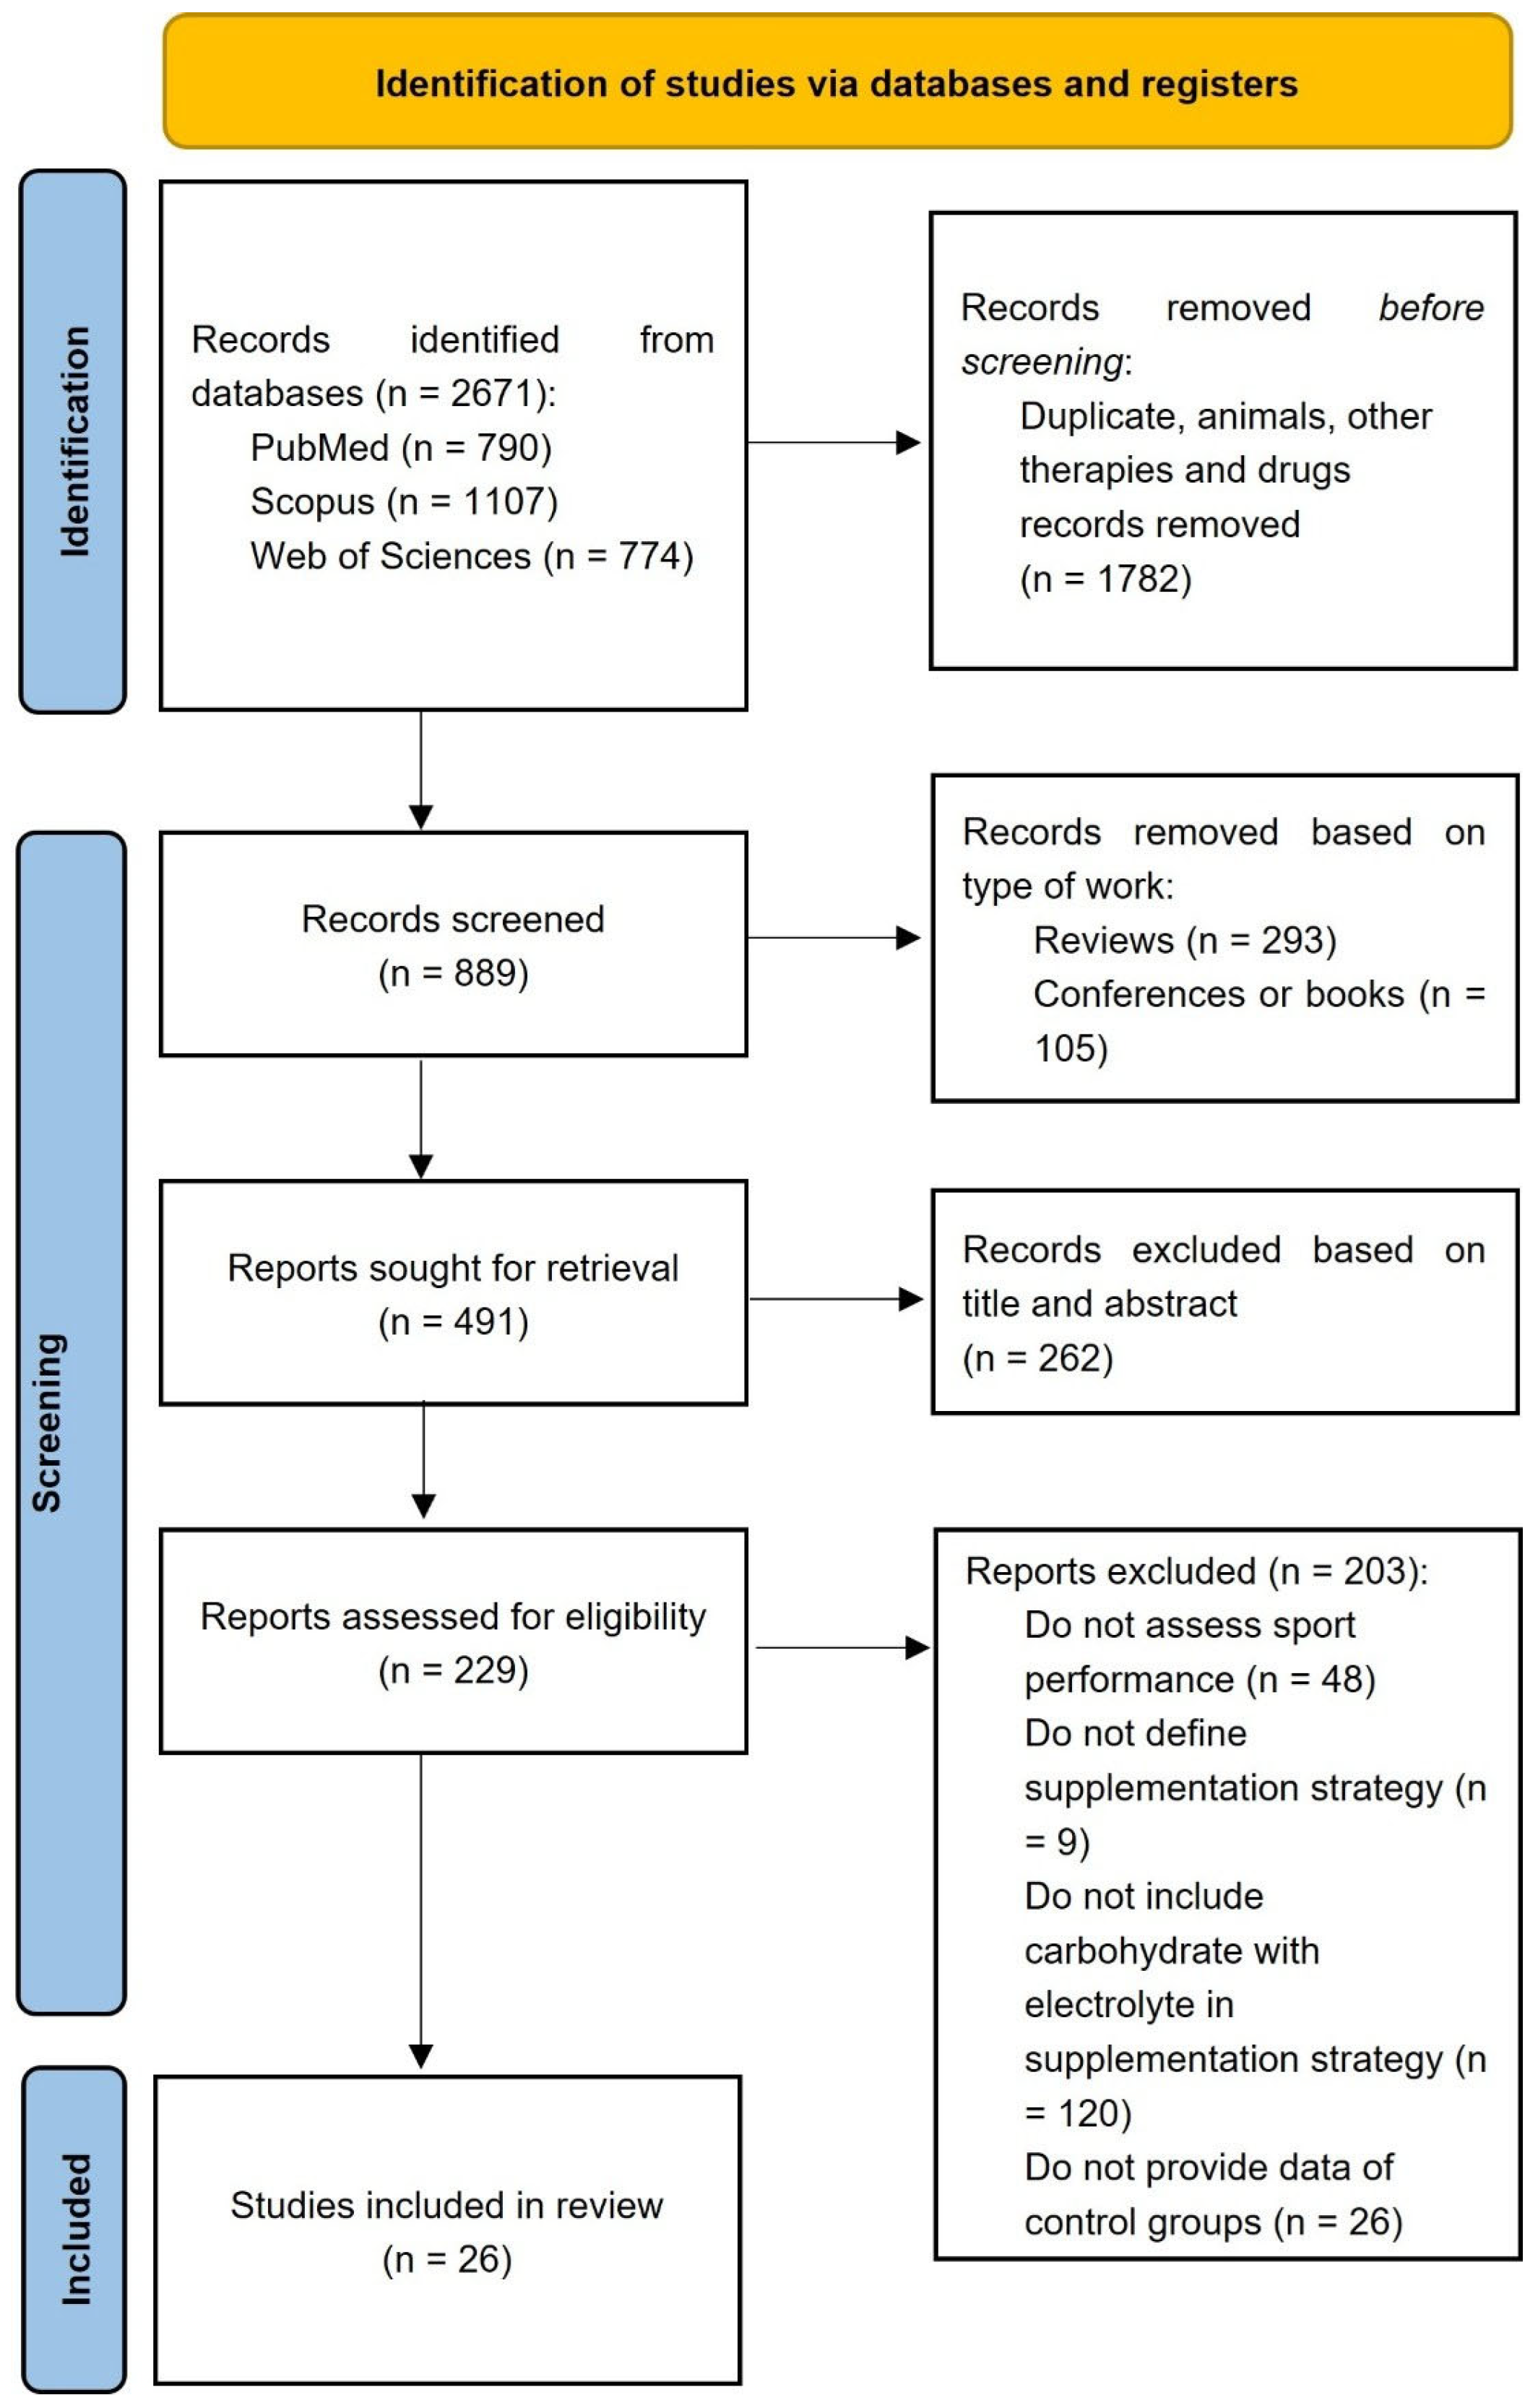
Following the database search, two authors independently determined whether studies fulfilled the criteria for inclusion in this review through an examination of titles, abstracts, keywords and the full text to later include those that did in the meta-analysis (Figure 1). A standardised form was used to determine the eligibility of retrieved studies. When authors failed to reach an agreement, a third author was consulted.

2.3. Quality Assessment and Data Extraction

The methodological quality of the included articles was assessed using the PEDro Scale. This tool was developed to evaluate the internal validity and statistical reporting of randomised controlled trials. Its content validity and inter-rater reliability have been well established [20]. The PEDro Scale consists of 11 items, 10 of which contribute to the total score, assessing criteria such as random allocation, concealed allocation, baseline comparability, blinding, and intention-to-treat analysis. Two independent reviewers conducted the assessments, and any disagreements were resolved through consultation with a third reviewer.
Studies could be awarded a maximum score of 10 points and were classified according to their methodological quality based on the total PEDro score. Scores of 9–10 were considered to indicate excellent quality, 6–8 good quality, 4–5 fair quality, and 0–3 poor quality [21]. Quality assessment was independently conducted by two reviewers, and any discrepancies were resolved through consultation with a third reviewer. The assessment was completed prior to data extraction. The certainty of evidence was assessed using the Grading of Recommendations Assessment, Development and Evaluation (GRADE) framework [22]. Evidence was classified as high, moderate, low, or very low according to study limitations (risk of bias), indirectness, inconsistency of results or unexplained heterogeneity, imprecision, and potential publication bias. The assessment was conducted independently by two reviewers (AB-S and MR-C), with a third author involved to resolve any discrepancies that arose (JA-V).
Data were extracted directly from the full-text articles. Quantitative outcomes were obtained from both the main text and tables. The extraction process was carried out independently by two reviewers (AB-S and MR-C), and any discrepancies were resolved through consultation with a third reviewer (JA-V). In cases where essential information was missing, the corresponding authors of the original studies were contacted. Studies that were duplicates or did not meet the inclusion criteria were excluded. For the studies that were included, the following variables were extracted: (1) study design and population characteristics; (2) intervention protocol, including supplementation strategy, supplementation composition, type of exercise and exercise protocol; and (3) outcome measures, including time to exhaustion, VO2max consumption, lactate, glucose, blood mineral concentration, insulin, glycerol and free fatty acid levels during exercise, plasma volume and sports performance.

2.4. Statistical Analysis

Four meta-analyses were carried out to analyse the effect of CHO-E: (1) on sports performance; (2) on metabolic biomarkers; (3) on blood mineral concentrations; and (4) on other performance descriptors. Meta-analyses and statistical evaluations were conducted using Review Manager software (RevMan, version 5.3; The Nordic Cochrane Centre, The Cochrane Collaboration, Copenhagen, Denmark, 2014). Both the chi-square test and the I2 statistic were applied to evaluate heterogeneity across studies, following the approach described by Higgins et al. [23]. I2 values of 25%, 50%, and 75% were interpreted as indicators of low, moderate, and high heterogeneity, respectively. A random-effects model was employed for data synthesis, utilising the inverse variance method. Effect sizes for continuous outcomes were calculated as Standard Mean Difference (SMD) with corresponding 95% confidence intervals (CIs) for the included studies. We pre-specified three sensitivity analyses: (i) excluding studies with PEDro score < 7; (ii) comparing random-effects with fixed-effect models; and (iii) leave-one-out analysis to assess individual study influence on pooled estimates. Statistical significance was defined as a p-value of less than 0.05.

3. Results

3.1. Literature Search

We found 4948 articles in the consulted databases. First, 4059 duplicates were removed, 28 papers were excluded because they analysed animals, 164 were conferences and books, 234 were reviews and 262 were excluded after reading the titles and abstracts. The final sample was composed of 26 papers after excluding 175 during the reading of the full text. Figure 1 shows the flow diagram of the study selection process after the full review.

3.2. Study Characteristics

This systematic review aimed to analyse the effect of CHO-E on sports performance and included 26 studies: 8 evaluated the time to exhaustion [24,25,26,27,28,29,30,31]; 11 monitored the performance in a time trial task [32,33,34,35,36,37,38,39,40,41,42]; 20 measured the effect on metabolic biomarkers [9,18,25,26,27,28,29,31,32,33,35,37,38,39,41,42,43,44,45,46]; 9 evaluated the effect on blood mineral concentrations [26,30,31,32,33,37,39,44,45]; and 24 focused on other performance indicators [17,18,24,25,26,27,28,29,30,31,33,34,35,36,37,38,39,40,41,43,44,45,46,47] (Table 1).

3.3. Study Quality

The methodological quality of all 26 studies was assessed using the PEDro scale and most of them were rated as of moderate to high quality (Table 2). It should be noted that the allocation of the athlete was not concealed in 19 of 26 studies. The only study [26] that obtained a poor qualification did not follow any blinding strategy.
The numbers in the columns correspond to the following items of the PEDro scale.
  • Eligibility criteria were specified.
  • Subjects were randomly allocated to groups.
  • Allocation was concealed.
  • The groups were similar at baseline regarding the most important prognostic indicators.
  • There was blinding of all subjects.
  • There was blinding of all therapists who administered the therapy.
  • There was blinding of all assessors who measured at least one key outcome.
  • Measures of at least one key outcome were obtained from more than 85% of the subjects initially allocated to groups.
  • All subjects for whom outcome measures were available received the treatment or control condition as allocated or, where this was not the case, data for at least one key outcome was analysed by “intention to treat”.
  • The results of between-group statistical comparisons are reported for at least one key outcome.
  • The study provides both point measures and measures of variability for at least one key outcome.

3.4. Effects of CHO-E on Sports Performance

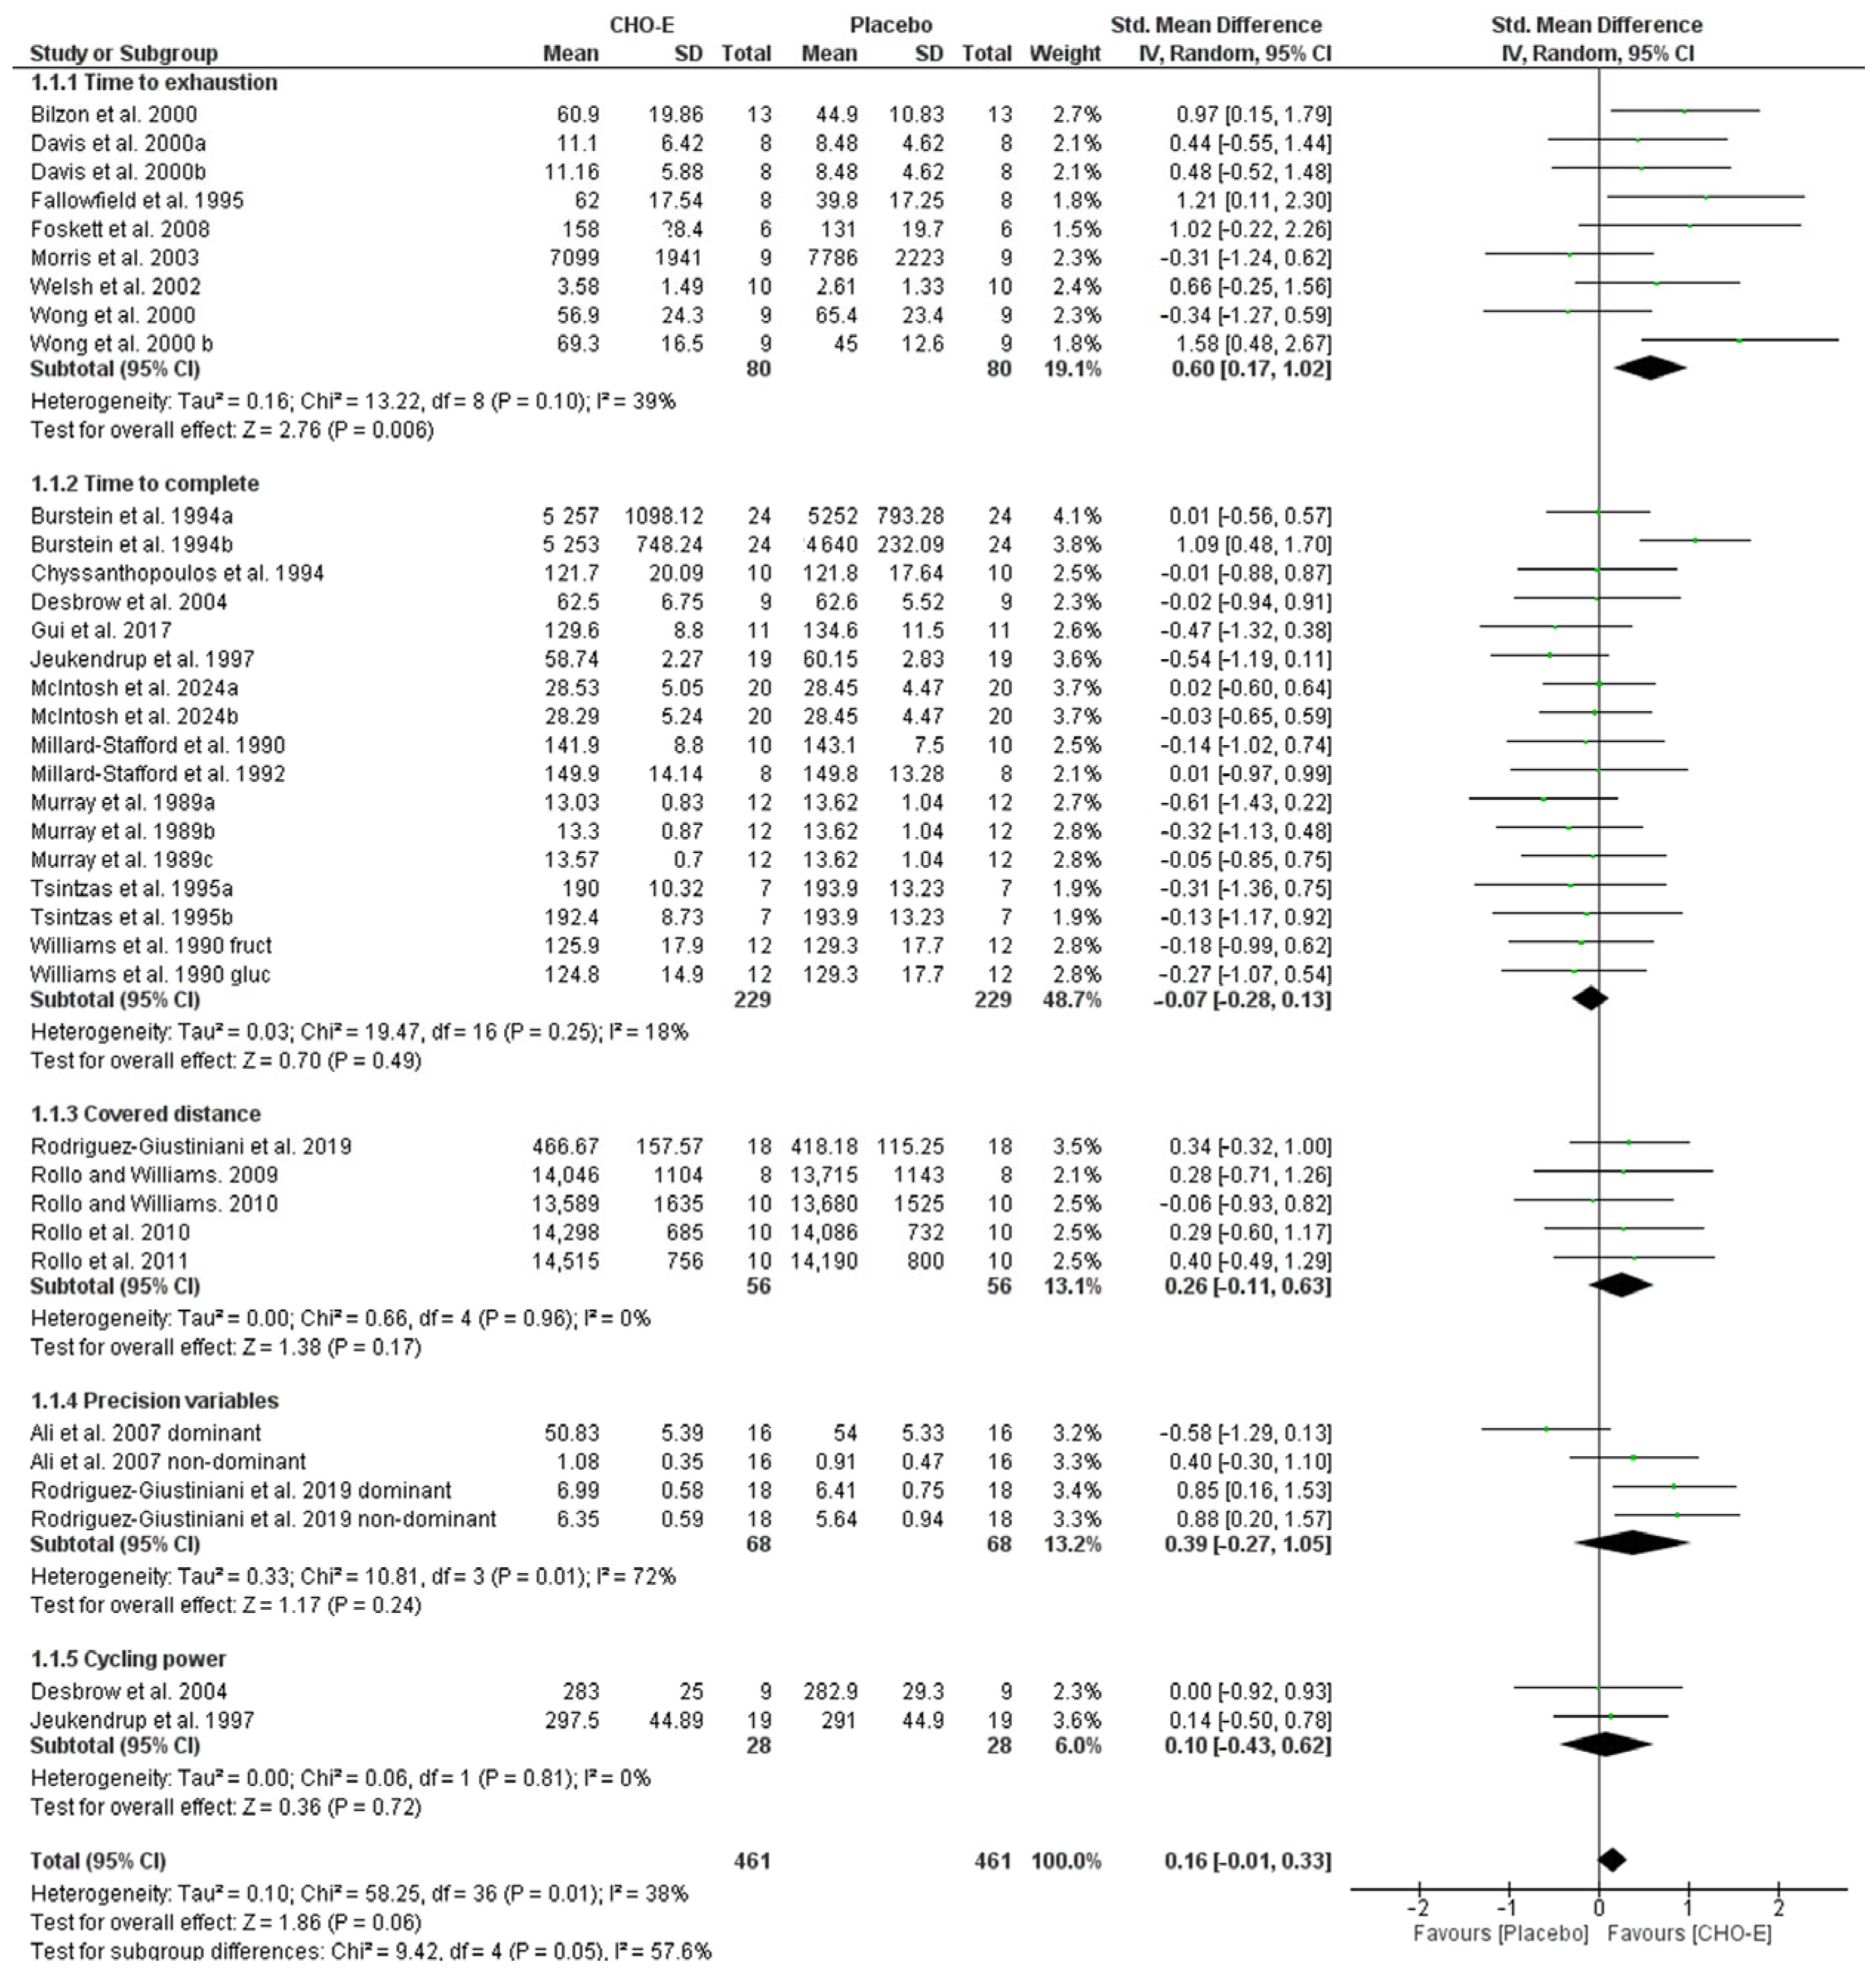
The meta-analysis did not find differences between CHO-E and placebo groups (SMD, 0.16; 95% CI: −0.01, 0.33; n = 922; Z = 2.76; p = 0.06) in sports performance with moderate heterogeneity (I2 = 38%) (Figure 2). The subgroup (condition) analysis showed moderate heterogeneity (I2 = 57%) and non-significant differences (p = 0.05). The CHO-E group showed a moderate effect (SMD, 0.60; 95% CI: 0.17, 1.02; n = 160; Z = 2.76), significant differences (p = 0.006) and moderate heterogeneity (I2 = 39%) compared to the placebo group in time to exhaustion (Figure 2). No differences (p = 0.49) with low heterogeneity (I2 = 18%) and a small effect (SMD, −0.07; 95% CI: −0.28, 0.13; n = 458; Z = 0.70) were described between CHO-E and placebo groups in the time to complete sub-analysis. The distance covered comparison between CHO-E and placebo showed a small effect (SMD, 0.17; 95% CI: −0.11, 0.63; n = 112; Z = 1.38), and non-significant differences were described (p = 0.17) and showed low heterogeneity (I2 = 0%) (Figure 2). The precision variables comparison between CHO-E and placebo showed a moderate effect (SMD, −0.39; 95% CI: −0.27, 1.05; n = 126; Z = 1.17), and non-significant differences were described (p = 0.24) and showed high heterogeneity (I2 = 72%) (Figure 2). Finally, the cycling power comparison between CHO-E and placebo showed a small effect (SMD, 0.10; 95% CI: −0.43, 0.2; n = 56; Z = 0.36), and non-significant differences were described (p = 0.72) and showed low heterogeneity (I2 = 0%) (Figure 2).

3.5. Effects of CHO-E on Metabolic Biomarkers

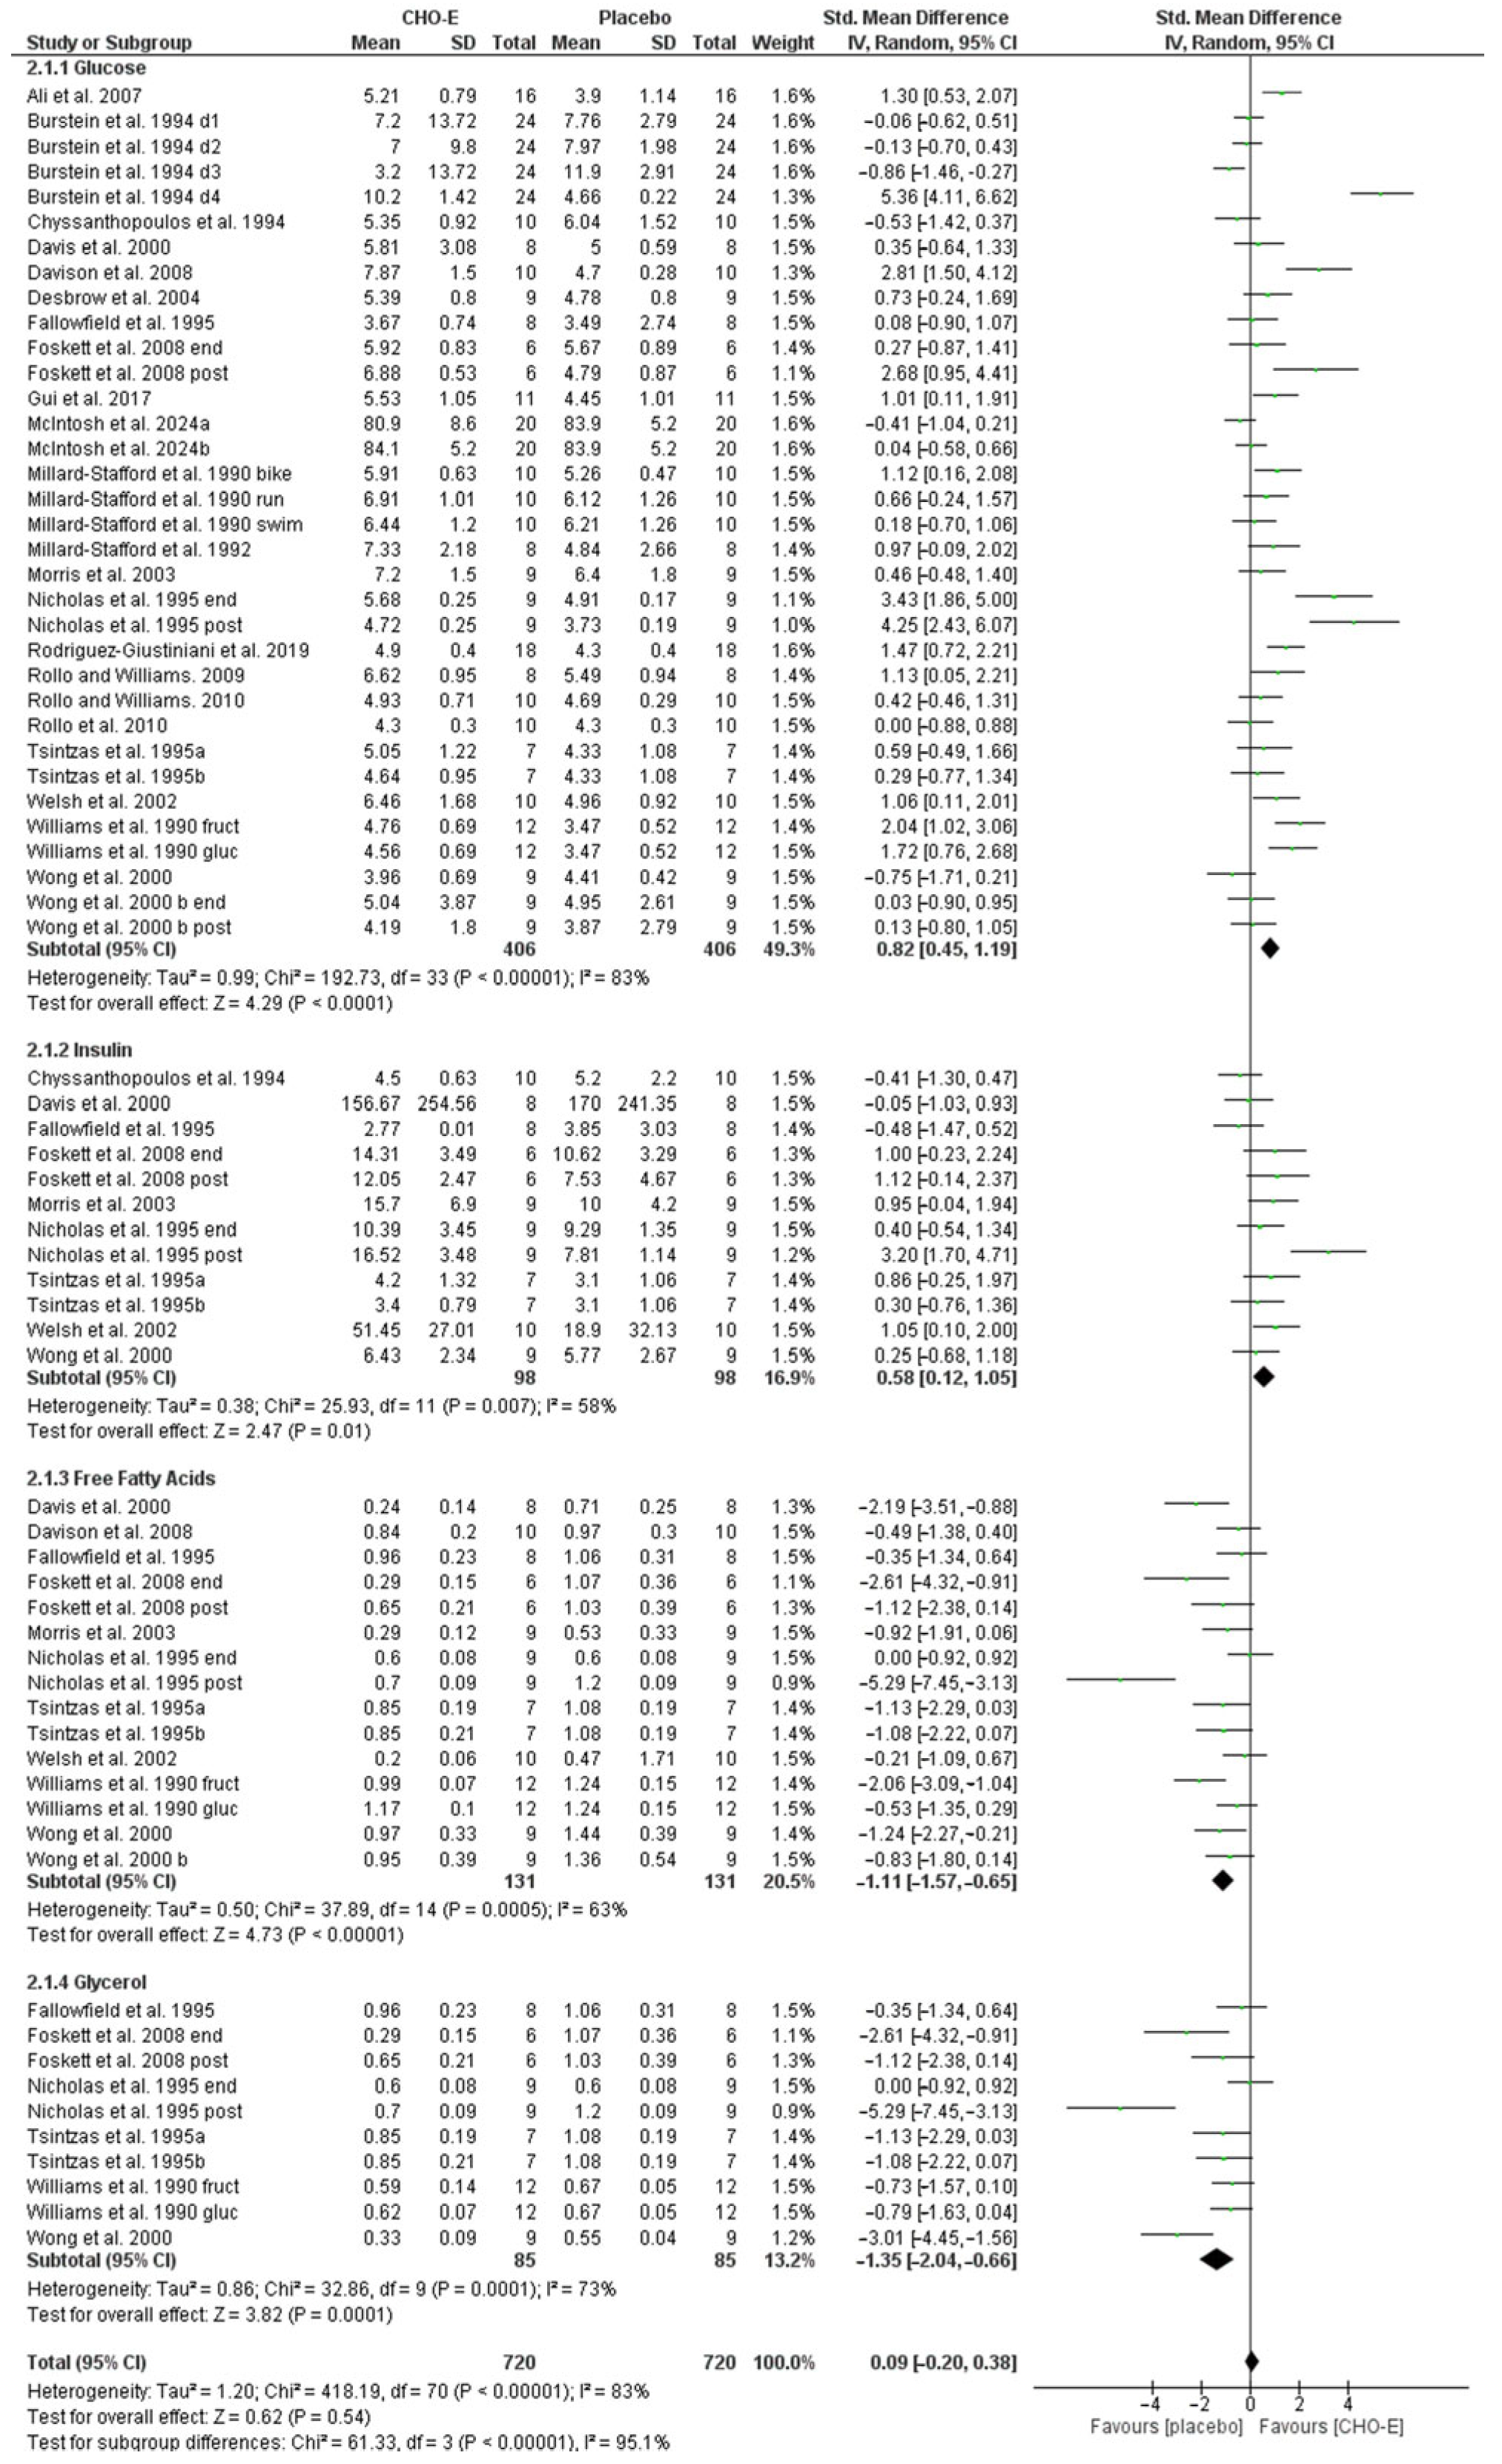
The meta-analysis did not find differences between CHO-E and placebo groups (SMD, 0.09; 95% CI: −0.20, 0.38; n = 1440; Z = 0.62; p = 0.54) in metabolic biomarkers with high heterogeneity (I2 = 83%) (Figure 3). The subgroup (condition) analysis showed high heterogeneity (I2 = 95.1%) and significant differences (p < 0.001). The CHO-E group showed high effects (SMD, 0.82; 95% CI: 0.45, 1.19; n = 160; Z = 4.29) and significant differences (p < 0.001) with high heterogeneity (I2 = 83%) compared to the placebo group in blood glucose levels (Figure 3). Significant differences (p = 0.01) with moderate heterogeneity (I2 = 58%) and a moderate effect (SMD, 0.58; 95% CI: 0.12, 1.05; n = 196; Z = 2.47) were described between CHO-E and placebo groups in insulin levels. The free fatty acid comparison between CHO-E and placebo showed a high effect (SMD, −1.11; 95% CI: −1.57, −0.65; n = 262; Z = 4.73) and significant differences were described (p < 0.001) with moderate heterogeneity (I2 = 63%) (Figure 3). The glycerol levels comparison between CHO-E and placebo showed a high effect (SMD, −1.35; 95% CI: −2.04, −0.66; n = 170; Z = 3.82) and significant differences were described (p < 0.001) and showed high heterogeneity (I2 = 73%) (Figure 3).

3.6. Effects of CHO-E on Blood Mineral Concentrations

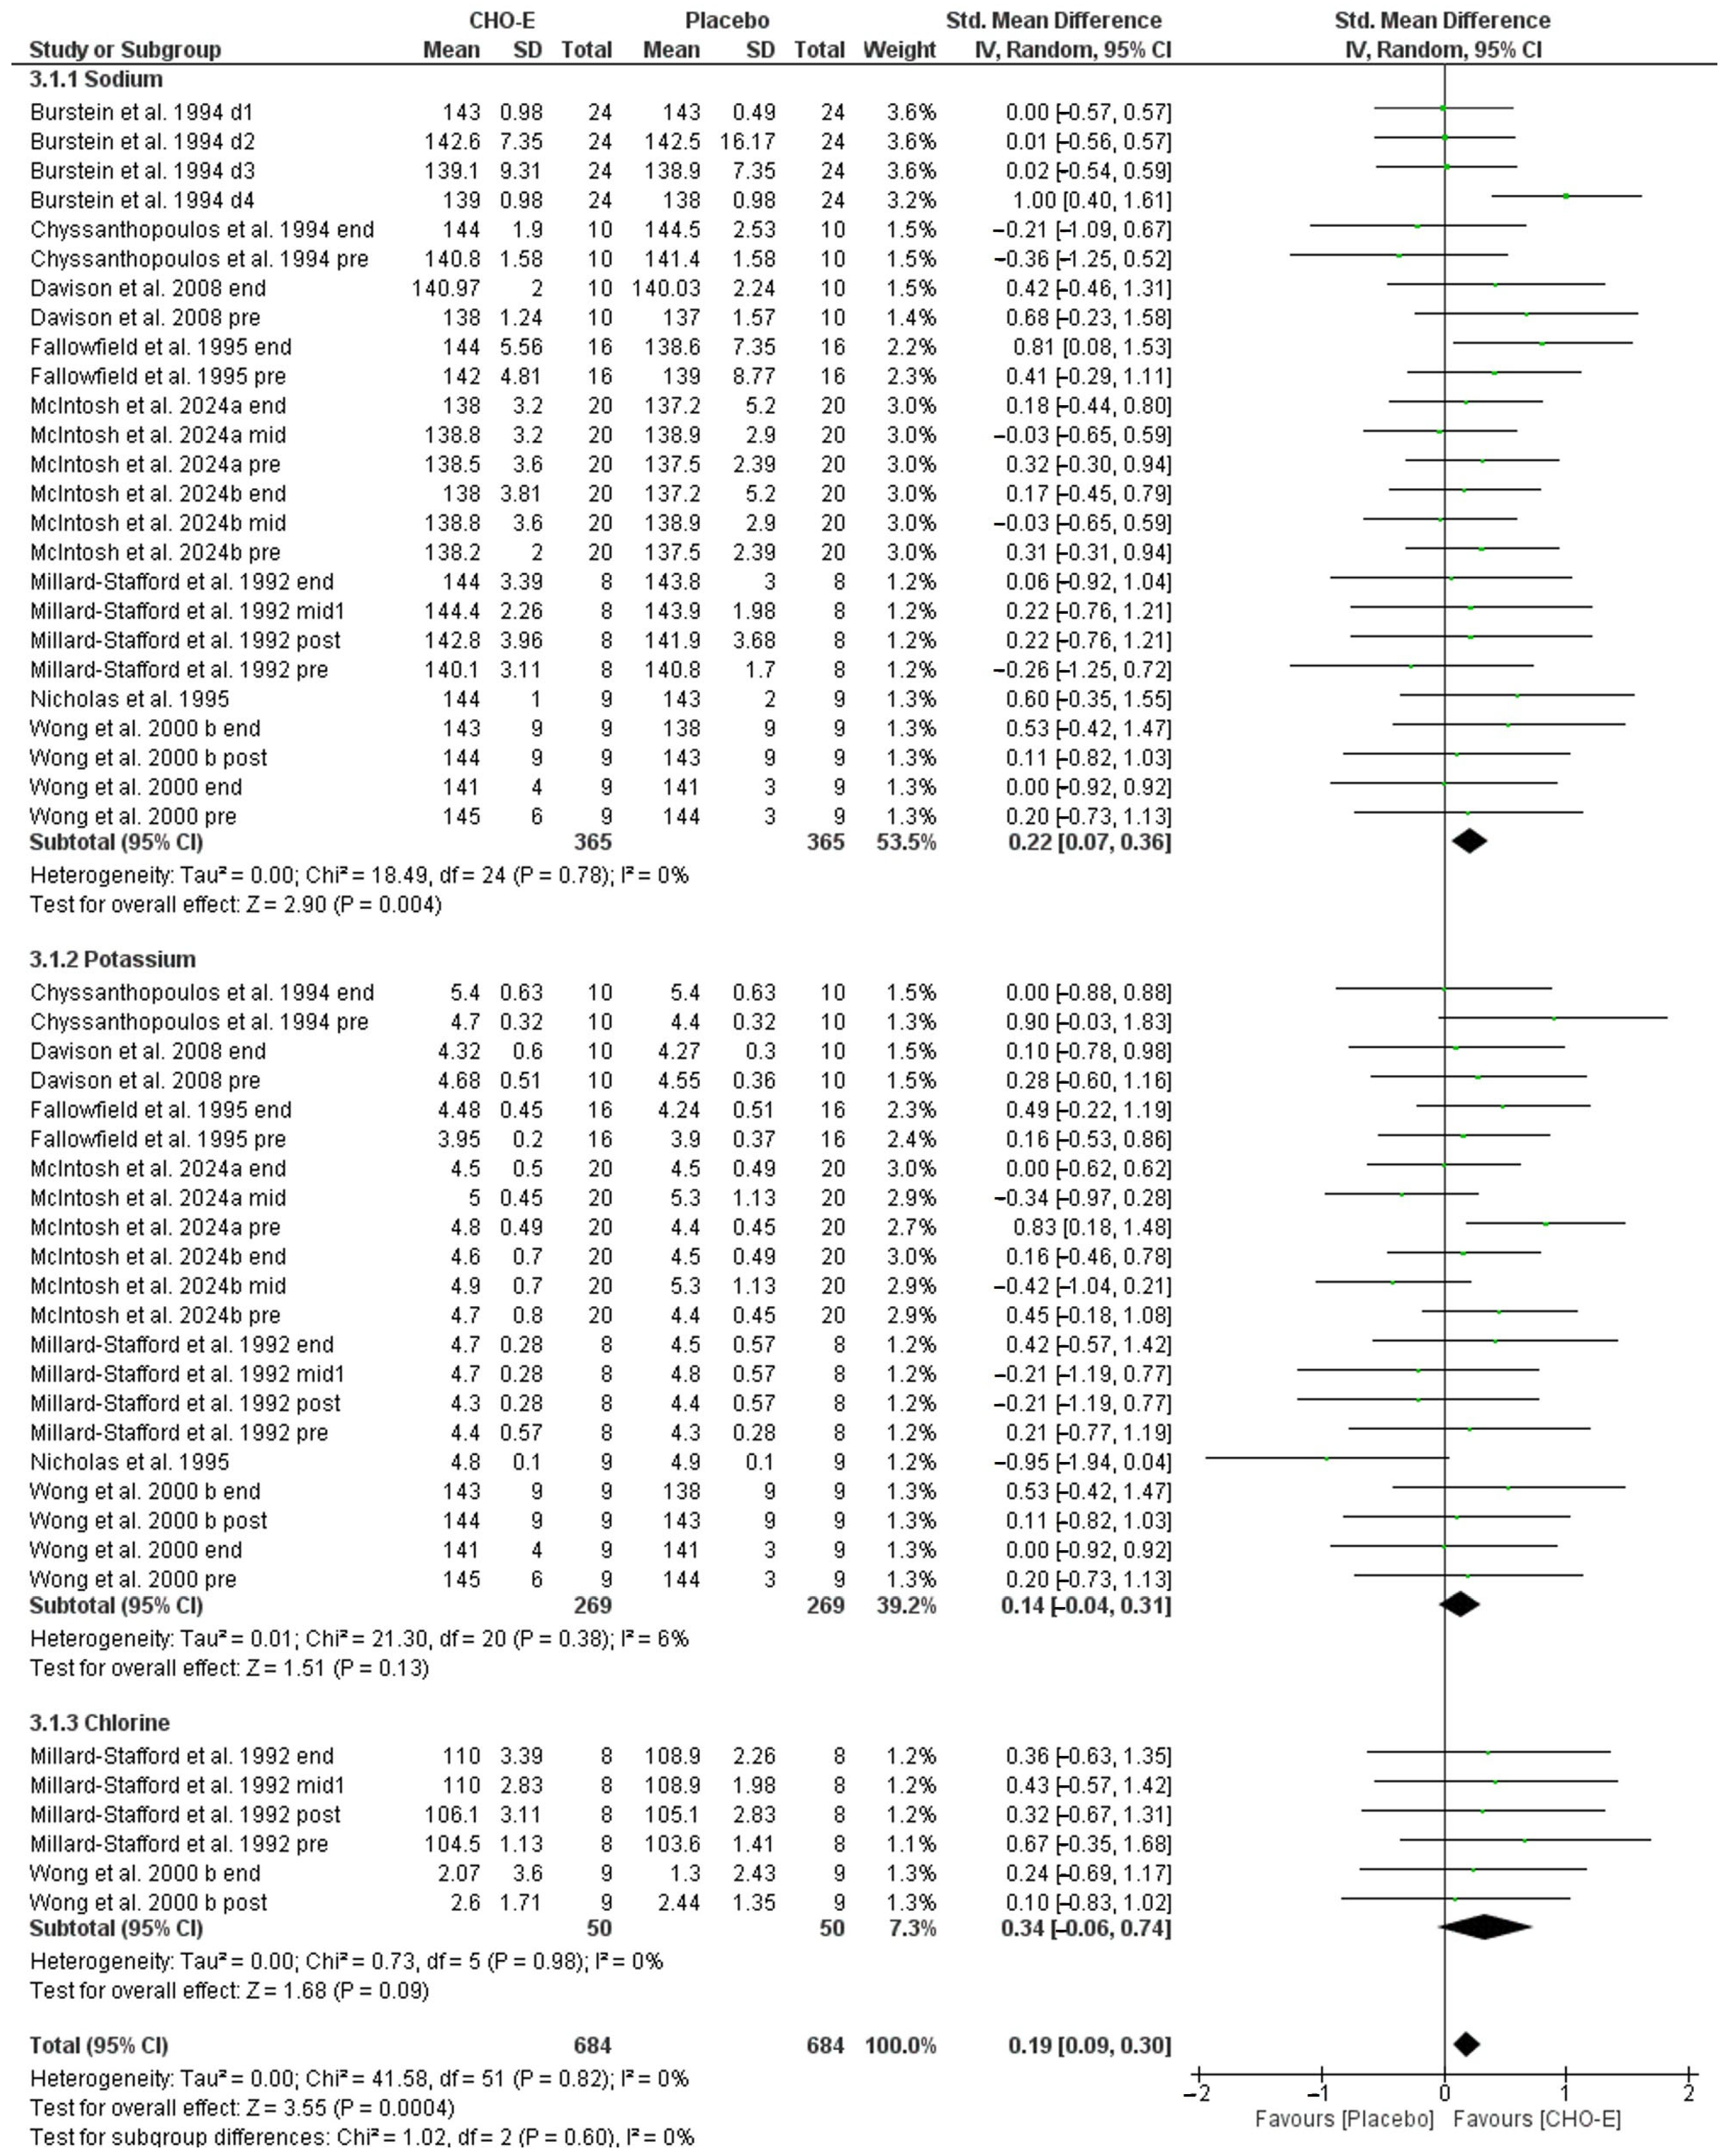
The meta-analysis found differences between CHO-E and placebo groups (SMD, 0.19; 95% CI: 0.09, 0.30; n = 1368; Z = 3.55; p < 0.001) in blood mineral concentrations with low heterogeneity (I2 = 0%) (Figure 4). The subgroup (condition) analysis showed low heterogeneity (I2 = 0%) and non-significant differences (p = 0.60). The CHO-E group showed low effects (SMD, 0.20; 95% CI: 0.07, 0.36; n = 730; Z = 2.90), and significant differences (p = 0.004) and low heterogeneity (I2 = 0%) compared to the placebo group in blood sodium levels (Figure 4). No significant differences (p = 0.13) with low heterogeneity (I2 = 6%) and a low effect (SMD, 0.14; 95% CI: −0.04, 0.31; n = 538; Z = 1.51) were described between CHO-E and placebo groups in potassium levels. The chlorine level comparison between CHO-E and placebo showed a low effect (SMD, 0.34; 95% CI: −0.06, 0.74; n = 100; Z = 1.68), and non-significant differences were described (p = 0.09) with low heterogeneity (I2 = 0%) (Figure 4).

3.7. Effects of CHO-E on Other Performance Descriptors

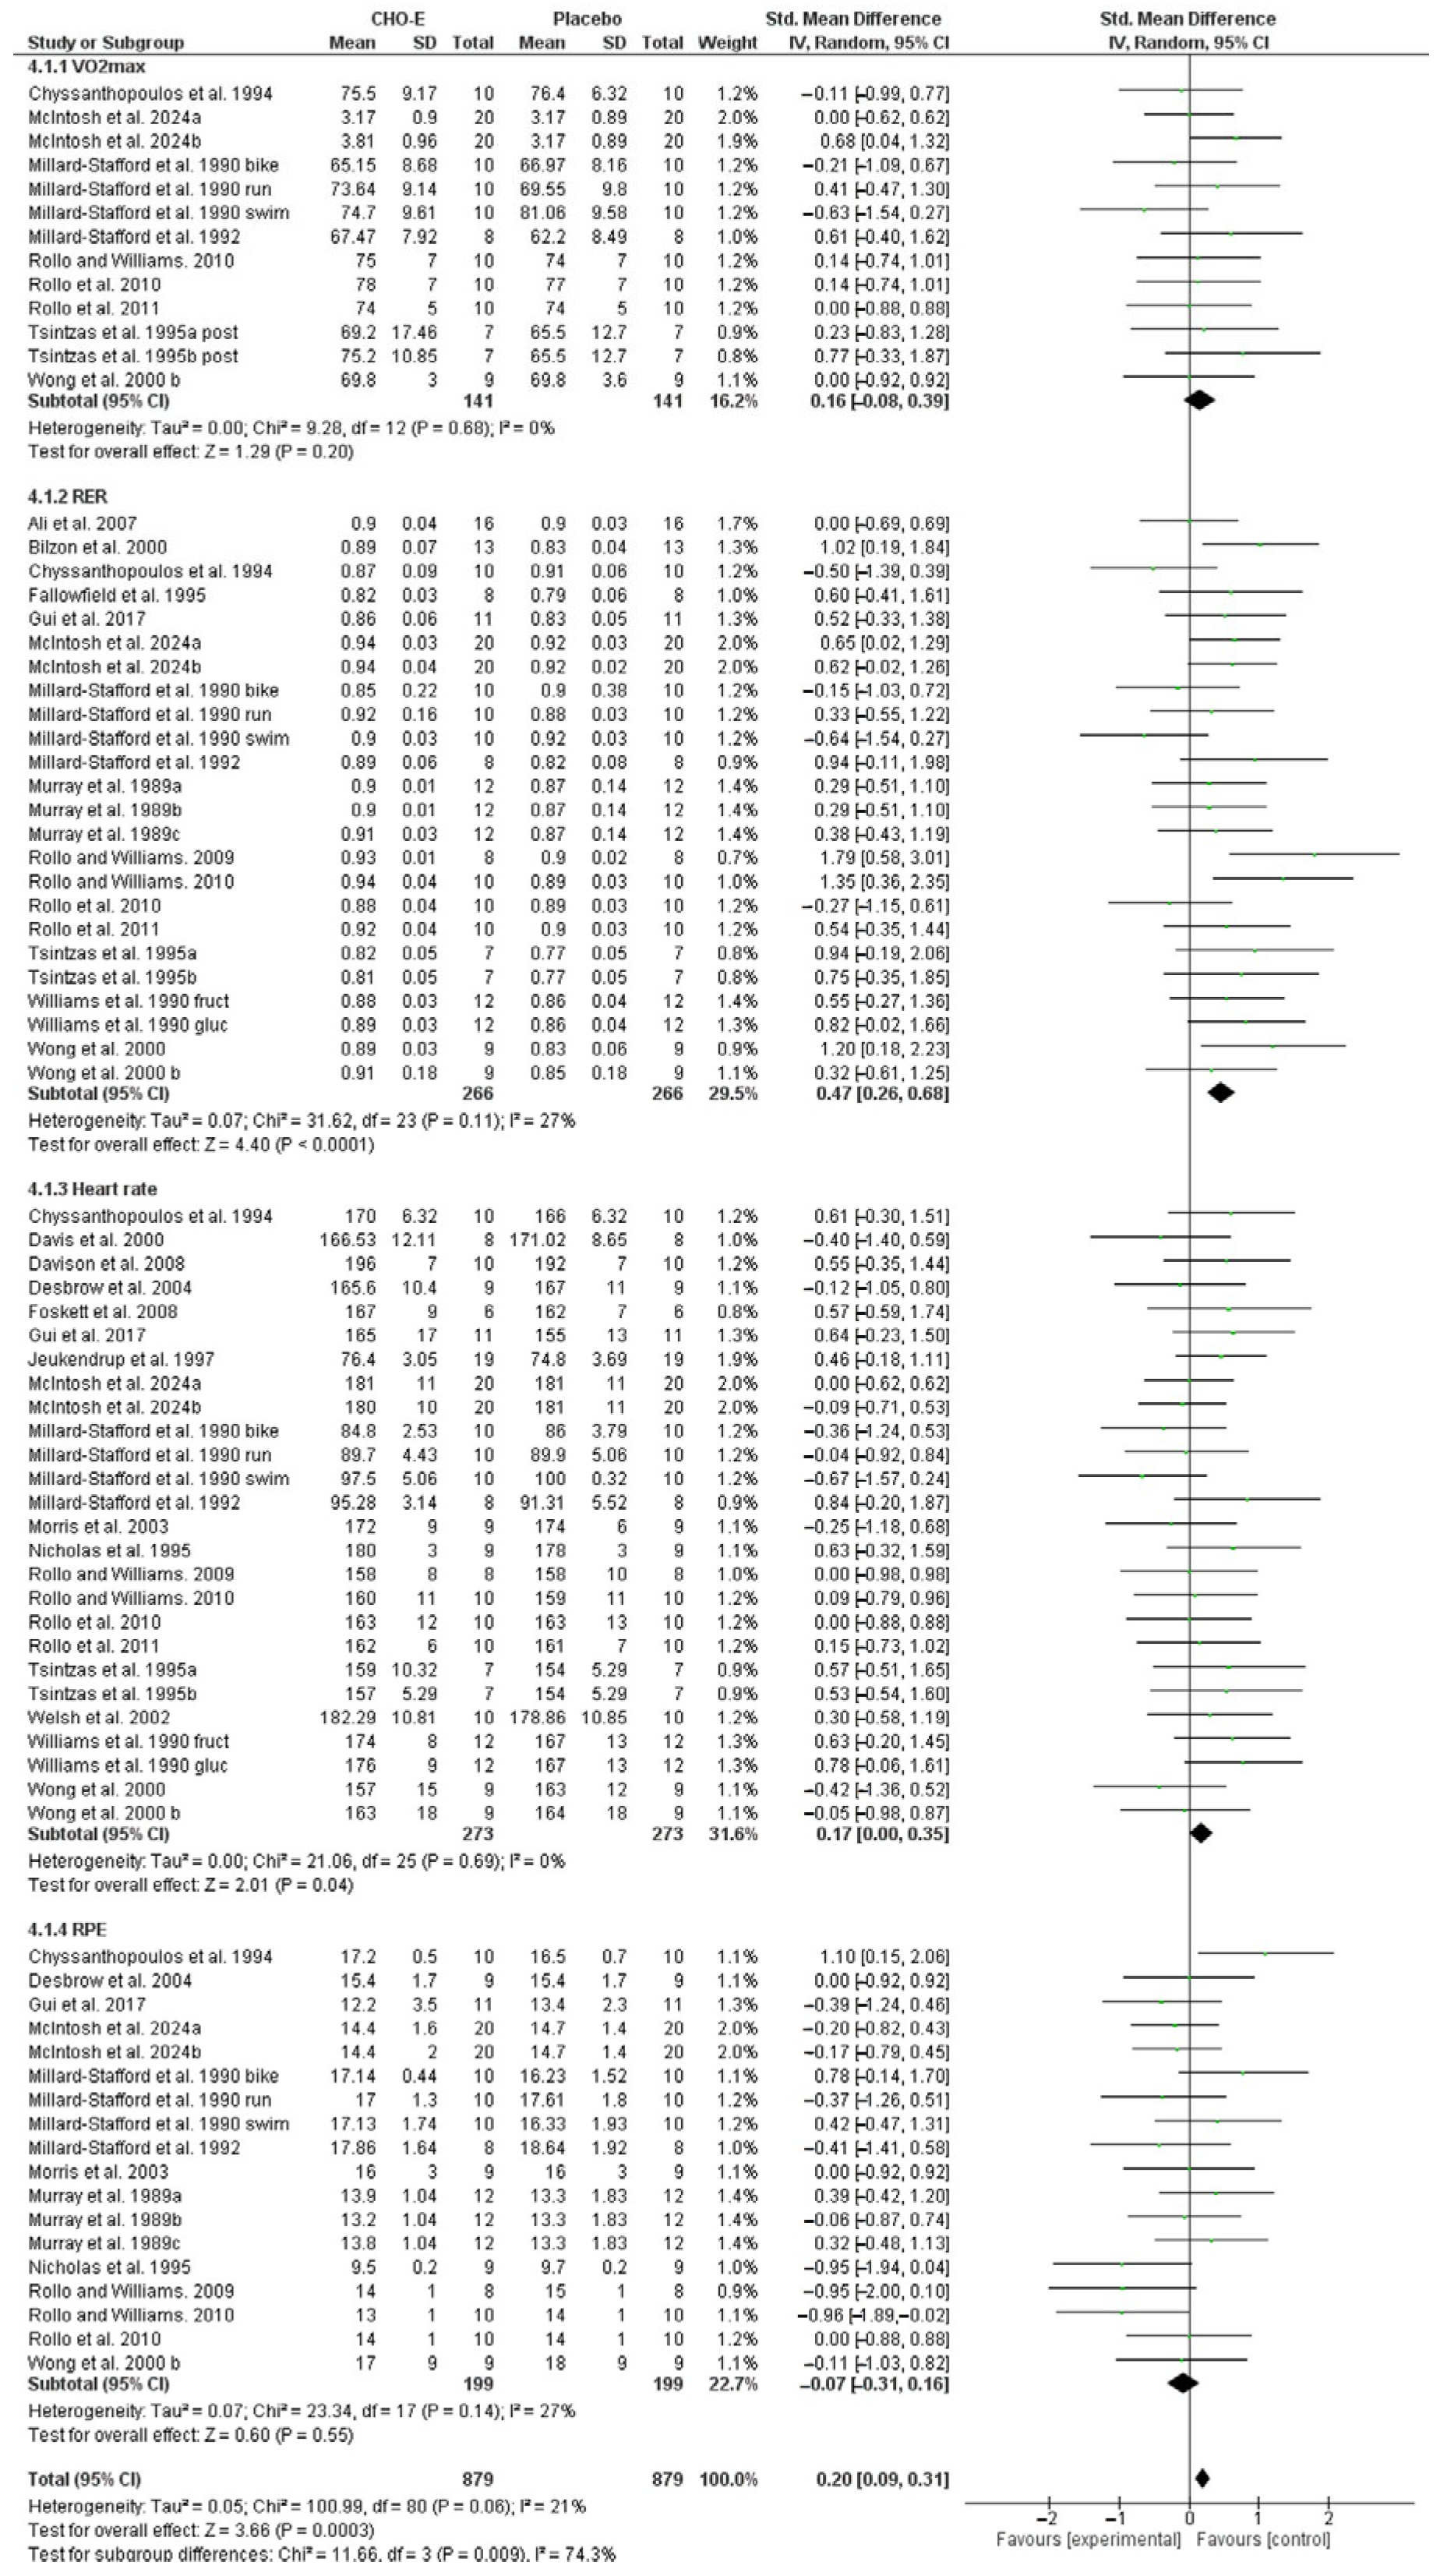
The meta-analysis found differences between CHO-E and placebo groups (SMD, 0.20; 95% CI: 0.09, 0.31; n = 1758; Z = 3.66; p < 0.001) in other performance predictors with low heterogeneity (I2 = 21%) (Figure 5). The subgroup (condition) analysis showed high heterogeneity (I2 = 74.3%) and significant differences (p = 0.009). The CHO-E group showed a low effect (SMD, 0.16; 95% CI: −0.08, 0.39; n = 282; Z = 1.29) and non-significant differences (p = 0.20) with low heterogeneity (I2 = 0%) compared to the placebo group in VO2max (Figure 5). Significant differences (p < 0.001) with moderate heterogeneity (I2 = 27%) and a low effect (SMD, 0.47; 95% CI: 0.26, 0.68; n = 572; Z = 4.40) were described between CHO-E and placebo groups in respiratory exchange ratio (RER) levels. The heart rate comparison between CHO-E and placebo showed a low effect (SMD, 0.17; 95% CI: 0.00, 0.35; n = 546; Z = 2.01) and significant differences were described (p = 0.04) with low heterogeneity (I2 = 0%) (Figure 5). The rated perceived exertion (RPE) comparison between CHO-E and placebo showed a low effect (SMD, −0.07; 95% CI: −0.31, 0.16; n = 398; Z = 0.60), and non-significant differences were described (p = 0.55) with moderate heterogeneity (I2 = 27%) (Figure 5).

3.8. Additional Analysis

Sensitivity analyses confirmed the robustness of the main findings. When fixed-effect models were compared with the primary random-effects models used in the main analyses, the direction and statistical significance of the pooled effects remained unchanged in sports performance, metabolic biomarkers, blood mineral concentrations and other performance descriptors. In addition, leave-one-out analyses identified various studies that had a considerable impact on the pooled estimate of metabolic biomarkers [25,27,32,42,44,45]. Removal of this study led to a change in the magnitude but not in the statistical significance of the effect in glucose (SMD ranged from 0.32 to 0.82), insulin (SMD ranged from 0.40 to 0.58), free fatty acids (SMD range from −1.11 to −0.67) and glycerol (SMD range from −0.68 to −0.60). Overall, the sensitivity analyses supported the stability of the results after decreasing the I2.

3.9. Quality of Evidence (GRADE)

The GRADE statement summarises the ROB, inconsistency of the results, indirectness of evidence, imprecision of results, and publication bias for determining the level of evidence according to GRADE assessment. Across the included studies, no risk of bias, indirectness, or publication bias was identified. However, several outcomes were downgraded due to serious imprecision and substantial heterogeneity, particularly in metabolic biomarkers and some sports performance indicators. As a result, the certainty of evidence ranged from low to high, with moderate or low certainty observed for outcomes affected by heterogeneity or limited sample sizes, while outcomes related to blood mineral concentrations and other performance descriptors remained at a high level of certainty (Table 3).

4. Discussion

In endurance sports, the intake of carbon CHO during exercise has been identified as a key factor to enhance athletic performance, although the effect of its supplementation in combination with electrolytes (CHO-E) has been more controversial. The principal objective of this study was to analyse the effect of CHO-E supplementation during exercise versus other non-CHO nutritional strategies on athletic performance. The main findings of our research showed that CHO-E supplementation could be a useful nutritional strategy when sports performance was linked to the duration of the event, with longer time to exhaustion and higher blood glucose and sodium levels being maintained during exercise. On the other hand, the lower RPE values associated with higher RER values might indicate greater tolerance to effort in athletes using CHO-E compared to a placebo. Therefore, CHO-E intake during exercise could be crucial for optimising performance.

4.1. Effects of CHO-E on Sports Performance

Sports performance in endurance sports is conditioned by the moment of onset of fatigue, which has a multifactorial origin [2]. The emptying of glycogen stores, together with a lack of blood glucose replenishment through nutrition, causes the athlete’s capacity for effort to decrease and, therefore, their performance to drop [48]. The duration of endurance sports events can range from one hour in disciplines such as the half marathon to more than three hours in cycling events or average marathon runners. Therefore, this heterogeneity in test duration needs to be taken into account when interpreting the effectiveness of CHO-E supplementation. Jeukendrup [10] indicated that in events lasting less than 75 min, CHO intake might not be necessary, whereas in events longer than 2.5 h, carbohydrate intake should be around 90 g per hour. Our results from 26 studies assessing sports performance under CHO-E supplementation compared to a placebo did not find a significant overall effect, although subgroup analysis showed a significantly positive effect of CHO-E supplementation on time to exhaustion (p = 0.006), suggesting that CHO-E intake may enhance endurance capacity under prolonged exercise conditions. In our meta-analysis, the studies that have shown positive results of CHO-E consumption on time to exhaustion have followed a similar protocol, consisting of two running tests separated by 4 h [24,26,31]. In the first test, a target intensity was set and in the second, the aim was to maintain that target intensity until exhaustion. In neither study did the placebo group receive CHO, so they started the second trial with little CHO available, compared to the CHO-E group, who did get a CHO refill. However, none of the studies analysed performed CHO supplementation according to the current recommendations (90 g/h for exercise longer than 2.5 h) [10]. Therefore, larger differences between placebo and CHO-E groups could be expected if the latest nutritional recommendations were followed.
On the other hand, no positive effects were found in the remaining performance variables analysed, including time to complete the test, distance covered, cycling power, and precision-related outcomes. This finding supports the hypothesis that the amount of carbohydrates provided in the studies included in this review may have been insufficient to elicit an ergogenic effect in situations where both groups started with fully replenished glycogen stores [49]. In such contexts, CHO-E supplementation may not represent a limiting factor for performance, particularly in shorter or less demanding exercise protocols [50]. The studies that provided power values up to exhaustion included a maximum effort limit in their protocols, so all participants had to cycle at 80% of their threshold power [34,36]. Future studies should assess the effect of CHO-E supplementation in time trials without effort limitation. Finally, factors such as accuracy may be more influenced by the technical ability of athletes than by the availability or lack of CHO [43].

4.2. Effects of CHO-E on Metabolic Biomarkers

Glucose is the primary source of energy during exercise [51]. Blood glucose levels during exercise depend on the level of glycogen stores before the start, the intensity of the activity, and food intake during the sport [4]. A decrease in glycogen availability is often associated with the onset of fatigue. Therefore, the consumption of carbohydrates before [52] and during [48] prolonged exercise helps to maintain blood glucose levels and improve performance. In our meta-analysis, the results showed a higher level of glucose in those athletes who consumed CHO-E compared to the placebo situation. Furthermore, although most of the protocols used by researchers to induce fatigue lasted no longer than two hours, the finding of greater availability of glucose in the blood in the CHO-E group compared to a placebo serves to reaffirm that supplementation with CHO during the trial, even in small doses (<70 g in total; ~20 to 30 gr/hour), helps to maintain higher glucose levels than simply following a rehydration strategy without CHO. Additionally, in line with the decrease in blood glucose, the placebo group showed significantly higher values of free fatty acids and glycerol than those observed in the CHO-E group, likely reflecting greater lipolysis and a shift toward fat utilisation secondary to lower carbohydrate availability, rather than a direct negative effect of these metabolites on performance [53]. This metabolic profile may be less favourable if exercise intensity had to be increased at the end of the test or if exercise duration were extended, since carbohydrate is the predominant substrate for higher-intensity exercise [54]. Nevertheless, the GRADE assessment indicated low certainty of evidence for glucose and moderate certainty for insulin, free fatty acids, and glycerol, mainly due to substantial heterogeneity among studies, which should be considered when interpreting these findings.

4.3. Effects of CHO-E on Blood Mineral Concentrations

Sodium and potassium are two essential electrolytes involved in maintaining cellular volume, osmolarity, and membrane potentials [55]. Increased electrolyte intake has not shown significant improvements in athletic performance; however, lower concentrations may accelerate fatigue processes and have been associated in some studies with the onset of muscle cramps [13]. As observed in the studies analysed, both electrolytes are among the most commonly used by energy drink manufacturers, although their concentrations vary depending on the brand [9,26,34].
The results of our study showed that the use of energy drinks helps to maintain higher sodium levels compared to those observed in the control group. Therefore, in situations involving intense exercise lasting approximately 1.5 h, sodium intake in amounts of 300–600 mg/h may be sufficient to prevent depletion [56]. On the other hand, the average potassium concentration consumed by the athletes analysed in our meta-analysis was under 100 mg, while the general recommendation is slightly higher (200–400 mg) [57]. This discrepancy could explain the lack of differences observed between the control group and the CHO-E group.
Another factor that may explain the different behaviour observed between sodium and potassium concentrations is the electrolyte composition of sweat during prolonged exercise. Sodium is the electrolyte most lost through sweating, with concentrations ranging from 20 to 80 mmol·L−1 [58], while potassium losses are substantially lower, generally around 3–8 mmol·L−1 [59]. Consequently, sodium balance during exercise is more influenced by sweat losses and fluid replacement strategies, making exogenous sodium intake particularly relevant for maintaining plasma concentrations [15]. In contrast, potassium is primarily an intracellular electrolyte, and its extracellular concentration is tightly regulated through cellular absorption mechanisms and renal control mechanisms [60]. Therefore, the relatively small amount of potassium provided by the CHO-E beverages analysed in the included studies (<100 mg on average) may have been insufficient to significantly influence circulating concentrations, especially considering the strict physiological regulation of this electrolyte and its comparatively minor losses through sweat.

4.4. Effects of CHO-E on Other Performance Descriptors

Exercise intensity can be assessed through measurements of oxygen consumption, respiratory exchange ratio (RER), and heart rate [61]. In laboratory-based maximal tests, such as incremental protocols used to determine ventilatory thresholds, a test is considered maximal when the RER exceeds 1.1 and heart rate reaches 90% of the age-predicted maximum [62]. The analysis of RER can be influenced by multiple factors, including exercise duration, fibre-type composition, and dietary fat intake or glycogen availability [63]. Most of the studies included in our review employed a crossover design, in which all participants underwent both conditions (CHO-E and placebo). Therefore, the higher RER values observed in the CHO-E group may indicate an increased rate of glycogen and exogenous carbohydrate oxidation during exercise under this condition, reflecting greater substrate availability and prolonged time to exhaustion.
In addition to physiological data, many studies included the assessment of perceived exertion using the Borg scale [64]. In our results, we observed that for the same exercise protocol and under similar environmental conditions, participants in the CHO-E group exhibited significantly higher heart rate values without reporting increased perceived exertion. This finding suggests that CHO-E supplementation allows athletes to sustain a higher absolute exercise intensity while maintaining a similar subjective perception of effort. This is consistent with the notion that exogenous carbohydrate intake helps preserve blood glucose levels and delay central fatigue, thereby stabilising RPE even as workload increases [65].

4.5. Limitations

This review is not without limitations. Firstly, most of the included studies have utilised energy drinks for comparison against placebo situations, but often these provided carbohydrate amounts significantly below the established recommendation of ~60 g/h for endurance sports, suggesting that the benefits of supplementation might be underestimated. Secondly, most exercise protocols lasted for one hour; future studies will need to verify effectiveness when the athlete is exercising for more than 2 h. Another limitation of the present systematic review is the considerable heterogeneity among the included studies in terms of supplementation strategies (e.g., ingestion during exercise vs. between exercise blocks) and exercise protocols. Such methodological variability may partly explain the heterogeneity observed in the results and may limit the generalizability of the findings. Finally, the studies were conducted in non-competitive environments, highlighting the need for future investigations to be performed during actual competition.

5. Conclusions

The findings of this systematic review and meta-analysis demonstrate that CHO-E supplementation during moderate- to high-intensity exercise confers significant benefits on athletic performance, particularly by increasing time to exhaustion and enhancing energy availability. These effects appear to be mediated by improved maintenance of blood glucose and sodium concentrations, which collectively delay the onset of fatigue and support sustained muscular performance during prolonged physical activity.
However, CHO-E beverages with a carbohydrate concentration of approximately 6% did not significantly improve time to completion in endurance tasks, suggesting that the effectiveness of supplementation may depend on factors such as dosage, exercise duration, and environmental conditions. Overall, these results support CHO-E supplementation as an effective nutritional strategy to optimise endurance performance, mitigate fatigue, and prevent glycogen and electrolyte depletion in physically active individuals.

Author Contributions

Conceptualization: A.B.-S. and J.A.-V. Data curation: A.B.-S. and M.R.-d. Formal analysis: A.B.-S., P.A., and J.A.-V. Funding acquisition: M.R.-d. Investigation: A.B.-S. and M.R.-d. Methodology: A.B.-S., J.S.-I., and P.A. Project administration: J.A.-V. and J.S.-I. Resources: M.R.-d. and P.A. Software: P.A. and A.B.-S. Supervision: M.R.-d. and J.A.-V. Validation: P.A. and J.A.-V. Visualisation: A.B.-S. and M.R.-d. Writing—original draft: A.B.-S. and M.R.-d. Writing—review and editing: P.A., J.A.-V., and J.S.-I. All authors have read and agreed to the published version of the manuscript.

Funding

This work was supported by pre-doctoral grants from the University of Castilla-La Mancha, Plan Propio de I+D+I, co-funded by the European Social Fund with number: 2020-PREDUCLM-16702.

Institutional Review Board Statement

Not applicable.

Informed Consent Statement

Not applicable.

Data Availability Statement

No new data were created or analyzed in this study. Data sharing is not applicable to this article.

Acknowledgments

The authors would like to thank Diane Schofield (Associate of the Chartered Institute of Linguists no. 31814) for the English language review.

Conflicts of Interest

The authors declare no conflicts of interest.

Abbreviations

The following abbreviations are used in this manuscript:
CHOCarbohydrate
CHO-ECarbohydrate and electrolyte
CIConfidence interval
FFAsFree fatty acids
ORsCombined odds ratios
RERRespiratory exchange ratio
RPERated perceived exertion
SMDStandard mean difference

References

  1. Yang, P.; Xu, R.; Le, Y. Factors influencing sports performance: A multi-dimensional analysis of coaching quality, athlete well-being, training intensity, and nutrition with self-efficacy mediation and cultural values moderation. Heliyon 2024, 10, e36646. [Google Scholar] [CrossRef]
  2. Cairns, S.P. Holistic approaches to understanding mechanisms of fatigue in high-intensity sport. Fatigue Biomed. Health Behav. 2013, 1, 148–167. [Google Scholar]
  3. Vigh-Larsen, J.F.; Ørtenblad, N.; Spriet, L.L.; Overgaard, K.; Mohr, M. Muscle Glycogen Metabolism and High-Intensity Exercise Performance: A Narrative Review. Sports Med. 2021, 51, 1855–1874. [Google Scholar] [CrossRef]
  4. Vitale, K.; Getzin, A. Nutrition and Supplement Update for the Endurance Athlete: Review and Recommendations. Nutrients 2019, 11, 1289. [Google Scholar] [CrossRef]
  5. Graybeal, A.J.; Kreutzer, A.; Willis, J.L.; Moss, K.; Braun-Trocchio, R.; Shah, M. Age Drives the Differences in Dietary Supplement Use in Endurance Athletes: A Cross-Sectional Analysis of Cyclists, Runners, and Triathletes. J. Diet. Suppl. 2023, 20, 602–620. [Google Scholar] [CrossRef]
  6. Miguel-Ortega, Á.; Calleja-González, J.; Mielgo-Ayuso, J. Endurance in Long-Distance Swimming and the Use of Nutritional Aids. Nutrients 2024, 16, 3949. [Google Scholar] [CrossRef] [PubMed]
  7. Mata, F.; Valenzuela, P.L.; Gimenez, J.; Tur, C.; Ferreria, D.; Domínguez, R.; Sanchez-Oliver, A.J.; Sanz, J.M.M. Carbohydrate Availability and Physical Performance: Physiological Overview and Practical Recommendations. Nutrients 2019, 11, 1084. [Google Scholar] [CrossRef]
  8. Podlogar, T.; Wallis, G.A. New Horizons in Carbohydrate Research and Application for Endurance Athletes. Sports Med. 2022, 52, 5–23. [Google Scholar] [CrossRef] [PubMed]
  9. Rodriguez-Giustiniani, P.; Rollo, I.; Witard, O.C.; Galloway, S.D.R. Ingesting a 12% Carbohydrate-Electrolyte Beverage Before Each Half of a Soccer Match Simulation Facilitates Retention of Passing Performance and Improves High-Intensity Running Capacity in Academy Players. Int. J. Sport Nutr. Exerc. Metab. 2019, 29, 397–405. [Google Scholar] [CrossRef] [PubMed]
  10. Jeukendrup, A. A step towards personalized sports nutrition: Carbohydrate intake during exercise. Sports Med. 2014, 44, S25–S33. [Google Scholar] [CrossRef]
  11. Bernal, A.; Zafra, M.A.; Simón, M.J.; Mahía, J. Sodium Homeostasis, a Balance Necessary for Life. Nutrients 2023, 15, 395. [Google Scholar] [CrossRef]
  12. McCubbin, A.J. Modelling sodium requirements of athletes across a variety of exercise scenarios—Identifying when to test and target, or season to taste. Eur. J. Sport Sci. 2023, 23, 992–1000. [Google Scholar] [PubMed]
  13. Tambalis, K.D. The effect of electrolytes and energy drinks consumption on athletic performance—A narrative review. Eur. J. Fit. Nutr. Sports Med. Stud. 2022, 3, 1–25. [Google Scholar]
  14. Sawka, M.N.; Burke, L.M.; Eichner, E.R.; Maughan, R.J.; Montain, S.J.; Stachenfeld, N.S. American College of Sports Medicine position stand. Exercise and fluid replacement. Med. Sci. Sports Exerc. 2007, 39, 377–390. [Google Scholar] [PubMed]
  15. Pérez-Castillo, Í.M.; Williams, J.A.; López-Chicharro, J.; Mihic, N.; Rueda, R.; Bouzamondo, H.; Horswill, C.A. Compositional Aspects of Beverages Designed to Promote Hydration Before, During, and After Exercise: Concepts Revisited. Nutrients 2023, 16, 17. [Google Scholar] [CrossRef] [PubMed]
  16. Deshayes, T.A.; Pancrate, T.; Goulet, E.D.B. Impact of dehydration on perceived exertion during endurance exercise: A systematic review with meta-analysis. J. Exerc. Sci. Fit. 2022, 20, 224–235. [Google Scholar] [CrossRef]
  17. Rollo, I.; Cole, M.; Miller, R.; Williams, C. Influence of mouth rinsing a carbohydrate solution on 1-h running performance. Med. Sci. Sports Exerc. 2010, 42, 798–804. [Google Scholar] [CrossRef]
  18. Rollo, I.; Williams, C. Influence of ingesting a carbohydrate-electrolyte solution before and during a 1-hour run in fed endurance-trained runners. J. Sports Sci. 2010, 28, 593–601. [Google Scholar] [CrossRef]
  19. Moher, D.; Liberati, A.; Tetzlaff, J.; Altman, D.G. Reprint--preferred reporting items for systematic reviews and meta-analyses: The PRISMA statement. Phys. Ther. 2009, 89, 873–880. [Google Scholar] [CrossRef]
  20. Ramírez-delaCruz, M.; Bravo-Sánchez, A.; Esteban-García, P.; Jiménez, F.; Abián-Vicén, J. Effects of Plyometric Training on Lower Body Muscle Architecture, Tendon Structure, Stiffness and Physical Performance: A Systematic Review and Meta-analysis. Sports Med. Open 2022, 8, 40. [Google Scholar]
  21. Cashin, A.G.; McAuley, J.H. Clinimetrics: Physiotherapy Evidence Database (PEDro) Scale. J. Physiother. 2020, 66, 59. [Google Scholar] [CrossRef]
  22. Schünemann, H.J.; Oxman, A.D.; Brozek, J.; Glasziou, P.; Bossuyt, P.; Chang, S.; Muti, P.; Jaeschke, R.; Guyatt, G.H. GRADE: Assessing the quality of evidence for diagnostic recommendations. Evid. Based Med. 2008, 13, 162–163. [Google Scholar] [CrossRef]
  23. Higgins, J.P.; Thompson, S.G.; Deeks, J.J.; Altman, D.G. Measuring inconsistency in meta-analyses. Br. J. Sports Med. 2003, 327, 557–560. [Google Scholar] [CrossRef] [PubMed]
  24. Bilzon, J.L.; Allsopp, A.J.; Williams, C. Short-term recovery from prolonged constant pace running in a warm environment: The effectiveness of a carbohydrate-electrolyte solution. Eur. J. Appl. Physiol. 2000, 82, 305–312. [Google Scholar] [CrossRef]
  25. Davis, J.M.; Welsh, R.S.; Alerson, N.A. Effects of carbohydrate and chromium ingestion during intermittent high-intensity exercise to fatigue. Int. J. Sport Nutr. Exerc. Metab. 2000, 10, 476–485. [Google Scholar] [CrossRef]
  26. Fallowfield, J.L.; Williams, C.; Singh, R. The influence of ingesting a carbohydrate-electrolyte beverage during 4 hours of recovery on subsequent endurance capacity. Int. J. Sport Nutr. 1995, 5, 285–299. [Google Scholar] [CrossRef]
  27. Foskett, A.; Williams, C.; Boobis, L.; Tsintzas, K. Carbohydrate availability and muscle energy metabolism during intermittent running. Med. Sci. Sports Exerc. 2008, 40, 96–103. [Google Scholar] [CrossRef] [PubMed]
  28. Morris, J.G.; Nevill, M.E.; Thompson, D.; Collie, J.; Williams, C. The influence of a 6.5% carbohydrate-electrolyte solution on performance of prolonged intermittent high-intensity running at 30 degrees C. J. Sports Sci. 2003, 21, 371–381. [Google Scholar] [CrossRef]
  29. Welsh, R.S.; Davis, J.M.; Burke, J.R.; Williams, H.G. Carbohydrates and physical/mental performance during intermittent exercise to fatigue. Med. Sci. Sports Exerc. 2002, 34, 723–731. [Google Scholar] [PubMed]
  30. Wong, S.H.; Williams, C. Influence of different amounts of carbohydrate on endurance running capacity following short term recovery. Int. J. Sports Med. 2000, 21, 444–452. [Google Scholar] [CrossRef]
  31. Wong, S.H.; Williams, C.; Adams, N. Effects of ingesting a large volume of carbohydrate-electrolyte solution on rehydration during recovery and subsequent exercise capacity. Int. J. Sport Nutr. Exerc. Metab. 2000, 10, 375–393. [Google Scholar] [CrossRef]
  32. Burstein, R.; Seidman, D.S.; Alter, J.; Moram, D.; Shpilberg, O.; Shemer, J.; Wiener, M.; Epstein, Y. Glucose polymer ingestion--effect on fluid balance and glycemic state during a 4-d march. Med. Sci. Sports Exerc. 1994, 26, 360–364. [Google Scholar] [CrossRef]
  33. Chryssanthopoulos, C.; Williams, C.; Wilson, W.; Asher, L.; Hearne, L. Comparison between carbohydrate feedings before and during exercise on running performance during a 30-km treadmill time trial. Int. J. Sport Nutr. 1994, 4, 374–386. [Google Scholar] [CrossRef]
  34. Desbrow, B.; Anderson, S.; Barrett, J.; Rao, E.; Hargreaves, M. Carbohydrate-electrolyte feedings and 1 h time trial cycling performance. Int. J. Sport Nutr. Exerc. Metab. 2004, 14, 541–549. [Google Scholar] [CrossRef]
  35. Gui, Z.; Sun, F.; Si, G.; Chen, Y. Effect of protein and carbohydrate solutions on running performance and cognitive function in female recreational runners. PLoS ONE 2017, 12, e0185982. [Google Scholar] [CrossRef]
  36. Jeukendrup, A.; Brouns, F.; Wagenmakers, A.J.; Saris, W.H. Carbohydrate-electrolyte feedings improve 1 h time trial cycling performance. Int. J. Sports Med. 1997, 18, 125–129. [Google Scholar] [CrossRef]
  37. McIntosh, M.C.; Ruple, B.A.; Kontos, N.J.; Mattingly, M.L.; Lockwood, C.M.; Roberts, M.D. The effects of a sugar-free amino acid-containing electrolyte beverage on 5-kilometer performance, blood electrolytes, and post-exercise cramping versus a conventional carbohydrate-electrolyte sports beverage and water. J. Int. Soc. Sports Nutr. 2024, 21, 2296888. [Google Scholar] [CrossRef] [PubMed]
  38. Millard-Stafford, M.; Sparling, P.B.; Rosskopf, L.B.; Hinson, B.T.; DiCarlo, L.J. Carbohydrate-electrolyte replacement during a simulated triathlon in the heat. Med. Sci. Sports Exerc. 1990, 22, 621–628. [Google Scholar] [CrossRef] [PubMed]
  39. Millard-Stafford, M.L.; Sparling, P.B.; Rosskopf, L.B.; DiCarlo, L.J. Carbohydrate-electrolyte replacement improves distance running performance in the heat. Med. Sci. Sports Exerc. 1992, 24, 934–940. [Google Scholar] [CrossRef] [PubMed]
  40. Murray, R.; Seifert, J.G.; Eddy, D.E.; Paul, G.L.; Halaby, G.A. Carbohydrate feeding and exercise: Effect of beverage carbohydrate content. Eur. J. Appl. Physiol. Occup. Physiol. 1989, 59, 152–158. [Google Scholar] [CrossRef]
  41. Tsintzas, O.K.; Williams, C.; Singh, R.; Wilson, W.; Burrin, J. Influence of carbohydrate-electrolyte drinks on marathon running performance. Eur. J. Appl. Physiol. Occup. Physiol. 1995, 70, 154–160. [Google Scholar] [CrossRef]
  42. Williams, C.; Nute, M.G.; Broadbank, L.; Vinall, S. Influence of fluid intake on endurance running performance. A comparison between water, glucose and fructose solutions. Eur. J. Appl. Physiol. Occup. Physiol. 1990, 60, 112–119. [Google Scholar] [CrossRef]
  43. Ali, A.; Williams, C.; Nicholas, C.W.; Foskett, A. The influence of carbohydrate-electrolyte ingestion on soccer skill performance. Med. Sci. Sports Exerc. 2007, 39, 1969–1976. [Google Scholar] [CrossRef]
  44. Davison, G.W.; McClean, C.; Brown, J.; Madigan, S.; Gamble, D.; Trinick, T.; Duly, E. The effects of ingesting a carbohydrate-electrolyte beverage 15 minutes prior to high-intensity exercise performance. Res. Sports Med. 2008, 16, 155–166. [Google Scholar] [CrossRef]
  45. Nicholas, C.W.; Williams, C.; Lakomy, H.K.; Phillips, G.; Nowitz, A. Influence of ingesting a carbohydrate-electrolyte solution on endurance capacity during intermittent, high-intensity shuttle running. J. Sports Sci. 1995, 13, 283–290. [Google Scholar] [CrossRef] [PubMed]
  46. Rollo, I.; Williams, C. Influence of ingesting a carbohydrate-electrolyte solution before and during a 1-hr running performance test. Int. J. Sport Nutr. Exerc. Metab. 2009, 19, 645–658. [Google Scholar] [CrossRef]
  47. Rollo, I.; Williams, C.; Nevill, M. Influence of ingesting versus mouth rinsing a carbohydrate solution during a 1-h run. Med. Sci. Sports Exerc. 2011, 43, 468–475. [Google Scholar] [CrossRef] [PubMed]
  48. Jeukendrup, A. Nutrition for endurance sports: Marathon, triathlon, and road cycling. J. Sports Sci. 2011, 29, S91–S99. [Google Scholar] [CrossRef] [PubMed]
  49. Schytz, C.T.; Ørtenblad, N.; Birkholm, T.A.; Plomgaard, P.; Nybo, L.; Kolnes, K.J.; Andersen, O.E.; Lundby, C.; Nielsen, J.; Gejl, K.D. Lowered muscle glycogen reduces body mass with no effect on short-term exercise performance in men. Scand. J. Med. Sci. Sports 2023, 33, 1054–1071. [Google Scholar] [CrossRef]
  50. Devenney, S.; Mangan, S.; Shortall, M.; Collins, K. Effects of carbohydrate mouth rinse and caffeine on high-intensity interval running in a fed state. Appl. Physiol. Nutr. Metab. 2018, 43, 517–521. [Google Scholar] [CrossRef]
  51. Lee, E.C.; Fragala, M.S.; Kavouras, S.A.; Queen, R.M.; Pryor, J.L.; Casa, D.J. Biomarkers in Sports and Exercise: Tracking Health, Performance, and Recovery in Athletes. J. Strength Cond. Res. 2017, 31, 2920–2937. [Google Scholar] [CrossRef]
  52. Tokmakidis, S.P.; Karamanolis, I.A. Effects of carbohydrate ingestion 15 min before exercise on endurance running capacity. Appl. Physiol. Nutr. Metab. 2008, 33, 441–449. [Google Scholar] [CrossRef]
  53. Muscella, A.; Stefàno, E.; Lunetti, P.; Capobianco, L.; Marsigliante, S. The Regulation of Fat Metabolism During Aerobic Exercise. Biomolecules 2020, 10, 1699. [Google Scholar] [CrossRef] [PubMed]
  54. Philpott, J.D.; Witard, O.C.; Galloway, S.D.R. Applications of omega-3 polyunsaturated fatty acid supplementation for sport performance. Res. Sports Med. 2019, 27, 219–237. [Google Scholar] [CrossRef] [PubMed]
  55. Mohamed, E.T.; Mahmood, F.N.; Merie, G.M.S.; Saadi, A.M. The Medical Importance of Sodium and Potassium. Int. J. Pharma Growth Res. Rev. 2025, 2, 1–10. [Google Scholar] [CrossRef]
  56. Veniamakis, E.; Kaplanis, G.; Voulgaris, P.; Nikolaidis, P.T. Effects of Sodium Intake on Health and Performance in Endurance and Ultra-Endurance Sports. Int. J. Environ. Res. Public Health 2022, 19, 3651. [Google Scholar] [CrossRef]
  57. Shirreffs, S.M.; Sawka, M.N. Fluid and electrolyte needs for training, competition, and recovery. J. Sports Sci. 2011, 29, S39–S46. [Google Scholar] [CrossRef]
  58. Barnes, K.A.; Anderson, M.L.; Stofan, J.R.; Dalrymple, K.J.; Reimel, A.J.; Roberts, T.J.; Randell, R.K.; Ungaro, C.T.; Baker, L.B. Normative data for sweating rate, sweat sodium concentration, and sweat sodium loss in athletes: An update and analysis by sport. J. Sports Sci. 2019, 37, 2356–2366. [Google Scholar] [CrossRef] [PubMed]
  59. Baker, L.B. Sweating Rate and Sweat Sodium Concentration in Athletes: A Review of Methodology and Intra/Interindividual Variability. Sports Med. 2017, 47, 111–128. [Google Scholar] [CrossRef] [PubMed]
  60. Hall, J.E.; Hall, M.E. Guyton and Hall Textbook of Medical Physiology, 14th ed.; Elsevier: Philadelphia, PA, USA, 2020. [Google Scholar]
  61. Ferri Marini, C.; Federici, A.; Skinner, J.S.; Piccoli, G.; Stocchi, V.; Zoffoli, L.; Correale, L.; Dell’aNna, S.; Naldini, C.A.; Vandoni, M.; et al. Effect of steady-state aerobic exercise intensity and duration on the relationship between reserves of heart rate and oxygen uptake. PeerJ 2022, 10, e13190. [Google Scholar] [CrossRef]
  62. García-Pallarés, J.; García-Fernández, M.; Sánchez-Medina, L.; Izquierdo, M. Performance changes in world-class kayakers following two different training periodization models. Eur. J. Appl. Physiol. 2010, 110, 99–107. [Google Scholar] [CrossRef]
  63. Rothschild, J.A.; Kilding, A.E.; Stewart, T.; Plews, D.J. Factors Influencing Substrate Oxidation During Submaximal Cycling: A Modelling Analysis. Sports Med. 2022, 52, 2775–2795. [Google Scholar] [CrossRef] [PubMed]
  64. Ferri Marini, C.; Micheli, L.; Grossi, T.; Federici, A.; Piccoli, G.; Zoffoli, L.; Correale, L.; Dell’aNna, S.; Naldini, C.A.; Lucertini, F.; et al. Are incremental exercise relationships between rating of perceived exertion and oxygen uptake or heart rate reserve valid during steady-state exercises? PeerJ 2024, 12, e17158. [Google Scholar] [CrossRef] [PubMed]
  65. Cesanelli, L.; Ylaitė, B.; Messina, G.; Zangla, D.; Cataldi, S.; Palma, A.; Iovane, A. The Impact of Fluid Loss and Carbohydrate Consumption during Exercise, on Young Cyclists’ Fatigue Perception in Relation to Training Load Level. Int. J. Environ. Res. Public Health 2021, 18, 3282. [Google Scholar] [CrossRef]
Figure 1. Flow diagram of the study selection process.
Applsci 16 02967 g001
Figure 2. Effects of CHO-E on sports performance. Forest plot illustrating the overall effect of CHO-E supplementation SMD in sports performance (time to exhaustion; time to complete; distance covered; precision variables; cycling power). Squares represent the SMD for each trial. Green dots represent the pooled SMD across trials. SMD, standardised mean difference. a = beverage A; b = beverage B; c = beverage C; fruct = fructose; gluc = glucose [9,17,18,24,25,26,27,28,30,31,32,33,34,35,36,37,38,39,40,41,42,43,46,47].
Applsci 16 02967 g002
Figure 3. Effects of CHO-E on metabolic biomarkers. Forest plot illustrating the overall effect of CHO-E supplementation SMD in metabolic biomarkers (glucose; insulin; free fatty acids; glycerol). Squares represent the SMD for each trial. Green dots represent the pooled SMD across trials. SMD, standardised mean difference. a = beverage A; b = beverage B; d1 = day 1; d2 = day 2; d3 = day 3; d4 = day 4; fruct = fructose; gluc = glucose [9,17,18,25,26,27,28,30,31,32,33,34,35,37,38,39,41,42,43,44,45,46].
Applsci 16 02967 g003
Figure 4. Effects of CHO-E on blood mineral concentrations. Forest plot illustrating the overall effect of CHO-E supplementation SMD in blood mineral concentrations (sodium; potassium; chlorine). Squares represent the SMD for each trial. Green dots represent the pooled SMD across trials. SMD, standardised mean difference. a = beverage A; b = beverage B; d1 = day 1; d2 = day 2; d3 = day 3; d4 = day 4 [26,30,31,32,33,37,39,44,45].
Applsci 16 02967 g004
Figure 5. Effects of CHO-E on other performance descriptors. Forest plot illustrating the overall effect of CHO-E supplementation SMD on other performance descriptors (VO2max; RER; heart rate; RPE). Squares represent the SMD for each trial. Green dots represent the pooled SMD across trials. SMD, standardised mean difference. a = beverage A; b = beverage B; c = beverage C; fruct = fructose; gluc = glucose [17,18,24,25,26,27,28,30,31,33,34,35,36,37,38,39,40,41,42,43,44,45,46,47].
Applsci 16 02967 g005
Table 1. Main characteristics of the selected studies for the systematic review (n = 26).
AuthorsObjectivesSample Size (n)SportAge (Years)Supplementation DrinksSupplementation StrategyProtocol
Ali et al. [43]To investigate whether ingestion of a carbohydrate–electrolyte solution before and during prolonged intermittent high-intensity shuttle running would have any beneficial effects on skill performance by soccer players with reduced carbohydrate stores.16 menSoccer21.3 ± 3.0
-
CHO-E group: sports drink 6.4% of CHO (21.7 mmol/L Na).
-
Placebo group: sweetened drink without CHO.
Both groups:
-
Before test, 5 mL/kg BM.
-
During test, 2 ml/kg BM each 15 min (during rest between reps).
2 periods of tests (2 days per period):
-
Day 1: LSPT and LSST at rest; cycling 30 min at 70% VO2max, followed by three 50” sprints at double the resistive load (with 2 min of rest between each bout), and then another 45 min of cycling at 70% VO2max.
-
Day 2: LSPT and LSST at rest; 6 blocks of high intensity shuttle running; LSST after exercise.
Bilzon et al. [24]To assess whether ingesting a carbohydrate–electrolyte solution during recovery from exercise in the heat influences endurance capacity 4 h later.13 menRunning32.3 ± 5.05
-
CHO-E group: sports drink 6.4% of CHO-E (24 mmol/L NA, 2.6 mmol/L K, 1 mmol/L Cl).
-
Placebo group: sweetened drink without CHO.
Both groups:
-
During test: 2 mL/kg body mass every 15 min (administered during rest intervals between exercise repetitions).
-
After test: ~25 mL/kg body mass during 4 h recovery period.
2 running tests at 60% VO2max of 60 min or until exhaustion, separated by 4 h of recovery.
Burnstein et al. [32]To assess the influence of glucose polymer electrolyte beverages on fluid balance and glycaemic state during long duration physical effort: a 4-day 134 km desert march.48 menMarch19.2 ± 0.1
-
CHO-E group: sports polymer–electrolyte drink 7.2% CHO-E (9.2 mmol/L NA, 5.5 mmol/L K, 2.1 mmol/L Ca, and 2.1 mmol/L Mg: 9.6 mmol/L Cl).
-
Placebo group: water.
Both groups: 900 mL/h of drink during exercise4 days (29, 39, 36 and 30 km) of intermittent marching (50 min exercise–10 min rest) at 5–6 km/h carrying a 10–12 kg back pack.
Chryssanthopoulos et al. [33]To examine whether, after an overnight fast, the ingestion of a carbohydrate–electrolyte solution during running would be as effective as ingestion of a carbohydrate meal 4 hr before running.10 menRunning28.7 ± 2.6
-
CHO-E group: sports drink 6.9% of CHO-E (24 mmol/L NA, 2.5 mmol/L K, 1.2 mmol/L Ca, and 0.8 mmol/L Mg).
-
Placebo group: water.
-
4 h before exercise—10 mL/kg of BW of liquid with 2 g/kg of BW for CHO-E, or without CHO for Placebo.
-
Immediately prior to the start of exercise, 8 mL/kg of BW.
-
During exercise, 2 mL/kg of BW each 5 km.
2 days of 30 km running: first 5 km at 70% VO2max and the rest as fast as they could.
Davis et al. [25]To determine the effects of ingesting carbohydrate drinks, with and without Cr, on fatigue during intermittent high-intensity shuttle running.8 menRunning27.1 ± 6.7
-
CHO-E group: sports drink 6% of CHO-E (20 mm/L NA and 3 mm/L K).
-
Placebo group: water.
Both groups:
-
10 min before exercise, 5 mL/kg of BW of liquid.
-
Between exercise bouts, 2 mL/kg of BW.
5 blocks of high-intensity shuttle running
Davison et al. [44]To examine the effect of ingesting a commercially available carbohydrate–electrolyte solution on strenuous exercise performance.10 menRunning20 ± 2
-
CHO-E group: sports drink 6% of CHO-E (4.35 mmol/L NA).
-
Placebo group: sweetened drink without CHO.
Both groups:
-
8 mL/kg of BW 15 min prior to exercise.
Intermittent shuttle running for 1 h (4 × 15 min blocks)
-
Each block: walking, jogging, sprinting, fast running
-
Followed by an incremental shuttle run to exhaustion
Desbrow et al. [34]To examine if a commercial sports drink consumed throughout a cycling time trial of approximately 60 min improves performance.9 menCycling30.0 ± 7.3
-
CHO-E group: sports drink 6% of CHO-E (4.35 mmol/L NA).
-
Placebo group: sweetened drink without CHO.
Both groups:
-
8 mL/kg of BW 15 min prior to exercise.
1 h cycling time trial
Fallowfield et al. [26]To examine the influence of ingesting a carbohydrate–electrolyte solution following prolonged running on exercise capacity 4 hr later.16 (12 men; 4 women)RunningCHO-E = 26.1 ± 3.7
Placebo = 27.9 ± 5.4
-
CHO-E group: sports drink 6.9% of CHO-E (22.6 mmol/L NA, 0.36 mmol/L K, 0.15 mmol/L Ca, and 0.04 mmol/L Mg).
-
Placebo group: sweetened drink without CHO.
Both groups:
-
1.0 g CHO/kg or placebo BW immediately after a 90 min run (R1)
-
Same dose again 2 h later
Two treadmill runs (T1 and T2) separated by 4 h recovery (REC)
-
T1: 90 min at 70% VO2max
-
T2: run to exhaustion at same speed
Foskett et al. [27]To investigate the effects of ingesting a carbohydrate–electrolyte solution on performance and muscle glycogen use during prolonged intermittent high-intensity running to fatigue in carbohydrate-loaded men.6 menRunning22.7 ± 3.4
-
CHO-E group: sports drink 6.4% of CHO-E (21.93 mmol/L NA, 0.26 mmol/L K).
-
Placebo group: sweetened drink without CHO (0.87 mmol/L NA, 0.28 mmol/L K).
Both groups:
-
8 mL/kg body mass immediately before exercise
-
3 mL/kg every 15 min during exercise
2-day CHO-loading diet before trials
Loughborough Intermittent Shuttle Test
-
90 min of LIST (6 blocks of 15 min) + run to fatigue
Gui et al. [35]To compare the effects of a carbohydrate–electrolyte–protein solution, a carbohydrate–electrolyte solution, and a noncaloric sweetened placebo on 21 km running performance and cognitive function.11 womenRunning32.4 ±g 6.7
-
CHO-E group: sports drink 6.0% of CHO-E (13.05 mmol/L NA, 1.79 mmol/L K, 0.02 mmol/L Ca, and 0.05 mmol/L Mg).
-
Placebo group: sweetened drink without CHO (13.05 mmol/L NA, 1.79 mmol/L K, 0.02 mmol/L Ca, and 0.05 mmol/L Mg).
Both groups:
-
150 mL of assigned drink every 2.5 km
21 km treadmill time trial (self-paced after 5 km at 70% VO2max)
Jeukendrup et al. [36]To investigate the effect of carbohydrate–electrolyte feeding on time trial cycling performance (comparable to a 40 km time trial) under strictly standardised conditions, without additional measurements.19 (17 men; 2 women)CyclingMen = 23 ± 4.1
Women = 21 ± 2.8
-
CHO-E group: sports drink 7.6% of CHO-E (20.4 mmol/L NA, 0.31 mmol/L K, 0.10 mmol/L Ca, and 1.01 mmol/L Cl).
-
Placebo group: sweetened drink with 0.5% CHO.
Both groups:
-
8 mL/kg body mass during 5 min warm-up
-
2 mL/kg at 25%, 50%, and 75% of total work completed
1 h cycling time trial
McIntosh et al. [37]To explore the effects of a sugar-free, electrolyte MIDS beverage on 5-kilometre time trial performance, hydration markers, blood electrolytes and metabolites, fuel oxidation, and perceptions of mood compared to a standard commercially available carbohydrate sports beverage and distilled water as a positive control.20 (10 men; 10 women)Running28 ± 4
-
CHO-E group: sports drink 6% of CHO-E (8.70 mmol/L NA and 2.67 mmol/L K).
-
Placebo group: distilled water.
-
MIDS beverage: sports drink without CHO (19.57 mmol/L Na, 16.09 mmol/L K, 2.53 mmol/L Ca, 2.06 mmol/L Mg, 1.27 mmol/L Po).
Both groups: 473 mL of drink followed by 45 min rest before exercise.5-kilometre treadmill time trial
Millard-Stafford et al. [38]To determine the effects of a carbohydrate–electrolyte beverage during a United States Triathlon Series distance triathlon in a warm environment.8 menRunning29.6 ± 3.7
-
CHO-E group: sports drink of 7% of CHO (9.7 mmol/L Na, 5.0 mmol/L K and 9.7 mmol/L Cl).
-
Placebo group: sweetened drink without CHO-E.
Both groups: 2 mL/kg body weight (130–174 mL) of the assigned beverage:
-
After the swim
-
Every 8 km during cycling
-
Every 3.2 km during running
Simulated Olympic triathlon: 1.5 km swim, 40 km bike and 10 km run.
Millard-Stafford et al. [39]To evaluate the effect of 7% carbohydrate–electrolyte drink on physiological responses, hydration status and exercise performance in male distance runners during a simulated 40 k road race under warm, humid conditions.10 menRunning32.1 ± 6
-
CHO-E group: sports drink of 7% of CHO (9.7 mmol/L Na, 5.0 mmol/L K and 9.7 mmol/L Cl).
-
Placebo group: sweetened drink without CHO-E.
Both groups:
-
400 mL of assigned drink 30 min before the test
-
250 mL of assigned drink every 5 km of running
40 km outdoor run:
-
First 35 km at self-selected training pace
-
Final 5 km at race effort
Morris et al. [28]To examine the influence of ingesting a 6.5% carbohydrate–electrolyte solution, flavoured water or a taste placebo on exercise capacity and the physiological and metabolic responses during a modified version of the Loughborough Intermittent Shuttle Test in a hot environment.9 menRunning23.3 ± 1.4
-
CHO-E group: sports drink 6.5% of CHO-E (21 mmol/L Na, 0.56 mmol/L K).
-
Placebo group: sweetened drink without CHO (2 mmol/L Na).
-
Flavoured water group (6 mmol/L Na, 0.08 mmol/L K).
Both groups:
-
6.5 mL/kg body mass consumed as a bolus before exercise
-
4.5 mL/kg consumed during each 15 min exercise set and 4 min rest period (approx. every 19 min)
Modified Loughborough Intermittent Shuttle Test (LIST) in a hot environment:
-
Part A: Five 15 min sets of intermittent shuttle running (walk, jog, cruise, and sprint)
-
Part B: 60 s run/60 s rest until exhaustion
Murray et al. [40]To determine the effect of ingesting fluids of varying carbohydrate content upon sensory response, physiological function, and exercise performance during 1.25 h of intermittent cycling in a warm environment.12 menCycling30.7 ± 4.9
-
CHO-E 6%: sports drink 6% of CHO-E (20 mmol/L Na, 3.2 mmol/L K).
-
CHO-E·8%: sports drink 8% of CHO-E (20 mmol/L Na, 3.2 mmol/L K).
-
CHO-E 10%: sports drink 10% of CHO-E (20 mmol/L Na, 3.2 mmol/L K).
-
Placebo group: sweetened drink without CHO-E.
All groups: 2.5 mL/kg of body weight during the 5 min rest periods between exercise bouts.Intermittent cycling in a warm environment:
-
Three 20 min bouts at 65% VO2max, each followed by 5 min rest
-
Final task: 1200 pedal revolutions as fast as possible
Nicholas et al. [45]To examine the influence of ingesting a commonly available sports drink (6.9% CHO–electrolyte solution) on sprint performance and running capacity during a prolonged intermittent, high-intensity shuttle running test.9 menRunning24.8 ± 0.6
-
CHO-E group: sports drink 6.9% of CHO-E (21 mmol/L Na, 0.56 mmol/L K).
-
Placebo group: sweetened drink without CHO-E.
-
Flavoured water group (6 mmol/L Na, 0.08 mmol/L K).
Both groups:
-
5 mL/kg body weight immediately before exercise
-
2 mL/kg body weight every 15 min during exercise
Prolonged Intermittent High-Intensity Shuttle Running Test (PIHSRT)
-
Part A: 75 min of intermittent running (sprint, jog at 55% VO2max, and cruise at 95% VO2max)
-
Part B: Alternating 20 m runs at 55% and 95% VO2max until exhaustion
Rodriguez-Giustiniani et al. [9]To provide further practical insight into the influence of ingesting a 12% carbohydrate–electrolyte beverage on soccer skill performance and high-intensity running capacity in professional youth academy soccer players.18 menSoccer18 ± 2
-
CHO-E group: sports drink 12% of CHO-E (17 mmol/L Na).
-
Placebo group: sweetened drink without CHO (17 mmol/L Na).
Both groups:
-
250 mL ingested 15 min before the first half
-
250 mL ingested at half-time (15 min before second half)
-
Total: 500 mL providing 60 g CHO (CHO-E group)
Soccer match simulation (90 min)
Rollo and Williams [18]To examine the effect of ingesting a carbohydrate–electrolyte solution on the 1 h running performance of club athletes who consumed a high-carbohydrate breakfast 3 h before exercise.10 menRunning34 ± 9
-
CHO-E group: sports drink 6.5% of CHO-E (21 mmol/L Na, 0.56 mmol/L K).
-
Placebo group: sweetened drink without CHO (21 mmol/L Na, 0.56 mmol/L K).
Both groups:
-
8 mL/kg of BW 15 min prior to exercise
-
2 mL/kg of BW 15 min during exercise
1 h self-paced treadmill run
Rollo and Williams [46]To investigate the influence of ingesting a 6.4% CHO-E solution on the total distance completed during a 1 hr running performance test.8 menRunning31 ± 8
-
CHO-E group: sports drink 6.5% of CHO-E (21 mmol/L Na, 0.56 mmol/L K).
-
Placebo group: sweetened drink without CHO (21 mmol/L Na, 0.56 mmol/L K).
Both groups:
-
8 mL/kg of BW 30 min prior to exercise
-
2 mL/kg of BW 15 min during exercise
1 h self-paced treadmill run
Rollo et al. [17]To investigate the influence of mouth rinsing a 6.4% CHO–E solution on self-selected running speed and distance covered in 1 h.10 menRunning25 ± 4
-
CHO-E group: sports drink 6.5% of CHO-E (21 mmol/L Na, 0.56 mmol/L K).
-
Placebo group: sweetened drink without CHO (21 mmol/L Na, 0.56 mmol/L K).
-
Mouth rinsed immediately before, and at 15, 30 and 45 min during the 1 h run test.
1 h self-paced treadmill run
Rollo et al. [47]To assess the relative effect of mouth rinsing and ingesting a carbohydrate–electrolyte solution on 1 h running performance.10 menRunning26 ± 6
-
CHO-E group: sports drink 6.5% of CHO-E (21 mmol/L Na, 0.56 mmol/L K).
-
Placebo group: sweetened drink without CHO (21 mmol/L Na, 0.56 mmol/L K).
Both groups:
-
8 mL/kg of BW 30 min prior to exercise
-
25 mL immediately before exercise
-
2 mL/kg of BW 15 min during exercise
1 h self-paced treadmill run
Tsintzas et al. [41]To examine the effects on performance of drinking two CHO-electrolyte solutions and water during three treadmill marathons.7 menRunning44 ± 13.2
-
CHO-E group: sports drink 5.5% of CHO-E (26.5 mmol/L Na, 2.56 mmol/L K).
-
CHO-E group: sports drink 6.9% of CHO-E (23.9 mmol/L Na, 5.12 mmol/L K).
-
Placebo group: sweetened drink without CHO (21 mmol/L Na, 0.56 mmol/L K).
All groups:
-
3 mL/kg BW immediately before the run
-
2 mL/kg every 5 km
42.2 km treadmill marathon (self-paced after 5 km at 70% VO2max)
Welsh et al. [29]To investigate the effects of CHO ingestion on physical and mental function during IHI shuttle running that most closely simulated a game.10 (5 men; 5 women)RunningMen = 24.6 ± 4.1
Women = 24.0 ± 4.0
-
CHO-E group:
Sports drink 6% of CHO-E (20 mmol/L Na, 3.2 mmol/L K) before exercise and during quarters.
Sports drink 6% of CHO-E (20 mmol/L Na, 3.2 mmol/L K) at halftime.
-
Placebo group: sweetened drink without CHO-E.
Both groups:
-
5 mL/kg of 6% CHO solution/placebo before warm-up
-
3 mL/kg of 6% CHO solution/placebo after QTR-1, HALF, QTR-3, and QTR-4
-
5 mL/kg of 18% CHO solution/placebo at halftime
Simulated intermittent high-intensity team sport protocol:
-
Four 15 min quarters of shuttle running, jumping, sprinting, and jogging
-
20 min halftime break
-
Followed by a shuttle run to fatigue
Williams et al. [42]To determine whether or not there are any positive benefits from drinking carbohydrate–electrolyte solutions, rather than water, on running performance during 30 km treadmill time trials12 menRunning30.8 ± 10.8
-
CHO-E glucose group: sports drink 5% of CHO-E (20 mmol/L Na).
-
CHO-E Fructose Group: sports drink 5% of CHO-E (20 mmol/L Na).
-
Placebo group: sweetened drink without CHO-E.
All groups:
-
250 mL of assigned drink before warm-up
-
150 mL every 5 km
-
30 km treadmill time trial (first 5 km at 70% VO2max, then self-paced)
Wong and Williams [30]To examine the influence of ingesting large and small amounts of CHO, during a 4 h recovery from prolonged running, on subsequent endurance running capacity when the subjects were fully rehydrated.9 menRunning34.3 ± 7.2
-
CHO-E group: sports drink of 6.5% of CHO (24 mmol/L Na, 2.6 mmol/L K and 1.2 mmol/L Ca).
-
Placebo group: sweetened drink without CHO-E.
All groups:
-
50 g CHO from 770 mL of 6.5% CHO-E solution ingested 30 min after first run
-
CHO-E group: same CHO-E solution every 30 min for 3 h
-
Placebo group: ingested placebo solution in same volumes
Two treadmill runs (T1 and T2) separated by 4 h recovery (REC)
-
T1: 90 min at 70% VO2max
-
T2: run to exhaustion at same speed
Wong et al. [31]To examine the effects of rehydration per se and rehydration plus CHO ingestion during 4 h of recovery on subsequent endurance running capacity.9 menRunning26.4 ± 5.1
-
CHO-E group: sports drink of 6.5% of CHO (24 mmol/L Na, 2.6 mmol/L K and 1.2 mmol/L Ca).
-
Placebo group: sweetened drink without CHO-E.
All groups:
725 mL of fluid 30 min after first run (T1)
-
CHO-E group: 50 g CHO
Remaining volume (to reach 200% of body mass lost) ingested in 5 equal doses every 30 min over 3 h
Two treadmill runs (T1 and T2) separated by 4 h recovery (REC)
-
T1: 90 min at 70% VO2max
-
T2: run to exhaustion at same speed
Men (M); Women (W); Body Mass (BM); Body Weight (BW); Loughborough Soccer Passing Test (LSPT); Loughborough Soccer Shooting Test (LSST); Multi-Ingredient Dietary Supplements (MIDS), g.
Table 2. Analysis of the methodological quality of the selected studies using PEDro (n = 26).
Study1234567891011ScoreEvaluation
Ali et al. [43]010111111119High
Bilzon et al. [24]0111111111110High
Burnstein et al. [32]111110011118Moderate
Chryssanthopoulos et al. [33]1111111111110High
Davis et al. [25]0111111111110High
Davison et al. [44]1111111111110High
Desbrow et al. [34]111111110119High
Fallowfield et al. [26]110100011116Poor
Foskett et al. [27]110111111119High
Gui et al. [35]1111111111110High
Jeukendrup et al. [36]110110011117Moderate
McIntosh et al. [37]111100011117Moderate
Millard-Stafford et al. [38]110111111119High
Millard-Stafford et al. [39]110111111119High
Morris et al. [28]110110011117Moderate
Murray et al. [40]110111111119High
Nicholas et al. [45]110111111119High
Rodriguez-Giustiniani et al. [9]110111111119High
Rollo and Williams. [18]110111111119High
Rollo and Williams. [46]110111111119High
Rollo et al. [17]110111111119High
Rollo et al. [47]110111111119High
Tsintzas et al. [41]110110011117Moderate
Welsh et al. [29]110111111119High
Williams et al. [42]110110011117Moderate
Wong and Williams. [30]110111111119High
Wong et al. [31]110111111119High
Table 3. GRADE assessment.
Number of StudiesRisk of BiasInconsistencyIndirectness of EvidenceImprecisionPublication
Bias
Quality of EvidenceSMD [95% CI]
Effects of CHO-E on Sports Performance
Overall effect (n = 35)NoNot applicableNoNoNoHigh0.16 [−0.01, 0.33]
Time to exhaustion (n = 9)NoNot applicableNoSeriousNoModerate0.60 [0.17, 1.02]
Time to complete
(n = 17)
NoNot applicableNoSeriousNoModerate−0.07 [−0.28, 0.13]
Distance covered (n = 5)NoNot applicableNoSeriousNoModerate0.26 [−0.11, 0.63]
Precision variables
(n = 4)
NoSerious
(I2 = 72%)
NoSeriousNoModerate0.39 [−0.27, 1.05]
Cycling power (n = 2)NoNot applicableNoSeriousNoLow0.10 [−0.01, 0.33]
Effects of CHO-E on Metabolic Biomarkers
Overall effect
(n = 35)
NoVery Serious (I2 = 83%)NoNoNoLow0.09 [−0.20, 0.38]
Glucose
(n = 34)
NoVery serious (I2 = 83%)NoNoNoLow0.82 [0.45, 1.19]
Insulin
(n = 12)
NoSerious (I2 = 58%)NoNoNoModerate0.58 [0.12, 1.05]
Free Fatty Acids
(n = 15)
NoSerious (I2 = 63%)NoNoNoModerate−1.11 [−1.57, −0.65]
Glycerol
(n = 10)
NoSerious
(I2 = 73%)
NoNoNoModerate−1.35 [−2.04, −0.66]
Effects of CHO-E on Blood Mineral Concentrations
Overall effect (n = 25)NoNot applicableNoNoNoHigh0.19 [0.09, 0.30]
Sodium (n = 25)NoNot applicableNoNoNoHigh0.22 [0.07, 0.36]
Potassium (n = 21)NoNot applicableNoNoNoHigh0.14 [−0.04, 0.31]
Chlorine (n = 6)NoNot applicableNoNoNoHigh0.34 [−0.06, 0.74]
Effects of CHO-E on Other Performance Descriptors
Overall effect (n = 25)NoNot applicableNoNoNoHigh0.20 [0.09, 0.31]
VO2maxNoNot applicableNoNoNoHigh0.16 [−0.08, 0.39]
RERNoNot applicableNoNoNoHigh0.47 [0.26, 0.68]
Heart RateNoNot applicableNoNoNoHigh0.17 [0.00, 0.35]
RPENoNot applicableNoNoNoHigh−0.07 [−0.31, 0.16]
No risk of bias was found in any study. I2 > 40%: serious. I2 > 80%: very serious. No indirectness of evidence was found in any study. N < 300: serious. N < 300 and estimated effect little or absent: very serious.
Disclaimer/Publisher’s Note: The statements, opinions and data contained in all publications are solely those of the individual author(s) and contributor(s) and not of MDPI and/or the editor(s). MDPI and/or the editor(s) disclaim responsibility for any injury to people or property resulting from any ideas, methods, instructions or products referred to in the content.