1. Introduction
With the continued advancement of dual-carbon targets, photovoltaic power generation has emerged as a crucial component of clean energy systems, gradually expanding from centralized power stations to distributed scenarios such as agricultural and pastoral regions. However, PV systems deployed during earlier development stages in such environments are now approaching the end-of-life phase, forming a large-scale stream of recyclable resources [
1,
2]. According to projections released by the International Renewable Energy Agency (IRENA), the global mass of discarded PV modules is expected to reach approximately 1.7–8.0 million tons by 2030 [
3], which urgently calls for efficient dismantling and recycling technologies to mitigate environmental pollution and resource waste. PV modules deployed in open-air environments, such as grasslands and deserts, tend to accumulate dust, rain stains, and biological attachments, in contrast to modules in urban settings. These factors severely degrade surface visual features and pose significant challenges to automated dismantling and recycling production lines for end-of-life PV modules.
In recent years, deep learning-based object detection methods have been widely adopted in industrial vision tasks, encompassing two-stage detectors such as the Faster Region-based Convolutional Neural Network (Faster R-CNN) and one-stage detectors such as You Only Look Once (YOLO) and the Single Shot MultiBox Detector (SSD). The YOLO family is favored for real-time applications due to its speed–accuracy trade-off, with many scenario-oriented improvements reported [
4,
5,
6,
7,
8,
9,
10,
11,
12,
13,
14,
15,
16]. Recent studies have explored alternative optimization and feature aggregation strategies. Fractional-order optimizers have been shown to improve convergence and training stability in tasks such as LSTM-based financial time-series forecasting [
17], while fuzzy probabilistic convolution clustering (FP-Conv-CM) provides an effective approach for feature aggregation and structure-preserving representation [
18]. These approaches provide theoretical insights, yet they are not directly tailored for dust-occluded end-of-life PV module inspection, which demands robustness to visual degradation, accurate geometric measurement, and compatibility with edge deployment. In the PV domain, the existing studies primarily focus on defect detection and dust recognition during the production or operation stages [
19,
20,
21,
22]. For instance, Zhou et al. [
22] developed RD-YOLO for PV module surface defect detection by integrating multi-scale channel attention and recursive depthwise separable convolution. However, most existing approaches rely on relatively high-quality images or visually salient targets and fail to adequately address the compounded challenges inherent in end-of-life PV modules, including the severe feature degradation caused by dust and stain occlusion, pronounced inter-class confusion, and the demand for high-precision geometric information extraction. Similar domain shift issues have been reported in transformer-based exterior cladding detection from street-view images [
23].
Moreover, the targeted mitigation of severe feature confusion induced by dust, particularly among visually similar components such as junction boxes and backsheet labels, has remained insufficient. Several prior works address object recognition and geometric measurement as separate stages, thereby limiting end-to-end alignment with dismantling workflows [
24,
25,
26]. In addition, the impact of complex illumination conditions, such as strong shadows and interference or diffraction stripes, on measurement accuracy is often underestimated in existing studies. While high detection accuracy is frequently emphasized, feasibility on industrial edge devices is commonly overlooked, making it difficult to achieve an effective balance among lightweight deployment, inference speed, and measurement precision. Under small-sample conditions, models are also prone to overfitting, necessitating coordinated strategies across transfer learning and deployment pipelines to enhance overall engineering robustness.
To improve robustness under degraded visual features, existing studies have explored attention mechanisms and multi-scale fusion designs [
27,
28,
29,
30], feature recalibration [
31], and image enhancement techniques [
32,
33]. Self-attention-enhanced detection designs have also been introduced to strengthen feature extraction under challenging conditions [
28,
29]. Yan et al. [
32] proposed a frequency-domain enhancement method to improve aerial small-object detection performance. Liu et al. [
33] combined discrete wavelet transform (DWT) with transformer architectures to enhance frequency-domain feature representation for small targets. For geometric measurement, several studies have attempted to infer three-dimensional physical parameters from two-dimensional images. Zhang et al. [
25] measured mushroom fruiting-body parameters based on an improved YOLOv8-Seg model, while Li et al. [
26] combined YOLO with point-cloud processing for citrus pose estimation. These works provide valuable insights into industrial detection and measurement tasks. Regarding lightweight deployment, commonly adopted strategies include lightweight network redesign for edge inference and postprocessing compression such as hashing-based compact indexing [
7,
31,
34]. As a postprocessing compression approach, CMFH enables efficient model compression without altering the network architecture, but its application has so far been largely confined to image retrieval tasks [
34].
In summary, two major bottlenecks persist in small-target detection under complex backgrounds: (1) subtle textures and low-contrast features are easily overwhelmed by background noise and illumination variations; (2) under feature pyramid fusion and edge deployment constraints, it remains challenging to simultaneously satisfy the requirements of accuracy, inference speed, and model compactness.
The main contributions and highlights of this work are summarized as follows: (1) Problem-oriented integrated framework: We present an end-to-end “detection–localization–measurement” pipeline tailored for dust-occluded end-of-life PV modules, so that the visual outputs can be directly consumed by dismantling equipment for process control. (2) Frequency–attention synergy for inter-class confusion: We design a cooperative DWT–FFT enhancement with CLAHE and embed Coordinate Attention not only in the backbone (C3CA) but also along the neck fusion pathways, specifically targeting the severe visual similarity between junction boxes and backsheet labels under surface degradation. (3) Metrology-grade geometric perception: We propose a shadow width-to-gap height inversion model and combine robust boundary fitting with subpixel localization and dual-path frequency-domain stripe suppression to obtain stable millimeter-level measurements under complex illumination. (4) Edge-ready deployment and rechecking: We jointly consider efficiency and practicality by introducing GSConv lightweighting, INT8 quantization-aware training, and CMFH-based compact rechecking, enabling a deployable solution on resource-constrained industrial devices.
Paper organization: The remainder of this paper is organized as follows.
Section 2 describes the dataset construction, the proposed frequency-domain enhancement, the improved YOLOv8 detector, and the geometric metrology module, along with edge-deployment optimization.
Section 3 presents the experimental settings and evaluation metrics.
Section 4 reports the comparative results and ablation studies, including robustness and deployment evaluations. Finally,
Section 5 discusses practical implications and limitations, and
Section 6 concludes the paper and outlines future work.
2. Materials and Methods
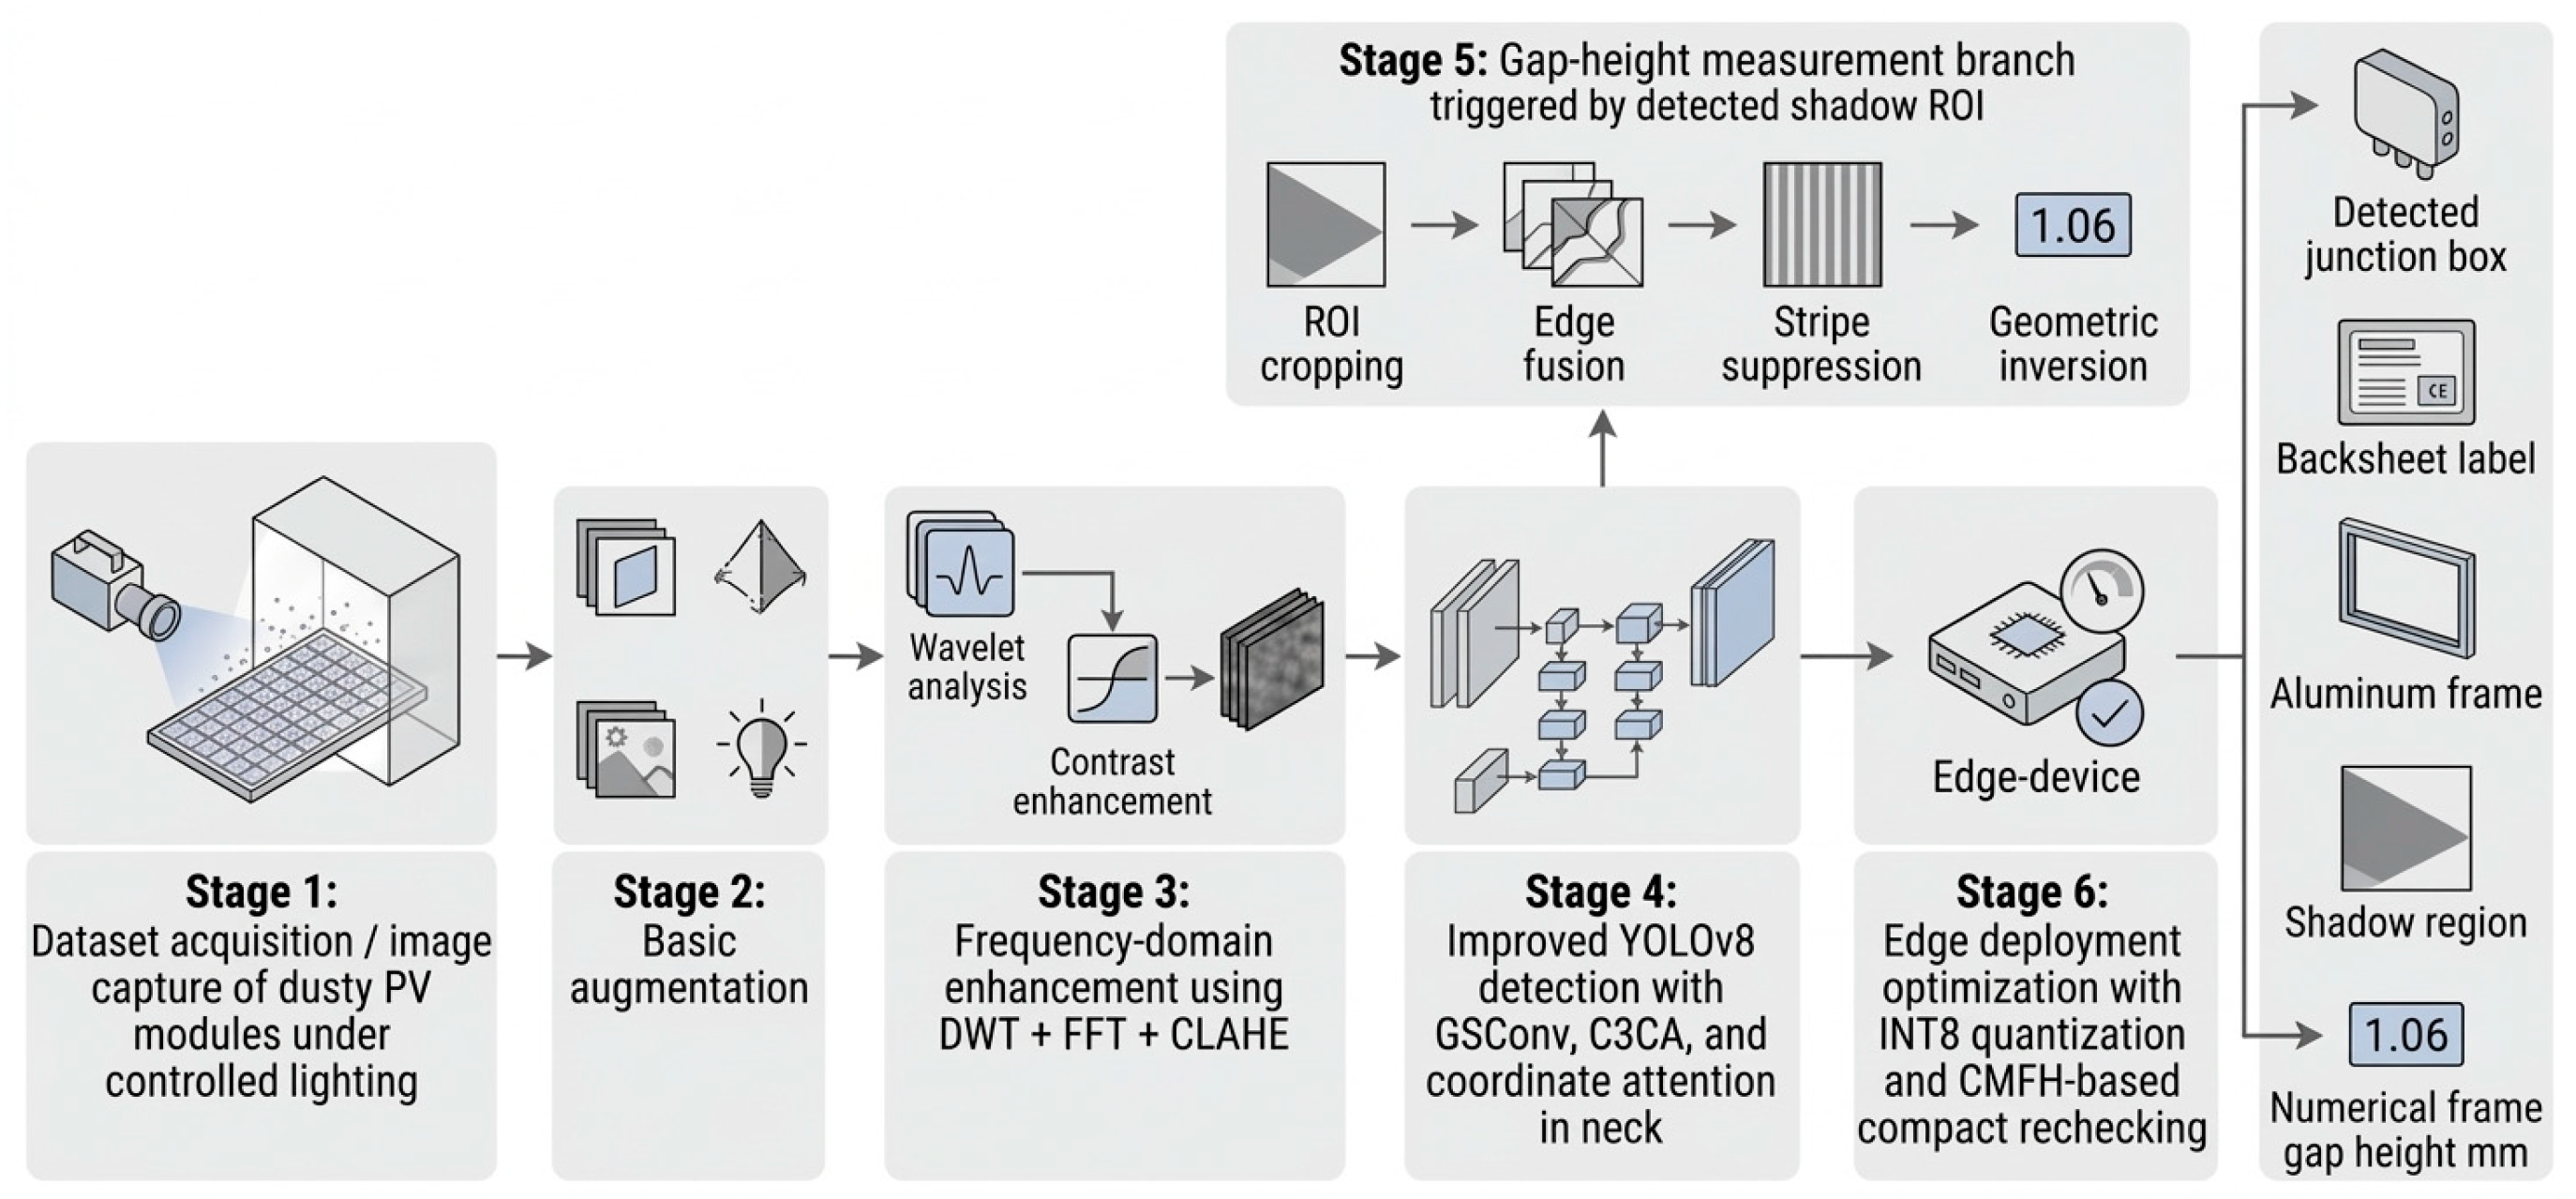
This study proposes an end-to-end framework for multi-feature detection and dimensional measurement of end-of-life photovoltaic (PV) modules under dusty conditions. The input of the framework is a visible-light image of an end-of-life PV module collected under controlled or natural illumination. The framework produces two categories of outputs. First, the improved YOLOv8 detector identifies the key module components and visual regions, including the junction box, backsheet label, aluminum frame, and shadow region. Second, based on the detected shadow ROI within the aluminum frame groove, the geometric module estimates the frame gap height in millimeters. The framework integrates image preprocessing, an improved YOLOv8-based detector, a shadow-guided geometric metrology module, and lightweight deployment optimization. Finally, quantization-aware training and CMFH-based compact indexing are applied to support resource-efficient edge deployment and engineering rechecking. The overall workflow of the proposed framework is illustrated in
Figure 1.
2.1. Image Acquisition and Dataset Construction
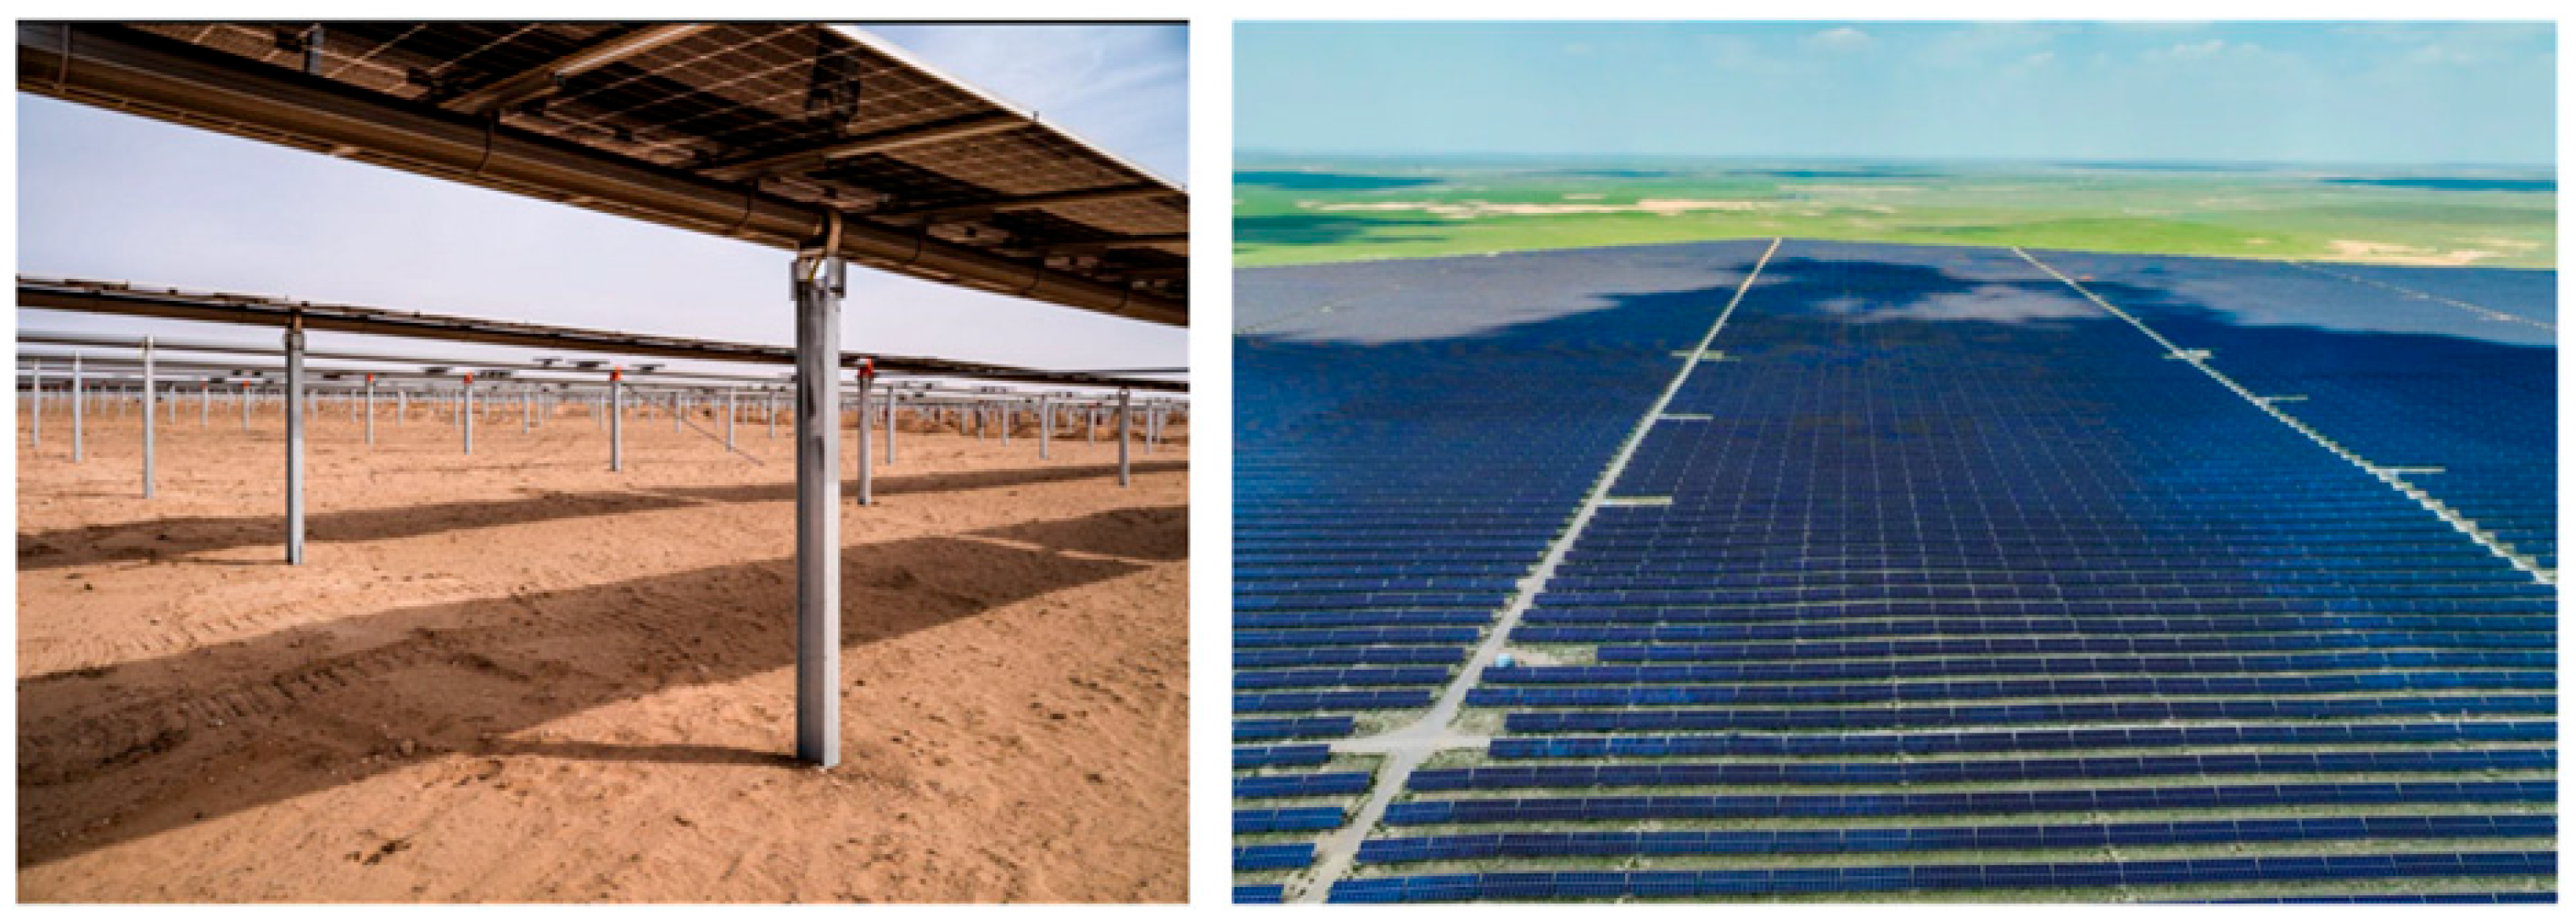
The end-of-life PV modules used in this study were collected from a power station located in Ordos City, Inner Mongolia, China, as shown in
Figure 2. This region is characterized by a typical inland arid grassland climate, with strong annual winds and frequent dust events. As a result of long-term outdoor exposure, the surfaces of the collected modules commonly exhibit dust deposition, material aging, and localized physical damage. These characteristics accurately reflect realistic feature degradation in end-of-life PV modules and provide representative value for engineering applications.
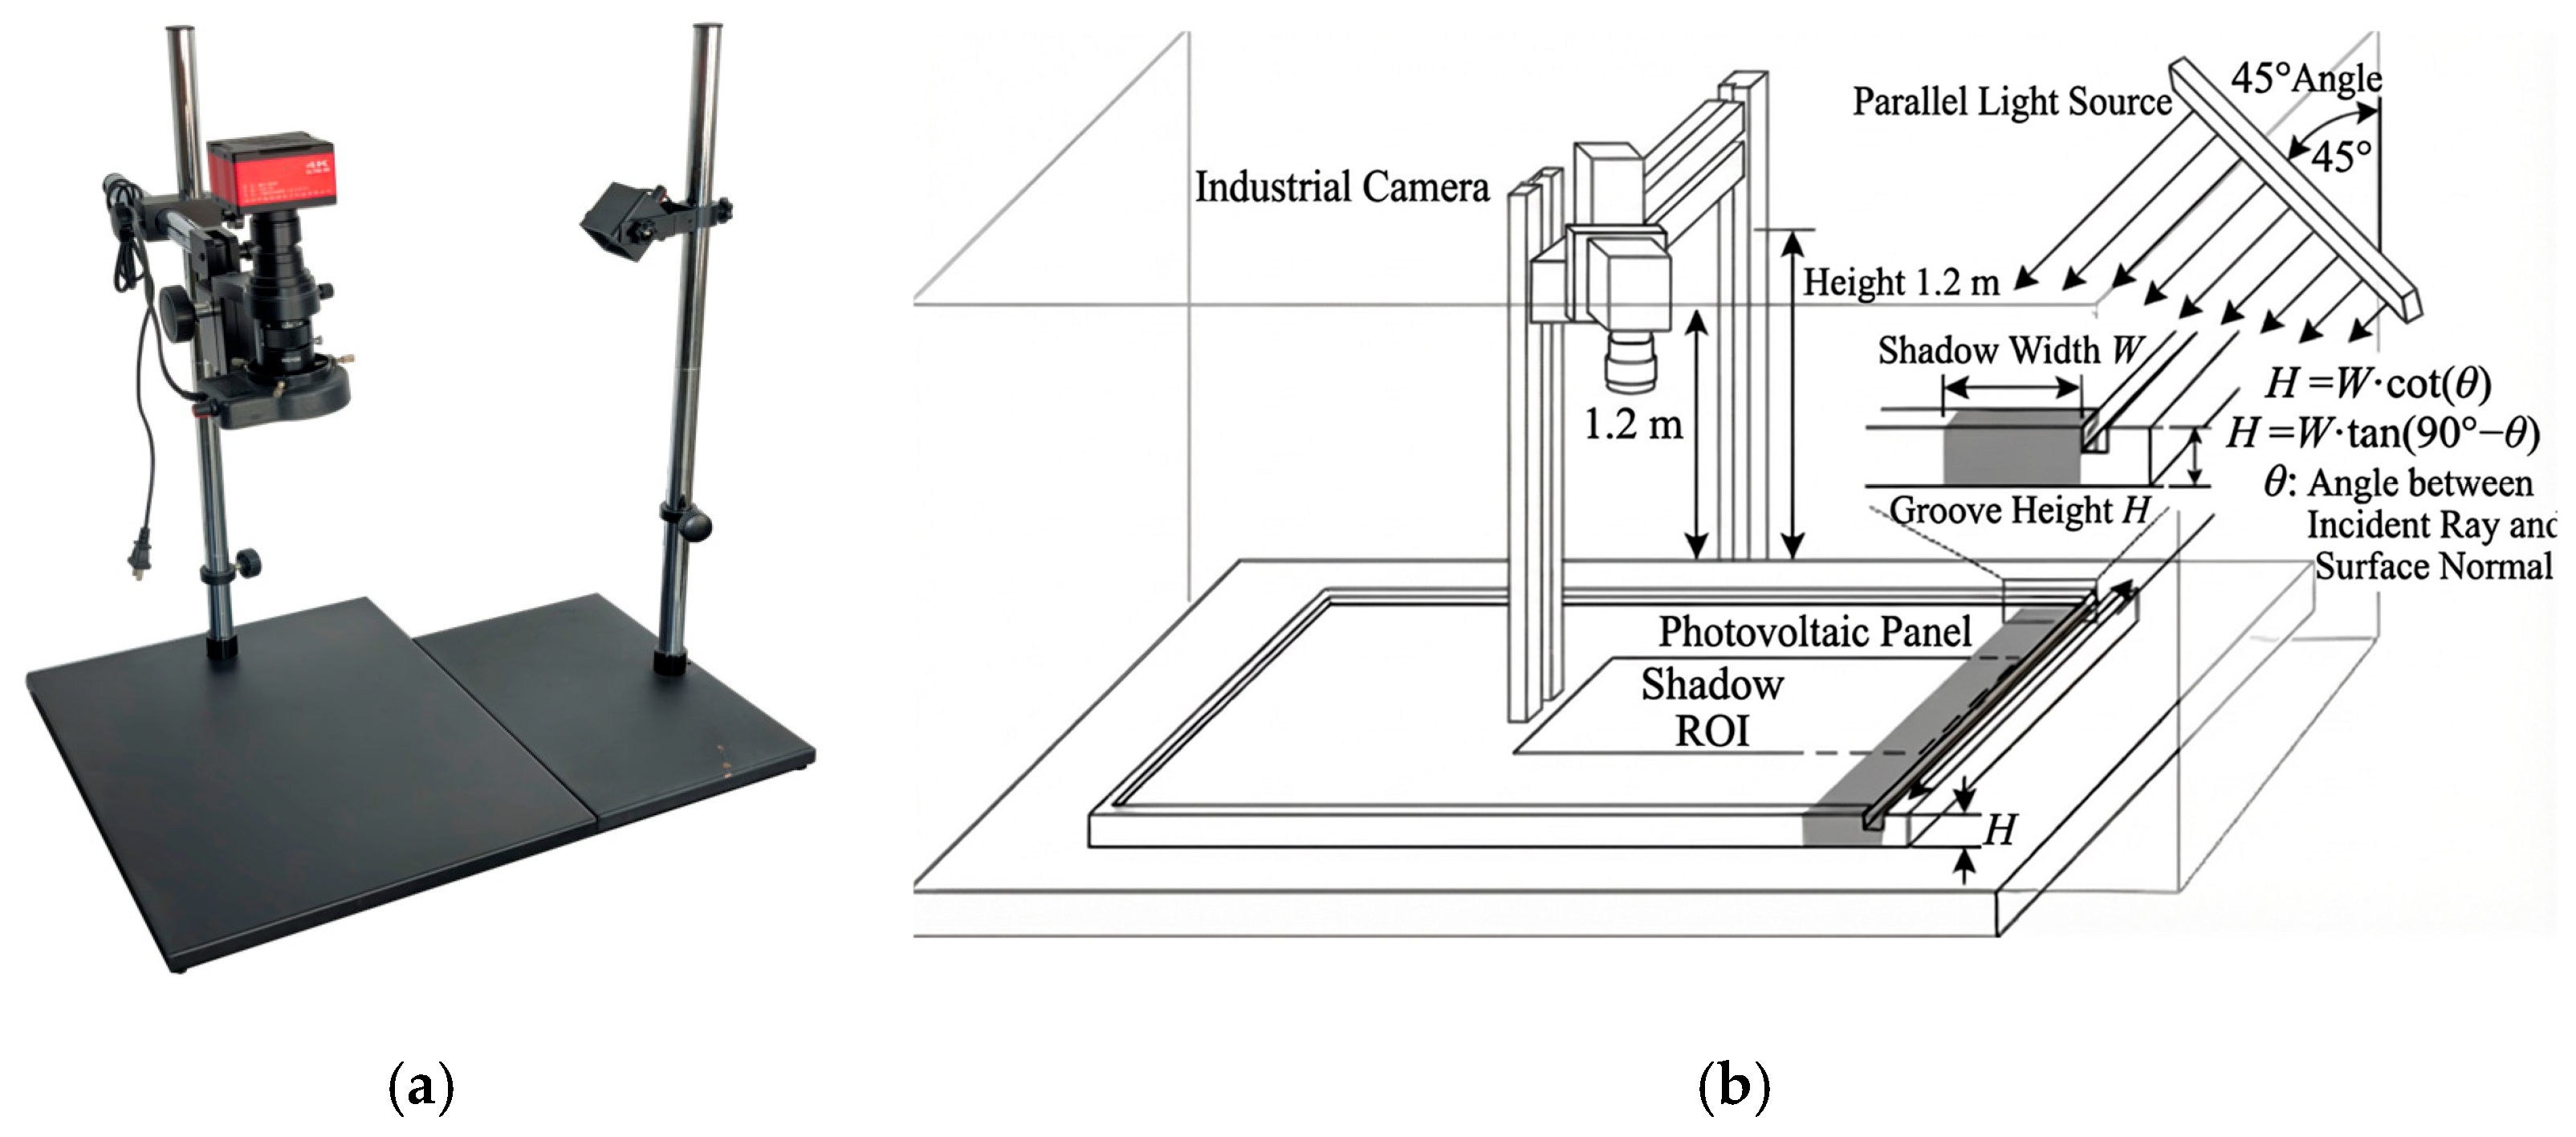
After on-site recycling, the PV modules were transported to the Mechanical Design Laboratory of the School of Mechanical Engineering, Inner Mongolia University of Technology. Systematic image acquisition was then conducted using a closed optical experimental platform to ensure illumination consistency and data reliability. A WST4K60P high-definition industrial camera (Weisite Electronic Technology Co., Ltd., Shenzhen, Guangdong, China) with a spatial resolution of 3840 × 2160 pixels was used for image capture, as shown in
Figure 3. Image samples were collected under both natural lighting conditions and controlled indoor illumination. To cover diverse operational scenarios, the dataset includes modules of different specifications and models, various service lifetimes, and multiple pollution levels, including mild dust coverage, moderate contaminant accumulation, and localized physical damage.
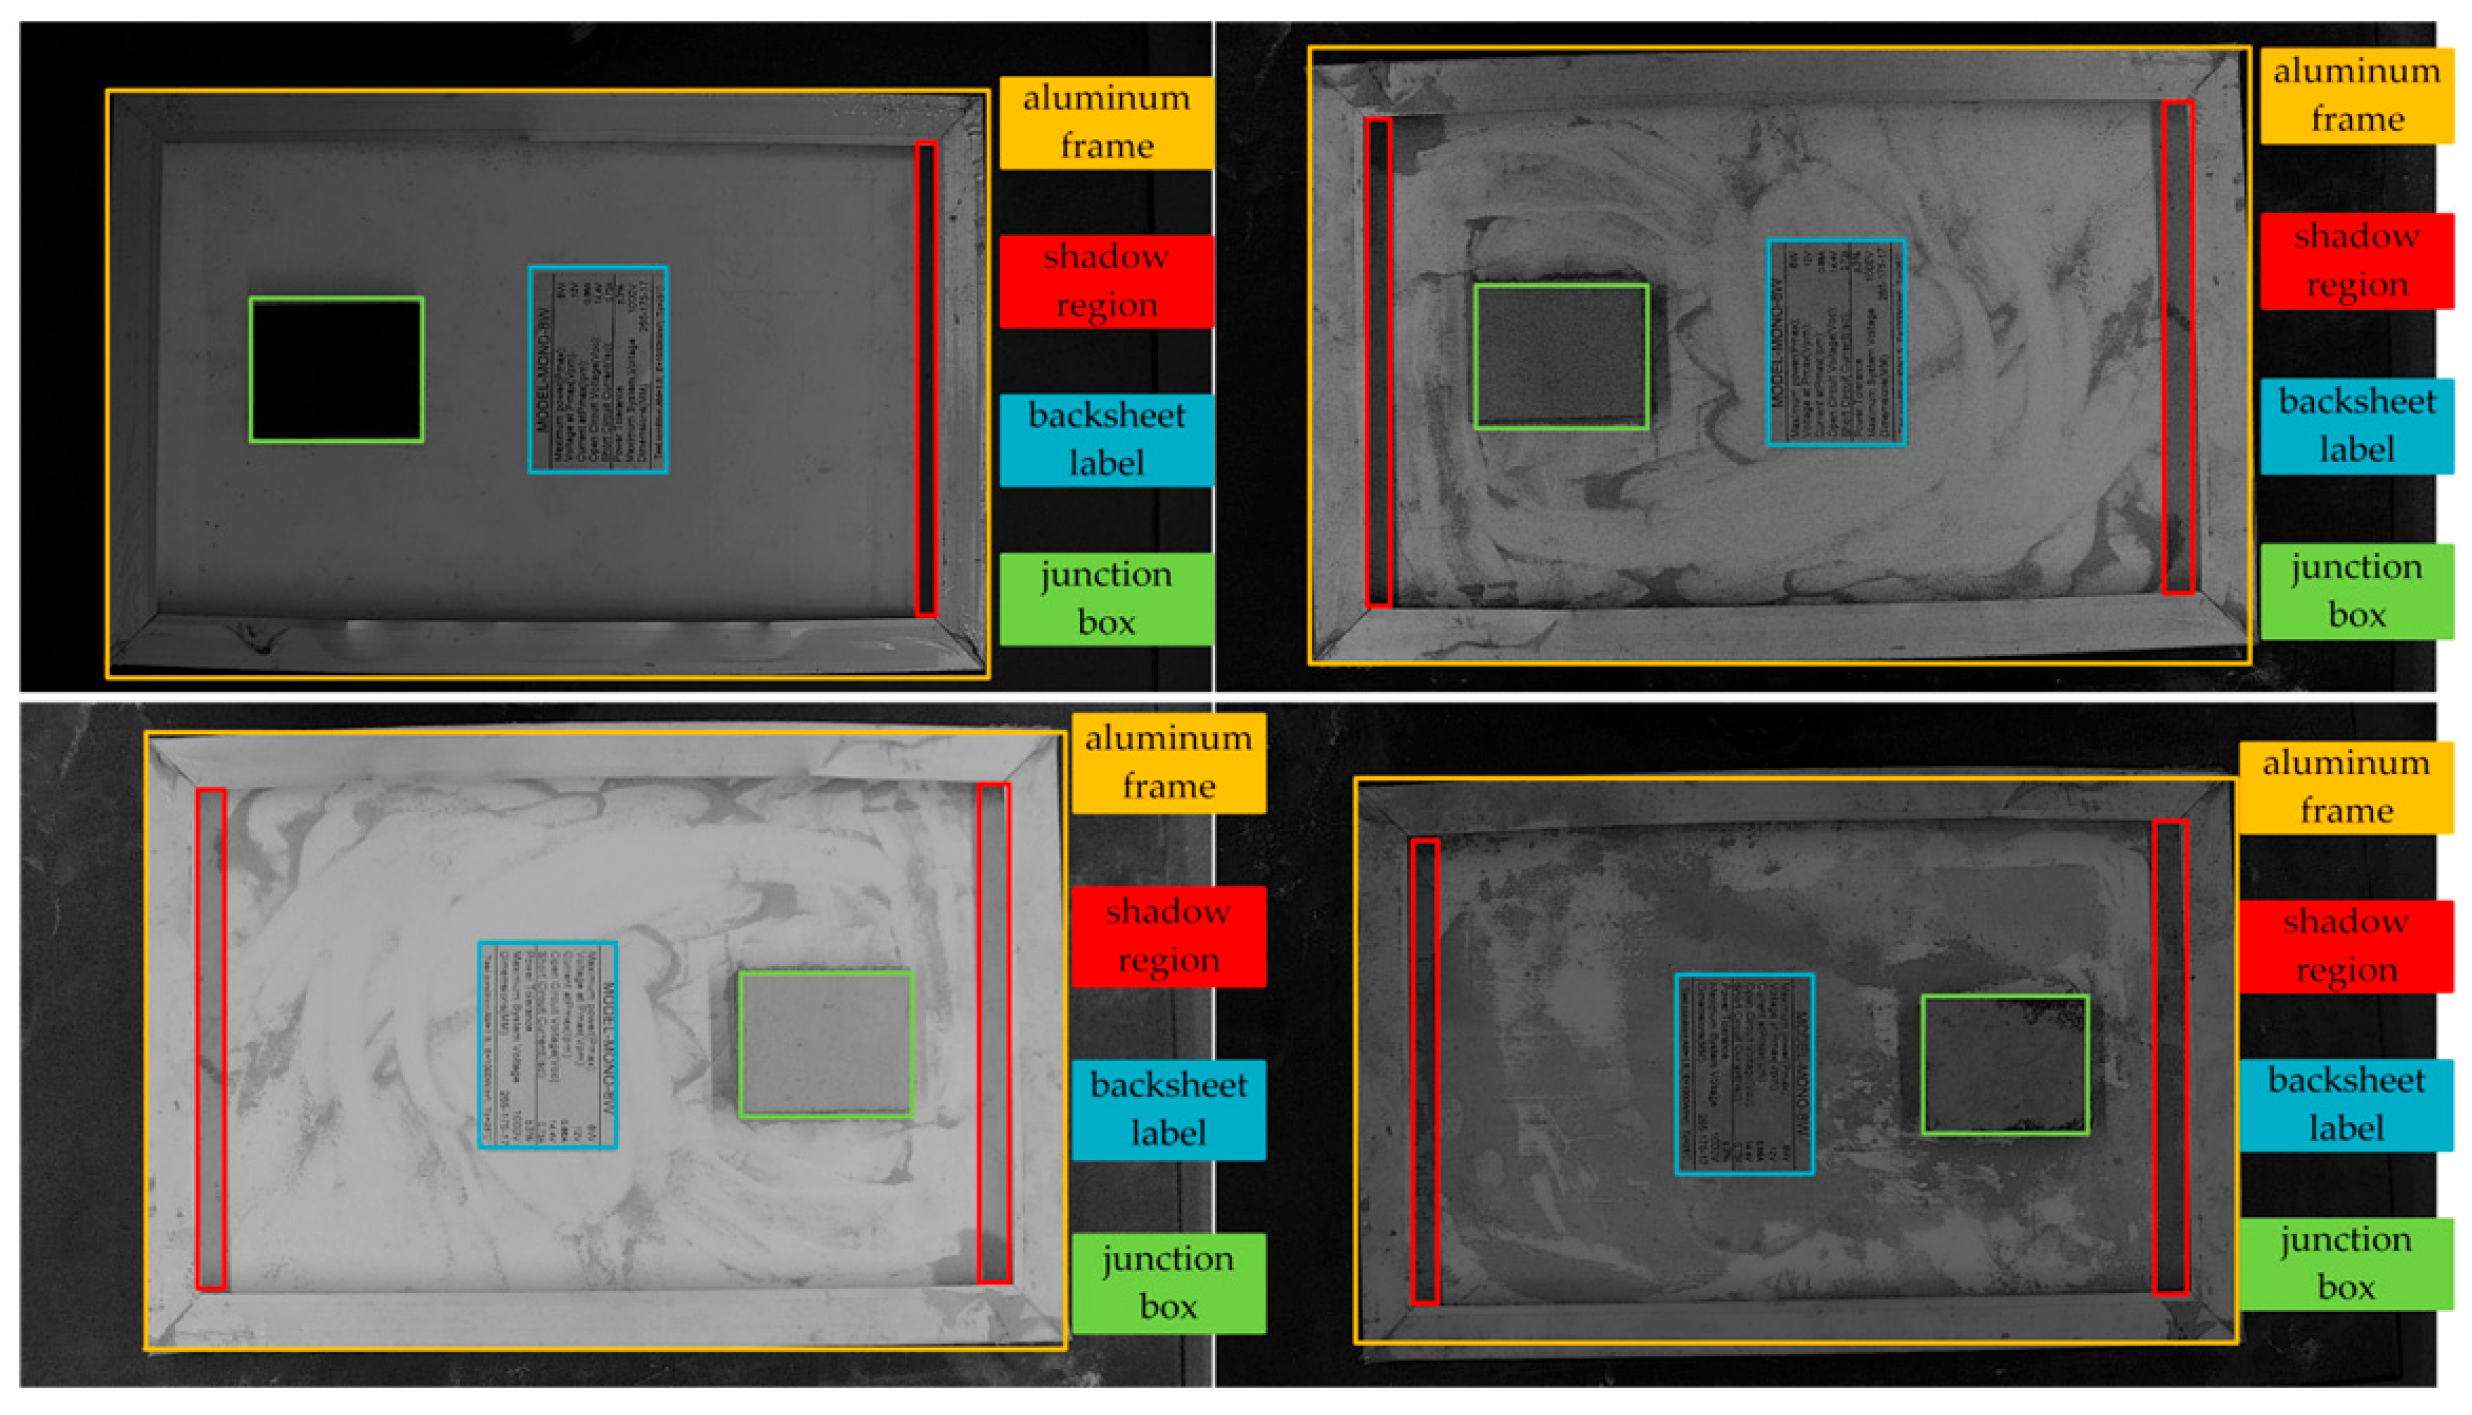
During imaging, a single-sided parallel light source with an incident angle of 45 degrees was employed to suppress specular reflection from the module surface. The camera was fixed at a height of 1.2 m to ensure complete coverage of the module area within each image. All images were acquired in the visible spectrum and stored in an uncompressed format to preserve full detail. Annotation was performed using LabelImg, and four target categories were defined, including the junction box, backsheet label, aluminum frame, and shadow region, covering different degradation states. Two trained annotators independently completed the initial annotation for all images. For samples with ambiguous boundaries or severe visual degradation—especially those involving strong dust/stain occlusion, partial damage, weak edges, or visual similarity between junction boxes and backsheet labels—the annotations were re-examined according to component shape and location priors, and the final labels were determined through consensus review before model training. The final review was conducted jointly by the two annotators under the supervision of the corresponding author before model training. Formal inter-annotator agreement statistics were not additionally reported because the disputed samples accounted for only a small proportion of the dataset and were manually resolved before model use. In total, 2006 images were collected and split into 1404 training images, 301 validation images, and 301 held-out test images (approximately 7:1.5:1.5). All subsequent detection experiments were conducted on this fixed split. This dataset design strategy is consistent with recent vision studies that emphasize task-oriented annotation and dataset reusability as prerequisites for robust deep learning-based analysis in real-world scenes [
35].
The full annotated dataset contains 2006 images of end-of-life photovoltaic modules collected under realistic dismantling conditions. Image-level statistical analysis shows that 1665 images contain identifiable junction boxes, while 341 images exhibit junction box damage or absence. A total of 1404 images contain backsheet labels, whereas 602 images present missing labels. Aluminum frames are present in all 2006 images, among which 100 samples show visible frame deformation, although the frame structure remains complete. These results indicate that the dataset covers both intact and degraded module states encountered in practical recycling scenarios.
Shadows are a common visual disturbance in the fully annotated dataset. Image-level statistical analysis shows that 1525 images contain two shadow regions, 478 images contain one shadow region, and only 3 images contain no visible shadow, corresponding to approximately 76.00%, 23.86%, and 0.14% of the dataset, respectively. At the annotation level, these images correspond to a total of 3528 annotated shadow instances. These results confirm that shadow interference is a representative characteristic of the dismantling scene and support its inclusion as an independent detection category. To characterize dust-related degradation in a reproducible manner, all images were graded into four dust severity levels according to visible dust and stain coverage: Level-0 (<5%), Level-1 (5–15%), Level-2 (15–30%), and Level-3 (>30%). Following this unified criterion, the test-set dust-level distribution and the corresponding detection performance were analyzed jointly to support the dust-erosion-aware analysis.
For junction boxes, backsheet labels, and aluminum frames, the statistics are reported at the image level, whereas shadow is additionally reported at the annotation level due to the possible presence of multiple regions in one image.
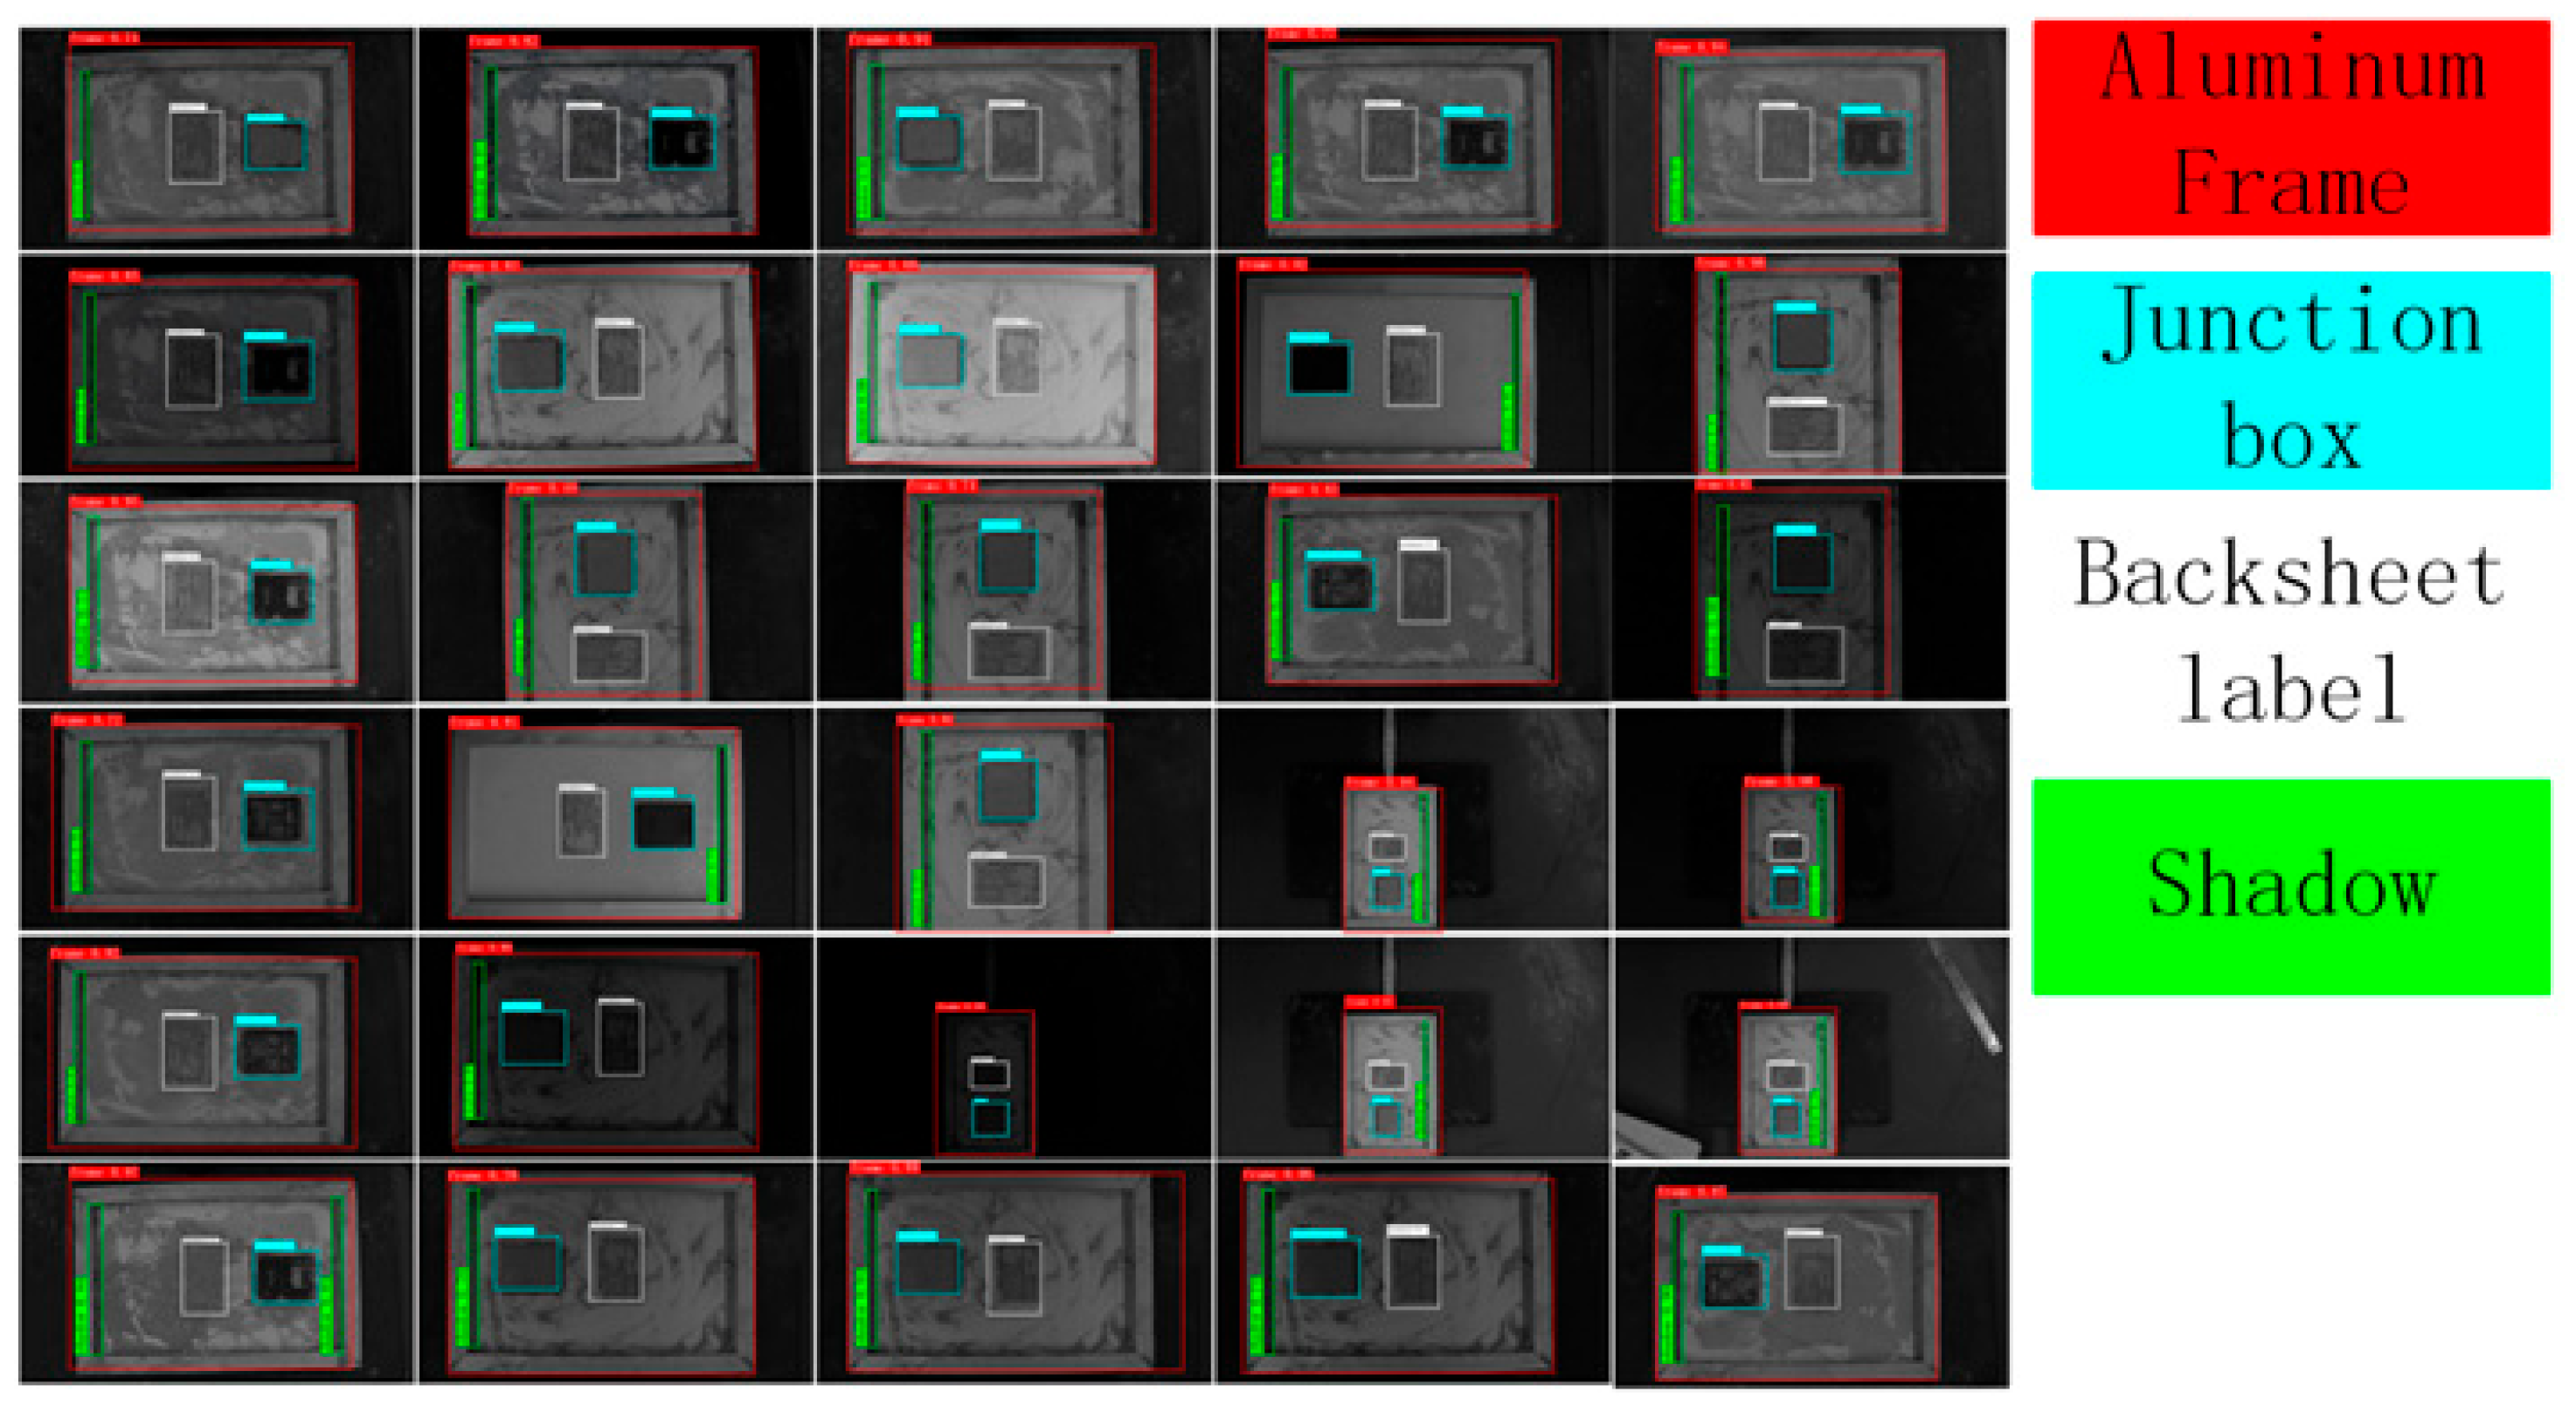
To characterize the scale distribution of detection targets, object size was quantified by the ratio between the bounding box area and full image area. Following a commonly used criterion, targets with an area ratio smaller than 0.01 were defined as small, those between 0.01 and 0.05 were defined as medium, and those larger than 0.05 were defined as large. Since the dataset contains three representative appearance groups with proportions of 66.6%, 16.7%, and 16.7%, respectively, a weighted estimation was performed based on representative annotated samples from each group. The results show that junction boxes, backsheet labels, and shadow regions are predominantly medium-sized targets (83.3%), while the remaining 16.7% fall into the small-target category. In contrast, aluminum frames consistently belong to the large-target category (100%). Overall, the dataset is estimated to contain approximately 12.5% small targets, 62.5% medium targets, and 25.0% large targets. These results indicate that the proposed task is dominated by medium-scale targets, while still involving a non-negligible proportion of small targets under degradation and occlusion conditions, as illustrated in
Figure 4.
In this study, the term gap height refers to the physical groove height of the aluminum frame in the PV module boundary structure. Under one-side oblique illumination, this groove generates a visible shadow region inside the frame recess. The corresponding shadow–gap relation denotes the geometric relationship between the measured shadow width in the image and the actual frame gap height in millimeters. This relation is later used for dimensional estimation after the shadow ROI has been detected by the improved YOLOv8 model.
2.2. Multimodal Image Enhancement and Robust Preprocessing Strategy
A hierarchical multimodal preprocessing and data augmentation pipeline is designed to enhance robustness against noise, uneven illumination, blurred textures, and occlusion in PV module images.
2.2.1. Basic Spatial-Domain Augmentation
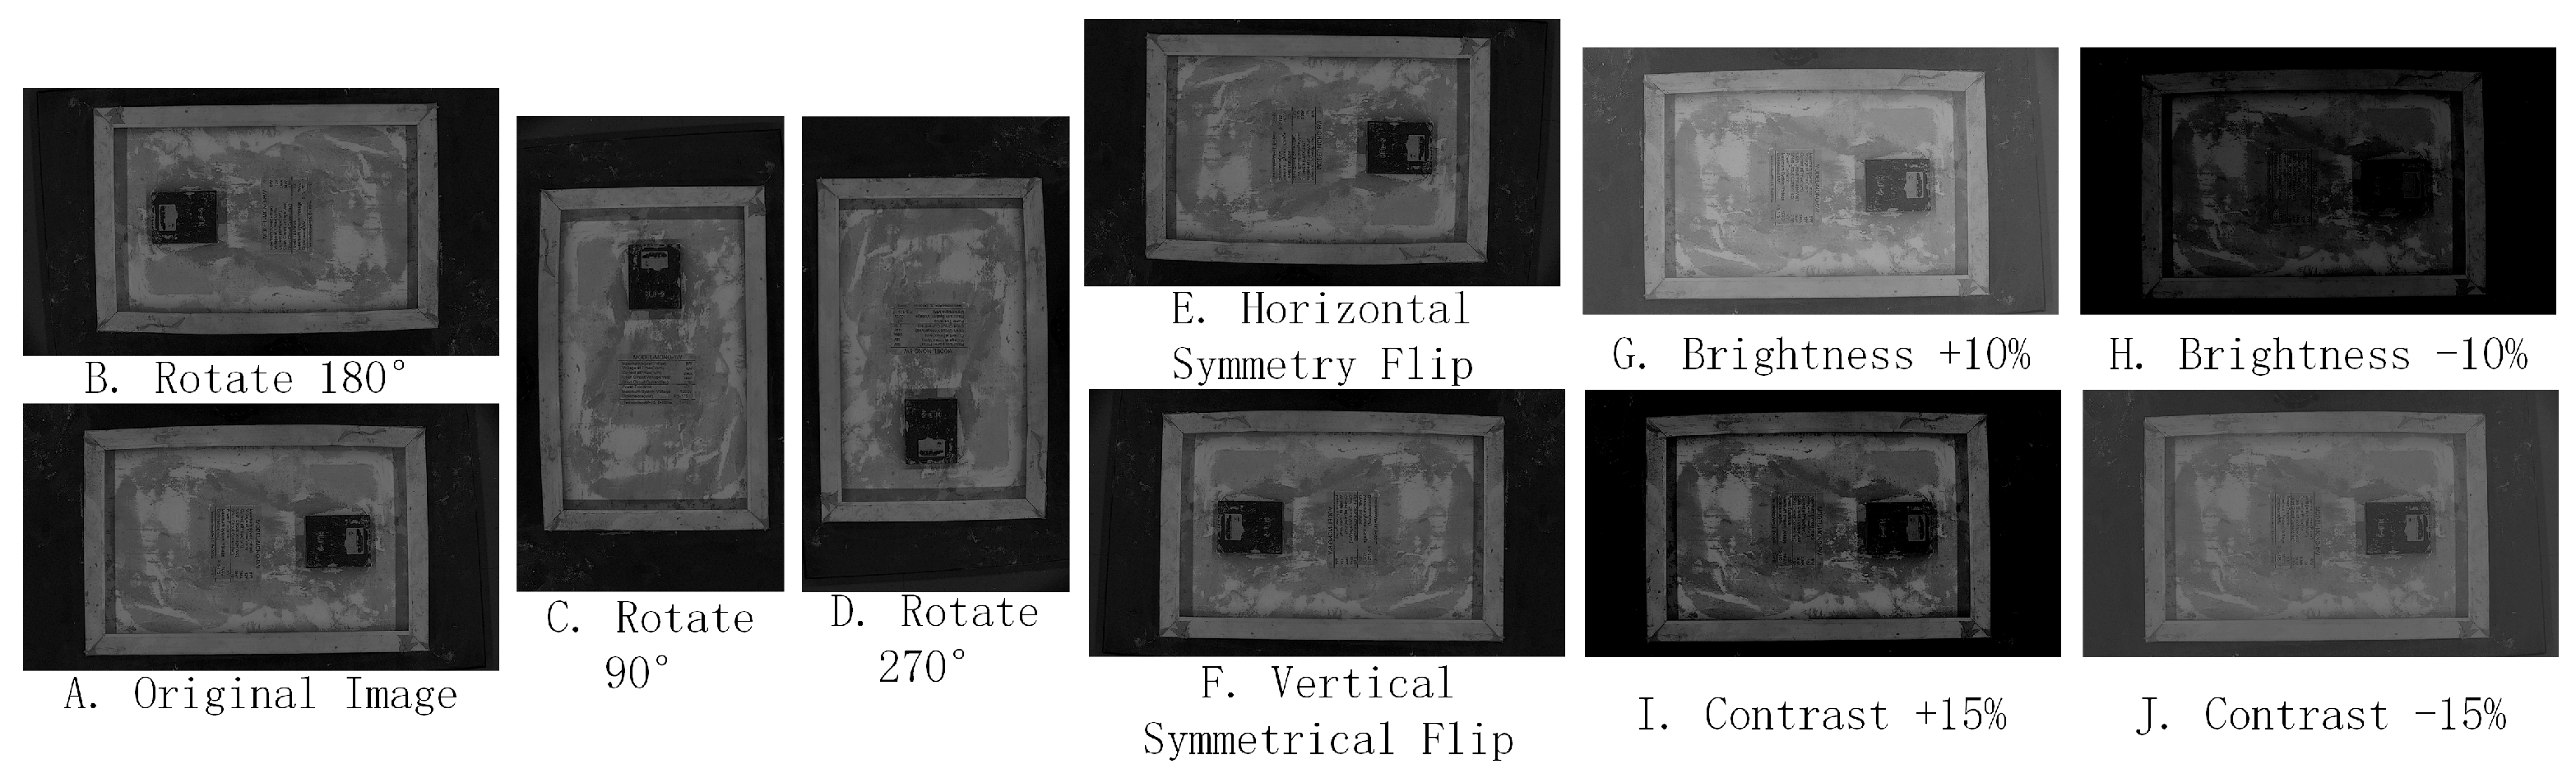
To simulate visual variations encountered in real industrial environments, three categories of spatial-domain data augmentation are applied to the training samples, including illumination robustness enhancement, geometric invariance, and scale invariance. Specifically, image brightness and contrast are randomly adjusted to emulate fluctuations in workshop lighting conditions, as commonly adopted in recent YOLO application studies [
4,
5,
6,
36,
37]. Random rotation and horizontal and vertical flipping are applied to improve robustness to changes in module orientation. In addition, random scaling with scale factors ranging from 0.8 to 1.2 and random cropping are performed to enhance recognition stability under varying shooting distances and fields of view, as shown in
Figure 5.
2.2.2. Noise and Occlusion Simulation
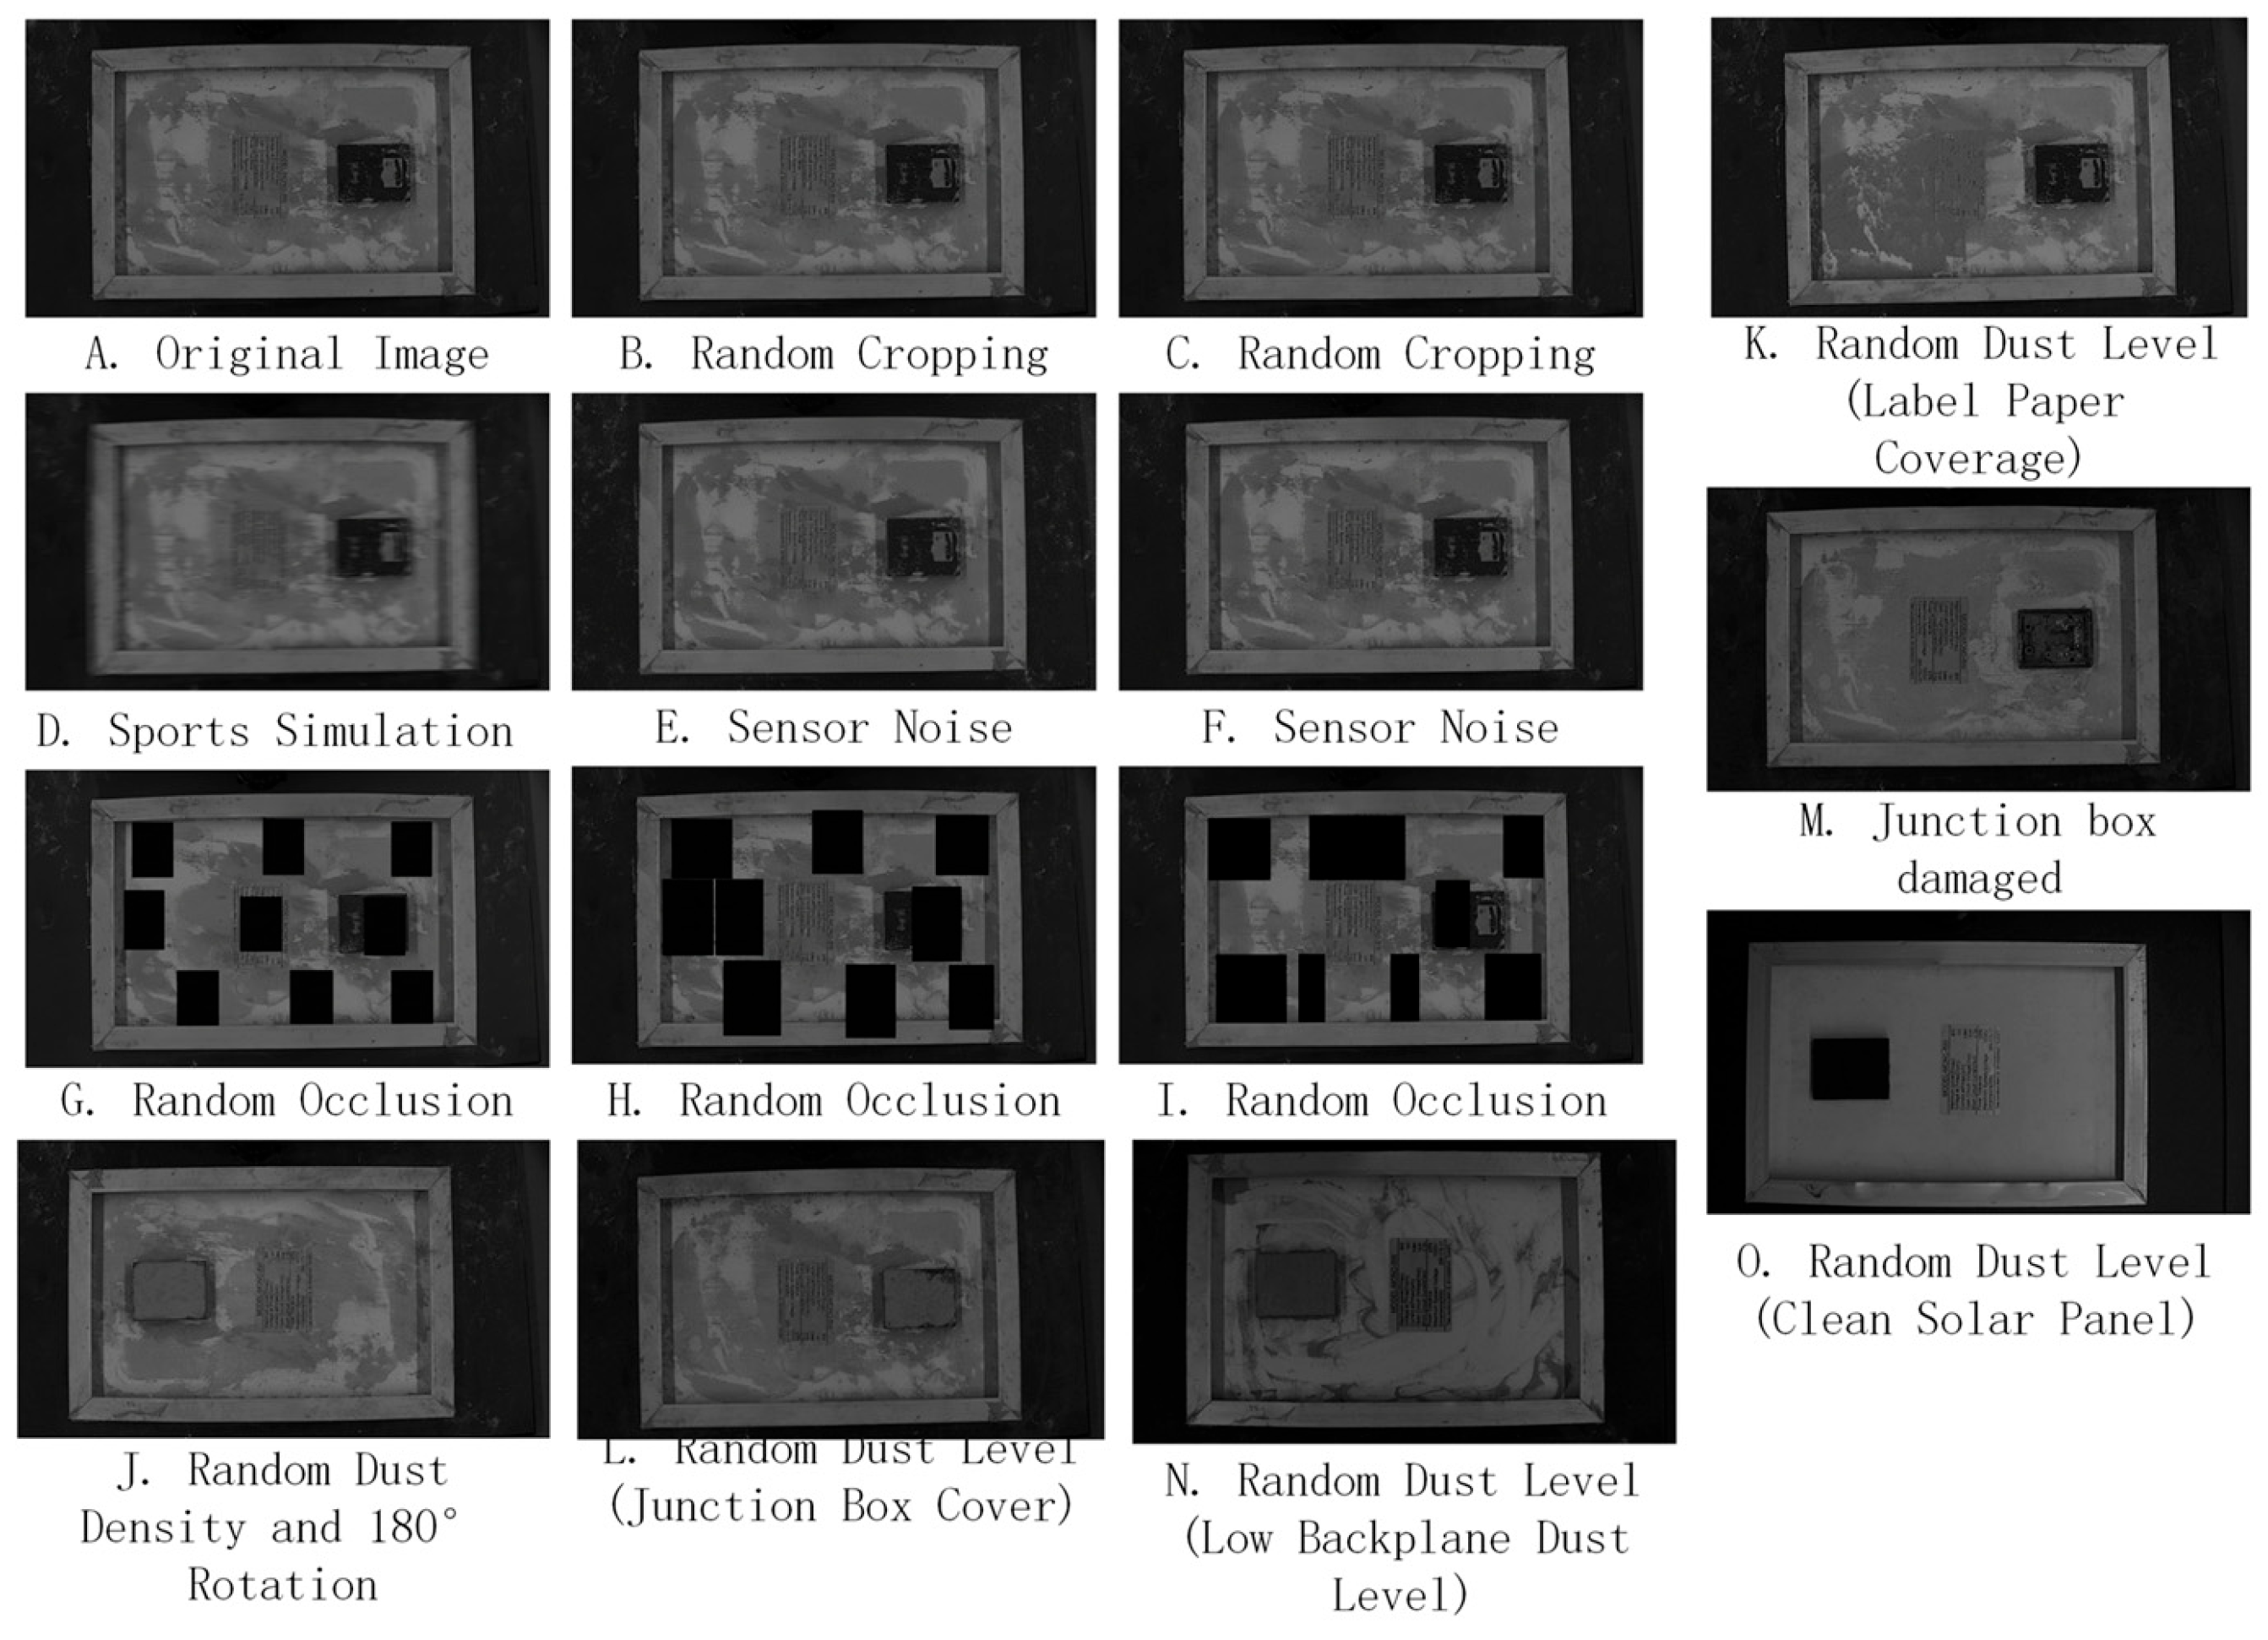
To improve detection performance under noise interference and partial occlusion, multiple degradation simulation strategies are incorporated, including sensor noise simulation, motion blur simulation, and local occlusion simulation. Gaussian noise (mean 0, std 0.05) simulates signal-to-noise ratio degradation under low-illumination conditions, a common robustness setting in UAV studies [
5,
37]. Motion blur is introduced using a convolution kernel with random direction and a length between 5 and 15 pixels to emulate vibration effects or conveyor belt motion, as typically considered in aerial/fast-motion imaging scenarios [
4,
37]. Furthermore, random rectangular occlusion regions covering approximately 10–30% of the image area are generated to simulate stains, water marks, or temporary surface attachments [
36], as illustrated in
Figure 6.
2.3. Cooperative Frequency-Domain Fusion Enhancement Strategy
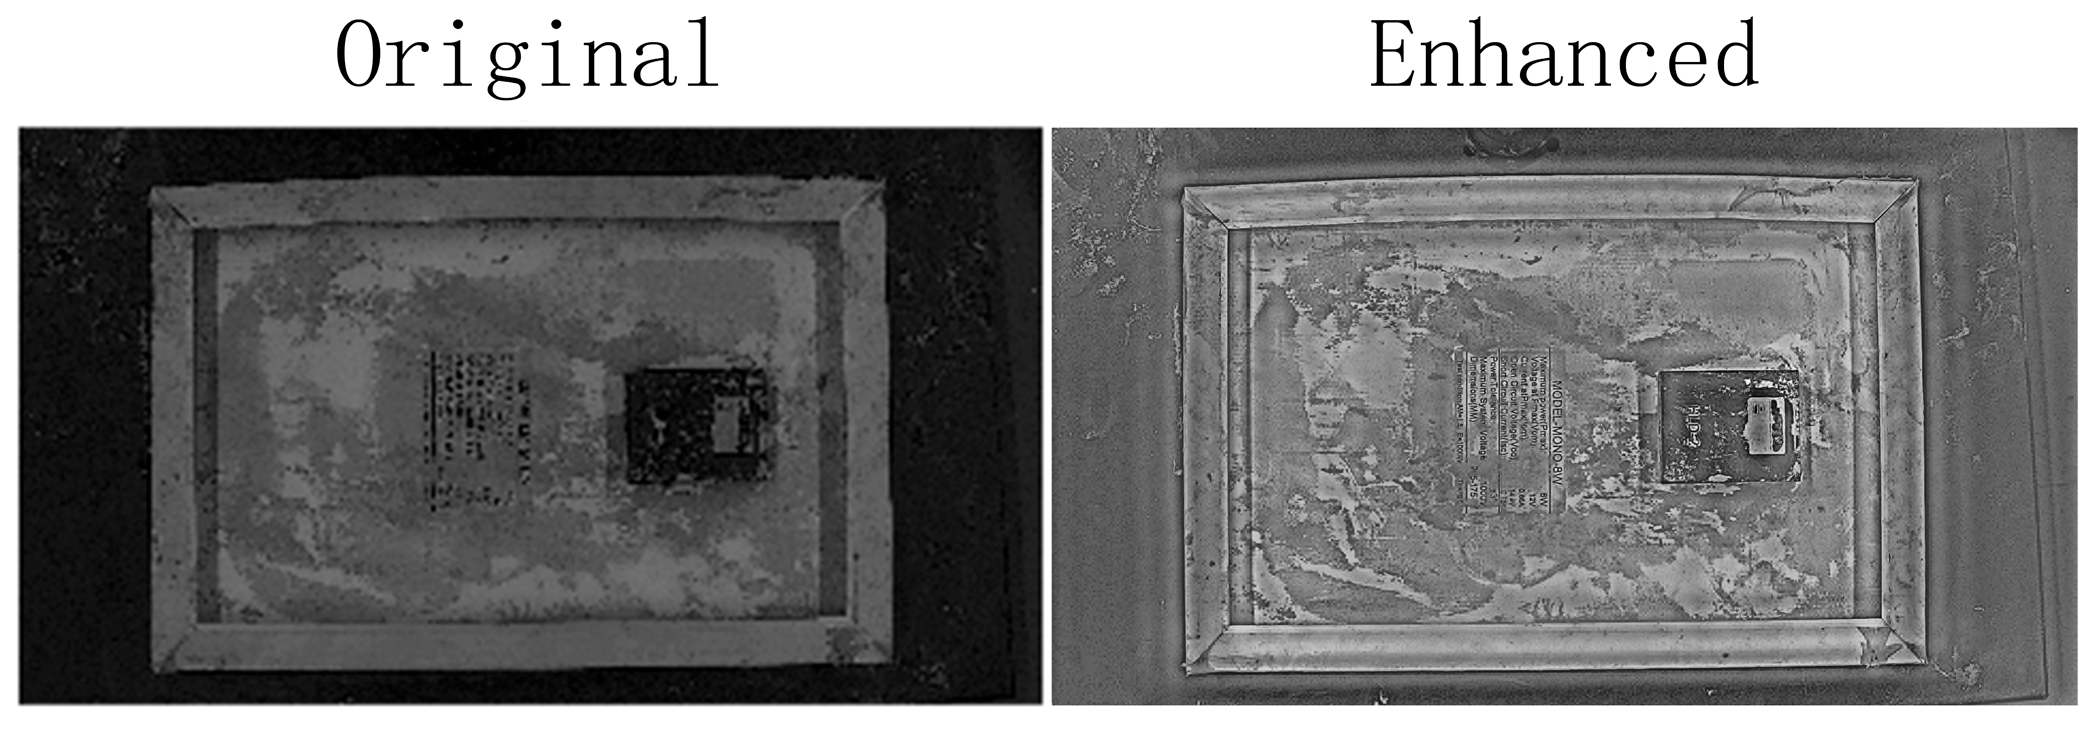
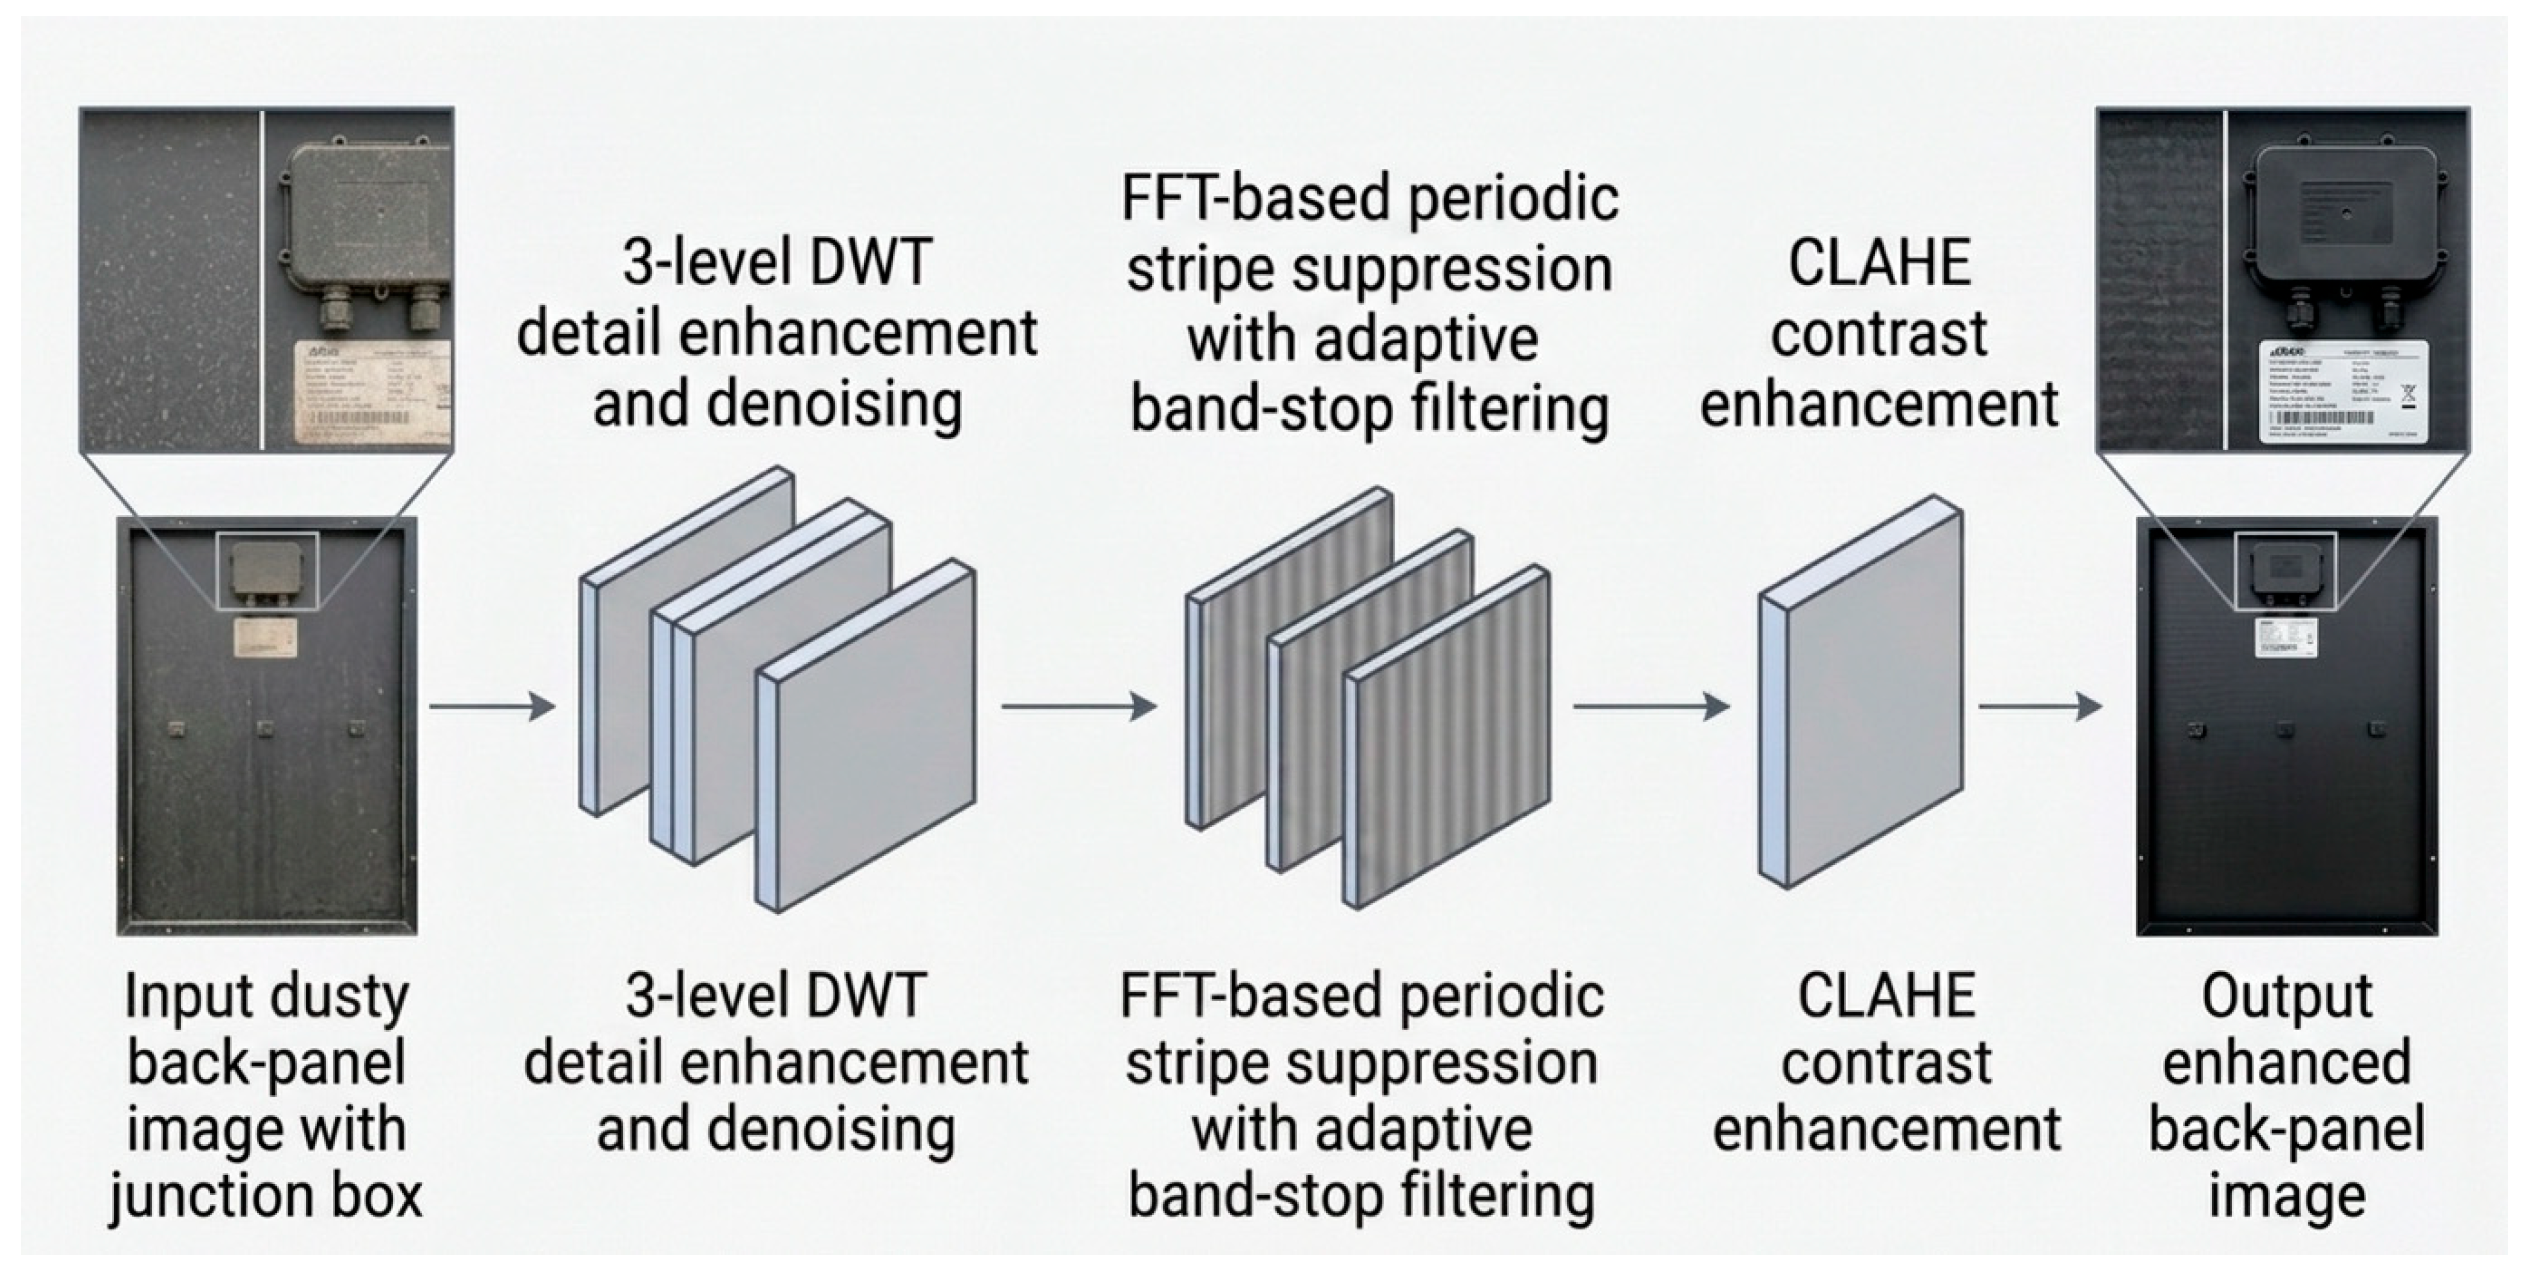
To alleviate edge blurring and texture degradation caused by dust, a DWT–FFT frequency-domain enhancement strategy is applied (
Figure 7), leveraging frequency-domain analysis to enhance structural details and suppress interference. This approach improves the perception of blurred targets in deep learning pipelines [
32,
33].
2.3.1. Wavelet-Domain Detail Enhancement
For an input image
I (
x,
y), a 3-level DWT decomposition is performed. The high-frequency wavelet coefficients are denoised using a soft-thresholding strategy, expressed as
where
is the soft threshold corresponding to the
b-th subband, with
, at decomposition level
j. For reproducibility, the noise standard deviation is estimated based on the median absolute deviation (MAD) as
The universal threshold is then defined as
where
is the number of wavelet coefficients in the corresponding subband. This thresholding strategy suppresses noise while preserving edge and texture details.
2.3.2. Fourier-Domain Periodic Interference Suppression
Since illumination interference and diffraction stripes typically manifest as high-energy components at specific frequencies in the Fourier domain, a 2D FFT is applied, and an adaptive band-stop filter is designed:
where
denotes the detected interference frequency center, and
controls the stopband width, enabling stripe suppression without damaging genuine edge structures.
K is the number of detected interference peaks. To avoid negative values caused by multi-peak superposition,
is truncated to [0, 1]:
2.3.3. CLAHE
To enhance subtle yet discriminative grayscale variations in dust-covered regions and improve target and background separability, contrast-limited adaptive histogram equalization is applied in the spatial domain. The input image is divided into B-by-B non-overlapping tiles, and local histograms are computed for each tile. Histogram clipping is then performed to limit excessive contrast amplification.
where
is the local histogram frequency at grayscale bin
i in tile
k, L is the number of gray levels (here
L = 256), and
is the clipping factor to prevent over-enhancement. The clipped counts are uniformly redistributed, cumulative distribution functions are calculated to obtain local intensity mappings, and bilinear interpolation is employed between adjacent tiles to ensure smooth transitions across the image, as shown in
Figure 8.
2.3.4. Normalization and Unified Resizing
All preprocessed images are resized to a spatial resolution of 640 × 640 pixels using bilinear interpolation and normalized at the pixel level as
where
and
are the channel-wise or grayscale mean and standard deviation computed from the training set. The validation and test sets use the same statistics to avoid data leakage and ensure fair evaluation. This operation accelerates convergence and reduces the impact of illumination-induced intensity distribution differences.
Through the above preprocessing and enhancement procedures, the overall dataset scale, diversity, and visual quality are significantly improved. These steps provide high-quality training inputs for the improved YOLOv8 network and support lightweight model design as well as validation for industrial deployment scenarios.
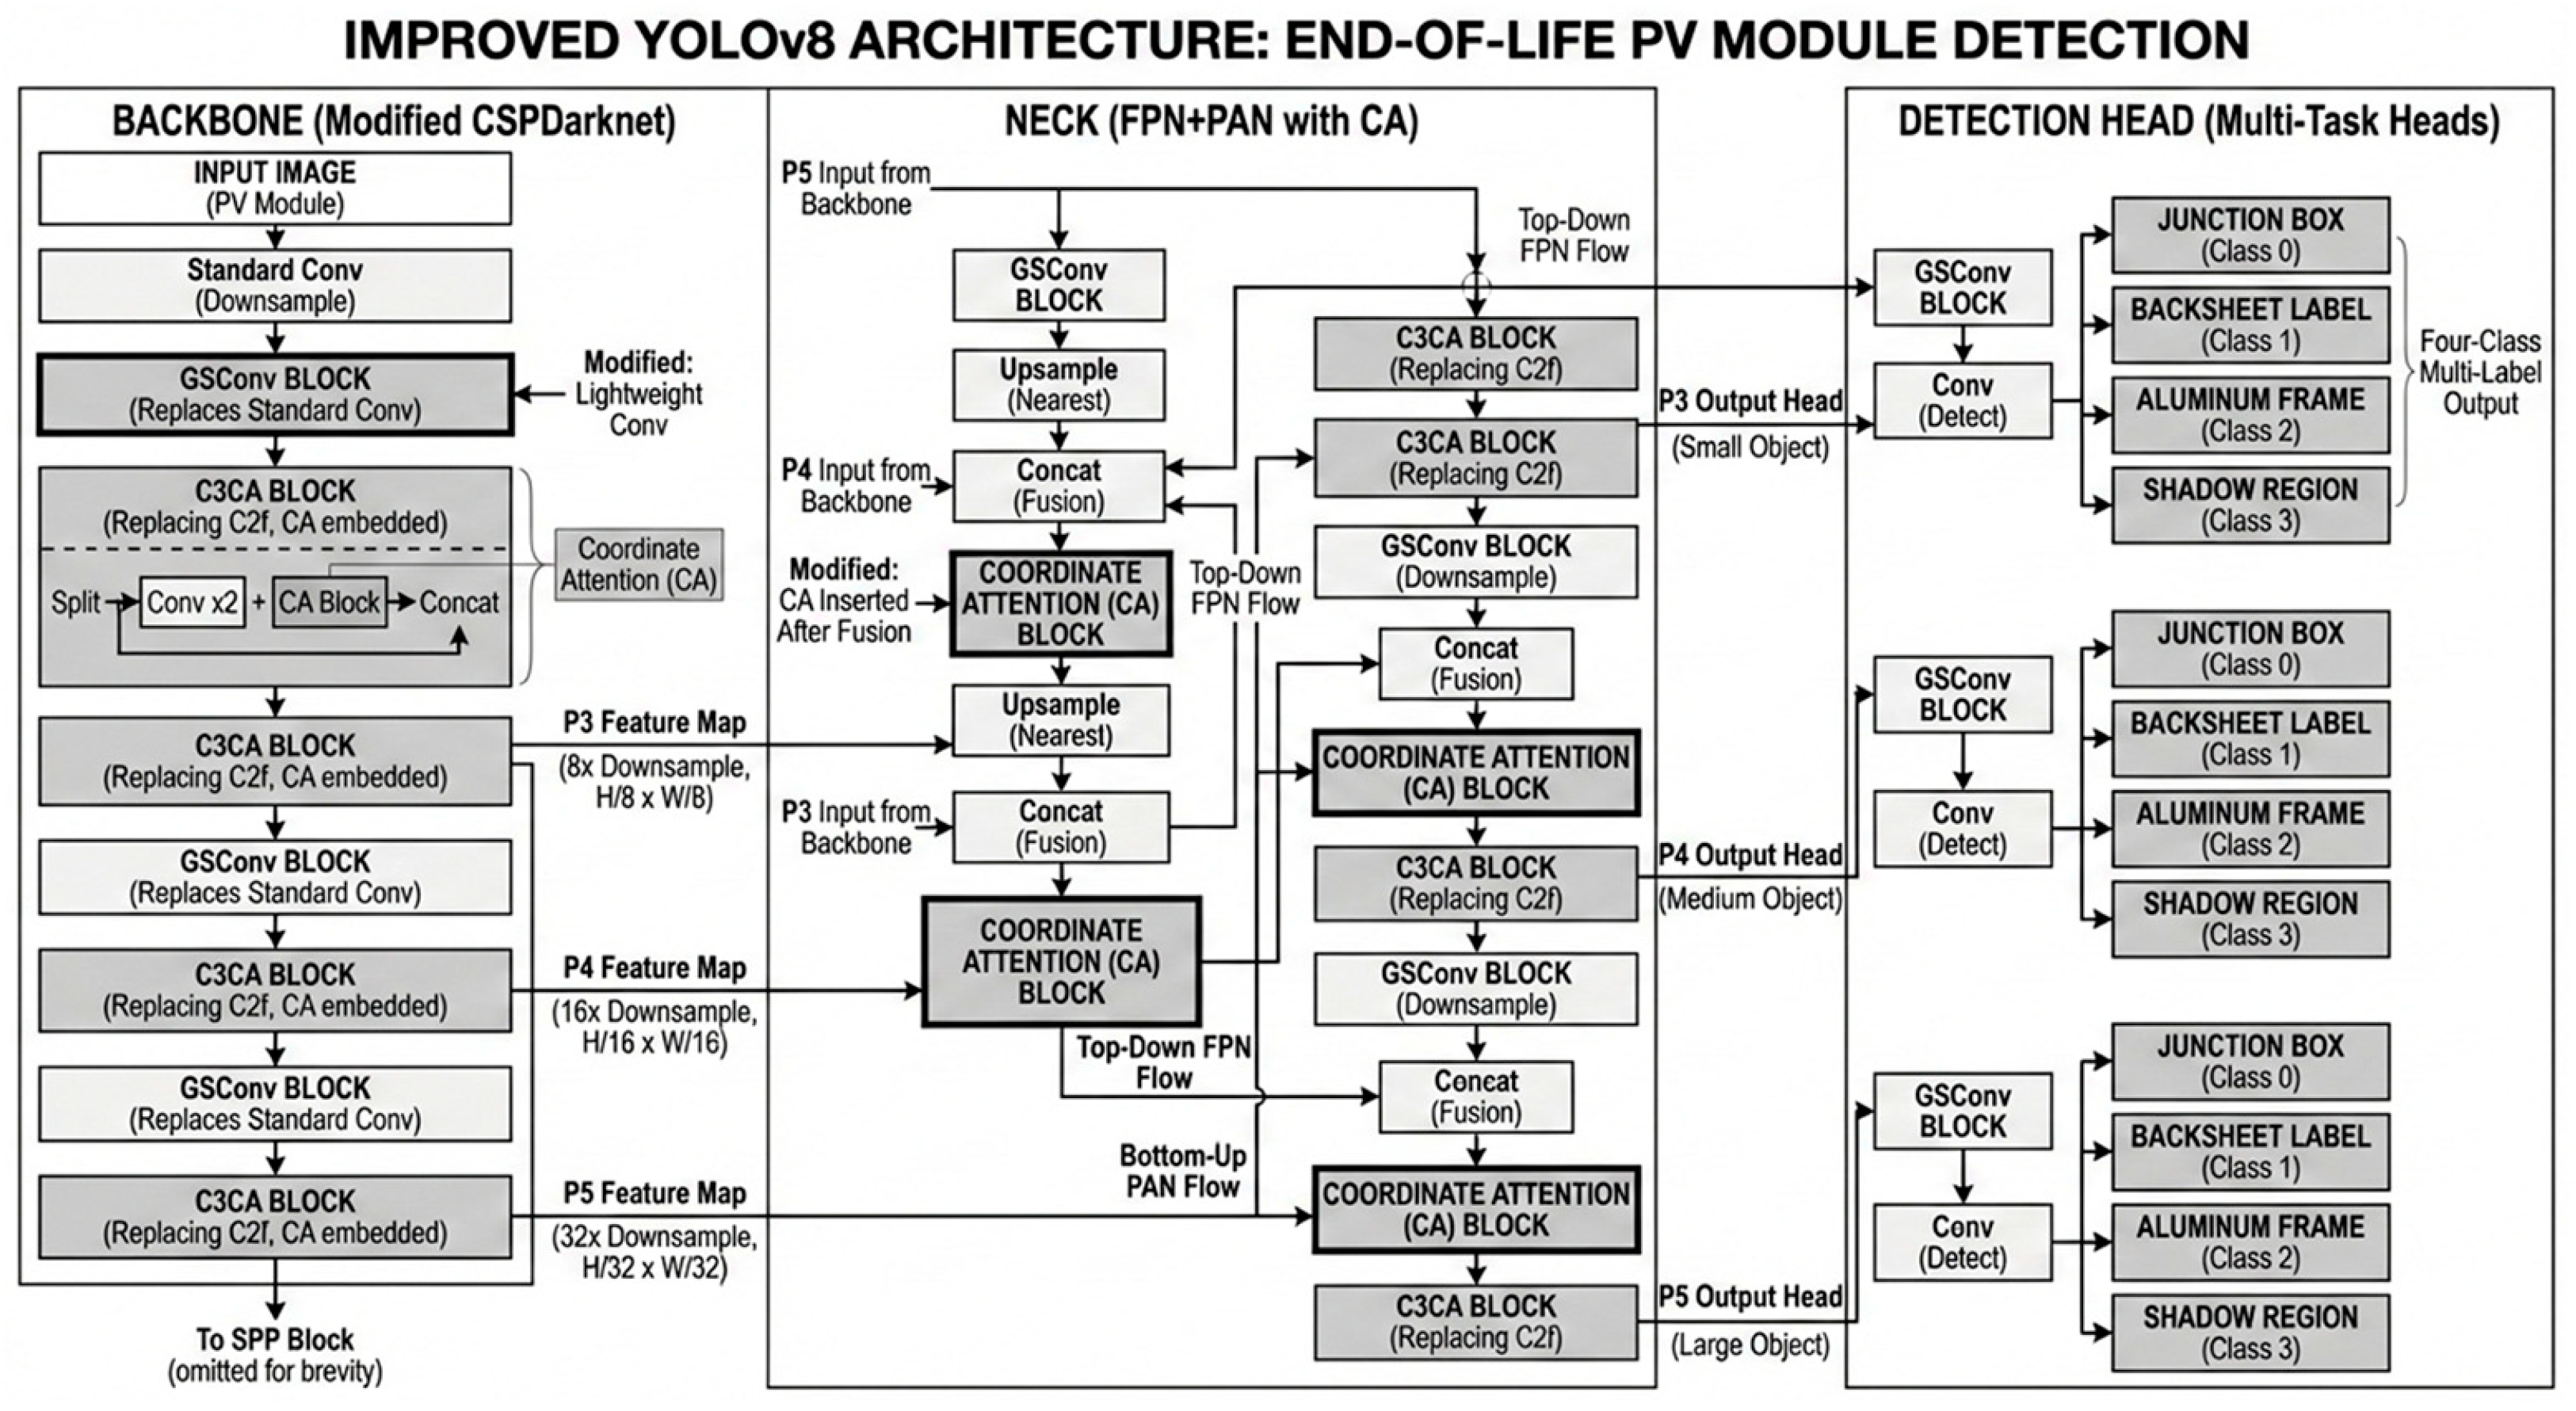
2.4. YOLOv8 Detection Network Integrating GSConv and C3CA with Coordinate Attention
YOLOv8 faces challenges in detecting PV module components under low contrast, blurred textures, and dust-induced inter-class similarity. We enhance it with lightweight GSConv and Coordinate Attention modules in the backbone and neck [
5,
7,
31]. The overall improved architecture is illustrated in
Figure 9.
Justification of the YOLOv8 baseline: YOLOv8 was chosen as the baseline detector because it provides a widely validated speed–accuracy trade-off and a stable open source training/deployment toolchain, which are important for reproducible engineering evaluation and edge deployment. Although newer YOLO variants continue to emerge, using YOLOv8 enables controlled ablation of the proposed modules (frequency-domain enhancement, GSConv lightweighting, and Coordinate Attention in both backbone and neck) without confounding architectural changes, while keeping the implementation compatible with common industrial inference stacks.
2.4.1. Backbone Lightweighting via GSConv
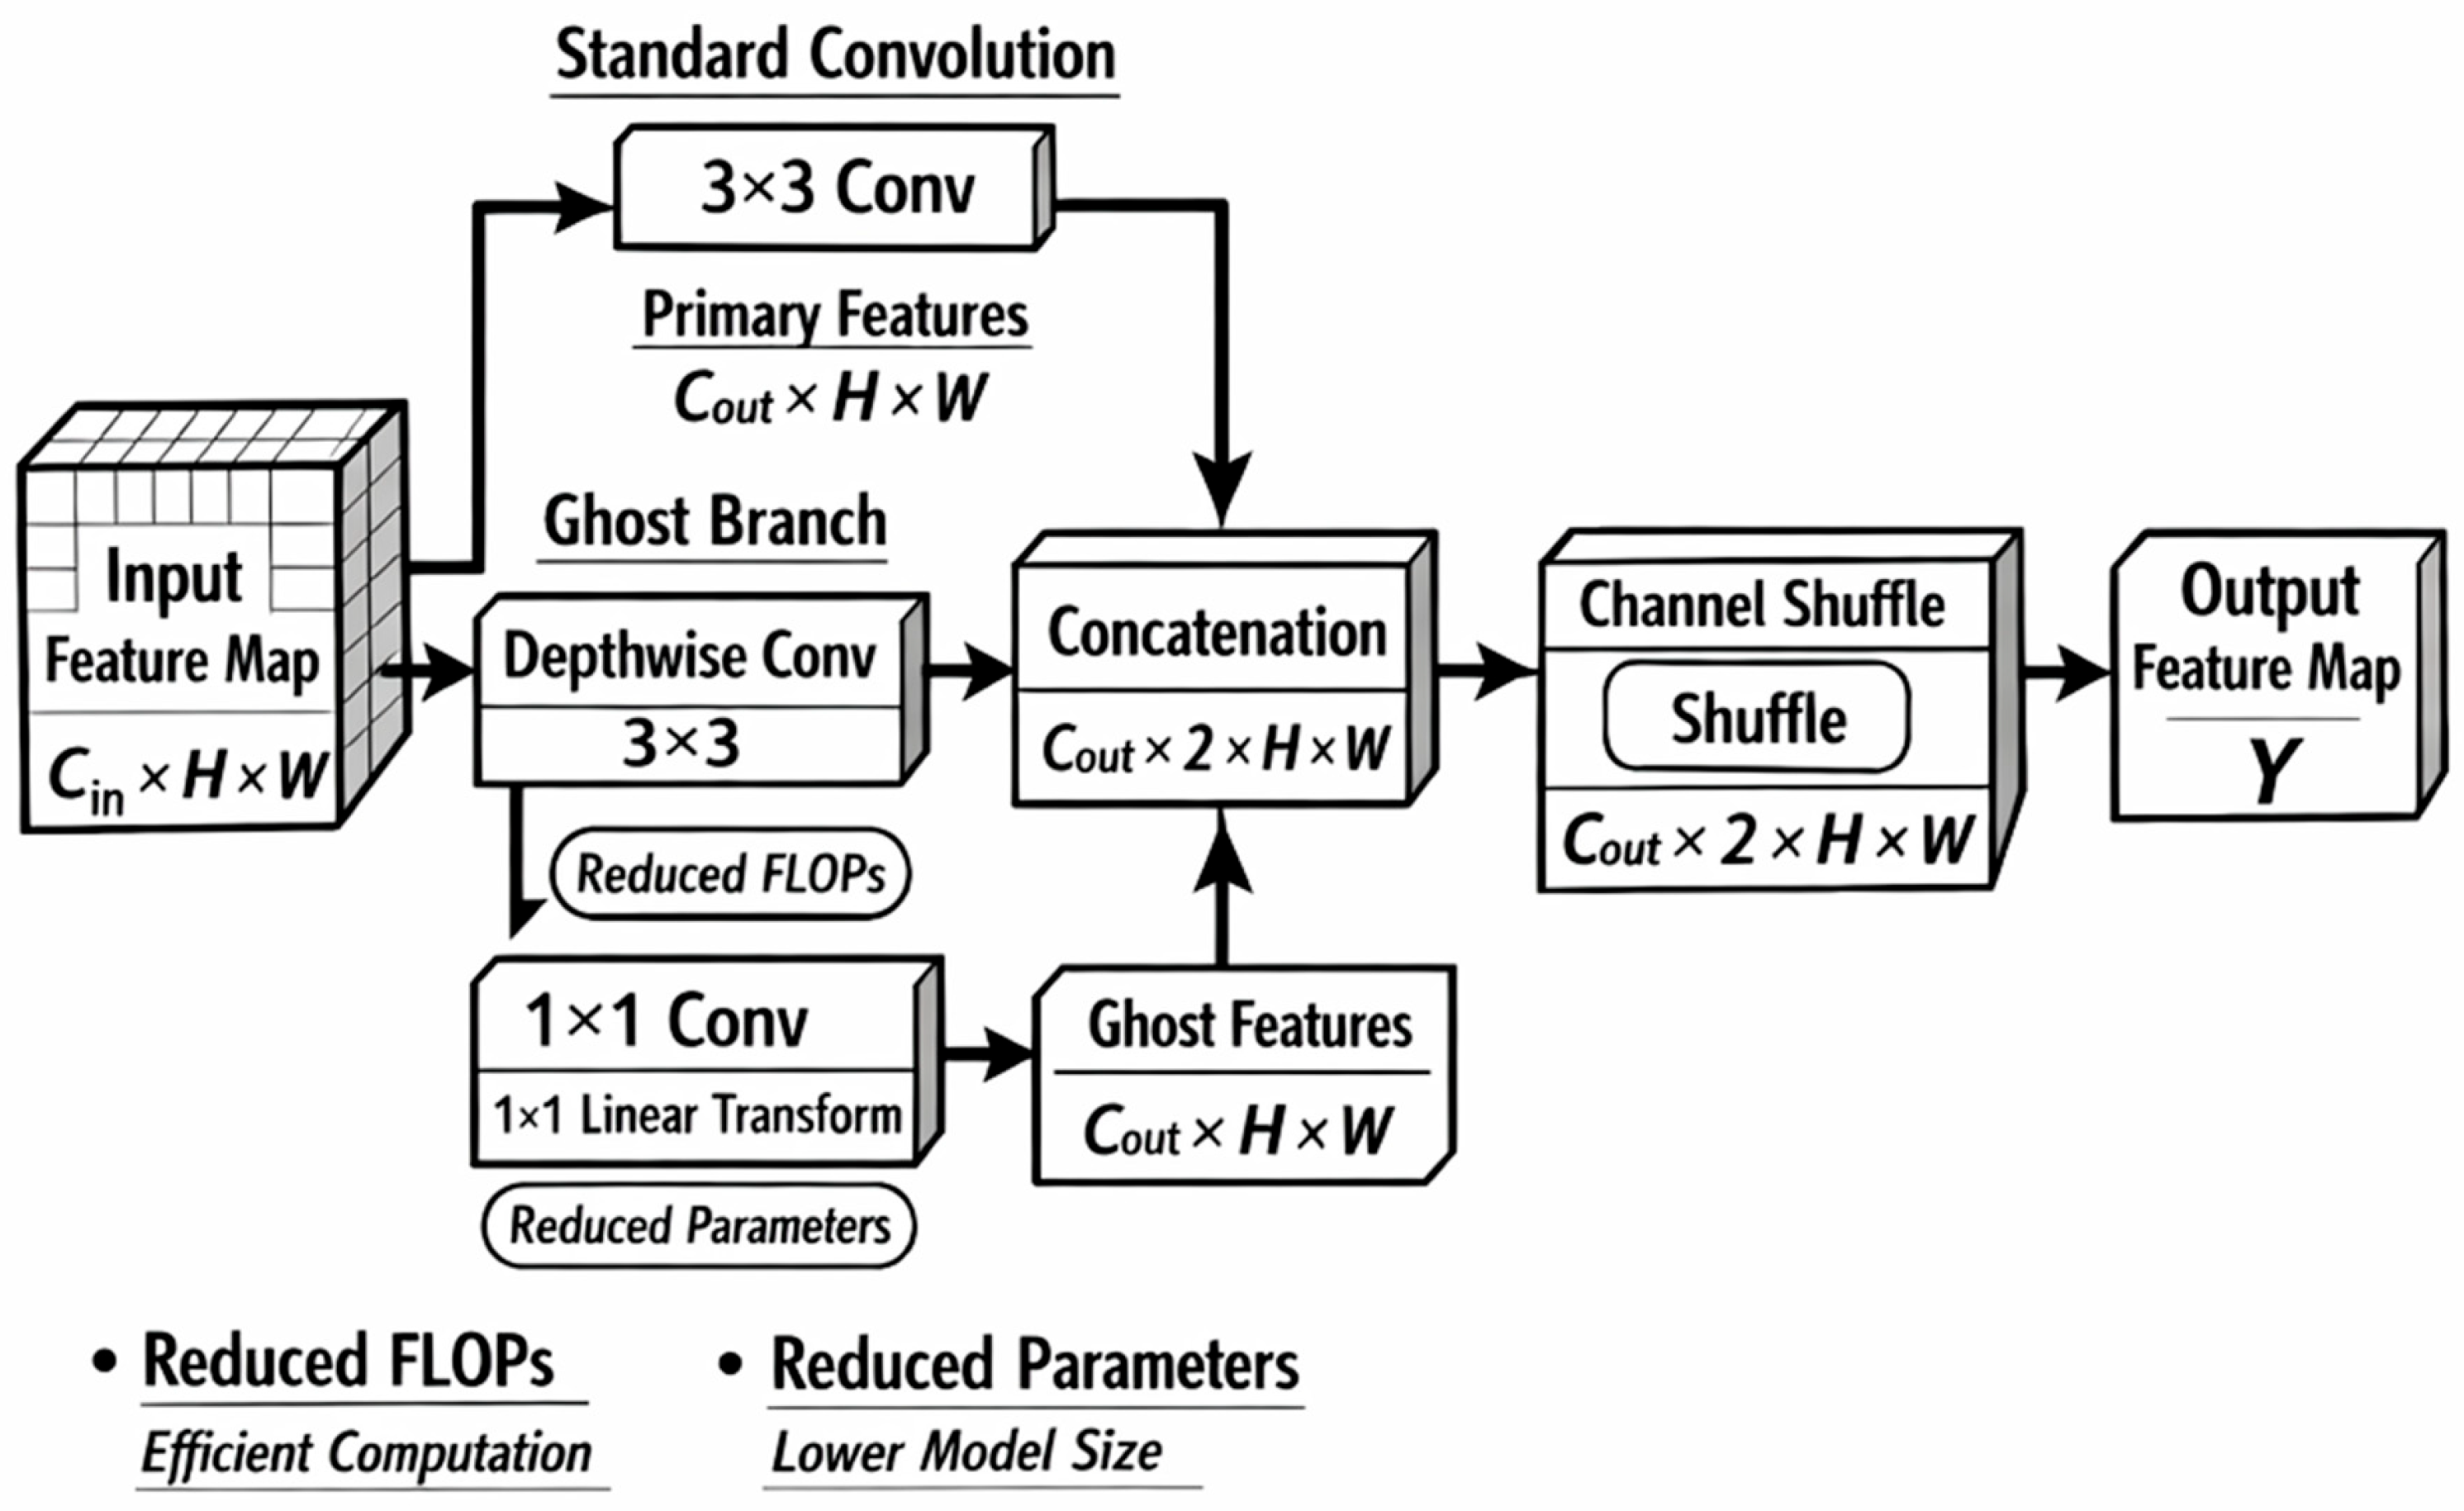
To enable efficient deployment on resource-constrained industrial edge devices without significantly compromising detection accuracy, GSConv has been integrated into the backbone network. The core concept of GSConv is to generate additional feature maps through efficient ghostoperations, thereby reducing the computational burden of standard convolution layers while preserving representative feature information. The structure of the GSConv operator is illustrated in
Figure 10.
For an input feature map
X, a standard convolution generates the main-branch feature
with an output channel number of
. Subsequently, a computationally inexpensive depthwise convolution (DWConv) followed by a linear transform produces the ghost features. Finally,
and
are concatenated along the channel dimension, and channel shuffling is applied to encourage cross-channel information exchange, expressed as
where Linear denotes a 1 × 1 convolution, and ChannelShuffle adopts a grouping strategy with g = 2. This structure reduces the number of parameters and floating point operations (FLOPs) while preserving feature expressiveness.
2.4.2. C3CA Module with Coordinate Attention
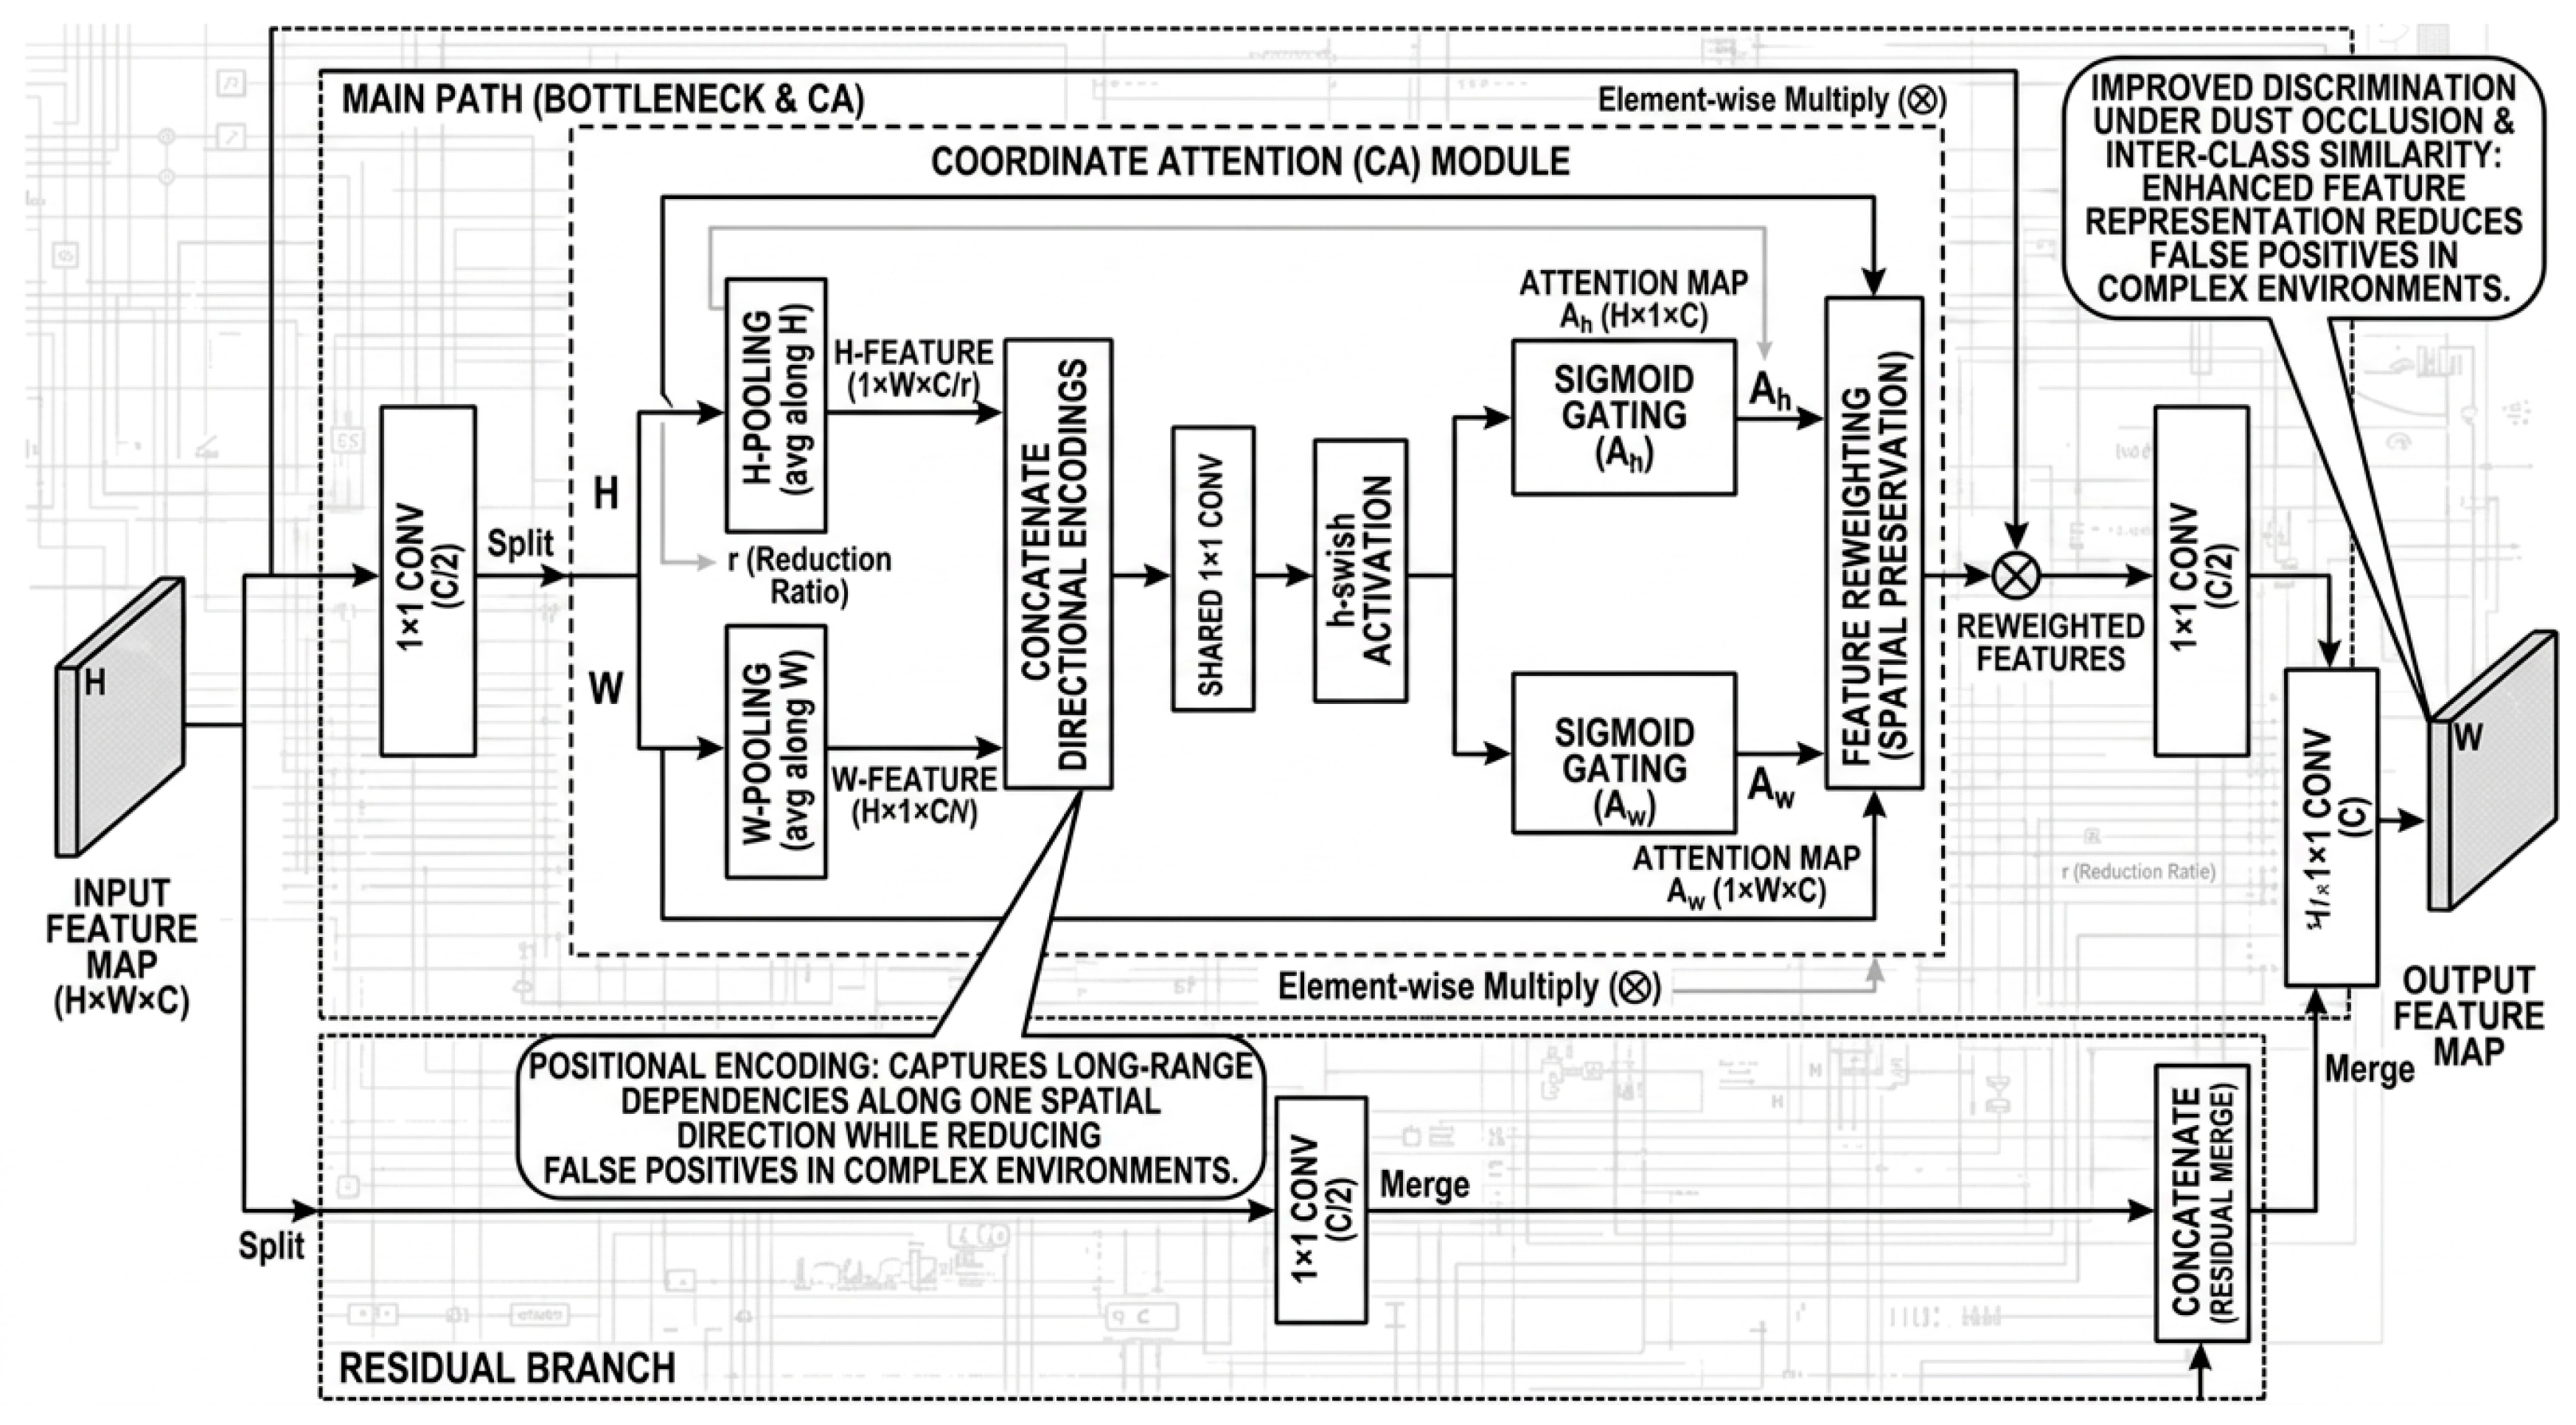
To enhance discrimination between visually similar targets under dust occlusion, such as junction boxes and backsheet labels, the C3CA module is designed to replace the original C2f structure in the backbone network. The proposed C3CA module preserves a multi-branch residual architecture while embedding CA, as illustrated in
Figure 11.
Coordinate Attention (CA) decomposes conventional channel attention into two one-dimensional feature encoding processes along the width and height directions. This design enables the model to capture cross-channel dependencies while simultaneously preserving long-range spatial positional information. Such characteristics are particularly important for PV components, which exhibit relatively fixed structural layouts and spatial arrangements. Compared with general attention/self-attention-enhanced detection designs, the explicit positional encoding introduced by CA allows the network to better resolve target location ambiguity induced by dust occlusion and surface degradation.
Given an input feature map, CA performs global pooling independently along the two spatial directions, which can be expressed as
The two directional encodings are then concatenated and transformed by a shared 1 × 1 convolution followed by a nonlinear activation function
implemented as the hard-swish (h-swish) activation. Subsequently, a sigmoid function
is applied to generate an intermediate feature representation
f, given by
Then, directional attention weights
and
are obtained as
Finally, the output feature is reweighted as
Thus, the C3CA module adaptively emphasizes key target positions and enhances feature separability for blurred targets at the feature extraction stage, consistent with recent attention-enhanced detection designs [
29].
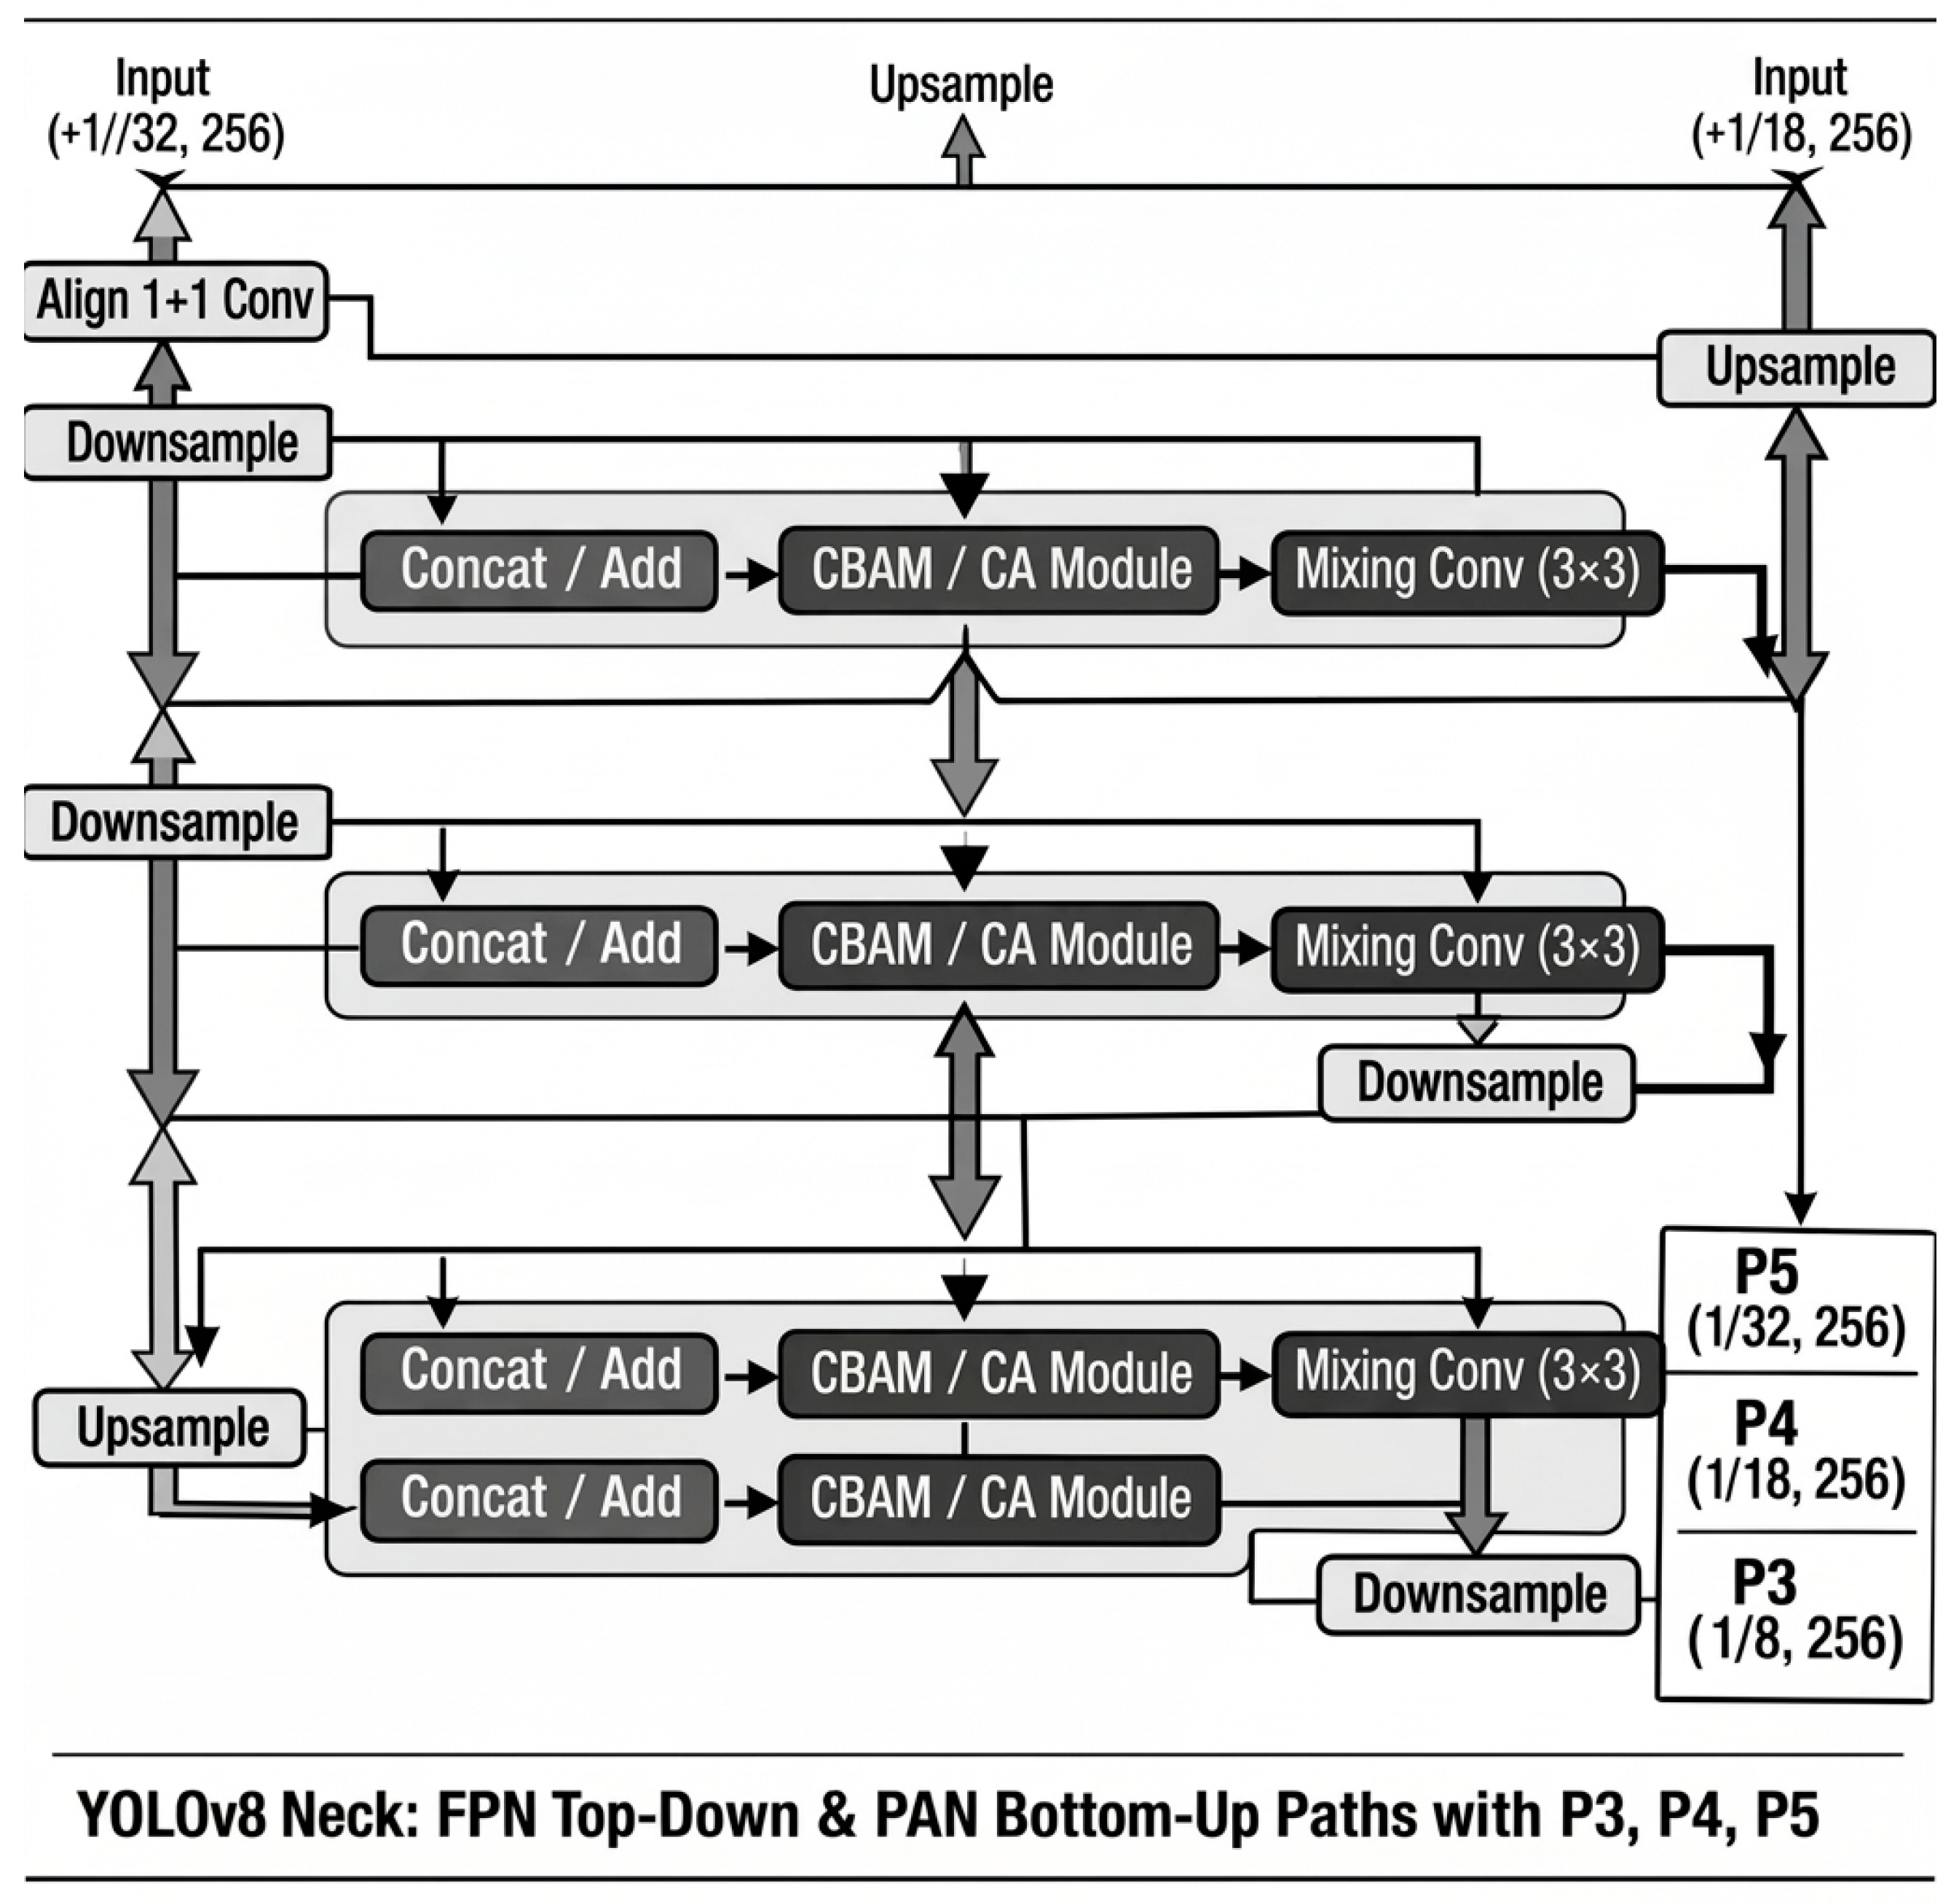
2.4.3. Neck Feature Fusion Enhancement with CA Embedding
In the YOLOv8 architecture, the neck adopts a combination of feature pyramid network and path aggregation network structures to achieve multi-scale feature interaction, as shown in
Figure 12.
Let the multi-scale outputs from the backbone be denoted as
where a larger
i indicates a stronger semantic representation with lower resolution. Feature fusion can be abstracted by a unified fusion operator defined as
where
denote the size/channel alignment (upsampling, downsampling, 1 × 1 conv, etc.),
denotes the fusion mode (Concat
or element-wise Add), and
is the post-fusion mixing mapping.
(1) FPN top-down fusion
Let
denote the multi-scale features. For
, we compute
where
upsamples to match
to match the spatial size of
.
(2) PAN bottom-up aggregation
For
, we compute
where
downsamples to match
Pi.
(3) CA embedding after each fusion
After each key fusion node (whether Concat or Add), CA is embedded to recalibrate feature weights:
CA can be represented as a separable reweighting:
where
and
are the attention weights along the height and width directions, respectively, with sigmoid outputs constrained to the interval [0, 1]. This design enhances target-related directional information and suppresses background textures during cross-scale propagation, thereby improving fusion representation under low contrast and inter-class similarity caused by dust.
2.5. Aluminum Frame Gap Height Estimation via Shadow–Gap Geometric Modeling
2.5.1. ROI Localization Guided by Active Imaging and Parallel Edge Pre-Extraction
Under controlled imaging conditions, a single-side parallel light source with an incident angle of 45 degrees illuminates the PV module, resulting in the formation of a clear shadow within the frame groove. First, the trained improved YOLOv8 model detects the shadow region and outputs its corresponding bounding box. Based on this result, the region of interest is cropped, thereby constraining subsequent edge processing to the target area, improving computational efficiency and providing an initial geometric constraint.
(1) Adaptive Canny detection: Otsu-based dynamic thresholding is adopted for Canny edge detection. Prior to edge extraction, the region of interest is smoothed using a Gaussian filter:
where
The gradient magnitude and direction are computed. Otsu’s method determines high/low thresholds Th and Tl to obtain the edge map Ecanny.
(2) Multi-scale Laplacian pyramid detection: A Laplacian operator is applied at multiple scales to enhance edge features at different resolutions:
Responses across scales are fused to obtain Elaplace.
(3) Composite operator detection: Sobel gradient intensity
G, Frei–Chen directional features
fFC, and custom logical operations are combined to generate the composite edge response:
where
is a fusion function and
is a set of empirical parameters.
This parallel processing stage produces three complementary edge response maps, including Ecanny, Elaplace, and Ecomposite, which provide stable input for subsequent confidence-aware attention fusion and serial refinement.
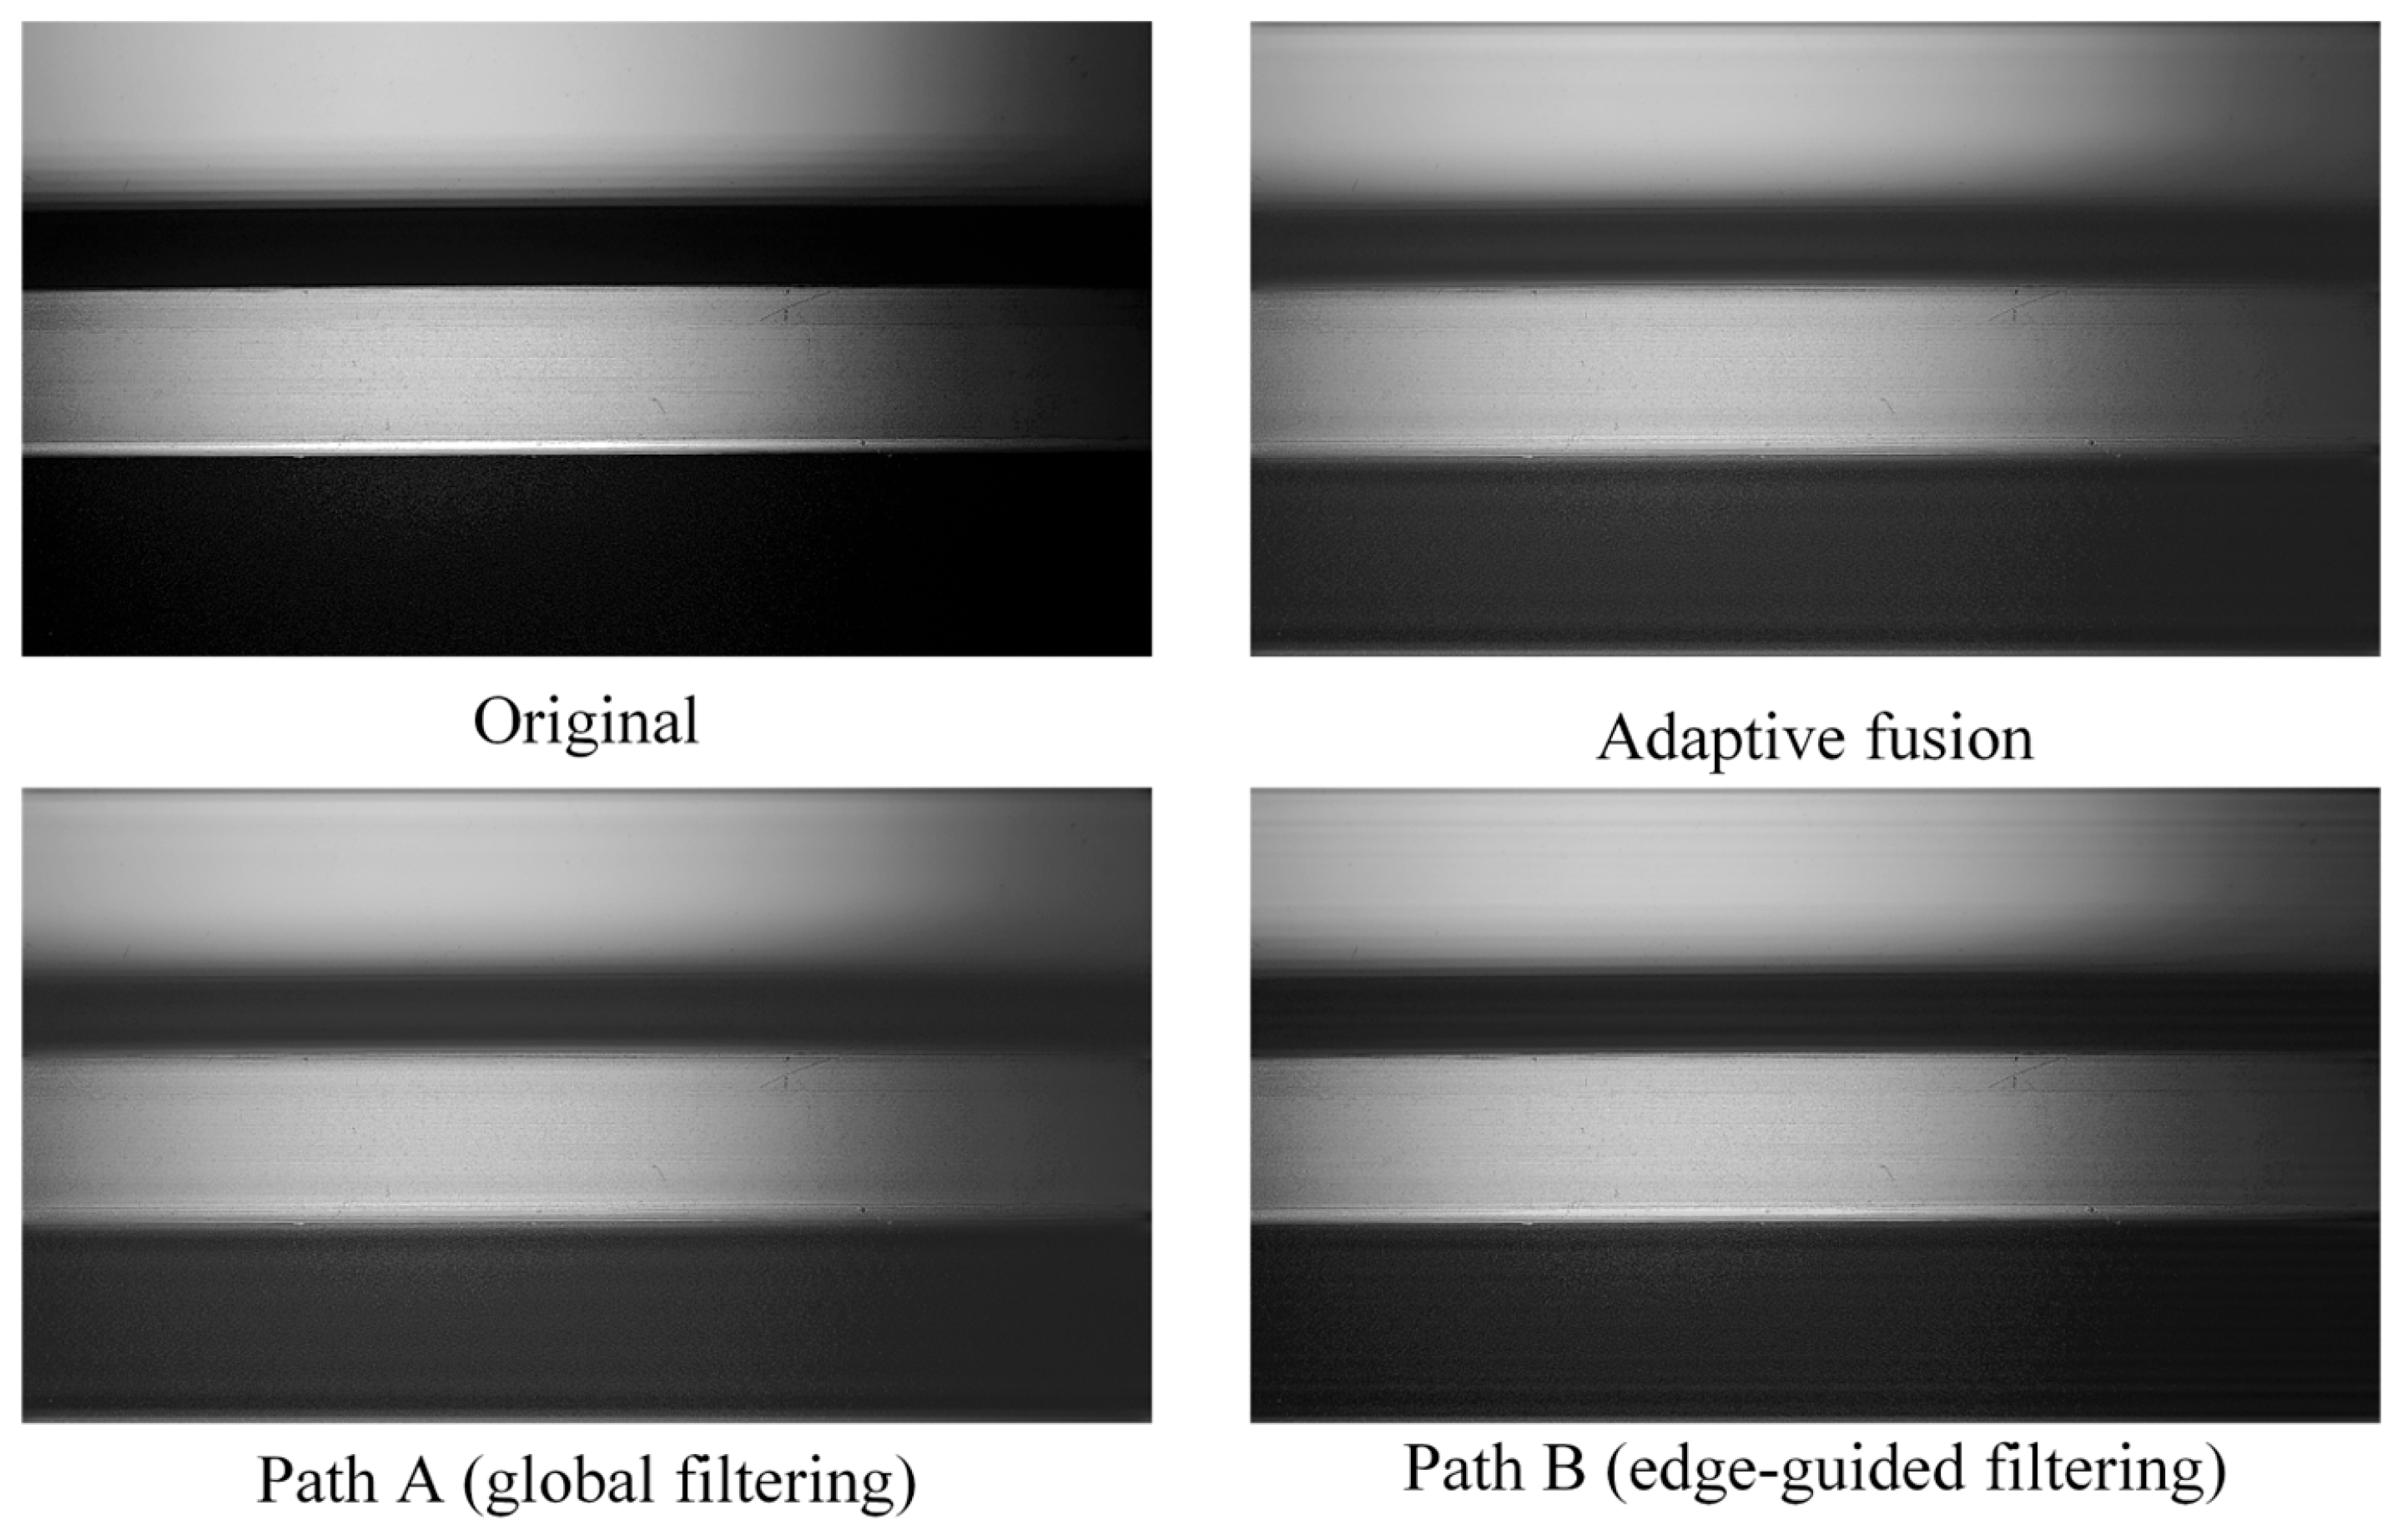
2.5.2. Confidence-Evaluated Attention Fusion
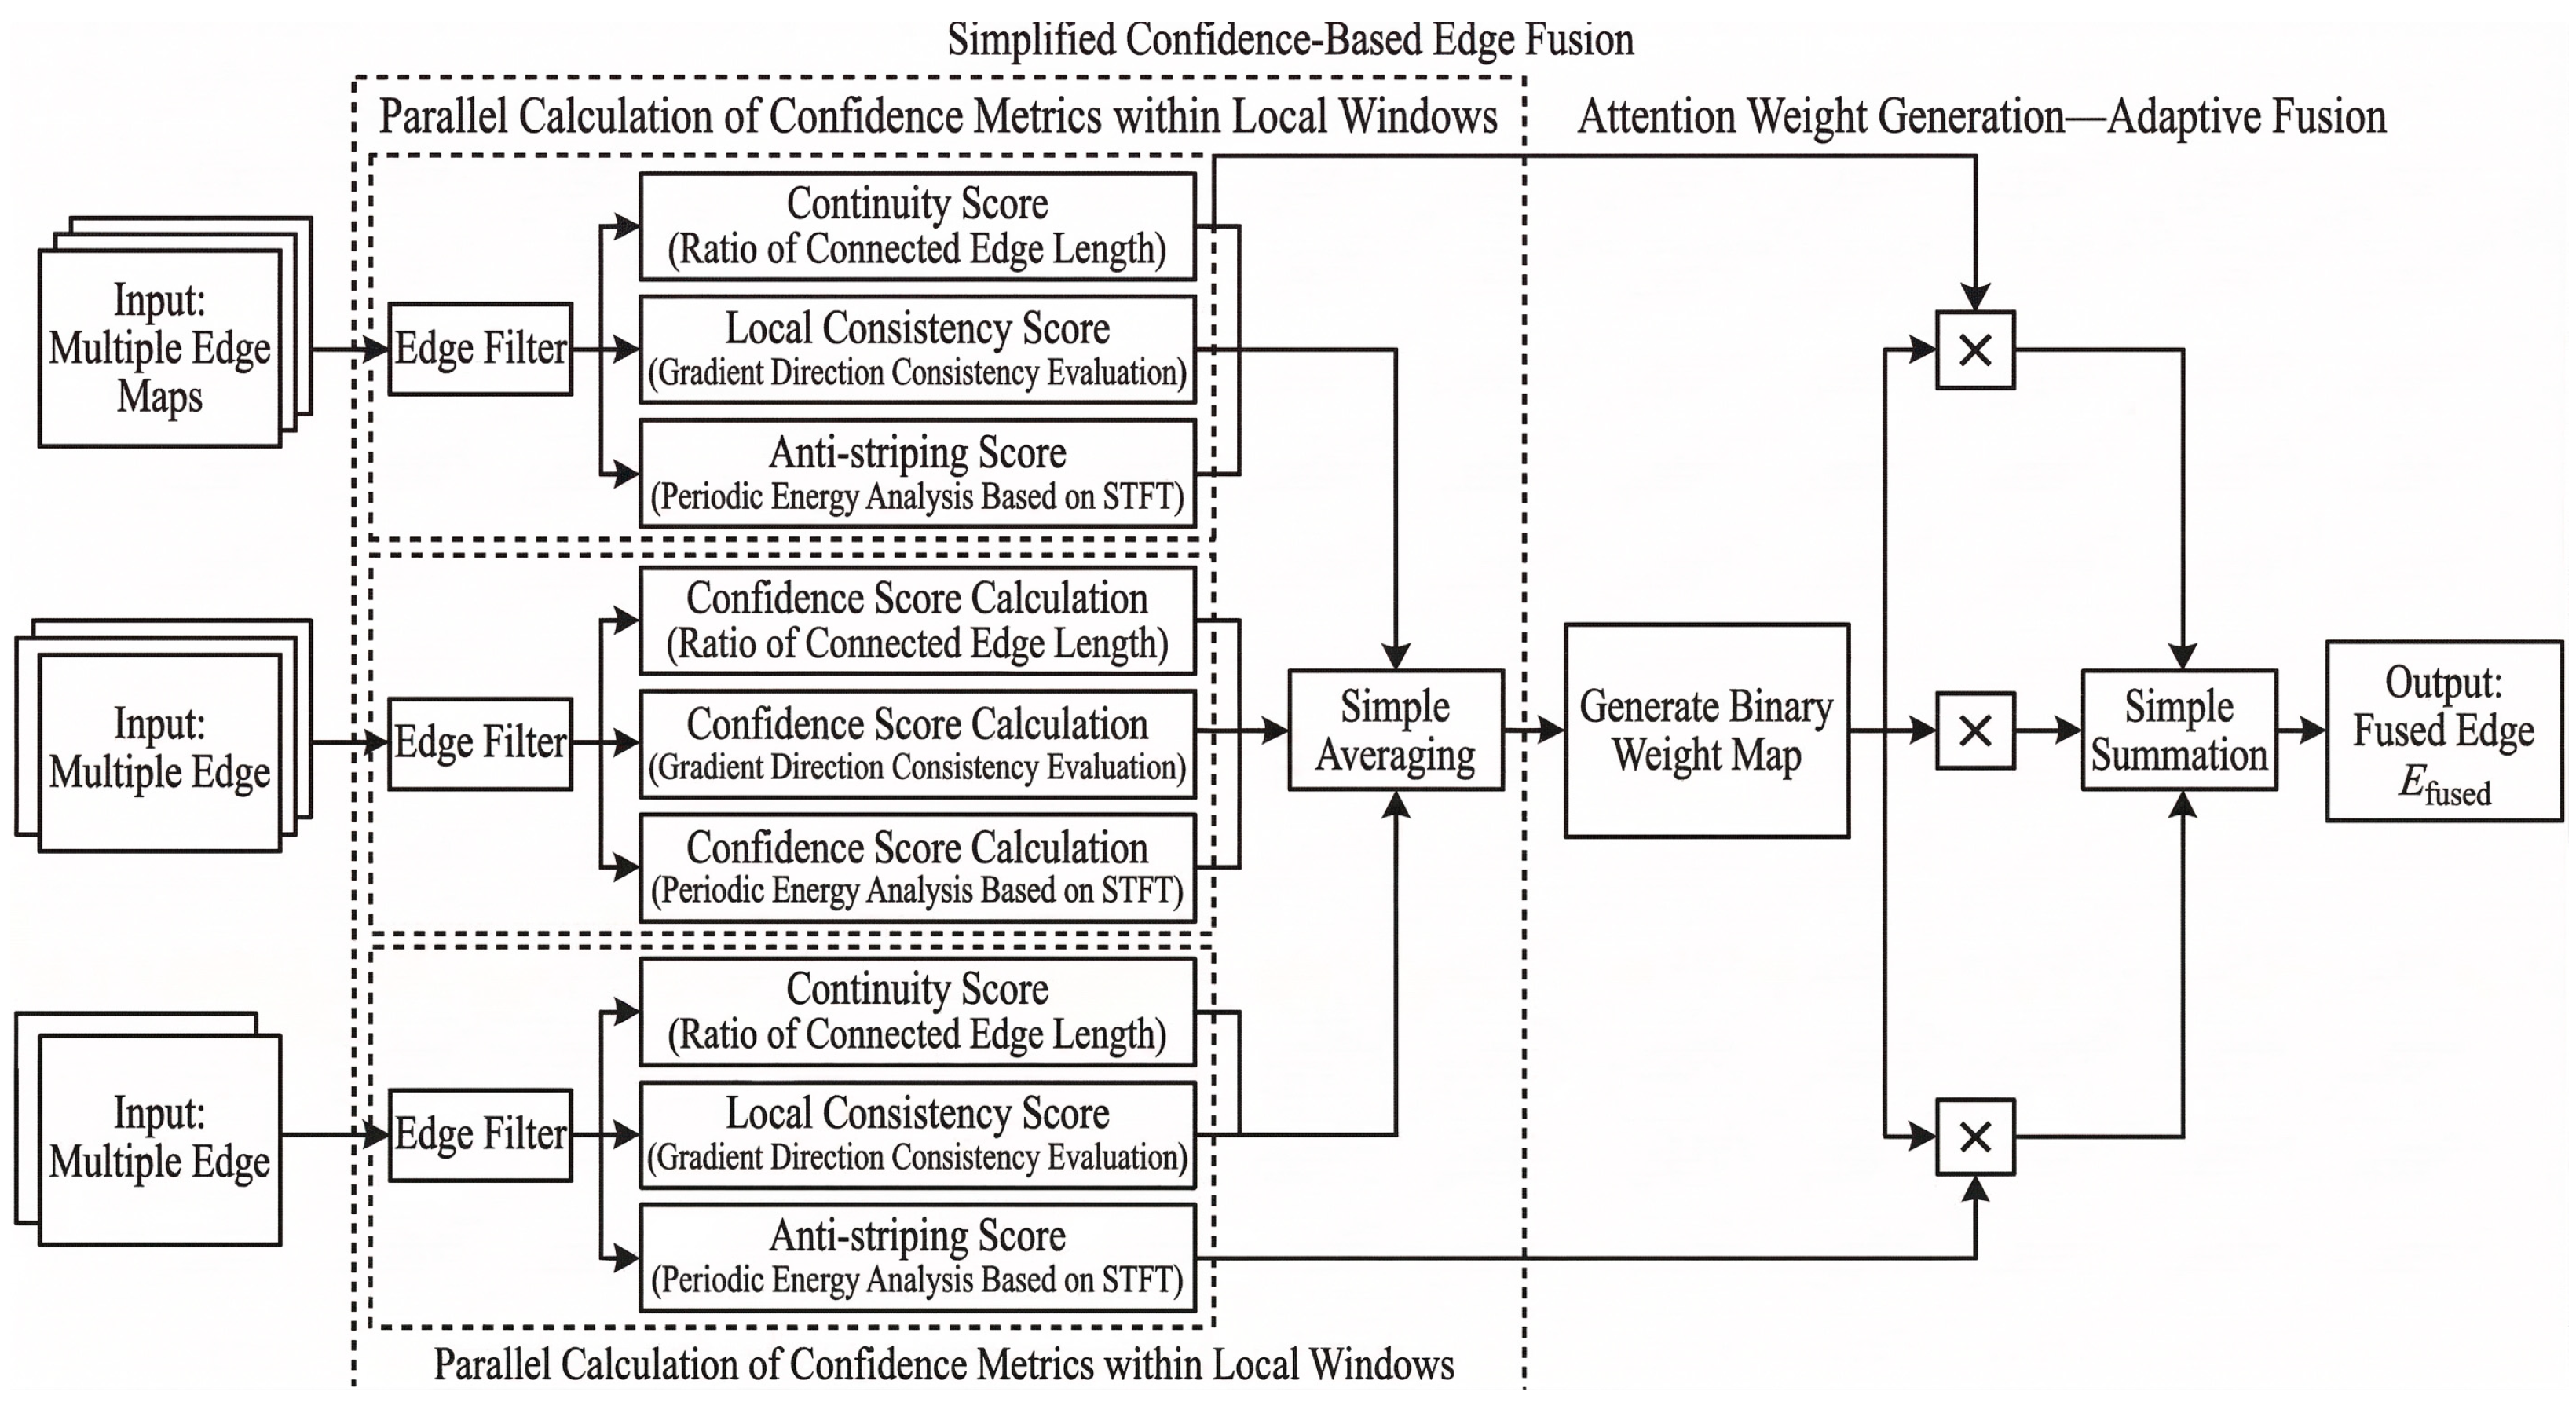
Instead of simple averaging, confidence scores for each edge map are computed within local regions, and different weights are assigned accordingly, as illustrated in
Figure 13.
For the k-th edge map, three confidence scores are computed in each local window:
The local consistency score evaluates gradient-direction consistency in the window:
Stripe-resistance score: Using short-time Fourier transform (STFT) on the local region (
x,
y), we analyze the spectral energy distribution
to determine periodic interference:
where
is the predefined stripe frequency band.
Based on these scores, a spatially adaptive attention weight map
is computed as
where
are balancing hyperparameters. The fused edge map is then obtained as
This design suppresses regions with severe stripe noise while emphasizing regions with continuous and directionally consistent edges.
2.5.3. Serial Refinement and Optimization
The fused edge map is further refined sequentially.
(1) Morphological thinning: Skeleton extraction yields a single-pixel-wide coherent curve, producing Ethin.
(2) Robust Hough fitting and outlier removal: Edge points in Ethin are fitted using weighted least squares for y = ax + b. Each point weight wi is set by gradient magnitude. Residuals are computed, and points with a residual exceeding threshold are removed to obtain accurate edge line positions.
(3) Zernike-moment subpixel localization: Within neighborhoods of retained edge points, a Zernike-moment model is employed to estimate subpixel edge positions (
xsub,
ysub). The Zernike moments
Anm are defined as
Subpixel offsets are obtained by solving the corresponding moment-based equation system.
2.5.4. Dual-Path Frequency-Domain Filtering
To specifically suppress interference stripes, a dual-path frequency-domain strategy is adopted, as shown in
Figure 14.
The filter design is based on detected interference frequency centers (
uk,
vk):
Path A (global filtering): Apply FFT to the ROI to obtain and use adaptive band-stop .
Path B (edge-guided filtering): Based on the main edge direction detected previously, a directional band-stop is designed to suppress frequency components perpendicular to .
Adaptive fusion: The purified image
Iclean is obtained as
where
is adaptively determined by the global signal-to-noise ratio (
). When stripe noise is strong (low SNR),
increases to emphasize Path A; otherwise, Path B is emphasized to preserve edge details:
2.5.5. Camera Calibration and Geometric Inversion Model
The camera intrinsic matrix and distortion coefficients are obtained in advance using Zhang’s calibration method. A calibration board with known physical length
Lreal is used to compute the pixel equivalent
Sp (mm/pixel):
where
Lpixel is the pixel length of the corresponding feature points in the image.
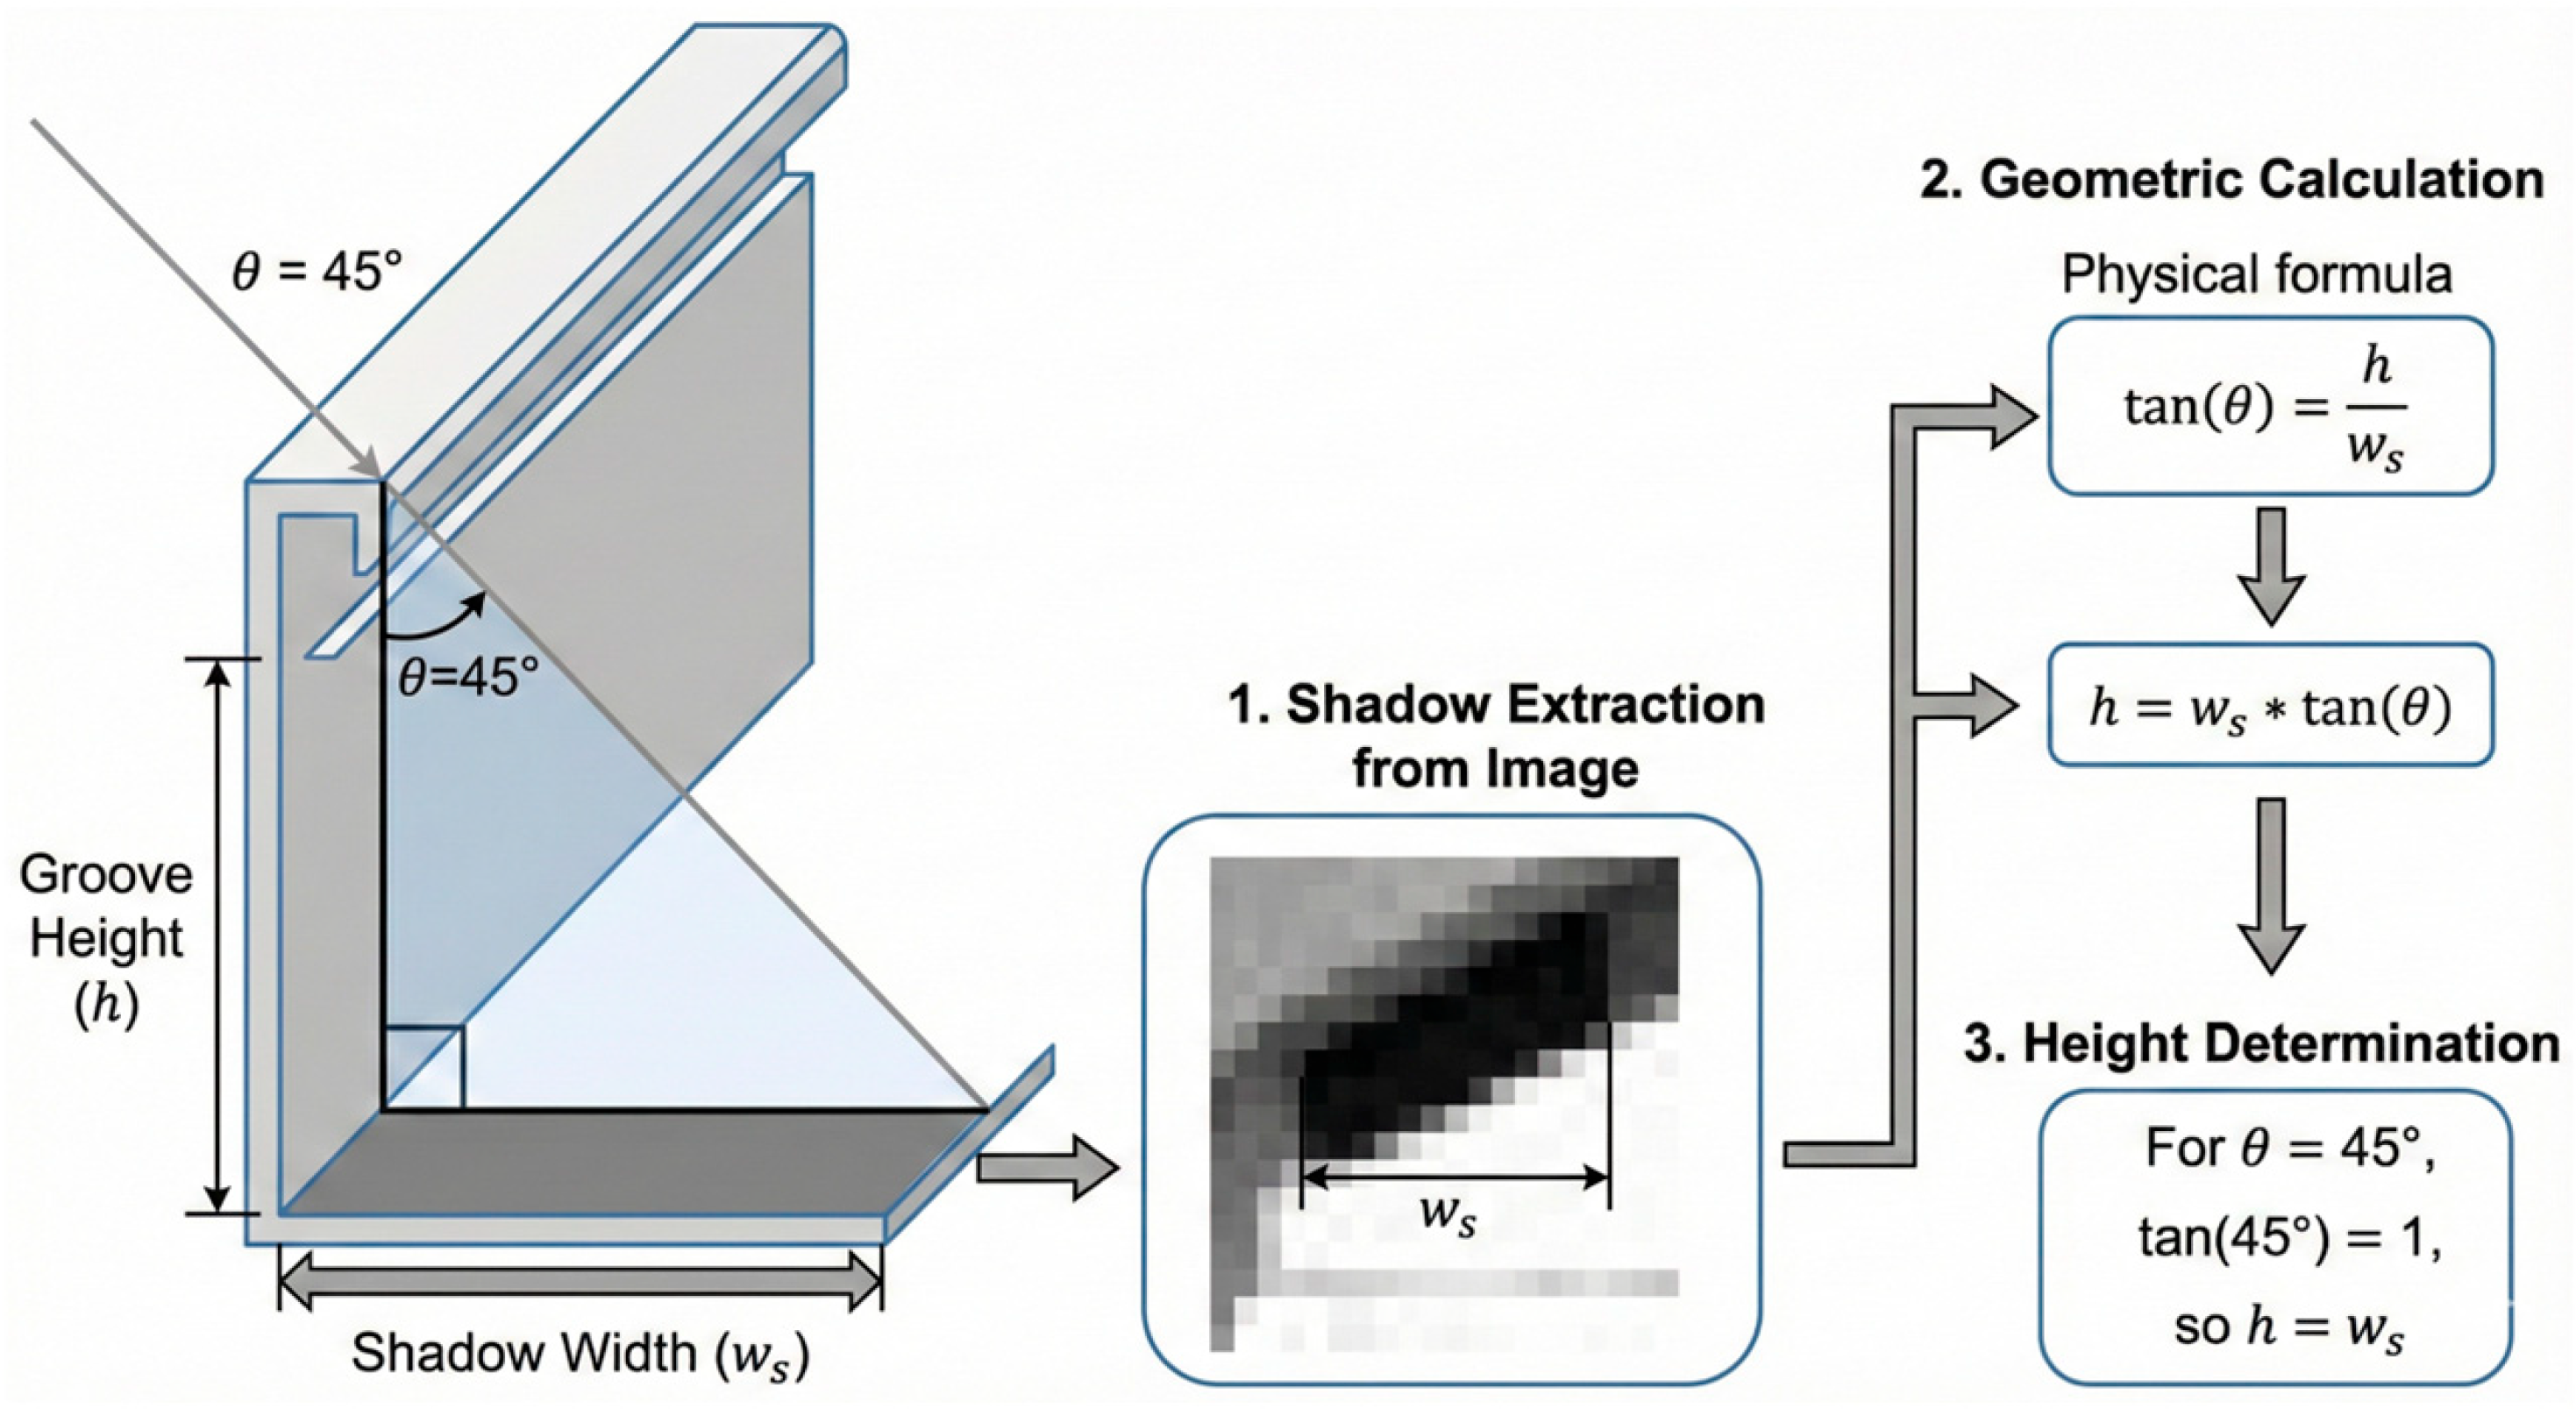
As shown in
Figure 15, under a 45-degree incident light condition, the shadow width
W and groove height
H follow a direct geometric relationship.
Let
be the angle between the incident ray and the surface normal (thus, the angle with the surface is
). By similar triangles,
The physical width
W is converted from pixel width
Wpixel measured using subpixel edges. If the subpixel x-coordinates of the left and right edges are
xsub,left and
xsub,right, respectively, then
Thus, the final height estimation is obtained as
This result provides direct and accurate feed-depth commands for the control system.
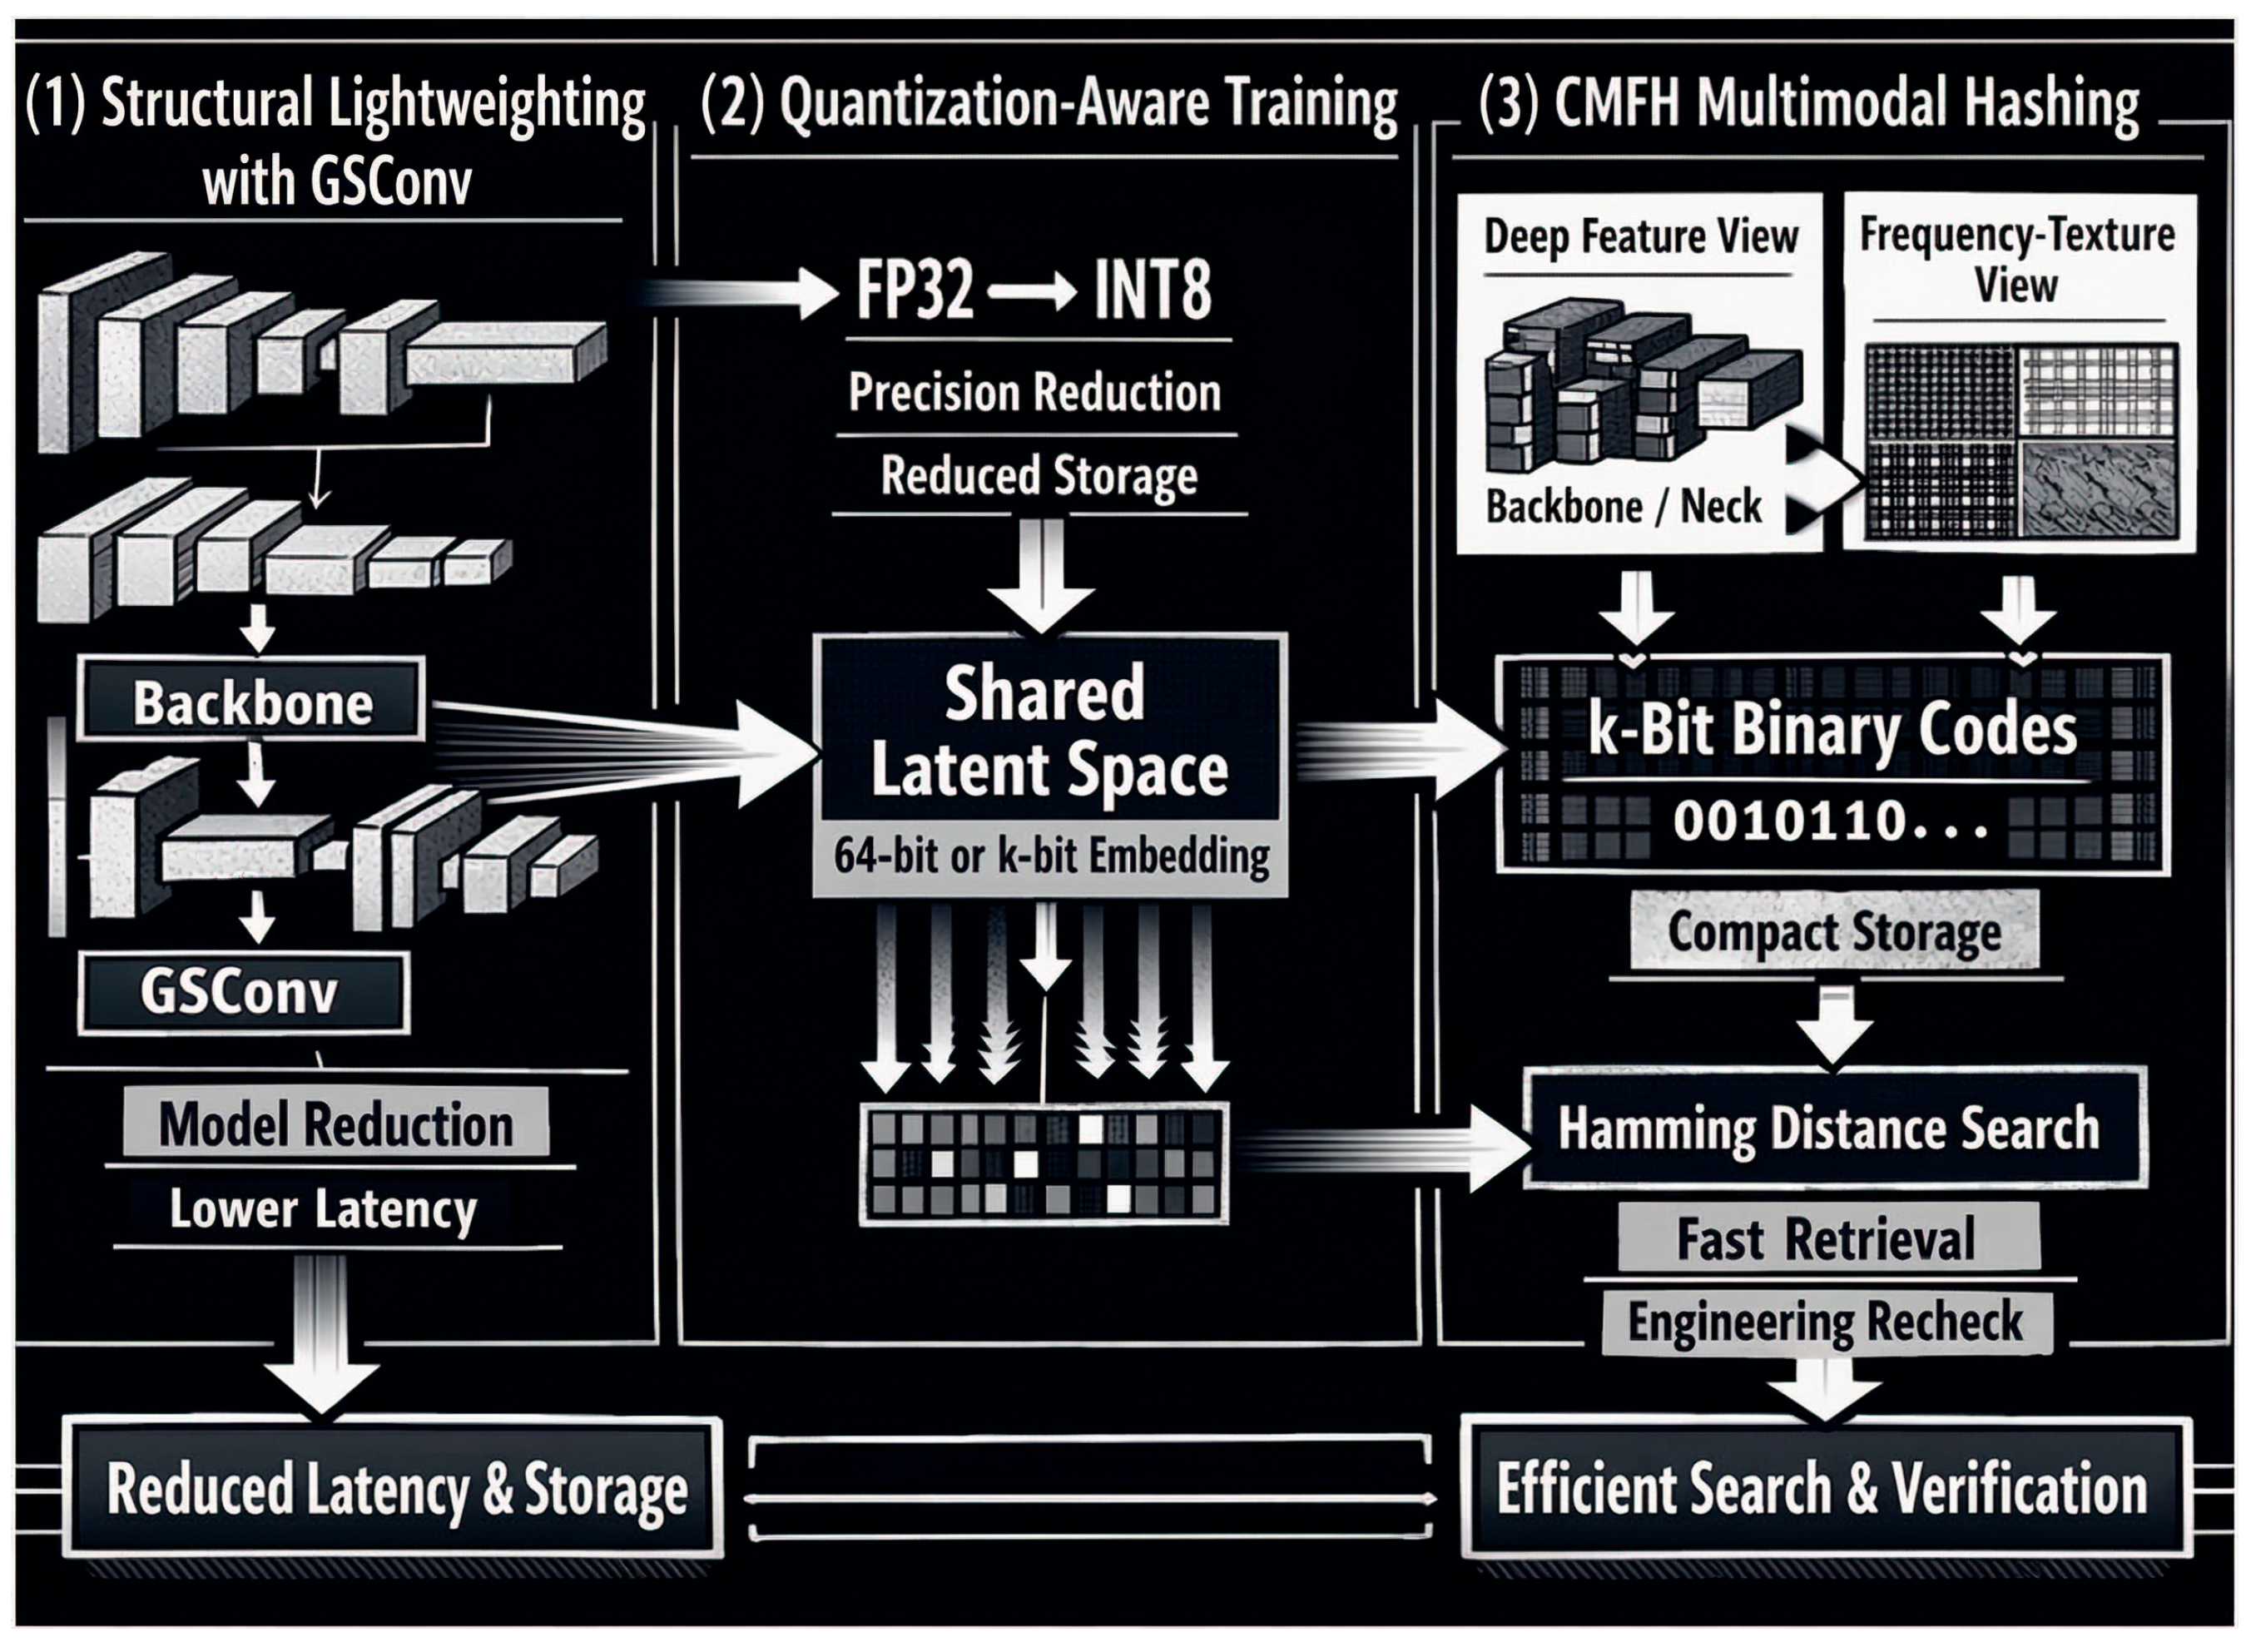
2.6. Feature Hashing and Edge Deployment Optimization (CMFH + QAT)
To enable the deployment of the trained model on resource-limited embedded devices, two optimization pipelines are employed. QAT converts 32-bit Floating Point Precision (FP32) weights to 8-bit integer (INT8) precision to reduce model storage requirements and inference latency. CMFH encodes deep features into binary hash codes, enabling compact index construction for similarity retrieval and auxiliary functions such as engineering rechecking, thereby reducing storage and retrieval overhead. The combined optimization strategy is illustrated in
Figure 16. Structural lightweighting methods, such as GSConv, reduce the number of parameters and computational complexity. Prior to feature hashing, network weights are quantized to 8-bit precision to mitigate cumulative precision loss.
From an engineering perspective, CMFH is not used to improve the detector itself, but to support compact feature indexing and fast similarity retrieval after detection. In practical deployment, this allows previously seen cases to be retrieved efficiently for engineering rechecking, similar-case backtracking, and lightweight storage on edge devices. It should be noted that clustering-based representation methods, such as FP-Conv-CM, are conceptually related to feature aggregation but are not directly equivalent to the present deployment-oriented design. FP-Conv-CM primarily emphasizes fuzzy probabilistic clustering and structure-preserving feature representation, whereas the present study focuses on lightweight detection, geometric metrology, and edge deployment under dust-degraded industrial scenes. In this framework, GSConv is used to reduce backbone computation, Coordinate Attention improves directional feature discrimination during multi-scale fusion, and CMFH is employed only as a compact indexing strategy for retrieval and engineering rechecking. Therefore, FP-Conv-CM is treated here as a related representation-learning reference rather than a one-to-one substitute for the proposed downsampling and deployment pipeline. A clustering-based baseline inspired by FP-Conv-CM is further introduced in the experimental section to provide an empirical comparison under the same detection framework.
2.6.1. Collaborative Semantic Subspace Learning
To reduce feature storage and similarity retrieval costs on edge devices while maintaining representation consistency across heterogeneous feature sources, CMFH is employed to jointly model two-view representations of the same image instance. Assume that there are
n samples, each associated with two observable views.
View 1 (deep view) is extracted from the intermediate backbone/neck features of the improved YOLOv8, followed by global average pooling and linear dimensionality reduction to a d1-dimensional vector. View 2 (frequency–texture view) is a low-dimensional frequency/texture statistical descriptor computed from the same input image. Specifically, DWT–FFT enhancement is applied to emphasize low-frequency structural information, and low-dimensional statistical features are extracted, including:
(1) Low-frequency subband energy ratios, including LL, LH, HL, and HH;
(2) The radial energy distribution of the magnitude spectrum, represented as energy histograms over multiple concentric rings;
(3) Texture statistics, including mean, variance, skewness, kurtosis, or gray-level co-occurrence matrix contrast, energy, and homogeneity.
These statistical features are concatenated to form a d2-dimensional feature vector, allowing this view to be computed directly from a single image during deployment.
In offline training, CMFH learns a shared latent variable
and view-specific subspace bases
and
, enforcing cross-view consistency in a unified latent space:
The objective is
with variable dimensions
where
is the Frobenius norm and
is a regularization coefficient. Alternating minimization is employed to optimize the objective function and obtain the corresponding projection and regression parameters, as well as the shared representation used for online hashing and similarity retrieval.
2.6.2. Compact Binary Code Generation and Fast Retrieval
To enable fast retrieval and low storage overhead on edge devices, the offline learned latent representations are mapped to k-bit binary codes, while new samples are encoded online using Hamming distance matching.
(1) Offline database construction
Step 1: Extract two-view features for each sample.
Step 2: Learn shared and generate database codes .
Step 3: Store codes in an index structure (bit-bucket or bitwise storage) for fast querying.
(2) Online querying
For an input image, extract deep-view feature
(optionally compute
). In engineering practice, a linear hash function is used for View 1:
where
W1 and
b1 are fitted offline. The similarity between query code and database codes uses the Hamming distance:
For
codes, this is equivalent to counting unequal bits and can be efficiently implemented using bitwise operations (XOR + POPCOUNT). During online operation, only the query binary code
b is computed, and the Top-
K most similar samples are retrieved for case backtracking, similar-defect retrieval, and false-detection rechecking. For clarity, the main symbols used in
Section 2.3,
Section 2.4,
Section 2.5 and
Section 2.6 are summarized in
Appendix A (
Table A1).
4. Results
4.1. Object Detection Performance Comparison
On the test set containing 301 images, comparisons were made between the improved YOLOv8 model and multiple baseline detection models. The quantitative results are summarized in
Table 1, and the per-class performance of the proposed method is further reported in
Table 2. Frames Per Second (FPS) and inference time were measured on the same hardware, with an input size of 640 × 640 and batch = 1, including Non-Maximum Suppression (NMS).
The proposed method achieves 3.5–4.8 percentage point improvements in precision, recall, and mAP for junction boxes and backsheet labels, and increases the detection speed to 52 FPS, outperforming the baseline YOLOv8, Faster R-CNN, SSD, and YOLOv7. Unless otherwise stated, the reported detection values in this section denote the mean over repeated runs, and the corresponding 95% confidence intervals are provided to reflect run-to-run variability.
4.2. Ablation Study
To quantify the contribution of each improvement module, ablation experiments were conducted, as shown in
Table 3.
Introducing GSConv increases mAP by 1.7 percent. Replacing C2f with C3CA yields an additional improvement of 1.8 percent, while embedding CA further increases mAP by 1.2 percent. Frequency-domain enhancement contributes a cumulative improvement of 4.9 percent, and transfer learning increases mAP to 93.3 percent. The number of parameters is reduced from 25.5 million to 22.5 million, and the inference time decreases from 22.0 ms to 20.8 ms. QAT further compresses the model size to 20 MB and reduces the inference time to 18.2 ms. Overall, mAP improves by 5.08 percent, the parameter count decreases by 11.8 percent, and the inference time is reduced by 17 percent.
4.3. Optimizer Comparison and Convergence Analysis
To examine whether the observed performance depends strongly on the optimization algorithm, comparative experiments were conducted using SGD, Adam, RMSProp, and fractional-order variants under the same architecture, data split, and training schedule. The comparison focuses on final detection performance, convergence behavior, and observed training stability. As summarized in
Table 4, Adam achieves the best balance between convergence stability and final detection accuracy under the present small-sample setting, whereas SGD converges more slowly and RMSProp shows slightly larger fluctuations during training. The fractional-order variants yield a competitive performance, but their overall advantage over Adam is limited in the current task. These results support the use of Adam as the default optimizer in this study.
4.4. Comparison with Clustering-Based Feature Aggregation Baseline
To further examine whether the proposed lightweight feature extraction and fusion design offer advantages over clustering-based aggregation strategies, an additional baseline inspired by FP-Conv-CM was constructed under the same YOLOv8 framework. In this baseline, the standard feature aggregation component was replaced by a fuzzy clustering-based representation module while keeping the remaining training and evaluation settings unchanged. The comparison focuses on detection accuracy, computational cost, dust-robustness performance, and edge-deployment suitability. As summarized in
Table 5, the clustering-based baseline improves feature aggregation to some extent compared with the original YOLOv8, but the proposed method remains superior in terms of the combined requirements of dust-degraded detection accuracy, geometric compatibility, and real-time deployment efficiency.
4.5. Model Visualization and Interpretability
To verify the effectiveness of the proposed strategies under dust occlusion and inter-class similarity conditions, intermediate feature responses were visualized and compared with those of the baseline YOLOv8 model, as shown in
Figure 17. In the baseline model, feature activations tend to diffuse into background regions under low-contrast and texture-degraded conditions, resulting in insufficient discrimination between visually similar targets. With the introduction of frequency-domain fusion and attention guidance, feature responses become more concentrated on target structures, while background interference is effectively suppressed. This observation indicates an enhanced denoising capability and improved spatial focus, which is consistent with the intended design of frequency enhancement and CA-based positional encoding. A further comparison of detection head responses shows a more continuous boundary activation and improved compensation under partial occlusion, thereby reducing false detections and missed targets.
4.6. Geometric Measurement Accuracy
The ground-truth gap height of the aluminum frame was obtained through manual measurement using a precision caliper. The caliper used for manual reference measurement had a resolution of 0.01 mm. For each sample, the manually measured physical gap height of the corresponding aluminum frame groove was used as the reference and compared with the prediction of the proposed method. In this study, a prediction was counted as correct when the absolute error was smaller than 0.5 mm. This threshold was adopted because the target application is dismantling-oriented inspection rather than ultra-precision metrology, and sub-millimeter deviations within this range do not affect the subsequent positioning and cutting decision in practical recycling operations. The geometric measurement evaluation was performed on a valid subset of 300 images derived from the same 301-image held-out test split used for detection evaluation. One test image was excluded from metrology evaluation because it did not provide a clearly measurable aluminum frame groove region for reliable manual reference acquisition. Based on this criterion, the proposed method achieves an accuracy of 93.0% with a mean error of 0.45 mm, outperforming conventional approaches, including the Canny and Hough method, with an 86.0% accuracy and a mean error of 1.1 mm, the Laplacian pyramid method, with an 88.5% accuracy and a mean error of 0.8 mm, and YOLO Segmentation [
25], with a 91.0% accuracy and a mean error of 0.6 mm. The detailed comparison of geometric measurement performance among the different methods is summarized in
Table 6.
4.7. Edge Deployment and Lightweighting Evaluation
Two categories of lightweighting metrics are reported, including the weight file size and feature database storage and retrieval overhead. Using FP32 weights as the baseline, CMFH compresses features into binary codes, reducing storage requirements by 79.7 percent and improving end-to-end latency by 14.5 percent [
34]. With quantization-aware training-exported INT8 weights, the model size is reduced to 20.0 MB, the inference speed increases by 17.3 percent, and the associated accuracy loss is controlled within 0.9 percentage points. The detailed results are summarized in
Table 7.
4.8. Robustness Analysis
To evaluate the robustness of the geometric measurement module, Gaussian noise and illumination perturbations were introduced, and the resulting changes in measurement accuracy were analyzed. With a baseline accuracy of 93.0%, the addition of Gaussian noise with variance ranging from 0 to 0.05 leads to a gradual decrease in accuracy to a minimum value of 90.5 percent. When illumination intensity fluctuates within plus or minus 30 percent, the accuracy variation remains within 2.3 percentage points. These results indicate stable performance under noise and illumination variations, while the detection performance under different dust severity levels is further summarized in
Table 8.
To further verify the dust erosion-aware capability of the proposed method, the same 301-image held-out detection test set used in
Section 4.1 was stratified according to the four dust severity levels defined in
Section 2.1.
Table 8 reports both the number of test images in each dust bin and the corresponding mAP@0.5 values of the original YOLOv8 model and the proposed method. The results show that the proposed method consistently outperforms the baseline across all dust levels, and the performance gain becomes more evident as the dust severity increases, indicating a stronger robustness under moderate and severe dust interference.
Specifically, the proposed method improves mAP@0.5 by 3.90, 4.50, 5.10, and 6.10 percentage points for Level-0, Level-1, Level-2, and Level-3, respectively. This trend indicates that the proposed improvements are particularly effective under moderate and severe dust interference, which is consistent with the design objective of enhancing robustness in degraded end-of-life PV module scenes.
4.9. Statistical Significance Analysis
To determine whether the observed improvement over the baseline YOLOv8 model is statistically meaningful, repeated-run results were further analyzed using formal statistical tests. For the comparison between the proposed method and the baseline YOLOv8 model, a paired
t-test was applied to mAP@0.5 across repeated runs. For the multi-optimizer comparison in
Section 4.3, one-way ANOVA was used to assess whether the differences in final detection accuracy among the candidate optimizers were statistically significant. As summarized in
Table 9, the paired comparison between the proposed method and the baseline YOLOv8 yielded a statistically significant improvement in mAP@0.5 (t = 11.84,
p = 0.0013), while the optimizer comparison also showed significant differences among the candidate optimizers (F = 5.27,
p = 0.012). These results indicate that the observed gains of the proposed method are statistically significant rather than random fluctuations.
4.10. Transfer Learning Analysis
By varying initialization strategies while maintaining the same network architecture and training hyperparameters, the contribution of pretraining is evaluated, as reported in
Table 10. Without pretraining, the mAP at 0.5 is 93.3 percent. With ImageNet-based pretraining initialization, the mAP at 0.5 increases to 94.0 percent, corresponding to an improvement of 0.7 percentage points. The error rate is defined as
e = 100 − mAP@0.5 and decreases from 6.7% to 6.0%, corresponding to a relative error reduction.
5. Discussion and Conclusions
This study establishes an integrated visual solution for the automated dismantling and recycling for end-of-life PV modules, combining frequency-domain enhancement, improved YOLOv8-based detection, shadow–gap geometric modeling measurement, and lightweight edge deployment. The experimental results demonstrate that junction box detection precision reaches 94.5 percent and backsheet label detection precision reaches 91.5 percent, with a stable performance under dusty conditions. The aluminum frame gap height measurement achieves an accuracy of 93.0%, with a mean error of 0.45 mm. With the improved network architecture, mAP increases to 93.38 percent, the parameter count is reduced by 11.8 percent, and the inference speed is improved by 17 percent. After INT8 quantization, the model weight size is compressed to 20 MB, reducing the storage requirements by 80 percent. The above results confirm that the proposed framework effectively integrates dust-aware detection, geometric metrology, and lightweight deployment for end-of-life PV module dismantling.
First, although comparative experiments with SGD, RMSProp, and fractional-order variants were included in this study, the optimizer benchmark was still limited to a small set of representative candidates under a fixed training schedule. Broader evaluation under different learning-rate policies and larger datasets remains necessary for a more comprehensive conclusion. Second, although a clustering-based baseline inspired by FP-Conv-CM was introduced for comparison, the present benchmark remains limited to a representative implementation under the current YOLOv8 framework. Broader comparisons with additional clustering-based representation-learning strategies remain necessary for a more comprehensive conclusion. Third, although repeated-run confidence intervals and statistical significance tests were introduced for the main comparisons in this study, broader validation across all sub-experiments and under additional training settings remains necessary for a more comprehensive statistical assessment. These issues do not affect the engineering validity of the proposed pipeline under the current evaluation protocol, but they remain important directions for future methodological extension.