Article

A Novel Method to Investigate the Effect of Normalization Techniques on Fuzzy Multi-Criteria Decision-Making in Web Service Quality Assessments


by
Diana Kalibatienė
1,* and
Rūta Simanavičienė
2
1
Department of Information Systems, Faculty of Fundamental Sciences, Vilnius Gediminas Technical University, Saulėtekio al. 11, LT-10223 Vilnius, Lithuania
2
Department of Mathematical Statistics, Faculty of Fundamental Sciences, Vilnius Gediminas Technical University, Saulėtekio av. 11, LT-10223 Vilnius, Lithuania
*
Author to whom correspondence should be addressed.
Appl. Sci. 2026, 16(6), 2940; https://doi.org/10.3390/app16062940
Submission received: 4 December 2025 / Revised: 5 February 2026 / Accepted: 16 March 2026 / Published: 18 March 2026
(This article belongs to the Special Issue Applications of Fuzzy Systems and Fuzzy Decision Making, 2nd Edition)

Abstract

Fuzzy multi-criteria decision-making (MCDM) methods remain popular for addressing decision-making problems involving uncertainty and explainability. However, decisions are usually made using data with different dimensions or even modalities. Therefore, existing MCDM methods incorporate various normalization techniques in order to transform attribute values into dimensionless quantities, ensuring the robustness and reliability of the decision-making results. Nevertheless, these normalization techniques may affect the ranking of alternatives. This study therefore proposes a novel method to investigate the effect of various normalization techniques on fuzzy MCDM methods. The study introduces a novel method for creating a fuzzy decision-making matrix using Tukey’s fences method, enabling the evaluation of alternatives using attributes under uncertain conditions. This method was evaluated in the context of web service quality assessments involving multi-dimensional and random variable attributes. The study demonstrated that Vector and Linear normalization techniques yield similar alternative rankings when using fuzzy MCDM methods, whereas rankings differ when Non-linear normalization techniques are applied. We believe that the current study will allow researchers and practitioners to address various practical uncertain decision-making problems with multi-dimensional attributes, thus promoting the digital transformation of complex, real-world decision-making issues.

1. Introduction

Despite the significant development and growing use of machine learning (ML) techniques, multi-criteria decision-making (MCDM) methods remain popular and widely adopted due to their provided structured, transparent, and justifiable decisions based on the ranking of alternatives. However, before applying ML or MCDM methods, the data used for these processes must be normalized in order to ensure the robustness and reliability of the decision-making results [1]. Different normalization techniques, which involve the transformation of attributes in a common range, have been proposed in various MCDM methods. A number of studies proved that various normalization techniques may affect the ranking of alternatives [2,3]. Therefore, it is important to investigate the effect of different normalization techniques for MCDM methods, or even to include MCDM methods that use different normalization techniques, to increase the clarity and robustness of the final decision.
However, the works found on the analyzed topic of normalization do not provide a detailed and comprehensive investigation of the effect of the normalization techniques on fuzzy MCDM methods. The reviewed literature reveals a lack of adequate studies focused on analyzing the impact of normalization in fuzzy MCDM cases [4]. For example, the authors of the studies [1,5,6] analyze the effect of normalization on the ranking of alternatives in the case of crisp data for MCDM methods. The authors of [4] investigated the fuzzy TOPSIS and fuzzy VIKOR methods in conjunction with different triangular fuzzy number normalization rules.
In order to deal with uncertainty, which can be due to ambiguity, stochasticity or partial information [7], in real decision problems, MCDM methods are extended by fuzzy set theory, which was proposed by Zadeh [8]. Fuzzy theory is often recommended for expressing the uncertainty associated with the information provided by decision-makers in multi-criteria decision aids [9]. Thanks to the contributions of other researchers, different fuzzy types and extensions proposed, like [10], allow decision makers to consider a wide range of uncertain information when formulating decision-making problems.
Fuzzy MCDM methods are widely applied in various fields, as demonstrated in [11]. A review of scientific articles by [12] highlighted the applications of fuzzy MCDM models, especially integrated fuzzy AHP and fuzzy TOPSIS, in the field of civil engineering. The authors of [13] proposed a novel MCDM method called Soft Clusters-Rectangles to address uncertainty and applied it to autonomous vehicle route selection problems. In [14], the authors proposed a new decision support model based on intuitionistic fuzzy group decision-making for the reconstruction priority ranking of bridges, integrating Integer Linear Programming and Ant Colony Optimization. Several studies in the literature apply fuzzy MCDM methods to solve medical problems, like selecting a medical waste disposal technology [15], evaluating and benchmarking trustworthy artificial intelligence (AI) applications in healthcare [16]. The authors of [17] emphasize a wide usage of MCDM methods to solve energy selection problems, like applying fuzzy COPRAS and fuzzy MULTIMOORA methods to rank the alternatives of renewable energy sources. In [18], the authors assessed cybersecurity measures for smart grids by applying a picture fuzzy SWARA–CODAS approach. In [19], an optimal segmentation algorithm for satellite images is selected using an intuitionistic fuzzy PROMETHEE method. The authors of [20] used an interval-valued neutrosophic VIKOR method together with AHP to assess scalp-detection algorithms. The authors of [21] applied fuzzy SWARA and fuzzy MOORA for evaluating banks according to customer preferences. In [22], the authors devised an adaptive utility ranking algorithm for evaluating blockchain-enabled microfinance. The authors of [23] proposed multi-criteria decision-making with the T-Spherical Hesitant Fuzzy Rough Sets to evaluate production efficiency, downtime, cost and resource usage in computer-aided production environments. In [24], the authors developed a rule-based decision support mechanism using fuzzy set theory and the Analytic Hierarchy Process (AHP) to evaluate the influential factors in IoT. The authors of [25] present a hybrid DEA–Fuzzy COPRAS approach for assessing the renewable energy of wind farms in Turkey.
Consequently, the main aim of this paper is to deepen research on the impact of the effect of normalization techniques for fuzzy MCDM on the further explainability of alternatives ranking. The novelty and contribution of this paper are as follows:
(1)
A novel method was proposed to evaluate the effect of normalization techniques on fuzzy multi-criteria decision-making.
(2)
A proposal was presented on how to select alternatives and attributes from a large real-world dataset.
(3)
An approach was proposed for pre-processing large datasets and forming a decision-making matrix (DMM) in cases of uncertainty where the attributes are stochastic variables with a continuous probability distribution, based on the interquartile range.
(4)
Formulas for normalizing fuzzy triangular numbers based on Linear Jüttler’s–Körth’s, Non-Linear Peldschus, and Logarithmic normalization techniques, for cost and benefit attributes are proposed.
(5)
The proposed method was applied to selected fuzzy MCDM methods (i.e., fuzzy WSM, fuzzy TOPSIS, and fuzzy VIKOR) with selected non-latent normalization techniques.
(6)
The correlation and clustering analysis was performed on the research results to evaluate the effect of normalization techniques on the ranking of alternatives in the context of fuzzy MCDM methods.
Summing up, our research addresses the lack of knowledge about the effect of normalization techniques in fuzzy MCDM methods. This study aims to help researchers and practitioners to become familiar with the influence of normalization techniques in fuzzy MCDM methods, such as fuzzy WSM, fuzzy TOPSIS, and fuzzy VIKOR. Furthermore, it opens avenues for further research on the impact of various normalization techniques in fuzzy MCDM methods.
It is important to note that normalization techniques are applied not only in MCDM methods, but also in other areas where values are transformed into dimensionless quantities, such as fuzzy inference systems [26], data pre-processing for microarray gene selection [27], fuzzy clustering [28], etc. In this paper, normalization techniques are analyzed only in the case of MCDM methods.
The remainder of the paper is structured as follows. Section 2 describes the preliminaries. Section 3 presents the related work. Section 4 describes the analyzed normalization techniques and the proposed research method. Section 5 presents the research results. Section 6 discusses the results. Section 7 concludes the paper.

2. Preliminaries

Fuzzification is defined as a process of transforming a crisp set to a fuzzy set by assigning a membership value to a fuzzy variable using a particular membership function (MF). It can be defined as follows:
Definition 1. 
Let U be the universe of discourse (UoD) containing elements u. Then a set of ordered pairs (see Equation (1)):
A = { u ,   μ A u | u U ,   μ A :   U 0 ; 1 } ,
where a fuzzy set A in a universe of discourse U and,  μ A u  is the MF of u in A [8,29,30,31].
The value µA(u) represents the grade of membership of u in A and is interpreted as the membership degree to which u belongs to A. So, the closer the value µA(u) is to 1, the more u belongs to A.
Definition 2. 
The fuzzy number is a convex set onsuch that: (1) there exists u μ A u = 1 ; (2)  μ A u  is piecewise continuous; (3)  S u p p A = a , b ,  a b , where neither a nor b is permitted to be infinite [29,30,31].
In the literature, we can find different MF shapes [32,33]. The most commonly used types of MF shapes are triangular, trapezoidal, Gaussian and histograms, since they can be easily implemented in various systems and require a reasonable amount of computation time. Therefore, in this research, we have used a triangular MF (Equation (2)) [33,34].
A fuzzy triangular number is a triplet A ˜ = a 1 , a 2 , a 3 with a membership function μ T r i a n g u defined as follows in Equation (2):
μ T r i a n g u = 0 , i f   u < a 1 , a 3 u , u a 1 a 2 a 1 , i f   a 1 u < a 2 , a 3 u a 3 a 2 , i f   a 2 u < a 3 .
Let A ˜ = a 1 , a 2 , a 3 and B ˜ = b 1 , b 2 , b 3 be two non-negative fuzzy triangular numbers and k > 0 . Then the arithmetic operations for those two fuzzy triangular numbers are defined as follows [35,36,37,38] in Table 1.
The fuzzy numbers are ranked using utility values U M i , U G i and   U T i of each generalized fuzzy number A ˜ i ,   i = 1 , n ¯ [40].
Let the fuzzy number A ˜ i = a 1 i , a 2 i ,   a 3 i ,   i = 1 , n ¯ has MF ( f A i u ) in a general triangular form as follows in Equation (14):
f A i u = u a 1 i a 2 i a 1 i , i f   a 1 i u < a 2 i , a 3 i u a 3 i a 2 i , i f     a 2 i u < a 3 i , 0 , i f   u < a 1 i , u a 3 i .
Definition 3. 
Suppose there are n generalized fuzzy numbers ( A ˜ i ,   i = 1 , n ¯ ), each with triangular MF. The maximizing set  M  and minimizing set  G  then have MFs   f M u ,   f G u   given respectively as:
f M u = w · u u m i n u m a x u m i n k , i f     u m i n u u m a x ,   0 , otherwise .
f G u = w · u u m a x u m a x u m i n k , i f     u m i n u u m a x , 0 , otherwise .
where  u m i n = inf S ,  u m a x = sup S ,  S = i = 1 n S i ,  S i = u f A i u > 0 ,  w i = sup u f A i u , and  w = inf w i [40]. In our research, w = 1 , since the value of our MF μ A u ranges in the interval 0 ,   1 . The value of k shows the type of MF used, i.e., linear, polynomic, etc., depending on the application domain. In this research, k = 1 , since we considered the linear case.
Definition 4 
([40]). The right utility value ( U M i ), the left utility value ( U G i ) and the total utility value ( U T i ) of each generalized fuzzy number ( A ˜ i ,   i = 1 , n ¯ ) are defined as (Equations (17)–(19)):
U M i = sup u f A i u f M u ,   i = 1 , n ¯ ,  
U G i = sup u f A i u f G u ,   i = 1 , n ¯ ,
U T i = U M i U G i + 1 2 ,   i = 1 , n ¯ ,
Total utility values ( U T i ) for each fuzzy number ( A ˜ i ,   i = 1 , n ¯ ) are calculated using Equation (20):
U T i = 1 2 w w i a 3 i u m i n w i u m a x u m i n w a 2 i a 3 i u m a x a 1 i w i u m a x u m i n + w a 2 i a 1 i + 1 w i ,   i = 1 , n ¯ .
Since in this research w = 1 , Equation (20) turns into Equation (21):
U T i = 1 2 · a 3 i u m i n u m a x u m i n a 2 i a 3 i u m a x a 1 i u m a x u m i n + a 2 i a 1 i + 1 ,   i = 1 , n ¯ .
Definition 5 
([40]). The fuzzy number A ˜ i ,   i = 1 , n ¯ is greater than A ˜ j ,   j = 1 , n ¯ , denoted as A ˜ i > A ˜ j , if and only if U T i U T j , but a 2 i > a 2 j .
Definition 6 
([40]). The fuzzy number A ˜ i ,   i = 1 , n ¯ equals A ˜ j ,   j = 1 , n ¯ , denoted as A ˜ i =   A ˜ j , if and only if U T i = U T j and a 2 i = a 2 j .

3. Related Works

In this section, we present related works found that investigate the suitability of various normalization techniques within the same or different MCDM methods. The number of publications found shows that the analysis of the influence of normalization techniques in fuzzy MCDM methods is not new, but still a relevant issue that needs more investigations in various circumstances, different data and application domains.
In order to minimize the impact of normalization techniques and the sensitivity of MCDM methods to these techniques on the ranking of alternatives and to promote a strong consensus on the final decision, Hocaoğlu and Tosun [5] proposed a combination of decision rankings by considering voting and ranking proportional values as weights. The authors of [1] investigate the impact of different MCDM tools on the decision-making process for assessing the sustainability of engineering processes and structures. They investigate how prominent normalization methods influence the final results. The study highlights the importance of selecting appropriate MCDM tools and normalization methods to improve the interpretability, robustness, reliability, and consistency of sustainability assessments in engineering applications. Mhlanga and Lall [6] conducted a study to assess whether different normalization methods influence the ranking of alternatives for an AHP-VIKOR hybrid method in the selection of web services, but did not perform a more comprehensive analysis. Ten web services were selected for the study, each of which was evaluated based on five attributes using crisp values. The authors of [41] noted that some fuzzy TOPSIS models are restricted to specific fuzzy number formats and have difficulties when normalizing zero or very small values. In order to address these limitations, the authors [41] proposed a generalized fuzzy geometric mean approach for deriving weights from pairwise comparisons and to ensure mathematically valid outcomes.
The main results of the related works found are summarized in Table 2. It consists of the following columns: (0) the reference of the analyzed paper; (1) the MCDM method examined; (2) normalization techniques applied with a particular MCDM method in the analyzed research; (3) the application domain of the MCDM method and a number (No) of alternatives and attributes used in the analyzed study; (4) the data vagueness type (crisp data or fuzzy data) used for the study; (5) what is fuzzified in the study, i.e., attribute values, weights or both; (6) the way it was fuzzified; (7) the fuzzy numbers used, i.e., triangular, trapezoidal, etc.; (8) the best normalization technique found for the analyzed MCDM method; and (9) the assessment approach.
Summing up, Table 2 presents eighteen related works found, in which the authors analyze the effect of normalization techniques on ranking of alternatives in the frame of chosen MCDM methods, in the time period [2014; 2025]. Column 3 shows that TOPSIS (found in nine papers), VIKOR (found in five papers) and AHP (found in four papers) are popular MCDM methods for the application of different normalization techniques. However, for more global conclusions, a systematic literature review should be performed to answer the question of MCDM methods’ popularity in the analyzed topic. Column 4 shows that Linear Min-Max (found in 18 papers), Vector (found in 17 papers), Linear Sum (found in 17 papers), Linear Max (found in 17 papers), and Logarithmic (found in 10 papers) normalizations are the most popular in the analyzed works. Column 5 reveals that different normalization techniques are applied in solving different ranking problems. However, most of them are defined with a small number of attributes and alternatives. Only in [42] did the authors randomly analyze 264 alternatives. On the contrary, in this study, we consider a large data MCDM problem, i.e., in the initial state we have a large number of alternatives and attributes. Therefore, not all MCDM methods are suitable for such data-driven decision-making, such as AHP because of a pairwise comparison approach.
Column 4 shows that authors performed research on the effect of normalization techniques with crisp data. However, the last publications found mostly analyze fuzzy MCDM methods, because fuzziness becomes more popular and relevant in the current investigations. In the analyzed papers with fuzzy data, different characteristics of the MCDM method were fuzzified (Column 7), like attributes [43,44,45], weights [46,47], or both characteristics (i.e., attributes and weights), like in [4,37,48]. The main approaches used for fuzzification (Column 6) are as follows: expert-based using a scale of linguistic terms [4,46,47,48]; random generations, as described in [37,49]; or statistics-based, like minimum values, arithmetic means and maximum values as described in [48].
Table 2. Compared normalization techniques within various MCDM methods (alternatives (alt.) and attributes (attr.)) (NA—Not Available).
No., Ref.MCDM MethodNormalization
Techniques
Application Domain, No of Alt. and Attr.Data Type (Crisp/Fuzzy)What Is
Fuzzified?
Way It Is
Fuzzified
Fuzzy
Numbers Used
Best Normalization Technique FoundAssessment
(0)(1)(2)(3)(4)(5)(6)(7)(8)(9)
1. [2]AHPLinear Max, Linear Max-Min, Linear Sum, Vector, LogarithmicSmart car parking,
7 alt., 3 attr. for pairwise comparison
Crisp---Linear Max combined with Linear SumPearson and Spearman correlations, Ranking Consistency Index (RCI)
2. [43]TOPSISLinear Max, Linear Max-Min, Linear Sum, Vector, Logarithmic, fuzzificationAutonomous landing of drones with hazard avoidance,
16 alt., 3 attr.
Crisp
fuzzification instead of normalization
Attributes, values-Fuzzy trapezoidalVectorPearson and Spearman correlations, RCI
3. [44]SAWLinear Max, Linear Max-Min, Linear Sum, Vector, Logarithmic, fuzzificationResilience frameworks,
7 alt., 3 attr.
Crisp
fuzzification instead of normalization
Attributes, values-Fuzzy trapezoidalLinear Sum, Linear Max and Vector Pearson and Spearman correlation, RCI
4. [50]AHPLinear Max, Linear Max-Min, Linear Sum, VectorThe smart parking example,
7 alt., 3 attr.
Crisp---Linear Max-Min and Linear Max Pearson correlation, distance metrics: Manhattan, Chebyshev, Euclidean
5. [42]WSM, WPM, TOPSIS, ELECTRELinear Max, Linear Max-Min, Vector, LogarithmicInternal hull layout design in ship design
264 alt., 3 attr.
Crisp ---Linear Max-Min and Vector Spearman correlation
6. [51]PROMETHEE II, TOPSIS, GRAVector, Linear Max-Min, Jüttler’s–Körth’s, Non-linear A flexible manufacturing system selection,
8 alt., 7 attr.
Crisp ---Vector Spearman correlation
7. [46]TOPSIS and FAHPLinear Max, Linear Max-Min, Linear Sum, VectorFinancial performance of Turkish deposit banks,
13 alt., 6 attr.
Crisp for TOPSIS;
fuzzy for weights in FAHP
Weights, valuesWeights—expert-based using scale from 9 linguistic termsFuzzy triangularVector, Linear normalizations (Max–Min, Max) are possiblePearson correlations
8. [39]fuzzy MULTI-MOORA, fuzzy TOPSIS, fuzzy VIKOR, fuzzy WASPASVector, Linear Max, Linear Max-Min1200 randomly generated decision problemsFuzzyWeights and attribute valuesWeights—all are equal fuzzy triangular numbers; attribute values generated randomly by uniform distributionFuzzy triangularNormalization technique has a low influence on the resultsSpearman correlation, Hierarchical clustering
9. [52]WSMLinear Max, Linear Max-Min, Linear Sum, VectorAircraft selection,
4 alt., 6 attr.
Crisp---Same ranking for Vector, Linear Sum, Linear Max.
Linear Max-Min yields different ranking when integrating attr. weights
Pearson and Spearman correlations
10. [45]Simple Average MethodLinear Max, Linear Max-Min, Linear Sum, Semi-linear (Vector), Semi-linear (target-based), Logarithmic, fuzzification-
5 alt., 2 attr.
Crisp
fuzzification instead of normalization
Attributes, values-Fuzzy trapezoidal Fuzzification–best, Linear Max-Min–second best, Target-Avg and Target-Med–worstMinkowski distances, Standard deviation, Pearson and Spearman correlations, RCI, Regression analysis
11. [53]ROVVector, Linear Sum, Non-linear, Peldschus, Linear Max-Min, enhanced accuracy2019 financial performance of firms,
10 alt., 7 attr.
Crisp ---Non-linear—best, Linear Sum and enhanced accuracy—not recommendedPearson and Spearman correlations
12. [54]WASPASVector, Linear Max, Linear Max-Min, Linear Sum, LogarithmicRobot selection,
7 alt., 5 attr.
Crisp ---Linear Max-MinSpearman correlation
13. [48]Fuzzy SWARA, Fuzzy TOPSIS, Fuzzy WASPAS, Fuzzy ARASLinear Min-Max, SumSupplier selection,
4 alt., 5 attr.
FuzzyWeights and attribute valuesQuantitative attr. evaluated using statistical data (min, arithmetic means and max values), qualitative attr.—expert-based (min, geometric mean and max values) using scale from 5 linguistic termsFuzzy triangularNANA
14. [47]SAWLinear Min-Max, Linear Max, Linear Sum, Linear Max *, VectorSport car selection, 3 alt., 2 attr.,
pursuing a degree in economics at a university, 4 alt., 2 attr.
CrispFuzzy WeightsQualitative expert-based evaluation of weights using scale from 7 linguistic termsFuzzy triangularNANA
15. [49]VIKORHybrid normalization: decimal scale, global linear scale Min-Max and standardizationSocial relationships between users:
Abrar student network (41 students),
Zachary’s karate club (34 members),
Bottlenose Dolphin network (37 nodes)
Crisp -Weights of attributes selected randomly-NANA
16. [55]VIKOR, TOPSISLogarithmic, Vector, Min-MaxRanking of suppliers: 4 alt., 5 attr.; 8 alt., 6 attr.Crisp ---NANA
17. [4]Fuzzy TOPSIS, Fuzzy VIKORVector, Linear Sum, Linear Max, Linear Max-Min, Non-linear, Logarithmic [56,57], Jüttler’s–Körth’sRatings of candidates,
6 alt., 4 attr.
Fuzzy Weights and attribute valuesExpert-based attributes and weights evaluated using scale from 7 linguistic termsFuzzy triangularNANA
18. [58]m-polar fuzzy ELECTRE-I Linear (Max), Linear (Max–Min), Linear (Sum), Vector, Logarithmic Numerous NTM processes,
8 alt., 6 attr.
FuzzyNormalizations and criteria weights-m-polarFor the single-valued mFs ELECTRE-I method, Linear Sum and Vector normalization is recommended.Spearman correlations
19. [5]AHP, TOPSIS, VIKOR, MOORA and PROMETHEE mSum, Vector, Max-Min, Max and LogarithmNozzle Selection Problem
4 alt., 5 attr.
CrispNANANANANA
* Note that the Linear Sum and Linear Max normalization techniques use Linear transformation for benefit criteria and Non-Linear transformation for the cost [59].
However, those found fuzzification approaches are suitable for cases when the fuzzified data is without outliers, like the application of minimum values, arithmetic means and maximum values for triangular fuzzification [48]. Nevertheless, the real data may have outliers or noise, be inaccurate, etc. [60]. In most applications, a large amount of real data from multiple sources needs to be pre-processed efficiently in order to provide relevant information to specialists [61]. Statistical calculations, training machine learning models, and monitoring performance using inaccurate data can lead to erroneous decisions and incorrect actions [62]. Therefore, the statistical fuzzification approach applied in [48] is not suitable in this case, and we need a systematic approach to pre-processing and fuzzifying a large amount of real data before applying MCDM methods.
Column 7 shows that the most popular fuzzification numbers are triangular [37,46,48] and trapezoidal [43,44,45], because their parameters are easily adjustable [26,63,64].
Column 8 presents that a Vector normalization is the best for TOPSIS, Linear Max combined with Linear Sum, Linear Max-Min or Linear Max—suitable for AHP [2,46,50], Linear Max-Min, Vector, Linear Sum and Linear Max—appropriate for WSM and WPM [42,52], etc. The most popular assessment techniques (Column 9) for the investigation of the normalization effect in MCDM methods are Pearson and Spearman correlations, found in almost all analyzed studies, and Ranking Consistency Index (RCI).
Summing up, despite the existing research found on the effect of normalization techniques in MCDM methods presented in Table 2, this topic remains relevant and further investigation, especially for application in decision-making problems with real and large amounts of data including its fuzzification. Thus, below, we present an approach for investigating the influence of normalization techniques in fuzzy MCDM.
The following fuzzy MCDM methods were selected for the investigations: the Technique for Order Preference by Similarity to Ideal Solution (TOPSIS) [65], as the most applicable MCDM method with a good computational efficiency [66,67], great robustness in dealing with MCDM problems in different application areas and extensibility; the Weighted Sum Model (WSM) [68], as the simplest and most commonly used method in MCDM [69], and suitable for single-dimensional problems; and VIKOR, as it provides a maximum group utility for the “majority” and a minimum individual regret for the “opponent” [36,70,71]. Moreover, fuzzy extensions are known for these methods, such as fuzzy TOPSIS [72], fuzzy WSM [68] and fuzzy VIKOR [73]. We have chosen the case of service quality evaluation as the application domain for this research, because, due to the multiple conflicting qualitative and quantitative criteria to be considered, the web service selection problem is considered to be an NP-complete problem [74,75].

4. Materials and Methods

4.1. Normalization Techniques

As can be seen from the real-world MCDM problems, the attributes can be benefit or cost criteria, measured in different units of measure, and values may vary in different ranges. Therefore, they should be normalized to convert the values of districts into a common dimensionless unit for comparison. Some MCDM methods have predefined normalization techniques, like TOPSIS has default Vector normalization [65], VIKOR has default linear-scale normalization [70], COPRAS has linear-scale sum normalization [76], etc.
In general, the normalization of data has several meanings based on the application area. We are investigating data normalization in MCDM methods. Here, normalization is the process of transforming data values measured on different scales to a common scale to ensure the comparability of criteria, thus making it useful for decision modeling [2]. One of the key requirements for the normalization of attributes is that it should meet the property of the monotonically increasing transformation. In the literature on MCDM methods, we can find Linear, Non-linear, Vector and other normalization techniques. In this research, we propose an assessment approach for evaluating eight normalization techniques (Table 3).

4.2. The Novel Method Assessing the Effect of Normalization Techniques

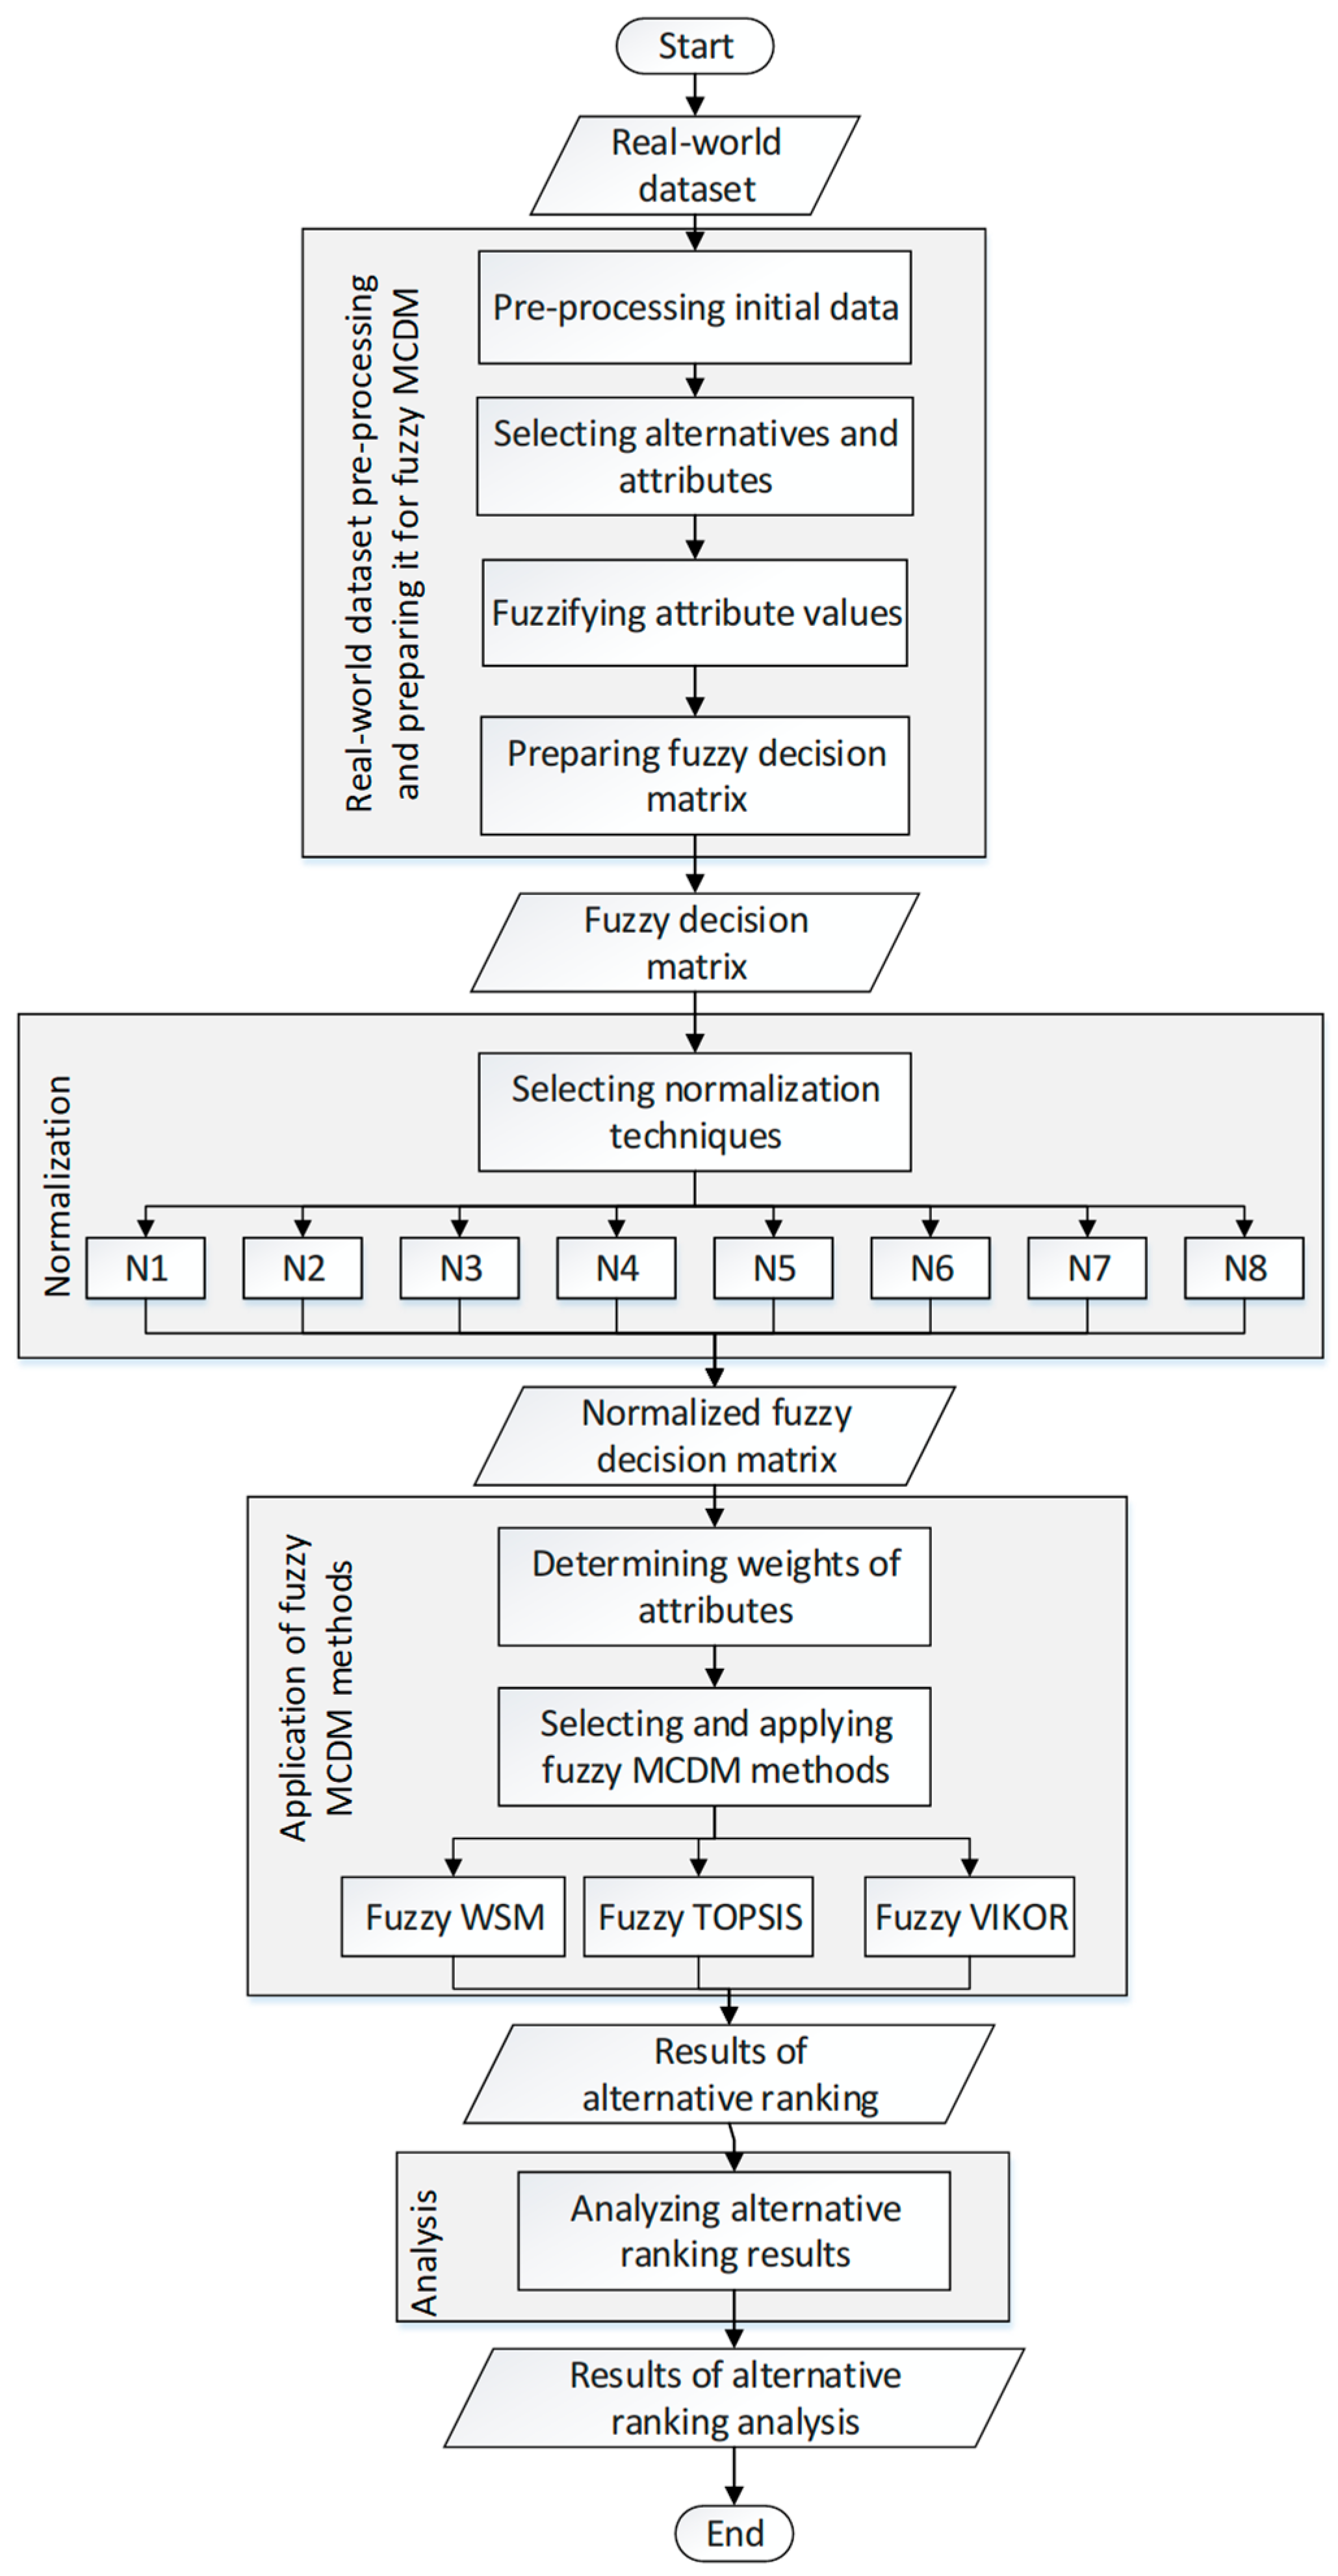
This section describes the method assessing the effect of normalization techniques. The schema of the assessment method is presented in Figure 1. The main key features of the proposed methods are as follows: (1) pre-processing of the real-world dataset and preparing it for fuzzy MCDM; (2) normalization within the selected normalization techniques; (3) application of the chosen fuzzy MCDM methods; and (4) analyzing the obtained alternative ranking results.

4.2.1. Selecting Alternatives and Attributes

For this research, we have used the large real-world QoS-QoE dataset [60], which contains over 69,000 observations and 51 attributes. Since the selection of an appropriate web service (WS), i.e., alternative, depends on a number of Quality-of-Service (QoS) and Quality-of-Experience (QoE) criteria, generally named quality, this problem can be viewed as an MCDM problem [75,85] involving the numerical analysis of WS alternatives based on quality attributes presenting quality criteria.
From this real large dataset (i.e., observations), we present how to distinguish nine alternatives and six independent attributes for further comparison. Note that the number of alternatives can be different depending on the dataset and preferences, but by increasing the number of alternatives, the number of calculations increases enormously. Therefore, we show how to formulate a DMM from a large dataset to get a scalable MCDM task.
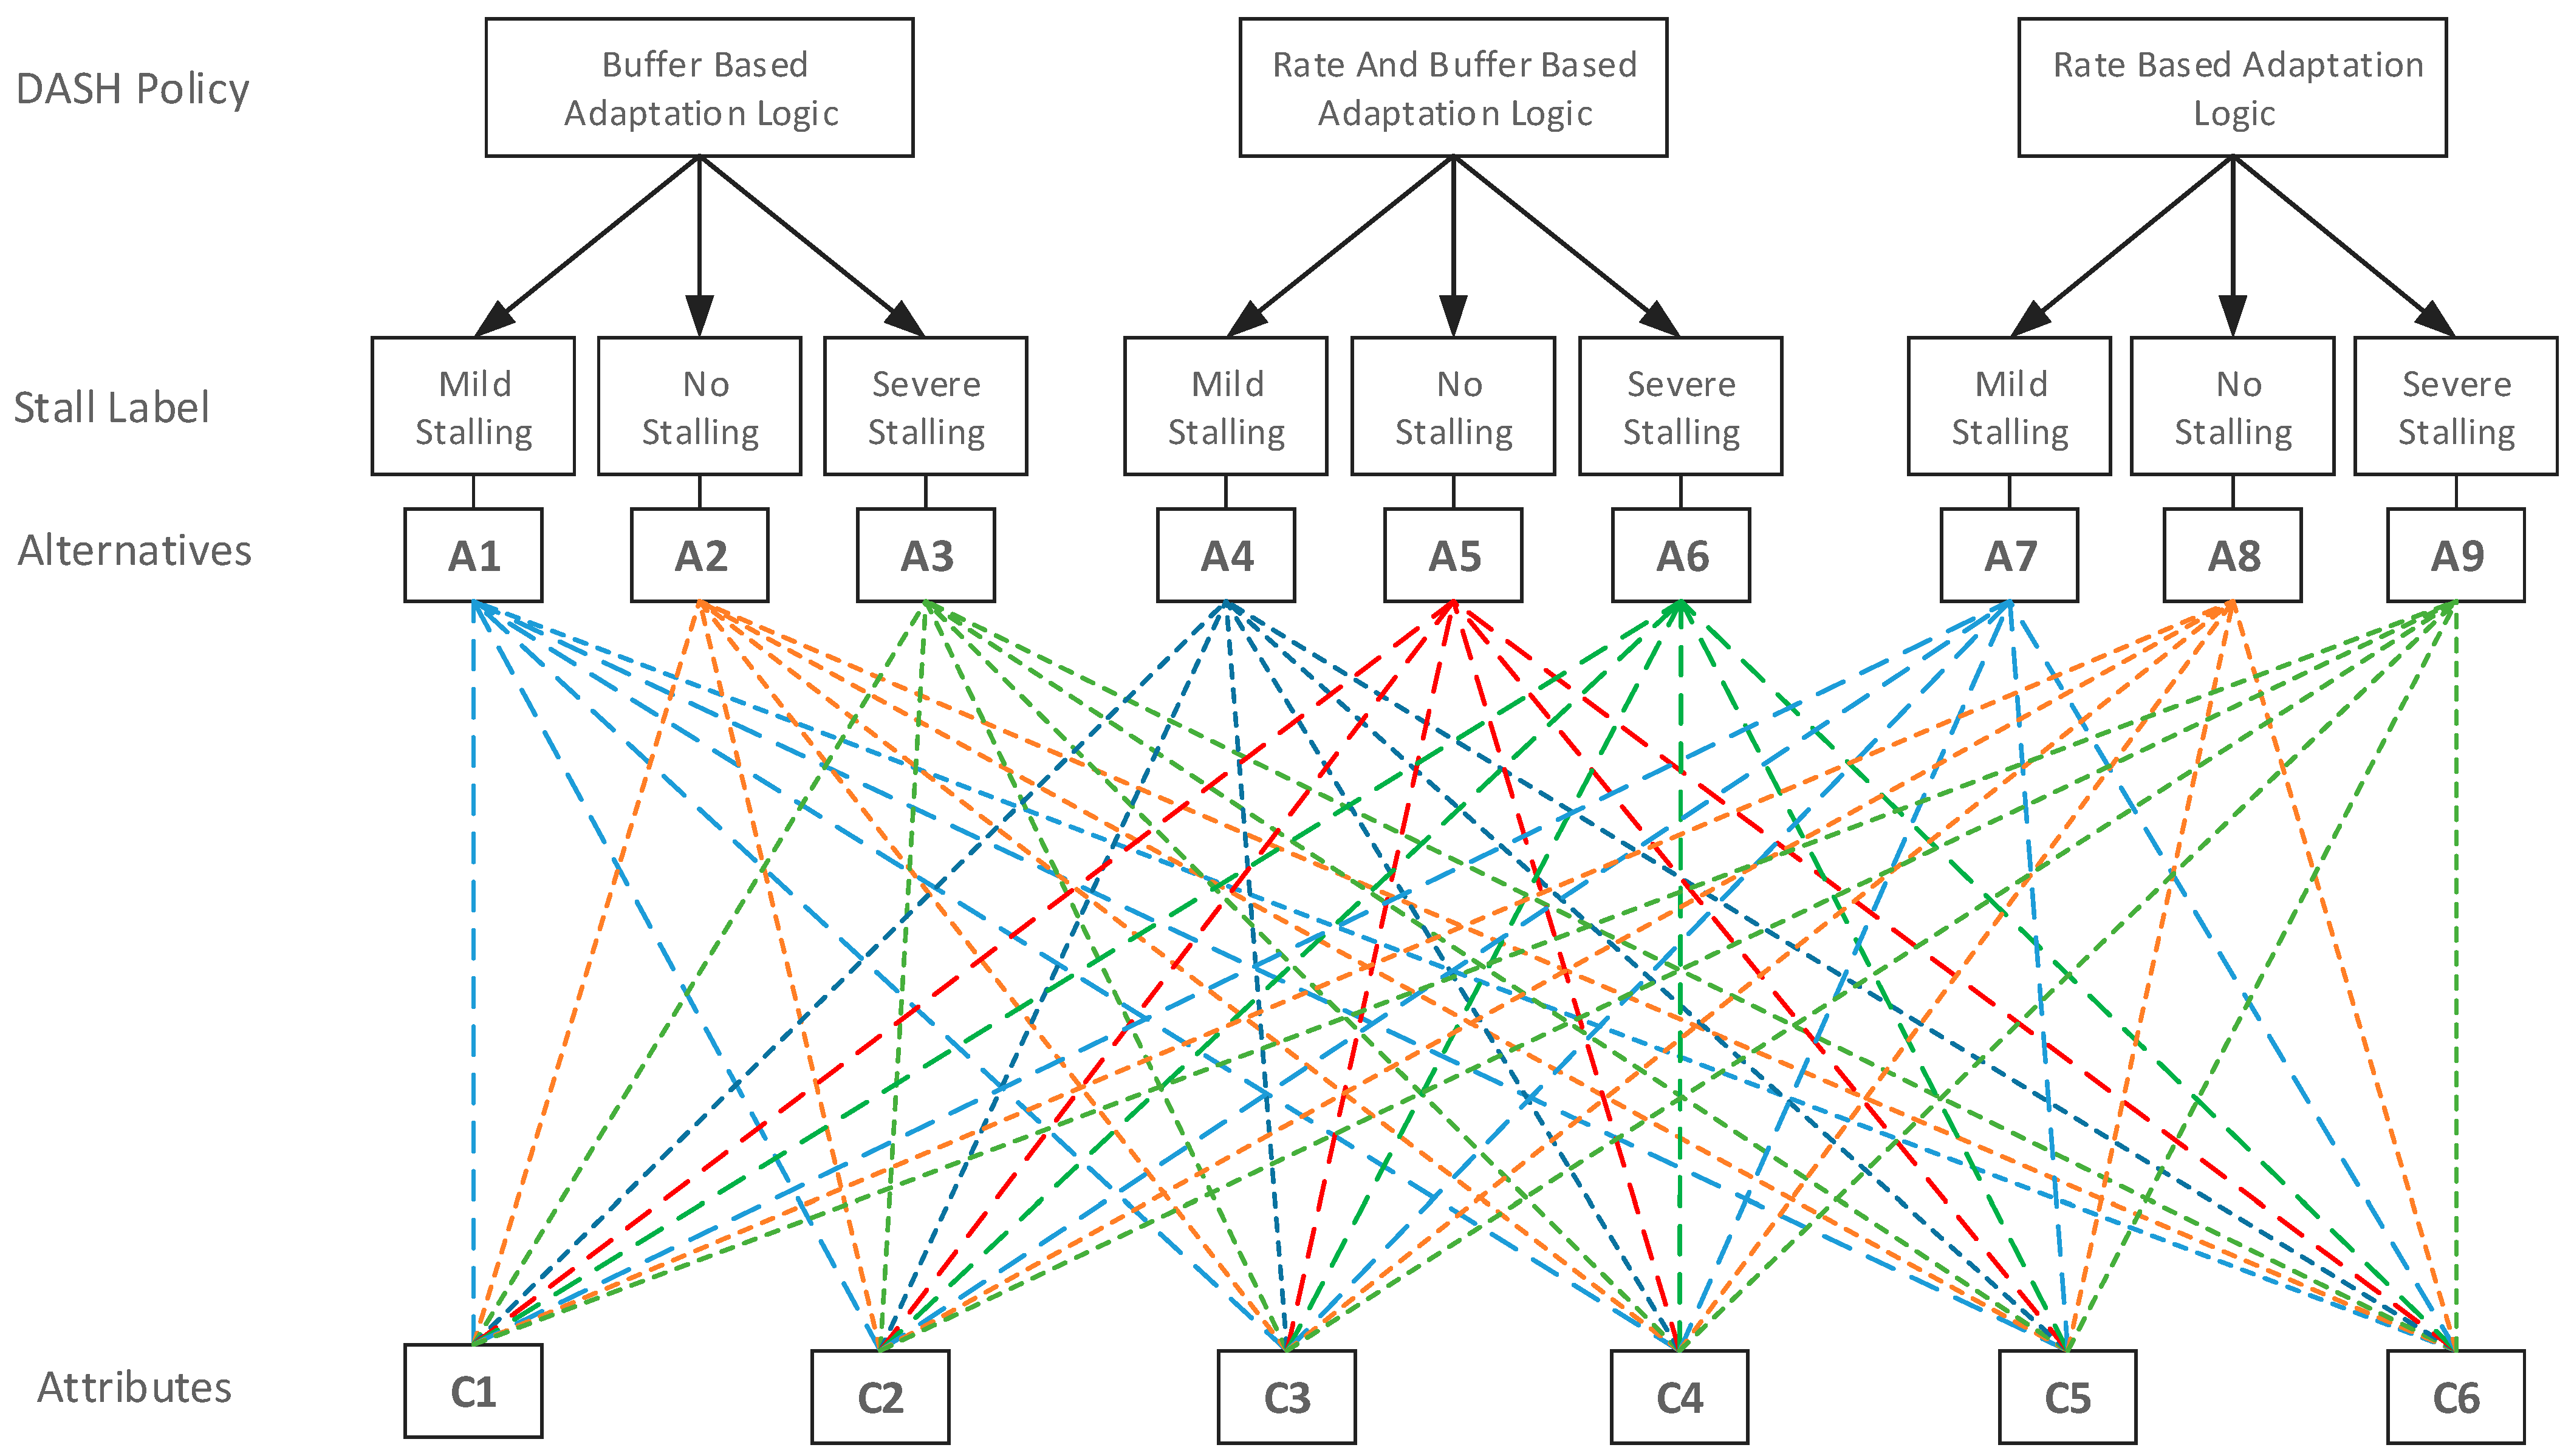
The alternatives for the assessment were selected using the schema in Figure 2. Starting from the highest level, all initial WS observations in the dataset are classified into nine categories according to the variables “DASH Policy” and “Stall Label”. As a result, we have the following classification of initial observations presented in Table 4.
As we can see from Table 4, the number of observations in each class are very different and their comparison is complicated. Therefore, in order to compare nine classes, which can be treated as nine alternatives, we suggest applying a fuzzification of attributes, which is described in Section 4.2.3.
Consequently, we have nine categories, which are defined as nine alternatives: A1—Mild stalling for Buffer-Based Adaptation Logic (BBAL); A2—No stalling for BBAL; A3—Severe stalling for BBAL; A4—Mild stalling for Rate- and Buffer-Based Adaptation Logic (RBBAL); A5—No stalling for RBBAL; A6—Severe stalling for RBBAL; A7—Mild stalling for Rate-Based Adaptation Logic (RBAL); A8—No stalling for RBAL; A9—Severe stalling for RBAL.
The attributes for the assessment of the selected alternatives were chosen based on their characteristics. In this study, we chose to examine only quantitative not correlating variables, which are minimized (i.e., cost attribute) or maximized (i.e., benefit attribute).
Since the values of the attributes are random, we define the attributes as continuous random variables. Nevertheless, for the construction of the DMM, we should ensure the independence of the selected attributes. Therefore, we used the Pearson correlation coefficient (Equation (39)) to check the correlation of the attributes and select non-correlated attributes for the DMM.
r X Y = i = 1 n x i x ¯ y i y ¯ i = 1 n x i x ¯ 2 i = 1 n y i y ¯ 2 ,
where n is a sample size (length of attribute values); x i , y i are the sample data indexed with i ; and x ¯ and y ¯ are means of variables X and Y values respectively. In our research, X and Y denote the attributes we compare with each other.
The correlation coefficient ( r X Y ) measures the statistical relationship between two variables. The values range between −1.0 and 1.0. A correlation of −1.0 means a perfect negative correlation, while a correlation of 1.0 is a perfect positive correlation. A correlation of 0 shows no linear relationship between the two variables. A correlation between 0 and 1 shows some strength of the correlation. Table 5 presents only those attributes for which the Pearson correlation coefficient is less than 0.42.
Out of all 48 variables, we selected only 6 with the weakest correlation and those for which it was possible to indicate whether it is minimized (i.e., cost attribute) or maximized (i.e., benefit attribute).
Table 6 presents the finally selected attributes for the assessment of normalization techniques.

4.2.2. Data Pre-Processing and Fuzzification Approach

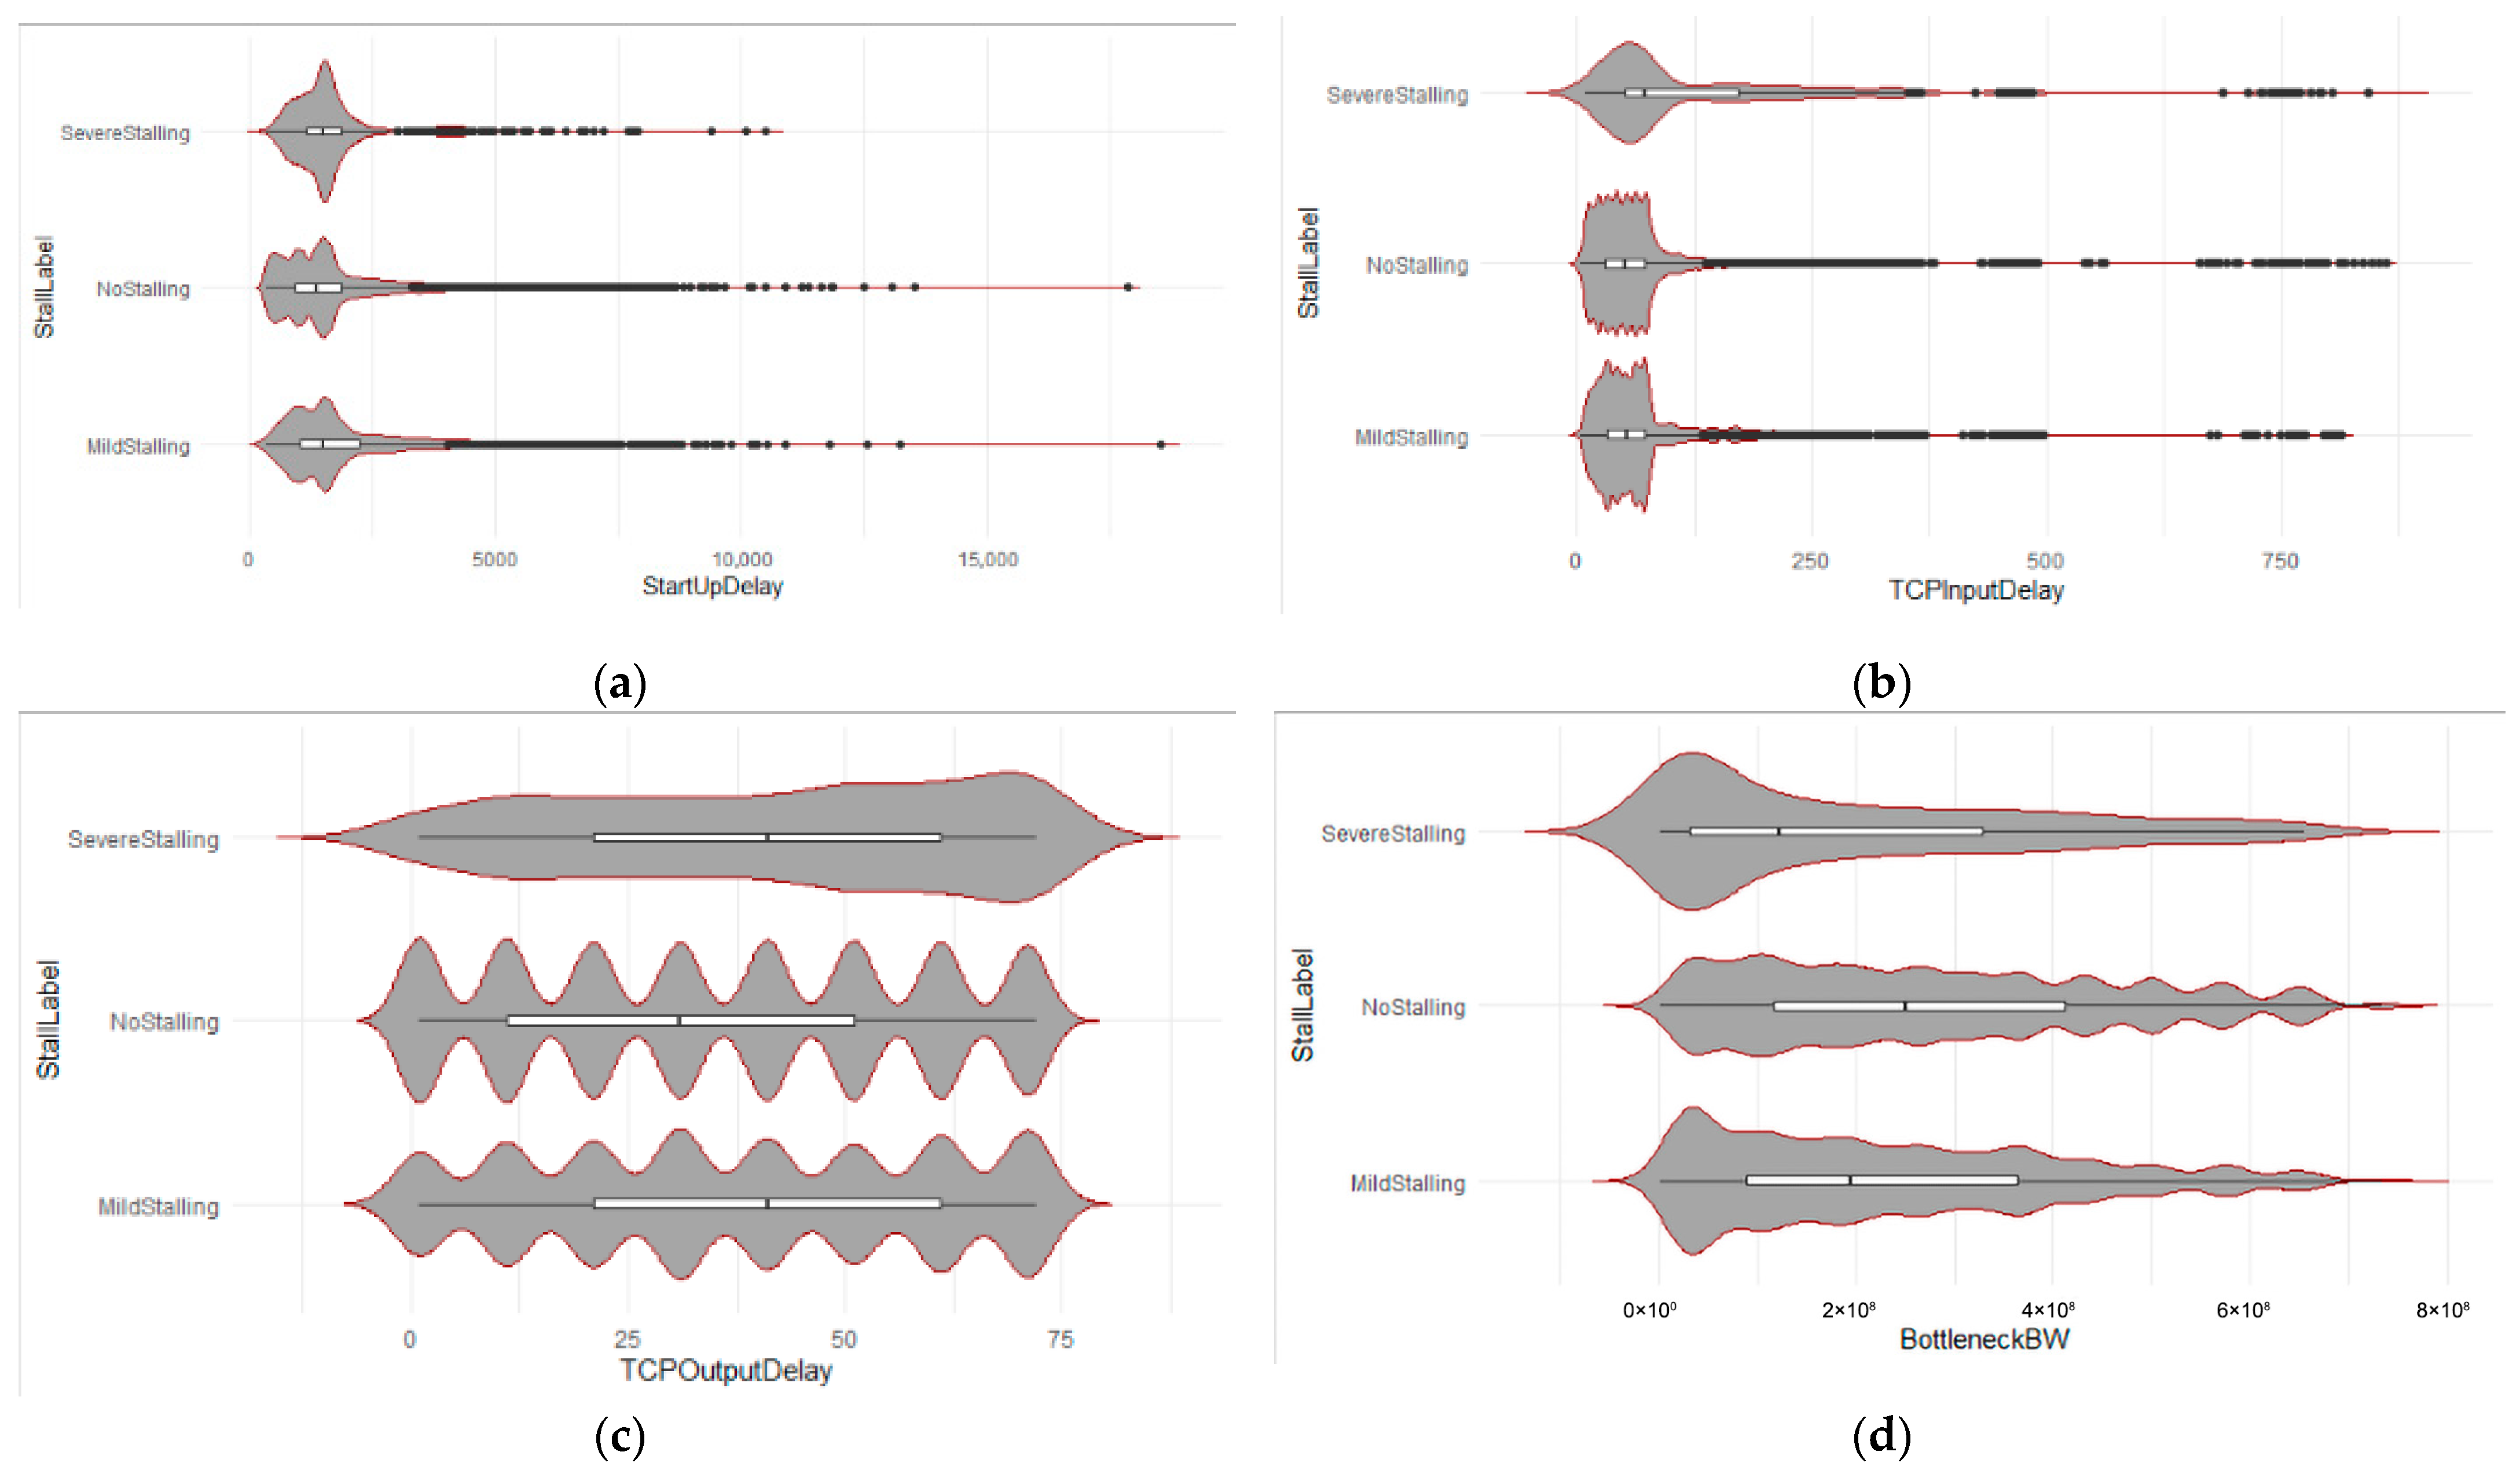
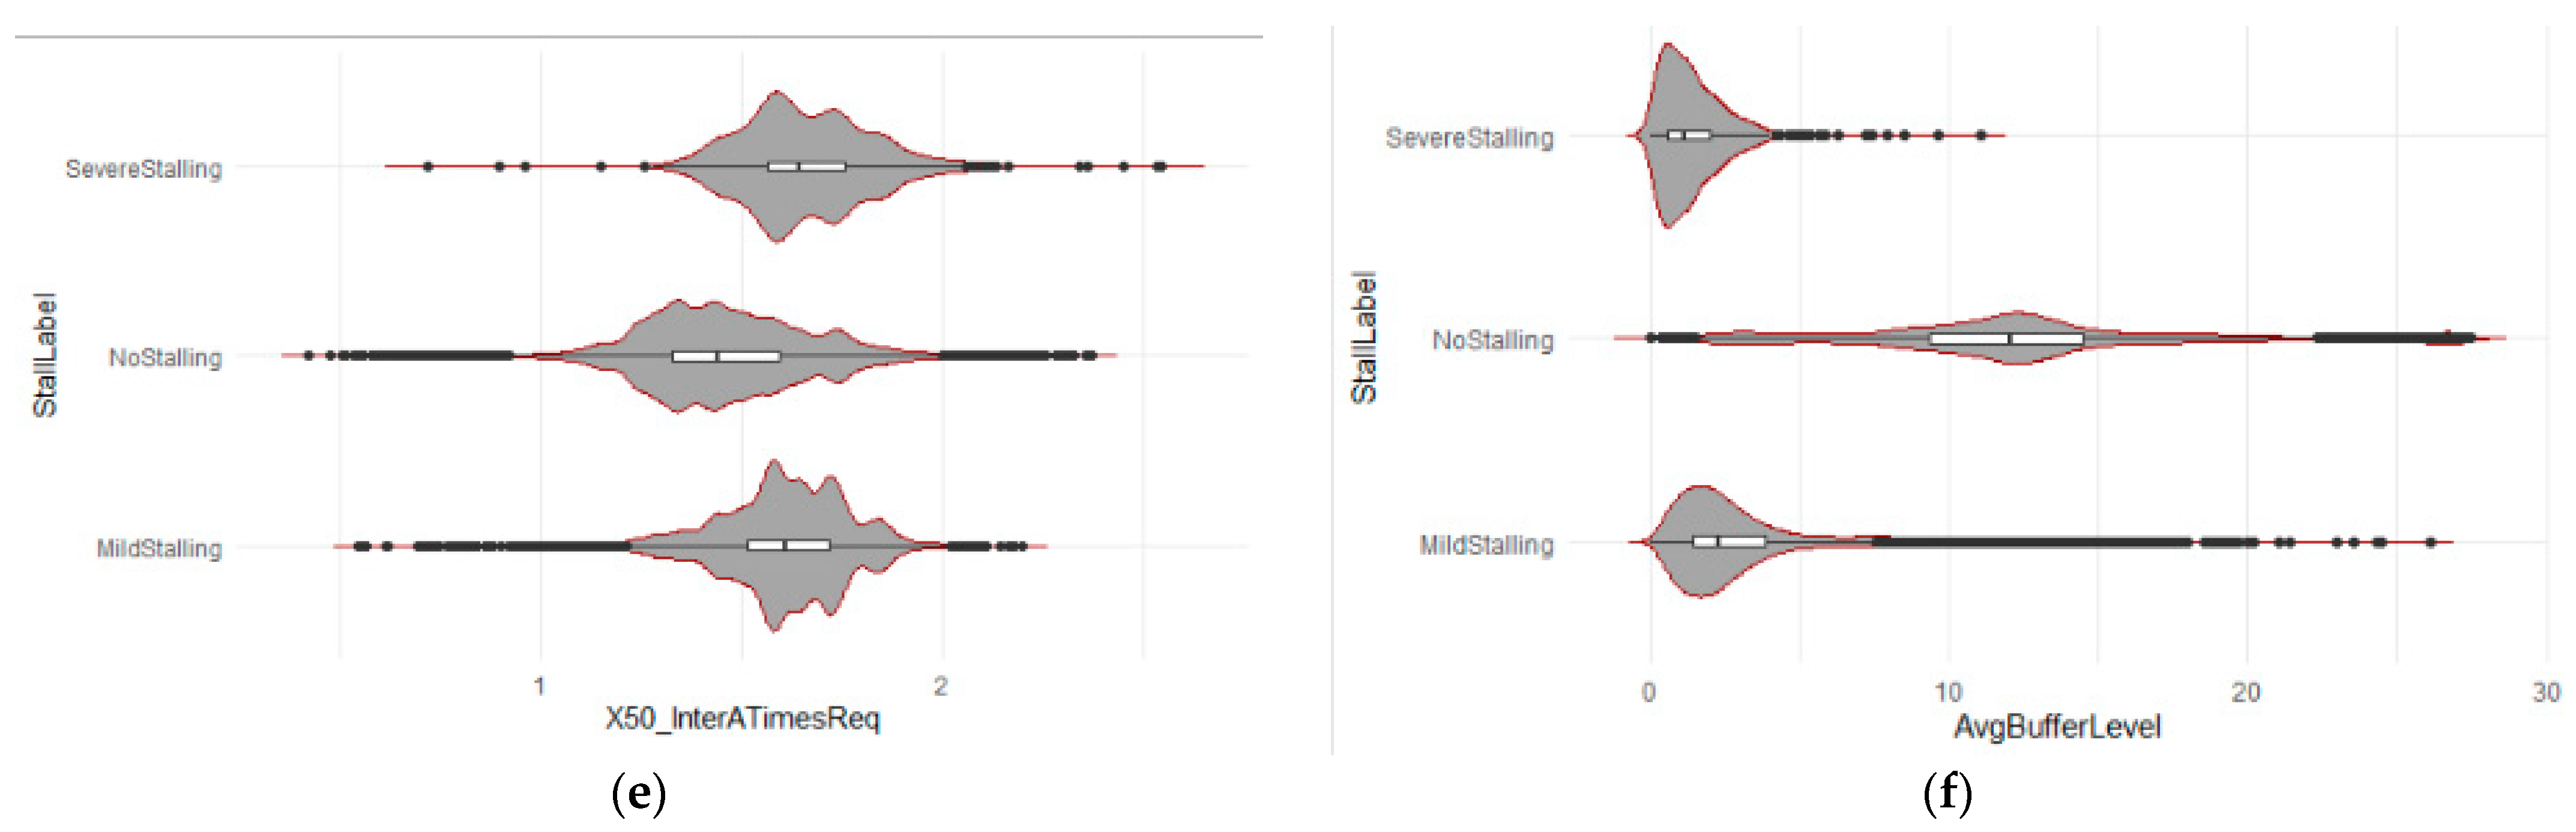
In this step, we perform data fuzzification using formulas from Preliminaries and develop a fuzzy decision-making matrix (fuzzy DMM). We have used the heuristic method [33] to develop triangular MFs (see Preliminaries). The MF parameters were set using violin plot-based histograms. Consequently, for each chosen attribute, a violin plot (see Figure 3) was developed and, based on its characteristics, which are presented below, fuzzy numbers were defined (Equation (40)).
The data of attributes C1, C2, C5 and C6 have many outliers (Figure 3). Therefore, it is difficult to determine a typical attribute value. The data of attributes C3 and C4 have no outliers. Moreover, as can be seen from Figure 3, the selected attributes are different in their nature. As noticed in [45], fuzzification is the best technique for data with outliers. Therefore, an appropriate fuzzification approach should be chosen to provide more information about attribute values.
In this research, we have applied Tukey’s fences method [86] to define intervals [ a 1 , a 3 ] of fuzzy triangular numbers. This method is based on measuring an interquartile range ( I Q R j ), which shows what values are characterized as regular observations and what values are outliers. Thus, a fuzzy triangular number is defined in Equation (40).
x i j l ,   x i j m ,   x i j u = Q 1 i j 1 , 5 · I Q R i j ,   x ¯ i j ,   Q 3 i j + 1 , 5 · I Q R i j ,   i = 1 , n ¯ ,   j = 1 , m ¯ ,
where x ¯ i j is the mean of values of the i-th alternative in terms of the j-th attribute; Q 1 i j and Q 3 i j are the lower and upper quartiles respectively; and I Q R i j is the interquartile range for the i-th alternative in terms of the j-th attribute.
Other possible approaches to develop triangular fuzzy numbers are as follows: (min, mode, max) [68,87,88], (min, arithmetic mean, max) [48,89], etc.
Consequently, the fuzzy decision-making matrix X ^ = x ^ i j n × m is made of a set of values x ^ i j , which are fuzzy triangular numbers, of the i-th alternative assessed by the j-th attribute (Equation (41)).
X ^ = x ^ 11 x ^ 12 x ^ 1 m x ^ 21 x ^ 22 x ^ 2 m x ^ n1 x ^ n2 x ^ n m
So, the main elements for MCDM are alternatives, attributes and their weights as follows:
(1)
A set of alternatives A = A i ,   i = 1 , n ¯ , where n is a number of alternatives.
(2)
A set of attributes C = { C j , j = 1 , m ¯ } , where m is a number of attributes.
(3)
The weight w j , denoting the importance of the j-th attribute to the decision in fuzzy triangular number form is defined as w ^ j = w j l ,   w j m ,   w j u ,   j = 1 , m ¯ . The sum of the weight values should be equal to 1. In the case of the fuzzy triangular numbers, this condition is described for the modal values w j m [35,68].
Since we analyze the effect of normalization techniques in fuzzy MCDM methods, we have set equal weights for all m attributes w ^ j = 1 m ,   1 m ,   1 m ,   j = 1 , m ¯ [90].

4.2.3. Fuzzy WSM, Fuzzy TOPSIS and Fuzzy VIKOR with Fuzzy Triangular Numbers

For fuzzy WSM [35], the preference values of the i-th alternative P i W S M = P i l ,   P i m ,   P i u are denoted by Equation (42):
P i W S M = j = 1 m r ˜ i j w ^ j ,   i = 1 , n ¯ ,
where r ˜ i j is the normalized fuzzy value of the i-th alternative in terms of the j-th attribute. For the normalization, we are using normalization techniques presented in Table 4.
For fuzzy TOPSIS [35], the preference values of the i-th alternative K i T O P S I S = K i l , K i m ,   K i u are calculated by Equation (43):
K i T O P S I S = S ˜ i S ˜ i S ˜ i + ,   i = 1 , n ¯ ,
where S ˜ i is the distance from each alternative to the Fuzzy Negative Ideal Solution (FNIS) A (Equation (44)):
S ˜ i = j = 1 m v ˜ i j v ˜ j 2 , i = 1 , n ¯ ;   j Ω c ,
where S ˜ i + is the distance from each alternative to the Fuzzy Positive Ideal Solution (FPIS) A + (Equation (45)):
S ˜ i + = j = 1 m v ˜ i j v ˜ j + 2 , i = 1 , n ¯ ; j Ω b .
The values v ˜ i j = v i j l ,   v i j m ,   v i j u ,   i = 1 , n ¯ ,   j = 1 , m ¯ are the entries of the weighted normalized fuzzy decision matrix V ˜ = v ˜ i j n × m , where v ˜ i j = r ˜ i j w ^ j ,   i = 1 , n ¯ ,   j = 1 , m ¯ ; w ^ j is the weights of the j-th criteria; r ˜ i j is the normalized fuzzy value of the i-th alternative in terms of the j-th criterion. The values v ˜ j ,   j = 1 , m ¯ are the elements of A = v ˜ 1 ,   ,   v ˜ m ; the values v ˜ j + ,   j = 1 , m ¯ are the elements of A + = v ˜ 1 + ,   ,   v ˜ m + . Entries of the weighted normalized fuzzy decision matrix V ˜ = v ˜ i j n × m are elements, the ranges of which belong to the interval [0, 1]. Then, we can define v ˜ j = 0 ,   0 ,   0 and v ˜ j + = 1 ,   1 ,   1 ,   j = 1 , m ¯ [88].
For fuzzy VIKOR [91], the preference values of the i-th alternative Q i V I K O R = Q i l ,   Q i m ,   Q i u are determined by Equation (46):
Q i V I K O R = v S ˜ i S ˜ * / S u S * l 1 v R ˜ i R ˜ * / R u R * l ,   i = 1 , n ¯ ,
where S ˜ * = min i S ˜ i , S u = max i S i u , S * l = min i S i l , R ˜ * = min i R ˜ i , R u = max i R i u , R * l = min i R i l , and v denotes a strategy weight of “the majority of criteria”, whereas 1 v is the weight of the individual regret. For the compromise, v = 0.5 [91].
A fuzzy weighted sum S ˜ i = S i l , S i m ,   S i u ,   i = 1 , n ¯ , presenting the separation measure of the i-th alternative A i from the fuzzy best value, is calculated using Equation (47):
S ˜ i = j = 1 m r ˜ i j w ^ j , i = 1 , n ¯ .
A fuzzy operator R ˜ i = R i l , R i m ,   R i u ,   i = 1 , n ¯ , presenting the separation measure of the i-th alternative A i from the fuzzy worst value, is calculated by Equation (48):
R ˜ i = max j r ˜ i j w ^ j , i = 1 , n ¯ .
Finally, the ranks of alternative are determined by sorting them decreasingly according to core values Q i m , i = 1 , n ¯ . Note that the initial VIKOR, defined by Opricovic [92], uses a normalization technique, which converts better values closer to zero (0), and worse values closer to one (1). Thus, when ranking alternatives according to Q i m , the best alternative is considered to be the one with the lowest preference values. In order to systematically investigate the effect of different normalization techniques in fuzzy MCDM methods (i.e., fuzzy WSM, fuzzy TOPSIS and fuzzy VIKOR), we apply eight normalization techniques (see Section 4), which are based on a monotonic transformation of attribute values. These transformations scale performance values such that higher normalized values correspond to better performance. When such monotonic transformations are used within fuzzy VIKOR, the resulting preference values become order-isomorphic to those obtained under the original formulation but differ in direction. Consequently, the optimal alternative corresponds to the maximum preference value rather than the minimum. Importantly, this reversal does not alter the relative ordering of alternatives, nor does it affect the compromise solution logic of VIKOR; it merely reflects a change in scale orientation. Therefore, in the case of fuzzy VIKOR with other normalization techniques, the best alternative is considered to be the one with the highest fuzzy preference values.

4.2.4. Normalization Techniques for Fuzzy Triangular Numbers

The normalization techniques for fuzzy triangular numbers are described and presented in Table 7.
As presented in Table 6, not all equations for the fuzzy normalization techniques are presented in the literature. For the Vector normalization (N1), the authors of [37] describe the fuzzy normalization only for benefit criteria; however, the fuzzy normalization for cost criteria is not presented. The same is true for the Linear Max normalization (N2), only the fuzzy normalization for benefit criteria is found. Linear Jüttler’s–Körth’s (N4), Non-linear Peldschus (N6) and Non-linear Logarithmic (N7) normalizations exist only for crisp values. Shukla et al. [94] described Linear Sum (N5) fuzzy normalization for benefit criteria. The missing fuzzy normalization formulas were defined by the authors of this paper based on the fuzzy number operations and existing normalization techniques and presented in Equations (55) and (56).

4.2.5. Evaluating Effect of Normalization Techniques

Finally, the effect of normalization techniques in fuzzy TOPSIS, fuzzy WSM and fuzzy VIKOR are analyzed using the Spearman rank correlation coefficient (Equation (67)) [96]:
r s X ,   Y = i = 1 n R X i R ¯ X R Y i R ¯ Y i = 1 n R X i R ¯ X 2 i = 1 n R Y i R ¯ Y 2 ,
where R X i , R Y i are i-th alternative ranks obtained applying a particular fuzzy MCDM method (i.e., in this research, fuzzy TOPSIS, fuzzy WSM and fuzzy VIKOR) with a particular normalization technique for X and Y , i = 1 , n ¯ . R ¯ X and R ¯ Y are rank means respectively. The correlation coefficient r s X ,   Y indicates the strength of the linear relationship between alternatives ranking using normalization techniques X and Y. A hypothesis about the significance of the correlation coefficient has been tested to decide whether the correlation is statistically significant. If p < 0.05, then the correlation between the ranks of alternatives using normalization methods X and Y is statistically significant; otherwise, this correlation is insignificant.
In order to determine the similarities between the analyzed normalization techniques, we have applied the hierarchical clustering Complete Linkage method [96] (Equation (68)):
d A , B = m a x d x i , y j , x i A   &   y j B ,
where d x i , y j is the distance between objects x i A and y j B . The distance was calculated applying a Euclidean distance in Equation (69):
d x i , y j = i = 1 n x i y i 2 ,

5. Results

This section presents the obtained results of our investigation. An initial fuzzy DMM is presented in Table 8.
Table 9 presents the alternative ranks and preference values obtained by applying fuzzy WSM, fuzzy TOPSIS and fuzzy VIKOR with different normalization techniques presented in Table 7.
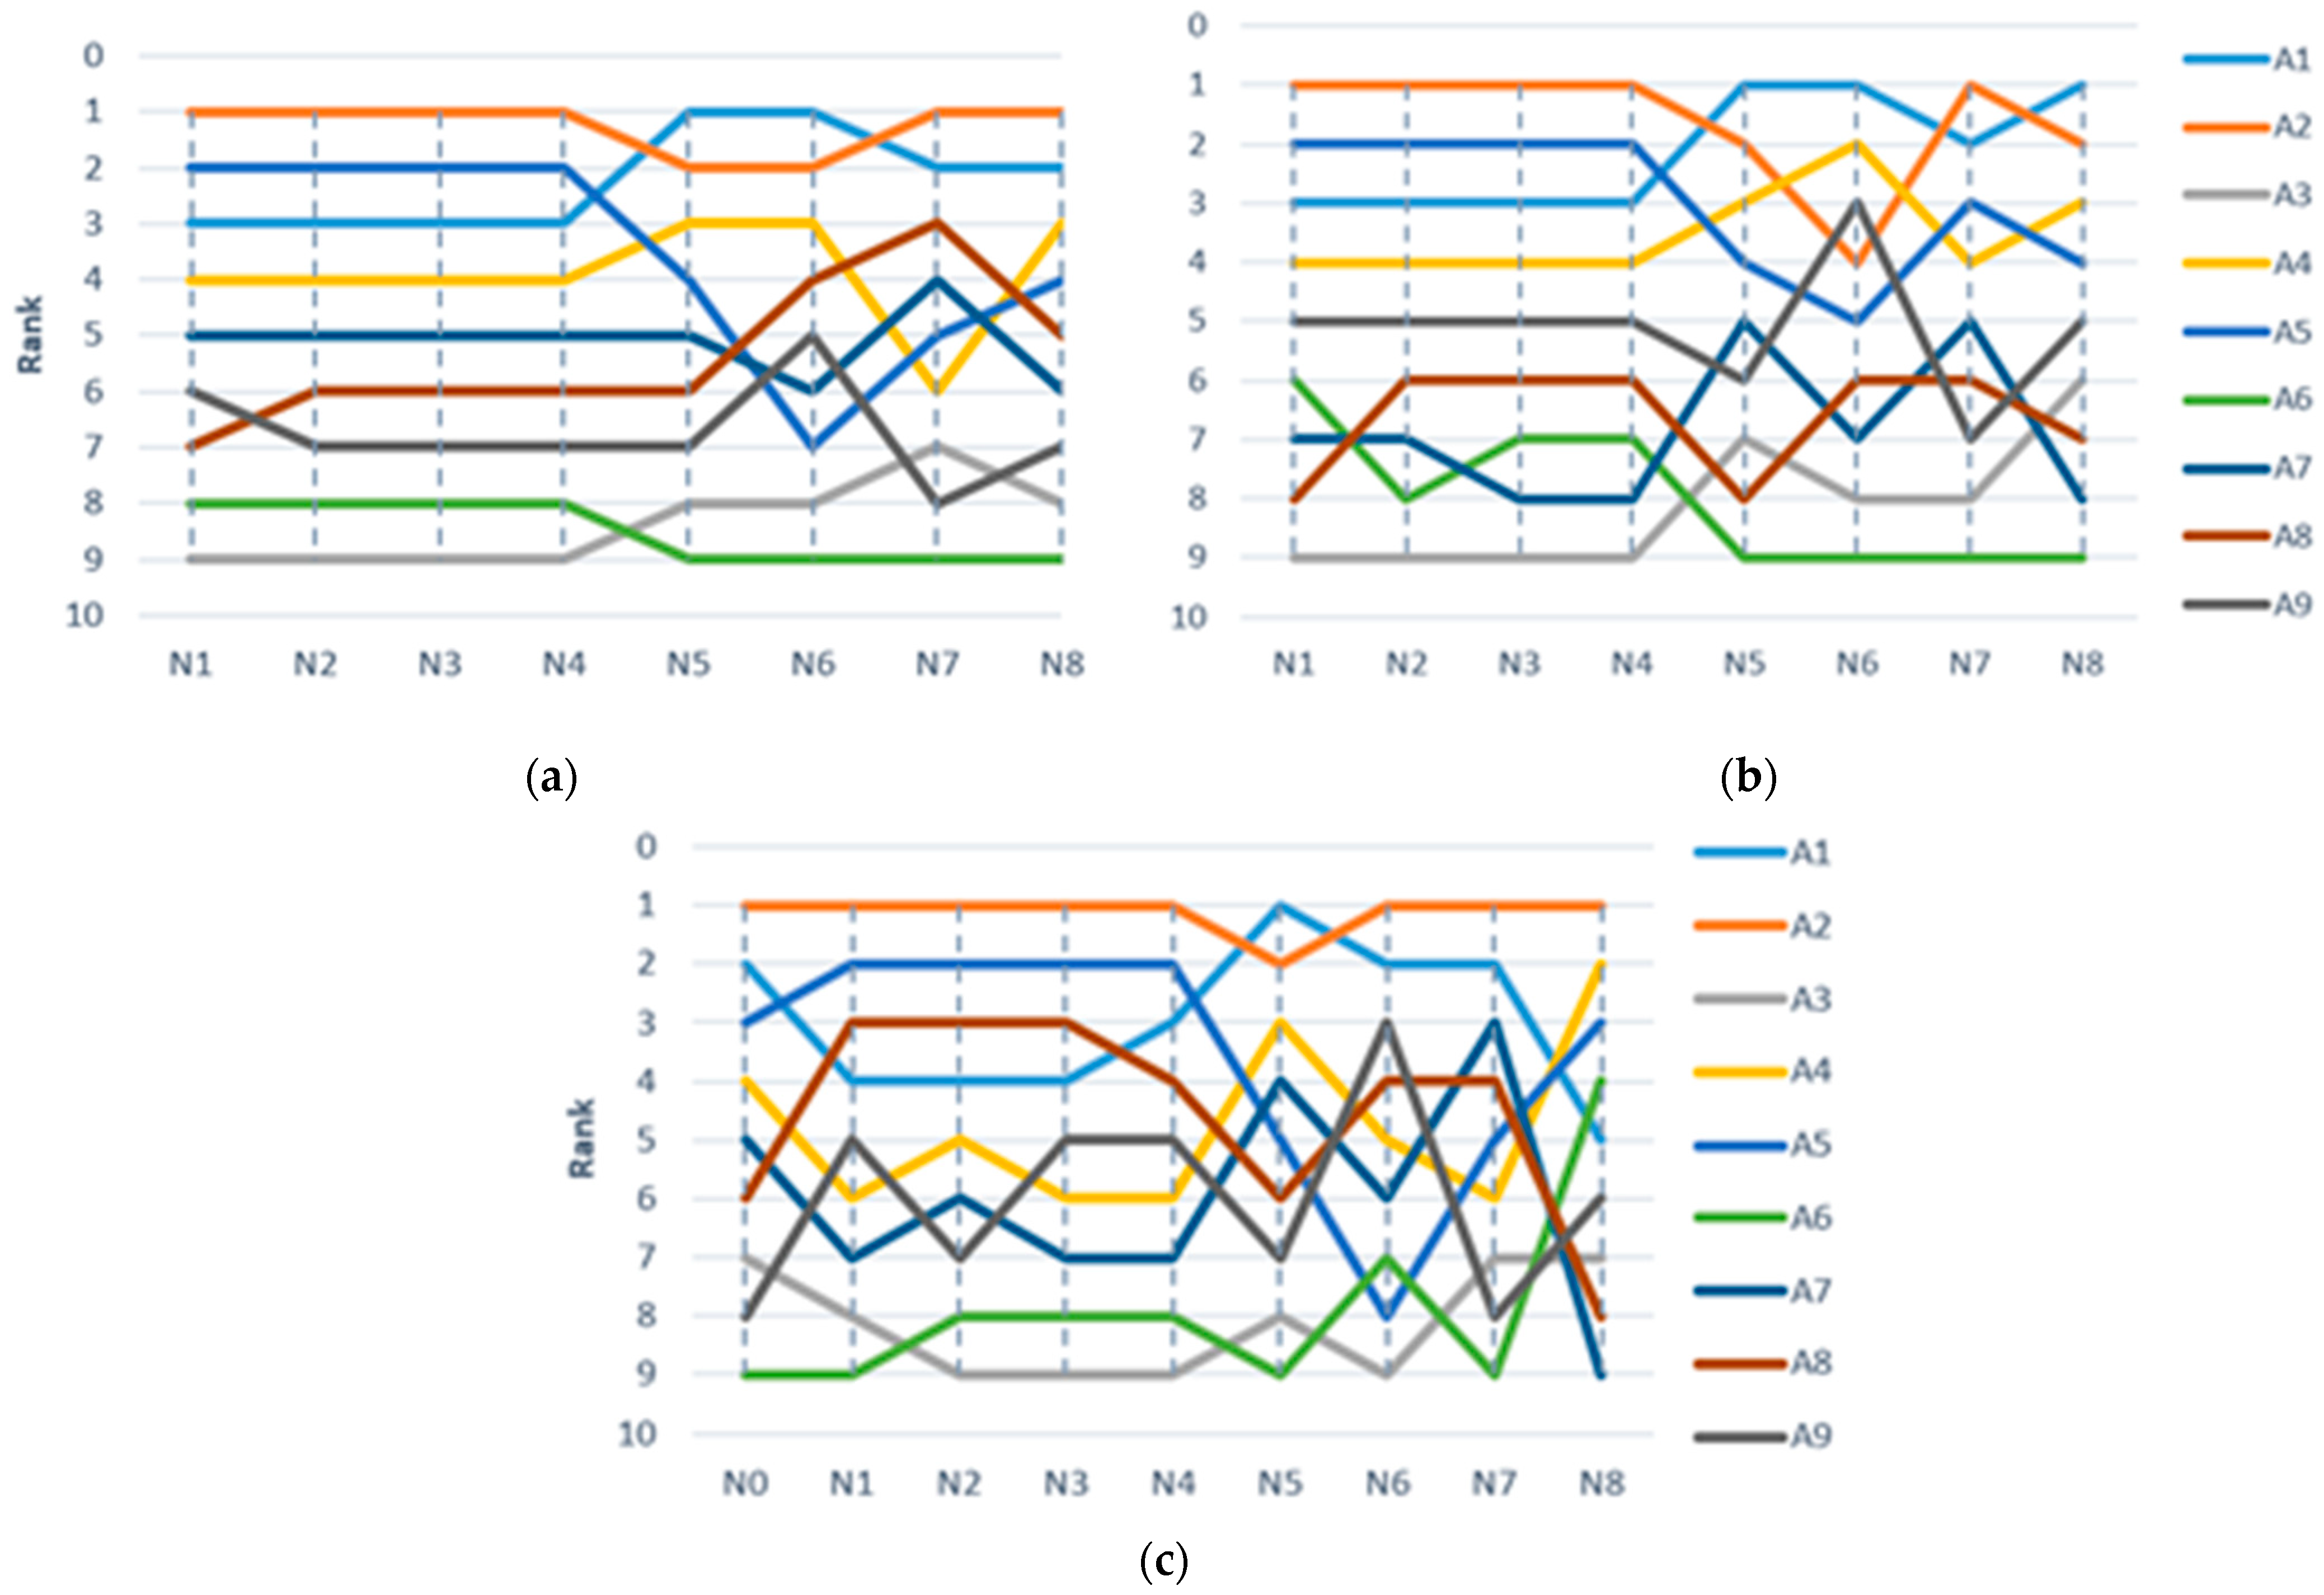
Figure 4a–c presents an alternatives ranking with fuzzy WSM, fuzzy TOPSIS and fuzzy VIKOR applying the analyzed normalization techniques. As we can see, for fuzzy WSM (Figure 4a), normalization techniques N1, N2, N3 and N4 give the same ranking result for A1, A2, A3, A4, A5, A6 and A7 alternatives. Applying N5, N6, N7 and N8 normalization techniques, alternative rankings change. Alternatives A2 and A6 have a more stable ranking, since their ranks change in one position.
Figure 4b presents a ranking of alternatives using fuzzy TOPSIS with the analyzed normalization techniques. As we can see, normalization techniques N1, N2, N3 and N4 (i.e., Vector, Linear Max, Linear Min-Max, and Linear Jüttler’s–Körth’s) give the same result for alternatives A1, A2, A3, A4 and A5 and A9. Applying N5, N6, N7 and N8 (i.e., Linear Sum*, Non-linear Peldschus, Non-linear Logarithmic, and Linear Max*) normalization techniques, alternative rankings change. No one alternative can be characterized as having a stable ranking with all analyzed normalization techniques in the fuzzy TOPSIS.
Figure 4c presents a ranking of alternatives using fuzzy VIKOR with the analyzed normalization techniques. As we can see, normalization techniques N1, N2 and N3 (i.e., Vector, Linear Max, Linear Min-Max) gives the same ranks for alternatives A1, A2, A5 and A8. Applying N2, N3 and N4 (i.e., Linear Max, Linear Min-Max and Linear Jüttler’s–Körth’s) normalization techniques, alternatives A6 and A3 give the same ranks. Applying N5, N6, N7 and N8 (i.e., Linear Sum*, Non-linear Peldschus, Non-linear Logarithmic, and Linear Max*) normalization techniques, alternative rankings change. No one alternative can be characterized as having a stable ranking with all analyzed normalization techniques in the fuzzy VIKOR. A2 has more stable ranks with a dominant rank—one. The alternative ranking using the default normalization technique for fuzzy VIKOR is most similar to the ranking using N7 (i.e., Non-linear Logarithmic).
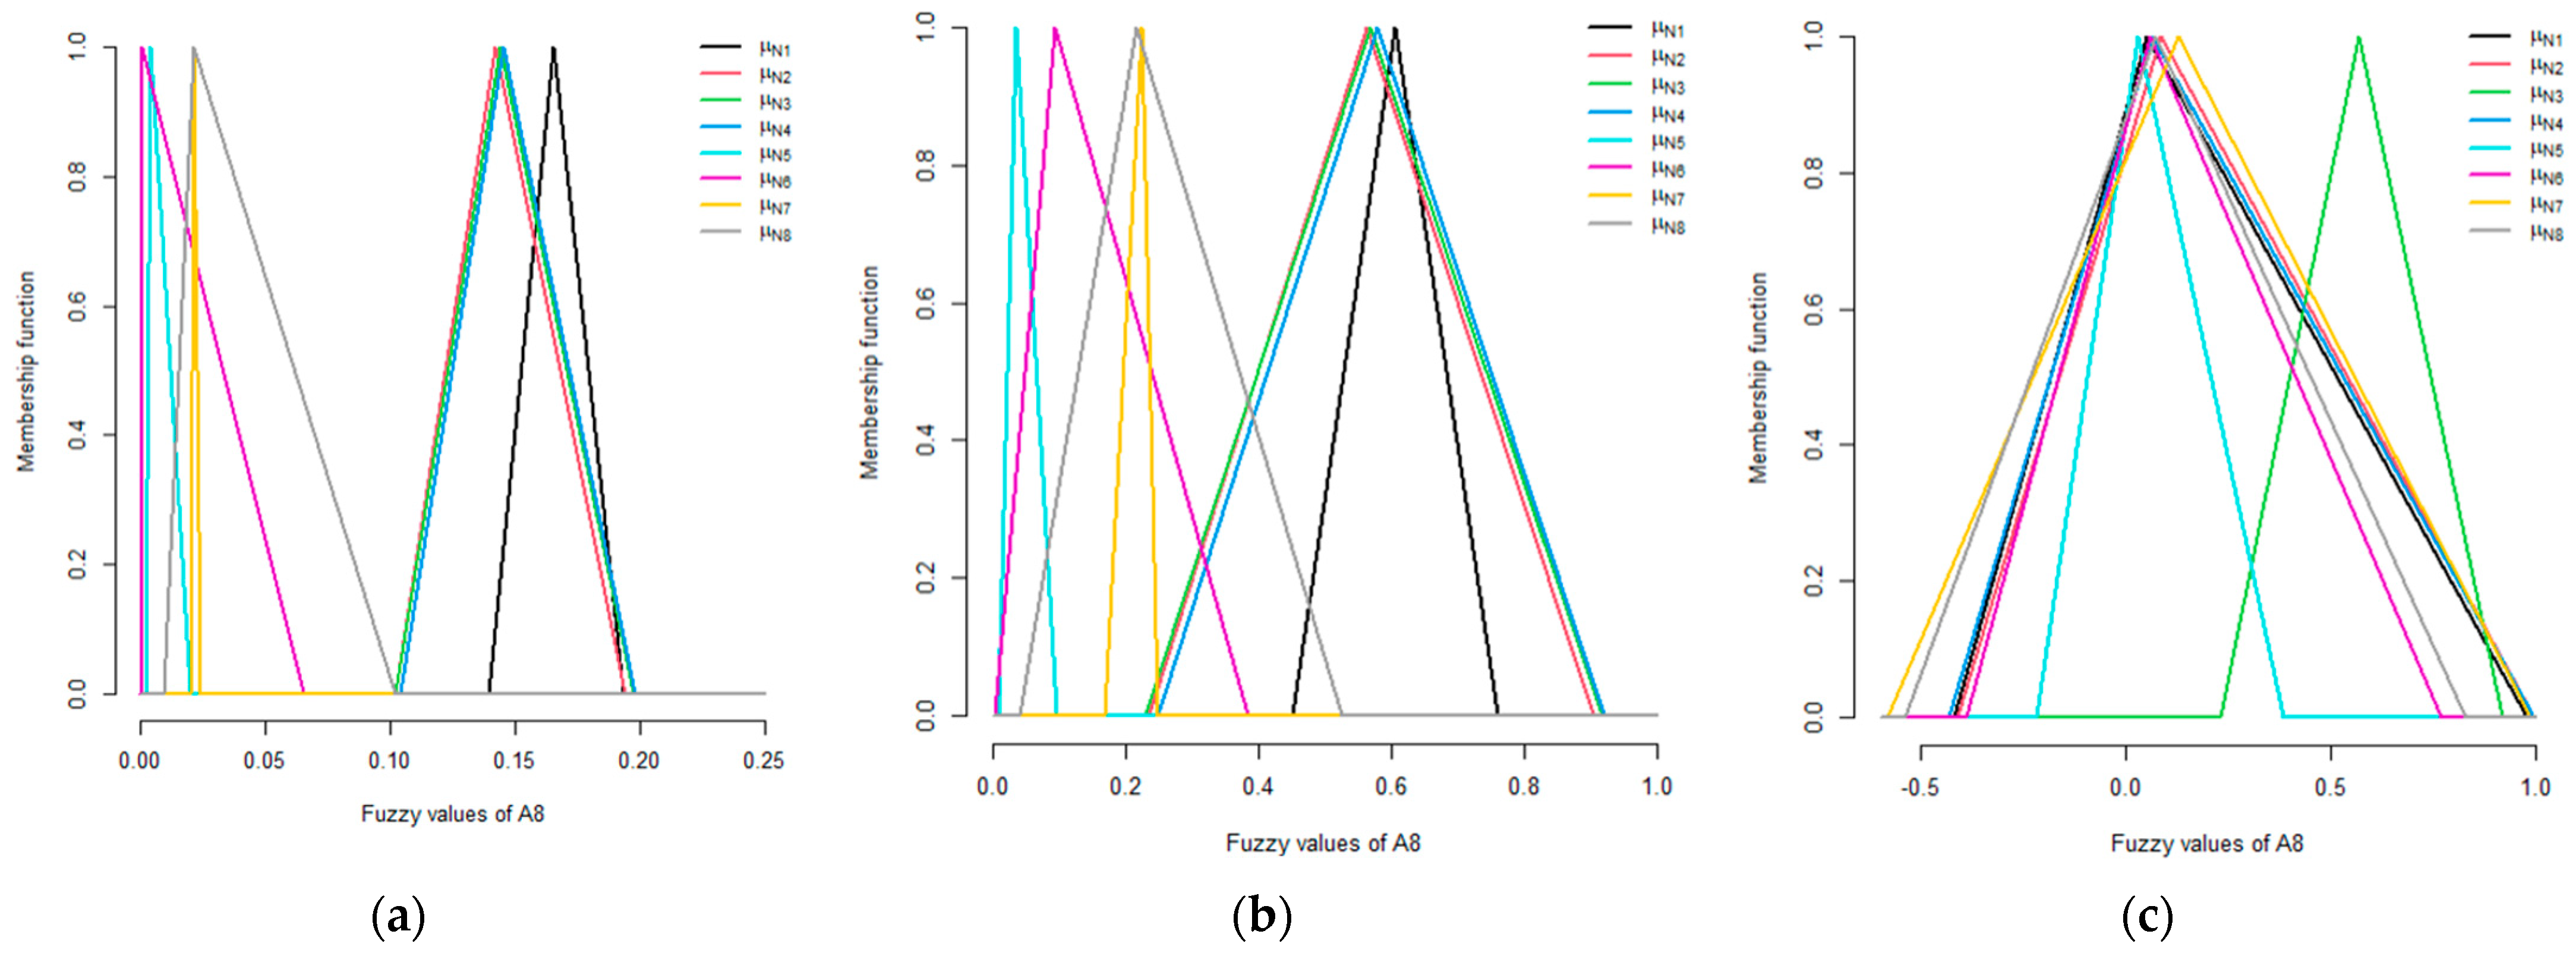
Figure 5 presents the change in A8 alternative preferences according to the eighth normalization techniques in fuzzy TOPSIS (Figure 5a), fuzzy WSM (Figure 5b) and fuzzy VIKOR (Figure 5c), since it is the most changing, i.e., unstable, alternative according to the analyzed normalization techniques. Its preferences presented by fuzzy triangular numbers vary from ranks 3 to 7 in fuzzy WSM, from ranks 6 to 8 in fuzzy TOPSIS and from ranks 3 to 8 in fuzzy VIKOR with a change in the normalization technique (Figure 4). The same can be said about the A5 alternative, the ranks of which are also very unstable (Figure 4).
Table 10 presents the Spearman correlation coefficients and p-values for ranks obtained by fuzzy WSM. According to the means of correlation coefficients, N8 (i.e., Linear Max*) has a greater correlation coefficient than the others; N6 (i.e., Non-linear Peldschus) has the smallest correlation coefficient among the others ( p > 0.05 ), especially with N1, N2, N3 and N4 (i.e., Vector, Linear Max, Linear Min-Max, and Linear Jüttler’s–Körth’s). N7 (i.e., Non-linear Logarithmic) has a non-significant correlation with N1 (Vector) ( p = 0.05 ). N2, N3 and N4 (i.e., Linear Max, Linear Min-Max, and Linear Jüttler’s–Körth’s) can be treated as very similar, giving the same alternative ranges with different normalization techniques in fuzzy WSM.
Table 11 presents the Spearman correlation coefficients and p-values for ranks obtained by fuzzy TOPSIS. According to the means of correlation coefficients, N2 (i.e., Linear Max) has a greater correlation coefficient than the others; N6 (i.e., Non-linear Peldschus) has the smallest correlation coefficient with N1 (i.e., Vector) ( p > 0.05 ), i.e., those normalization techniques differ. N3 (i.e., Linear Min-Max) and N4 (i.e., Linear Jüttler’s–Körth’s) can be treated as very similar, giving the same alternative ranges with different normalization techniques in fuzzy TOPSIS.
Table 12 presents the Spearman correlation coefficients and p-values for ranks obtained by fuzzy VIKOR. According to the means of correlation coefficients, N4 (i.e., Linear Jüttler’s–Körth’s) has a greater correlation coefficient than the others, N8 (i.e., Linear Max*) has the smallest and insignificant correlation coefficient ( p > 0.05 ). Default normalization techniques strongly correlate with N5 (i.e., Linear Sum*) and N7 (i.e., Non-linear Logarithmic), but are uncorrelated with N6 (i.e., Non-linear Peldschus) and N8 (i.e., Linear Max*).
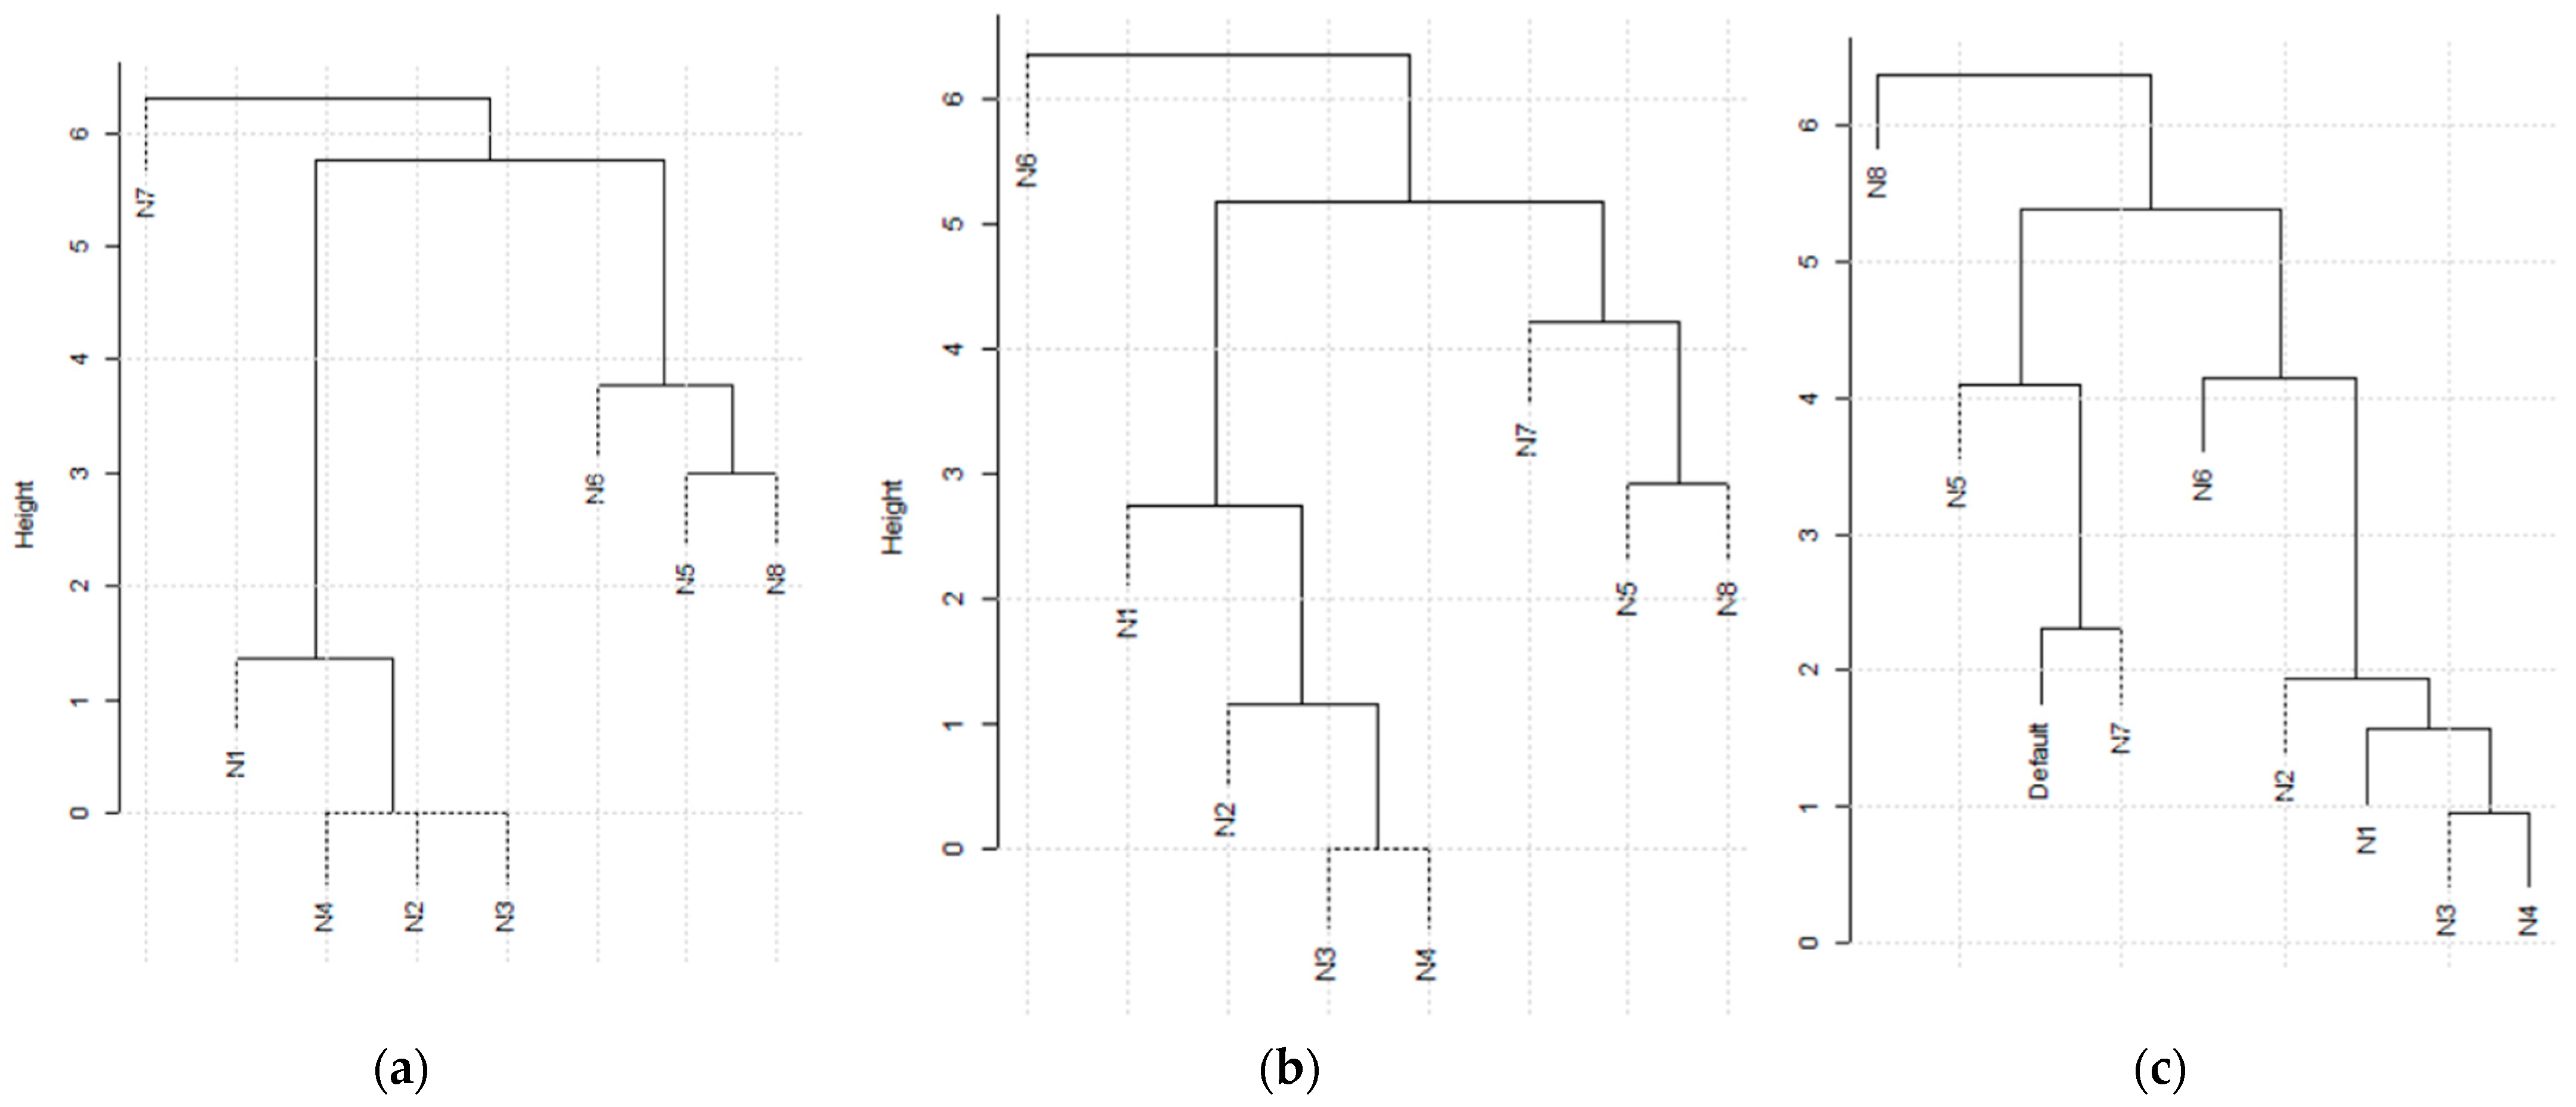
Figure 6 presents the similarities between the analyzed normalization techniques using the hierarchical clustering Complete Linkage method, which is based on Euclidian distances. From the figure, we can see that the structure of the hierarchical clustering obtained with fuzzy WSM (Figure 6a), fuzzy TOPSIS (Figure 6b) has a similar structure of hierarchical clustering to fuzzy VIKOR (Figure 6c). Figure 6 shows that N1, N2, N3 and N4 (i.e., Vector, Linear Max, Linear Min-Max, and Linear Jüttler’s–Körth’s) give similar results for ranking and are assigned to a single cluster. The clusters of the other normalization techniques, N5, N6, N7 and N8 (i.e., Linear Sum*, Non-linear Peldschus, Non-linear Logarithmic and Linear Max*), differ when different fuzzy MCDM methods are used. The default normalization of fuzzy VIKOR is similar to N7 (i.e., Non-linear Logarithmic) because they belong to the same cluster.
The obtained correlation analysis results and the hierarchical clustering results do not contradict each other. Therefore, we can now move on to the discussion of the results obtained.

6. Discussion

The analysis of the related works on the effect of normalization techniques shows that it is an important research topic, becoming more vital with the growth of data (i.e., quantity and variability) used for the decision-making process. Most of the related work analyzed shows that normalization techniques influence the alternative ranking when experiments with crisp data are performed. Nevertheless, there is a knowledge gap on the effect of normalization techniques on alternative rankings in MCDM methods with fuzzy data. This gap can be explained by the calculations required during the experiments. Moreover, there is no consensus on how to convert some of the normalization techniques described for crisp data into appropriate and corresponding normalization techniques for fuzzy data. For example, if it was a Linear Sum normalization with crisp data, it would remain a Linear Sum normalization with fuzzy data.
Analyzing the normalization technique used in this research, equivalents to fuzzy data were found in the literature for the Vector (N1) benefit criteria, Linear Max (N2) benefit criteria, Linear Min-Max (N3) benefit and cost criteria, Linear Sum (N5) benefit criteria, and Linear Max* (N8) benefit and cost criteria normalization techniques. For the Linear Jüttler’s–Körth’s (N4), Non-Linear Peldschus (N6), and Non-linear Logarithmic (N7) normalization techniques, we did not find equivalent equations for fuzzy data. Therefore, to conduct an experiment, appropriate equations for the mentioned normalization techniques (the literature for the Vector (N1) cost criteria, Linear Max (N2) cost criteria, Linear Sum (N5) cost criteria, Linear Jüttler’s–Körth’s (N4), Non-linear Peldschus (N6), and Non-linear Logarithmic (N7)) were proposed in Table 7, based on the arithmetic operations for fuzzy triangular numbers (see Table 1).
The obtained results show that the Linear (N2, N3 and N4) and Vector (N1) normalization techniques have little effect on the ranking of alternatives, i.e., the ranking of alternatives does not change or changes insignificantly with a change in those Linear and Vector normalization techniques. This is because, in those Linear (N2, N3 and N4) and Vector (N1) normalization techniques, a linear transformation of data is applied. This result is also confirmed by the strong linear correlation between these (N1, N2, N3 and N4) normalization techniques. However, the application of the Linear Sum (N5), Linear Max* (N8), Non-linear Peldschus (N6) and Non-linear Logarithmic (N7) normalization techniques strongly influences the ranking of alternatives. This result is also confirmed by the weak correlation of these techniques with other previously discussed normalization techniques. This is because, in Non-linear Peldschus (N6) and Non-linear Logarithmic (N7) normalization techniques, a non-linear transformation of data is applied for benefit and cost criteria. In Linear Sum (N5) and Linear Max* (N8) normalization techniques, a non-linear transformation of data is applied only for cost criteria. Therefore, the application of Linear Sum (N5) and Linear Max* (N8) normalization techniques can produce chaotic ranking results that can be seen in Figure 6. Summing up, those normalization techniques (Linear Sum (N5) and Linear Max* (N8)) should be examined in detail and this will be the case for future work.
The application of the hierarchical clustering method shows that eight analyzed normalization techniques can be grouped into three general clusters. Those clusters are different for fuzzy TOPSIS, fuzzy WSM and fuzzy VIKOR. Nevertheless, the similarity between those clusters is that Vector (N1), Linear Max (N2), Linear Min-Max (N3) and Linear Jüttler’s–Körth’s (N4) normalization techniques fall into one cluster when applying analyzed fuzzy MCDM methods. This means that, with these normalization techniques (N1, N2, N3 and N4), and applying the analyzed fuzzy MCDM methods (i.e., fuzzy TOPSIS, fuzzy WSM and fuzzy VIKOR), the ranking of the alternatives will be very similar, and therefore there is no big difference as to which MCDM method (i.e., fuzzy TOPSIS, fuzzy WSM and fuzzy VIKOR) and which normalization technique (i.e., N1, N2, N3 and N4) we will choose. However, other normalization techniques fall into different clusters with different MCDM methods. Why this happens requires further research. Such clustering can be obtained because of the nature of normalization formulas. For example, the reason Vector (N1), Linear Max (N2), Linear Min-Max (N3) and Linear Jüttler’s–Körth’s (N4) normalization techniques fall into one cluster could be the linear nature of the formulas. Consequently, the normalized decision-making matrices produced by these techniques are highly similar in terms of Euclidean distance. This similarity leads to comparable alternative rankings, small inter-method distances, and assignment to the same hierarchical cluster. Moreover, we can predict that, in this case, the clustering could reflect a methodological equivalence of the normalization formulas rather than their coincidence.
The differing clustering behavior of N5–N8 (i.e., Linear Sum*, Non-linear Peldschus, Non-linear Logarithmic, and Linear Max*) is mainly due to the use of non-linear transformations or modified linear schemes. These normalization techniques alter the distribution shape of normalized values and amplify or suppress differences between alternatives. Consequently, in this case, the clustering reflects a methodological difference in the normalization formulas.
The benefit and scientific contribution of this clustering is that it can be used to select the appropriate normalization technique based on the data used for the particular case study. For example, we know that in our case study, the data ranges in the interval [0; 1] that is not suitable for the application of the Logarithmic normalization technique. Based on the assumption of similarity of the normalization techniques, we can replace Logarithmic normalization (N7) with, for example, Linear Sum (N5) or Linear Max* (N8) when applying fuzzy TOPSIS. Therefore, in further work, it is necessary to investigate the influence of different normalization techniques on the ranking of alternatives in different fuzzy MCDM methods, so that they can be applied to research with various real-world data.
The results of correlational analysis show the highest sensitivity of fuzzy VIKOR, a moderate sensitivity of fuzzy TOPSIS and the least sensitivity of fuzzy WSM to changes in normalization techniques. Therefore, when applying fuzzy MCDM methods for the assessment of alternatives, we should think carefully and justify the choice of normalization technique. Moreover, in future works, we are going to extend the research to other fuzzy MCDM methods.
The visual analysis of the alternative preferences shows that all of them have a different range, i.e., the difference between the lowest ( a 1 ) and highest ( a 3 ) values of a fuzzy triangular number. Therefore, the question arises: how does the range of a fuzzy triangular number expressing the alternative preference affect the rank of this alternative by changing normalization techniques? Initial analysis shows that the smaller the range of a fuzzy triangular number expressing the alternative preference, the more variable the rank of this alternative. Consequently, the more likely it is that a change in the normalization technique will change the rank of the alternative among other alternatives. However, since the aim of this paper was different, we leave the detailed study of this issue for future works.
Other advantages and scientific contributions of this research include the use of real-world data (i.e., the WS QoS-QoE dataset [60]). The size and abundance of this dataset allowed us to select sufficiently different attributes and alternatives for the study, and examine in detail the effect of the Linear and Non-linear normalization techniques on the ranking of alternatives. In addition, an initial dataset analysis has shown that it is appropriate to use fuzzy numbers rather than crisp values to characterize alternative attributes, since some attribute values belong to outliers. The fuzzification of this data applying Tukey’s fences method allows us to define fuzzy triangular numbers and eliminate those outliers.
Summing up, the analyzed normalization techniques influence the alternative ranking with crisp and fuzzy data. Therefore, the choice of the MCDM method, which usually involves a predefined normalization technique, needs to take into account the alternatives under consideration, their attributes, and attribute characteristics (i.e., data type, range, etc.), as shown in this research with WS. In addition, it is important to continue the research on the effect of normalization techniques on the ranking of alternatives in MCDM methods with fuzzy data.

6.1. Practical Implication of the Current Research

Based on the results of the current research, the following practical implications can be presented:
  • Improved reliability of web service selection decisions—the findings of this research provide practical guidance for decision-makers, such as system architects, IT managers, and service integrators, involved in web service selection. By demonstrating that certain normalization techniques yield stable and consistent rankings across different fuzzy MCDM methods, the study helps practitioners reduce the risk of biased or misleading service quality evaluations. This supports more reliable service comparison and selection in dynamic web environments.
  • Guidance for choosing appropriate normalization techniques—the results highlight that normalization is not a neutral pre-processing step but a critical methodological choice that significantly influences decision outcomes. Practitioners implementing fuzzy WSM, fuzzy TOPSIS, or fuzzy VIKOR in web service quality assessments can use the current findings to select normalization techniques that ensure ranking robustness and to avoid normalization techniques that introduce unnecessary volatility into decision-making. This leads to a more transparent and defensible decision support process.
  • Enhanced design of decision support systems (DSSs)—developers of web service quality assessment tools and DSS platforms can incorporate the study’s insights by embedding recommended default normalization techniques, and allowing users to switch between normalization techniques and observe ranking changes. Such features improve DSS usability, trustworthiness, and adaptability to diverse evaluation contexts.
  • Support for quality-aware service composition and Service Level Agreement (SLA) management—the accurate ranking of web services directly impacts service composition, orchestration, and SLA negotiation. The identification of normalization techniques that preserve relative quality differences ensures more consistent QoS-based service compositions, and a reduced risk of selecting suboptimal services due to normalization-induced distortions. This is particularly relevant in cloud computing and service-oriented architectures.
  • Facilitation of sensitivity and robustness analysis—the observed differences between Linear and Non-linear normalization techniques offer practitioners a practical mechanism for conducting sensitivity analysis and identifying QoS criteria or services that are highly affected by data transformation. This supports proactive risk assessments and informed decision-making in uncertain or fuzzy evaluation environments.
  • Standardization and best-practice development—the research contributes to the development of best-practice guidelines for web service quality assessments by encouraging consistency in normalization choices across studies and applications, and improving comparability between evaluation results obtained by different organizations or tools. This has practical value for benchmarking web services and establishing industry standards.
  • Increased transparency and stakeholder confidence—by clarifying how normalization techniques affect fuzzy MCDM outcomes, the study enhances transparency in decision processes. This improves stakeholder confidence in automated service ranking systems, and the acceptance of fuzzy MCDM-based recommendations in operational environments.
Summing up, the practical takeaway can be formulated as follows. For practitioners evaluating web service quality using fuzzy MCDM, selecting an appropriate normalization technique is essential for ensuring stable, trustworthy, and interpretable ranking results. Linear normalization methods are particularly suitable for routine decision-making, while non-linear techniques should be used deliberately for sensitivity exploration.

6.2. Limitations of the Current Research and Further Development

The following limitations can be viewed in the current research and covered in the future work:
  • Limited set of normalization techniques analyzed in the research. Although eight Linear and Non-linear normalization techniques were analyzed, the study does not cover the full spectrum of existing normalization approaches. Other methods, including hybrid, dynamic, or context-aware normalization techniques, may produce different ranking behaviors and are left for future works.
  • Dependence on selected fuzzy MCDM methods. The current study is restricted to specific fuzzy MCDM methods (e.g., fuzzy WSM, fuzzy TOPSIS, and fuzzy VIKOR). Since different MCDM methods apply distinct aggregation and compromise mechanisms, the observed effects of normalization techniques may not be directly generalizable to other fuzzy MCDM approaches. In our future research, we are going to extend our experimentation with other fuzzy MCDM methods.
  • Sensitivity to Euclidean distance and clustering parameters. The similarity analysis relies on Euclidean distance and the Complete Linkage hierarchical clustering method. Alternative distance measures or clustering strategies could yield different similarity structures, potentially affecting the interpretation of normalization method relationships. Consequently, in future research, other distances and clustering approaches should be investigated.
  • Case study-specific data characteristics. The evaluation is based on a specific web service quality assessment dataset. Characteristics such as the number of services, QoS criteria distribution, and fuzziness of expert judgments may influence the results. Therefore, the findings may not fully generalize to other web service environments or domains.
  • Subjectivity in fuzzy modeling. The construction of fuzzy numbers, linguistic scales, and membership functions depends on expert judgment. Variations in expert opinions or fuzzy parameterization could alter normalized values and, consequently, ranking outcomes. Consequently, in future works, different fuzzification approaches should be investigated.
Summing up, while the study provides valuable insights into the influence of normalization techniques on fuzzy MCDM outcomes in web service quality assessments, its findings are constrained by methodological choices, data scope, and modeling assumptions, indicating the need for further empirical and methodological investigation.

7. Conclusions

This paper presents an approach to investigate the effect of eight well-known normalization techniques on WS ranking using fuzzy WSM, fuzzy TOPSIS and fuzzy VIKOR. The detailed description of the proposed approach allows us (1) to select alternatives and attributes from the large WS QoS dataset to form a decision-making matrix (DMM); (2) to form a fuzzy DMM using triangular fuzzy numbers in cases of uncertainty where the attributes are stochastic variables with a continuous probability distribution, based on the interquartile range (i.e., Tukey’s fences method); (3) to normalize an initial fuzzy DMM using the proposed eight normalization techniques; (4) to rank alternatives using fuzzy WSM, fuzzy TOPSIS and fuzzy VIKOR; and (5) to perform the correlation and clustering analysis to compare the normalization techniques analyzed. In conclusion, the scientific contribution and advantages of the proposed approach are that it is a systematic, multiple and complete method for evaluating the effect of normalization techniques with different MCDM methods.
Concluding the analysis of the normalization techniques, it is found that Vector (N1), Linear Max (N2), Linear Min-Max (N3) and Linear Jüttler’s–Körth’s (N4) normalization techniques in the applied fuzzy TOPSIS, fuzzy WSM and fuzzy VIKOR give a similar ranking of the alternatives. Therefore, these normalization techniques can be substituted for each other in the analyzed MCDM methods, depending on the specificity of data types used in the study. However, other normalization techniques give different ranking results and should be analyzed more in future research.
Summing up, our research contributes and addresses the lack of knowledge about the effects of normalization techniques on fuzzy MCDM methods, particularly fuzzy WSM, fuzzy TOPSIS and fuzzy VIKOR for WS QoS ranking. However, as was discussed before, some further research directions have been found.
For future research, it is necessary to investigate the effect of normalization techniques with different fuzzy numbers and different MCDM methods.

Author Contributions

Conceptualization, D.K. and R.S.; methodology, D.K. and R.S.; software, D.K. and R.S.; validation, D.K. and R.S.; formal analysis, R.S.; investigation, R.S.; resources, R.S.; data curation, R.S.; writing—original draft preparation, D.K. and R.S.; writing—review and editing, D.K. and R.S.; visualization, D.K. and R.S.; supervision, D.K.; funding acquisition, D.K. and R.S. All authors have read and agreed to the published version of the manuscript.

Funding

This research received no external funding.

Institutional Review Board Statement

Not applicable.

Informed Consent Statement

Not applicable.

Data Availability Statement

The dataset used in this research is publicly available—the large real-world QoS-QoE dataset [60].

Conflicts of Interest

The authors declare no conflicts of interest.

Abbreviations

The following abbreviations are used in this manuscript:
MCDMMulti-Criteria Decision-Making
WSMWeighted Sum Model
TOPSISTechnique for Order Preference by Similarity to Ideal Solution
VIKORVlse Kriterijumska Optimizacija Kompromisno Resenje
UoDUniverse of Discourse
MFMembership Function
QoSQuality-of-Service
QoEQuality-of-Experience
DMMDecision-Making Matrix

Appendix A

We claim that the formula below, using the values of the attributes, will form fuzzy triangular numbers as follows (Equation (A1)):
r ˜ i j = 1 x j l m i n x i j u x j u m a x ,   1 x j l m i n x i j m x j u m a x ,   1 x j l m i n x i j l x j u m a x ,
Suppose the prime triangular number is as follows:
The fuzzy number is a convex set on ℝ.
Fuzzy numbers must be convex, meaning that, in the case of a triangular number, its membership function must satisfy Equation (A2):
μ T r i a n g u = 0 , i f   u < a 1 , a 3 u , u a 1 a 2 a 1 , i f   a 1 u < a 2 , a 3 u a 3 a 2 , i f   a 2 u < a 3 ,
and the following inequality is true: a 1 < a 2 < a 3 .
Let us say the triangular fuzzy number is as follows: x i j l ,   x i j m ,   x i j u , which satisfies the properties of fuzzy numbers (monotonicity, boundedness, and behavior in limiting cases), then the following inequality is true: x i j l <   x i j m < x i j u .
To prove that our presented Equation (A1) will give a triangular number that satisfies the above inequality, we will examine the absolute values of the proposed formula, meaning that x j u m a x 0 .
x j l m i n x i j u x j u m a x ,   x j l m i n x i j m x j u m a x ,   x j l m i n x i j l x j u m a x
The denominators of all fractions are the same, x j u m a x 0 . Let us recall the modulus property:
x j l m i n x i j u x j u m a x = x j l m i n x i j u x j u m a x ,   x j u m a x 0 .
x j l m i n x i j m x j u m a x = x j l m i n x i j m x j u m a x ,   x j u m a x 0 .
x j l m i n x i j l x j u m a x = x j l m i n x i j l x j u m a x ,   x j u m a x 0 .
For the inequality, presented in (A4), to be true,
1 x j l m i n x i j u x j u m a x < 1 x j l m i n x i j m x j u m a x < 1 x j l m i n x i j l x j u m a x ,
the following inequality (A5) must be true:
x j l m i n x i j u x j u m a x > x j l m i n x i j m x j u m a x >   x j l m i n x i j l x j u m a x     .
Inequality (A5) will remain true if we multiply it by the denominator x j u m a x 0 (see Equation (A6)):
x j l m i n x i j u > x j l m i n x i j m >   x j l m i n x i j l .
Hence, inequality (A4) is also true. Hence, the resulting triangular number satisfies the properties expected for fuzzy triangular numbers: monotonicity, boundedness, and behavior in limiting cases.

References

  1. Malefaki, S.; Markatos, D.; Filippatos, A.; Pantelakis, S. A Comparative Analysis of Multi-Criteria Decision-Making Methods and Normalization Techniques in Holistic Sustainability Assessment for Engineering Applications. Aerospace 2025, 12, 100. [Google Scholar] [CrossRef]
  2. Vafaei, N.; Ribeiro, R.A.; Camarinha-Matos, L.M. Normalization Techniques for Multi-Criteria Decision Making: Analytical Hierarchy Process Case Study. In Proceedings of the IFIP Advances in Information and Communication Technology; Springer: Cham, Switzerland, 2016; Volume 470, pp. 261–268. [Google Scholar]
  3. D’Agostino, D.; De Falco, F.; Minelli, F.; Minichiello, F. New Robust Multi-Criteria Decision-Making Framework for Thermal Insulation of Buildings under Conflicting Stakeholder Interests. Appl. Energy 2024, 376, 124262. [Google Scholar] [CrossRef]
  4. Ploskas, N.; Papathanasiou, J. A Decision Support System for Multiple Criteria Alternative Ranking Using TOPSIS and VIKOR in Fuzzy and Nonfuzzy Environments. Fuzzy Sets Syst. 2019, 377, 1–30. [Google Scholar] [CrossRef]
  5. Hocaoğlu, M.; Tosun, E. Consensus Among Multi-Criteria Decision-Making Methods: Using Methods as Voters. J. Fac. Eng. Archit. Gazi Univ. 2025, 40, 103–120. [Google Scholar]
  6. Mhlanga, S.T.; Lall, M. Influence of Normalization Techniques on Multi-Criteria Decision-Making Methods. J. Phys. Conf. Ser. 2022, 2224, 012076. [Google Scholar]
  7. Pelissari, R.; Oliveira, M.C.; Abackerli, A.J.; Ben-Amor, S.; Assumpção, M.R.P. Techniques to Model Uncertain Input Data of Multi-criteria Decision-making Problems: A Literature Review. Int. Trans. Oper. Res. 2021, 28, 523–559. [Google Scholar] [CrossRef]
  8. Zadeh, L.A. Fuzzy Sets. Inf. Control 1965, 8, 338–353. [Google Scholar] [CrossRef]
  9. Luo, X.; Gong, Z.; Guo, W.; Wei, G.; Jin, T. On Disaggregation Modeling of Uncertainty Group Preferences Considering Trust Networks. Fuzzy Optim. Decis. Mak. 2025, 24, 29–68. [Google Scholar] [CrossRef]
  10. Dymova, L.; Kaczmarek, K.; Sevastjanov, P.; Kulawik, J. A Fuzzy Multiple Criteria Decision Making Approach with a Complete User Friendly Computer Implementation. Entropy 2021, 23, 203. [Google Scholar] [CrossRef] [PubMed]
  11. Mardani, A.; Jusoh, A.; Zavadskas, E.K. Fuzzy Multiple Criteria Decision-Making Techniques and Applications—Two Decades Review from 1994 to 2014. Expert Syst. Appl. 2015, 42, 4126–4148. [Google Scholar] [CrossRef]
  12. Wen, Z.; Liao, H.; Zavadskas, E.K.; Antuchevičienė, J. Applications of fuzzy multiple criteria decision making methods in civil engineering: A state-of-the-art survey. J. Civ. Eng. Manag. 2021, 27, 358–371. [Google Scholar] [CrossRef]
  13. Zakeri, S.; Konstantas, D.; Chatterjee, P.; Zavadskas, E.K. Soft Cluster-Rectangle Method for Eliciting Criteria Weights in Multi-Criteria Decision-Making. Sci. Rep. 2025, 15, 284. [Google Scholar] [CrossRef]
  14. Rogulj, K.; Kilić Pamuković, J.; Antucheviciene, J.; Zavadskas, E.K. Intuitionistic Fuzzy Decision Support Based on EDAS and Grey Relational Degree for Historic Bridges Reconstruction Priority. Soft Comput. 2022, 26, 9419–9444. [Google Scholar] [CrossRef]
  15. Demir, A.T.; Moslem, S. A Novel Fuzzy Multi-Criteria Decision-Making for Enhancing the Management of Medical Waste Generated during the Coronavirus Pandemic. Eng. Appl. Artif. Intell. 2024, 133, 108465. [Google Scholar] [CrossRef]
  16. Alsalem, M.A.; Alamoodi, A.H.; Albahri, O.S.; Albahri, A.S.; Martínez, L.; Yera, R.; Duhaim, A.M.; Sharaf, I.M. Evaluation of Trustworthy Artificial Intelligent Healthcare Applications Using Multi-Criteria Decision-Making Approach. Expert Syst. Appl. 2024, 246, 123066. [Google Scholar] [CrossRef]
  17. Alkan, Ö.; Albayrak, Ö.K. Ranking of Renewable Energy Sources for Regions in Turkey by Fuzzy Entropy Based Fuzzy COPRAS and Fuzzy MULTIMOORA. Renew. Energy 2020, 162, 712–726. [Google Scholar] [CrossRef]
  18. Kara, B.; Ayyildiz, E.; Kavus, B.Y.; Karaca, T.K. Evaluating Cybersecurity Measures for Smart Grids Under Uncertainty: A Picture Fuzzy SWARA–CODAS Approach. Appl. Sci. 2025, 15, 10704. [Google Scholar] [CrossRef]
  19. Janusonis, E.; Kazakeviciute-Januskeviciene, G.; Bausys, R. Selection of Optimal Segmentation Algorithm for Satellite Images by Intuitionistic Fuzzy PROMETHEE Method. Appl. Sci. 2024, 14, 644. [Google Scholar] [CrossRef]
  20. Chen, X.; Sun, W.; Zhang, R. An Interval-Valued Neutrosophic Framework: Improved VIKOR with a Preference-Aware AHP–Entropy Weight Method for Evaluating Scalp-Detection Algorithms. Appl. Sci. 2025, 15, 11937. [Google Scholar] [CrossRef]
  21. Özdağoğlu, A.; Keleş, M.K.; Şenefe, M. Evaluation of Banks in Terms of Customer Preferences with Fuzzy SWARA and Fuzzy MOORA Integrated Approach. J. Decis. Anal. Intell. Comput. 2024, 4, 216–232. [Google Scholar] [CrossRef]
  22. Kamarul Zaman, M.M.; Rodzi, Z.M.; Andu, Y.; Shafie, N.A.; Sanusi, Z.M.; Ghazali, A.W.; Mahyideen, J.M. Adaptive Utility Ranking Algorithm for Evaluating Blockchain-Enabled Microfinance in Emerging—A New MCDM Perspective. Int. J. Econ. Sci. 2025, 14, 123–146. [Google Scholar] [CrossRef]
  23. Turgay, S.; Başar, E.E.; Çalışan, M.; Geçkil, M.F.; Baydaş, M.; Stević, Ž. Enhancing Decision Quality in Smart Manufacturing: Uncertainty-Aware Evaluation of Edge–Cloud Architectures with T-Spherical Hesitant Fuzzy Rough Sets. Int. J. Comput. Methods Exp. Meas. 2025, 13, 211–225. [Google Scholar] [CrossRef]
  24. Ly, P.T.M.; Lai, W.-H.; Hsu, C.-W.; Shih, F.-Y. Fuzzy AHP Analysis of Internet of Things (IoT) in Enterprises. Technol. Forecast. Soc. Change 2018, 136, 1–13. [Google Scholar] [CrossRef]
  25. Yilmaz, I. A Hybrid DEA–Fuzzy COPRAS Approach to the Evaluation of Renewable Energy: A Case of Wind Farms in Turkey. Sustainability 2023, 15, 11267. [Google Scholar] [CrossRef]
  26. Kalibatiene, D.; Miliauskaitė, J. A Dynamic Fuzzification Approach for Interval Type-2 Membership Function Development: Case Study for QoS Planning. Soft Comput. 2021, 25, 11269–11287. [Google Scholar] [CrossRef]
  27. Ramasamy, P.; Kandhasamy, P. Effect of Intuitionistic Fuzzy Normalization in Microarray Gene Selection. Turk. J. Electr. Eng. Comput. Sci. 2018, 26, 1141–1152. [Google Scholar] [CrossRef]
  28. Kim, S.Y.; Lee, J.W.; Bae, J.S. Effect of Data Normalization on Fuzzy Clustering of DNA Microarray Data. BMC Bioinform. 2006, 7, 134. [Google Scholar] [CrossRef][Green Version]
  29. Zadeh, L.A. The Concept of a Linguistic Variable and Its Application to Approximate Reasoning—III. Inf. Sci. 1975, 9, 43–80. [Google Scholar] [CrossRef]
  30. Zadeh, L.A. The Concept of a Linguistic Variable and Its Application to Approximate Reasoning—II. Inf. Sci. 1975, 8, 301–357. [Google Scholar] [CrossRef]
  31. Zadeh, L.A. The Concept of a Linguistic Variable and Its Application to Approximate Reasoning—I. Inf. Sci. 1975, 8, 199–249. [Google Scholar] [CrossRef]
  32. Miliauskaitė, J.; Kalibatiene, D. On General Framework of Type-1 Membership Function Construction: Case Study in QoS Planning. Int. J. Fuzzy Syst. 2020, 22, 504–521. [Google Scholar] [CrossRef]
  33. Choi, B.I.; Rhee, F.C.H. Interval Type-2 Fuzzy Membership Function Generation Methods for Pattern Recognition. Inf. Sci. 2009, 179, 2102–2122. [Google Scholar] [CrossRef]
  34. Zimmermann, H.J. Fuzzy Set Theory—And Its Applications, 4th ed.; Springer: Dordrecht, The Netherlands, 2001. [Google Scholar]
  35. Triantaphyllou, E. Multi-Criteria Decision Making Methods: A Comparative Study; Springer: New York, NY, USA, 2000; ISBN 978-1-4419-4838-0. [Google Scholar]
  36. Nădăban, S.; Dzitac, S.; Dzitac, I. Fuzzy TOPSIS: A General View. Procedia Comput. Sci. 2016, 91, 823–831. [Google Scholar] [CrossRef]
  37. Ceballos, B.; Lamata, M.T.; Pelta, D.A. Fuzzy Multicriteria Decision-Making Methods: A Comparative Analysis. Int. J. Intell. Syst. 2017, 32, 722–738. [Google Scholar] [CrossRef]
  38. Chen, S.-J.; Hwang, C.-L. Fuzzy Multiple Attribute Decision Making Methods. In Fuzzy Multiple Attribute Decision Making: Methods and Applications; Springer: Berlin/Heidelberg, Germany, 1992; pp. 289–486. [Google Scholar] [CrossRef]
  39. Ceballos, B.; Lamata, M.T.; Pelta, D.A. A Comparative Analysis of Multi-Criteria Decision-Making Methods. Prog. Artif. Intell. 2016, 5, 315–322. [Google Scholar] [CrossRef]
  40. Chen, S.H. Ranking Fuzzy Numbers with Maximizing Set and Minimizing Set. Fuzzy Sets Syst. 1985, 17, 113–129. [Google Scholar] [CrossRef]
  41. Ouraki, K.; Hadi-Vencheh, A.; Jamshidi, A.; Karbassi Yazdi, A. An Enhanced Hierarchical Fuzzy TOPSIS-ANP Method for Supplier Selection in an Uncertain Environment. Mathematics 2025, 13, 3417. [Google Scholar] [CrossRef]
  42. Jafaryeganeh, H.; Ventura, M.; Guedes Soares, C. Effect of Normalization Techniques in Multi-Criteria Decision Making Methods for the Design of Ship Internal Layout from a Pareto Optimal Set. Struct. Multidiscip. Optim. 2020, 62, 1849–1863. [Google Scholar] [CrossRef]
  43. Vafaei, N.; Ribeiro, R.A.; Camarinha-Matos, L.M. Data Normalisation Techniques in Decision Making: Case Study with TOPSIS Method. Int. J. Inf. Decis. Sci. 2018, 10, 19–38. [Google Scholar] [CrossRef]
  44. Vafaei, N.; Ribeiro, R.A.; Camarinha-Matos, L.M. Selection of Normalization Technique for Weighted Average Multi-Criteria Decision Making. In Proceedings of the Technological Innovation for Resilient Systems: 9th IFIP WG 5.5/SOCOLNET Advanced Doctoral Conference on Computing, Electrical and Industrial Systems, DoCEIS 2018, Costa de Caparica, Portugal, 2–4 May 2018; IFIP Advances in Information and Communication Technology Series; Springer: Cham, Switzerland, 2018; Volume 521, pp. 43–52. [Google Scholar] [CrossRef]
  45. Vafaei, N.; Ribeiro, R.A.; Camarinha-Matos, L.M. Comparison of Normalization Techniques on Data Sets with Outliers. Int. J. Decis. Support Syst. Technol. 2022, 14, 1–17. [Google Scholar] [CrossRef]
  46. Celen, A. Comparative Analysis of Normalization Procedures in TOPSIS Method: With an Application to Turkish Deposit Banking Market. Informatica 2014, 25, 185–208. [Google Scholar] [CrossRef]
  47. Pena, J.C.; Nápoles, G.; Salgueiro, Y. Normalization Method for Quantitative and Qualitative Attributes in Multiple Attribute Decision-Making Problems. Expert Syst. Appl. 2022, 198, 116821. [Google Scholar] [CrossRef]
  48. Petrović, G.; Mihajlović, J.; Ćojbašić, Ž.; Madić, M.; Marinković, D. Comparison of three fuzzy MCDM methods for solving THE supplier selection problem. Facta Univ. Ser. Mech. Eng. 2019, 17, 455. [Google Scholar] [CrossRef]
  49. Zhou, X.; Zhang, R.; Yang, K.; Yang, C.; Huang, T. Using Hybrid Normalization Technique and State Transition Algorithm to VIKOR Method for Influence Maximization Problem. Neurocomputing 2020, 410, 41–50. [Google Scholar] [CrossRef]
  50. Vafaei, N.; Ribeiro, R.A.; Camarinha-Matos, L.M. Selecting Normalization Techniques for the Analytical Hierarchy Process. In Proceedings of the Technological Innovation for Life Improvement: 11th IFIP WG 5.5/SOCOLNET Advanced Doctoral Conference on Computing, Electrical and Industrial Systems, DoCEIS 2020, Costa de Caparica, Portugal, 1–3 July 2020; IFIP Advances in Information and Communication Technology Series; Springer: Cham, Switzerland, 2020; Volume 577, pp. 43–52. [Google Scholar] [CrossRef]
  51. Chatterjee, P.; Chakraborty, S. Investigating the Effect of Normalization Norms in Flexible Manufacturing Sytem Selection Using Multi-Criteria Decision-Making Methods. J. Eng. Sci. Technol. Rev. 2014, 7, 141–150. [Google Scholar] [CrossRef]
  52. Ardil, C. Aircraft Selection Using Multiple Criteria Decision Making Analysis Method with Different Data Normalization Techniques Image Denoising View Project. Int. J. Ind. Syst. Eng. 2019, 13, 744–756. [Google Scholar]
  53. Ersoy, N. Selecting the Best Normalization Technique for Rov Method: Towards a Real Life Application. Gazi Univ. J. Sci. 2021, 34, 592–609. [Google Scholar] [CrossRef]
  54. Mathew, M.; Sahu, S.; Upadhyay, A.K. Effect of Normalization Techniques in Robot Selection Using Weighted Aggregated Sum Product Assessment. Int. J. Innov. Res. Adv. Stud. (IJIRAS) 2017, 4, 59–63. [Google Scholar]
  55. Zolfani, S.H.; Yazdani, M.; Pamucar, D.; Zarate, P. A Vikor and Topsis Focused Reanalysis of the Madm Methods Based on Logarithmic Normalization. Facta Univ. Ser. Mech. Eng. 2020, 18, 341–355. [Google Scholar] [CrossRef]
  56. Markovic, Z. Modification of TOPSIS Method for Solving of Multicriteria Tasks. Yugosl. J. Oper. Res. 2010, 20, 117–143. [Google Scholar] [CrossRef]
  57. Tzeng, G.; Huang, J. Multiple Attribute Decision Making: Methods and Applications; CRC Press: Boca Raton, FL, USA, 2011. [Google Scholar]
  58. Jagtap, M.; Karande, P. Effect of Normalization Techniques and Criteria Weight Calculation Methodologies on Nontraditional Machining Process Rank for M-Polar Fuzzy Set ELECTRE-I Algorithm. Cogent Eng. 2024, 11, 2367744. [Google Scholar] [CrossRef]
  59. Yu, L.; Pan, Y.; Wu, Y. Research on Data Normalization Methods in Multi-Attribute Evaluation. In Proceedings of the 2009 International Conference on Computational Intelligence and Software Engineering, Wuhan, China, 11–13 December 2009. [Google Scholar]
  60. Vasilev, V.; Leguay, J.; Paris, S.; Maggi, L.; Debbah, M. Predicting QoE Factors with Machine Learning. In Proceedings of the 2018 IEEE International Conference on Communications (ICC), Kansas City, MO, USA, 20–24 May 2018. [Google Scholar]
  61. Basu, S.; Meckesheimer, M. Automatic Outlier Detection for Time Series: An Application to Sensor Data. Knowl. Inf. Syst. 2007, 11, 137–154. [Google Scholar] [CrossRef]
  62. Liu, Y.; Dillon, T.; Yu, W.; Rahayu, W.; Mostafa, F. Noise Removal in the Presence of Significant Anomalies for Industrial IoT Sensor Data in Manufacturing. IEEE Internet Things J. 2020, 7, 7084–7096. [Google Scholar] [CrossRef]
  63. Zhao, T.; Li, P.; Cao, J. Self-Organising Interval Type-2 Fuzzy Neural Network with Asymmetric Membership Functions and Its Application. Soft Comput. 2019, 23, 7215–7228. [Google Scholar] [CrossRef]
  64. Sanchez, M.A.; Castro, J.R.; Castillo, O.; Mendoza, O.; Rodriguez-Diaz, A.; Melin, P. Fuzzy Higher Type Information Granules from an Uncertainty Measurement. Granul. Comput. 2017, 2, 95–103. [Google Scholar] [CrossRef]
  65. Hwang, C.-L.; Yoon, K. Methods for Multiple Attribute Decision Making. In Multiple Attribute Decision Making: Methods and Applications—A State-of-the-Art Survey; Springer: Berlin/Heidelberg, Germany, 1981; pp. 58–191. [Google Scholar] [CrossRef]
  66. Ocampo, L.; Genimelo, G.J.; Lariosa, J.; Guinitaran, R.; Borromeo, P.J.; Aparente, M.E.; Capin, T.; Bongo, M. Warehouse Location Selection with TOPSIS Group Decision-Making under Different Expert Priority Allocations. Eng. Manag. Prod. Serv. 2020, 12, 22–39. [Google Scholar] [CrossRef]
  67. Hung, C.C.; Chen, L.H. A Fuzzy TOPSIS Decision Making Model with Entropy Weight under Intuitionistic Fuzzy Environment. In Proceedings of the International MultiConference of Engineers and Computer Scientists, Hong Kong, China, 18–20 March 2009. [Google Scholar]
  68. Triantaphyllou, E. Multi-Criteria Decision Making Methods. In Multi-Criteria Decision Making Methods: A Comparative Study; Springer: New York, NY, USA, 2000; pp. 5–21. [Google Scholar] [CrossRef]
  69. Triantaphyllou, E.; Baig, K. The Impact of Aggregating Benefit and Cost Criteria in Four MCDA Methods. IEEE Trans. Eng. Manag. 2005, 52, 213–226. [Google Scholar] [CrossRef]
  70. Opricovic, S.; Tzeng, G.-H. Compromise Solution by MCDM Methods: A Comparative Analysis of VIKOR and TOPSIS. Eur. J. Oper. Res. 2004, 156, 445–455. [Google Scholar] [CrossRef]
  71. Junior, F.R.L.; Hsiao, M. A Hesitant Fuzzy Topsis Model to Supplier Performance Evaluation. DYNA Colomb. 2021, 88, 126–135. [Google Scholar] [CrossRef]
  72. Bottani, E.; Rizzi, A. A Fuzzy TOPSIS Methodology to Support Outsourcing of Logistics Services. Supply Chain Manag. 2006, 11, 294–308. [Google Scholar] [CrossRef]
  73. Peleckis, K. Application of the Fuzzy VIKOR Method to Assess Concentration and Its Effects on Competition in the Energy Sector. Energies 2022, 15, 1349. [Google Scholar] [CrossRef]
  74. Huhns, M.N.; Singh, M.P. Service-Oriented Computing: Key Concepts and Principles. IEEE Internet Comput. 2005, 9, 75–81. [Google Scholar] [CrossRef]
  75. Masdari, M.; Khezri, H. Service Selection Using Fuzzy Multi-Criteria Decision Making: A Comprehensive Review. J. Ambient Intell. Humaniz. Comput. 2021, 12, 2803–2834. [Google Scholar] [CrossRef]
  76. Zavadskas, E.K.; Kaklauskas, A.; Peldschus, F.; Turskis, Z. Multi-Attribute Assessment of Road Design Solutions by Using the COPRAS Method. Balt. J. Road Bridge Eng. 2007, 2, 195–203. [Google Scholar]
  77. Nijkamp, P.; Delft, A.v. Multi-Criteria Analysis and Regional Decision-Making; Martinus Nijhoff Social Sciences Division: Leiden, The Netherlands, 1977. [Google Scholar]
  78. Weitendorf, D. Beitrag Zur Optimierung Der Räumlichen Struktur Eines Gebäudes. Doctoral Dissertation, Hochschule für Architektur und Bauwesen, Weimar, Germany, 1976. [Google Scholar]
  79. Zavadskas, E.K.; Turskis, Z. A New Logarithmic Normalization Method in Games Theory. Informatica 2008, 19, 303–314. [Google Scholar] [CrossRef]
  80. Körth, H. Zur Berücksichtigung Mehrer Zielfunktionen Bei Der Optimierung von Produktionsplanen. Math. Und Wirtsch. 1969, 6, 184–201. [Google Scholar]
  81. Jüttler, H. Untersuchungen Zur Fragen Der Operations Aforschung und Ihrer Anwendungsmöglichkeiten Aufökonomische Problemstellungen Unter Besonderer Berücksichtigung Der Spieltheorie. Ph.D. Thesis, a Humboldt-Universitat zu Berlin, Berlin, Germany, 1966. [Google Scholar]
  82. Amiri, M.; Hashemi-Tabatabaei, M.; Ghahremanloo, M.; Keshavarz-Ghorabaee, M.; Zavadskas, E.K.; Antucheviciene, J. A New Fuzzy Approach Based on BWM and Fuzzy Preference Programming for Hospital Performance Evaluation: A Case Study. Appl. Soft Comput. 2020, 92, 106279. [Google Scholar] [CrossRef]
  83. Wang, Y.-M.; Luo, Y. Integration of Correlations with Standard Deviations for Determining Attribute Weights in Multiple Attribute Decision Making. Math. Comput. Model. 2010, 51, 1–12. [Google Scholar] [CrossRef]
  84. Peldschus, F.; Vaigauskas, E.; Zavadskas, E.K. Technologische Entscheidungen Bei Der Berücksich Tigung Mehrerer Ziehle. Bauplan. Bautech. 1983, 37, 173–175. [Google Scholar]
  85. Polska, O.; Kudermetov, R.; Alsayaydeh, J.A.J.; Shkarupylo, V. QOS-Aware Web-Services Ranking Normaliztion Techniques Comparative Analysis for LSP Method. ARPN J. Eng. Appl. Sci. 2021, 16, 248–254. [Google Scholar]
  86. Tukey, J.W. Exploratory Data Analysis; Addison-Wesley: Boston, MA, USA, 1977. [Google Scholar]
  87. Chang, D.Y. Applications of the Extent Analysis Method on Fuzzy AHP. Eur. J. Oper. Res. 1996, 95, 649–655. [Google Scholar] [CrossRef]
  88. Sun, C.C. A Performance Evaluation Model by Integrating Fuzzy AHP and Fuzzy TOPSIS Methods. Expert Syst. Appl. 2010, 37, 7745–7754. [Google Scholar] [CrossRef]
  89. Zhao, W.-J.; Liu, J.-C. Triangular Fuzzy Number-Typed Fuzzy Cooperative Games and Their Application to Rural E-Commerce Regional Cooperation and Profit Sharing. Symmetry 2018, 10, 699. [Google Scholar] [CrossRef]
  90. Chatterjee, N.C.; Bose, G.K. A COPRAS-F Base Multi-Criteria Group Decision Making Approach for Site Selection of Wind Farm. Decis. Sci. Lett. 2013, 2, 1–10. [Google Scholar] [CrossRef]
  91. Opricovic, S. Fuzzy VIKOR with an Application to Water Resources Planning. Expert Syst. Appl. 2011, 38, 12983–12990. [Google Scholar] [CrossRef]
  92. Opricovic, S. Multicriteria Optimization of Civil Engineering Systems. Ph.D. Thesis, University of Belgrade, Belgrade, Serbia, 1998. [Google Scholar]
  93. Chu, T.-C.; Lin, Y. An Extension to Fuzzy MCDM. Comput. Math. Appl. 2009, 57, 445–454. [Google Scholar] [CrossRef]
  94. Shukla, R.K.; Garg, D.; Agarwal, A. An Integrated Approach of Fuzzy AHP and Fuzzy TOPSIS in Modeling Supply Chain Coordination. Prod. Manuf. Res. 2014, 2, 415–437. [Google Scholar] [CrossRef]
  95. Stanković, M.; Stević, Ž.; Das, D.K.; Subotić, M.; Pamučar, D. A New Fuzzy MARCOS Method for Road Traffic Risk Analysis. Mathematics 2020, 8, 457. [Google Scholar] [CrossRef]
  96. Cleff, T. Exploratory Data Analysis in Business and Economics; Springer International Publishing: Cham, Switzerland, 2014; ISBN 978-3-319-01516-3. [Google Scholar]
Figure 1. The schema of the method for assessing the effect of eight normalization techniques in fuzzy WSM, fuzzy TOPSIS and fuzzy VIKOR.
Applsci 16 02940 g001
Figure 2. An alternatives and attributes selection schema (C1—StartUpDelay, C2—TCPInputDelay, C3—TCPOutputDelay, C4—BottleneckBW, C5—X50_InterATimesReq, C6—AvgBufferLevel).
Applsci 16 02940 g002
Figure 3. Violin plots for the selected attributes: (a) C1—StartUpDelay; (b) C2—TCPInputDelay; (c) C3—TCPOutputDelay; (d) C4—BottleneckBW; (e) C5—X50_InterATimesReq; (f) C6—AvgBufferLevel.
Applsci 16 02940 g003aApplsci 16 02940 g003b
Figure 4. Ranking of alternatives with the application of different normalization techniques: (a) ranking of alternatives by fuzzy WSM; (b) ranking of alternatives by fuzzy TOPSIS; (c) ranking of alternatives by fuzzy VIKOR.
Applsci 16 02940 g004
Figure 5. The preferences of alternative A8 in fuzzy TOPSIS (a), in fuzzy WSM (b) and in fuzzy VIKOR (c).
Applsci 16 02940 g005
Figure 6. Hierarchical clustering of the normalization techniques by: (a) fuzzy WSM; (b) fuzzy TOPSIS; and (c) fuzzy VIKOR.
Applsci 16 02940 g006
Table 1. The arithmetic operations for fuzzy triangular numbers.
OperationFormulaNumber
Addition [35,36,39] A ˜ B ˜ = a 1 + b 1 ,   a 2 + b 2 ,   a 3 + b 3 (3)
Negation [35] B ˜ = b 3 , b 2 , b 1 (4)
Subtraction [36,39] A ˜ B ˜ = a 1 b 3 ,   a 2 b 2 ,   a 3 b 1 (5)
Multiplication [35,36,39] A ˜ B ˜ a 1 × b 1 ,   a 2 × b 2 ,   a 3 × b 3 (6)
Scalar multiplication [36,39] A ˜ k = a 1 × k ,   a 2 × k ,   a 3 × k (7)
Division [36,39] A ˜ B ˜ a 1 b 3 ,   a 2 b 2 ,   a 3 b 1 (8)
Square root [39] A ˜ = a 1 ,   a 2 ,   a 3 (9)
Natural logarithm [35] l n A ˜ = l n a 1 ,   l n a 2 ,   l n a 3 (10)
Maximum [39] m a x A ˜ ,   B ˜ = m a x a 1 ,   b 1 ,   m a x a 2 ,   b 2 ,   m a x a 3 ,   b 3 (11)
Minimum [39] m i n A ˜ ,   B ˜ = m i n a 1 ,   b 1 ,   m i n a 2 ,   b 2 ,   m i n a 3 ,   b 3 (12)
Distance [36,38] d A ˜ ,   B ˜ = a 1 b 1 2 + a 2 b 2 2 + a 3 b 3 2 3 (13)
Table 3. Analyzed normalization techniques ( Ω b —denotes a set of benefit criteria, Ω c —denotes a set of cost criteria).
Normalization TechniqueCondition of UseFormulaNo.
Vector (N1)
[42,77]
Benefit criteria r i j = x i j i = 1 n x i j 2 ,   i = 1 , n ¯ ; j Ω b (22)
Cost criteria r i j = 1 x i j i = 1 n x i j 2 ,   i = 1 , n ¯ ; j Ω c (23)
Linear Max (N2)
[42,78]
Benefit criteria r i j = x i j x j m a x ,   i = 1 , n ¯ ; j Ω b (24)
Cost criteria r i j = 1 x i j x j m a x ,   i = 1 , n ¯ ; j Ω c (25)
Linear Min-Max (N3)
[42,78]
Benefit criteria r i j = x i j x j m i n x j m a x x j m i n ,   i = 1 , n ¯ ; j Ω b (26)
Cost criteria r i j = x j m a x x i j x j m a x x j m i n ,   i = 1 , n ¯ ; j Ω c (27)
Linear Jüttler’s–Körth’s (N4)
[79,80,81]
Benefit criteria r i j = 1 x j m a x x i j x j m a x ,   i = 1 , n ¯ ; j Ω b (28)
Cost criteria r i j = 1 x j m i n x i j x j m i n ,   i = 1 , n ¯ ; j Ω c (29)
Linear Sum * (N5)
[65,82,83]
Benefit criteria r i j = x i j i = 1 n x i j ,   i = 1 , n ¯ ; j Ω b (30)
Cost criteria * r i j = 1 x i j i = 1 n 1 x i j ,   i = 1 , n ¯ ; j Ω c (31)
Non-linear (N6)
[79,84]
Benefit criteria r i j = x i j x j m a x ,   2 i = 1 , n ¯ ; j Ω b (32)
Cost criteria r i j = x j m i n x i j 3 ,   i = 1 , n ¯ ; j Ω c (33)
Logarithmic (N7)
[79]
Benefit criteria r i j = l n x i j l n i = 1 n x i j ,   i = 1 , n ¯ ; j Ω b (34)
Cost criteria r i j = 1 l n x i j l n i = 1 n x i j n 1 ,   i = 1 , n ¯ ; j Ω c ,   x i j > 0 . (35)
Linear Max * (N8)
[65]
Benefit criteria r i j = x i j x j m a x ,   i = 1 , n ¯ ; j Ω b (36)
Cost criteria * r i j = x j m i n x i j ,   i = 1 , n ¯ ; j Ω c (37)
Linear normalization for VIKOR
[70]
Benefit and cost criteria r i j = x j * x i j x j * x j ,   i = 1 , n ¯ ,
x j * = max i x i j , j Ω b ;
x j * = min i x i j , j Ω c ,
x j = min i x i j , j Ω b ;
x j = max i x i j , j Ω c .
(38)
* Note that the Linear Sum and Linear Max normalization techniques use linear transformation for benefit criteria and Non-linear transformation for the cost [59].
Table 4. Classification of the initial observations according to DASH Policy and Stall Label.
DASH PolicyStall LabelAlternativeNumber of Observations
Buffer-Based Adaptation LogicMild StallingA11065
No StallingA221,917
Severe StallingA343
Rate- And Buffer-Based Adaptation LogicMild StallingA41500
No StallingA519,538
Severe StallingA614
Rate-Based Adaptation LogicMild StallingA714,615
No StallingA89700
Severe StallingA9737
Table 5. Correlation matrix for selected attributes.
C1C2C3C4C5C6
C110.390.4−0.23−0.03−0.31
C20.3910.29−0.41−0.02−0.17
C30.40.2910.01−0.03−0.15
C4−0.23−0.410.0110.020.25
C5−0.03−0.02−0.030.021−0.26
C6−0.31−0.17−0.150.25−0.261
Table 6. Attributes selected for the assessment.
Notation of
Attribute
NameDescriptionMin/Max
C1StartUpDelayInitial time for the client to start playing the videoMin
C2TCPInput DelayAverage delay experienced by TCP packets (In and Out)Min
C3TCPOutput DelayAverage delay experienced by TCP packets (In and Out)Min
C4BottleneckBWCapacity of the bottleneckMax
C5X50_InterATimesReq50th quantile for the
inter-arrival times of segment requests
Min
C6AvgBufferLevelAverage video buffer lengthMax
Table 7. Normalization techniques with formulas for fuzzy triangular numbers.
Normalization TechniqueCondition of UseFormulaNo.
Vector (N1) Benefit criteria [37] r ˜ i j = x i j l i = 1 n x i j u 2 , x i j m i = 1 n x i j u 2 , x i j u i = 1 n x i j u 2 , (49)
Cost criteria r ˜ i j = 1 x i j u i = 1 n x i j u 2 ,   1 x i j m i = 1 n x i j u 2 ,   1 x i j l i = 1 n x i j u 2 , (50)
Linear Max (N2) Benefit criteria [37] r ˜ i j = x i j l x j u m a x , x i j m x j u m a x , x i j u x j u m a x ,  
x j u m a x = max i x i j u ,   i = 1 , n ¯ ; j Ω b
(51)
Cost criteria r ˜ i j = 1 x i j u x j u m a x ,   1 x i j m x j u m a x ,   1 x i j l x j u m a x ,   i = 1 , n ¯ ; j Ω c (52)
Linear
Min-Max (N3) [37,93]
Benefit criteria r ˜ i j = x i j l x j l m i n x j u m a x x j l m i n ,   x i j m x j l m i n x j u m a x x j l m i n ,   x i j u x j l m i n x j u m a x x j l m i n ,  
x j u m a x = max i x i j u ,   x j l m i n = min i x i j l ,   i = 1 , n ¯ ; j Ω b
(53)
Cost criteria r ˜ i j = x j u m a x x i j u x j u m a x x j l m i n ,   x j u m a x x i j m x j u m a x x j l m i n , x j u m a x x i j l x j u m a x x j l m i n ,  
x j u m a x = max i x i j u ,   x j l m i n = min i x i j l ,   i = 1 , n ¯ ; j Ω c
(54)
Linear Jüttler’s–Körth’s (N4) (proposed by authors)Benefit criteria r ˜ i j = 1 x j u m a x x i j l x j u m a x ,   1 x j u m a x x i j m x j u m a x ,   1 x j u m a x x i j u x j u m a x ,  
x j u m a x = max i x i j u ,   i = 1 , n ¯ ; j Ω b
(55)
Cost criteria r ˜ i j = 1 x j l m i n x i j u x j u m a x ,   1 x j l m i n x i j m x j u m a x ,   1 x j l m i n x i j l x j u m a x ,  
x j l m i n = min i x i j l , i = 1 , n ¯ ; j Ω c
(56)
Linear Sum * (N5)Benefit criteria [94] r ˜ i j = x i j l i = 1 n x i j u ,   x i j m i = 1 n x i j u ,   x i j u i = 1 n x i j u ,   i = 1 , n ¯ ; j Ω b (57)
Cost criteria * r ˜ i j = 1 x i j u i = 1 n 1 x i j l , 1 x i j m i = 1 n 1 x i j l ,   1 x i j l i = 1 n 1 x i j l , (58)
Non-linear Peldschus (N6)Benefit criteria r ˜ i j = x i j l x j u m a x 2 , x i j m x j u m a x 2 , x i j u x j u m a x 2 ,   x j u m a x = max i x i j u ,   i = 1 , n ¯ ; j Ω b (59)
Cost criteria r ˜ i j = x j l m i n x i j u 3 ,   x j l m i n x i j m 3 ,   x j l m i n x i j l 3 ,   x j l m i n = min i x i j l , i = 1 , n ¯ ; j Ω c (60)
Non-linear Logarithmic (N7)Benefit criteria r ˜ i j = l n x i j l l n i = 1 n x i j u ,   l n x i j l m l n i = 1 n x i j u ,   l n x i j u l n i = 1 n x i j u ,  
i = 1 , n ¯ ; j Ω b
(61)
Cost criteria r ˜ i j = 1 n 1 · 1 l n x i j u l n i = 1 n x i j u ,   1 l n x i j l m l n i = 1 n x i j u , 1 l n x i j l l n i = 1 n x i j u ,  
i = 1 , n ¯ ; j Ω c , x i j l > 1 ,   x i j m > 1 ,   x i j u > 1  
(62)
Linear Max (N8) [4,37,95]Benefit criteria r ˜ i j = x i j l x j u m a x , x i j m x j u m a x , x i j u x j u m a x ,   x j u m a x = max i x i j u ,   i = 1 , n ¯ ; j Ω b (63)
Cost criteria r ˜ i j = x j l m i n x i j u , x j l m i n x i j m ,   x j l m i n x i j l ,   x j l m i n = min i x i j l , i = 1 , n ¯ ; j Ω c (64)
Linear normalization for VIKOR [73,91] **Benefit criteria r ˜ i j = x ˜ j * x ˜ i j x j * u x j l , x ˜ i j = x i j l ,   x i j m ,   x i j u   i = 1 , n ¯ ,
x ˜ j * = max i x ˜ i j , j Ω b ;   x ˜ j * = min i x ˜ i j , j Ω c ,   x ˜ j * = x j * l ,   x j * m ,   x j * u ,
x ˜ j = min i x ˜ i j , j Ω b ;   x ˜ j = max i x ˜ i j , j Ω c ,   x ˜ j = x j l ,   x j m ,   x j u .
(65)
Cost criteria r ˜ i j = x ˜ i j x ˜ j * x j u x j * l , x ˜ i j = x i j l ,   x i j m ,   x i j u   i = 1 , n ¯ , (66)
* Formula proposed by the authors of this article. The theoretical validation of the proposed formula is presented in Appendix A. ** Described for VIKOR, but not used for the normalization effect evaluation in other MCDM methods.
Table 8. An initial fuzzy DMM.
Attribute
AlternativeC1C2C3C4C5C6
A1(327, 3000, 7368)(10.6, 75, 390.65)(1.02, 39.01, 67.51)(5.5 × 10⁶, 3.65 × 10⁸, 6.56 × 10⁸)(1.66, 5.27, 18.1)(5.6, 12.32, 19.04)
A2(409, 1425, 3008)(1.5, 25, 141.04)(9.8, 17.82, 58.01)(1.45 × 10⁶, 3.73 × 10⁸, 4.62 × 10⁸)(4.43, 7.23, 15.55)(6.72, 20.16, 26.88)
A3(821, 1545, 9403)(62.34, 250.53, 546.35)(11, 58.01, 64.58)(2.4 × 10⁶, 3.2 × 10⁸, 3.73 × 10⁸)(3.34, 13.34, 23.4)(1.02, 12,32, 24.64)
A4(325, 2325, 6832)(1.2, 98, 267)(10.51, 39.09, 49.18)(3.35 × 10⁶, 3.73 × 10⁸, 5.08 × 10⁸)(3.23, 12.72, 16.6)(3.64, 11, 16.64)
A5(405, 1925, 3355)(2.1, 45, 132.99)(8.7, 45.36, 74.86)(4.3 × 10⁶, 3.73 × 10⁸, 5.79 × 10⁸)(8.74, 11.41, 15.5)(2.24, 12.5, 17.66)
A6(1044, 2425, 6723)(72.74, 102.2, 746)(20.45, 33.27, 71.24)(5.25 × 10⁶, 4.94 × 10⁸, 5.75 × 10⁸)(8.03, 13.74, 22.9)(1.12, 2.87, 7.84)
A7(1325, 3325, 8824)(11.92, 57.11, 301.39)(1.8, 43.98, 72)(8.1 × 10⁶, 4.13 × 10⁸, 7.331 × 10⁸)(13.4, 18.62, 24.66)(4.48, 10.08, 22.42)
A8(396, 2100, 4318)(7.3, 65.82, 147.37)(5.6, 50.01, 71.03)(6.2 × 10⁶, 3.71 × 10⁸, 7.331 × 10⁸)(11.87, 28.13, 41.13)(2.81, 14.56, 22.96)
A9(326, 2825, 2583)(9.82, 72.02, 420.85)(23.32, 67.51, 70.91)(1.45 × 10⁶, 4.62 × 10⁸, 6.561 × 10⁸)(5.41, 14.52, 18.09)(1.23, 6.72, 14)
Min/maxMinMinMinMax MinMax
Table 9. Ranks of alternative by fuzzy WSM, fuzzy TOPSIS and fuzzy VIKOR.
MCDM AlternativeA1A2A3A4A5A6A7A8A9
Norm. Technique
Fuzzy WSMVector (N1) 3 (0.610)1 (0.724)9 (0.515)4 (0.594)2 (0.623)8 (0.523)5 (0.549)7 (0.543)6 (0.545)
Fuzzy TOPSIS3 (0.613)1
(0.727)
9
(0.517)
4
(0.606)
2
(0.642)
6
(0.544)
7
(0.544)
8
(0.543)
5
(0.560)
Fuzzy VIKOR4 (0.516)1 (0.578)8 (0.474)6 (0.507)2 (0.546)9 (0.472)7 (0.505)3 (0.516)5 (0.513)
Fuzzy WSMLinear Max (N2)3 (0.591)1
(0.706)
9
(0.502)
4
(0.577)
2
(0.596)
8
(0.513)
5
(0.537)
6
(0.535)
7
(0.519)
Fuzzy TOPSIS3
(0.598)
1
(0.719)
9
(0.505)
4
(0.587)
2
(0.632)
8
(0.529)
7
(0.531)
6
(0.545)
5
(0.552)
Fuzzy VIKOR4
(0.519)
1
(0.583)
9
(0.469)
5
(0.513)
2
(0.548)
8
(0.478)
6
(0.512)
3
(0.523)
7
(0.511)
Fuzzy WSMLinear Min-Max (N3)3
(0.590)
1
(0.706)
9
(0.502)
4
(0.576)
2
(0.595)
8
(0.512)
5
(0.535)
6
(0.533)
7
(0.518)
Fuzzy TOPSIS3
(0.597)
1
(0.714)
9
(0.506)
4
(0.585)
2
(0.629)
7
(0.527)
8
(0.526)
6
(0.540)
5
(0.550)
Fuzzy VIKOR4
(0.517)
1
(0.577)
9
(0.473)
6
(0.507)
2
(0.542)
8
(0.473)
7
(0.506)
3
(0.517)
5
(0.507)
Fuzzy WSMLinear Jüttler’s–Körth’s (N4)3
(0.591)
1
(0.706)
9
(0.502)
4
(0.577)
2
(0.596)
8
(0.513)
5
(0.537)
6
(0.535)
7
(0.519)
Fuzzy TOPSIS3
(0.598)
1
(0.718)
9
(0.506)
4
(0.587)
2
(0.631)
7
(0.529)
8
(0.529)
6
(0.541)
5
(0.552)
Fuzzy VIKOR3
(0.517)
1
(0.577)
9
(0.473)
6
(0.506)
2
(0.542)
8
(0.473)
7
(0.506)
4
(0.517)
5
(0.508)
Fuzzy WSMLinear Sum (N5) 1
(0.364)
2
(0.345)
8
(0.221)
3
(0.302)
4
(0.269)
9
(0.158)
5
(0.250)
6
(0.246)
7
(0.223)
Fuzzy TOPSIS1
(0.335)
2
(0.253)
7
(0.143)
3
(0.244)
4
(0.188)
9
(0.080)
5
(0.173)
8
(0.125)
6
(0.144)
Fuzzy VIKOR1
(0.378)
2
(0.358)
8
(0.261)
3
(0.329)
5
(0.292)
9
(0.238)
4
(0.297)
6
(0.274)
7
(0.271)
Fuzzy WSMNon-linear Peldschus (N6)1
(0.317)
2
(0.292)
8
(0.168)
3
(0.264)
7
(0.209)
9
(0.130)
6
(0.214)
4
(0.247)
5
(0.225)
Fuzzy TOPSIS1
(0.261)
4
(0.154)
8
(0.040)
2
(0.227)
5
(0.123)
9
(0.010)
7
(0.048)
6
(0.123)
3
(0.183)
Fuzzy VIKOR2
(0.412)
1
(0.459)
9
(0.355)
5
(0.397)
8
(0.360)
7
(0.374)
6
(0.395)
4
(0.399)
3
(0.409)
Fuzzy WSMNon-linear Logarithmic (N7)2
(0.673)
1
(0.725)
7
(0.596)
6
(0.635)
5
(0.642)
9
(0.484)
4
(0.642)
3
(0.651)
8
(0.559)
Fuzzy TOPSIS2
(0.467)
1
(0.532)
8
(0.295)
4
(0.406)
3
(0.421)
9
(0.271)
5
(0.351)
6
(0.333)
7
(0.322)
Fuzzy VIKOR2
(0.527)
1
(0.531)
7
(0.498)
6
(0.514)
5
(0.518)
9
(0.484)
3
(0.525)
4
(0.524)
8
(0.496)
Fuzzy WSMLinear Max (N8)2
(0.395)
1
(0.409)
8
(0.297)
3
(0.367)
4
(0.344)
9
(0.230)
6
(0.301)
5
(0.327)
7
(0.298)
Fuzzy TOPSIS1
(0.342)
2
(0.297)
6
(0.204)
3
(0.295)
4
(0.251)
9
(0.125)
8
(0.149)
7
(0.196)
5
(0.217)
Fuzzy VIKOR5
(0.455)
1
(0.504)
7
(0.444)
2
(0.494)
3
(0.479)
4
(0.460)
9
(0.439)
8
(0.440)
6
(0.447)
Fuzzy VIKORDefault normalization *2
(0.508)
1
(0.479)
7
(0.548)
4
(0.516)
3
(0.516)
9
(0.561)
5
(0.528)
6
(0.547)
8
(0.558)
* In the original fuzzy VIKOR method, which uses the default normalization, alternatives are ranked according to their preference values in ascending order, where rank 1 is assigned to the alternative with the lowest preference value.
Table 10. Spearman correlation coefficients and p-values (in brackets) for ranks by fuzzy WSM.
N1N2N3N4N5N6N7N8MeanRank
N110.98 (0.00)0.98 (0.00)0.98 (0.00)0.88 (0.00)0.63 (0.07)0.67 (0.05)0.88 (0.00)0.8756
N20.98 (0.00)1110.90 (0.00)0.65 (0.06)0.75 (0.02)0.92 (0.00)0.92
N30.98 (0.00)1110.90 (0.00)0.65 (0.06)0.75 (0.02)0.92 (0.00)0.92
N40.98 (0.00)1110.90 (0.00)0.65 (0.06)0.75 (0.02)0.92 (0.00)0.92
N50.88 (0.00)0.90 (0.00)0.90 (0.00)0.90 (0.00)10.85 (0.00)0.80 (0.01)0.97 (0.00)0.95
N60.63 (0.07)0.65 (0.06)0.65 (0.06)0.65 (0.06)0.85 (0.00)10.75 (0.02)0.87 (0.00)0.7568
N70.67 (0.05)0.75 (0.02)0.75 (0.02)0.75 (0.02)0.80 (0.01)0.75 (0.02)10.83 (0.01)0.7887
N80.88 (0.00)0.92 (0.00)0.92 (0.00)0.92 (0.00)0.97 (0.00)0.87 (0.00)0.83 (0.01)10.9141
Table 11. Spearman correlation coefficients and p-values (in brackets) for ranks by fuzzy TOPSIS.
N1N2N3N4N5N6N7N8MeanRank
N110.93 (0.00)0.95 (0.00)0.95 (0.00)0.77 (0.02)0.63 (0.07)0.80 (0.01)0.75 (0.02)0.8485
N20.93 (0.00)10.98 (0.00)0.98 (0.00)0.80 (0.01)0.73 (0.02)0.90 (0.00)0.82 (0.01)0.8931
N30.95 (0.00)0.98 (0.00)110.73 (0.02)0.70 (0.04)0.83 (0.01)0.80 (0.01)0.8742
N40.95 (0.00)0.98 (0.00)110.73 (0.02)0.70 (0.04)0.83 (0.01)0.80 (0.01)0.8742
N50.77 (0.02)0.80 (0.01)0.73 (0.02)0.73 (0.02)10.80 (0.01)0.92 (0.00)0.90 (0.00)0.8317
N60.63 (0.07)0.73 (0.02)0.70 (0.04)0.70 (0.04)0.80 (0.01)10.68 (0.04)0.87 (0.00)0.7648
N70.80 (0.01)0.90 (0.00)0.83 (0.01)0.83 (0.01)0.92 (0.00)0.68 (0.04)10.82 (0.01)0.8484
N80.75 (0.02)0.82 (0.01)0.80 (0.01)0.80 (0.01)0.90 (0.00)0.87 (0.00)0.82 (0.01)10.8456
Table 12. Spearman correlation coefficients and p-values (in brackets) for ranks by fuzzy VIKOR.
defN1N2N3N4N5N6N7N8MeanRank
def10.73 (0.02)0.82 (0.01)0.70 (0.04)0.77 (0.02)0.92 (0.00)0.47 (0.21)0.87 (0.00)0.48 (0.19)0.7515
N10.73 (0.02)10.93 (0.00)0.98 (0.00)0.97 (0.00)0.58 (0.10)0.57 (0.11)0.67 (0.05)0.38 (0.31)0.7574
N20.82 (0.01)0.93 (0.00)10.95 (0.00)0.93 (0.00)0.68 (0.04)0.52 (0.15)0.75 (0.02)0.45 (0.22)0.762.5
N30.70 (0.04)0.98 (0.00)0.95 (0.00)10.98 (0.00)0.57 (0.11)0.60 (0.09)0.63 (0.02)0.43 (0.24)0.762.5
N40.77 (0.02)0.97 (0.00)0.93 (0.00)0.98 (0.00)10.65 (0.06)0.63 (0.07)0.67 (0.05)0.48 (0.19)0.7871
N50.92 (0.00)0.58 (0.10)0.68 (0.04)0.57 (0.11)0.65 (0.06)10.63 (0.07)0.85 (0.00)0.35 (0.36)0.6926
N60.47 (0.21)0.57 (0.11)0.52 (0.15)0.60 (0.09)0.63 (0.07)0.63 (0.07)10.57 (0.11)0.25 (0.52)0.5828
N70.87 (0.00)0.67 (0.05)0.75 (0.02)0.63 (0.07)0.67 (0.05)0.85 (0.00)0.57 (0.11)10.08 (0.83)0.6777
N80.48 (0.19)0.38 (0.31)0.45 (0.22)0.43 (0.24)0.48 (0.19)0.35 (0.36)0.25 (0.52)0.08 (0.83)10.4339
Disclaimer/Publisher’s Note: The statements, opinions and data contained in all publications are solely those of the individual author(s) and contributor(s) and not of MDPI and/or the editor(s). MDPI and/or the editor(s) disclaim responsibility for any injury to people or property resulting from any ideas, methods, instructions or products referred to in the content.