1. Introduction
With the sustained growth of the global economy and society, traditional fossil energy sources such as coal and petroleum are being depleted at an accelerating rate [
1,
2,
3]. Against this background, the development of clean and renewable energy to replace conventional fossil fuels has become an urgent priority and a major direction for future energy development [
4,
5]. Owing to its abundant reserves, cleanliness, and renewability, geothermal energy has emerged as a major research focus in the energy sector in recent years and has attracted increasing attention from the academic community [
6,
7].
Among the available technological pathways, enhanced geothermal systems (EGSs) are regarded as the mainstream approach for geothermal resource development [
8,
9]. However, despite nearly five decades of development, the EGS has yet to achieve large-scale commercial deployment because of several persistent technical bottlenecks, including the high pressures required for hydraulic fracturing, limited controllability of fracture propagation, difficulties in establishing interwell connectivity, and high development costs [
10,
11]. To overcome these challenges, Zijun Feng et al. [
12] proposed a fault-controlled hot dry rock development scheme, in which natural fault fracture zones are directly utilized as geothermal reservoirs. This approach avoids the need for hydraulic-fracturing-based reservoir stimulation and instead realizes injection–production circulation simply by drilling wells to intersect the fault zone. Consequently, both engineering complexity and development costs can be substantially reduced, while the high hydraulic conductivity of the fracture zone can further improve heat conversion efficiency and production performance.
As products of tectonic activity, fault fracture zones are commonly filled with fragmented rock masses characterized by irregular particle morphology and a loose structural fabric. In recent years, extensive studies have been conducted, both domestically and internationally, on the seepage behavior of fragmented rock masses. Kogure [
13] investigated seepage through crushed rock under different hydraulic gradients, identified the critical hydraulic gradient governing flow regime transition, and established its quantitative relationship with the effective particle size of the rock. Nakagawa et al. [
14] developed a finite element model that incorporates the two-way coupling between rock skeleton deformation and pore water pressure, and further established a numerical procedure capable of predicting the evolution of pore water pressure. Li [
15] formulated a nonlinear dynamical equation for fluid–solid coupled seepage in fragmented rock masses, clarified the dynamic response relationships among pore water pressure, seepage velocity, and volumetric strain, and revealed the bifurcation characteristics of the coupled system. Through laboratory experiments, Shuncai Li [
16] demonstrated that pore structure alteration induced by pore water pressure and particle corner breakage caused by interparticle interaction are the key factors controlling the seepage behavior of fragmented rock masses, and first reported the unusual phenomenon of a negative non-Darcy flow deviation factor. Kan [
17] conducted seepage experiments on fragmented rock masses under cyclic loading and unloading conditions, and clarified the influence of cyclic loading on permeability evolution.
Although previous studies have preliminarily revealed the seepage behavior of fragmented rocks under the effects of stress and pore water pressure, seepage in fault-controlled geothermal exploitation is also strongly influenced by the dynamic evolution of the geothermal field. Moreover, most existing studies have not adequately considered the coupled interaction between pore water pressure and rock mass deformation, which limits the applicability of their conclusions. Therefore, under the multi-field coupled conditions associated with fault-controlled geothermal development, the seepage characteristics of fragmented rock masses still require more in-depth and systematic investigation.
In the exploitation of geothermal resources hosted in hot rock formations, the occurrence state of deep high-temperature rocks and engineering-induced disturbances together constitute an integrated system [
18]. Owing to the combined effects of complex deep geological conditions and circulating fluids, the rock mass is continuously subjected to the coupling of the thermal, seepage, and stress fields. Therefore, systematic investigation of thermo-hydro-mechanical (THM) coupling is of great importance. Noorishad [
19] was the first to establish the governing equations for THM coupling in saturated porous media based on consolidation theory and thermoelasticity, thereby laying the theoretical foundation for subsequent studies. Building on this framework, many researchers have further conducted systematic investigations into coupled processes in porous media, the thermal extraction response of fractured reservoirs, and the dynamic evolution of permeability, progressively advancing the theoretical framework of multi-field coupling in geothermal reservoirs [
20,
21,
22,
23,
24]. Based on a single-porosity THM model, Cao et al. [
25] demonstrated that rock deformation during geothermal exploitation can significantly alter reservoir permeability, thereby inducing thermal breakthrough and reducing heat exchange efficiency.
In summary, substantial progress has been made in the study of seepage in fragmented rocks and THM coupling in porous media. However, most existing models focus on idealized fractures or hydraulically fractured fracture networks, whereas systematic simulations of the thermo-hydro-mechanical evolution of natural fault zones during long-term heat extraction, as well as their influence on heat recovery performance, remain limited. In addition, coordinated optimization analyses of key development parameters, such as well spacing and reinjection rate, are still lacking, making it difficult to provide direct guidance for engineering design. Based on the hydrothermal system model of the Yangbajing geothermal field proposed by Academician Duoji [
26], this study takes the development of geothermal resources in the first deep reservoir of the Yangbajing field as its engineering background. By combining laboratory experiments with numerical simulations and considering the influence of a stochastic discrete fracture network on reservoir development, the effects of key parameters, including well spacing and reinjection rate, on geothermal exploitation are systematically investigated, with the aim of providing guidance for the implementation of the development scheme for the first deep reservoir in the Yangbajing geothermal field.
3. Numerical Simulation and Results
3.1. Basic Assumptions
To characterize the THM coupling during geothermal exploitation, the following basic assumptions were adopted:
- (1)
The dense surrounding rock around the geothermal reservoir is treated as a homogeneous and isotropic porous continuum, and its mechanical behavior is assumed to obey the small-strain theory.
- (2)
Fluid flow is assumed to strictly follow Darcy’s law.
- (3)
The inertial effects and body forces associated with fluid flow and rock mass deformation are neglected.
- (4)
The thermophysical properties of the rock mass, including density, thermal conductivity, and specific heat capacity, are assumed to be independent of temperature.
- (5)
The solid skeleton and the fluid are assumed to remain in local thermal equilibrium.
- (6)
For heat transfer in the rock mass, only heat conduction and thermal effects are considered, while thermal radiation is neglected.
3.2. Governing Equations
The governing equation of the seepage field is derived based on the fluid mass balance equation and Darcy’s law:
where
Qs is the fluid source term,
ρw is the fluid density,
ρwφ is the fluid mass per unit volume of rock mass,
φ denotes porosity which is related to the volumetric strain of the rock mass,
μ is the dynamic viscosity of the fluid,
k is permeability,
p is the fluid pressure, and
t is the time variable.
According to the fundamental laws of thermodynamics, the governing equation of the temperature field for fluid flow in the geothermal reservoir can be obtained as:
where
ρs is the density of the rock skeleton,
K is the bulk modulus of the rock mass,
T is temperature,
cs is the specific heat capacity at constant pressure of the rock skeleton,
αT is the thermal expansion coefficient of the rock mass,
λs is the thermal conductivity of the rock skeleton,
εV is the volumetric strain of the rock skeleton, and the heat source intensity of the rock mass is (1
− φ)
QTs.
cw is the specific heat capacity at constant pressure of the fluid,
λw is the thermal conductivity of the fluid, and the heat source intensity of the fluid is
φQTw.
The left-hand side of the equation represents the rate of change in internal energy of the system. The first term on the right-hand side is the rate of change in thermal strain energy, the second term is the convective term, the third term is the heat conduction term, and the fourth term is the heat source term, where QT = (1 − φ)QTs + φQTw.
Although the temperature of the first deep geothermal reservoir in Yangbajing is relatively high, the formation as a whole is still dominated by elastic deformation under small-strain conditions, without pronounced plastic yielding or damage evolution. Therefore, an isotropic linear elastic constitutive model was adopted for the stress-field analysis in this study, with inertial effects neglected. Accordingly, the governing equation for hot rock deformation can be expressed as follows:
where
ui is the displacement component,
fi is the body force component,
G is the shear modulus,
ν is Poisson’s ratio,
α is the Biot coefficient with
α = 1 −
K/Ks,
Ks represents the bulk modulus of the rock matrix, −
αTK,i denotes the effect of temperature variation on rock mass deformation, and
−αp,i denotes the effect of fluid seepage on rock mass deformation. The above equation can adequately characterize the coupled interactions among temperature variation, fluid seepage, and elastic deformation of the rock mass at the reservoir scale, thereby satisfying the requirements of the present study for analyzing the mechanical response of a fault-controlled geothermal reservoir during long-term exploitation.
In this study, the governing equation for porosity is given as follows [
27].
where
p0 is the initial fluid pressure,
T0 is the initial rock temperature, and
εV0 is the initial volumetric strain of the rock skeleton.
Among the many permeability models proposed by previous researchers, the Kozeny–Carman equation is the most widely used [
28]. The equation relating permeability and porosity derived from it is as follows:
In this study, tight coupling is achieved through the dynamic feedback of key multi-field parameters. Fluid pressure in the seepage field directly drives rock mass deformation, which in turn influences seepage efficiency through changes in porosity. The temperature field affects rock mass deformation through thermal expansion, while the flowing fluid transports heat by convection; temperature variations also influence fluid properties and seepage processes. Porosity is jointly regulated by fluid pressure and temperature, and its relationship with permeability is described on the basis of the Kozeny–Carman equation, thereby providing feedback to the seepage field. This framework fully characterizes the interactive and co-evolutionary coupling mechanism among multiple physical fields in high-temperature rock masses. A three-dimensional fully coupled THM numerical model was employed in this study to simulate the geothermal exploitation process, and the governing equations were solved using the finite element method (FEM). The governing equations were discretized in space by FEM and solved in time using a backward difference scheme. The numerical simulations were implemented on the COMSOL Multiphysics 5.8 platform, using the “Darcy’s Law”, “Heat Transfer in Porous Media”, and “Solid Mechanics” interfaces to construct the THM coupling model. This approach can reasonably capture the spatial migration of geothermal fluids within the reservoir, as well as the coupled evolution of the temperature and stress fields.
3.3. Model Validation
Bing Bai [
29] analytically solved the one-dimensional thermoelastic consolidation model using finite Fourier transform and its inverse transform, and derived analytical expressions for the evolution of temperature, pore water pressure, and displacement inside the soil column, as shown in Equation (9):
where
Ta is the top boundary temperature,
h is the height of the geometric model,
z is the position variable,
F is the normal top pressure, and
M is Young’s modulus.
ξ is the characteristic wave number determined by
ξ = (2
n + 1) π/2
h, (
n = 0, 1, 2 …).
ϕ2i and
ϕ1i are the coefficients of the temperature field and pore pressure field, respectively, and
Ψi is the coefficient of the displacement field. The calculation methods for the above parameters can be found in Ref. [
29].
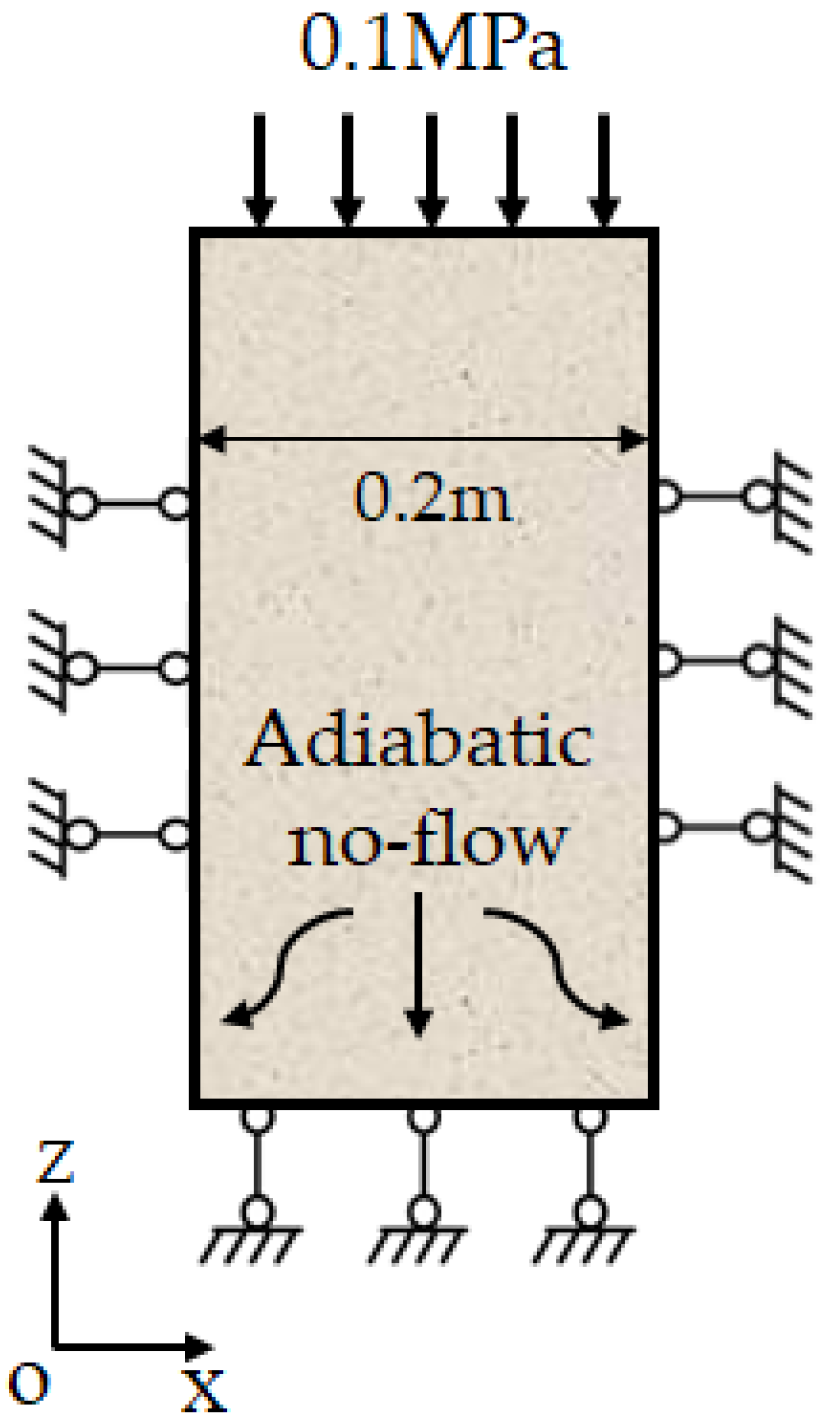
This is a typical THM coupling problem. The numerical method is used to solve this problem, and the model is shown in
Figure 6.
The soil column has a height of 2 m and a width of 0.2 m, and its physical properties are listed in
Table 2. A vertical load of 0.1 MPa is applied at the top of the soil column. The initial temperature and initial pore water pressure of the soil column are 283.15 K and 0.1 MPa, respectively, while the temperature at the top surface is 333.15 K. The left and right boundaries of the model are impermeable and adiabatic, with displacement fixed in the
-direction. The bottom boundary is also impermeable and adiabatic, with displacement fixed in the
-direction. The top boundary is specified as a free seepage boundary. Under the action of the top load, heat transfer, fluid flow, and deformation occur within the soil column over time.
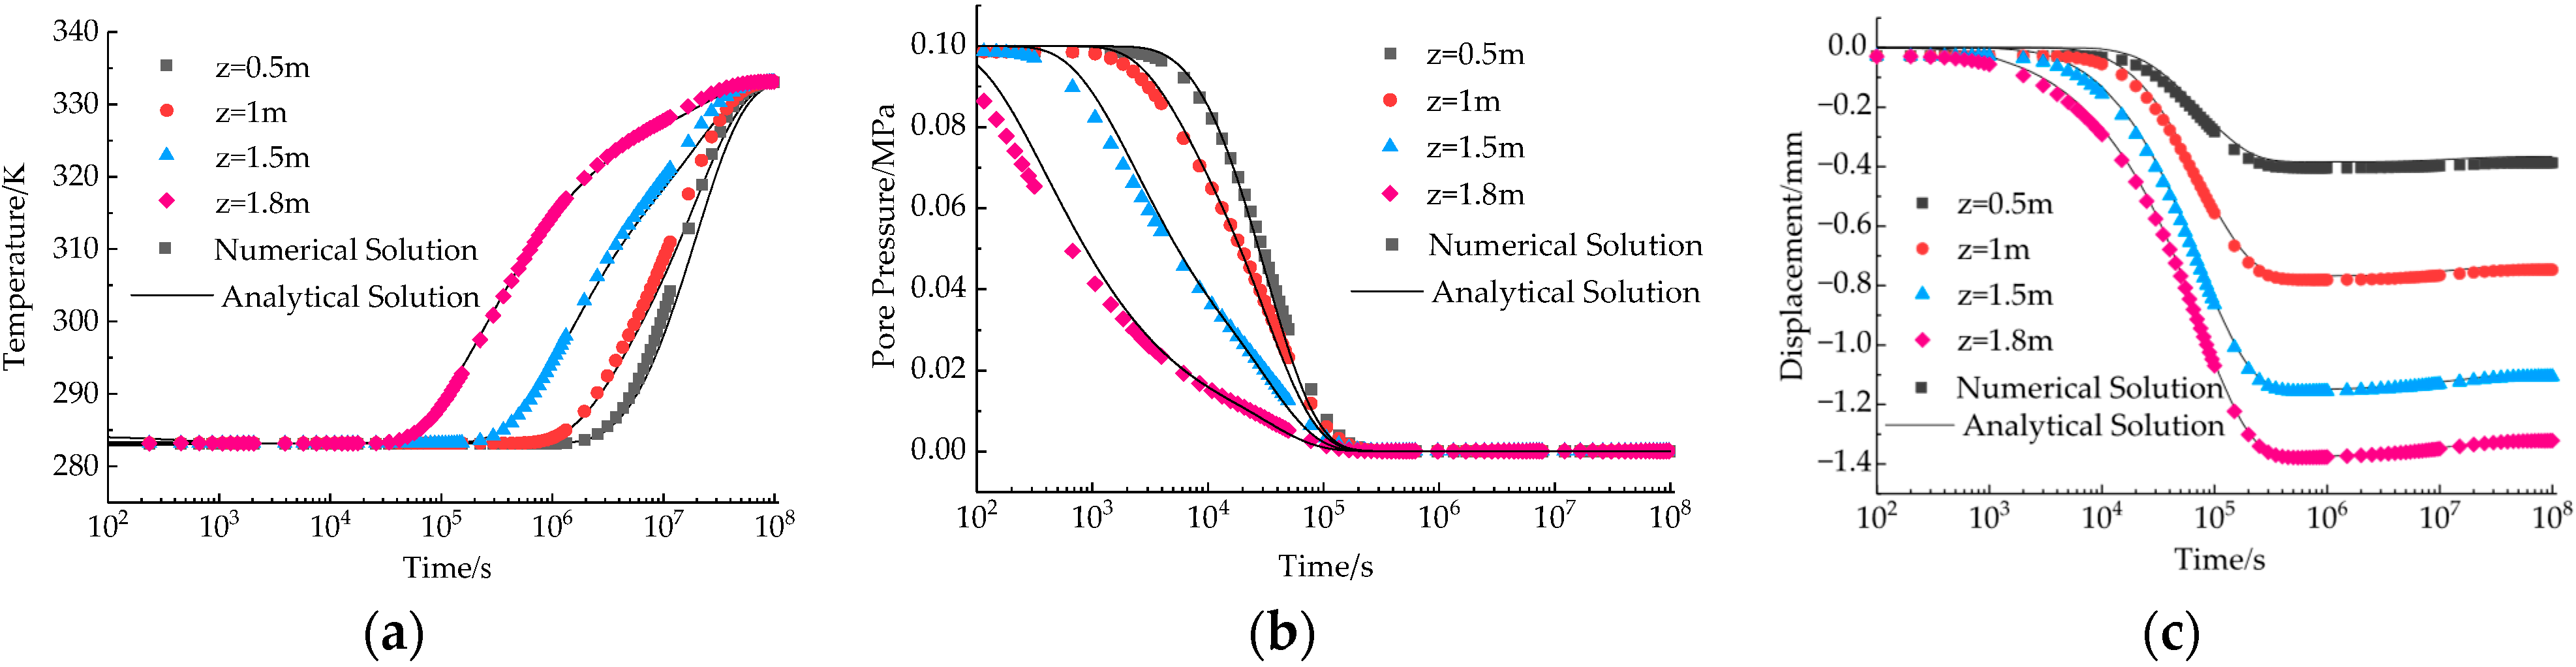
A corresponding soil column model was established in numerical simulation software to calculate the temperature, pore pressure, and deformation of the soil column after a certain period. Comparisons between the analytical and numerical solutions at depths of 0.5, 1.0, 1.5, and 1.8 m are presented in
Figure 7. The two sets of results show good agreement, thereby verifying the stability of the THM coupling model.
3.4. Geometric Model
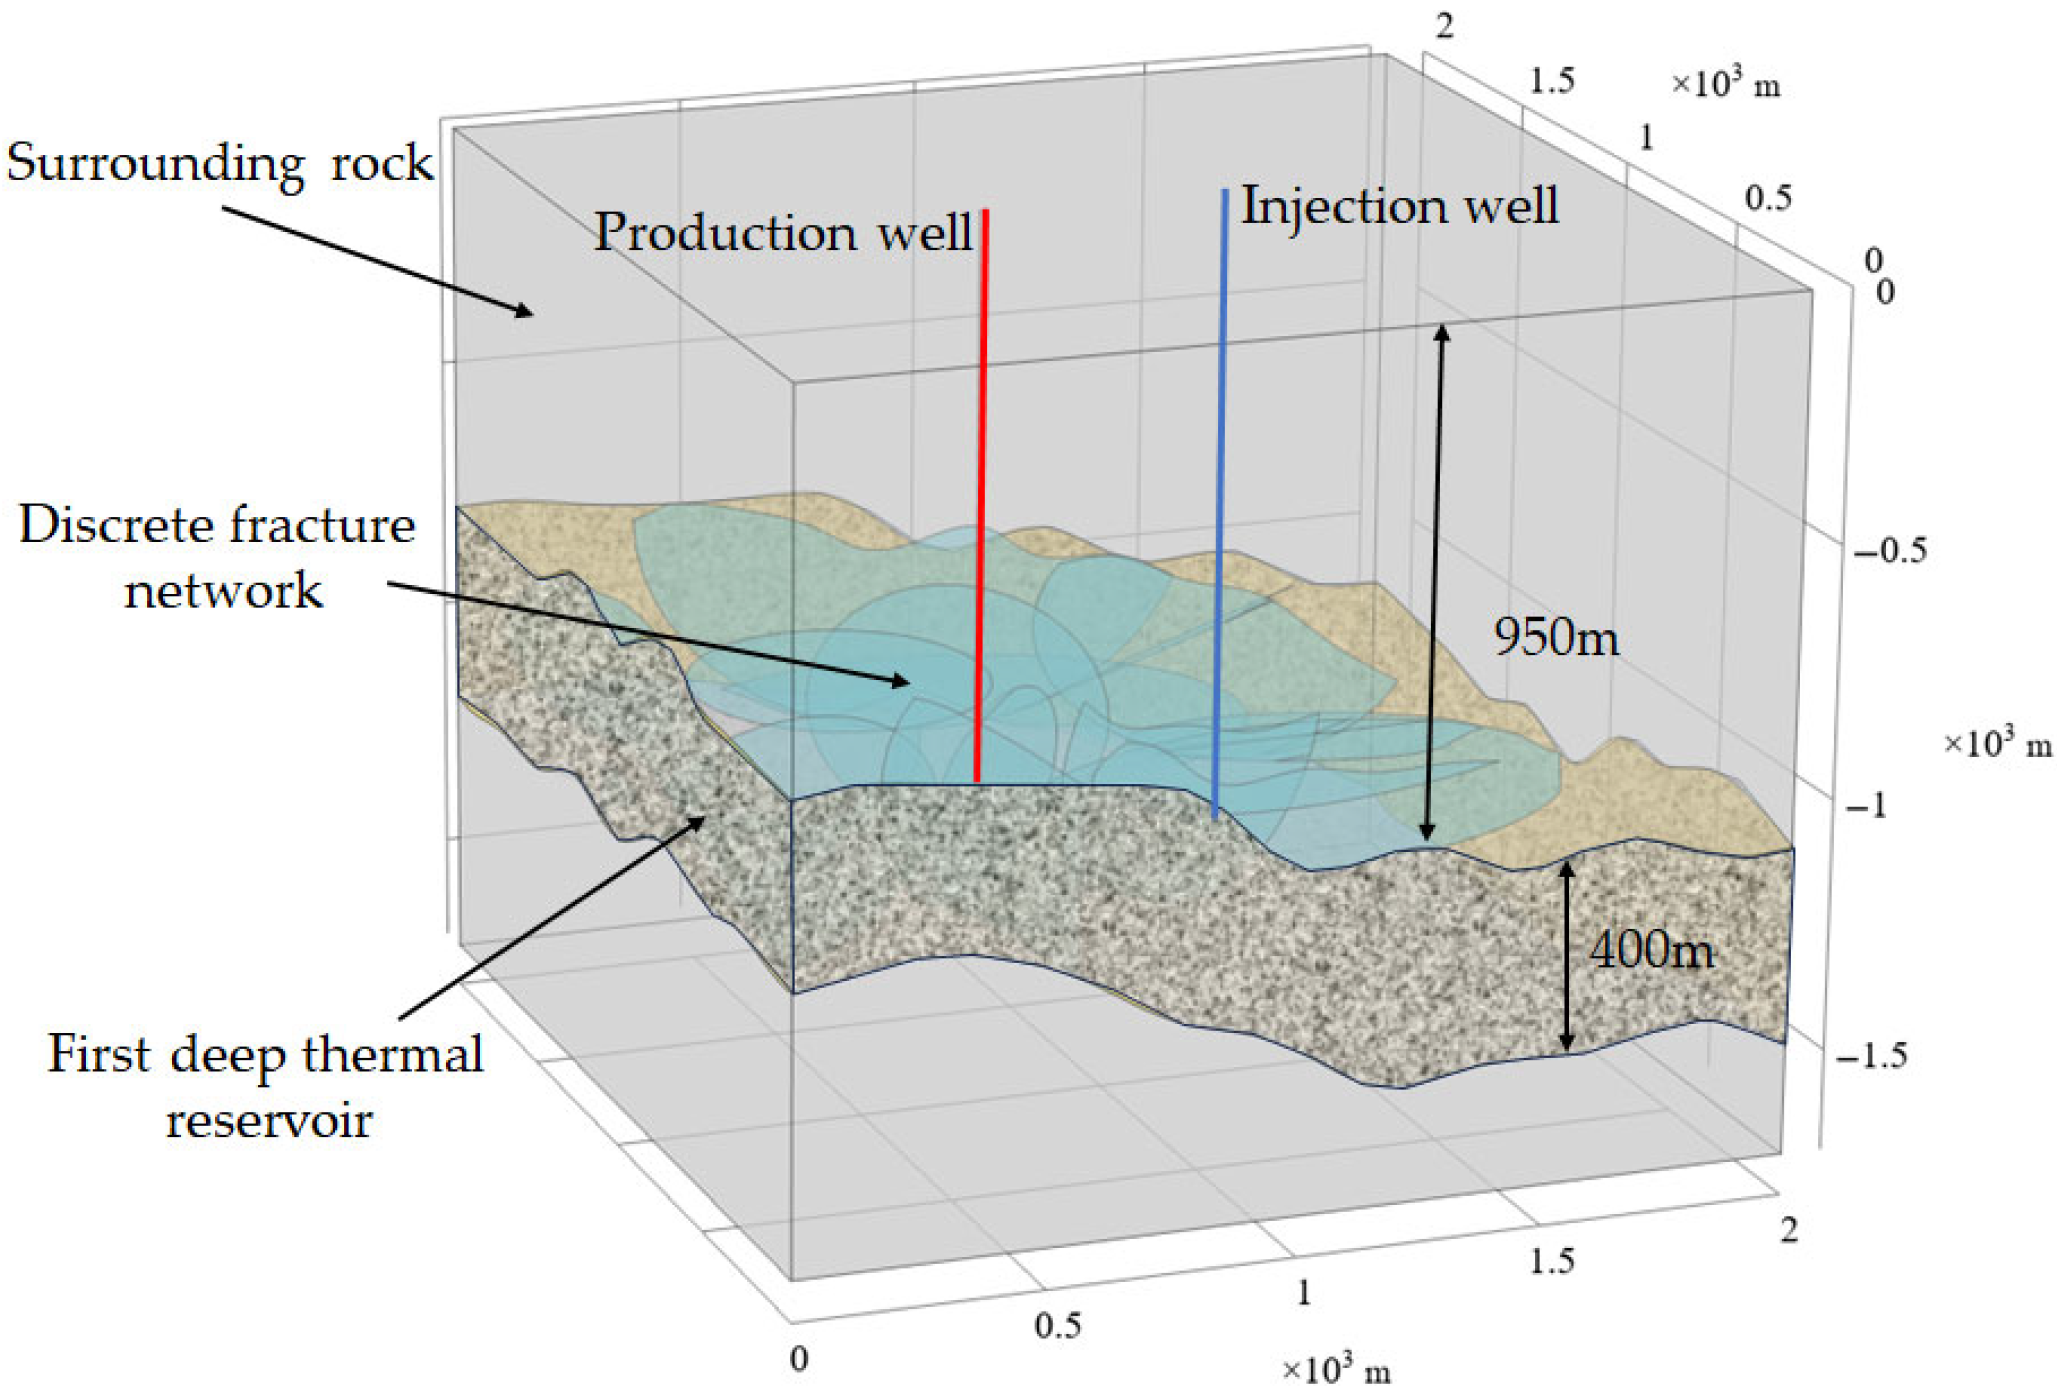
This study takes the Yangbajing geothermal field in Xizang as the geological setting and constructs a physical model based on the exploration data from Well ZK-4001. The Yangbajing geothermal field is a typical non-volcanic high-temperature geothermal system located at a plate margin and formed by continent–continent collision. Its geothermal reservoir structure is characterized by vertical stratification: the shallow reservoir consists of Quaternary sediments and weathered bedrock crust, whereas the deep reservoir is dominated by fractured geothermal reservoirs. Duo Ji [
26] further divided the deep geothermal reservoir into two zones, of which the first deep reservoir is buried at a depth of 950 m with a thickness of 400 m and a maximum temperature of 259.6 °C. Its permeability exhibits the typical characteristics of a fault-controlled geothermal reservoir, indicating favorable heat extraction potential. Therefore, a fully coupled THM numerical simulation was carried out with the first deep geothermal reservoir as the main study object, as shown in
Figure 8.
Yilong Yuan [
30] reported that, according to geophysical and geochemical exploration analyses, the area of the Yangbajing reservoir is estimated to be approximately 4.0 km
2. Accordingly, the geothermal reservoir was modeled at a depth of 950 m below the surface, with a horizontal extent of 2 km × 2 km and a thickness of 400 m. Owing to the lack of measured statistical data on the subsurface fracture system in the Yangbajing area, a stochastic discrete fracture network (DFN) was introduced to provide a more realistic representation of the geological formation. The injection and production wells were arranged to penetrate the central part of the geothermal reservoir, with an open-hole length of 300 m.
3.5. Mesh Discretization
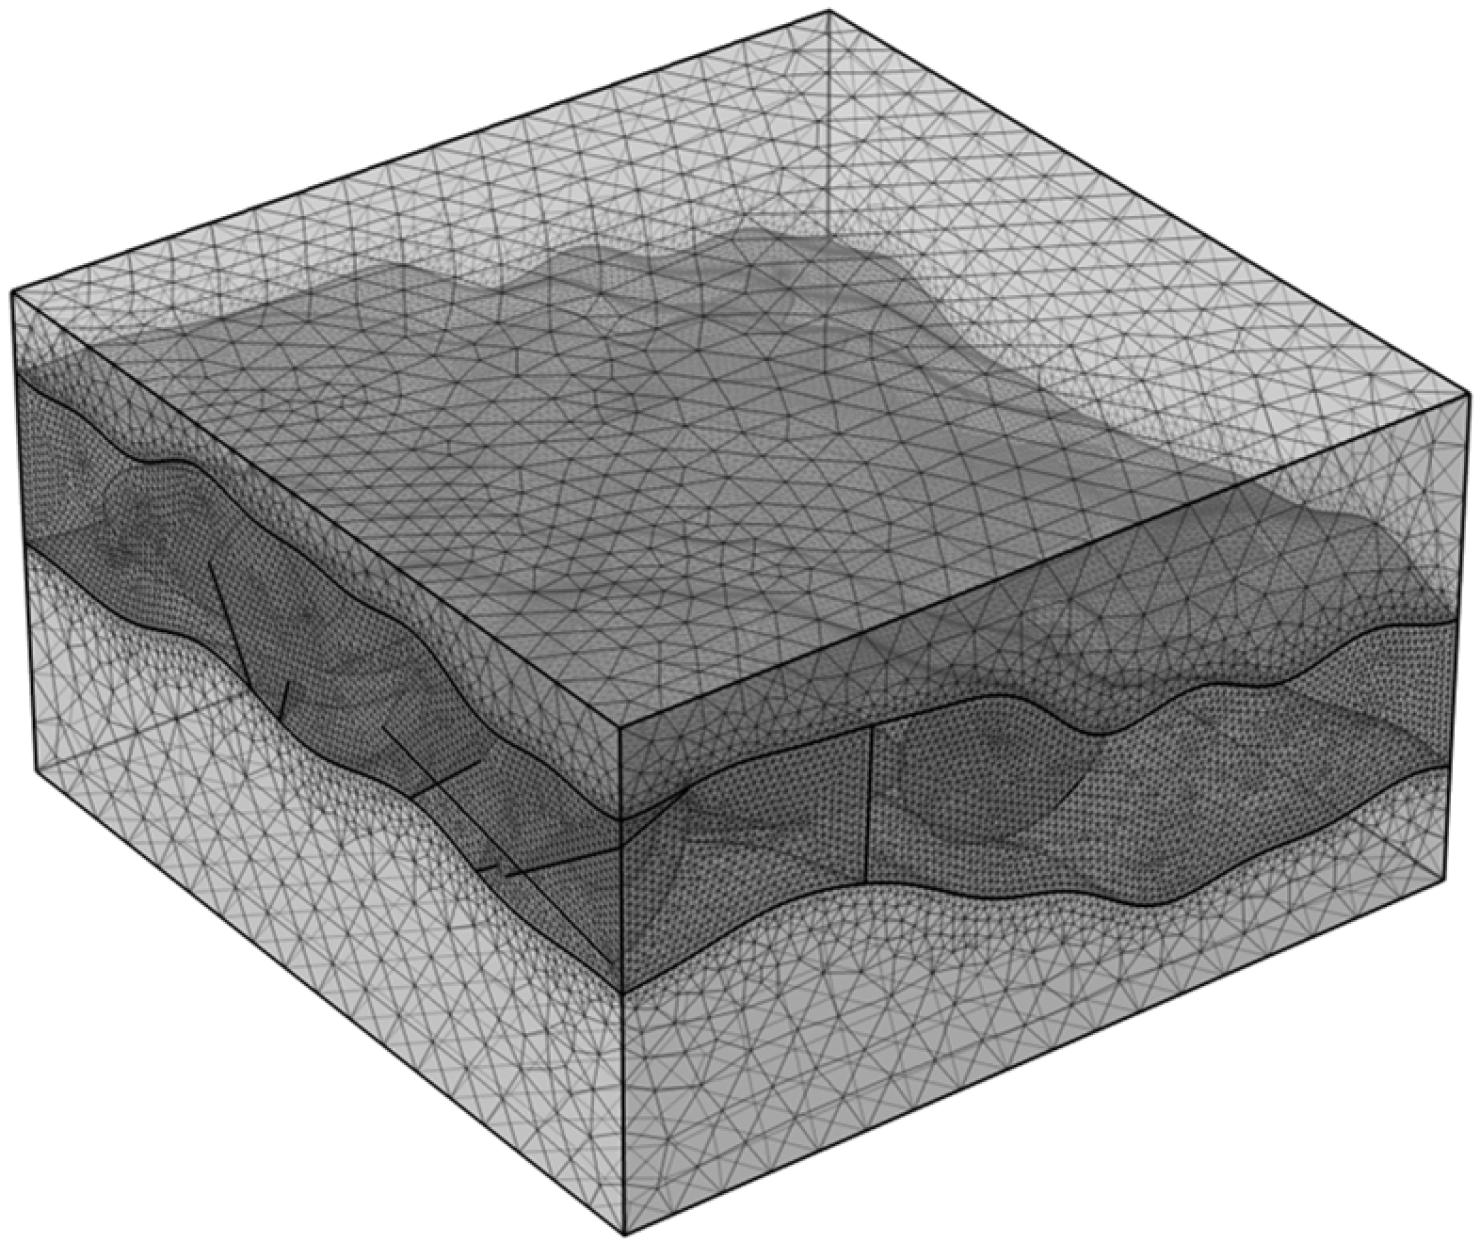
To reduce the computational cost of the numerical model, the actual geological formation was simplified during geometric model construction. Considering that heat extraction mainly occurs within the geothermal reservoir, the thickness of the overlying surrounding rock was appropriately reduced in the model. In addition, only the open-hole section of the wellbore was retained, while the upper wellbore structure was not considered. The model was discretized using a free tetrahedral mesh, resulting in a total of 890,877 mesh elements, as shown in
Figure 9.
The specific meshing strategy was as follows. Global mesh control: a relatively coarse base mesh was adopted for the surrounding rock region, with the maximum element size controlled at approximately 100 m in order to limit the overall computational cost. Local mesh refinement: targeted refinement was applied to key regions where the physical fields vary significantly. Near-well regions: the mesh around the production and reinjection wells was refined to 1–3 m to accurately capture the pressure and temperature gradients associated with fluid convergence and divergence. Near the fracture network: local refinement was applied in the regions containing discrete fractures, with the element size controlled at 5–10 m, so as to better characterize the controlling effect of fractures on fluid flow and heat transfer.
3.6. Boundary Conditions
The surrounding boundaries of the model are assumed to consist of tight, low-permeability cap rocks and are therefore specified as no-flow boundaries. The initial temperature field of the model is derived from the drilling data of Well ZK-4001. Considering that the surrounding rock provides a continuous high-temperature heat supply, the lateral and bottom boundaries of the model are specified as isothermal boundaries, with the initial reservoir temperature set to 250 °C. The lateral boundaries are defined as fixed-displacement boundaries in the x-direction, whereas the bottom boundary is defined as a fixed-displacement boundary in the y-direction. The upper boundary of the model is subjected to the pressure of the overlying strata, which is calculated by
Pz =
ρsgz [
31], where
g = 9.8 N/kg and
z is the burial depth in meters. Both the injection well and the production well are specified as fixed-displacement boundaries.
3.7. Initial Conditions
The initial reservoir conditions and thermophysical parameters required for the model are listed in
Table 3. Among these parameters, the density, dynamic viscosity, specific heat capacity, and thermal conductivity of the fluid are all treated as temperature-dependent in order to accurately represent the underlying physical processes, whereas the thermophysical properties of the rock mass are approximated as constants.
According to the drilling report of Well ZK-4001, the average temperature of the geothermal reservoir is approximately 250 °C. The initial hydrostatic pressure is assumed to be calculated by
p = ρwgz, where
ρw is the density of the geothermal fluid. Serious chemical scaling may occur when the temperature of the geothermal fluid is below 60 °C, which will significantly affect the heat production efficiency and even damage the power generation system. Therefore, the injection water temperature is set at 60 °C [
32].
According to the study by Yilong Yuan [
30], the optimal injection flow rate is approximately 60 m
3/h at a well spacing of 500 m. Taking this value as the design reference point, five injection flow-rate cases were considered: 50, 75, 100, 125, and 150 m
3/h. The model predictions of Shufang Wang [
33] indicate that a well spacing of 400 m may result in a rapid temperature decline in the production well. Therefore, four well-spacing cases were selected, namely 500, 600, 700, and 800 m. The production pressure was set equal to the formation hydrostatic pressure.
3.8. Results
3.8.1. Temperature Evolution and System Lifetime
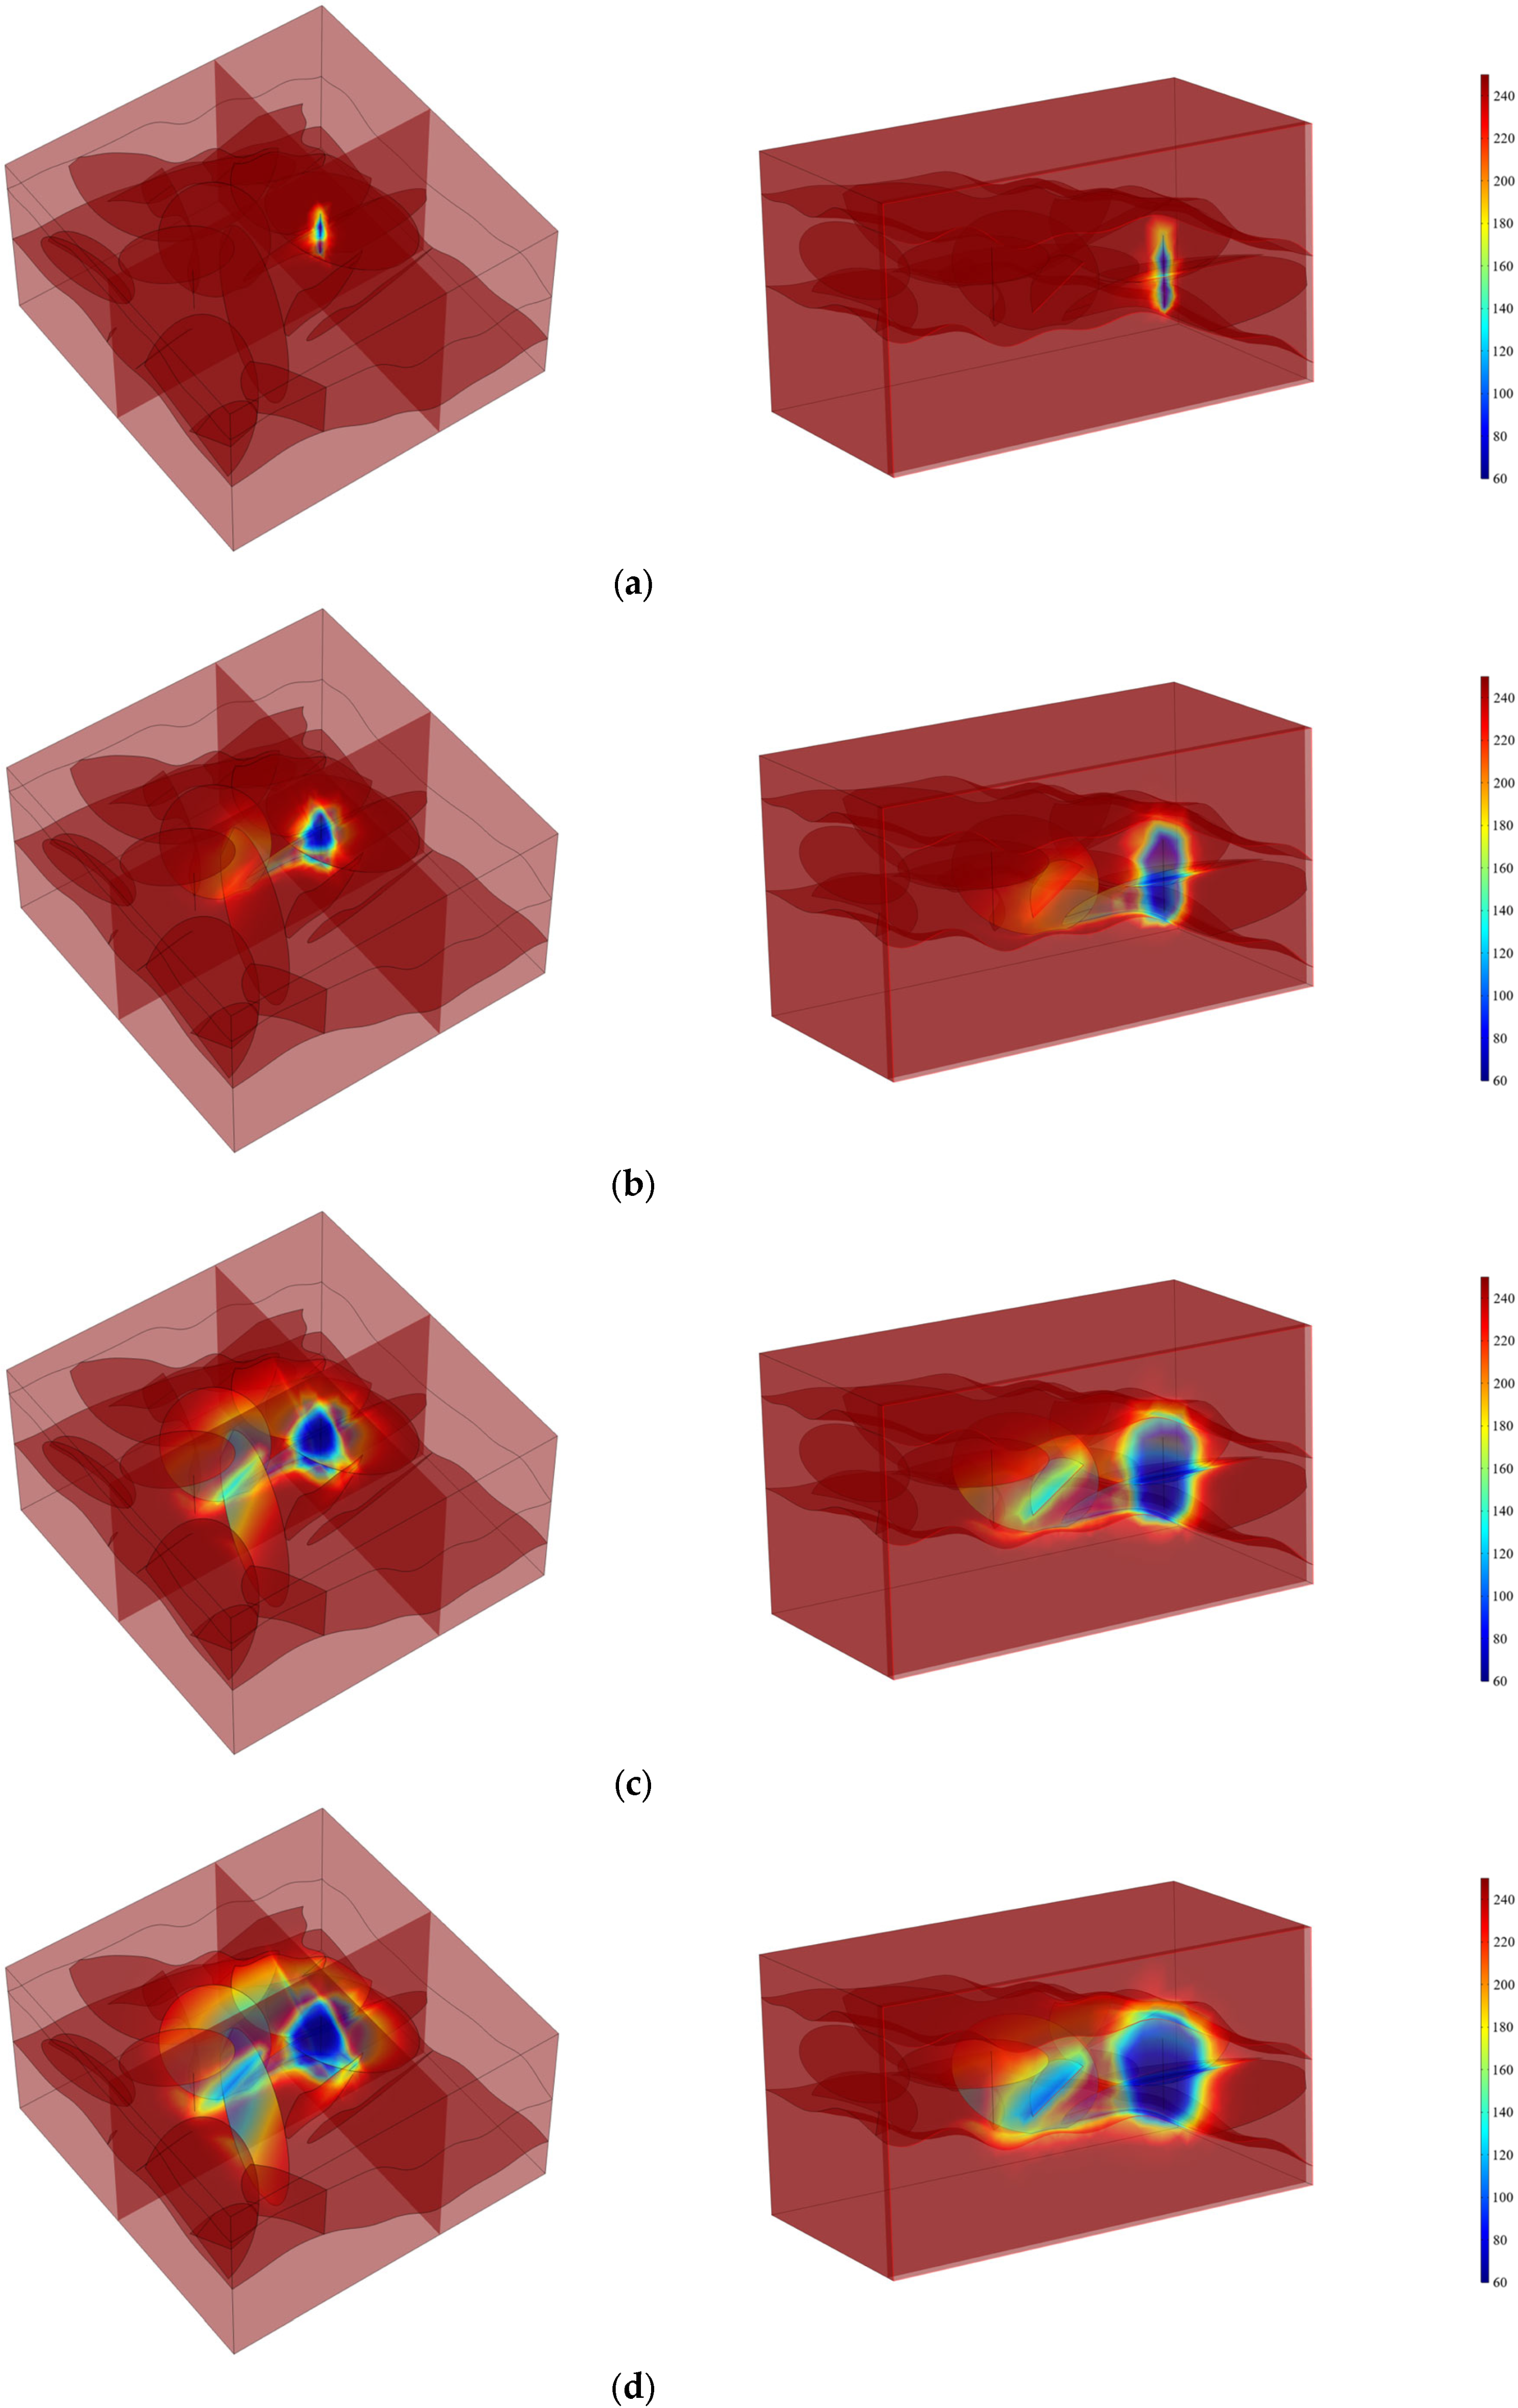
When low-temperature fluid is injected through the reinjection well, a pronounced and localized cooling zone initially develops around the well, with a relatively limited extent of thermal influence. As time progresses, the cold fluid gradually migrates preferentially toward the production well along the highly permeable fracture network, causing the cooling zone to propagate along the fractures and continuously expand, as shown in
Figure 10.
Eventually, the migration pathways of the low-temperature fluid exhibit distinct preferential flow channels toward the production well along high-permeability fractures. The propagation of the cooling zone is highly consistent with the distribution of high-permeability fractures, directly reflecting the migration pattern of low-temperature fluid controlled by the fractured medium. This result also demonstrates the fluid–reservoir interaction and the dynamic evolution of the temperature field during geothermal exploitation.
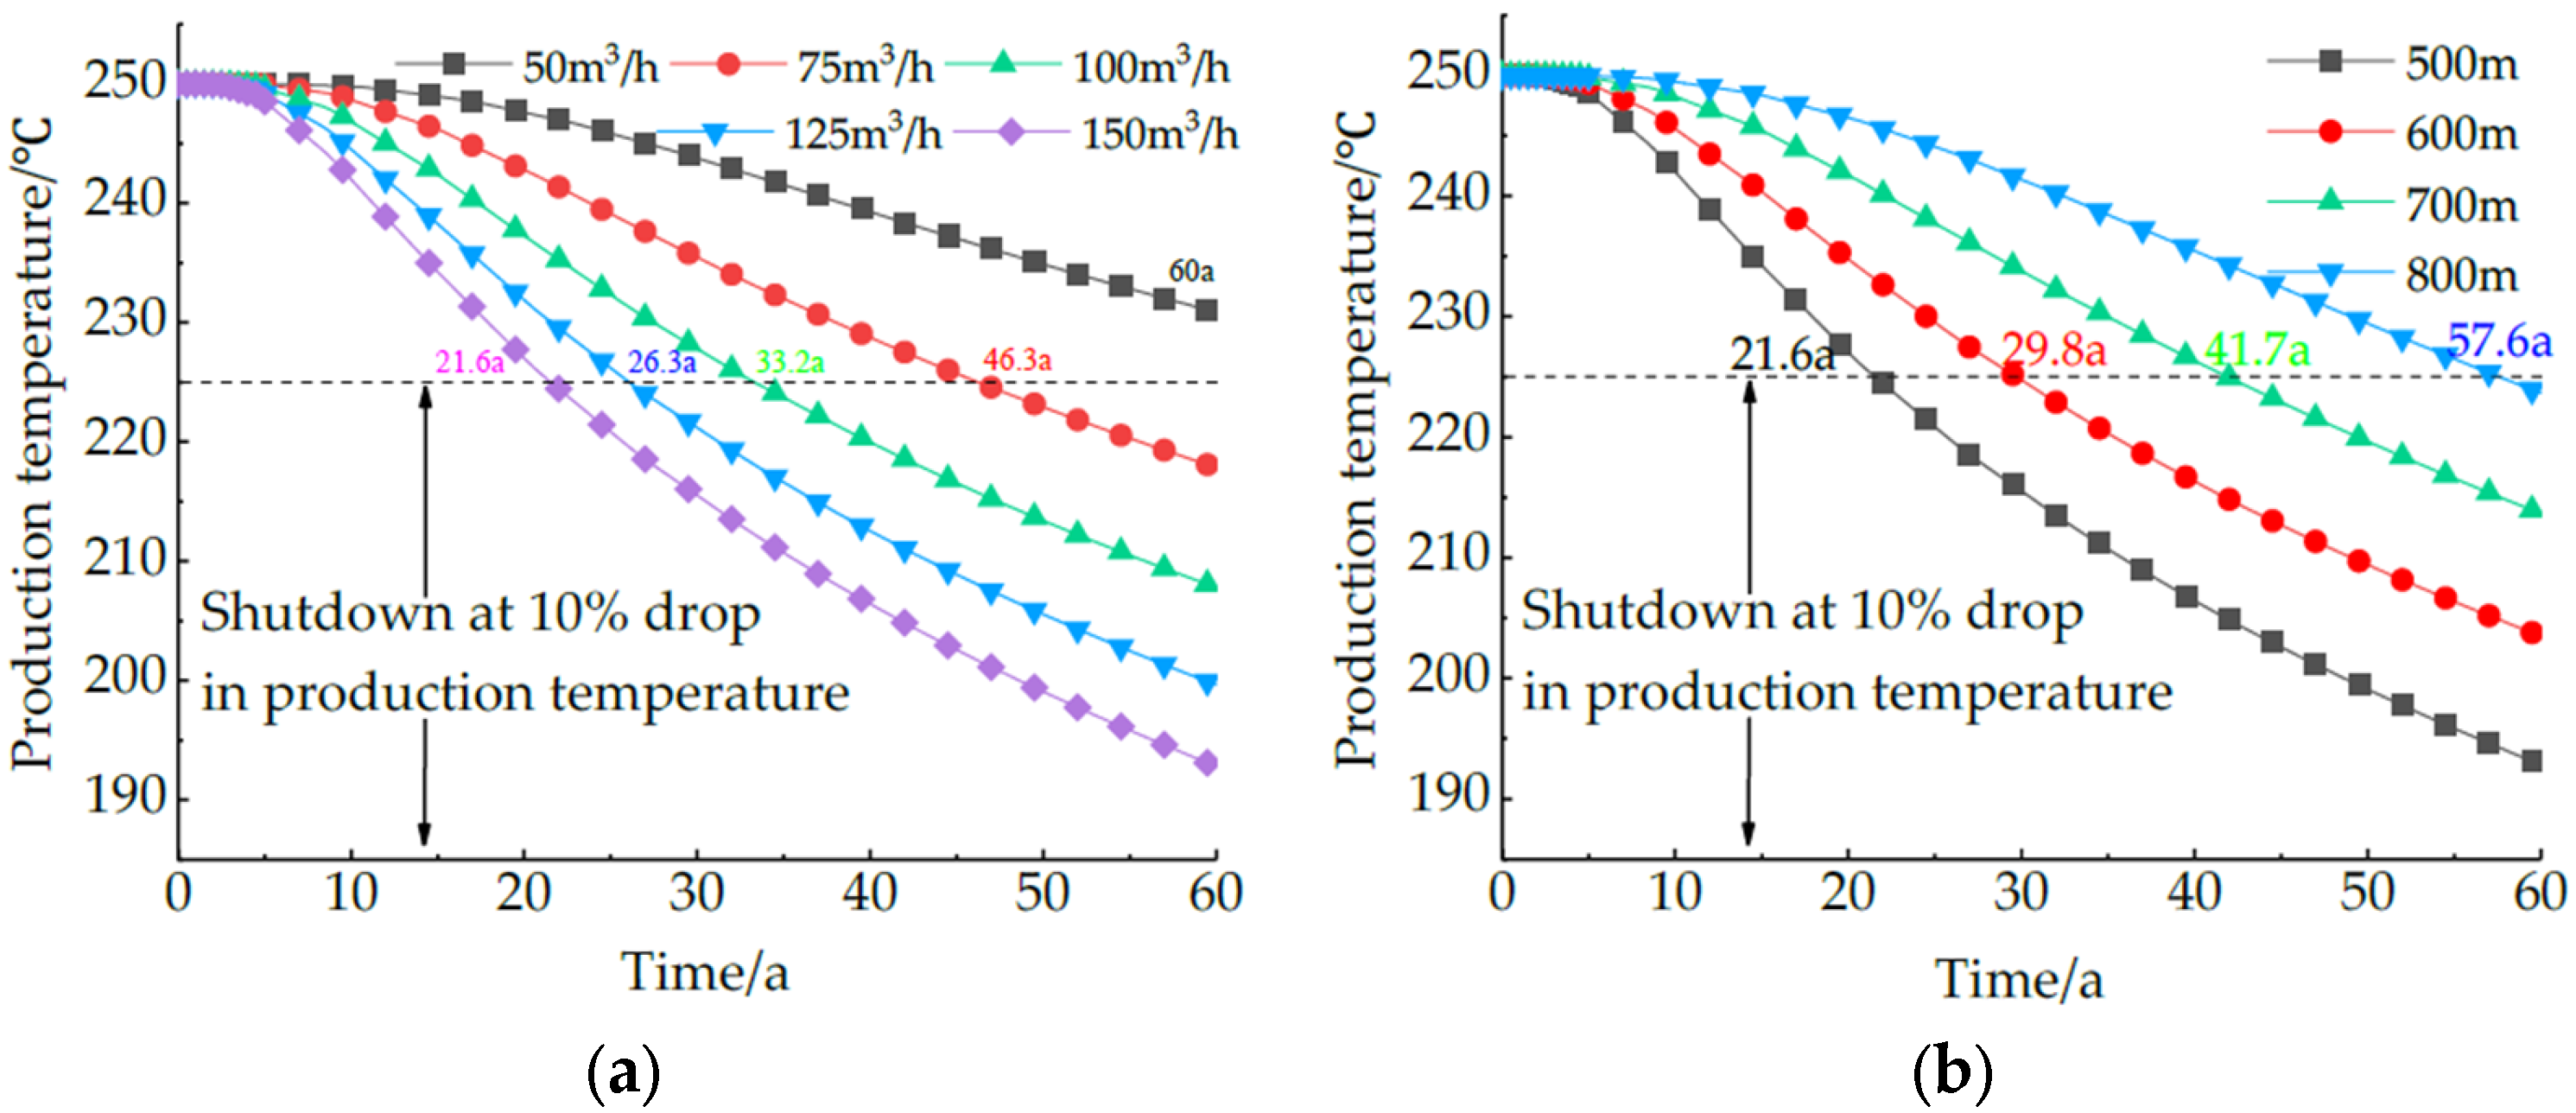
To avoid excessive curve overlap caused by plotting multiple cases in a single figure, the production temperature evolutions for different reinjection rates at a fixed well spacing of 500 m and for different well spacings at a fixed reinjection rate of 150 m
3/h are presented separately in
Figure 11. The production process of geothermal water can generally be divided into two stages: an initial stable stage followed by a subsequent decline stage. The transient variation in production well temperature can be well explained by the spatial evolution of the reservoir temperature field. During the early stage of exploitation, the injected water can be fully heated by the rock matrix, allowing the production well temperature to remain close to the initial reservoir temperature. Once the cooling front reaches the production well, the injected water no longer has sufficient time to exchange heat fully with the rock matrix, resulting in a gradual decline in production temperature during the later stage.
Observation of the temporal evolution of reservoir production temperature under different injection flow rates reveals a significant positive correlation between injection flow rate and the rate of production temperature decline. As the injection flow rate increases from 50 m3/h to 150 m3/h, the slope of the temperature decline curve becomes progressively steeper. At year 60, the production temperature at 150 m3/h is approximately 38.08 °C lower than that at 50 m3/h. This is because a higher injection flow rate increases the migration velocity of the cold fluid within the geothermal reservoir and accelerates heat transfer from the reservoir rock to the fluid. At the same time, a higher flow rate expands the migration range of the cold fluid within the reservoir, thereby enlarging the cooling zone. Although a high injection flow rate can enhance heat extraction efficiency in the short term, it also accelerates reservoir cooling and shortens the economic lifetime of the system. Therefore, in practical development, the injection flow rate should be properly controlled to achieve better economic performance.
Analysis of the production well temperature evolution under different well spacings reveals a significant negative correlation between well spacing and the rate of production temperature decline. As the well spacing increases from 500 m to 800 m, the decline in production temperature becomes progressively slower. At year 60, the production temperature at a well spacing of 800 m is approximately 30.8 °C higher than that at 500 m. This behavior can be explained as follows: under a fixed injection flow rate, a larger well spacing results in a longer fluid migration path within the reservoir and a longer heat exchange duration between the fluid and the reservoir medium, allowing the high-temperature fluid to maintain a higher temperature upon reaching the production well. In addition, the propagation of the cooling front is constrained by well spacing. Under larger well-spacing conditions, the cooling front is less likely to propagate rapidly toward the production well region, thereby resulting in a slower decline in production temperature.
The system lifetime varies considerably under different operating conditions. To ensure the long-term viability of the production system, the decline in production temperature over the entire service period should not exceed 10%. Therefore, a 10% decline in production temperature was adopted in this study as the shutdown criterion [
34]. The wellbore lifetime was set to 60 years, meaning that the maximum heat extraction period considered in the simulation was 60 years [
6]. Accordingly, at a fixed well spacing of 500 m, the system lifetime is 60.0, 46.3, 33.2, 26.3, and 21.6 years for reinjection rates of 50, 75, 100, 125, and 150 m
3/h, respectively. Similarly, at a fixed reinjection rate of 150 m
3/h, the system lifetime is 21.6, 29.8, 41.7, and 57.6 years for well spacings of 500, 600, 700, and 800 m, respectively.
3.8.2. Heat Production, Power Generation and System Pumping Consumption
The heat production efficiency of the geothermal system is expressed by Equation (8):
where
cw is the heat capacity of the fluid,
m is the mass flow rate of the production well,
Tpro is the production temperature, and
Tinj is the injection temperature.
According to the first and second laws of thermodynamics, the efficiency f defines the thermal energy that can be converted into maximum mechanical work [
35].
Trej is the heat rejection temperature. The annual average air temperature of the Yangbajing Geothermal Field is approximately 9 °C [
36], so
Trej = 282.15 K is adopted in this study.
Generally, the utilization efficiency of converting maximum mechanical work into electrical energy is about 0.45. Therefore, the power generation
We can be defined by Equation (10) [
35].
The total energy consumption during system operation includes the energy consumed by the pumps in the injection well and production well, calculated as:
where
Wp1 is the energy consumption of the injection pump,
Wp2 is the energy consumption of the production pump,
Qinj and
Pinj are the injection flow rate and pressure, respectively, and
Qpro and
Ppro are the production flow rate and pressure, respectively.
ρgh1 is the formation hydrostatic pressure near the open-hole section of the injection well, and
ρgh2 is the formation hydrostatic pressure near the open-hole section of the production well. The pump efficiency is 80%. Since the production pressure in the model equals the formation hydrostatic pressure,
Wp2 = 0, and the total pump energy consumption
Wp =
Wp1.
3.8.3. Collaborative Optimization of Well Spacing and Injection Flow Rate
To further elucidate the coupling mechanism between well spacing and injection flow rate, this study establishes a coordinated optimization model for these two parameters by comprehensively evaluating temperature-field evolution and thermal breakthrough characteristics under different spatial configurations, thereby providing a theoretical basis for the design of engineering parameter combinations.
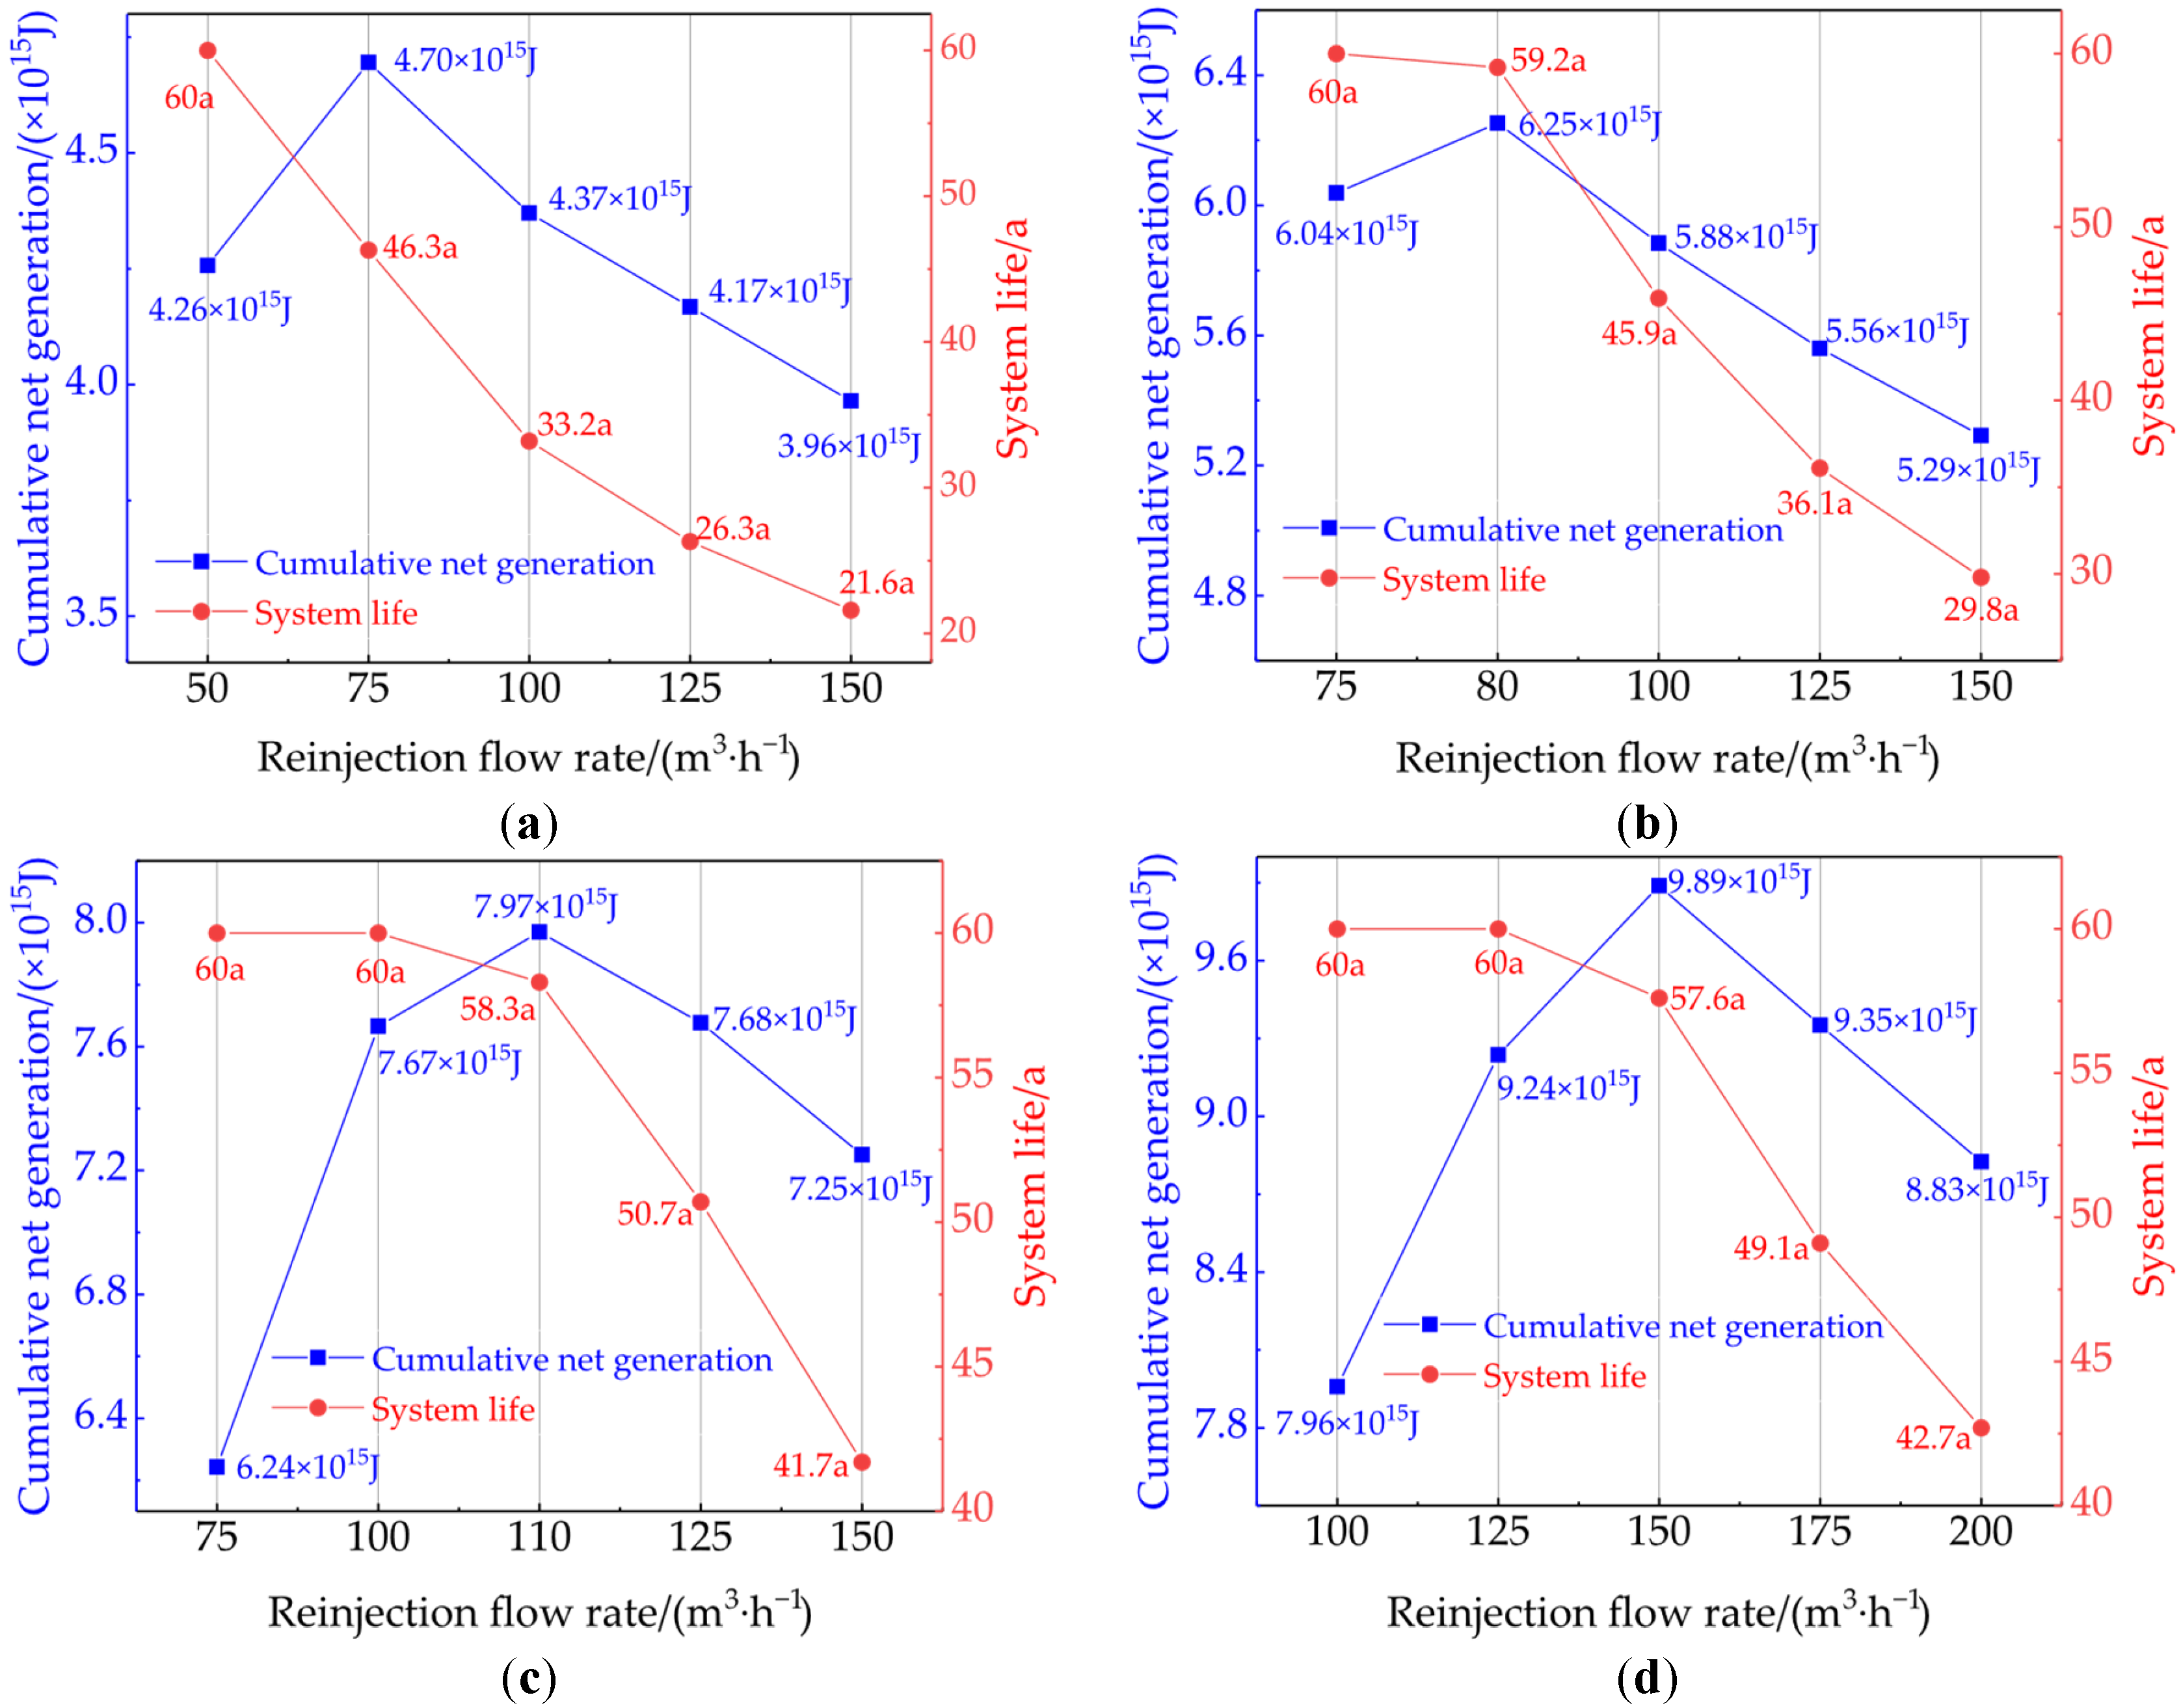
Excluding pumping power consumption, the system lifetime and the cumulative net power generation over the full life cycle of the heat extraction system under different well spacings and injection flow rates are presented in
Figure 12.
The effect of injection flow rate on cumulative net power generation over the system life cycle exhibits a nonlinear trend of an initial increase followed by a subsequent decline. As shown in
Figure 12a, when the well spacing is 500 m and the injection flow rate is 75 m
3/h, the cumulative net power generation reaches its peak value of 4.70 × 10
15 J. Compared with 50 m
3/h, a moderate increase in injection flow rate can improve the effective thermal energy extraction rate per unit time by enhancing the circulation efficiency of geothermal fluid within the reservoir. However, as the injection flow rate continues to increase, excessive injection accelerates the decline in production temperature and sharply shortens the system lifetime, causing the cumulative net power generation to gradually decrease with further increases in injection flow rate. By contrast, at a relatively low injection flow rate of 50 m
3/h, the production temperature decline does not reach 10% by the end of the designed wellbore service life of 60 years, indicating that the thermal energy of the geothermal reservoir is not fully exploited under this condition and that geothermal resources are therefore not efficiently utilized. To further determine the optimal injection parameters, an additional case with an injection flow rate of 60 m
3/h was specifically designed and investigated. The results show that, under this condition, the production temperature declines to approximately 10% exactly at the end of the wellbore service life. Meanwhile, the cumulative net power generation over the system life cycle is calculated to be 4.94 × 10
15 J. It can therefore be concluded that, without causing underutilization of geothermal resources, a relatively low injection flow rate yields better economic performance within the wellbore service life.
As shown in
Figure 12b, the simulation results exhibit the same trend, namely a significant negative correlation between injection flow rate and system lifetime. To determine the optimal injection parameters, an additional case with an injection flow rate of 80 m
3/h was introduced. Under this condition, the system lifetime reaches 59.2 years, which is generally consistent with the wellbore service life, while the cumulative power generation increases to 6.25 × 10
15 J. Therefore, considering both system lifetime and cumulative net power generation, an injection flow rate of 80 m
3/h was identified as the optimal operating parameter at a well spacing of 600 m. Similarly, as shown in
Figure 12c,d, the optimal operating condition was determined to be 110 m
3/h at a well spacing of 700 m. When the well spacing is further increased to 800 m, the optimal operating condition is 150 m
3/h.
This optimization scheme significantly improves the heat extraction efficiency of the system over its full life cycle while ensuring engineering safety through precise regulation of injection parameters. The results indicate that, within the wellbore service life and under the condition of avoiding geothermal resource underutilization, reducing the fluid migration velocity within the reservoir and appropriately lowering the injection flow rate can enhance heat recovery and yield better economic performance.
3.8.4. Fitting Equation of Well Spacing and Injection Flow Rate
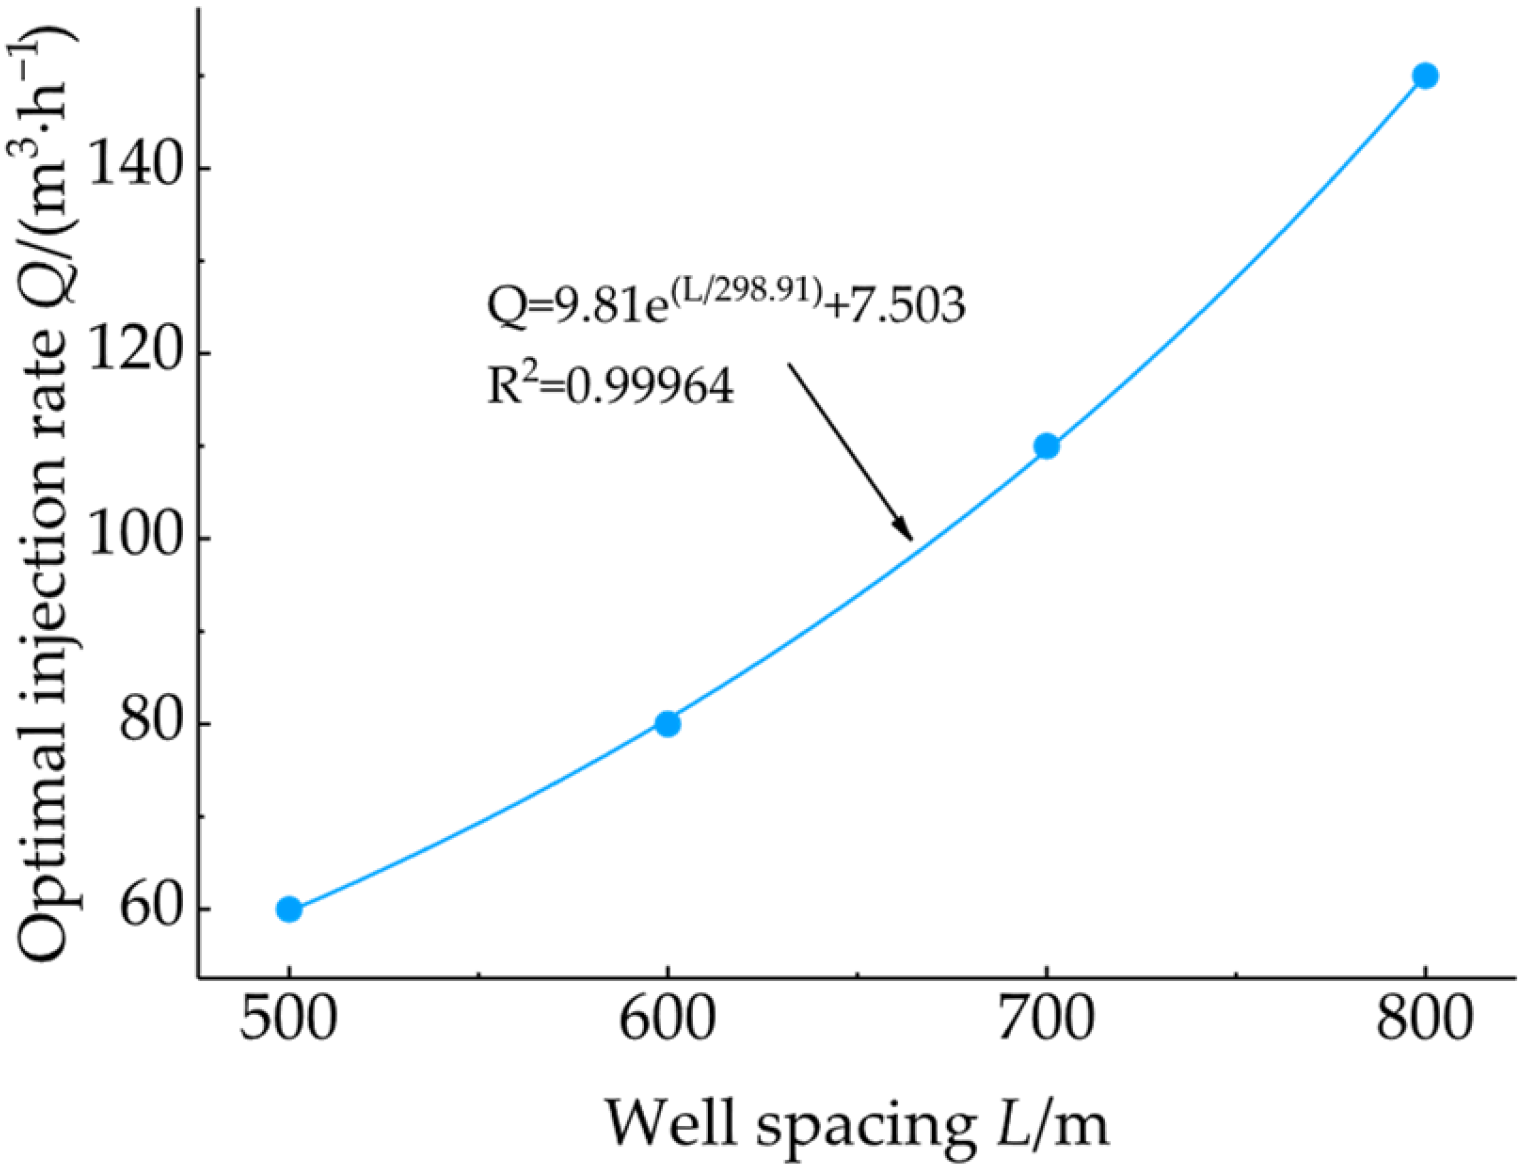
By systematically analyzing the power generation performance at different reinjection rates for each well spacing, the reinjection rate that maximizes cumulative power generation over the system lifetime was identified as the optimal reinjection rate. Under the shutdown criterion of a 10% decline in production temperature, the optimal reinjection rates corresponding to well spacings of 500, 600, 700, and 800 m were determined to be 60, 80, 110, and 150 m
3/h, respectively. The characteristic curve describing the nonlinear increasing relationship between reinjection rate and well spacing is shown in
Figure 13:
The results indicate that the reinjection rate is constrained by both lower and upper bounds. The lower bound is governed by development efficiency: an insufficient reinjection rate leads to low heat extraction efficiency and a reservoir development period that exceeds the wellbore service life, thereby resulting in resource underutilization. The upper bound is controlled by system sustainability: an excessively high reinjection rate accelerates thermal breakthrough, shortens system lifetime, increases pumping consumption, and significantly reduces economic performance. It should be noted that this equation is an empirical fitting relationship established on the basis of the simulation results of this study. It can adequately characterize the variation pattern between well spacing and the optimal reinjection rate within the current range of operating conditions, thereby providing a useful reference for parameter optimization under similar conditions.
3.8.5. Prospects for the Development of the Yangbajing Geothermal Field
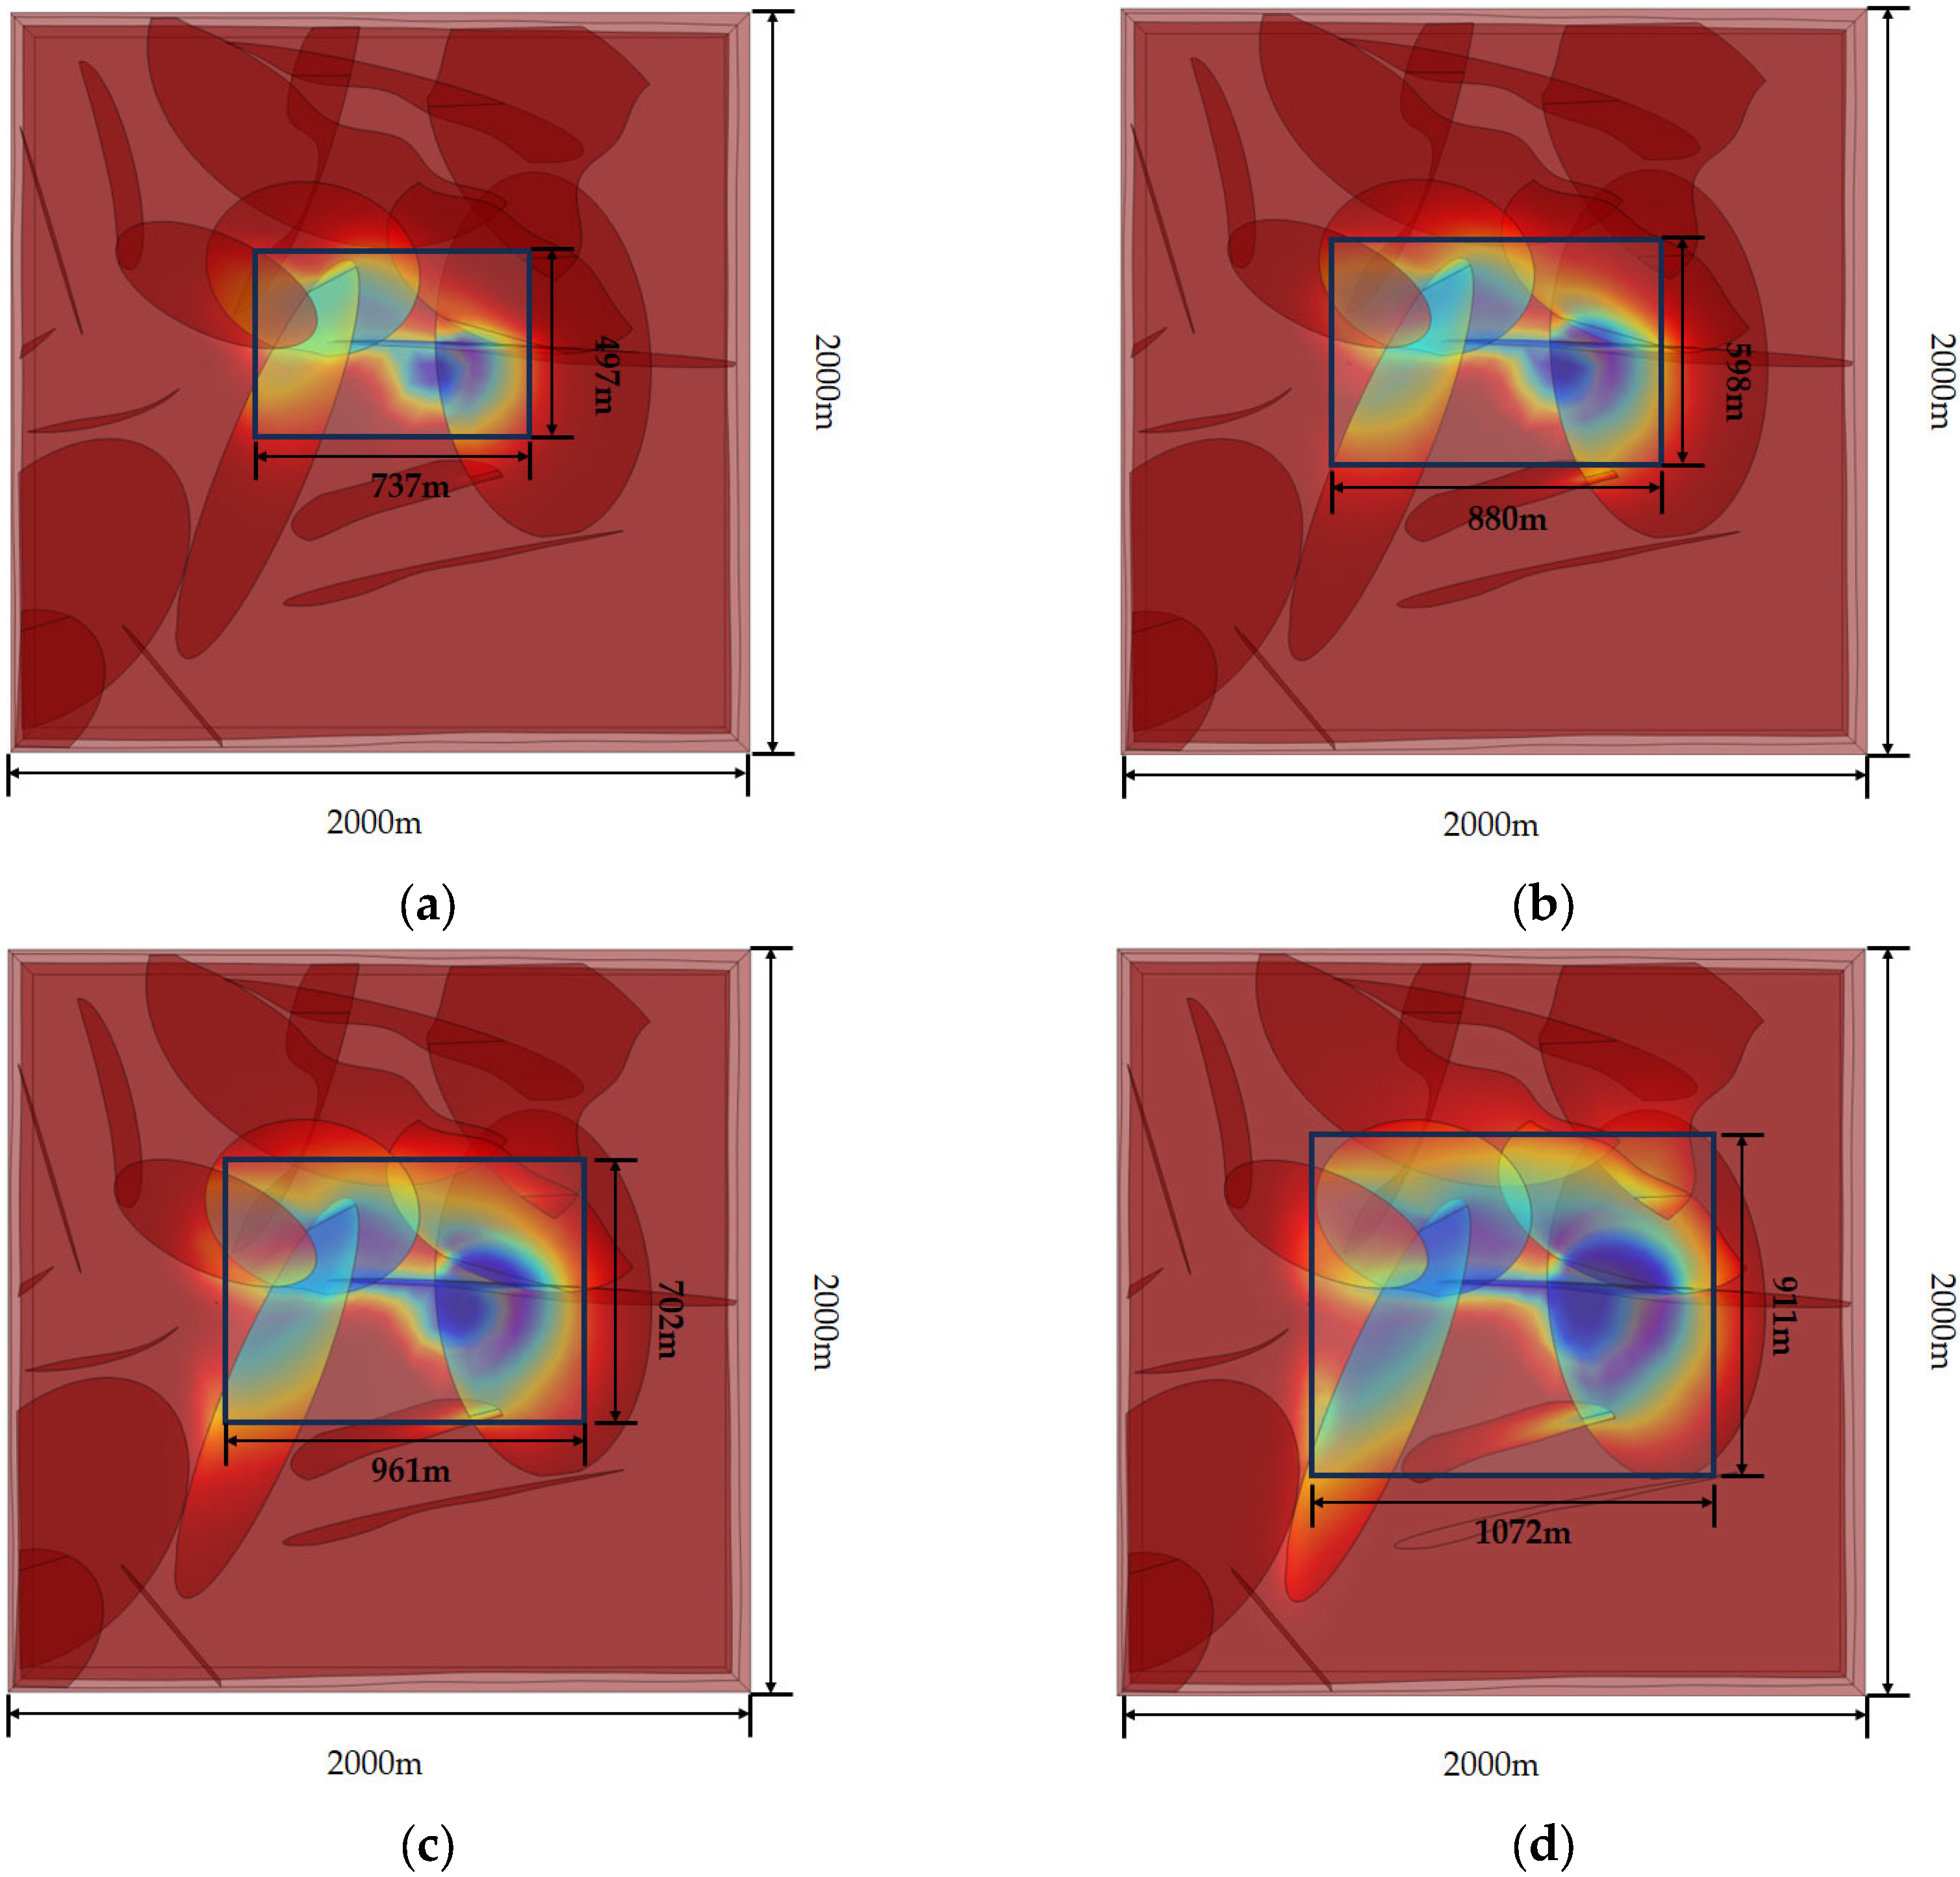
Under the shutdown criterion of a 10% decline in production temperature, the spatial extent of the reservoir temperature-field disturbance corresponding to the optimal reinjection scheme for each well spacing is shown in
Figure 14. Because a larger well spacing permits a higher optimal reinjection rate, thereby enhancing geothermal fluid displacement and convective heat transfer, the cold front propagates over a wider range. Consequently, the extent of temperature disturbance increases significantly with increasing well spacing.
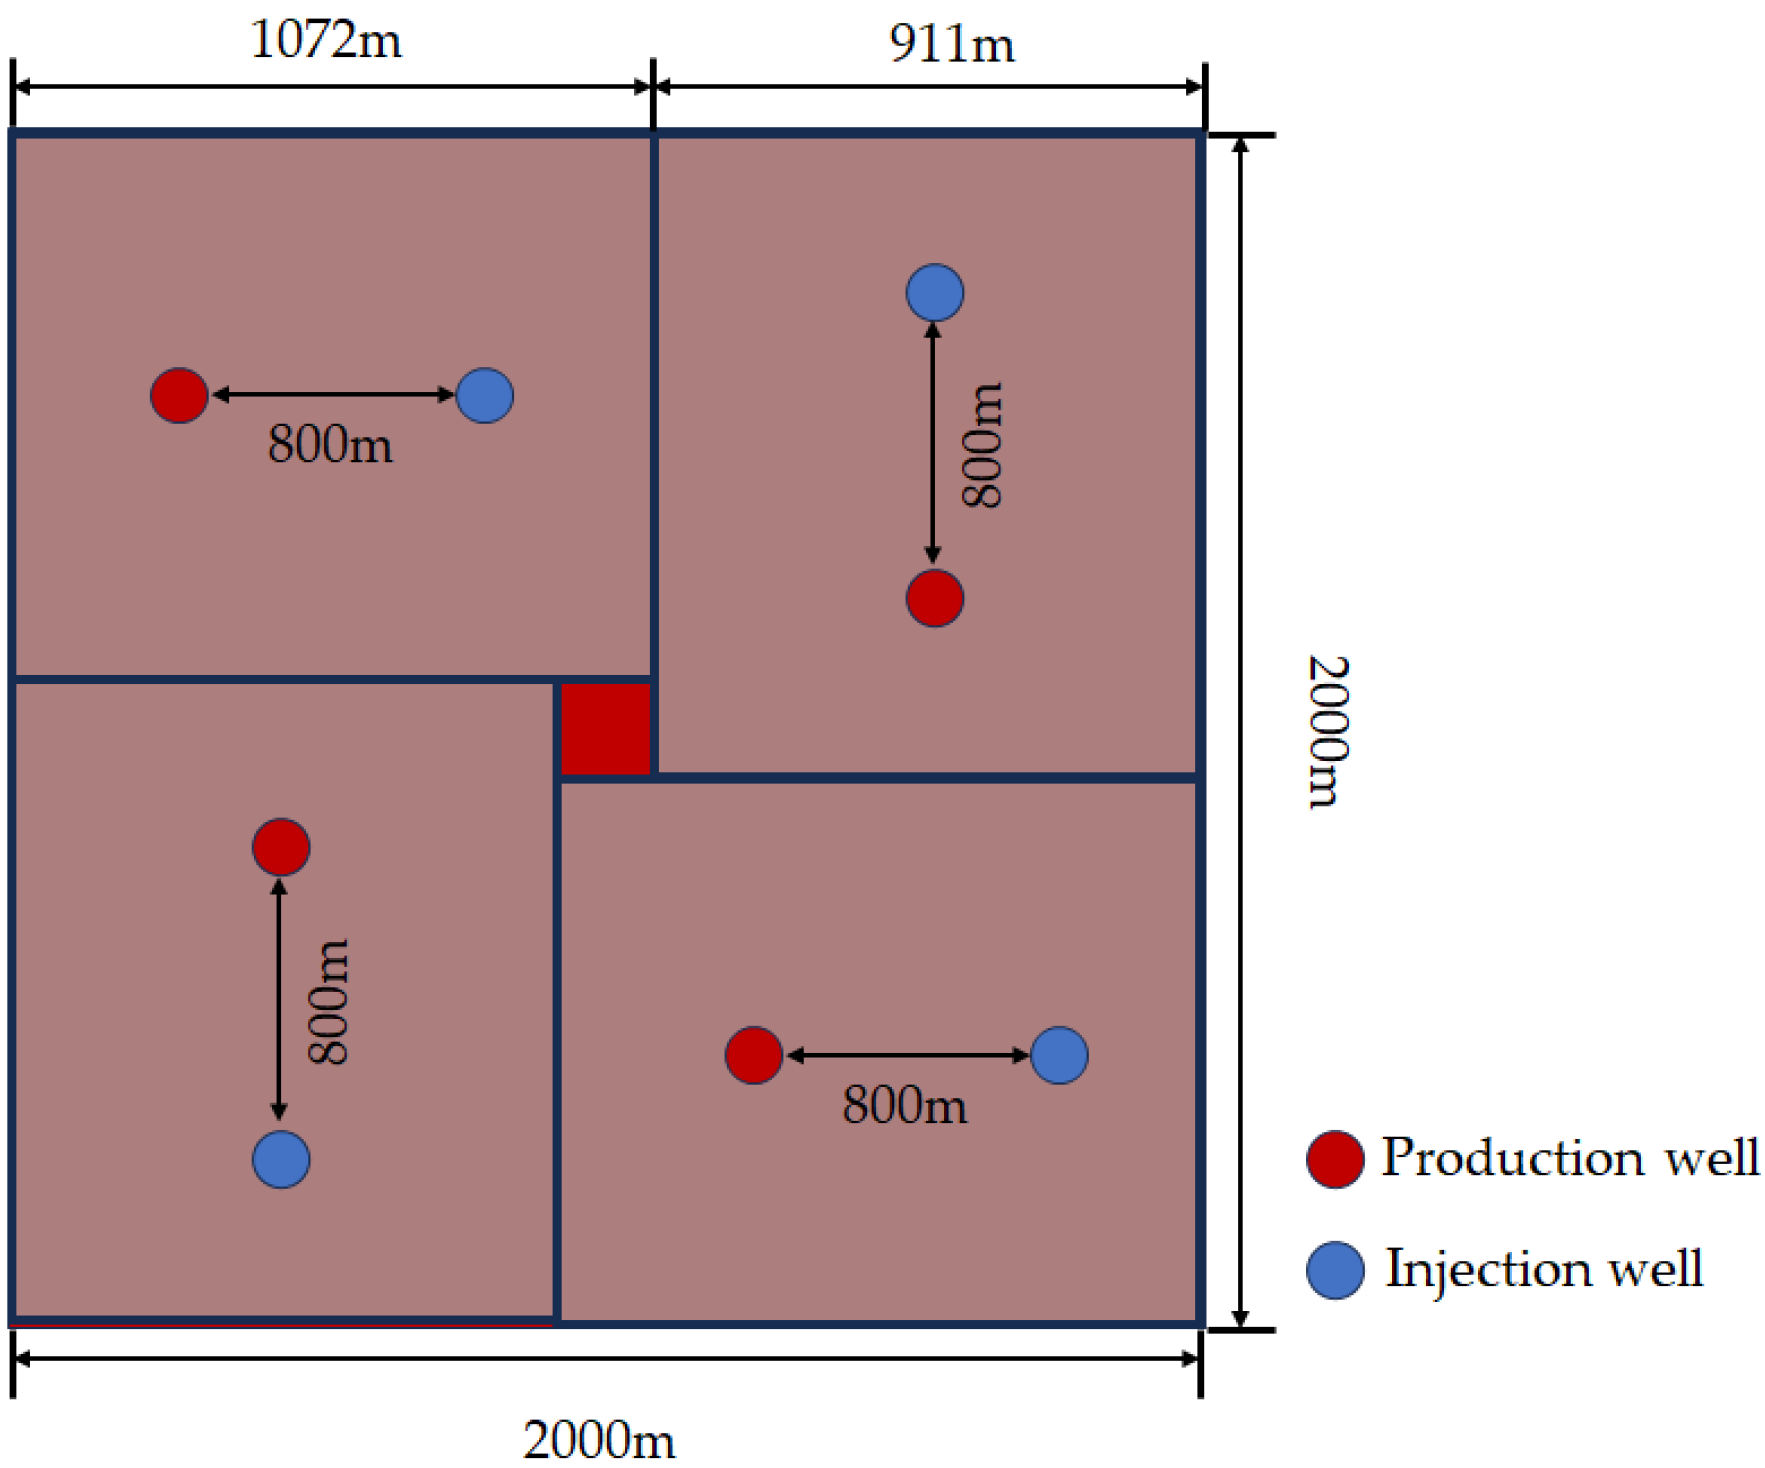
To evaluate the development potential of the first deep geothermal reservoir in Yangbajing, a preliminary estimate of the number of heat-extraction units that can be deployed within the entire reservoir was made based on the optimized performance of a single heat-extraction unit and the extent of thermal disturbance. The layout corresponding to the maximum installed capacity is shown in
Figure 15. When the well spacing is 800 m and the reinjection rate is 150 m
3/h, the installed capacity of a single heat-extraction unit can reach 7.95 MW. On this basis, the theoretical installed capacity of the first deep reservoir in the Yangbajing geothermal field is preliminarily estimated to be approximately 31.8 MW, indicating considerable development potential.