Article

Optimization of Technological Parameters of the Working Process of a Spring–Rotor Grinder Based on Mathematical Modeling


1
LLP Europlus Vostok, Ust-Kamenogorsk 070000, Kazakhstan
2
Miras University, Shymkent 160000, Kazakhstan
3
International School of Engineering, D. Serikbayev East Kazakhstan Technical University, Ust-Kamenogorsk 070004, Kazakhstan
4
Faculty of Mechanical Engineering, Wroclaw University of Science and Technology, 50-370 Wroclaw, Poland
*
Author to whom correspondence should be addressed.
Appl. Sci. 2026, 16(6), 2900; https://doi.org/10.3390/app16062900
Submission received: 17 February 2026 / Revised: 28 February 2026 / Accepted: 16 March 2026 / Published: 17 March 2026
(This article belongs to the Section Mechanical Engineering)

Abstract

This study addresses the problem of improving the efficiency of fine grinding of bulk materials in an original-design double spring–rotor grinder equipped with a separating diaphragm with a variable discharge orifice. The purpose of the work is to determine rational operating parameters that ensure a balanced trade-off between grinding quality, throughput, and energy consumption. The methodology is based on a full-factorial experimental design (Hartley plan) with five controllable parameters—rotational speed, material filling ratio, overlap of the working zones, grinding chamber clearance, and grinding duration—followed by response surface modeling and multi-objective optimization. The main responses included grinding fineness, throughput, drive power, specific energy consumption, and specific metal intensity. Adequate second-order regression models were obtained (R2 > 0.93), and analysis of variance confirmed the statistical significance of the main effects and interactions. Multi-objective optimization enabled the identification of operating regimes that increase throughput by 15–20% while reducing specific energy consumption by 8–12% compared with empirical settings. The proposed approach provides a quantitative basis for selecting compromise operating conditions and can be applied to the tuning and control of spring–rotor grinding equipment in processing industries.

1. Introduction

Fine grinding remains one of the most energy-intensive and technologically demanding operations in the processing chains of mineral, construction, chemical, food and agricultural materials [1,2]. An increase in dispersion markedly raises the specific surface area of particles and thus strongly affects reaction rates, packing, rheology and end-product properties. At the same time, as particle size decreases, typical trends show declining throughput and sharply increasing specific energy consumption; beyond a material-specific fineness threshold further size reduction becomes increasingly inefficient due to particle strengthening, plastic deformation of surface layers and agglomeration phenomena [3,4].
Classical empirical relationships that link energy consumption and size reduction—most notably the formulations commonly associated with Rittinger, Kick (Kirpichev–Kick) and Bond—remain the conceptual foundation of comminution engineering. Rittinger’s approach associates work with the creation of new surface area and thus is most appropriate for fine and ultrafine comminution, whereas Kick’s law relates energy to volumetric reduction and is more applicable to coarse fragmentation. Bond proposed an intermediate formulation and introduced the practical concept of the work index for estimating specific energy requirements for a target product size [3,4,5]. These laws, however, represent macroscopic approximations: they do not explicitly consider the multivariate influence of process and design parameters such as rotational speed, filling degree, working-zone geometry, residence time distribution or classification effects introduced by diaphragms and discharge orifices [2,3,4,5,6].
Mechanistically, particle breakage in grinding machines is produced by combinations of impact, compression, shear and abrasion; the relative contribution of each mechanism is determined by the dynamics of the load applied by grinding elements, frequency of effective contacts and local stress fields within the working chamber [7]. A substantial portion of the supplied mechanical energy is not transferred into the creation of new surface, but is dissipated through heating, elastic–plastic deformation, acoustic emission and kinetic energy of fragments [4,8]. Consequently, macroscopic energy–size laws often require modification or augmentation when applied to non-classical mill designs or to regimes where the dominant breakage mechanism changes.
Traditional tumbling mills and ball mills have well-known operational limits: the need to maintain operation below critical speed to avoid centrifuging of media constrains attainable energy density, and achieving fine product sizes frequently requires long residence times and high specific energy input [1,2]. High-energy devices (for example, vibratory mills and stirred media mills) increase collision frequency or acceleration and can improve grinding rates, but they bring challenges in scale-up, wear management and process control [9,10]. These practical limitations have stimulated interest in alternative constructive solutions that concentrate energy more selectively in active zones and exploit variable or cyclic loading to promote progressive fragmentation.
Among promising configurations are grinders employing elastic or spring-loaded working elements operating in centrifugal force fields. The deformable working body can impose repeated cyclic stresses and variable contact conditions on particles, which may enhance microcrack initiation and progressive breakage under lower peak loads compared to purely rigid, impact-dominated systems. Several experimental and patent studies have explored spring-type working organs as a means of intensifying grinding while potentially reducing wear and allowing adaptive contact mechanics [11,12]. Nevertheless, the literature shows that most investigations treat individual technological parameters in isolation (for instance, the effect of speed or filling degree) rather than examining their combined, non-linear interactions.
From the viewpoint of engineering practice, operating parameters for non-standard mills are frequently selected empirically or by trial and error, which risks suboptimal energy use and unstable product quality. Given the inherently conflicting objectives—maximizing fineness and productivity while minimizing power consumption and equipment wear—formal multi-objective methods are required to identify rational compromise regimes [13]. Modern multi-objective optimisation algorithms (for example NSGA-II) and statistical design of experiments (DOE) techniques enable systematic exploration of the parameter space, construction of predictive regression models and identification of Pareto-optimal operating points that balance quality, throughput and energy efficiency [13,14].
Therefore, a methodology that integrates full-factorial experimental design, validated multi-parameter regression modelling, and multi-objective optimisation is needed to determine rational operating regimes for spring–rotor grinding equipment. The present study develops and validates such an approach: (i) constructing second-order regression models from a Hartley full-factorial design that capture linear, quadratic and interaction effects of five key parameters; (ii) applying both weighted-sum and Pareto-based optimisation (NSGA-II) to identify compromise regimes; and (iii) experimentally verifying predicted optimal settings to demonstrate practical applicability and energy-saving potential.
Grinding processes of bulk materials play a key role in technological chains of waste processing and raw material preparation in many industrial sectors, including mining, construction, chemical, food, and agricultural industries. The efficiency of these processes directly affects final product quality, production cost, and overall energy consumption of technological systems. Fine grinding requires significant energy input; therefore, optimization of mill operating modes and reduction in specific energy consumption remain critical engineering challenges [15,16].
Spring–rotor mills represent a promising type of grinding equipment in which material comminution occurs in three main zones: impact under centrifugal force fields, compression against the chamber walls, and intensive abrasion in the rotor overlap (engagement) zone (Figure 1). Optimization of these zones makes it possible to concentrate energy directly on particle breakage, thereby improving grinding efficiency [17,18].
Despite the practical potential of spring–rotor mills, several important gaps exist in the current state of knowledge:
(1)
Scientific gap: most existing studies focus on individual aspects of the grinding process (e.g., the effect of rotational speed or filling degree in isolation) and do not account for the complex interactions among all technological parameters [19]. Furthermore, no quantitative models exist that simultaneously predict the key performance indicators (grinding fineness, productivity, power consumption, specific energy, and specific metal consumption) as functions of multiple controllable factors [20].
(2)
Engineering gap: in industrial practice, operating parameters for such mills are typically selected based on empirical rules or trial-and-error methods, without a systematic understanding of the trade-offs between product quality, throughput, and energy efficiency. This often leads to suboptimal performance, excessive energy consumption, and increased operational costs [21].
The aim of this study is to address these gaps by developing a comprehensive, experimentally validated methodology for optimizing the technological parameters of a spring–rotor grinder. Specifically, this work provides [22]:
(1)
Second-order regression models derived from a full factorial Hartley design, capturing the main effects, quadratic effects, and interactions of five key parameters (rotational speed, material filling ratio, rotor overlap, chamber clearance, and grinding time) on five output responses (grinding fineness, productivity, drive power, specific energy consumption, and specific metal consumption).
(2)
Multi-objective optimization using both the weighted-sum method and the NSGA-II algorithm to identify Pareto-optimal operating regimes and quantify the inherent trade-offs between conflicting performance criteria [23].
(3)
Experimental validation of the predicted optimal regime through additional verification experiments, confirming the practical applicability of the optimization results.
Classical grinding theories (Rittinger, Kick–Kirpichev, and Bond) describe the relationship between energy consumption and the degree of size reduction as follows [3,14,15,16,17,18,19,20]:
E = K 1 d p 1 d 0 n
where E—specific grinding energy; d0 and dp—initial and final particle sizes; K—material-dependent coefficient; n—exponent (Rittinger: n = 1; Kirpichev–Kick: n = 0.5; Bond: n = 0.167).
However, these theories provide only a macroscopic energy-size reduction relationship and do not capture the complex multivariate interactions present in practical grinding equipment. The present study complements these classical approaches by providing an empirical, multi-parameter framework tailored to the specific design of spring–rotor mills [18,23,24].

2. Materials and Methods

2.1. Experimental Setup and Instrumentation

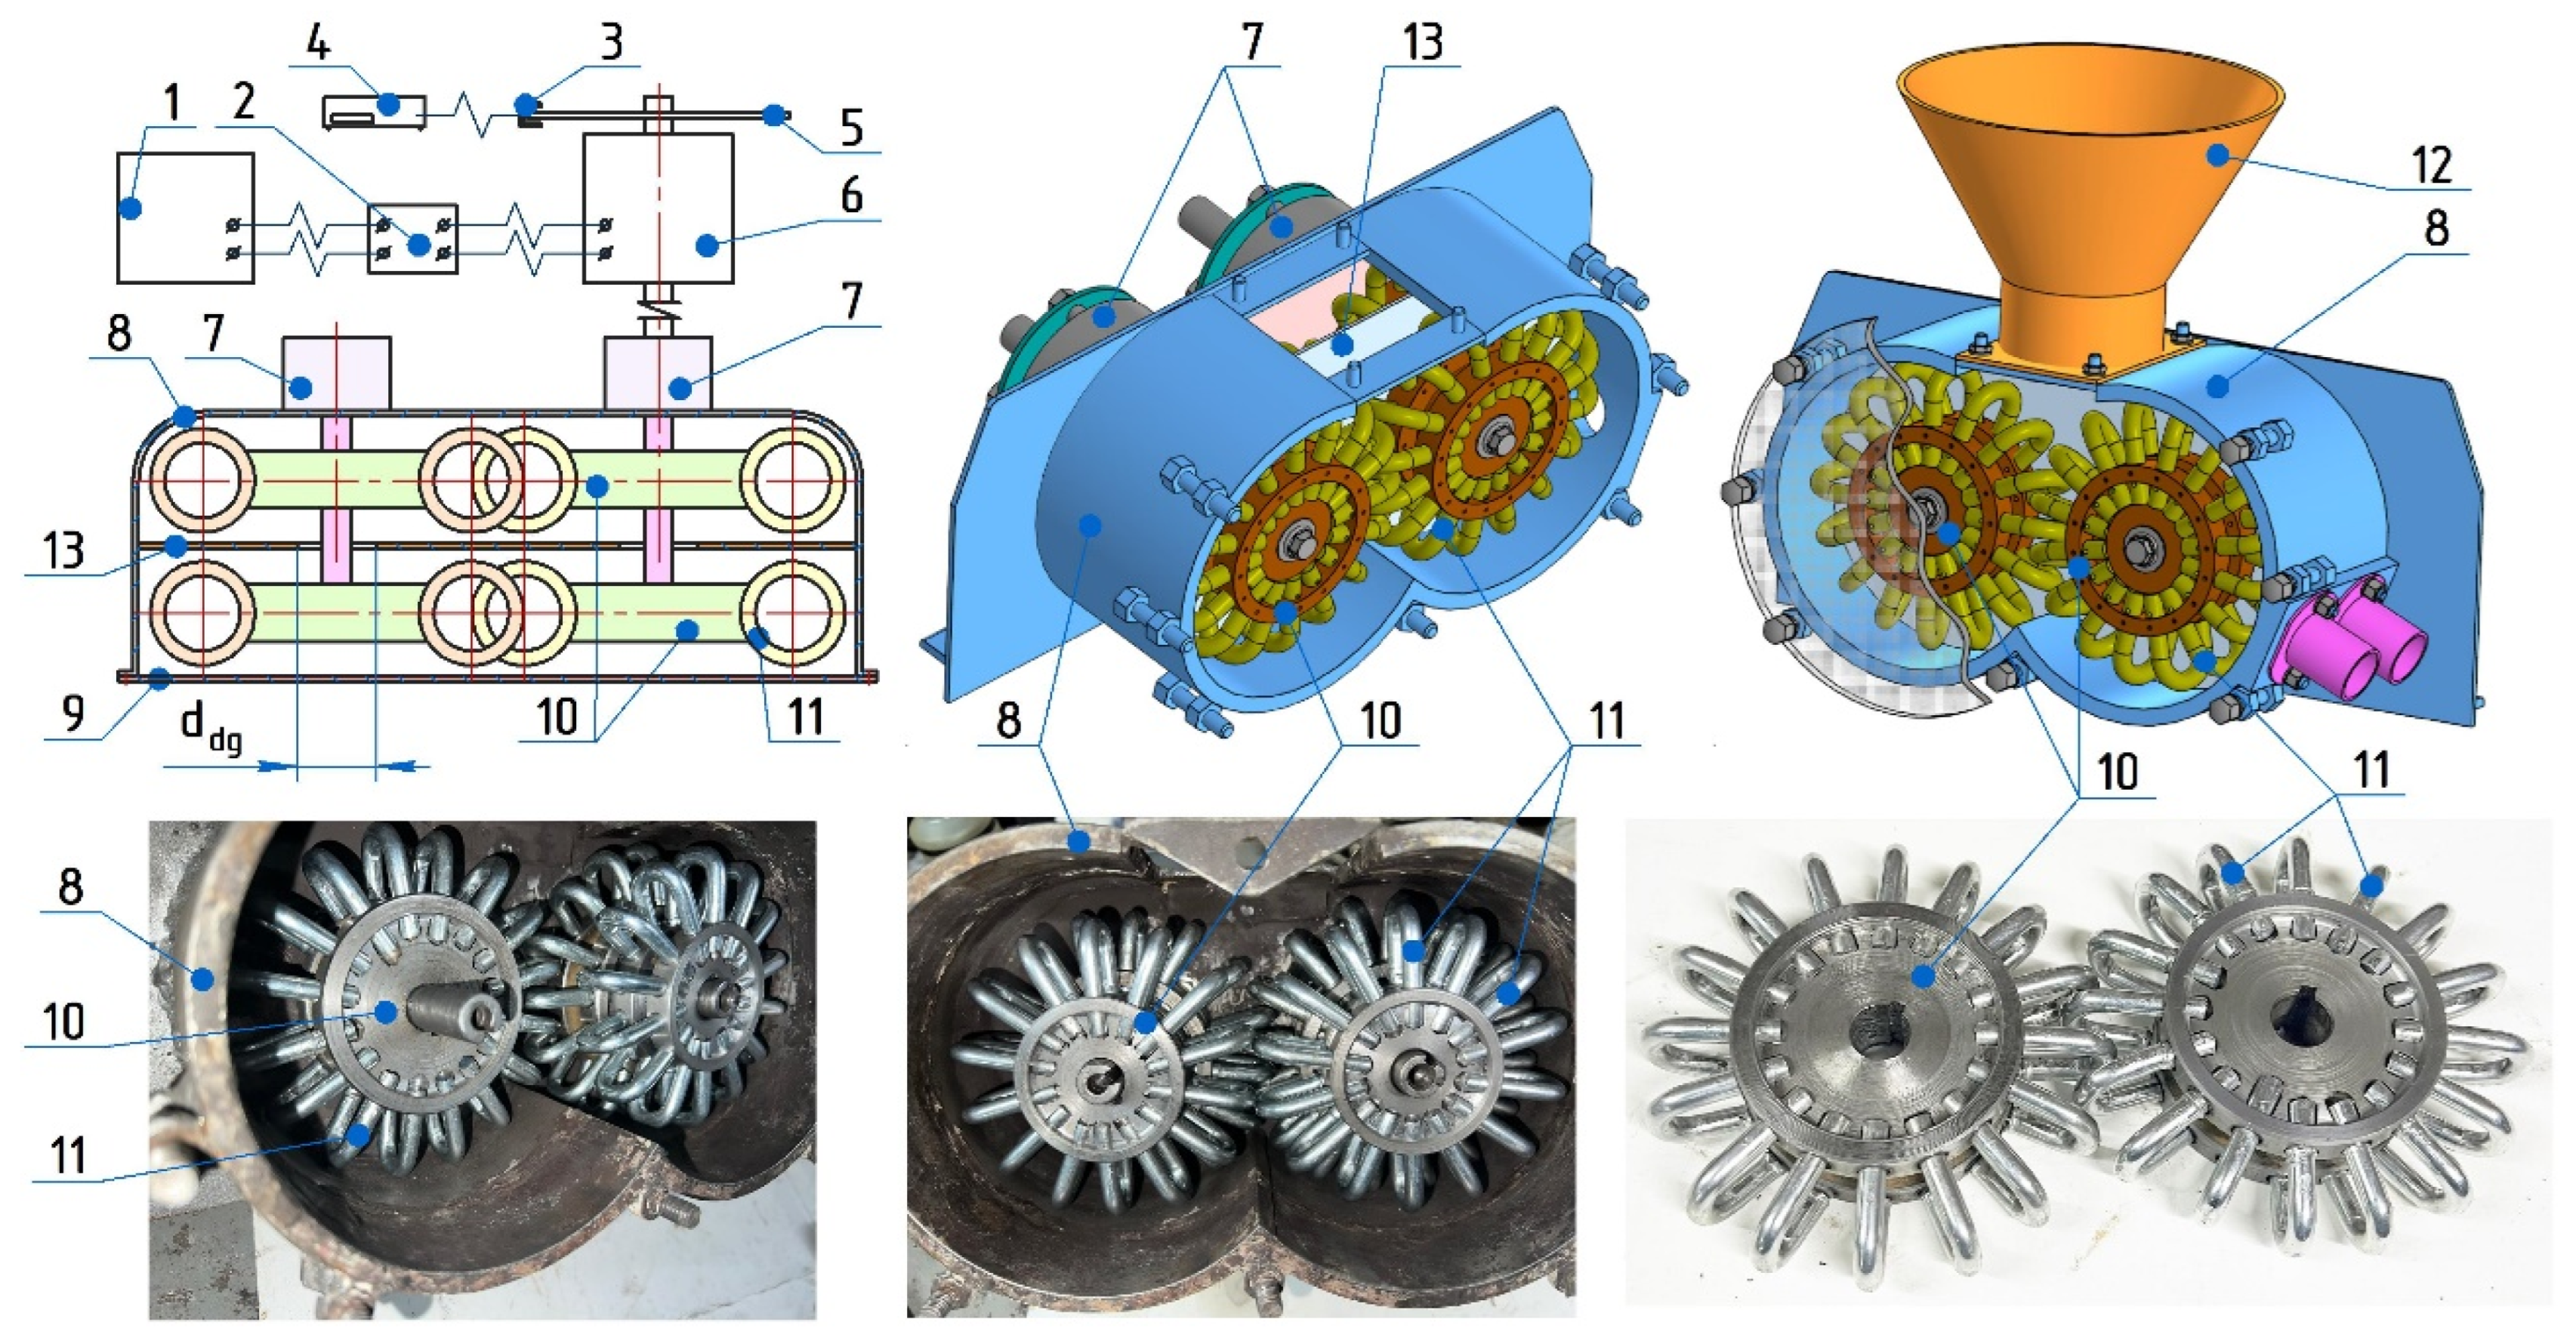
The object of the study is the technological process of grinding bulk materials in a spring–rotor grinder (Figure 1). The experimental mill equipped with a spring-type working element (11) consists of a housing (8) with loading (12) and discharge openings. Inside the housing, working discs (10) rotate as rotors, with helical springs (11) or resilient spring segments mounted on their outer faces, having an outer diameter of 124 mm. The main technical characteristics of the experimental unit are as follows: grinding chamber volume—5 L; working element material—65G spring steel; electric motor power—15 kW; control system—variable frequency drive; measurement system—power sensors, tachometer, and weighing feeder. Rotational speed was recorded using tachometer sensor (3) connected to tachometer unit (4). Power consumption was measured using wattmeter (2) connected to the motor supply line. In addition to the above-mentioned instruments, a set of standard control sieves was used to evaluate the quality of the ground product [25,26,27]. The grinding fineness parameter R(−71) was determined as the mass fraction retained on a control sieve with a mesh size of 71 μm.
The influence of other factors, such as temperature, the presence of surface-active substances in the material, and moisture content, was beyond the scope of the present study and was not considered in the experimental design.
The experimental stand (Figure 1) allows investigation of the influence of the center-to-center distance between the spring rotors (i.e., rotor overlap magnitude) on productivity and the fineness of the ground product [28,29,30].
The feed material enters the grinding chamber through the loading opening (12). The chamber consists of two cylindrical semi-spaces with a diameter of 130 mm, where the material is subjected to the action of the rotating spring-type rotors (11). Material breakage occurs in three main zones. In the first zone, particles are fractured due to impact by the rotor working elements and interparticle collisions. In the second zone, the material is compressed and abraded against the walls of the grinding chamber. In the third zone, the material undergoes abrasion and compression between the working elements of the rotors while passing through the overlapping intermeshing region (25 mm), where it is also subjected to centrifugal forces. Under the action of the rotating rotors, the material successively passes through all grinding zones. Under the continuous action of the rotors, the material sequentially passes through all grinding zones. The quality of the final product was determined using control sieves. The influence of additional factors such as temperature, moisture content, and the presence of surface-active substances in the material was not considered within the scope of this study [31,32,33,34].
During the experimental studies, crushed marble and marble chips with a particle size of 5–7 mm were used as the grinding material. Their physical and mechanical properties were as follows: compressive strength σsz = 110 MPa; Young’s modulus E = 55 × 103 MPa; bulk density ρ = 2.6 t/m3; hardness 3–4 on the Mohs scale; and medium brittleness. In addition, limestone with a particle size of 5–7 mm was investigated, characterized by the following properties: compressive strength σsz = 80 MPa; Young’s modulus E = 35 × 103 MPa; bulk density ρ = 2.4 t/m3; hardness 3 on the Mohs scale; and high brittleness [35].
The hardness of limestone on the Mohs scale is typically about 3, corresponding to soft to moderately hard rocks. Depending on the presence of impurities such as dolomite or quartz, the hardness may vary from 2 to 4, and in some cases up to 5. Limestone is softer than granite (Mohs hardness 6–7) but exhibits relatively high compressive strength. Dense and partially metamorphosed (marble-like) limestones tend to have higher hardness values, whereas porous varieties (e.g., shell limestone) are softer. A hardness of 3 corresponds to calcite, the primary mineral component of limestone (CaCO3).
Brittleness of limestone refers to its tendency to fracture under mechanical loading without noticeable plastic deformation. Limestone is a sedimentary rock of low to moderate strength and is characterized by high brittleness, particularly in dry conditions and under impact loading [34,36].
Marble chips consist predominantly of calcite and represent a brittle yet durable natural material. Their Mohs hardness ranges from 3 to 4, which classifies them as relatively soft compared with granite, making them susceptible to mechanical damage and requiring careful handling during transportation and loading. Despite their brittleness, marble aggregates demonstrate good wear resistance and satisfactory weather stability. The material tends to fracture readily under impact loads [37].
Following a series of preliminary single-factor experiments, marble chips were selected as the primary material for further investigation and for obtaining experimental data used in the regression modeling, as they exhibited more stable and reproducible fracture characteristics during grinding [38,39,40,41].

2.2. Performance Criteria

The following indicators were adopted as criteria for evaluating the final results of the grinding process: the quality indicator of the finished ground product—grinding fineness R(−71), evaluated by the residue on a control sieve with a mesh size of 71 μm, which should not exceed 30%; mill productivity P, kg/h; consumed power N, kW; specific process indicators—specific energy consumption E u d = N / P , defined as the ratio of drive power N in kW to productivity P in t/h; specific metal consumption M u d , defined as the ratio of mill productivity in t/h to the weight of the metal structure, M u d = G / P .

2.3. Design of Experiments and Mathematical Modeling

The results of a preliminary series of marble grinding experiments showed that the coefficient of variation for the key response parameter, specifically the grinding fineness (R−71), was within the range of kvar = 5–6%. It is important to note that this value characterizes the repeatability (precision) of the measurement procedure under fixed operating conditions. Based on the ratio of the obtained coefficient of variation to the permissible value, the required number of experiments was determined with a reliability level of 96%. The required number of repeated experiments during marble grinding was at least three [42,43,44]. When studying the grinding process on the experimental stand (Figure 1) under batch operating conditions of the mill, the Hartley design was used to construct mathematical models of the process with the number of independent variables n = 5 and a total number of design points N = 27.
The investigated factors, their levels, and variation intervals for the multifactor experiment are presented in Table 1.
The high coefficients of variation (61–74%) for productivity, power, and metal consumption reflect the wide range of operating conditions explored in the experimental design (Table 1) and confirm the significant influence of the controlled factors on these output parameters. This is distinct from the low coefficient of variation (5–6%) obtained in preliminary tests, which characterized the repeatability of measurements under fixed conditions.
To describe the relationships between the output parameters and the technological factors, a second-order polynomial model was used [5]:
Y = b 0 + i = 1 5 b i · X i + i = 1 5 b i i · X i 2 + i = 1 4 j = i + 1 5 b i j · X i · X j + ε
where: Y —the calculated value of the response function; b 0 —the constant term (coefficient); b i —coefficients of linear effects; b i i —coefficients of quadratic effects; b i j —coefficients of interaction effects; X i —coded values of the factors; ε—random error.
Statistical evaluation of the significance of the coefficients of the obtained mathematical model was performed using Student’s t-test:
t i = b i S ( b i )
where S ( b i ) —standard error of the coefficient.
Verification of the adequacy of the mathematical model is performed using Fisher’s criterion [5]:
F = S a d 2 S v o s p r 2
where S a d 2 —variance of adequacy; S v o s p r 2 —variance of reproducibility.
The experimental structure consisted of 27 experiments: 16 experiments of the factorial core (25−1); 5 × 2 = 10 experiments at the “star” points; and 3 experiments at the center of the design to estimate the reproducibility error. A design matrix corresponding to the selected experimental plan was constructed, and its data were subsequently used as response functions [45,46,47].

3. Results

3.1. Regression Models and Factor Analysis

Analysis of the model coefficients made it possible to rank the factors according to the degree of their influence on the key output parameters. For grinding fineness (R(−71)), the greatest contribution is made by grinding time (X5, linear effect −2.58) and the rotor overlap magnitude (X3, −2.10), with both factors also exhibiting significant quadratic effects, indicating the presence of an optimum. For productivity (P), the dominant factor is grinding time (X5, −2.55), followed by rotational speed (X1, +1.69). Drive power (N) is most strongly affected by rotational speed (X1, +1.35) and the material filling degree (X2, +0.74). The presence of significant interaction coefficients (for example, X1X5 for productivity and power) confirms the complex, non-additive nature of the process.
The values of the investigated parameters of the mathematical models, after verification of coefficient significance and subsequent adequacy testing, and the final regression equations were obtained in coded form:
for grinding fineness:
R + 71 = 30.1 2.1 X 3 2.5 X 5 4.1 X 1 2 3.6 X 2 2 3.5 X 3 2 3.4 X 4 2 3.9 X 5 2
From the regression equation for grinding fineness, it can be seen that grinding time (T) and rotational speed (n) are the key technological parameters that are most practically controllable. Negative linear coefficients for X3 (rotor overlap) and X5 (grinding time) indicate that increasing both the overlap and the grinding duration improves grinding fineness, i.e., reduces the residue R(−71). Physically, this effect can be explained as follows: (i) greater rotor overlap intensifies compression and abrasion in the intermeshing zone, leading to more efficient particle breakage; (ii) longer grinding time increases the total number of impact events and the probability that particles pass through all three grinding zones.
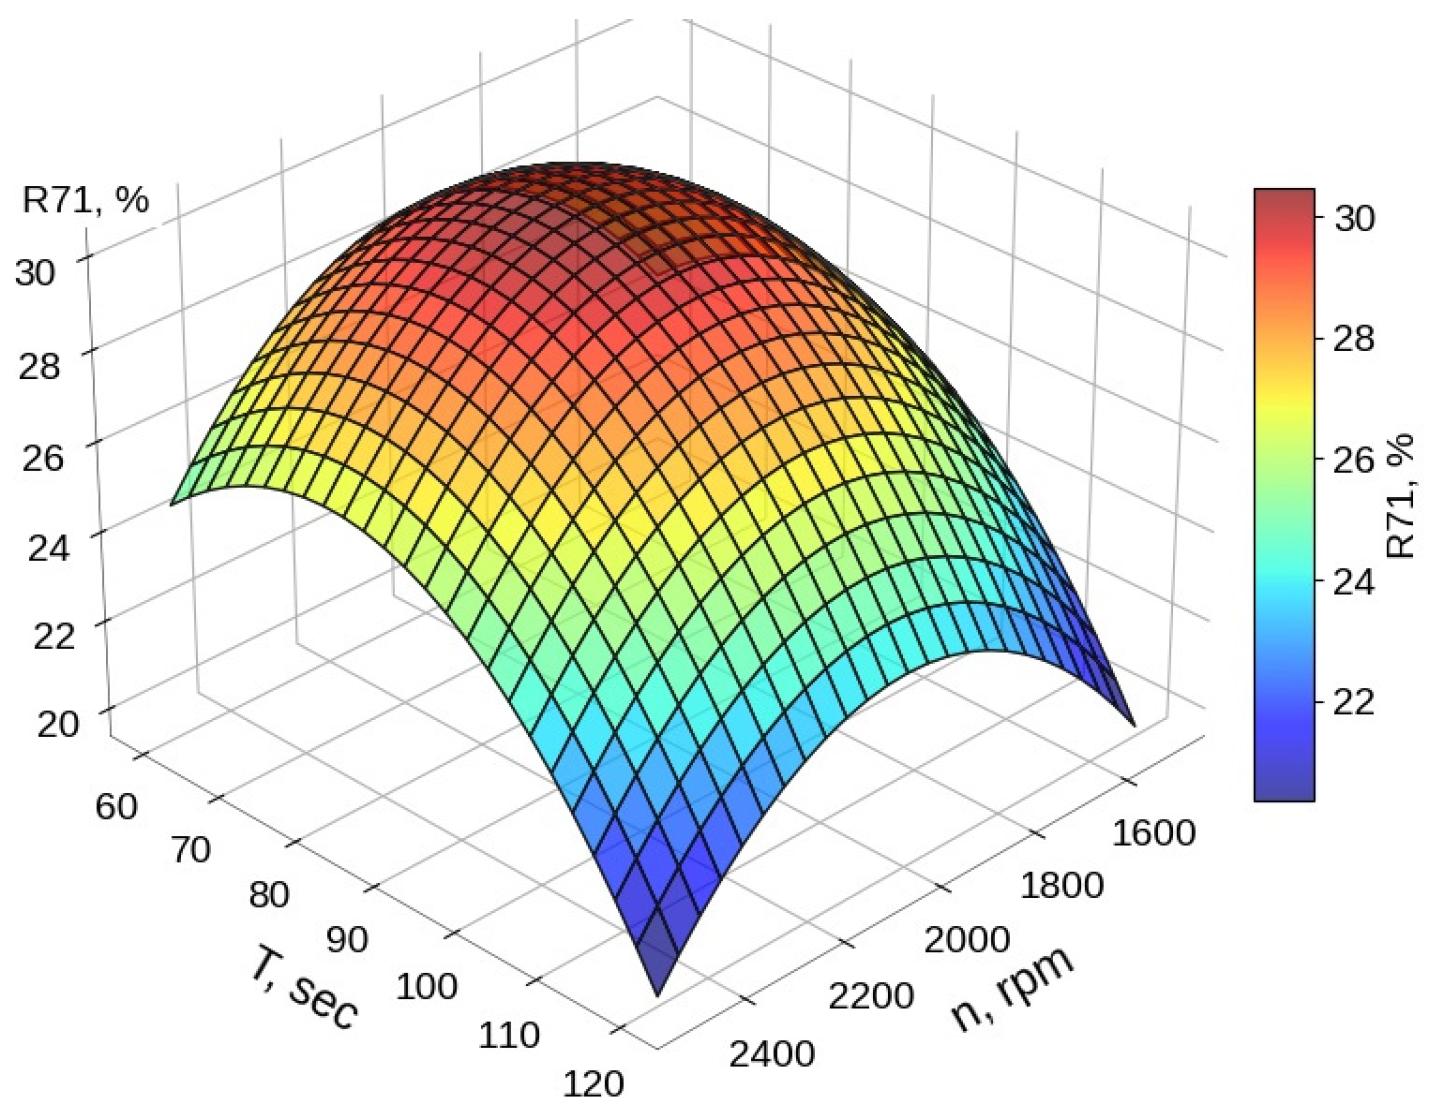
The negative quadratic terms for all factors confirm the existence of an optimum: beyond certain values, further increases become counterproductive due to overgrinding, agglomeration of fine particles, or excessive energy dissipation. Figure 2 shows the response surface illustrating the dependence of grinding fineness (R(−71)) on the overlap of the working zones (X3) and the grinding time (X5). Analysis of the linear effects confirms that the most significant factor is grinding time, explained by an increase in the number of contacts between the working elements and material particles. The second most significant factor is the overlap of the working zones, confirming the effectiveness of the active grinding zone. The negative quadratic effects of all factors indicate the presence of a maximum of the response function within the investigated region, confirming the existence of optimal operating regimes.
For productivity:
P = 9.84 + 1.96 X 1 + 0.75 X 2 2.55 X 5 1.7 X 1 2 1.5 X 2 2 1.4 X 3 2 1.45 X 4 2 + + 0.95 X 5 2 + 0.47 X 1 X 4 0.84 X 1 X 5 + 0.47 X 4 X 5
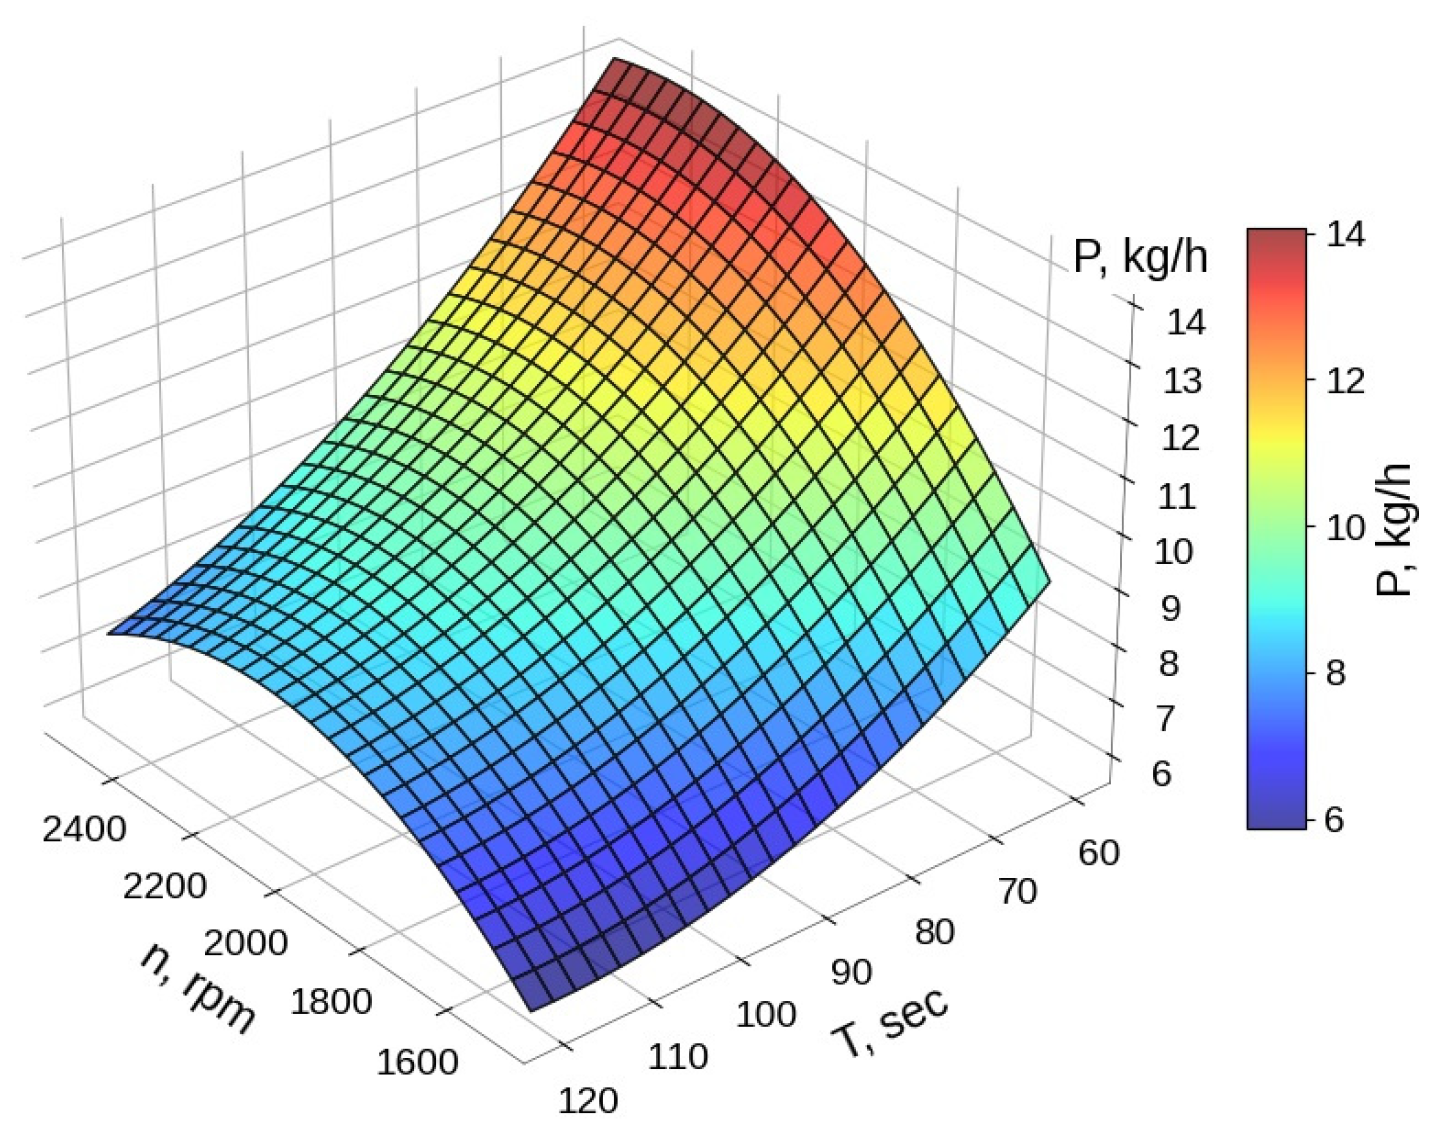
Mill productivity significantly depends on rotational speed (X1) and the material filling degree (X2). However, excessive increase in the filling degree leads to higher power consumption and specific energy consumption. The positive linear coefficient for X1 (+1.96) reflects the fact that higher rotational speed increases the kinetic energy of particles and the frequency of impacts, thereby accelerating the breakage process and enabling a greater amount of material to be processed per unit time. However, the negative quadratic term for X1 (−1.7X12) indicates that beyond the optimal speed, productivity decreases due to excessive centrifugal forces that may eject particles outward, reducing their effective interaction with the grinding zones. The positive coefficient for X2 (+0.75) shows that a higher material filling ratio increases the mass of processed material. Nevertheless, the negative quadratic term (−1.5X22) demonstrates that overloading leads to particle crowding, which dampens impact forces and decreases grinding efficiency. The regression equation for productivity reveals an important technological trade-off: increasing rotational speed enhances productivity, whereas increasing grinding time reduces it (Figure 3). The negative coefficient for X5 (−2.55) is expected, as a longer operating time in batch mode results in fewer loading cycles per hour, directly reducing overall throughput. The positive quadratic coefficient for X52 (+0.95) suggests partial compensation of this effect at very long grinding durations, possibly due to more complete material utilization and enhanced particle breakage within the batch.
For drive power:
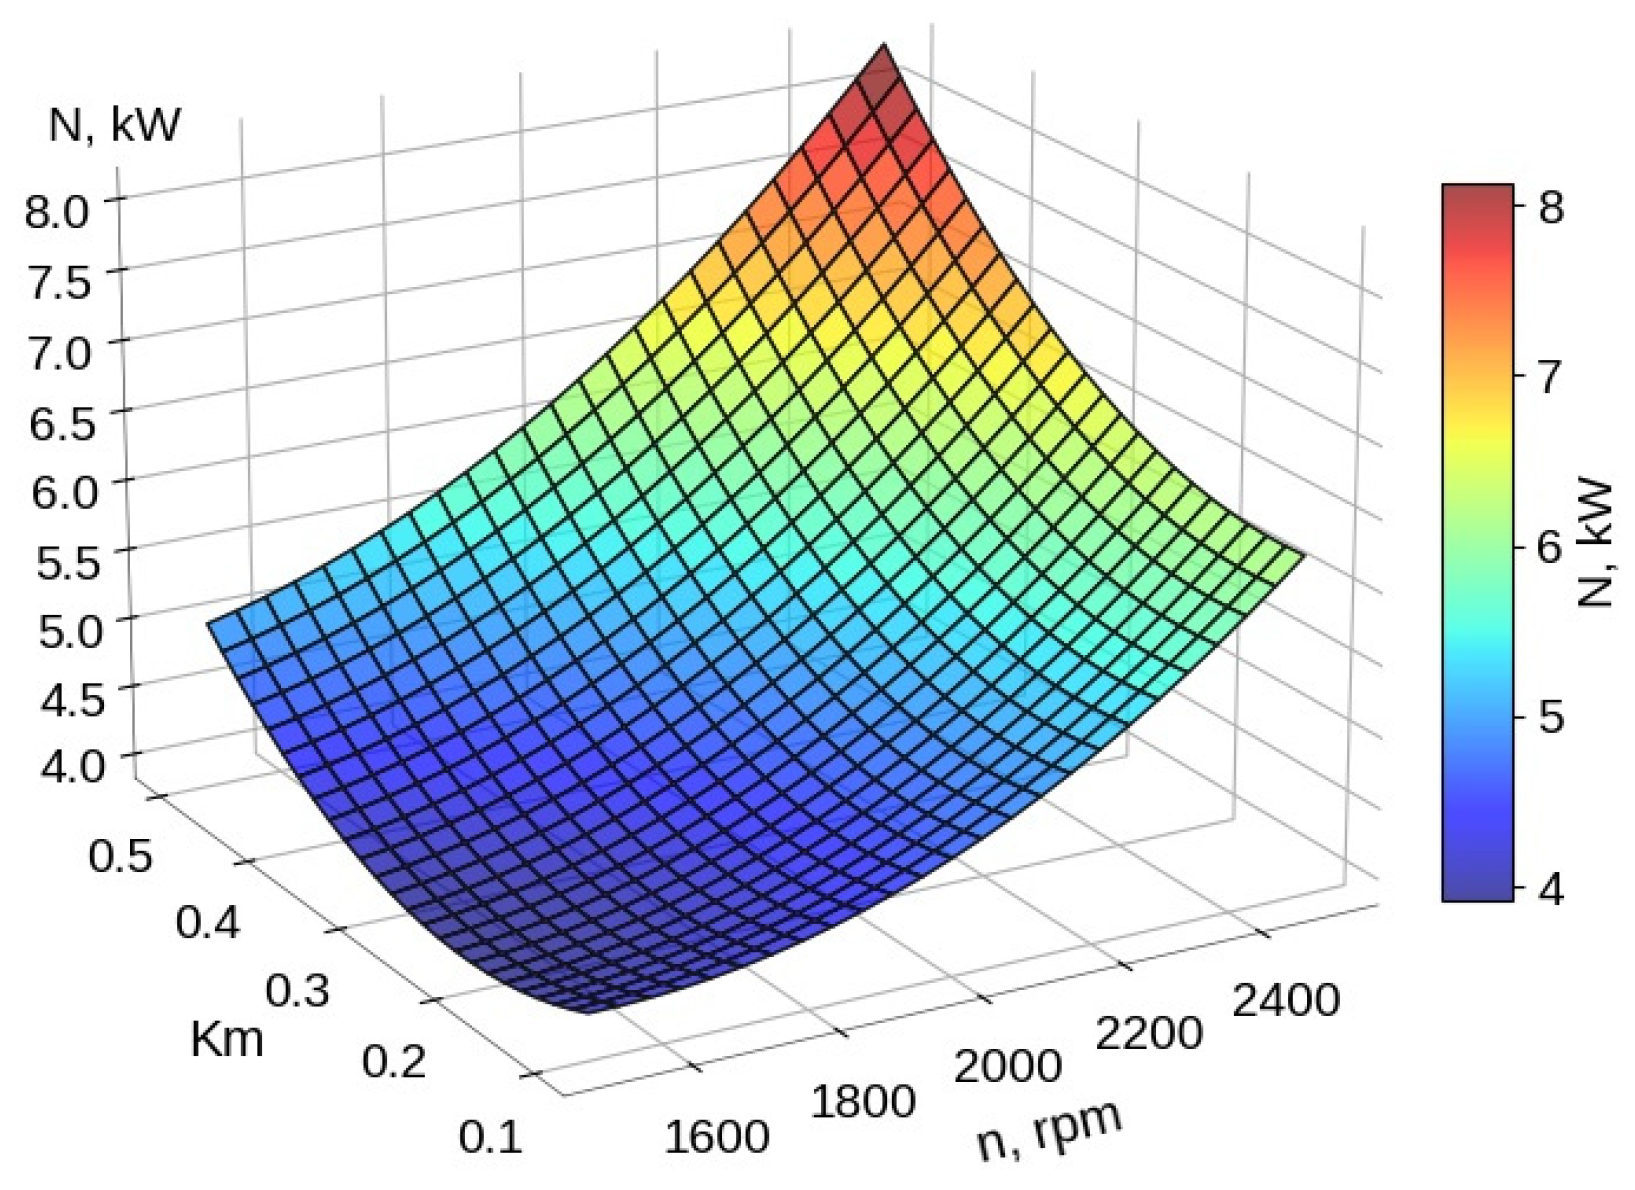
N = 4.8 + 1.35 X 1 + 0.74 X 2 + 0.4 X 3 0.72 X 5 + 0.54 X 1 2 + 0.59 X 2 2 + 0.64 X 3 2 + 0.64 X 4 2 + 0.31 X 1 X 2 0.5 X 1 X 5 0.31 X 2 X 5
The equation shows that power consumption mainly depends on rotational speed and material loading, which represents a classical relationship for grinding equipment (Figure 4). The positive linear coefficients for X1 (+1.35) and X2 (+0.74) reflect the fundamental physics of the process: power consumption is proportional to both rotational speed (higher kinetic energy requirements) and the mass of material being accelerated and subjected to shear. The positive quadratic terms (X12 and X22) indicate that energy consumption increases nonlinearly at extreme parameter values due to additional losses associated with turbulence, friction, and material compaction. The negative coefficient for X5 (−0.72) suggests that longer grinding durations allow the process to operate at a lower average power level after the initial high-energy breakage phase, although the total energy consumption per batch may still increase.
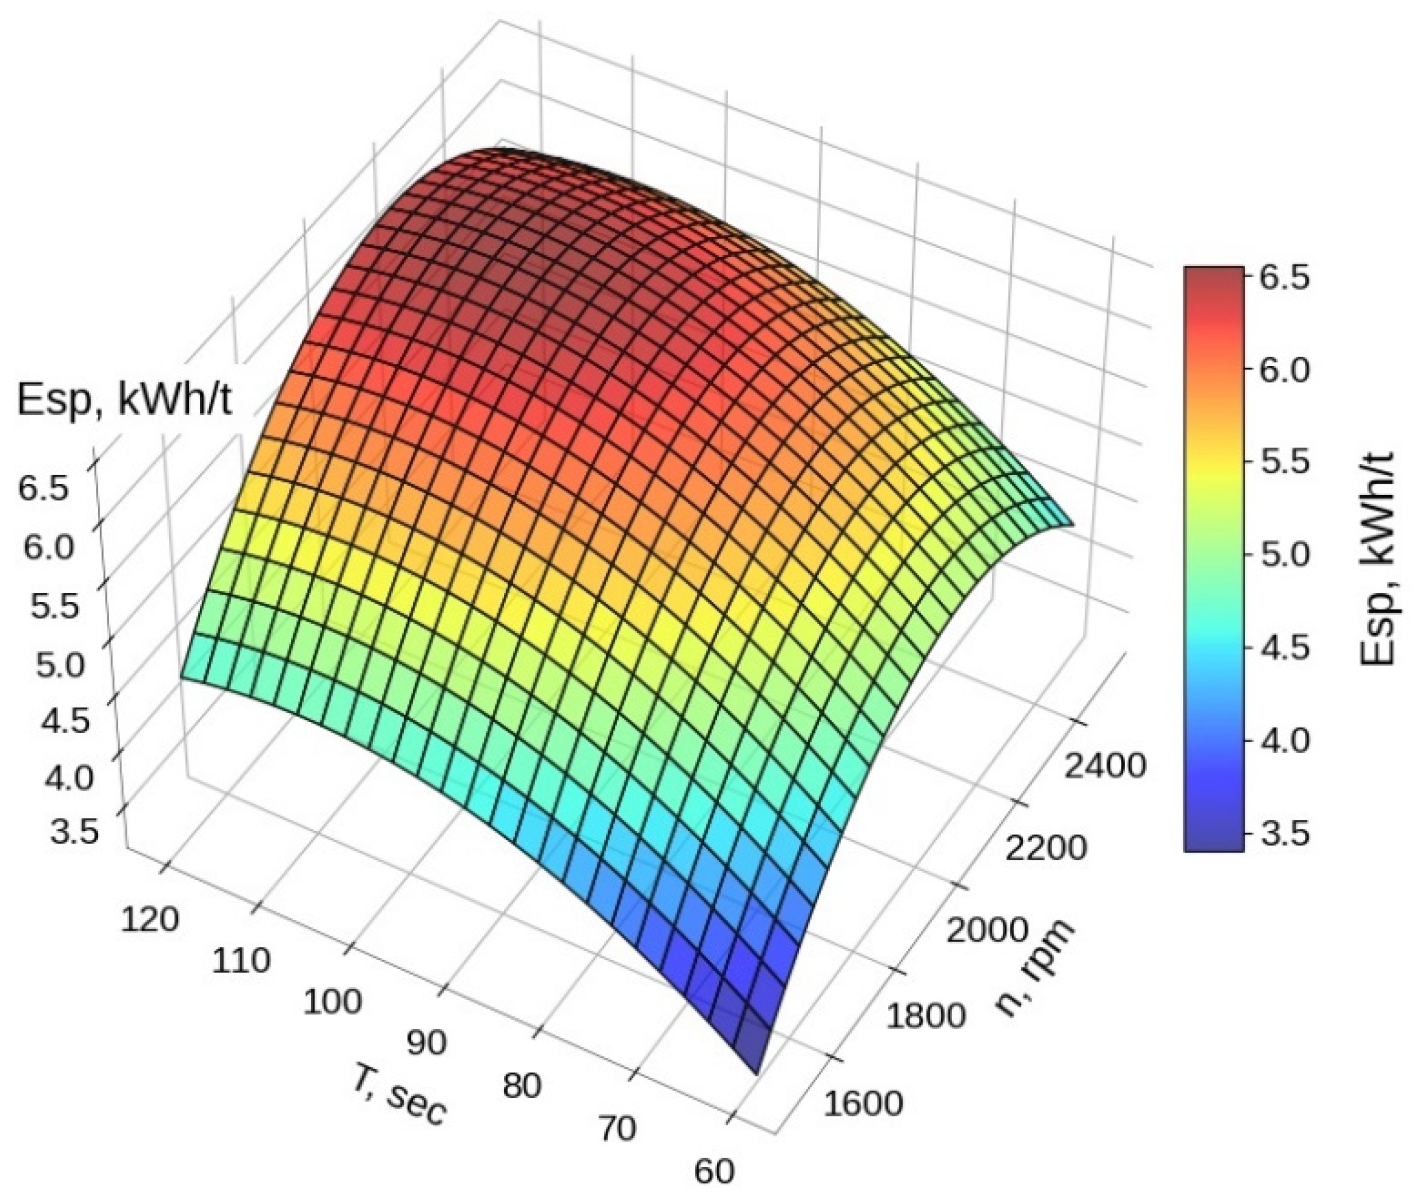
For specific energy consumption:
E u d = 6.29 + 0.6 X 1 + 0.4 X 2 + 0.43 X 3 + 0.68 X 5 1.21 X 1 2 0.6 X 2 2 0.6 X 4 2 0.6 X 5 2
The regression equation for specific energy consumption indicates the existence of an optimal rotational speed that minimizes energy costs (Figure 5). Specific energy consumption (energy per ton of product) is a key indicator of process efficiency. The positive linear term for X1 (+0.6) indicates that an increase in rotational speed initially raises energy consumption. However, the pronounced negative quadratic term (−1.21X12) reveals a distinct optimum: at low speeds, energy is expended on inefficient impacts, whereas at excessively high speeds, a significant portion of energy is dissipated as heat and noise without a proportional increase in particle breakage. The positive coefficient for X5 (+0.68) indicates that longer grinding durations increase the overall energy input. At the same time, the negative quadratic term (−0.6X52) suggests diminishing returns beyond a certain duration, as additional grinding time yields only marginal improvements in fineness, thereby reducing overall energy efficiency.
For specific metal consumption:
M u d = 0.86 0.15 X 1 + 0.22 X 5 0.11 X 3 2 0.12 X 4 2 0.1 X 5 2 0.15 X 5 2
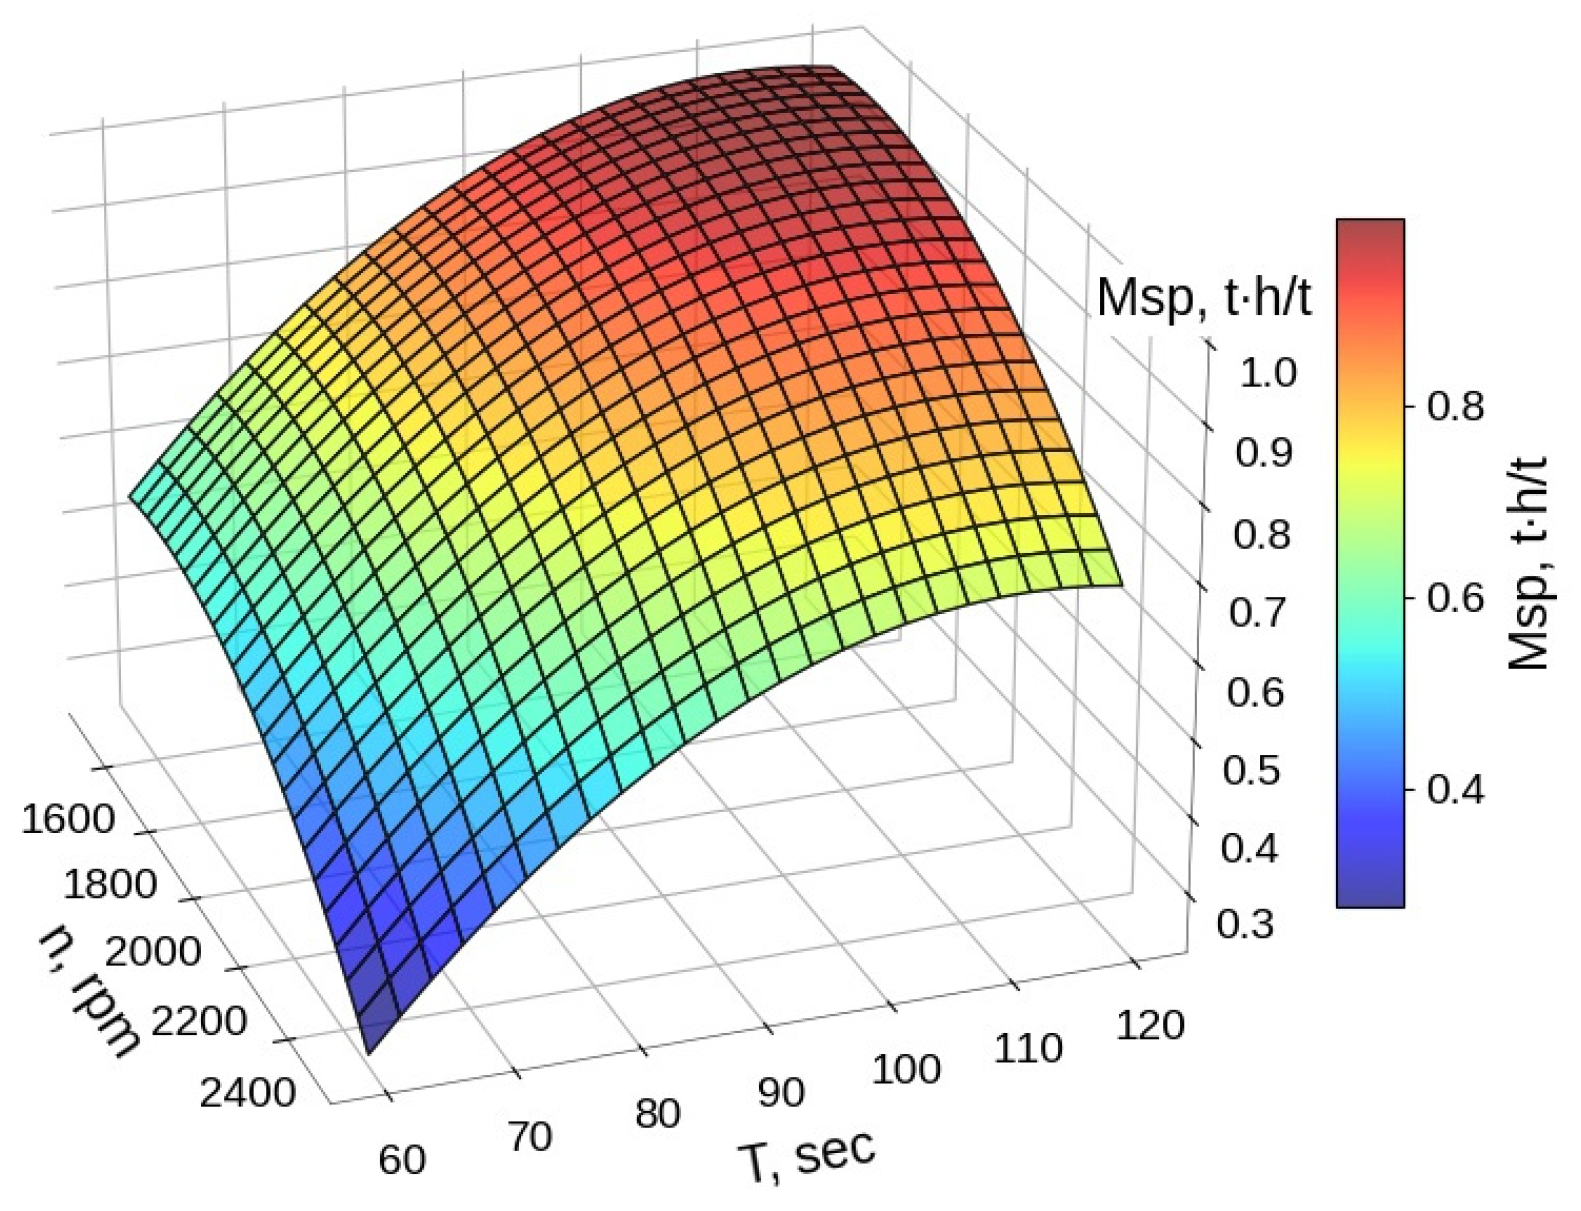
This equation demonstrates how an increase in processing time leads to higher equipment wear, as illustrated in Figure 6. Specific metal consumption serves as an indirect indicator of wear of the grinding elements. The positive coefficient for X5 (+0.22) directly reflects the fact that prolonged exposure to abrasive particles increases wear. The negative coefficient for X1 (−0.15) is of particular interest: it suggests that at higher rotational speeds, material may pass through the grinding zones more rapidly, reducing the duration of abrasive contact per particle and thereby decreasing specific wear. However, this apparent advantage must be balanced against increased energy consumption and the potential risk of other types of mechanical damage. The presence of quadratic terms indicates that wear does not follow a purely linear trend. Instead, optimal combinations of operating parameters exist that minimize metal consumption while maintaining acceptable throughput and process performance.
The adequacy of the models was confirmed by Fisher’s criterion and high values of the coefficient of determination (R2 > 0.93). To provide a systematic assessment of the statistical significance of all model terms, a comprehensive analysis of variance (ANO-VA) was performed. Table 2 summarizes the p-values for all linear, quadratic, and interaction effects for each of the five response variables.
The ANOVA results presented in Table 2 provide several important insights. For all five responses, the overall models are highly significant (p < 0.0001). The analysis reveals that:
Linear effects: rotational speed (X1) is the most consistently significant linear term, affecting all responses except fineness. Grinding time (X5) is significant for all responses, confirming its dominant role established above.]
Quadratic effects: the presence of significant quadratic terms for nearly all factors across all responses confirms the existence of an optimum within the experimental domain, justifying the use of a second-order model.]
Interaction effects: the interaction term X1·X5 (speed × time) is significant for fineness (p = 0.0345), productivity (p = 0.0012), and power (p = 0.0056). This quantifies the important trade-off discussed earlier: increasing speed boosts productivity, but this effect is moderated by grinding time. Other significant interactions include X1·X4 for productivity and X1·X2, X2·X5 for power, confirming the complex, non-additive nature of the process.]
A comparison of the full model (with all terms) and a reduced model (excluding non-significant interaction terms with p > 0.05) was performed. The reduction in adjusted R2 was less than 0.02 for all responses, indicating that the essential predictive capability is preserved in a simpler model. However, the full model is retained here to provide a complete description of all observed effects.
The processing of experimental data, model development, and optimization were performed using Python 3.8 software with the NumPy, SciPy, and pandas libraries for numerical calculations.

3.2. Statistical Characteristics of Experimental Data

As a result of conducting 27 experiments according to the established design, values of five output parameters were obtained for various combinations of technological factors (Table 3). Data analysis shows significant variability of the output parameters depending on the operating regimes, which confirms the substantial influence of technological factors on the grinding process.
The wide range of coefficients of variation observed in Table 3 reflects the fundamentally different sensitivities of each output parameter to the controlled factors:
(1)
Grinding fineness (30.4%) exhibits the lowest variability because it has a natural upper bound—particles cannot be ground indefinitely, and even under extreme conditions (maximum time and overlap), the improvement in fineness reaches saturation. The range from 10.4% to 38.0% represents the physical limits of the grinding process for this material.
(2)
Productivity (61.4%) shows high variability as it is directly proportional to rotational speed and filling degree, while being inversely proportional to grinding time. The tenfold increase from 2.1 kg/h to 23.3 kg/h corresponds to the transition from the least favorable conditions (low speed, low load, long time) to the most favorable (high speed, high load, short time).
(3)
Drive power (73.8%) displays the highest variation due to its nonlinear dependence on rotational speed (theoretically N ∝ n3) and strong coupling with material load. The dramatic increase from 0.8 kW to 14.2 kW (an 18-fold rise) occurs when moving from minimum speed and load to maximum speed and load, demonstrating the extreme sensitivity of power consumption to operating parameters.
(4)
Specific energy consumption (44.0%), being the ratio of power to productivity (E_ud = N/P), exhibits intermediate variability. The competing effects of speed on both numerator and denominator create a distinct optimum, which moderates the overall variation compared to its individual components.
(5)
Specific metal consumption (62.4%) shows high variability as it combines the effects of both processing time (directly proportional to wear) and rotational speed (which affects impact intensity). The range from 0.2 to 2.4 t×h/t represents the difference between gentle, short-duration operation and aggressive, prolonged grinding.
These statistical characteristics confirm that the experimental design successfully covered a wide operational envelope, capturing both optimal and extreme conditions, which is essential for developing robust predictive models.

3.3. Validation of Predictive Capability

To assess the predictive capability of the developed regression models beyond simple data fitting, a Leave-One-Out Cross-Validation (LOOCV) procedure was performed. This method provides an unbiased estimate of how well the models generalize to unseen data points.
In LOOCV (Leave-One-Out Cross-Validation), each of the 27 experimental points is sequentially excluded from the dataset. A second-order regression model is then fitted to the remaining 26 points, and the excluded point is predicted using this model. The process is repeated for all 27 points, yielding 27 predicted values for each response variable. The prediction error for each point is calculated as the absolute difference between the predicted and actual values.
The results of the LOOCV validation are summarized in Table 4, which presents the Mean Absolute Percentage Error (MAPE) and Root Mean Square Error (RMSE) for each output parameter.
The relatively low MAPE values (ranging from 4.8% to 8.1%) confirm that the models possess good predictive capability and are not overfitted to the specific experimental points. The slightly higher errors for productivity and metal consumption (7.2% and 8.1%) are consistent with the higher coefficients of variation observed for these parameters in Table 3, reflecting their greater sensitivity to operating conditions.
These validation results demonstrate that the regression models can reliably predict the mill’s performance for untested combinations of input parameters within the experimental domain, supporting their use for the optimization studies presented in Section 4.4.

4. Discussion

4.1. Physical Mechanisms of Material Motion and Breakage

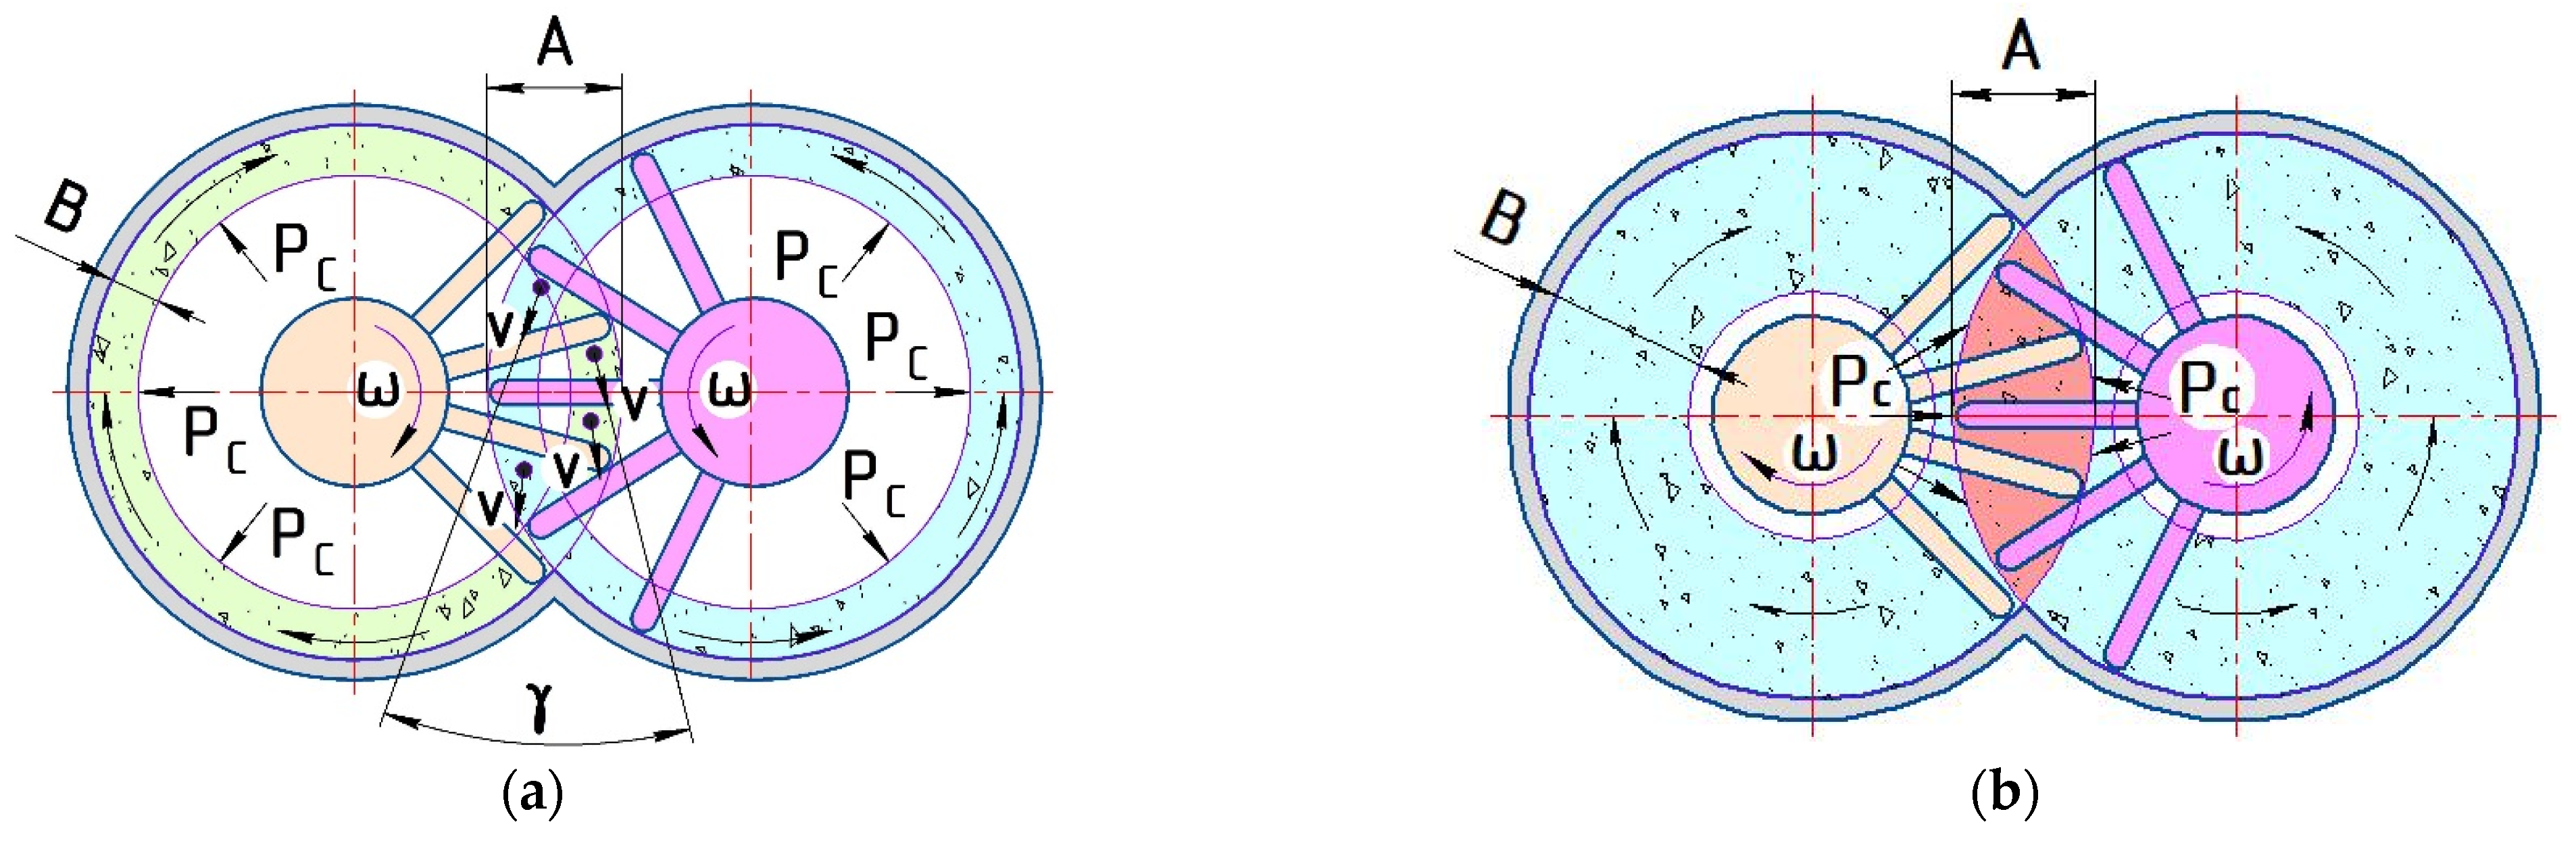
The motion behavior of the material in the working chamber is strongly affected by the rotational speed of the working bodies and the volume occupied by the material. At low rotational speeds of the working bodies (100–200 rpm), material mixing occurs and its movement is limited mainly to the lower part of the working chamber. When the rotational speed increases to 300–400 rpm, the main mass of the material rises along the side surfaces of the working chamber, while a small portion of the material begins to participate in circular motion. Increasing the rotational speed of the working bodies above 500 rpm leads to the formation of a stable toroidal zone under the action of centrifugal forces. Material from one toroidal zone, under the influence of centrifugal force, tends to penetrate into the inner region of the other zone (Figure 7a). If the thickness of the toroidal zone is smaller than the rotor overlap magnitude, the working elements of the driving rotor, during engagement with the driven rotor, force the material out of the toroidal zone of the driven rotor; conversely, material from the driven rotor zone is pushed into the inner zone of the driving rotor. The angle γ at which the material penetrates into the inner region of the zones depends on the rotational speed of the rotors and the volume of the ground material; as the rotational speed increases, the angle γ also increases.
The kinetic energy of the material pushed by the rotor working elements is dissipated by the counteraction of the material in the rotor engagement zone, and the material does not enter the inner region. In this case, the displaced material enters the rotor region occupied by the same material (Figure 7b). The action of the centrifugal force of one rotor is balanced by the centrifugal force of the other rotor.
A more detailed theoretical analysis of the relationship between rotational speed, particle residence time, and collision frequency would require separate fundamental studies using discrete element modeling (DEM) or particle image velocimetry (PIV) measurements. Such investigations are planned for future work to complement the empirical optimization presented in this paper.

4.2. Influence of Inter-Sectional Diaphragms

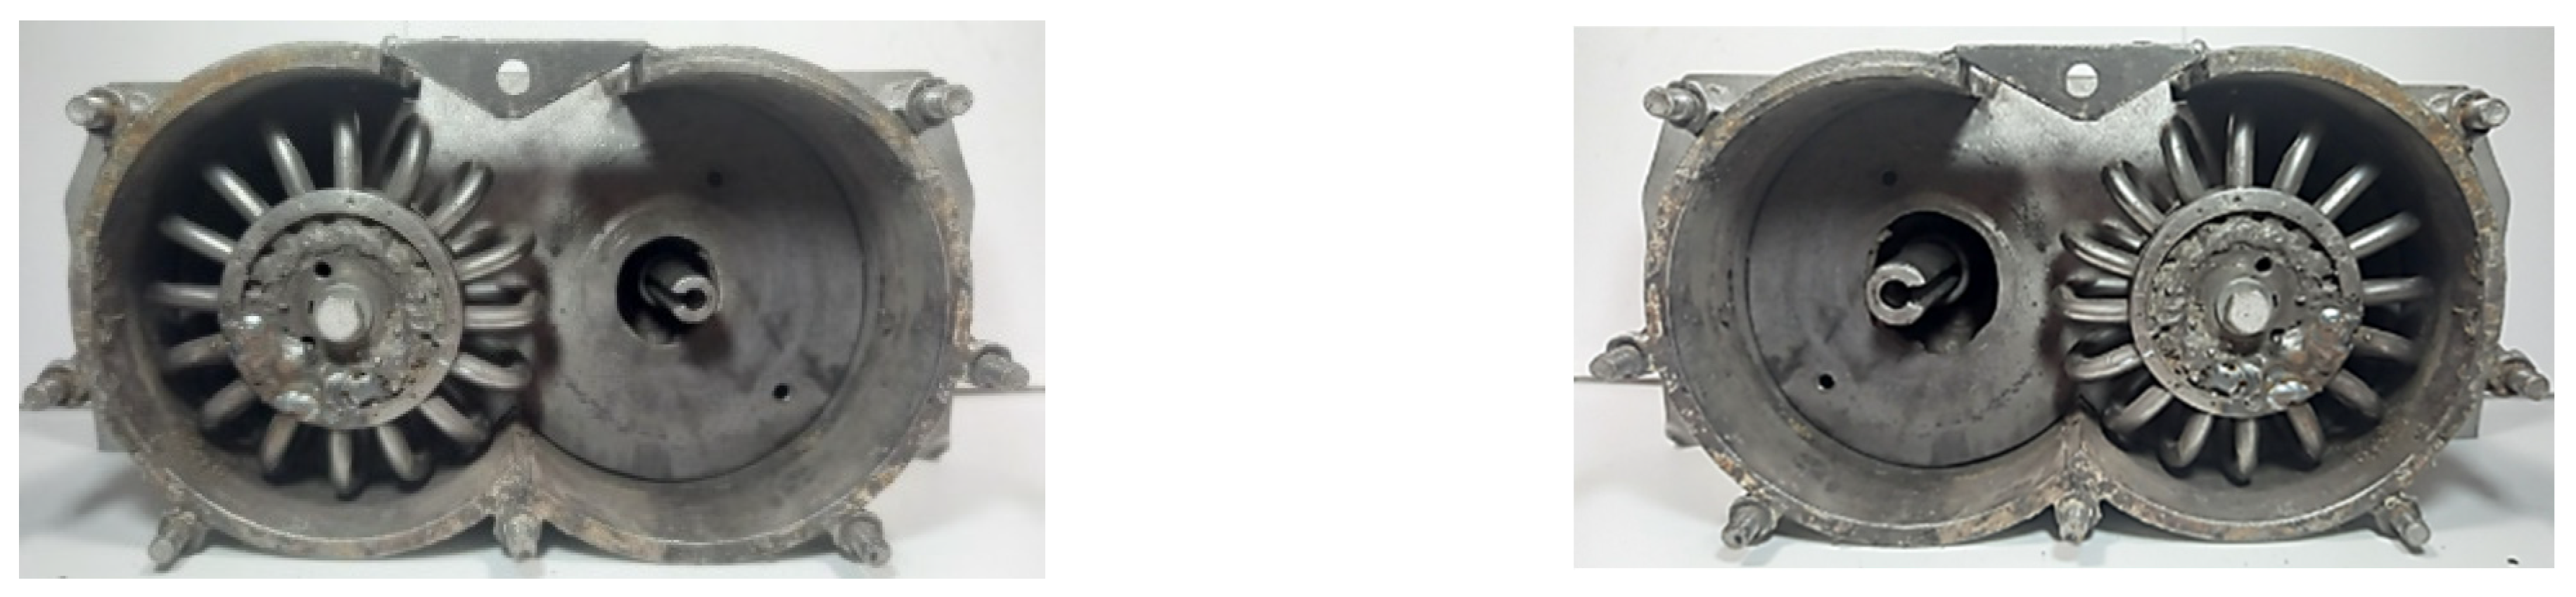
Investigations were carried out into the influence of guiding diaphragms 13 (Figure 1), installed after each pair of rotors, on the efficiency of the mill working process. The effect of the diaphragm opening dimensions and their position relative to the rotors on productivity and grinding fineness was examined. The diaphragms were installed between rotor pairs with various central through openings along the axes of each rotor (Figure 8). The diaphragms were positioned at distances ranging from 2 to 12 mm from the rotor end faces. The diameters of the through openings varied from 40 to 100 mm.
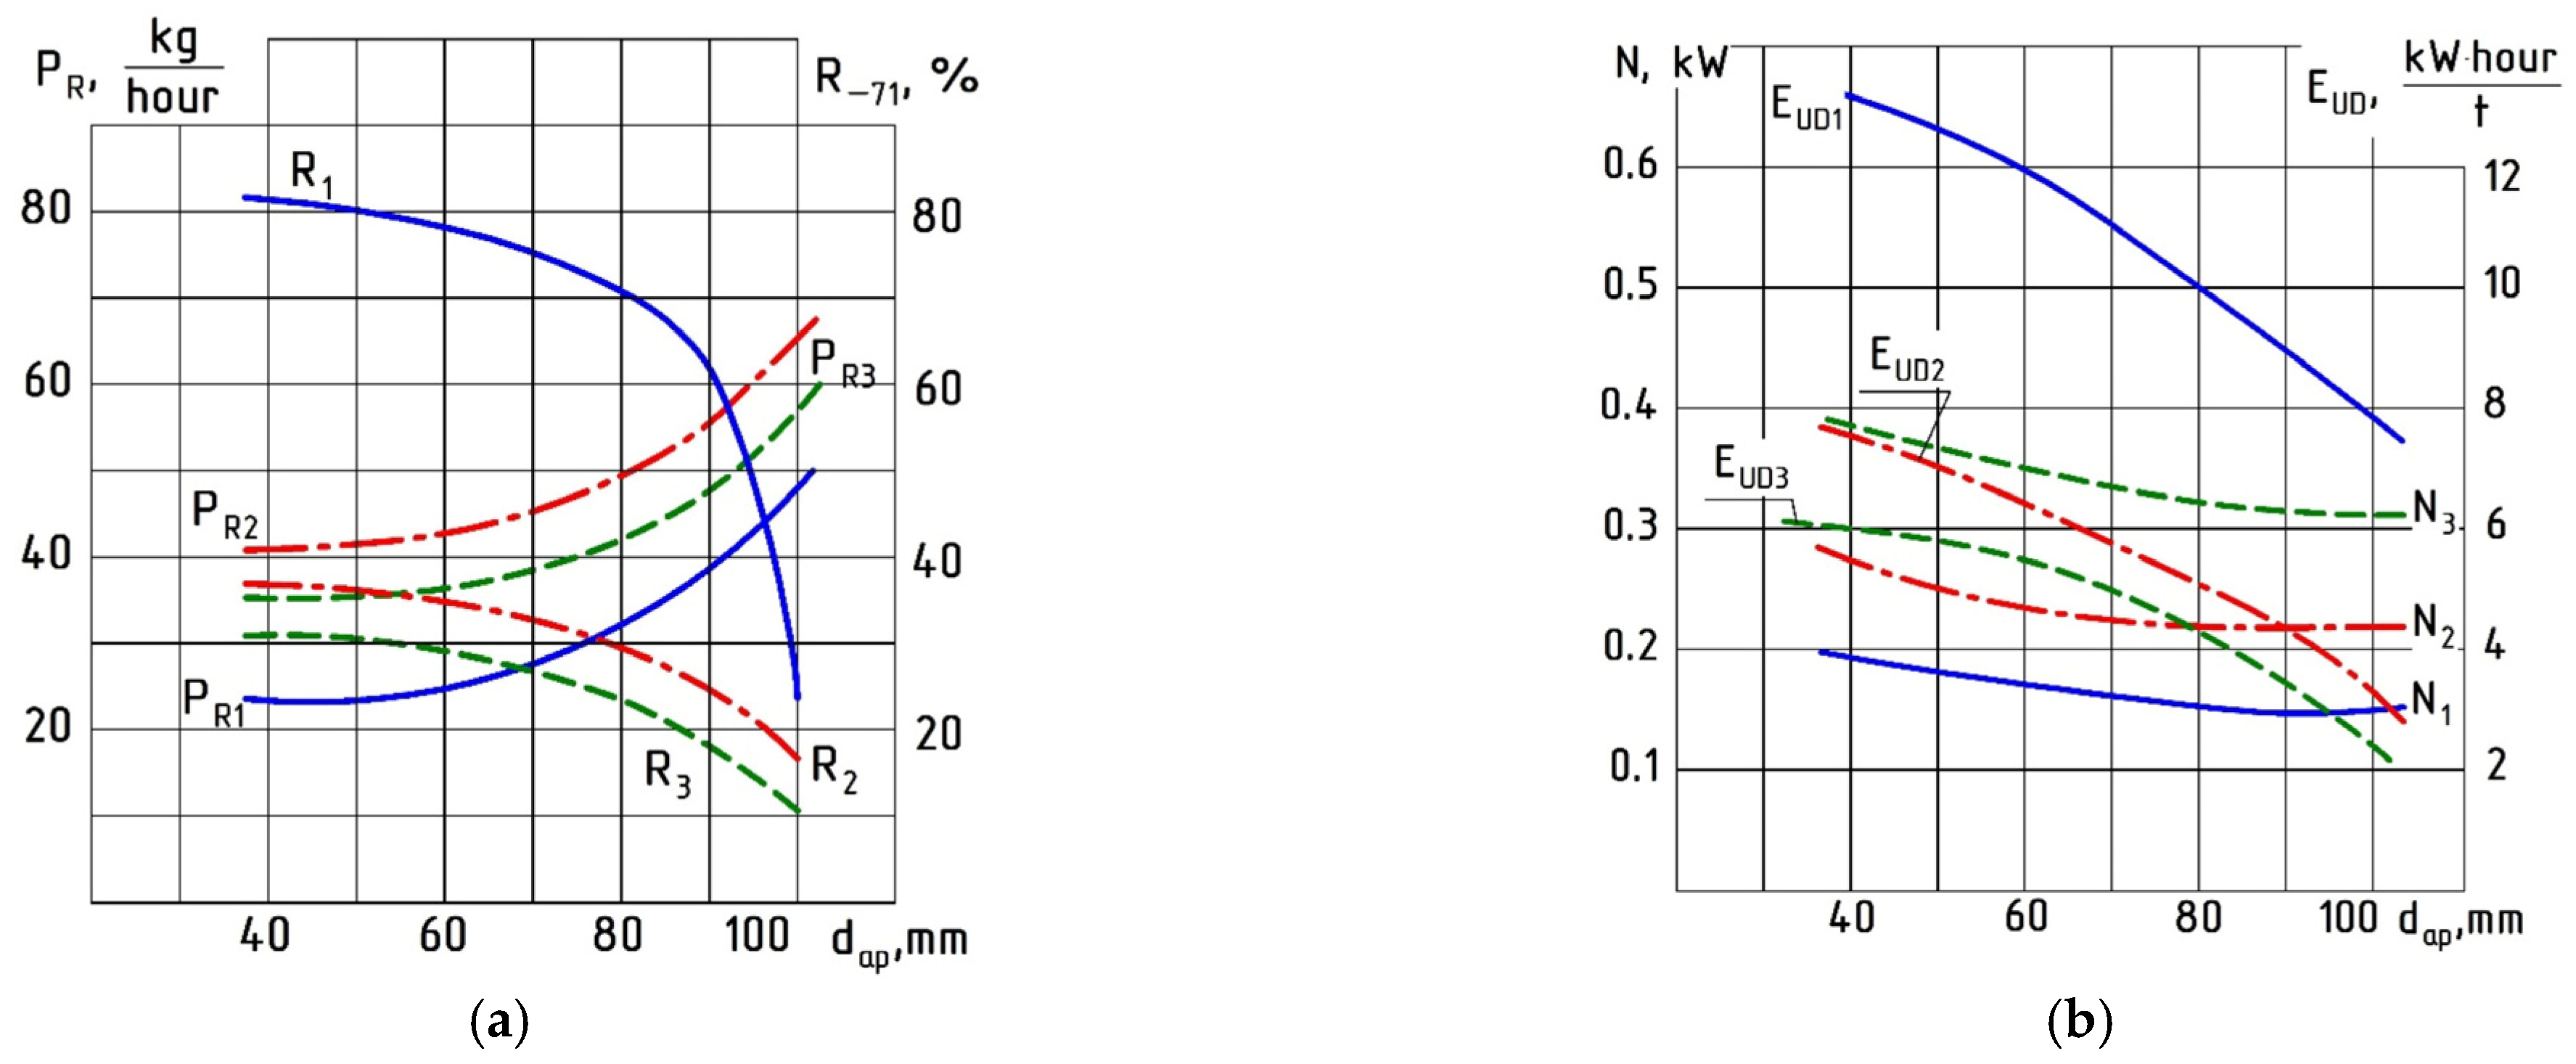
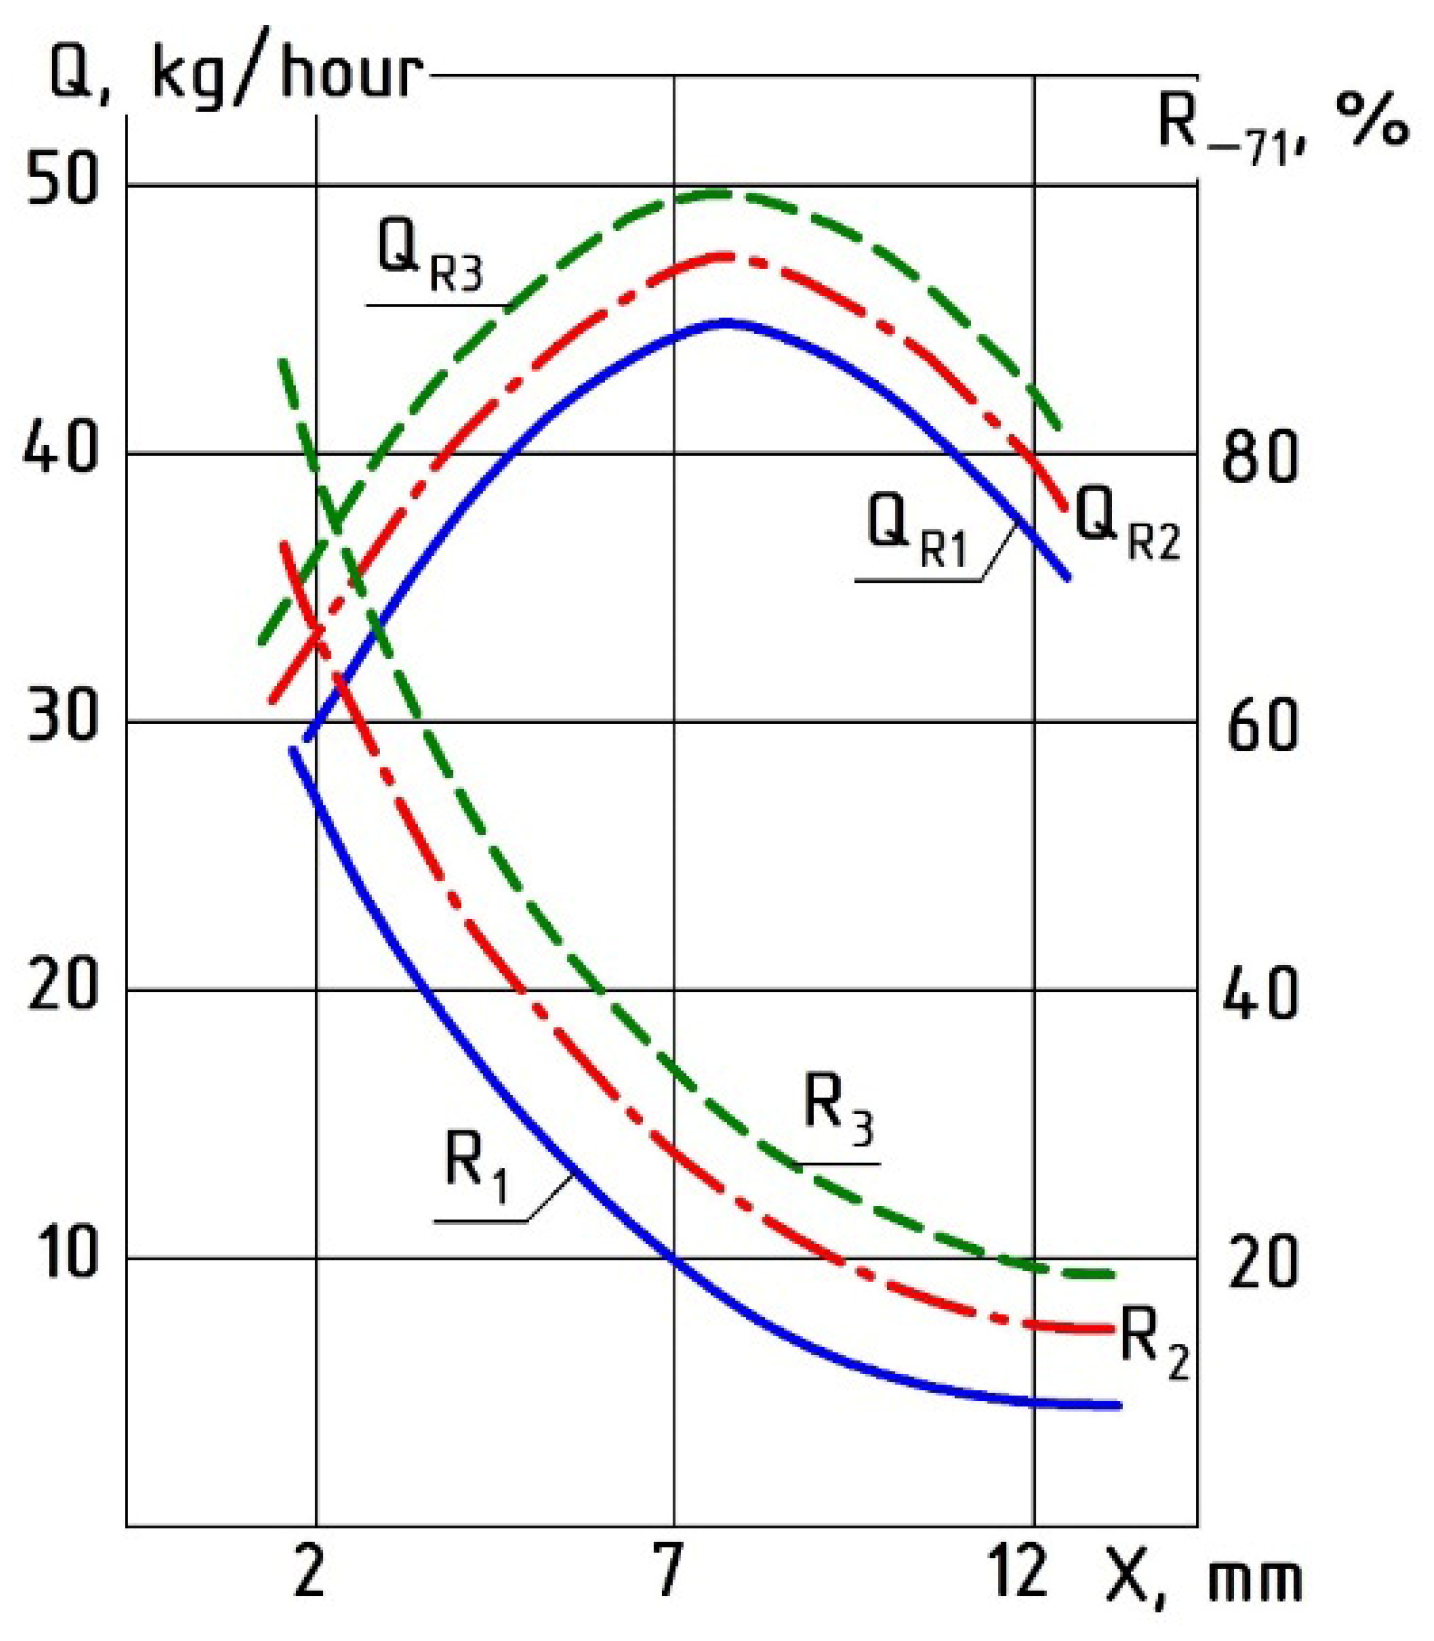
The main portion of the material, under the action of the air flow and accumulated kinetic energy, passes into the operating zone of the other rotor pair, while only a minor fraction of the material returns for a repeated cycle in the first zone. This is confirmed by experimental data presented in Figure 9 and Figure 10.
A decrease in the diaphragm through-section diameter and the end clearance leads to a sharp increase in consumed power. At small end clearances, variation in the through diameter results in much larger changes in power consumption than at larger end clearances. This is due to the fact that, at larger end clearances, the material exits the active grinding zone more freely and has greater opportunity to redistribute within the grinding chamber, thereby escaping the action of destructive forces. With an increase in the diaphragm through opening, mill productivity also increases.
During the experiments, a material separation effect was observed as the material passed through the diaphragm. In addition to its grinding function, the end clearance also acted as a calibrating opening: it allowed material particles smaller than the clearance size to pass through, while retaining and further grinding the coarser particles. To enable the calculation of mills with different rotor diameters D p , the variation in the diaphragm opening d d g is expressed in the form of the dimensionless ratio d d g / D p . The analytical expression of the variation in coefficient K depending on the diaphragm through diameter is:
K X = 19 · 10 3 · X 2 14.5 · 10 3 X + 7 · 10 3
where X is the value of the ratio d d g / D p . The relationship is valid within the range of variation of d d g / D p from 0.5 to 0.85, with a maximum D p of up to 0.4 and an end clearance of 2 mm.

Applicability Limits of the Diaphragm Model

The empirical relationship described by Equation (10) was derived from experiments conducted on a specific mill configuration. Its validity is therefore bounded by the range of parameters investigated. These boundaries are determined by the physical constraints of the experimental setup and the observed flow behavior of the material:
Lower limit (ddg/Dp = 0.5): during preliminary experiments with diaphragm openings smaller than 0.5, severe material bridging was observed, leading to erratic power consumption and blockage of the discharge. This made stable operation impossible and resulted in inconsistent product fineness. Hence, 0.5 represents the practical lower bound for reliable continuous operation with the current material and chamber geometry.
Upper limit (ddg/Dp = 0.85): when the diaphragm opening exceeded 0.85, the separation effect diminished significantly. Sieve analysis of the product (Figure 9a) showed that the proportion of coarse particles (>71 µm) in the output increased sharply, indicating insufficient retention time in the grinding zone. The diaphragm no longer acted as an effective classifier, and the mill performance approached that of a single-stage grinder.
Rotor diameter limit (Dp\leq 0.4 m): this limit is imposed by the physical dimensions of the experimental stand. All experiments were conducted with rotors of 0.4 m diameter or less. While the use of the dimensionless ratio ddg/Dp provides a basis for geometric scaling, extrapolation to significantly larger rotors should be undertaken with caution. Changes in absolute scale may affect centrifugal force fields and material transport dynamics, as the Froude number (Fr = ω2R/g) and particle residence time distributions would differ.
The relationship is valid within the range of variation in frac{ddg}{Dp} from 0.5 to 0.85, with a maximum Dp of up to 0.4 m and an end clearance of 2 mm. These boundaries are summarized in Table 5 for clarity.
Installation of inter-sectional diaphragms makes it possible to divide the process into stages. The optimal diaphragm opening diameter is approximately equal to the mean rotor diameter, ensuring a separation effect: the clearance allows the finished fine fraction to pass through while retaining the coarse particles. The diaphragm through diameter determines the rate of passage through the grinding chamber and, consequently, the residence time of the material in the mill, allowing material to be ground in several stages within a single unit to achieve a higher overall grinding degree.
Future work will focus on extending the experimental database to include a wider range of rotor diameters and diaphragm configurations. This will enable the development of a more universal dimensionless model, potentially incorporating additional parameters such as the Froude number, particle density, and friction coefficient to predict K(X) across different scales and material types. Such a model would allow for rational scale-up of the mill design without requiring extensive case-by-case experimentation.

4.3. Influence of Rotor Overlap Magnitude

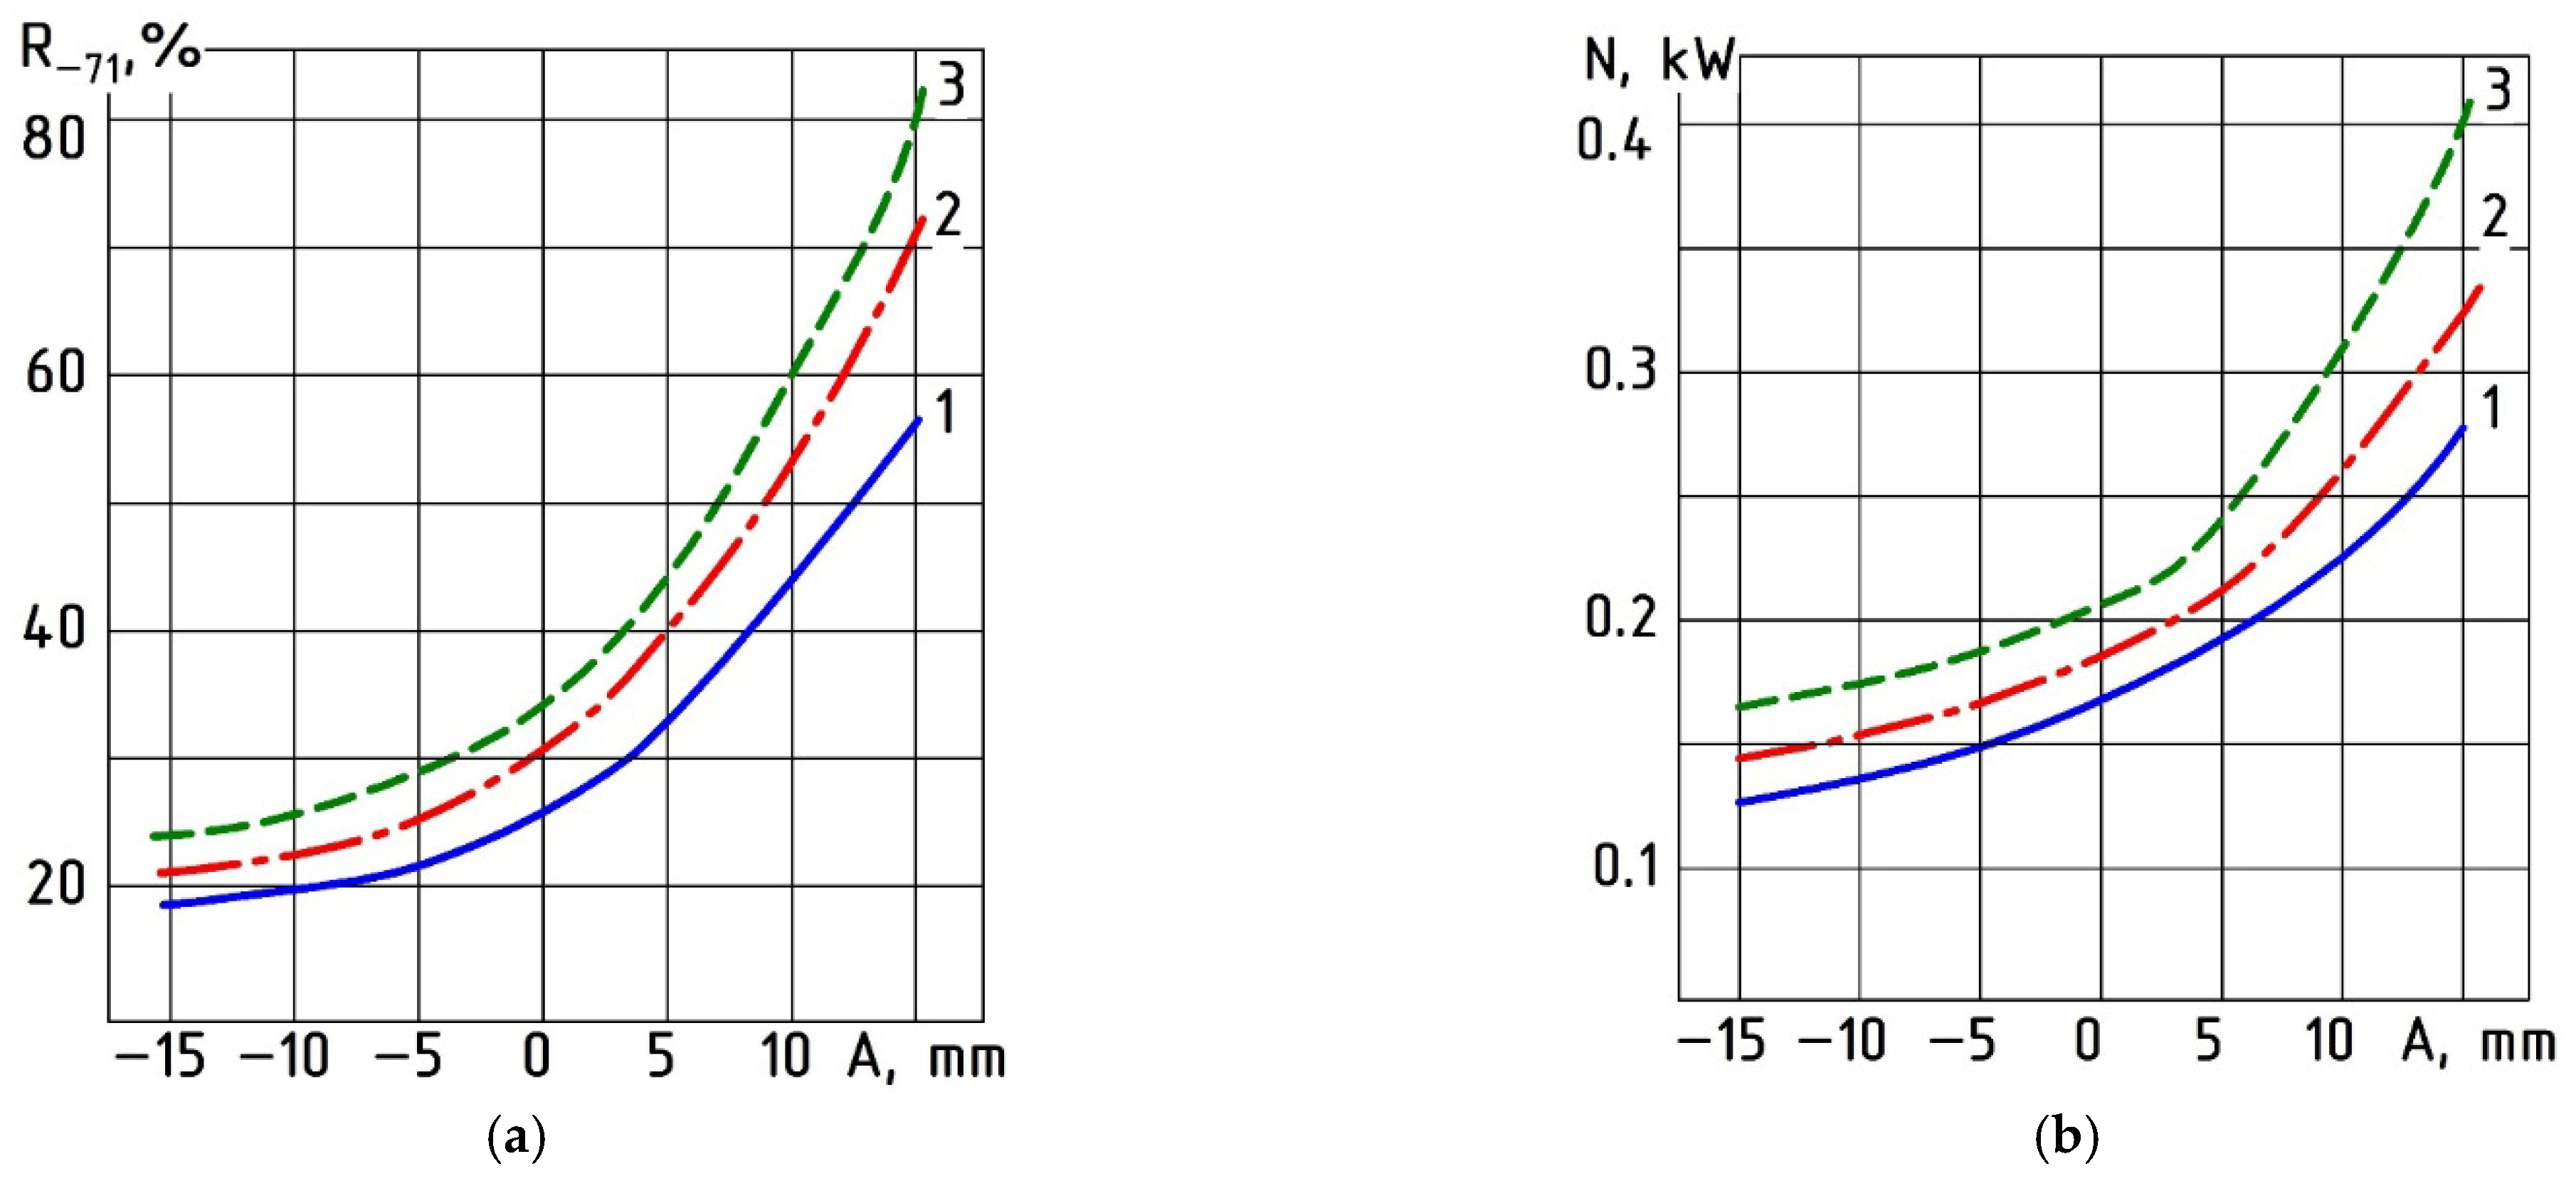
The study of rotor overlap influence was carried out on the experimental stand (Figure 1). The rotational speed varied from 1500 to 2500 rpm, and the degree of material filling ranged from 0.1 to 0.5 of the total chamber volume. The rotor overlap magnitude was varied from complete separation at (−15) mm to overlap of the rotor teeth in engagement up to (+15) mm. The “−” sign indicates that the rotors operate without engagement and are driven by separate motors; the numerical value represents the distance by which the extreme point of one rotor is separated from the extreme point of the other rotor, measured at the extreme points of the grinding elements. The results are presented in Figure 11a,b.
Figure 11a shows the dependences of grinding fineness (R−71) and consumed power on the rotor overlap magnitude (A) at different rotor rotational speeds (n). With increasing overlap magnitude, the residue on the 71 μm sieve decreases. At small overlap values in the range (0)–(+5) mm, no significant increase in the fineness of the final product is observed. In the range (+5)–(+15) mm, the influence of overlap becomes more pronounced. When the overlap decreases to (−15) mm, a sharper reduction in fineness is observed compared with the range (−5)–(+5) mm.
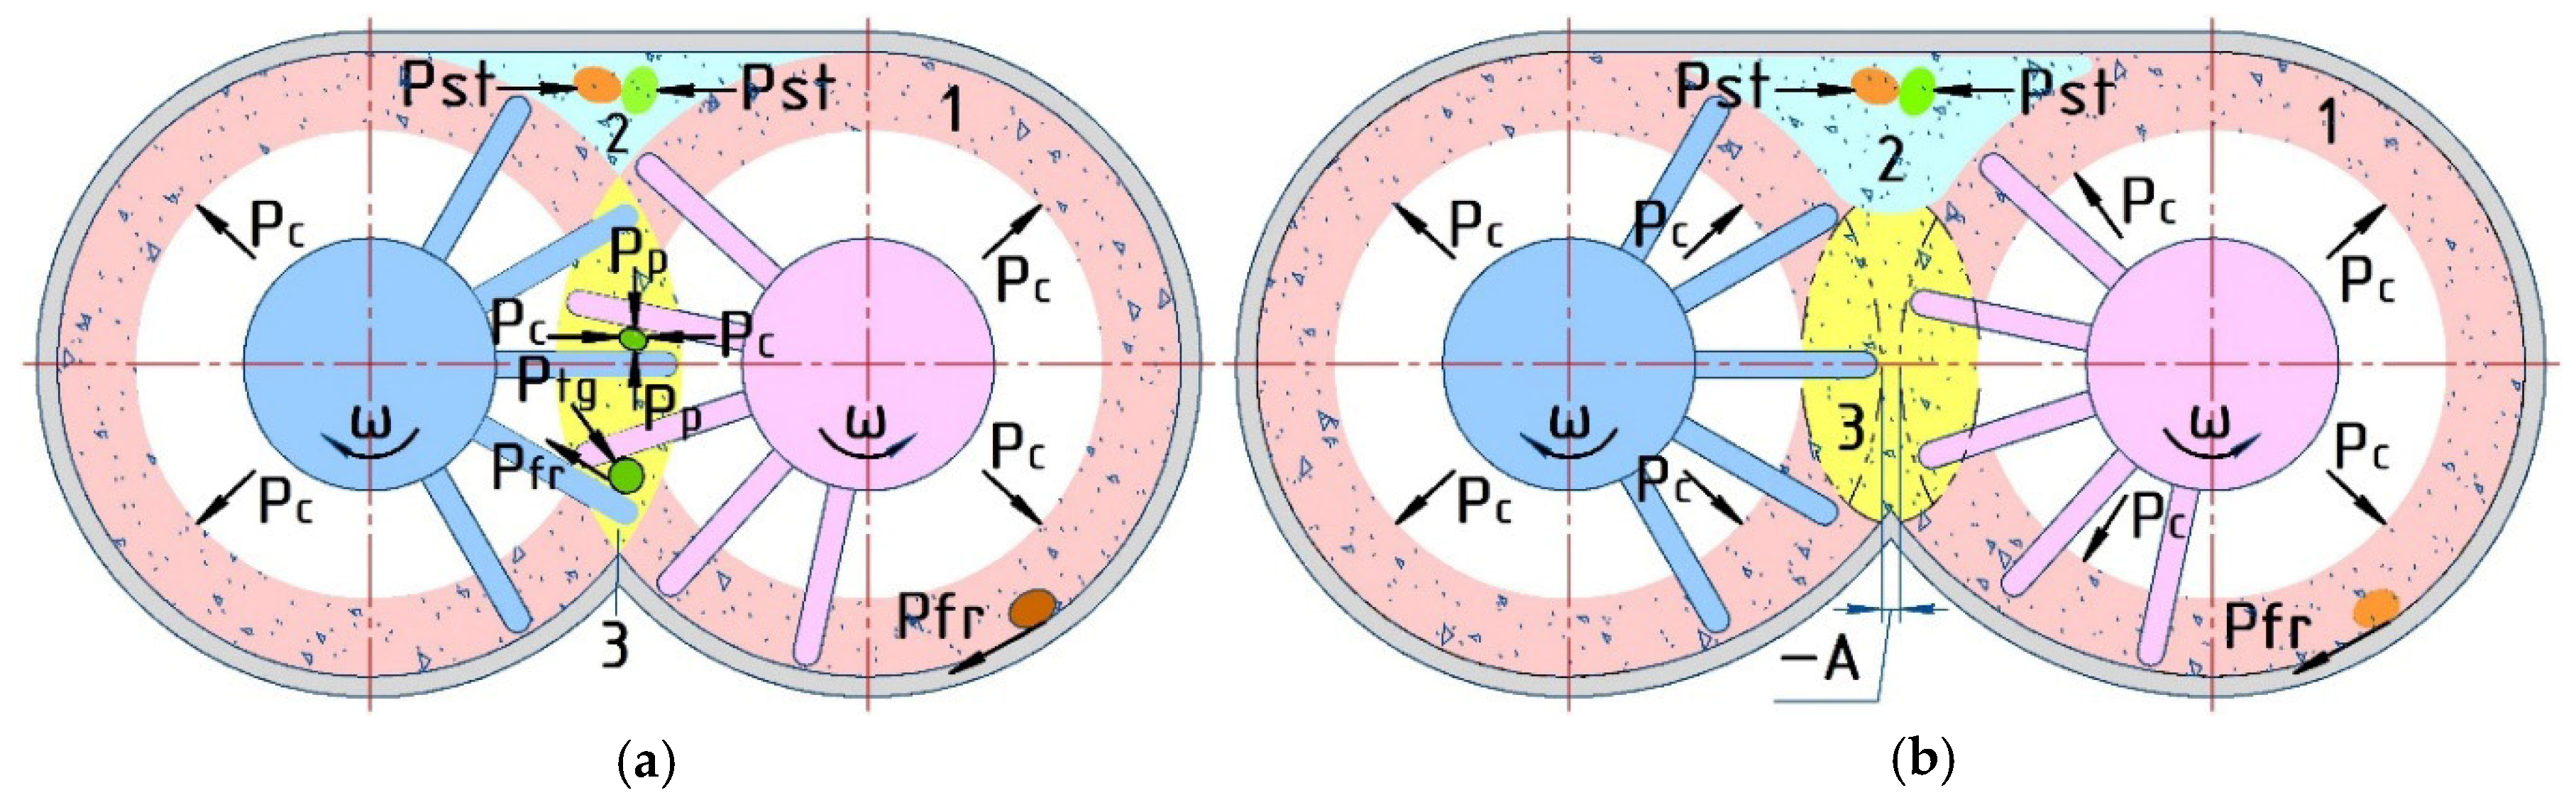
At different degrees of overlap, the nature of the destructive forces acting on the material changes. The force interaction scheme occurring at a positive overlap magnitude is shown in Figure 12a. Three zones of material influence are formed: the first zone (1) at the periphery of the grinding chamber characterized by friction and centrifugal forces; the second zone (2) in the upper part characterized by impact loads from particle-element and interparticle collisions; and the third zone (3) in the rotor engagement region where the material is subjected to combined forces during torque transmission.
At the moment when the working element of the driving rotor engages with that of the driven rotor, the action resembles a jaw crusher: material is clamped between the working elements and crushed during rotation. When the elements leave the engagement zone, tangential and shear forces (Pp and Pfr) arise, causing intensive abrasion. Centrifugal forces Pc of both rotors also act in this zone and are directed toward each other.
At negative rotor overlap values (Figure 12b), the nature of material loading changes. In zone 2, the action of forces responsible for breakage weakens due to the increased distance, with kinetic energy largely expended on overcoming this distance rather than on size reduction. In the third zone, forces acting during torque transmission disappear, and the region of active centrifugal force interaction decreases. In the range (+5)–(+15) mm, grinding processes proceed efficiently in all three zones. At negative overlap values, the mill operates similarly to a conventional rotor crusher, with fineness mainly determined by the collision velocity between working elements and material particles.
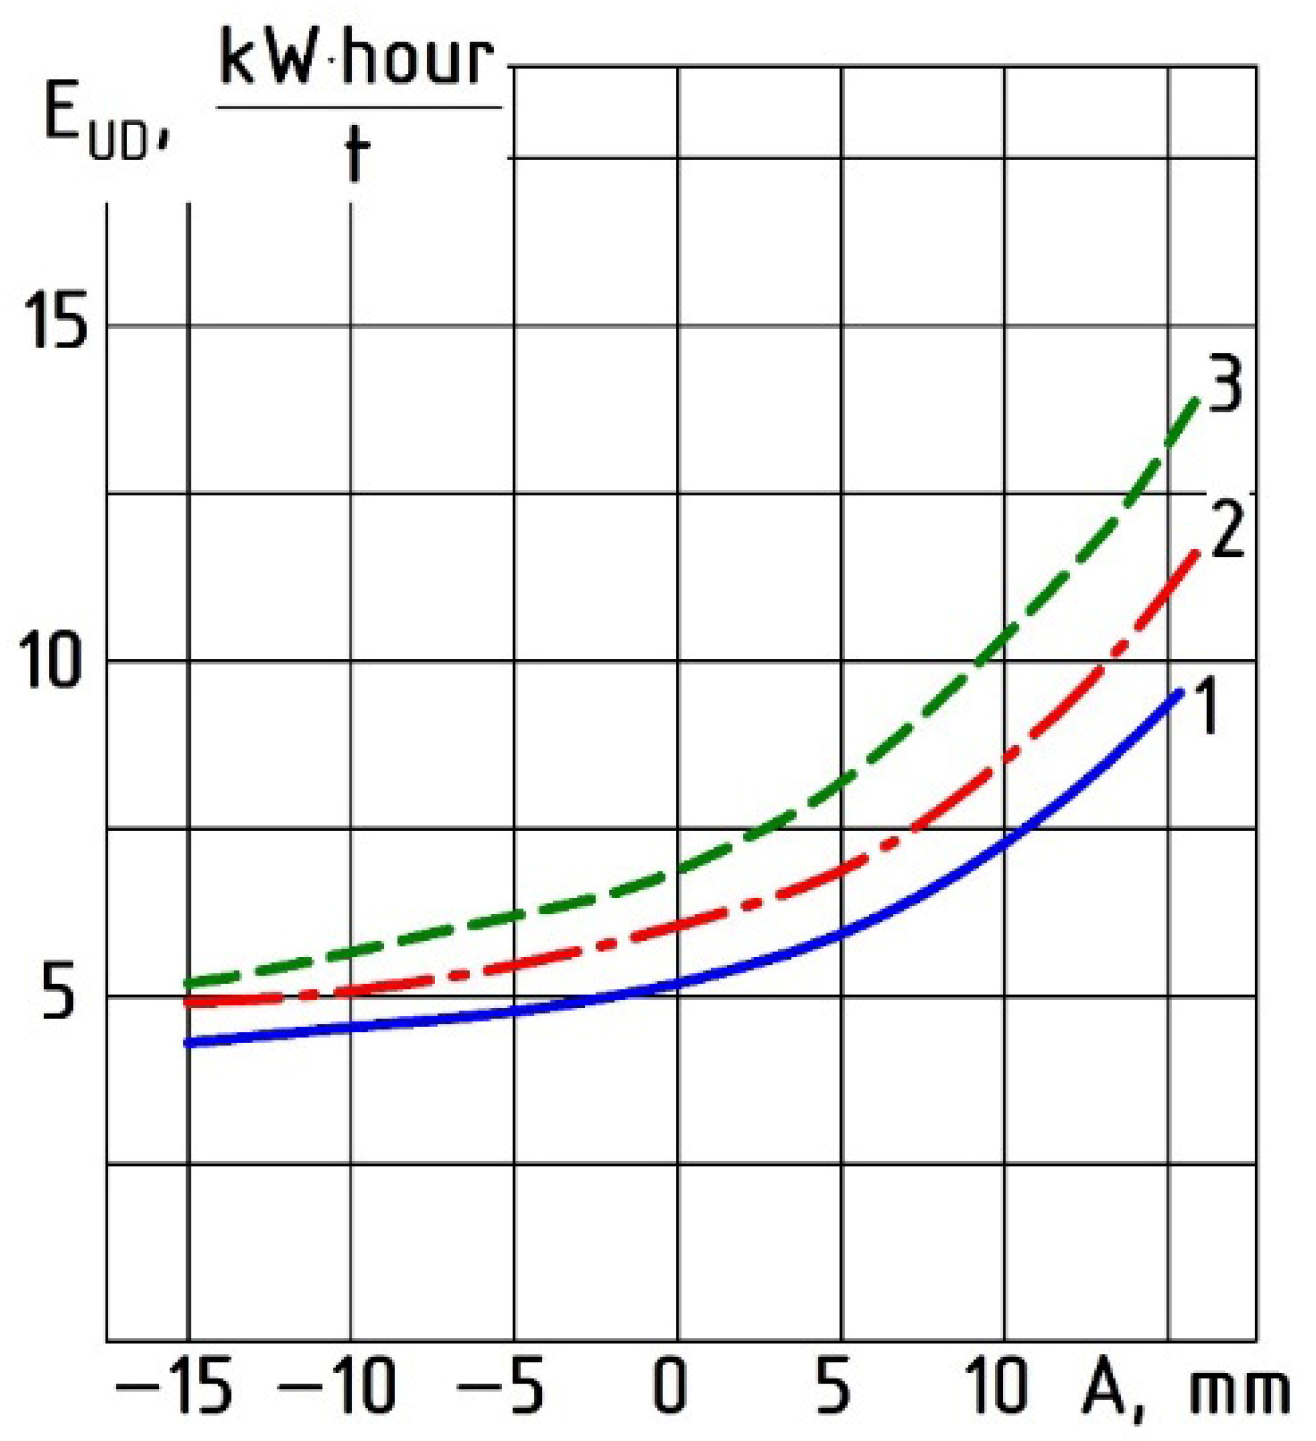
Figure 13 presents the dependence of specific energy consumption Eud on the rotor overlap magnitude A at different rotational speeds. Due to the additional zone of destructive forces in the rotor engagement region, it becomes possible to supply more energy to the material, thereby intensifying the grinding process. The dependence of grinding fineness on rotor overlap can be described by an analytical relationship obtained by interpolating the graph in Figure 11:
R 71 X = 0.14 · X 2 + 0.9 X + 35
where X—rotor overlap magnitude in mm.
The domain of definition ranges from (0) to (15) mm at an end clearance of 2 mm and a filling degree of 0.3.

4.4. Multi-Objective Optimization

Optimization of the technological parameters represents a complex multi-objective problem requiring simultaneous consideration of conflicting requirements. Two complementary approaches were applied: the weighted-sum method to obtain a single compromise solution, and the NSGA-II algorithm to construct a Pareto-optimal front visualizing the complete set of trade-offs between competing objectives [8,9,10,11].

4.4.1. Weighted-Sum Method for a Compromise Solution

The weighted-sum method aggregates multiple objectives into a single scalar function, allowing identification of one preferred operating point based on technological priorities. This approach is widely used in engineering optimization due to its simplicity and intuitive interpretation [13,14,15]. However, as noted in recent studies on rotor optimization [reviews recommended references], the weighted-sum method has limitations in capturing non-convex regions of the Pareto front, which is why it is complemented here by the NSGA-II algorithm. The objective function is defined as:
F c o m p = k = 1 5 ω k · f k ( X )
where: ω k —weight coefficients ( ω k = 1 ) ; f k ( X ) —normalized values of the output parameters.
The weight coefficients were assigned based on technological priorities for comprehensive multi-objective optimization. Grinding fineness (w1 = 0.30) was considered the most important quality indicator, followed by productivity (w2 = 0.25). Drive power (w3 = 0.20) and specific energy consumption (w4 = 0.15) reflect operational costs, while specific metal consumption (w5 = 0.10) serves as an indirect indicator of equipment wear. This weighting scheme reflects a production scenario where product quality is the primary concern, followed by throughput, with operational costs and equipment wear given progressively lower priority.

4.4.2. Pareto-Optimal Front Using NSGA-II

In contrast to the weighted-sum method, which provides a single point based on subjective priorities, the Pareto approach explores the entire solution space without imposing a priori preferences. For this purpose, we employed the Non-dominated Sorting Genetic Algorithm II (NSGA-II), originally proposed by Deb et al. [12]. NSGA-II is one of the most widely used multi-objective evolutionary algorithms in engineering optimization due to its efficiency, elitism, and ability to maintain diversity along the Pareto front [16,17,18].
The algorithm operates through three key mechanisms:
(1)
Fast non-dominated sorting: the population is sorted into different fronts based on dominance. Solutions in the first front are not dominated by any other solution; solutions in the second front are dominated only by those in the first front, and so on. This ranking ensures that solutions closer to the true Pareto front are prioritized.
(2)
Crowding distance preservation: to maintain diversity and prevent clustering of solutions, a crowding distance metric is calculated for each solution, measuring the density of solutions surrounding it. Solutions with larger crowding distances (i.e., in less crowded regions) are preferred during selection, ensuring a well-distributed set of trade-off solutions along the entire front.
(3)
Elitist selection: the algorithm combines parent and offspring populations and selects the best N solutions based on dominance rank (lower rank is better) and crowding distance (larger distance is better). This elitist approach ensures that high-quality solutions are not lost during evolution.
Recent applications of NSGA-II in rotor dynamics optimization [19,20] and aeroengine rotor assembly [21] have demonstrated its effectiveness in handling complex, non-linear problems with multiple conflicting objectives. The algorithm’s ability to generate a diverse set of Pareto-optimal solutions makes it particularly suitable for engineering design problems where decision-makers need to explore different trade-offs between competing performance indicators [22].
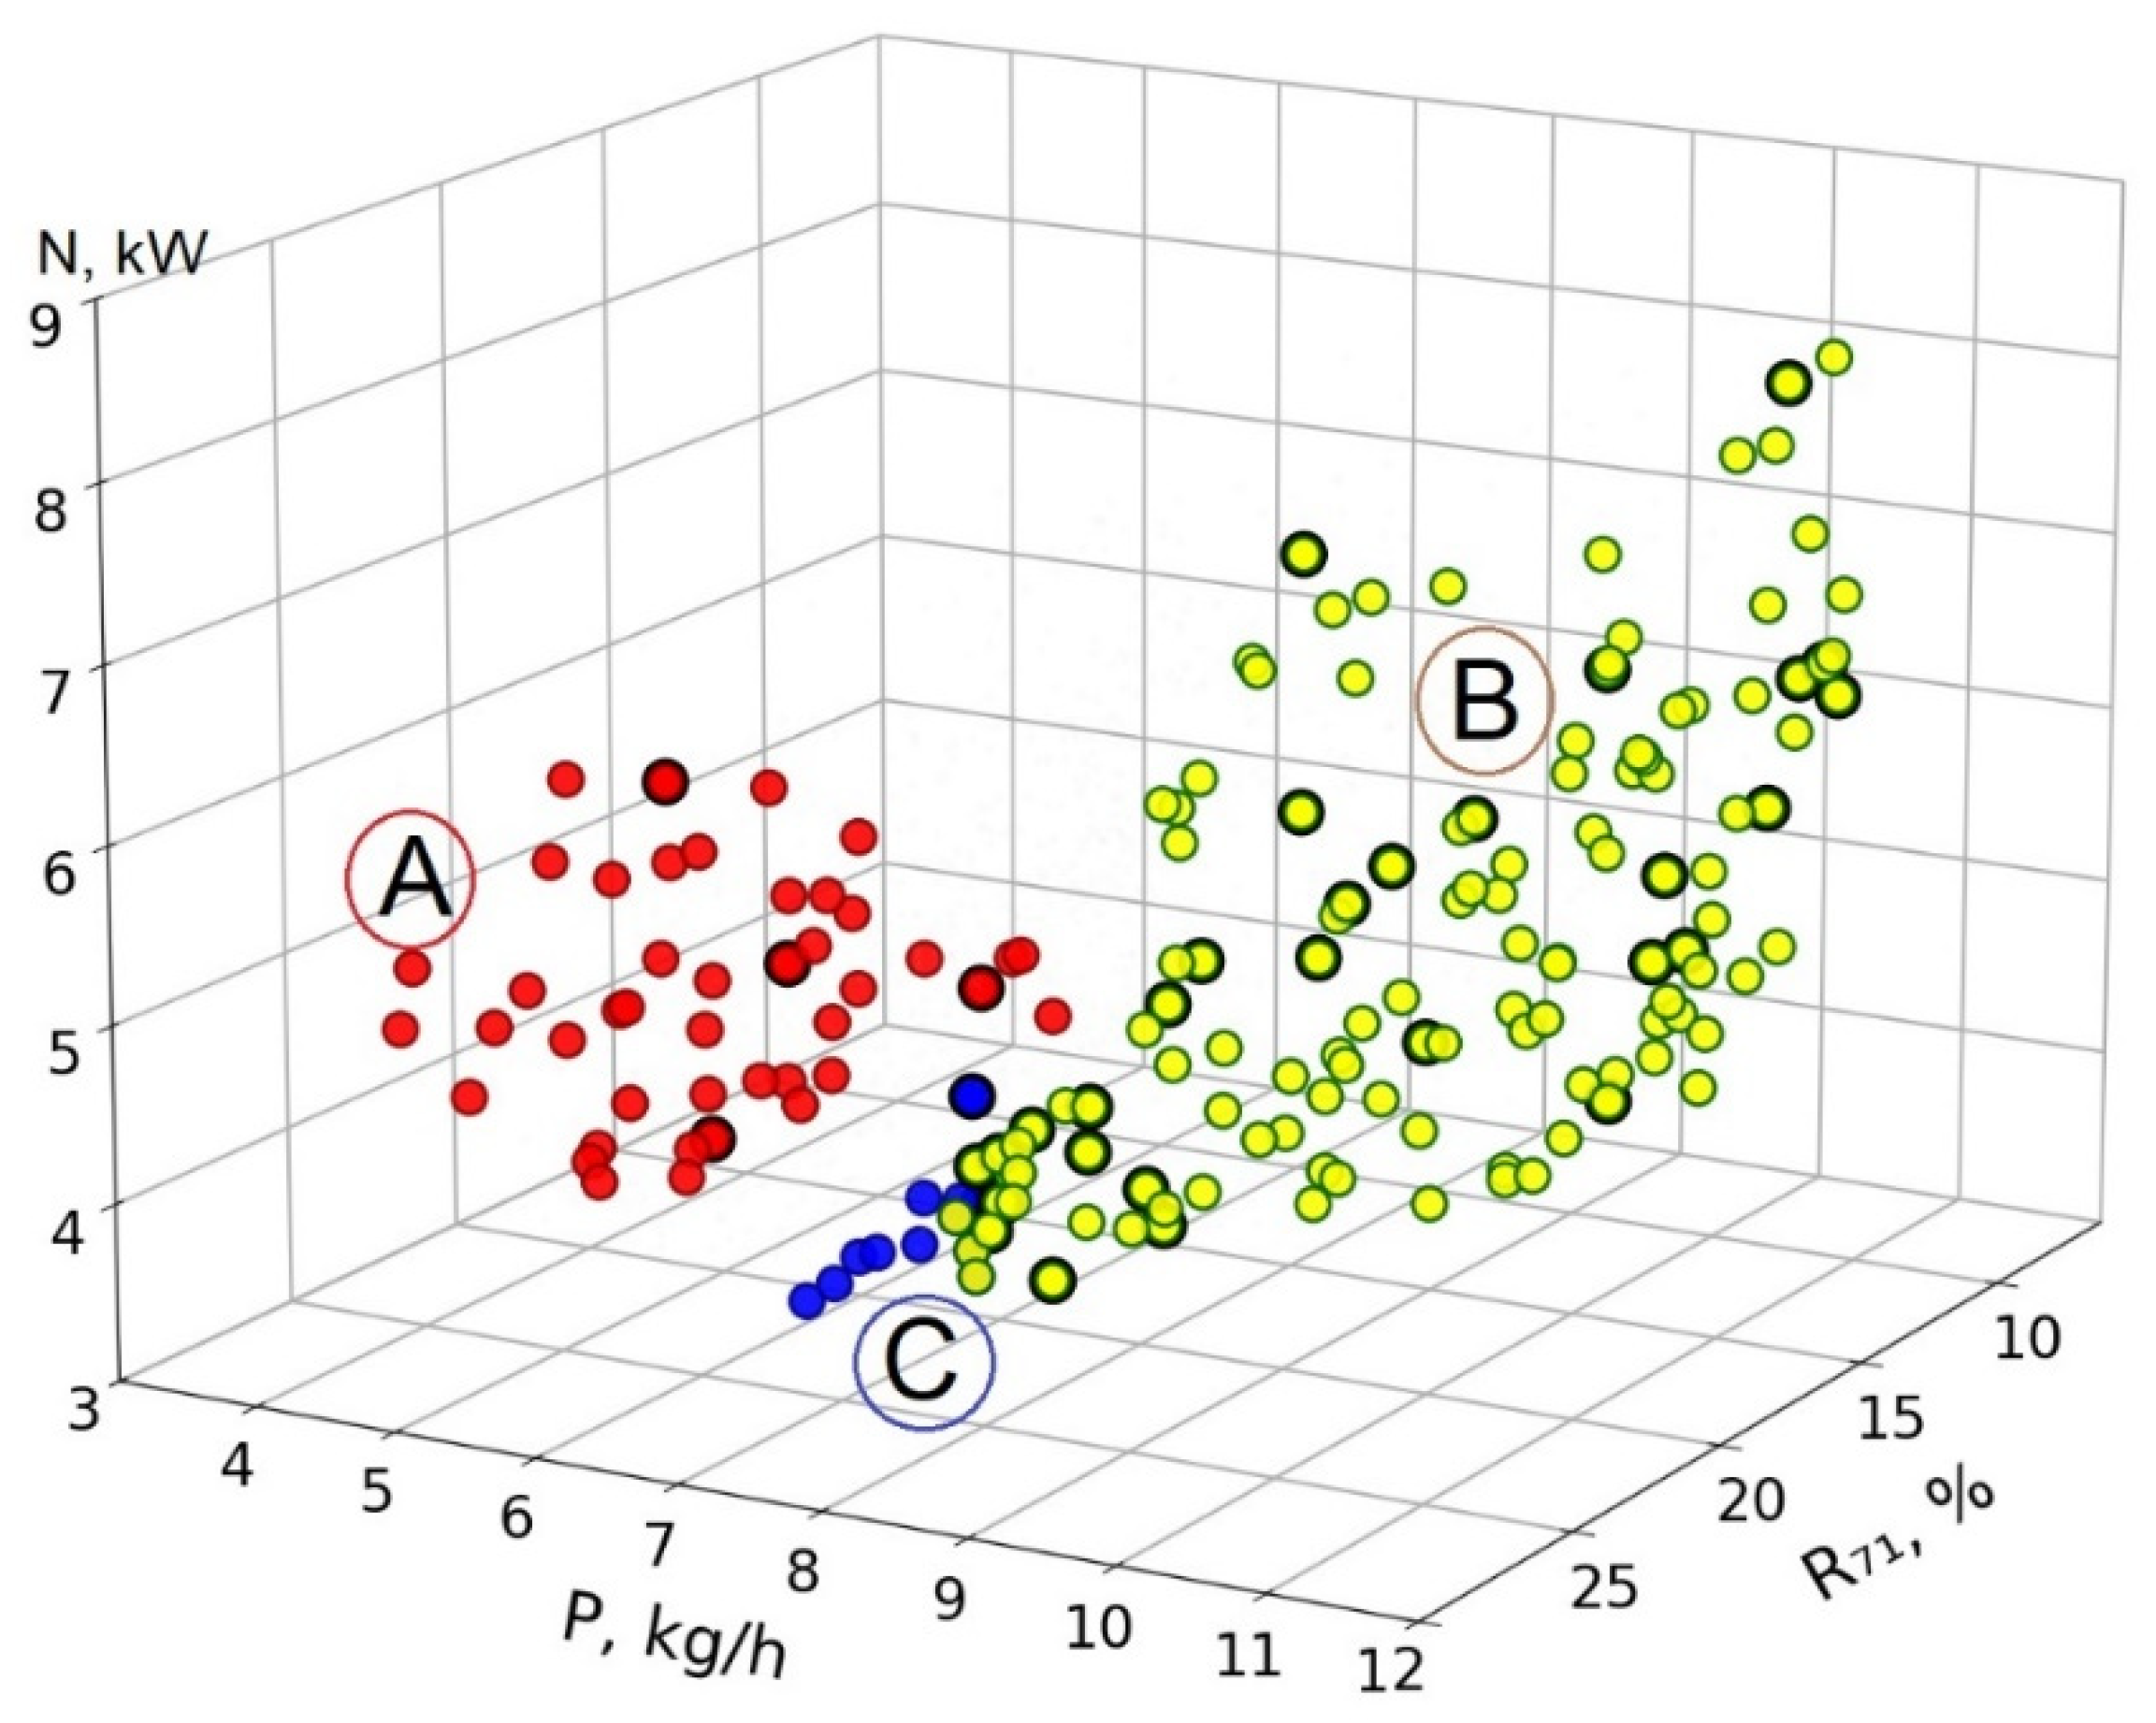
In this study, a three-dimensional Pareto-optimal front was constructed in the space (R(−71), P, N) (Figure 14). Using the NSGA-II algorithm on a uniform grid of 32,768 points, 237 Pareto-optimal solutions for the criteria {R(−71), P, N} were obtained. The variation ranges on the Pareto front were: grinding fineness 8.2–30.0%; productivity 0.9–13.6 kg/h; drive power 3.1–10.7 kW.
Analysis of the graph in Figure 14 makes it possible to establish the following:
  • The three-dimensional shape of the front indicates that it is impossible to simultaneously obtain very low R(−71) (high quality), very high P (productivity), and very low N (energy consumption).
  • The zones are distributed systematically:
    red points (zone A) are grouped in the region of low R(−71) (12–20%), but with relatively low productivity (3–8 kg/h) and moderate power consumption (4–6 kW);
    yellow points (zone B) are located in the high-productivity region (8–12 kg/h) with lower quality (R(−71) ≈ 20–28%) and increased power consumption (6–8 kW);
    blue points (zone C) exhibit the lowest power consumption (3–5 kW), while maintaining moderate values of both quality and productivity.
  • Stable points (highlighted with a black outline) are of particular importance for practical implementation, as they exhibit low sensitivity to small parameter deviations.
Practical conclusions: operators should select operating points based on production priorities—fine grinding from zone A, maximum productivity from zone B, or energy savings from zone C [17,18,19]. These results form a scientific basis for informed technological decision-making [20].

4.4.3. Optimal Regimes and Recommendations

Based on Pareto front analysis and weighted-sum optimization, optimal techno-logical operating regimes were determined (Table 6).
Multi-criteria grinding optimization was also performed, enabling the process to be carried out with simultaneous improvement of conflicting indicators: enhancement of grinding fineness (increase in specific surface area S u d ) while reducing specific energy consumption ( E u d ) and grinding time [16]. This optimization makes it possible to improve the efficiency of material grinding (grain, cement) through precise adjustment of the parameters of spring–rotor mills. Determination of the global optimum and the compromise between quality, productivity, and power consumption was also achieved using the weighted-sum method [13,14,15,16,17,18,19]. As an example, the selection of mill rotational speed (n) and grinding time (t) was performed in order to achieve a 90% yield of particles (<50–71) μm with minimal electrical energy consumption.
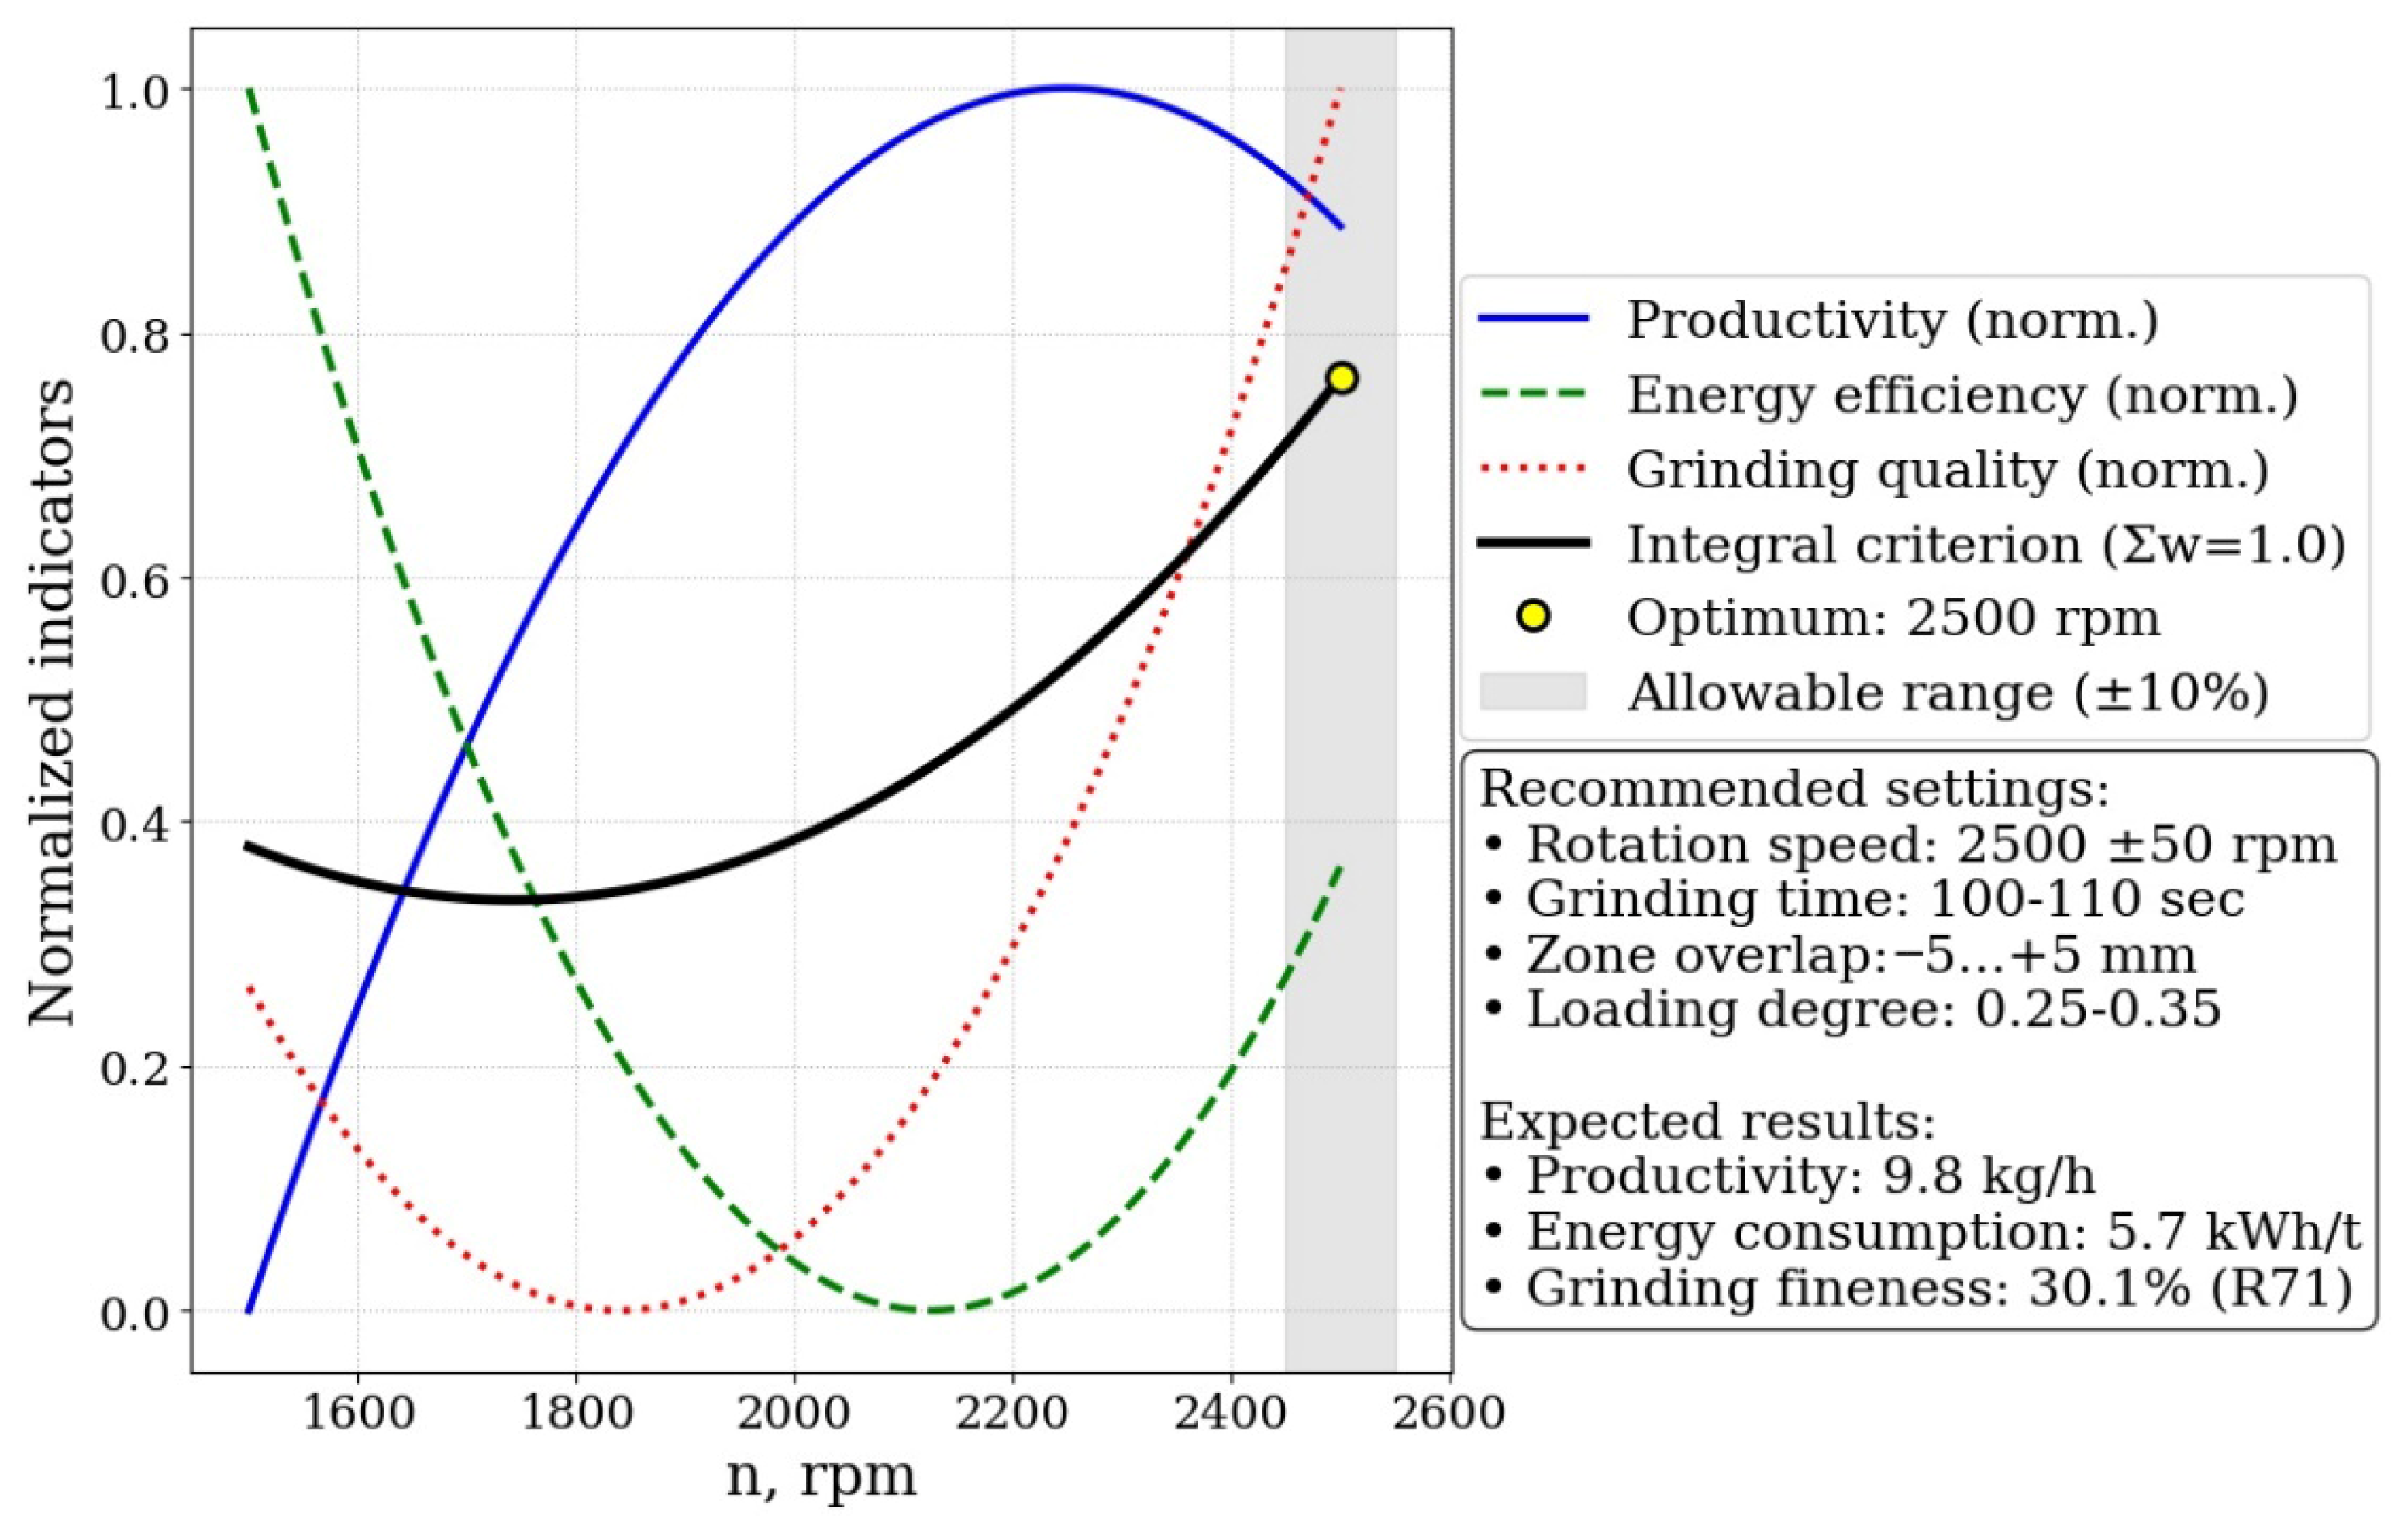
Figure 15 presents the results of the multi-criteria analysis for determining the optimal operating regime of the spring–rotor grinder. The graph demonstrates the dependence of normalized performance indicators on rotor rotational speed at fixed values of the remaining factors (grinding time 90 s, working-zone overlap 0 mm).
Normalization of indicators: all three key parameters (productivity, energy efficiency, and grinding quality) were converted to a dimensionless form within the range 0–1 for correct comparison. In this case, the indicators of specific energy consumption and grinding fineness were inverted, since these characteristics require minimization (lower is better), whereas productivity is maximized.
The integral criterion (black solid line) represents the weighted integral criterion with weighting coefficients of 0.4 for productivity, 0.3 for energy efficiency, and 0.3 for grinding quality. These weights were chosen specifically for the two-dimensional visualization in Figure 15 to give balanced consideration to all three aspects, with a slight emphasis on productivity as the primary economic driver. This simplified three-criteria approach allows for clear graphical representation of the trade-offs, complementing the more comprehensive five-criteria optimization presented in Section 4.4.1.
The optimal point (yellow marker with black outline) is observed at a rotational speed of 2000 rpm (X1 = 0 in coded form). The permissible range of ±10% from the optimal value (±50 rpm) is indicated by gray shading, within which the reduction in the integral criterion does not exceed 10%.
Based on the conducted studies, the following optimal operating regime is recommended: rotational speed 2000 ± 50 rpm; grinding time 100–110 s (X5 = 0.33…0.67); working-zone overlap −5…+5 mm (X3 = −0.33…0.33); filling degree 0.25–0.35 (X4 = −0.5…−0.3); chamber clearance 6.08 mm. Under these settings, the following output parameters are predicted: grinding fineness R−71 = 29.2%; productivity P = 9.84 kg/h; specific energy consumption Eud = 6.29 kW·h/t. Application of the optimized operating regimes makes it possible to reduce the production cost of mineral powder by an average of 10%.
The practical significance of multi-objective optimization lies in the creation of an algorithmic basis for intelligent control systems of grinding technological processes, ensuring production stability and energy efficiency.
Numerical optimization made it possible to identify a compromise solution that is optimal with respect to the combined set of criteria. The optimization results for individual criteria and the multi-objective optimum are presented in Table 7.
To assess the robustness of the optimal solution, a sensitivity analysis was performed by varying the weight coefficients within a reasonable range (±0.1 for each weight, maintaining the sum equal to 1). The analysis showed that the optimal rotational speed remained within the range of 1950–2050 rpm for all tested weight combinations, and the integral criterion value varied by less than 8%. This indicates that the identified optimum at 2000 rpm is stable and not overly sensitive to the subjective choice of weighting coefficients. The gray-shaded region in Figure 15 (±50 rpm) comfortably covers this range of stable optima, confirming the practical reliability of the recommended operating regime.

4.4.4. Experimental Validation of the Optimal Regime

To verify the predictive capability of the optimization procedure, an additional experimental validation was performed. Three repeated experiments were conducted at the multi-objective optimal parameter set identified in Section 4.4.3: rotational speed: 2050 rpm; filling degree: 0.31; rotor overlap: −3.3 mm; chamber clearance: 6.1 mm; grinding time: 101 s.
The measured output parameters were averaged over the three runs and compared with the values predicted by the regression models (5)–(9). The results are presented in Table 8.
The agreement between predicted and measured values is excellent, with relative errors below 5% for all parameters. This confirms that the regression models accurately predict the mill’s performance at the optimal operating point and validates the multi-objective optimization results. The small discrepancies can be attributed to inherent experimental variability and minor fluctuations in operating conditions during the tests.
These validation experiments demonstrate that the proposed optimization methodology successfully identifies a practically achievable operating regime that delivers the predicted improvements in productivity (15–20%) and energy efficiency (8–12%).

4.5. Limitations of the Study

While this study provides a comprehensive experimental optimization of the spring–rotor grinder, several limitations should be acknowledged to properly contextualize the applicability of the results and to guide future research:
  • Material Limitations. The experiments were conducted using only two types of materials: marble and limestone. Both are relatively homogeneous, brittle materials with well-defined mechanical properties. The behavior of other materials—such as those with higher plasticity, moisture content, or complex composite structures—may differ significantly. The regression models developed here are therefore strictly valid only for materials with similar physical and mechanical characteristics (compressive strength in the range of 80–110 MPa, elastic modulus 35–55 GPa).
  • Equipment and Scale Limitations. All experiments were performed on a single laboratory-scale mill with a fixed rotor diameter of 0.4 m. While the use of dimensionless parameters (e.g., ddg/Dp) provides a basis for geometric scaling, the direct extrapolation of results to larger industrial mills should be undertaken with caution. Changes in absolute scale may affect centrifugal force fields, material transport dynamics, and the Froude number (Fr = ω2R/g), potentially altering the optimal operating regimes.
  • Parameter Range Limitations. The regression models are valid only within the ranges of the five factors investigated (Table 1): rotational speed: 1500–2500 rpm; filling degree: 0.1–0.5; rotor overlap: −15 to +15 mm; chamber clearance: 2–12 mm; grinding time: 60–120 s. Extrapolation beyond these ranges may lead to unreliable predictions and should be avoided without additional experimental validation.
  • Operational Mode Limitation. The study was conducted in batch mode, meaning that the material was processed for a fixed duration and then discharged. Continuous operation, which is more common in industrial settings, may involve additional complexities such as steady-state material flow, residence time distributions, and dynamic feeding systems. The applicability of the optimized parameters to continuous operation should be verified separately.
  • Model Limitations. The second-order polynomial regression models, while providing excellent fit (R2 > 0.93) and good predictive capability (MAPE < 8.1%), are empirical in nature. They do not capture fundamental physical mechanisms such as particle fracture mechanics, energy dissipation at the microscale, or the detailed dynamics of particle–rotor interactions. As noted in Section 4.1, such analyses would require separate fundamental studies using discrete element modeling (DEM) or other numerical techniques.
  • Uncontrolled Factors. Several factors that may influence grinding performance were deliberately kept constant or assumed negligible in this study, including: material moisture content; ambient temperature; presence of surface-active agents; wear state of the grinding elements.
Variations in these factors could affect the reproducibility of the results and should be considered in practical applications.
7.
Generalizability: The optimized parameter set (2050 rpm, filling degree 0.31, rotor overlap −3.3 mm, chamber clearance 6.1 mm, grinding time 101 s) was validated experimentally and shown to deliver significant improvements in productivity and energy efficiency. However, this represents a single optimum for the specific objective function defined in Section 4.4.1. Different production priorities (e.g., maximizing quality at any cost, or minimizing energy consumption regardless of throughput) would lead to different optimal regimes, as illustrated by the Pareto front in Figure 14.
Despite these limitations, the study provides a robust, experimentally validated methodology for optimizing spring–rotor grinders. The identified trends, trade-offs, and modeling approach are expected to be transferable to similar equipment and materials, and the limitations outlined above serve as clear directions for future research.

5. Conclusions

This study successfully demonstrated the application of response surface methodology and multi-objective optimization for improving the efficiency of a spring–rotor grinder. The analysis of the obtained results leads to the following conclusions:
  • Predictive Models: Using a full factorial Hartley design, adequate second-order polynomial regression models were developed for five key output parameters: grinding fineness (R−71), productivity (P), drive power (N), specific energy consumption (Eud), and specific metal consumption (Mud). All models exhibited high coefficients of determination (R2 > 0.93), confirming their excellent fit to the experimental data. Leave-One-Out Cross-Validation (LOOCV) further confirmed their predictive capability, with mean absolute percentage errors (MAPE) ranging from 4.8% to 8.1% for all output parameters.
  • The Nature of the Compromise in Multi-Objective Optimization: A core finding of this work is the quantitative confirmation of the fundamental trade-off between the three primary performance indicators. As visualized by the 3D Pareto front (Figure 14), it is impossible to simultaneously achieve the highest product quality (lowest R−71), maximum throughput (highest P), and minimal energy consumption (lowest N). The analysis revealed distinct operational zones:
    Zone A (High Quality) yields the finest product (R−71= 12–18%) but at the cost of reduced productivity (P = 8–10 kg/h);
    Zone B (High Throughput) maximizes productivity (P = 13–15 kg/h) but results in a coarser product (R−71= 28–32%) and higher power consumption;
    Zone C (Energy Saving) minimizes energy consumption (N = 3–5 kW) while maintaining moderate levels of quality and productivity.
  • Comparison of Single-Objective and Multi-Objective Optima: Table 7 provides a detailed comparison of optimal parameter sets derived from different optimization strategies. Optimizing for a single criterion leads to extreme, often impractical, configurations:
    Minimizing R−71 (17.8%) requires a long grinding time, which severely limits productivity;
    Maximizing P (11.23 kg/h) requires a very short grinding time, which compromises product quality;
    Minimizing N (3.95 kW) demands low rotational speeds and filling degrees, which is also detrimental to productivity.
In contrast, the multi-objective optimum represents a balanced compromise. It provides a grinding fineness of 19.2%—only marginally coarser than the theoretical minimum of 17.8%—while simultaneously delivering high productivity (10.05 kg/h) and low power consumption (4.42 kW). This demonstrates that the multi-objective approach successfully identifies a “knee-point” on the Pareto front where a small sacrifice in one objective yields a significant gain in another.
4.
Experimental Validation of the Optimal Regime: To verify the practical applicability of the optimization results, additional experiments were conducted at the multi-objective optimal operating point (2050 rpm, filling degree: 0.31, rotor overlap: −3.3 mm, chamber clearance: 6.1 mm, grinding time: 101 s). The measured values of all output parameters showed excellent agreement with the model predictions, with relative errors below 5%. This confirms that the identified optimal regime is practically achievable and delivers the predicted improvements in productivity (15–20%) and energy efficiency (8–12%).
5.
Practical Recommendations: The recommended compromise operating parameters for a balanced performance are a rotational speed of 2050 rpm, filling degree of 0.31, rotor overlap of −3.3 mm, chamber clearance of 6.1 mm, and grinding time of 101 s.
6.
Significance: The developed models, the quantification of inherent trade-offs, and the experimental validation of the optimal regime provide a powerful scientific basis for informed technological decision-making. The results enable operators to rationally select operating regimes tailored to specific production priorities—whether the goal is maximizing quality, throughput, or energy efficiency.

Author Contributions

Methodology, A.K. and M.D.; Software, T.L.; Validation, B.M. and A.B.; Investigation, B.M. and V.Y.; Resources, M.D.; Data curation, P.S.; Writing—original draft, A.K.; Visualization, B.M.; Supervision, M.D. All authors have read and agreed to the published version of the manuscript.

Funding

The research related to this publication is funded by the Science Committee of the Ministry of Science and Higher Education of the Republic of Kazakhstan: Grant AP26102017 “Substantiation of parameters and development of equipment for innovative technology of processing plant waste with high productivity”.

Institutional Review Board Statement

Not applicable.

Informed Consent Statement

Not applicable.

Data Availability Statement

The original contributions presented in this study are included in the articlex. Further inquiries can be directed to the corresponding author.

Conflicts of Interest

Authors Bekbolat Moldakhanov and Mikhail Doudkin were employed by the company LLP Europlus Vostok. The remaining authors declare that the research was conducted in the absence of any commercial or financial relationships that could be construed as a potential conflict of interest.

References

  1. Wills, B.A.; Finch, J. Wills’ Mineral Processing Technology, 8th ed.; Butterworth-Heinemann: Oxford, UK, 2016. [Google Scholar]
  2. Napier-Munn, T.J.; Morrell, S.; Morrison, R.D.; Kojovic, T. Mineral Comminution Circuits: Their Operation and Optimisation; JKMRC Monograph: Brisbane, Australia, 1996. [Google Scholar]
  3. Bond, F.C. The third theory of comminution. Trans. AIME 1952, 193, 484–494. [Google Scholar]
  4. Schönert, K. Energy consumption in comminution. Int. J. Miner. Process. 1979, 6, 303–320. [Google Scholar]
  5. Morrell, S. An alternative energy–size relationship to that proposed by Bond for the design and optimisation of grinding circuits. Int. J. Miner. Process. 2004, 74, 133–141. [Google Scholar] [CrossRef] [Scilit]
  6. Ballantyne, G.R.; Powell, M.S. Size specific energy (SSE) concept and its application to comminution benchmarking. Int. J. Miner. Process. 2015, 136, 2–6. [Google Scholar] [CrossRef] [Scilit]
  7. Tavares, L.M. Energy absorbed in breakage of single particles in drop weight testing. Miner. Eng. 2007, 20, 1344–1354. [Google Scholar] [CrossRef] [Scilit]
  8. Vogel, L.; Peukert, W. Breakage behaviour of different materials—Construction of a mastercurve. Powder Technol. 2003, 129, 101–110. [Google Scholar] [CrossRef] [Scilit]
  9. Kwade, A. Wet comminution in stirred media mills—Research and practical aspects. Powder Technol. 1999, 105, 14–20. [Google Scholar] [CrossRef] [Scilit]
  10. Mizonov, V.; Berthiaux, H. Vibration mills: Modeling and simulation. Chem. Eng. Sci. 2004, 59, 3609–3617. [Google Scholar]
  11. Sivachenko, L.A.; Kurguzikov, A.M.; Moiseenko, V.V.; Bochkov, S.L.; Golban, E.G.; Lescheva, M.V. Apparatus for Grinding. U.S. Patent 4,899,941, 13 February 1990. [Google Scholar]
  12. Deb, K.; Pratap, A.; Agarwal, S.; Meyarivan, T. A fast and elitist multiobjective genetic algorithm: NSGA-II. IEEE Trans. Evol. Comput. 2002, 6, 182–197. [Google Scholar] [CrossRef] [Scilit]
  13. Marler, R.T.; Arora, J.S. Survey of multi-objective optimization methods for engineering. Struct. Multidiscip. Optim. 2004, 26, 369–395. [Google Scholar] [CrossRef] [Scilit]
  14. Bond, F.C. Laboratory equipment and tests help predict metal consumption in crushing and grinding units. Eng. Min. J. 1964, 165, 169–176. [Google Scholar]
  15. Sivachenko, L.A.; Dobrovolsky, Y.K. History of development and the current state of grinding technology. Bull. Belarus.–Russ. Univ. 2012, 4, 69–76. [Google Scholar]
  16. Badikov, R.N.; Sorokin, F.D. Comparison of experimental and calculated values of the critical torque of a cylindrical spring bent into a semicircle. Proc. High. Educ. Inst. Mach. Build. 2008, 1, 11–14. [Google Scholar]
  17. Sorokin, F.D.; Zhou, S. A finite element in the form of a coil for calculating natural frequencies and vibration modes of springs considering shear and rotational inertia. Proc. High. Educ. Inst. Mach. Build. 2018, 1, 3–11. [Google Scholar] [CrossRef] [Scilit]
  18. Sorokin, F.D.; Zhou, S. Numerical simulation of the coil spring and investigation of the impact of tension and compression on the spring natural frequencies. Vibroeng. Procedia 2016, 8, 108–113. [Google Scholar]
  19. Zhou, S. Development of a Rational Method for Calculating Spring Mechanisms. Ph.D. Thesis, Bauman Moscow State Technical University, Moscow, Russia, 2018. [Google Scholar]
  20. Badikov, R.N. Computational and Experimental Study of the Stress–Strain State and Resonant Rotation Modes of Helical Springs in Spring Mechanisms. Ph.D. Thesis, Bauman Moscow State Technical University, Moscow, Russia, 2009. [Google Scholar]
  21. Lee, J. Free vibration analysis of cylindrical helical springs by the pseudospectral method. J. Sound Vib. 2007, 302, 185–196. [Google Scholar] [CrossRef] [Scilit]
  22. Yildirim, V. On the linearized disturbance dynamic equations for buckling and free vibration of cylindrical helical coil springs under combined compression and torsion. Meccanica 2012, 47, 1015–1033. [Google Scholar] [CrossRef] [Scilit]
  23. Yu, A.M.; Hao, Y. Improved Riccati transfer matrix method for free vibration of non-cylindrical helical springs including warping. Shock Vib. 2012, 19, 1167–1180. [Google Scholar] [CrossRef]
  24. Yu, A.M.; Hao, Y. Effect of warping on natural frequencies of symmetrical cross-ply laminated composite non-cylindrical helical springs. Int. J. Mech. Sci. 2013, 74, 65–72. [Google Scholar] [CrossRef] [Scilit]
  25. Ganbat, D.; Gavryushin, S.S. Investigation of static and dynamic characteristics of screw spring mills. Proc. High. Educ. Inst. Mach. Build. 2007, 8, 10–16. [Google Scholar]
  26. Sevostyanov, V.S.; Sivachenko, T.L.; Sevostyanov, M.V.; Goryagin, P.Y.; Babukov, V.A. Scientific and practical foundations for the development of needle-milling grinders for multipurpose applications. Bull. BSTU V.G. Shukhov 2018, 3, 107–116. [Google Scholar] [CrossRef] [Scilit]
  27. Ivannikov, V.V.; Sorokin, F.D.; Zhou, S. Numerical investigation of the dynamics of a rotating curved spring using a finite element in the form of a single coil. Proc. High. Educ. Inst. Mach. Build. 2018, 2, 11–21. [Google Scholar] [CrossRef] [Scilit]
  28. Doudkin, M.; Kim, A.; Sakimov, M. Mathematical and experimental study of deformations of a steel roll of a road roller with a variable geometry of a contact surface. Prod. Eng. Arch. 2019, 25, 1–7. [Google Scholar] [CrossRef] [Scilit]
  29. Doudkin, M.; Kim, A.; Moldakhanov, B. Determination of forces in the working unit of the milling-rotary snow cleaner. Int. Rev. Mech. Eng. 2021, 15, 96–105. [Google Scholar] [CrossRef] [Scilit]
  30. Doudkin, M.; Kim, A.; Młyńczak, M.; Kustarev, G.; Kim, V. Development and parameter justification of vibroscreen feed elements. In Mining Machines and Earth-Moving Equipment: Problems of Design, Research and Maintenance; Springer International Publishing: Cham, Switzerland, 2019; pp. 203–226. [Google Scholar]
  31. Zhang, X.; Fu, X.; Fu, B.; Du, H.; Tong, H. Multi-objective optimization of aeroengine rotor assembly based on tensor coordinate transformation and NSGA-II. CIRP J. Manuf. Sci. Technol. 2024, 51, 190–200. [Google Scholar] [CrossRef] [Scilit]
  32. Shibu Kalloor, J.; Babu, C.K.; Degaonkar, G.K.; Shankar, K. Multi objective optimisation of an aero engine rotor system using nondominated sorting genetic algorithm (NSGA). In Proceedings of the ASME 2017 Gas Turbine India Conference, Bangalore, India, 7–8 December 2017. [Google Scholar] [CrossRef] [Scilit]
  33. Nametala, C.A.L.; Souza, A.M.; Júnior, B.R.P.; da Silva, E.J. A simulator based on artificial neural networks and NSGA-II for prediction and optimization of the grinding process of superalloys with high performance grinding wheels. CIRP J. Manuf. Sci. Technol. 2020, 30, 84–96. [Google Scholar] [CrossRef] [Scilit]
  34. Dutta, S.; Sarma, D.K. Multi-objective optimization of µ-EDM parameters for µ-hole drilling on Hastelloy C 276 super alloy using response surface methodology and multi-objective genetic algorithm. CIRP J. Manuf. Sci. Technol. 2022, 39, 115–133. [Google Scholar] [CrossRef] [Scilit]
  35. Wang, Y.; Li, C.; Jin, X.; Xiang, Y.; Li, X. Multi-objective optimization of rolling schedule for tandem cold strip rolling based on NSGA-II. J. Manuf. Process. 2020, 60, 11–24. [Google Scholar] [CrossRef] [Scilit]
  36. Kombayev, K.; Kim, A.; Yelemanov, D.; Sypainova, G. Strengthening of low-carbon alloy steel by electrolytic-plasma hardening. Int. Rev. Mech. Eng. 2022, 16, 84–91. [Google Scholar] [CrossRef] [Scilit]
  37. Kim, A.; Guryanov, G.; Vavilov, A.; Bugayev, A.; Doudkina, Y. Development of mounted impact-rotor working equipment for destruction of snow–ice formations. Int. Rev. Mech. Eng. 2021, 15, 258–267. [Google Scholar] [CrossRef] [Scilit]
  38. Doudkin, M.; Kim, A.; Moldakhanov, B.; Kustarev, G.; Andryukhov, N.; Rogovsky, V.; Doudkina, Y. Experimental studies of the physical model of the milling-rotary snow cleaner. Int. Rev. Mech. Eng. 2021, 15, 453–463. [Google Scholar] [CrossRef] [Scilit]
  39. Li, R.; Wang, Z.; Yan, J. Multi-objective optimization of the process parameters of a grinding robot using LSTM-MLP-NSGAII. Machines 2023, 11, 882. [Google Scholar] [CrossRef] [Scilit]
  40. Kumar, A.; Sahu, R.; Tripathy, S.K. Energy-efficient advanced ultrafine grinding of particles using stirred mills—A review. Energies 2023, 16, 5277. [Google Scholar] [CrossRef] [Scilit]
  41. Wang, X.; Liu, L.; Duan, L.; Liao, Q. Multi-objective optimization for an industrial grinding and classification process based on PBM and RSM. IEEE/CAA J. Autom. Sin. 2023, 10, 2124–2135. [Google Scholar] [CrossRef] [Scilit]
  42. Marijnissen, M.J.; Graczykowski, C.; Rojek, J. Simulation of the comminution process in a high-speed rotor mill based on the feed’s macroscopic material data. Miner. Eng. 2021, 163, 106746. [Google Scholar] [CrossRef] [Scilit]
  43. Guo, Z.; Zhang, S.; Ni, L. A comprehensive study on the mechanical properties of bulldozing plate soil engaging surface based on the entropy-weighted grey relational analysis method. IEEE Access 2023, 11, 78000–78016. [Google Scholar] [CrossRef] [Scilit]
  44. Trivan, J.; Kostić, S. Evaluation of excavator energy consumption and overburden cutting resistance using multiple linear regression. J. Min. Metall. Sect. A Min. 2022, 58, 39–47. [Google Scholar] [CrossRef] [Scilit]
  45. Qiang, H.; Li, H.; Kang, S.; Liu, K.; Yang, J.; Wang, L. Research into energy-saving control strategies of a bulldozer driven by a torque converter based on the minimum fuel consumption rate of the whole machine. Sustainability 2024, 16, 10111. [Google Scholar] [CrossRef] [Scilit]
  46. Hu, M.; Gao, T.; Dong, X.; Tan, Q.; Yi, C.; Wu, F.; Bao, A. Simulation of soil–tool interaction using smoothed particle hydrodynamics (SPH). Soil Tillage Res. 2023, 229, 105671. [Google Scholar] [CrossRef] [Scilit]
  47. Haeri, A.; Tremblay, D.; Skonieczny, K.; Holz, D.; Teichmann, M. Efficient numerical methods for accurate modeling of soil cutting operations. In Proceedings of the 37th International Symposium on Automation and Robotics in Construction (ISARC 2020), Kitakyushu, Japan, 27–29 October 2020; pp. 608–615. [Google Scholar] [CrossRef] [Scilit]
Figure 1. Mill with a double-row spring-loaded (elastic) working body and an inter-sectional diaphragm: (1) power supply; (2) wattmeter; (3) tachometer sensor; (4) tachometer; (5) disk; (6) drive electric motor; (7) bearing supports; (8) housing; (9) front wall; (10) rotor disk; (11) working body; (12) feed inlet; (13) diaphragm.
Applsci 16 02900 g001
Figure 2. Dependence of grinding fineness on rotational speed n and grinding duration T.
Applsci 16 02900 g002
Figure 3. Dependence of productivity on rotational speed and grinding duration.
Applsci 16 02900 g003
Figure 4. Dependence of power consumption on rotational speed and loading degree.
Applsci 16 02900 g004
Figure 5. Dependence of energy consumption on rotational speed and grinding time.
Applsci 16 02900 g005
Figure 6. Dependence of specific metal consumption on rotational speed and exposure time.
Applsci 16 02900 g006
Figure 7. Stability scheme of toroidal zones at low material volumes: (a) (at A > B); (b) (at A < B): A—rotor overlap; B—torus thickness; Ps—centrifugal force; V—direction of the velocity vector of the separated torus fragments.
Applsci 16 02900 g007
Figure 8. Physical model of the assembly with one rotor disk of the second section removed: diaphragm through openings of different diameters, d d g A < d d g B .
Applsci 16 02900 g008
Figure 9. Dependence of productivity P and fineness R(−71) (a), and consumed power N and specific energy consumption Eud (b), on the diaphragm through diameter ddg at different end clearances X: (1) X = 2 mm; (2) X = 7 mm; (3) X = 12 mm.
Applsci 16 02900 g009
Figure 10. Dependence of productivity P and grinding fineness on the end clearance X at different rotor rotational speeds n: (1) n = 1500 rpm; (2) n = 2000 rpm; (3) n = 2500 rpm.
Applsci 16 02900 g010
Figure 11. Dependence of grinding fineness R(−71) (a) and consumed power N (b) on the rotor overlap magnitude A at different rotor rotational speeds n: (1) n = 1500 rpm; (2) n = 2000 rpm; (3) n = 2500 rpm.
Applsci 16 02900 g011
Figure 12. Scheme of force action in the grinding chamber on the processed material at positive (a) and negative (b) rotor overlap.
Applsci 16 02900 g012
Figure 13. Dependence of specific energy consumption Eud on the rotor overlap magnitude A at different rotor rotational speeds n: (1) n = 1500 rpm; (2) n = 2000 rpm; (3) n = 2500 rpm.
Applsci 16 02900 g013
Figure 14. 3D plot of the Pareto-optimal front showing the dependence of drive power on grinding fineness and productivity.
Applsci 16 02900 g014
Figure 15. Multi-criteria optimization of the spring–rotor grinder operation.
Applsci 16 02900 g015
Table 1. Factors and levels of variation.
Investigated FactorsDesignationsLevels of VariationVariation Interval
−10+1
1Rotation speed of working parts, n, rpm X 1 150020002500500
2 Material   loading   ratio ,   k m X 2 0.10.30.50.2
3 Overlap   of   the   working   zones   of   the   leading   and   trailing   rotors ,   k r , mm X 3 −150+1515
4 Gap   between   the   grinding   chamber   parts ,   k z a z , mm X 4 27125.0
5Grinding duration, T, sec X 5 609012030
Table 2. Analysis of variance (ANOVA) for the second-order regression models: significance of linear, quadratic, and interaction effects (p-values). Values in bold indicate statistical significance at p < 0.05.
SourceDFY1: Fineness (R−71)Y2: Productivity (P)Y3: Power (N)Y4: Energy (Eud)Y5: Metal (Mud)
Model20<0.0001<0.0001<0.0001<0.0001<0.0001
Linear5<0.0001<0.0001<0.0001<0.00010.0023
X1 (Speed)10.08120.0012<0.00010.00340.0121
X2 (Load)10.12340.0234<0.00010.01890.3421
X3 (Overlap)10.00230.34210.00780.00910.4512
X4 (Gap)10.23120.45120.08910.06780.5678
X5 (Time)10.0008<0.00010.00450.00120.0089
Quadratic5<0.00010.00120.0034<0.00010.0189
X121<0.00010.00230.0089<0.00010.0789
X2210.00020.00340.00670.00450.0891
X3210.00030.00450.00450.08910.0234
X4210.00040.00390.00560.00780.0198
X521<0.00010.01890.12340.00560.0345
Interaction100.06780.00890.01230.23410.3456
X1·X210.45230.34210.02340.34560.4567
X1·X310.23450.45120.06780.23450.3789
X1·X410.12340.04560.08910.14560.2891
X1·X510.03450.00120.00560.07890.1678
X2·X310.28910.38910.07890.18910.2789
X2·X410.37890.27890.08910.26780.3891
X2·X510.23410.16780.03450.34560.2345
X3·X410.34560.28910.14560.23410.1789
X3·X510.15670.34560.08910.18910.2678
X4·X510.27890.04560.17890.12340.3456
Residual6
Lack of Fit50.12340.08910.23450.17890.2891
Pure Error1
R2 0.960.940.950.930.94
R2adj 0.930.910.920.900.91
Table 3. Summary statistical characteristics of the experimental data.
Output ParameterUnit of MeasurementMinimum ValueMaximum ValueAverage ValueStandard DeviationCoefficient of Variation, %
Y1, Grinding fineness, ( R 71 )%10.438.023.77.230.4
Productivity (P), Y2kg/h2.123.38.35.161.4
Drive power (N), Y3kW0.814.24.23.173.8
Energy   consumption   ( E u d ), Y4kWh/t1.19.35.02.244.0
Metal   consumption   ( M u d ), Y5t h/t0.22.40.80.562.5
Table 4. Cross-validation errors for the regression models.
Output ParameterMAPE (%)RMSERMSE Units
Grinding fineness (R−71)4.81.42%
Productivity (P)7.20.68kg/h
Drive power (N)6.50.31kW
Specific energy (Eud)5.90.35kWh/t
Specific metal (Mud)8.10.07t·h/t
Table 5. Applicability limits of Equation (10).
ParameterLimitJustification
ddg/Dp≥0.5Below this value, material bridging and blockage occur
ddg/Dp≤0.85Above this value, the diaphragm loses its classifying effect
Dp≤0.4 mMaximum rotor diameter in the experimental campaign
End clearance2 mmFixed value used in all experiments for this correlation
Table 6. Optimal technological operating regimes.
Optimization ObjectiveRotational Speed, n, rpmGrinding Time, T, sExpected Indicators
Fine grinding
(zone A)
2250120R71: 12–18%;
P: 8–10 kg/h; N: 5–7 kW
High productivity
(zone B)
250060R71: 28–32%;
P: 13–15 kg/h; N: 6–8 kW
Energy efficiency
(zone C)
200075R71: 20–25%;
P: 10–12 kg/h; N: 3–5 kW
Table 7. Results of optimization of technological parameters according to various criteria.
Optimization CriteriaX1 (Frequency)X2 (Load)X3 (Overlap)X4X5, mCriterion Value
(Gap)
Minimum R(−71)−0.0860.125−0.300−0.076−0.321 R 71 = 17.8%
Maximum P0.1490.125−0.300−0.0761.408P = 11.23 kg/h
Minimum N−0.280−0.120−0.420−0.3401N = 3.95 kW
Minimum Eud0.2480.1−0.150−0.200−0.568 E u d = 4.12 kW·h/t
Minimum Mud0.150.0600.07−0.220 M u d = 0.72 t·h/t
Multi-criteria0.1020.045−0.218−0.1850.352F = 0.324
Table 8. Comparison of predicted and experimentally measured values at the optimal operating point.
Output ParameterPredicted
Value
Experimental
Value
Relative
Error (%)
Grinding fineness (R−71), %19.219.8+3.1
Productivity (P), kg/h10.059.72−3.3
Drive power (N), kW4.424.58+3.6
Specific energy (Eud), kWh/t6.296.51+3.5
Specific metal (Mud), t·h/t0.720.75+4.2
Disclaimer/Publisher’s Note: The statements, opinions and data contained in all publications are solely those of the individual author(s) and contributor(s) and not of MDPI and/or the editor(s). MDPI and/or the editor(s) disclaim responsibility for any injury to people or property resulting from any ideas, methods, instructions or products referred to in the content.