


Abstract
The present study deals with the problem of irregular temperature distribution, simultaneous under-firing and over-firing, and their resultant efficiency and quality problems in a mechanical lime vertical kiln powered by domestic waste flue gas. The numerical simulation and structure optimization were carried out based on a 150 kg/h pilot-scale kiln. This combined model was built on the ANSYS Fluent 2022 R1 platform with UDF and UDS, incorporating limestone decomposition kinetics to enable the solution of gas and solid energy equations separately, and simulation of complex transfer and reaction processes. To correct the separation of flows at one inlet, a symmetric four-direction (00, 900, 1800, 2700) air intake plan was suggested. The findings show that this design essentially transforms the internal flow field into uniform and symmetrical temperature and concentration distributions. The calcination region contained both gas and solid temperatures in the optimum range to produce active lime. Specifically, the optimized kiln achieved a temperature range of 1190–1450 K in the calcination zone, a decomposition rate of approximately 82.7% (compared to 5.3% in the original model), and an increase in effective CaO content from 81.7% to 87.7%, with validation errors below 15%. It was demonstrated that the model is reliable, since the outlet simulated values correlated well with the measured ones. The preheating, calcining, and cooling zones’ heights of the optimized kiln adhered to the design requirements. This research is innovative in its application of a multi-physics coupling model with a varying heat source in a kiln and, in turn, identifies the synergism improvement process in the flow, temperature, concentration, and reaction fields.
1. Introduction
Within the lime industry, natural limestone mined in the quarries is crushed into pieces of around several centimeters in size. In calcination, the main constituent of limestone is calcium carbonate, which separates off at high temperatures into calcium oxide and CO2 [1,2]. Quicklime is an excellent agent in the removal of acidic pollutants by effective purification of harmful substances in the incineration flue gas. Continual evolution has occurred in the structure and design of lime kilns, the major equipment in the manufacture of quicklime, in response to changing national energy policies and environmental regulations. Stabilization of lime production to be used in gas purification during flue gas requires basically precise regulation of the calcination temperature as a key variable in determining the reactivity of the end-product [3]. Considering the prohibitive costs of physical experimentation and the long time frame associated with conventional empirical control techniques, numerical simulation becomes particularly useful as a means of investigating and optimizing this phenomenon [4]. Most of the current research on simulation is limited to conventional fuels having fixed compositions, like natural gas or pulverized coal [5,6]. However, simulations dealing with calcination processes when using thermal flue gases of household waste, which is a heat source with complex composition and varying calorific value, are remarkably thin. Therefore, the mechanism of action of its combustion properties and temperature distributions on the capacity of cleansing of the created lime is yet unknown. There is a void in the research within this context in opposition to the general literature on lime kiln production processes, in which researchers have made contributions by conducting different numerical simulation studies.
Krause et al. [7] used the three-dimensional discrete element method (DEM) and computational fluid dynamics (CFD) coupling technique to simulate a vertical lime shaft kiln. In their model, they modeled not only the gas-flow, combustion, and heat transfer at the kiln-system scale, but they also modeled the movement of individual limestone particles using DEM, as well as intra-particle heat transfer, CO2 diffusion, convection, and calcination reactions. Zhou et al. [8] developed a three-dimensional transient multi-phase multi-component CFD model of an industrial-sized pulverized-coal parallel flow regenerative (PFR) Kiln, which could simulate a full calcination–regeneration sequence. The mesh and time-step independence analysis, iterative initialization, and comparison of the industrial measurement data were used to test the reliability of the model. The simulation results obtained by Arévalo et al. [9] were validated with the measurement data of an industrial unit when the first successful co-firing of biomass and coke with up to 65 percent co-firing was demonstrated in a parallel flow regenerative (PFR) lime shaft kiln. Moreover, Mohammadpour et al. [10] examined the radial transfer of fuel across the bed layer and flame length of a PFR kiln, considering a porous media model. The validity of the model was confirmed using experimental data, and it was noted that the number and location of burners have great significance on the uniformity of cross-sectional temperatures. The research by Camargos et al. [11] showed that the energy efficiency of calcining could be further enhanced through the recovery of heat loss in flue gas, the reduction of heat losses, and the optimization of the operational variables, offering the most important performance references of how biomass fuels can be alternately applied in lime kilns.
Concerning the calcination process within vertical lime kilns, the simulation study by Kang et al. [12] revealed that the calcination temperature throughout the kiln was uneven and generally lower than required, with further limestone decomposition taking place closer to the wall area because of the wall’s effect. This variation in temperature over space and reaction directly determines the rate of calcination reaction and the behavior of CO2 generation and release. Ryan et al. [13] developed a two-dimensional axisymmetric CFD model and validated it using industrial data to study calcination in a rotary lime kiln. This is one of the effective models to determine the effect of operational parameters on the location and size of the calcination reaction zone, and therefore, it can serve as a reference in controlling the calcination process and CO2 release behavior. In regard to the calcination process in cement rotary kilns, Fatahi et al. [14] built an interpretable artificial intelligence model to forecast and optimize kiln operating variables with the purpose of digitally supporting the reduction of calcination energy usage and concomitant CO2 emissions. The research conducted by Benchekroun et al. [15] utilized a machine learning model to predict critical operational parameters. The effective optimization of the calcination process can lead to a significant decrease in power consumption and its CO2 emissions, thus presenting information-based solutions to the problem of the low-carbon operation of industrial kilns. The article by Su et al. [16] stated that utilizing high-concentration CO2 at the end of the kiln as fertilizer gas in an agriculture facility can effectively connect the reduction of industrial emissions to the growth of agricultural development. The article by Bojanovsky et al. [17] mentioned that lime kilns also function as intersecting units of both process and energy systems, which has now expanded into other fields, including the treatment of biomass and waste to energy. The integrated method of process and energy integration proposed by the review gives a systemic viewpoint of how better calcination processes and the reduction of carbon emissions could be achieved.
The cited works by researchers mainly deal with shaft kilns and rotary kilns without carrying out any structured analysis of the mechanical lime shaft kiln that is widely used. The present paper uses a 150 kg/h pilot-scale mechanical lime vertical kiln as the research object. A comparative analysis of fuel, CO2, and O2 mass fractions distribution and temperature distributions was performed by comparing the state of the system before and after the implementation of the local non-thermal equilibrium model and the limestone chemical reaction model coded through user-defined functions (UDF) and user-defined scalar equations (UDS); this confirmed the rationality of the modeling. It will serve as a database of optimization analysis of the lime vertical kiln when using hot flue gas as a heat source, and as some guidance for further scale-up construction of larger kilns.
2. Materials and Methods
2.1. Assumptions
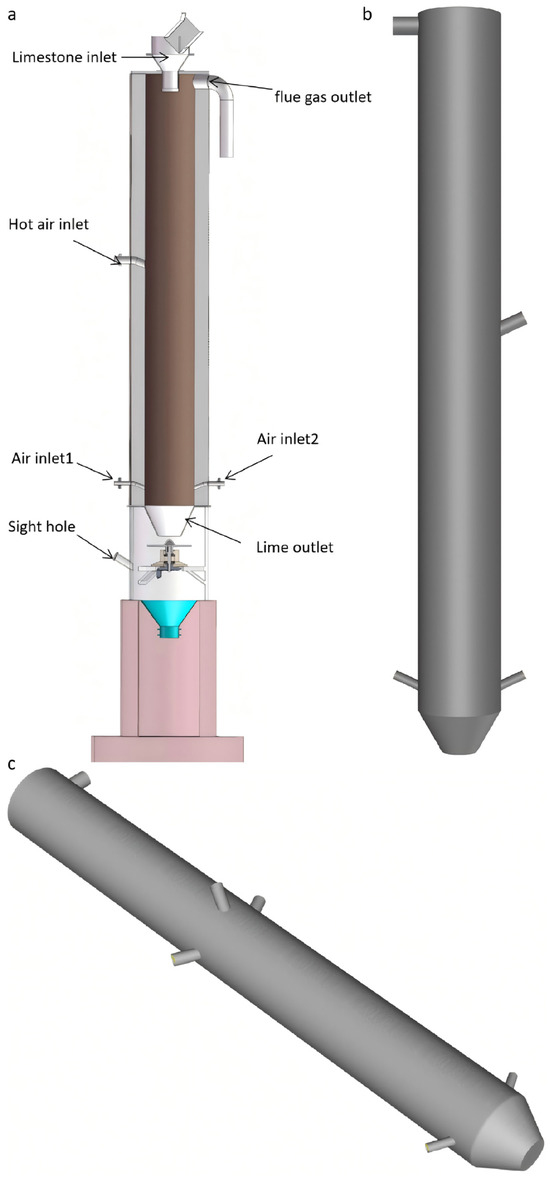
The subject of this study is a pilot-scale mechanical vertical lime kiln with a processing capacity of 150 kg/h; its structure is shown in Figure 1. This kiln adopts a continuous feeding and discharging method, where limestone particles are added from the top of the kiln and pass sequentially through the preheating zone, calcination zone, and cooling zone under gravity, finally being discharged from the bottom. The kiln body is a cylindrical steel structure lined with refractory materials, with a total height of 6.5 m and a cross-sectional area of approximately 4.13 m2. The heat source is high-temperature flue gas (design temperature 1573 K) generated from the secondary combustion chamber of domestic waste, introduced from one side of the kiln wall; cooling air is symmetrically introduced from both sides at the bottom of the kiln to cool the lime product and preheat the combustion air. To minimize the complexity and amount of grid discretization in numerical calculation, there should be a simplification in the geometric modeling and in the physical conditions: The computational domain will keep just the kiln body system core and discard any support equipment; The hot air inlet has been reduced to a uniform outlet edge with hot air being fully developed and evenly spread at the entrance and the real angle of incoming air is discarded; it is assumed that the direction of the entering hot air is normal to the axis of the kiln. Simultaneously, to concentrate on the thermal process within the kiln, the wall thickness of the kiln and its heat loss to the environment are neglected, and the kiln wall is considered to be in an adiabatic boundary condition. The simplification of the packed limestone bed as a porous medium is widely adopted in industrial-scale reactor simulations to reduce computational complexity while preserving the essential flow and heat transfer characteristics. This approach has been successfully applied in various packed-bed reactor studies [18,19]. Furthermore, the adiabatic wall assumption, which neglects heat losses through the kiln lining, is commonly employed when the primary focus is on internal thermal processes rather than overall energy balance [13].
Figure 1.
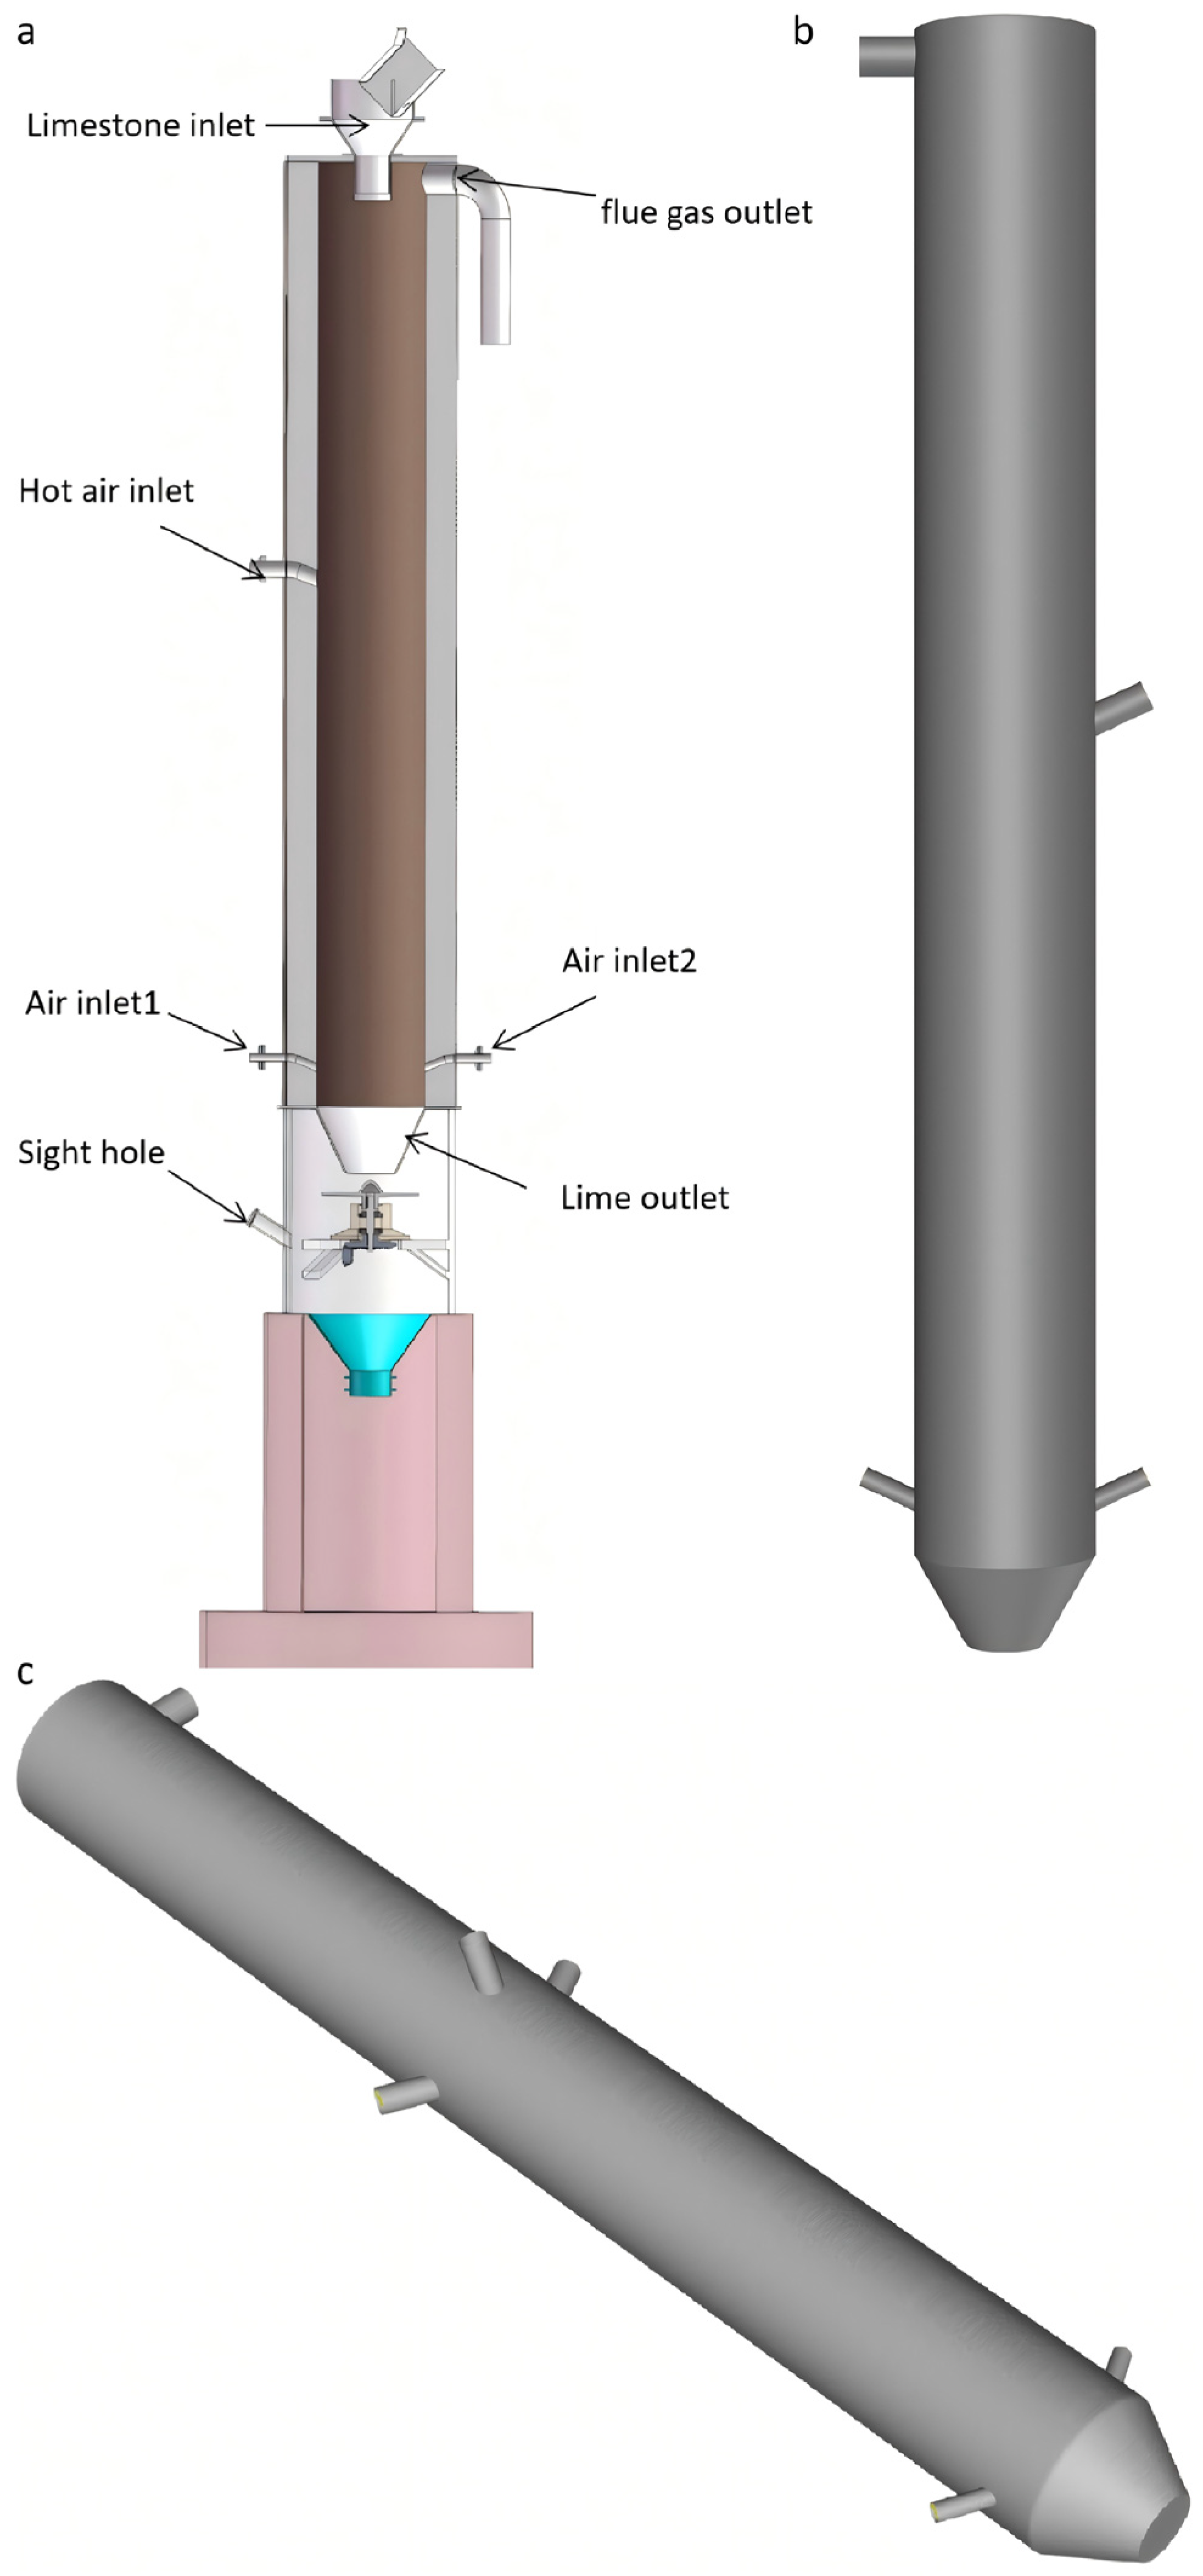
Schematic diagrams of the mechanical limestone shaft kiln models: (a) structural diagram of the mechanical limestone shaft kiln; (b) schematic diagram of the basic model; (c) schematic diagram of the improved model.
To experimentally validate the numerical simulation results, systematic tests were conducted on a pilot-scale kiln with a processing capacity of 150 kg/h of limestone. Key process parameters of the experimental setup were monitored in real-time using K-type thermocouples. Specifically, three thermocouples were embedded at different heights along the axial direction of the kiln to obtain the temperature distribution in the calcination zone, preheating zone, and cooling zone. All temperature probes were connected to a paperless recorder for continuous data acquisition. Simultaneously, a portable flue gas analyzer was installed at the kiln outlet to monitor the concentrations of O2, CO2, and CO in the exhaust gas online, thereby assisting in evaluating the combustion state and ventilation performance inside the kiln.
2.2. Structural Parameters
The ANSYS ICEM CFD 2022 R1 software served as a tool to create such a mesh of the lime kiln model. The schematic diagram of the lime kiln is shown in Figure 1a, while the overall and local meshing are illustrated in Figure 1b,c, respectively. Due to the symmetrical structure of the lime kiln, only half of the model was meshed and simulated to reduce computation time. An unstructured mesh was adopted, with local refinement applied to key regions, such as the hot air inlet, cooling air inlet, and the core reaction zone, to improve calculation accuracy. A schematic diagram of the mesh is shown in Figure 1c.
To evaluate the influence of mesh density on the simulation results and to ensure the numerical solution is grid-independent, a grid independence verification study was conducted. Four sets of meshes with different densities (coarse, medium, fine, and very fine) were selected for steady-state simulations under identical boundary conditions and solver settings. The average kiln gas outlet temperature (Tout) and the maximum static pressure difference inside the kiln (ΔPmax) were monitored as key parameters, as they are sensitive to the flow field and heat transfer processes. The verification results are presented in Table 1.
Table 1.
Results of the Grid Independence Test.
As can be seen from Table 1, the variation in the monitored parameters gradually decreases with increasing mesh density. Compared to the medium mesh, the fine mesh shows a change of only 0.13% in the average outlet temperature and 0.74% in the maximum pressure difference. Furthermore, the very fine mesh exhibits even smaller changes relative to the fine mesh, with rates of 0.03% and 0.22%, respectively, indicating that the calculation results have converged. Considering both calculation accuracy and computational resource consumption, the fine mesh was ultimately selected for subsequent simulations. This mesh consists of 1,756,373 nodes, 2,153,474 faces, and 3,204,090 elements, with calculation errors within the acceptable range.
Table 2 shows its key design parameters. Figure 1a represents the simplified proportional model created with Solid-Works. Figure 1b is the mechanical lime vertical kiln model, and Figure 1c is the improved mechanical lime vertical kiln model.
Table 2.
Design Parameters of the Mechanical Lime Shaft Kiln.
3. Mathematical Model
3.1. Basic Assumptions
The mechanical operation of limestone calcination with hot flue gas being used as a heat source in a mechanical lime vertical kiln is a multi-stage physicochemical process. It is extremely challenging to perform a numerical simulation analysis that will fully correspond to reality. Hence, on the basis of not substantially changing the research outcome, the following simplifying assumptions are taken into consideration in the computational model. Since the vertical kiln has continuous and uniform behaviors at a steady state, the model is chosen to be a steady-state model. The piled limestone particle bed in the kiln is viewed as a porous isotropic medium having the same porosity. The flow of hot flue gas as a heat source is mostly in the direction of the kiln axis, and it is approximated as a vertical inlet velocity boundary condition neglecting possible local vortices and radial velocity component. This study focuses on the thermal effect of the high-temperature flue gas on limestone calcination. According to relevant municipal solid waste treatment standards, acidic and other harmful components in the flue gas are removed prior to entry, and their residual concentrations are extremely low; therefore, chemical reactions between the flue gas components and the limestone beyond the thermal input are considered negligible in this model. The thickness of the kiln wall and heat losses to the environment are neglected and the walls of the kiln are considered to be in an adiabatic boundary condition. The shape of the limestone particles is simplified into spheres and the size of the limestone particles does not change during calcination. The macroscopic kinetics model is taken as the limestone decomposition reaction. The porous media approach for packed beds has been extensively validated in CFD simulations of gas–solid reacting flows [18,19,20]. The assumption of isotropic porosity and the use of the Ergun equation for momentum loss are standard practices in modeling industrial-scale packed-bed reactors [20,21]. The local non-thermal equilibrium model, which solves separate energy equations for fluid and solid phases, is particularly important when significant temperature gradients exist between the gas and solid phases, such as in strongly endothermic calcination processes [22,23].
3.2. Model Establishment
For low-permeability particle beds and industrial-size shaft furnaces, it is computationally impractical to calculate the local flow region surrounding each particle [18]. Simulations of large-scale industrial reactors can be made feasible by assuming that the packed bed of particles is a continuous porous medium [19,22]. ANSYS Fluent uses the local non-thermal equilibrium porous media model discussed in this study. The basis of this model is to solve the energy equations of the fluid phase and the solid phase individually and thus to account for the possible significant temperature difference between them, which is essential in the limestone calcination process. Based on the mechanism of the lime kiln reaction, the heat flow between a limestone particle and the flue gas occurs mainly through convection between the two at a high temperature gradient. Thus, the use of the local non-thermal equilibrium model is justified and sensible.
3.3. Governing Equations
Based on the reaction mechanism of the lime kiln, the primary heat transfer mode between the limestone particles and flue gas in the kiln is convective heat transfer, and a temperature gradient is present between them. The local non-thermal equilibrium model has been used in analysis and computation. The control equations in the computational model are outlined in [19,22,24,25].
3.3.1. Continuity Equation
The mass conservation of the gas phase is described in Equation (1). Taking the occupied volume of the particle bed as a porous medium, porosity γ is introduced.
where γ is the porosity, is the fluid density, and v is the velocity vector.
3.3.2. Momentum Conservation Equation
Equation (2) describes momentum conservation in the gas phase. The resistance of the solid particle bed to the gas flow is modeled by a source term that is computed based on the classic Ergun equation [19,26]. It can be used in packed beds and has a viscous and inertial term.
Here, p represents pressure, is the viscous-stress tensor, and is the gravitational acceleration vector.
Si is the momentum source term that represents the porous media resistance. It has an opposing direction to the flow velocity, and its intensity is given by the Ergun equation [21]. The relationship between the pressure drop gradient, superficial velocity, bed porosity, and particle diameter is given by Equation (3), as follows:
Here, L is the characteristic length in the direction of flow and is the average particle diameter. On the right-hand side, the first term is the viscous loss term, which takes over at low Reynolds numbers, and the second is the inertial loss term, which dominates at high Reynolds numbers [27].
This resistance in ANSYS ICEM CFD 2022 R1 software is usually incorporated into the momentum equation in the form of a source term, Si, of the form.
Comparing Equations (3) and (4) yield the permeability and inertial resistance coefficient relevant to the Ergun [20] equation as follows:
3.3.3. Fluid Energy Equation
Equation (7) explains the energy saving of the gas phase. The equation takes into consideration convection, effective conduction, as well as convective heat transfer with the solid particles [23,28].
Here, is the fluid temperature, is the effective thermal conductivity of the fluid, is the specific surface area, is the gas–solid convective heat transfer coefficient, and is the internal heat source in the gas phase.
3.3.4. Solid Energy Equation
Equation (8) describes the energy conservation of a solid-state system. The equation takes into consideration effective solid conduction, convective heat transfer with the gas phase, and the endothermic source term due to the decomposition reaction of the limestone [29].
Here, is the solid temperature, is the effective thermal conductivity of the solid, and and are the solid density and specific heat capacity, respectively.
3.3.5. Gas–Solid Convective Heat Transfer Coefficient and Specific Surface Area
The convection heat exchange coefficient of the gaseous solid substance is determined by applying the Ranz–Marshall empirical correlation applicable to spherical bodies [30].
Specific surface area, defined as the gas–solid heat transfer area per unit volume, depends on the particle diameter and porosity, as follows:
3.3.6. Limestone Decomposition Reaction Kinetic Model
The main reaction is the calcination decomposition of limestone (CaCO3).
The local solid temperature and CO2 concentration govern the spatial distribution of the calcium carbonate decomposition rate within the particles. The local CaCO3 mass consumption rate is formulated as follows [31]:
where is the reaction interface area, is the molar mass of calcium carbonate, is the reaction rate constant, is the local CO2 concentration, and is the CO2 equilibrium concentration at the current temperature.
3.3.7. Reaction Rate Constant and Temperature Correction Factor
The chemical rate constant is derived using Vonderbank et al. [30] and corrected by a factor of the temperature as follows:
The temperature correction factor can be fitted using the experimental data of Chugtai and Michelfelder as follows [32]:
3.3.8. CO2 Equilibrium Concentration and Equilibrium Pressure
The cause of the reaction is the local concentration difference between the CO2 concentration of the pores of the porous stone and the equilibrium concentration. In the case where the CO2 concentration is greater than the equilibrium concentration, Equation (11) is reversed to form CaCO3. The equilibrium concentration is then obtained through Equation (15), which is strongly associated with the local solid temperature.
The CO2 equilibrium pressure is determined using the empirical equation suggested by Hills [33]:
3.3.9. Mass and Energy Source Terms
The CO2 mass source term released from limestone decomposition is calculated as follows:
The reaction endothermic source term (as applied to the solid energy equation) is based on the following calculation:
where the reaction enthalpy change is a function of temperature, which can be obtained through integration of the heat capacity difference between reactants and products as follows:
3.4. Model Implementation
To achieve the stated multi-physics field-coupling model, this paper has performed the detailed development through ANSYS Fluent 2022 R1 software platform with the aid of its user-defined functions.
The first step is to assemble and resolve the solid energy equation of the limestone particles (Equation (8)) with the help of user-defined scalar equations (UDS). At the same time, the most important parameters and source terms of this equation were dynamically calculated through the user-defined functions (UDF), such as the gas–solid convective heat transfer coefficient (Equation (9)), the effective thermal conductivity of the solid , and, most crucially, the endothermic source term due to the limestone decomposition reaction (Equation (18)).
Thus, the chemical reaction rate (Equation (13)) of limestone decomposition and the resulting CO2 mass source term (Equation (17)) were compiled once more using UDF, and it was combined with the gas-phase species transport equation.
In conjunction with this coupling of UDS and UDF, it has been possible to achieve a fully integrated formulation of the local non-thermal equilibrium porous media model and the fine-scale model of the limestone decomposition chemistry with its reaction kinetics so that the temperature field, component field, and progress of the chemical reaction of the gas–solid two-phase may be simulated accurately within the kiln. The concluding control equations of the computational model include the continuity of Equation (1), the momentum of Equation (2), the fluid energy of Equation (7), the solid energy of Equation (8), and the CO2 species transport equation.
Table 3, Table 4 and Table 5 contain the parameters defining the porous media zone, the turbulence model parameters, and material physical properties, respectively.
Table 3.
Parameter Configuration for the Porous Media Domain [6,22].
Table 4.
Parameters Settings of the Turbulence Model [6,22].
Table 5.
Material Physical Properties Parameters [6,22].
3.5. Boundary Conditions
At 1573.15 K, hot air was chosen as the hot air inlet of the mechanical lime vertical kiln, representing the high-temperature flue gas from the secondary combustion chamber of domestic waste [2,16]. The remaining models and inlet/outlet boundary conditions were established based on the real operating process [13]. The realizable k-ε model of turbulent flow was selected [22], and the kiln wall was made adiabatic to focus on internal thermal processes [13,18]. The fuel flow rate, combustion air flow rate, and cooling air flow rate needed to produce with this kiln type were derived using the kiln design thermal calculations [20,24]. In Table 6, the detailed boundary condition setting is indicated for each inlet/outlet.
Table 6.
Inlet and Outlet Boundary Conditions.
The simulator has used a pressure-based segregated solution. The SIMPLE algorithm was used to perform the pressure–velocity coupling operation, whereas the distance-based Rhie–Chow procedure was used in flux interpolation to eliminate the possibility of pressure oscillations. To discretize space, the pressure was implemented with the second-order scheme, whereas the momentum, energy, turbulence parameters, species, and user-defined scalars were discretized with the second-order upwind scheme to enhance the accuracy of the computation. The least squares approach was used to estimate the gradient terms. The discretization of the time was performed with the use of the first-order implicit form, which is always stable and can be applied to transient simulations; however, it is only the first order in time. The convergence criteria were residuals less than 10−6 and key outlet properties (i.e., temperature, mass flow rate) varying by no more than 0.1 percent. Each steady-state simulation case required approximately 8–10 h of computational time on a workstation equipped with 32 cores (Intel Xeon Gold 6248R)
4. Discussion
Considering the developed models in physics and mathematics, the calculations by means of numerical simulation were performed on both the initial model with one hot air inlet and the modified model with four-directional hot air inlets. By comparing their temperature fields and the fields of concentration of important components, the usefulness of the improved model in terms of the optimization of calcination uniformity and improvement of performance of products was confirmed.
4.1. Original Model Numerical Simulation Results and Analysis
In order to assess the performance bottlenecks of the original design, the initial simulation analysis was made using the original model with one hot air inlet. The study object was chosen as the mid-longitudinal cross-section of the kiln body (the Z = 0 plane), and its results are as shown.
4.1.1. Temperature Field Distribution
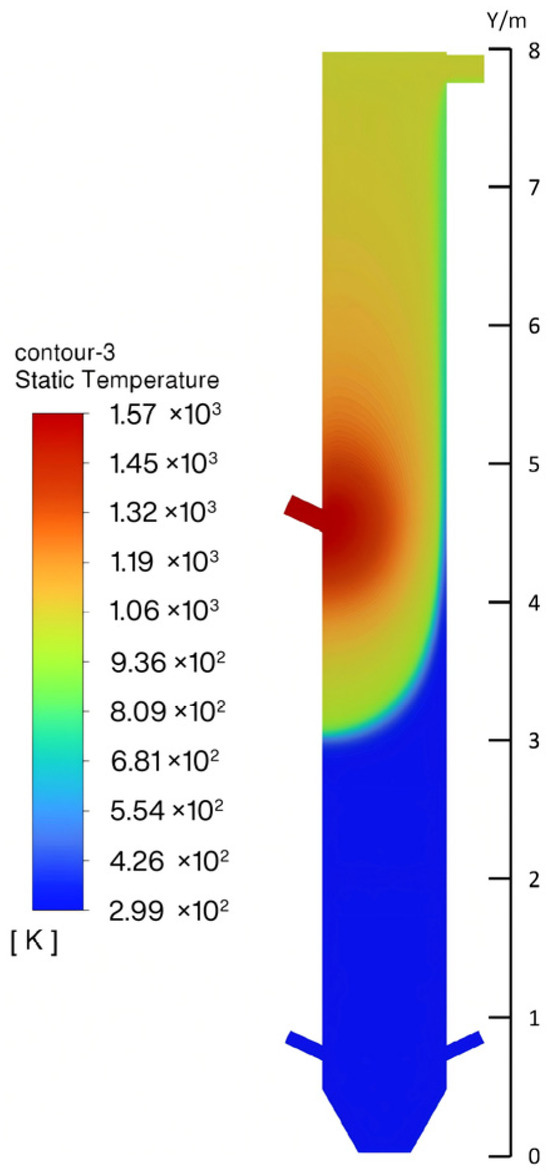
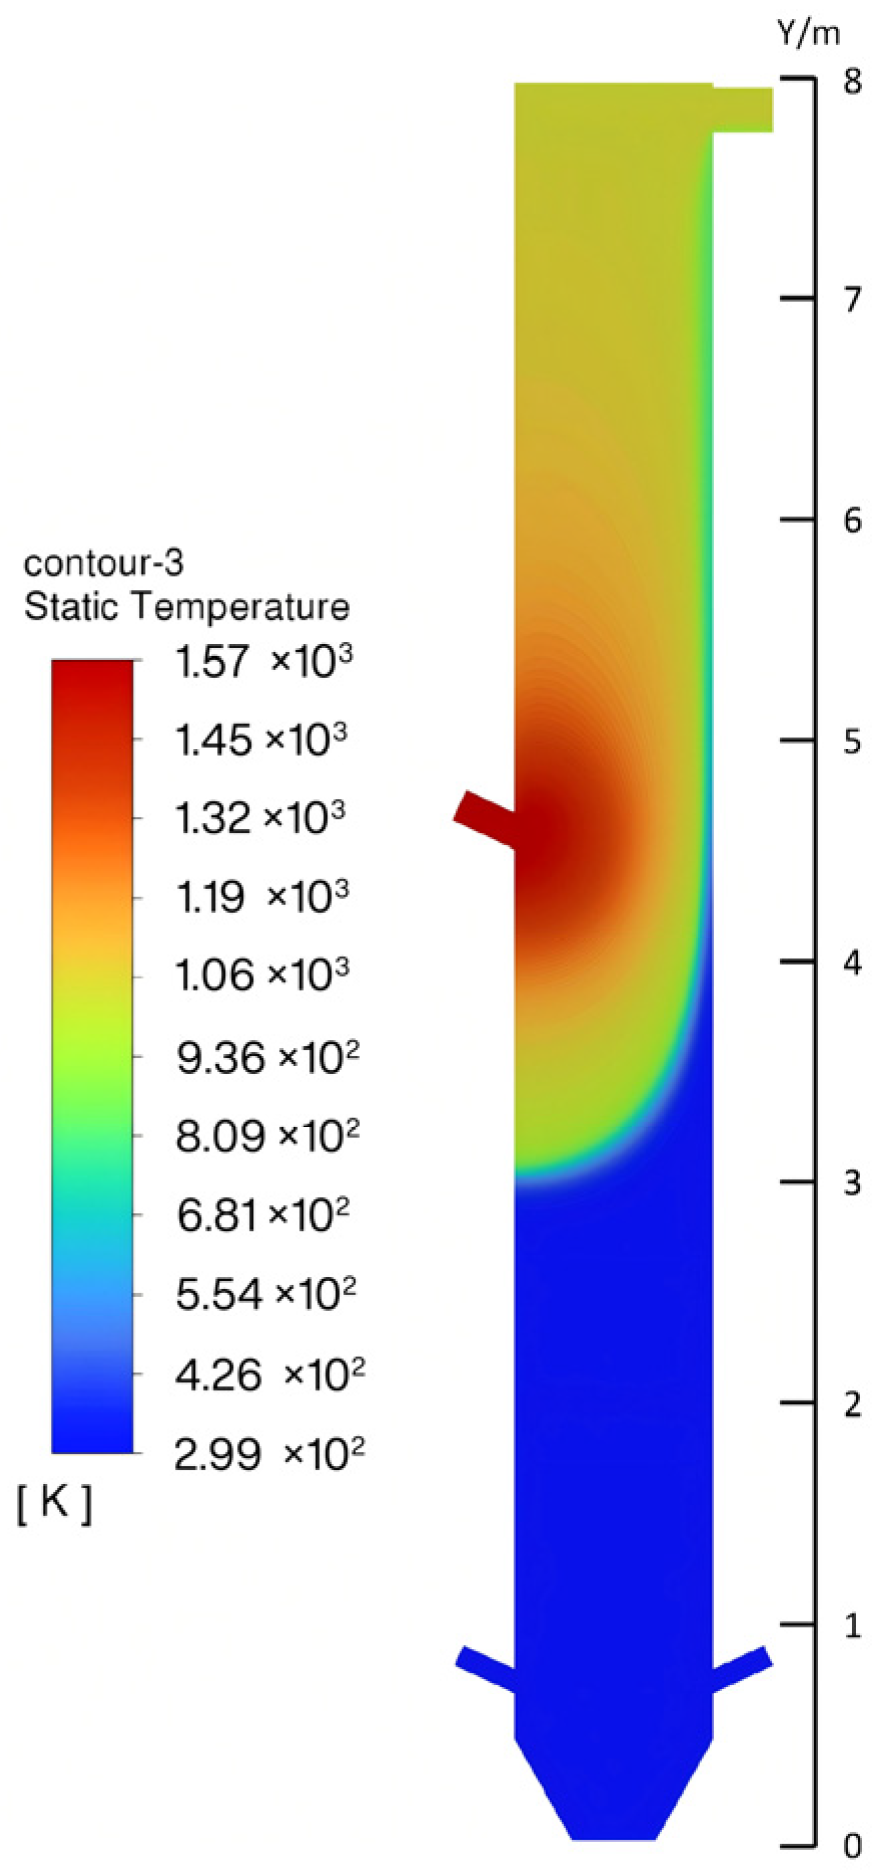
Figure 2 displays the contours of the temperature distribution of the flue gas and limestone particle temperatures at the kiln inner surfaces with the original model. The simulation findings demonstrate that, once the high-temperature flue gas is introduced through the single inlet, there is a clearly asymmetric flow field and temperature field within the kiln. The heat-intensive area of the calcining zone is greatly tilted toward the end of the hot air inlet, with the local highest temperature of flue gas being 1450 K, as opposed to the much lower temperature of the leeward region, only 936 K. That evident temperature inconsistency straightaway brings about improper heating of the limestone particles with a danger of firing too high on one hand and very little heating on the other. This construction can start the calcination step, and permit the limestone to achieve the calcination temperature, to confirm its fundamental feasibility, but the design has a tremendous impact on the uniformity of the quality of the products and the total efficacy of the energy used in the whole kiln.
Figure 2.
Cloud diagram of the temperature distribution of the mechanical lime vertical kiln Original model.
4.1.2. Key Component Concentration Field Distribution
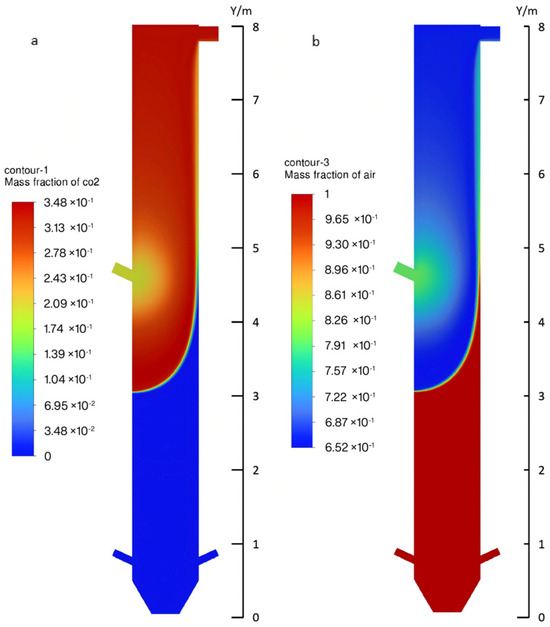
The mass fraction distributions of air and CO2 of the original model are presented in Figure 3. The usage and distribution of air are highly uneven due to the asymmetry of the flow field. The hot air jet core region experiences a rapid decrease in the concentration of air, whereas the areas where flow has stagnated or recirculated have higher concentrations of air but do not significantly contribute towards future combustion and atmosphere maintenance. Equivalently, decomposition product CO2 also has its highest concentration region along the high-temperature boundary, with a peak concentration of 0.306, while the leeward side concentration is lower. The distribution of these components also confirms that the calcination reaction of the kiln experiences a high degree of spatial variation, which indicates the natural flaw of the single-inlet mode of providing a homogeneous reaction space.
Figure 3.
Cloud maps of the mechanical lime vertical kiln original model: (a) CO2 distribution cloud map; (b) air distribution cloud map.
4.2. Improved Model Numerical Simulation Results and Verification
In order to solve the shortcomings of the initial model, a revised design was offered with symmetrical positioning of hot air inlet openings at the 0°/90°, 180°, and 270° positions. This model has been simulated and experimentally verified.
4.2.1. Optimization of Temperature Field Distribution
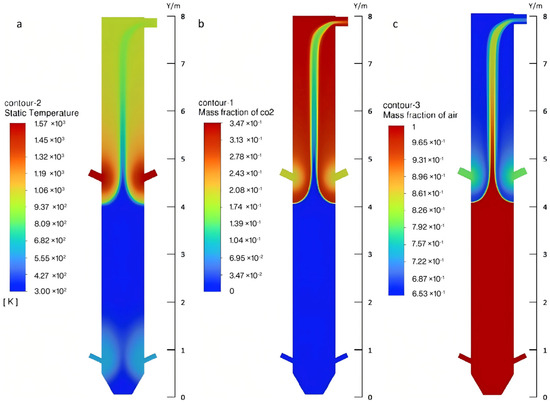
Having introduced the inlets in four directions, the kiln temperature field was essentially increased, as can be seen in Figure 4a. The four identical inlets in symmetry create a smooth and steady flow environment in the middle sector of the kiln body that enables the high-temperature flue gas to evenly pass through the limestone bed. The maximum flue gas temperature at the calcination area is 1450 K, and the temperature range of the limestone solid particles is 1190 K. Relative to the initial model, the modified model not only removes local overheat and underheating areas, but it also allows for making the temperature distribution in the whole calcination area more focused and equal, which is completely within the range of optimal calcination temperatures of active lime (1050–1150 K). The difference between the gaseous and solid phase temperatures is also balanced to an acceptable level, and this shows that a more effective heat transfer mechanism takes place.
Figure 4.
Cloud maps of the improved model of the mechanical lime vertical kiln: (a) temperature distribution; (b) CO2 distribution; (c) air distribution.
The reliability of the temperature field, as simulated above, was tested through the temperature profile predictions of the optimized kiln. It reveals that, under conditions resulting in high-quality products (e.g., the batch LIM1445), the kiln system can achieve a better temperature distribution. The core temperature of calcination is constantly at 830–850 °C, which falls well within the required range of the thermodynamic temperature needed to decompose the material. On the other hand, in situations where the quality of the products produced (e.g., batch LIME1800) deteriorates, even though one of the predicted temperature values may be similar, the overall thermal situation within the kiln is poor (the outlet gas temperature is only 51.4 °C), indicating severe non-uniformity or heat loss issues. To further assess the reliability of the numerical model, the simulated outlet gas temperature and the discharged lime temperature were compared with the experimental measurements under identical operating conditions. The discrepancies between the predicted and measured values were within 15%, which is acceptable for engineering applications. This level of agreement confirms that the multi-physics coupling model, incorporating local non-thermal equilibrium and limestone decomposition kinetics, accurately captures the key physical and chemical processes inside the kiln. Therefore, the model provides a solid foundation for structural optimization and performance evaluation, and the improved temperature uniformity demonstrated above serves as the basis for enhanced calcination efficiency.
4.2.2. Improvement in Component Concentration Fields
Air and CO2 concentration distributions in the improved model (Figure 4b,c) have very high symmetry and uniformity. The calcination zone has a constant and complete utilization of air, with small gradients of the concentration field, and there are no visible regions of excessive or insufficient oxygen saturation. Also, the formation and dissemination of CO2 are associated with the temperature field in a good manner, as its density is evenly spread on the cross-section of the whole calcination zone. It illustrates that the design of the four-directional inlet is capable of facilitating the even dispersal of reaction gases, which form favorable environmental conditions for the simultaneous and even decomposition of limestone.
4.2.3. Decomposition Rate Distribution
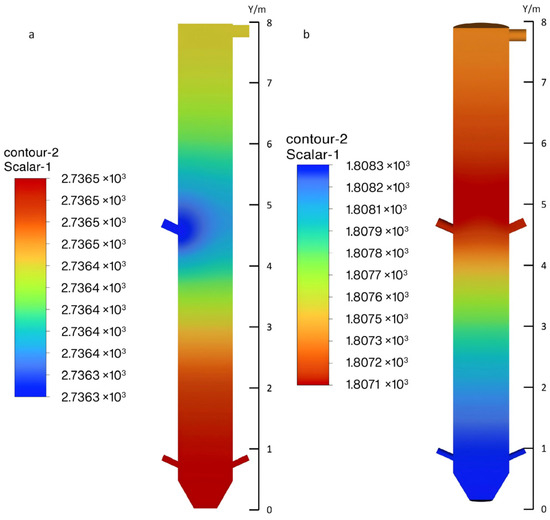
The quantitative assessment of calcination effects between the two models under similar feed conditions and overall reaction residence time (7200 s) was performed by measuring changes in density. The initial density of limestone is 2800 kg/m3. The average reacted mixture density of the improved model is 1807–1808 kg/m3, and 2736 kg/m3 in the case of the basic model. In turn, the estimated average decomposition speed of the improved model is approximately 82.7%, which is much higher than the approximately 5.3% of the basic model. A layered decomposition pattern is observed in both models in the direction of kiln height, and the layering pattern in the improved model is better defined, and its gradient is smoother, suggesting that its calcining operation is better organized spatially. The slight change in decomposition rate in the axis of the furnace height can also be associated with the local gas permeability alteration owing to the introduction of cooling air through the bottom of the furnace. This phenomenon could optimize the kinetics of the last step of the reaction by optimizing the gas–solid mass transfer performance and particle packing behavior at the bottom of the calcination region.
4.2.4. Available CaO Content and Reaction Activity
The major aspect of the chemical analysis of the product was the available CaO content and hydration reactivity. Table 7 demonstrates that, at the same raw limestone purity (CaCO3) level (approximately 95%), when lime is made at stable high yields consistent with the optimized model (e.g., LIME1445), it is characterized by very high available CaO levels of 87.7%, as well as the best possible reactivity (the reaction time is merely 14.3 s). Meanwhile, the product of the poor or original operating conditions (e.g., LIME1800) is significantly different, with much lower values of available CaO (81.7) and a longer reaction time of 21.1 s. When looking at the chemical performance of the end product, the direct increase of the available CaO content and the reduction of the reaction time are definitely indicative of the fact that the optimized internal kiln environment strongly enhances the process of complete decomposition of calcium carbonate and the formation of highly active lime products.
Table 7.
Comparison of the Key Lime Product Quality Indicators based on the Production Data.
4.3. Optimization Mechanism Analysis and Product Quality Evaluation
The above-mentioned findings show that the four-directional intake enhanced model has a significant role in improving temperature field uniformity and component field uniformity inside the kiln at the microscopic level. Through this section, the authors give a detailed discussion on how the improved model improves performance in terms of multi-physics field coupling, reaction kinetics, and energy efficiency of the system.
4.3.1. Flow Field-Temperature Field Synergy and Gas–Solid Heat Transfer Enhancement Mechanism
The basic cause of improved performance of the improved model is that it has generated a synergism among flow fields and temperatures. It can be seen in Figure 4 (the improved model temperature field) that the symmetrical four-directional inlet design divides the initial single high-speed jet into four interacting jets of counter-momentum. The reconstructed flow field then makes the high-temperature fluid form a homogeneous, steady, slow-speed main flow zone in the center region of the kiln mass, not as previously depicted in the original model with an inner fast-moving jet region near the walls and a surrounding circulating section.
In fluid dynamics theory in porous media, it is stated that the convective heat transfer coefficient between the fluid and solid particles greatly relies on the local Reynolds number Re (Equation (9) applies). With the high speed jets in the original model, the Re number is too large, so that there is not enough contact time between the gas flow and the particles; in circulatory or stagnant regions, the Re number is too small, and there is a poor convective heat transfer. The optimized Re number distribution throughout the whole calcination zone cross-section by generating a uniform flow field narrows the range of values down to a more favorable spread of Re numbers that enhances heat transfer. It is directly expressed through the improvement of the convective heat transfer efficiency between the flue gas and the limestone particles, which is shown in Figure 4a as the convergence of the gas–solid two-phase temperatures and the decrease and stabilization of the temperature difference. This homogeneous and intensified heat exchange allows for achieving the decomposing temperature of the limestone particles at the same time and evenly, which gives the physical basis of the elimination of local under-firing and over-firing and the quality of the products.
4.3.2. Synergistic Optimization of Component Transport and Chemical Reaction Kinetics
Homogenizing the component field in the advanced model (Figure 4b,c) is not only a passive consequence of the flow field improvement but creates an active synergistic interaction with the limestone decomposition reaction kinetics.
To begin with, the uniformity of distribution allows for maintaining the constant oxidizing environment at each location within the kiln by the high-temperature flue gas, which is used as the source of heat to provide enough conditions for reactions to the incompletely burned parts and to ensure the steady heat release.
Secondly, and more crucially, the optimization of the CO2 concentration field directly affects the thermodynamic driving force for the decomposition reaction. The limestone decomposition reaction is a reversible process; its reaction rate is determined not only by the kinetic constant Kr, CaCO3, but is controlled by the thermodynamic driving force (Equation (12)), where , ∞ is the CO2 equilibrium concentration at the current limestone temperature Ts.
In the original scheme, CO2 produced within the local high-temperature area (at the edge near the inlet) does not diffuse easily, and hence the real CO2 levels in that region are significantly higher compared to other regions. As indicated by Equation (12), tends towards or can even surpass the value of , ∞, the reaction forcing factor is going to fall very steeply to a point where it will become zero (the reaction achieves a local equilibrium), and this greatly reduces the rate of the decomposition in that region even though it has the highest temperature. It is the so-called phenomenon of local atmosphere inhibition.
The better model enhances the lateral mixing and axial transport of materials within the kiln due to symmetry in the flow fields and facilitates a speedy outflow of the CO2 produced by the reaction, which can be achieved by keeping the level of at a minimal and constant concentration along the entire calcination zone. This has the effect of keeping the reaction driving force to a fairly large positive magnitude over the total area covered by the calcination zone, with the decomposition reaction rate being mainly influenced by temperature. The chemical reaction rates in the calcination zone eventually become highly consistent and effective since the temperature field of the improved model is already uniform.
4.3.3. Calcium Carbonate Decomposition Rate Distribution and Reconstruction of Kiln Functional Zones
Figure 5 compares the calcination effects between the two kiln designs in terms of the same feed conditions and the cumulative reaction residence time. The analysis demonstrates that the decomposition rate areas of the improved model and the basic model can be characterized by a general tendency to evolve with the vertical direction of the kiln. Nonetheless, the spatial organization of the improved model is more seamless, and its overall rate of decomposition is much greater, thus proving the validity of this model as it optimizes its structure to enhance the overall quality of calcination.
Figure 5.
Cloud maps of the decomposition rate of calcium carbonate in the mechanical lime vertical kiln: (a) original model; (b) improved model.
The mentioned distinctions may be explained under the process mechanism by the joint analysis of the temperature and flow fields,
The Preheating Zone: Mainly physical heating of the material takes place in this zone, and the temperature gradually rises to the reaction initiation point. The decomposition rates start to rise slowly and prepare the stage for further strong reactions.
The Calcination Zone: During this important stage, under the influence of optimal organization of airflow, the temperature of the material in the improved model is better stabilized within the effective range of the reaction. The curve of its decomposition rate is more concentrated and swift to climb, finally achieving a greater plateau of reaction completion. It shows that the condition of internal transfer of heat and diffusion of the reactant (CO2) is much better than before, and the reaction kinetics are increased greatly.
The Zone of Cooling: The main reaction is also completed here, and the curve of the decomposition rate has entered the plateau stage at a high level. The products give off the remaining heat to the cooling air that comes through to the bottom. It is worth noting that the minor change in decomposition rate present in the vertical axis at the very bottom of kiln body can correspond to the intervention effect of the cooling airflow. The introduction of cooling air into the system alters the gas permeability and gas flow structure locally, which might lead to delicate regulation of the gas–solid heat exchange micro-environment and inter-particle mass transfer process during the last stage of the process, resulting in distinct physical trace in the overall distribution.
Overall, by restoring the internal flow and temperature field, the enhanced model will create a macroscopically better-organized and effective reaction process gradient in terms of the improvement of heat mass transfer conditions on a microscopic level by optimizing them, thus providing more uniform and detailed calcination results without affecting the overall time of operation restrictions.
4.3.4. Preliminary Assessment of System Energy Efficiency
Although the calcination process is the main area of concern in this research, the developed model also points out possible energy efficiency gains. A uniform temperature field prevents localized overheating, and that can decrease the maximum combustion temperature or the overall heat input needed to maintain the same overall decomposition rate. Such uniformity of product quality also avoids the energy consumption often incurred to recycle under-fired goods, as well as wasted energy due to excess burning of materials. The proximity between the design values of the outlet flue gas temperature and the actual values observed also suggests that a more logical trade-off exists between systemic heat usage and loss. Further studies can be based on the presented results through quantitative evaluation through specific enthalpy calculations, and comparison with standard examples.
4.4. Comprehensive Discussion: Comparison Between Original and Improved Models
To validate the accuracy and reliability of the established numerical model, Table 8 presents a comparison between the simulation results and the actual production data obtained from the 150 kg/h pilot-scale kiln.
Table 8.
Comparison of the Simulation Results with the Actual Production Data.
All relative errors for the indicators are less than 3%, and the deviation between the fluctuation range of the actual production data (standard deviation) and the simulated values is within an acceptable engineering range. This demonstrates that the established numerical model can accurately reflect the physical and chemical processes of the actual kiln. This validation provides a solid foundation for the reliability of subsequent optimization schemes.
In order to demonstrate how systematically the improvement effect is occurring, Table 9 contains a comparison of the performance indicators of the two models.
Table 9.
Comprehensive Performance Comparison between the Original and Improved Models.
According to this comparison, the optimization of one hot-air inlet into four symmetrical inlets will address, in principle, the series of problems induced by the unevenness of flows and temperature fields that exist in the original model. The revised model not only enhances the rate of limestone decomposition through an even and stable temperature environment and the quality of products, but ensures that the kilns do not sustain damage due to excessive local overheating. It offers an accurate theoretical foundation and action plan for designing and maintaining mechanical lime vertical kilns using hot flue gas optimally.
4.5. Comparison with Existing Studies and Theoretical Linkages
The improvements observed align with previous numerical studies while extending them to waste flue gas contexts. Krause et al. [7] demonstrated through DEM–CFD that particle-scale phenomena influence heat transfer uniformity, though their work focused on conventional fuels. Similarly, Zhou et al. [8] highlighted temperature uniformity as critical for product quality in PFR kilns. The four-directional inlet design proposed herein achieves comparable uniformity improvements (Figure 4a) through a simpler structural modification.
The observed trends are consistent with classical theories. Improved flow uniformity reduces the local Reynolds number variation across the calcination zone, which, per the Ranz–Marshall correlation (Equation (9)), enhances the gas–solid convective heat transfer coefficient hsf. This is evidenced by the convergence of gas and solid temperatures in Figure 4. Furthermore, the homogeneous CO2 field (Figure 4b) mitigates the local atmosphere inhibition described by reversible decomposition kinetics (Equations (12)–(16)). By maintaining below equilibrium concentration , ∞, the thermodynamic driving force is preserved, yielding the high decomposition rate (82.7%) and available CaO content (87.7%) in Table 7.
The symmetrical inlet configuration also distributes gas flow more evenly, reducing localized high-velocity jets and associated viscous losses per the Ergun equation (Equation (3)). This prevents stagnant regions where heat and mass transfer would be inhibited, corroborating Mohammadpour et al. [10] on the importance of uniform gas distribution.
In summary, the enhanced model demonstrates agreement with fundamental transport phenomena and reaction kinetics, providing a robust foundation for the proposed structural optimization.
5. Conclusions
(1) A multi-physics coupling model incorporating local non-thermal equilibrium porous media treatment and limestone decomposition kinetics (implemented via UDF/UDS) was developed for a 150 kg/h pilot-scale mechanical lime vertical kiln using waste flue gas as a heat source. The model accurately captures the complex interactions between flow, heat transfer, species transport, and chemical reactions, with validation errors below 15% for key outlet parameters.
(2) Structural optimization from a single hot air inlet to a symmetric four-directional (0°, 90°, 180°, 270°) inlet design effectively eliminates flow and temperature field segregation. The optimized configuration establishes a homogeneous and symmetrical flow structure, addressing the fundamental cause of uneven calcination in the original design.
(3) The improved flow field leads to significant enhancements in temperature and concentration uniformity. The calcination zone achieves gas and solid temperatures consistently within the optimal range (1123–1423 K), with O2 and CO2 distributions exhibiting high symmetry and homogeneity. This eliminates simultaneous under-firing and over-firing, ensuring consistent product quality.
(4) Quantitative performance improvements include an increase in the limestone decomposition rate from 5.3% to 82.7%, an increase in the available CaO content from 81.7% to 87.7%, and a reduction in the reactivity time from 21.1 s to 14.3 s. The optimized kiln also exhibits clearly defined preheating, calcination, and cooling zones that conform to design specifications.
(5) This study demonstrates that synergistic optimization of flow, temperature, concentration, and reaction fields is achievable through structural modification, even with variable-composition heat sources. Future work should extend the model to transient conditions, incorporate particle size distribution and wall heat losses, and explore intelligent control strategies for enhanced operational flexibility and energy efficiency.
Author Contributions
Conceptualization, J.Y. and Y.L.; methodology, Z.L.; software, Y.L.; formal analysis, J.Y.; investigation, Z.L.; resources, F.H.; data curation, J.Y.; writing—original draft preparation, J.Y.; writing—review and editing, K.L.; funding acquisition, F.H. All authors have read and agreed to the published version of the manuscript.
Funding
The research was funded by the Dean Project of Guangxi Key Laboratory of Petrochemical Resource Processing and Process Intensification Technology (Grant No. 2023Z005), the Opening Project of Guangxi Key Laboratory of Petrochemical Resource Processing and Process Intensification Technology (Grant No. 2025K011).
Institutional Review Board Statement
Not applicable.
Informed Consent Statement
Not applicable.
Data Availability Statement
The original contributions of the paper are contained in the article, any other queries can be forwarded to the corresponding author.
Conflicts of Interest
The authors declare no conflicts of interest.
Abbreviations
The following abbreviations are used in this manuscript:
| Symbol | Meaning |
| Reaction interface area constant | |
| Specific surface area | |
| Pre-exponential factor for the calcium carbonate decomposition reaction rate constant | |
| Inertial resistance coefficient | |
| Local CO2 concentration | |
| Equilibrium concentration of CO2 at the current temperature | |
| Specific heat capacity of calcium oxide | |
| Specific heat capacity of calcium carbonate | |
| Specific heat capacity of CO2 | |
| Fluid specific heat capacity at constant pressure | |
| Solid specific heat capacity at constant pressure | |
| Average diameter of limestone particles | |
| Reaction enthalpy change under standard conditions | |
| Reaction enthalpy change at temperature | |
| Gas–solid convective heat transfer coefficient | |
| Reaction rate constant for calcium carbonate decomposition | |
| Effective thermal conductivity of the fluid | |
| Effective thermal conductivity of the solid | |
| Characteristic length in the flow direction | |
| Molar mass of calcium carbonate | |
| Molar mass of calcium oxide | |
| Molar mass of CO2 | |
| Mass of calcium carbonate | |
| Equilibrium partial pressure of CO2 | |
| Prandtl number | |
| CO2 mass source term | |
| Internal heat source in the gas phase | |
| Internal heat source in the solid phase | |
| Universal gas constant | |
| Reynolds number | |
| Source term in the momentum equation | |
| Fluid temperature | |
| Solid temperature | |
| Fluid velocity vector | |
| Superficial velocity | |
| Temperature correction factor for the calcium carbonate decomposition reaction | |
| Permeability | |
| Porosity | |
| Turbulent dissipation rate | |
| Thermal conductivity of the fluid | |
| Dynamic viscosity of the fluid | |
| Relative viscosity | |
| Pressure gradient | |
| Fluid density | |
| Solid density | |
| Viscous stress tensor |
References
- Stark, J.; Wicht, B. Zement und Kalk; Birkhäuser: Basel, Switzerland, 2000. [Google Scholar]
- Bajamundi, C.; Leino, T.; Kauppinen, J.; Louhola, O.; Lappalainen, M. Production of high-concentration CO2 from electrified limestone calcination for carbon capture applications. Int. J. Greenh. Gas Control 2026, 149, 104559. [Google Scholar] [CrossRef] [Scilit]
- Ajam, M.; Hashemi, M. The study on reducing environmental emissions in a rotary cement kiln. Iran. J. Chem. Chem. Eng. 2026, 45, 181–191. [Google Scholar]
- Hu, X.; Wu, C.; Wen, J.; Li, T. Performances and improvement mechanism of basic magnesium sulfate cement derived from suspension kiln calcination of salt lake magnesium slag. Constr. Build. Mater. 2026, 511, 145271. [Google Scholar] [CrossRef] [Scilit]
- Saidur, R.; Hossain, M.S.; Islam, M.R.; Fayaz, H.; Mohammed, H.A. Review on modeling kiln systems. Renew. Sustain. Energy Rev. 2011, 15, 2487–2500. [Google Scholar] [CrossRef] [Scilit]
- Piringer, H. Lime Shaft Kilns. Energy Procedia 2017, 120, 75–95. [Google Scholar] [CrossRef] [Scilit]
- Krause, B.; Liedmann, B.; Wiese, J.; Wirtz, S.; Scherer, V. Coupled three dimensional DEM–CFD simulation of a lime shaft kiln—Calcination, particle movement and gas phase flow field. Chem. Eng. Sci. 2015, 134, 834–849. [Google Scholar] [CrossRef] [Scilit]
- Zhou, P.; Yang, S.; Liu, Q.; Yang, X.; Zhou, H.; Chen, M.; Zhu, R.; Wu, D. The transient simulation of heat and mass transfer in a parallel flow regenerative lime kiln with pulverized coal injection. Appl. Therm. Eng. 2023, 227, 120412. [Google Scholar] [CrossRef] [Scilit]
- Arévalo, R.; Rezeau, A.; Herce, C. CFD Simulation of Co-firing Coke and Biomass into a Regenerative Parallel Flow Lime Kiln. Waste Biomass Valorization 2022, 13, 4925–4949. [Google Scholar] [CrossRef] [Scilit]
- Chitsazan, A.; Mohammadpour, K.; Specht, E. The CFD simulation of reactive flow in parallel regenerative shaft kilns with the use of a porous medium model. Therm. Sci. 2022, 26, 1175–1183. [Google Scholar]
- Camargos, T.P.; Costa, A.O.D.; Junior, E.C. Energy and exergy analysis of an industrial annular shaft limekiln with producer gas as renewable biomass. Chem. Ind. Chem. Eng. Q. 2018, 24, 11–22. [Google Scholar]
- Kang, Z.; Su, F.; Fang, L.; Zhu, H. Combined DEM-CFD simulation of limestone calcination and fuel burning in a beam-type lime shaft kiln. Appl. Therm. Eng. 2023, 231, 120935. [Google Scholar] [CrossRef] [Scilit]
- Bussmann, M.; Demartini, N.; Ryan, J. CFD Modeling of Calcination in Rotary Lime Kiln. Processes 2022, 10, 1516. [Google Scholar] [CrossRef] [Scilit]
- Fatahi, R.; Nasiri, H.; Homafar, A.; Khosravi, R.; Siavoshi, H.; Chelgani, S.C. Operational Cement Rotary Kiln Variables Modeling Using Explainable Artificial Intelligence Methods—A Consciencity Lab Development. Part. Sci. Technol. 2023, 41, 715–724. [Google Scholar] [CrossRef] [Scilit]
- Toum Benchekroun, M.; Zaki, S.; Aboussaleh, M. Performance optimization modelization of a kiln. Int. J. Adv. Manuf. Technol. 2023, 127, 1333–1339. [Google Scholar] [CrossRef] [Scilit]
- Su, B.; Huang, X.; Chen, X.; Li, J.; Zhang, S. Evolutionary Developments in Application of Lime Kiln Flue Gas to Carbon Dioxide-based Fertilizer in Protected Cultivation Processes. Processes 2025, 13, 3719. [Google Scholar] [CrossRef] [Scilit]
- Bojanovský, J.; Máša, V.; Hudák, I.; Skryja, P.; Hopjan, J. Rotary Kiln, a Unit on the Border of the Process and Energy Industry --- Current State and Perspectives. Sustainability 2022, 14, 13903. [Google Scholar] [CrossRef] [Scilit]
- Nijemeisland, M.; Dixon, A.G.; Stitt, E.H. Design of catalyst based on CFD to transfer heat and react with steam reforming. Chem. Eng. Sci. 2004, 59, 5185–5191. [Google Scholar] [CrossRef] [Scilit]
- Jakobsen, H.A.; Lindborg, H.; Handeland, V. A numerical analysis of the dynamics of interaction between the flow of viscous fluids, transport, and reaction rates in fixed bed reactors. Comput. Chem. Eng. 2002, 26, 333–357. [Google Scholar] [CrossRef] [Scilit]
- Duan, S.; Li, B.; Rong, W. Calculation of Heat Transfer between Gas and Solid, and Decomposition Reaction of Calcination Process Occurring in the Annular Shaft Kiln Using the Finite Volume Method. Processes 2022, 10, 648. [Google Scholar] [CrossRef] [Scilit]
- Mohammadpour, K. CFD Simulation of Reactive Flow in Lime Shaft Kilns Using Porous Media Model and Experimental Validation. Ph.D. Dissertation, Otto-von-Guericke-Universität Magdeburg, Magdeburg, Germany, 2019. [Google Scholar] [CrossRef]
- ANSYS Inc. Fluent Theory Guide, Release 2023 R1; ANSYS, Inc.: Canonsburg, PA, USA, 2023. [Google Scholar]
- Nield, D.A.; Bejan, A. Convection in Porous Media, 4th ed.; Springer: New York, NY, USA, 2012. [Google Scholar]
- Sagastume Gutiérrez, A.; Cogollos Martinez, J.B.; Vandecasteele, C. Energy and exergy analysis of a lime shaft kiln. Appl. Therm. Eng. 2013, 51, 273–280. [Google Scholar] [CrossRef] [Scilit]
- Duan, S.; Li, B.; Rong, W. Research on the Numerical Simulation on Mixed Particle Size Calcination Processes of Parallel Flow Regenerative Lime Kiln in the Calcination Area. Materials 2022, 15, 4609. [Google Scholar] [CrossRef] [Scilit]
- Perry, R.H. Perry’s Chemical Engineers’ Handbook, 6th ed.; Chemical Industry Press: Beijing, China, 1992. [Google Scholar]
- Aghaei-Jouybari, M.; Seo, J.; Pinto, S.; Cattafesta, L.; Meneveau, C.; Mittal, R. Extended Darcy- Forchheimer law, accounting for the contribution of inertial flow deflection. J. Fluid Mech. 2024, 980, A13. [Google Scholar] [CrossRef] [Scilit]
- Mahiques, E.I.; Brömmer, M.; Wirtz, S.; van Wachem, B.; Scherer, V. Discrete Element Method/Computational Fluid Dynamics of Reacting, Moving Granular Assemblies of Thermally Thick Particles. Chem. Eng. Technol. 2023, 46, 1317–1332. [Google Scholar] [CrossRef] [Scilit]
- Attanayake, D.D.; Sewerin, F.; Kulkarni, S.; Dernbecher, A.; Dieguez-Alonso, A.; van Wachem, B. Modeling of Pyrolysis Processes with CFD-DEM: A Review. Flow Turbul. Combust. 2023, 111, 355–408. [Google Scholar] [CrossRef] [Scilit]
- Vonderbank, R.S.; Leithner, R.; Schiewer, S. Modellierung paralleler Kalzinierung und Sulfatierung bei der SO2-Einbindung durch das Trocken-Additiv-Verfahren. Brennstoff-Wärme-Kraft 1993, 45, 44350. [Google Scholar]
- Duan, S.; Li, B.; Rong, W. Numerical Simulation Investigation on Gas-Solid Heat Transfer and Decomposition Reactions of Limestone Calcined Using Blast Furnace Gas in Parallel Flow Regenerative Lime Kiln. Materials 2022, 15, 4024. [Google Scholar] [CrossRef] [Scilit]
- Chugtai, M.; Michelfelder, S. Untersuchungen zur Schadstoffeinbindung durch Additiveinblasung um die Flamme. VDI-Berichte 1983, 498, 39–55. [Google Scholar]
- Hills, A. Mechanismus der thermischen Zersetzung von Calciumcarbonat. Chem. Eng. Sci. 1968, 23, 297–320. [Google Scholar] [CrossRef] [Scilit]

Disclaimer/Publisher’s Note: The statements, opinions and data contained in all publications are solely those of the individual author(s) and contributor(s) and not of MDPI and/or the editor(s). MDPI and/or the editor(s) disclaim responsibility for any injury to people or property resulting from any ideas, methods, instructions or products referred to in the content. |
© 2026 by the authors. Licensee MDPI, Basel, Switzerland. This article is an open access article distributed under the terms and conditions of the Creative Commons Attribution (CC BY) license.