Article

Comparative Study on Aerodynamic Performance of VAWTs with Different Airfoils Under Dimple-Gurney Flap Synergistic Control

College of Mechanical and Electrical Engineering, Guilin University of Electronic Technology, Guilin 541004, China
*
Author to whom correspondence should be addressed.
Appl. Sci. 2026, 16(6), 2882; https://doi.org/10.3390/app16062882
Submission received: 6 February 2026 / Revised: 6 March 2026 / Accepted: 9 March 2026 / Published: 17 March 2026

Abstract

The combined control method of dimples and Gurney flaps has proven effective in enhancing the power coefficient of Vertical Axis Wind Turbines (VAWTs). However, the adaptability of this combined control structure to different airfoil geometries remains unclear. This paper investigates the aerodynamic characteristics of the Toward-Outside Dimple-Gurney Flap (TO-DGF) on three typical airfoils: NACA0021, NACA0012, and S1046. A dynamic flow field prediction model was established using the Lattice Boltzmann Method (LBM) combined with Wall-Modeled Large Eddy Simulation (WMLES). The Taguchi experimental design was employed to analyze the sensitivity of aerodynamic performance to airfoil type, Gurney flap position, and Gurney flap height. The results indicate that the airfoil type is the most critical factor affecting the power coefficient C P , contributing significantly to the performance variance. Specifically, the NACA0021 airfoil demonstrated optimal performance in suppressing dynamic stall. Furthermore, the optimal DGF position varies with the tip speed ratio (TSR): placing the structure at 0.05C and 0.15C from the trailing edge yields the best aerodynamic performance for low (TSR = 1.5) and medium (TSR = 2.4) TSRs, respectively. This study provides a valuable reference for the structural design of high-efficiency VAWT blades within the investigated TSR range.

1. Introduction

The continuous development of wind energy technology has driven the development and application of Vertical Axis Wind Turbines (VAWTs). These turbines provide effective solutions for off-grid and distributed energy applications due to their simple structure, low noise, and omnidirectional design [1]. However, compared to horizontal-axis wind turbines (HAWTs), VAWTs exhibit lower aerodynamic efficiency, and the large variation in blade angle of attack tends to induce dynamic stall, which are inherent problems that have become the main factors constraining VAWT market applications [2,3,4,5,6]. Existing research has explored solutions to these problems, with primary optimization methods including blade geometric parameter optimization [7,8], blade shape feature optimization [9,10], application of flow control techniques [11,12,13,14], and cluster configuration planning [15]. This paper focuses on Passive Flow Control (PFC) technology and seeks effective strategies for improving VAWT aerodynamic performance within the investigated operating window. Specifically, this study examines two representative tip speed ratios, TSR = 1.5 (deep dynamic stall) and TSR = 2.4 (near-optimal energy extraction), and the conclusions are limited to this TSR range.
Flow control improves the flow structure around blade walls through active or passive means to enhance the power coefficient [16]. Active Flow Control (AFC) offers good controllability and is applicable across a wide range of operating conditions, but it has high maintenance costs and requires an external energy supply. In contrast, PFC has significant advantages of simple structure and zero energy consumption. Its main forms include blade suction surface dimples [12], Gurney Flaps (GFs) [13], slots [14], and vortex generators [17]. Among these, Gurney flaps and dimples have become recent research hotspots due to their ease of structural integration and outstanding effectiveness in controlling flow separation.
Gurney flaps alter the position and size of separation bubbles, thereby delaying flow separation. Some studies have improved Gurney flap designs (with slit-modified Gurney flaps and serrated Gurney flaps), effectively enhancing the lift-to-drag ratio of wind turbine airfoils [18,19]. The optimal parameters for GF position, height, and width vary under different model configurations. Previous studies have found that, for the NACA0018 airfoil, the optimal height is 0.75%C and the optimal width is 0.12%C, which increased the maximum C P by approximately 21.32% [20], whereas other researchers reported an optimal height of 3%C for the NACA0021 airfoil, resulting in a 69.94% improvement in peak aerodynamic performance at medium TSRs [21]. Dimples create a storage space to capture vortices, attracting flow and promoting surface attachment. Studies on the effects of dimple position, diameter, and shape on VAWT performance have shown that optimal results are achieved with a diameter of 0.08C when the dimple is placed on the pressure side near the leading edge. Under these optimal conditions, the C P increased by 18% relative to the baseline airfoil at a TSR of 2.6 [22]. Some scholars have also optimized dimple shapes through genetic algorithms to improve VAWT utilization performance [12,23].
However, single passive control methods have limitations under wide operating conditions, prompting scholars to explore compound flow control solutions for VAWT [24]. For example, synergistic designs such as SFA (slot-GF) [25] and dimple-GF [26] have been confirmed to further mitigate blade flow separation at low TSR, thereby enhancing the wind turbine’s self-starting capability. Additionally, the applicability of other compound techniques (such as the dimple-vortex generator [27] and vortex generator-GF [28]) has also been validated on airfoils for helicopter tiltrotor wings and hydrofoils for watercraft.
The flow structures around the blades directly affect the effectiveness of the flow-control mechanisms. Therefore, accurately predicting and simulating the complex unsteady flow field of VAWTs is essential for elucidating the underlying flow-control physics. The Lattice Boltzmann Method combined with Large Eddy Simulation is considered a reliable high-fidelity numerical approach [29,30,31].
In summary, the Toward-Outside Dimple-Gurney Flap (TO-DGF) is an effective approach for improving blade flow structure and improving performance at the investigated TSRs. While recent studies have explored the application of flow control techniques across different baseline profiles [32,33], the actual flow effects of compound flow control structures, particularly their impact on blade dynamic stall characteristics and their applicability to various airfoils, still require further verification.
However, the actual flow effects of flow control structures, particularly their impact on blade dynamic stall characteristics and their applicability to different airfoils, still require further verification. Therefore, this paper takes three typical airfoils—NACA0021, NACA0012, and S1046—as research objects and establishes a dynamic flow field numerical prediction model using the LBM combined with the LES method to analyze the effects of TO-DGF parameter combinations on aerodynamic performance and flow field structure.

2. Methodology

2.1. Model Characteristics and Computational Domain Setup

2.1.1. Geometric Characteristics and Numerical Modeling Approach

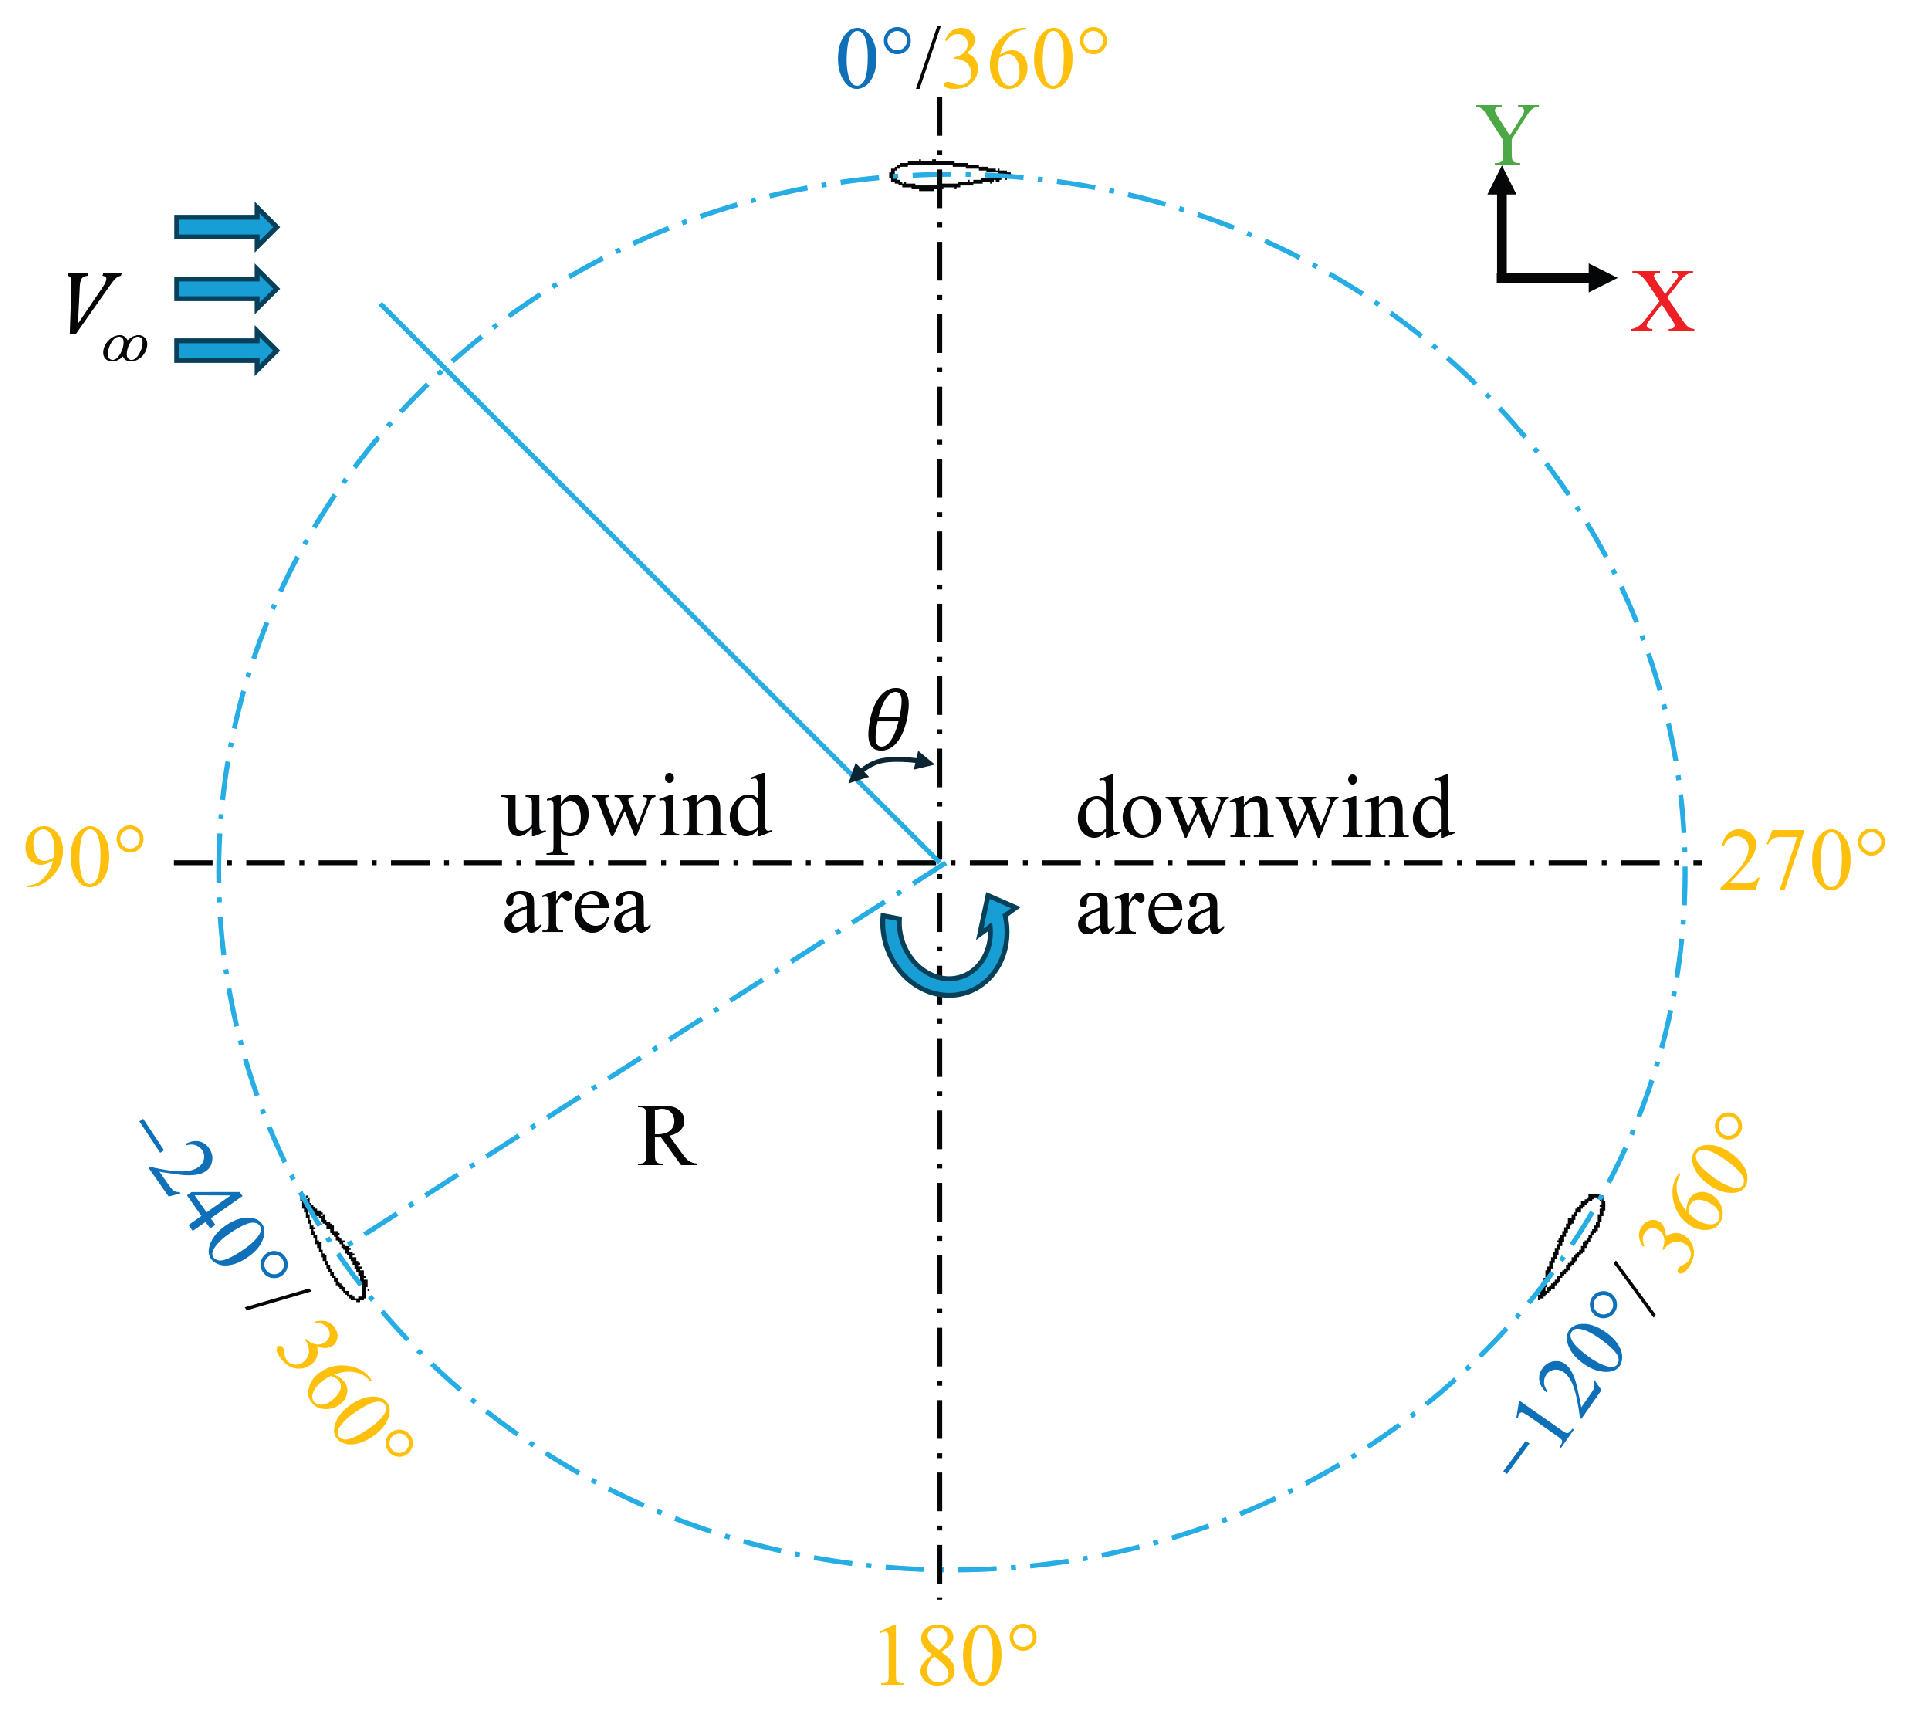
This study is based on the results of existing wind tunnel experiments analyzed on VAWT [34]. The original VAWT rotor structure is simplified to three blade sets, where the turbine rotation direction, incoming wind direction, and wind zone distribution (upwind zone: 0°–180° and downwind zone: 180°–360°) are configured. The VAWT structure is shown in Figure 1.
According to the experimental setup, the simulation rotor structural parameters are shown in Table 1. This study employs XFLOW® 2022 software based on the LBM, which utilizes a high-fidelity Wall-Modeled Large Eddy Simulation (WMLES) model to ensure solution accuracy. The adaptive mesh refinement technology, which employs a fully Lagrangian approach, reduces the workload of manual mesh division.
The numerical model is based on the Lattice Boltzmann Method (LBM) coupled with Wall-Modeled Large Eddy Simulation (WMLES). The evolution of the particle distribution function on a fixed lattice is governed by
f i x + c i t , t + t = f i x , t + Ω i f i ( x , t )
where f i is the particle distribution function, c i is the discrete velocity vector, and Ω i is the collision operator.
At the macroscopic scale, the spatially filtered Navier–Stokes equations are solved in the LES framework. The filtered momentum equation is
u i t + u j u i x j = 1 ρ p x i + ν 2 u i x j 2 τ i j SGS x j
where u i and p denote the resolved filtered velocity component and pressure, respectively, ρ is the fluid density, ν is the kinematic viscosity, and τ i j SGS is the sub-grid-scale (SGS) stress tensor. To close the filtered equations, the wall-adapting local eddy-viscosity (WALE) model is used to evaluate the SGS eddy viscosity ν t :
ν t = C s 2 S d i j S d i j 3 / 2 S i j S i j 5 / 2 + S d i j S d i j 5 / 4
where C s is the WALE constant, is the filter scale, S i j is the resolved strain-rate tensor, and S d i j is the traceless symmetric part of the square of the velocity-gradient tensor. Detailed derivations, including the Chapman–Enskog expansion and tensor formulations, are available in Refs. [35,36].

2.1.2. Computational Domain Configuration

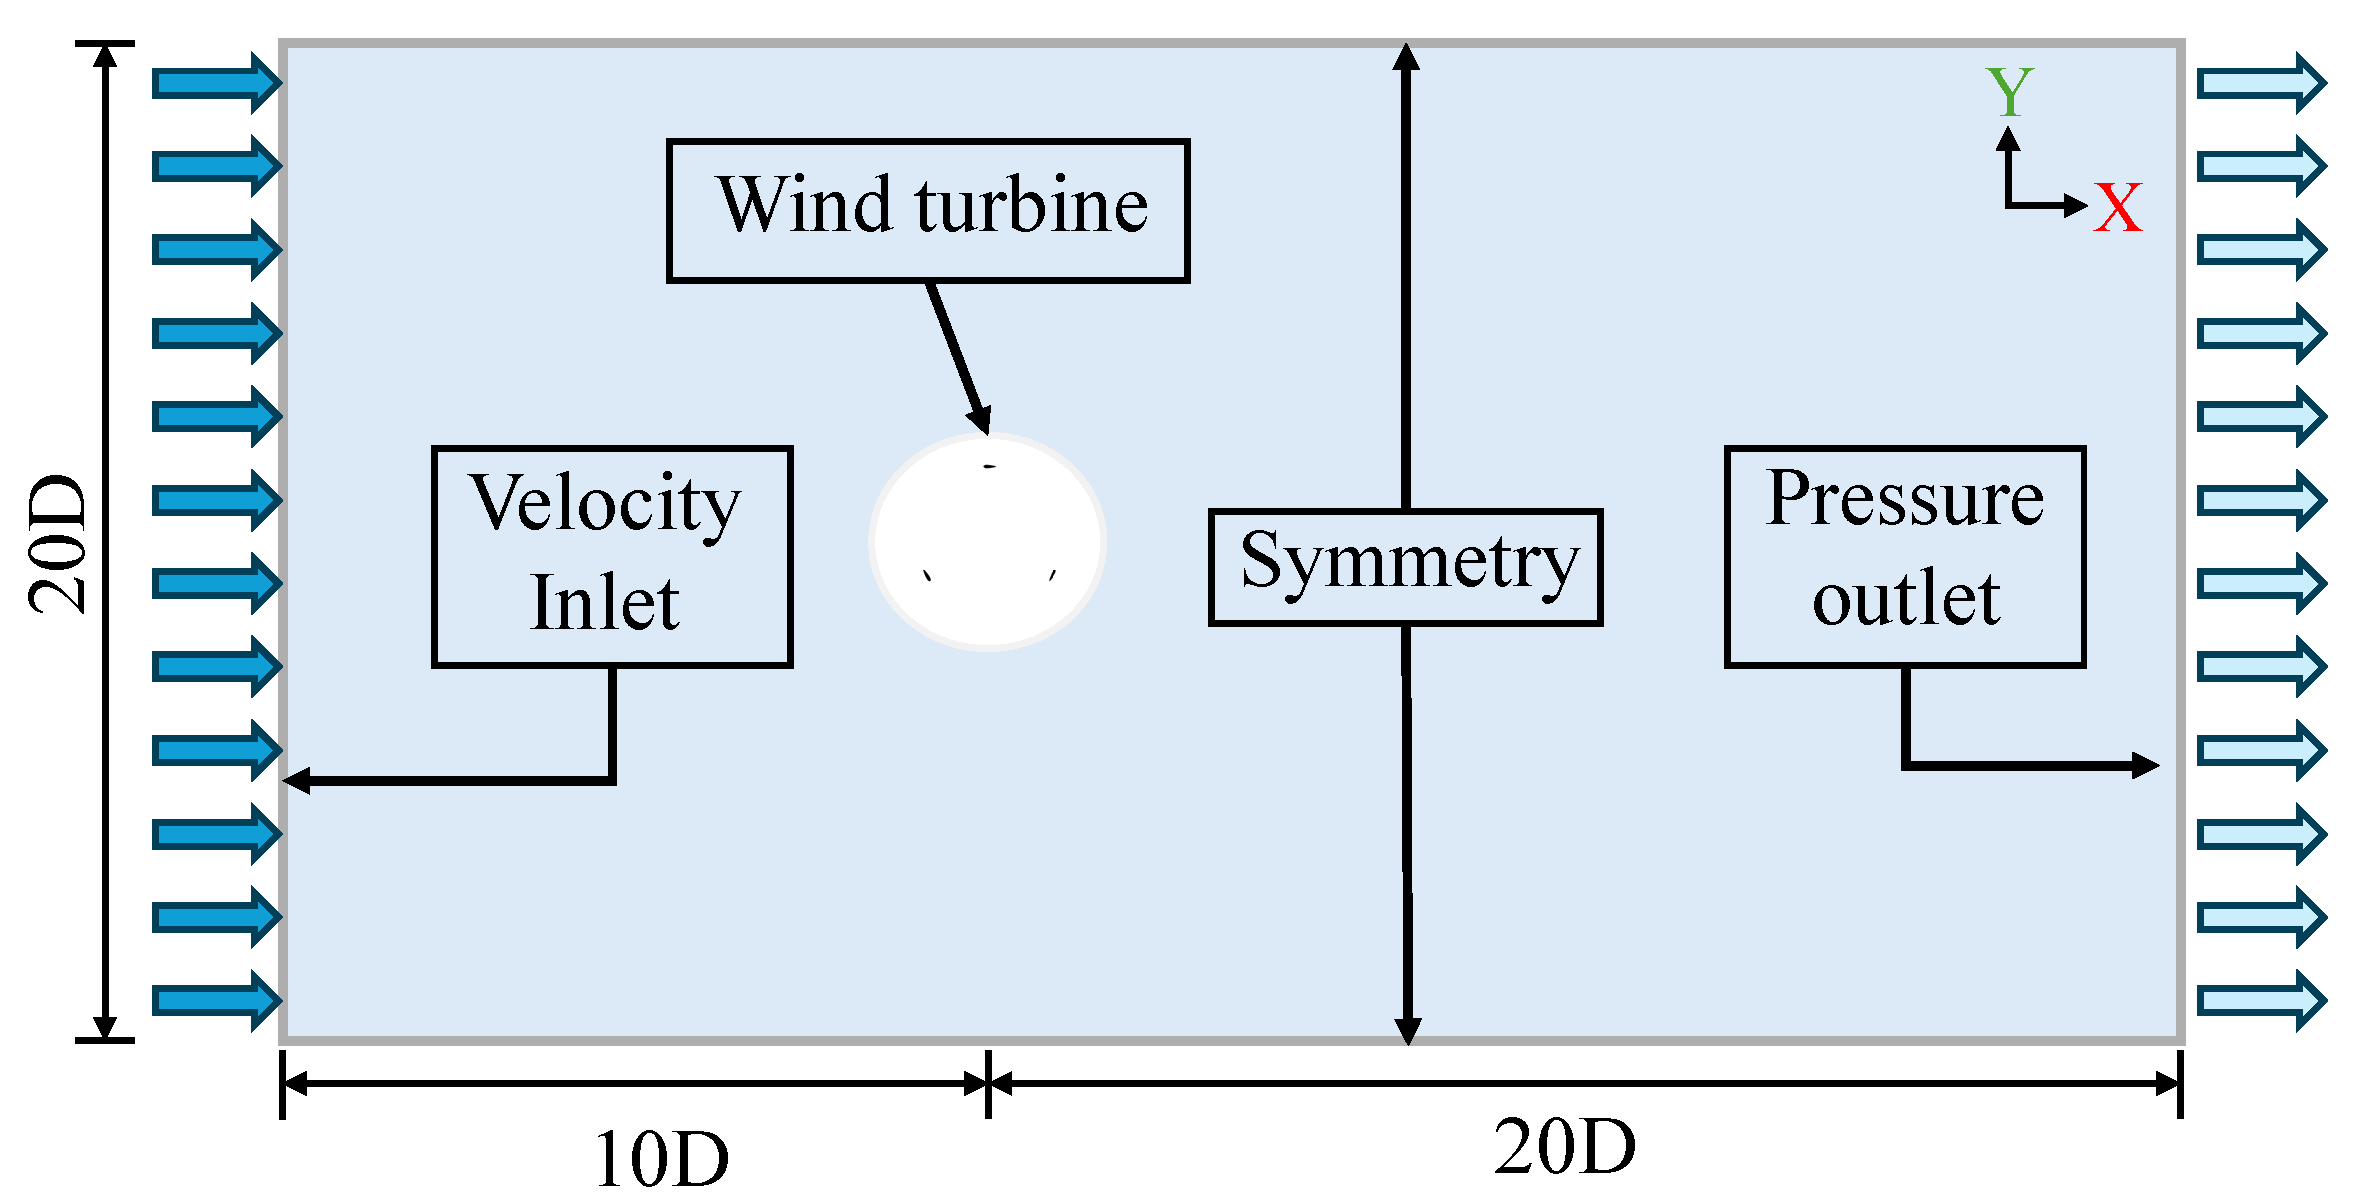
The computational domain established in this paper, which is shown in Figure 2, was defined to replicate the free-stream environment. A uniform velocity inlet was applied at the upstream boundary, while a pressure outlet condition (zero gauge pressure) was prescribed at the downstream boundary. The top and bottom boundaries were defined as symmetry planes. Furthermore, the surfaces of the VAWT blades were treated as no-slip walls. Specifically, the default automatic enhanced wall-function was generally employed; however, it is worth noting that at low TSRs ( TSR 2 ), the blade wall conditions were explicitly adjusted to the non-equilibrium enhanced wall function to accurately resolve the severe flow separation and adverse pressure gradients under dynamic stall conditions. The domain size and settings follow previous research on optimal VAWT simulation parameters aimed at minimizing blockage effects and boundary condition uncertainties while considering accuracy and computational cost; an azimuthal angle increment of 0.5° was used during simulation [37]. Based on the physical field parameters in the Raciti Castelli experiment, the simulation settings include air density ρ = 1.225 kg / m 3 , temperature T = 288.15 K , dynamic viscosity μ = 1.7894 × 10 5 Pa · s , and inlet turbulence intensity I = 3 % [34]. The flow field was initialized with a uniform free-stream velocity over the entire computational domain at t = 0 to accelerate convergence.

2.2. Numerical Model Validation

2.2.1. Rotational Cycle Verification

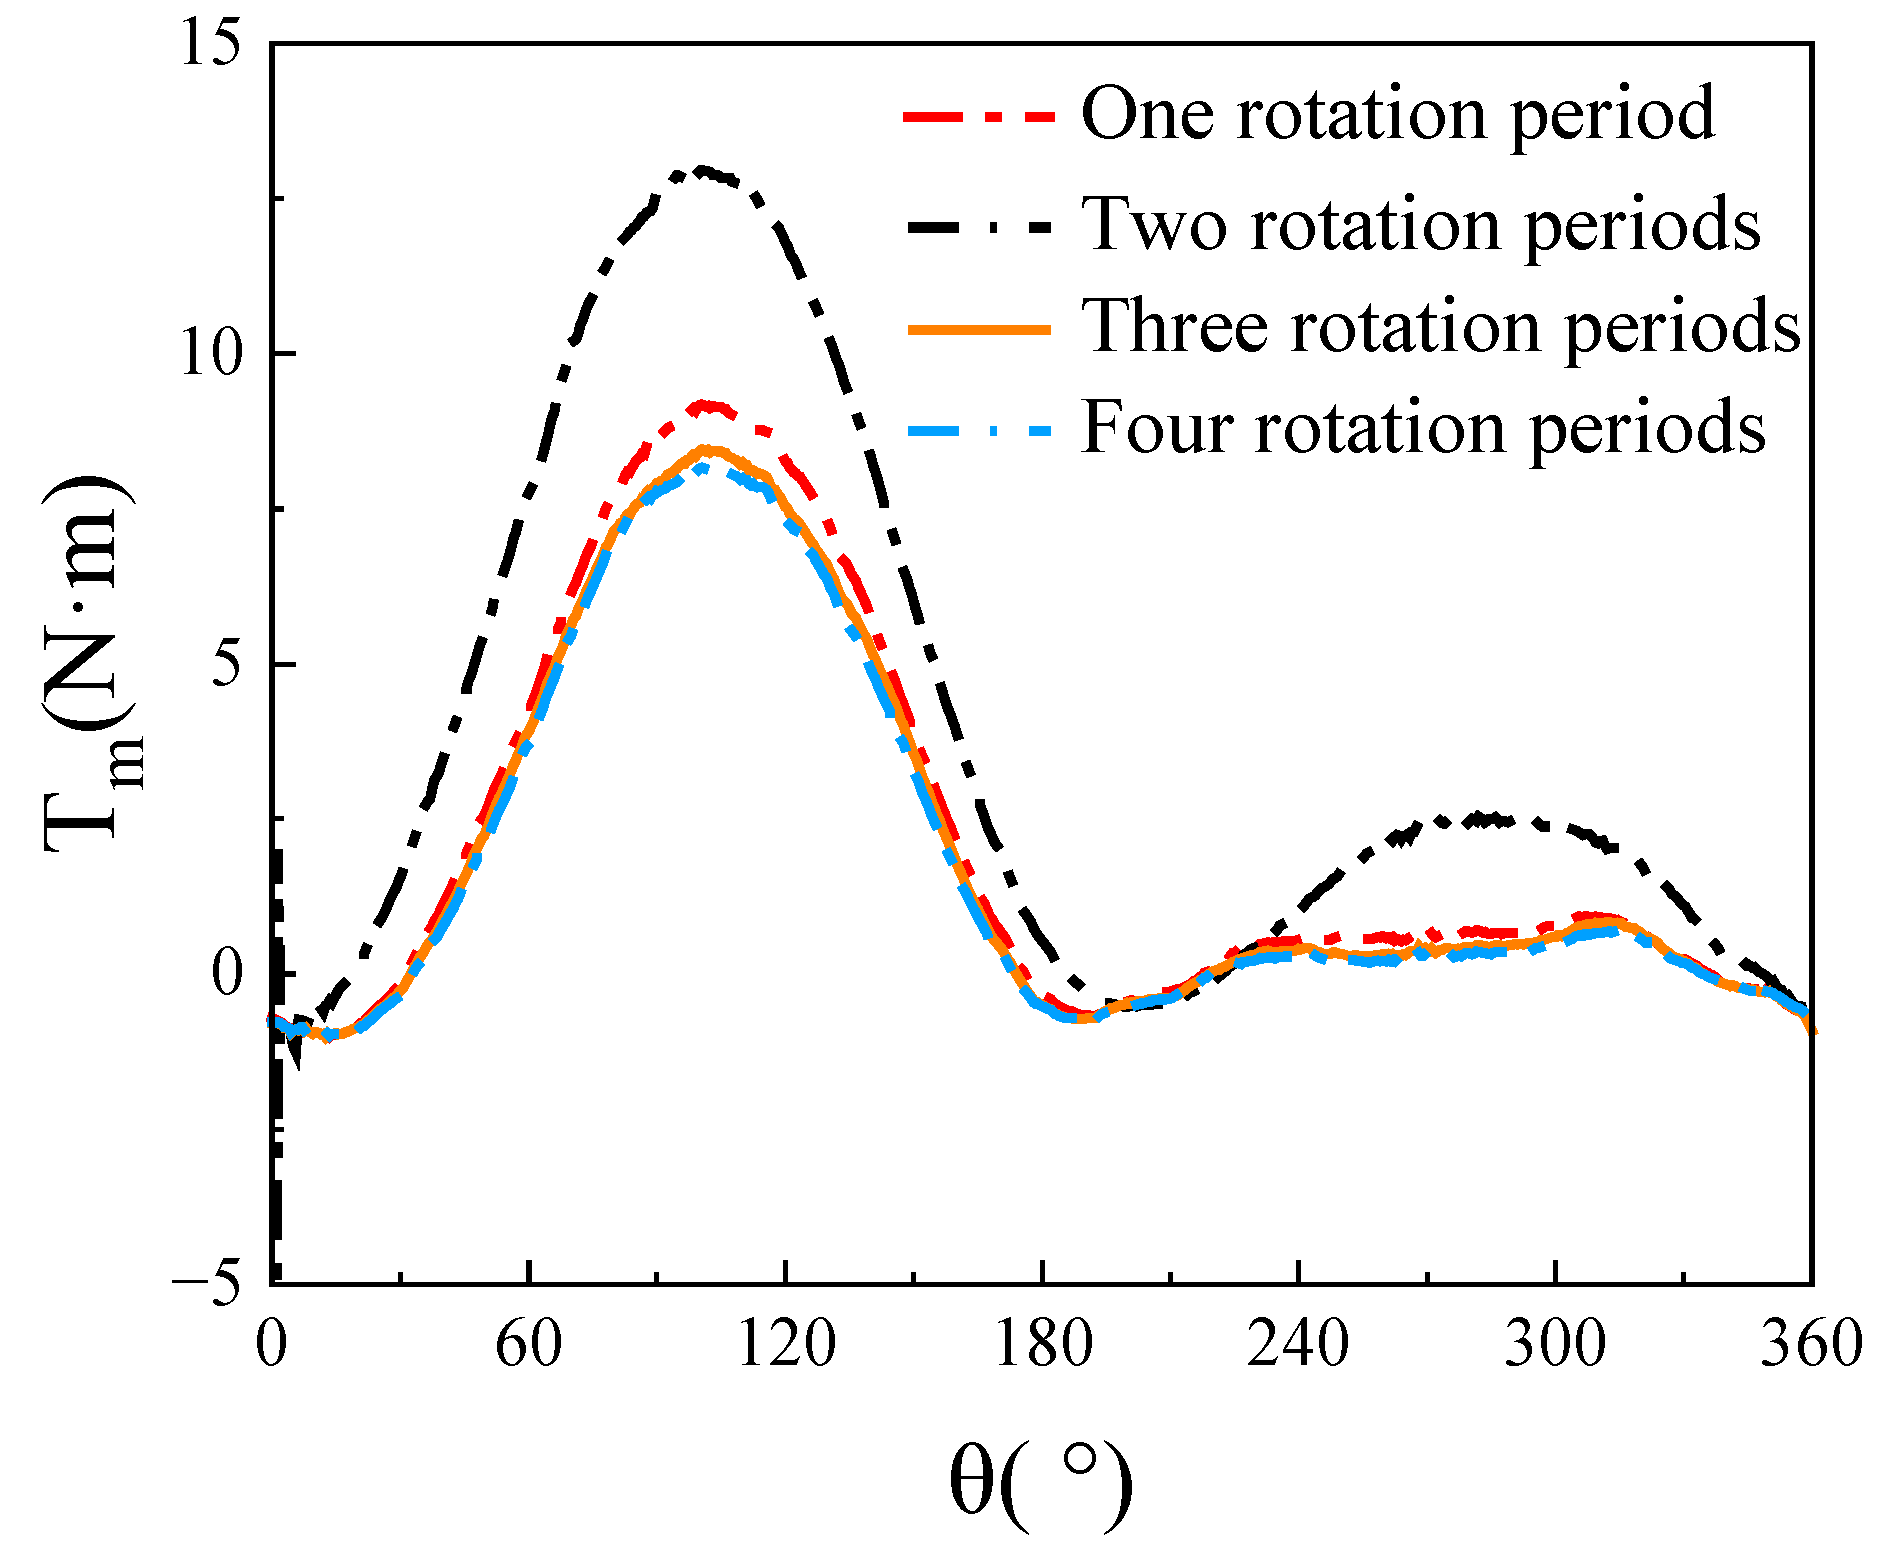
For model validation and the grid-independence test, the baseline NACA0021 airfoil (Table 1) was used. Simulation results indicate that the simulation error between the third and fourth rotation cycles of the VAWT is only 2.67%, which is relatively small. The torque generated in the first rotation cycle is larger, mainly due to the underdeveloped wake. As the number of rotation cycles increases, the wake reduces the VAWT torque as shown in Figure 3. Therefore, considering that the wake-induced reduction in VAWT torque aligns with realistic characteristics and that the simulation results of the third cycle are similar to the fourth cycle with less time consumption, this paper selects the third cycle as the effective cycle for subsequent model validity verification.

2.2.2. Grid Independence Verification

For the flow field with strong separation and large deformation inside the VAWT rotor, the lattice size in the computational domain needs to be sufficiently small (i.e., high lattice density) to accurately capture the dynamic evolution of vortices. Insufficient lattice density at the blade wall and wake regions will significantly affect the accuracy of computational results. This study uses XFLOW to conduct grid independence verification under TSR = 1.5 conditions. As shown in Table 2, when the grid resolution (defined as the number of lattices per chord length, N / C ) increases from 145 to 167, the average power coefficient ( C P , ave ) growth rate is less than 2%, which serves as the quantitative criterion for grid adequacy. Therefore, the lattice number of 145 is considered grid independent and was used for baseline validation. For the modified airfoils with TO-DGF, the finer lattice number of 167 was adopted to better resolve the more complex near-wall vortical interactions.
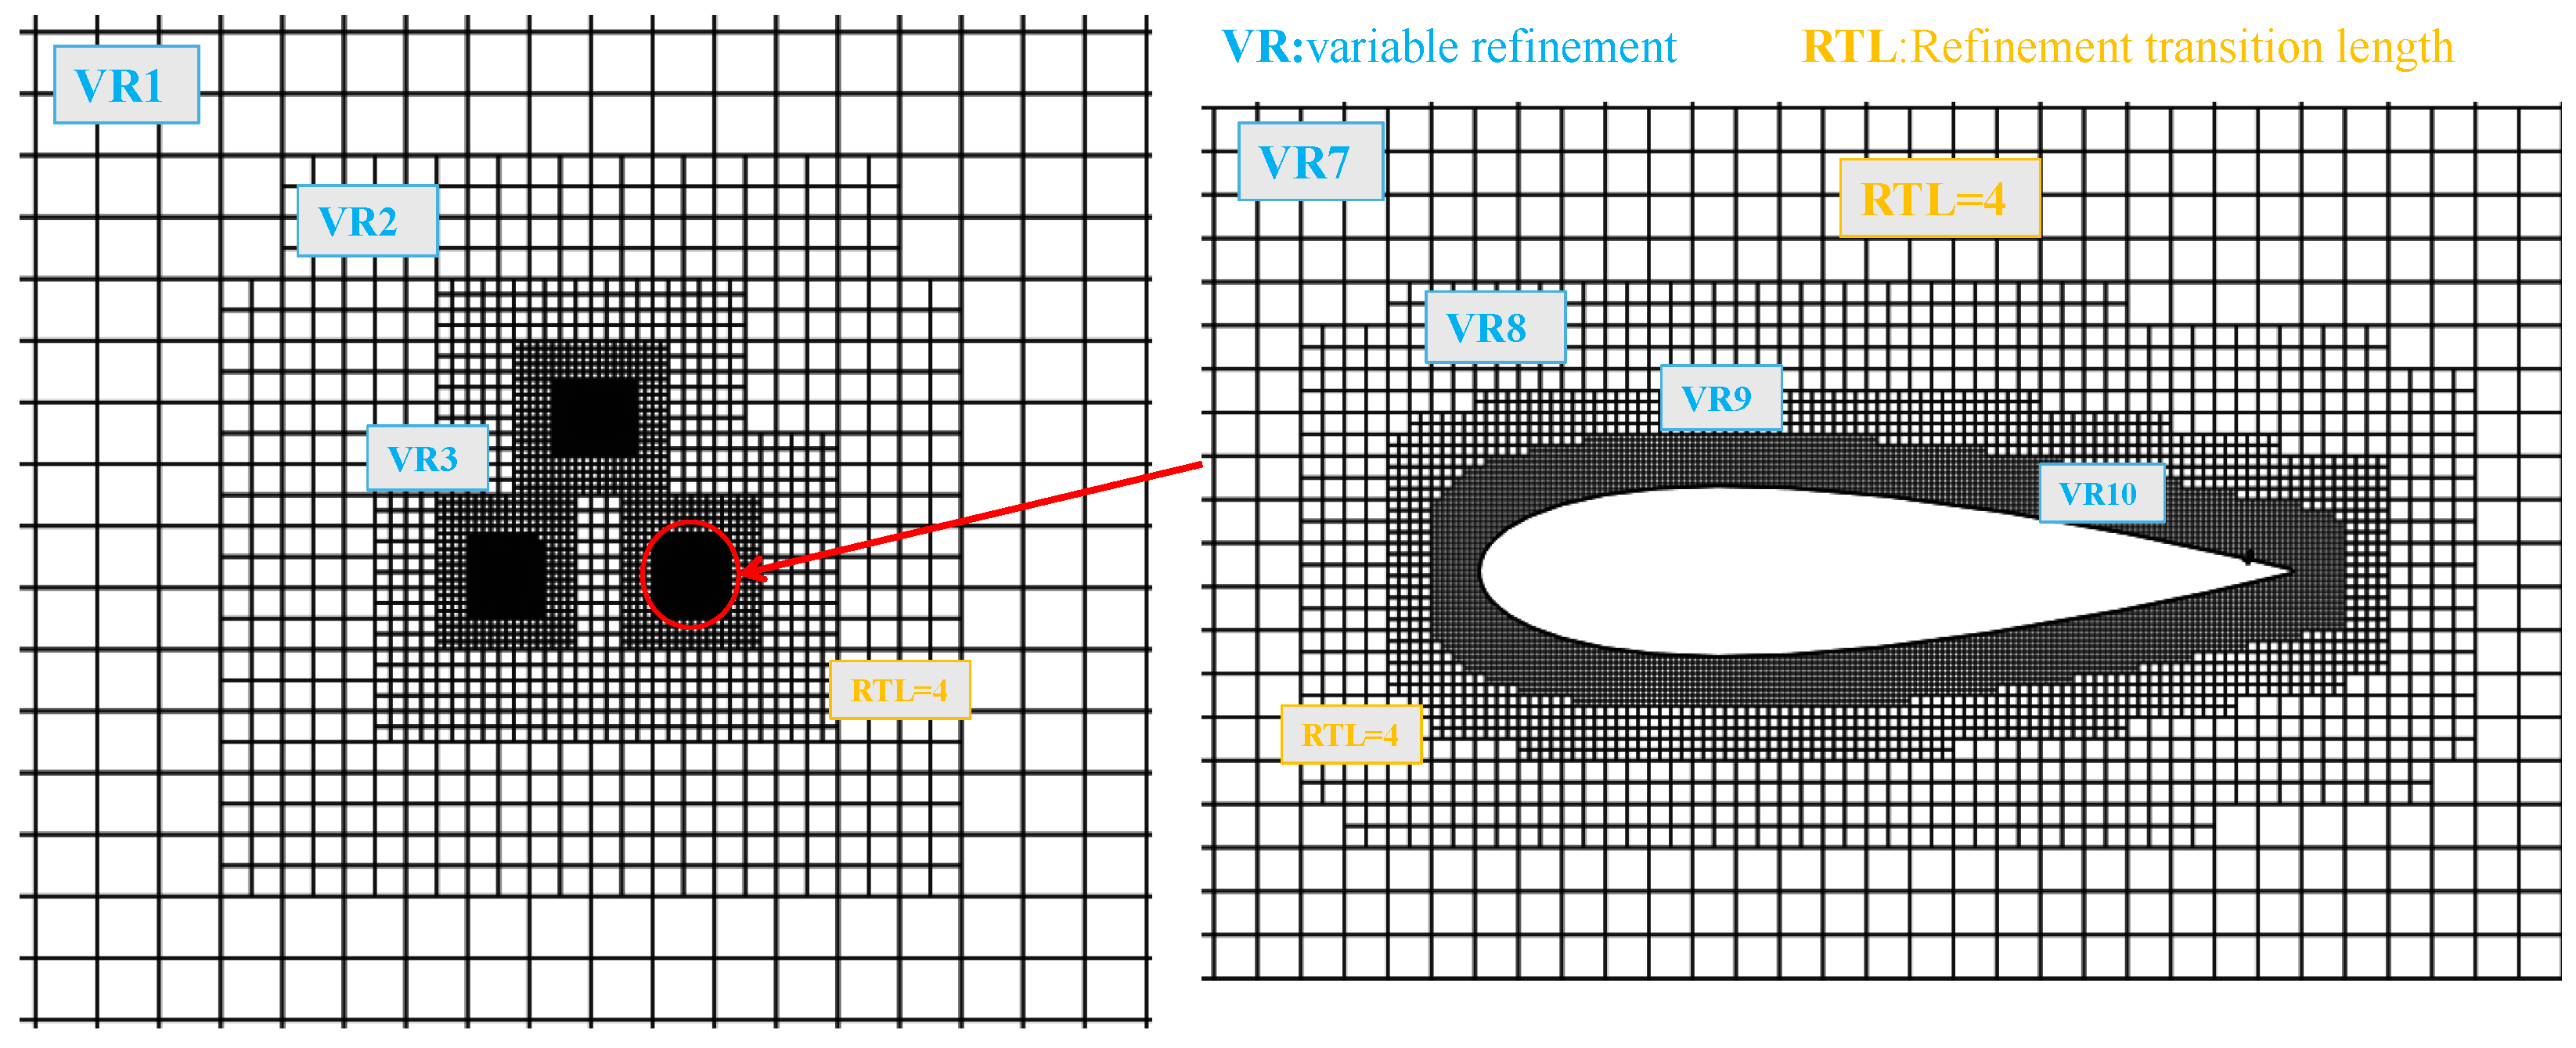
The refinement transition length (RTL) is the number of element layers between two refinement levels, representing the transition gradient from fine resolution at the wall to coarse resolution in the far field. The RTL is set to at least four lattice sizes. The computational domain and blade mesh refinement are shown in Figure 4, with the computational domain Variable Refinement (VR) region consisting of ten layers. Meanwhile, according to the XFLOW technical protocol, the computational stability parameter during the simulation process should be around 0.1–0.3 to ensure the convergence and repeatability of the computational results [35].

2.2.3. Model Validation

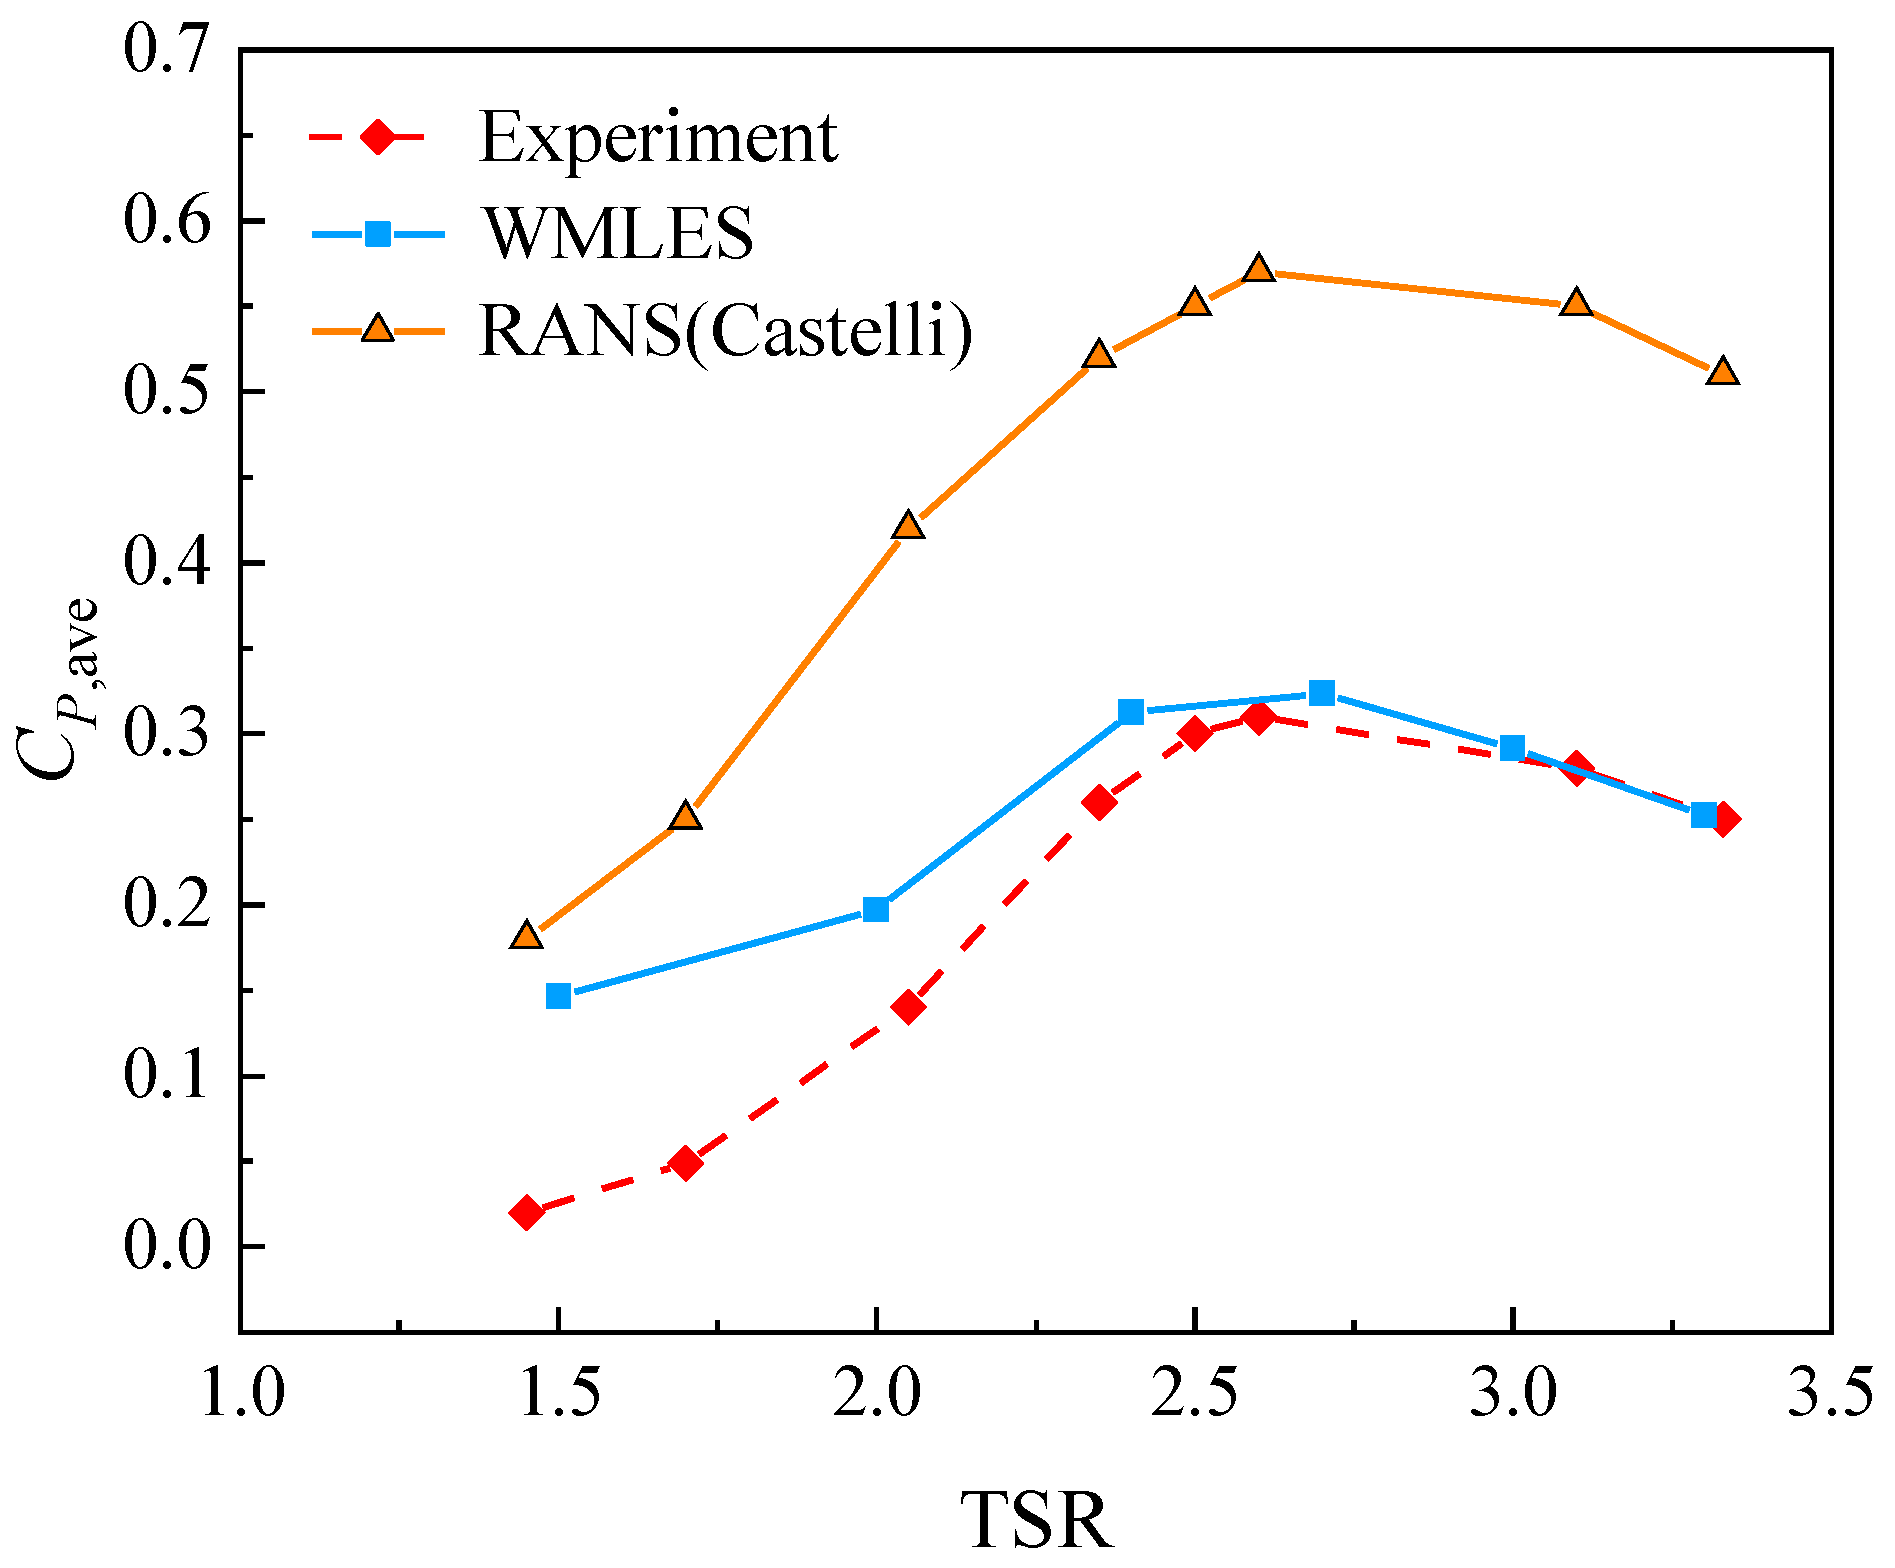
To verify model validity, six simulation schemes covering different TSR are set, using TSR = 2.4 as the baseline and comparing the VAWT wind energy conversion rate between the experiment and the simulation. The scheme settings are shown in Table 3.
Due to the neglect of tip effects in two-dimensional simulation and the lack of modeling of VAWT struts (support columns), the obtained power coefficient is inherently overestimated compared to experiments. Among these factors, due to the influence of turbulence magnitude, the effective wind energy of the VAWT is affected by the effective blade utilization area. At low TSR, turbulence intensity is high and the effective blade utilization area is small; at high TSR, turbulence intensity is low and the effective blade area increases. Three-dimensional effects are more significant at low TSR, so the error is larger than at high TSR.
To evaluate the predictive capability, the WMLES results were compared with the experiments using C P = C P , WMLES C P , Exp . Over the TSR points in Figure 5, the mean absolute error is about 0.05, and the maximum absolute error is about 0.126 at TSR = 1.5. At TSR ≈ 2.6 and TSR ≈ 3.3, the relative errors are about 4.2% and 1%, respectively. The larger deviation at low TSR is consistent with known limitations of 2D simulations in representing strong 3D dynamic-stall losses. Therefore, the model is considered acceptable for comparative trend analysis in the subsequent parametric study.
Despite the quantitative overestimation, previous studies [35] have confirmed that 2D LBM-LES is sufficient to accurately capture the relative performance trends and dynamic stall characteristics. Since the primary objective of this study is a comparative sensitivity analysis rather than absolute performance prediction, the 2D model provides a reliable framework.

2.3. TO-DGF Optimization Form and Airfoil Selection

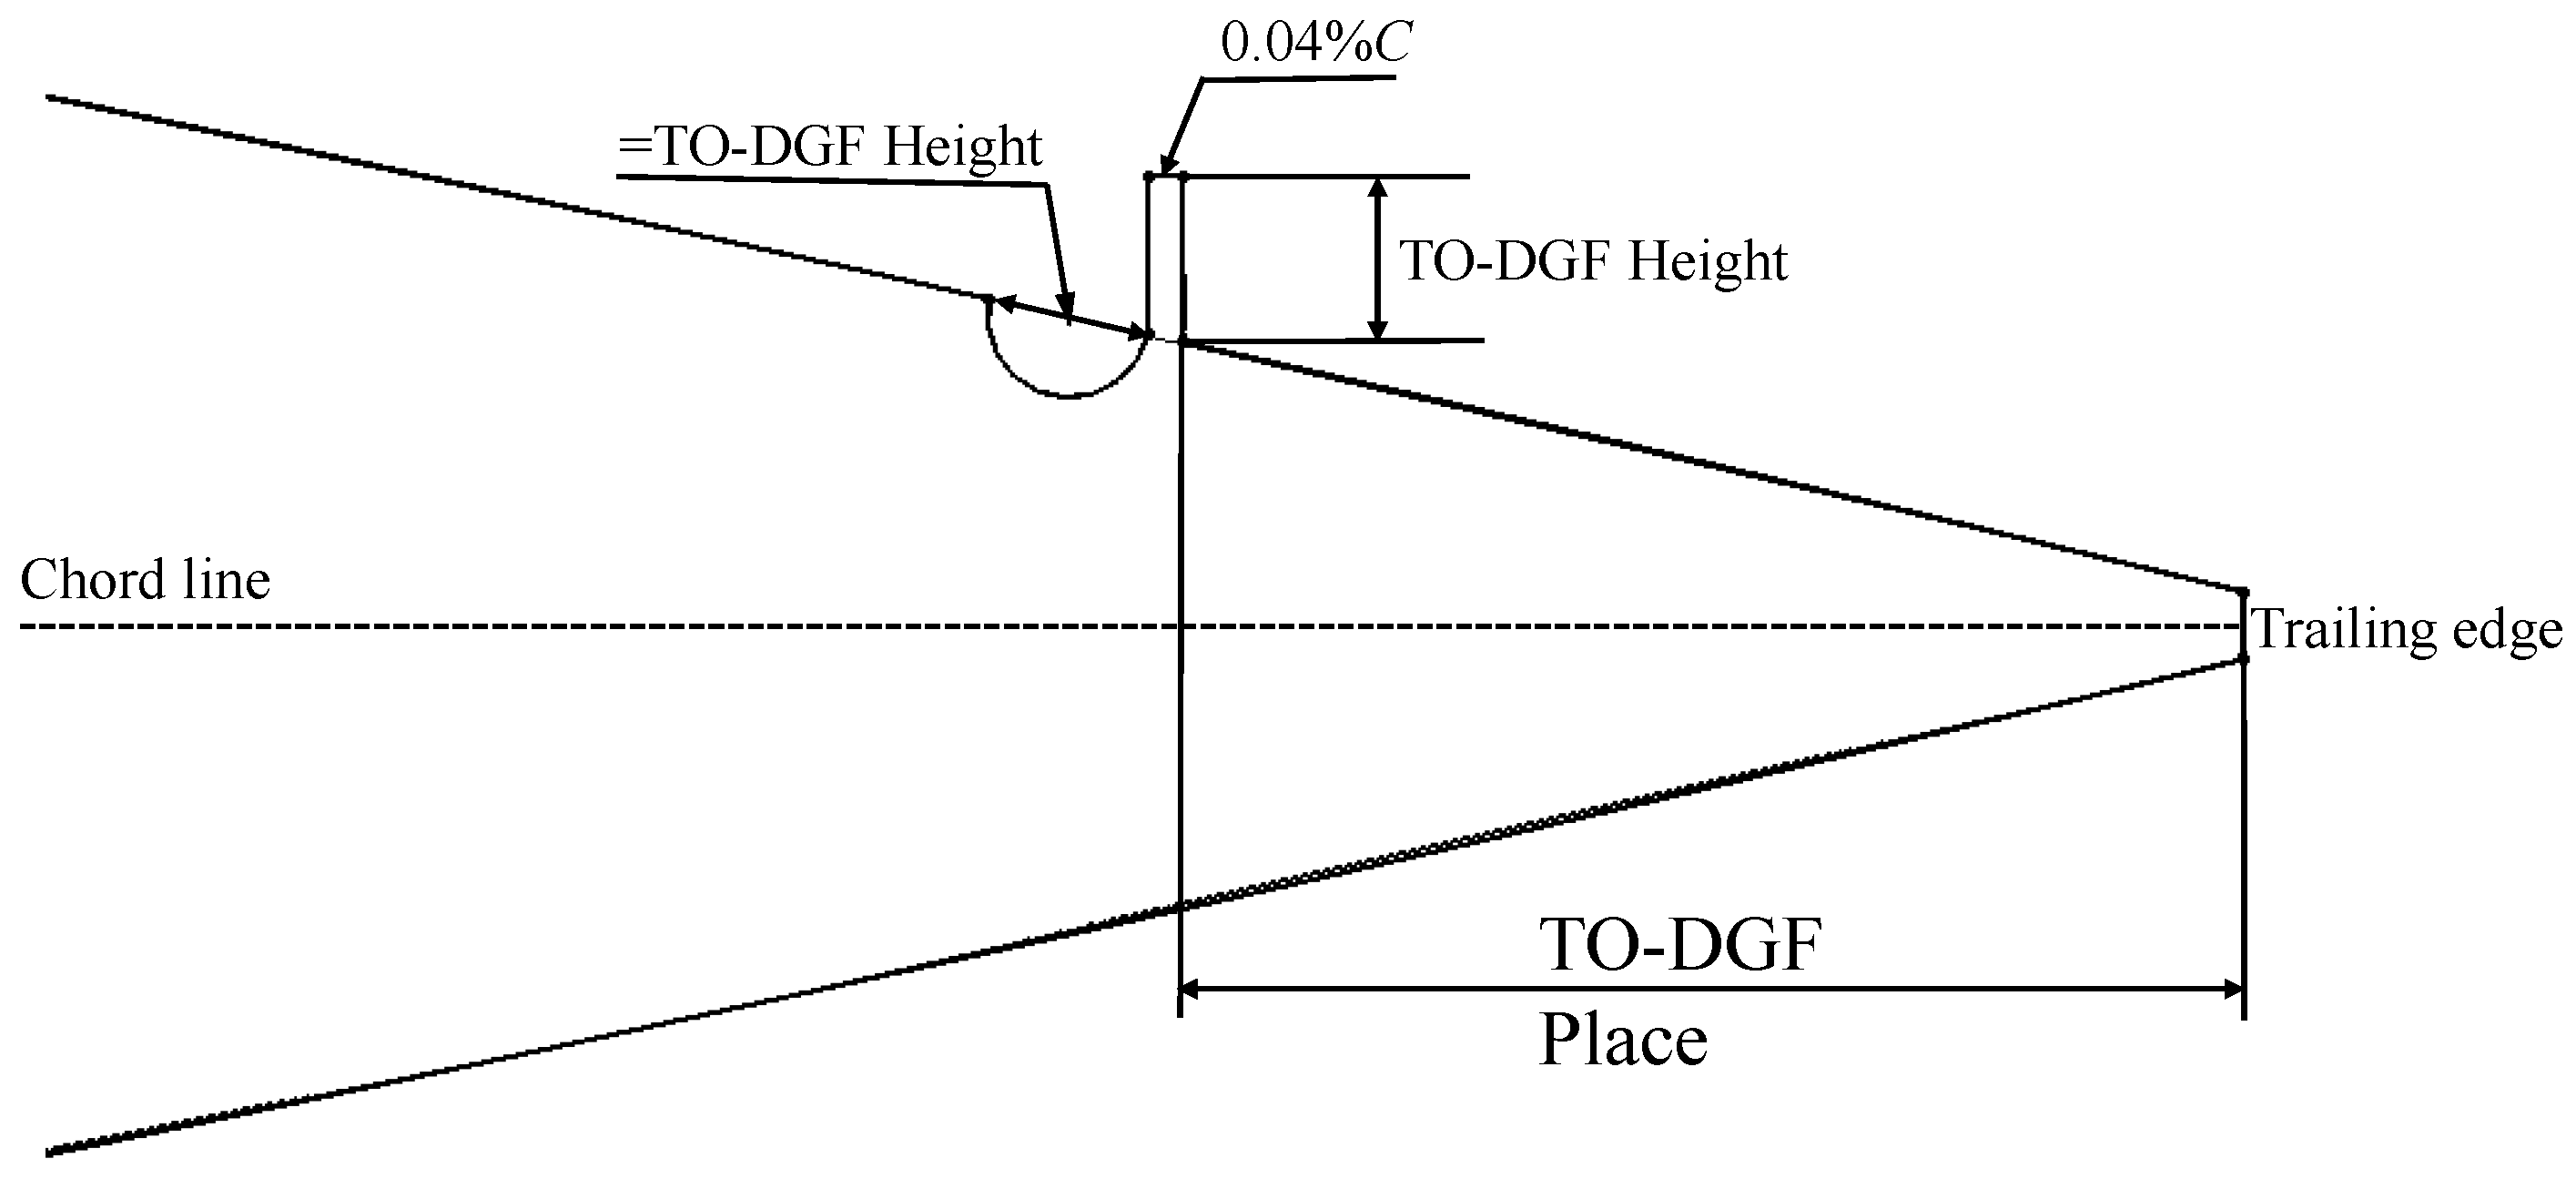
The study of dimple-Gurney flaps mainly originates from Zhu, H.’s research on the application prospects of Two-Side Gurney Flap (TS-GF), Toward-Outside Gurney Flap (TO-GF), Toward-Inside Gurney Flap (TI-GF), Two-Side Dimple-Gurney Flap (TS-DGF), Toward-Outside Dimple-Gurney Flap (TO-DGF), and Toward-Inside Dimple-Gurney Flap (TI-DGF) in SB-VAWT, ultimately determining that TO-DGF has the best aerodynamic performance [20]. Therefore, this paper establishes TO-DGF flow control as the research foundation, with its structure shown in Figure 6.
Specifically, the TO-DGF consists of a circular dimple on the pressure surface near the trailing edge and a Gurney flap positioned immediately downstream. The dimple and the Gurney flap are continuously connected geometrically, with the dimple diameter being identical to the TO-DGF height. Furthermore, the position of the TO-DGF is defined as the straight-line distance measured along the chord line from the trailing edge toward the leading edge to the Gurney flap. Among the factors affecting the effective power generation of VAWT rotors, the influence of TO-DGF position and TO-DGF height on this flow control method is relatively significant.
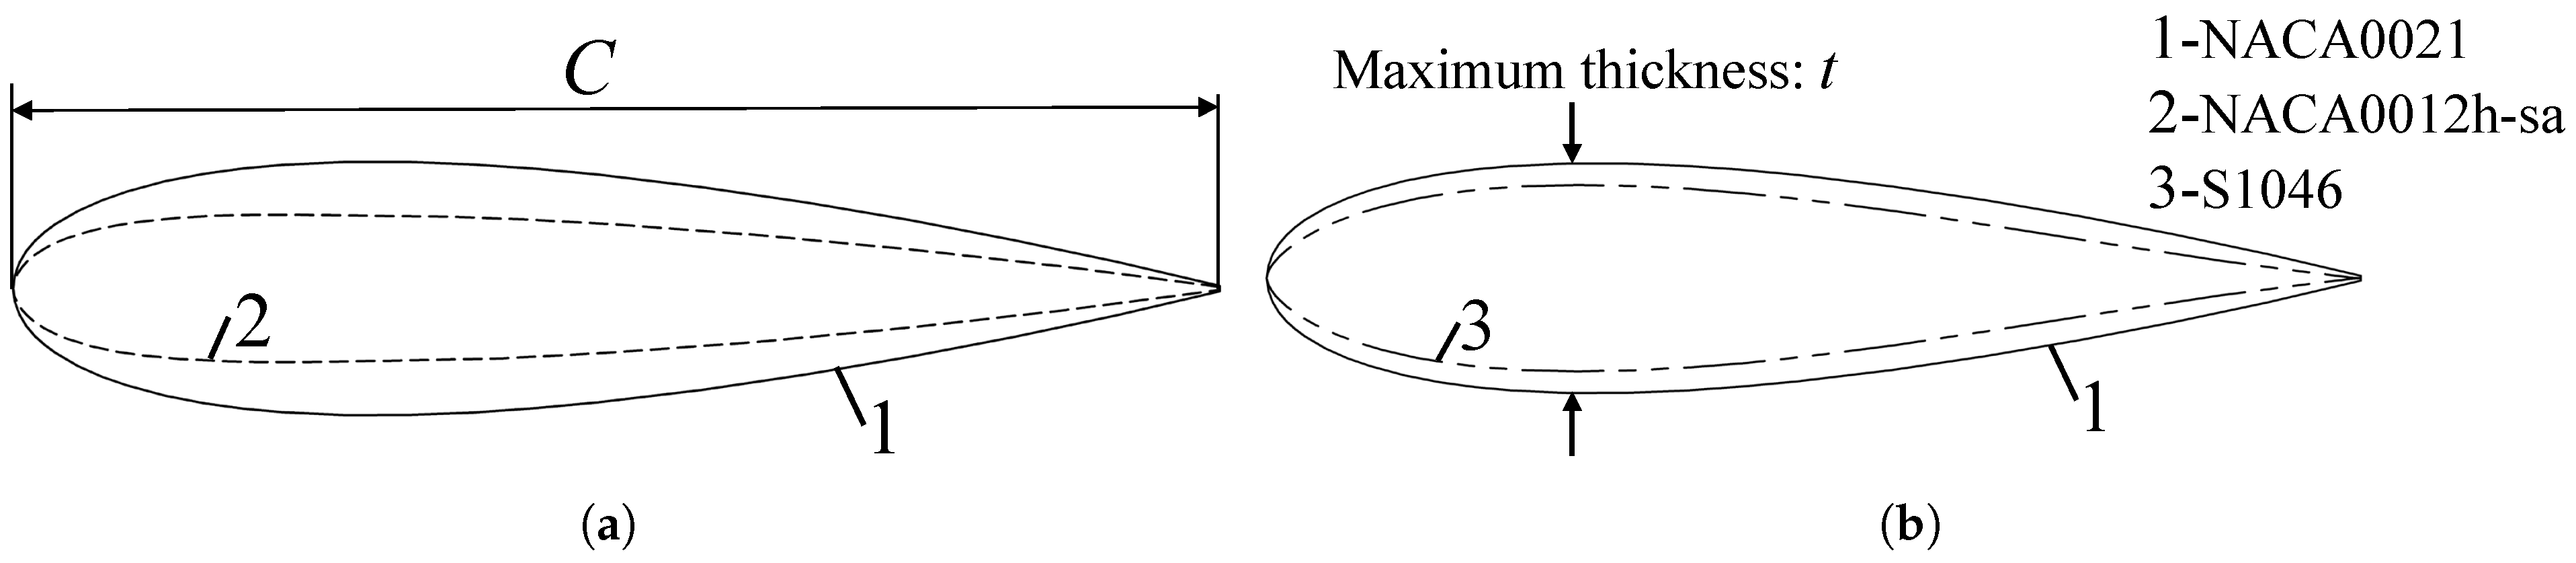
Regarding airfoil aspects, considering that symmetric airfoils are suitable for the reciprocating flow characteristics of VAWT with stable performance at low Reynolds numbers, it was found that the flow control effect using NACA0012 in TO-DGF airfoils is most significant [38]. The internal flow field of S1046 airfoil wind turbines is more regular, with smoother streamlines that improve to varying degrees the vortices flowing through the blade tips and inside the wind turbine, reducing energy loss to a certain extent, and having better self-starting performance than the NACA0018 airfoil. Therefore, three airfoils—NACA0021, NACA0012, and S1046—covering different aerodynamic characteristics are selected for comparative analysis as shown in Figure 7. The t / C ratio reflects the maximum thickness percentage in the airfoil characteristics, with NACA0021, NACA0012, and S1046 having t / C ratios of 21%, 12%, and 17%, respectively.

2.4. Taguchi Experimental Design

The Taguchi method can efficiently identify the main effects of multiple design factors on VAWT aerodynamic performance, thereby determining the most influential factors. According to the parameters affecting VAWT aerodynamic performance mentioned in Section 2.3, the Taguchi experimental scheme is set as shown in Table 4. The levels for the TO-DGF position (0.05C, 0.1C, and 0.15C) were selected to cover the critical region of the blade trailing edge where flow separation typically initiates. Placing flow control devices in this region is most effective for modifying the Kutta condition and suppressing the development of trailing-edge vortices. Similarly, TO-DGF-height levels (1%C, 1.25%C, and 1.5%C) were selected to match the order of the trailing-edge boundary-layer thickness, following common micro-tab design practice. Too small a height provides limited control authority, whereas too large a height tends to increase wake loss and drag; therefore, this range is expected to provide a practical lift–drag trade-off.
A full-factorial design with three factors at three levels requires 27 runs ( 3 3 ). In this study, a standard L9 ( 3 3 ) orthogonal array was adopted to efficiently evaluate the main effects, reducing the number of runs from 27 to 9 (33.3% of the full-factorial design), while higher-order interactions were not explicitly resolved.

3. Analysis

3.1. Taguchi Experimental Design Results

This study focuses on the aerodynamic performance optimization of VAWT in the high-efficiency range of tip speed ratios. Based on the high-efficiency range of TSR = 2.0 to 3.0 identified in similar studies, TSR = 2.4 was selected as the typical operating condition, with the low tip speed ratio of TSR = 1.5 serving as a comparison case. The parameter schemes and corresponding C P , ave optimization results are shown in Table 5. The signal-to-noise ratio of average torque under different tip speed ratios was used as the evaluation metric, with the formula as follows:
S / N = 10 × log 1 n i = 1 n 1 y i 2
where S/N is the signal-to-noise ratio and y i is the evaluation index; in this study, y i is taken as the power coefficient C P (wind energy utilization efficiency).

3.2. Analysis of Influencing Factors

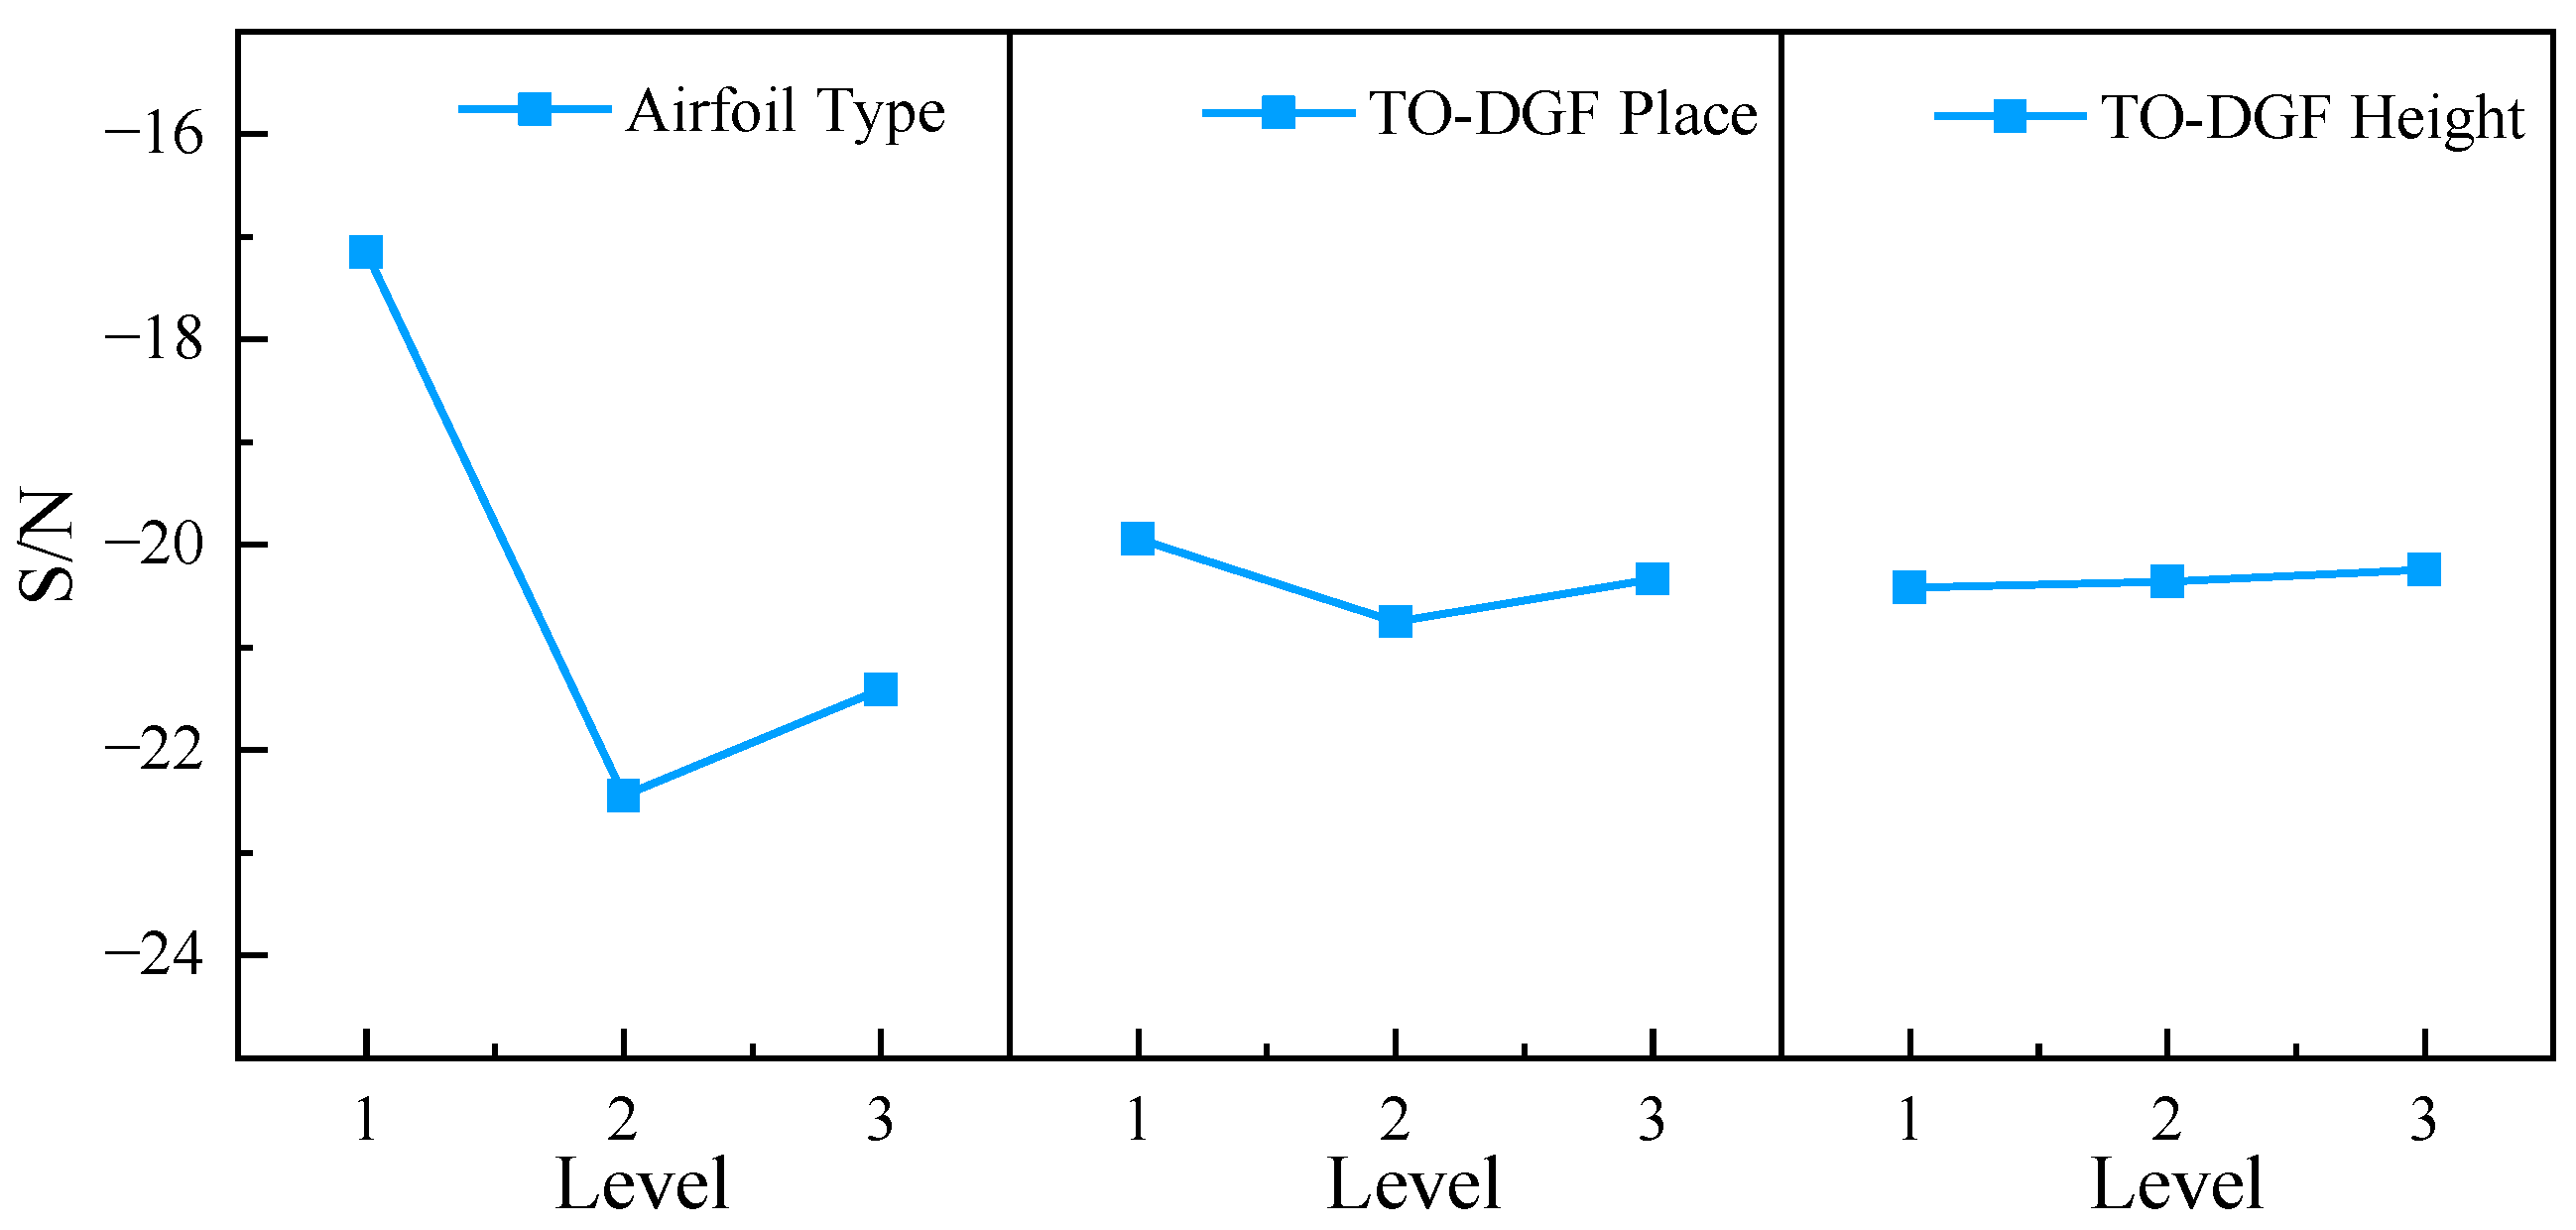
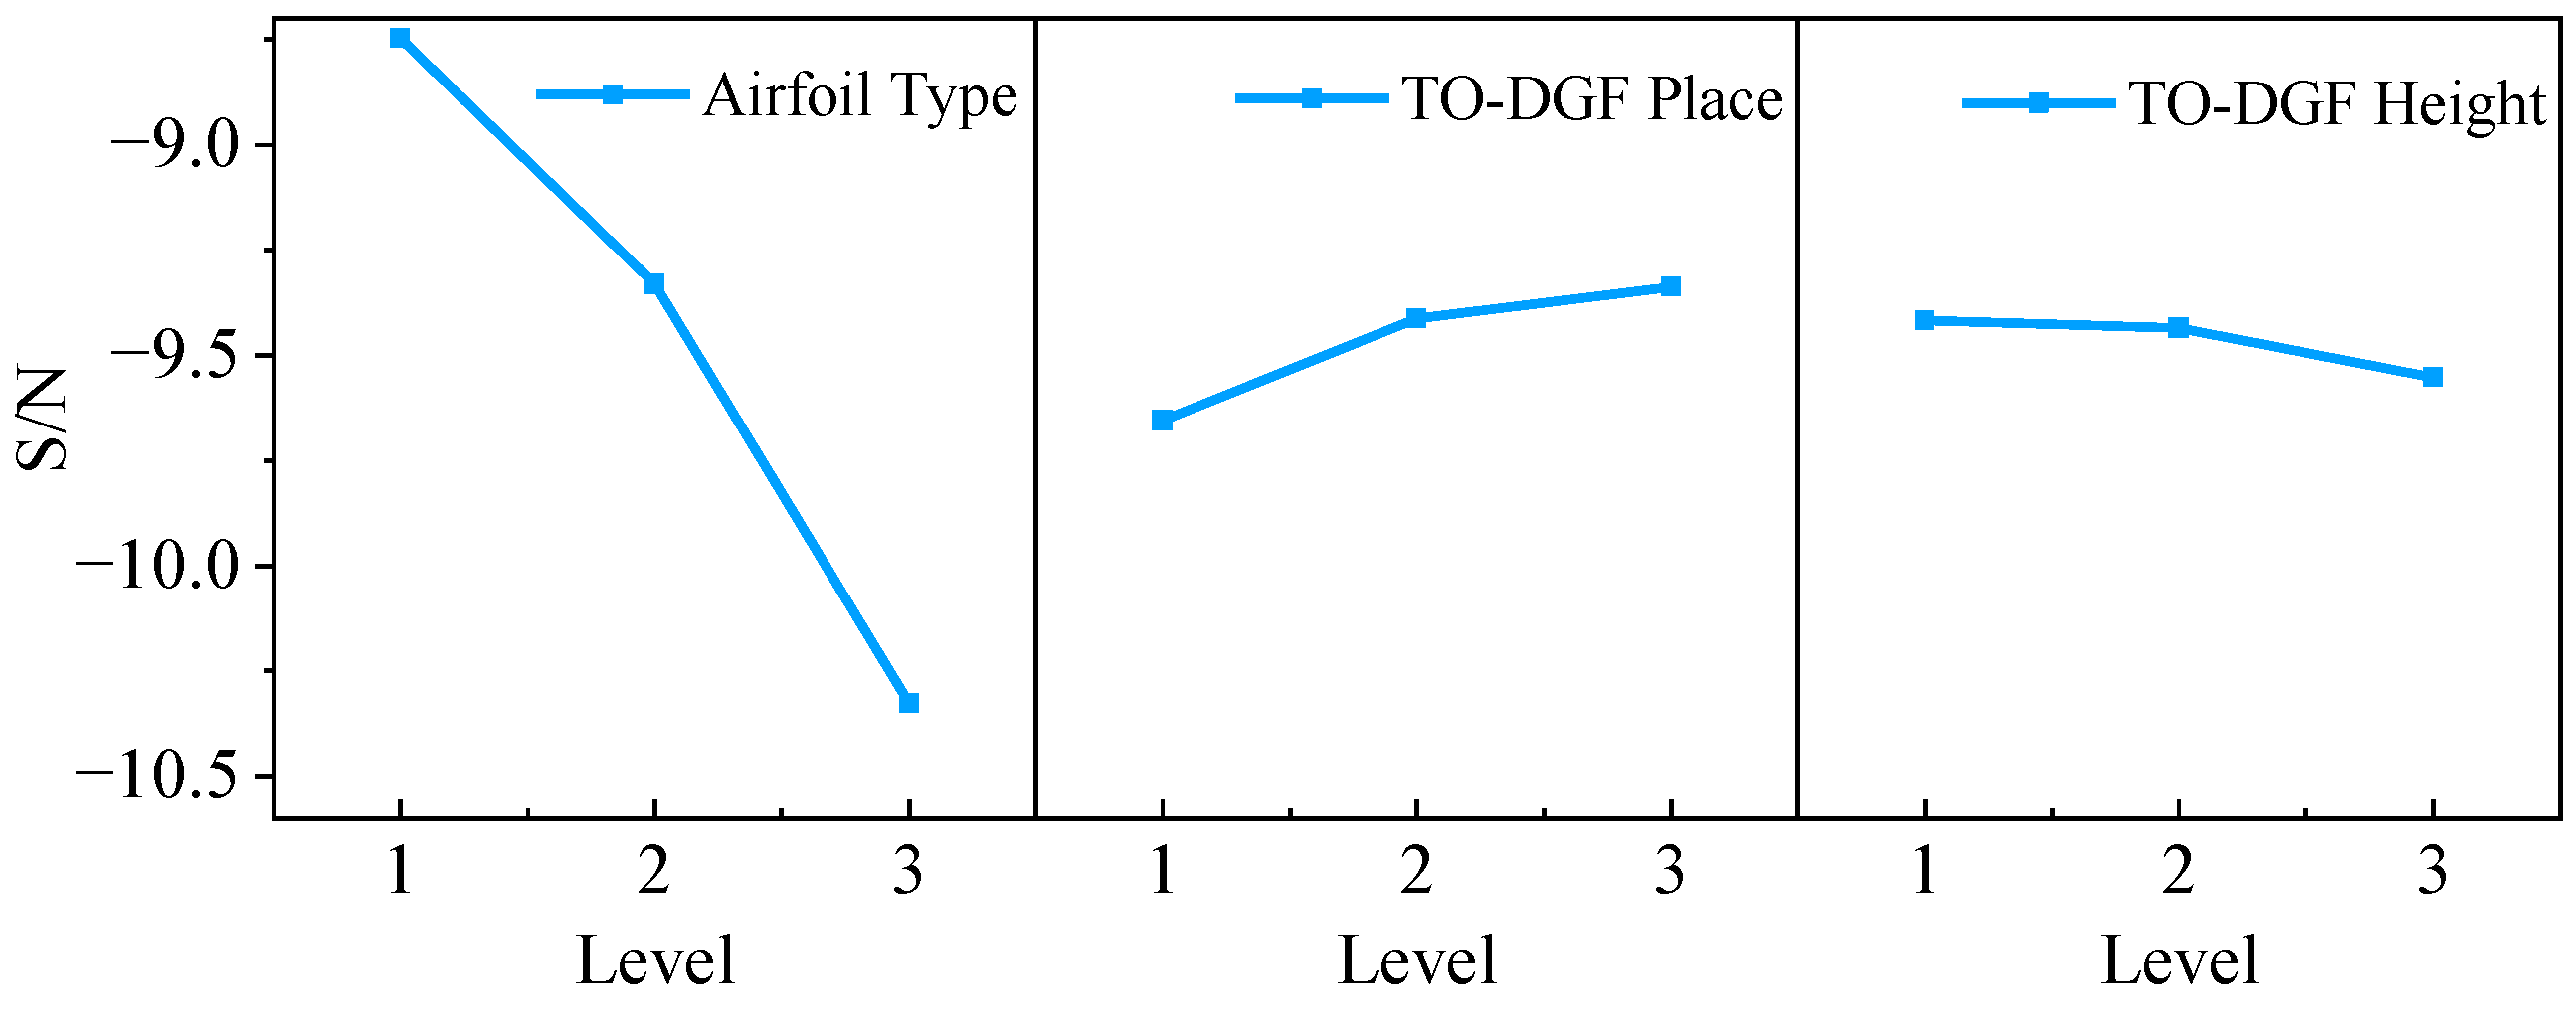
Since larger C P , ave values indicate better aerodynamic performance for VAWT, this experiment adopted the larger-the-better criterion, selecting the maximum S/N value to determine the optimal value. The signal-to-noise ratio response tables obtained at TSR = 1.5 and TSR = 2.4 are shown in Table 6. Figure 8 and Figure 9 illustrate the variation trends of each factor across different levels.
The ANOVA (Analysis of Variance) results are shown in Table 7, which reveals that among the influencing factors, the airfoil type is identified as the dominant factor, contributing 95.57% and 94.95% to the total variance at TSR = 1.5 and TSR = 2.4, respectively. This overwhelming dominance indicates a high geometric sensitivity of the TO-DGF strategy. It suggests that the flow control mechanism does not function independently but is strictly constrained by the baseline aerodynamic characteristics (thickness and camber) of the blade. Although the contribution of TO-DGF Place appears secondary (approximately 2% to 4%), it is treated as a secondary tuning parameter rather than a statistically dominant factor under the current three-level design. Consistently, the p-values for TO-DGF Place in Table 7 are above 0.05, indicating limited statistical significance in this dataset. Further refinement of this factor would require a denser level setting (smaller spacing around the favorable range) to resolve its effect in greater depth. Once a compatible airfoil (e.g., NACA0021) is selected, optimizing the DGF position is essential to precisely match the local separation point and maximize the aerodynamic gain. The TO-DGF Height shows a negligible contribution (<0.6%), indicating that the control effectiveness is relatively robust to minor variations in height within the tested range.
Based on this analysis, the applicability of TO-DGF is predominantly dictated by the airfoil geometry, followed by the specific placement of the device. The low statistical significance of the TO-DGF height indicates that the aerodynamic performance is stable within the explored optimal range (1%C to 1.5%C). Exploring higher levels would not improve performance because exceeding the local boundary-layer thickness turns the structure into a bluff body, inducing excessive parasitic drag.
Consequently, TO-DGF Height is excluded from the detailed flow field analysis in the next section. It should be noted that the fractioned Taguchi design adopted in this study evaluates main effects only and does not allow for a statistical assessment of interaction effects. Therefore, the following discussion is limited to a qualitative, physics-based interpretation of the coupled influence of airfoil type and TO-DGF placement on the flow field at TSR = 2.4 and TSR = 1.5.

4. Discussion

4.1. Optimization Comparison at Medium Tip Speed Ratio TSR = 2.4

4.1.1. Effect of Airfoil Type at TSR = 2.4

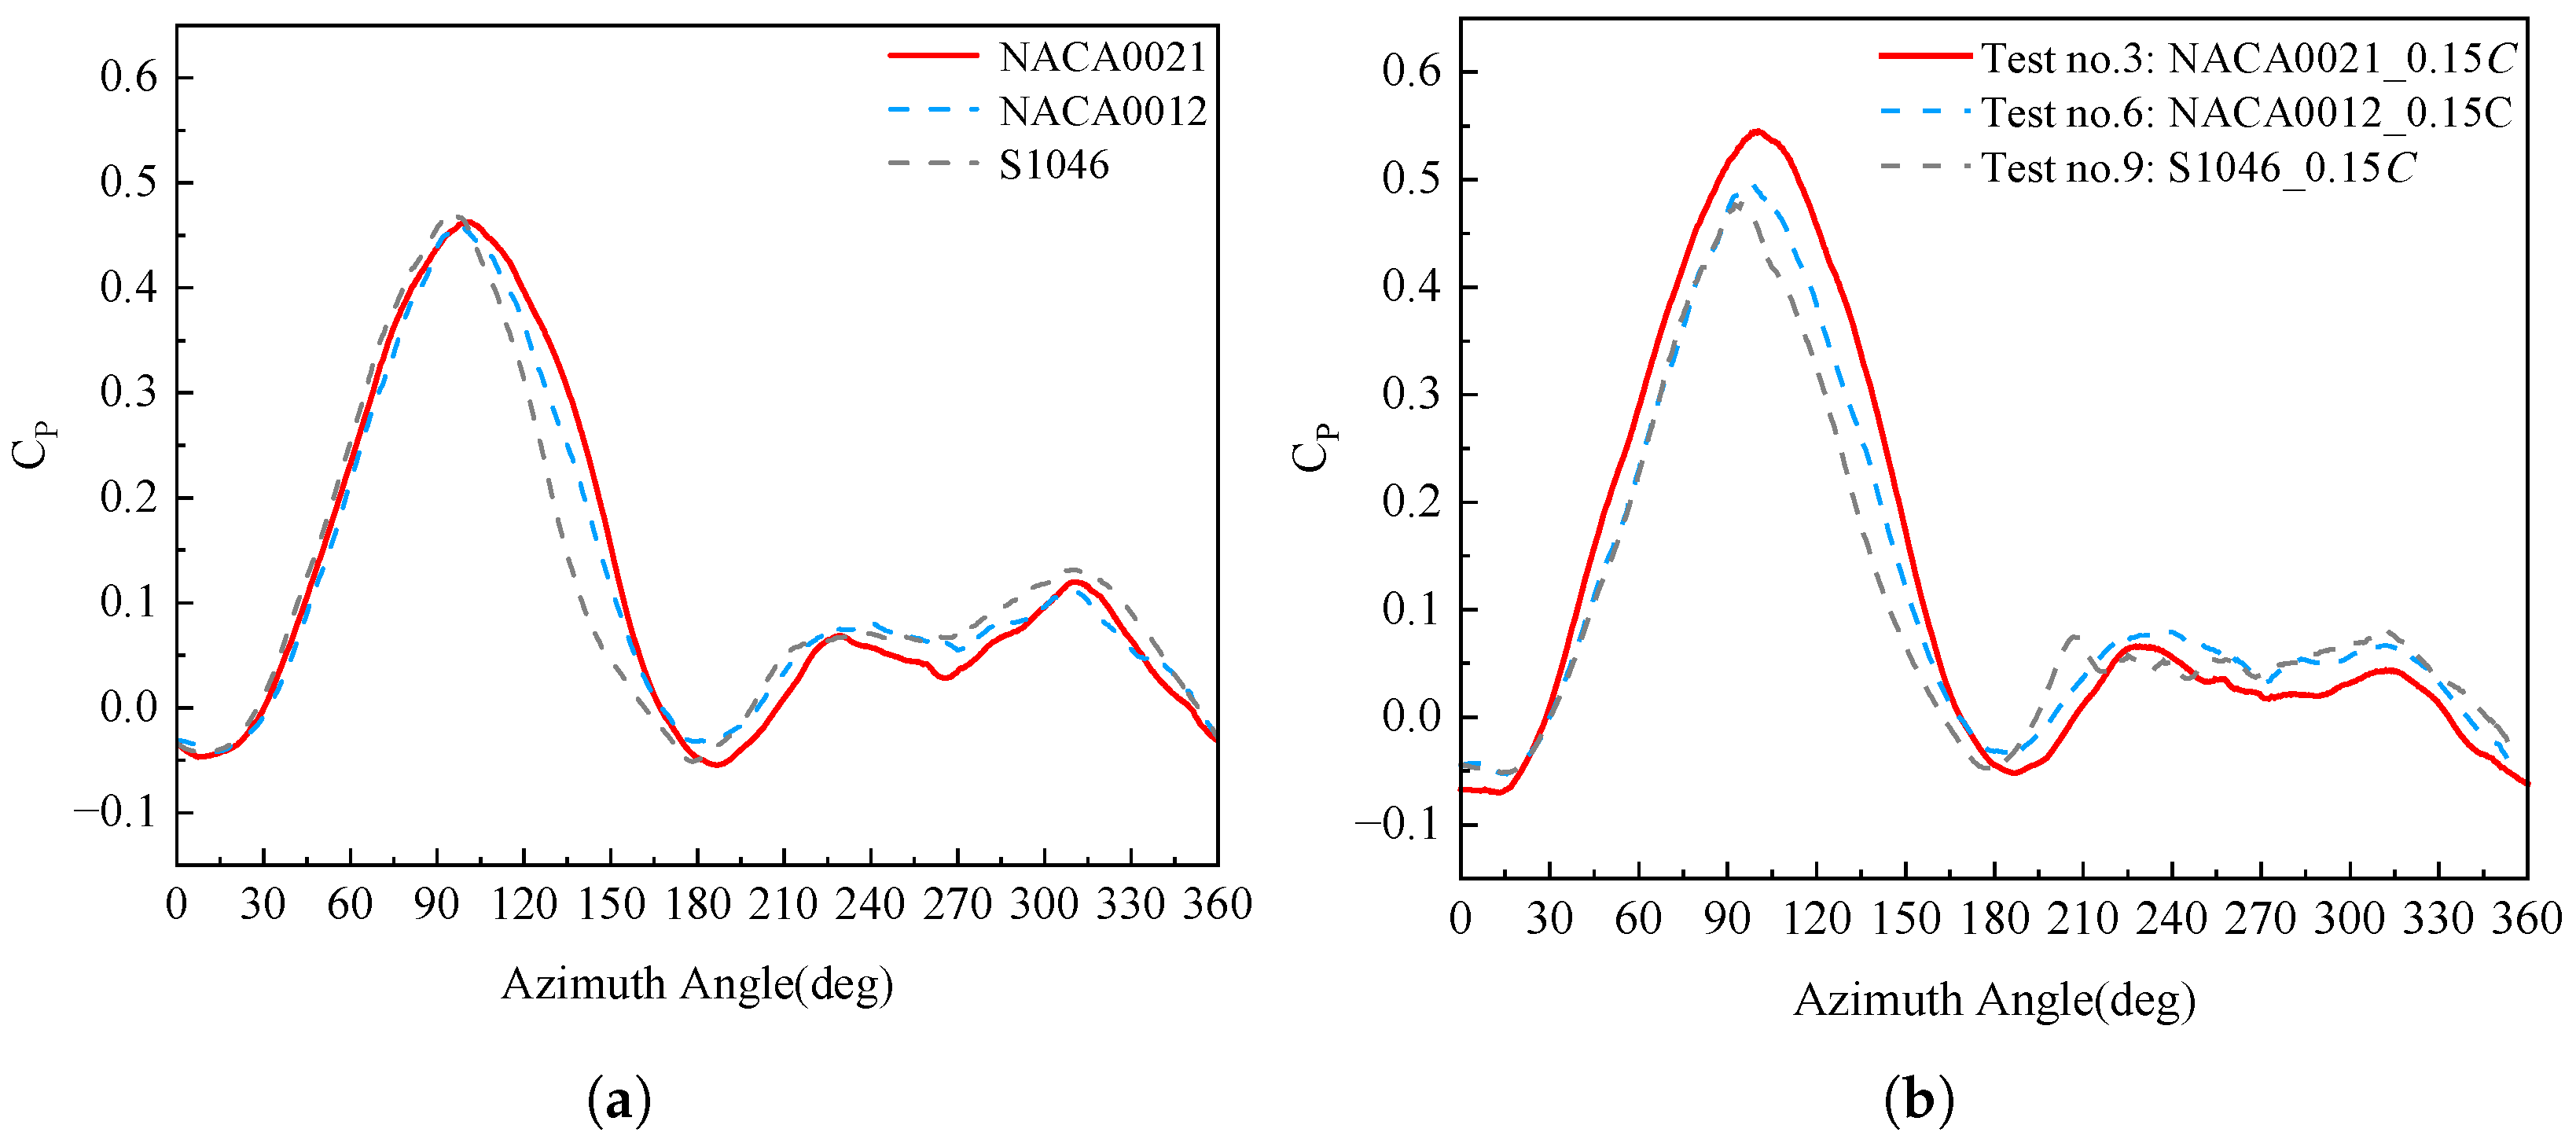
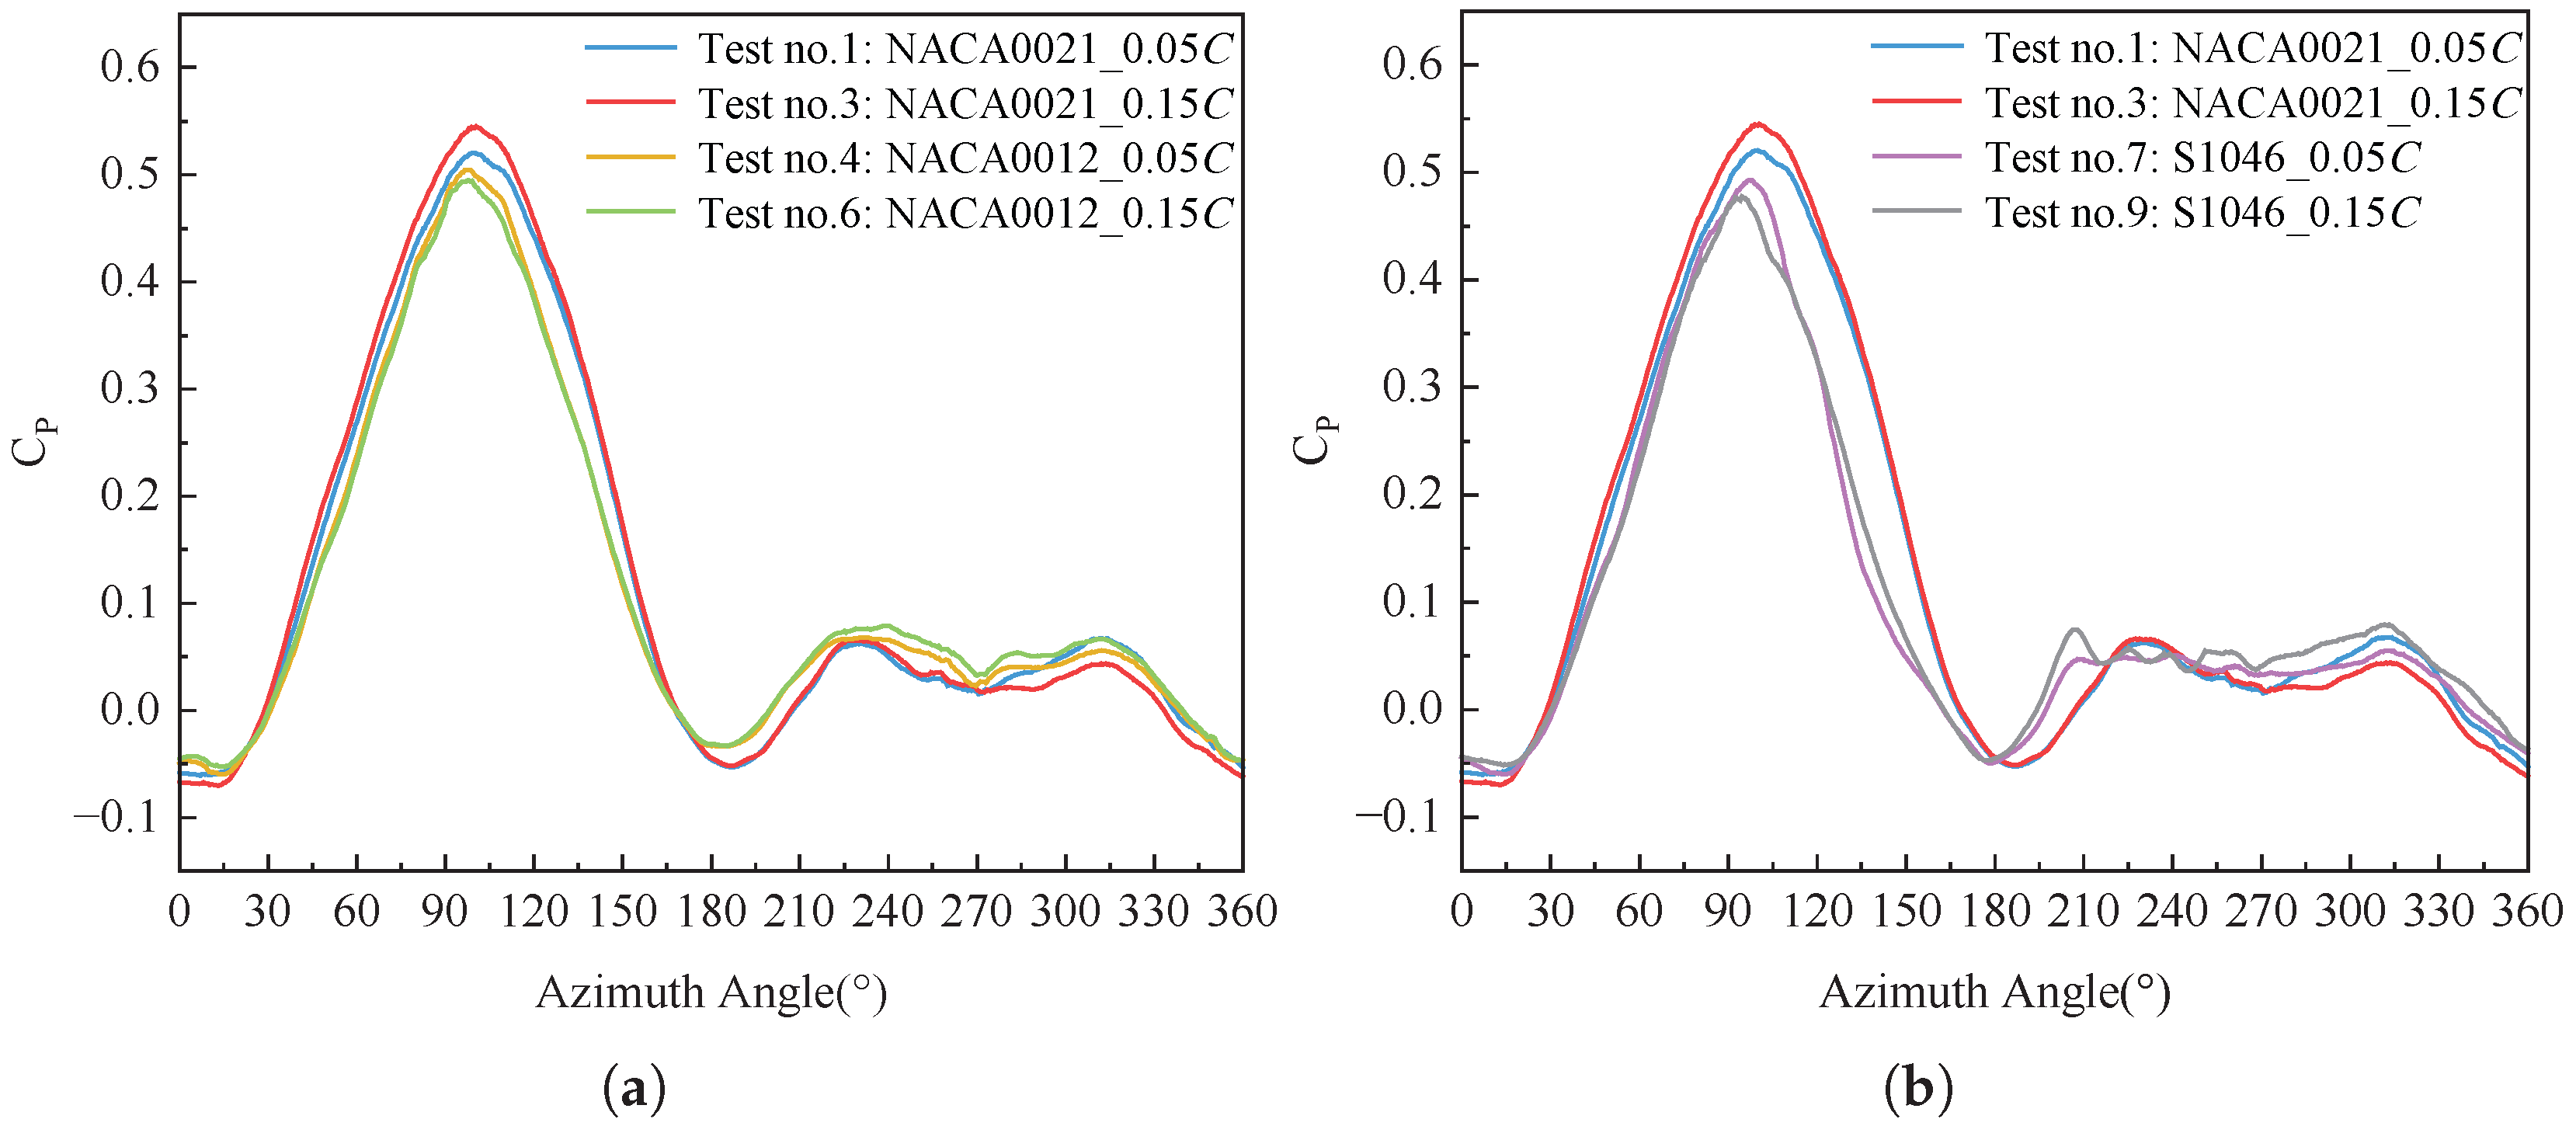
As shown in Table 5, at TSR = 2.4, the maximum C P , ave values for NACA0021, NACA0012, and S1046 appear under Test no. 3, no. 6, and no. 9 conditions, respectively. The variation of C P with the azimuth is compared as shown in Figure 10. Among the three optimization schemes, only NACA0021 shows improvement in C P (total C P , ave increased by 3.48%), with the main improvement region being the upwind area, while NACA0012 and S1046 show minimal change or decline (total C P , ave decreased by 1.76% and 9.55%, respectively). For TO-DGF acting on a single blade, the C P , ave of NACA0021 increased by 6.7% and 15% compared to NACA0012 and S1046, respectively.
This performance divergence is fundamentally linked to the thickness effect. For the thick NACA0021, the TO-DGF successfully energizes the shear layer to suppress its severe trailing-edge separation. Conversely, for the thinner NACA0012, the natural flow separation is less severe; thus, the TO-DGF acts more as an obstacle, introducing additional parasitic drag that outweighs the lift benefits.
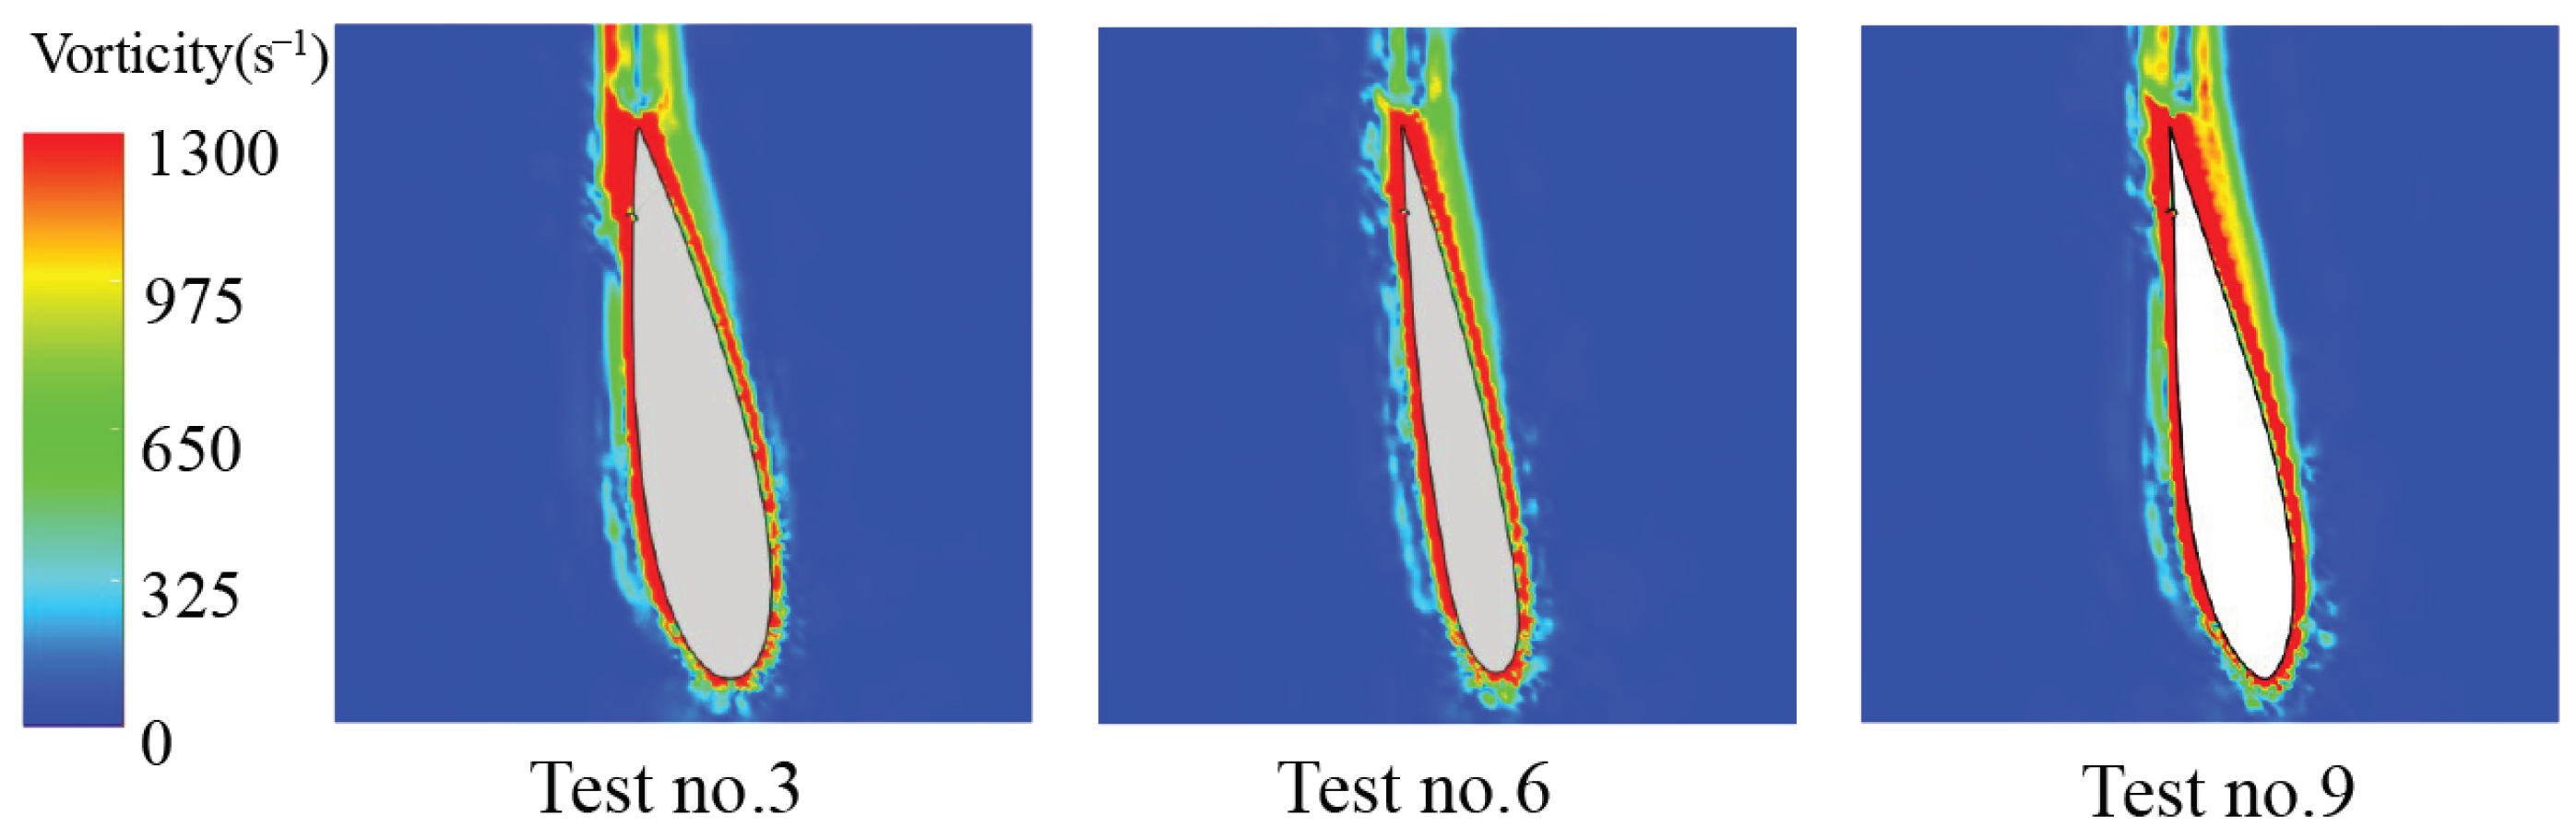
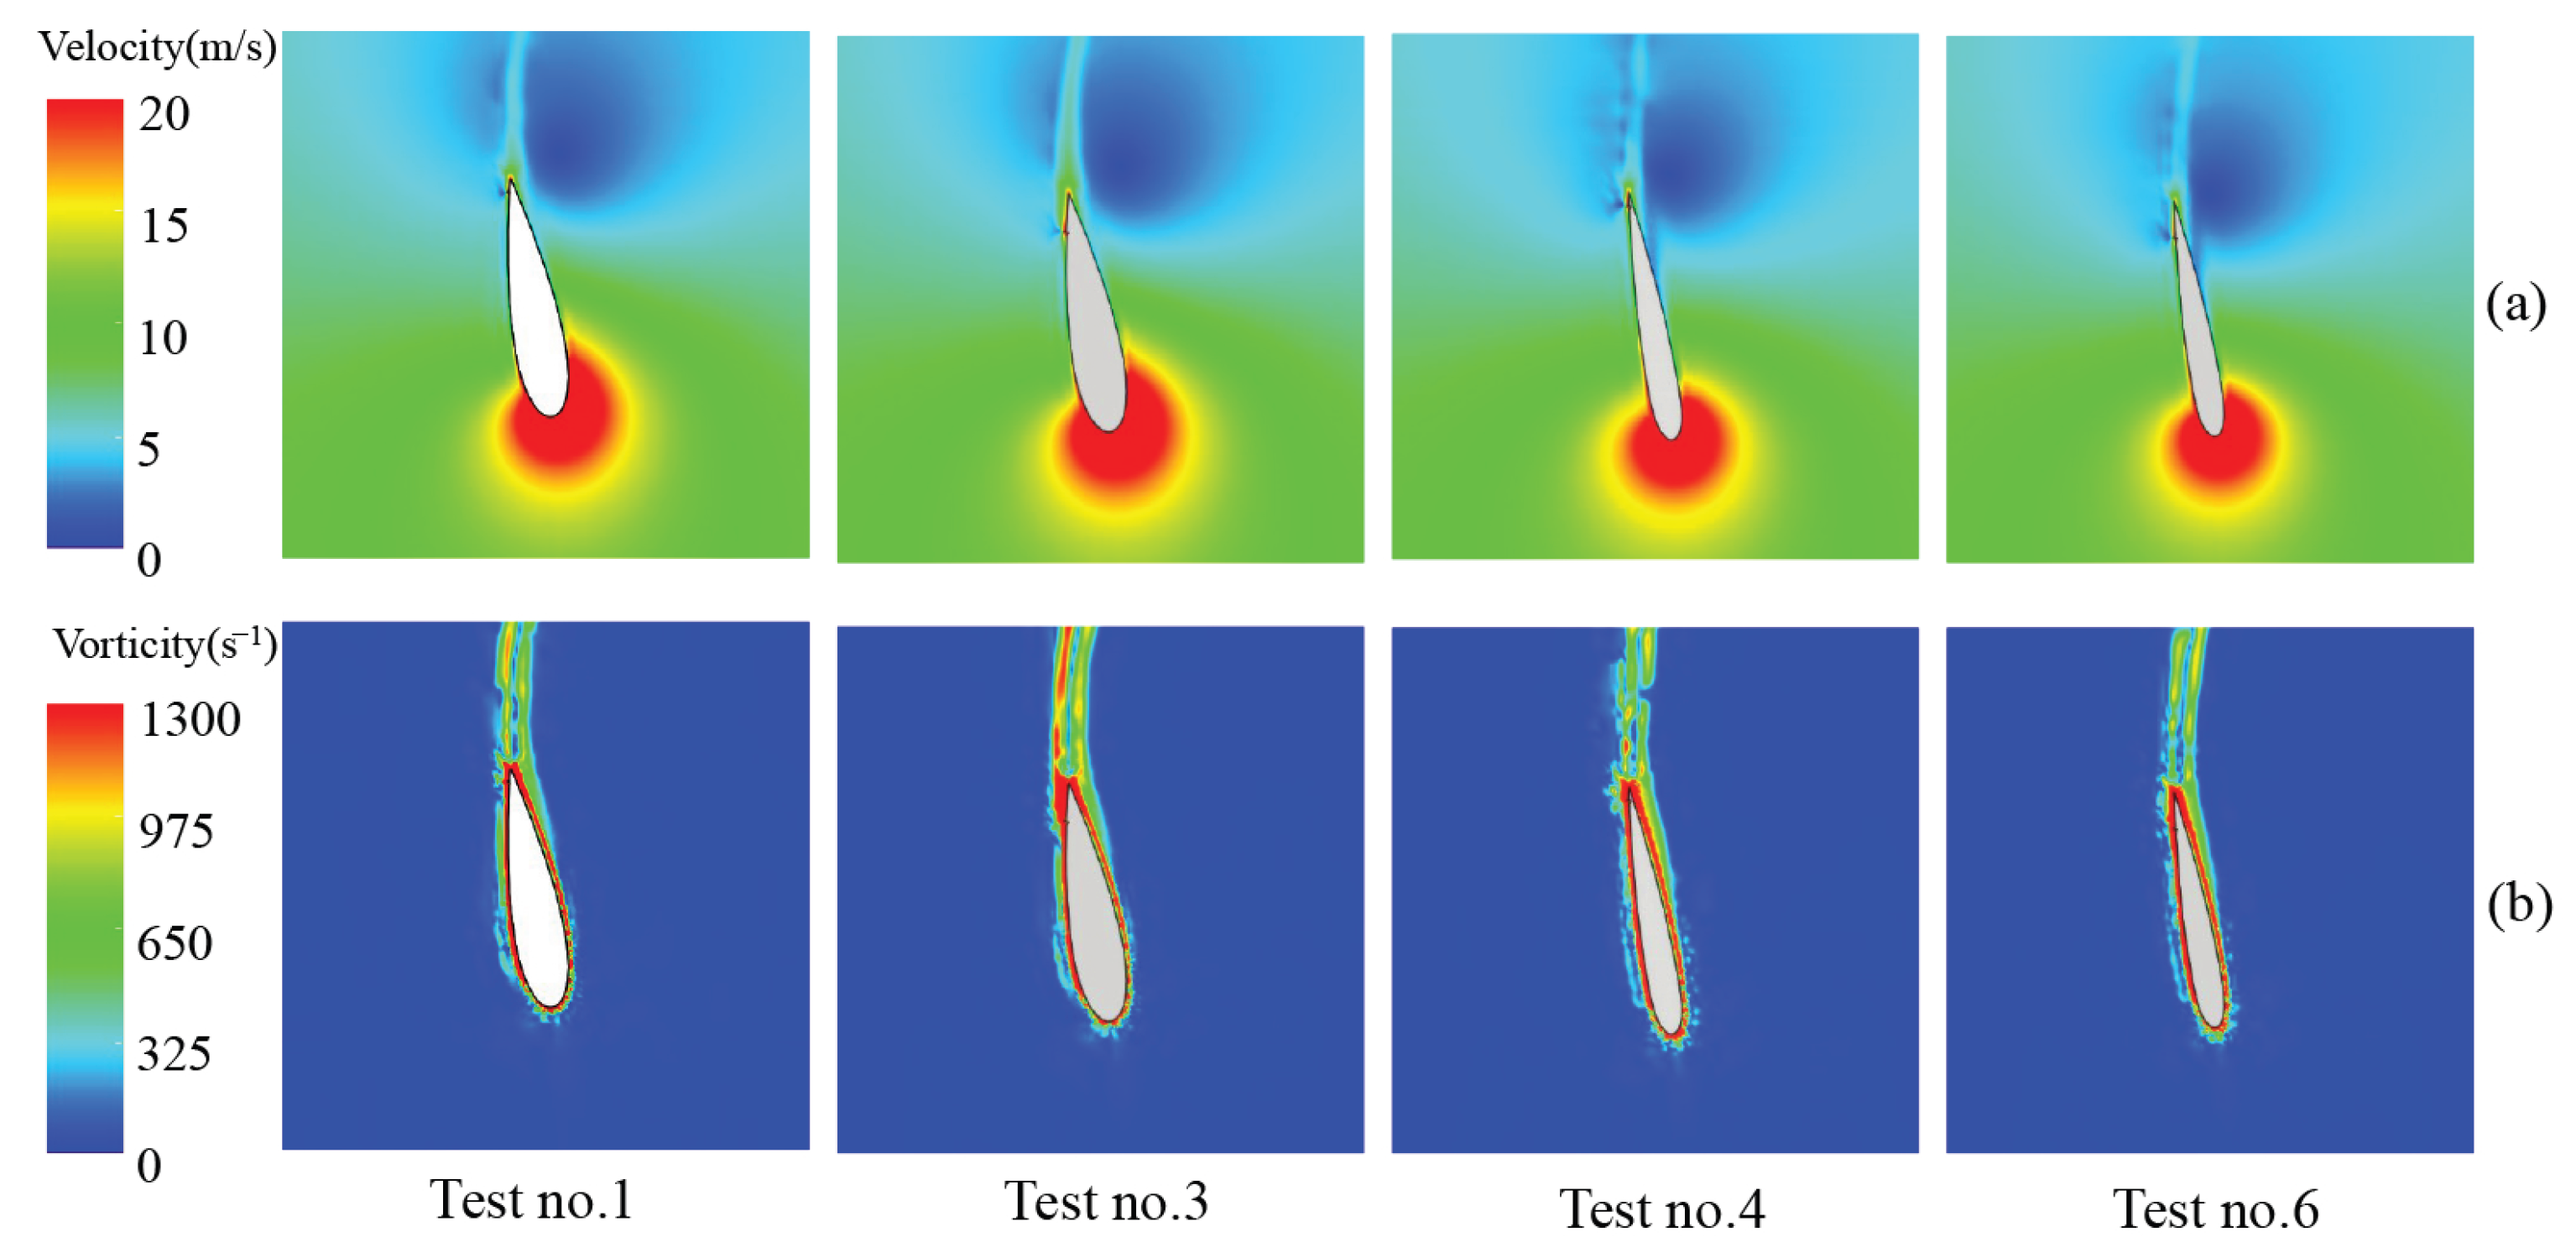
As shown in Figure 10, at θ = 100°, the C P of test no. 3, no. 6, and no. 9 are near their peaks at 0.54, 0.48, and 0.45, respectively. The vorticity at this moment can be observed from Figure 11: the trailing edge vorticity of test no. 3 is concentrated near the pressure surface, with good flow attachment on the suction surface and weak separation; in contrast, the vorticity of test no. 6 and no. 9 is mainly distributed on the suction surface side, and the vorticity intensity and range of no. 9 are larger, indicating more significant flow separation. Strong flow separation on the suction surface typically represents a higher adverse pressure gradient, which leads to reduced pressure difference between the two sides of the blade (reduced lift) and increased form drag, resulting in the lowest C P for the test no. 9 scheme.

4.1.2. TO-DGF Position Effect on Upwind Region

At TSR = 2.4, the C P , ave of all three schemes using 0.15C shows improvement compared to 0.05C, with the NACA0021, NACA0012, and S1046 airfoil schemes increasing by 2.3%, 2.1%, and 6.6%, respectively. The instantaneous power coefficients of the two comparison groups are shown in Figure 12. It is observed that the forward movement of GF for the NACA0021 airfoil mainly improves C P in the upwind zone, while NACA0012 and S1046 airfoils mainly improve C P in the downwind zone. Therefore, schemes corresponding to NACA0021 and NACA0012 airfoils are selected for comparison in the upwind zone. Under TSR = 2.4 conditions, blade flow separation is weak, and compared to the TSR = 1.5 condition with strong flow separation, the benefits produced by flow control are lower.
At θ = 100°, which is the position of C P values, the flow structure around the blade is shown in Figure 13. From test no. 3, it is observed that the forward movement of the GF position expands the vorticity range at the pressure side trailing edge. The vortex induced by the GF will induce incoming wind to enter the separation zone, thereby delaying dynamic stall, meaning the blade produces a higher wind energy utilization rate. Due to the smaller t / C ratio of the NACA0012 blade, in test no. 6, the forward movement of the GF position reduces the vorticity generated by the GF on the trailing edge pressure surface. From Figure 13, it can be observed that the trailing edge vorticity on the pressure surface of test no. 3 is greater, producing a larger induced force at this position, which helps suppress the trailing-edge flow separation.

4.1.3. TO-DGF Position Effect on Downwind Region

At θ = 310°, the VAWT operates in the downwind zone. According to the comparison of C P for single blade in the downwind zone between the two schemes in Figure 12, the TO-DGF Place scheme using 0.15C compared to 0.05C shows that the C P of the NACA0021 airfoil decreased by 53%, while the C P of NACA0012 and S1046 airfoils increased by 20% and 35%.
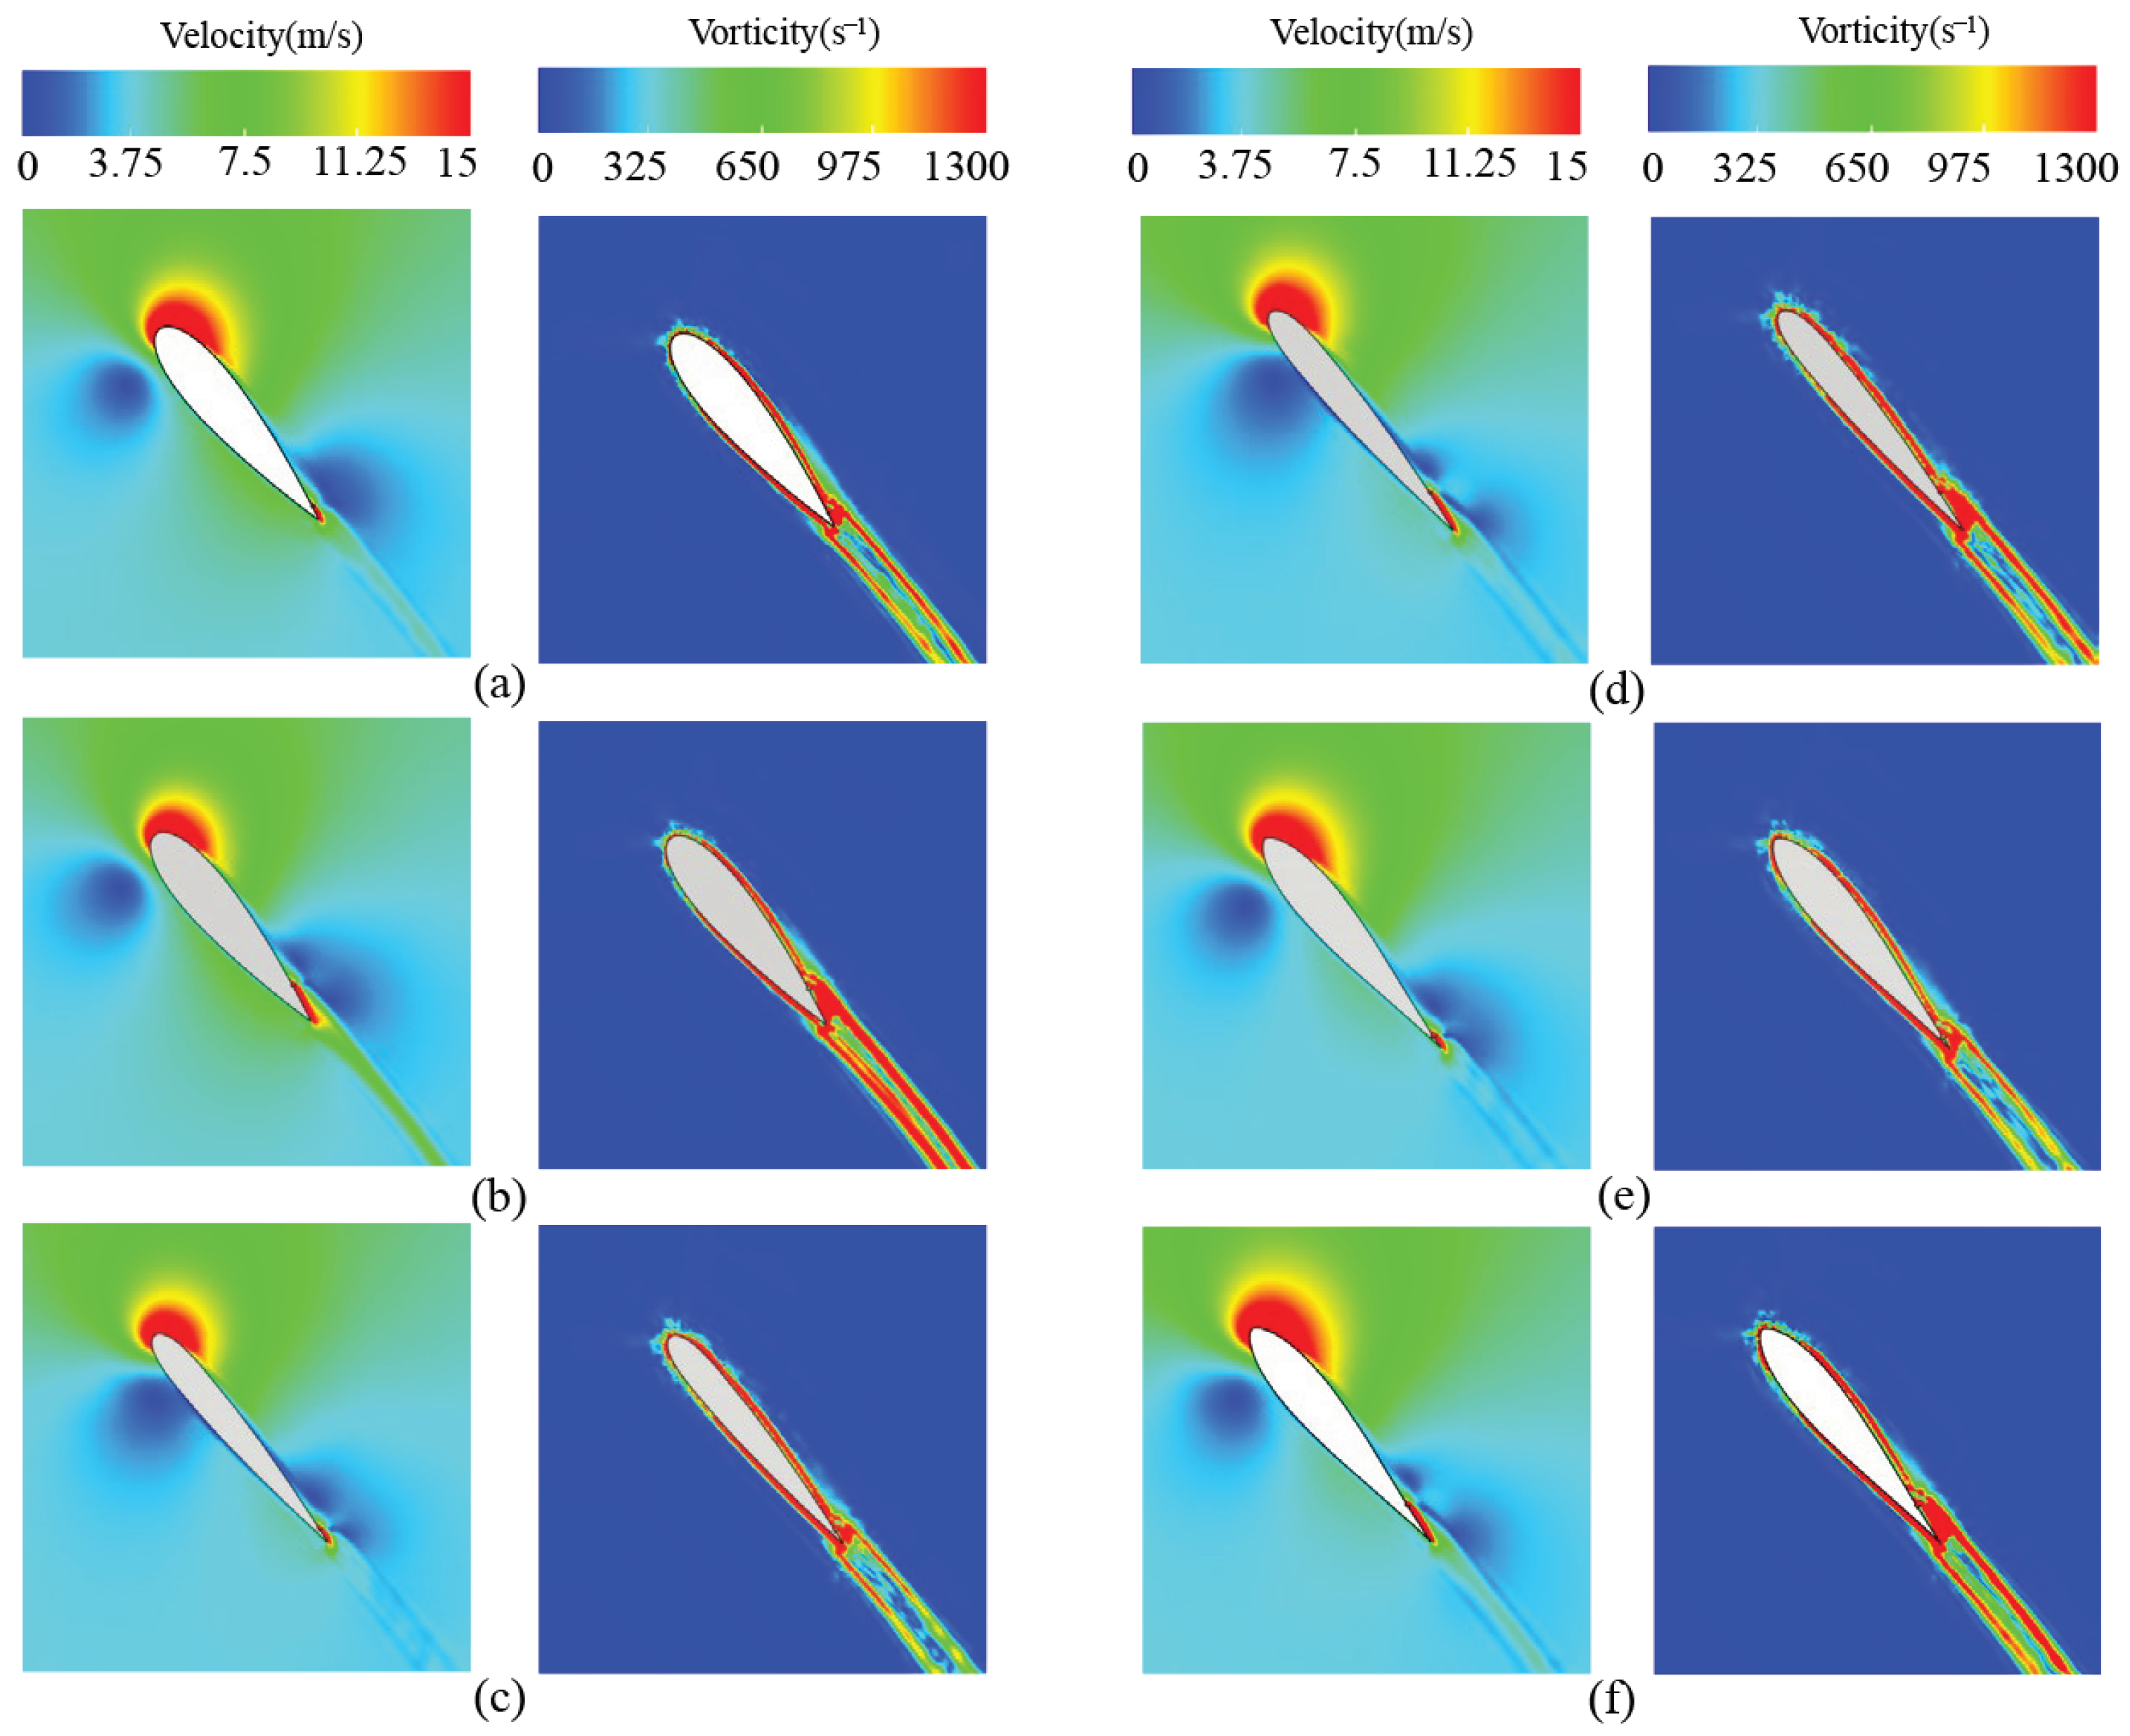
The velocity contours and vorticity distribution of the three airfoils are shown in Figure 14. When the blade operates in the downwind zone, the pressure surface and suction surface of the blade interchange. For the test no. 3 scheme in the NACA0021 airfoil, the Gurney flap position away from the trailing edge increases the vorticity on the suction surface of the blade trailing edge. The generated separation flow stagnates on the blade suction surface, and the increased adverse pressure gradient reduces lift and increases blade operating resistance.
Based on the above analysis, at TSR = 2.4, the NACA0021 airfoil demonstrates the best aerodynamic performance. For all three airfoils, the GF position at 0.15C (away from the blade trailing edge) provides better aerodynamic performance. The NACA0021 airfoil mainly improves C P in the upwind region, while NACA0012 and S1046 airfoils mainly improve C P in the downwind region.

4.2. Optimization Comparison at Low Tip Speed Ratio TSR = 1.5

4.2.1. Effect of Airfoil Type at TSR = 1.5

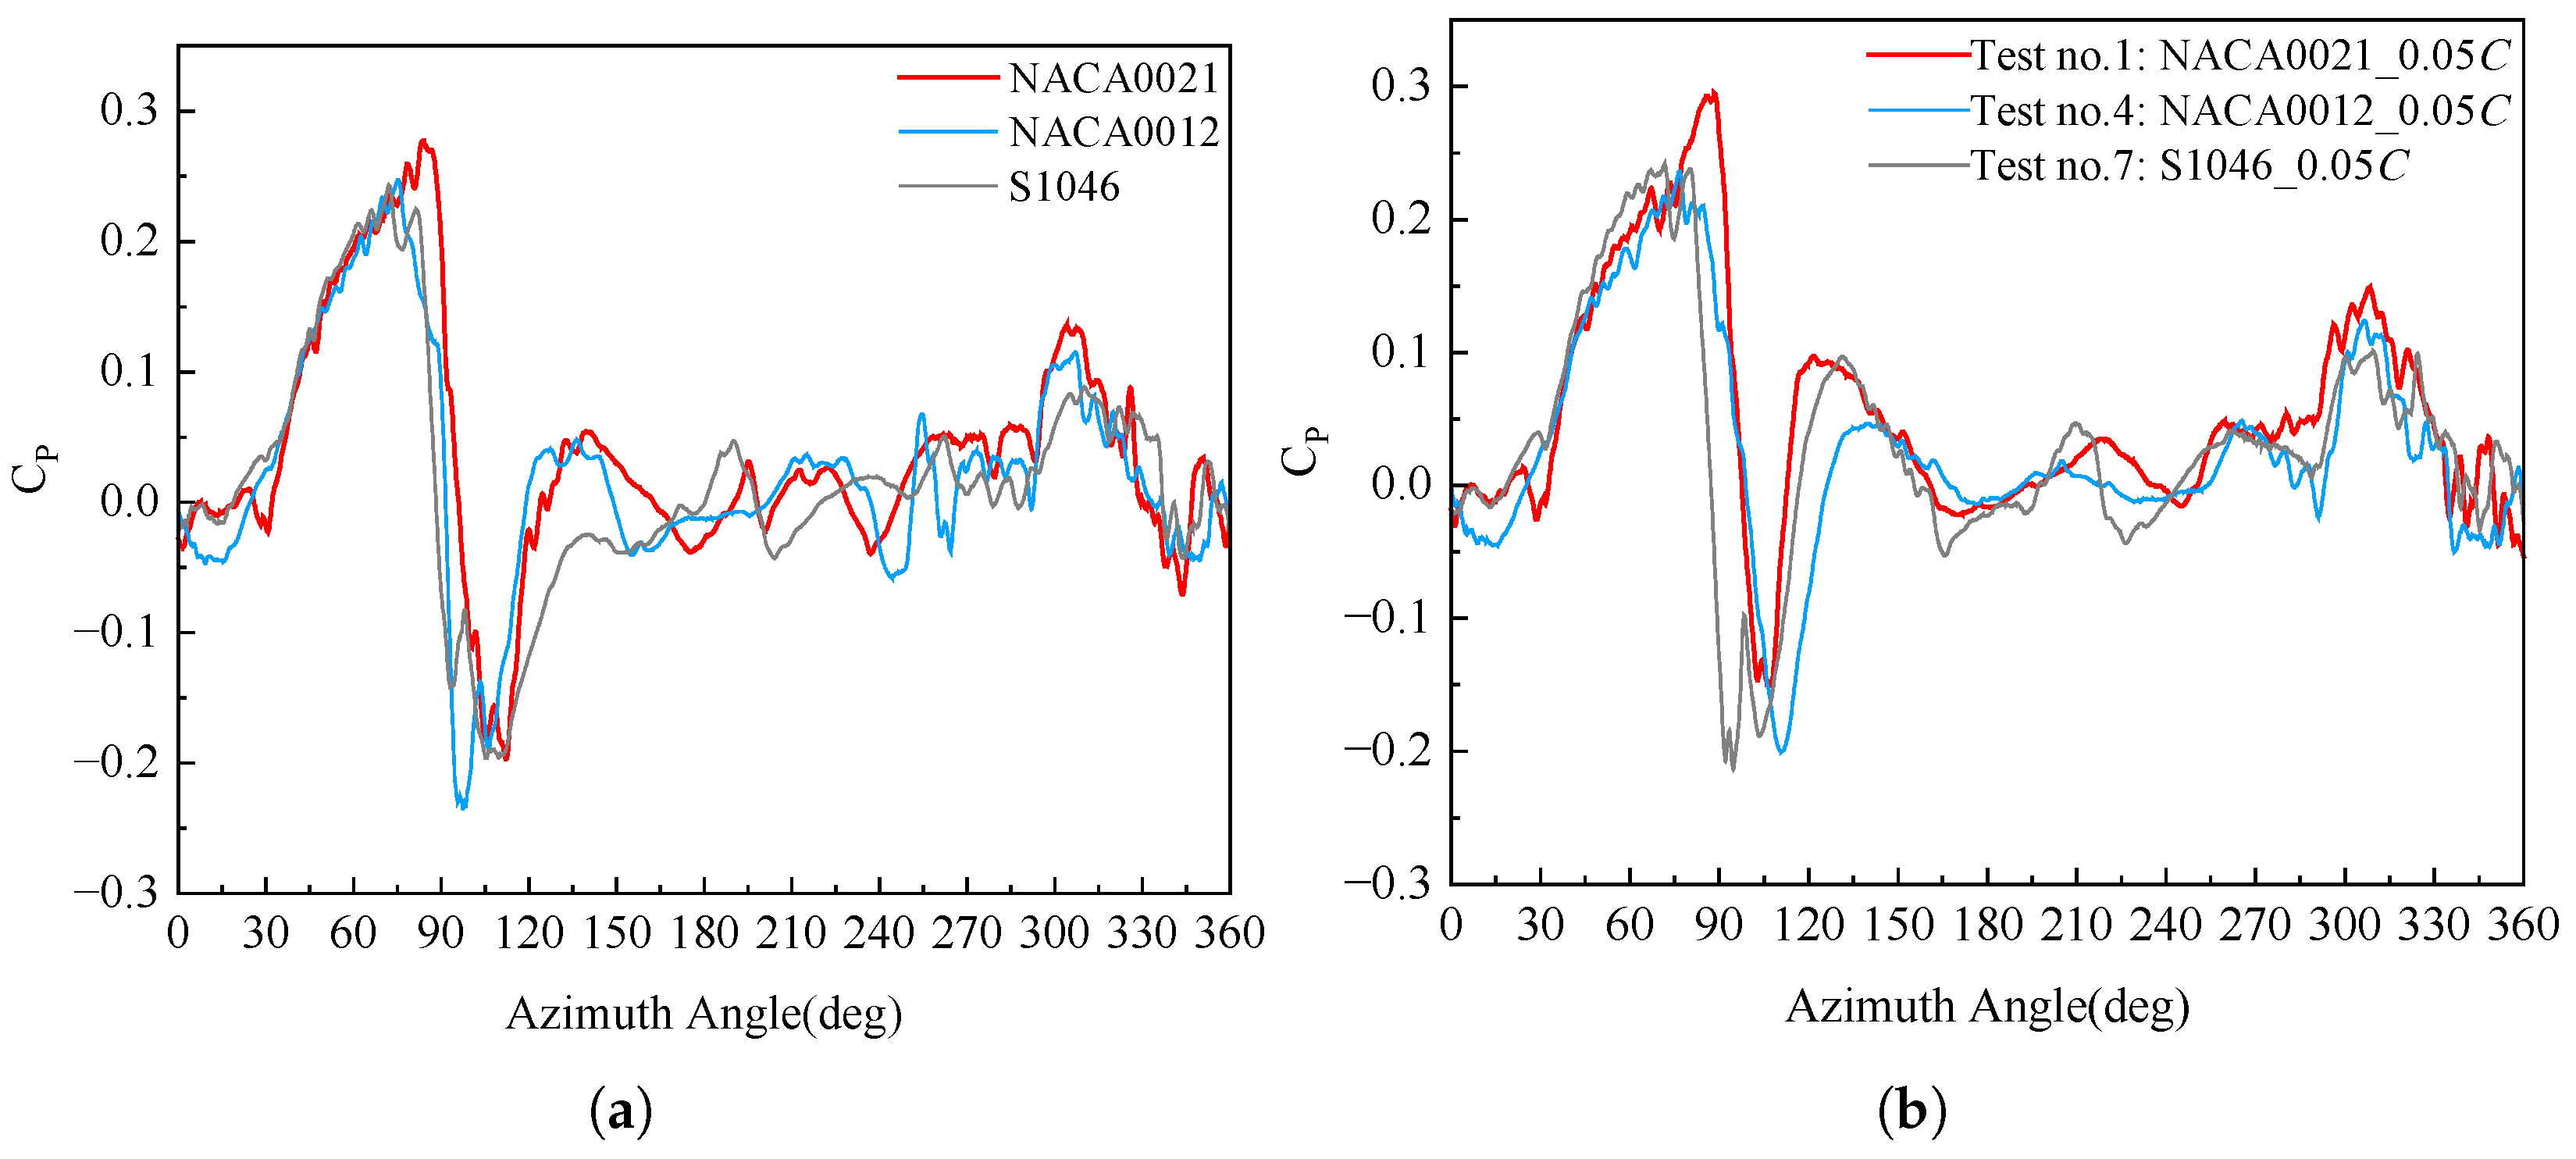
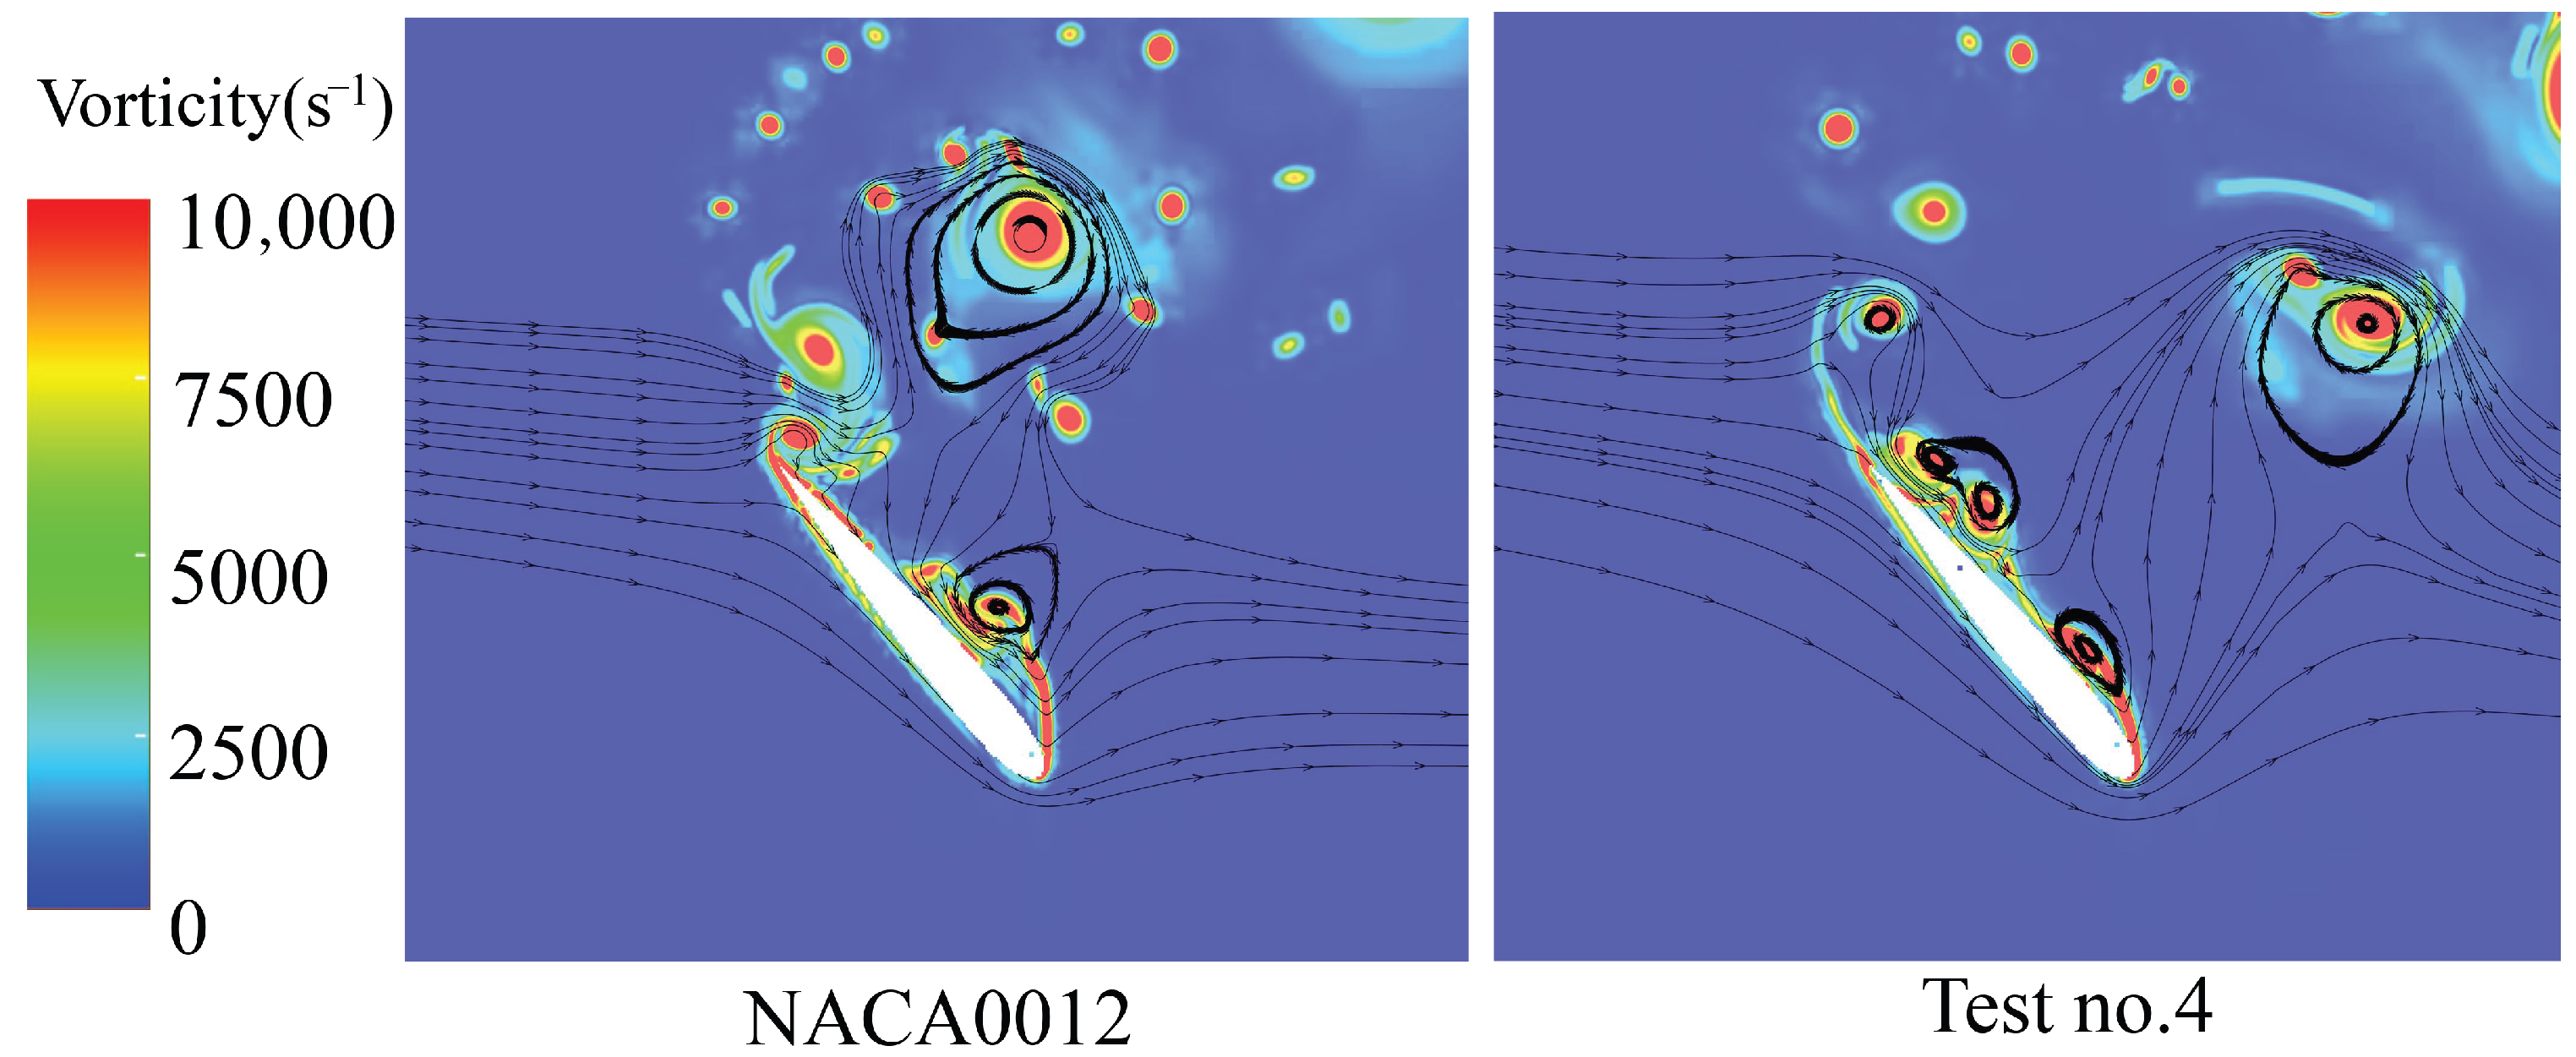
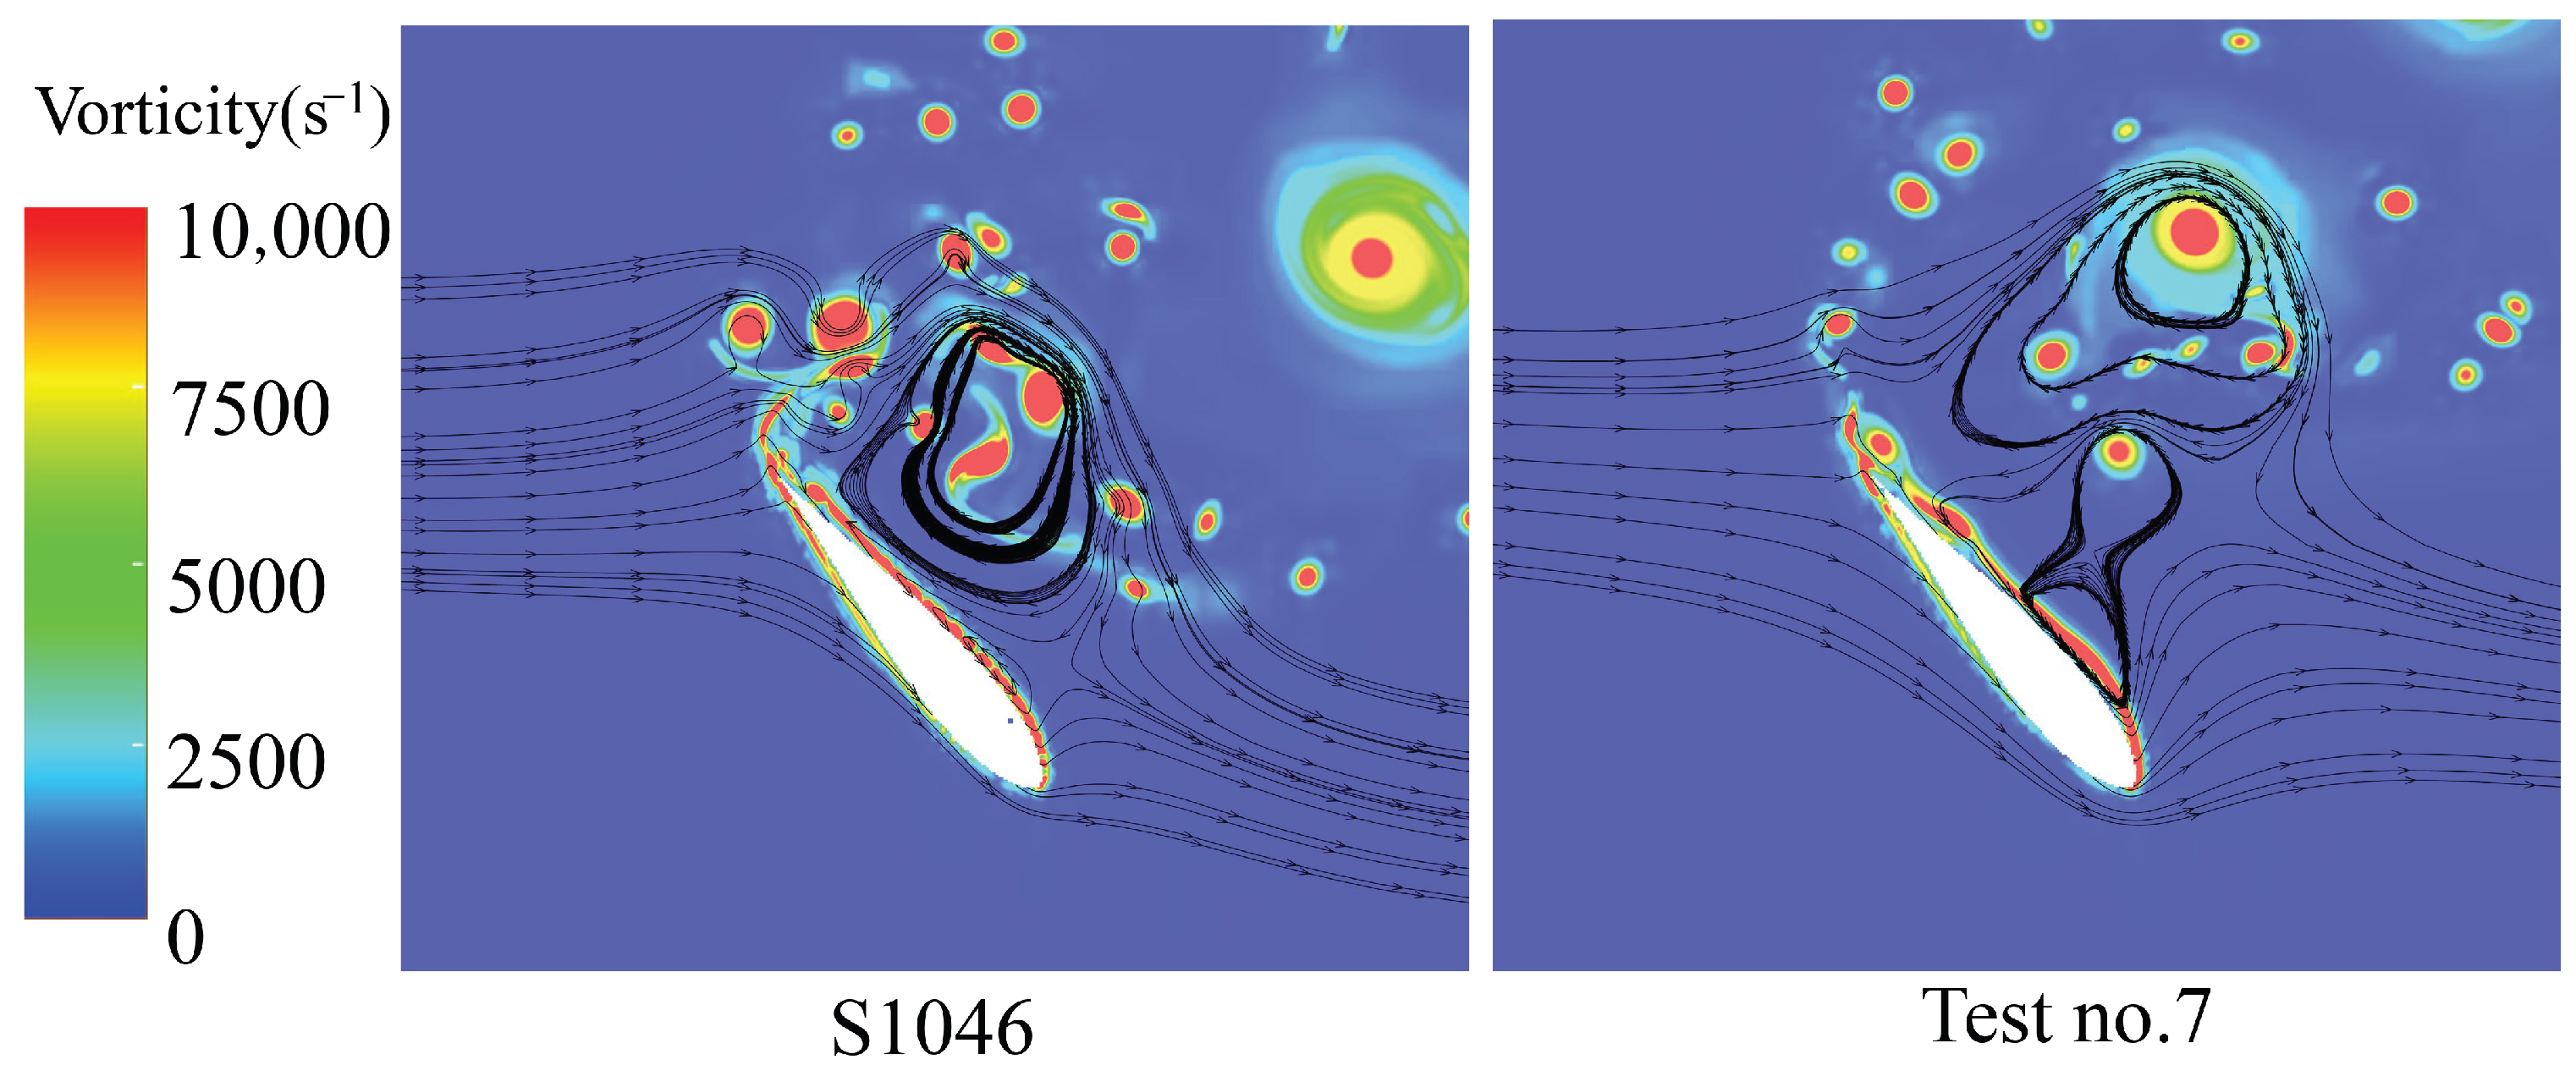
To investigate the flow effects and applicability of TO-DGF synergistic optimization for different airfoils at low TSR, at TSR = 1.5, Test no. 1, no. 4, and no. 7 comparison schemes are set to analyze the variation of single-blade C P values as shown in Figure 15. In Table 5, the maximum average power coefficient C P , ave of the NACA0021 airfoil optimization scheme shows little change compared to the baseline airfoil, while NACA0012 and S1046 are increased by 24% and 72%, respectively.
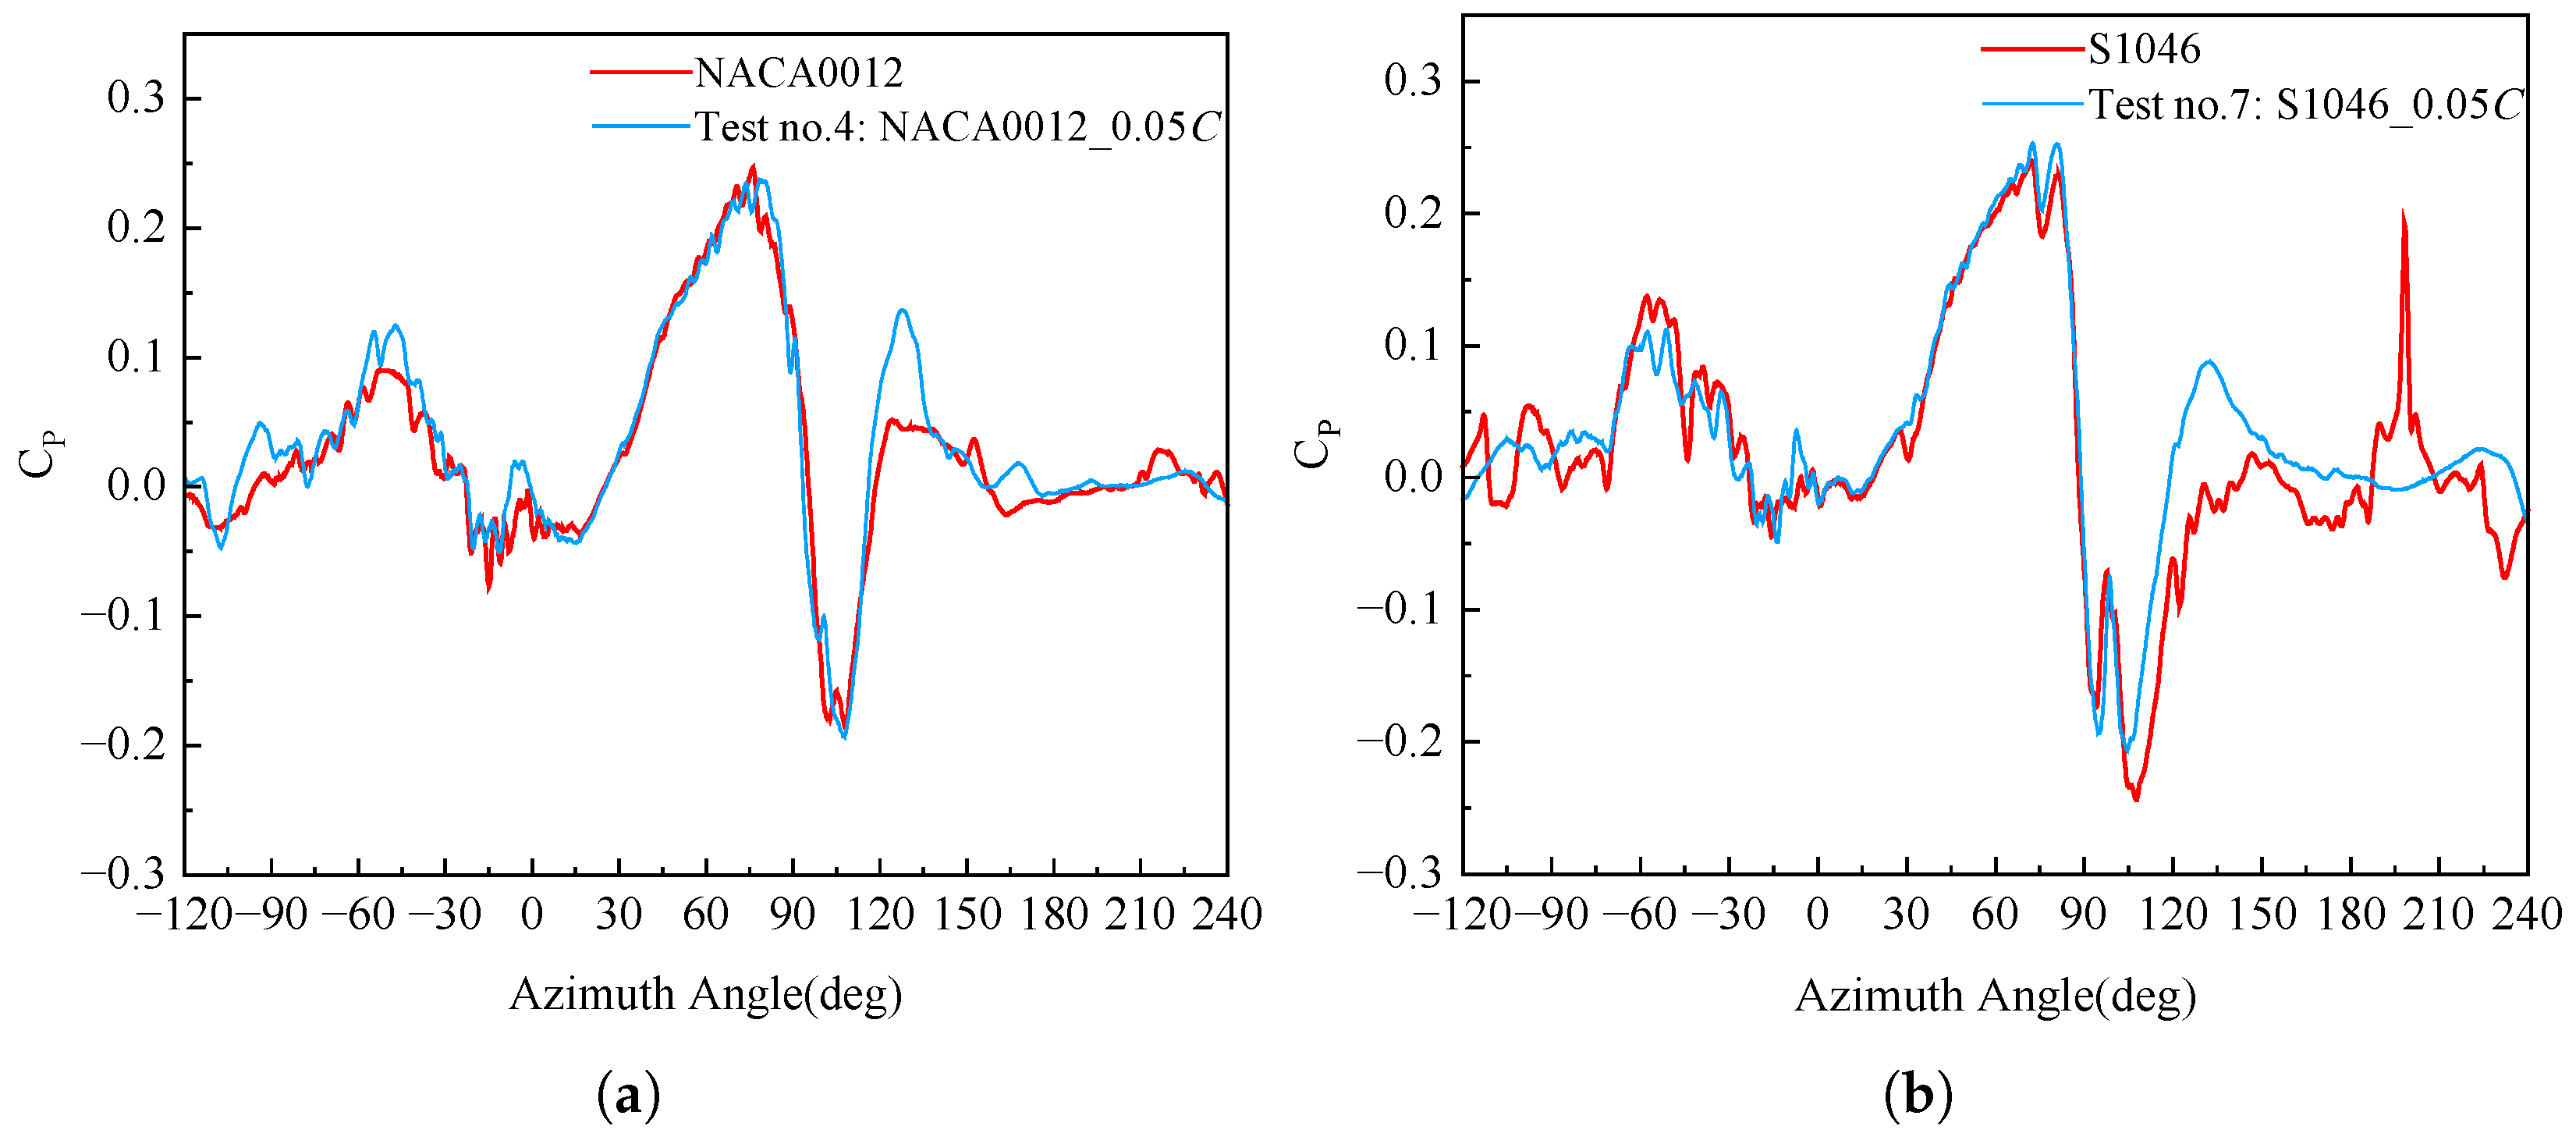
Due to the large fluctuations in dynamic vortices generated by the blade at low tip speed ratios, the power coefficients of the three VAWT blades are not completely consistent. The instantaneous power coefficient C P blade that produces the maximum average power coefficient C P , ave for S1046 and NACA0012 airfoils is compared with the baseline airfoil as shown in Figure 16.
As shown in Figure 16, at θ = 130°, the single-blade C P of NACA0012 and S1046 airfoils is improved compared to the baseline airfoil, with increases of approximately 0.082 and 0.089, respectively. The blade flow structure is shown in Figure 17 and Figure 18. From Figure 17, it can be observed that the separation zone of the NACA0012 baseline airfoil is developed to the blade leading edge, while the separation vortex of the Test no. 4 scheme is already shed from the blade surface. The shedding of the separation vortex slows the development of the separation zone toward the leading edge in the Test no. 4 scheme, and the streamlines at the leading edge of the suction surface reattach to the blade surface, which helps restore the leading edge negative pressure that is the main source of blade lift.
In Figure 18, the S1046 baseline airfoil is close to complete flow separation. Due to the influence of TO-DGF on the suction surface of the Test no. 7 blade, the fluid on the suction surface is induced to deflect toward the airfoil boundary layer. This process suppresses flow separation, causing the dynamic stall vortex in the separation zone to shed prematurely, thereby reducing blade operating resistance.

4.2.2. TO-DGF Place Factor Influence

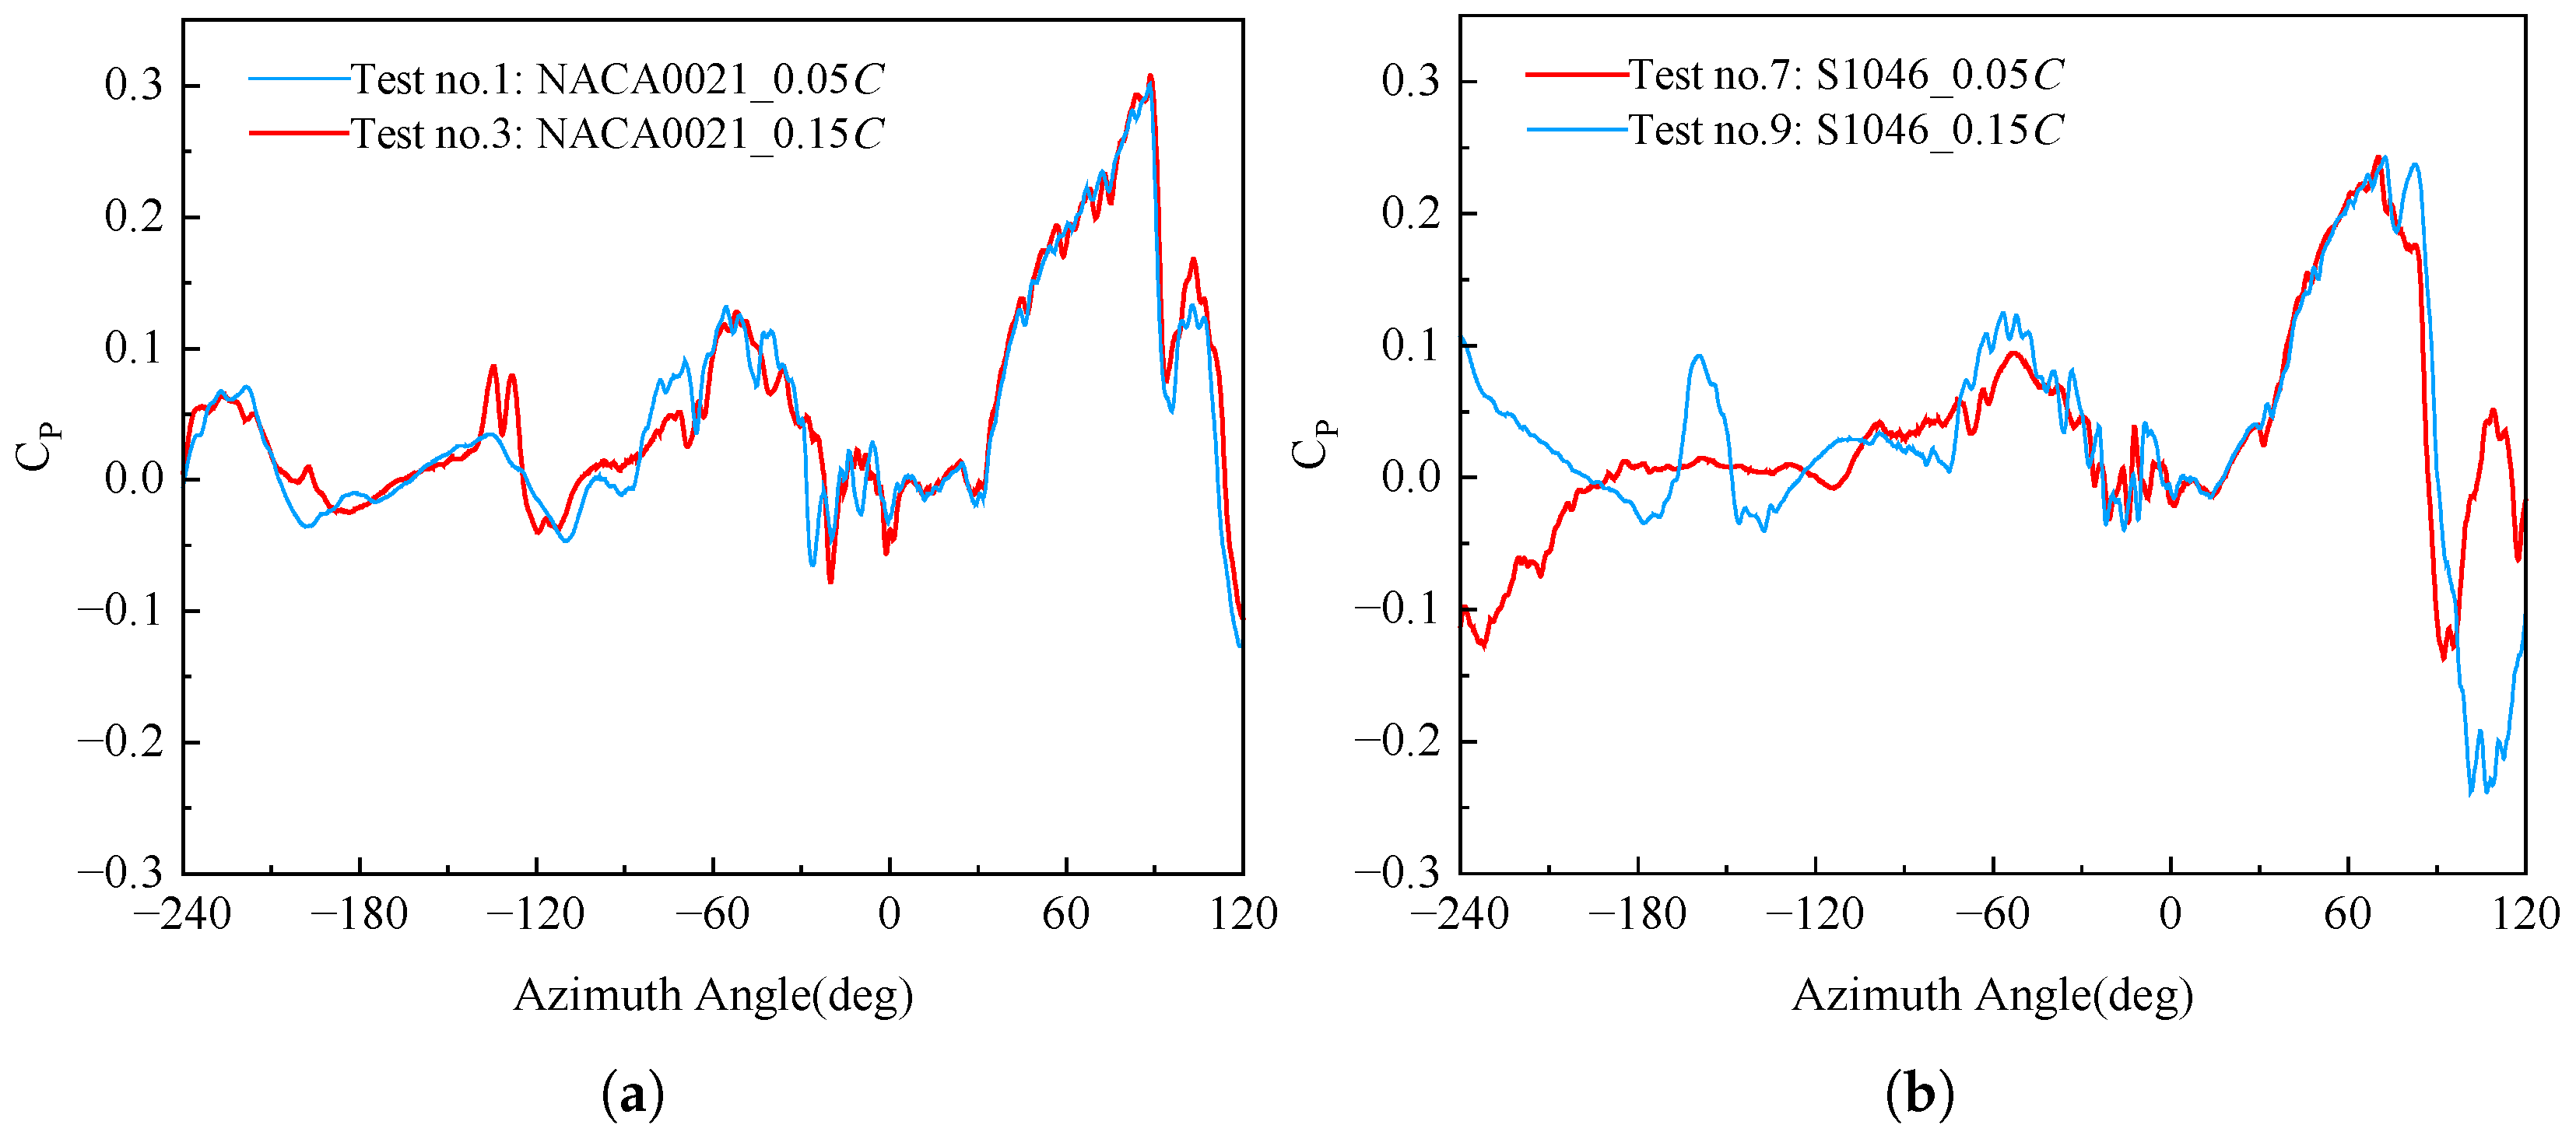
From the average power coefficient C P , ave of each scheme at TSR = 1.5 in Table 5, it can be seen that when TO-DGF Place = 0.15C compared to TO-DGF Place = 0.05C, only the NACA0021 airfoil scheme is increased by 7.9%, while the NACA0012 and S1046 airfoil schemes are decreased by 8.6% and 11.3%, respectively. Therefore, two groups of schemes for NACA0021 and S1046 airfoils are selected for analysis, with their C P shown in Figure 19.
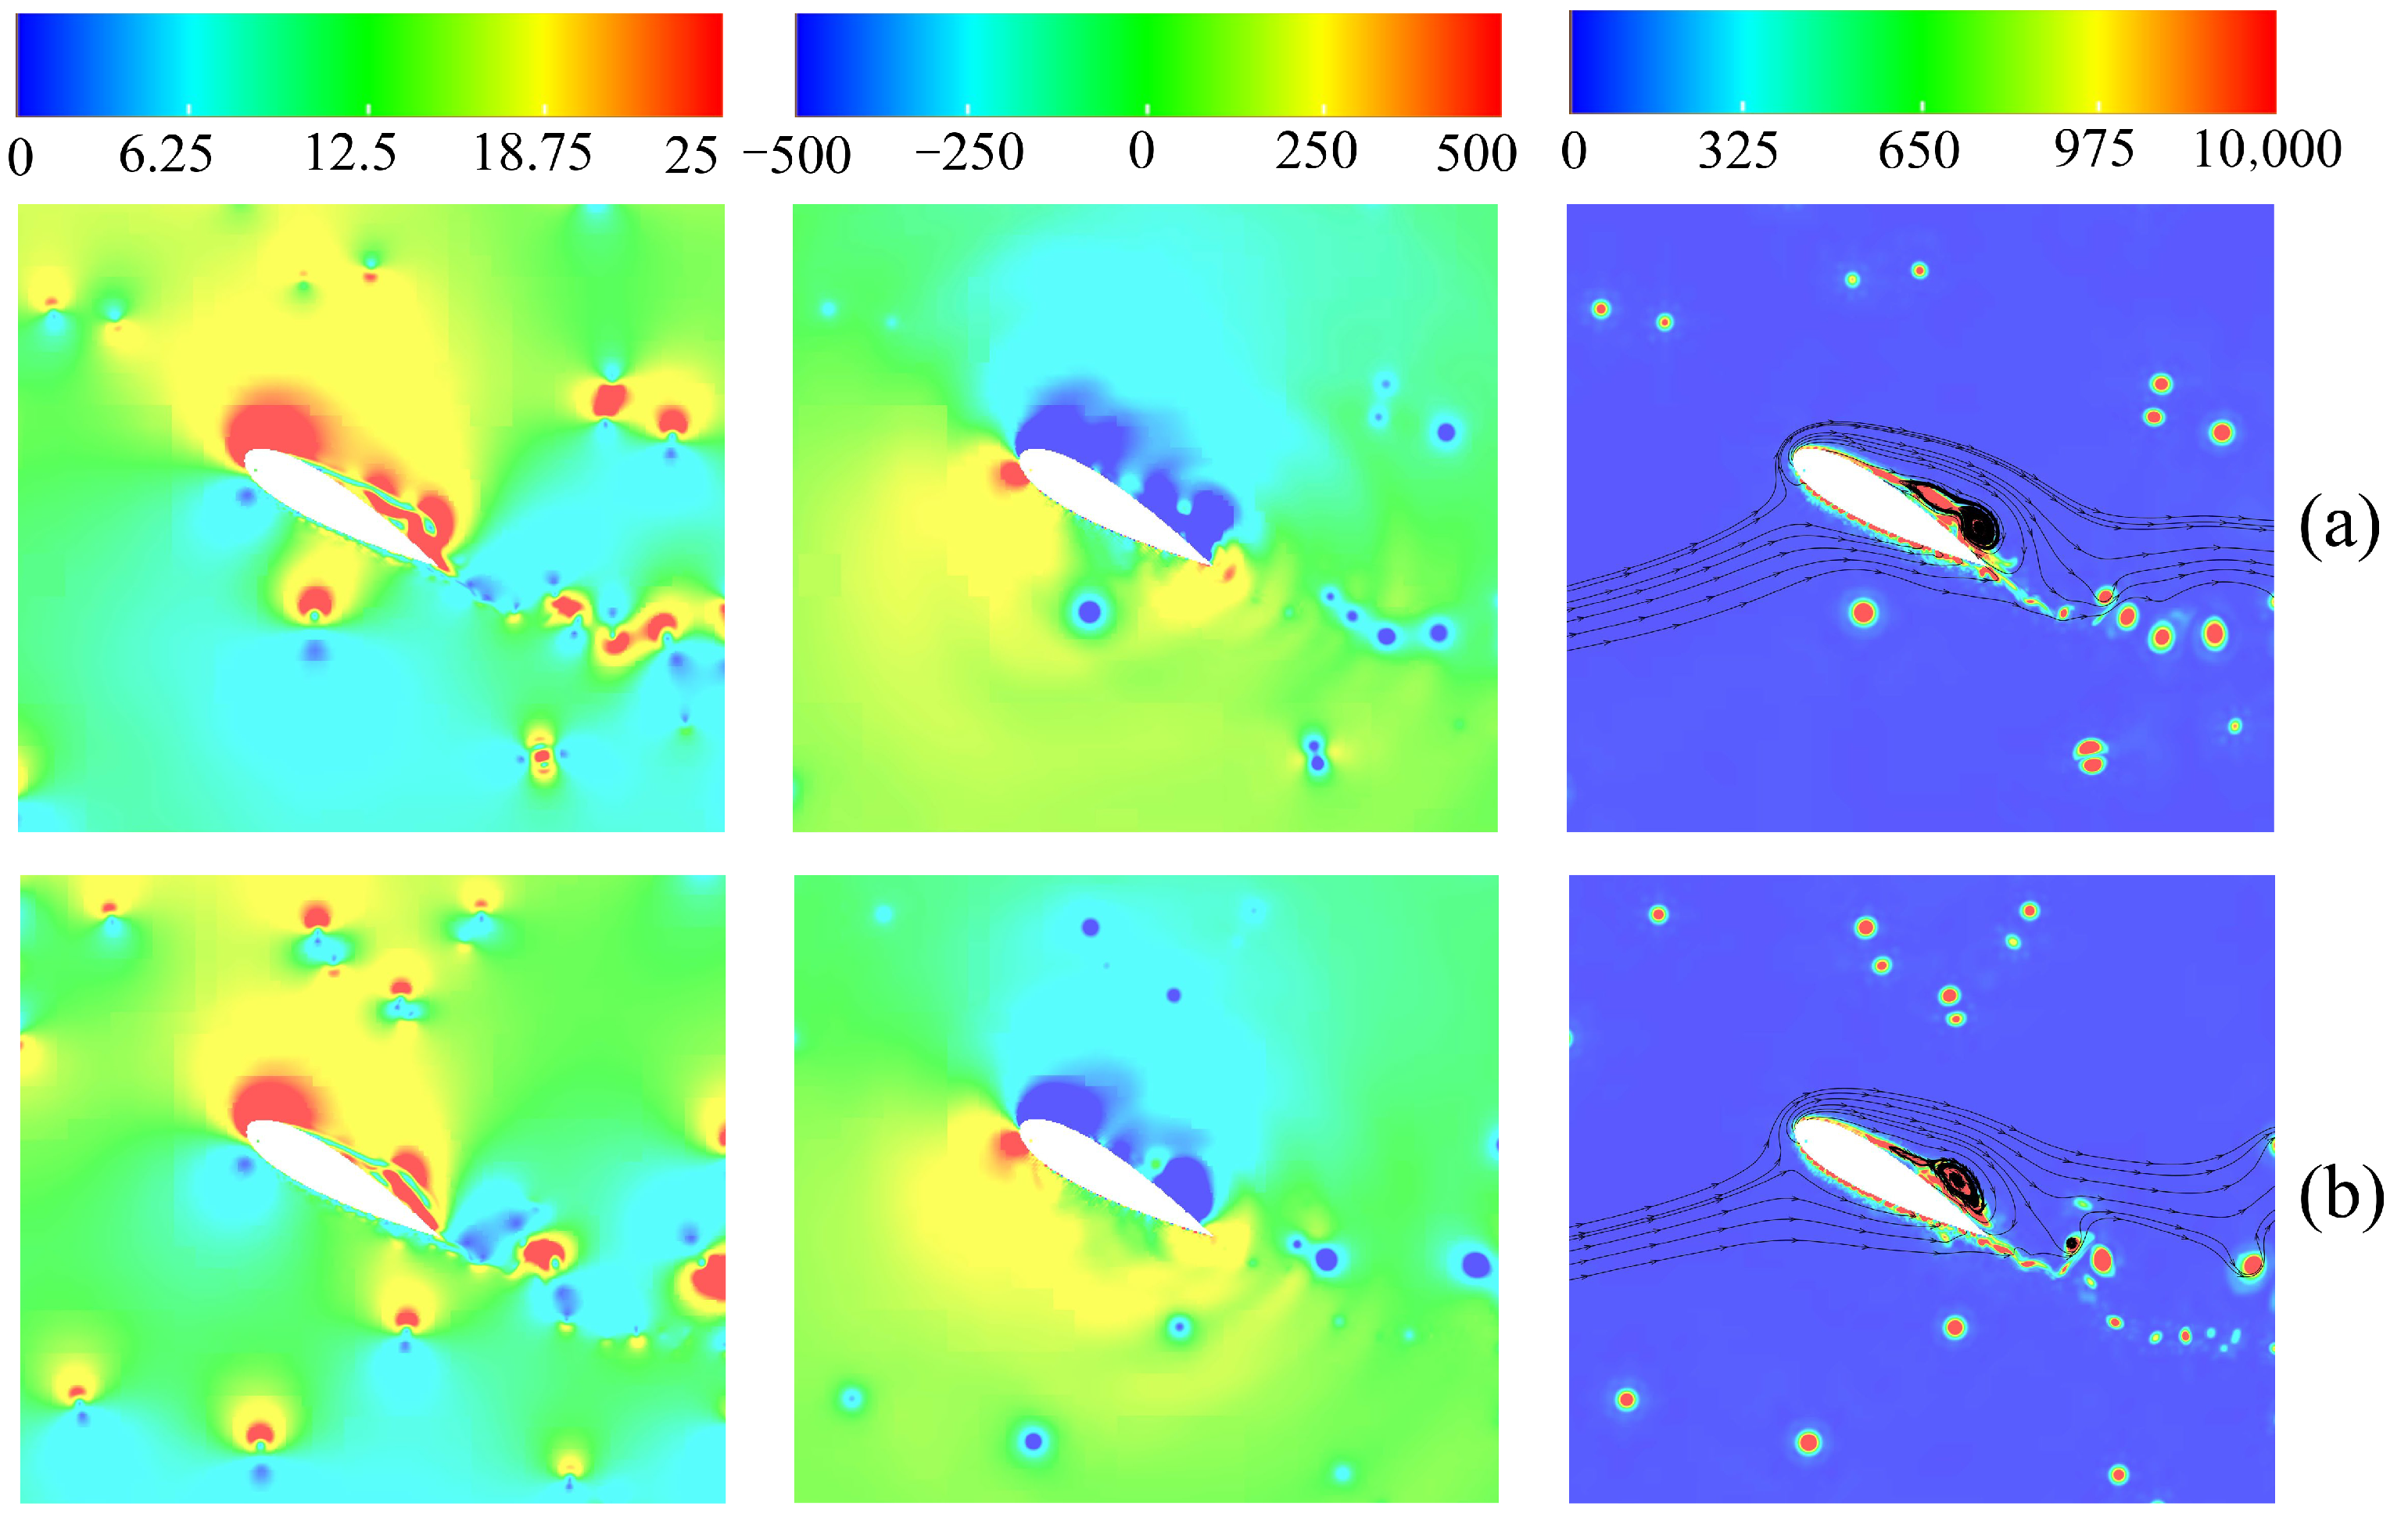
For the NACA0021 airfoil, the blade’s C P suddenly decreases near θ = −131°, due to the blade’s flow structure being affected by dynamic stall vortices shed from the upwind zone. To observe normal flow phenomena, θ = −27° is selected for observation to avoid the influence of such large-scale vortices. At this moment, the velocity, pressure contours, and vorticity distribution can be observed from Figure 20: in the velocity field, the high-velocity wake region at the trailing edge of the Test no. 1 scheme airfoil is more concentrated than the Test no. 3 scheme; in the static pressure field, the stall vortex of the Test no. 1 scheme produces more negative pressure zones, and the pressure fluctuation caused by suction drag is more intense than the Test no. 3 scheme; in the vorticity field, the Test no. 1 scheme has more stall vortices with higher intensity than the Test no. 3 scheme. This indicates that the suction surface pressure gradient of the Test no. 1 scheme is larger, the flow separation of the airfoil under this scheme is more intense, there is greater aerodynamic drag and lift fluctuation, and the wind energy utilization rate is lower.
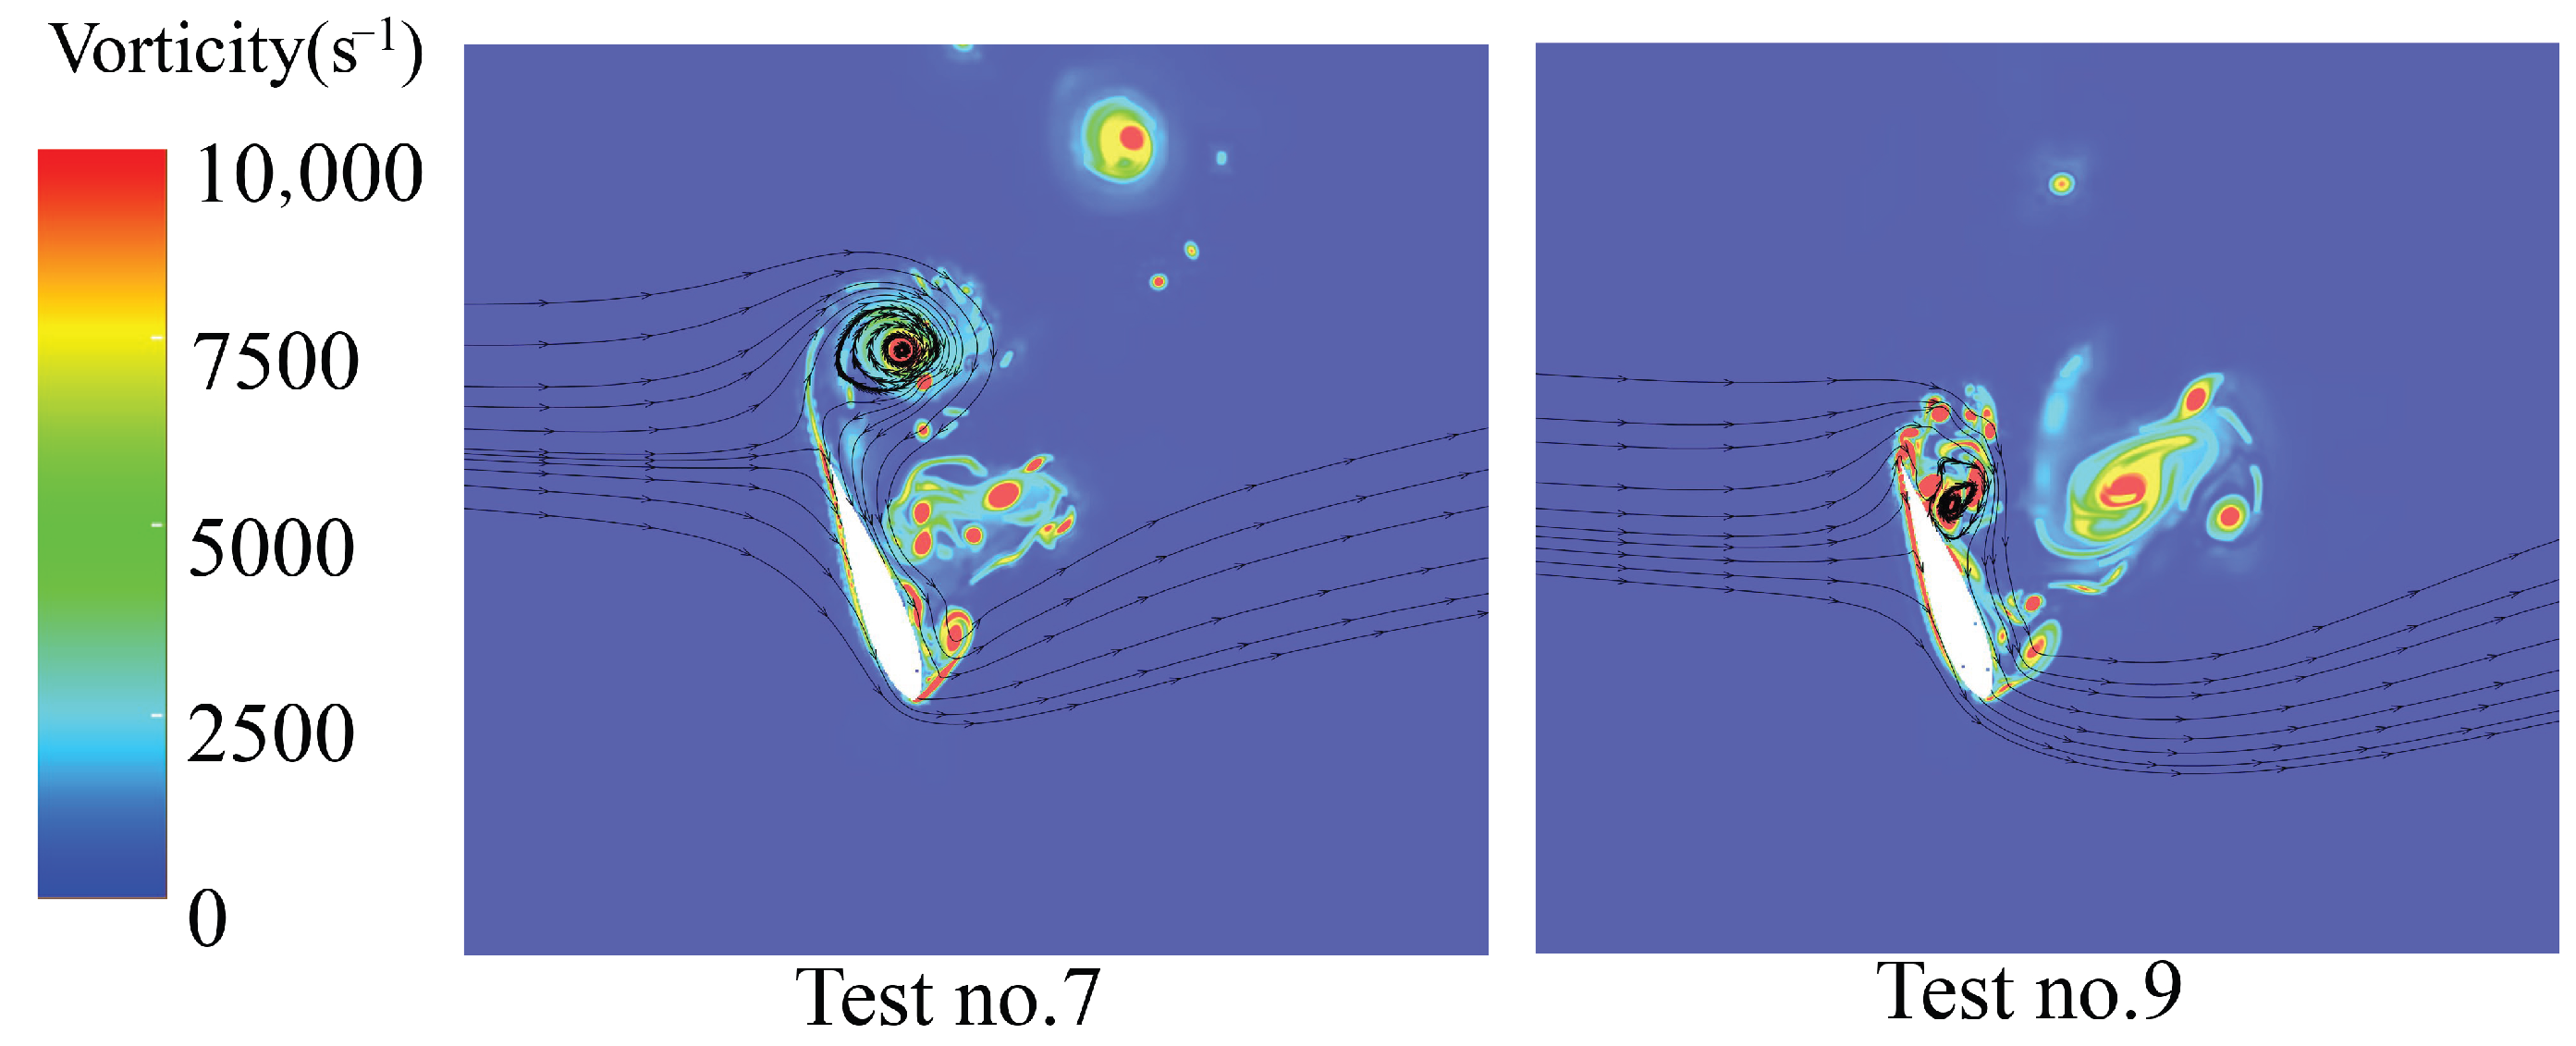
For the S1046 airfoil, at azimuth angle θ = 110°, Test no. 9 shows a significant decrease in C P compared to the Test no. 7 scheme. The blade vorticity distribution is shown in Figure 21: it can be observed that in the Test no. 7 scheme, a concentrated and intense dynamic stall vortex structure appears near the blade trailing edge, with a small portion of streamlines on the suction surface still able to attach to and flow along the blade leading edge surface. In contrast, the dynamic stall vortex structure in Test no. 9 adheres to the blade surface and causes the separation zone to further expand toward the leading edge. That is, moving TO-DGF Place to 0.15C weakens the flow control effect near the blade leading edge, preventing the streamlines on the suction surface from properly attaching to the blade leading edge surface, severely disrupting the flow structure in the leading edge negative pressure zone.

5. Conclusions

This paper employs the Lattice Boltzmann Method combined with LES to establish a VAWT flow field prediction model and designs a Taguchi experiment to investigate the applicability and flow effects of TO-DGF synergistic flow control on three airfoils: NACA0021, NACA0012, and S1046. Through comparative analysis of C P and flow field structure characteristics at different tip speed ratios, the main conclusions are as follows:
(1)
Airfoil geometric sensitivity is the determining factor for TO-DGF applicability. Variance analysis results indicate that the contribution rate of the airfoil factor to aerodynamic performance reaches 95.57% and 94.95% at TSR = 1.5 and TSR = 2.4, respectively, significantly higher than the influence of TO-DGF position and TO-DGF height parameters. Specifically, TO-DGF flow control achieves optimal suppression of dynamic stall for the NACA0021 airfoil, increasing its C P by 3.48% at TSR = 2.4, while NACA0012 and S1046 are decreased by 1.76% and 9.55%, respectively.
(2)
The optimal TO-DGF position exhibits certain patterns with tip speed ratio variation. At TSR = 1.5, TO-DGF performs best when located at 0.05C from the trailing edge, where placement near the trailing edge can effectively suppress the development of dynamic stall vortices on the suction surface and reduce turbulent dissipation in the blade wake region. At TSR = 2.4, performance improvement is more significant when the TO-DGF position moves forward to 0.15C, bringing power coefficient gains of 2.3%, 2.1%, and 6.6% for NACA0021, NACA0012, and S1046, respectively. The forward position can expand the trailing edge vorticity distribution on the blade pressure surface, induce incoming flow into the separation zone, thereby suppressing and weakening separation and reducing blade drag.
(3)
Although the overall statistical contribution of TO-DGF to the S/N ratio is limited to 3.83%, its aerodynamic significance is clearly manifested through changes in local flow variables, including suction-side flow attachment, trailing-edge vorticity redistribution, and suction-side pressure gradient enhancement. TO-DGF exhibits significant differences in flow effects on different airfoils. For the NACA0021 airfoil, TO-DGF mainly enhances the power coefficient in the upwind zone by maintaining suction surface flow attachment, concentrating trailing-edge vorticity on the pressure surface, and improving the suction surface pressure gradient. For the NACA0012 and S1046 airfoils, TO-DGF mainly improves downwind zone performance.
Future research directions of this paper should focus on verifying the applicability patterns of TO-DGF considering t / C outside the 12–21% range. Additionally, the Taguchi experiment designed in this paper does not consider interaction effects. Future work is recommended to adopt response surface methodology or genetic algorithm optimization design to reduce computational costs.

Author Contributions

Conceptualization, T.J.; Methodology, T.J. and L.L.; Formal analysis, T.J.; Investigation, T.J., Q.M. and L.L.; Data curation, T.J., Y.Z., W.L. and C.Q.; Writing—original draft, T.J. and L.L.; Writing—review & editing, T.J. and L.L.; Project administration, Q.M. All authors have read and agreed to the published version of the manuscript.

Funding

This work was supported by the 2023 Annual Research Basic Competence Improvement Project for Young and Middle-aged Teachers in Colleges and Universities in Guangxi (2023KY0207).

Institutional Review Board Statement

Not applicable.

Informed Consent Statement

Not applicable.

Data Availability Statement

The data presented in this study are available on request from the corresponding author.

Acknowledgments

The authors would like to thank Junjie Lai for his helpful discussions and suggestions regarding the simulation results.

Conflicts of Interest

The authors declare no conflicts of interest.

Nomenclature

SymbolDefinition
CBlade chord length [m]
NBlade number [-]
HBlade height [m]
RTurbine radius [m]
DTurbine diameter [m]
A s The swept zone of turbine A s = 2 H R [ m 2 ]
T m Torque [N·m]
V Freestream velocity [m/s]
ρ Air density [ kg / m 3 ]
μ Dynamic viscosity [Pa·s]
nRotating velocity of turbine [rpm]
V s Tip velocity of turbine V s = 2 π R n / 60 [m/s]
TSRTip speed ratio TSR = V s / V [-]
θ Azimuthal angle [°]
AOAAngle of Attack AOA = tan 1 sin θ / ( TSR + sin θ ) [-]
C T Torque coefficient C T = T m / ( 1 / 2 ρ V 2 A s R ) [-]
C P Power coefficient C P = C T · TSR [-]
C P , ave Average power coefficient during one cycle [-]
σ Solidity σ = N C / D [-]
IFreestream turbulence intensity [-]

References

  1. Nugraha, A.D.; Garingging, R.A.; Wiranata, A.; Sitanggang, A.C.; Supriyanto, E.; Tanbar, F.; Muflikhun, M.A. Comparison of “Rose, Aeroleaf, and Tulip” vertical axis wind turbines (VAWTs) and their characteristics for alternative electricity generation in urban and rural areas. Results Eng. 2025, 25, 103885. [Google Scholar] [CrossRef]
  2. Seifi Davari, H.; Seify Davari, M.; Botez, R.M.; Chowdhury, H. Advancements in vertical axis wind turbine technologies: A comprehensive review. Arab. J. Sci. Eng. 2025, 50, 2169–2216. [Google Scholar]
  3. Shen, Z.; Gong, S.; Zuo, Z.; Chen, Y.; Guo, W. Darrieus vertical-axis wind turbine performance enhancement approach and optimized design: A review. Ocean Eng. 2024, 311, 118965. [Google Scholar] [CrossRef]
  4. Tayebi, A.; Torabi, F. Flow Control Techniques to Improve the Aerodynamic Performance of Darrieus Vertical Axis Wind Turbines: A Critical Review. J. Wind Eng. Ind. Aerodyn. 2024, 252, 105820. [Google Scholar]
  5. Miliket, T.A.; Ageze, M.B.; Tigabu, M.T. Aerodynamic Performance Enhancement and Computational Methods for H-Darrieus Vertical Axis Wind Turbines: Review. Int. J. Green Energy 2022, 19, 1428–1465. [Google Scholar] [CrossRef]
  6. Sun, X.; Zhou, D. Review of Numerical and Experimental Studies on Flow Characteristics around A Straight-bladed Vertical Axis Wind Turbine and Its Performance Enhancement Strategies. Arch. Comput. Methods Eng. 2022, 29, 1839–1874. [Google Scholar]
  7. Kuang, L.; Zhang, R.; Su, J.; Shao, Y.; Zhang, K.; Chen, Y.; Zhang, Z.; Tu, Y.; Zhou, D.; Han, Z.; et al. Systematic Investigation of Effect of Rotor Solidity on Vertical-Axis Wind Turbines: Power Performance and Aerodynamics Analysis. J. Wind. Eng. Ind. Aerodyn. 2023, 233, 105284. [Google Scholar] [CrossRef]
  8. Le Fouest, S.; Mulleners, K. Optimal Blade Pitch Control for Enhanced Vertical-Axis Wind Turbine Performance. Nat. Commun. 2024, 15, 2770. [Google Scholar] [CrossRef]
  9. Mohamed, M.H. Performance Investigation of H-rotor Darrieus Turbine with New Airfoil Shapes. Energy 2012, 47, 522–530. [Google Scholar] [CrossRef]
  10. Huang, S.X.; Li, C.; Ng, E.Y.K.; Wang, Y. Bio-Inspired Asymmetric Airfoil Design Based on the Wind Energy Quality and Flow Field Spatio-Temporal on the Vertical Axis Wind Turbine Rotor Plane. Renew. Energy 2025, 248, 122999. [Google Scholar] [CrossRef]
  11. Rezaeiha, A.; Montazeri, H.; Blocken, B. Active Flow Control for Power Enhancement of Vertical Axis Wind Turbines: Leading-edge Slot Suction. Energy 2019, 189, 116131. [Google Scholar] [CrossRef]
  12. Fatehi, M.; Nili-Ahmadabadi, M.; Nematollahi, O.; Minaiean, A.; Kim, K.C. Aerodynamic Performance Improvement of Wind Turbine Blade by Cavity Shape Optimization. Renew. Energy 2019, 132, 773–785. [Google Scholar] [CrossRef]
  13. Zhu, H.; Hao, W.; Li, C.; Luo, S.; Liu, Q.; Gao, C. Effect of Geometric Parameters of Gurney Flap on Performance Enhancement of Straight-Bladed Vertical Axis Wind turbineGurney. Renew. Energy 2021, 165, 464–480. [Google Scholar]
  14. Attie, C.; ElCheikh, A.; Nader, J.; Elkhoury, M. Performance Enhancement of a Vertical Axis Wind Turbine Using a Slotted Deflective Flap at the Trailing Edge. Energy Convers. Manag. 2022, 273, 116388. [Google Scholar] [CrossRef]
  15. Randall, R.; Chen, C.; Ageze, M.; Tigabu, M. Perspectives of Vertical Axis Wind Turbins in Cluster Configurations. Fluid Dyn. Mater. Process. 2024, 20, 2657–2691. [Google Scholar] [CrossRef]
  16. Abdolahifar, A.; Zanj, A. A review of available solutions for enhancing aerodynamic performance in Darrieus vertical-axis wind turbines: A comparative discussion. Energy Convers. Manag. 2025, 327, 119575. [Google Scholar] [CrossRef]
  17. Özden, M.; Genç, M.S.; Koca, K. Investigation of the effect of hidden vortex generator-flap integrated mechanism revealed in low velocities on wind turbine blade flow. Energy Convers. Manag. 2023, 287, 117107. [Google Scholar] [CrossRef]
  18. Syawitri, T.P.; Yao, Y.; Yao, J.; Chandra, B. Drag Reduction of Lift-Type Vertical Axis Wind Turbine with Slit Modified Gurney Flap. J. Wind Eng. Ind. Aerodyn. 2024, 253, 105853. [Google Scholar] [CrossRef]
  19. Ye, X.; Hu, J.; Zheng, N.; Li, C. Numerical Study on Aerodynamic Performance and Noise of Wind Turbine Airfoils with Serrated Gurney Flap. Energy 2023, 262, 125574. [Google Scholar] [CrossRef]
  20. Zhu, H.; Hao, W.; Li, C.; Ding, Q. Numerical Study of Effect of Solidity on Vertical Axis Wind Turbine with Gurney Flap. J. Wind Eng. Ind. Aerodyn. 2019, 186, 17–31. [Google Scholar] [CrossRef]
  21. Syawitri, T.P.; Yao, Y.; Yao, J.; Chandra, B. Geometry Optimisation of Vertical Axis Wind Turbine with Gurney Flap for Performance Enhancement at Low, Medium and High Ranges of Tip Speed Ratios. Sustain. Energy Technol. Assessments 2022, 49, 101779. [Google Scholar] [CrossRef]
  22. Sobhani, E.; Ghaffari, M.; Maghrebi, M.J. Numerical Investigation of Dimple Effects on Darrieus Vertical Axis Wind Turbine. Energy 2017, 133, 231–241. [Google Scholar] [CrossRef]
  23. Javaid, M.T.; Sajjad, U.; Hassan, S.S.; Nasir, S.; Shahid, M.U.; Ali, A.; Salamat, S. Power Enhancement of Vertical Axis Wind Turbine Using Optimum Trapped Vortex Cavity. Energy 2023, 278, 127808. [Google Scholar] [CrossRef]
  24. Bouterra, S.; Belamadi, R.; Djemili, A.; Ilinca, A. Microcylinder and slot combination for flow separation control over a wind turbine airfoil. Wind Energy 2025, 28, e70035. [Google Scholar] [CrossRef]
  25. Elbaz, A.M.R.; Ibrahim, A.A.; Mohamed, O.S.; Etman, A.K. Performance of Darrieus Wind Turbine Using Slotted Blades With Gurney Flap. In Proceedings of the ASME Turbo Expo 2020: Turbomachinery Technical Conference and Exposition, Virtual, 21–25 September 2020. [Google Scholar]
  26. Ismail, M.F.; Vijayaraghavan, K. The Effects of Aerofoil Profile Modification on a Vertical Axis Wind Turbine Performance. Energy 2015, 80, 20–31. [Google Scholar] [CrossRef]
  27. Kundu, P. Numerical Simulation of the Effects of Passive Flow Control Techniques on Hydrodynamic Performance Improvement of the Hydrofoil. Ocean Eng. 2020, 202, 107108. [Google Scholar] [CrossRef]
  28. Chen, H.; Du, S.; Chen, Z. Lift Augmentation on a Tiltrotor Wing Using the Combination of Vortex Generators and Gurney’s Flap. Int. J. Aerosp. Eng. 2023, 2023, 6646817. [Google Scholar] [CrossRef]
  29. Venkatraman, K.; Moreau, S.; Christophe, J.; Schram, C. Numerical investigation of h-Darrieus wind turbine aerodynamics at different tip speed ratios. Int. J. Numer. Methods Heat Fluid Flow 2023, 33, 1489–1512. [Google Scholar] [CrossRef]
  30. Yin, M.; Wang, M.; Huo, Y.; Rao, Z. Simulation of solid-liquid phase change at pore scale using lattice Boltzmann method with central moments in thermal energy storage. J. Energy Storage 2022, 49, 104116. [Google Scholar] [CrossRef]
  31. Li, W.; Wang, W.-Q.; Yan, Y.; Yu, Z.-F. A strong-coupled method combined finite element method and lattice Boltzmann method via an implicit immersed boundary scheme for fluid structure interaction. Ocean Eng. 2020, 214, 107779. [Google Scholar] [CrossRef]
  32. Huang, Z.; Wang, H.P.; Li, Y.; Shi, H.W. Research of asymmetric airfoil on aerodynamic characteristics of vertical axis wind turbines. Wind Eng. 2024, 48, 617–631. [Google Scholar] [CrossRef]
  33. Maher, N.S.; Ghazalla, R.A.; Mohamed, M.H.; Nawar, M.A.A.; Attai, Y.A. An innovative approach for harnessing wind power by Darrieus turbines using a passive flow controller. J. Eng. Appl. Sci. 2025, 72, 210. [Google Scholar] [CrossRef]
  34. Raciti Castelli, M.; Ardizzon, G.; Battisti, L.; Benini, E.; Pavesi, G. Modeling Strategy and Numerical Validation for a Darrieus Vertical Axis Micro-Wind Turbine. In Proceedings of the ASME 2010 International Mechanical Engineering Congress and Exposition, Vancouver, BC, Canada, 12–18 November 2010; pp. 409–418. [Google Scholar]
  35. Luo, L.Q.; Mo, Q.Y.; Li, Y.F.; Jiang, T.; Zhao, Y.L. A study on the effect of slotted airfoil on the performance of Darrieus vertical axis wind turbines in different wind regions. PLoS ONE 2025, 20, e0334110. [Google Scholar]
  36. Chávez-Modena, M.; Martínez, J.L.; Cabello, J.A.; Ferrer, E. Simulations of aerodynamic separated flows using the lattice Boltzmann solver XFlow. Energies 2020, 13, 5146. [Google Scholar] [CrossRef]
  37. Rezaeiha, A.; Kalkman, I.; Blocken, B. CFD Simulation of a Vertical Axis Wind Turbine Operating at a Moderate Tip Speed Ratio: Guidelines for Minimum Domain Size and Azimuthal Increment. Renew. Energy 2017, 107, 373–385. [Google Scholar] [CrossRef]
  38. Li, G.; Mou, W.; Li, C.; Liu, Q. Effect of trailing edge dimple-flap on dynamic stall characteristics of airfoil. J. Eng. Therm. Energy Power 2022, 37, 151–159. [Google Scholar]
Figure 1. VAWT rotor structure and blade initial azimuth angle θ (Blue Degree).
Applsci 16 02882 g001
Figure 2. Computational flow domain.
Applsci 16 02882 g002
Figure 3. Rotational cycle comparison.
Applsci 16 02882 g003
Figure 4. Variable mesh refinement region and refinement transition length in computational domain.
Applsci 16 02882 g004
Figure 5. C P , ave -TSR curves of the VAWT obtained through WMLES and experimental testing [34].
Applsci 16 02882 g005
Figure 6. TO-DGF structure.
Applsci 16 02882 g006
Figure 7. Planned airfoil structures and comparisons: (a) NACA0021 and NACA0012. (b) NACA0021 and S1046.
Applsci 16 02882 g007
Figure 8. Trend variation chart of each factor under different levels at TSR = 1.5.
Applsci 16 02882 g008
Figure 9. Trend variation chart of each factor under different levels at TSR = 2.4.
Applsci 16 02882 g009
Figure 10. Comparison of C P for single blade between baseline airfoils and TO-DGF optimization at TSR = 2.4: (a) baseline airfoils. (b) TO-DGF Optimization Schemes.
Applsci 16 02882 g010
Figure 11. Vorticity conditions for test no. 3, no. 6, and no. 9 at TSR = 2.4.
Applsci 16 02882 g011
Figure 12. Single blade C P for two scheme groups at TSR = 2.4: (a) schemes corresponding to NACA0021 and NACA0012 airfoils. (b) schemes corresponding to NACA0021 and S1046 airfoils.
Applsci 16 02882 g012
Figure 13. Effect of TO-DGF Position in upwind region at TSR = 2.4: (a) Velocity contours. (b) Vorticity distribution.
Applsci 16 02882 g013
Figure 14. Velocity contours and vorticity distribution for TO-DGF Position in downwind region at TSR = 2.4: (a) Test no. 1. (b) Test no. 3. (c) Test no. 4. (d) Test no. 6. (e) Test no. 7. (f) Test no. 9.
Applsci 16 02882 g014
Figure 15. Comparison of C P for single blade between baseline airfoils and TO-DGF optimization at TSR = 1.5: (a) Baseline airfoils. (b) Three optimization schemes.
Applsci 16 02882 g015
Figure 16. Comparison of C P for single blade between TO-DGF optimization scheme and baseline airfoil at TSR = 1.5: (a) NACA0012 airfoil. (b) S1046 airfoil.
Applsci 16 02882 g016
Figure 17. Comparison of single-blade vorticity diagrams between NACA0012 baseline airfoil and TO-DGF optimization scheme at TSR = 1.5.
Applsci 16 02882 g017
Figure 18. Comparison of single-blade vorticity diagrams between S1046 baseline airfoil and TO-DGF optimization scheme at TSR = 1.5.
Applsci 16 02882 g018
Figure 19. Comparison of C P for single blade of two airfoil groups with different TO-DGF Place schemes at TSR = 1.5: (a) NACA0021 airfoil. (b) S1046 airfoil.
Applsci 16 02882 g019
Figure 20. Comparison of velocity, static pressure contours, and vorticity distribution for NACA0021 airfoil with different TO-DGF Place schemes at TSR = 1.5: (a) Test no. 1 (b) Test no. 3.
Applsci 16 02882 g020
Figure 21. Comparison of vorticity distribution for S1046 airfoil with different TO-DGF Place schemes at TSR = 1.5.
Applsci 16 02882 g021
Table 1. Rotor structural parameters.
D (mm)H (mm) A s (m2)NAirfoilC (mm)s-b 1Aspect Ratio σ
10301456.41.53NACA 002185.80.5C1.4140.25
1 s-b: Spoke-blade connection.
Table 2. Three-blade C P , ave for different lattice densities.
TSRLattice NumberG-Lattice Size 1W-W Lattice Size 2 C P , ave Growth Rate
1.51050.1058.20 × 10−40.1214
1.51270.0866.72 × 10−40.141216.3%
1.51450.1515.90 × 10−40.14482.6%
1.51670.0665.16 × 10−40.14661.2%
1 G-Lattice Size: Global Lattice Size [m]; 2 W-W Lattice Size: Wall and Wake Lattice Size [m].
Table 3. Model validation simulation scheme configuration.
Program NumberTSRCorresponding V (m/s)
No. 11.514.38
No. 2211.85
No. 32.49.0
No. 42.78.0
No. 537.2
No. 63.46.54
Table 4. Design factors and Taguchi experimental levels.
FactorLevel
123
Airfoil-typeNACA0021NACA0012S1046
TO-DGF-Place0.05C0.1C0.15C
TO-DGF-Height1%C1.25%C1.5%C
Table 5. Taguchi design schemes and C P , ave of VAWT and S/N analysis under different TSR.
Test No.Airfoil TypeTO-DGF PlaceTO-DGF HeightTSR = 1.5 C P , ave TSR = 2.4 C P , ave TSR = 1.5 S/NTSR = 2.4 S/N
11 (NACA0021)1 (0.05C)1 (1%C)0.136440.36110−17.3012−8.8475
21 (NACA0021)2 (0.1C)2 (1.25%C)0.133050.36527−17.5197−8.7476
31 (NACA0021)3 (0.15C)3 (1.5%C)0.147200.36948−16.6418−8.6462
42 (NACA0012)1 (0.05C)2 (1.25%C)0.082560.33761−21.6656−9.4318
52 (NACA0012)2 (0.1C)3 (1.5%C)0.069030.34180−23.2192−9.3245
62 (NACA0012)3 (0.15C)1 (1%C)0.075450.34531−22.4468−9.2358
73 (S1046)1 (0.05C)3 (1.5%C)0.090710.29222−20.8469−10.6559
83 (S1046)2 (0.1C)1 (1%C)0.080400.32103−21.5051−10.1674
93 (S1046)3 (0.15C)2 (1.25%C)0.080420.31159−21.8927−10.1282
Table 6. S/N response table for TSR = 1.5 and TSR = 2.4.
LevelsFactors
TSR = 1.5TSR = 2.4
Airfoil
Type
TO-DGF
Place
TO-DGF
Height
Airfoil
Type
TO-DGF
Place
TO-DGF
Height
Level 1−17.15−19.94−20.42−8.748−9.655−9.417
Level 2−22.44−20.75−20.36−9.331−9.413−9.436
Level 3−21.41−20.33−20.24−10.327−9.337−9.553
Delta5.290.810.181.5790.3180.136
Table 7. Results of ANOVA for TSR = 1.5 and TSR = 2.4 C p .
Variance SourceDOF 1SS 2MS 3F-Ratiop-Value 4Contribution Rate (%)
TSR = 1.5
Airfoil type247.188323.594241.110.02495.574
TO-DGF Place20.98580.49290.860.5381.997
TO-DGF Height20.05160.02580.040.9570.105
Error21.14790.57392.325
Total849.376100
TSR = 2.4
Airfoil type20.0055990.002799142.260.00794.95
TO-DGF Place20.0002260.0001135.740.1483.83
TO-DGF Height20.0000330.0000160.840.5430.56
Error20.0000390.0000200.66
Total80.005897100
1 DOF: Degrees of Freedom; 2 SS: Sum of Squares; 3 MS: Mean Square; 4 p-value: significance probability based on the F-test.
Disclaimer/Publisher’s Note: The statements, opinions and data contained in all publications are solely those of the individual author(s) and contributor(s) and not of MDPI and/or the editor(s). MDPI and/or the editor(s) disclaim responsibility for any injury to people or property resulting from any ideas, methods, instructions or products referred to in the content.