Article

Evaluation of Rail Damage Using Image Analysis Based on an Artificial Neural Network

1
Department of Construction Engineering, Dongyang University, No. 145 Dongyangdae-ro, Punggi-eup, Yeongju-si 36040, Republic of Korea
2
Gyeongbuk RISE Project Group, Dongyang University, No. 145 Dongyangdae-ro, Punggi-eup, Yeongju-si 36040, Republic of Korea
*
Author to whom correspondence should be addressed.
Appl. Sci. 2026, 16(6), 2767; https://doi.org/10.3390/app16062767
Submission received: 2 February 2026 / Revised: 10 March 2026 / Accepted: 11 March 2026 / Published: 13 March 2026

Abstract

Rolling contact fatigue cracks at the contact surface between a wheel and rail are evaluated based on the results of an external inspection (visual inspection). We developed a rail damage assessment technique using a fast regional convolutional neural network deep learning-based image analysis framework. We collected rail specimens from in-service tracks and performed scanning electron microscopy to correlate surface damage with subsurface crack formation, including crack depth, length, and angle. This data was input into an artificial neural network (ANN) to assess internal crack conditions using visual information obtained from rail surface damage. The resulting model achieved an average accuracy of 94.9%, outperforming other algorithms. We integrated this model into a developed rail damage diagnosis app with deep learning that links field photographs with cloud-based big data to learn, quantitatively diagnose, and present the type and scale of rail damage. We examined the field applicability of the application at a rail damage site. The standard deviation of the rail damage diagnosis results was 0.2–1.5% between different users. Appropriateness of the rail damage assessment technique using the proposed ANN image analysis technique was verified experimentally. Consistent diagnosis results could be derived regardless of the inspector, minimizing human error.

1. Introduction

Railway rails experience more loading cycles than those of the conventional road pavements because of the repeated rolling contact between the steel wheels and steel rails. Under such conditions, high-contact forces are concentrated within a limited wheel–rail contact area. Consequently, the induced contact stress often exceeds the yield strength of the rail steel, causing plastic deformation and initiating crack formation. Continuous exposure to rolling contact fatigue (RCF) accelerates crack propagation over time, necessitating systematic inspections and diagnostic procedures to prevent rail failure.
Although recently established Detailed Guidelines for the Performance Evaluation of Track Facilities specify procedures for track condition assessment, current rail damage detection and grading practices rely largely on visual inspection. These methods are inherently subjective because they depend on the experience of the inspector, resulting in qualitative rather than quantitative evaluations [1,2].
To address this limitation, a matched dataset of rail surface damage images and corresponding internal damage images was constructed, followed by testing a deep learning model. For model validation, a rail damage image dataset consisting of 2500 rail surface damage images obtained from field inspections was developed. The damaged rail segments were extracted from the site, and scanning electron microscopy (SEM) tests were performed to acquire 2500 internal damage images. A total of 5000 images were collected for training.
The experimental results indicated an average detection accuracy of 94.9%, confirming that the Fast regional convolutional neural network (R-CNN) model identified rail damage effectively and demonstrated superior recognition performance compared with conventional algorithms. A deep learning-based rail damage diagnostic application was developed based on these results. Using the developed smartphone application, users can capture rail surface images, which are analyzed to quantitatively assess the type and extent of rail damage based on learned patterns.
This study focused on evaluating rail damage using ANN-based image analysis. This research involved enhancing the image data to accurately assess the extent of both surface and internal rail damage, constructing a comprehensive training dataset and evaluating the suitability and field applicability of deep learning models. Through the development of a deep learning-based rail damage diagnostic application, this study presents an analytical approach that can effectively evaluate both surface and internal rail damage. This process encompasses the enhancement of image datasets, dataset construction, verification of model suitability, and on-site applicability, and the proposal of an optimal analytical method for comprehensive rail damage evaluation.
This study proposes a novel smartphone-based quantitative diagnostic platform—the first of its kind—aimed at verifying the field applicability of rail damage detection while minimizing inspector-dependent errors. The experimental results, presented here for the first time, reveal that the system effectively limits human error to within 0.2–1.5%, ensuring high objectivity in railway safety management.
Previous studies predominantly focused on coating tests and numerical simulations addressing rail surface damage mechanisms, dynamic responses, and material characteristics; however, research addressing internal defects related to rail surface damage remains limited [3,4,5,6]. Choi [3] introduced a dynamic model that incorporates wheel–rail interaction forces and provided a qualitative assessment of the dynamic behavior of ballasted railway tracks. Grassie [7] analyzed frequency ranges associated with the corrugation mechanism and demonstrated that rail corrugations with similar wavelengths can occur at different locations because of distinct mechanisms based on the train speed [7]; the characteristics, causes, and potential mitigation measures of corrugation were also analyzed [7]. Damme et al. [8] numerically investigated changes in contact geometry and stress distributions as a function of wheel–rail contact position and wear [8]. Baeza et al. [9] developed a wheel–rail contact analysis methodology that considers various influencing parameters, including the contact position, and they proposed a railway dynamic simulation model based on the elastic contact theory [9]. Franklin et al. investigated RCF and wear phenomena, focusing on the effects of head checking defects on wheel–rail interaction and the associated derailment risks [10]. Further, they demonstrated that the application of railhead coatings using two novel materials could improve durability, extend service life, and enhance RCF resistance [10]. Conner [11] studied the applicability and limitations of the RCF and fracture mechanics-based life prediction. Donzella et al. [12] experimentally investigated the competitive relationship between wear and RCF at the wheel–rail contact interface, providing empirical evidence.
Steyn [13] conducted a comprehensive review of rail grinding and milling technologies; examined their operational mechanisms, benefits, and limitations; and suggested potential enhancements through advanced milling and high-speed polishing techniques. Mihai [14] analyzed railway noise generation mechanisms and identified wheel–rail contact during train operation as a primary source; further, they demonstrated that noise distribution varies with train speed and dynamic wheel–rail forces significantly affect railway noise. Popović et al. [15] categorized rail defects induced by RCF, reviewed the classification codes proposed by the International Union of Railways, and analyzed existing RCF defect classification frameworks. They emphasized the necessity of aligning such classification systems with European standards [15].
Zerbst et al. [16] examined the major cracks and damage mechanisms in railways by analyzing various load conditions, including contact, thermal, and residual stresses, along with the damage types, failure scenarios, and crack propagation stages. Ndao [17] developed an automated rail inspection method to detect fatigue damage, such as squats and head checks, on rail head surfaces. Using laser ultrasonics and electromagnetic acoustic transducers, this study experimentally verified the effectiveness of a noncontact surface acoustic wave detection method [17]. Nielsen et al. [18] investigated the causes and effects of extended wavelength (out-of-roundness) issues such as polygonalization in railway wheels. They proposed experimental detection technologies, numerical models, defect-removal criteria, and damage-mitigation strategies. Ishida et al. [19] demonstrated that applying lubrication to sharp curves reduces friction and wear effectively, decreases energy consumption, and contributes to derailment prevention and noise mitigation [19]. Kaewunruen [20] analyzed the effects of dynamic loading on the structural degradation in railway turnouts and proposed methods to monitor degradation within urban rail networks. Sresakoolchai et al. [21] utilized deep learning approaches to detect and diagnose complex railway defects with high accuracy by training and validating models using simulated acceleration data [21].
Yang et al. [22] emphasized the importance of understanding the wheel–rail dynamic interaction for improving railway capacity, providing a comprehensive discussion on its effects, modeling techniques, defect detection methods, and maintenance strategies.
In this study, rail samples were extracted from sections that exhibited surface damage during on-site inspections. Representative damage types were identified from field surveys, and three 20 m rail segments were cut and retrieved during train service suspension periods. The extracted rail sections were processed into specimens indicating characteristic damage regions. High-resolution surface images were obtained through laboratory inspections, and internal damage features were captured using SEM. The SEM observations enabled a detailed examination of the subsurface crack characteristics. A comprehensive training dataset was established based on the collected surface images and SEM-derived internal damage data. The rail defects were classified into headcheck and spalling categories, and a fast R-CNN-based deep learning model was implemented for automated damage detection. A quantitative deep learning framework was developed to represent the internal damage state of railway rails using this approach. This model enables detecting internal rail damage, which is often difficult for inspectors to assess using only rail surface images. The classification and application of the training dataset were conducted in accordance with the rail damage criteria specified in the “Detailed Guidelines for Track Facility Performance Evaluation” in Korea [1,2]. Furthermore, a smartphone-based rail damage diagnostic application was developed to bridge the gap between theoretical models and field maintenance. By matching surface images captured on-site with a cloud-based big data repository of internal damage features, the application provides inspectors with quantitative metadata—such as crack depth, length, and angle—enabling more scientific and proactive maintenance strategies. This system significantly reduces human error inherent in conventional visual inspections and ensures consistency across different evaluators. The remainder of this paper is organized as follows: Section 2 details the field investigation of various rail damage types and defines the terminology for load and stress directions. Section 3 describes the laboratory investigation using Scanning Electron Microscopy (SEM) to analyze the correlation between surface defects and subsurface crack propagation. Section 4 explains the construction of the deep learning training dataset and the architecture of the Fast R-CNN model used for damage classification. Section 5 presents the development of the rail damage diagnostic application and its field applicability and reliability assessment. Finally, Section 6 summarizes the research findings and suggests directions for future work. While we utilized a robust model architecture, the scientific novelty of this research resides in the original dataset protocol, the quantitative human-AI performance benchmarking, and the proposal of a data-driven predictive maintenance framework.

2. Rail Damage Investigation

2.1. Overview

Rails from an operating line were collected and examined to investigate the relationship between surface damage types and internal defect characteristics. The extracted rail segments were prepared as SEM specimens. The samples originated from a tunnel section with a concrete track structure. An overview of the observed rail damage is presented in Figure 1.
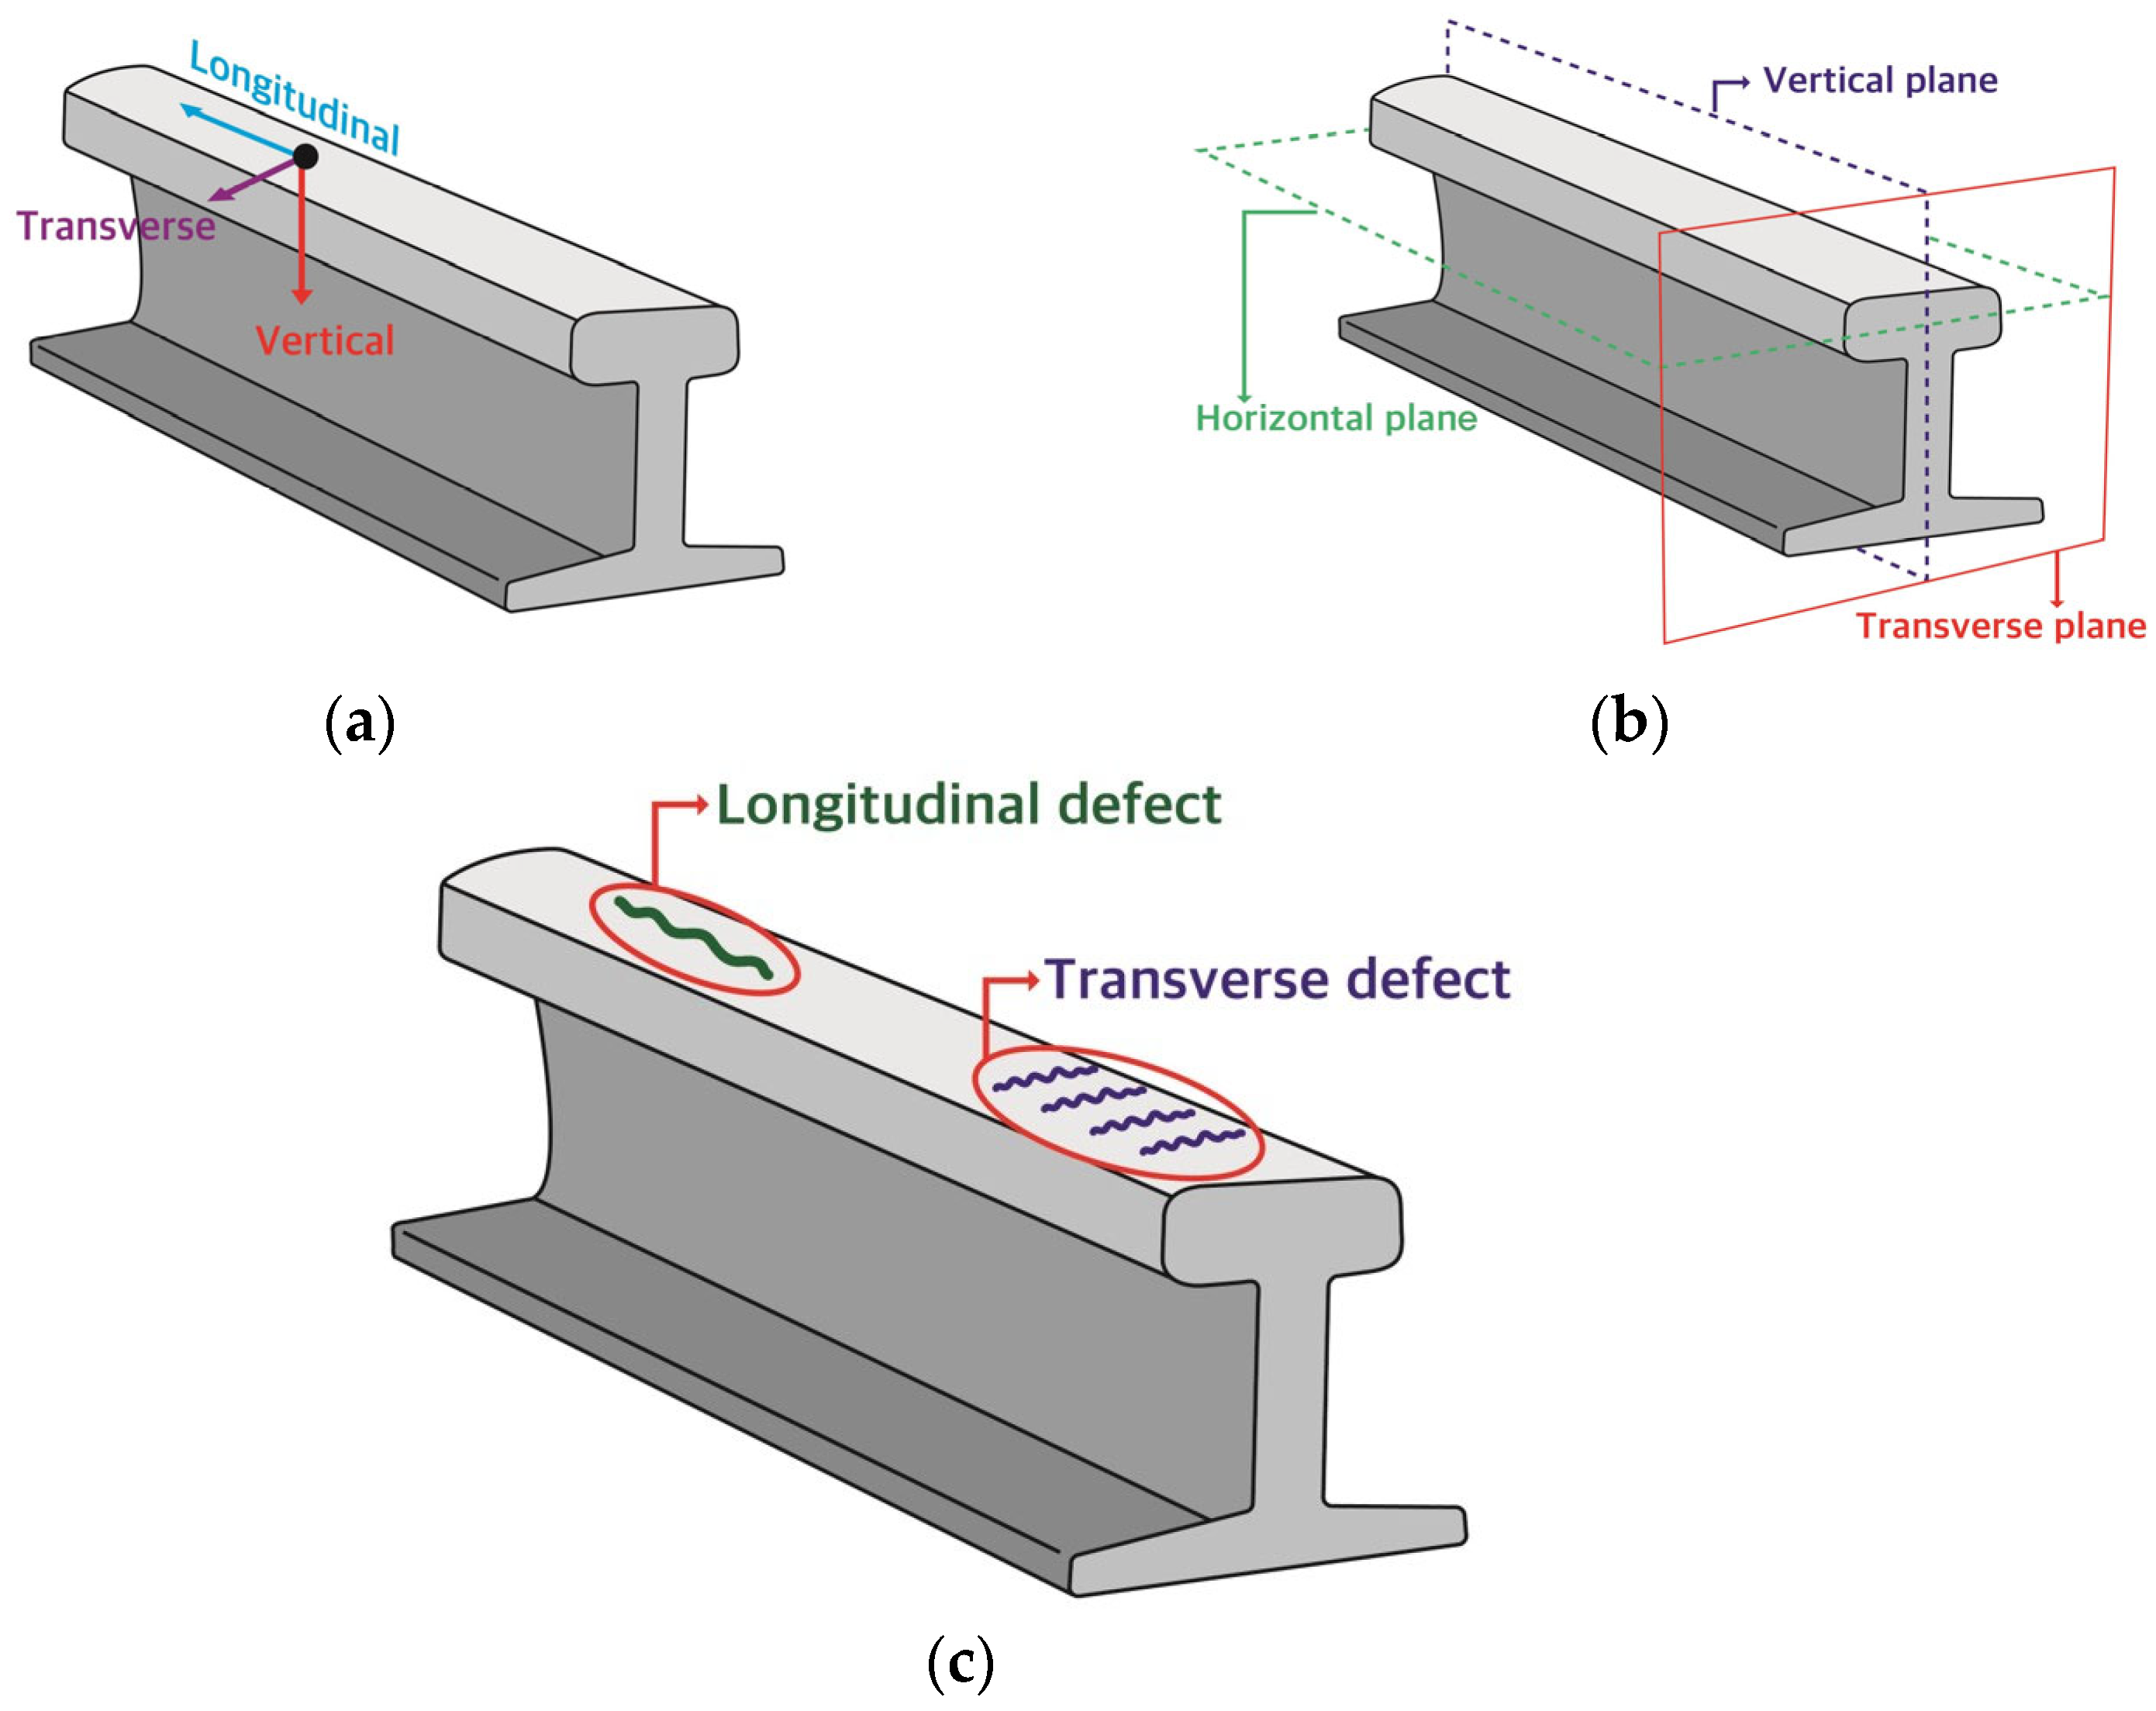
A site investigation was conducted in a tunnel section with a concrete track where multiple instances of rail damage occurred. The samples of damaged rails were collected via field surveys. The initiation and progression of rail damage require the presence of loads and stresses acting on the rail. The terminology related to the rail direction necessary to describe rail loads and stresses is illustrated in Figure 2.
As shown in Figure 2a, the longitudinal and transverse directions refer to the lengthwise and cross-sectional directions of the rail, respectively. The vertical direction refers to the direction perpendicular to the rail surface. Terms describing planes relevant to the load and stress explanations are presented in Figure 2b. The vertical and horizontal planes are defined as planes perpendicular and parallel to the rail length, respectively. The transverse plane corresponds to the cross-sectional plane of the rail. Terminology used to describe the orientations of the surface and internal rail defects is illustrated in Figure 2c. A longitudinal defect (L-direction defect) refers to a defect aligned with the rail’s longitudinal axis, and it is caused by lateral wheel movement attributed to hunting and snakelike motions of the vehicle. A transverse defect (C-direction defect) is defined as a defect aligned with the transverse axis of the rail, which results from the rolling contact between the wheel and rail during train operation.

2.2. Rail Damage Types

Rail damage was defined in accordance with previous research as RCF damage, and cracks propagating from the rail surface into the interior were referred to as internal cracks [3,4,5,6]. RCF damage is a form of fatigue damage induced by rolling contact and primarily formed under the effect of axle load and traffic volume. Typical examples include microdefects such as head checks, squats, and spalling. Defects originating below the surface layer are manufacturing-related, and shelling is a representative example.

2.2.1. Shelling

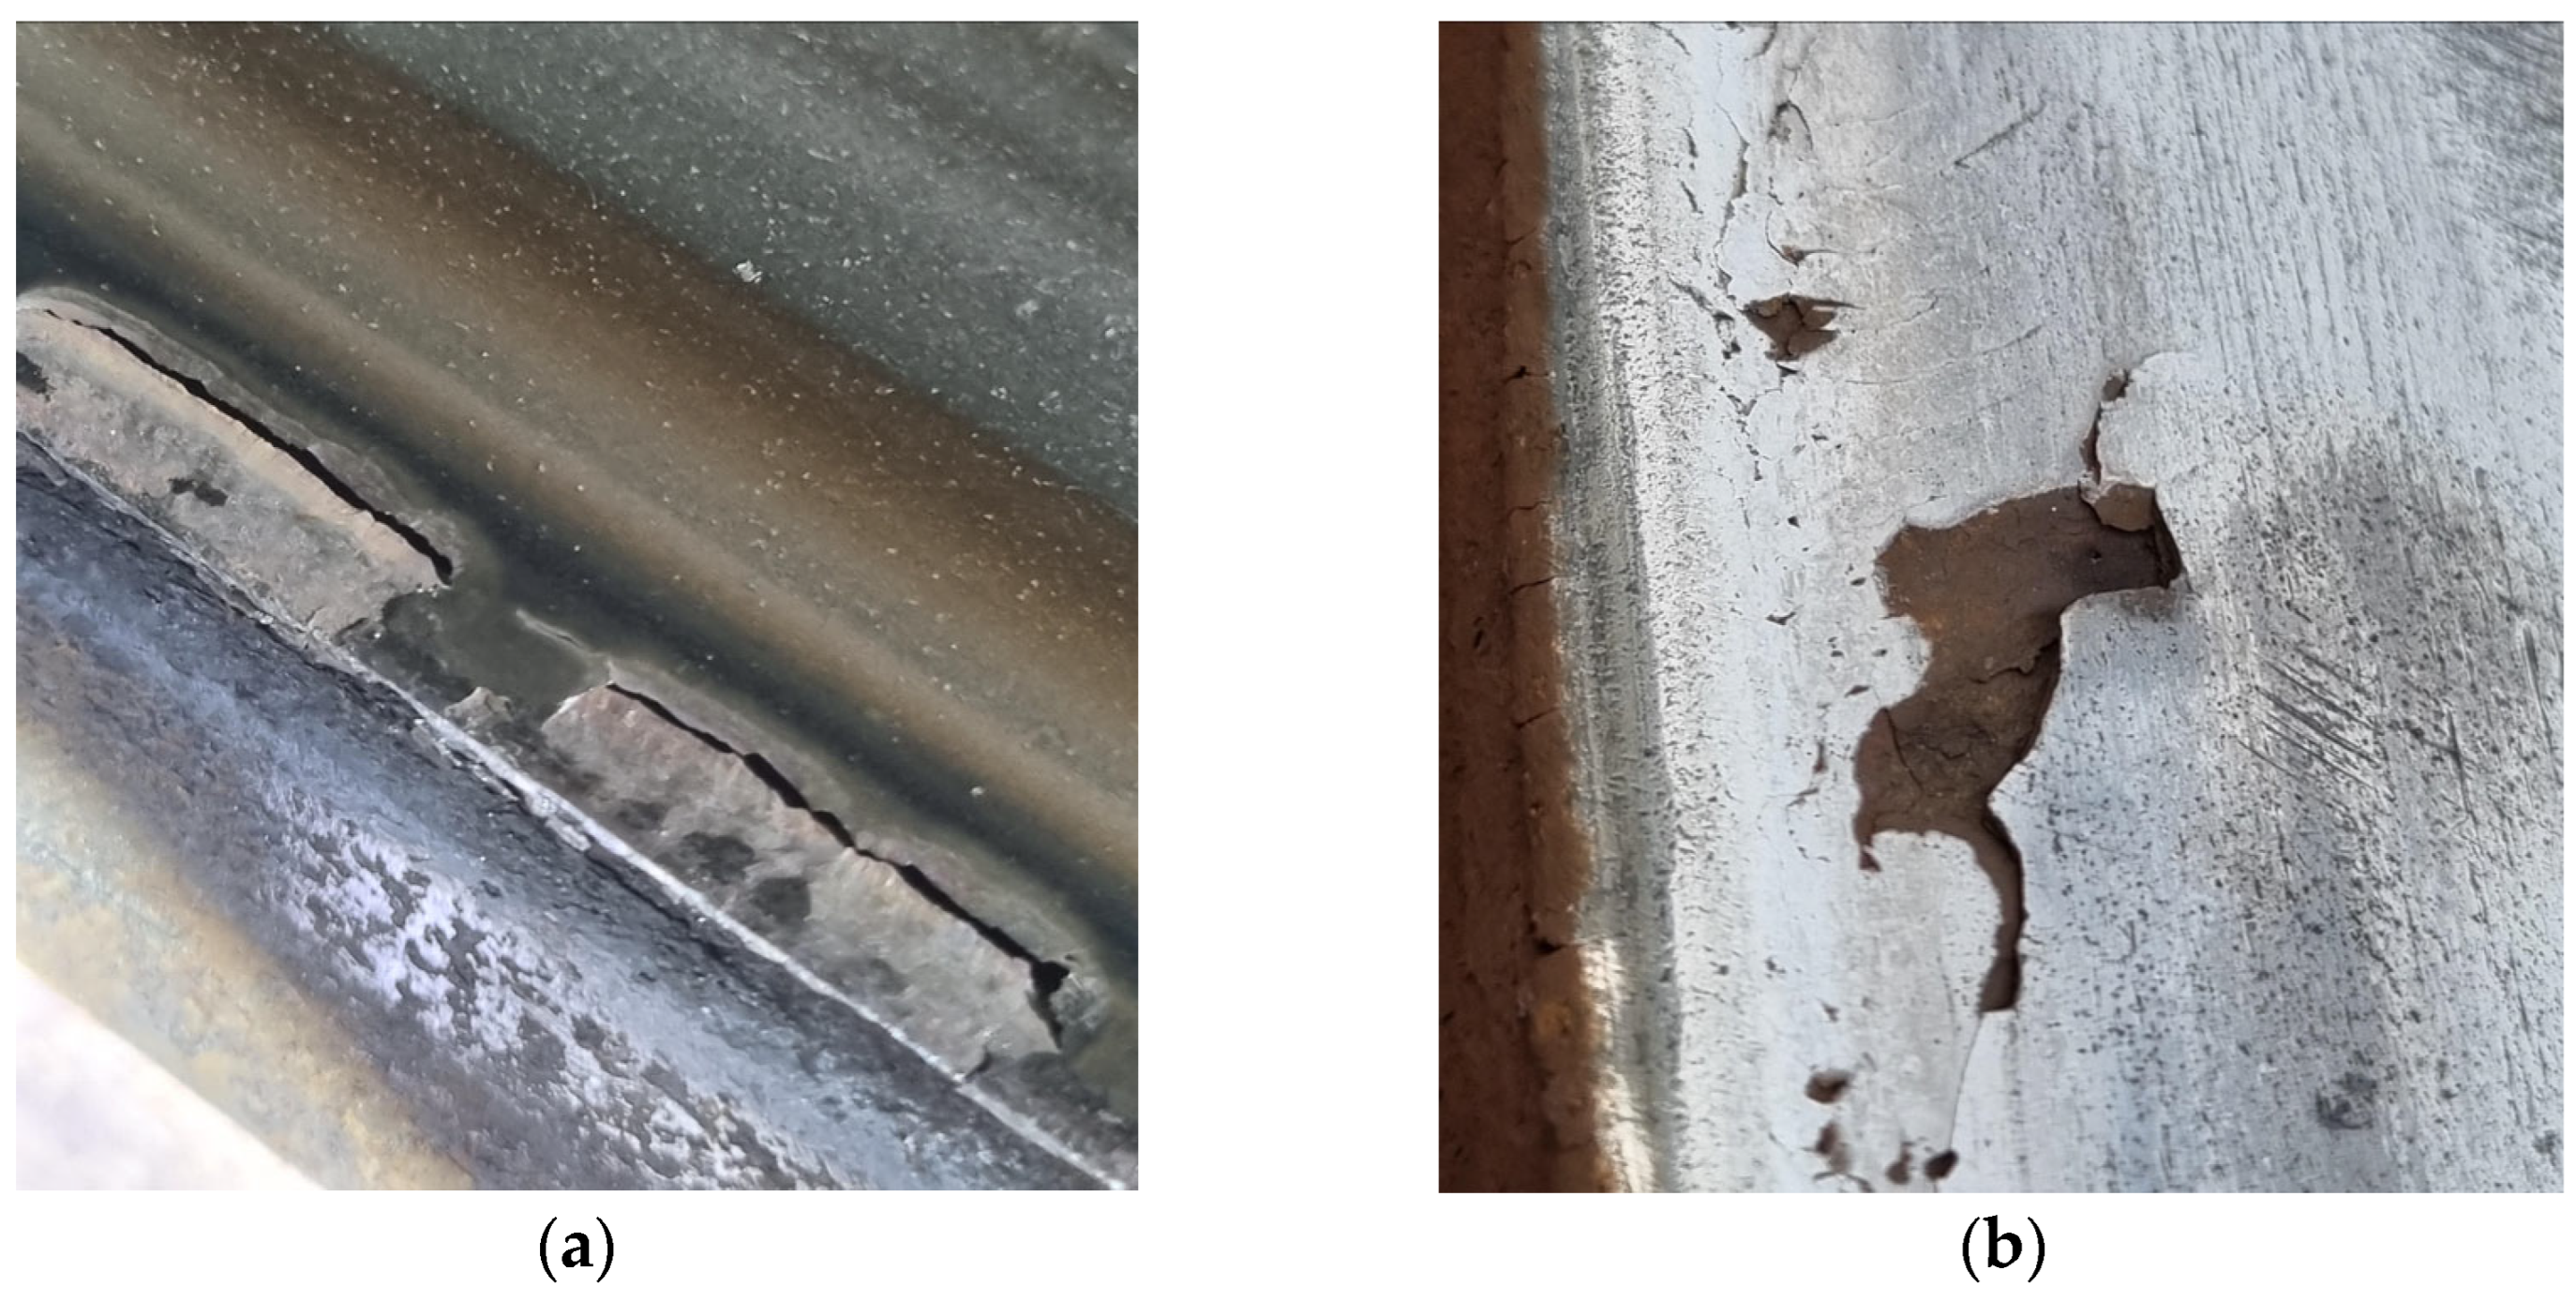
Shelling occurred at the interface between the hardened regions of the rail and boundary subjected to train loading, where a cold-formed boundary layer was generated. This cold-formed layer extended from the rail surface to a zone unaffected by significant internal stress variations. Figure 3 shows that delamination occurs because of the combined effects of the notch-induced stress concentration and the presence of nonmetallic inclusions within the rail, accelerating the shelling process and eventually leading to material separation. Such defects are initiated at a depth of 2–8 mm below the gauge corner of the outer rail in curved track sections. In some cases, cracks propagate further beneath the surface, leading to transverse fractures.
Rail shelling is predominantly caused by material loss attributed to subsurface fatigue, with defect initiation occurring below the surface layer. This is closely associated with factors such as the presence of oxides, nonmetallic inclusions, and residual stresses from the rail manufacturing process. To prevent shelling, using high-purity rail steel free from macroscopic inclusions or applying preventive grinding to remove the cold-formed boundary layer is considered effective. Although shelling can be misidentified as spalling, the two differ in appearance, formation mechanisms, and damage characteristics, making accurate differentiation essential.

2.2.2. Headcheck

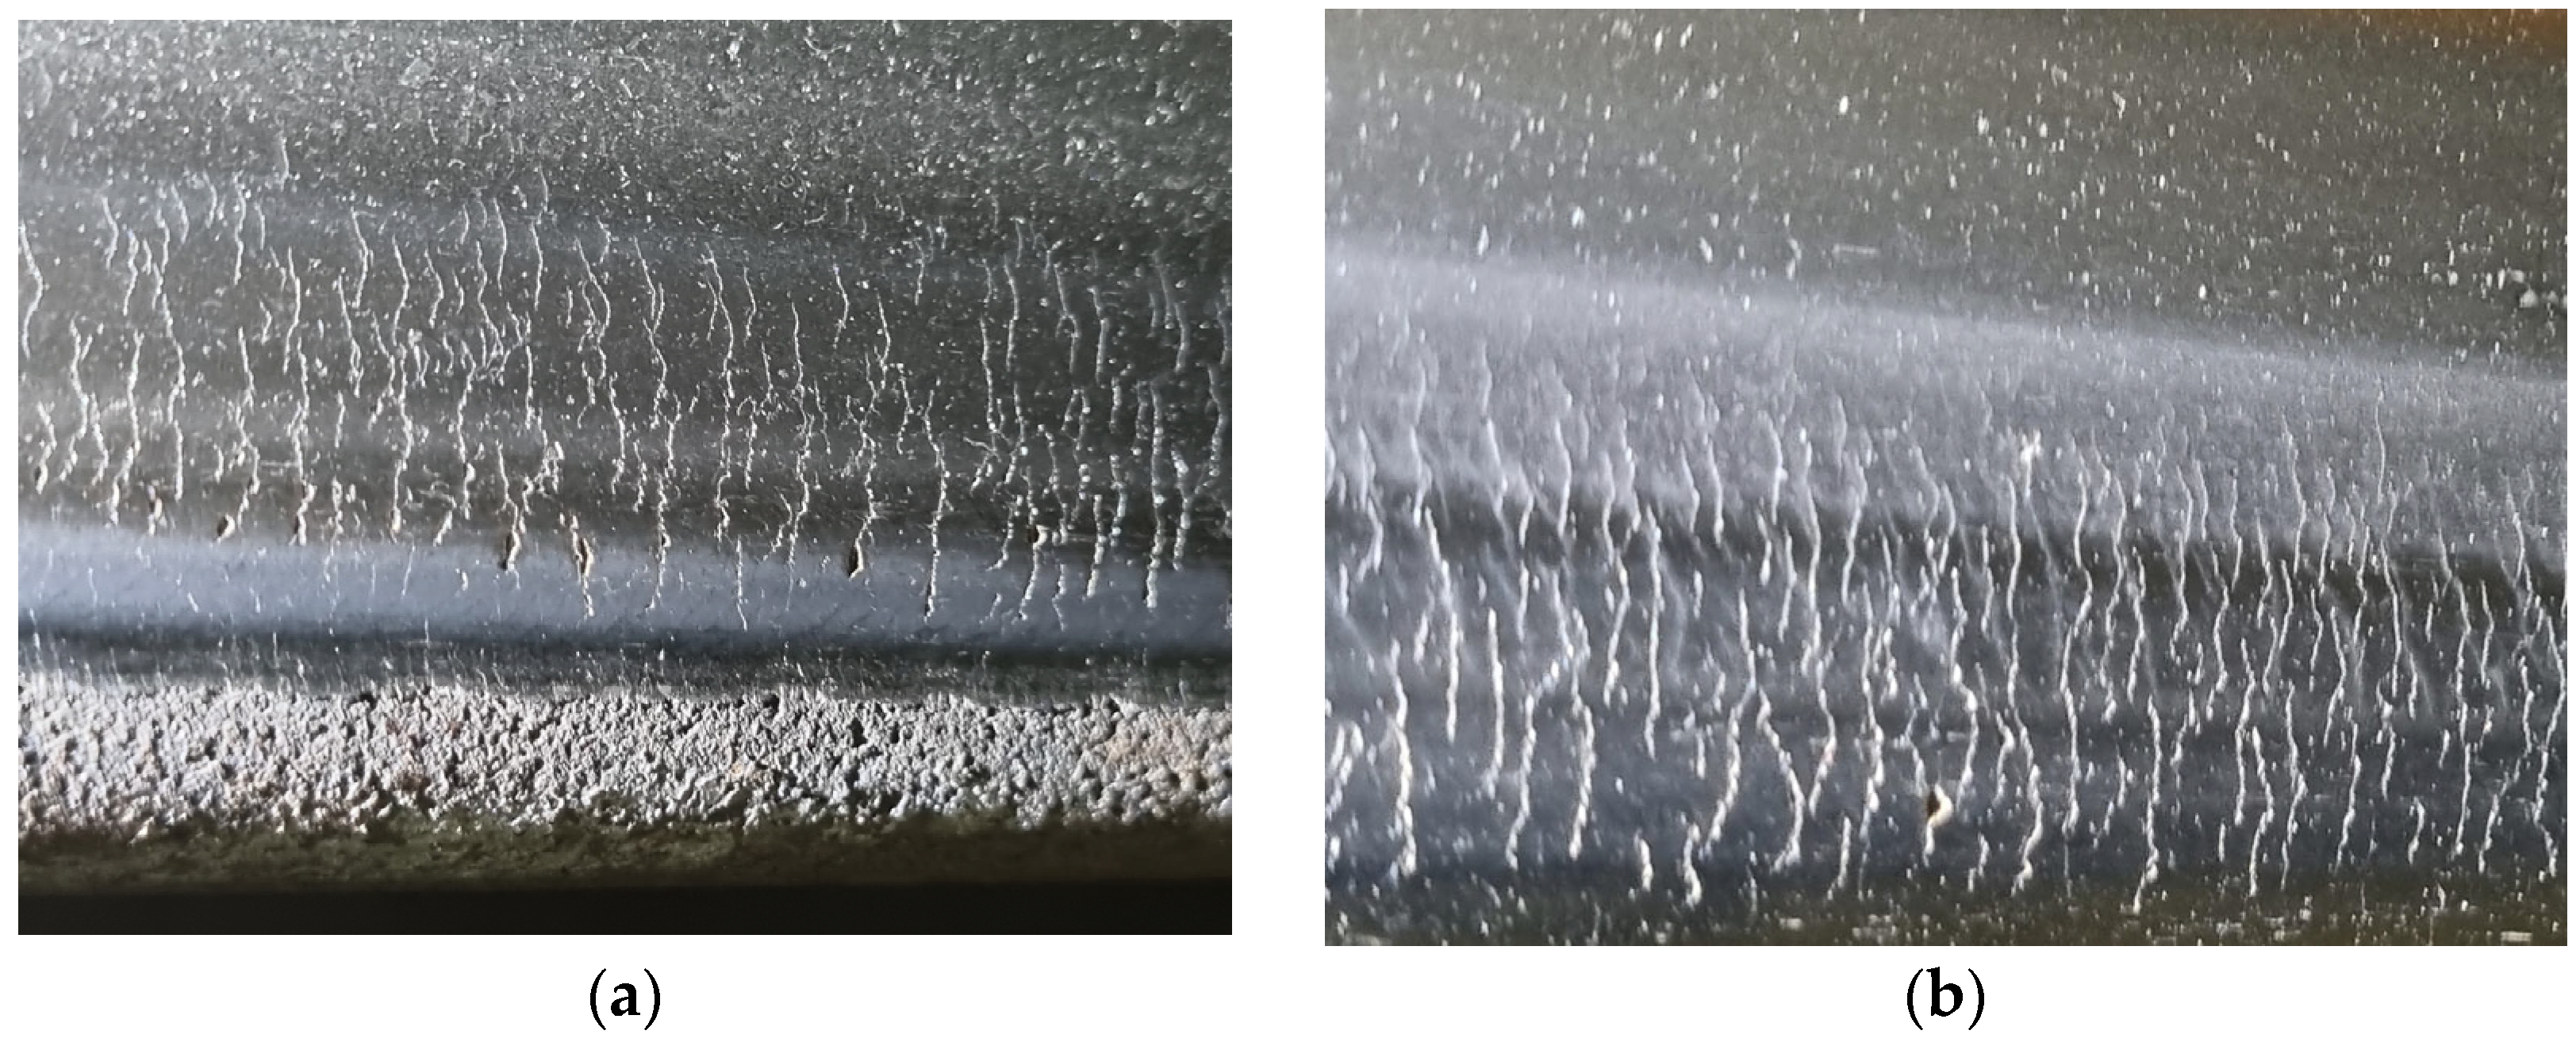
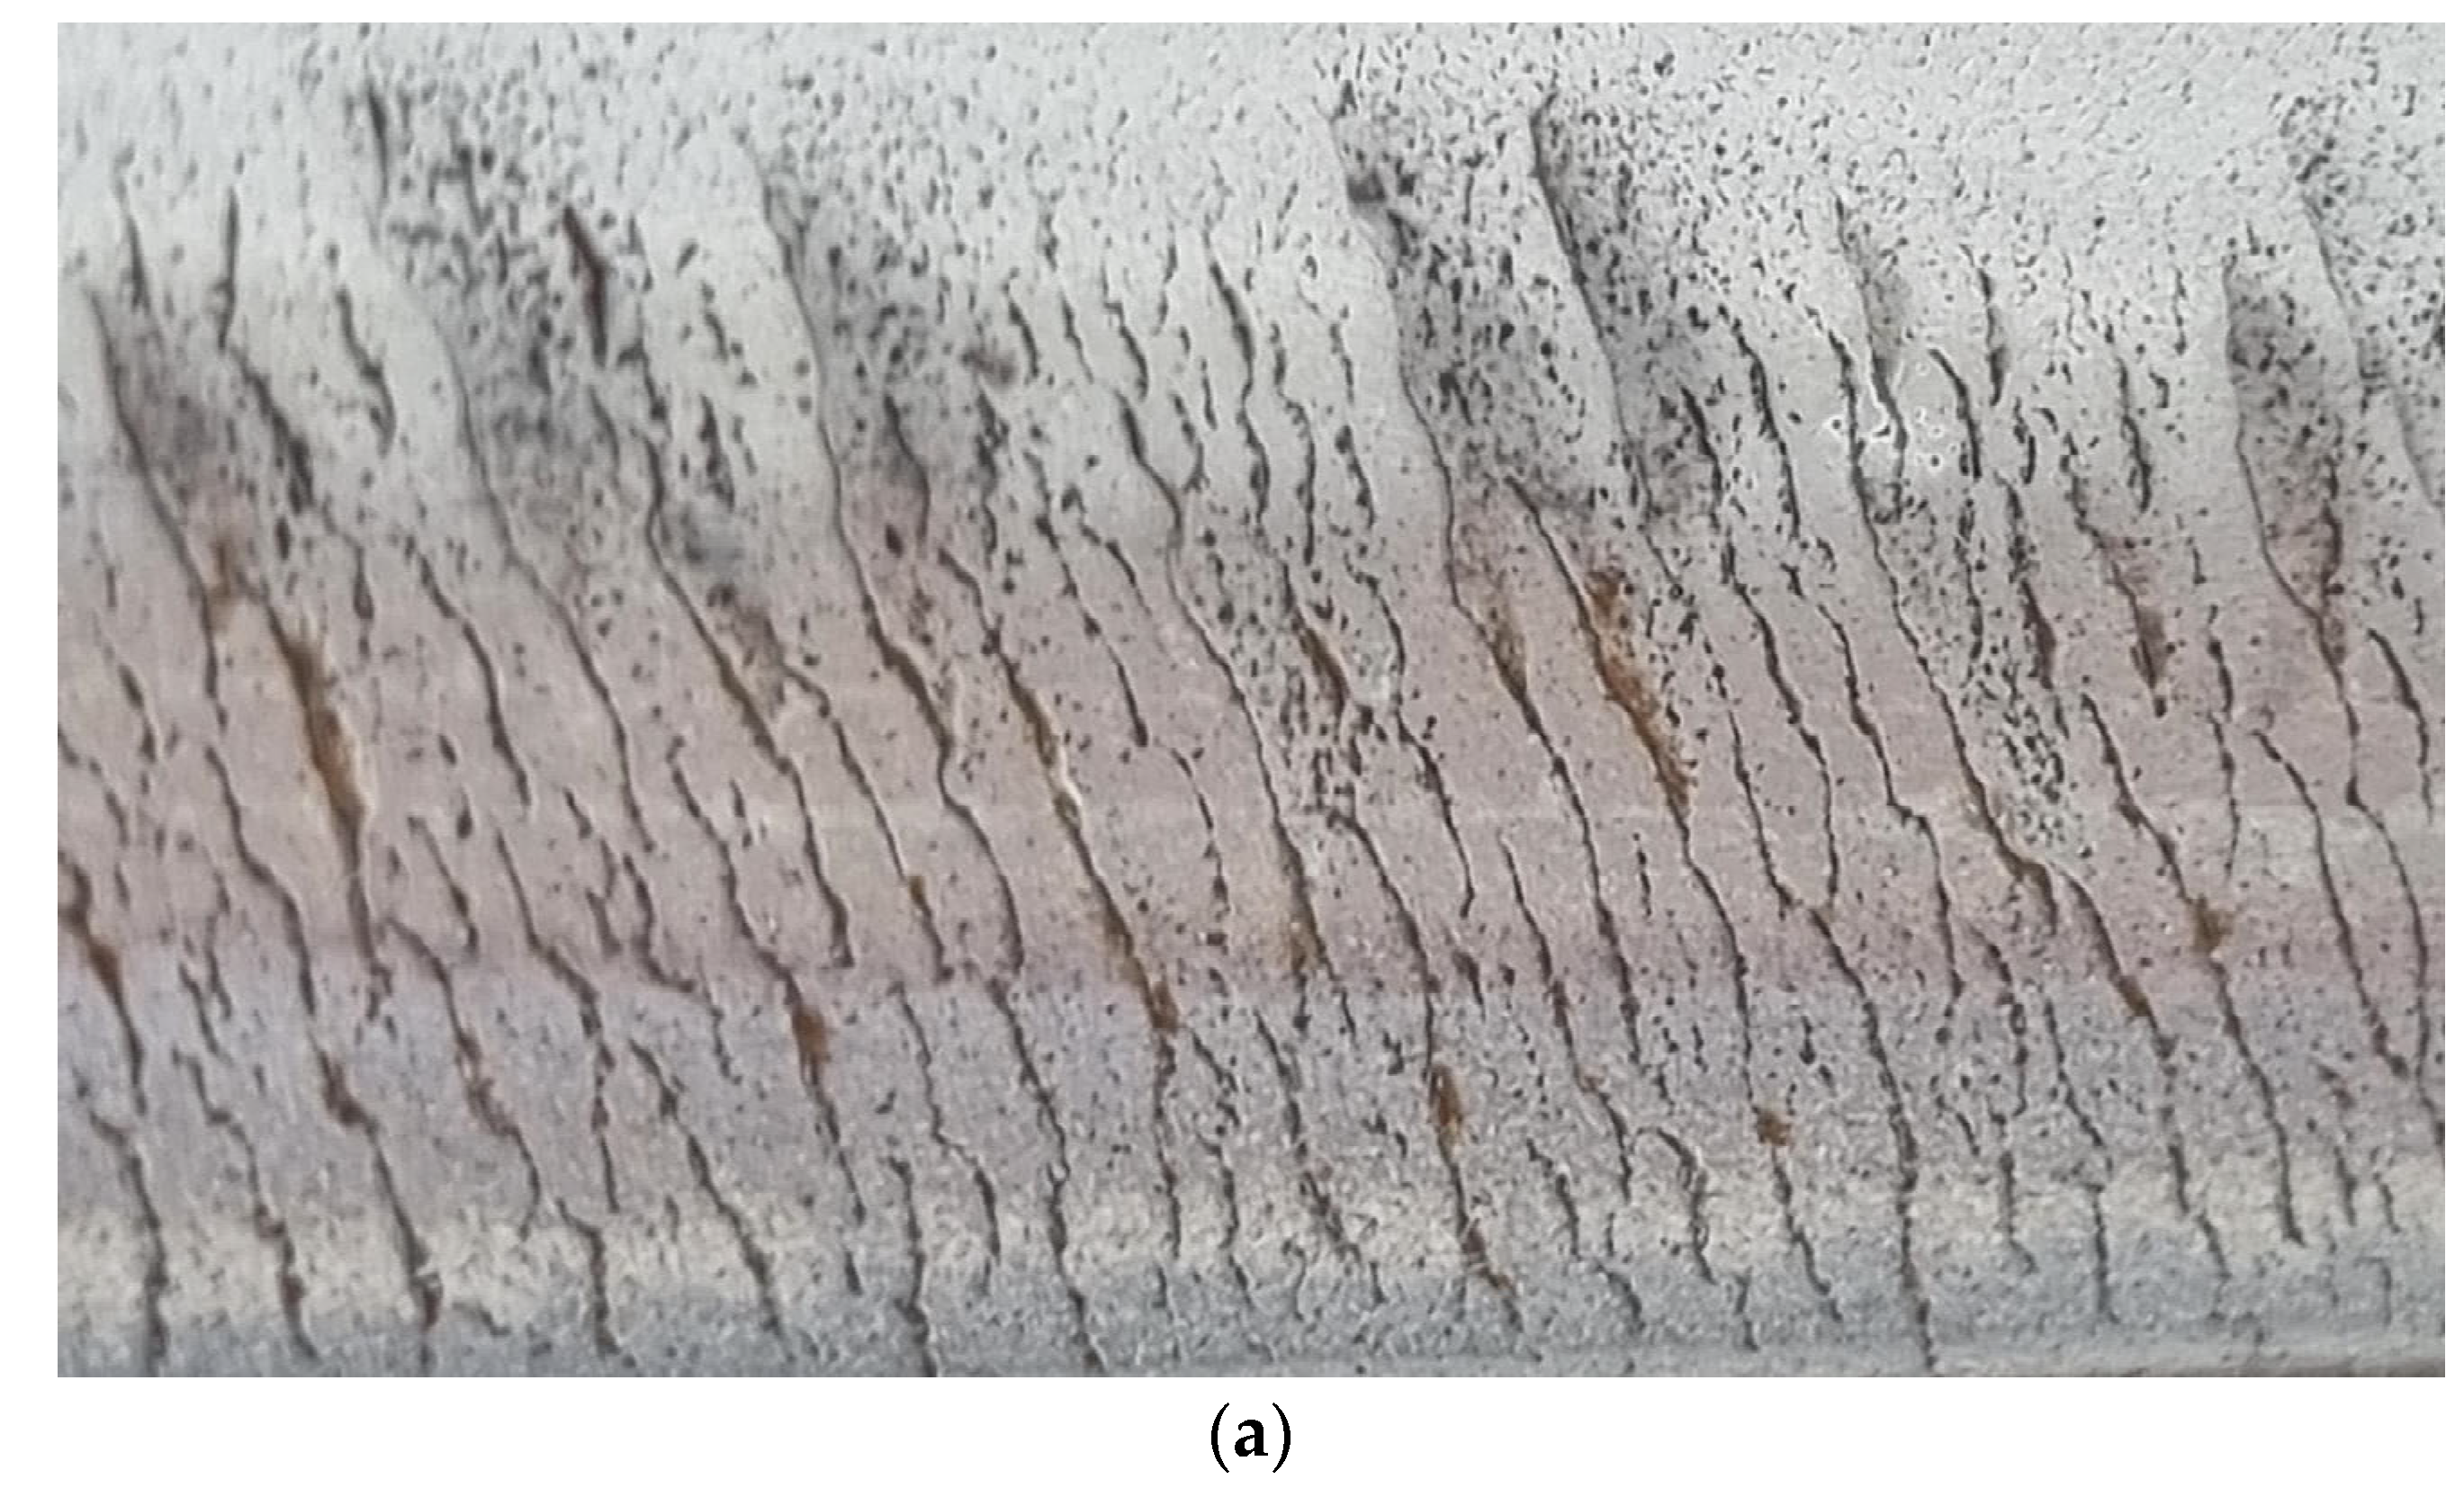
Cracks that develop on rail surfaces can be identified through visual inspection; however, quantitatively evaluating the depth and extent of the associated damage is considerably challenging. Microcracks commonly occur in track sections with large curve radii (1500–2000 m), forming at an angle of ~30–60° to the gauge corner because of the contact and slip between the wheel and outer rail in the curved sections. As shown in Figure 4, these microcracks appear as continuous lines measuring 2–7 mm in length and are initiated within the deformed layer when it reaches the critical energy threshold during train braking.
Microcracks can form near welded joints, where surface hardness may be slightly lower than that of the parent material. This reduction in hardness can lead to surface irregularities or wear, altering the contact area between the wheel and rail. Such changes in contact geometry affect contact stress distribution, potentially causing excessive localized contact pressure and promoting microcrack initiation. When microcracks originating within the railhead surface layer cause small, thin metal fragments to detach, the damage manifests as spalling. Most damage to the railhead surface is caused by RCF, which exhibits the following characteristics:
  • Occurrence at the gauge corner of rails with a curve radius less than 1200 m.
  • Occurrence at the gauge corner of straight rails or rails with curve radii exceeding 2000 m.
  • Occurrence on both inner and outer rail surfaces.
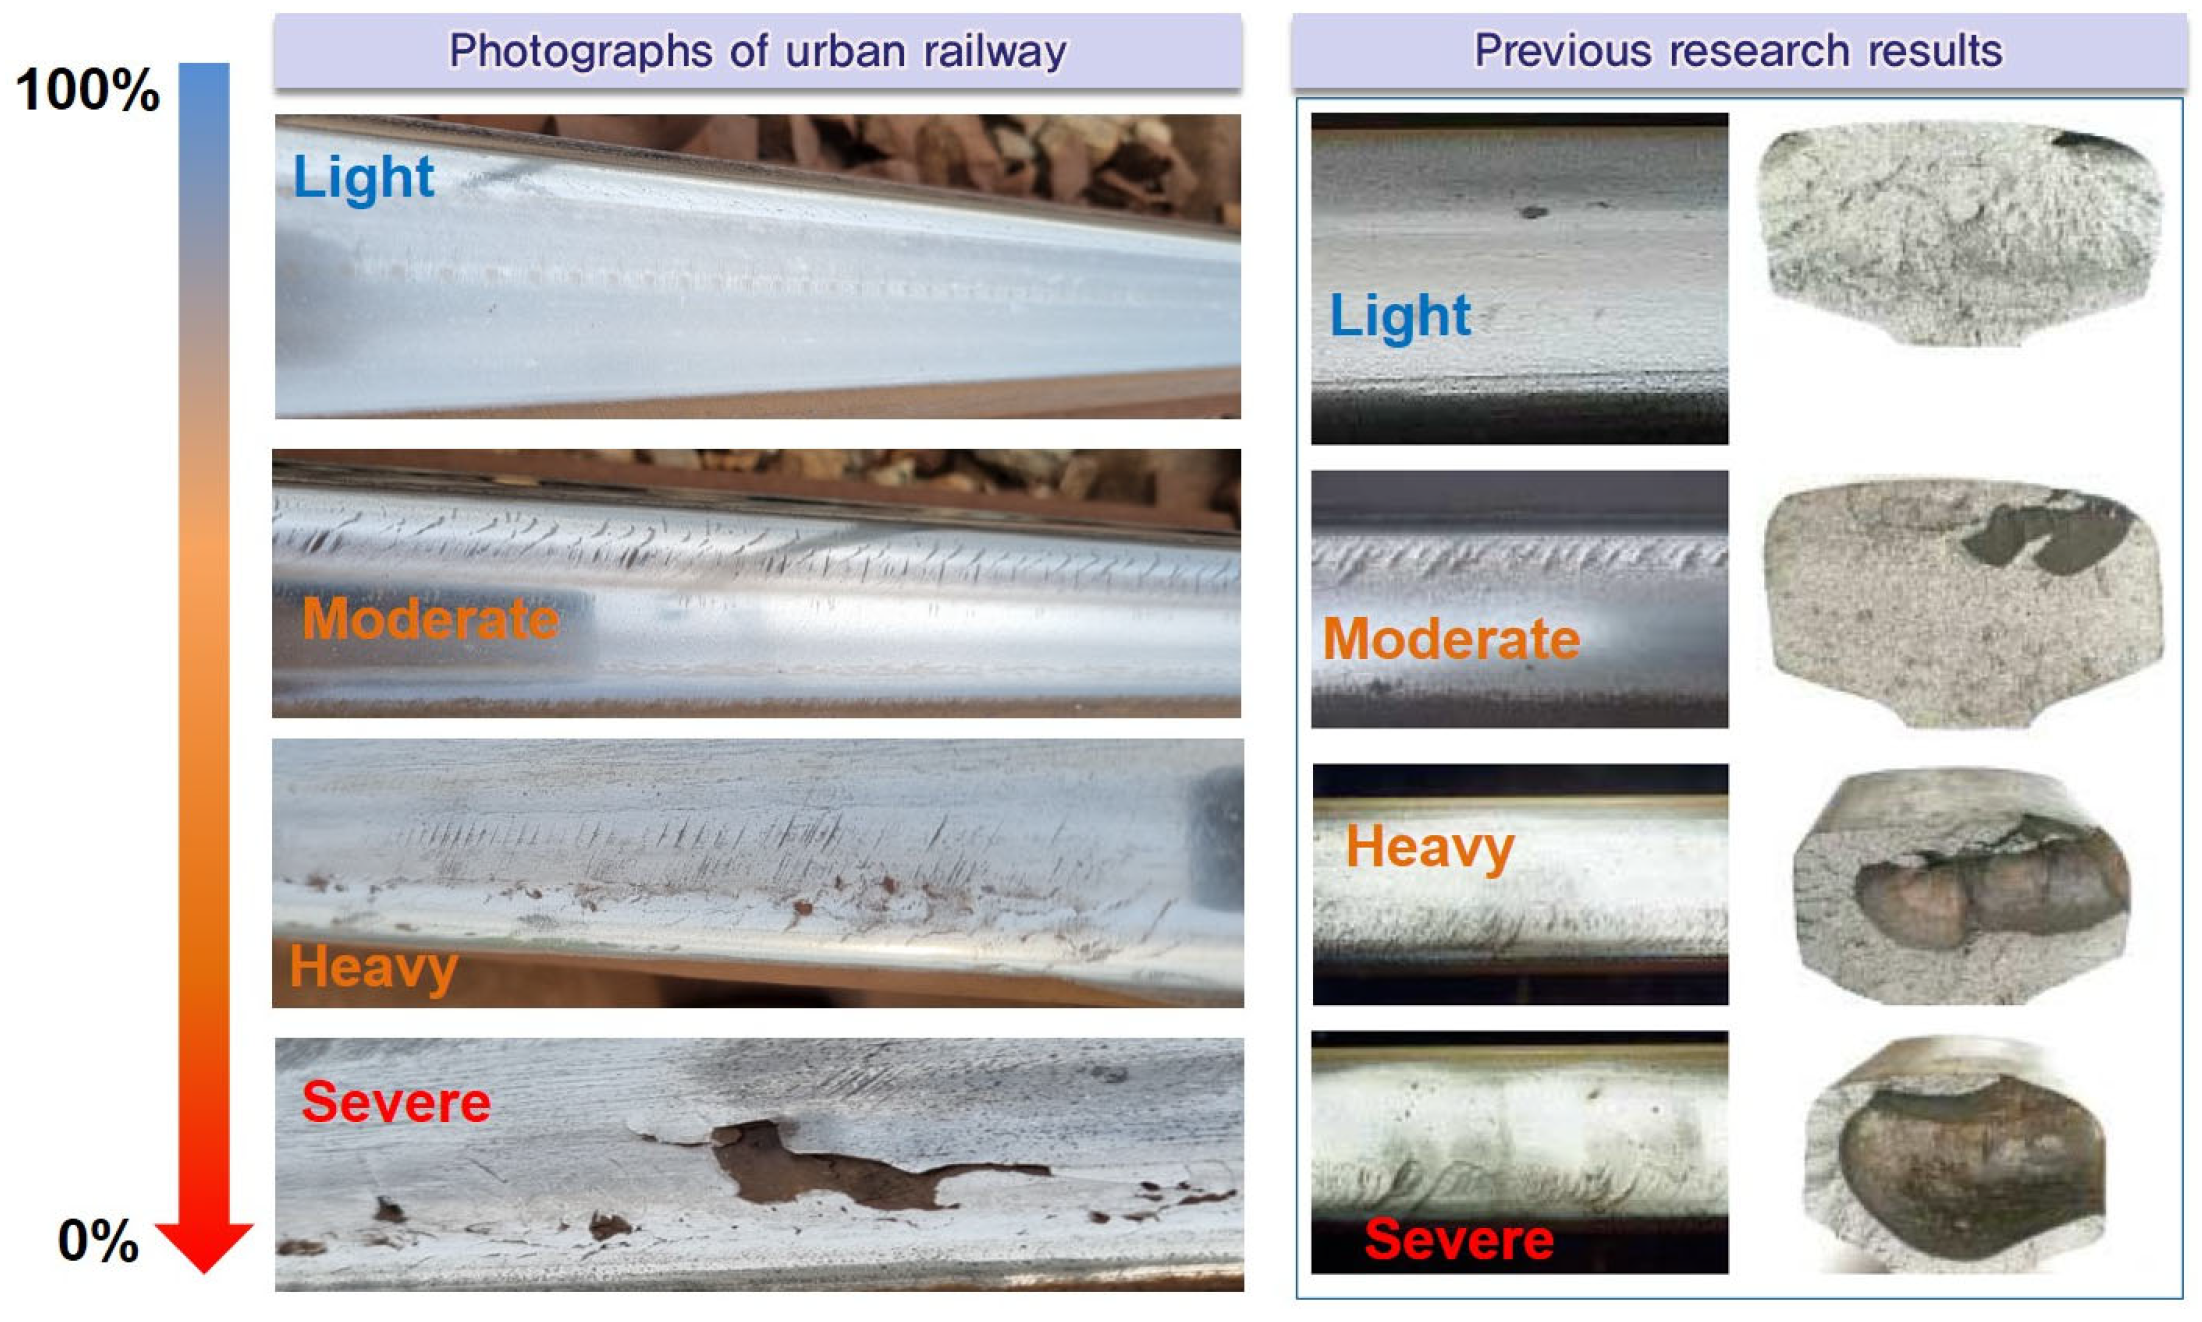
The correlation between surface defects detectable through visual inspection and internal cracks or changes in the internal metallographic structure is illustrated in Figure 5. When RCF damage such as microcracks can be assessed as minor during visual inspection, it is not removed in a timely manner and can lead to the development of internal rail defects, as shown in Figure 5. Further, cracks originating from the rail surface may propagate and cause transverse fractures in the rail cross-section. Therefore, rail grinding (or milling) is the most commonly employed method to remove surface defects and serve as a preventive maintenance measure to reduce the risk of rail fracture.

2.2.3. Spalling

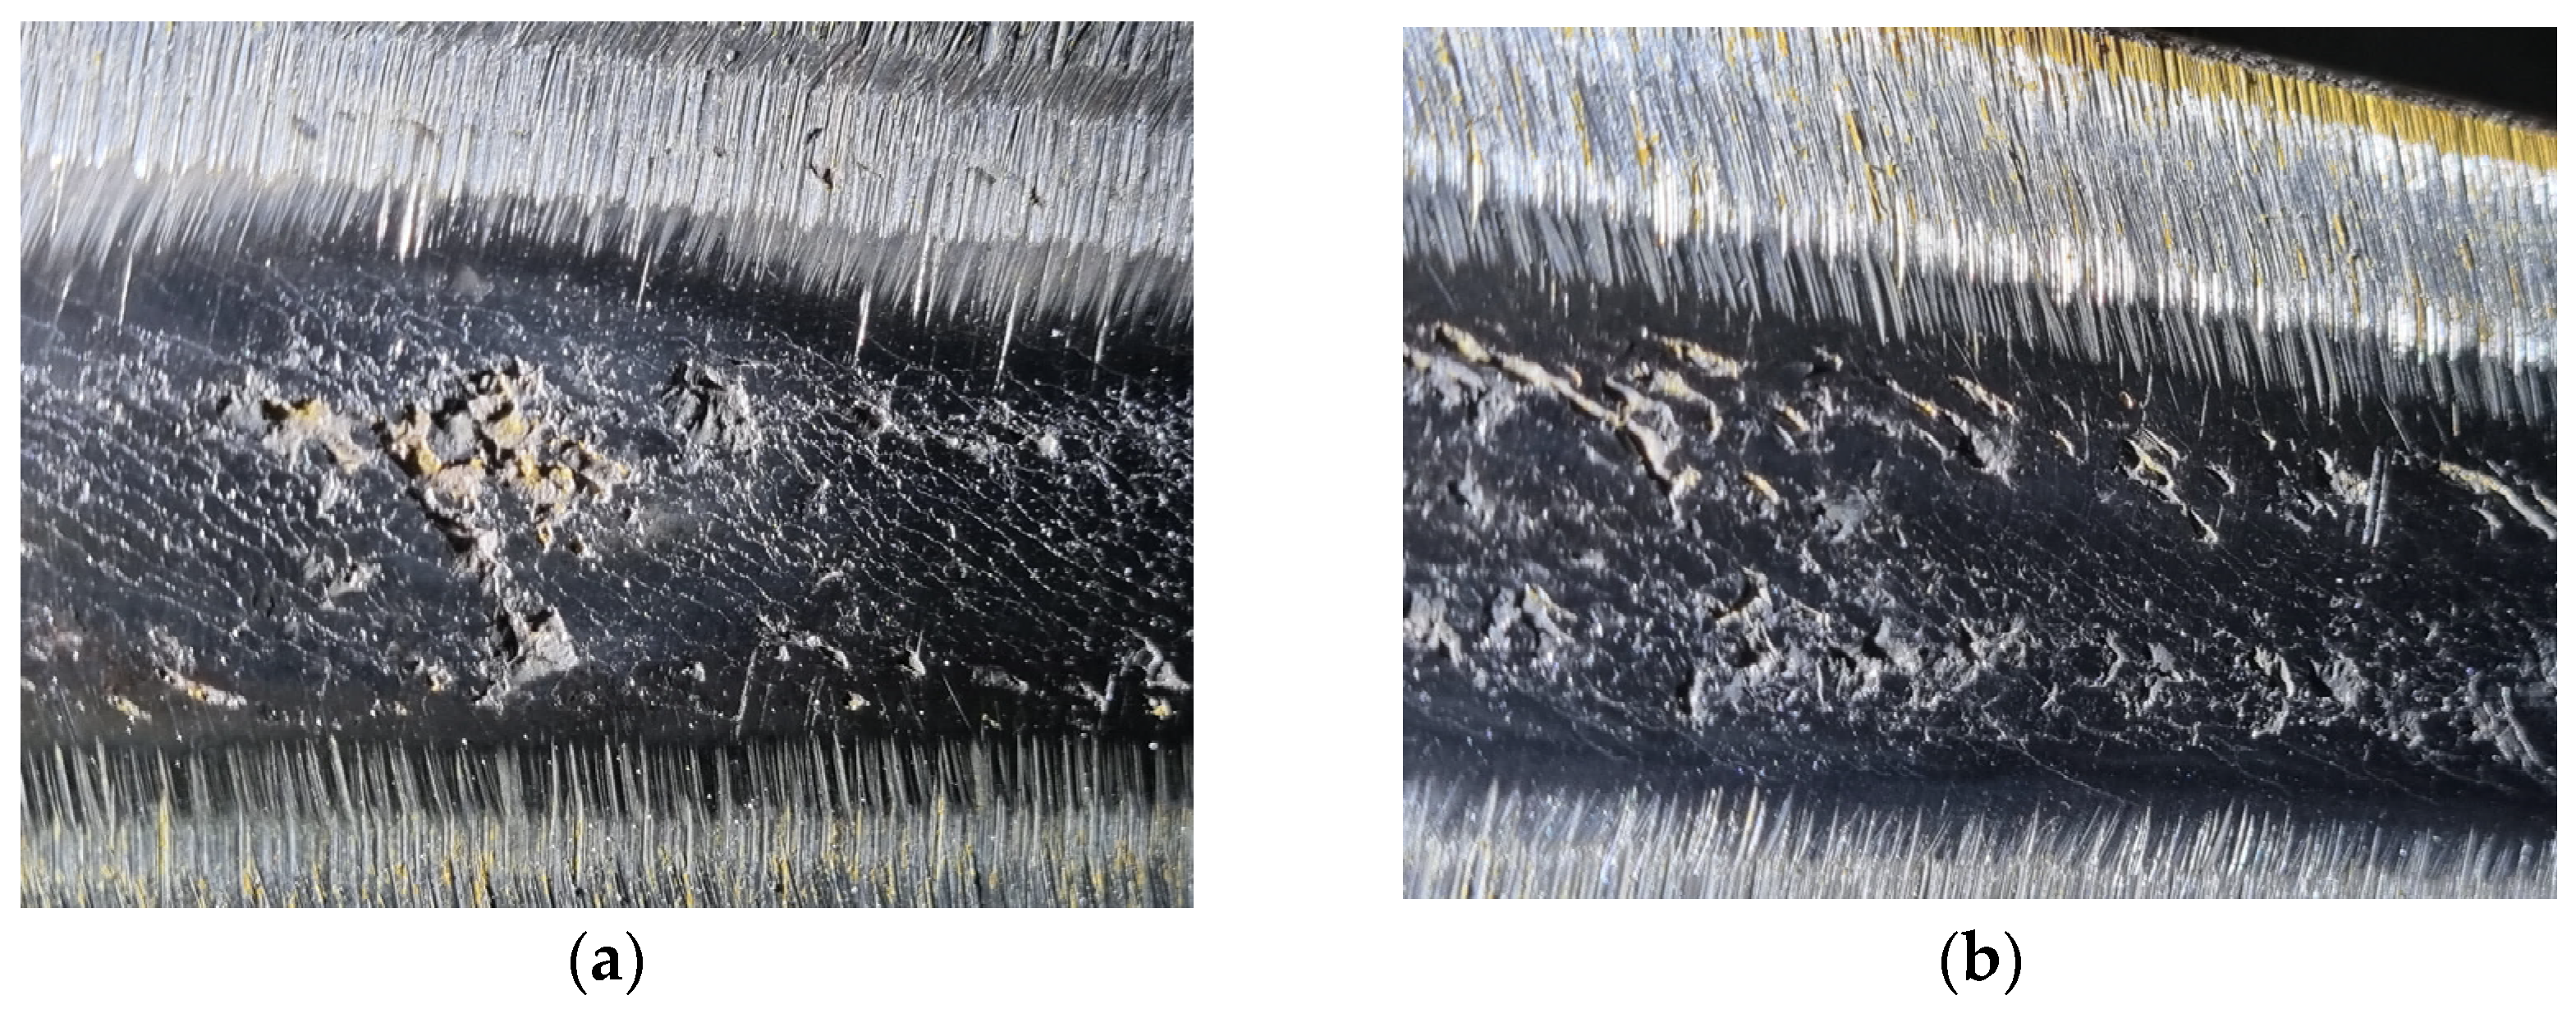
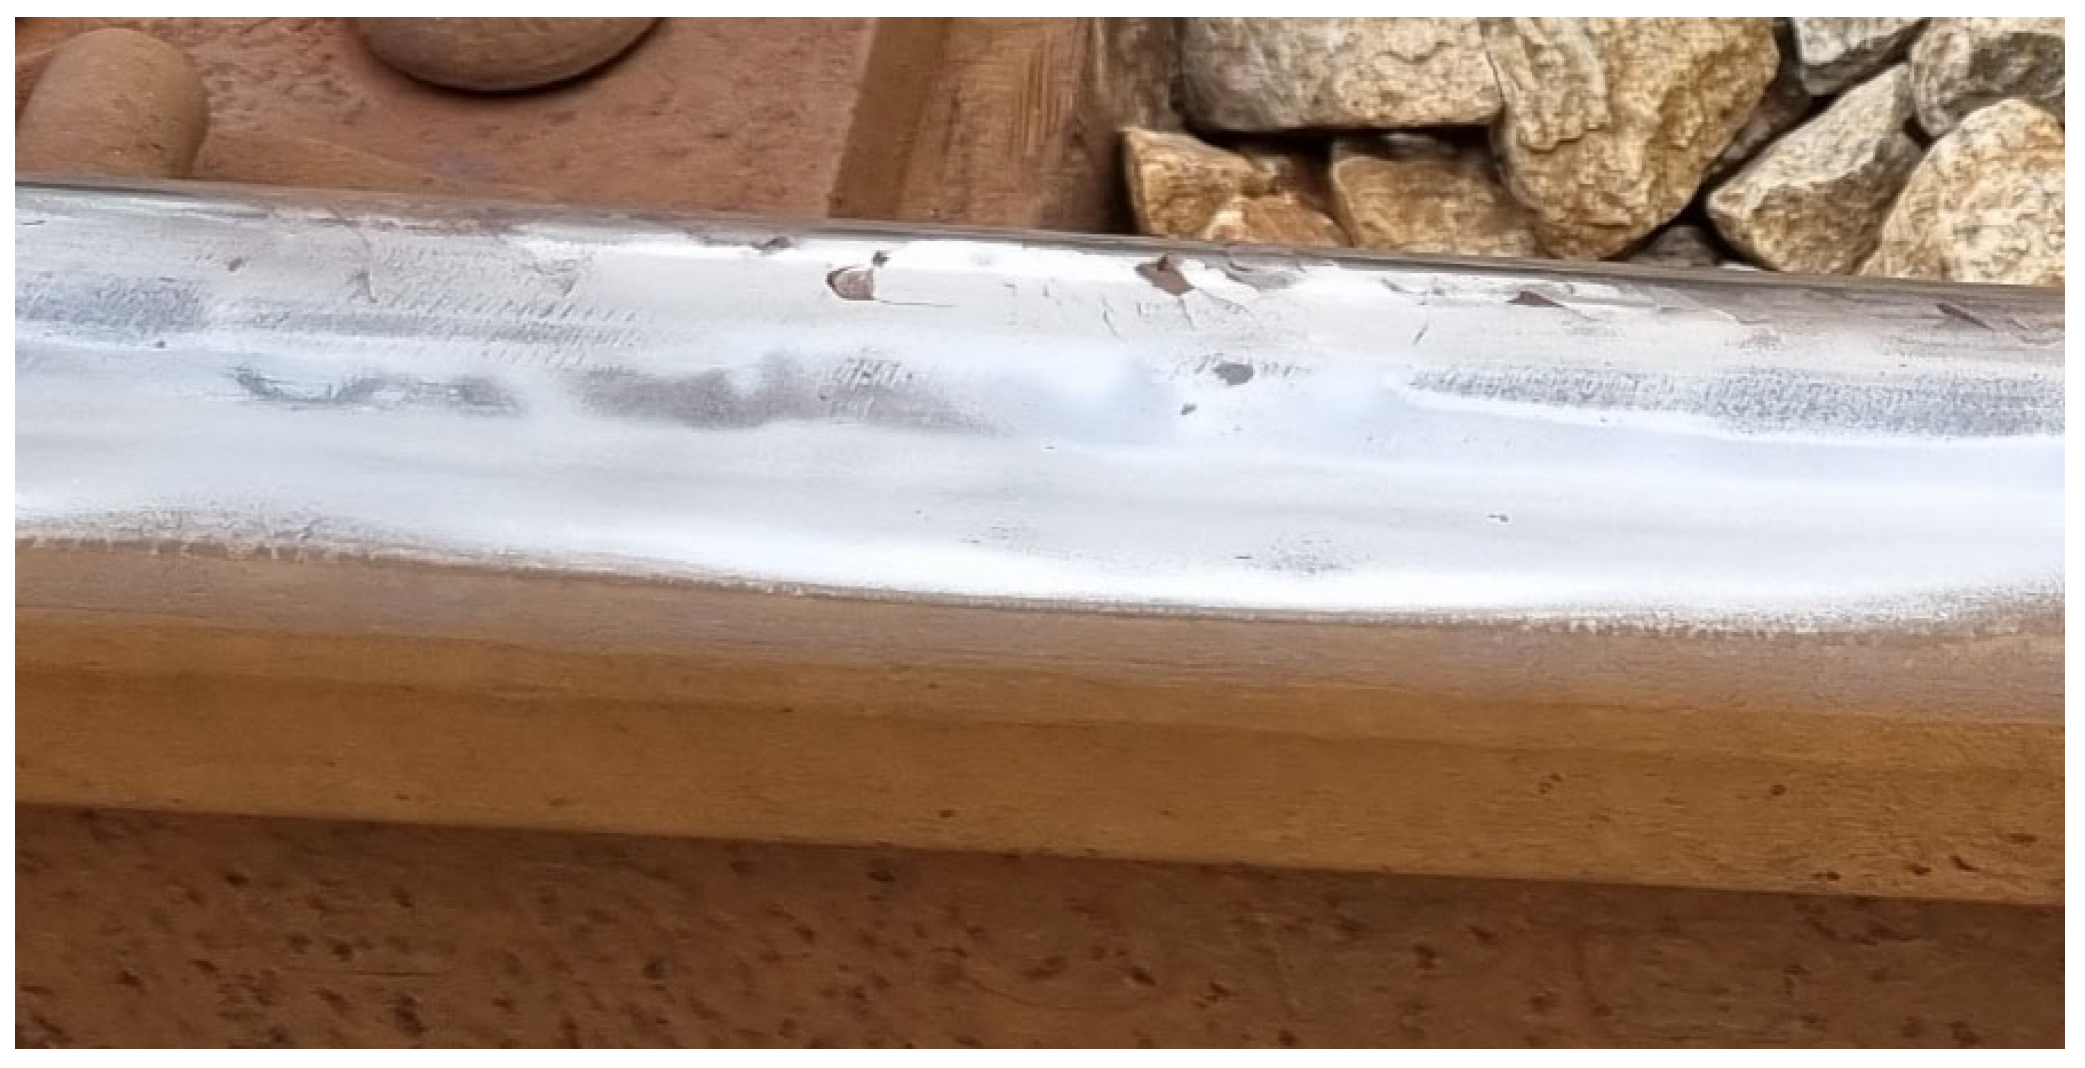
Spalling refers to the separation of metallic fragments from a railhead caused by elevated contact stresses under repeated loading. As shown in Figure 6, this phenomenon occurs when surface-initiated cracks merge with shallow subsurface cracks in the rail head. Spalling is commonly observed at the gauge corner of a high rail in curved sections; however, it can appear on the running surface of a low rail. In the early stages, spalling appears as microcracks, and it is closely associated with high shear stress and RCF damage. Spalling develops after a substantial crack angle (crack propagation) occurs and is more frequently observed in cold climates.

2.2.4. Squats

The mechanism leading to the formation of squats is yet to be clarified. However, it is understood that squats initiate with surface cracks propagating in response to rolling contact stresses, subsequently developing into trailing cracks [5,6,7,8,9,10,11,12,13,14,15,16,17,18,19,20,21,22]. High traction forces are widely recognized as the primary cause, which generates excessive surface shear stresses that trigger characteristic RCF cracks [5,6,7,8,9,10,11,12,13,14,15,16,17,18,19,20,21,22]. Squats are observed on both straight and curved track sections where trains operate at high speeds (above 200 km/h). As indicated in Figure 7, the cross-section of a squat contains two cracks: a short leading crack oriented in the train running direction and a considerably longer trailing crack inclined ~30° from the horizontal. The trailing crack propagates faster than the leading crack, and if not addressed at an early stage, it can grow and extend toward the lower web of the rail. In the early stages, a squat appears as a shallow depression at the center of the railhead, often visible as a dark patch on the running surface. In some cases, large cracks are observed beneath the patches. As illustrated in Figure 7, these depressions promote the propagation of surface cracks and increase the dynamic wheel load between the wheel and rail.
Unlike head checks, squats tend to occur on rails where wear is less advanced. Unlike spalling, they form on the central running surface of the rail head on straight-track sections. These defects are categorized as surface defects induced by the RCF.

2.2.5. Plastic Flow

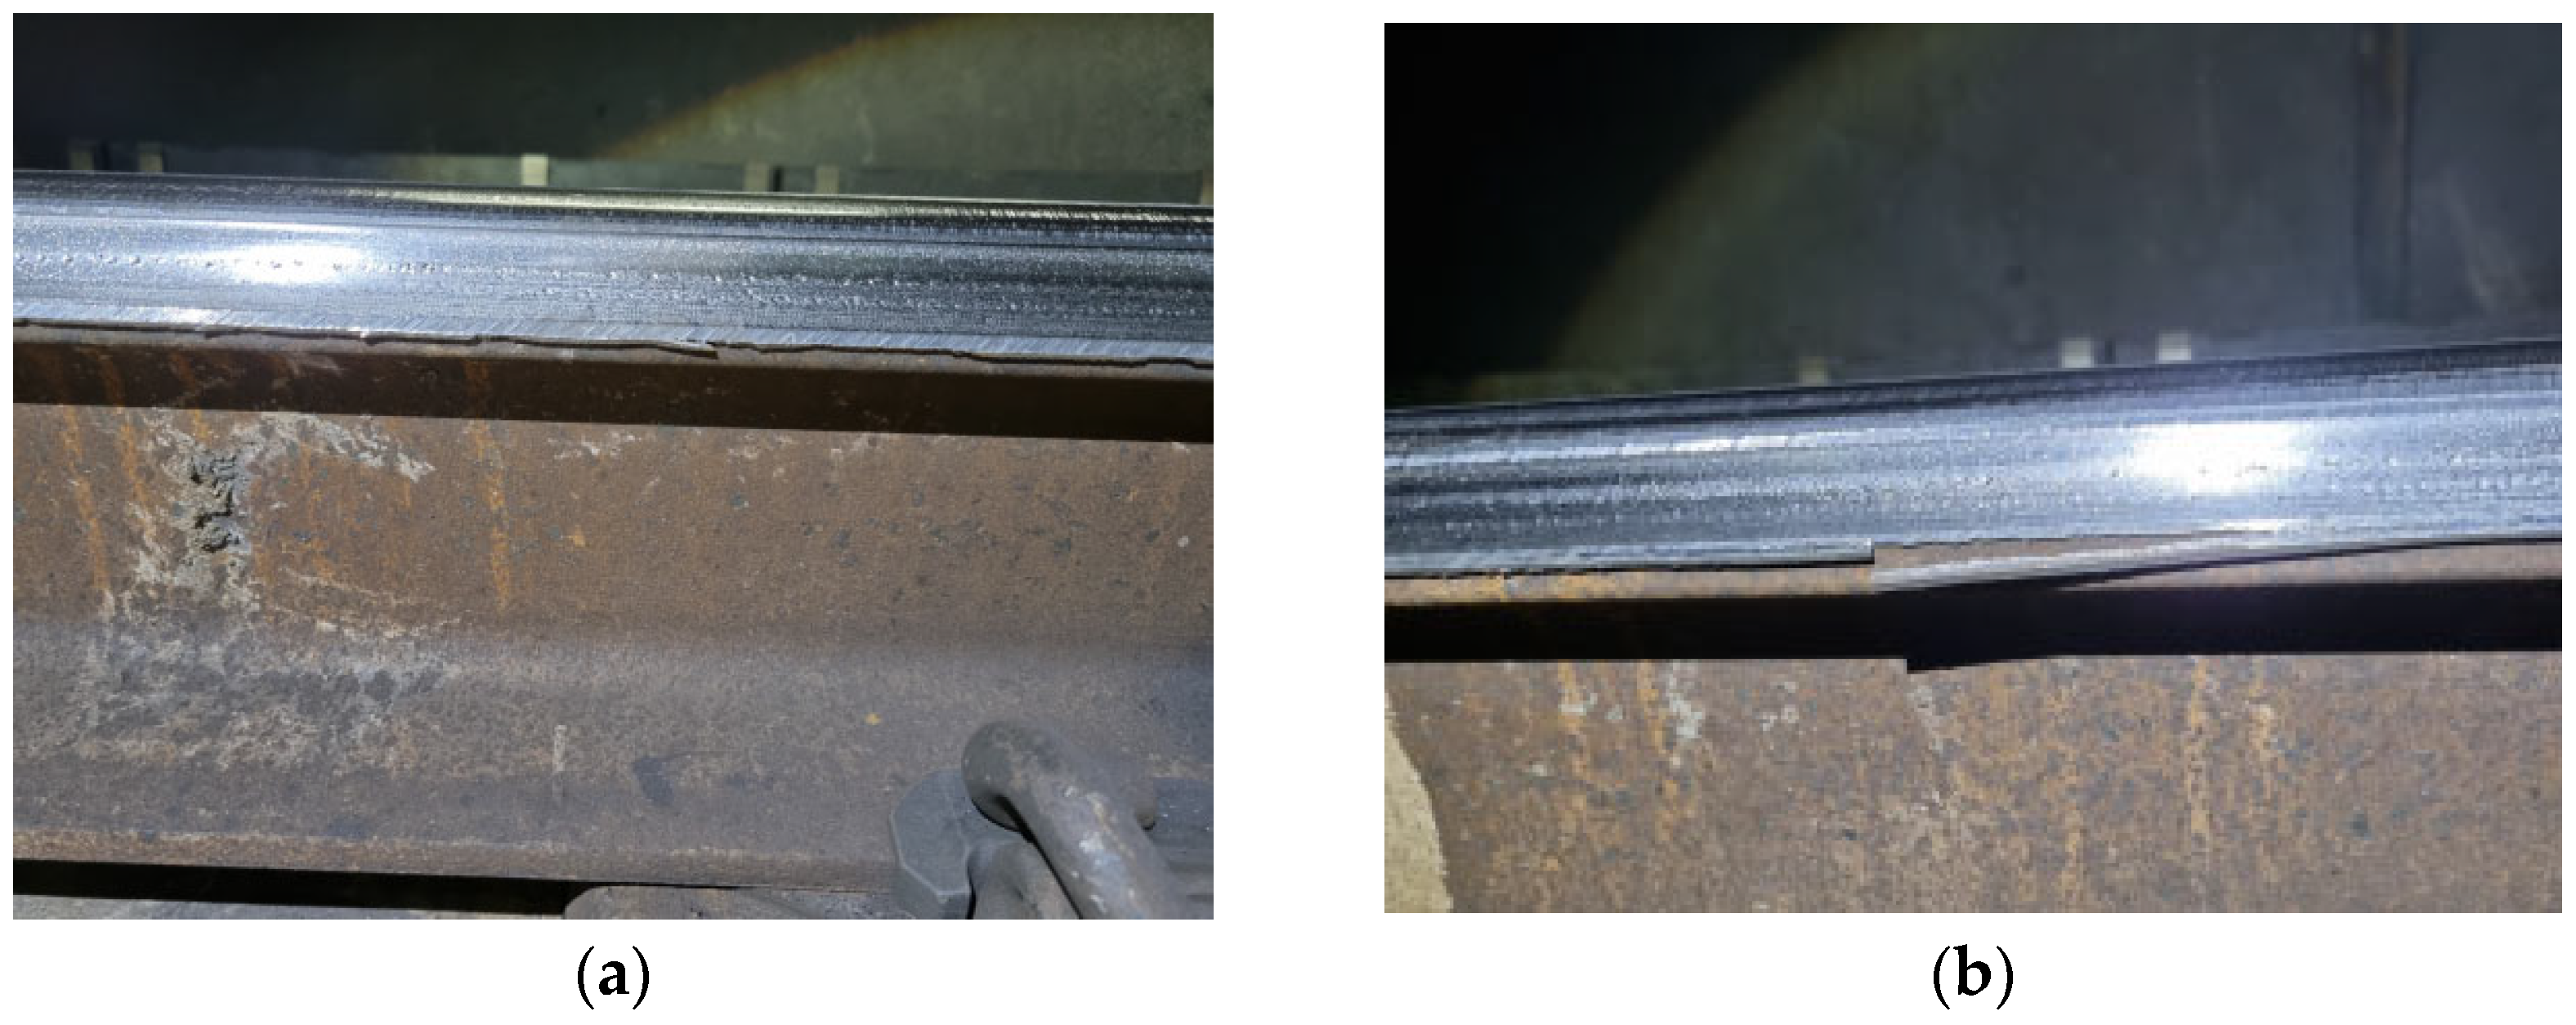
Plastic flow occurs at the rail head, with crack depths reaching ~15 mm. It is initiated on the field side of a low rail in curves under excessive loading conditions. Tongue lipping is a specific form of plastic deformation originating from surface defects. Under heavy axle loads, such cracks can separate a layer from the parent rail material, with the separated protrusions undergoing plastic deformation. As shown in Figure 8, tongue lipping indicates the presence of cracks that can be effectively removed through grinding.

2.3. Field Investigation Results

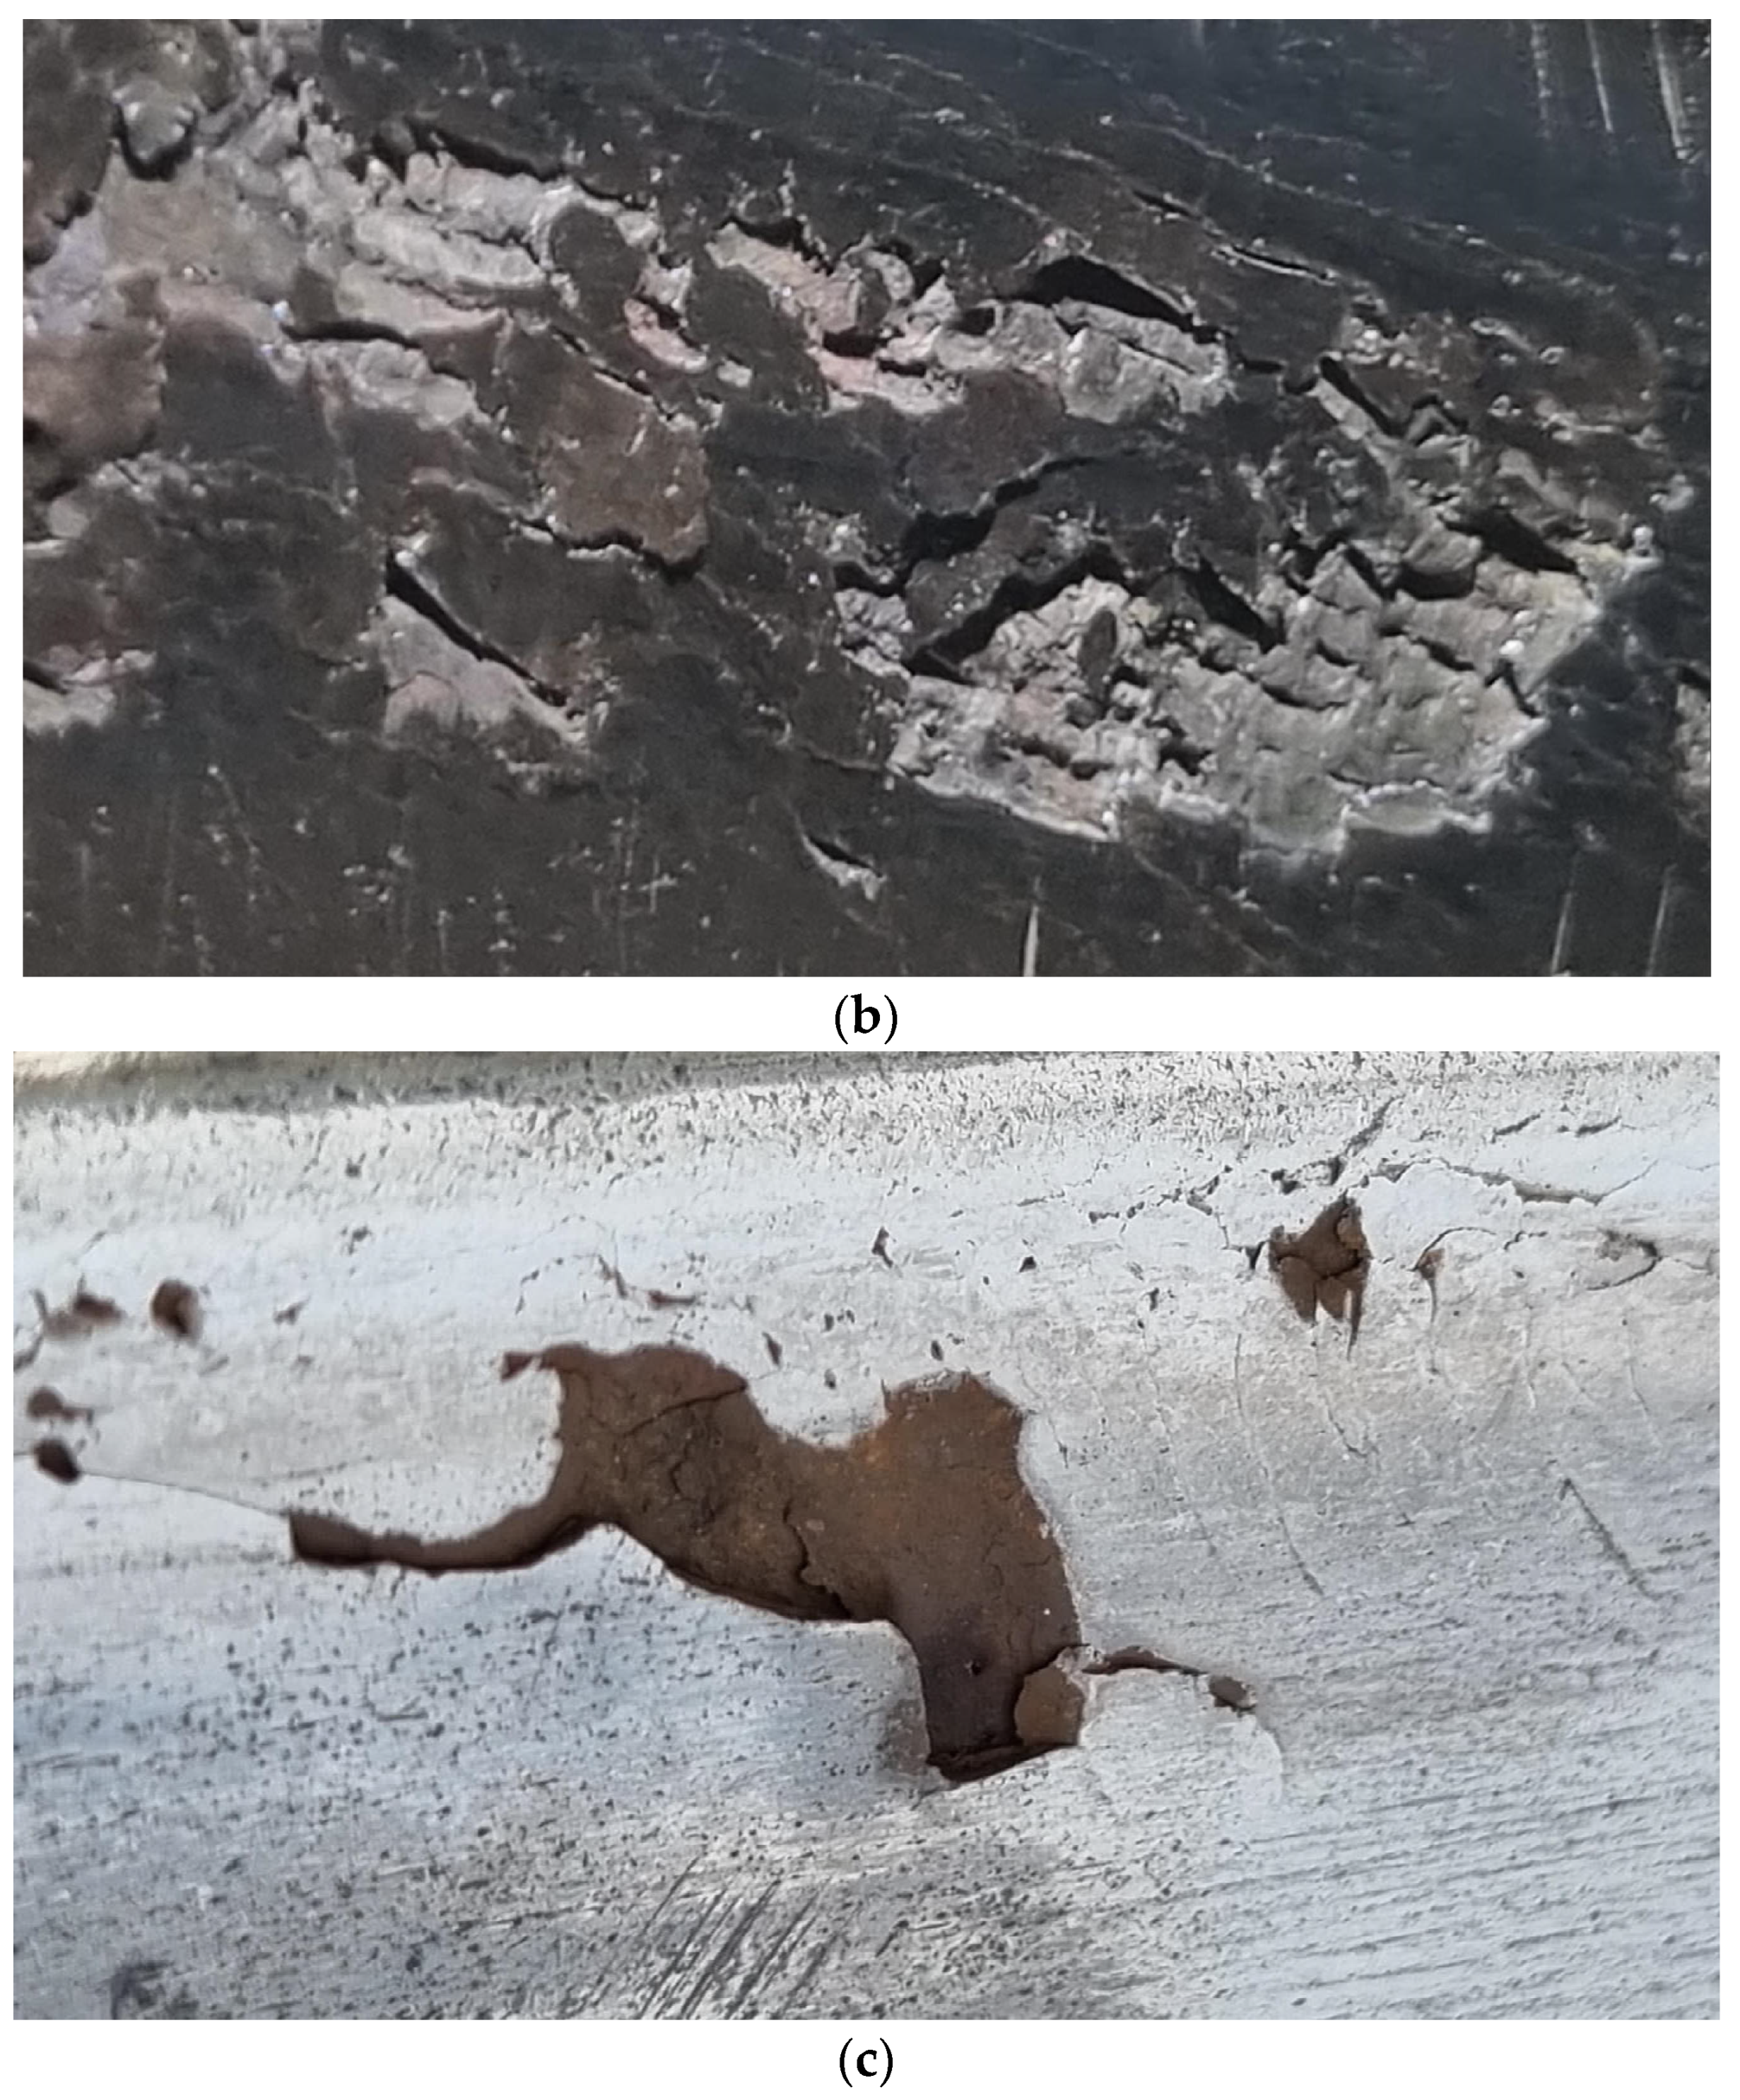
The conditions of rail surface damage identified during field inspections are illustrated in Figure 9. The observed damage patterns are attributed to RCF, with microcracks propagating in the direction of rail traffic. Such deterioration is caused under sustained loading from wheel impacts, train speed, and load distribution between the inner and outer wheels during wheel–rail interaction.
As shown in Figure 9a, head checks can be easily detected visually; however, it is extremely difficult to assess the depth or extent of damage. Head checks occur in track sections with relatively large curve radii (1500–2000 m) and are generated by longitudinal forces and slip between the wheel and outer rail during rolling contact. These defects appear at the gauge corner of the outer rail, forming thin linear features with lengths ranging from 2 to 7 mm at angles between 30° and 60°. As indicated in Figure 9b, spalling involves localized material loss from the rail head and results from repeated loading and high-contact stresses. As shown in Figure 9c, spalling is observed when surface-initiated cracks are connected to other cracks located at shallow depths within the rail head, causing small thin fragments of metal to detach from the rail surface. For the shell-type defects, the investigation confirmed that localized separation occurred because of the fatigue crack angle (crack propagation). The crack angle (degrees) is defined as the crack propagation rate and calculated using the SEM results [3,4,5,6,7,8,9,10,11,12].

3. Laboratory Investigation

3.1. Analysis of Internal Rail Damage Characteristics

Cracks originating from the rail surface propagate internally into regions that cannot be identified through visual inspection. Grinding should be performed before the crack reaches an unexpected stage of development because it is not possible to detect the subsurface crack angle visually. Rail fractures can be prevented by removing the damage before the unanticipated crack growth stage. When continuous surface cracks and subsurface-propagating cracks overlap and grow beyond a certain extent, adjacent cracks can cause distortion and refraction of ultrasonic waves during nondestructive testing, which makes it difficult to accurately determine the actual crack depth. In this study, SEM was employed to measure the internal crack depth, length, and orientation for analyzing the correlation between rail surface damage and subsurface cracking. Railway lines exhibit a wide range of rail damage types and severities. However, most previous studies focused on the effect of wheel–rail contact loads and stress variations caused by changes in the contact area on crack initiation and damage evolution. When inspectors visually examine a rail surface from a distance, detecting rail damage is challenging. Close-up inspections of damaged areas have shown that assessment results can vary based on the perspective of the inspector. The SEM testing of surface damage revealed that internal rail defects exhibited varying crack depths and lengths.
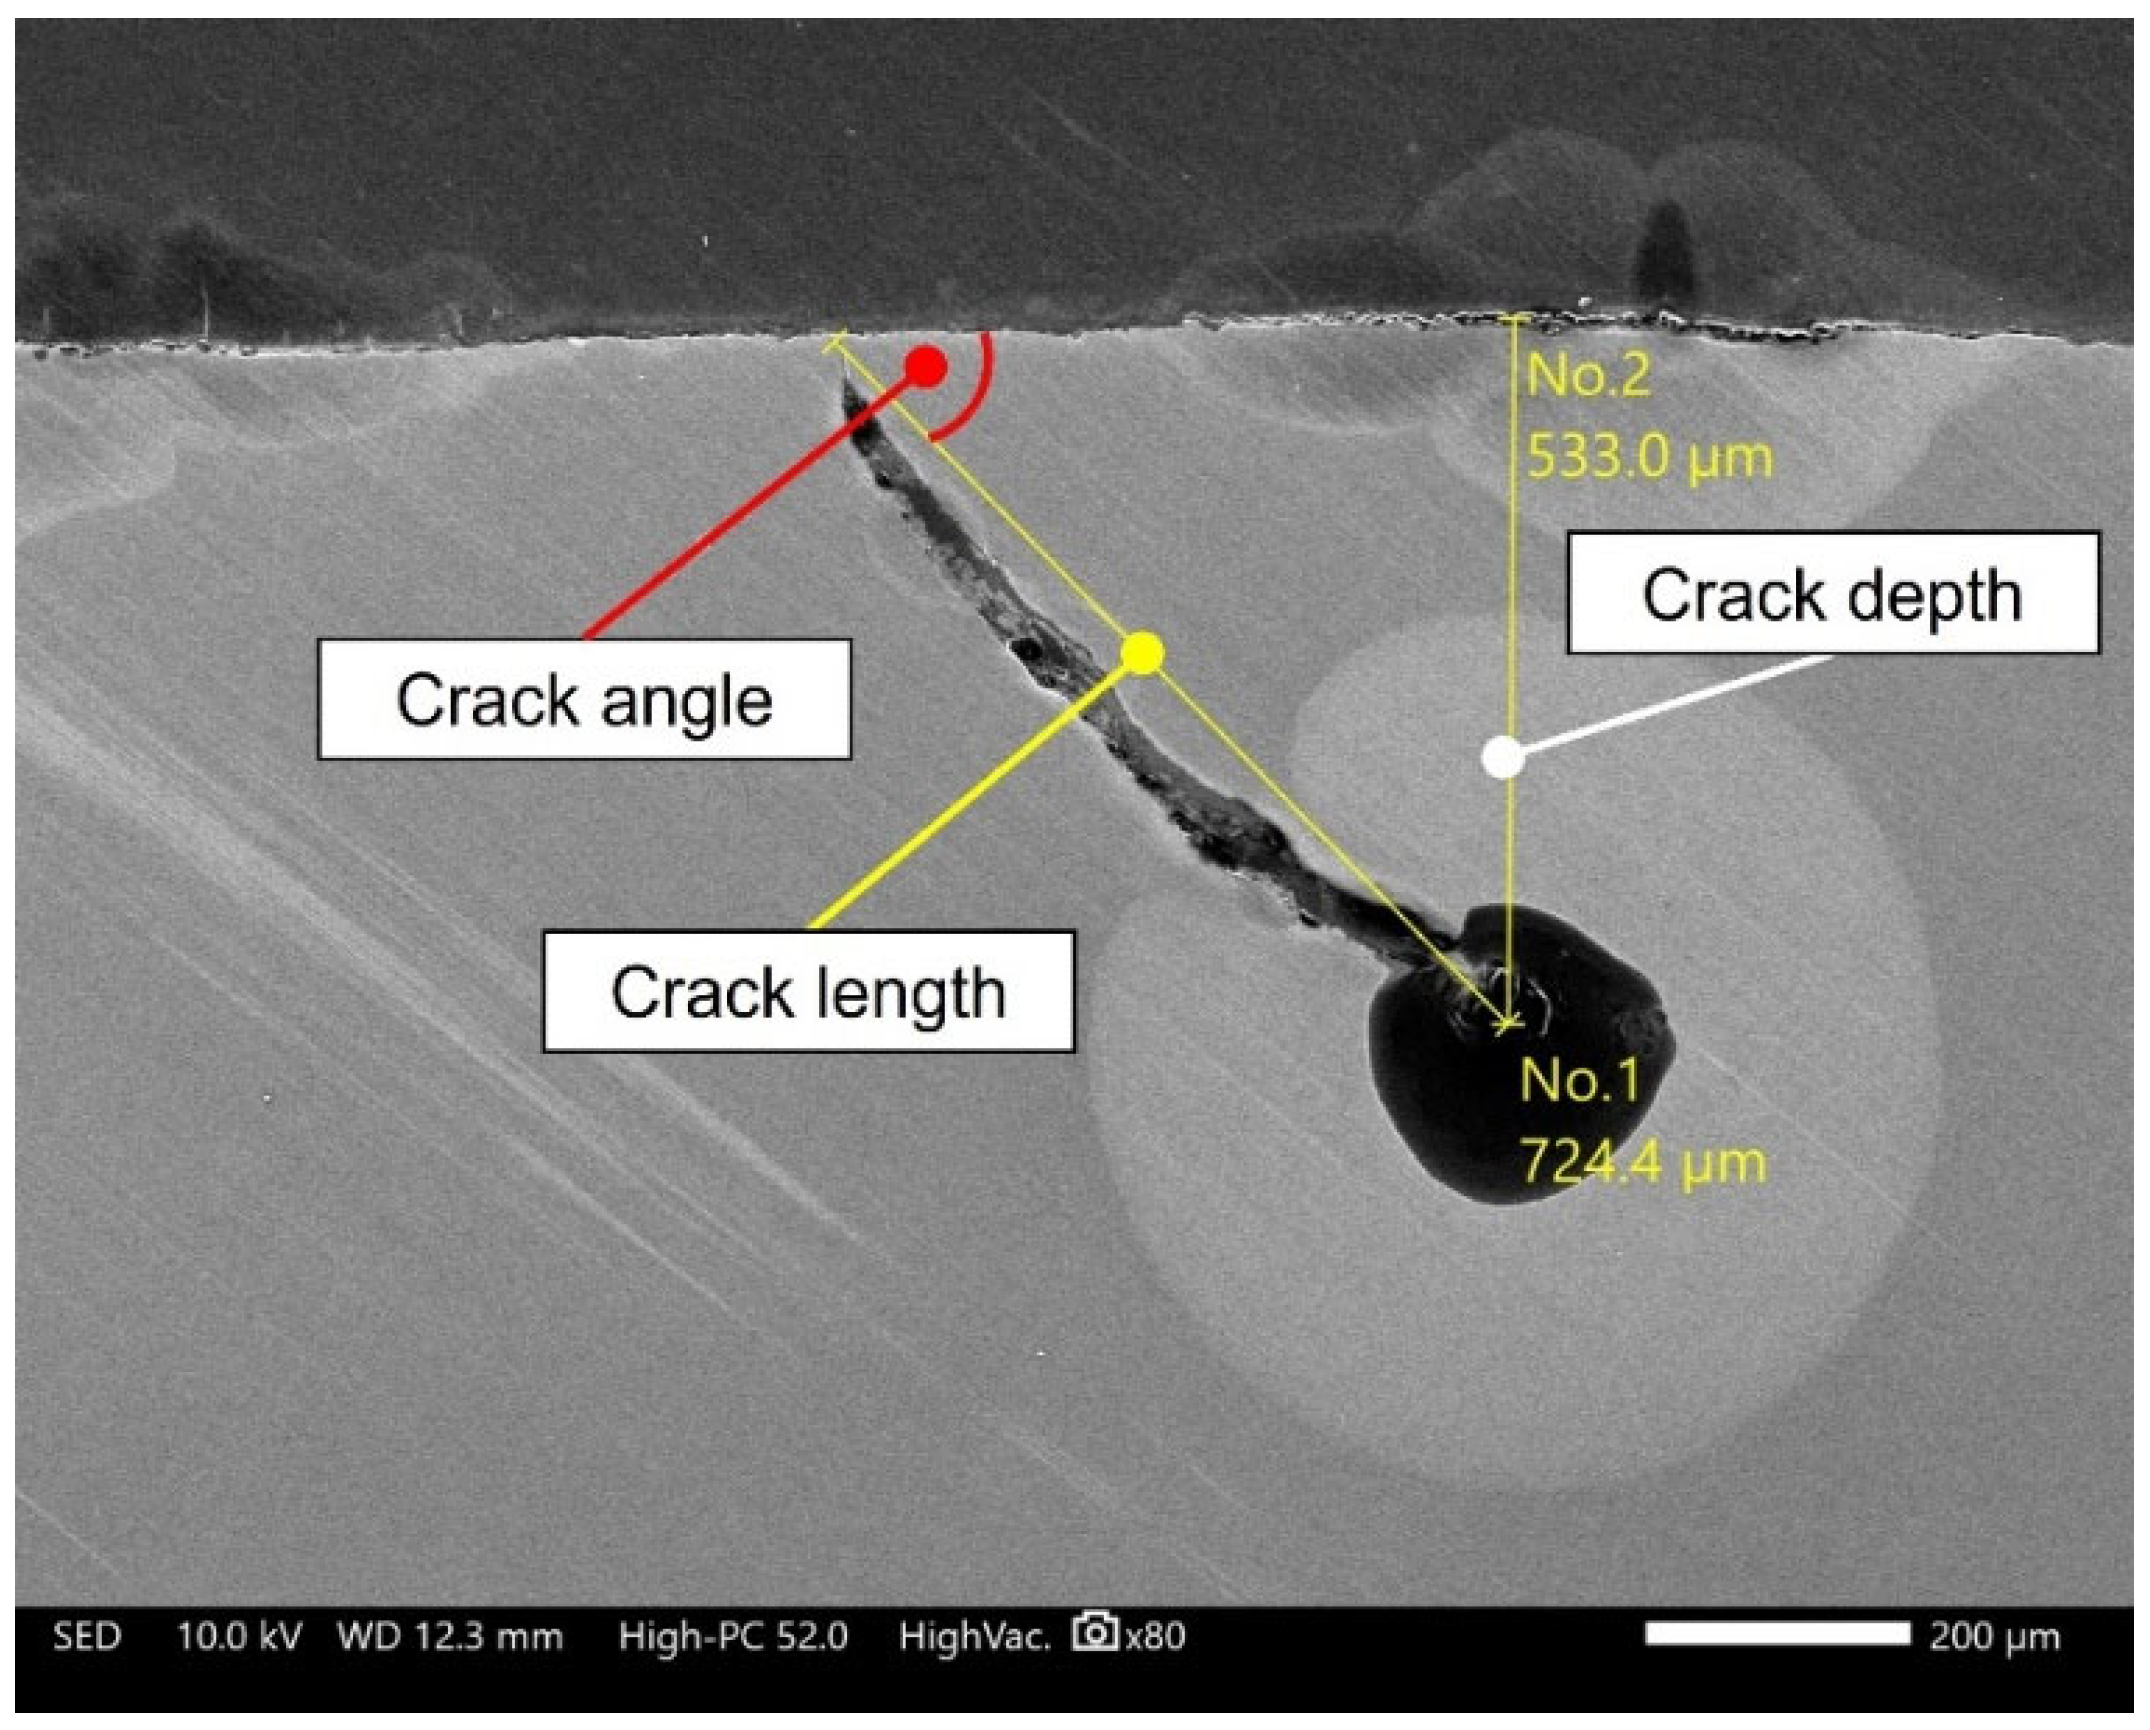
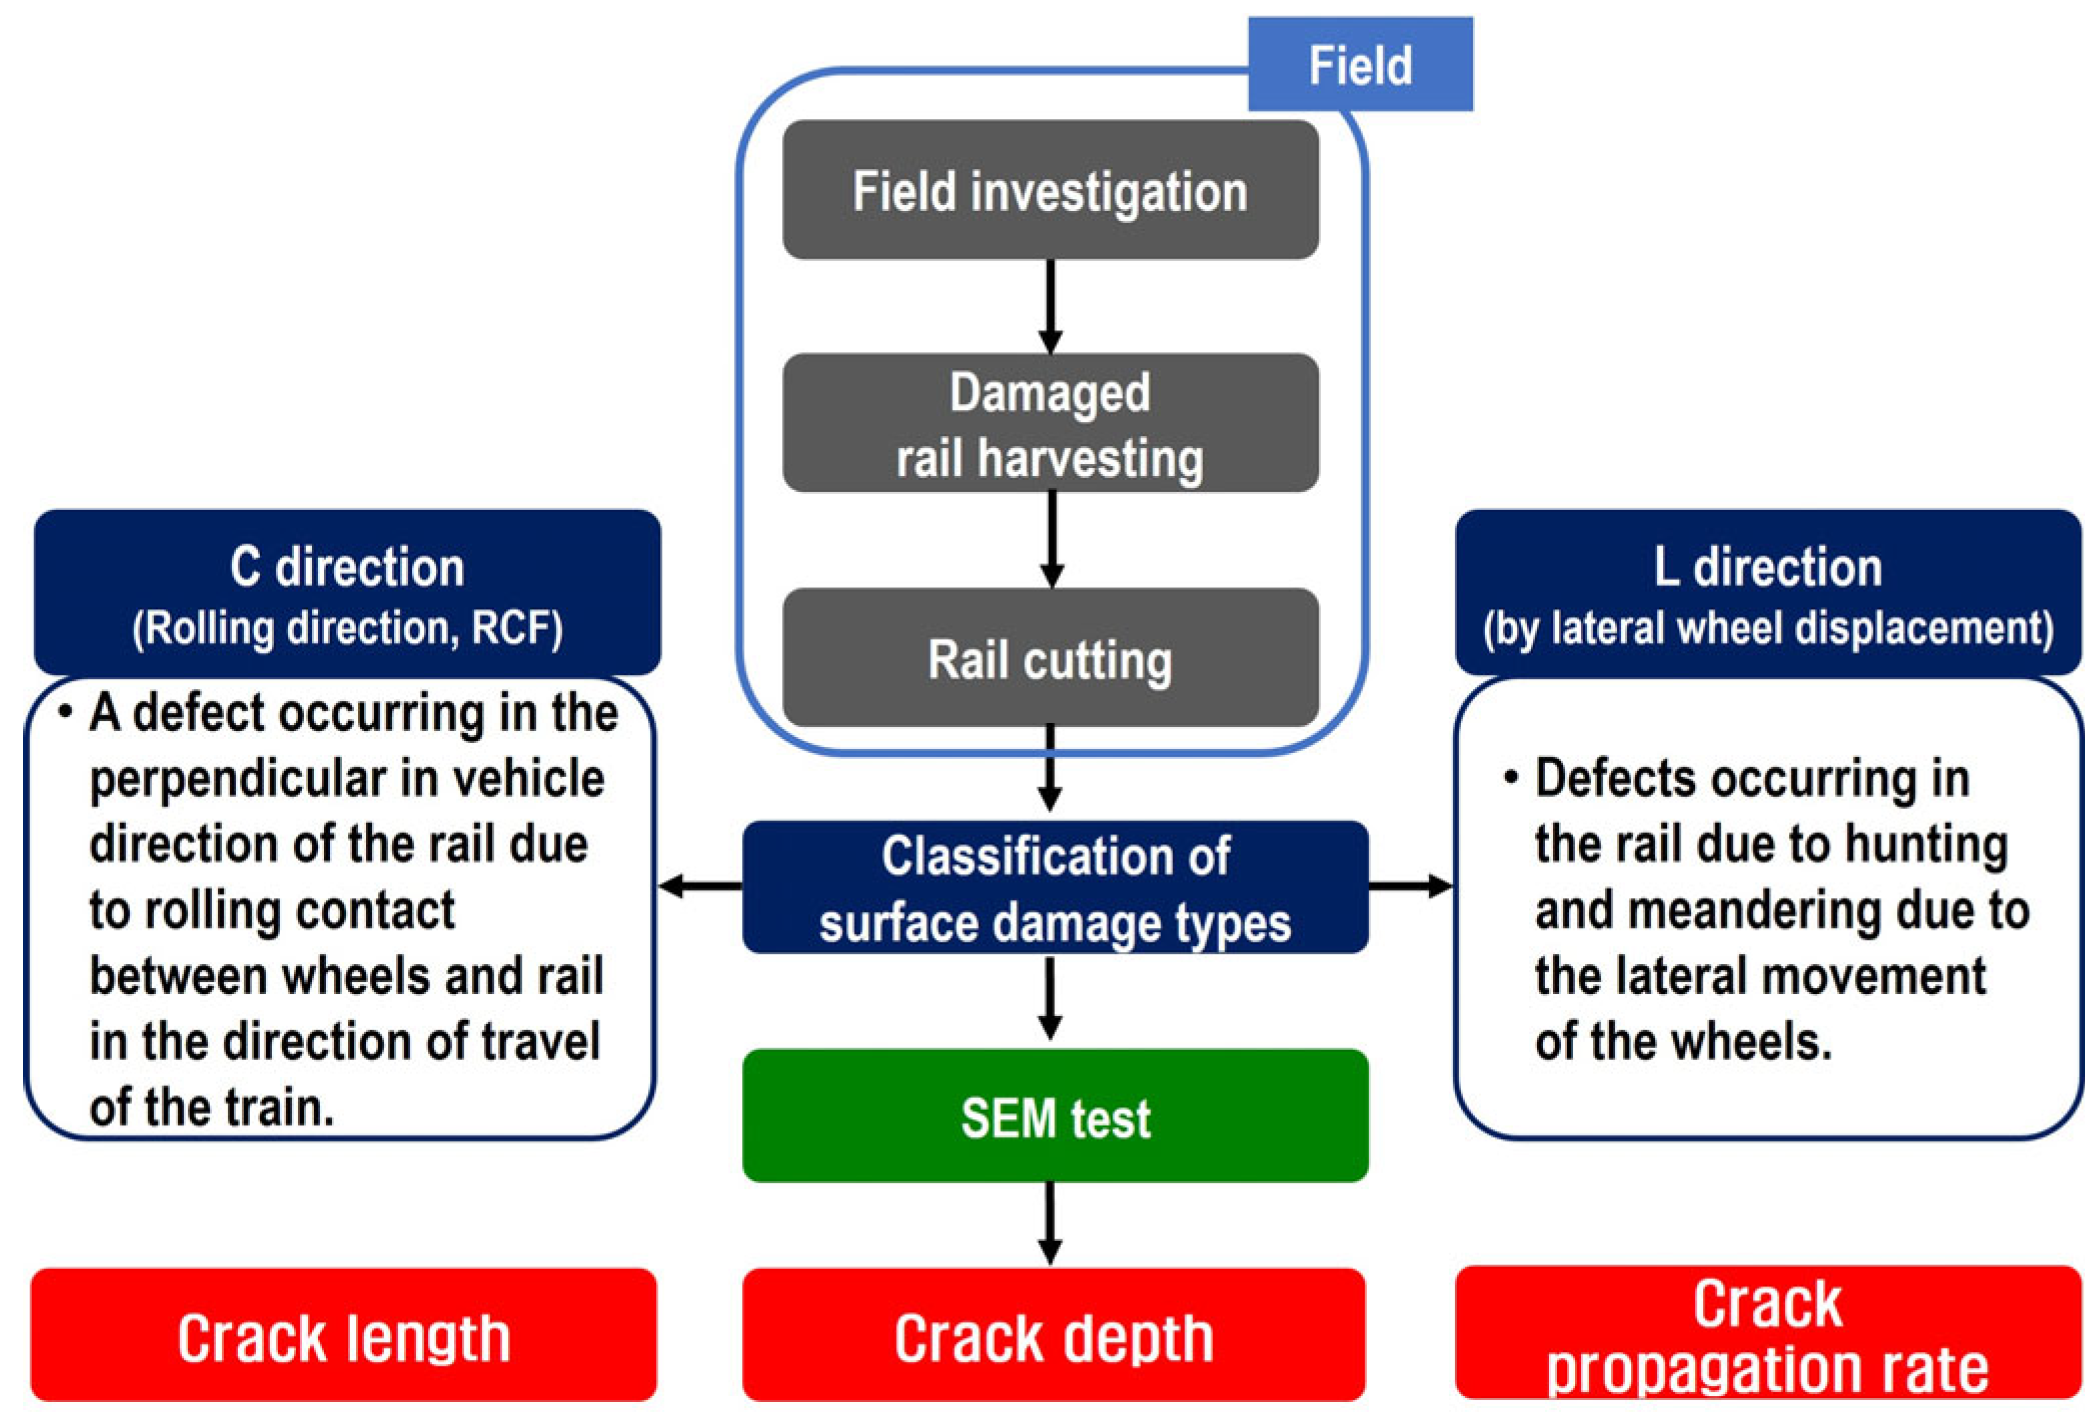
The SEM test procedure is shown in Figure 10. Damaged rail segments were collected during on-site inspections, detailed analyses were conducted to examine the propagation behavior of cracks extending from the rail surface into the interior, and damage types were classified. Surface defects on the rail originating from the wheel–rail contact were categorized into two types: defects in the C-direction (cross direction) occurring along the train running direction and defects in the L-direction (lateral direction) caused by lateral wheel movements. Subsequently, SEM was conducted on the specimens. The conical profile of the wheel tread is an important geometric factor in wheel–rail contact mechanics. The wheel rolling radius varies, and rolling contact patterns are generated when the wheel and rail surfaces come into contact. Field investigations confirmed that crack patterns vary based on the wheel–rail contact conditions. The characteristics of differently oriented crack patterns were examined using SEM. In the field measurements, damaged rails identified on an operating urban railway line (three segments, each 20 m in length) were removed and cut at 30 cm intervals, yielding a total of 100 specimens. For the SEM examination, specimens were prepared based on the type of surface damage, followed by mounting and polishing to evaluate the relationship between surface defects and internal cracking. The crack depth, length, and orientation were measured, and the crack angle was defined as the directional growth rate of the crack. For specimen preparation, mechanical polishing was performed using an epoxy resin and sandpaper (100 to #2000). Subsequently, the polishing was completed with a polishing cloth and 0.02 μm silica abrasive. The crack length, depth, and angle were measured using a scanning electron microscope (JEOL JSM-IT500 with OXFORD ULTIM MAX). Figure 11 shows the SEM-based rail microstructural analysis and an overview of the testing equipment.
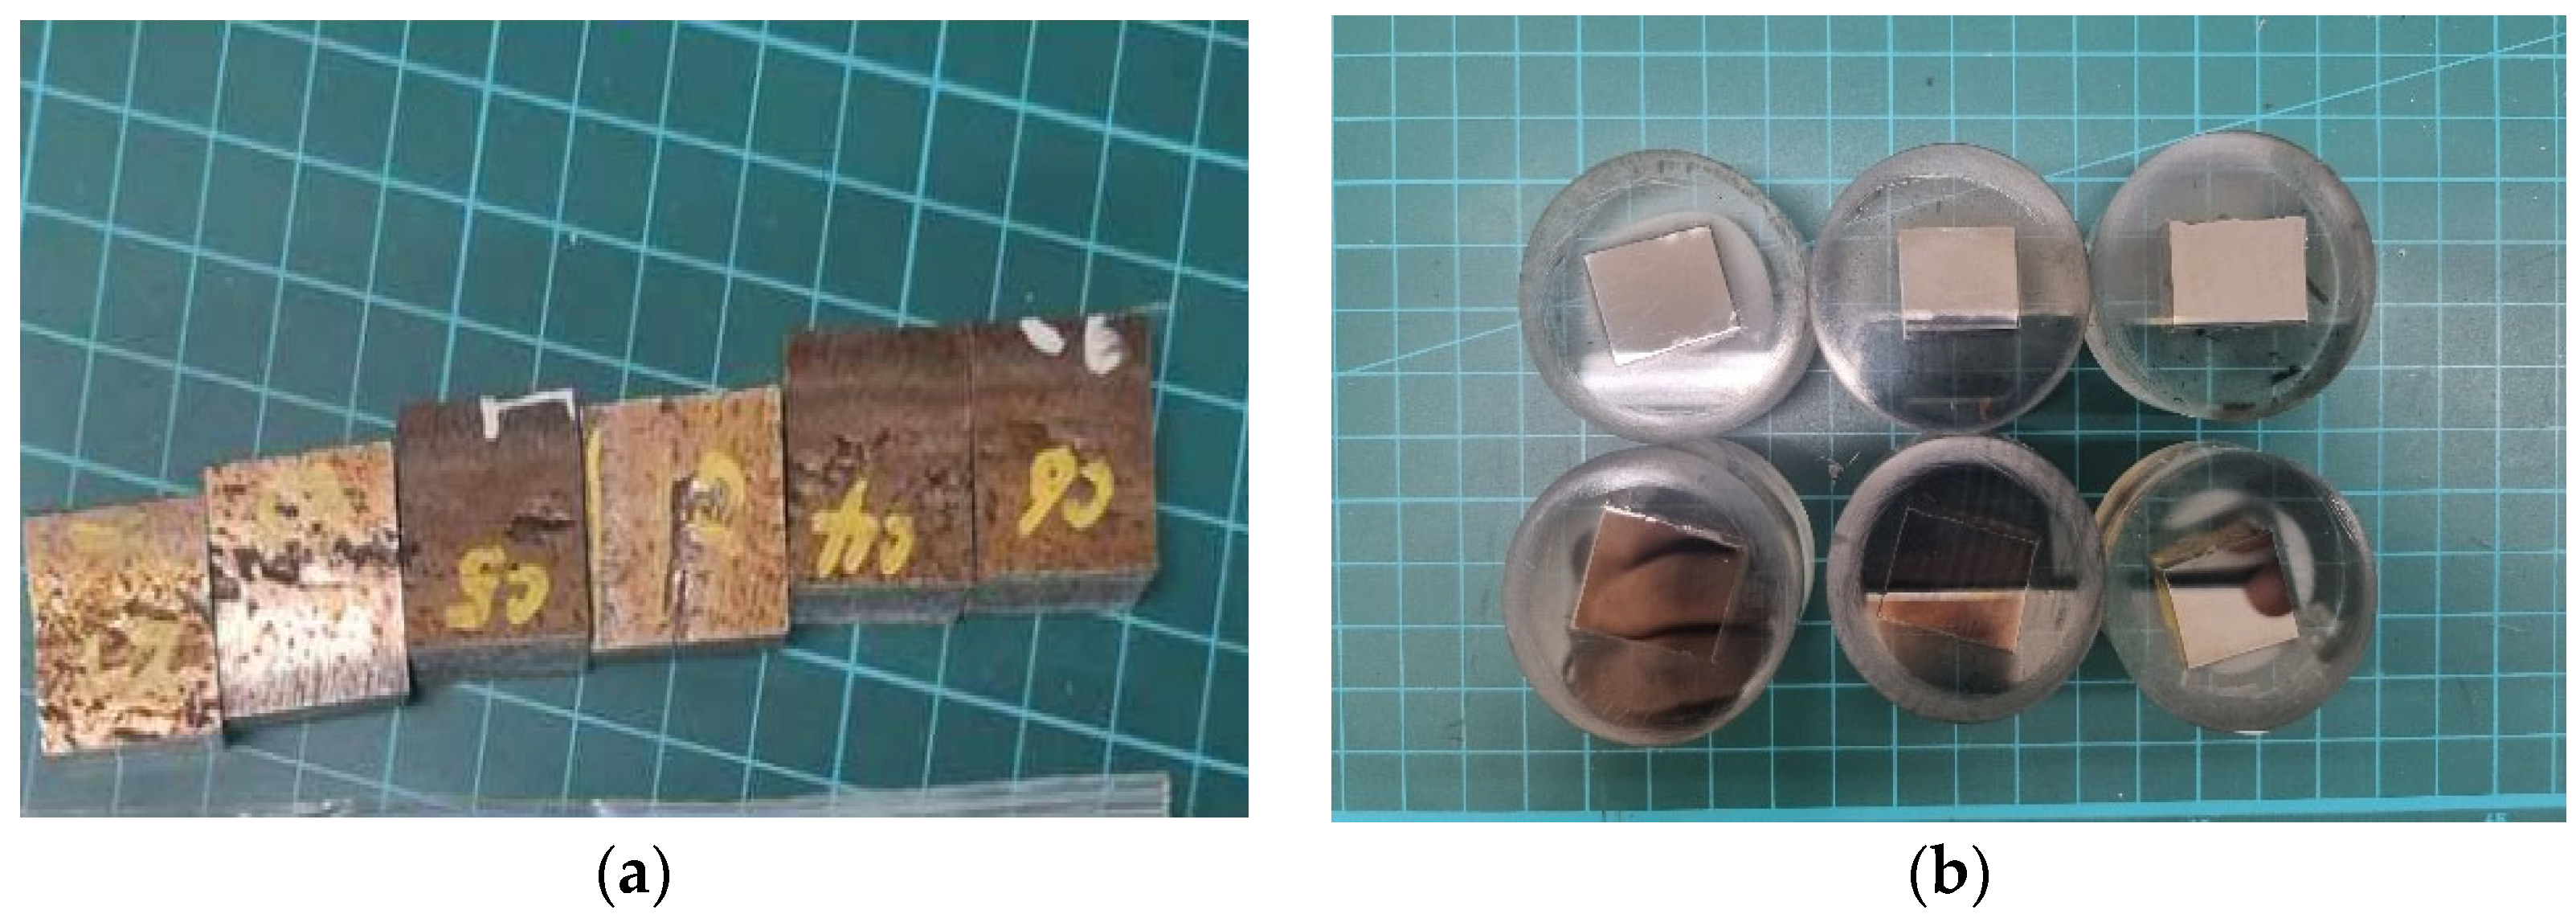
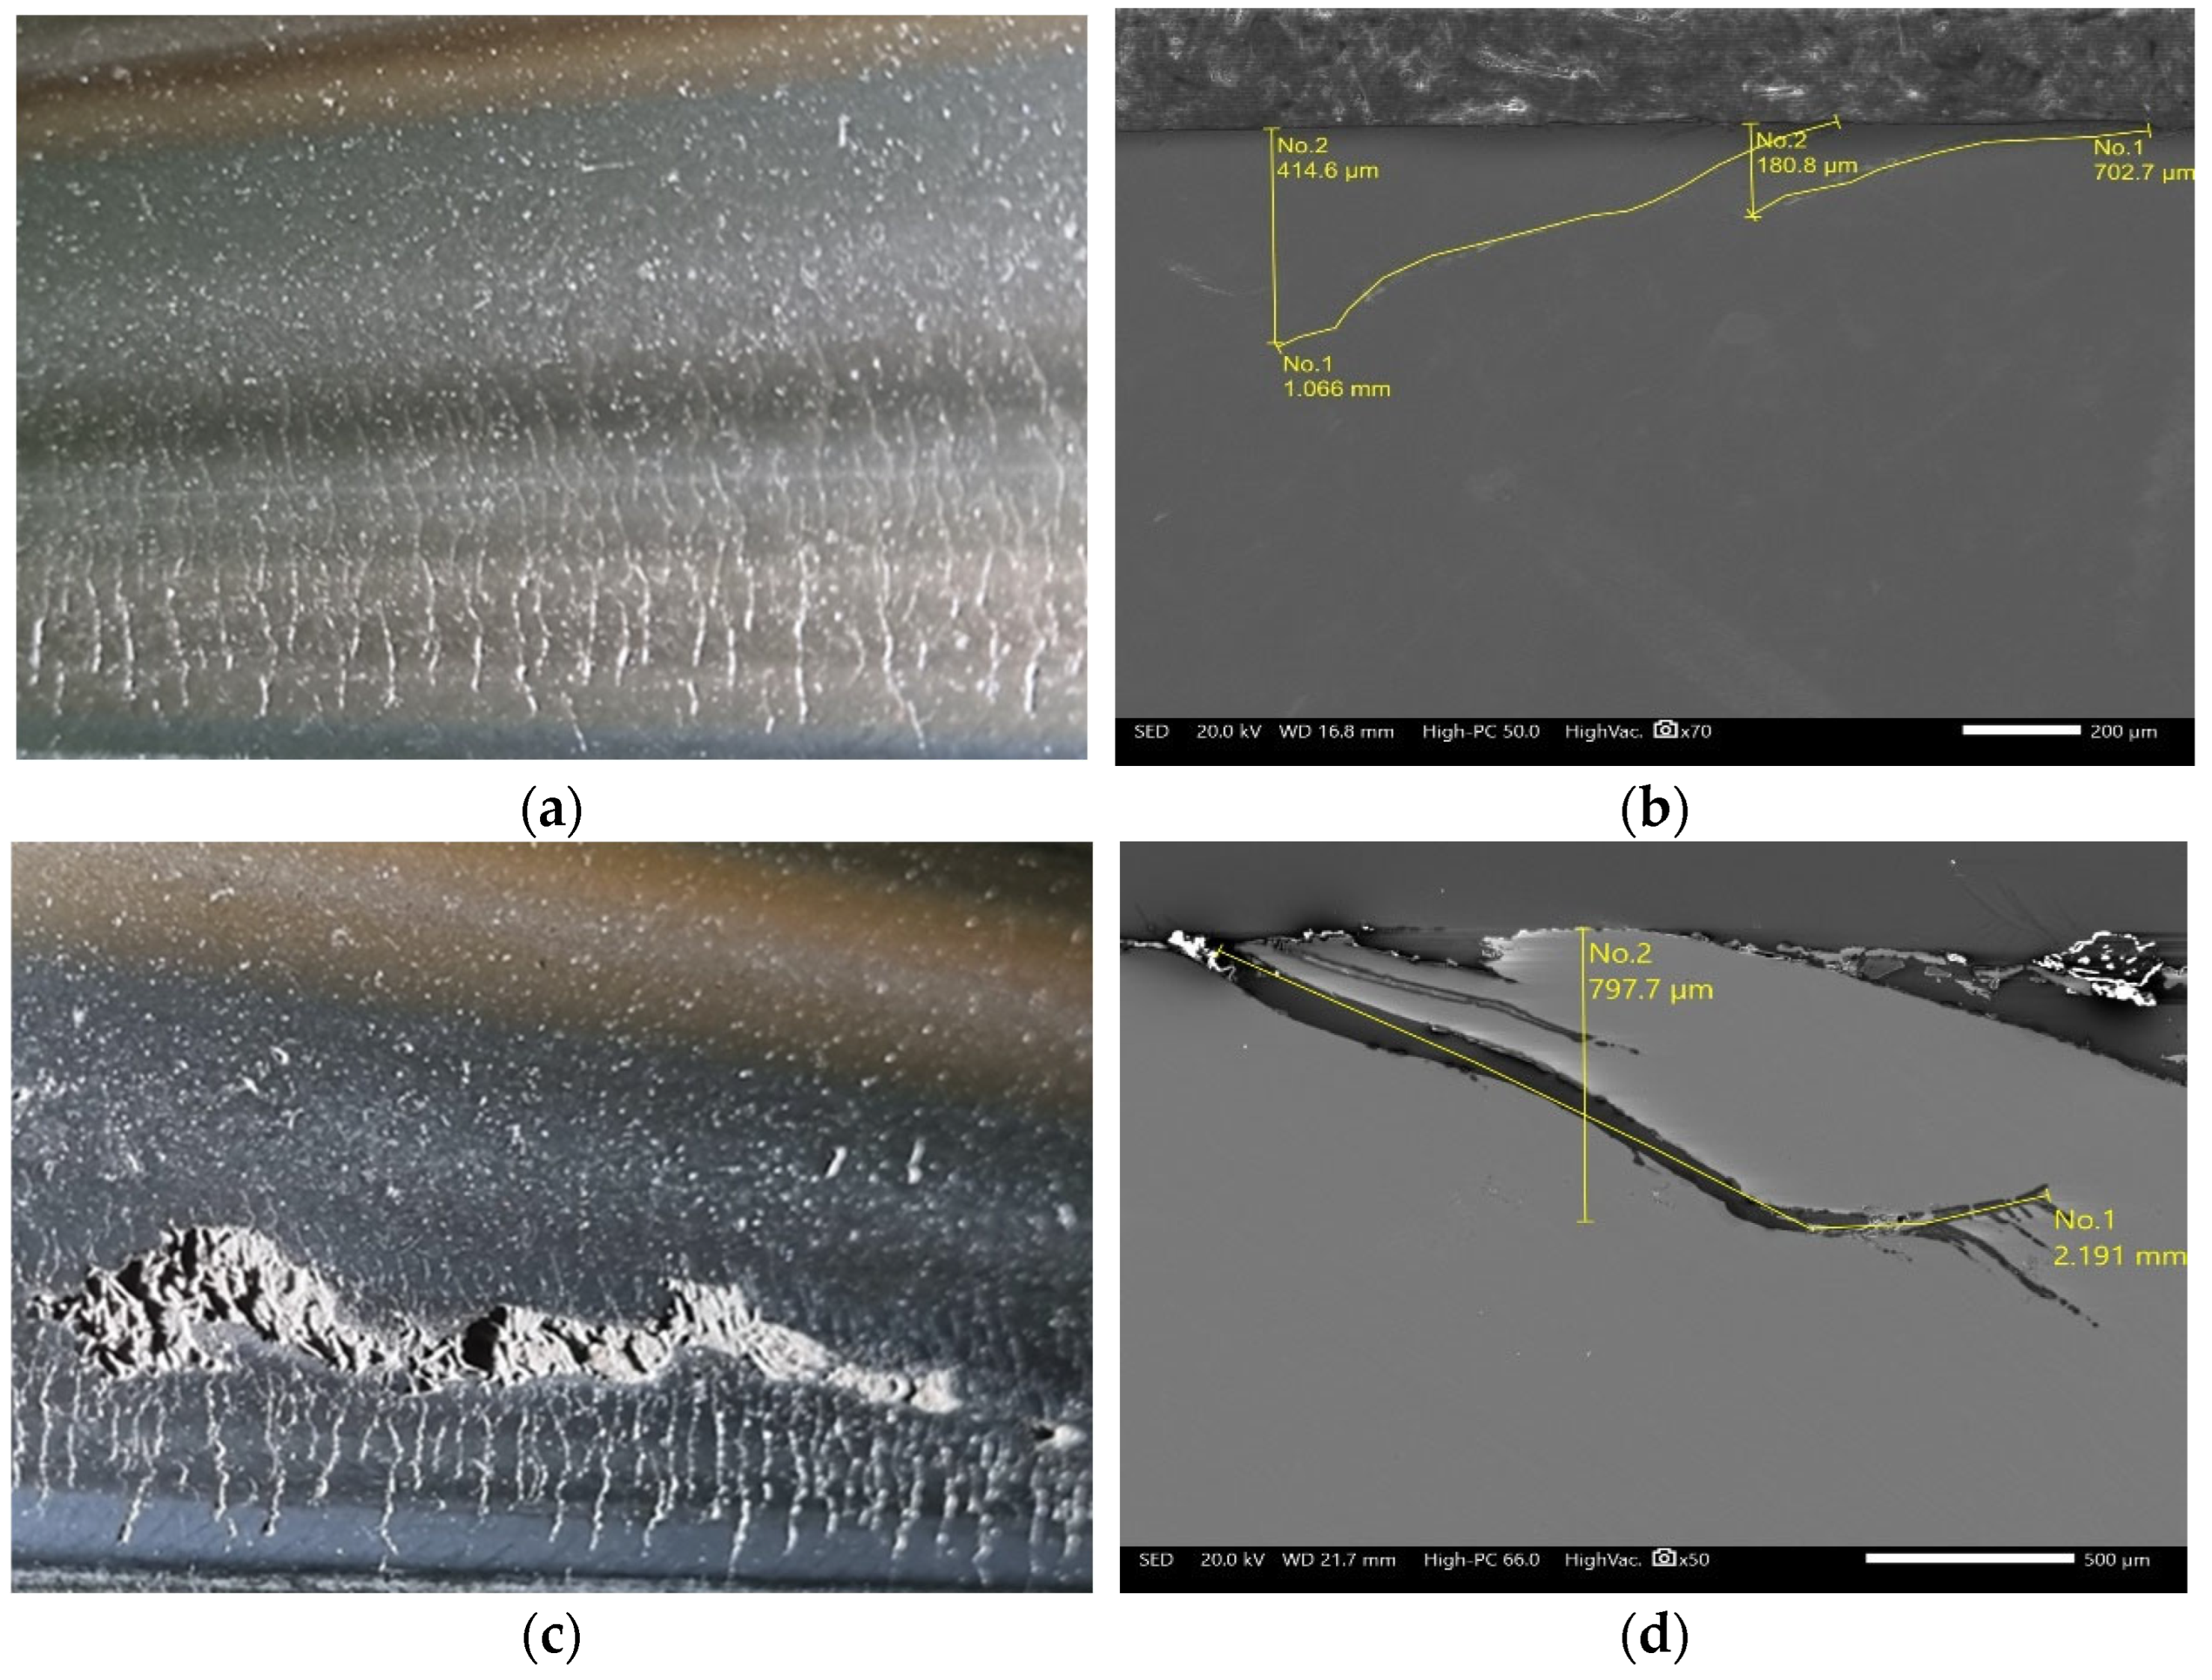
The accurate measurement of internal rail cracks using nondestructive testing techniques remains challenging. In this study, surface damage severity was quantified, and its correlation with internal defects was investigated through specimen processing, as illustrated in Figure 11a,b [5,6]. The damaged rails were mechanically cut around the crack region into specimens measuring 20 mm × 20 mm or less. The specimens were mounted using the hot mounting method on a conductive resin to protect the edges, fill the pores, and standardize the specimen geometry [23,24,25]. As shown in Figure 12, the SEM analysis was performed to measure the crack depth, length, and angle. Approximately 2500 internal rail defects are examined, and the representative damage images are shown in Figure 13.
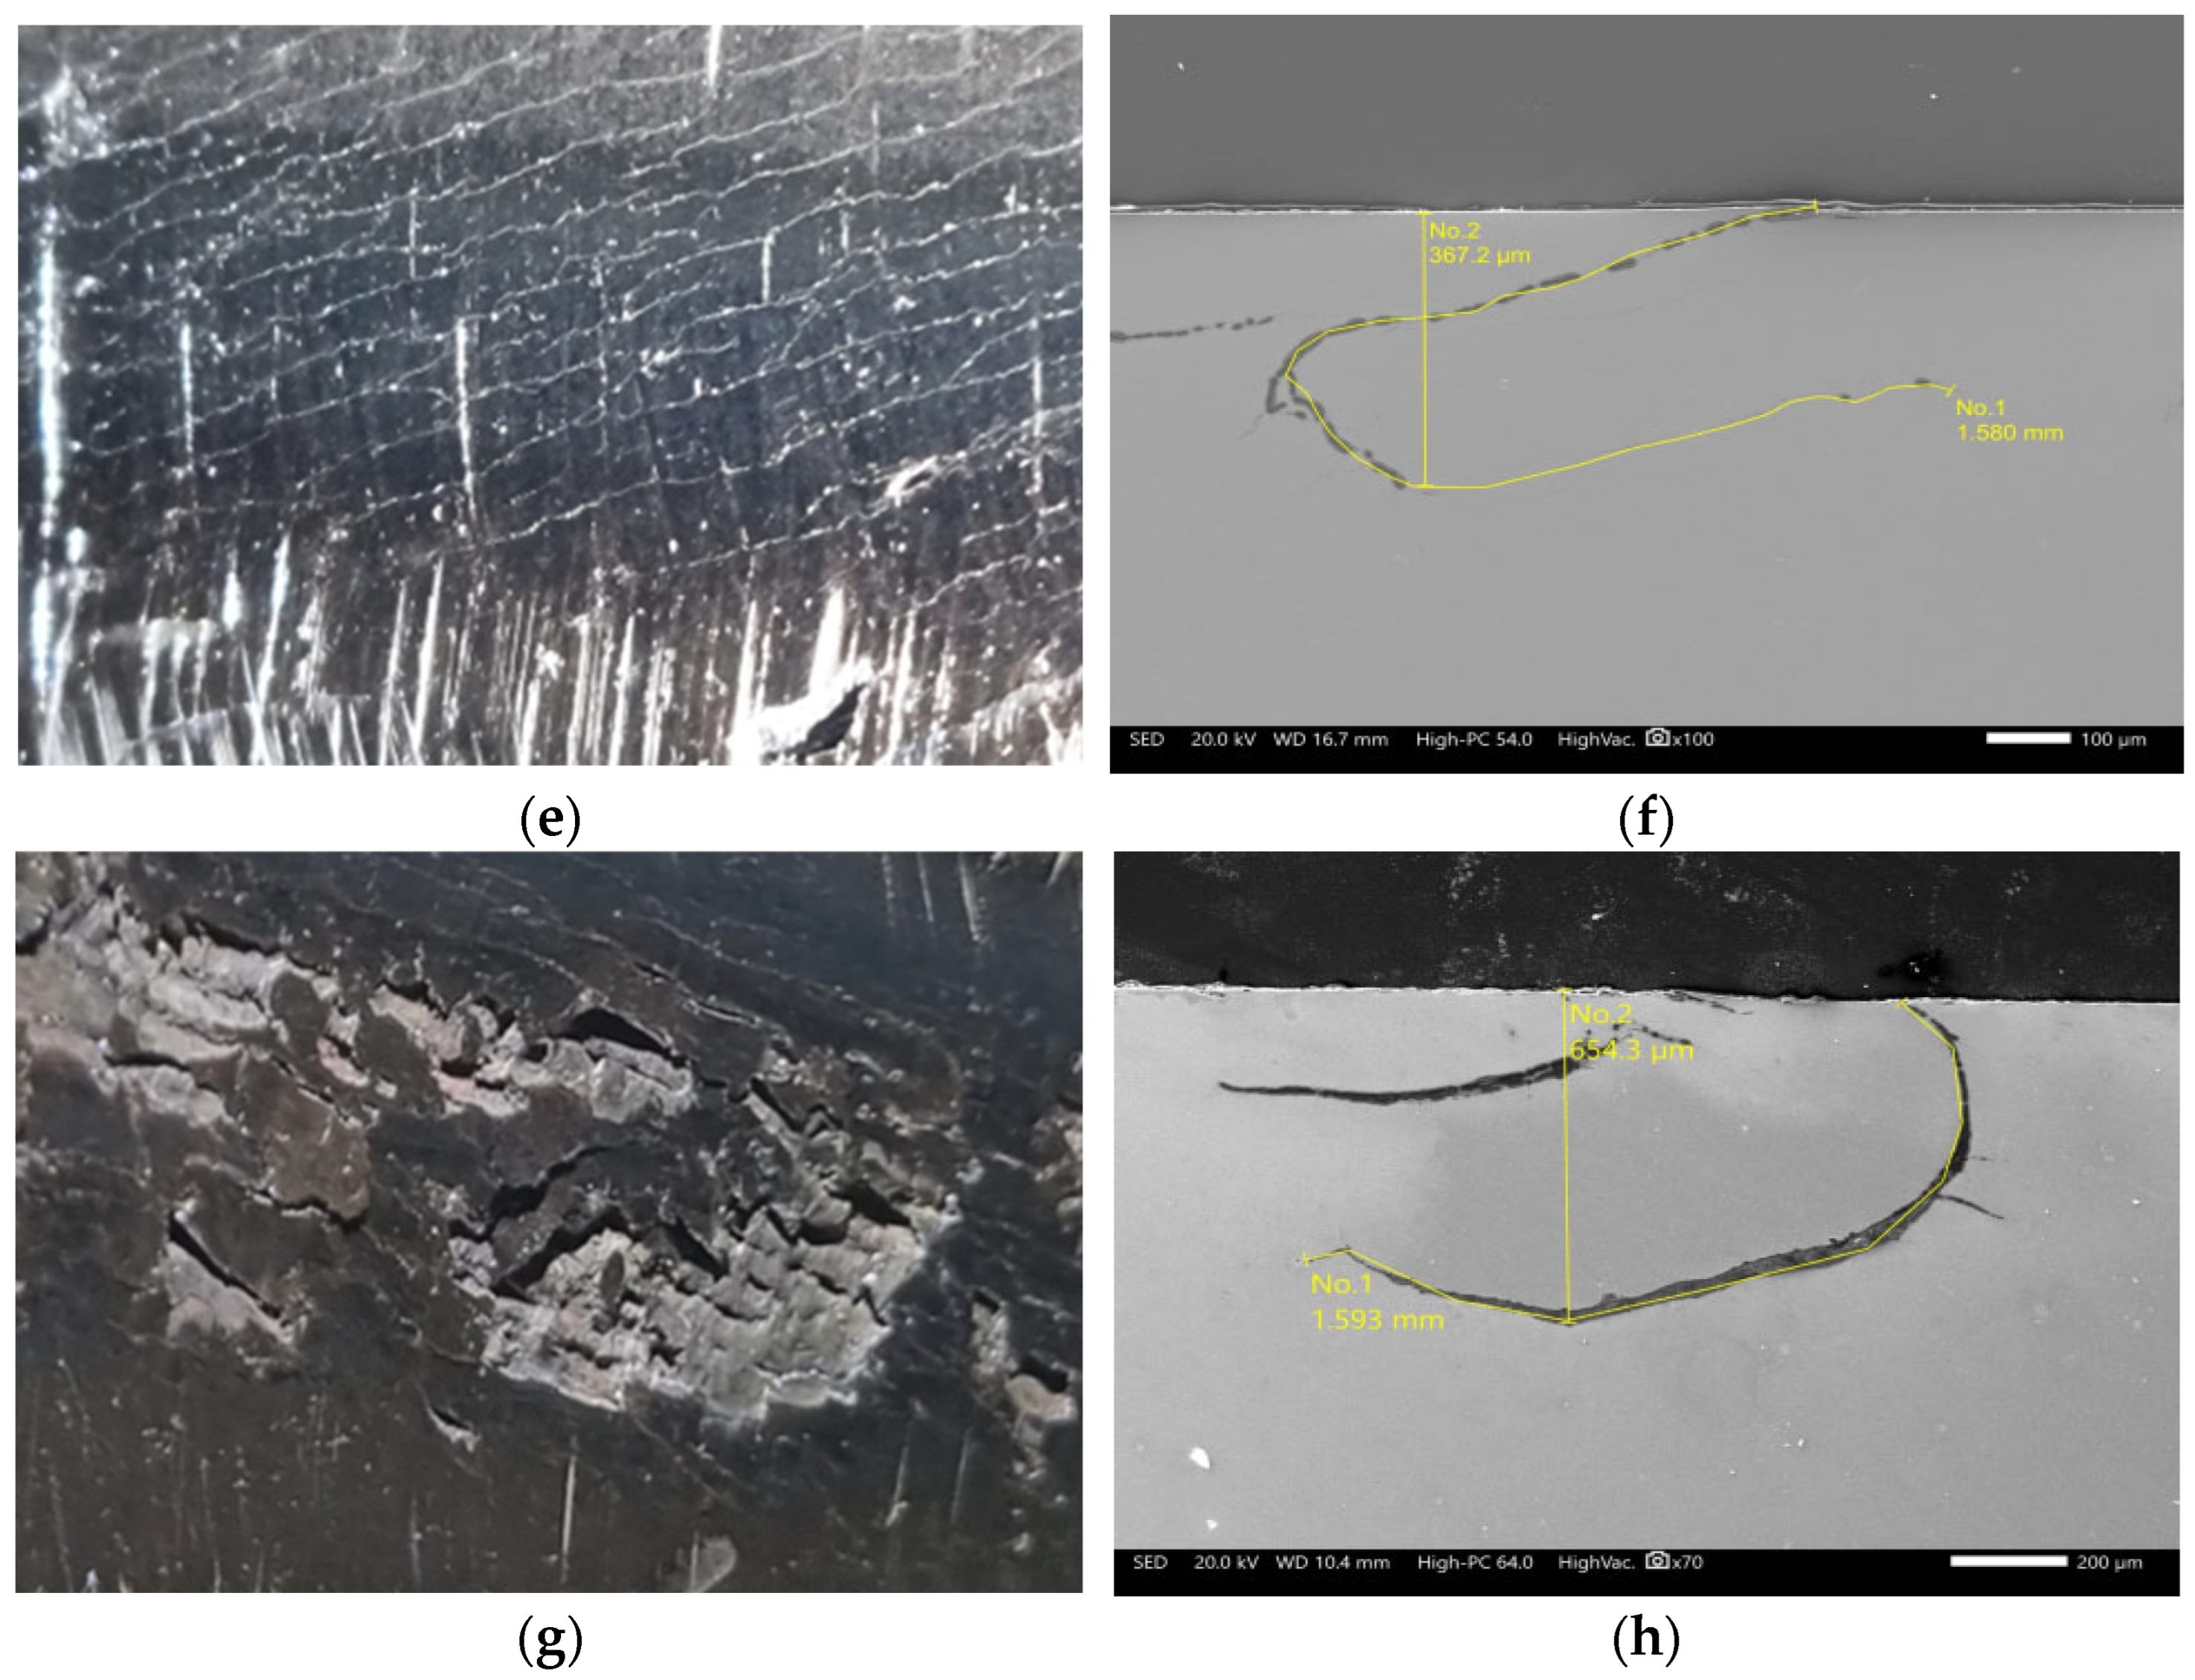
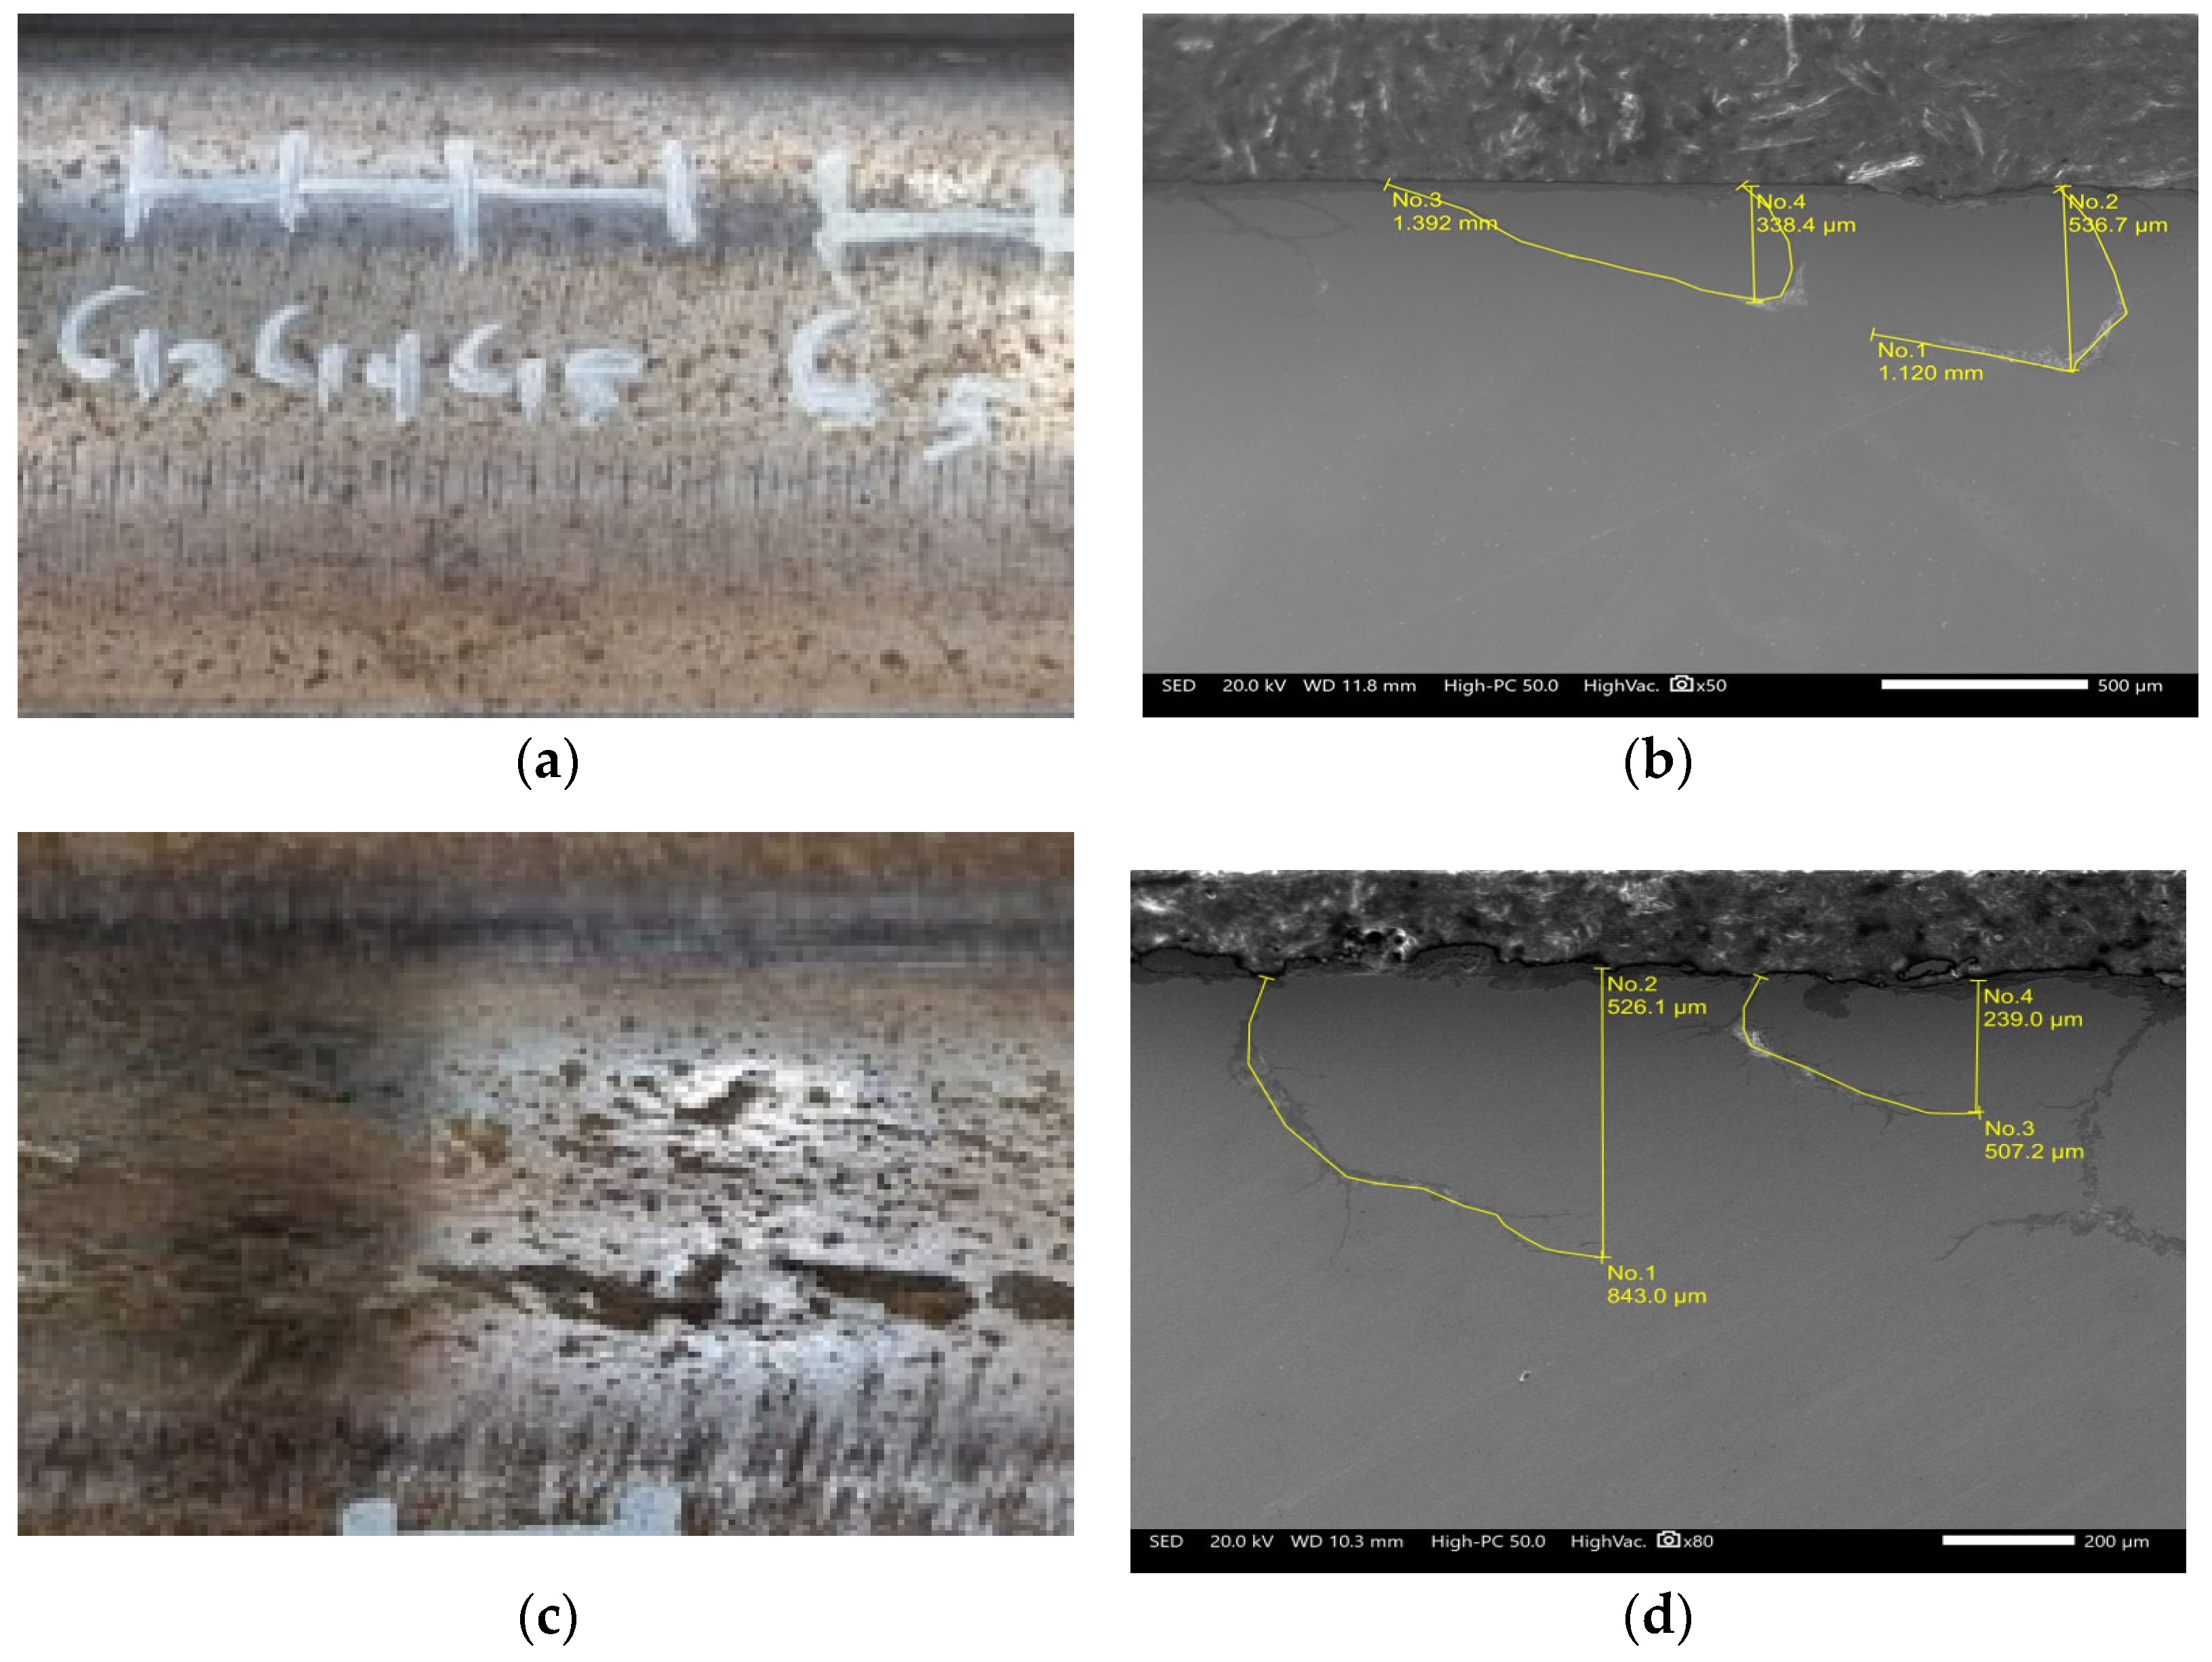
The results are shown as an example of 2500 data sets matching rail surface damage and rail internal damage, with sample numbers and test results. Figure 13a,b shows the rail-surface damage and internal crack characteristics of the Case 1 sample (L = 0.7027 mm; D = 0.1808 mm; and θ = 6.9°). Figure 13c,d shows the rail-surface damage and internal crack characteristics of the Case 500 sample (L = 2.191 mm; D = 0.7977 mm; and θ = 28.6°). Figure 13e,f shows the rail-surface damage and internal crack characteristics of the Case 1500 sample (L = 1.580 mm; D = 0.3672 mm; and θ = 5°). Figure 13g,h shows the rail-surface damage and internal crack characteristics of the Case 2520 sample (L = 1.593 mm; D = 0.6543 mm; and θ = 43°).

3.2. SEM Test Results

The rail specimens described in Section 3 were used in this study. Surface defect images were collected at multiple locations during field inspections, resulting in ~2500 surface images. Further, aged rails were processed to obtain 2500 internal defect images via SEM testing [25]. These data were combined to construct a dataset of 5000 samples, as illustrated in Figure 14. A deep learning model was applied to classify rail surface defects.
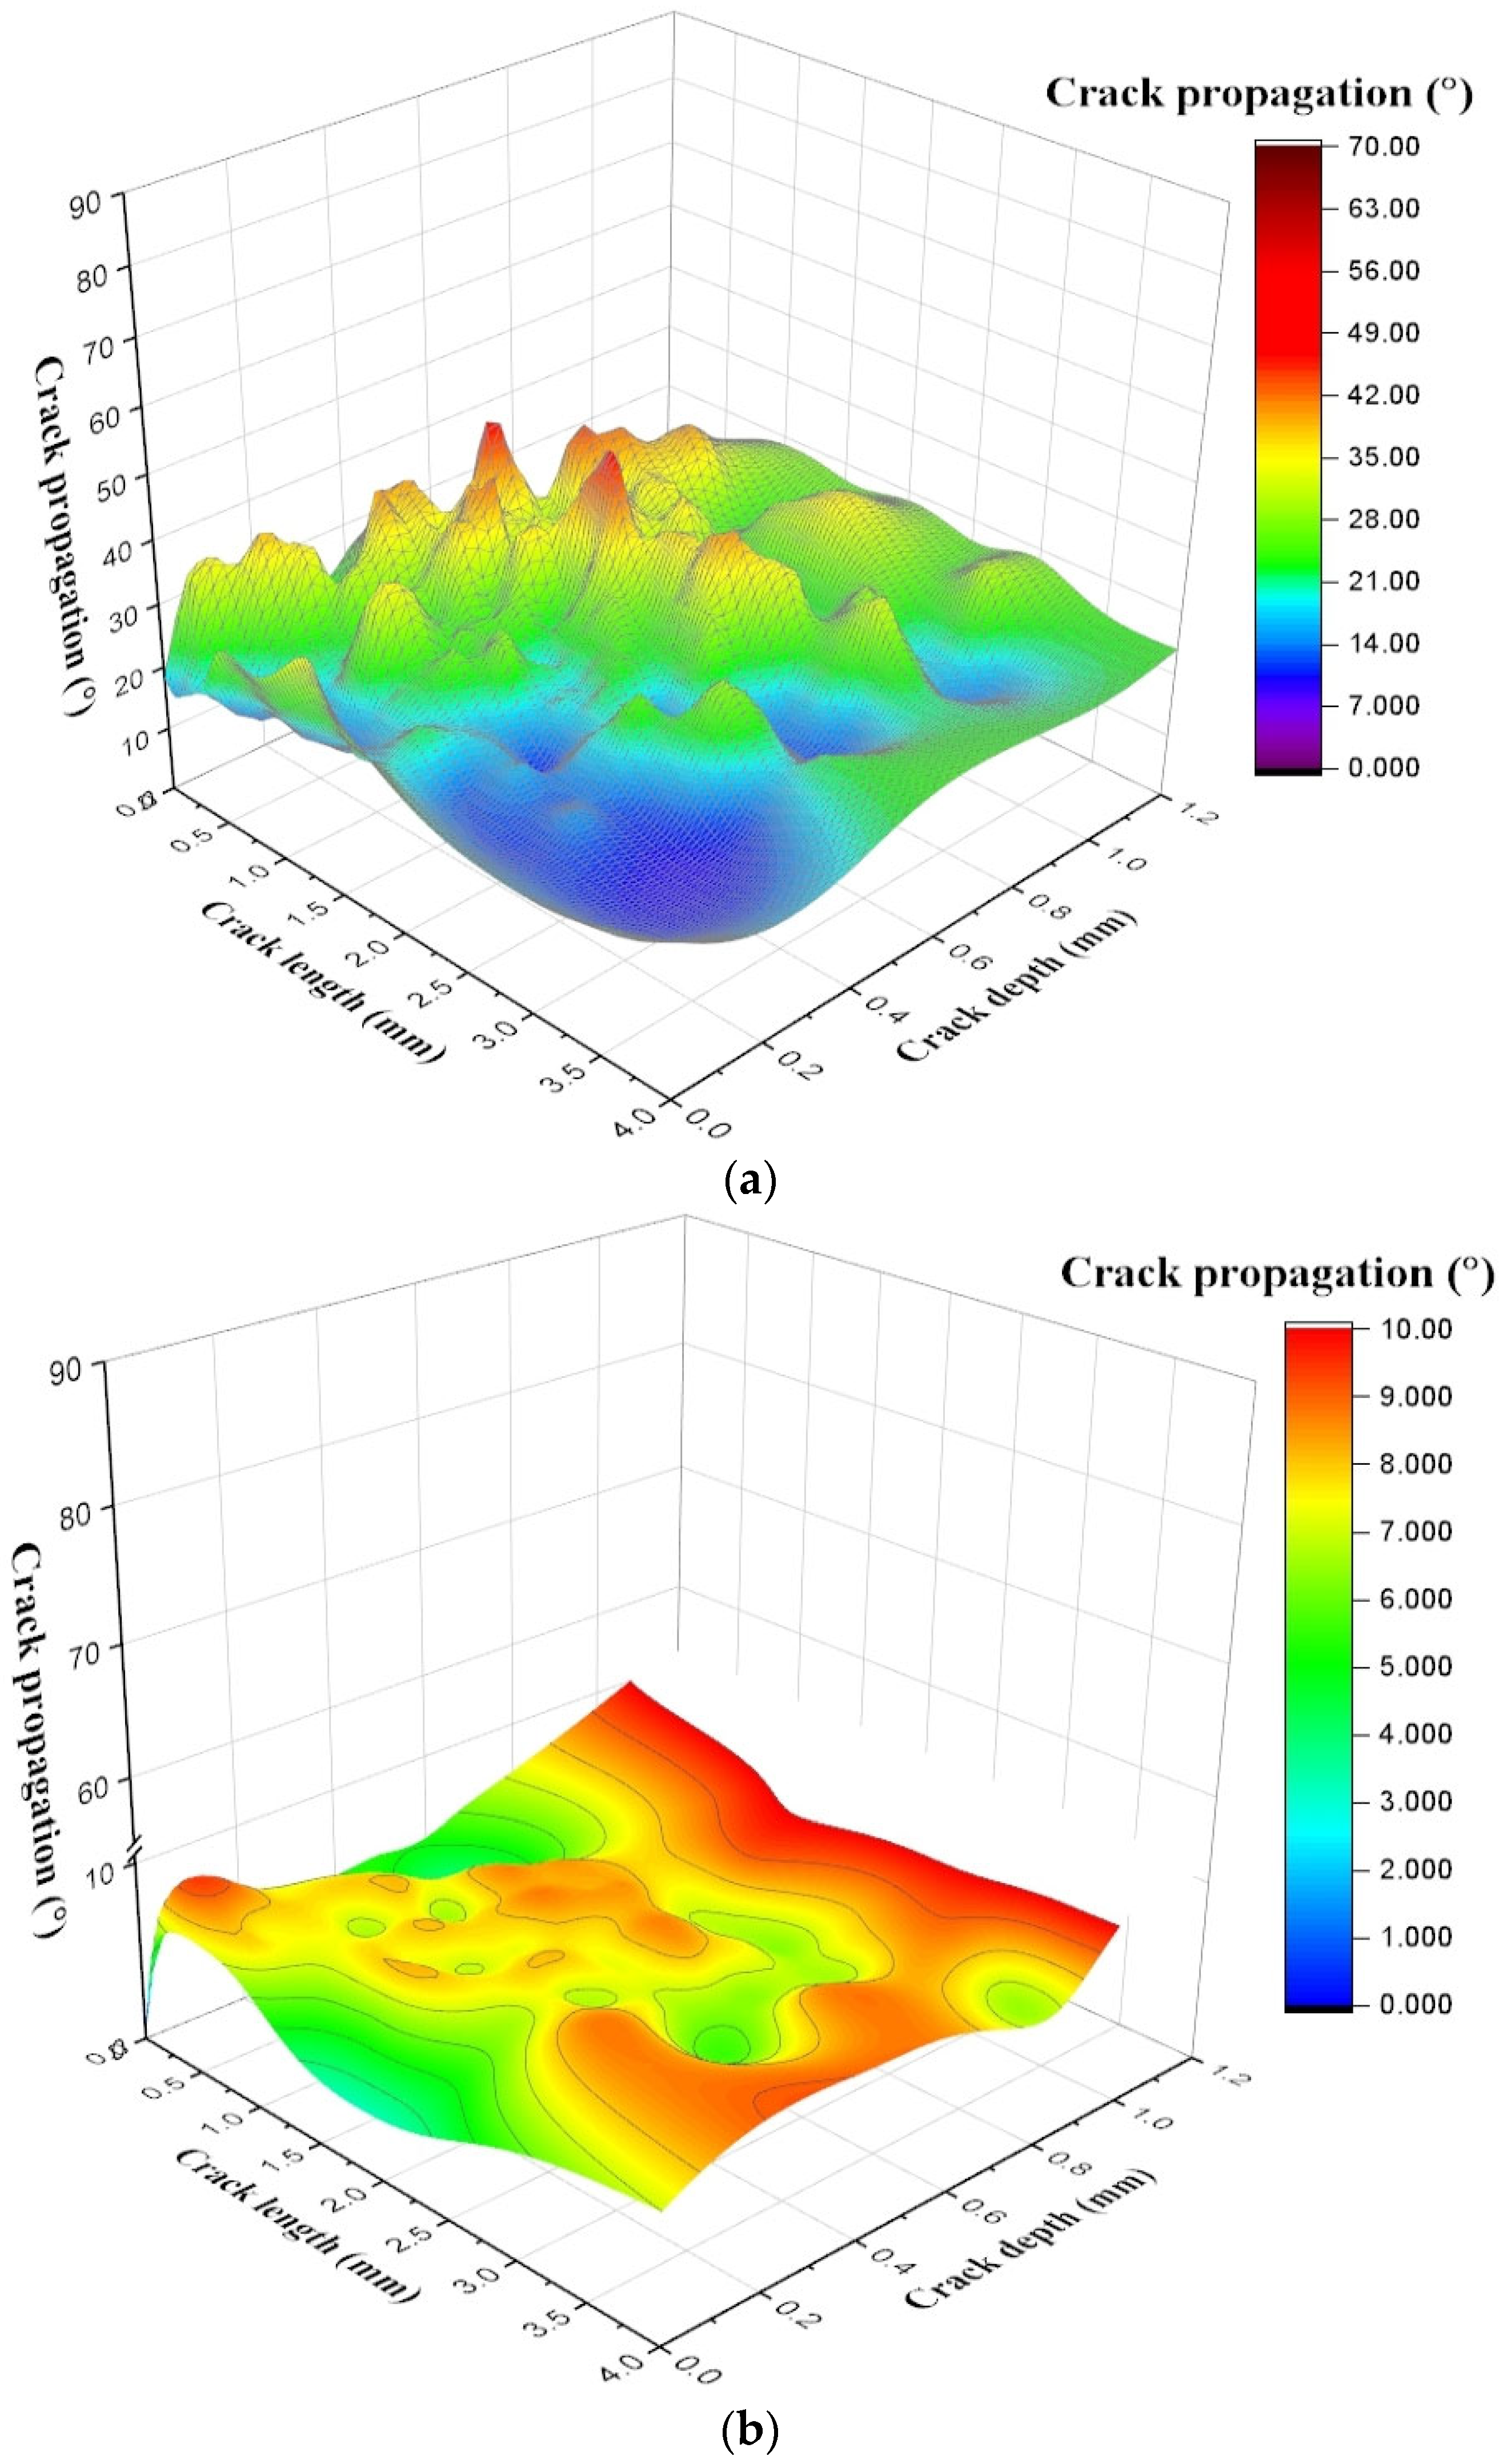
The defects oriented laterally were associated with the rolling contact between the wheel and rail in the direction of travel (Figure 14a), while SEM observations revealed cracks propagating from the surface toward the rail core. Longitudinal defects were attributed to wheel-hunting and lateral movement (Figure 14b), with cracks growing at inclined angles and returning toward the surface. The crack depth, length, and propagation angle were quantified based on the SEM measurements, as shown in Figure 14.
An SEM-based analysis was conducted to evaluate the correlation between the crack characteristics and internal rail defects. The significant dispersion in the relationship between the crack length and propagation rate for both C- and L-direction damages (Figure 14) makes a direct correlation analysis challenging. Therefore, Gaussian probability density analysis was performed to evaluate the internal damage characteristics. Figure 14 illustrates the correlation between crack depth (x-axis), crack length (y-axis), and the resulting crack growth rate/angle (z-axis) based on a dataset of 2500 points. The fluctuations observed in these 3D trends are primarily attributed to the non-linear interaction between wheel–rail contact mechanics and hunting oscillations. A detailed trend analysis and statistical verification of these data characteristics are provided in Section 3.3 through the application of Probability Density Functions (PDFs).

3.3. Gaussian Probability Density Function Analysis According to Crack Depth

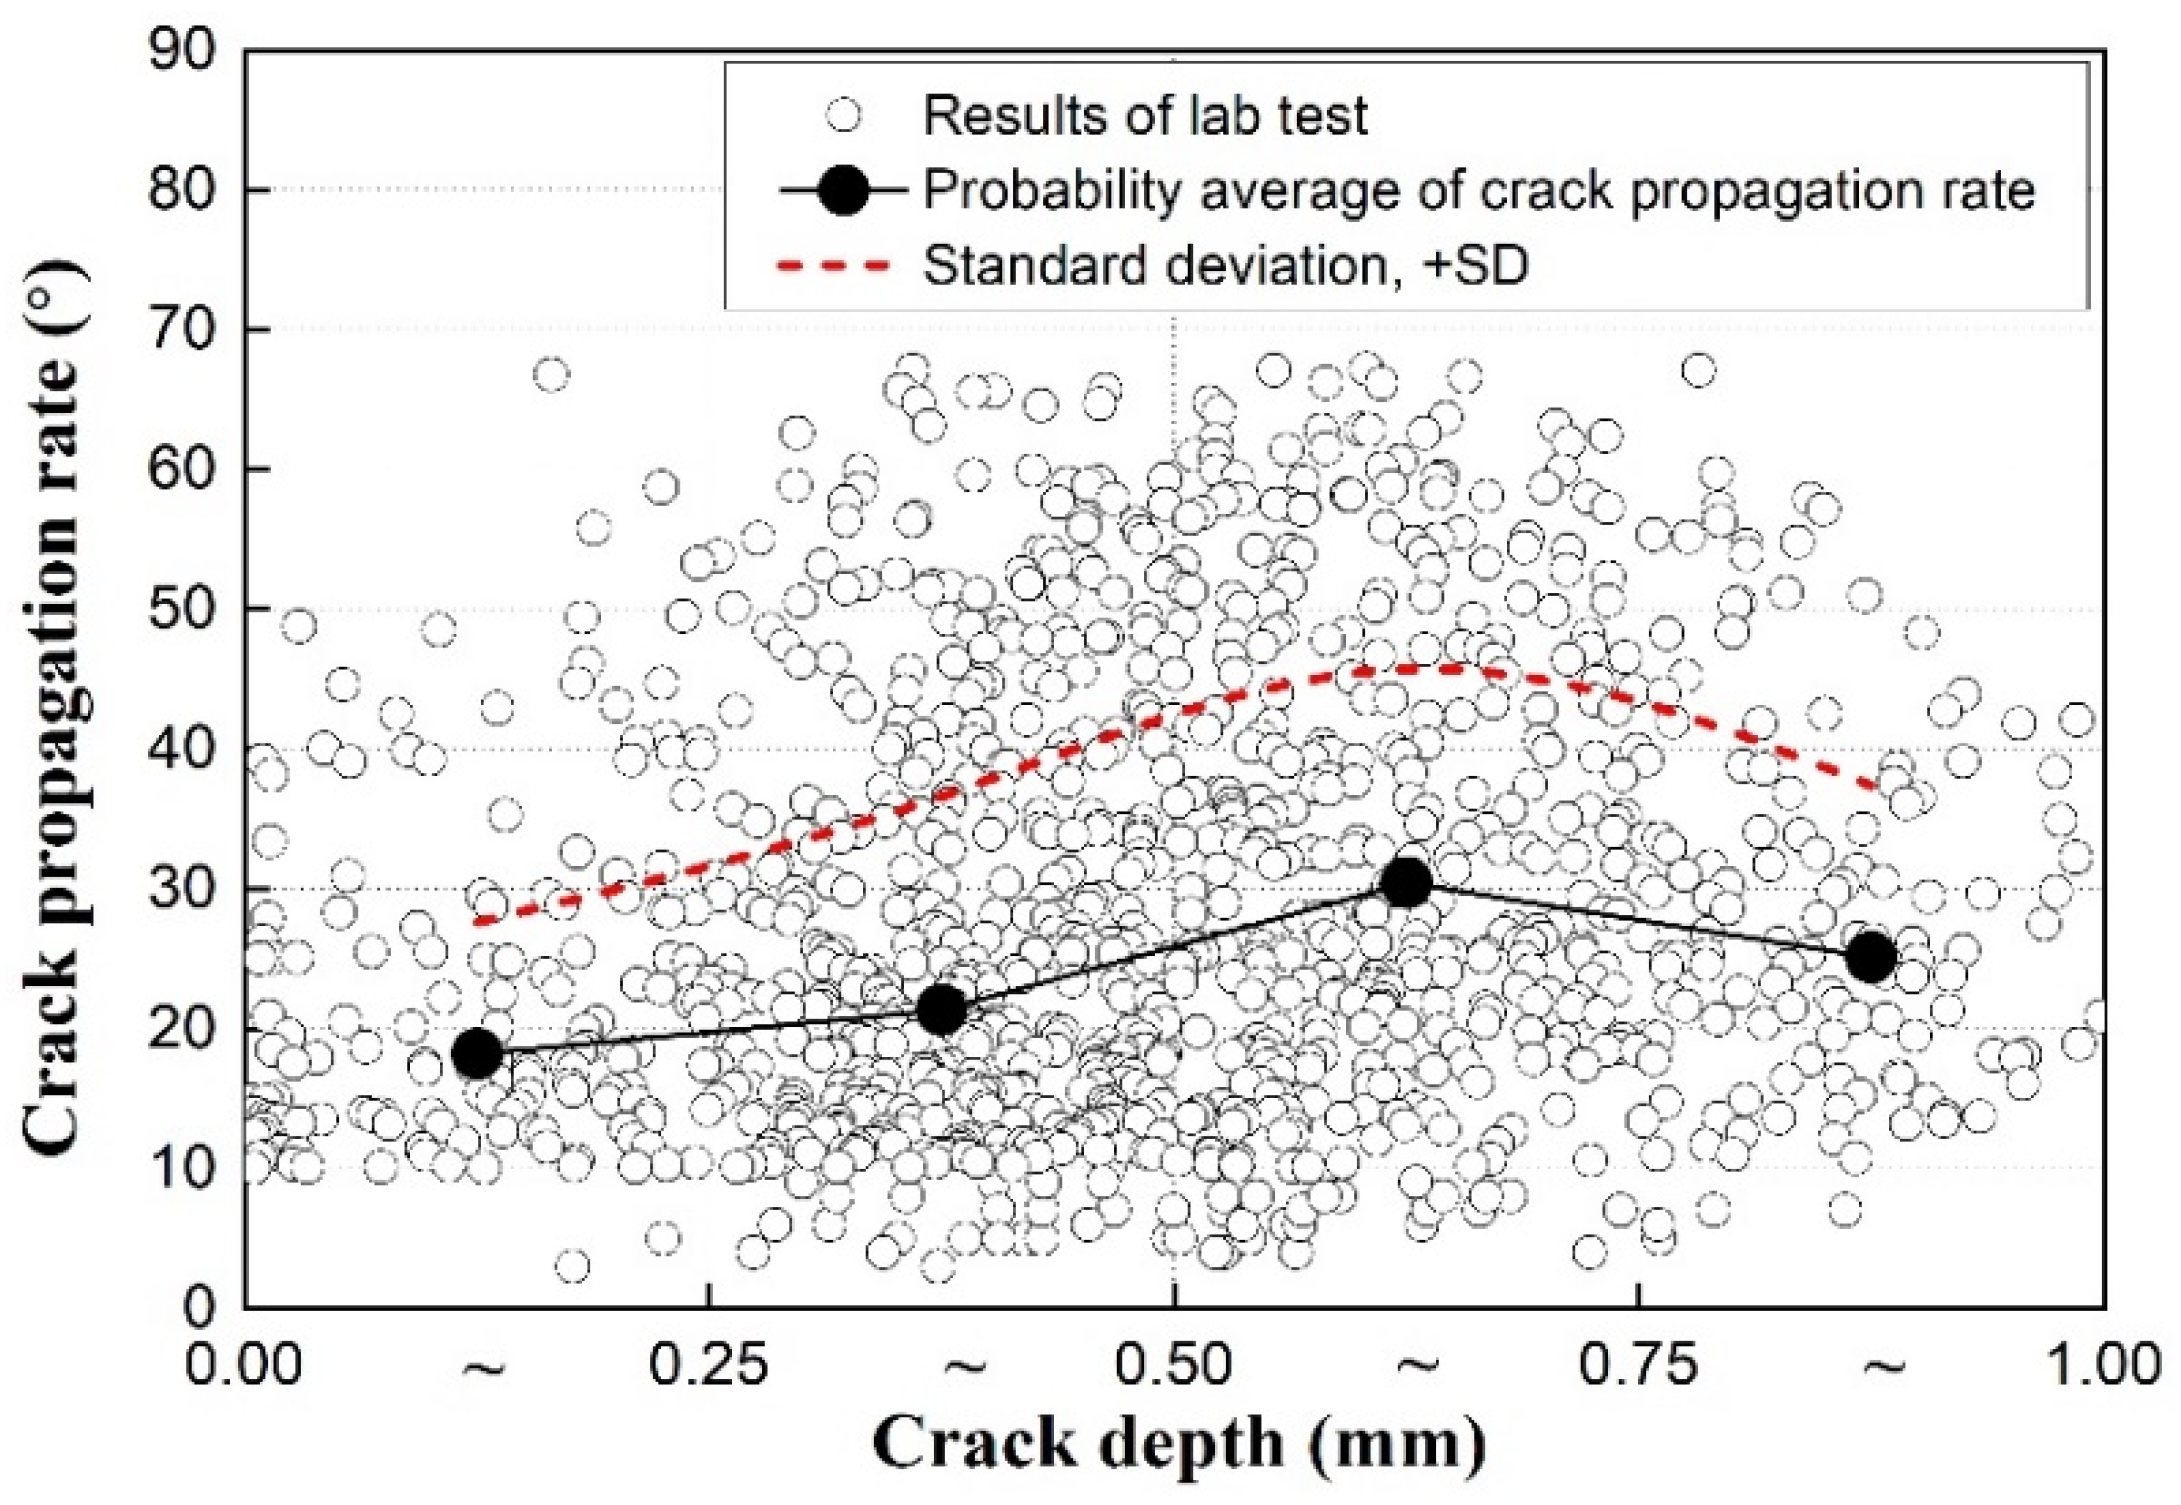
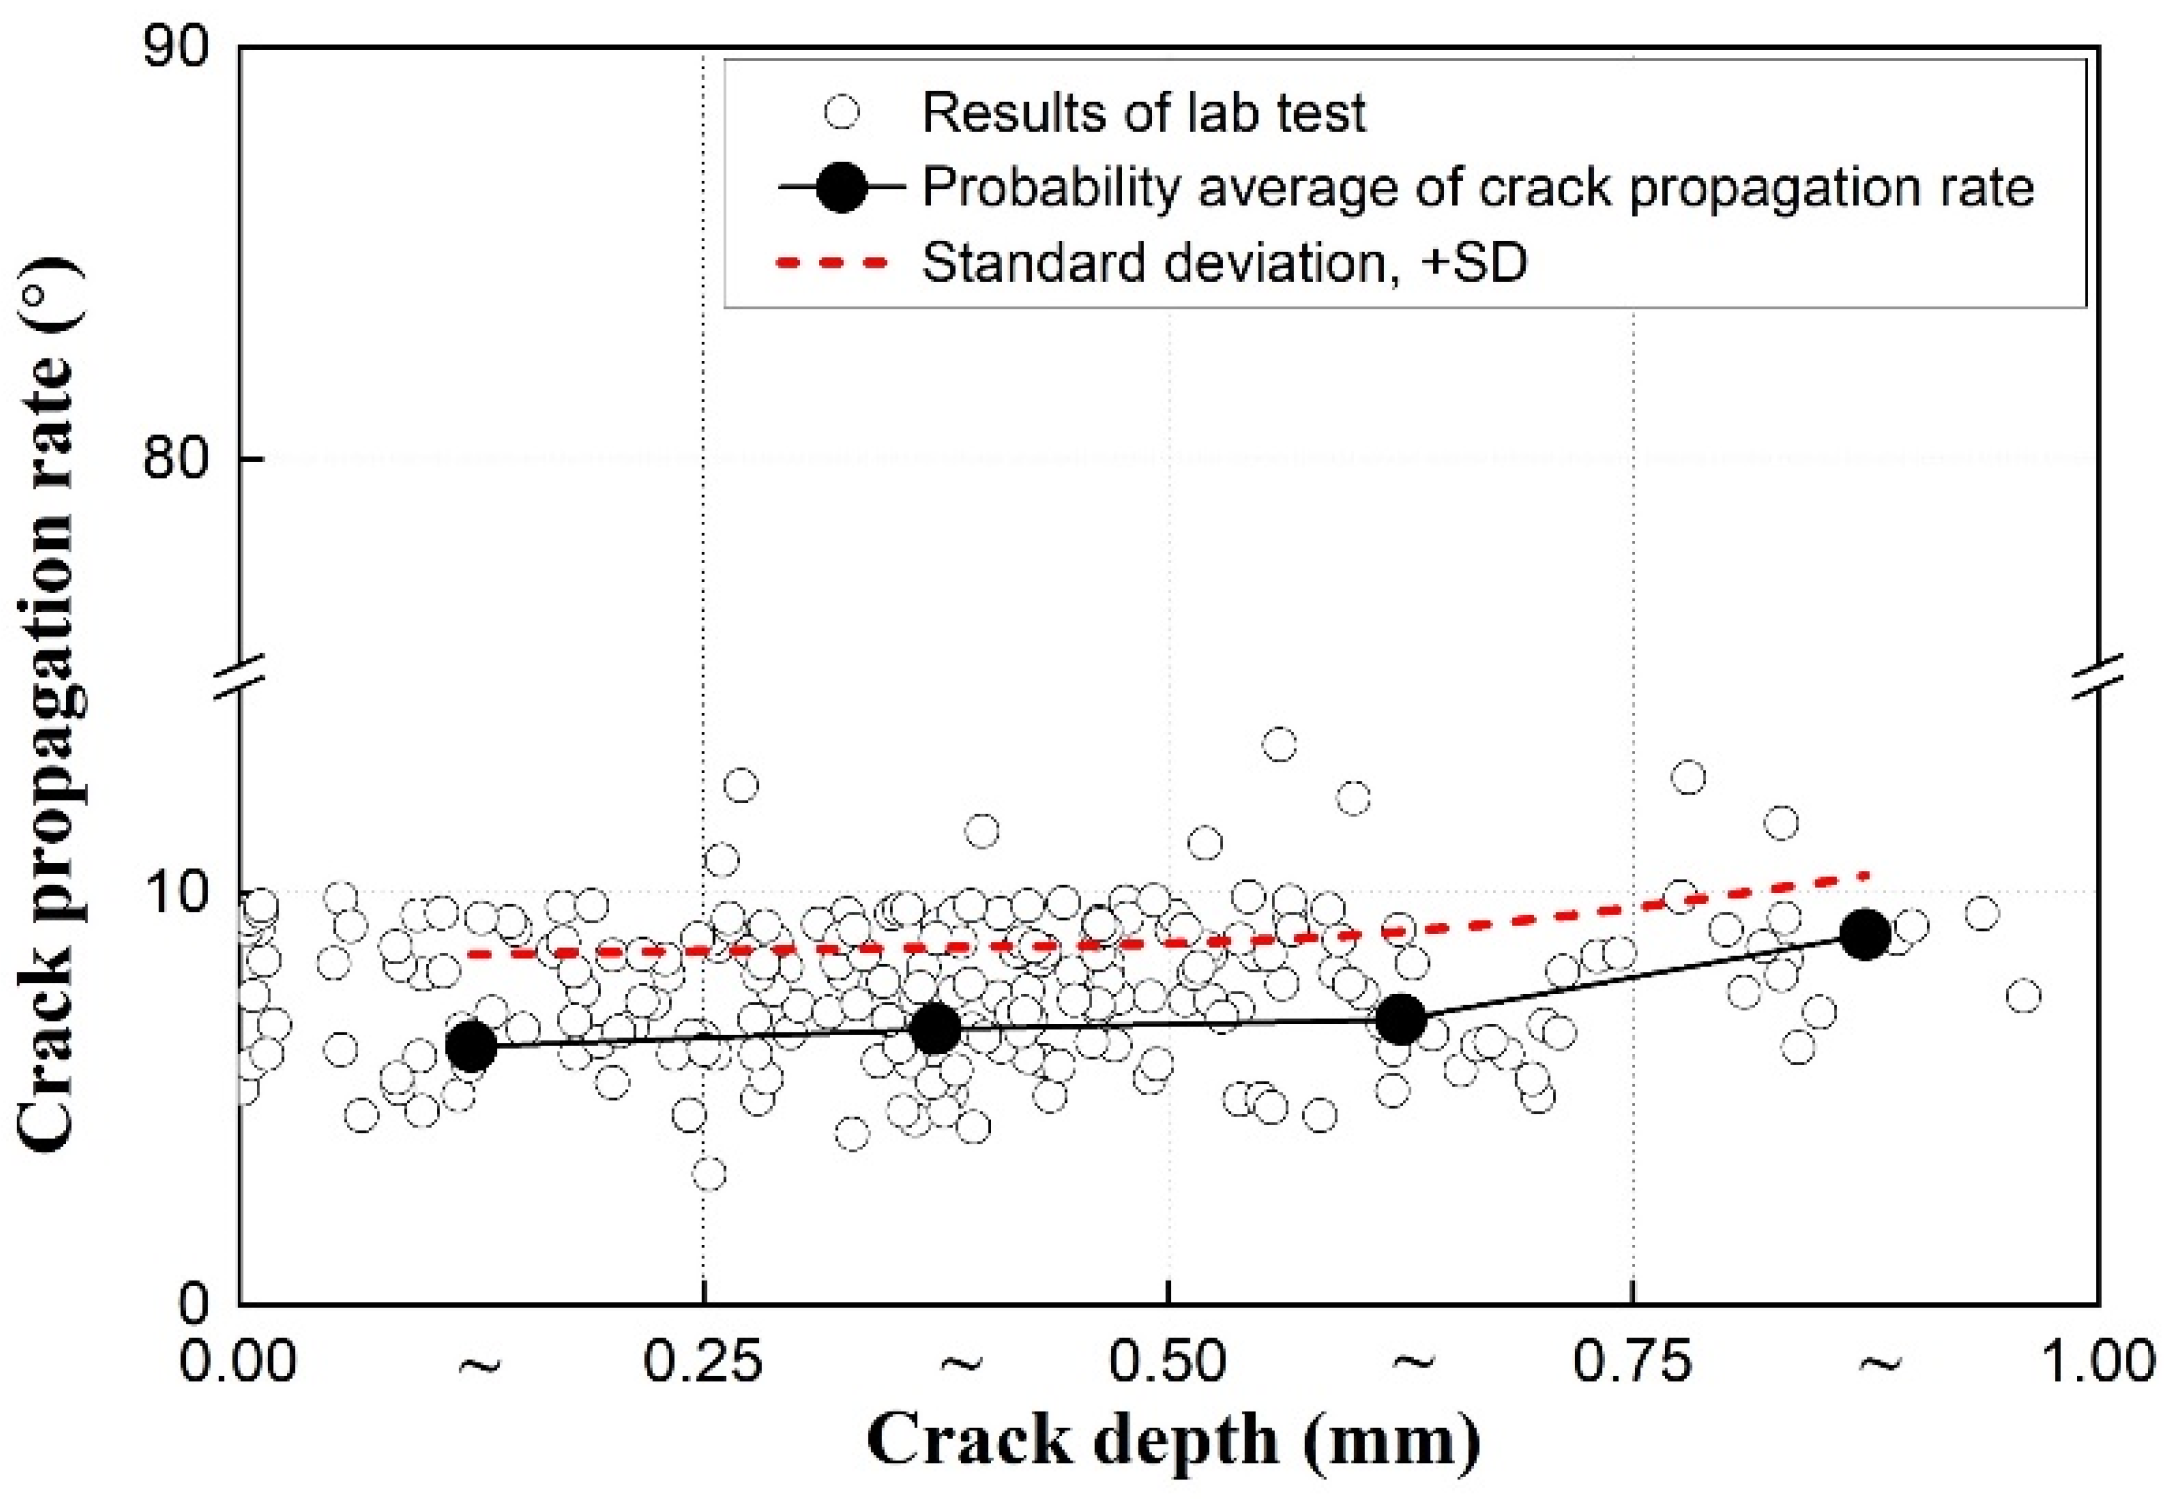
A Gaussian distribution is characterized by a bell-shaped curve defined by mean ( x c ), standard deviation ( w ), and area ( A ), where x c , w, and A represent the average value, dispersion around the mean, and total area under the curve, respectively. A is required to calculate the maximum probability density y c = x c [25]. In this study, a Gaussian probability density function is applied to analyze the relationship between the crack angle (propagation rate) and crack depth. The results are presented in Figure 15 and Figure 16 and Table 1 and Table 2.
Analysis of the crack propagation behavior revealed that the crack angle and its standard deviation increased initially with the crack depth and decreased subsequently, as shown in Figure 15. The highest variability in crack propagation rate was observed for crack depths between 0.50 and 0.75 mm. Beyond 0.75 mm, a gradual reduction in the standard deviation and propagation range was identified, indicating that the 0.50–0.75 mm range represents a critical threshold for crack growth behavior.
Table 2 shows that the relative increase in the mean crack angle (x_c) within the 0.25–0.50 mm depth range was ~17% compared to that of the 0–0.25 mm range, whereas the standard deviation increased by ~49.5%. Between 0.50 and 0.75 mm, x_c increased by ~42.74% and the standard deviation increased by 41.1%. For crack depths exceeding 0.75 mm, both x_c and the standard deviation decreased by ~17.53% and 38.4%, respectively. The relationship between the crack angle and crack depth indicated that the average value and range of crack propagation increased with fracture depth. The widest propagation range was observed at crack depths of 0.75 mm or greater. Conversely, the standard deviation decreases for crack depths exceeding 0.75 mm.
The RCF-induced damage observed in this study was classified into the C-direction and L-direction damage. Gaussian probability density analysis revealed distinct defect characteristics associated with each damage orientation. The results confirm that rail surface damage can be mitigated before the internal crack depth exceeds ~0.5 mm. In addition, the L-direction damage occurred predominantly in the curved track sections, suggesting the need for periodic surface management in these regions. The identified probability distributions provide threshold values applicable to urban railway maintenance strategies.

4. Building Deep Learning Training Data

4.1. Overview

Machine learning approaches differ in terms of the amount of training data required, complexity of the algorithm, training time, and interpretability; further, each approach is suitable for specific problems. To construct the training dataset, the surface damage images of the rails (such as cracks, spalling, and wear) were matched with the internal damage images obtained from SEM testing. The images were captured under various lighting and environmental conditions using a camera, and the damage types were classified by labeling. Deep learning-based image analysis demonstrates improved accuracy with an increase in the volume of visual data; deep learning models are sensitive to the size of the dataset compared to that of traditional machine learning. Although the training time is longer and model complexity is higher, introducing a structure optimized for rail damage pattern recognition can deliver effective performance. When internal rail defects such as cracks are visualized and used as training data, the interpretation may be challenging. However, deep learning models are advantageous for automatically learning internal structural patterns.
Traditional machine learning requires significant human intervention during the feature-extraction stage, while deep learning can automatically extract and learn complex internal structures. Although this reduces interpretability, it improves predictive accuracy, making it well-suited for highly complex internal damage. Accordingly, model designs optimized for structural complexity are required. Recently, in the field of facility defect detection, event camera-based feature separation and image restoration technology in bad weather or blurry environments are being studied in combination with deep learning models to perform precise diagnosis even in irregular environments. In particular, there is a trend toward maximizing the accuracy of defect measurement through advanced segmentation techniques utilizing Mamba architecture or hybrid machine learning [23,24,25,26,27]. In this study, a matched dataset of rail surface and internal damage images was constructed for developing an integrated diagnostic system. Rail damage encompasses a wide range of defect types, and therefore, it is essential to ensure sufficient data volume and diversity, enabling the full utilization of the hierarchical architecture and multi-input processing capabilities of deep learning models. Although the training time is long and the algorithmic complexity increases, deep learning is advantageous for specific tasks such as multidamage diagnosis. Leveraging integrated datasets, the system can achieve higher diagnostic accuracy and broader applicability than single-image approaches. Based on these insights, this study seeks to develop a neural-network-based rail damage diagnostic application that utilizes deep learning models.

4.2. Building Damage Scale Data by Rail Damage Type

As illustrated in Figure 17, the surface and internal rail damage are matched and constructed as training data for the deep learning model.
The dataset was developed by investigating Rolling Contact Fatigue (RCF) damage on operational urban railway lines in South Korea. The two most prevalent damage types identified were Headcheck and Spalling, which formed the core of our training data. To ensure a rigorous one-to-one correspondence, we implemented a precise cross-sectional matching protocol as shown in Figure 17. Labeling: Specific sections on the rail surface were marked as C-sections (Crosswise) and L-sections (Lengthwise). Data Matching: Each marked surface image was then subjected to Scanning Electron Microscopy (SEM) after physical sectioning. This allowed us to directly link the visual surface characteristics with the actual internal crack morphology (internal damage image) for every single specimen. The internal damage characteristics—specifically crack length, depth, and propagation angle—were quantitatively extracted from the SEM images. Furthermore, in accordance with the Korean Rail Facility Performance Evaluation Guidelines, we subdivided the damage types into Headcheck (Types A and B) and Spalling (Types C and D). Paired Samples: 2500 unique damage locations were identified and analyzed. Image Count: Each location consists of one surface image and one corresponding SEM internal image. This resulted in 2500 strictly paired sets, totaling 5000 images (2500 surface + 2500 internal). They were subsequently applied to the development of a rail damage diagnostic application.

4.3. Fast R-CNN

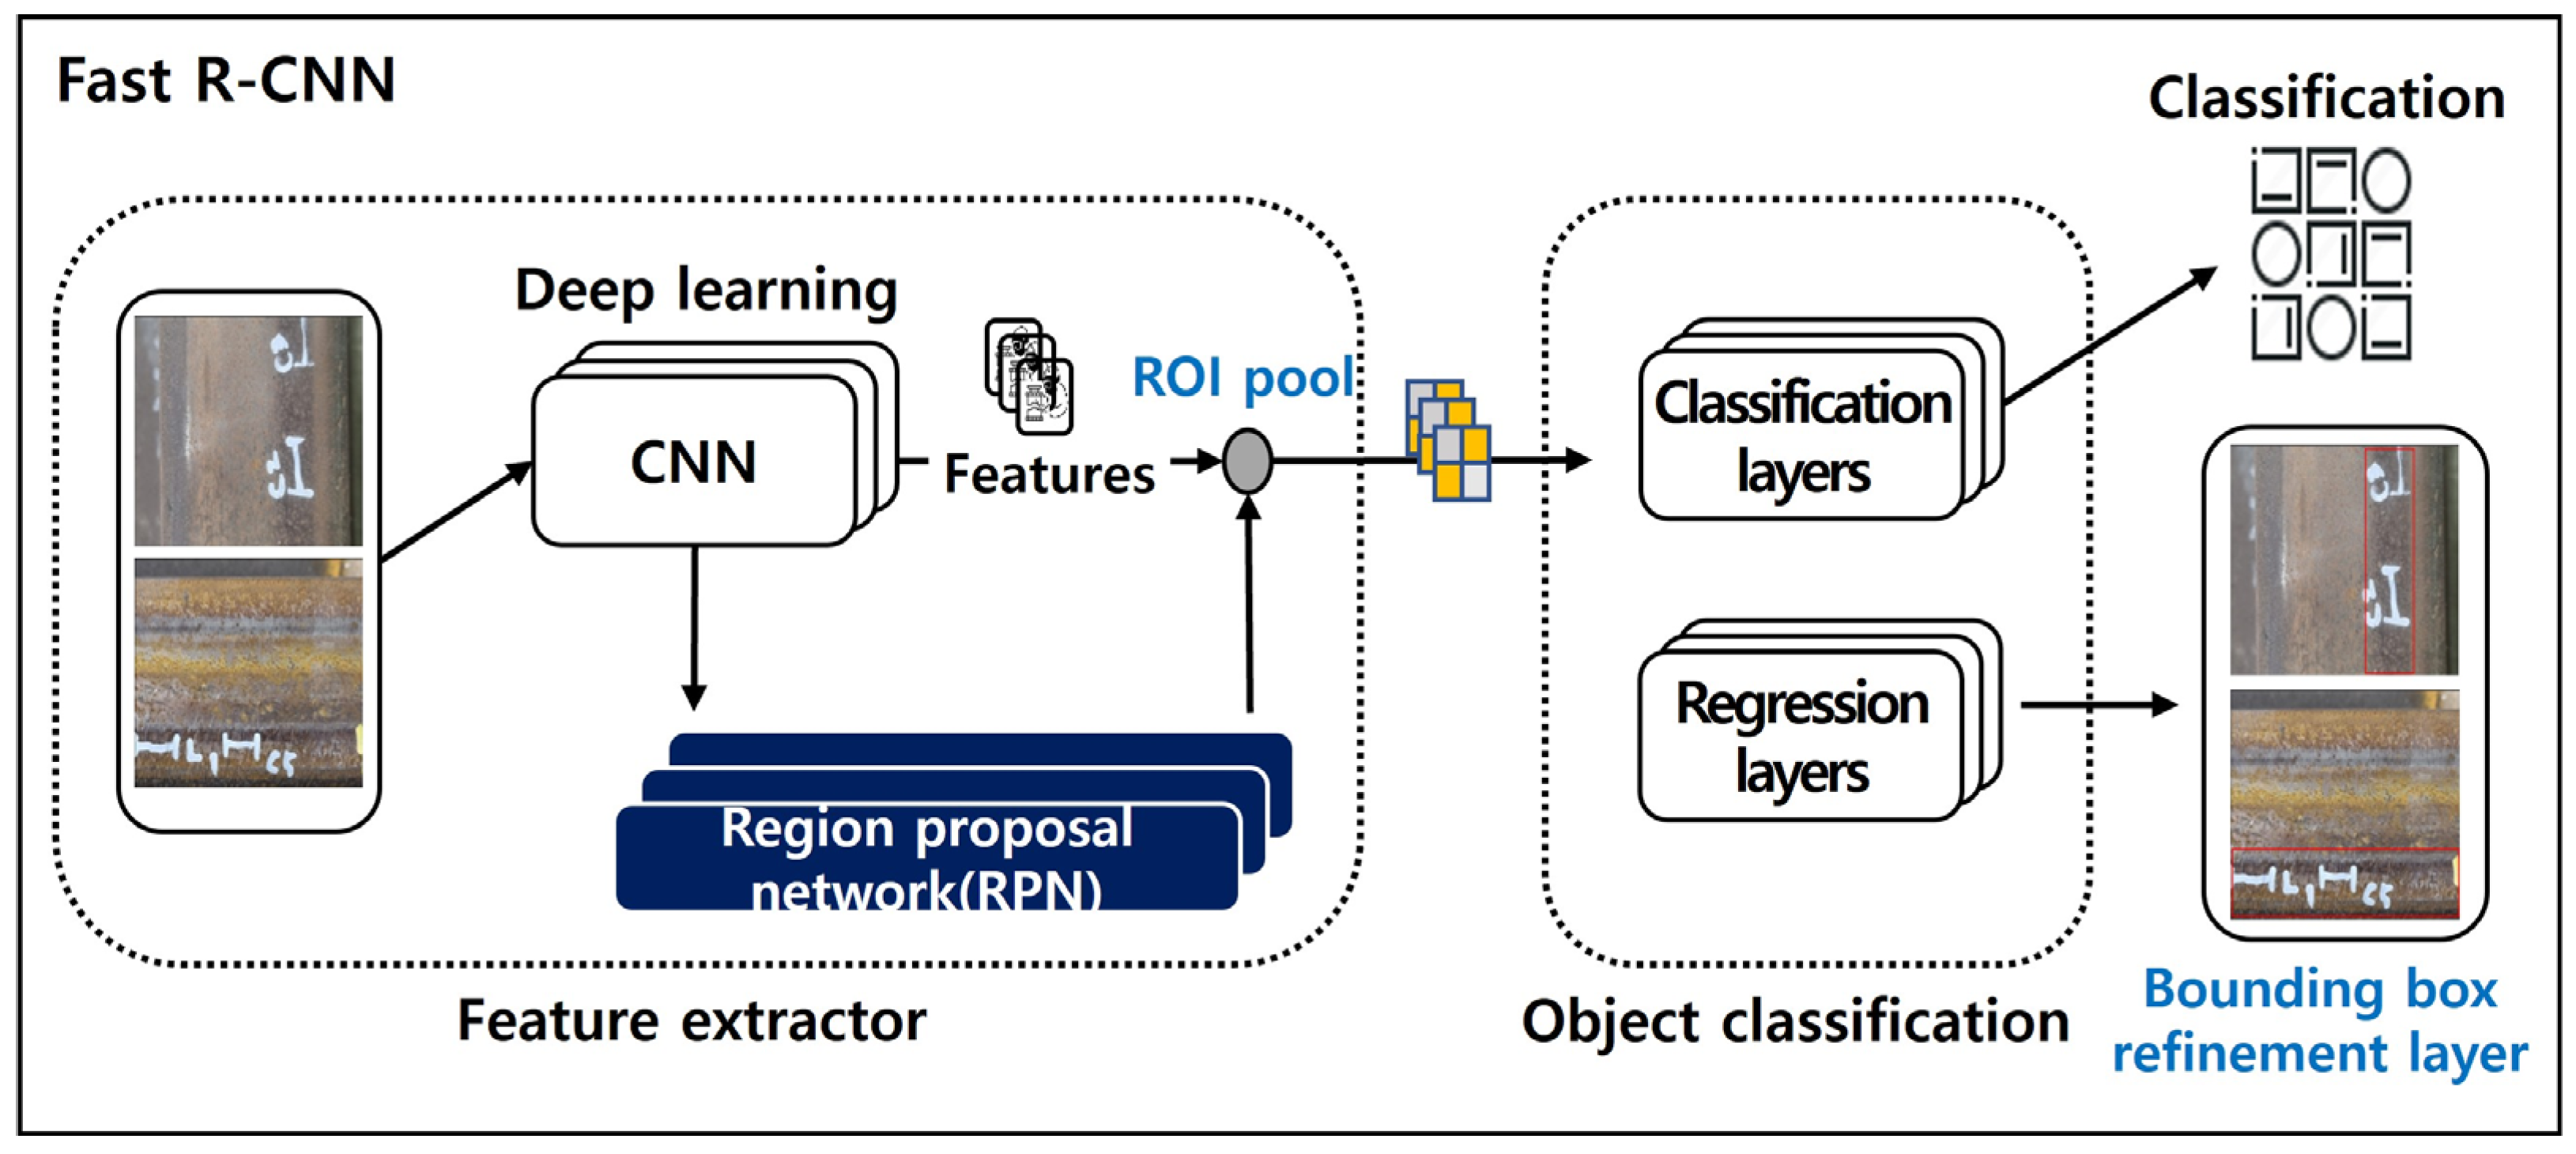
As illustrated in Figure 18, rail surface images containing cracks are processed using the Fast R-CNN framework, wherein features are extracted using CNN and subsequently passed to the region proposal network (RPN) and object classifier [25,26,27,28,29,30,31,32,33,34,35,36,37,38,39,40]. The RPN generates candidate regions with corresponding objectiveness scores, whereas region of interest (ROI) pooling standardizes region sizes prior to classification. Finally, the detected defects are output as bounding boxes.
Applying deep learning-based analysis to rail surface damage images can significantly reduce the human error associated with conventional visual inspections, providing inspectors and infrastructure managers with reliable and objective diagnostic information.

4.4. Model Learning and Experimental Environment

The collected dataset was split into training, validation, and test sets in a ratio of 8:1:1. To supplement insufficient training data and address overfitting, we used ImageDataGenerator (TensorFlow version 2.7) for data augmentation. The 2500 paired samples were partitioned into training, validation, and test sets at an 8:1:1 ratio. In this study, data acquisition was conducted in accordance with the Guidelines for Regular Inspection of Railway Facilities in South Korea. Due to the operational characteristics of the Korean railway system, where detailed internal diagnoses via inspection cars must be completed within strictly limited maintenance windows (train stop times), the focus is placed on diagnosing discrete, localized damage points identified during visual inspections. Consequently, rather than grouping by continuous rail segments, we utilized 2500 independent damage locations (1250 Headcheck and 1250 Spalling cases) verified by track diagnostic experts to ensure the diversity of damage morphologies in the training process. Random rotation, brightness adjustment, shear, zoom, and horizontal/vertical flipping were applied to enhance the robustness of the training model. Key hyperparameters for Fast R-CNN model training were set to 0.001 for the learning rate and 32 for the batch size. We set a maximum of 500 epochs for model training, but set the Early Stopping Patience to 20 to halt training if the validation loss does not improve. All experiments were conducted using Python 3.9.16 within the PyCharm 2021.3 integrated development environment. The computing platform included a Windows 11 operating system, Intel i5-13,600 K CPU, NVIDIA GeForce RTX 4060 Ti GPU, and 128 GB of RAM, as summarized in Table 3. The Fast R-CNN model was implemented using Keras (v2.9.0), with CUDA v12.2 and cuDNN v8.9.0 utilized for GPU acceleration.
The model performance was evaluated using true positive (TP), true negative (TN), false positive (FP), and false negative (FN) metrics derived from the validation dataset. TP, FP, FN, and TN represent the correctly identified crack images, noncrack images incorrectly classified as cracks, crack images incorrectly classified as noncracks, and correctly classified as noncrack images, respectively.
The detection performance of the proposed algorithm is assessed using a confusion matrix, as defined in Table 4. TP, FP, FN, and TN indicate correct detection, incorrect detection, missed detections, and correct rejection of nontarget objects, respectively. The recall, precision, and accuracy were defined based on the TP, FP, FN, and TN values. The performance evaluation assesses the suitability of a deep learning model using Recall, Precision, and Accuracy.
Recall is the ratio of items that are actually true that were correctly detected by the model and can be expressed as
Recall = TP TP + FN .
Precision is the ratio of items detected to be true by the model that are actually true and can be expressed as
Precision = TP TP + FP .
Accuracy evaluates the ratio of correct predictions to the total predictions made. The values were examined and analyzed to increase Accuracy, which is expressed as
Accuracy = TP + TN TP + FN + TN + FP

4.5. Deep Learning Model Suitability Analysis

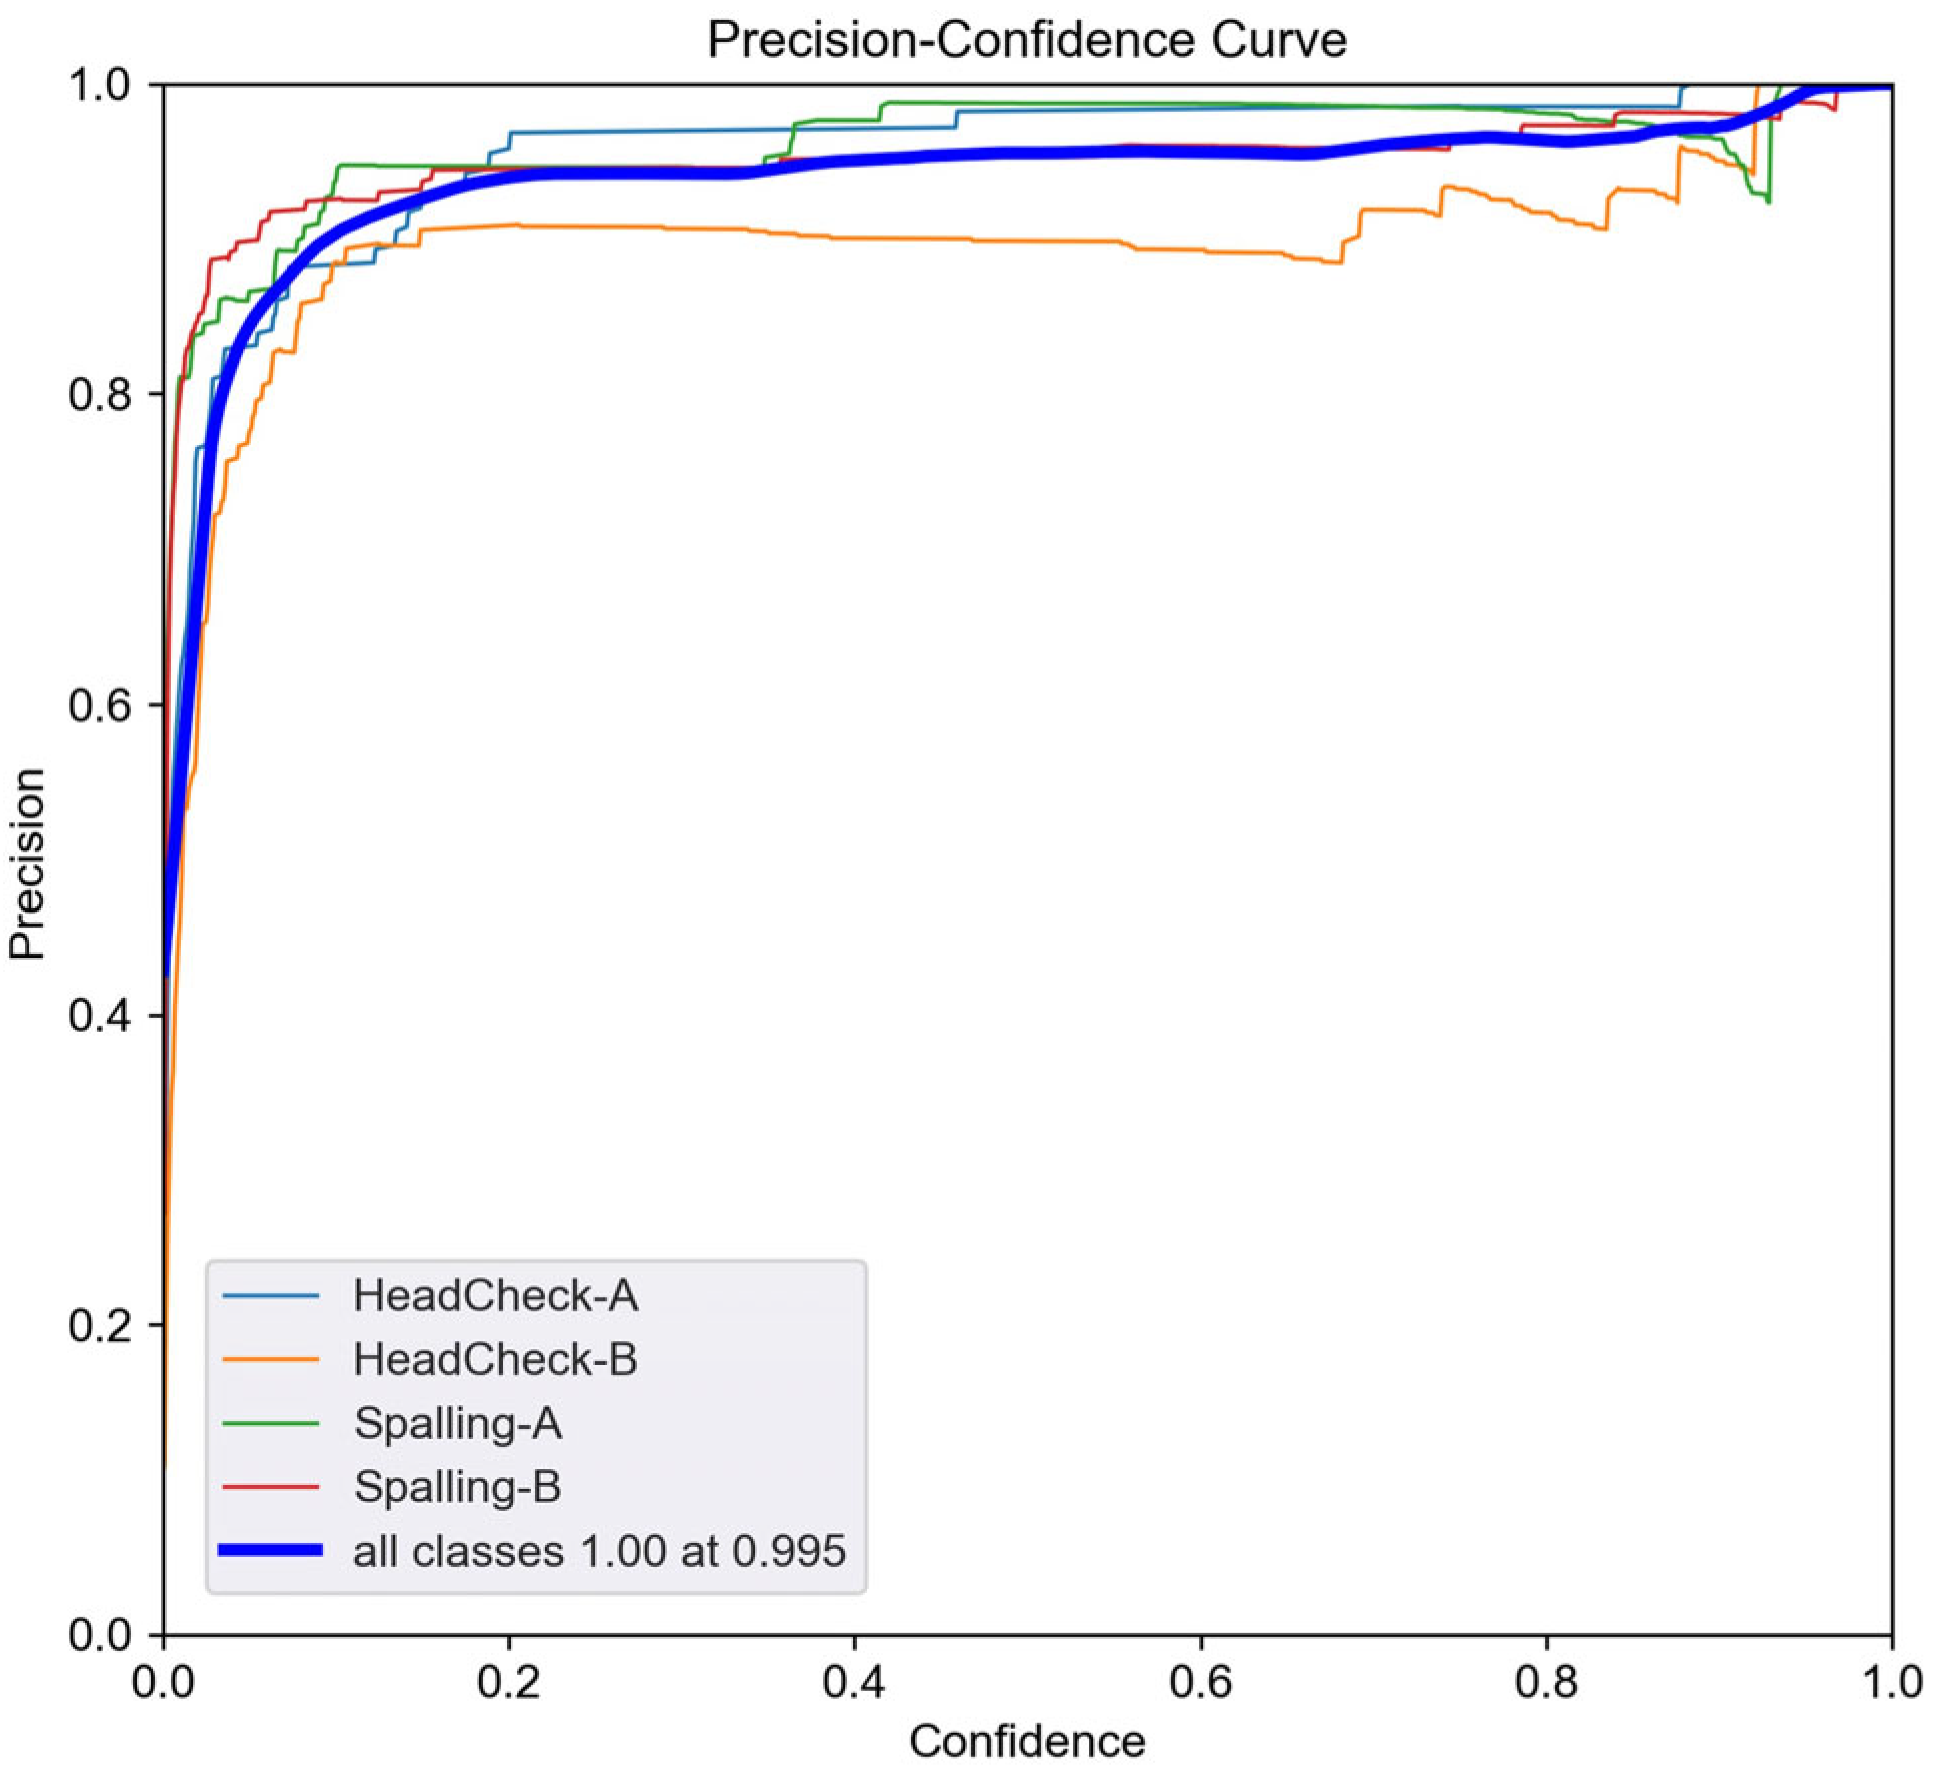
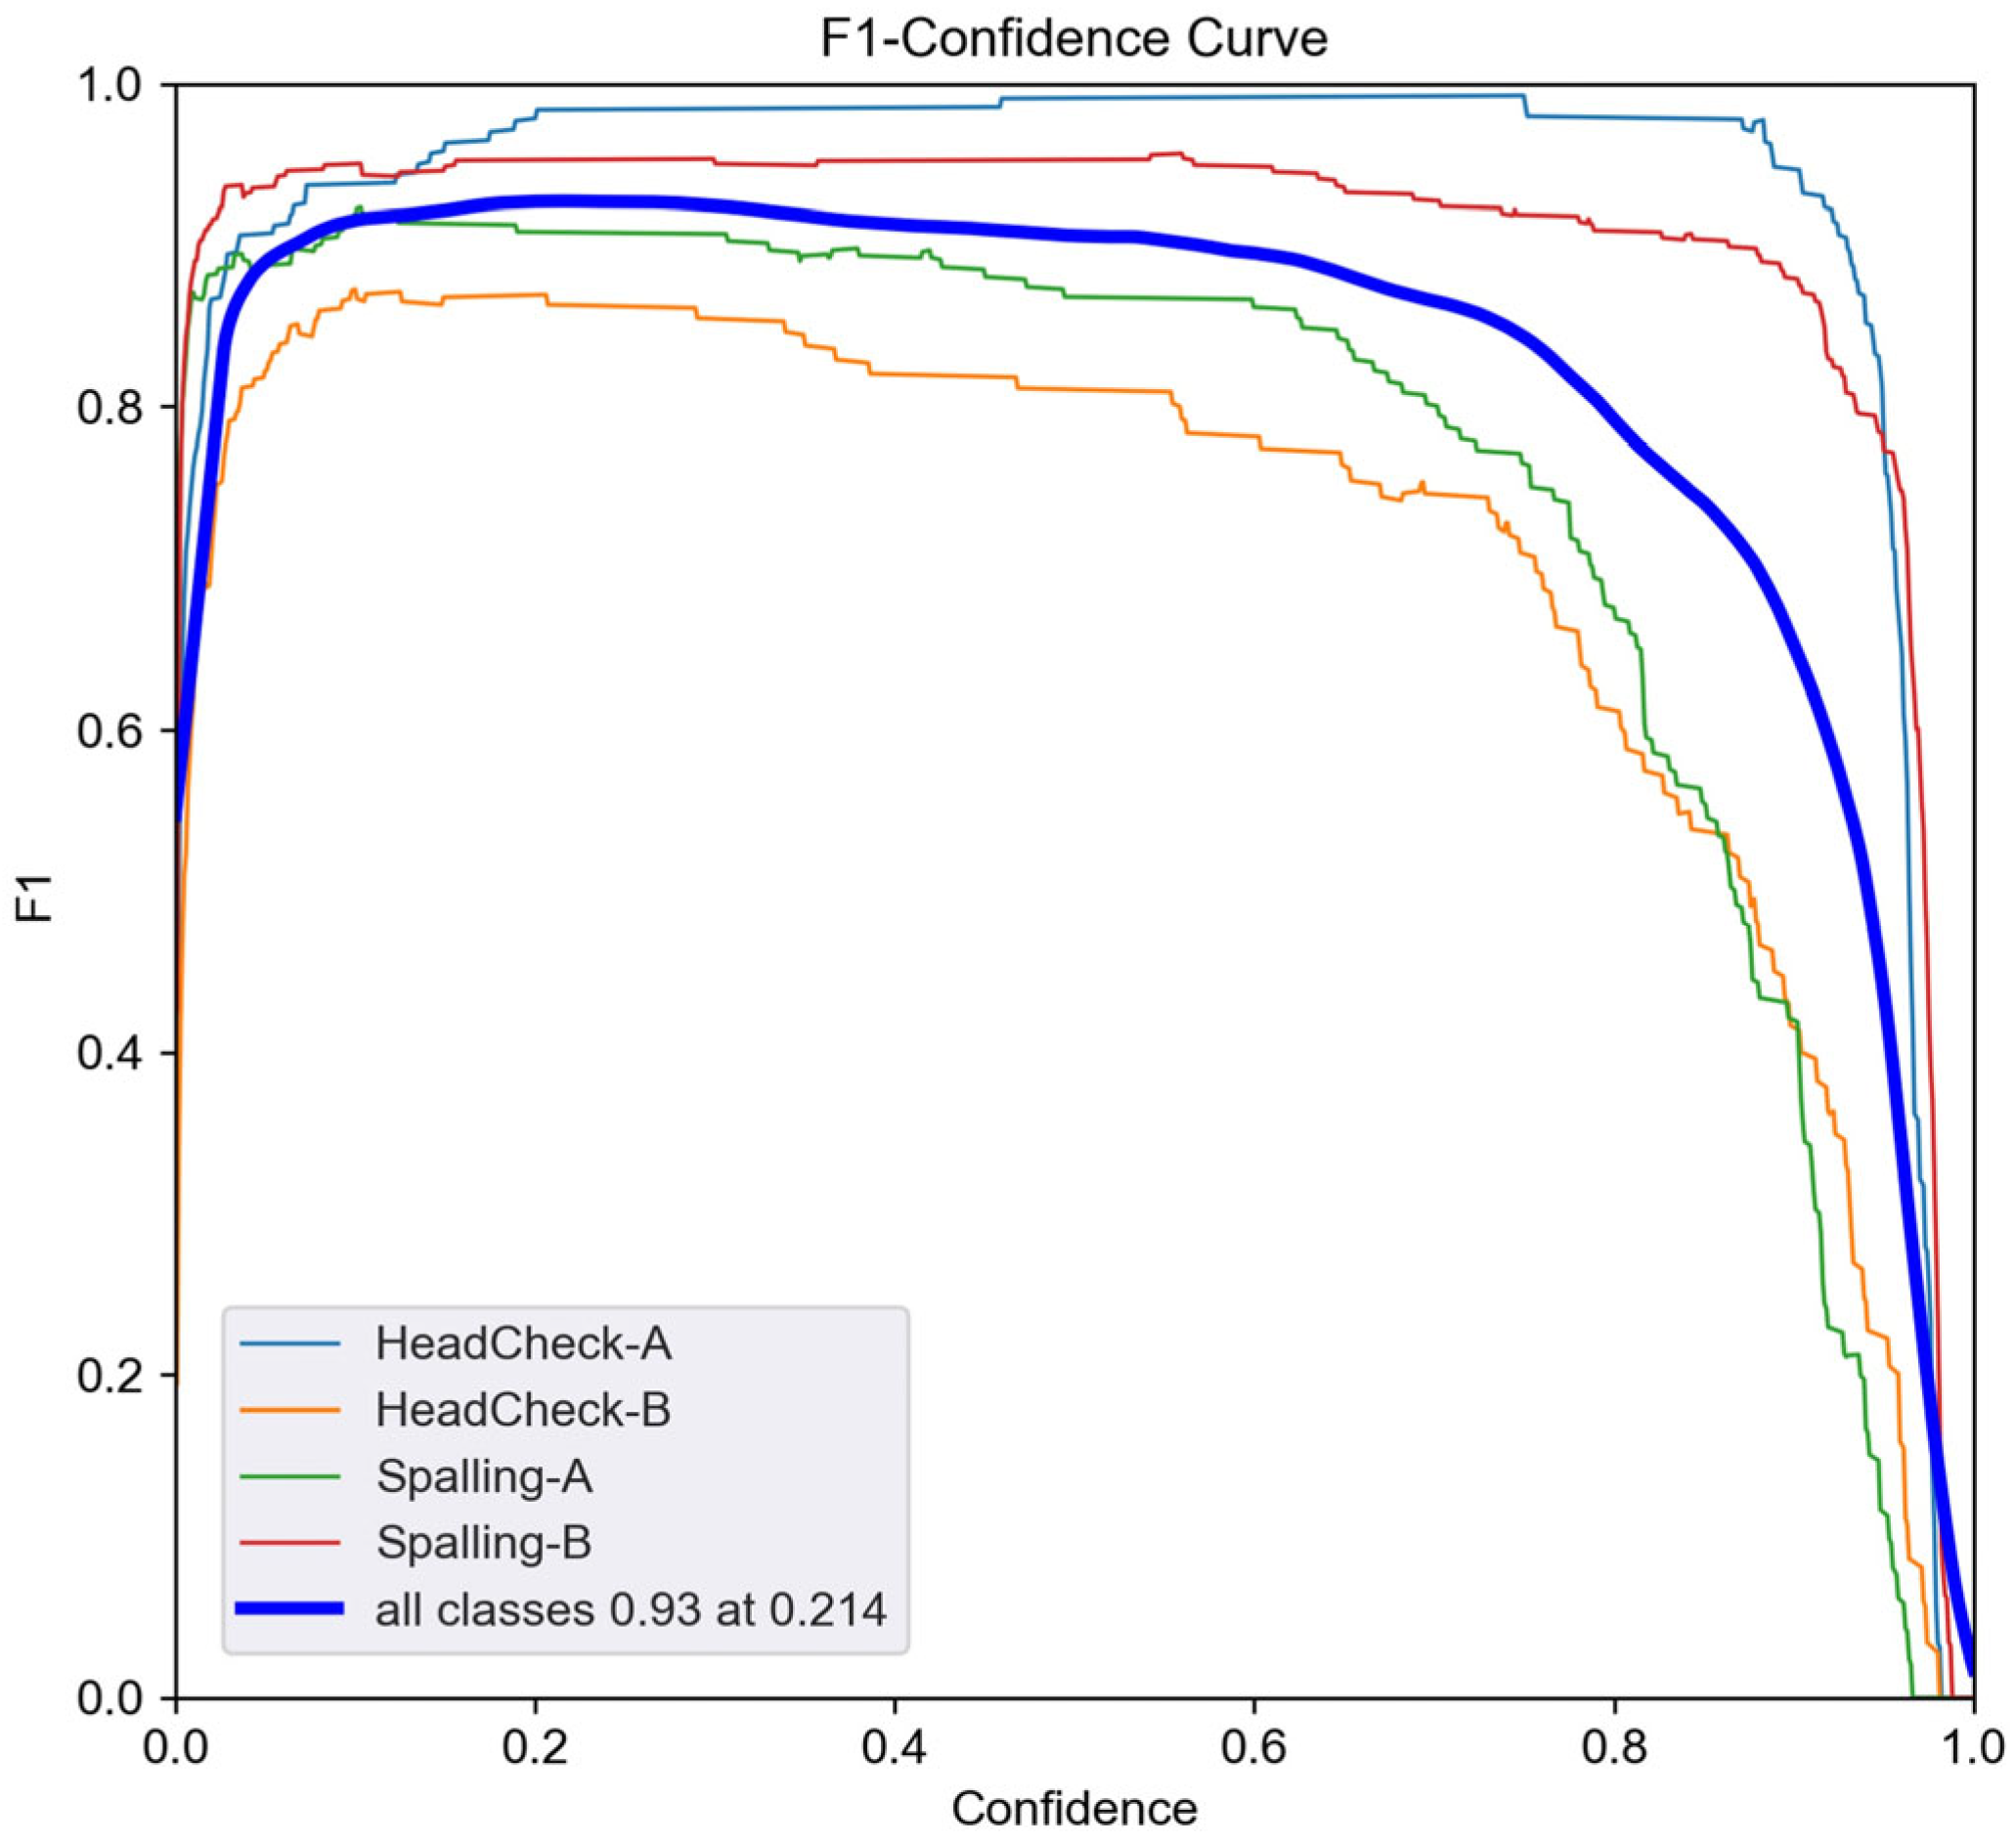
Figure 19 presents the precision–confidence graph, which shows the mean precision of the correctly detected object boxes relative to the predicted object boxes from the validated model. Figure 20 presents the recall–confidence graphs, which show that the F1-score reaches 92% at a confidence level of 0.214 and remains as high as 88%, even at a confidence level of 0.8.
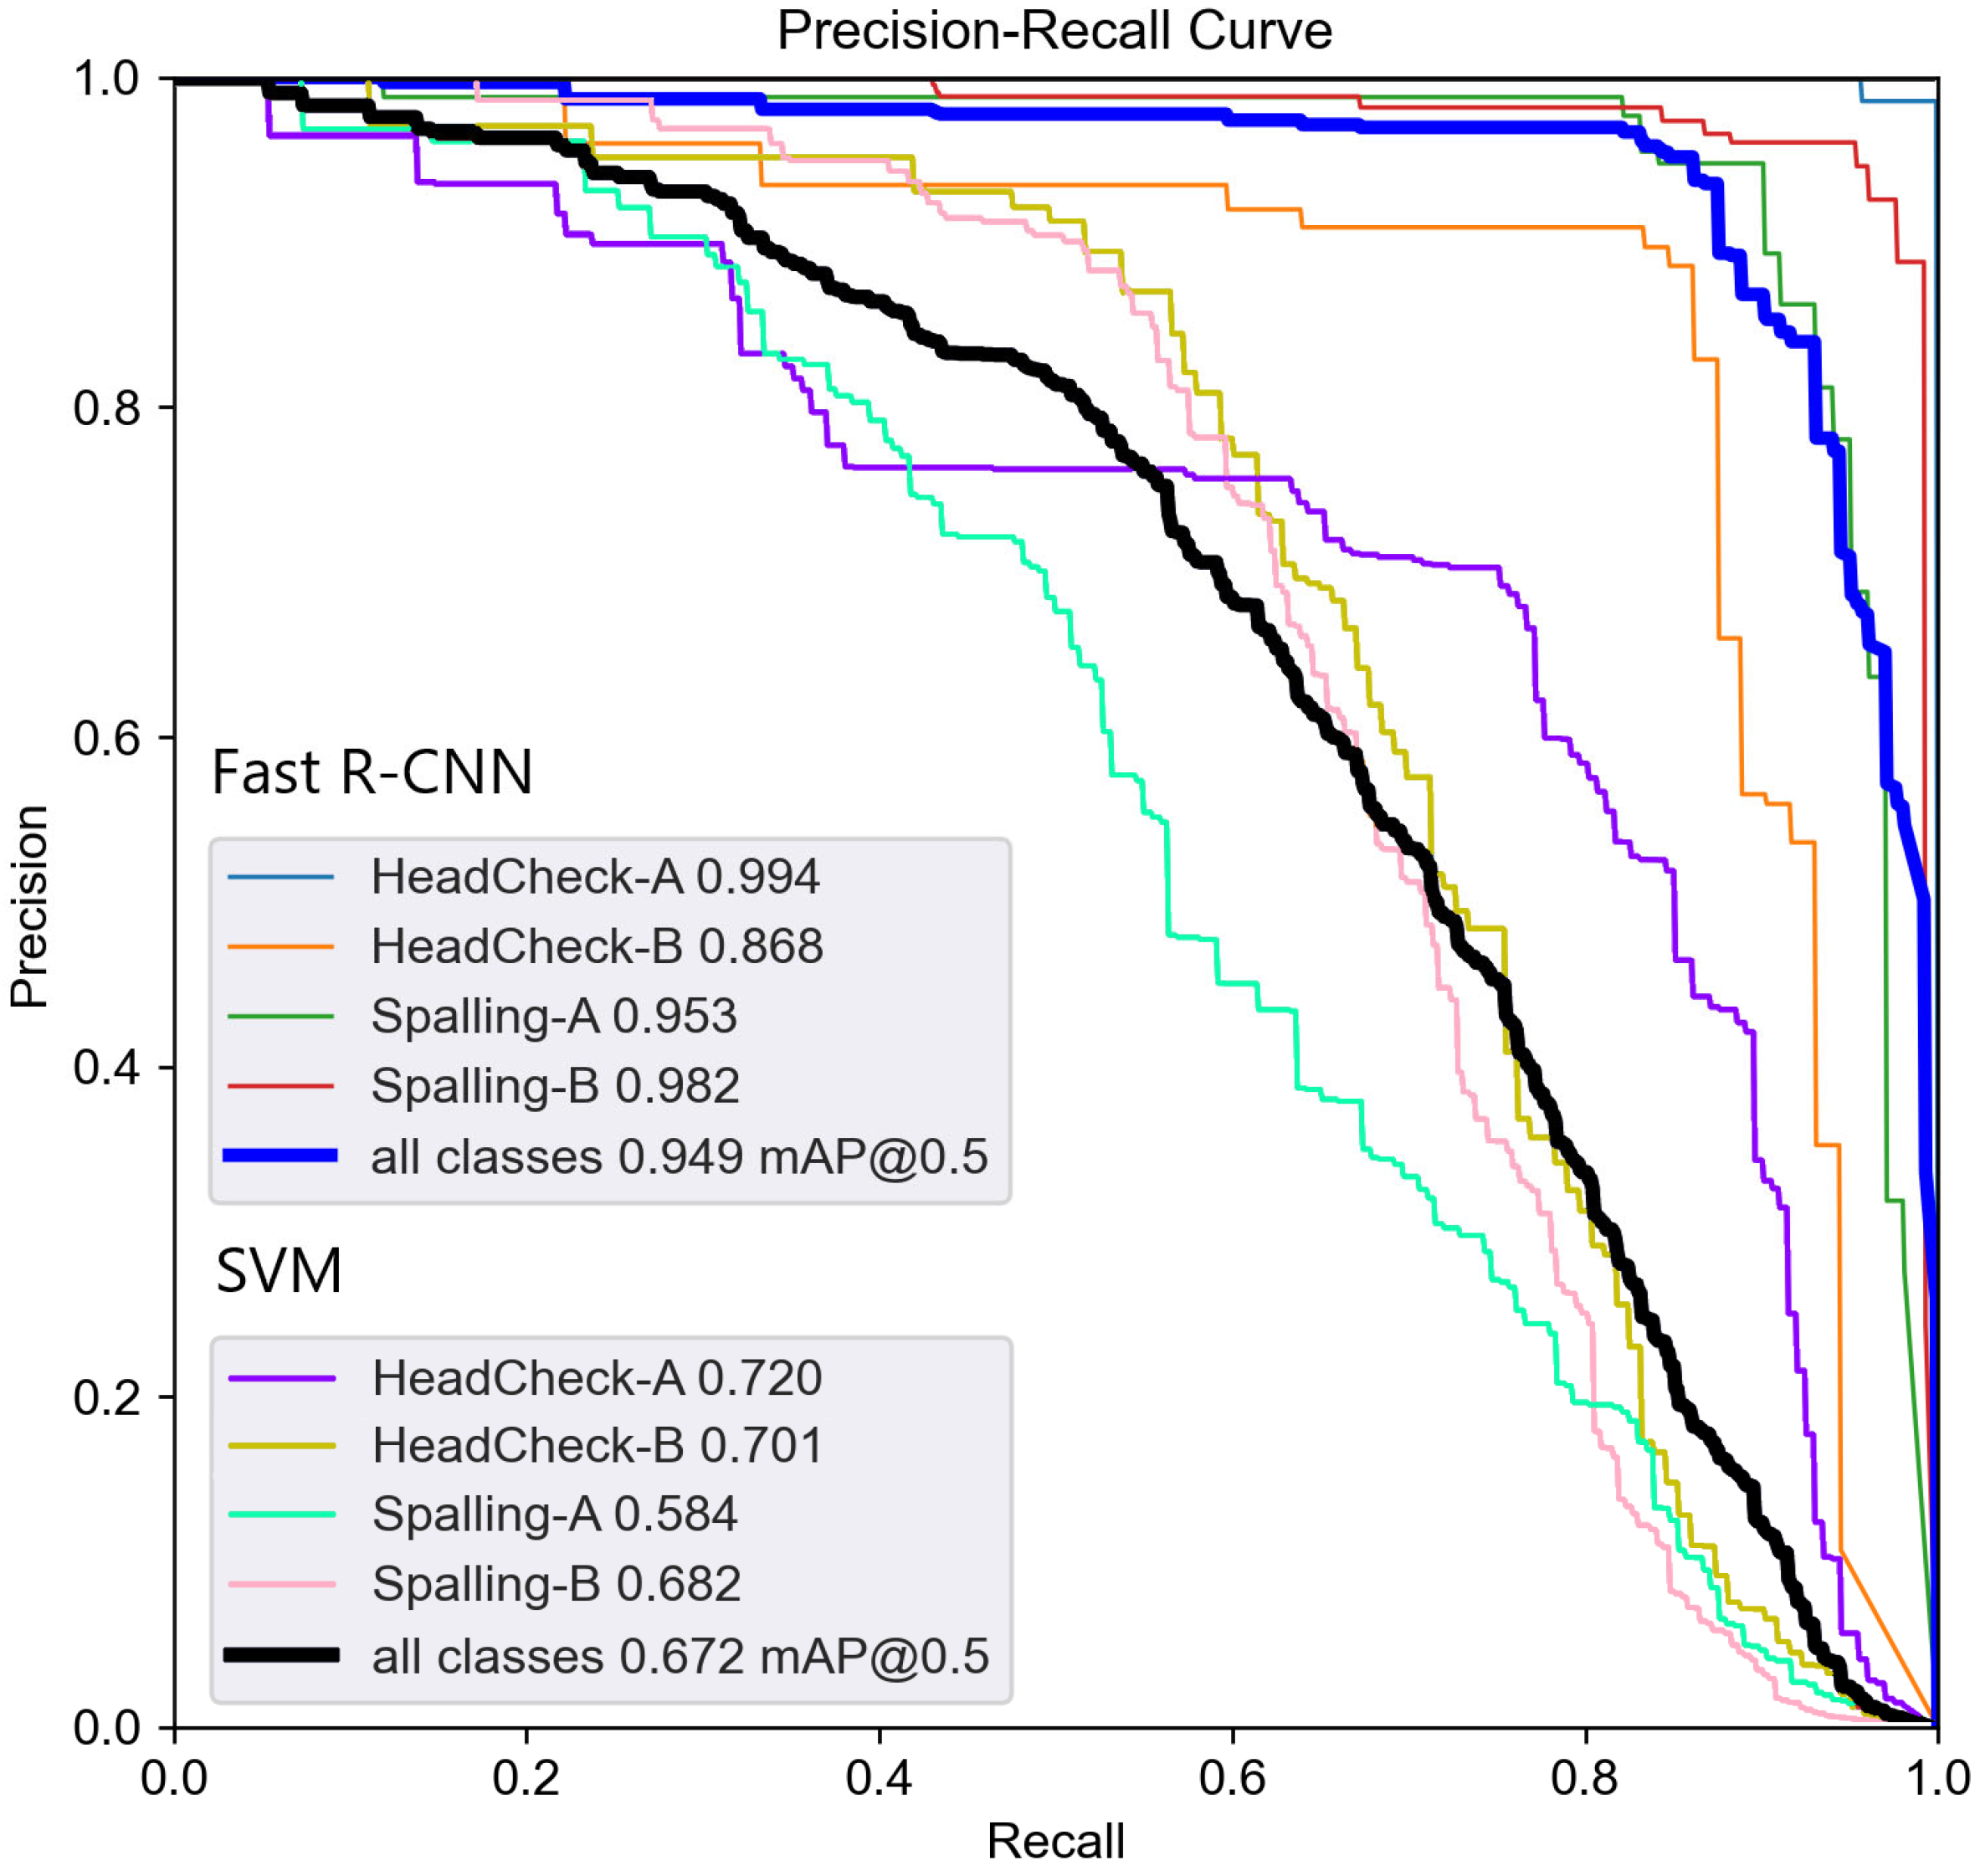
Figure 21 compares the performances of the support vector machine (SVM) and Fast R-CNN. At a threshold of 0.5, Fast R-CNN achieved a detection accuracy of 94.9%, whereas SVM achieved only 67.2%. In addition, the precision and recall across all classes exceeded 92% and 90% at confidence levels of 0.85 and 0.72, respectively.
Table 5 lists the comparison of the test results of the SVM and Fast R-CNN.
Field surveys were conducted in sections with rail damage, and rail samples were extracted from these locations. Laboratory tests were performed to analyze the characteristics of internal rail damage. A training dataset was constructed based on the field images and SEM analysis results, and the damage types were categorized into two classes: headcheck and spalling. Further, using this dataset, a deep learning-based diagnostic model was developed by applying a Fast R-CNN algorithm for model training.
As shown in Table 6, a defect class within the top k search results was defined as a correct match if it included both the actual defect label of the input image and the correct defect class among the top k search results. In this study, detection performance was evaluated based on mAP during the object detection phase, and search performance was evaluated based on Top-k accuracy during the application phase, thereby comprehensively analyzing the overall system performance.
Rail damage detection was achieved through model parameter tuning, dataset construction, and model training. An experimental analysis confirmed that the developed model could detect rail damage and effectively identify the damage types. This study developed a deep learning model using Fast R-CNN based on image data collected through field surveys and laboratory testing and implemented it in a diagnostic application.
The proposed model shifts rail damage diagnostics from labor-driven qualitative assessments toward training data-based prediction and diagnosis, with the potential for the systematic management of diagnostic histories. This approach can enhance public safety, advance safety-focused technologies, and serve as a preventive diagnostic system that can address expensive repairs, reinforcements, derailments, and fracture accidents. Compared to traditional inspection and maintenance methods (e.g., labor-intensive visual inspections), this approach can reduce maintenance costs while improving the practical value of diagnostic data. By applying a deep learning-based analytical technique to rail damage image data, this study also minimizes the potential for human error inherent in visual inspections and provides more reliable information to managers and inspectors. Consequently, the accuracy of rail damage diagnostics can be improved, and risk prediction based on damage progression can help prevent major accidents and reduce social costs.
The findings of this study indicate that the systematic big data archiving of rail damage conditions and inspection results can be achieved. This framework is expected to enable the scientific tracking of track damage histories and significantly improve the reliability of future track diagnostics.

5. Rail Damage Diagnostic Application

5.1. Overview

Railway rails undergo progressive deterioration because of an increase in their service life. This steadily raises maintenance costs, not only to ensure train operation safety but also to sustain usability and performance. The recently established Detailed Guidelines for the Performance Evaluation of Track Facilities provide the essential procedures and requirements for conducting track performance assessments. However, rail damage diagnosis and grading primarily employ visual inspection, which inevitably relies on subjective judgments of the inspector, making it a qualitative evaluation method. Further, the safety performance indicators currently used to assess rail damage and assign condition grades depend largely on the visual inspection conducted by the inspector, making subjective judgment unavoidable.
To overcome these limitations, this study applied an ANN-based deep learning model for object detection and segmentation to effectively extract crack images. A learning model based on deep neural networks can help address overfitting issues in ANNs and has demonstrated outstanding performance and versatility in processing unstructured data in computer vision, speech recognition, natural language processing, and image analysis [25]. Thus far, various models have been developed for different application domains, including CNN. Among these, CNNs are effective for image-related tasks. The Fast R-CNN model used in this study can accurately recognize and analyze complex image data such as crack images, and it has been widely applied in related research fields.
Fast R-CNN is a deep learning model that specializes in solving image recognition problems in computer vision. It was trained through supervised learning, and the parameters of the CNN were automatically adjusted according to the training data. Fast R-CNN employs convolutional structures for extracting features from images, which are widely used in image recognition and various feature-extraction fields such as signal processing. Convolutional structures effectively extract high-level features from images that are essential for handling complex image recognition tasks. This structure enables the Fast R-CNN to provide accurate and efficient image classification and object detection and play a vital role in a wide range of computer vision applications.
The model architecture includes two primary components:
  • Convolutional layers, which extract features from raw pixel data and identify abstract and high-level characteristics. These layers process localized regions in the image and aggregate them to capture the overall features of the image.
  • Extracted features, which pass through fully connected layers that classify the images based on learned patterns and relationships. This enables the network to effectively classify images by learning complex patterns.
In this study, a dataset was classified and applied according to the rail damage criteria specified in the Detailed Guidelines for Track Facility Performance Evaluation to develop a rail damage diagnostic application applicable to real inspection environments. In addition, machine-learning algorithms were designed to effectively identify the point at which rail damage reaches the evaluation threshold.
Unlike traditional visual inspection methods that are susceptible to human error owing to subjective judgment, the proposed approach provides more quantitative and reliable data. Consequently, railway managers and inspectors can obtain more accurate and meaningful information for diagnosing rail damage, improving diagnostic precision and enhancing decision making in maintenance planning.

5.2. Development of a Rail Damage Diagnosis Application

A client program was developed to enable inspectors (general users) to detect railway rail damage, along with a server program that deploys the AI model on the AWS.
In this rail damage diagnostic application, users can conveniently capture and edit images of the rail cracks observed in the field. Subsequently, the captured images are transmitted to the server, where the AI model analyzes them to diagnose the type and severity of damage. Two user roles are implemented in the client web program: inspector and administrator. The inspectors can review a list of rail crack images captured and uploaded via the application, while administrators can manage user accounts and oversee the system. Further, the administrators have the capability to retrain the AI model using the uploaded rail crack images, continuously improving the model performance. In addition, administrators can select and deploy the most appropriate AI model for a service, making it available to end users. A mobile application was developed to diagnose rail damages using smart devices, enabling users to capture, edit, and transmit images of damaged rails to the server. Using a deep learning model for rail damage image analysis deployed on a server, inspectors can predict both the type and severity of rail damage. By simply capturing an image, the system assesses the extent of rail damage, including cracks propagating into the rail interior. When inspectors use the application, the entry screen provides a preliminary overview of the damage severity. To support diagnostic accuracy, the application is designed to present tabulated information that visualizes the damage scale according to the rail damage types.
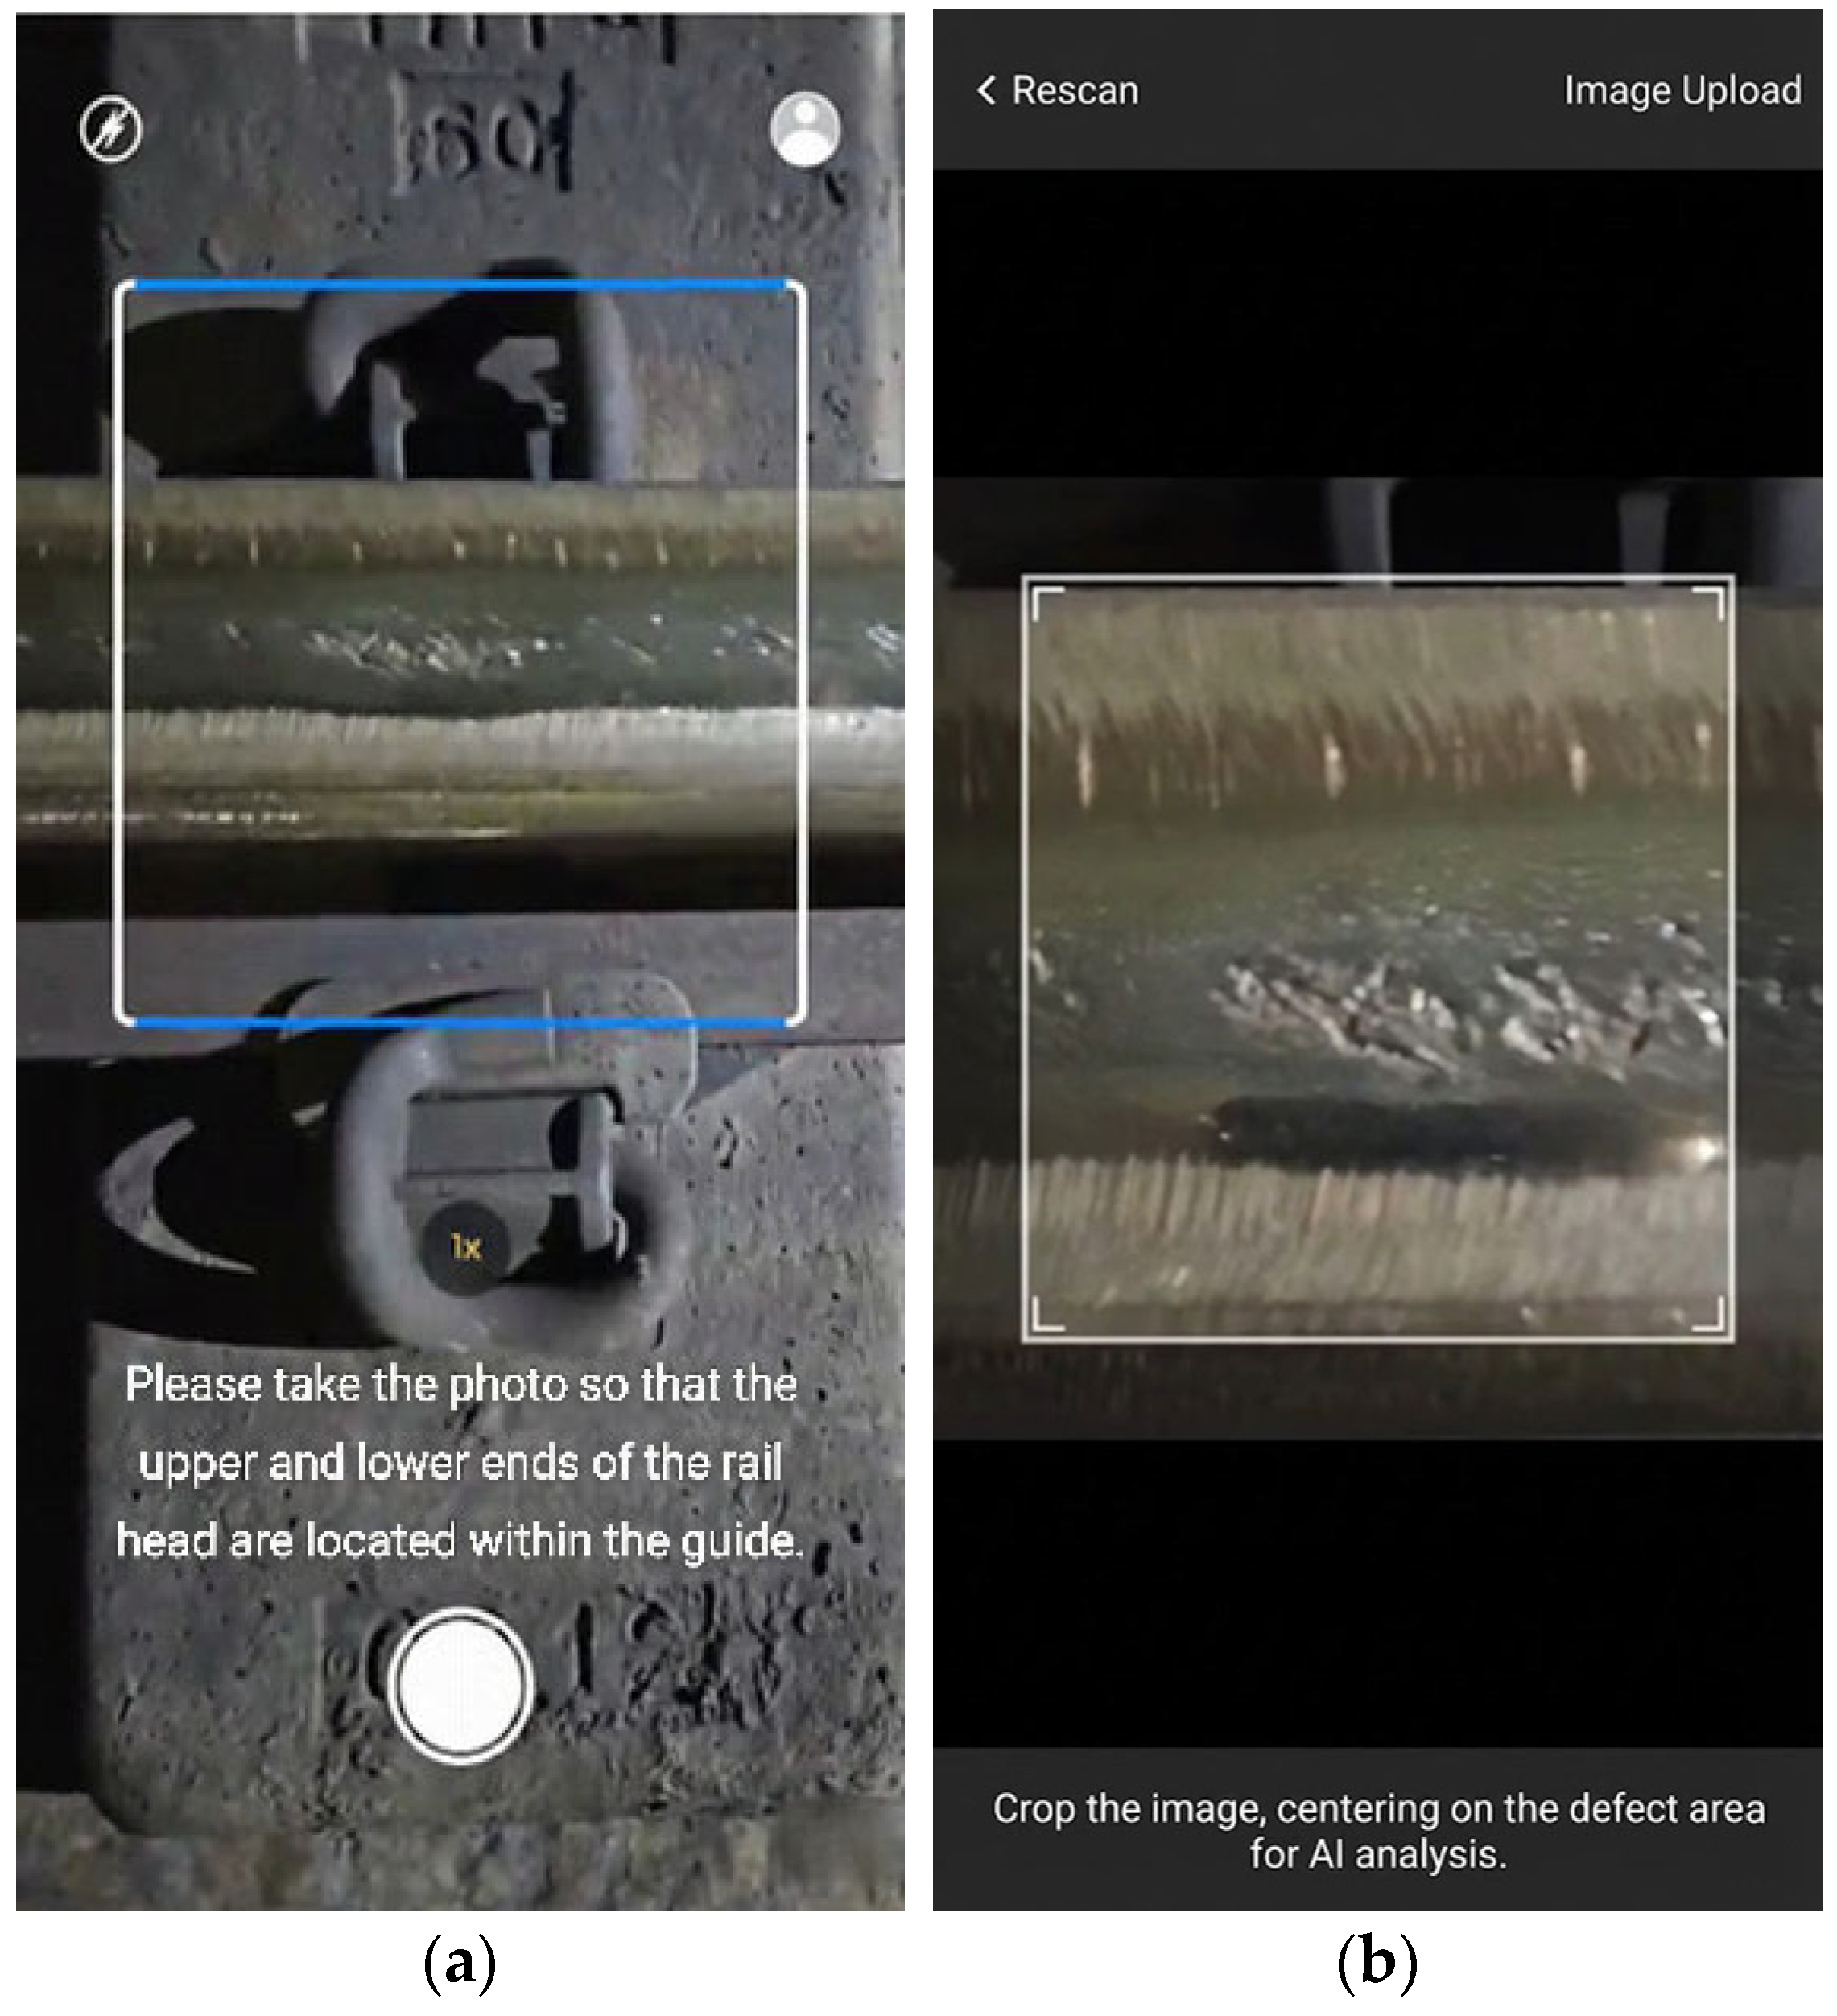
When a user initiates image capture through the application, the system minimizes the distortion of the damage size that can occur when inspectors capture photographs from different angles in the field, as indicated in Figure 22. To ensure a standardized evaluation, the system incorporates a calibration feature to normalize rail dimensions, enabling a quantitative assessment of the damage scale. During image capture, the upper and lower edges of the railhead need to be positioned within predefined guidelines, which automatically trigger the shutter, ensuring the accurate imaging of the damaged area.
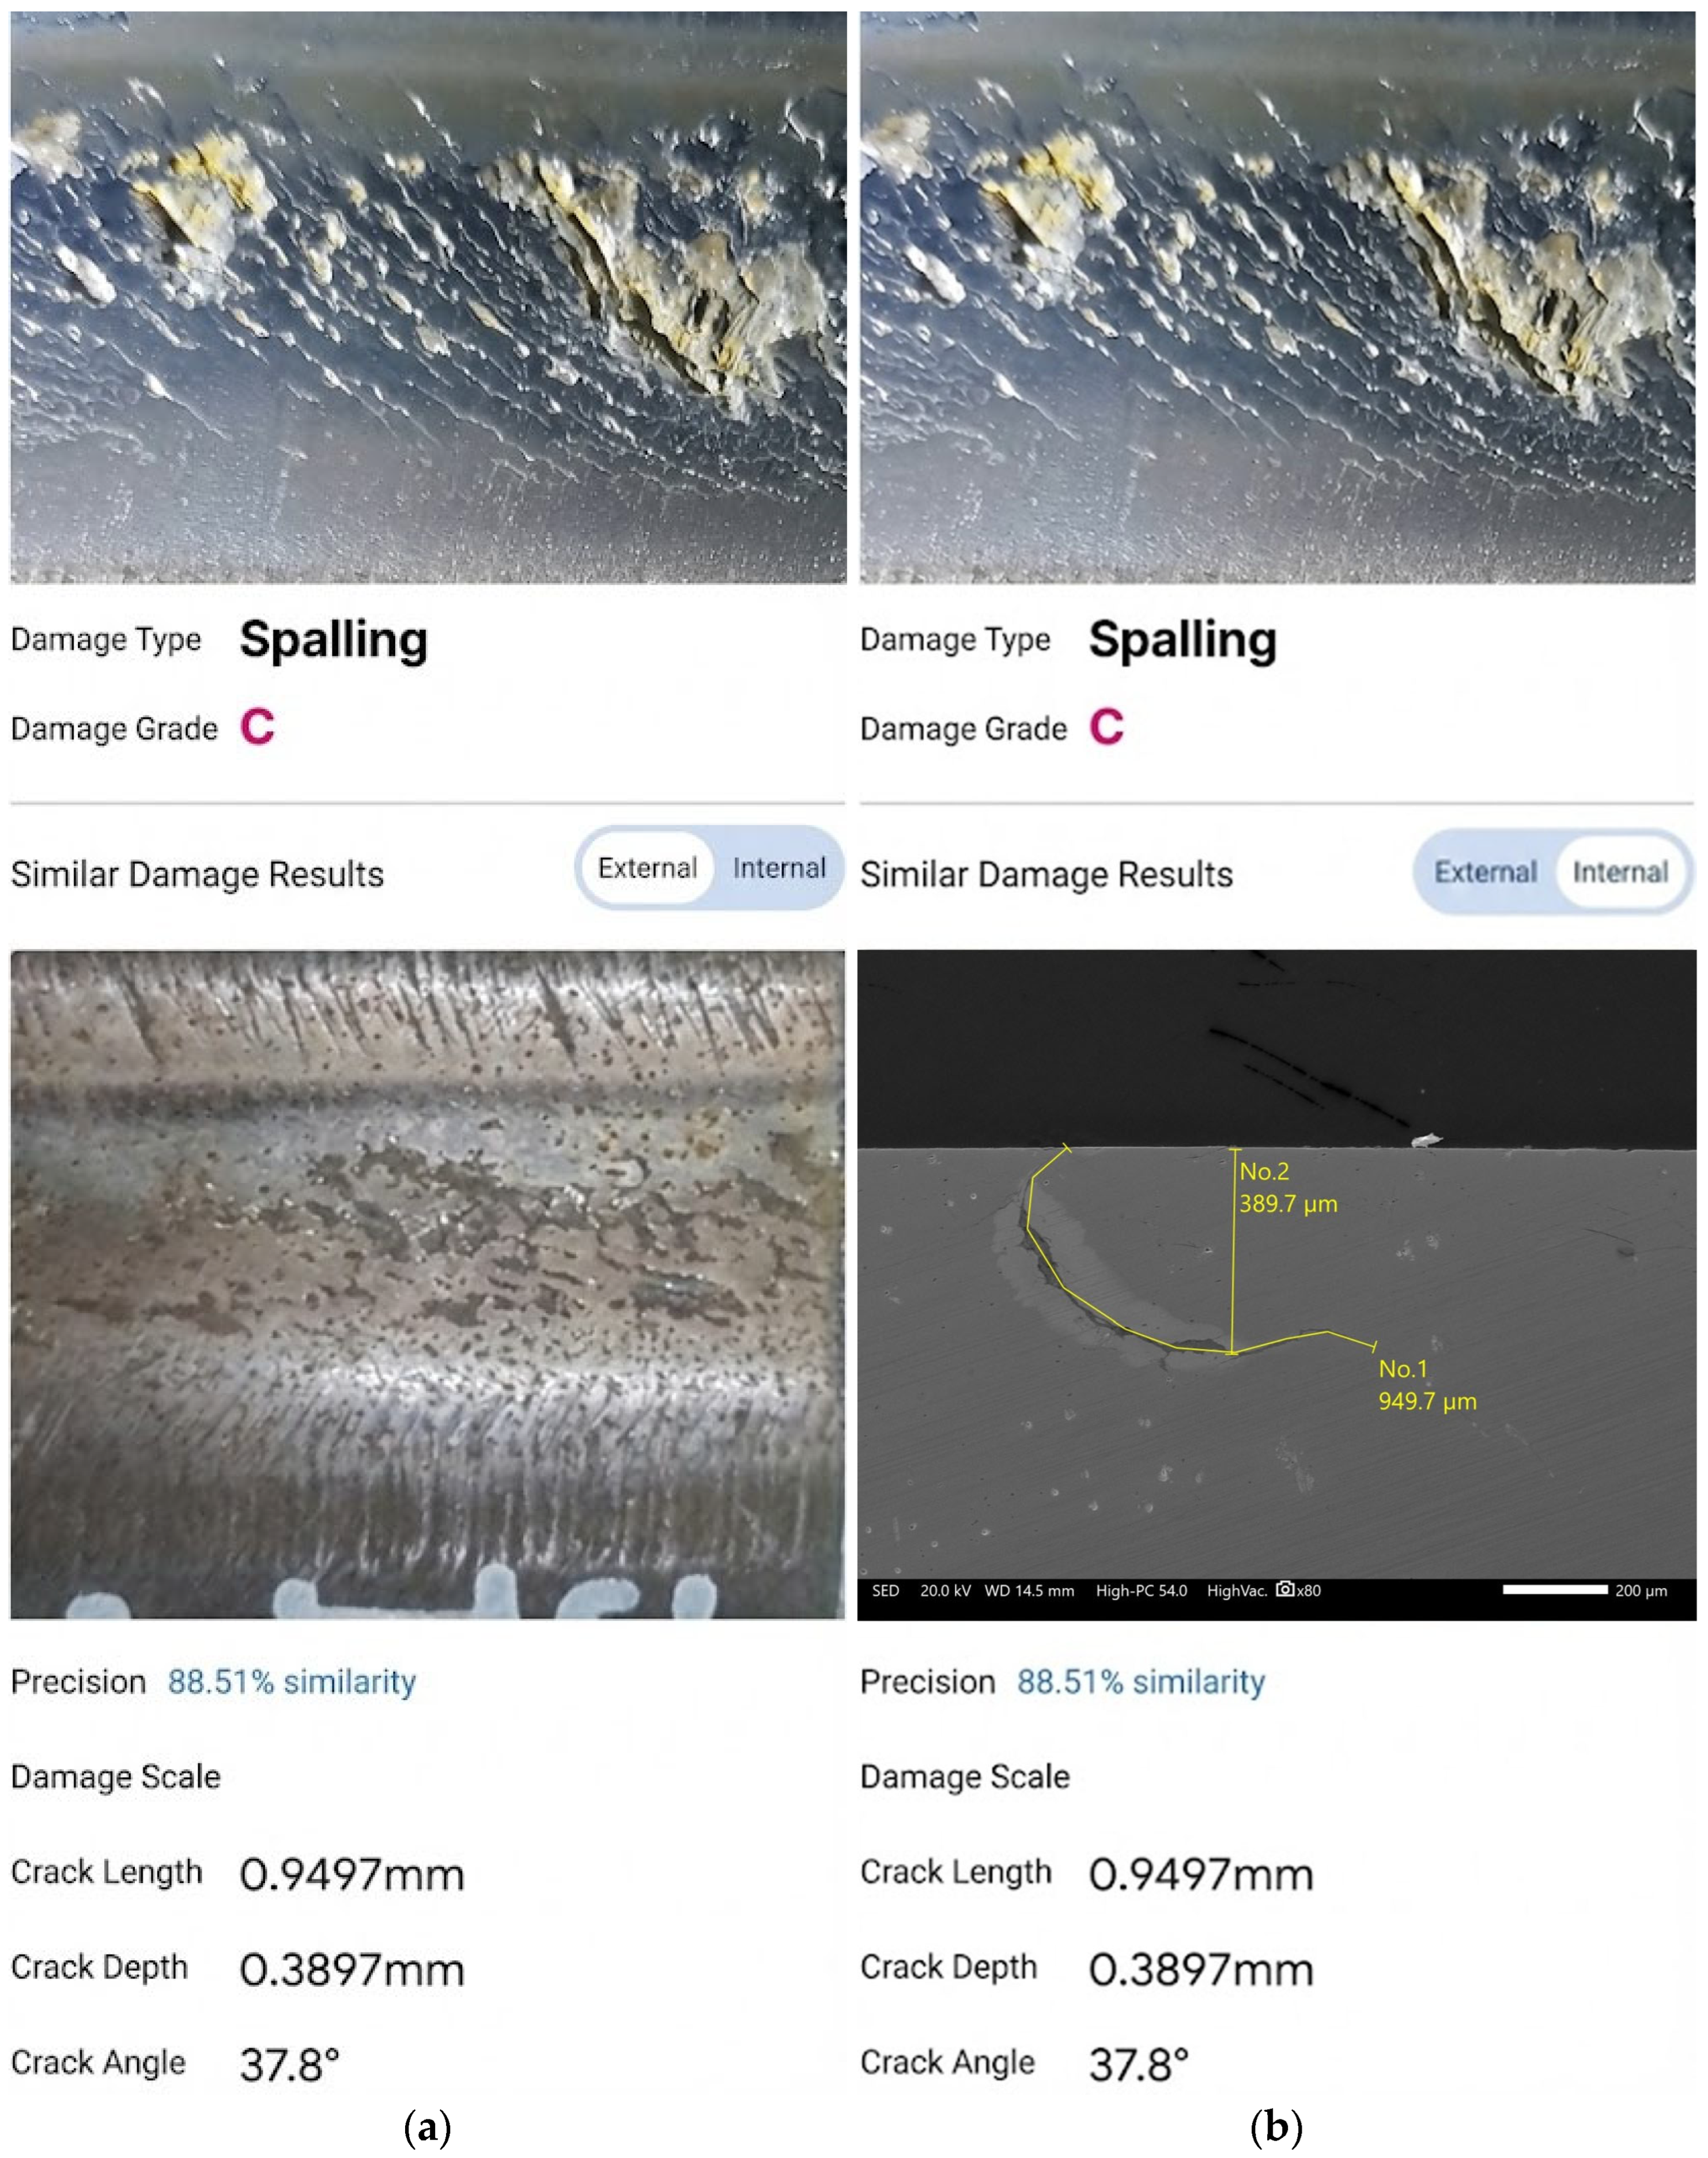
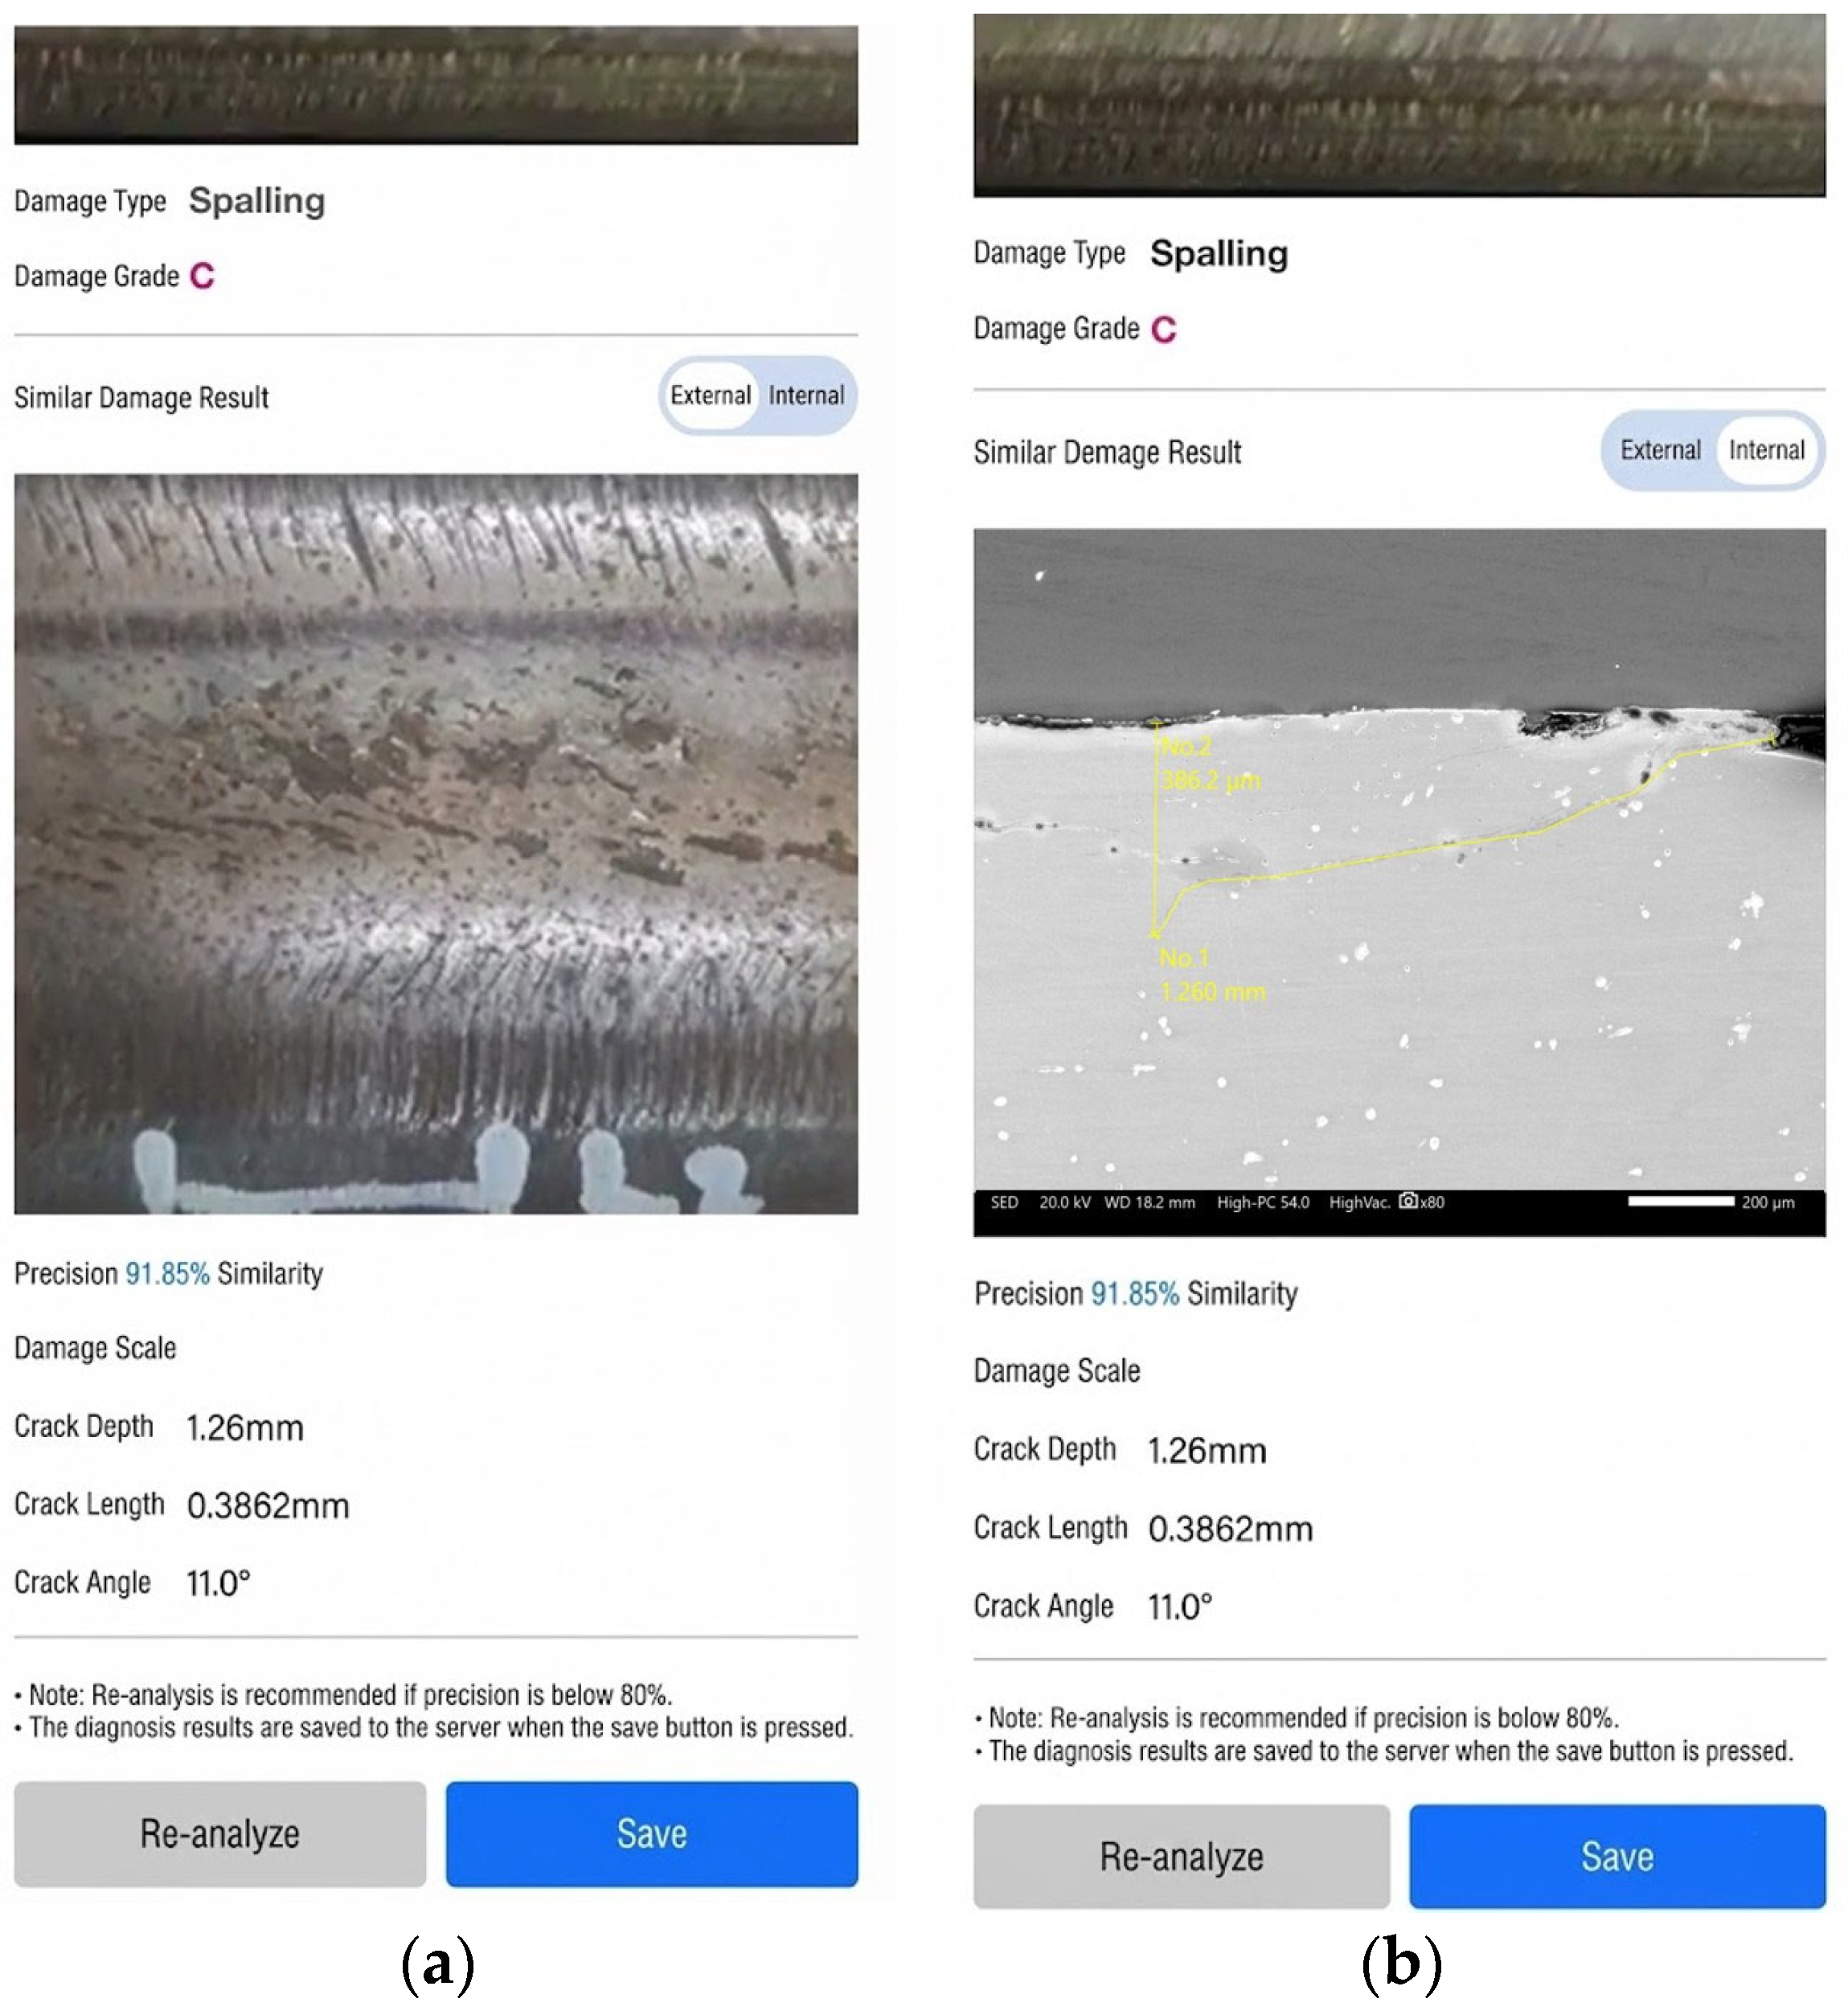
As shown in Figure 23, the captured rail damage images are analyzed using the deep learning model, which provides a confidence score based on comparison with the training dataset. The diagnostic results classify the damage according to type and severity. For external damage, the system presents two outputs (damage type and damage grade), allowing for a systematic and reliable evaluation.
As illustrated in Figure 23, the internal damage caused by rail surface defects is displayed in a manner similar to that in the program designed to provide quantitative information on the extent of internal defects by matching them with the training dataset. This enables a more accurate evaluation of the results. In cases where the diagnostic confidence is low, a recapture function is provided to allow users to retake the image and obtain more reliable results for reference. The damage grading system proposed in this study is defined in accordance with the Detailed Guidelines for the Performance Evaluation of Track Facilities. For internal defects, the program quantitatively presents key parameters such as crack length, depth, and angle, enabling a systematic and objective assessment of damage severity. The diagnostic application operates on a matching-based retrieval framework rather than a direct regression-based prediction of crack dimensions. Specifically, the internal crack parameters including length ( L ), depth ( D ), and angle ( θ ) are derived by identifying the most statistically similar surface-to-internal data pair from the cloud-based repository of 2500 SEM-validated samples. Once a field-captured image is processed, the system retrieves and assigns the metadata of the optimal match to provide the inspector with a reliable estimation based on proven physical evidence. To evaluate the effectiveness of this retrieval-based diagnosis, the system’s performance was measured using Accuracy, defined as the proportion of correctly identified damage types and matched characteristics out of the total test samples. This metric serves as a comprehensive indicator of the application’s final decision-making reliability in field environments.

5.3. Field Applicability of the Rail Damage Diagnosis Application

5.3.1. Rail Damage Diagnostic Application Reliability Assessment

A survey was conducted among 80 railway sector engineers and experts to verify the reliability and accuracy of the smartphone-based rail-damage diagnostic application developed in this study. The respondents included 40 junior engineers and 40 PhD experts. Each participant visually inspected the same rail surface damage images, and the results were compared with diagnostic outputs generated by the application to evaluate accuracy. The differences in diagnostic accuracy were analyzed according to the level of expertise of the engineers and experts. This evaluation was used to quantitatively assess the practical effectiveness of the rail-damage diagnostic application.
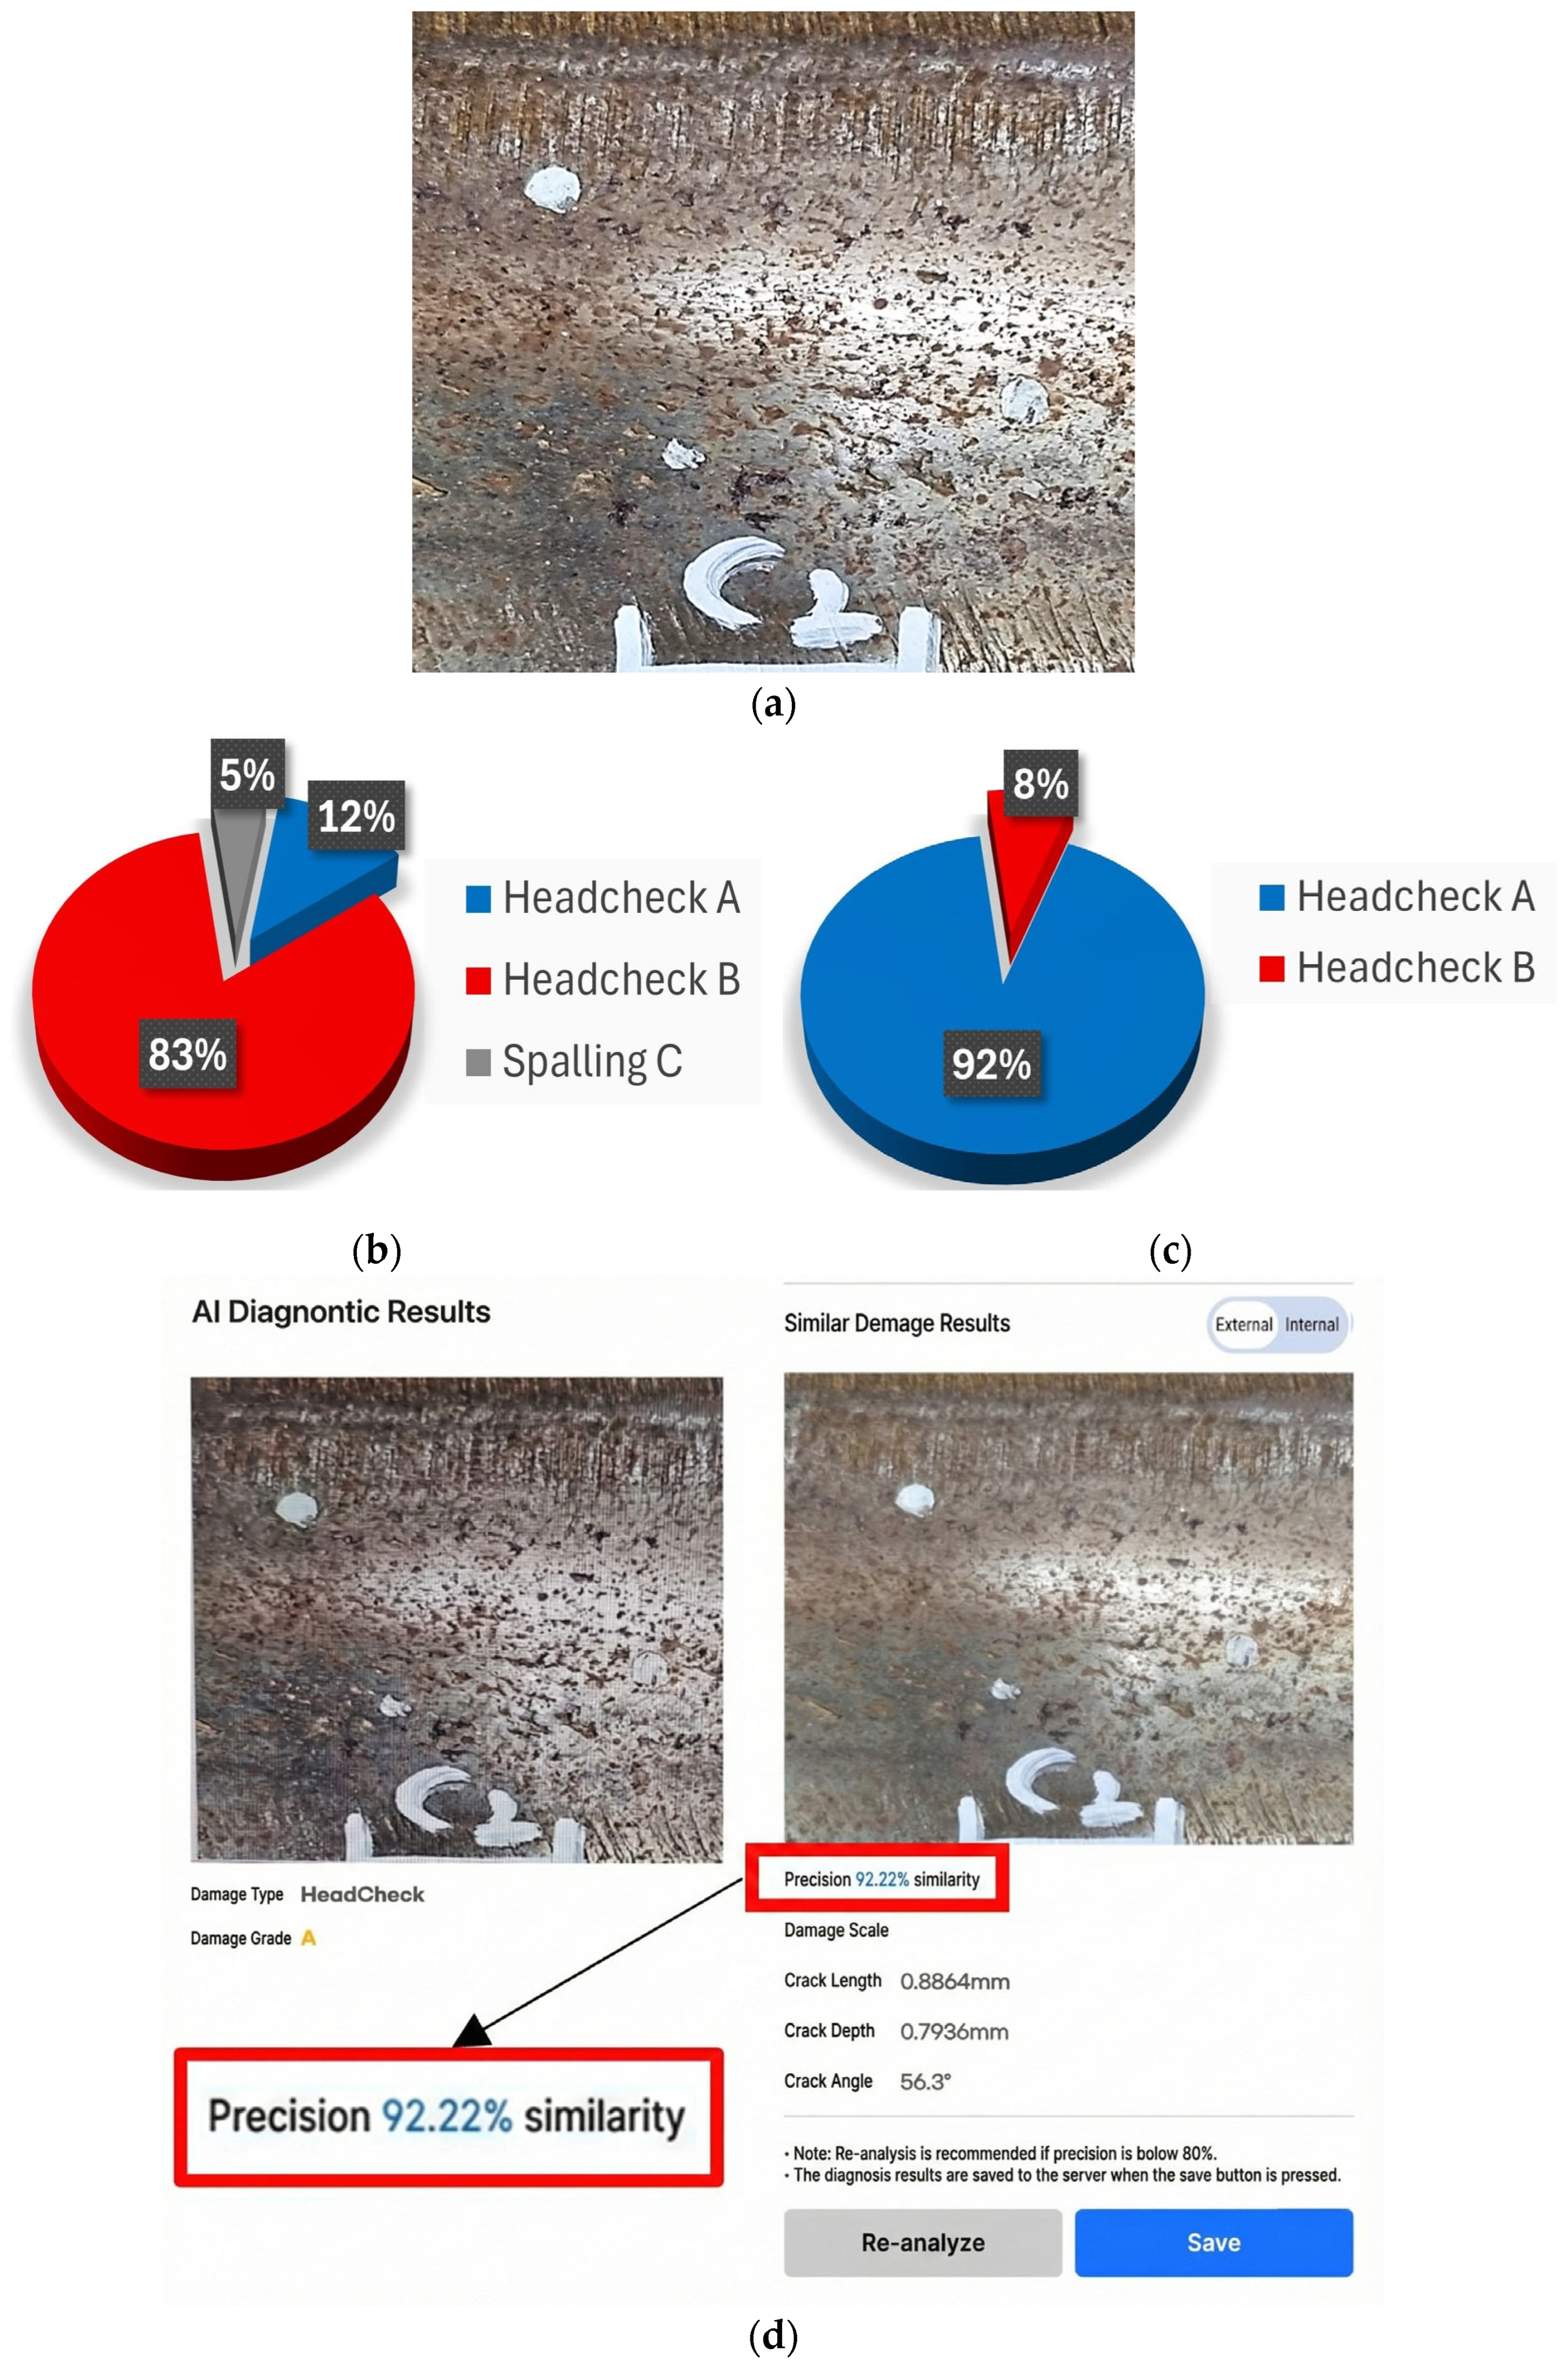
As shown in Figure 24a, when junior engineers were asked to diagnose a rail surface damage image corresponding to Headcheck A, the results indicated that 12% identified it correctly, while 83% diagnosed it as Headcheck B, and 5% as Spalling C (Figure 24b). Thus, ~88% of the diagnoses by junior engineers involved human error, with a tendency to underestimate the severity of rail surface damage. When the same image was presented to experts holding doctoral degrees in railway engineering, ~92% correctly identified it as Headcheck A and 8% as Headcheck B (Figure 24c). The rail damage diagnostic application developed in this study achieved an accuracy exceeding 92%, correctly diagnosing the defect as Headcheck A (Figure 24d).
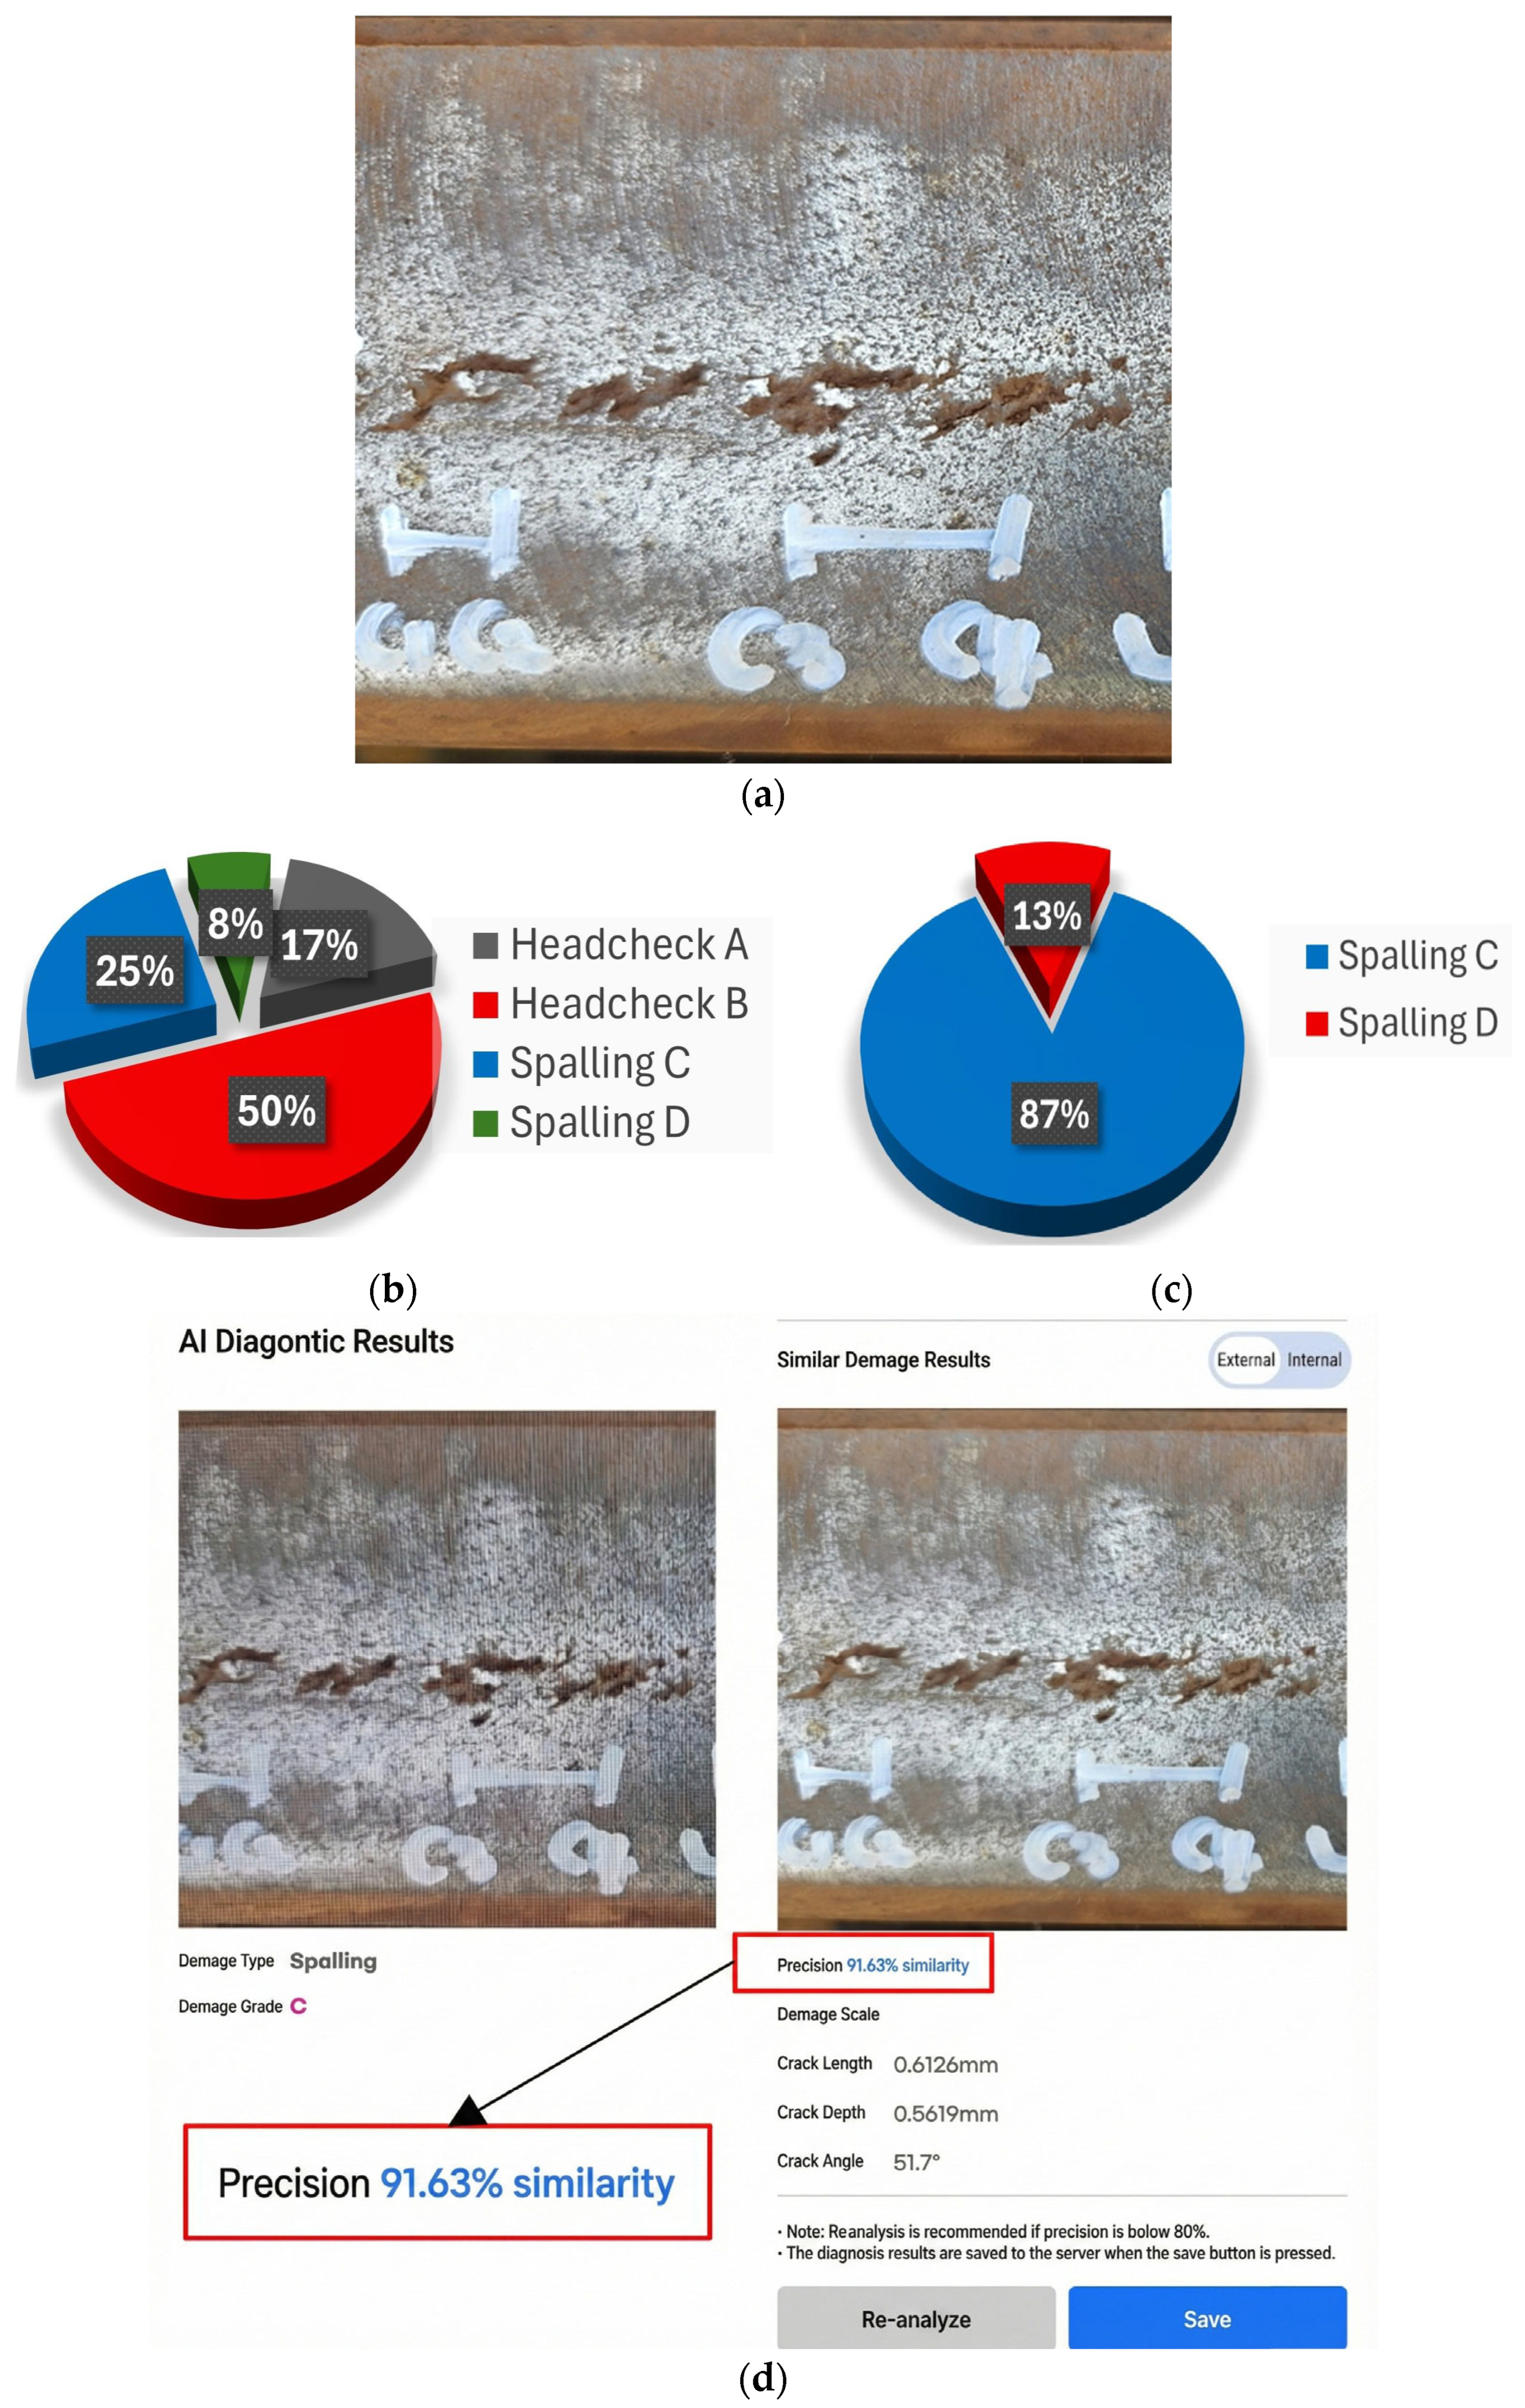
Similarly, when the junior engineers were asked to diagnose a rail surface damage image corresponding to Spalling C (Figure 25a), only 25% correctly identified it as Spalling C. The remaining diagnoses included 8% as Headcheck A, 50% as Headcheck B, and 17% as Spalling D (Figure 25b). Thus, ~75% of the evaluations by junior engineers contained human error, again suggesting a tendency to underestimate defect severity. Conversely, when experts diagnosed the same image, approximately 87% correctly identified it as Spalling C and 13% as Spalling D (Figure 25c). The diagnostic application achieved an accuracy exceeding 91%, correctly classifying the defect as Spalling C (Figure 25d).
These results confirm that the proposed rail damage diagnostic application can provide objective, engineering-based diagnostic results that are not directly influenced by qualitative factors such as the level of expertise of the inspector. In addition, the system can contribute to minimizing human errors during rail-damage inspection.

5.3.2. Field Applicability Evaluation

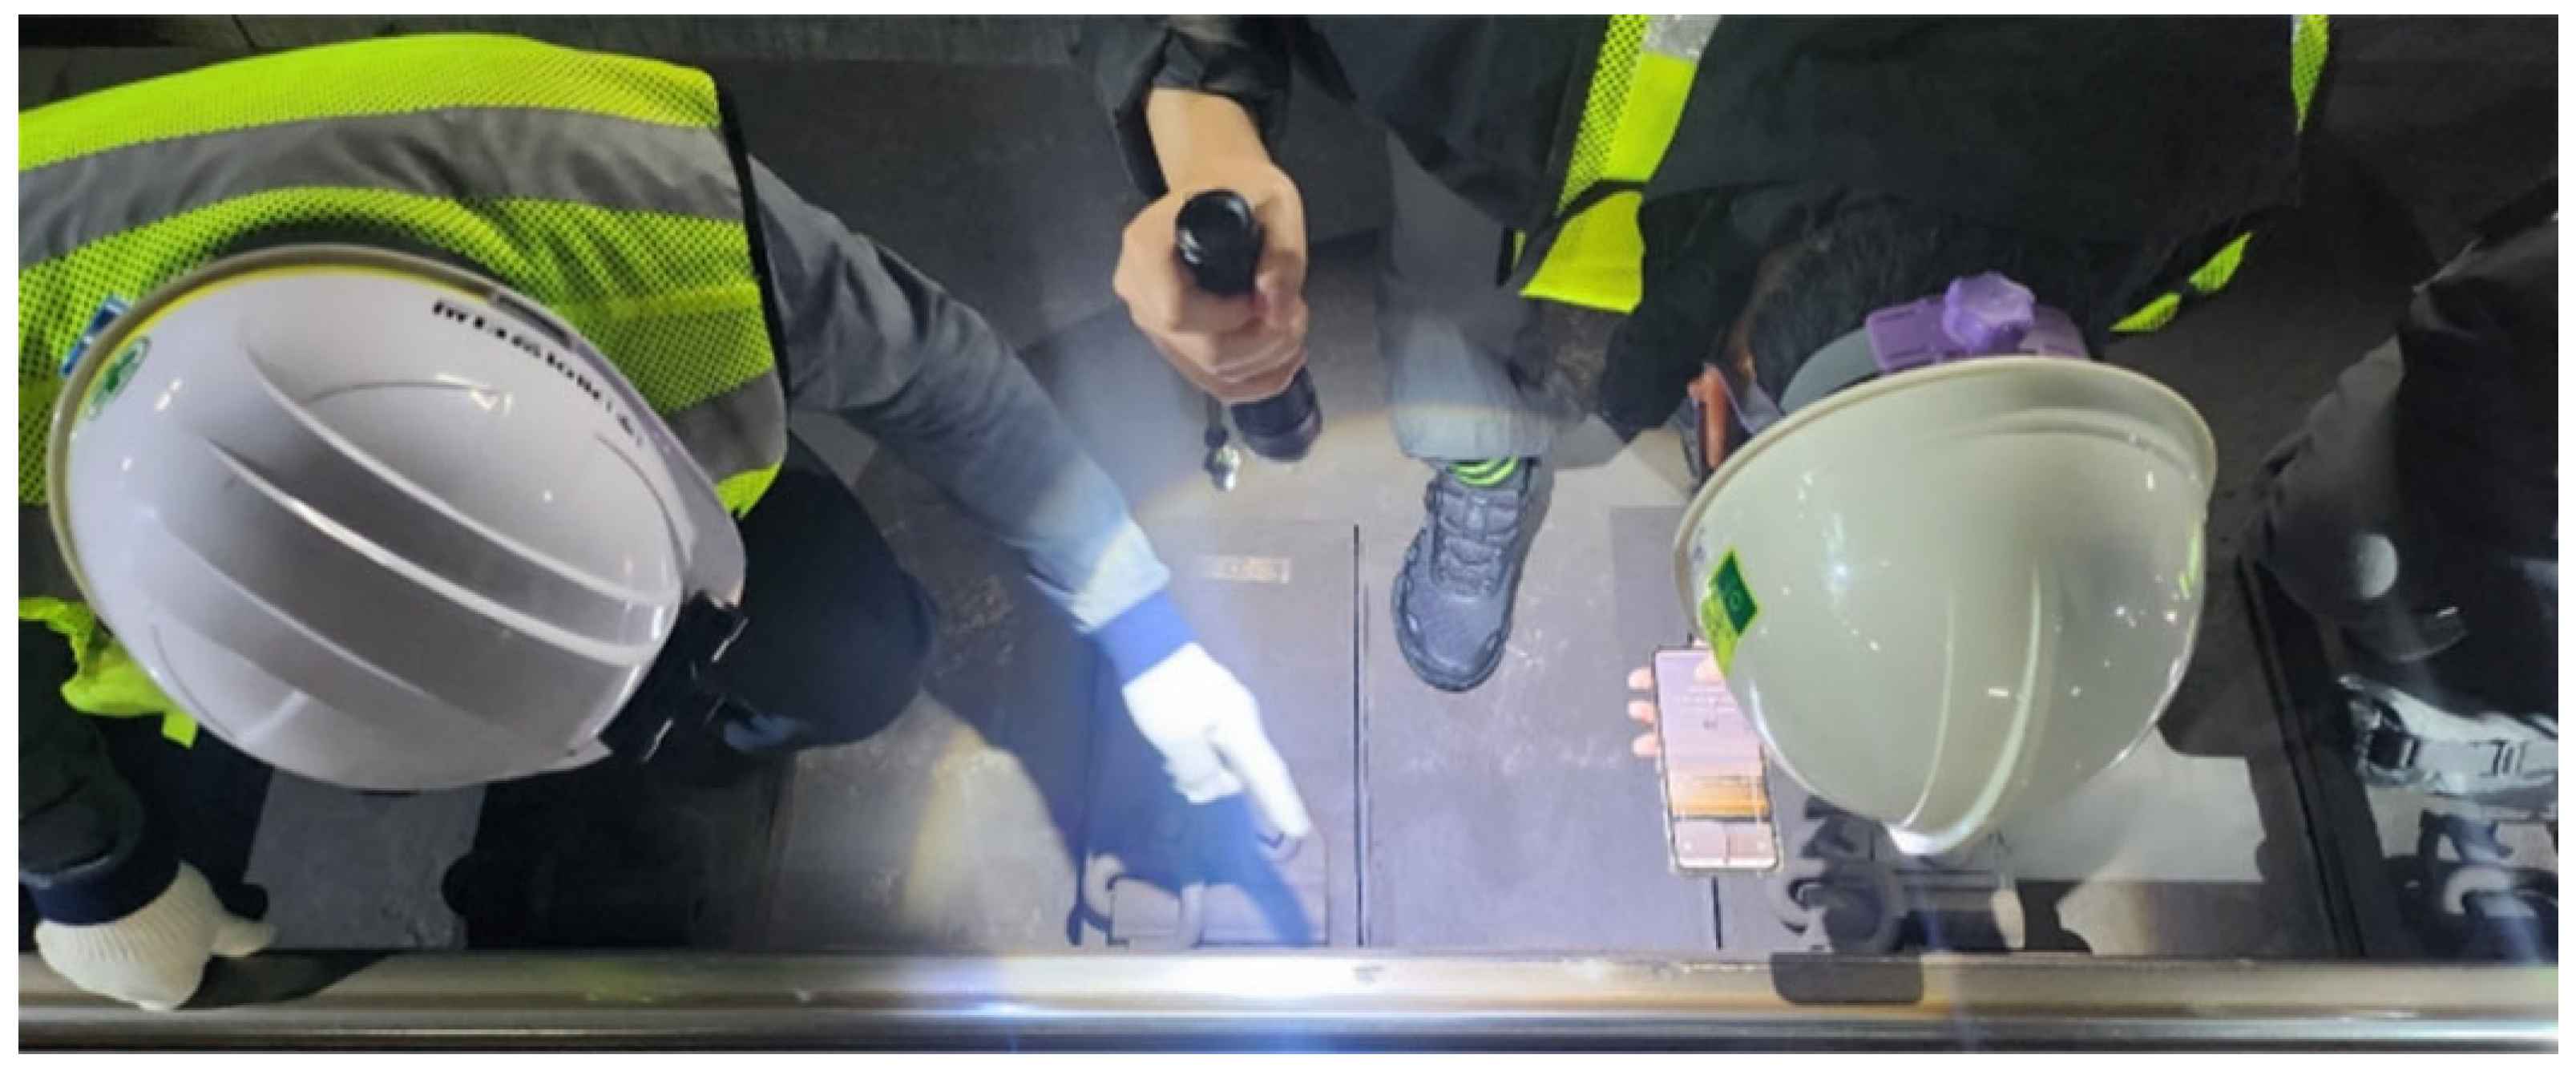
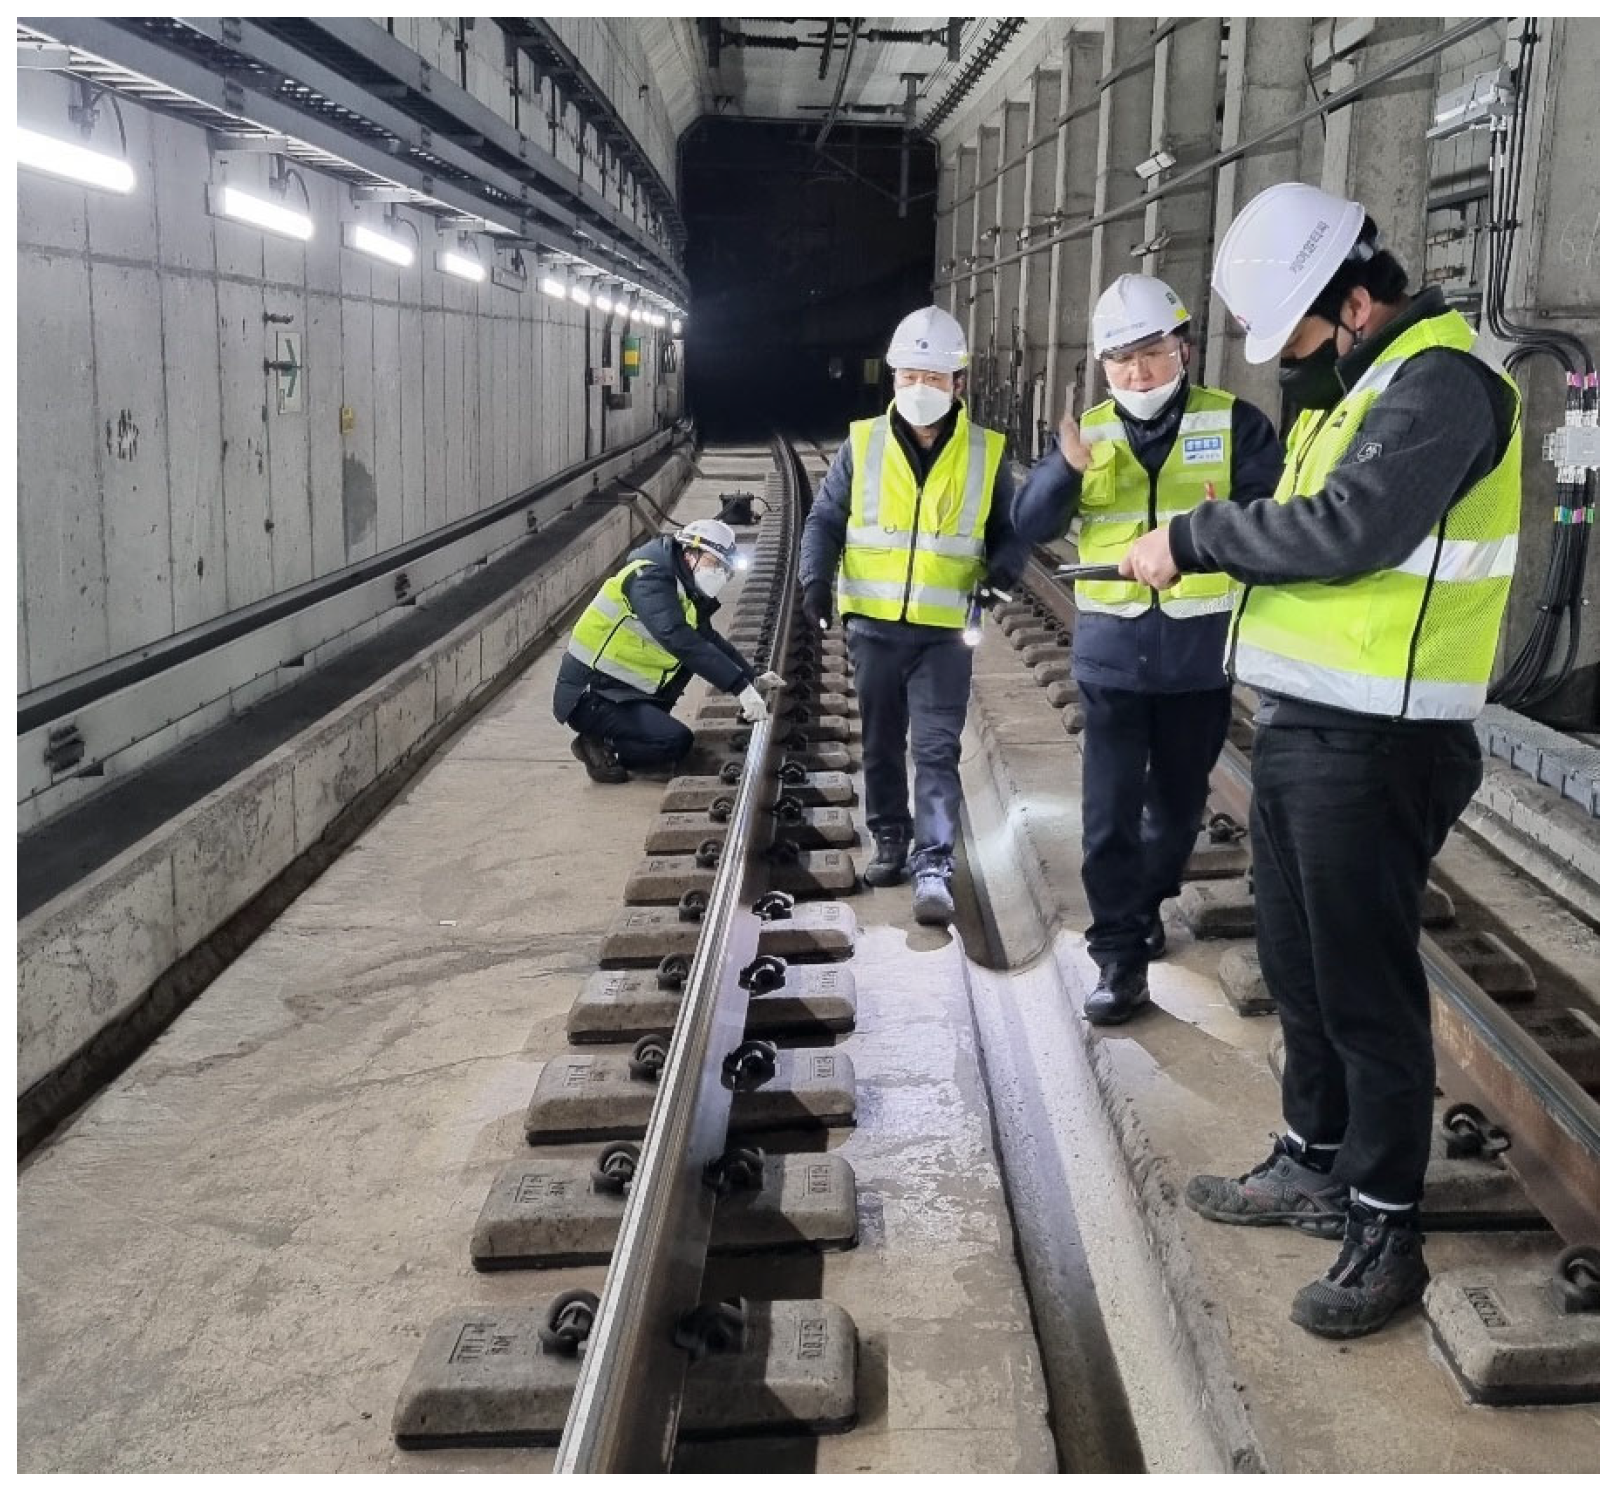
In this study, field validation was conducted by installing a diagnostic application on three smartphones to perform a rail damage assessment. As shown in the field specifications in Figure 26 and Table 7, Field tests were conducted at locations identified as vulnerable to rail damage within a low-vibration track (LVT) system based on historical inspection records.

5.3.3. Diagnostic Process Using the Rail Diagnostic Application

The inspectors capture images of the rail surface using the application. These images are then analyzed by the deep learning model to determine the extent of damage. The system visualizes and quantifies the severity of rail damage by presenting the damage scale in a tabular form according to the different damage types.
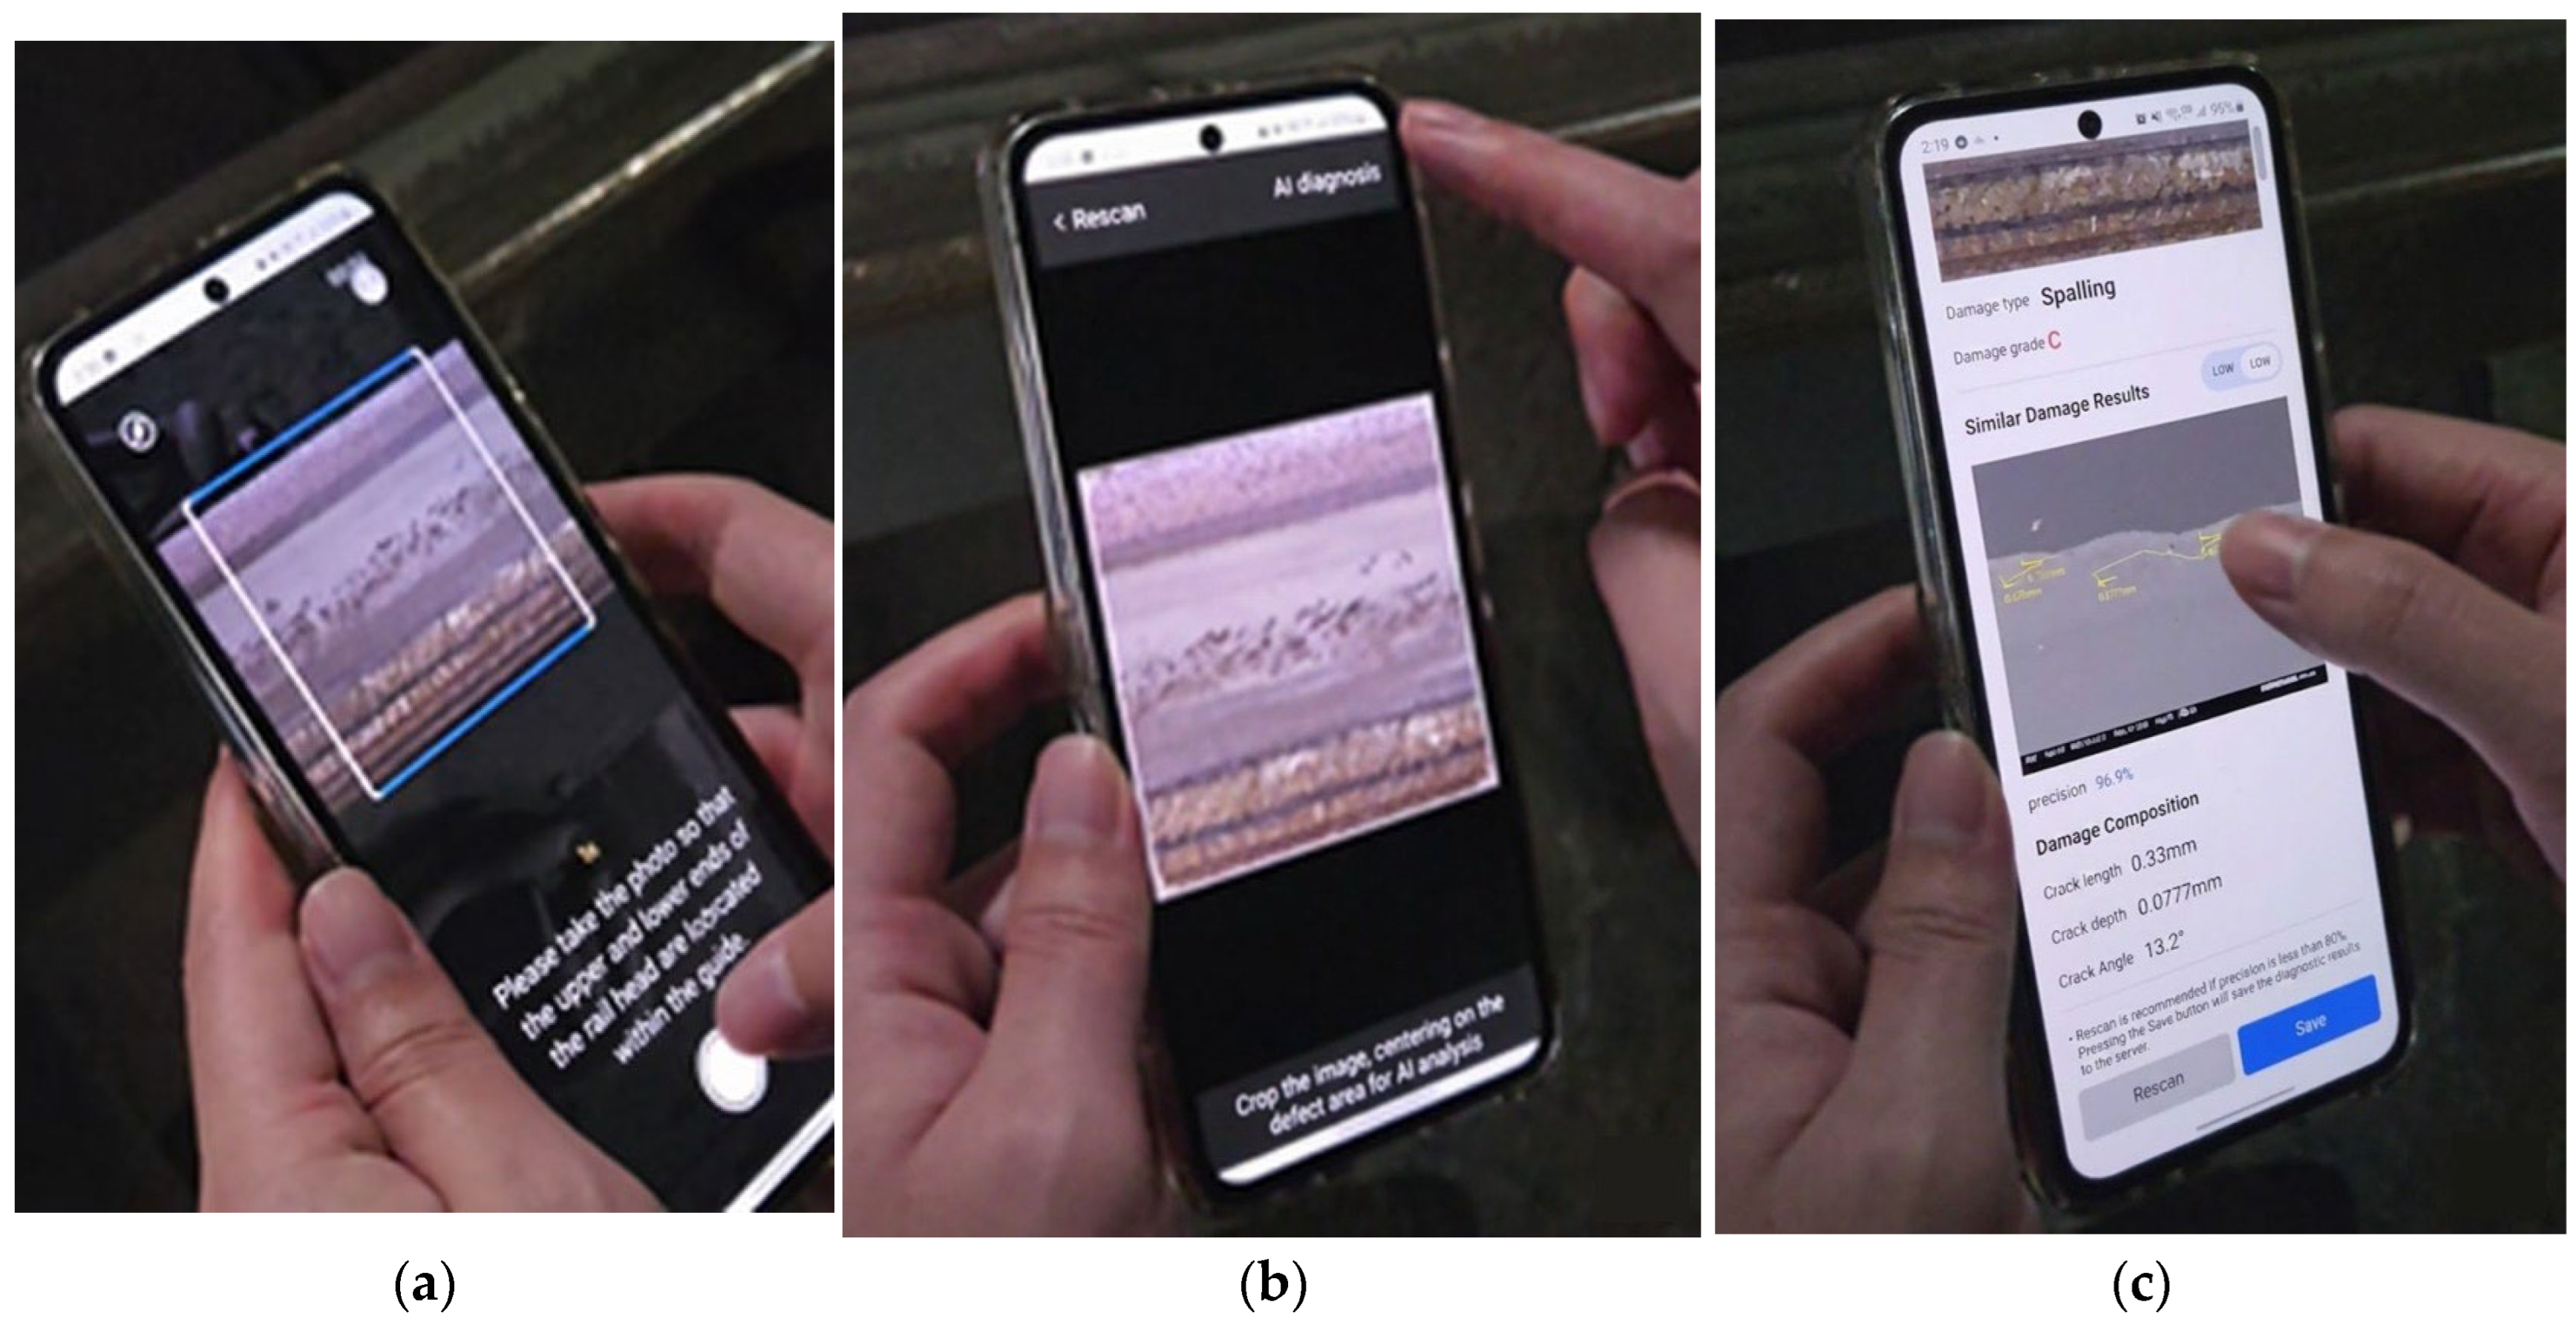
When the user initiates image capture using the rail diagnostic application, the system ensures accurate imaging of the damaged rail area. As shown in Figure 27a, image capture is automatically triggered when the upper and lower edges of the rail head are properly aligned within the on-screen guidelines. After the user completes the image capture (Figure 27b), a cropping function enables the user to exclude unnecessary areas from the image before proceeding to the next diagnostic step and uploading the image to the server.
The system provides inspectors with similar reference images from the database that correspond to the captured rail damage. As illustrated in Figure 27c, the internal damage is quantitatively presented in terms of crack length, depth, and angle. If the damage type and associated metadata from the captured image match those stored on the server, the inspector can finalize the diagnosis by selecting the save option. However, if inconsistencies are detected between the captured data and the existing dataset, the system allows the user to perform re-diagnosis through the recapture function, ensuring accurate and reliable diagnostic results.

5.3.4. Rail Damage Diagnosis Results

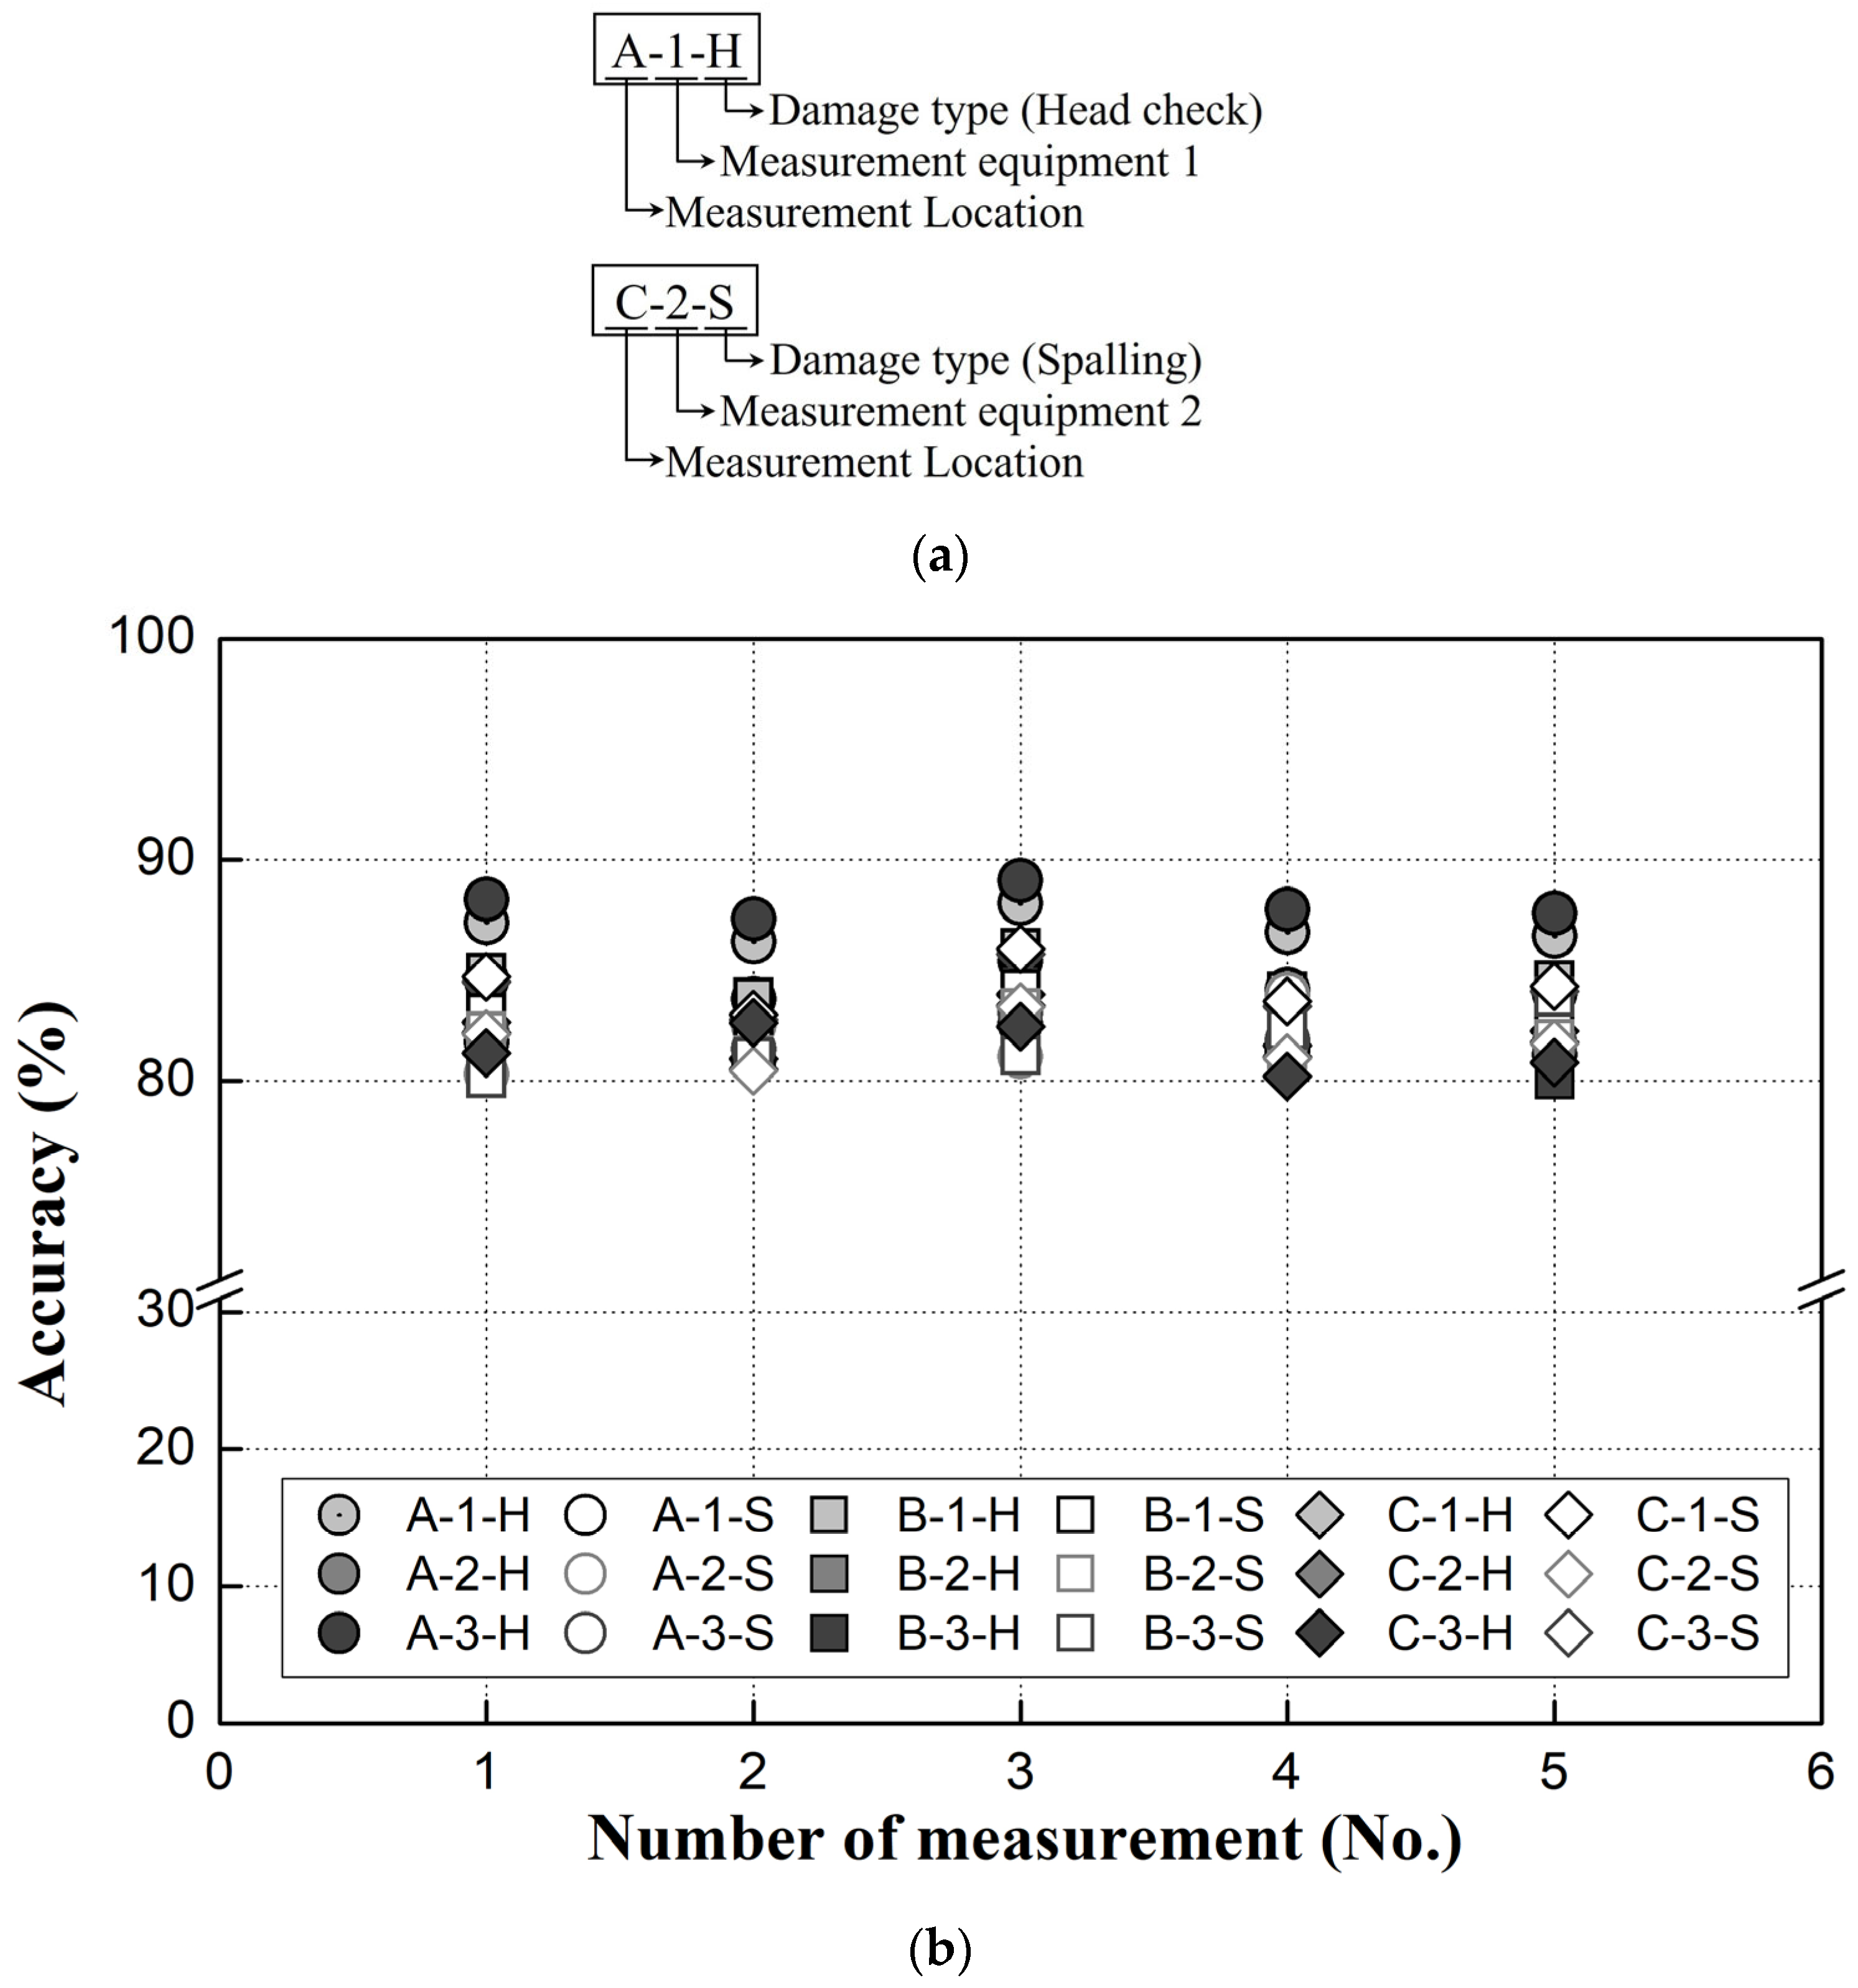
Field verification was performed by installing the diagnostic application on three smartphones to conduct rail damage assessments. As shown in Figure 28, the consistency of the diagnostic results was analyzed, and the validity of the diagnostic algorithm was evaluated by comparing the similarity between the results obtained from field testing and the pretrained dataset, assessing both its accuracy and field applicability.
For the field validation of the rail damage diagnostic application, the measurements were conducted at sites where rail damage had occurred. The rail damage was assessed using the diagnostic application installed on-site. Three smartphones were utilized to evaluate the rail damage at multiple measurement locations, enabling a comparative analysis of the diagnostic results across devices.
Considering the actual field conditions during railway track precision inspections and performance evaluations, where multiple personnel are required to assess rail damage, the study analyzed whether deviations in diagnostic results caused by inspector variability (i.e., human error) were within an acceptable range.
As shown in Figure 29, the standard deviation of the average diagnostic results across the measurement devices (smartphones) ranged from 0.2 to 1.5%, which suggests that discrepancies among devices were negligible. Thus, the field applicability and reliability of the developed rail damage diagnostic system were successfully verified.


6. Conclusions

This study presented a quantitative evaluation and diagnostic method for assessing rail damage using ANN-based image analysis. The proposed method achieved an objective and data-driven assessment of rail degradation by analyzing the internal crack characteristics of rails derived from surface damage images. The damaged rail specimens were collected from in-service lines, and SEM tests were conducted to analyze the correlation between the surface defects and internal cracks. Paired image datasets consisting of surface defect images and internal crack feature images (depth, length, and angle) were constructed for the neural network-based image analysis. The major findings of this study are summarized as follows:
  • Fast R-CNN achieved an average accuracy of 94.9%, demonstrating superior recognition performance compared to other algorithms and proving its effectiveness for rail damage detection.
  • The developed smartphone-based rail damage diagnostic application quantitatively identified and classified rail damage types and magnitudes. Field validation confirmed the practical applicability of the system, with the diagnostic results exhibiting a standard deviation of only 0.2–1.5%, indicating minimal variance because of human factors. The proposed diagnostic application enabled reliable and quantitative data management and analysis, improving inspection efficiency.
  • The proposed ANN-based image analysis technique was experimentally validated as an effective rail damage evaluation method. The model achieved consistent diagnostic results independent of inspector expertise, suggesting a significant reduction in human error during rail inspection. Compared to conventional visual inspections, the proposed method provides more objective results, enhances the reliability of rail damage assessments, and contributes to improved rail safety.
  • The accumulation and analysis of large-scale diagnostic history data is expected to facilitate big-data-based predictive maintenance strategies, supporting proactive rail management.
  • Conventional visual inspections of track structures depend heavily on the operator’s skill and are prone to human error. In contrast, the proposed application automatically determines the type, scale, and internal extent of the rail damage through deep learning analysis.
  • This work proposes a scientific management model that facilitates a paradigm shift from reactive to proactive/preventative maintenance.
Previous research used damaged rails to build training data and developed a fast deep learning R-CNN algorithm based on these data. In this study, a smartphone application utilizing the deep learning model developed in a previous study was developed and its field applicability was analyzed. Further research is required to improve the accuracy of the algorithm and ensure its versatility by utilizing images captured in a wider range of environments (day and night, above- and belowground, and varying lighting conditions).

Author Contributions

Conceptualization, J.-Y.C.; Methodology, J.-Y.C.; Software, J.-M.H.; Formal analysis, J.-Y.C. and J.-M.H.; Investigation, J.-M.H.; Data curation, J.-Y.C. and J.-M.H.; Writing—Original draft, J.-Y.C. and J.-M.H.; and Writing—Review and editing, J.-Y.C. and J.-M.H. All authors have read and agreed to the published version of the manuscript.

Funding

This research received no external funding.

Institutional Review Board Statement

Not applicable.

Data Availability Statement

The data are available from the corresponding author upon reasonable request, subject to restrictions related to infrastructure security and data sharing agreements.

Acknowledgments

This research was supported by the Regional Innovation System & Education(RISE) program through the Gyeongbuk RISE CENTER, funded by the Ministry of Education(MOE) and the Gyeongsangbuk-do, Republic of Korea (2025-RISE-15-113).

Conflicts of Interest

The authors declare no conflicts of interest.

Abbreviations

The following abbreviations are used in this manuscript:
ANNArtificial neural network
RCFRolling contact fatigue
SEMScanning electron microscopy
R-CNNRegional convolutional neural network
RPNRegion proposal network
ROIRegion of interest
TPTrue positive
TNTrue negative
FPFalse positive
FNFalse negative
SVMSupport vector machine
LVTLow-vibration track

References

  1. Ministry of Land, Infrastructure and Transport. Guidelines for Regular Inspection of Railway Facilities; Ministry of Land, Infrastructure and Transport: Sejong City, Republic of Korea, 2021.
  2. Korea National Railway. Detailed Guidelines on Performance Evaluation of Track Facilities; Korea National Railway: Daejeon, Republic of Korea, 2021. [Google Scholar]
  3. Choi, J.Y. Qualitative Analysis for Dynamic Behavior of Railway Ballasted Track. Ph.D. Thesis, Technical University of Berlin, Berlin, Germany, 2014. [Google Scholar]
  4. Choi, J.Y.; Park, D.R.; Chung, J.S.; Kim, S.H. Dynamic wheel-rail force-based track-irregularity evaluation for ballasted track on serviced railway by adjacent excavation. Appl. Sci. 2022, 12, 375. [Google Scholar] [CrossRef] [Scilit]
  5. Gren, D.; Ahlstrom, J. Fatigue Crack propagation on uniaxial loading of biaxially predeformed pearlitic rail steel. Metals 2023, 13, 1726. [Google Scholar] [CrossRef] [Scilit]
  6. Constantin-Ioan, B.; Corneliu, M.; George-Radu, P.; Lorenz, P.; Daniela-Lucia, C.; Cătălina, A.; Andreea-Carmen, B. Determining the causes that led to a railway rail breaking. In Railway Infrastructure Development for an Efficient & Green Transport; Railway PRO: Edinburgh, UK, 2011; pp. 5–9. [Google Scholar]
  7. Grassie, S.L. Rail corrugation: Characteristics, cause and treatments. Proc. Inst. Mech. Eng. Part F J. Rail Rapid Transit 2009, 223, 581–596. [Google Scholar] [CrossRef] [Scilit]
  8. Damme, S.; Nackenhorst, U.; Wetzel, A.; Zastrau, B.W. On the numerical analysis of the wheel-rail system in rolling contact. In System Dynamics and Long-Term Behaviour of Railway Vehicles, Track and Subgrade; Springer: Berlin/Heidelberg, Germany, 2003; Volume 6, pp. 155–174. [Google Scholar]
  9. Baeza, L.; Thompson, D.J.; Squicciarini, G.; Denia, F.D. Method for obtaining the wheel–rail contact location and its application to the normal problem calculation through ‘CONTACT’. Veh. Syst. Dyn. 2018, 56, 1734–1746. [Google Scholar] [CrossRef] [Scilit]
  10. Franklin, F.J.; Weeda, G.-J.; Kapoor, A.; Hiensch, E.J.M. Rolling contact fatigue and wear behaviour of the infrastar two-material rail. Wear 2005, 258, 1048–1054. [Google Scholar] [CrossRef] [Scilit]
  11. Conner, B.P. Contact Fatigue: Life Prediction and Palliatives. Ph.D. Thesis, Massachusetts Institute of Technology, Cambridge, MA, USA, 2016. [Google Scholar]
  12. Donzella, G.; Mazzù, A.; Petrogalli, C. Competition between wear and rolling contact fatigue at the wheel–rail interface: Some experimental evidence on rail steel. Proc. Inst. Mech. Eng. Part F J. Rail Rapid Transit 2009, 223, 31–44. [Google Scholar] [CrossRef] [Scilit]
  13. Steyn, E. Rail Surface Treatment Grinding and Milling—Competing or Complementary Technologies. Master’s Thesis, Chalmers University of Technology, Gothenburg, Sweden, 2019. [Google Scholar]
  14. Mihai, D.M. Efficient solutions for diminuting the rolling noise of trains. In Railway Infrastructure Development for an Efficient & Green Transport; Railway PRO: Edinburgh, UK, 2011; pp. 50–52. [Google Scholar]
  15. Popović, Z.; Lazarević, L.; Mićić, M.; Brajović, L. Critical analysis of RCF rail defects classification. Transp. Res. Procedia 2022, 63, 2550–2561. [Google Scholar] [CrossRef] [Scilit]
  16. Zerbst, U.; Lundén, R.; Edel, K.-O.; Smith, R.A. Introduction to the damage tolerance behaviour of railway rails—A review. Eng. Fract. Mech. 2009, 76, 2563–2601. [Google Scholar] [CrossRef] [Scilit]
  17. Ndao, B. Generation et Detection sans Contact des ondes de Rayleigh par Methodes Ultrasons-Laser et EMAT Mode Statique et Dynamic Application to the Detection of Surface Defects in the Rail Head. Ph.D. Thesis, University of Valenciennes and Hainaut-Cambresis, Valenciennes, France, 2016. [Google Scholar]

  18. Nielsen, J.C.O.; Johansson, A. Out-of-round railway wheels-a literature survey. Proc. Inst. Mech. Eng. Part F J. Rail Rapid Transit 2000, 214, 79–91. [Google Scholar] [CrossRef] [Scilit]
  19. Ishida, M.; Ban, T.; Iida, K.; Ishida, H.; Aoki, F. Effect of moderating friction of wheel/rail interface on vehicle/track dynamic behaviour. Wear 2008, 265, 1497–1503. [Google Scholar] [CrossRef] [Scilit]
  20. Kaewunruen, S. Monitoring structural deterioration of railway turnout systems via dynamic wheel/rail interaction. Case Stud. Nondestruct. Test. Eval. 2014, 1, 19–24. [Google Scholar] [CrossRef] [Scilit]
  21. Sresakoolchai, J.; Kaewunruen, S. Detection and severity evaluation of combined rail defects using deep learning. Vibration 2021, 4, 341–356. [Google Scholar] [CrossRef] [Scilit]
  22. Yang, Z.; Li, Z. Rail Infrastructure Resilience—Part 7 Wheel-Rail Dynamic Interaction; Elsevier: Amsterdam, The Netherlands, 2022; pp. 111–135. [Google Scholar] [CrossRef] [Scilit]
  23. Babu, S.R.; Jaskari, M.; Järvenpää, A.; Porter, D. The effect of hot-mounting on the microstructure of an as-quenched auto-tempered low-carbon martensitic steel. Metals 2019, 9, 550. [Google Scholar] [CrossRef] [Scilit]
  24. Dasgupta, A.; Wahed, A. Clinical Chemistry, Immunology and Laboratory Quality Control; Elsevier: Amsterdam, The Netherlands, 2014; pp. 47–66. [Google Scholar]
  25. Choi, J.Y.; Han, J.M. Deep learning (Fast R-CNN)-based evaluation of rail surface defects. Appl. Sci. 2024, 14, 1874. [Google Scholar] [CrossRef] [Scilit]
  26. Chen, N.; Li, B.; Wang, Y.; Ying, X.; Wang, L.; Zhang, C.; Guo, Y.; Li, M.; An, W. Motion and Appearance Decoupling Representation for Event Cameras. IEEE Trans. Image Process. 2025, 34, 5964–5977. [Google Scholar] [CrossRef] [Scilit] [PubMed]
  27. Zhang, K.; Luo, W.; Zhong, Y.; Ma, L.; Liu, W.; Li, H. Adversarial Spatio-Temporal Learning for Video Deblurring. IEEE Trans. Image Process. 2019, 28, 1037–1051. [Google Scholar] [CrossRef] [Scilit]
  28. Wen, Y.; Gao, T.; Li, Z.; Zhang, J.; Zhang, K.; Chen, T. All-in-One Weather-Degraded Image Restoration via Adaptive Degradation-Aware Self-Prompting Model. IEEE Trans. Multimed. 2025, 27, 3343–3355. [Google Scholar] [CrossRef] [Scilit]
  29. Zhang, J.; Chen, W. UAV-Based Quantitative Crack Measurement for Bridges Integrating Four-Point Laser Metric Calibration and Mamba Segmentation. Autom. Constr. 2026, 182, 106774. [Google Scholar] [CrossRef] [Scilit]
  30. Deng, C.; Li, Y.; Xiong, F.; Liu, H.; Li, X.; Zeng, Y. Detection of Rupture Damage Degree in Laminated Rubber Bearings Using a Piezoelectric-Based Active Sensing Method and Hybrid Machine Learning Algorithms. Struct. Control Health Monit. 2025, 2025, 6694610. [Google Scholar] [CrossRef] [Scilit]
  31. Perez, L.; Wang, J. The effectiveness of data augmentation in image classification using deep learning. arXiv 2017, arXiv:1712.04621. [Google Scholar] [CrossRef] [Scilit]
  32. Ross, G. Fast R-CNN. arXiv 2015, arXiv:1504.08083. [Google Scholar] [CrossRef] [Scilit]
  33. Jog, G.M.; Koch, C.; Golparvar-Fard, M.; Brilakis, I. Pothole Properties Measurement Through Visual 2D Recognition and 3D Reconstruction. In Proceedings of the International Conference on Computing in Civil Engineering, Clearwater Beach, FL, USA, 17–20 June 2012; pp. 553–560. [Google Scholar] [CrossRef] [Scilit]
  34. Buza, E.; Omanovic, S.; Huseinovic, A. A Pothole Detection with Image Processing and Spectral Clustering. In Proceedings of the 2nd International Conference on Information Technology and Computer Networks, Konya, Türkiye, 8–10 October 2013; pp. 48–53. [Google Scholar]
  35. Mednis, A.; Strazdins, G.; Zviedris, R.; Kanonirs, G.; Selavo, L. Real Time Pothole Detection using Android Smartphones with Accelerometers. In Proceedings of the IEEE International Conference on Distributed Computing in Sensor Systems and Workshops, Barcelona, Spain, 27–29 June 2011. [Google Scholar] [CrossRef] [Scilit]
  36. Yin, T.; Yang, J. Detection of Steel Surface Defect Based on Faster R-CNN and FPN. In Proceedings of the International Conference on Computing and Artificial Intelligence (ICCAI), Tianjin, China, 23–26 April 2021; pp. 15–20. [Google Scholar] [CrossRef] [Scilit]
  37. Wang, H.; Li, M.; Wan, Z. Rail surface defect detection based on improved mask R-CNN. Comput. Electr. Eng. 2022, 102, 108269. [Google Scholar] [CrossRef] [Scilit]
  38. Munawar, H.S.; Hammad, A.W.; Haddad, A.; Soares, C.A.P.; Waller, S.T. Image-based crack detection methods: A review. Infrastructures 2021, 6, 115. [Google Scholar] [CrossRef] [Scilit]
  39. Guo, Z.; Wang, C.; Yang, G.; Huang, Z.; Li, G. MSFT-YOLO: Improved YOLOv5 based on transformer for detecting defects of steel surface. Sensors 2022, 22, 3467. [Google Scholar] [CrossRef] [Scilit]
  40. Yu, R.; Wei, X.; Liu, Y.; Yang, F.; Shen, W.; Gu, Z. Research on automatic recognition of dairy cow daily behaviors based on deep learning. Animals 2024, 14, 458. [Google Scholar] [CrossRef] [Scilit]
Figure 1. Photograph of the rail damage site.
Applsci 16 02767 g001
Figure 2. Rail and surface defect direction: (a) Terminology used for directions in rails; (b) terminology used for planes in rails; (c) terminology used for directions in rail defects.
Applsci 16 02767 g002
Figure 3. Shell-type rail damage: (a) Rail gauge corner damage; (b) damage to the front surface of the rail.
Applsci 16 02767 g003
Figure 4. Headcheck-type rail damage: (a) Rail gauge corner damage; (b) damage to the front surface of the rail.
Applsci 16 02767 g004
Figure 5. Rail damage classification.
Applsci 16 02767 g005
Figure 6. Spalling-type rail damage: (a) Rail surface damage; (b) rail surface after grinding.
Applsci 16 02767 g006
Figure 7. Squats.
Figure 7. Squats.
Applsci 16 02767 g007
Figure 8. Plastic flow: (a) Rail gauge corner damage; (b) tongue lipping.
Applsci 16 02767 g008
Figure 9. Status of rail surface damage in the field investigation section: (a) Headcheck; (b) Spalling; (c) Shell.
Applsci 16 02767 g009aApplsci 16 02767 g009b
Figure 10. Flowchart of the SEM test.
Applsci 16 02767 g010
Figure 11. SEM Test: (a) Rail sample processing; (b) Mounting + polishing.
Applsci 16 02767 g011
Figure 12. SEM-test measurement example [25].
Applsci 16 02767 g012
Figure 13. Deep learning training data sample (rail surface defects and rail internal defects): (a) rail surface minor defect (C direction); (b) SEM image (cross cut); (c) rail surface with extended defects (C direction); (d) SEM image (cross cut); (e) rail surface minor defect (L direction); (f) SEM image (longitudinal cut); (g) rail surface with extended defects (L direction); (h) SEM image (longitudinal cut).
Applsci 16 02767 g013aApplsci 16 02767 g013b
Figure 14. SEM test results [25]: (a) C direction (3D); (b) L direction (3D).
Applsci 16 02767 g014
Figure 15. Correlation analysis result between the rail surface crack depth and crack angle (crack propagation rate) (C direction) [25].
Applsci 16 02767 g015
Figure 16. Correlation analysis result between the rail surface crack depth and crack angle (crack propagation rate) (L direction) [25].
Applsci 16 02767 g016
Figure 17. Examples of training data for rail surface and internal rail damages: (a) Headcheck (surface defect); (b) Headcheck (SEM image); (c) Spalling (surface defect); (d) Spalling (SEM image).
Applsci 16 02767 g017
Figure 18. Fast R-CNN architecture [25].
Applsci 16 02767 g018
Figure 19. Precision and confidence results [25].
Applsci 16 02767 g019
Figure 20. F1 and Confidence results [25].
Applsci 16 02767 g020
Figure 21. Precision and recall results for SVM and Fast R-CNN [25].
Applsci 16 02767 g021
Figure 22. Rail damage diagnosis process: (a) Photographing rail surface damage; (b) Image cropping function.
Applsci 16 02767 g022
Figure 23. Rail damage diagnosis results: (a) Rail damage diagnosis results (external); (b) Rail damage diagnosis results (internal).
Applsci 16 02767 g023
Figure 24. Accuracy verification of the rail damage diagnostic app: (a) Rail surface damage (Headcheck A); (b) Junior technician diagnosis; (c) PhD expert diagnosis; (d) Rail damage diagnostic app results.
Applsci 16 02767 g024
Figure 25. Accuracy verification of the rail damage diagnostic app: (a) Rail surface damage (Spalling C); (b) Junior technician diagnosis; (c) PhD expert diagnosis; (d) Rail damage diagnostic app results.
Applsci 16 02767 g025
Figure 26. Photograph of the rail damage diagnosis.
Applsci 16 02767 g026
Figure 27. Diagnostic process using the rail diagnostic app: (a) Photographing rail damage; (b) Transmitting diagnostic results; (c) Rail damage diagnostic results.
Applsci 16 02767 g027
Figure 28. Examples of diagnostic results: (a) Rail damage diagnostic results; (b) Rail internal damage diagnostic results.
Applsci 16 02767 g028
Figure 29. Rail damage diagnostic application measurement results: (a) Legend description; (b) Measurement results.
Applsci 16 02767 g029
Table 1. Crack propagation rate analysis results according to rail crack depth (C direction) [5,6,7,8,9,10,11,12].
Crack Depth RangeCrack Propagation Probability Average Value (Xc, mm)Standard
Deviation (SD, mm)
Crack Propagation Angle (°)
0.00–0.25 mm18.2±9.438.77–27.63
0.25–0.50 mm21.34±14.107.24–35.44
0.50–0.75 mm30.46±19.910.56–50.36
0.75 mm<25.12±12.2712.85–37.39
Table 2. Crack propagation rate analysis results according to the rail crack depth (L direction) [5,6,7,8,9,10,11,12].
Crack Depth RangeCrack Propagation Probability Average Value (Xc, mm)Standard
Deviation (SD, mm)
Crack Propagation Angle (°)
0.00–0.25 mm6.28±2.234.05–8.51
0.25–0.50 mm6.71±1.984.73–8.69
0.50–0.75 mm6.93±1.895.04–8.82
0.75 mm<9.01±1.427.59–10.43
Table 3. Experimental environment.
DivisionEnvironment
OSWindows 11 Professional
CPUIntel(R) Core (TM) i5-13600 K CPU @ 3.5 GHz
RAMDDR5 32 GB (PC5-44800) × 4 = 128 GB
GPUGeForce RTX 4060 Ti
SSDGold P31 M.2 2 TB
Table 4. Confusion matrix [25].
Correct Answer
TrueFalse
Classification resultTrueTrue positiveFalse positive
FalseFalse negativeTrue negative
Table 5. Comparison of test results between SVM and Fast R-CNN [25].
Learning DataModel (AP) All Classes (mAP (IoU@0.5))
SVMFast R-CNNSVMFast R-CNN
Headchek_A72.099.467.294.9
Headchek_B70.186.8
Spalling_A58.495.3
Spalling_B68.298.2
Table 6. Search performance evaluation based on top-k accuracy.
ClassSVMFast R-CNN
Top@1Top@2Top@3Top@4Top@1Top@2Top@3Top@4
Headchek_A0.720.880.961.000.940.980.9951.00
Headchek_B0.640.810.931.000.760.890.961.00
Spalling_A0.410.670.861.000.840.920.971.00
Spalling_B0.630.790.901.000.900.960.991.00
Table 7. Field demonstration sections.
SectionTrack TypeDiagnostic Length (km) Radius (m)Cant (mm)
1~3Concrete track
(LVT)
1 kmStraight section-
Disclaimer/Publisher’s Note: The statements, opinions and data contained in all publications are solely those of the individual author(s) and contributor(s) and not of MDPI and/or the editor(s). MDPI and/or the editor(s) disclaim responsibility for any injury to people or property resulting from any ideas, methods, instructions or products referred to in the content.