Article

Multi-Hop LoRaWAN Protocol with Efficient Placement of the Relay Nodes

by
Konstantina Spathi
,
Anastasios Valkanis
,
Georgia Beletsioti
,
Konstantinos Kantelis
,
Georgios Papadimitriou
and
Petros Nicopolitidis
*
Department of Informatics, Aristotle University of Thessaloniki, 54124 Thessaloniki, Greece
*
Author to whom correspondence should be addressed.
Appl. Sci. 2026, 16(6), 2698; https://doi.org/10.3390/app16062698
Submission received: 26 November 2025 / Revised: 27 January 2026 / Accepted: 6 March 2026 / Published: 11 March 2026

Abstract

Multi-hop networks’ performance strongly depends on relay node placement, which affects delay, throughput, and coverage. This work introduces a dual-layer protocol combining Slotted ALOHA for node-to-relay communication and TDMA for relay-to-gateway transmission. Using a Java-based simulator, we evaluate three relay placement strategies—random, square grid, and hexagonal grid—considering metrics such as delay, throughput, packet collisions, and coverage. Results show that the hexagonal grid offers superior performance, reducing collisions, minimizing delay, and expanding coverage. A fallback mechanism for out-of-range nodes and sensitivity analysis of different backoff values are also included. The study quantifies the benefits of structured relay placement for LoRaWAN and wireless sensor networks, while also identifying challenges for realistic deployments. These findings provide guidelines for designing scalable and reliable IoT networks and highlight directions for future work involving irregular placements and dynamic routing. The simulation results are intended to provide comparative, trend-based insights under conservative modeling assumptions, rather than absolute performance predictions.

1. Introduction

Wireless communication has evolved significantly over the past few decades, with multi-hop networking emerging as an effective mechanism for extending coverage and improving reliability in challenging environments. In low-power wide-area networks such as LoRaWAN, however, communication is inherently designed around a single-hop star topology, which limits scalability and coverage in dense deployments or large geographical areas. These limitations are primarily driven by duty-cycle constraints, shared-spectrum access, and increased collision probability as the number of devices grows.
Recent research has highlighted the need for relay-based and multi-hop LoRaWAN solutions to address these challenges. Researchers have proposed various strategies to optimize these networks, ranging from advanced routing algorithms to novel deployment frameworks. Recent work in this domain has explored techniques such as reconfigurable intelligent surfaces [1], proactive route optimization, and novel grid-based relay node placements to enhance network performance [2]. Despite LoRaWAN’s success in low-power wide-area networking, its single-hop architecture suffers from limited coverage, scalability constraints, and increased collision probability in dense or large-area deployments. Prior analytical and simulation-based studies have shown that LoRaWAN scalability is fundamentally constrained by duty-cycle regulations and inter-SF interference, leading to throughput saturation under increasing load [3,4,5]. While multi-hop and relay-based extensions have been proposed, existing studies largely focus on routing, hardware design, or scheduling mechanisms, with limited attention to the combined impact of relay placement and MAC-layer coordination. Reproducing the same large-scale, topology-driven experiments in packet-level simulators such as NS-3 or OMNeT++ would be computationally prohibitive and unnecessary for the comparative focus of this study.
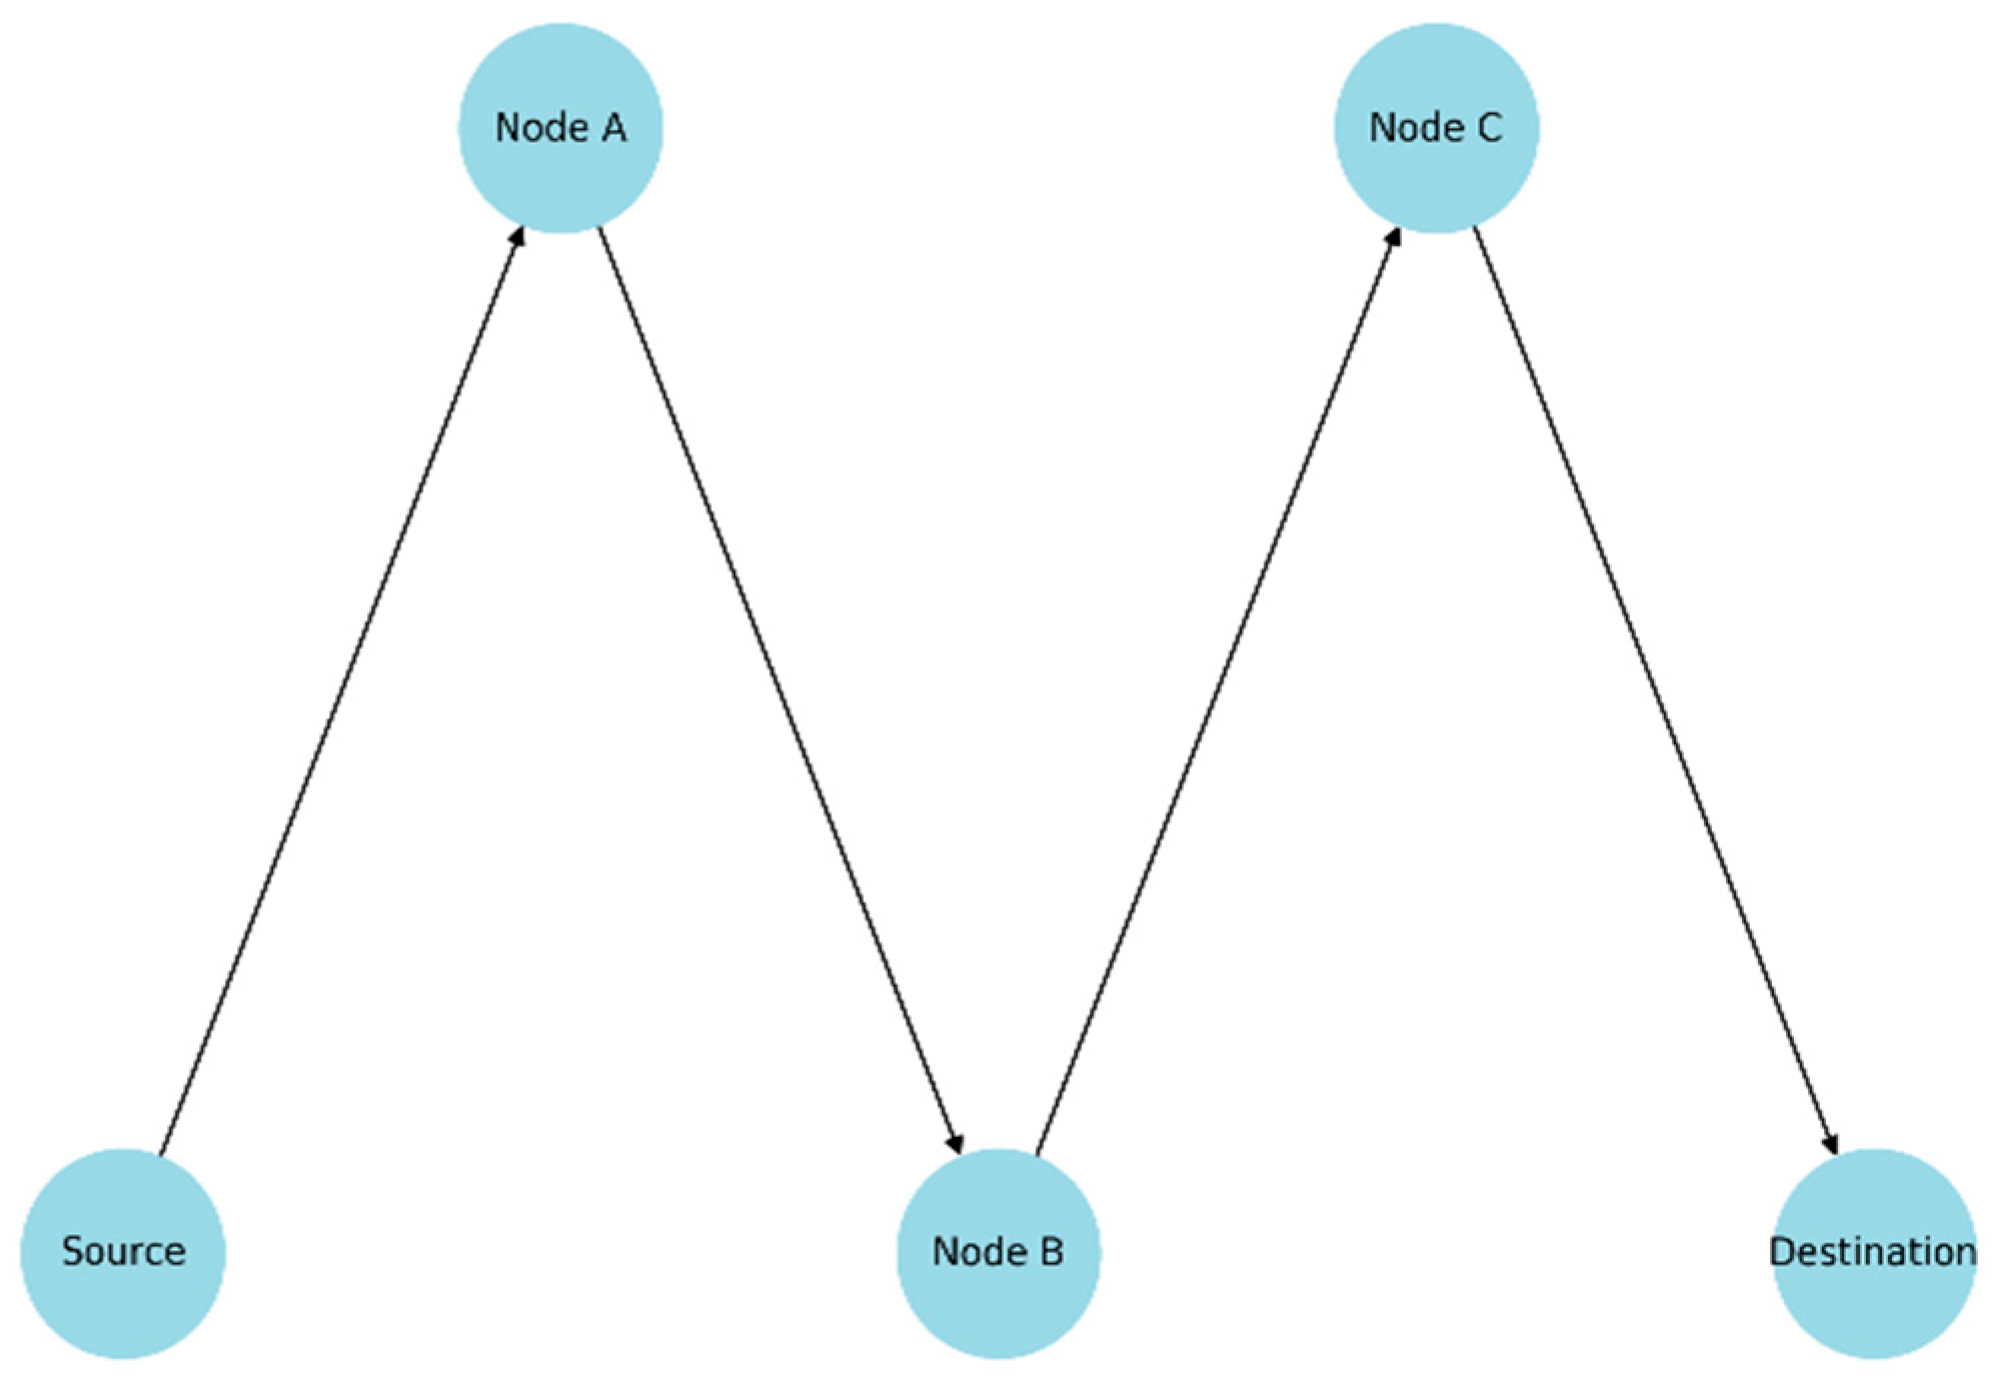
Figure 1 illustrates an example of a graphical representation of a multi-hop network. This method is particularly useful when direct communication is blocked by obstacles or distance, effectively extending the network’s coverage beyond the reach of individual nodes.
A key advantage of multi-hop networks is their capacity to expand coverage. By using intermediate nodes, these networks can function in areas where single-hop networks would struggle, enhancing reliability and reducing overall power consumption [6]. Additionally, these networks are highly scalable, meaning they can support a growing number of nodes without a major decline in performance, making them ideal for large-scale deployments.
Despite these benefits, multi-hop networks also present challenges. One of the biggest hurdles is routing complexity. Another challenge is interference management. Security is also a major concern. The decentralized nature of multi-hop networks makes them more vulnerable to threats like eavesdropping, data tampering, and unauthorized access [7]. Addressing these issues is essential to ensuring the security and optimal performance of these networks [8,9].
This study builds on these advancements by proposing a novel relay node placement strategy based on a hexagonal grid layout [10]. In this work, we consider a two-hop LoRaWAN architecture where end nodes transmit via relay nodes to a central gateway. A dual-layer MAC protocol is used to manage contention at both communication stages. This architecture enables a controlled and systematic evaluation of how relay placement influences collisions, delay, throughput, and coverage.
The main contribution of this study is the joint evaluation of relay node placement strategies together with dual-layer MAC coordination in multi-hop LoRaWAN networks. Using a conservative, topology-centric simulation framework, three relay placement strategies—random placement, square grid placement, and hexagonal grid placement—are compared under identical conditions. The results demonstrate that structured relay placement, particularly hexagonal grid deployment, significantly reduces collision probability, lowers delay, and improves throughput compared to unstructured deployments. These findings provide practical insights for the design of scalable and reliable multi-hop LoRaWAN and wireless sensor network deployments.
Analytical and simulation-based studies have shown that LoRaWAN performance degrades rapidly under increasing load due to collisions and gateway bottlenecks, even when multiple spreading factors are employed [5]. As a result, several works have explored multi-hop communication as a means to improve coverage, reliability, and energy efficiency in wireless sensor networks and LoRa-based systems [6].
In multi-hop LoRaWAN networks, relay nodes play a central role in shaping network performance. Their spatial placement directly affects coverage, collision domains, and traffic aggregation, while MAC-layer coordination determines how efficiently traffic is forwarded toward the gateway. Although prior studies have investigated routing protocols, relay node designs, and scheduling mechanisms [11,12,13,14], most approaches consider these aspects in isolation. The combined effect of relay placement strategies and layered MAC operation on multi-hop LoRaWAN performance remains insufficiently explored.
While several open-source simulators such as ns-3 and OMNeT++ provide highly detailed PHY-layer modeling for LoRaWAN, they are primarily designed for large-scale, single-hop performance evaluation and protocol compliance testing. In this work, the objective is not to obtain absolute performance figures, but to isolate and compare the impact of relay node placement and MAC-layer coordination in controlled multi-hop topologies. For this reason, a lightweight, purpose-built simulator was developed to enable fair, repeatable, and topology-centric comparisons under identical conditions.
The main contributions of this work are summarized as follows: (i) a dual-layer MAC protocol combining Slotted ALOHA for node-to-relay communication and TDMA for relay-to-gateway transmission in multi-hop LoRaWAN networks, (ii) a systematic comparative evaluation of relay node placement strategies (random, square grid, and hexagonal grid), (iii) a conservative, topology-centric simulation study highlighting how structured relay placement reduces collisions, delay, and improves throughput, (iv) a fallback mechanism for out-of-range nodes and a sensitivity analysis of retransmission backoff values.

2. Related Work

Recent advancements in multi-hop networks have addressed many of the aforementioned challenges and introduced novel methods of providing better performance and reliability. As an example, Samarathunga et al. [15] explored the advantages of applying multi-hop in indoor 60 GHz wireless networks. From their work, it was found that blockage is alleviated using multi-hop routing and range is extended in millimeter-wave bands.
In another paper, Samarathunga et al. [16] presented a proactive route optimization approach for multi-hop millimeter-wave networks. The approach blends sectorized MAC (Media Access Control) layer communication with on-demand multi-hop routing at the network layer, providing higher reliability and lower latency in dynamic situations.
Xiong et al. [17] proposed a design and optimization approach to successive RIS (Reconfigurable Intelligent Surface)—based multi-hop wireless systems. Their work is concerned with deployment and beam optimization strategies to achieve high aperture efficiency and high signal power gain, of particular significance in high obstacle density or long-tunnel scenarios.
Soleimani-Nasab and Coleri [18] explored the effects of hardware impairments in multi-hop relay systems using amplify-and-forward and decode-forward strategies in general H-fading models. Closed-form expressions of outage probability, bit error probability, and ergodic capacity were established, offering system optimization knowledge in the presence of hardware impairments.
Zhao et al. [19] addressed simultaneous routing and task offloading in wireless multi-hop networks via a biased backpressure algorithm. The method dynamically adjusts a task’s path and destination based on system-wide long-term knowledge and local current states, offering a shorter makespan than existing approaches.
Dias and Grilo [11] propose a multi-hop uplink extension for LoRaWAN that enables end nodes to transmit data through intermediate relay nodes before reaching the gateway. Their approach leverages a simplified DSDV (destination-sequenced distance vector) routing protocol to ensure efficient data forwarding while maintaining compatibility with the LoRaWAN specification. Through a prototype implementation and performance evaluation, the study demonstrates that packet reception rates and throughput remain stable, even as the number of hops increases, highlighting the potential of multi-hop communication in enhancing LoRaWAN network coverage and reliability.
Cotrim et al. [12] provide a comprehensive review of multi-hop communication strategies in LoRaWAN networks, with a particular focus on the role of relay nodes. Their study explores how relay nodes can effectively extend network coverage while minimizing the complexity associated with full routing protocols. The authors emphasize the balance between simplicity and functionality, highlighting how optimized relay-based approaches can enhance LoRaWAN scalability and efficiency without introducing excessive overhead.
Aslam et al. [13] investigate the use of multi-hop LoRa (Long-Range) networks to enhance energy efficiency and coverage in smart city applications. The authors conducted experimental evaluations comparing single-hop and multi-hop LoRa topologies, focusing on metrics such as packet reception ratio, spreading factors, and transmission power. The findings indicate that multi-hop configurations can lead to significant energy savings and improved coverage, highlighting their potential for green smart city implementations.
Cotrim, Margi, and Kleinschmidt [14] presented a study that focuses on the development of a gateway-based relay node for multi-hop LoRaWAN networks. The research addresses key challenges related to network scalability and reliability, proposing an innovative relay node design to optimize data transmission efficiency. Their findings highlight the potential of gateway-based relay nodes in extending network coverage and improving communication performance in large-scale LoRaWAN deployments. Georgiou & Raza [3] proposed analytical and empirical baselines for LoRaWAN scalability and collision probability and Adelantado et al. [5] proposed coverage/network behavior benchmarks.
More recent studies have examined scalability, duty-cycle constraints, and multi-spreading-factor behavior in LoRaWAN through both simulation and experimental evaluation. Marini et al. [20] introduced LoRaWANSim, a flexible simulation framework supporting multi-spreading-factor operation and duty-cycle modeling, enabling large-scale performance evaluation. Durand and Booysen [21] evaluated mesh-topology LoRa networks and demonstrated how forwarding strategies and network topology significantly impact throughput and reliability in dense deployments. These works highlight the importance of scalable evaluation frameworks while also illustrating the trade-off between detailed physical-layer realism and topology-centric comparative analysis.
Unlike these existing approaches, our study addresses the core issue of optimal spatial deployment and dual-layer congestion management. Specifically:
Cotrim et al. [14] focus on the hardware design of gateway-based relay nodes for multi-hop LoRaWAN networks without analyzing spatial placements or hybrid MAC coordination. Our work advances this by optimizing relay placement and MAC layer coordination, showing how these choices affect network performance, moving research from node-level design to network-level optimization.
These studies contribute to the continuous enhancement of multi-hop networks, offering solutions to improve coverage, reliability, and scalability in diverse wireless communication environments. Unlike existing approaches that require time synchronization and involve complex control messages, the proposed method employs simple slot allocation and adaptive frame scheduling based on node range estimation, enabling simple yet effective communication. It addresses key gaps in the literature by offering a practical, energy efficient and low-cost solution.
Several simulation tools have been proposed for LoRaWAN performance evaluation, including ns-3-based frameworks and LoRaWANSim. These tools provide detailed physical-layer modeling, including fading, capture effects, and interference, and are well suited for studying absolute throughput, packet error rates, and scalability limits in single-hop networks. In contrast, this work focuses on relative performance trends arising from spatial relay placement and dual-layer MAC coordination in idealized multi-hop scenarios. As such, a simplified and conservative simulation model is adopted to isolate these effects without introducing confounding physical-layer randomness.

3. Proposed Protocol

The proposed protocol utilizes Slotted ALOHA for communication from nodes to relay nodes, and TDMA for communication from relay nodes to the Gateway. In the Slotted ALOHA system, packet collisions are minimized by rescheduling packets with different backoff values. In the TDMA system, nodes are assigned specific sequential time slots to transmit their packets, ensuring efficient communication [3].

3.1. Algorithm Operation

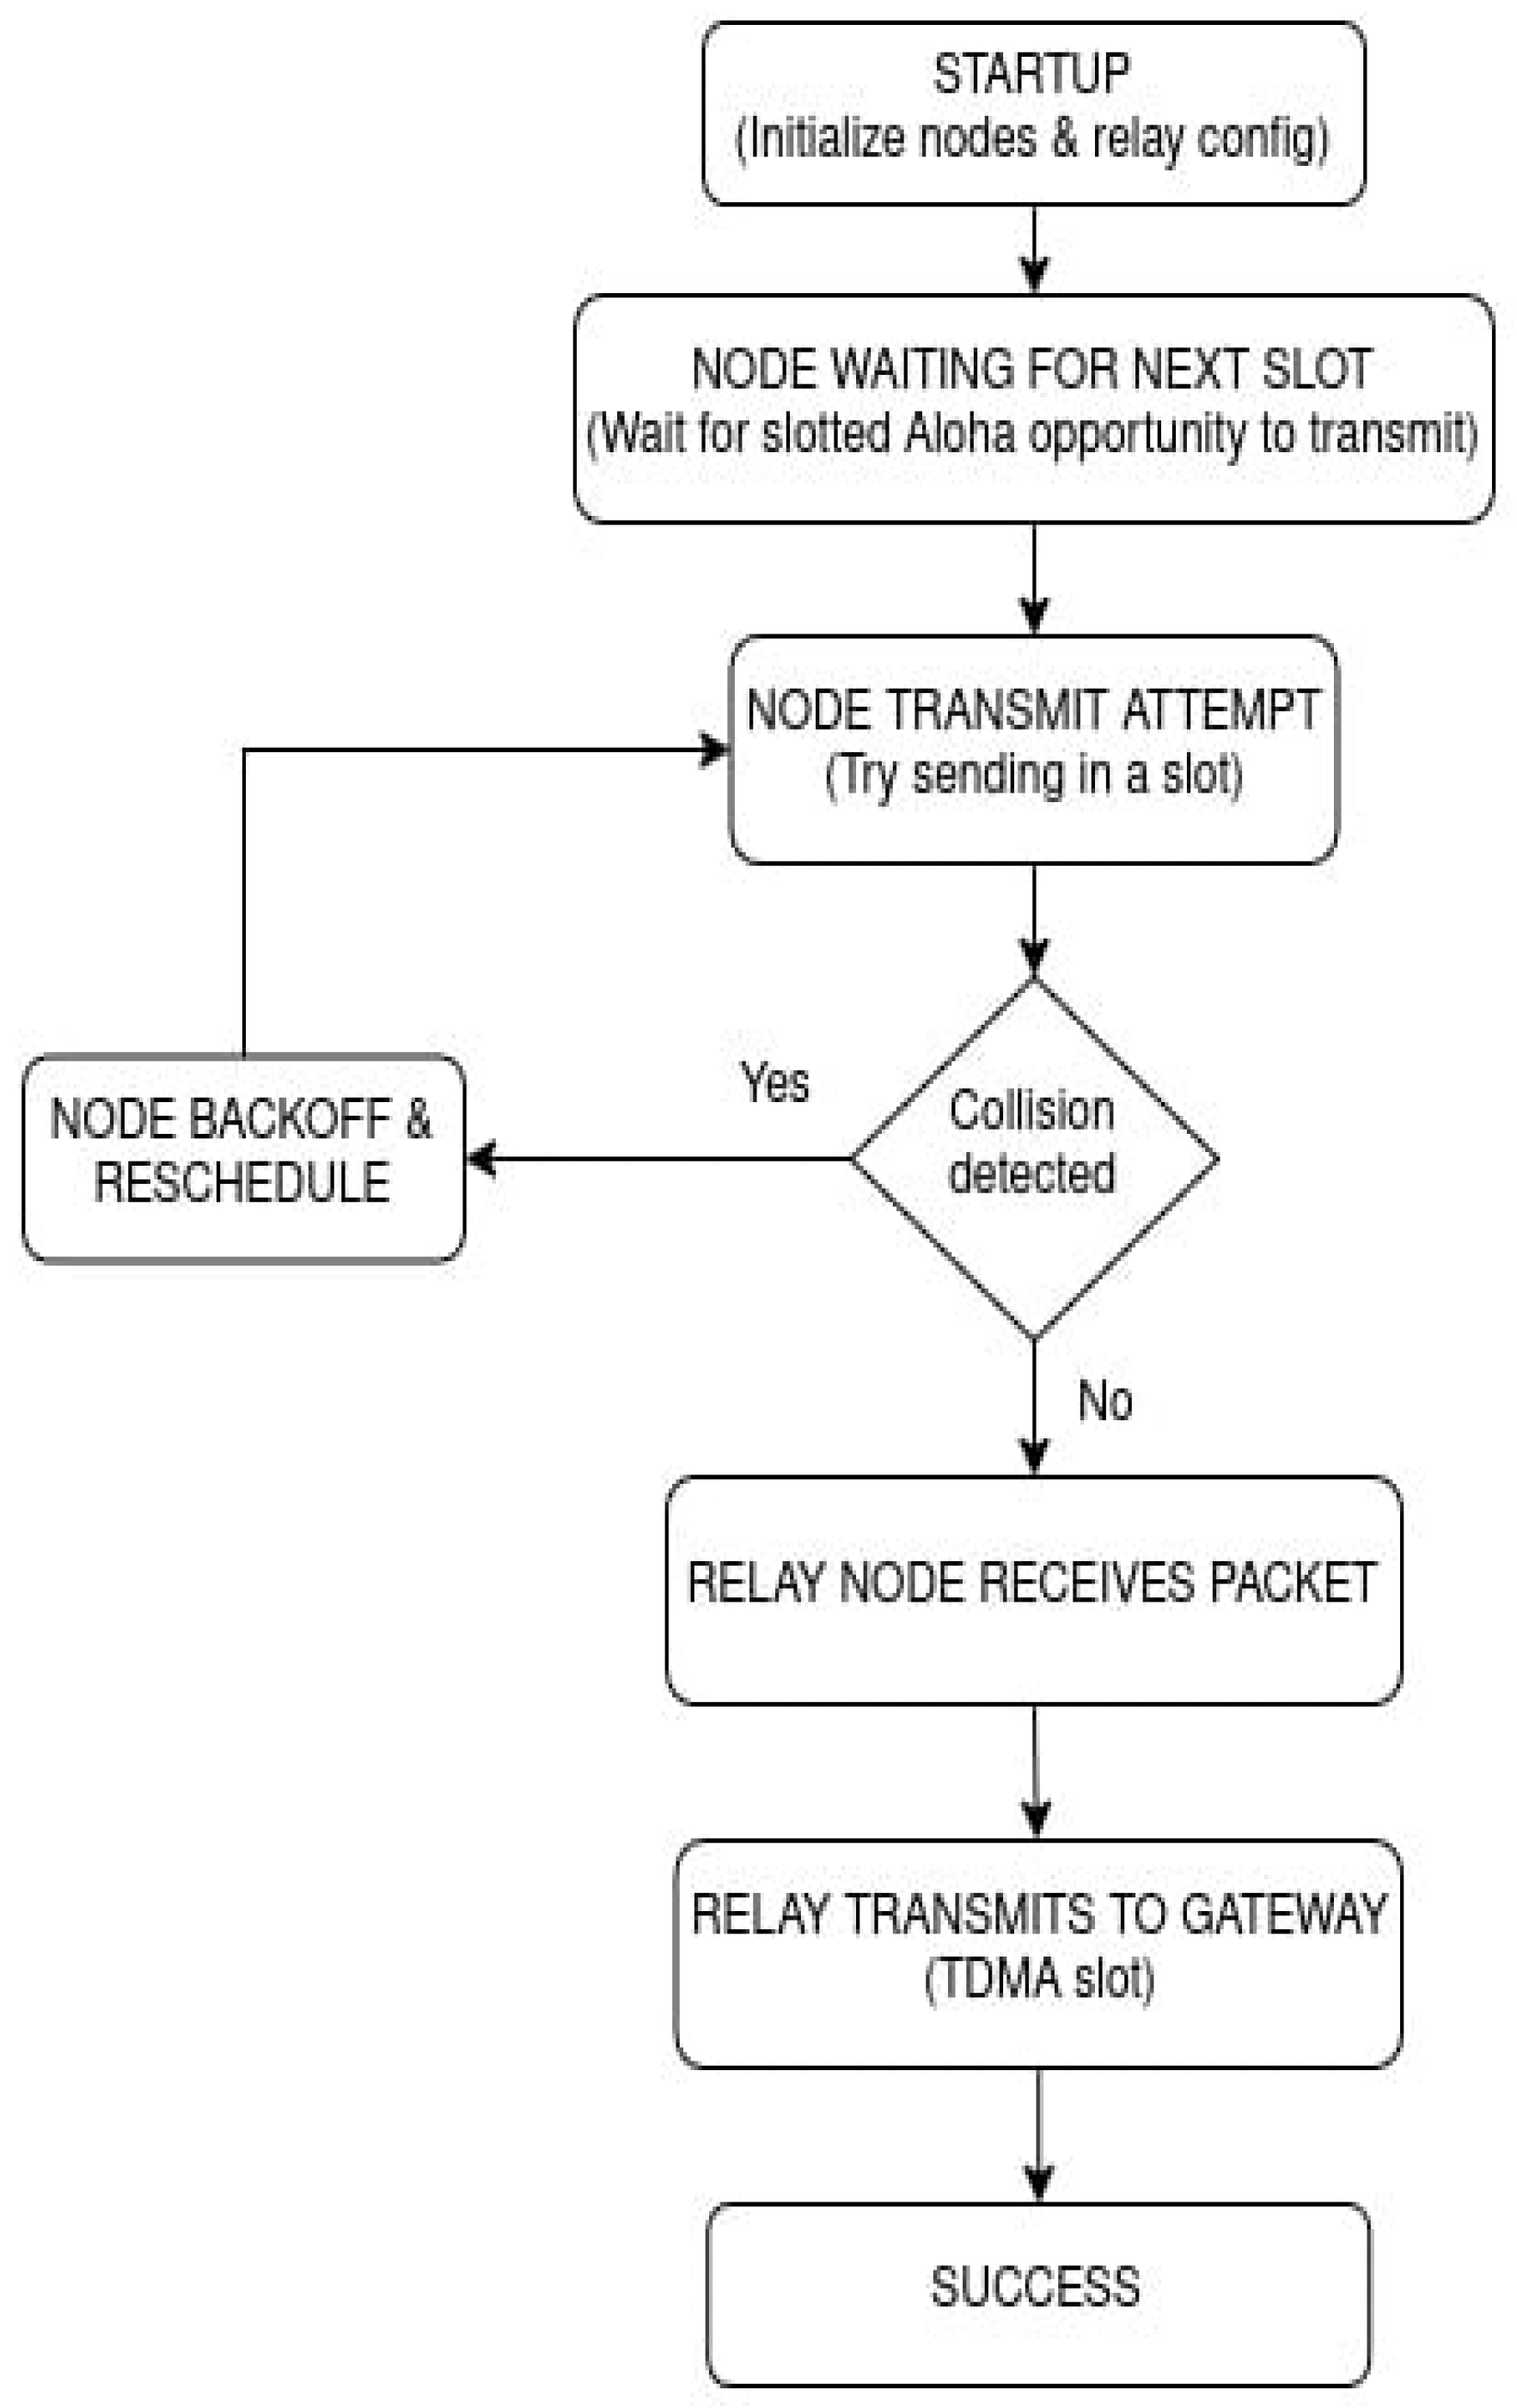
Figure 2 presents a state diagram that summarizes the operation of the algorithm developed in this work. The algorithm is executed independently by each end node of the system. The initial nodes (end nodes) are the nodes that produce traffic.
Each node transmits to its closest relay node. Transmission range is the distance between the end node (represented as a point) and the furthest away points that this packet can reach. It is represented as a circle around the end node with transmission range equal to the radius of this circle. The border of the circle defines the transmission range.
A collision occurs when two nodes attempt to transmit to the same relay node simultaneously. If a collision occurs, the packet remains in the node’s queue and is rescheduled for transmission. If the transmission is successful, the packet enters the relay node’s queue.
A key innovation of this study lies in the use of the joint Slotted ALOHA–TDMA protocol to manage congestion across two distinct transmission layers. In the first layer, Slotted ALOHA is applied for communication from nodes to relay nodes. Each node can transmit only at the start of a time slot, and collisions occur when multiple nodes within the same relay region transmit at the same time. However, the use of spatially distributed relay nodes significantly reduces the potential of packet collisions. Because each relay node is responsible for a different area, nodes across the network can transmit simultaneously to different relays nodes without interfering with each other. This distribution effectively splits the traffic load and avoids excessive collisions, particularly in sparse or moderately dense deployments.
In the second layer, once data reaches the relay nodes, TDMA is employed for communication from the relays to the gateway. Each relay node is assigned a specific time slot, avoiding direct collisions during transmission. This scheduling ensures orderly access to the shared medium. However, unlike the first stage, all traffic is now directed toward a single destination—the gateway. This introduces a new congestion point, especially as the number of relay nodes increases. Even though collisions are eliminated by TDMA, the gateway must still handle data from all relays, which may result in queuing delays.
A key capacity of this layered protocol design is that addresses the unique challenges of each stage. Slotted ALOHA handles random access efficiently at the network’s edge, allowing scalable, distributed communication among a large number of nodes. TDMA, on the other hand, enforces strict time-based coordination in the more constrained and centralized relay-to-gateway link, where contention must be strictly controlled. Slotted Aloha and TDMA exist in separate frequencies so there is no need for separation in time.
The effectiveness of this combination is tested in a network with 100 nodes and 16 relay nodes. Data generated by the nodes is distributed to different relays, minimizing congestion in the first stage. However, when the relays forward the data to the gateway, they all share the same communication channel. TDMA mitigates potential conflicts by assigning fixed time slots to each relay, but the shared destination remains a bottleneck. The protocol balances these factors by tailoring the communication strategy to each level’s needs.
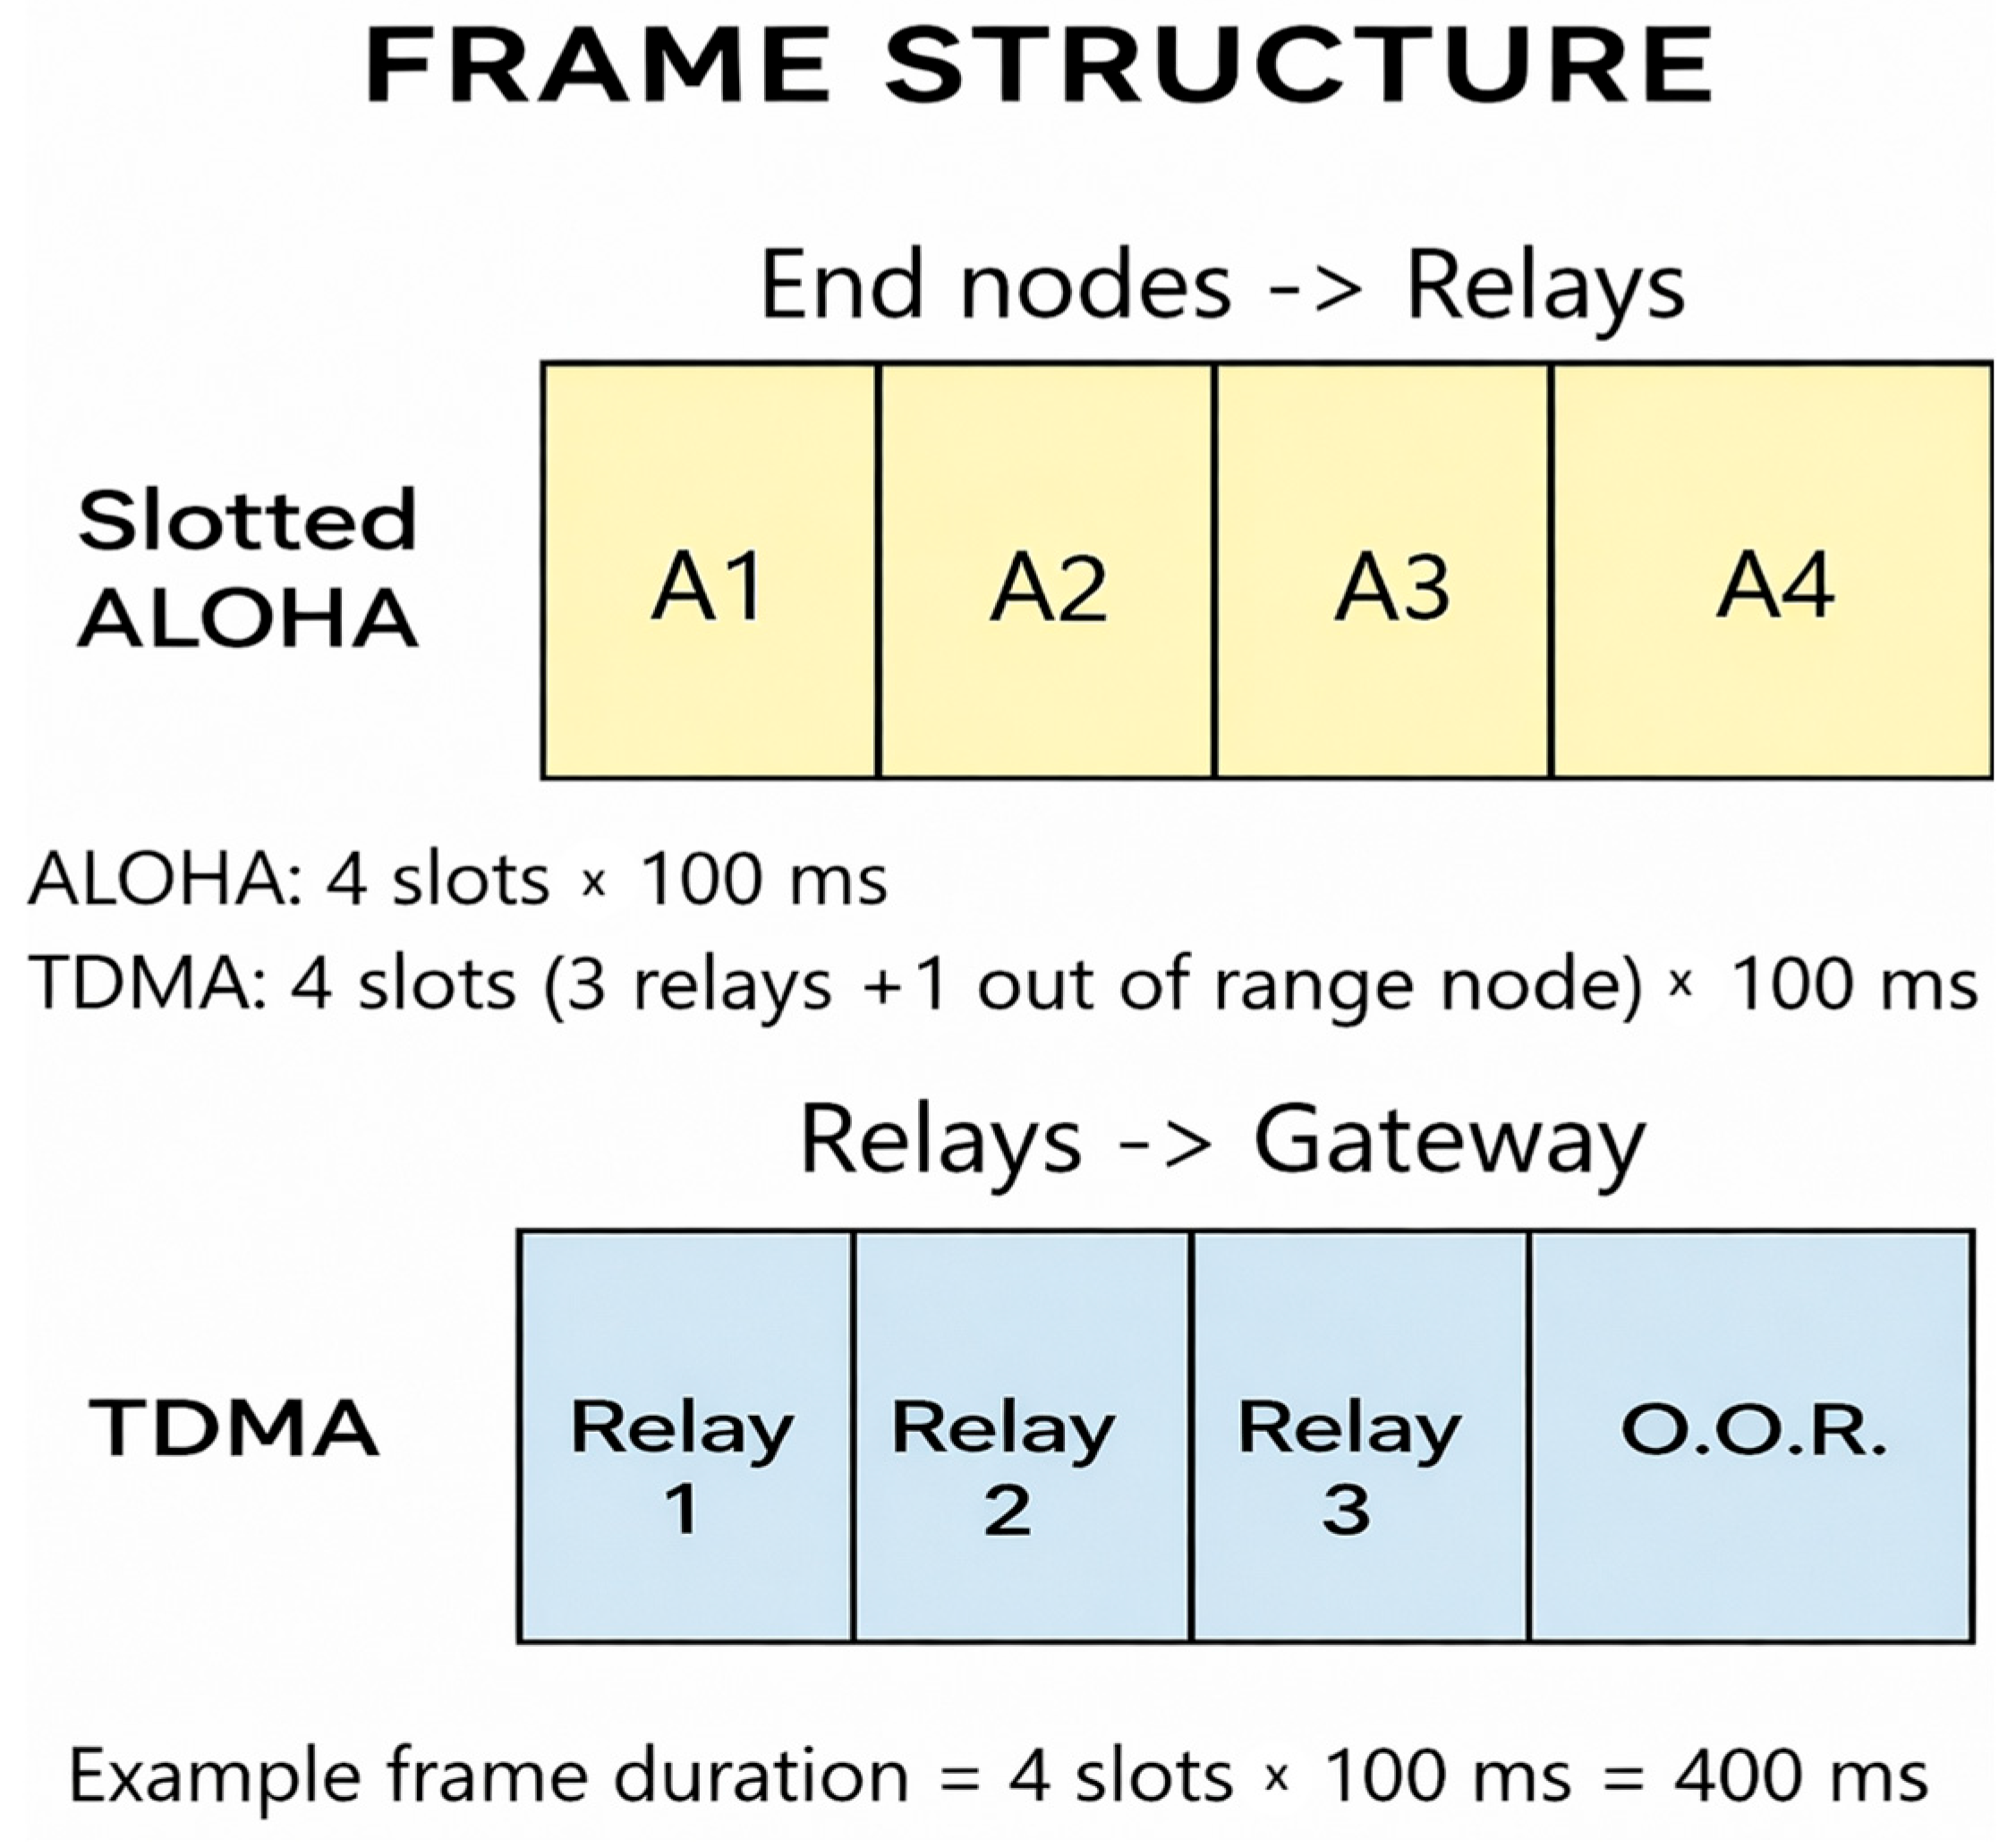
Slotted ALOHA and TDMA operate on separate frequencies, eliminating the need for temporal separation. Figure 3 presents a diagram of a single communication frame with two stacked subframes. The top subframe, colored pale yellow, shows four Slotted ALOHA slots (end nodes transmit to relays). The bottom subframe, colored pale blue, shows three TDMA slots (Relay 1, Relay 2, Relay 3) plus a fourth out-of-range slot (O.O.R.) used by nodes not associated with relays. The total duration of this frame is equal to 4 slots of 100 ms, i.e., 400 ms in total.

3.2. Relay Placement Strategies and Coverage

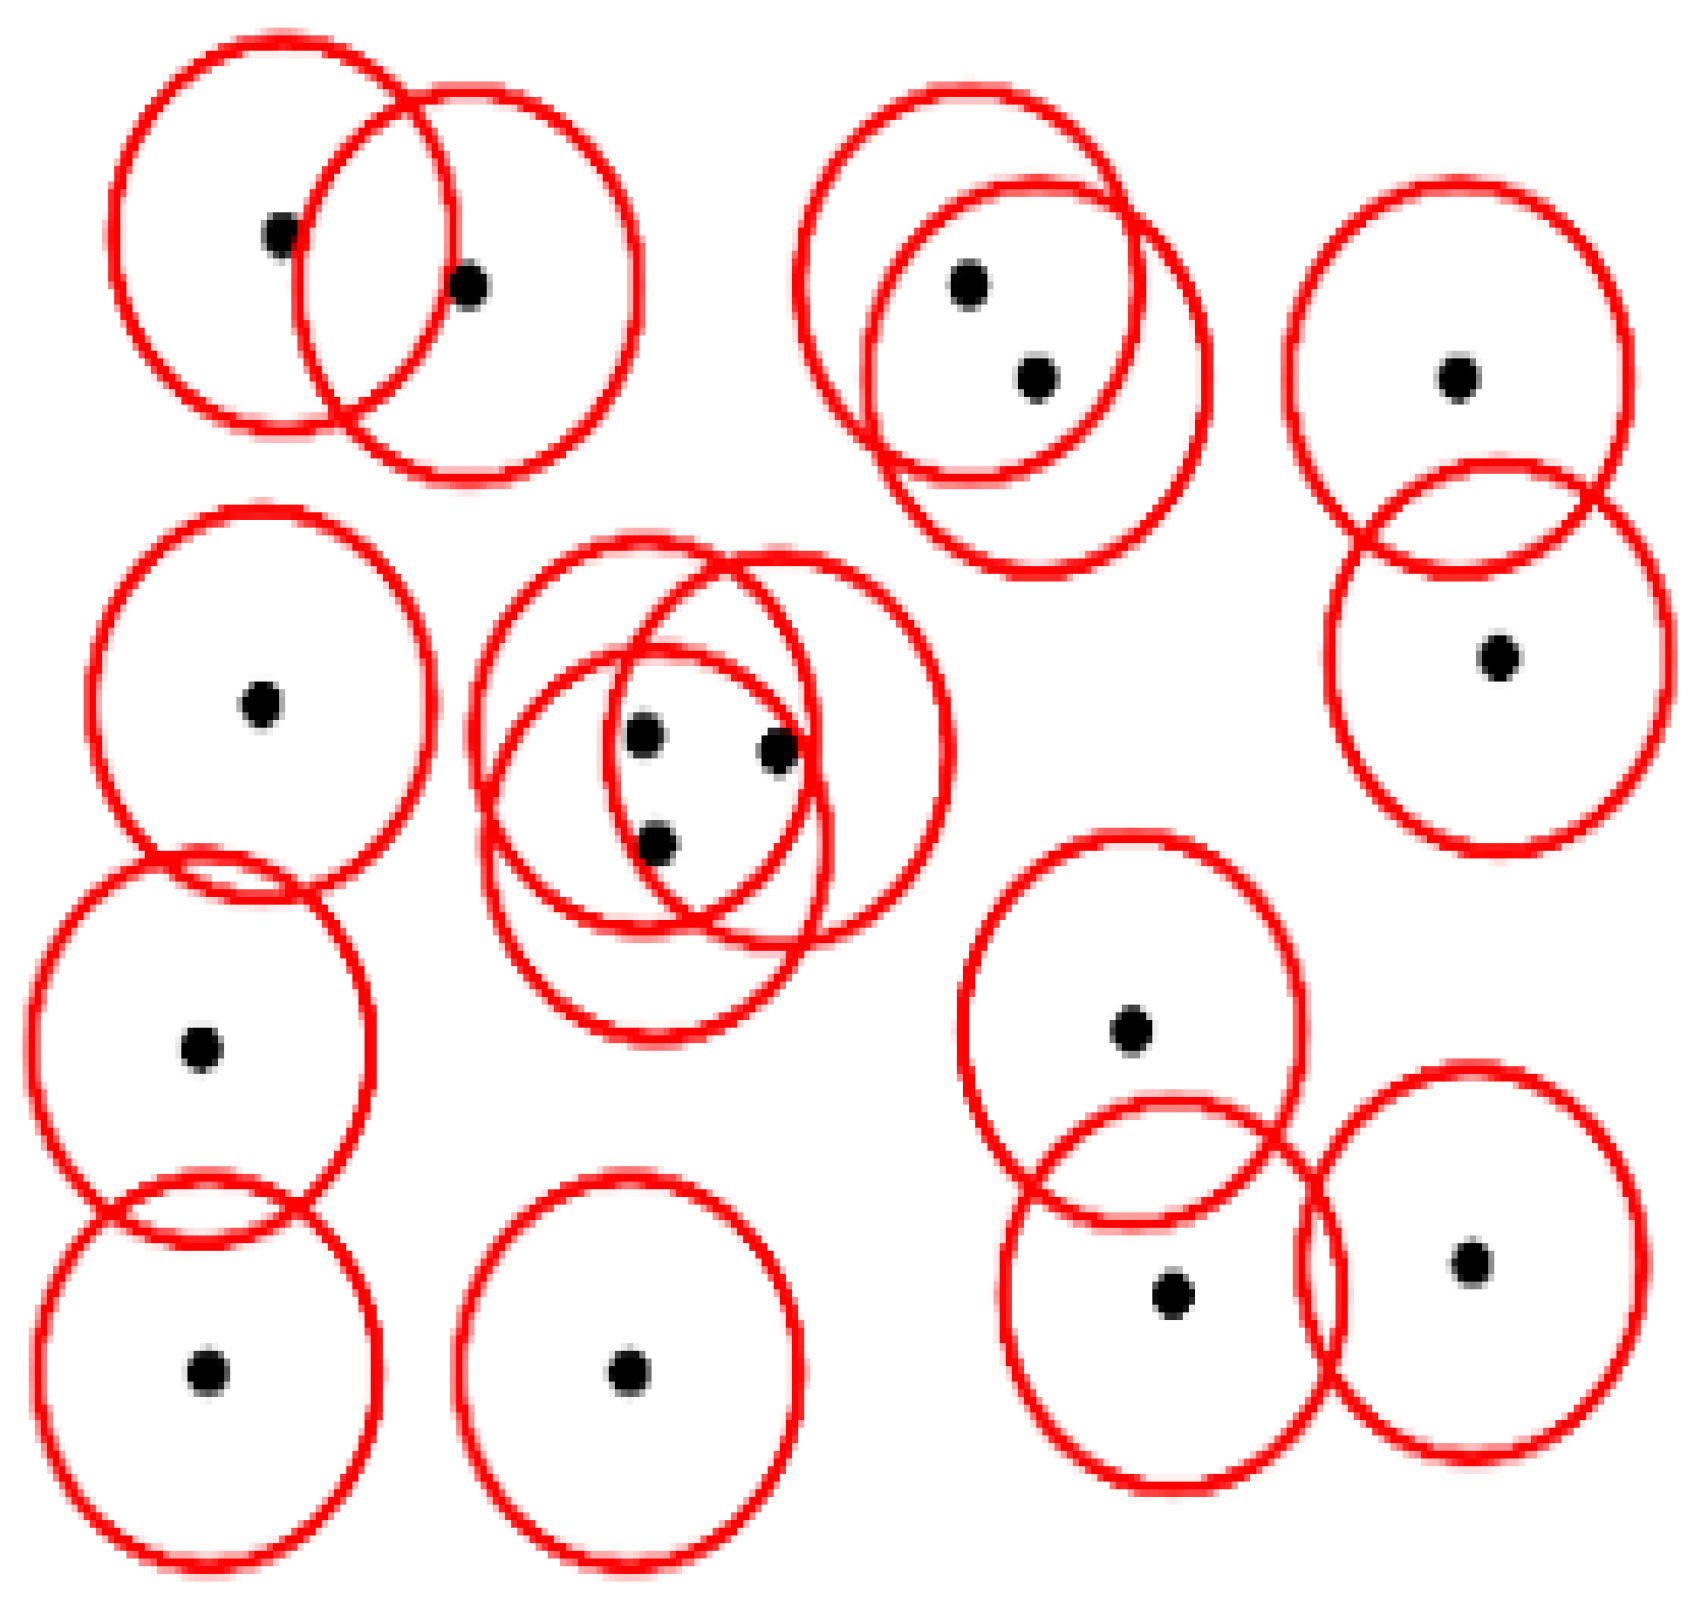
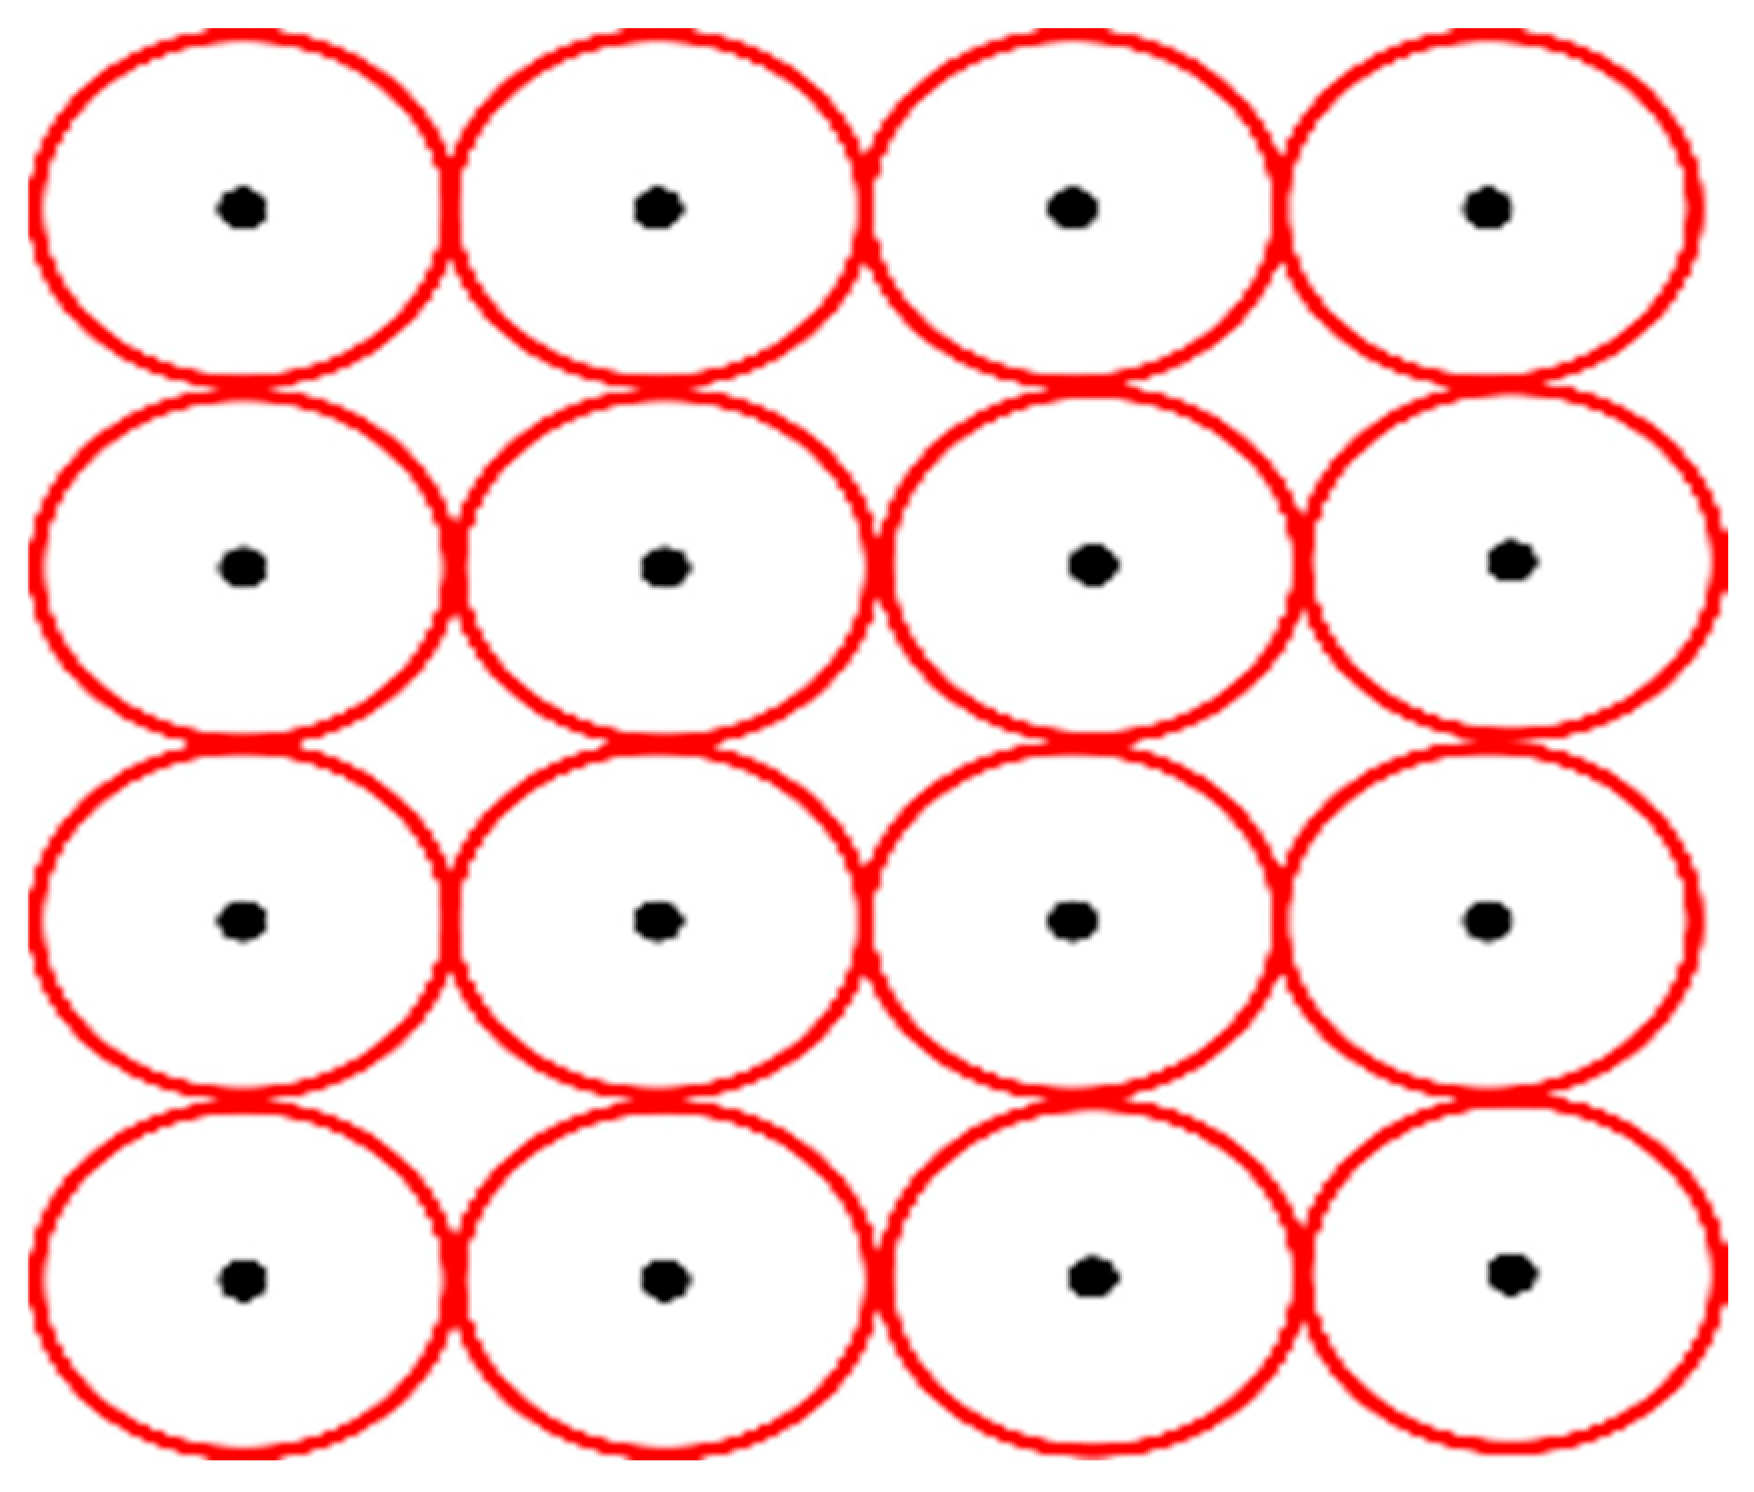
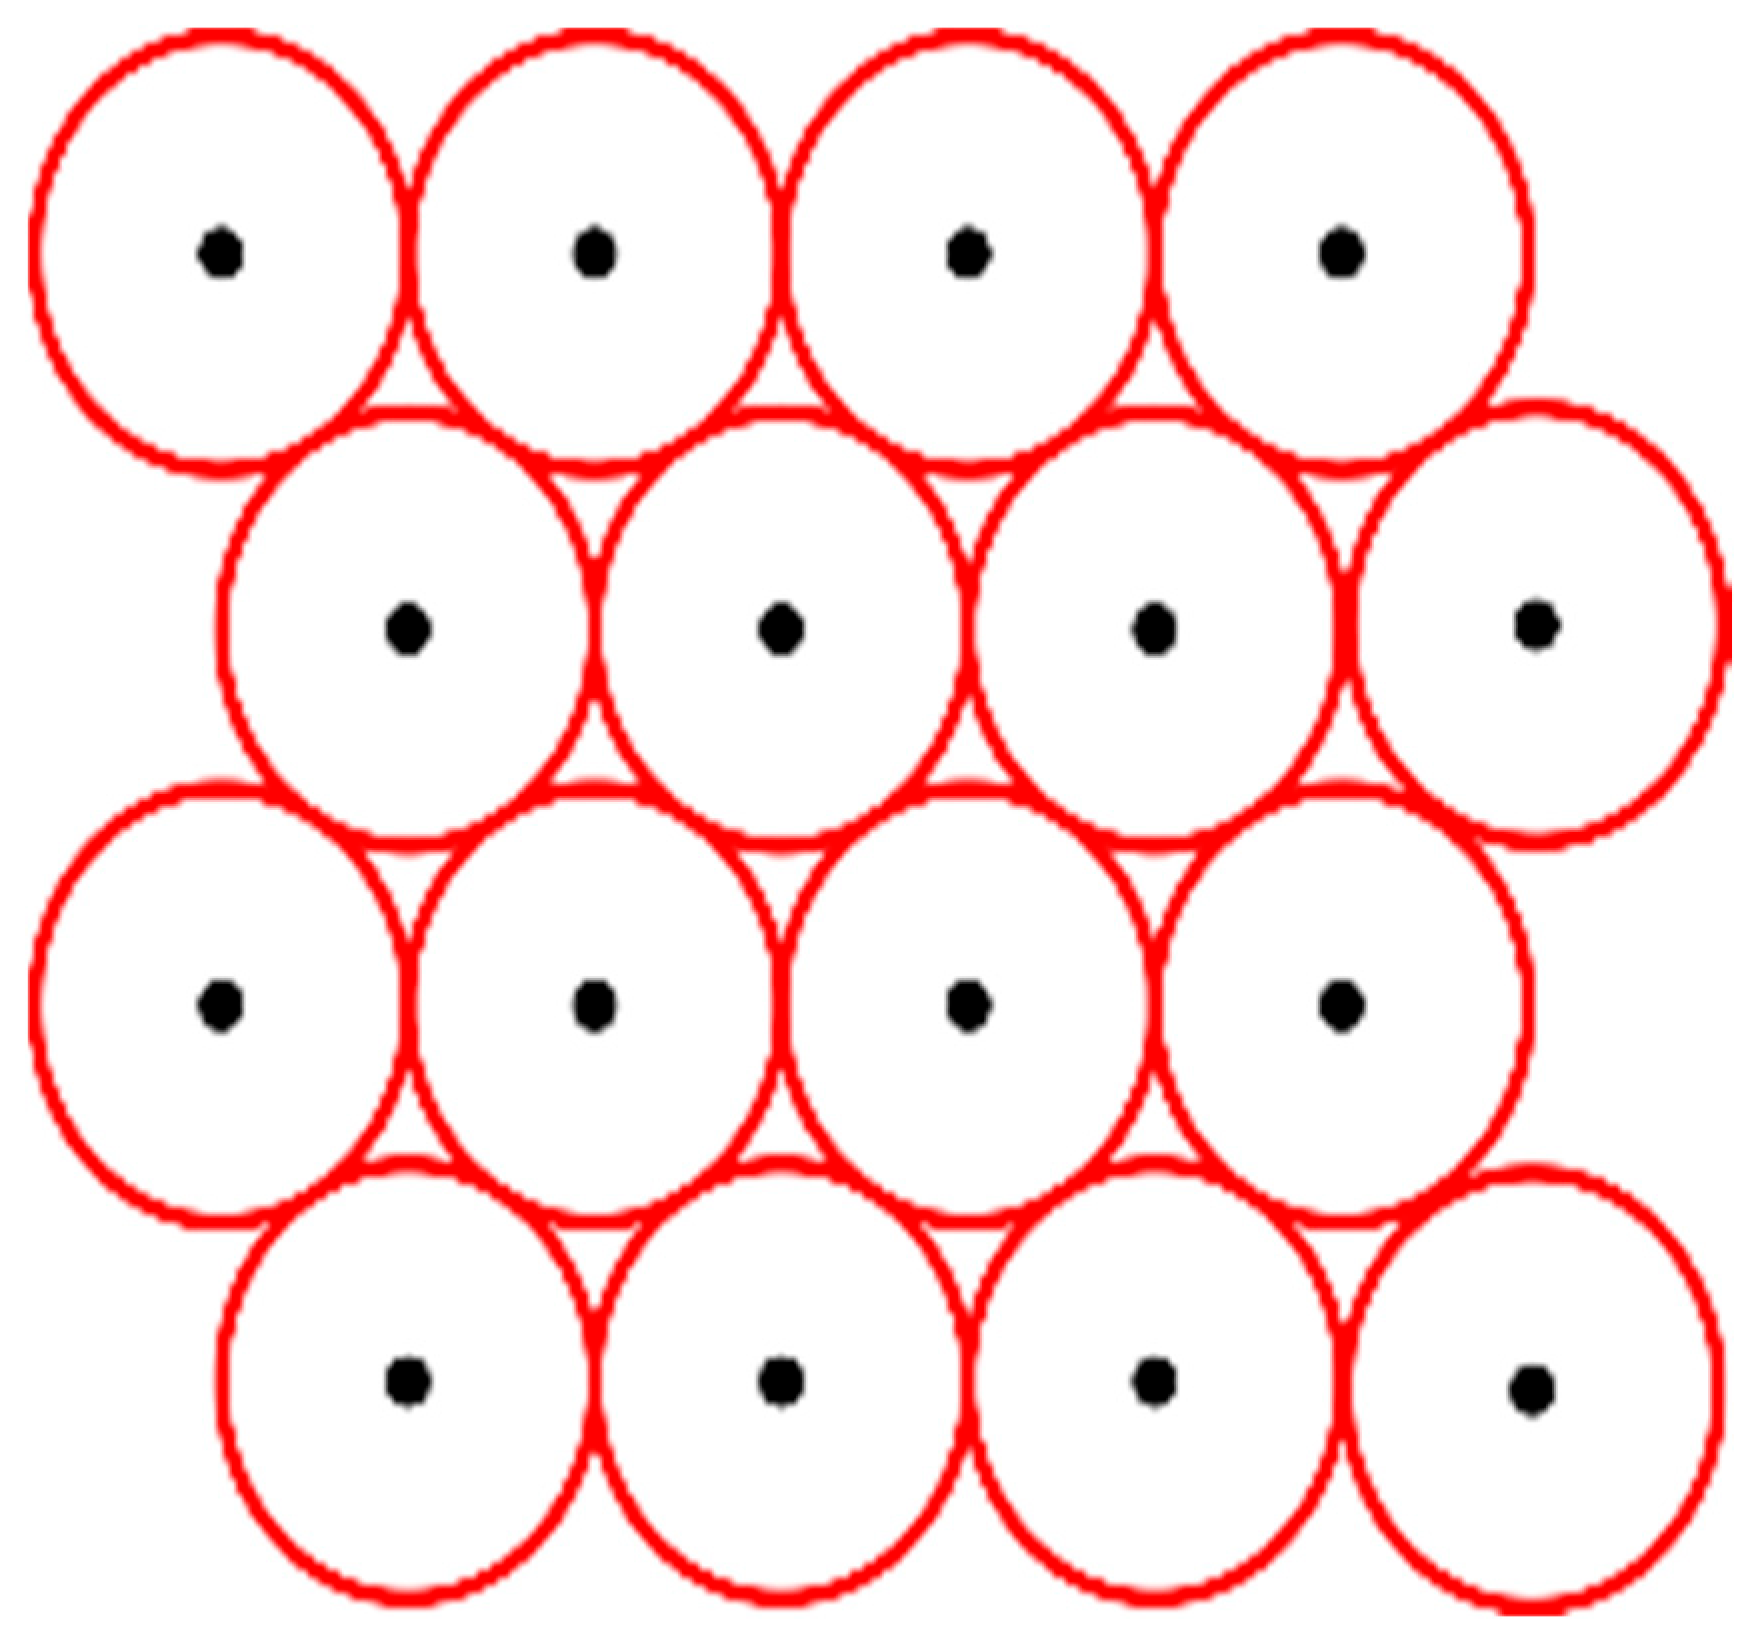
In the first scenario (as illustrated in Figure 4), relay nodes were placed randomly, leading to the need for deployment of a large number of nodes to achieve full coverage, resulting in significant overlap between neighboring relay nodes. The red circles in Figure 4, Figure 5 and Figure 6 mark the boundaries of the transmission range of the relay node, and the white circular area indicates its coverage area. A commonly used model for this kind of placement is the RSA (Random Sequential Adsorption) model, which estimates a packing efficiency of around 55–60% in large-scale scenarios. Since our setup involves only 16 relay nodes, the packing is not dense, so overlap is somewhat lower. Based on reasonable assumptions from prior studies, it is estimated that roughly 20–30% of the area is lost to overlap, resulting in an effective coverage of approximately 58–60%. Employing a square grid layout approach in the second scenario (Figure 5) yielded notable enhancements, improving coverage to about 79%. However, the use of a hexagonal grid (Figure 6) proved to be the most effective, ameliorating both coverage and performance. In the hexagonal grid scenario, the probability of collision is significantly reduced. Furthermore, this setup offers two additional benefits: improved spatial coverage and reduced gaps between nodes, with an estimated overall coverage of approximately 91%.
The inter-relay distance in all grid scenarios (square and hexagonal) is twice the transmission range of the end nodes, which is 250 m. Each node knows the coordinates of the relay nodes and the gateway as placed at the initial setup before starting the simulation, and always connects to its nearest relay, preventing packet duplication and avoiding being in a conflict zone. If the end node is out of communication range of all relays, then it sends the packet directly to the gateway. In the extremely rare case of simultaneous reception by adjacent relays packets are handled as separate transmissions if it occurs, but our simulation parameters (three-decimal coordinate precision) make this practically negligible. When it happens, the packet is transmitted twice to the gateway, through the two different relay nodes (inside the end node’s transmission range).

3.3. Handling Out-of-Range Nodes

The protocol also accounts for edge cases scenarios. A small number of nodes may fall outside the coverage of any relay node due to the hexagonal arrangement. These nodes transmit directly to the gateway using a separate TDMA frame reserved for such cases.
This direct communication of out-of-range nodes with the central gateway may initially seem unusual but is based on energy efficiency considerations. By increasing the transmission power, these nodes can directly reach the gateway, thereby avoiding the use of the relay node. If such nodes were to first communicate with a relay node using increased power and then have the relay forward the packet to the gateway, this would result in two transmissions (node to relay and relay to gateway). In contrast, a single direct high-power transmission to the gateway can be more energy-efficient overall, since it avoids the additional hop and processing at the relay node.
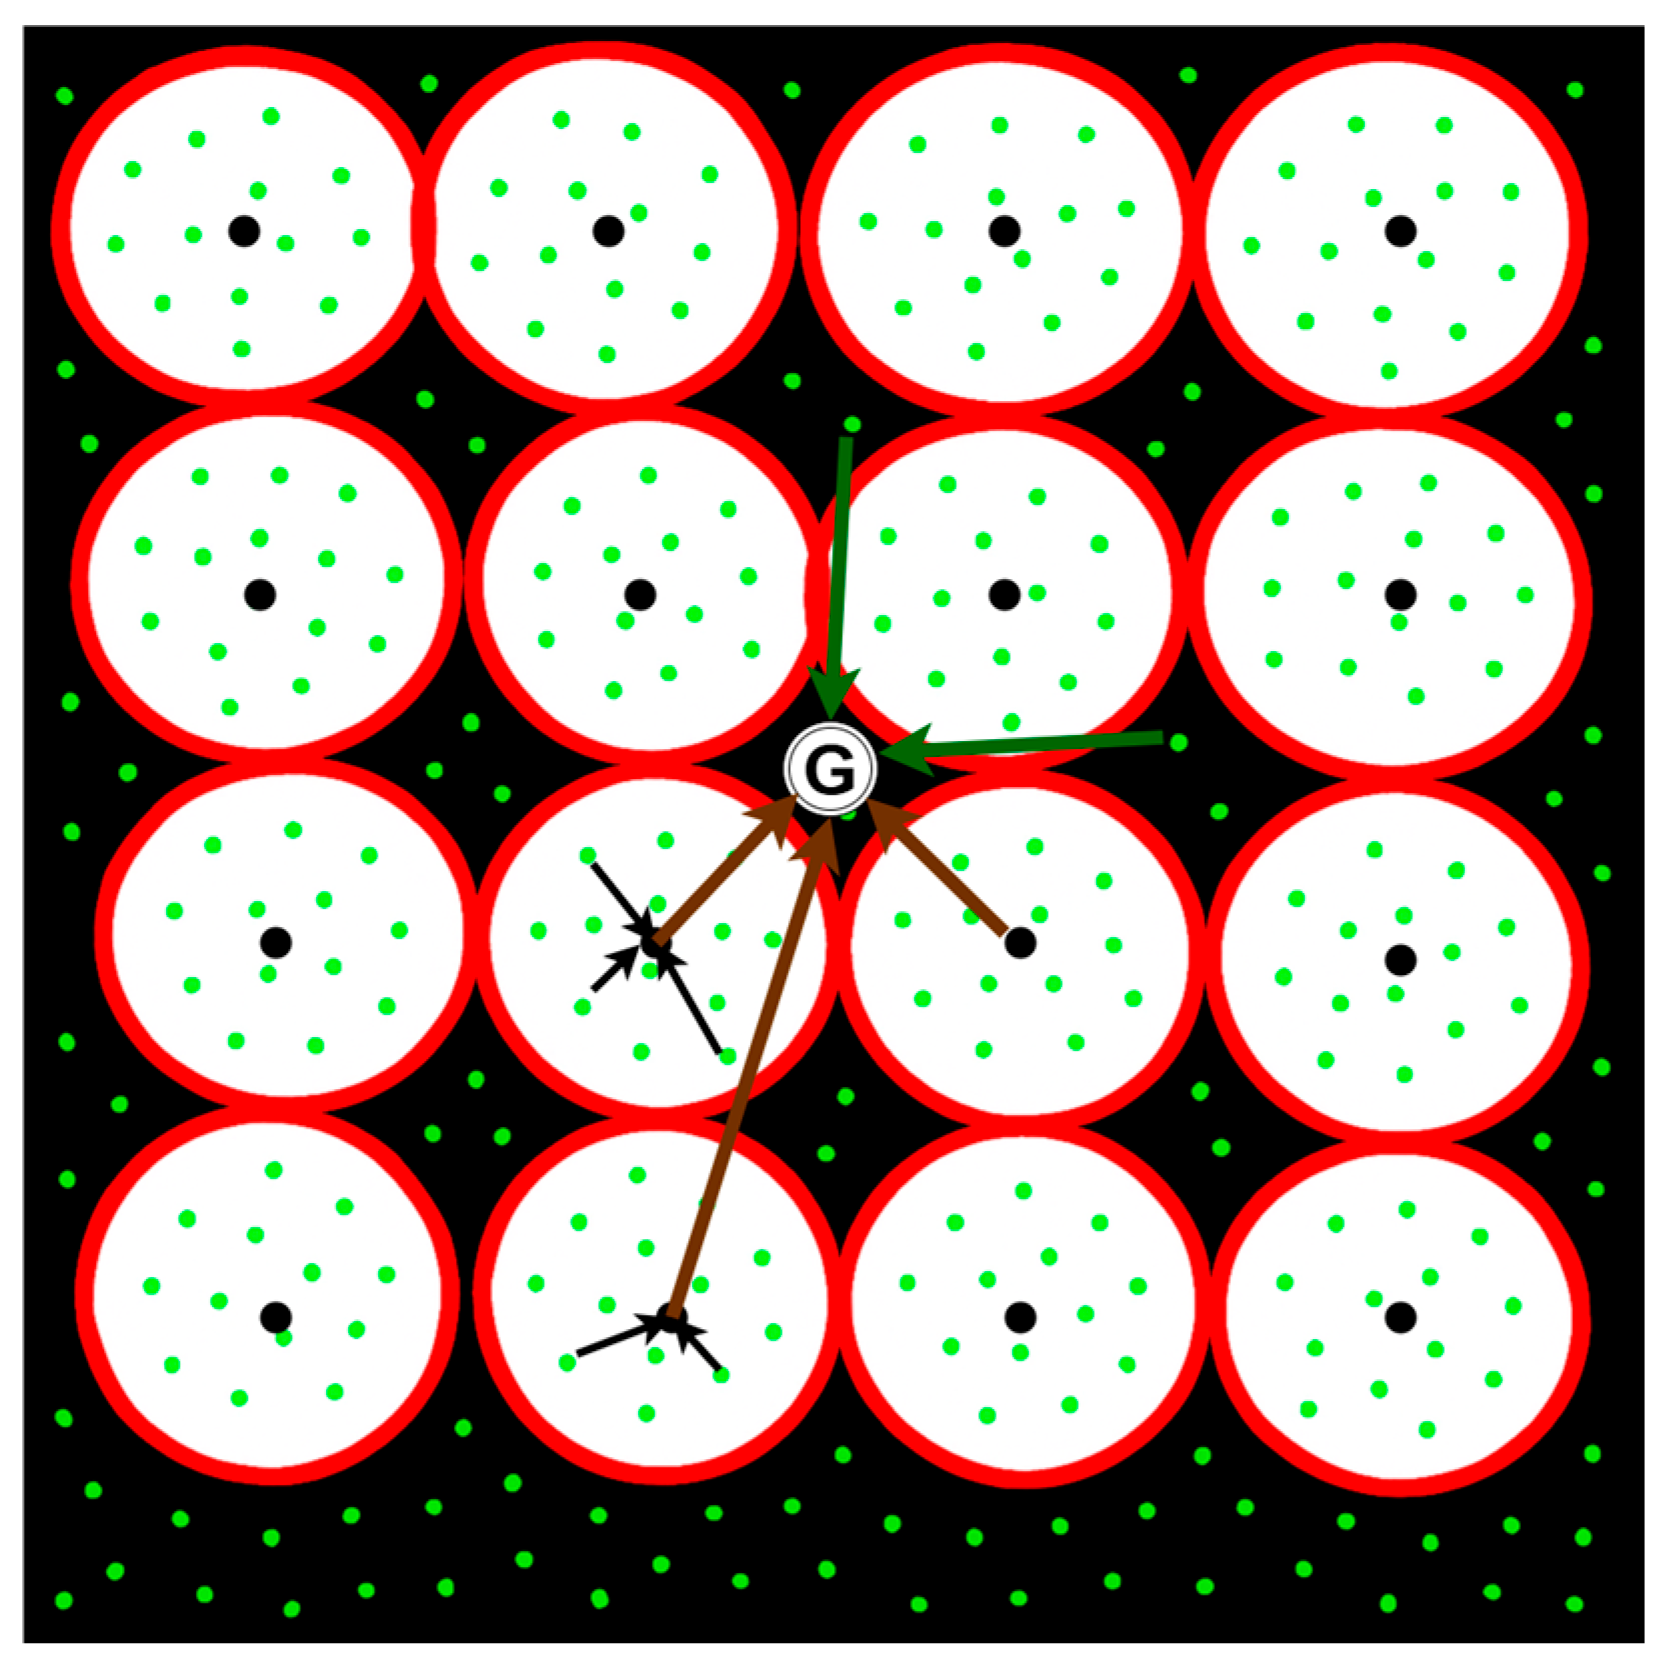
The figure below (Figure 7) illustrates this mechanism for the square grid. In this figure, the end nodes (100) are represented by green dots, the relay nodes (16) are shown as black dots, and the white circle in the center labeled “G” represents the gateway. The white circular area around each relay node indicates its coverage area, while the red line marks the boundaries of its transmission range. The black arrows represent packet transmission from end nodes to relay nodes, while the brown arrows represent transmission from relay nodes to the gateway.
Nodes located in the black areas are out of range and therefore send their packets directly to the gateway (represented by green arrows for illustration). This communication method applies to all out-of-range nodes, regardless of their distance from the gateway.
Prior to each experiment, the frequency of this frame is set according to the ratio of out-of-range nodes to the total number of nodes. Regarding sharing nodes that do not have relay nodes, it is assumed in this work that there is the same likelihood that a node exists in any location.
Finally, to improve the responsiveness of the protocol under different traffic conditions, three different backoff values were tested for the Slotted ALOHA layer. We selected relatively high backoff percentages (10%, 2.5%, 1%) in order to avoid the avalanche effect. In Slotted ALOHA, if the backoff values are too small, many nodes that collide will reattempt transmission after only a short delay, leading to repeated simultaneous retransmissions and causing the network throughput to collapse. By using larger backoff percentages, we spread retransmissions more evenly across future slots, reducing the probability of repeated collisions and stabilizing the network, especially when traffic (G) is high. This allowed an assessment of how varying retransmission timing affects overall delay and throughput, especially under increased load conditions. As expected, higher network load led to more frequent retransmissions at the first level, increasing delay and reducing throughput—particularly evident in scenarios with minimal spacing or less efficient relay placement.


4. Simulation Results

4.1. Simulation Setup

4.1.1. Scope and Modeling Philosophy

A network simulator developed in Java was employed to assess the performance of the proposed multi-hop LoRaWAN protocol. The simulator was intentionally designed as a lightweight, purpose-built tool to enable controlled and repeatable evaluation of relay node placement strategies under identical conditions. The primary objective of the simulation is not to provide absolute performance predictions for real-world LoRaWAN deployments, but rather to isolate and compare relative performance trends arising from spatial relay placement and dual-layer MAC coordination in multi-hop scenarios.
To achieve this goal, the simulator adopts deterministic and conservative modeling assumptions that intentionally bias results toward higher collision probability. This design choice ensures that any observed performance improvements can be attributed solely to relay placement and MAC-layer operation, rather than to favorable or stochastic physical-layer effects. The simulator logic is deterministic given identical seeds and parameters, ensuring repeatability across experiments. Each simulation scenario was executed over a duration of 10,000 time slots. To ensure statistical robustness, experiments were repeated using multiple independent random seeds affecting node placement and traffic generation. Traffic generation follows a Poisson arrival process. Results presented in this paper correspond to averaged values across runs, following standard practice in comparative network simulation studies.

4.1.2. Simulator Architecture and Assumptions

The simulator operates in discrete slotted time. Space dimensions define the physical area in which end nodes and relay nodes are deployed. The deployment area is defined as a square region with fixed side length. All node coordinates are generated within this area using a common Cartesian coordinate system.
Relay nodes are positioned according to one of three strategies: random placement, square grid placement, hexagonal grid placement with fixed inter-relay distance. For the random placement strategy, relay node positions are generated independently by selecting horizontal and vertical coordinates from a uniform distribution over the deployment area. This results in an unstructured topology where relay locations are randomly scattered, serving as a baseline for comparison. For the square grid placement strategy, relay nodes are positioned at regular intervals along both horizontal and vertical directions, forming an evenly spaced lattice. The distance between adjacent relay nodes is fixed and identical in both dimensions. Only relay nodes whose coordinates fall within the deployment area are retained. This placement results in uniform spacing and equal neighbor distances along orthogonal axes. For the hexagonal grid placement strategy, relay nodes are arranged in staggered rows to form a hexagonal tiling of the deployment area. Relay nodes within the same row are equally spaced, while adjacent rows are vertically offset and horizontally shifted by half the inter-relay distance. This configuration produces a more uniform spatial distribution than the square grid and reduces overlap between neighboring relay coverage regions.
A single gateway is placed at the geometric center of the deployment area and remains fixed across all simulation scenarios.
End nodes are randomly distributed within the deployment area following a uniform spatial distribution. Each end node associates with the geographically nearest relay node based on Euclidean distance. If an end node is located outside the coverage range of all relay nodes, it communicates directly with the gateway. This association rule is applied consistently across all placement strategies to ensure fair and topology-driven comparisons.
The propagation model is based on a log-distance path loss formulation with a fixed transmission range R. Fading is not included, allowing the study to focus on the interaction between relay placement and MAC-layer behavior without introducing random signal fluctuations caused by environmental variability. Transmission ranges are predefined for node-to-relay and relay-to-gateway communication, enabling consistent spatial comparisons across scenarios.

4.1.3. Conservative Collision Model and Validation

The simulator employs a deterministic, slot-level collision model. If two or more devices transmit to the same relay node within the same time slot, a collision is declared and all involved packets are dropped. Collided packets remain in the node queue and are rescheduled for transmission using a predefined backoff procedure.
The capture effect, fading, shadowing, timing synchronization errors, and external interference are intentionally excluded. These exclusions represent conservative assumptions compared to real LoRaWAN behavior, where capture effects and power imbalances often allow successful packet reception despite concurrent transmissions. By excluding such effects, the simulator avoids optimistic bias and provides a stricter evaluation of collision dynamics, congestion, and relay placement efficiency.
Although simplified, the simulator’s behavior is externally supported by the consistency of observed trends with well-established analytical and simulation-based studies on LoRaWAN collision probability, duty-cycle limitations, scalability and throughput saturation. The relationships between offered load, retransmissions, delay, and throughput observed in the results align with prior published findings, providing confidence in the correctness of the implemented logic and the robustness of the comparative conclusions.
To further ensure correctness of the simulator implementation, multiple sanity checks were performed. These include verifying expected trends under extreme parameter settings (e.g., zero relay nodes and maximum relay density), confirming consistency of results across independent random seeds, and observing qualitative agreement with well-established behaviors reported in the LoRaWAN literature, such as increased collision probability and throughput saturation under high offered load and duty-cycle constraints. While the simulator is not intended to reproduce detailed PHY-level effects, these checks provide confidence in the correctness of the logical model and its suitability for comparative, topology-driven analysis.
Finally, the simulator framework is modular and extensible. Future work will incorporate more complex physical-layer models, including capture effects, Rayleigh fading, interference, and obstacle-aware propagation, in order to evaluate performance degradation relative to the idealized benchmark scenarios considered in this study.
Table 1 represents the exact set of assumptions and variables used for the network simulator.

4.2. Definitions of Metrics

The key metrics presented in the results are defined as follows:
Delay: The mean number of time slots between the generation of a packet at a source node and its successful reception at the gateway. Delay includes retransmission waiting times caused by collisions and backoff.
Traffic/Network Load (G): Defined as the average number of packets generated per slot, i.e., the packet generation rate.
Throughput (S): Defined as the average number of packets successfully delivered to the gateway per slot.
Backoff (%): The fraction of the total experiment time that a node waits before retransmitting after a collision. For instance, a 10% backoff means that the node will postpone its retransmission by a random time interval corresponding to 10% of the simulation duration.

4.3. Results and Observations

All results are interpreted comparatively across relay placement strategies under identical assumptions, and should be viewed as trend-based rather than absolute performance metrics. By arranging relay nodes in structured grids (hexagonal or square), network throughput is significantly improved, and collisions are reduced when compared to random relay node placement. This enhancement occurs as end nodes are grouped into smaller, more manageable clusters, reducing interference.
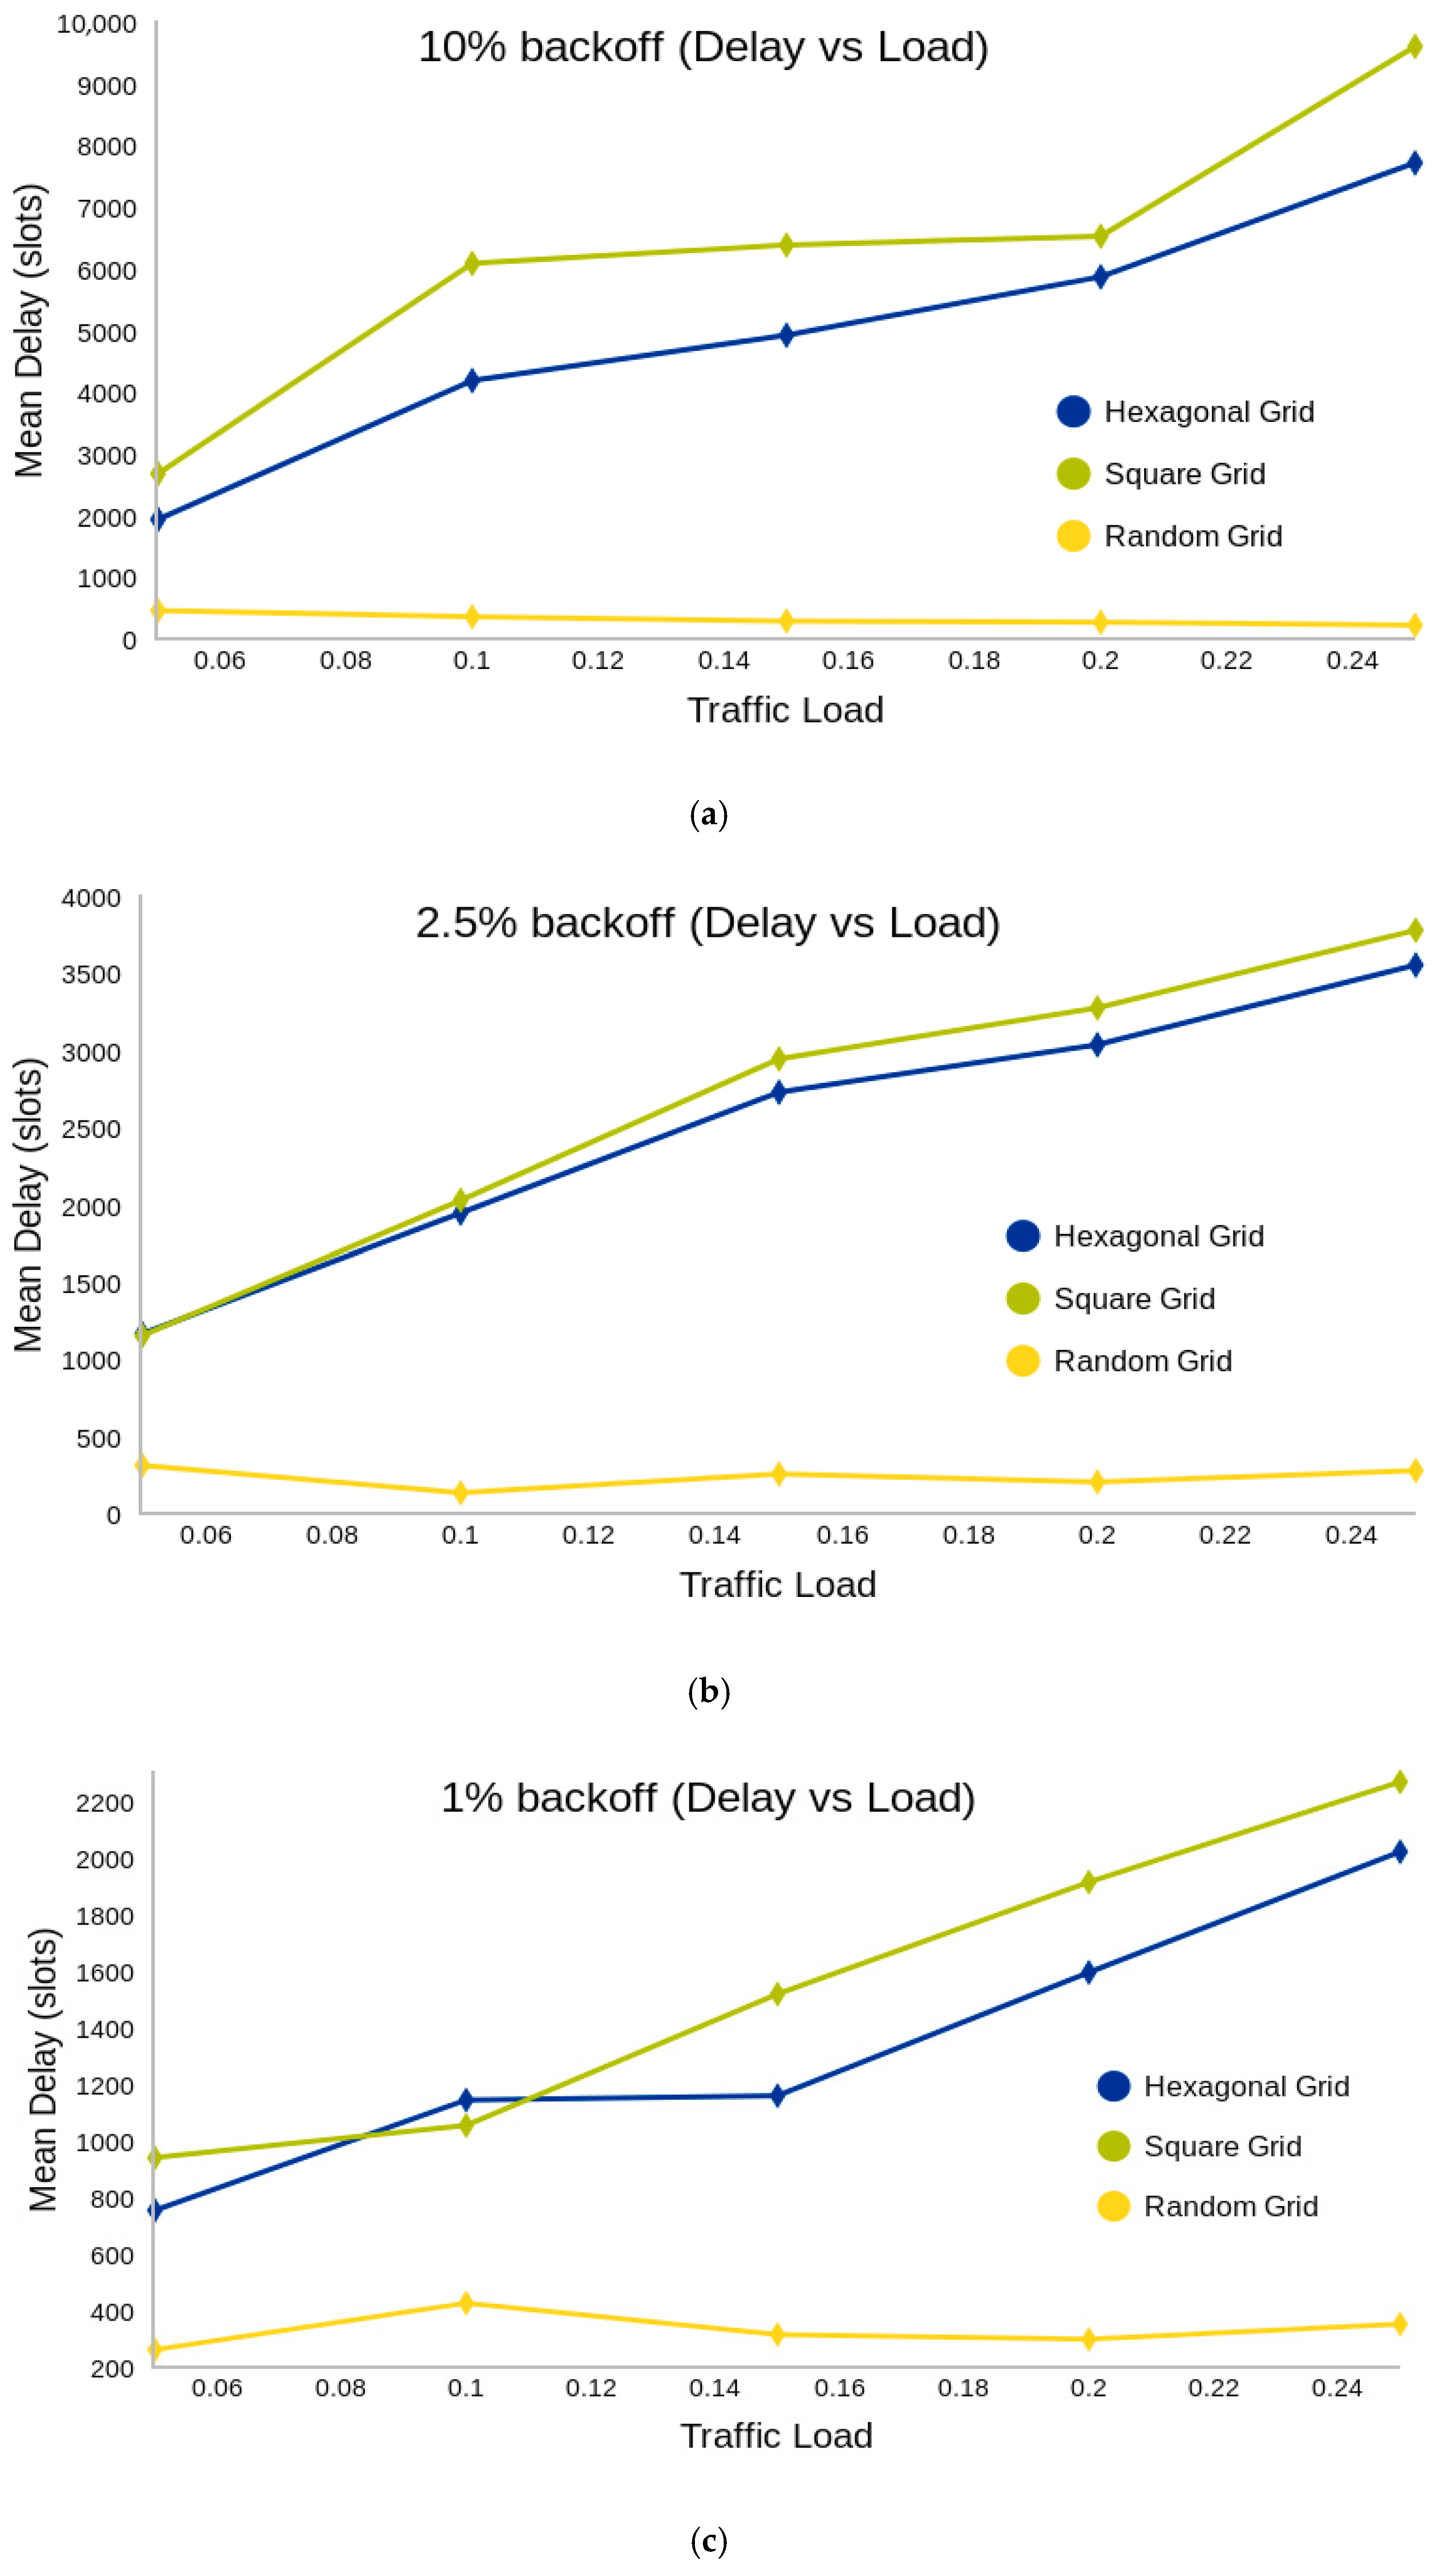
Delay and Network Load: Figure 8 reveals that as network load increases, delay also rises. Additionally, the hexagonal grid outperforms the square grid by exhibiting lower delays, highlighting its superior performance. The hexagonal grid layout results in lower delays compared to the square grid, mainly because it reduces the number of nodes that fall outside the coverage area of relay nodes. In the square grid, more nodes are out of range and tend to transmit at the same time, increasing the likelihood of collisions. These collisions lead to retransmissions and queue buildup, which in turn increase overall delay. Out-of-range nodes use the same frame in TDMA, so the more nodes there are, the longer the delay. The more uniform and efficient coverage provided by the hexagonal layout reduces the number of out-of-range cases and distributes traffic more evenly, resulting in improved performance and lower latency.
The duration of the backoff and the total duration are set at the nodes and in their configuration before the start of the experiment. These results hold true across all three tested backoff values (10%, 2.5%, and 1%), as shown in Figure 8a–c, which were tested for variability. The delay in the random grid is extremely low because very few packets arrive, and the delay is only measured for packets that arrive successfully at their destination. Since most packets are out of range, the ones within range are able to reach their destination more quickly and with fewer collisions through the corresponding relay nodes. However, out-of-range packets experience frequent collisions due to their high number and the limitation of a single TDMA frame. Each relay node has its own slot in the TDMA; however, out-of-range nodes share a slot, resulting in collisions. As a result, most of these packets fail to arrive and are not included in the calculation of the mean delay. On the contrary, each relay node is assigned a dedicated TDMA slot for communication with the gateway, ensuring that no collisions occur during this phase.
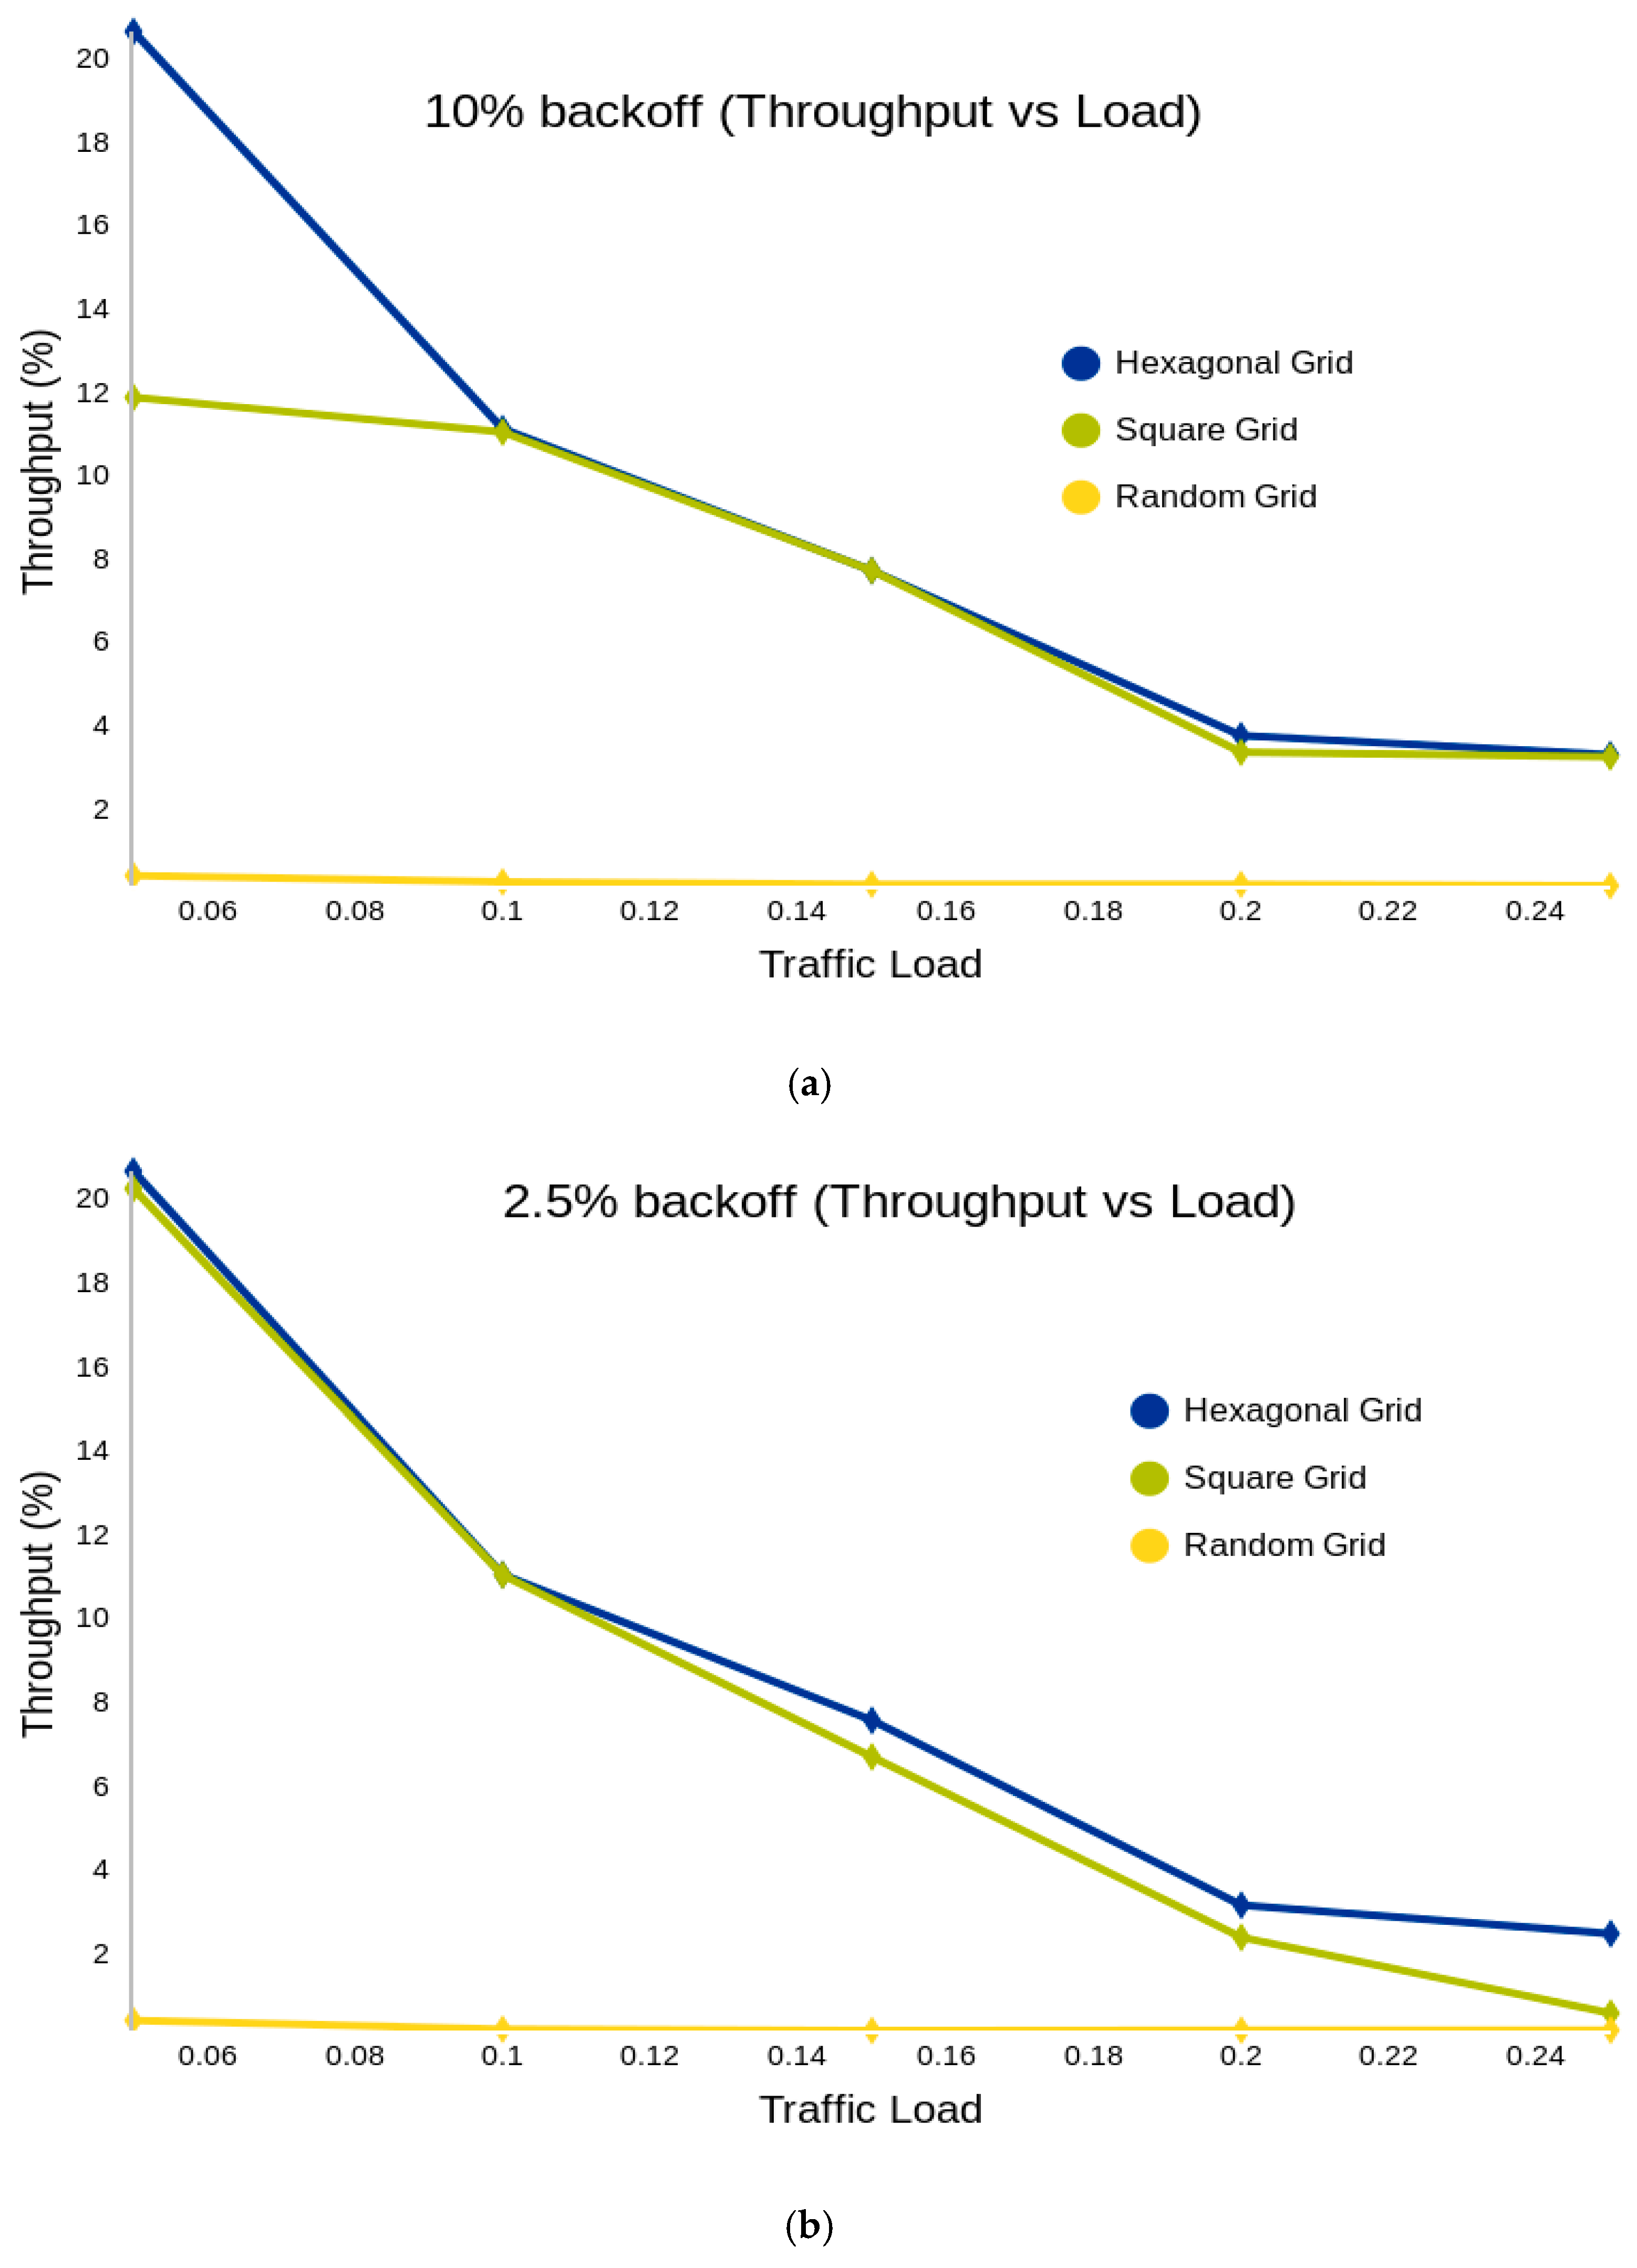
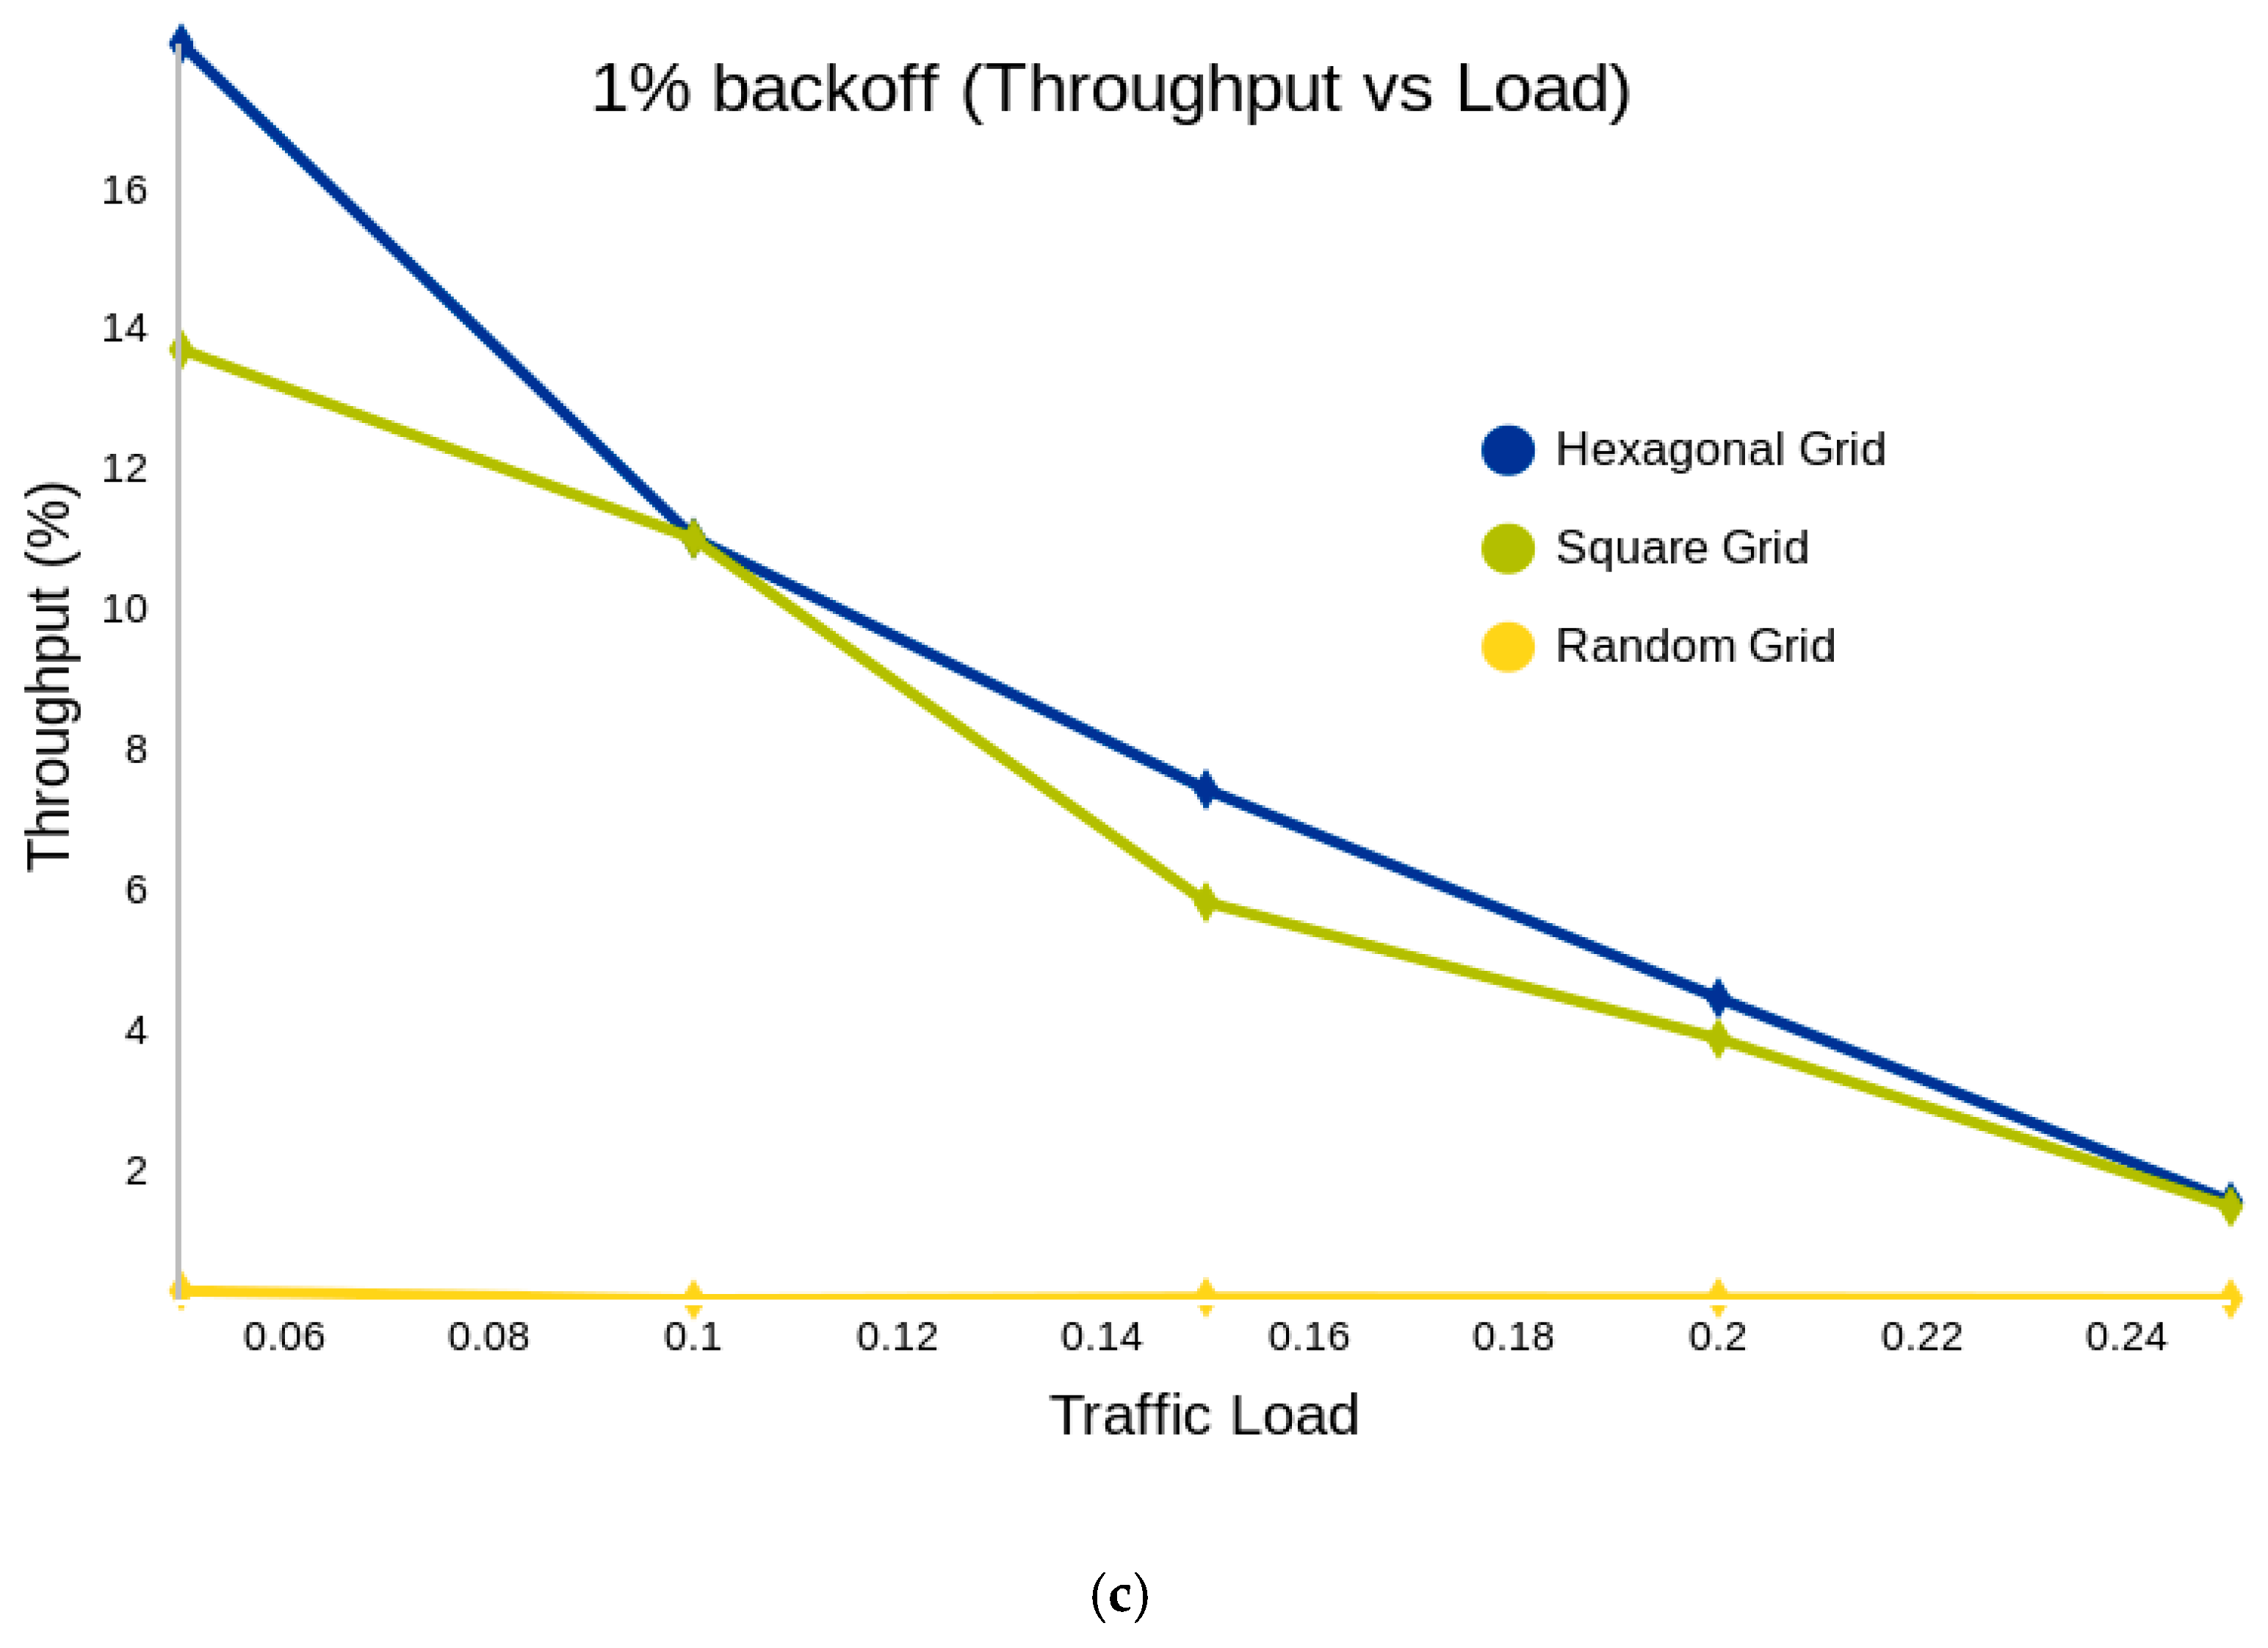
Throughput and Network Load: Figure 9 presents the relationship between network load and throughput. As the network load increases, throughput decreases. This is mainly due to a rise in packet retransmissions at the first level, where slotted ALOHA is used. Higher load leads to more collisions, triggering frequent retransmissions and ultimately reducing the overall throughput. The hexagonal grid consistently achieves the highest throughput, further confirming its effectiveness. This trend is consistent across the three different backoff values (10%, 2.5% and 1%). The throughput in the random grid relay node placement is nearly zero due to poor spatial distribution and elevated collision rates. Because relay nodes are placed without structure, many end nodes fall outside any relay’s coverage area and cannot transmit. Nodes that are within range tend to cluster unevenly, which increases the likelihood of collisions under Slotted ALOHA and lowers the number of successfully delivered packets. The low delay observed is not indicative of network efficiency, but rather a consequence of limited packet delivery—mostly from uncongested relays. As few packets reach relay nodes, TDMA slots are underutilized, and the gateway channel remains largely idle, further degrading system throughput.
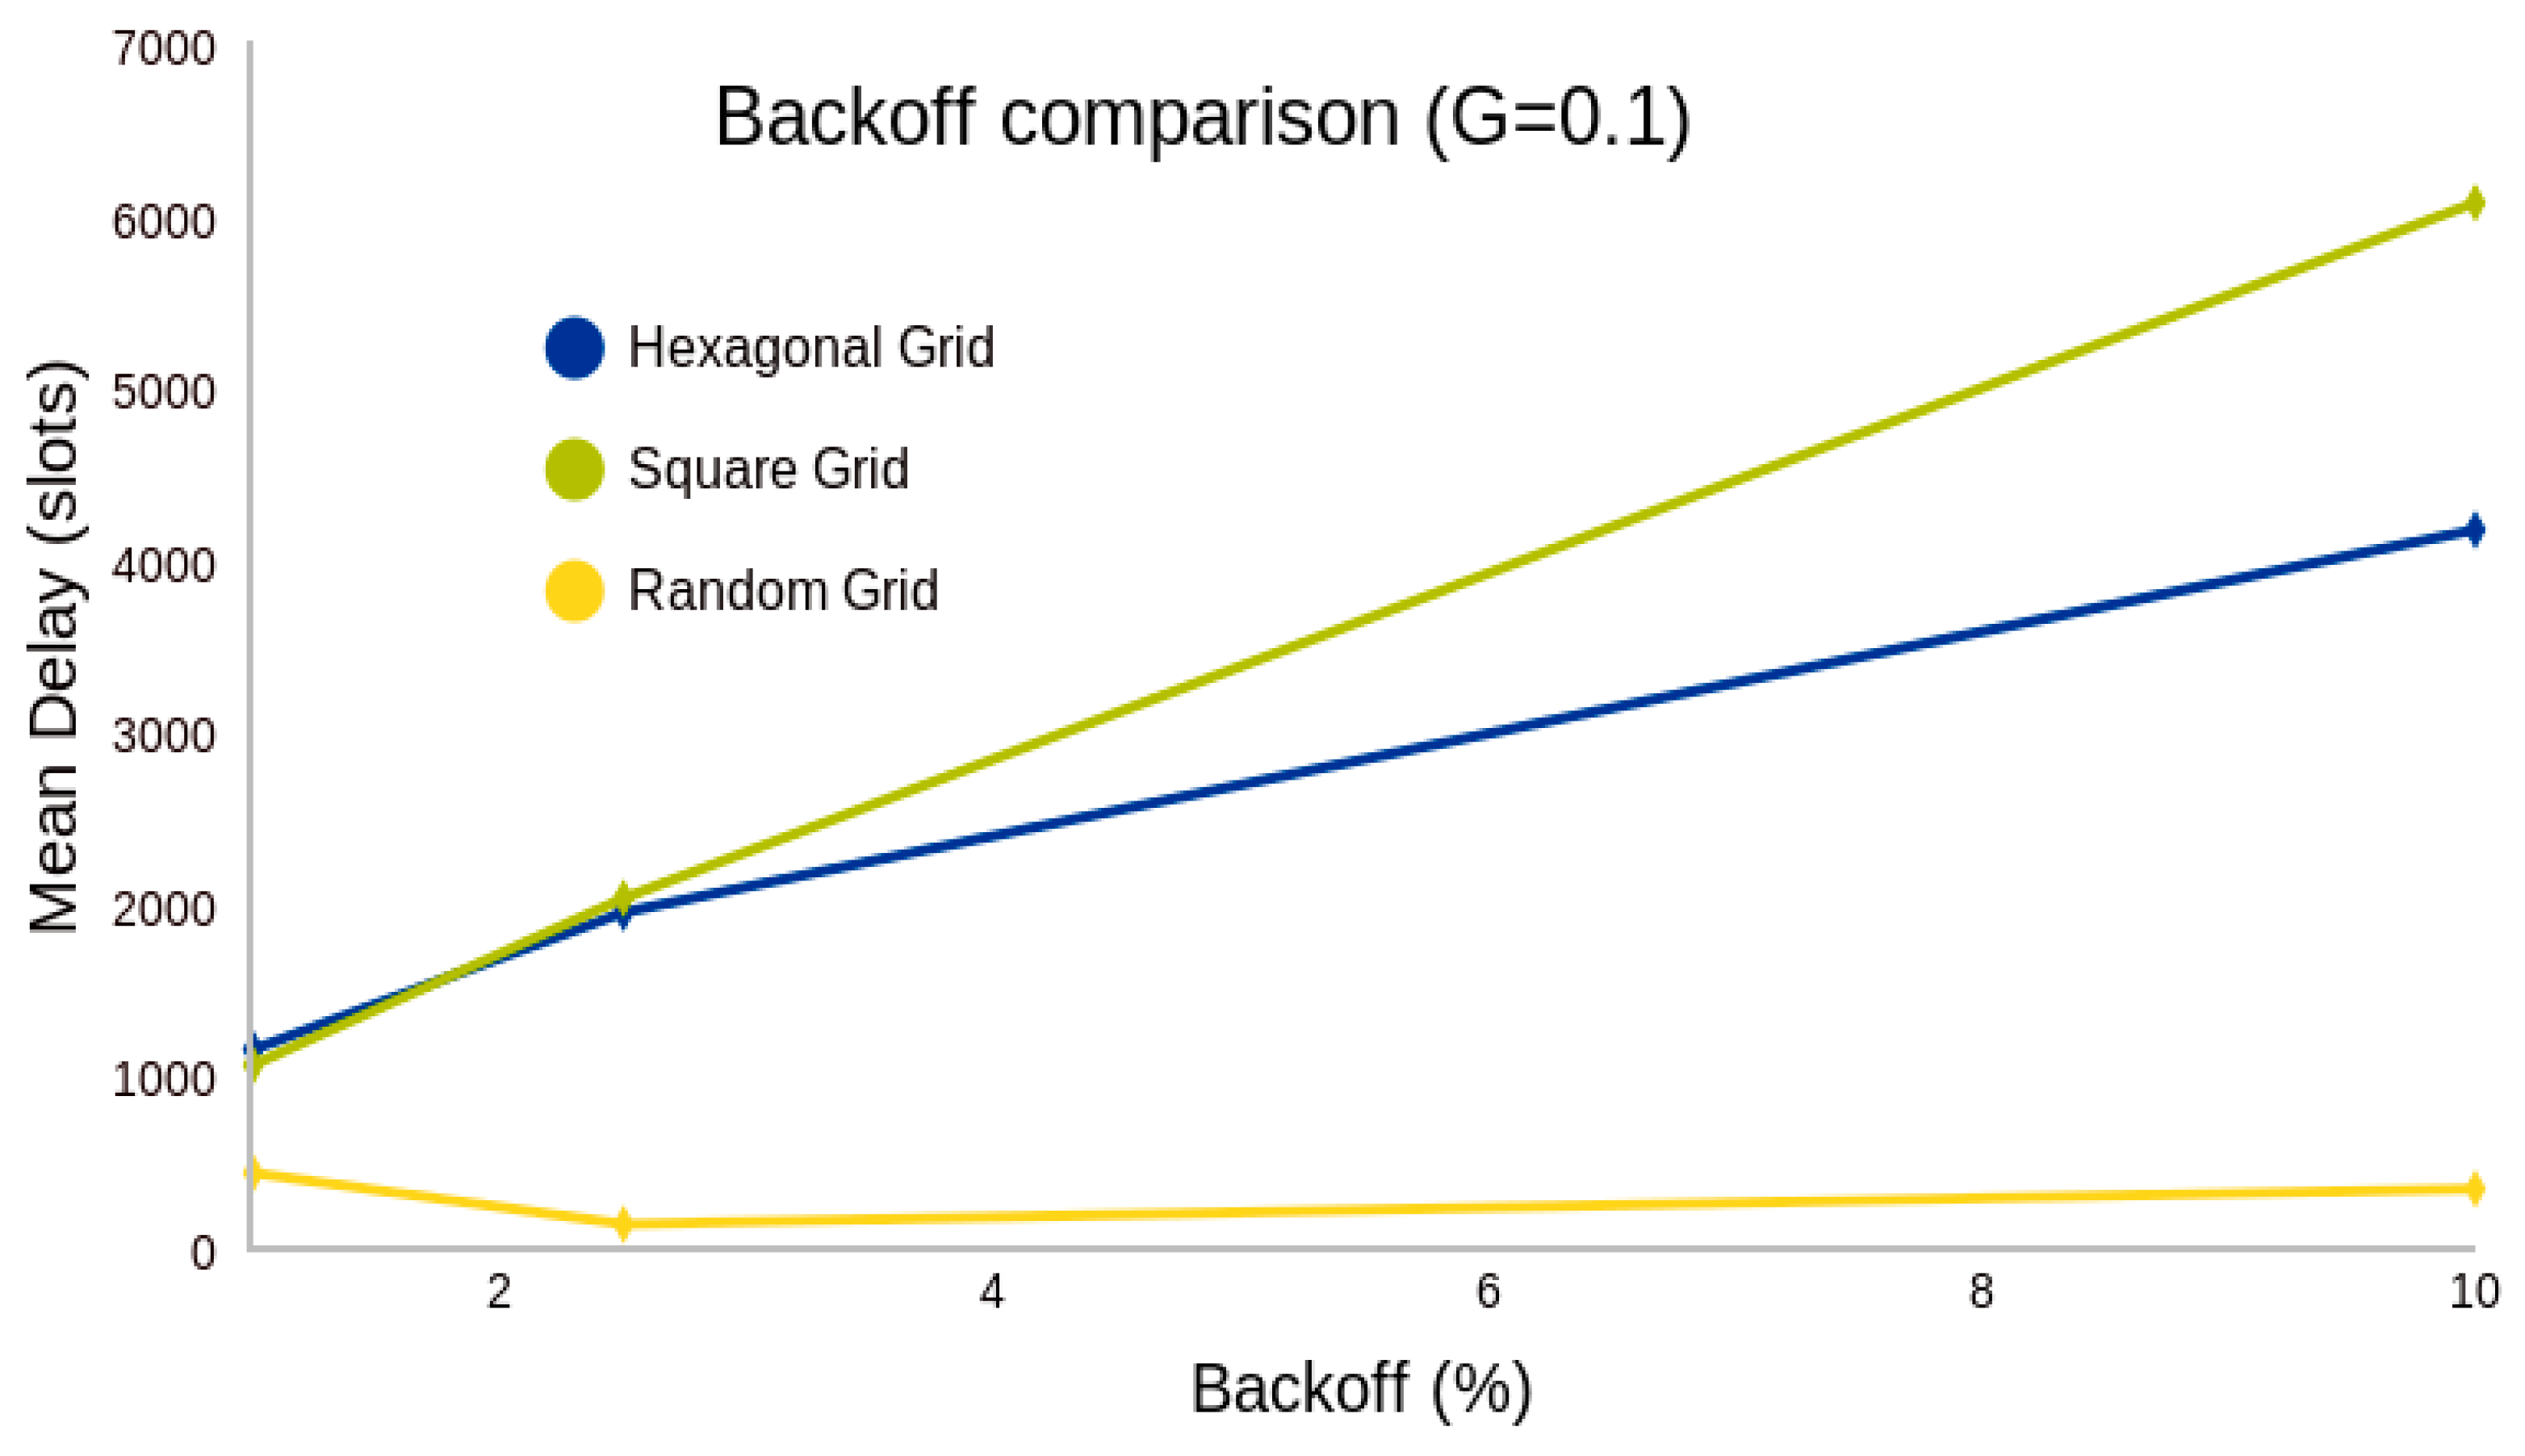
Backoff Impact on Delay: Figure 10 compares the average delay across three different backoff values, demonstrating that as backoff increases, delay also increases—an expected outcome since failed packet transmissions require additional time for retransmission. Furthermore, it is evident that the hexagonal grid consistently results in lower delay compared to the square grid. The network load applies to each device separately.
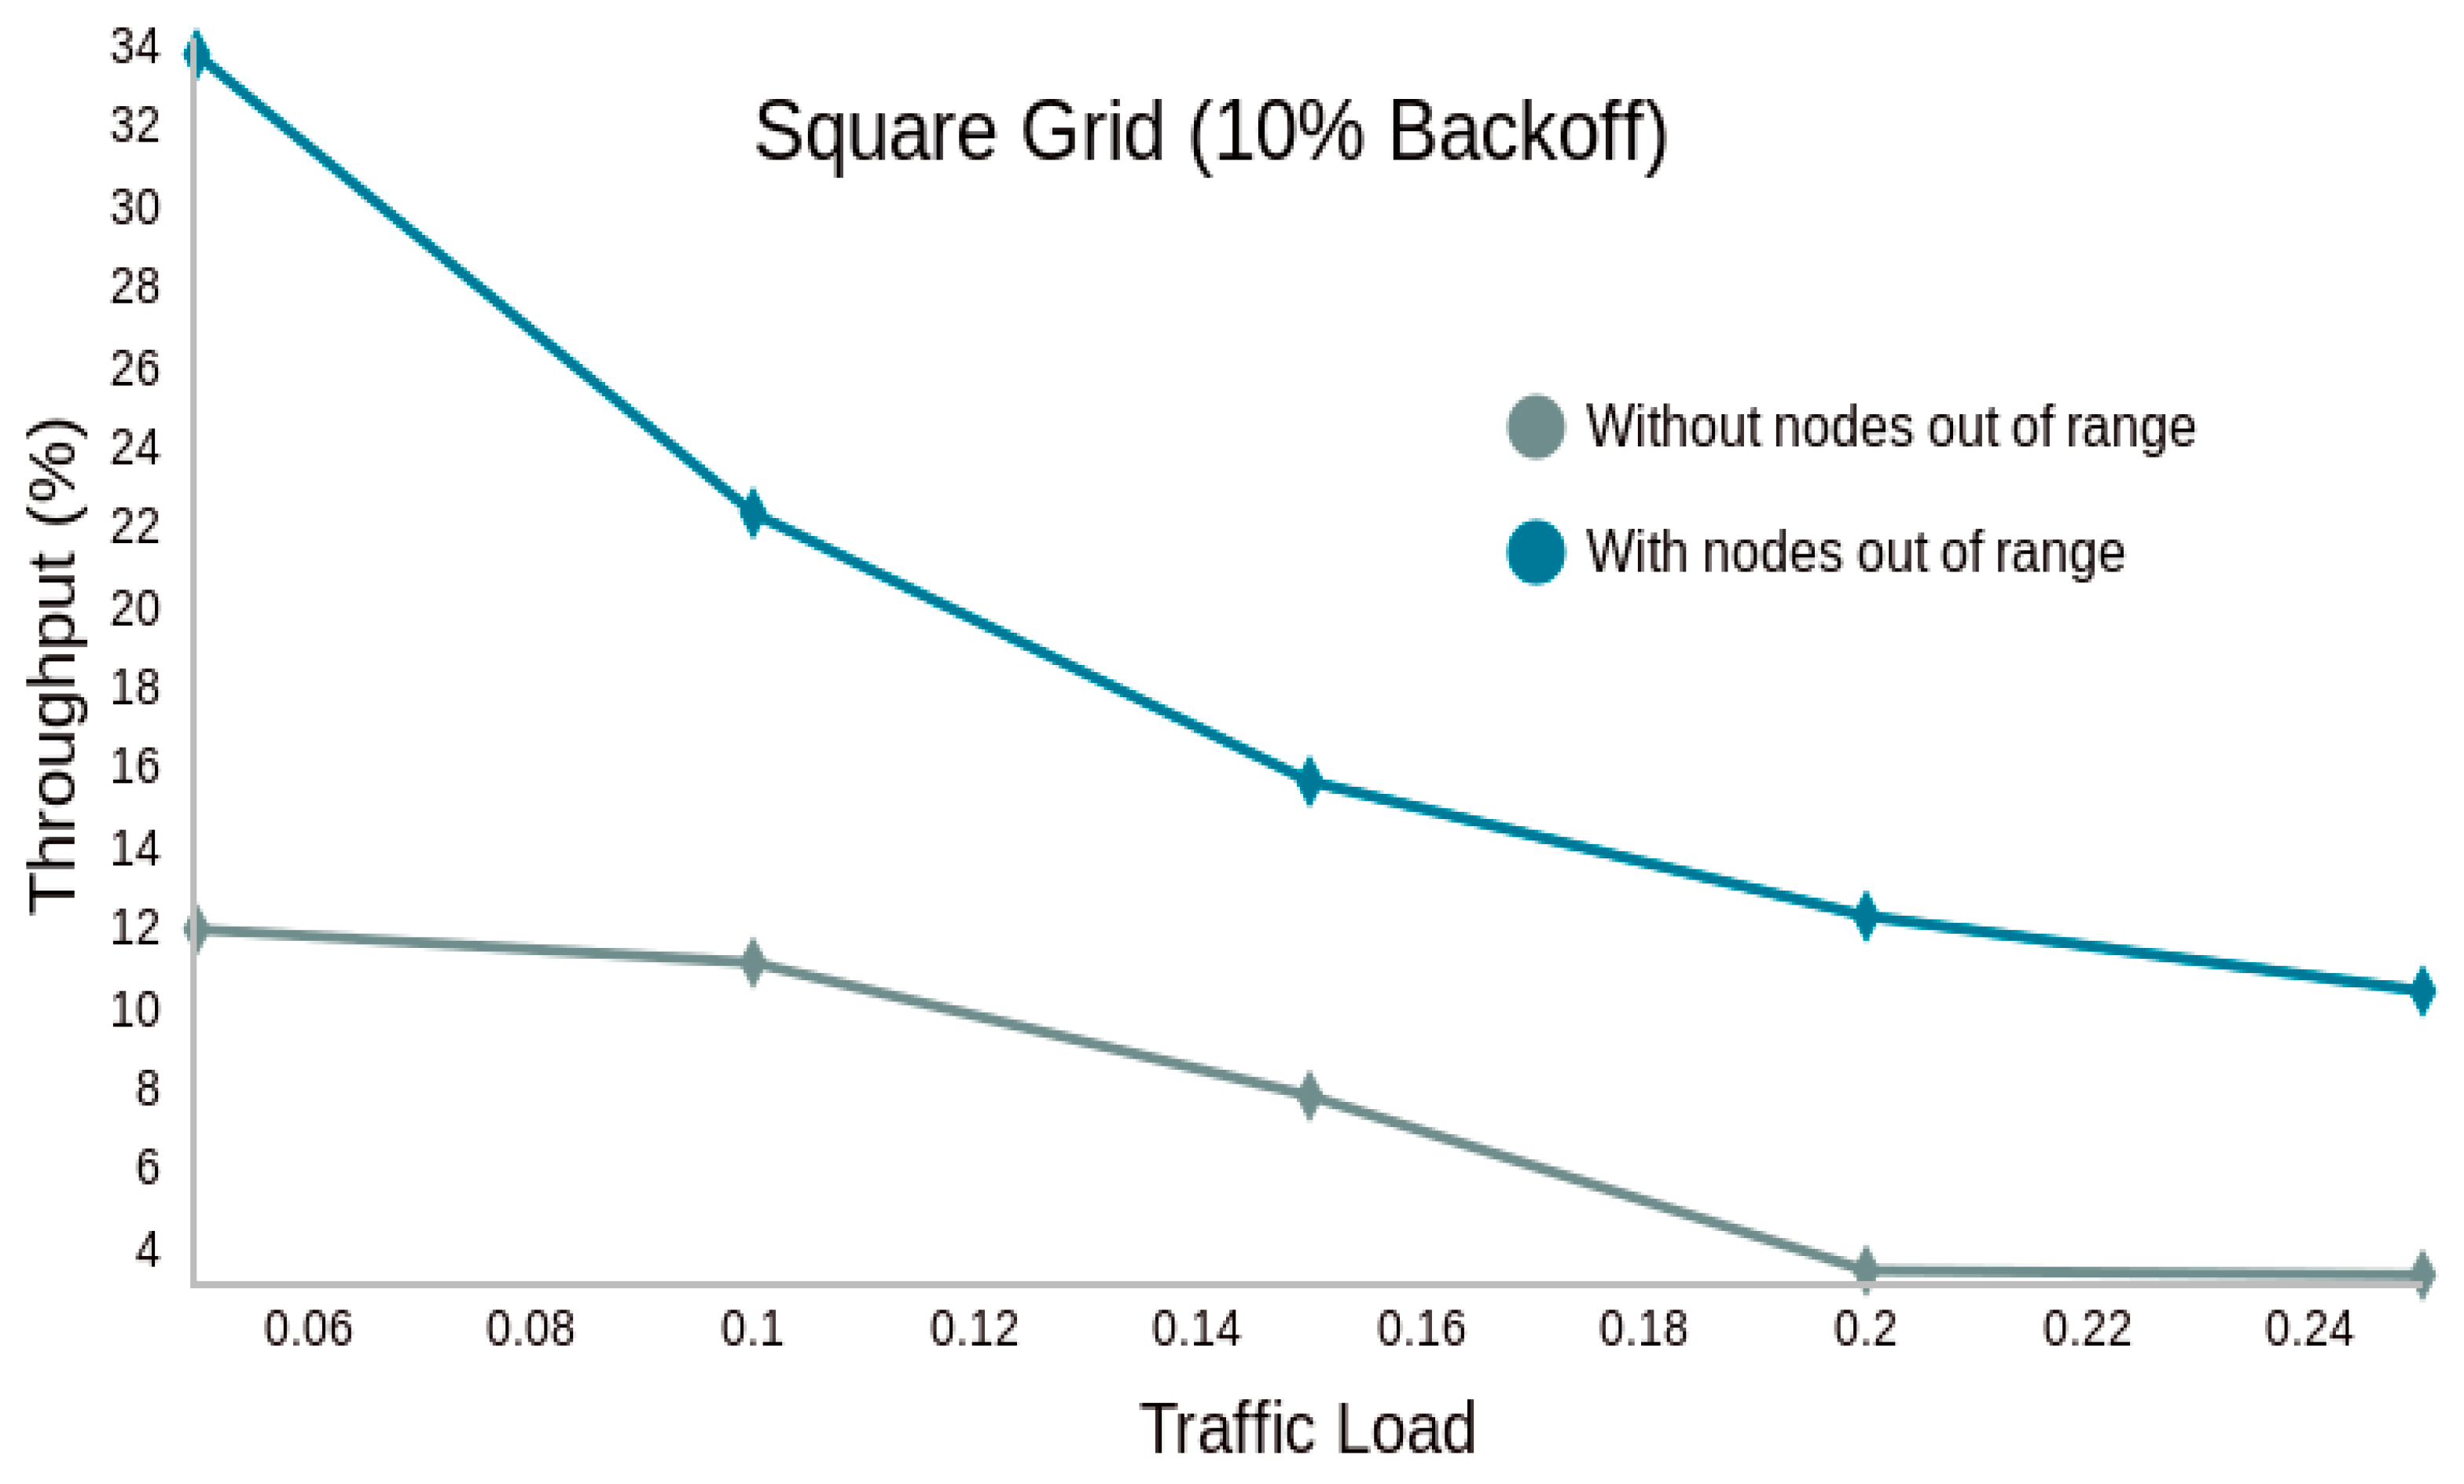
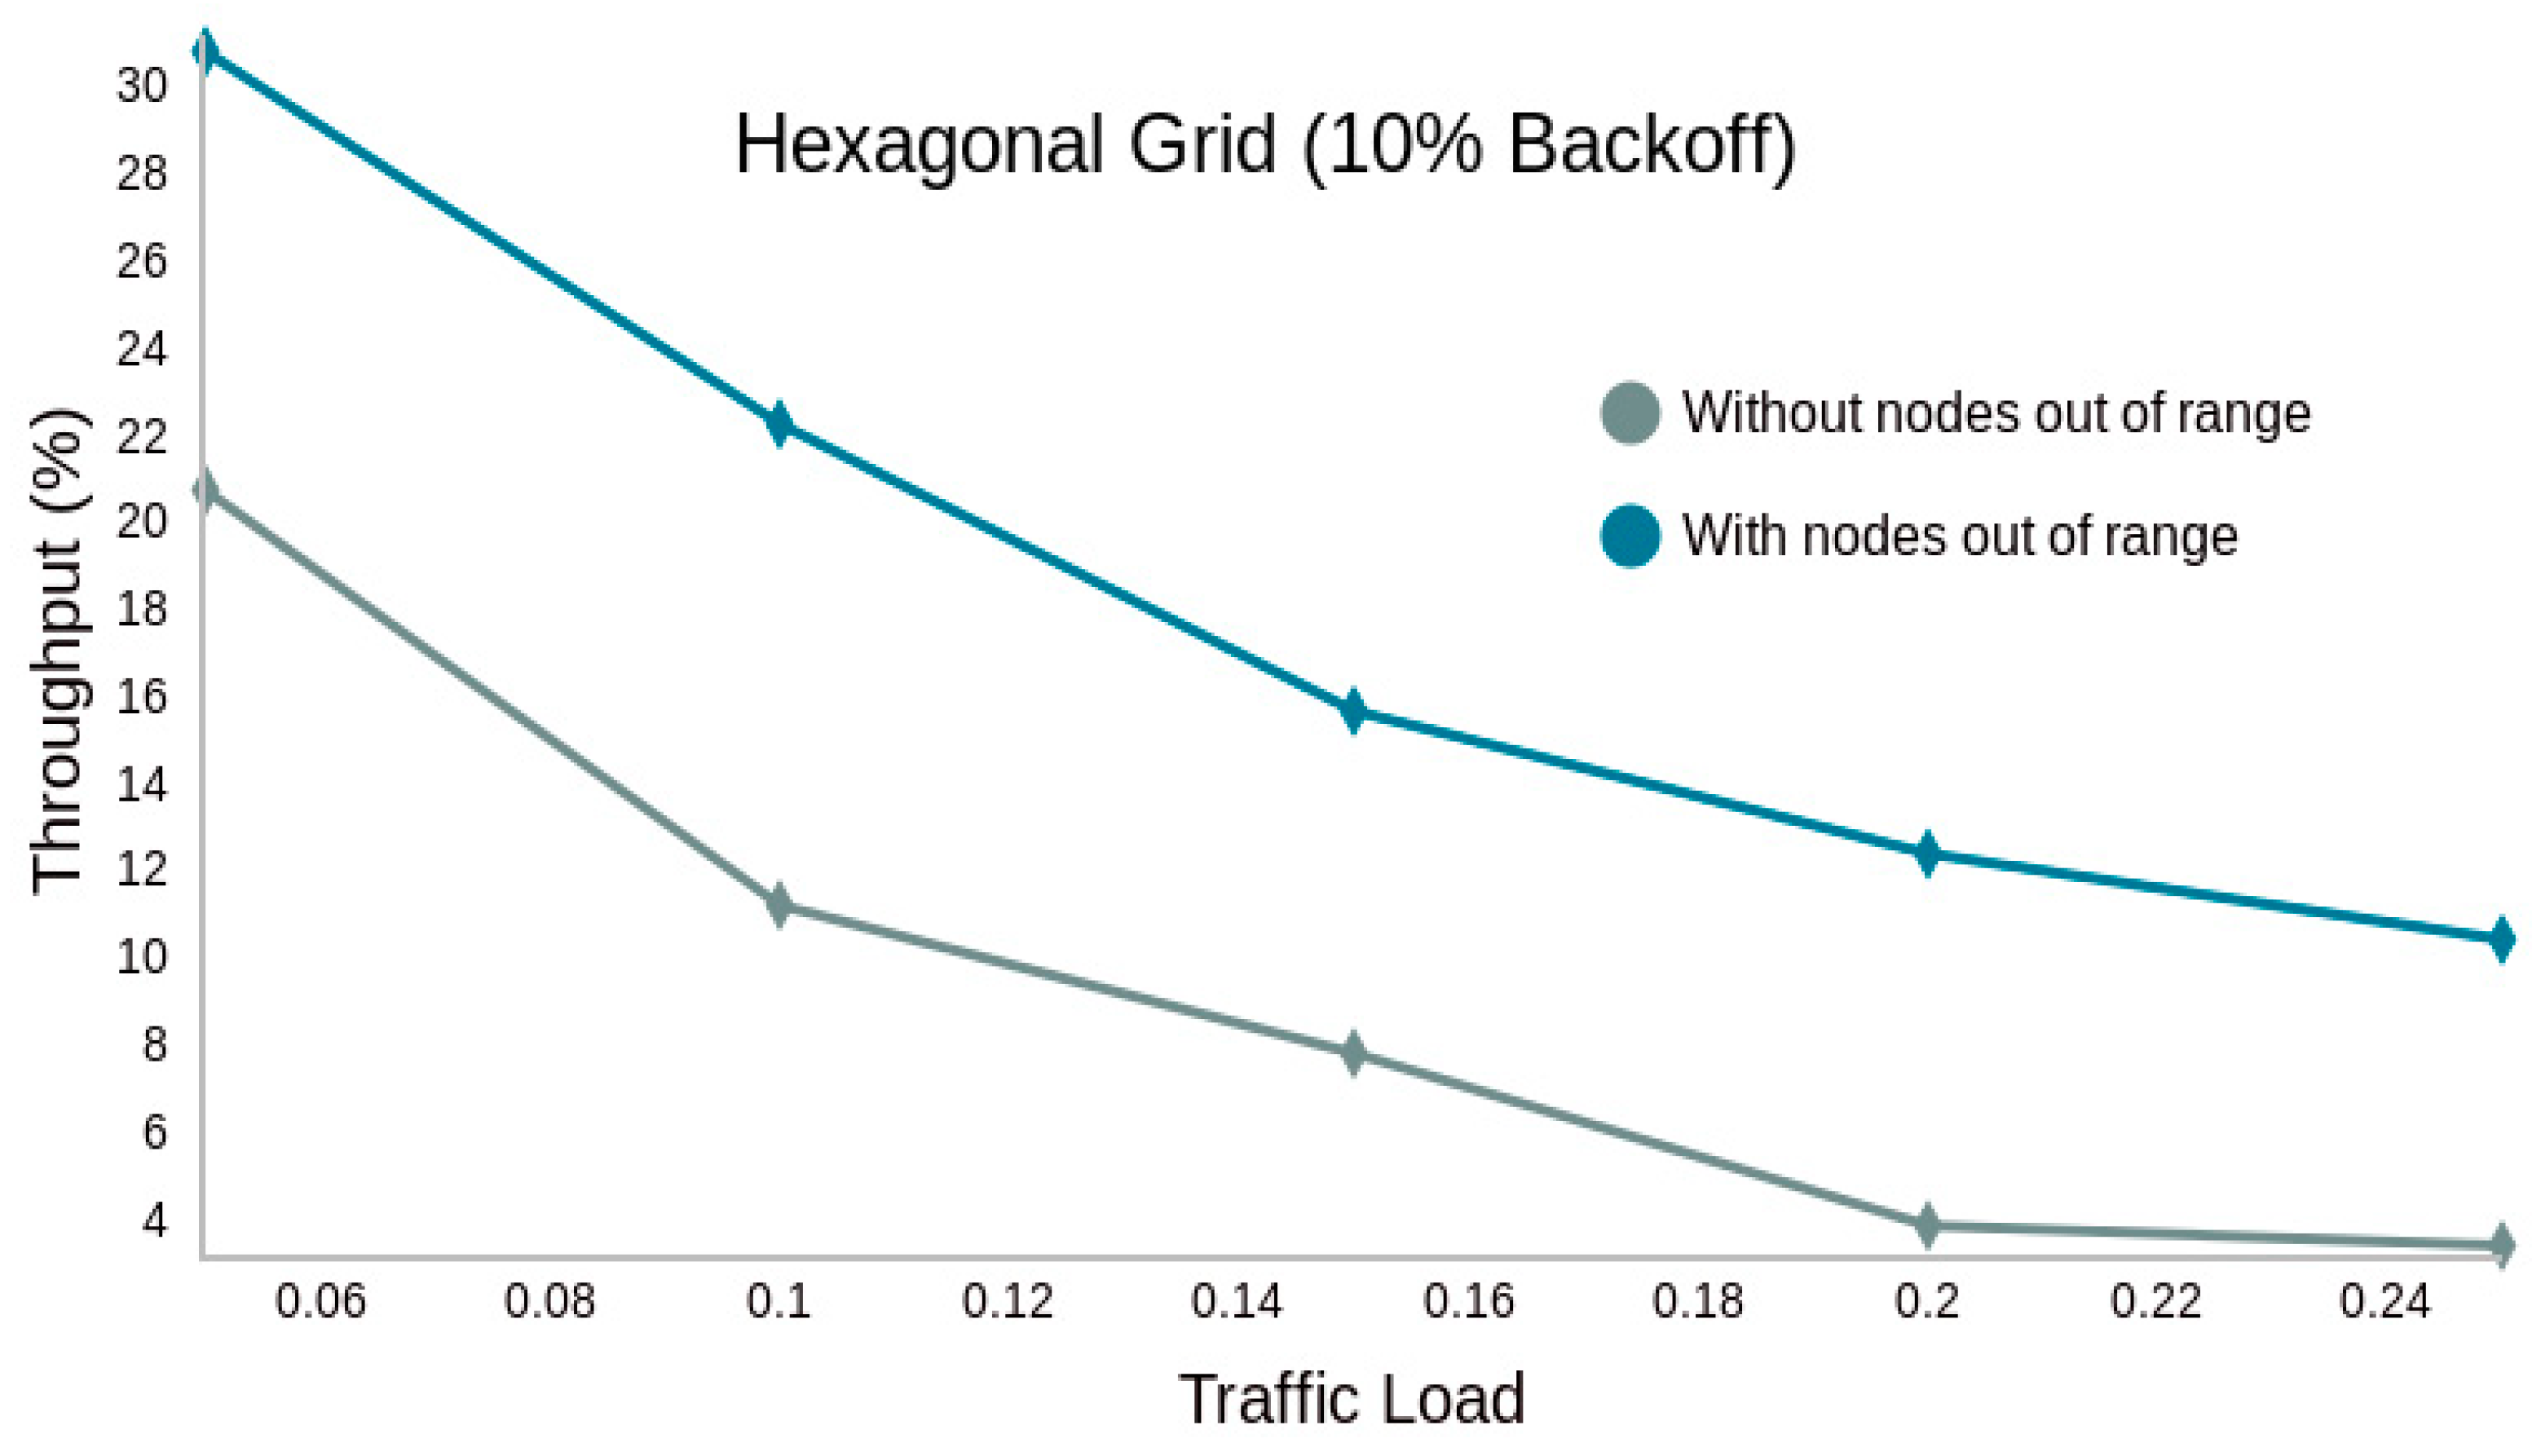
Handling Out-of-Range Nodes: Figure 11 and Figure 12 address nodes that fall outside the transmission range of their respective relay node. Rather than losing the packets from these out-of-range nodes, the protocol forwards them directly to the gateway. Within the TDMA framework used for packet transmission between relay nodes and the gateway, an additional time slot is allocated specifically for these out-of-range nodes. The objective is to highlight the substantial improvement in throughput when these packets are properly accounted for. In one method (grey line), all packets sent to nodes out of range were lost, whereas in the blue line method, most of these packets reached the gateway.
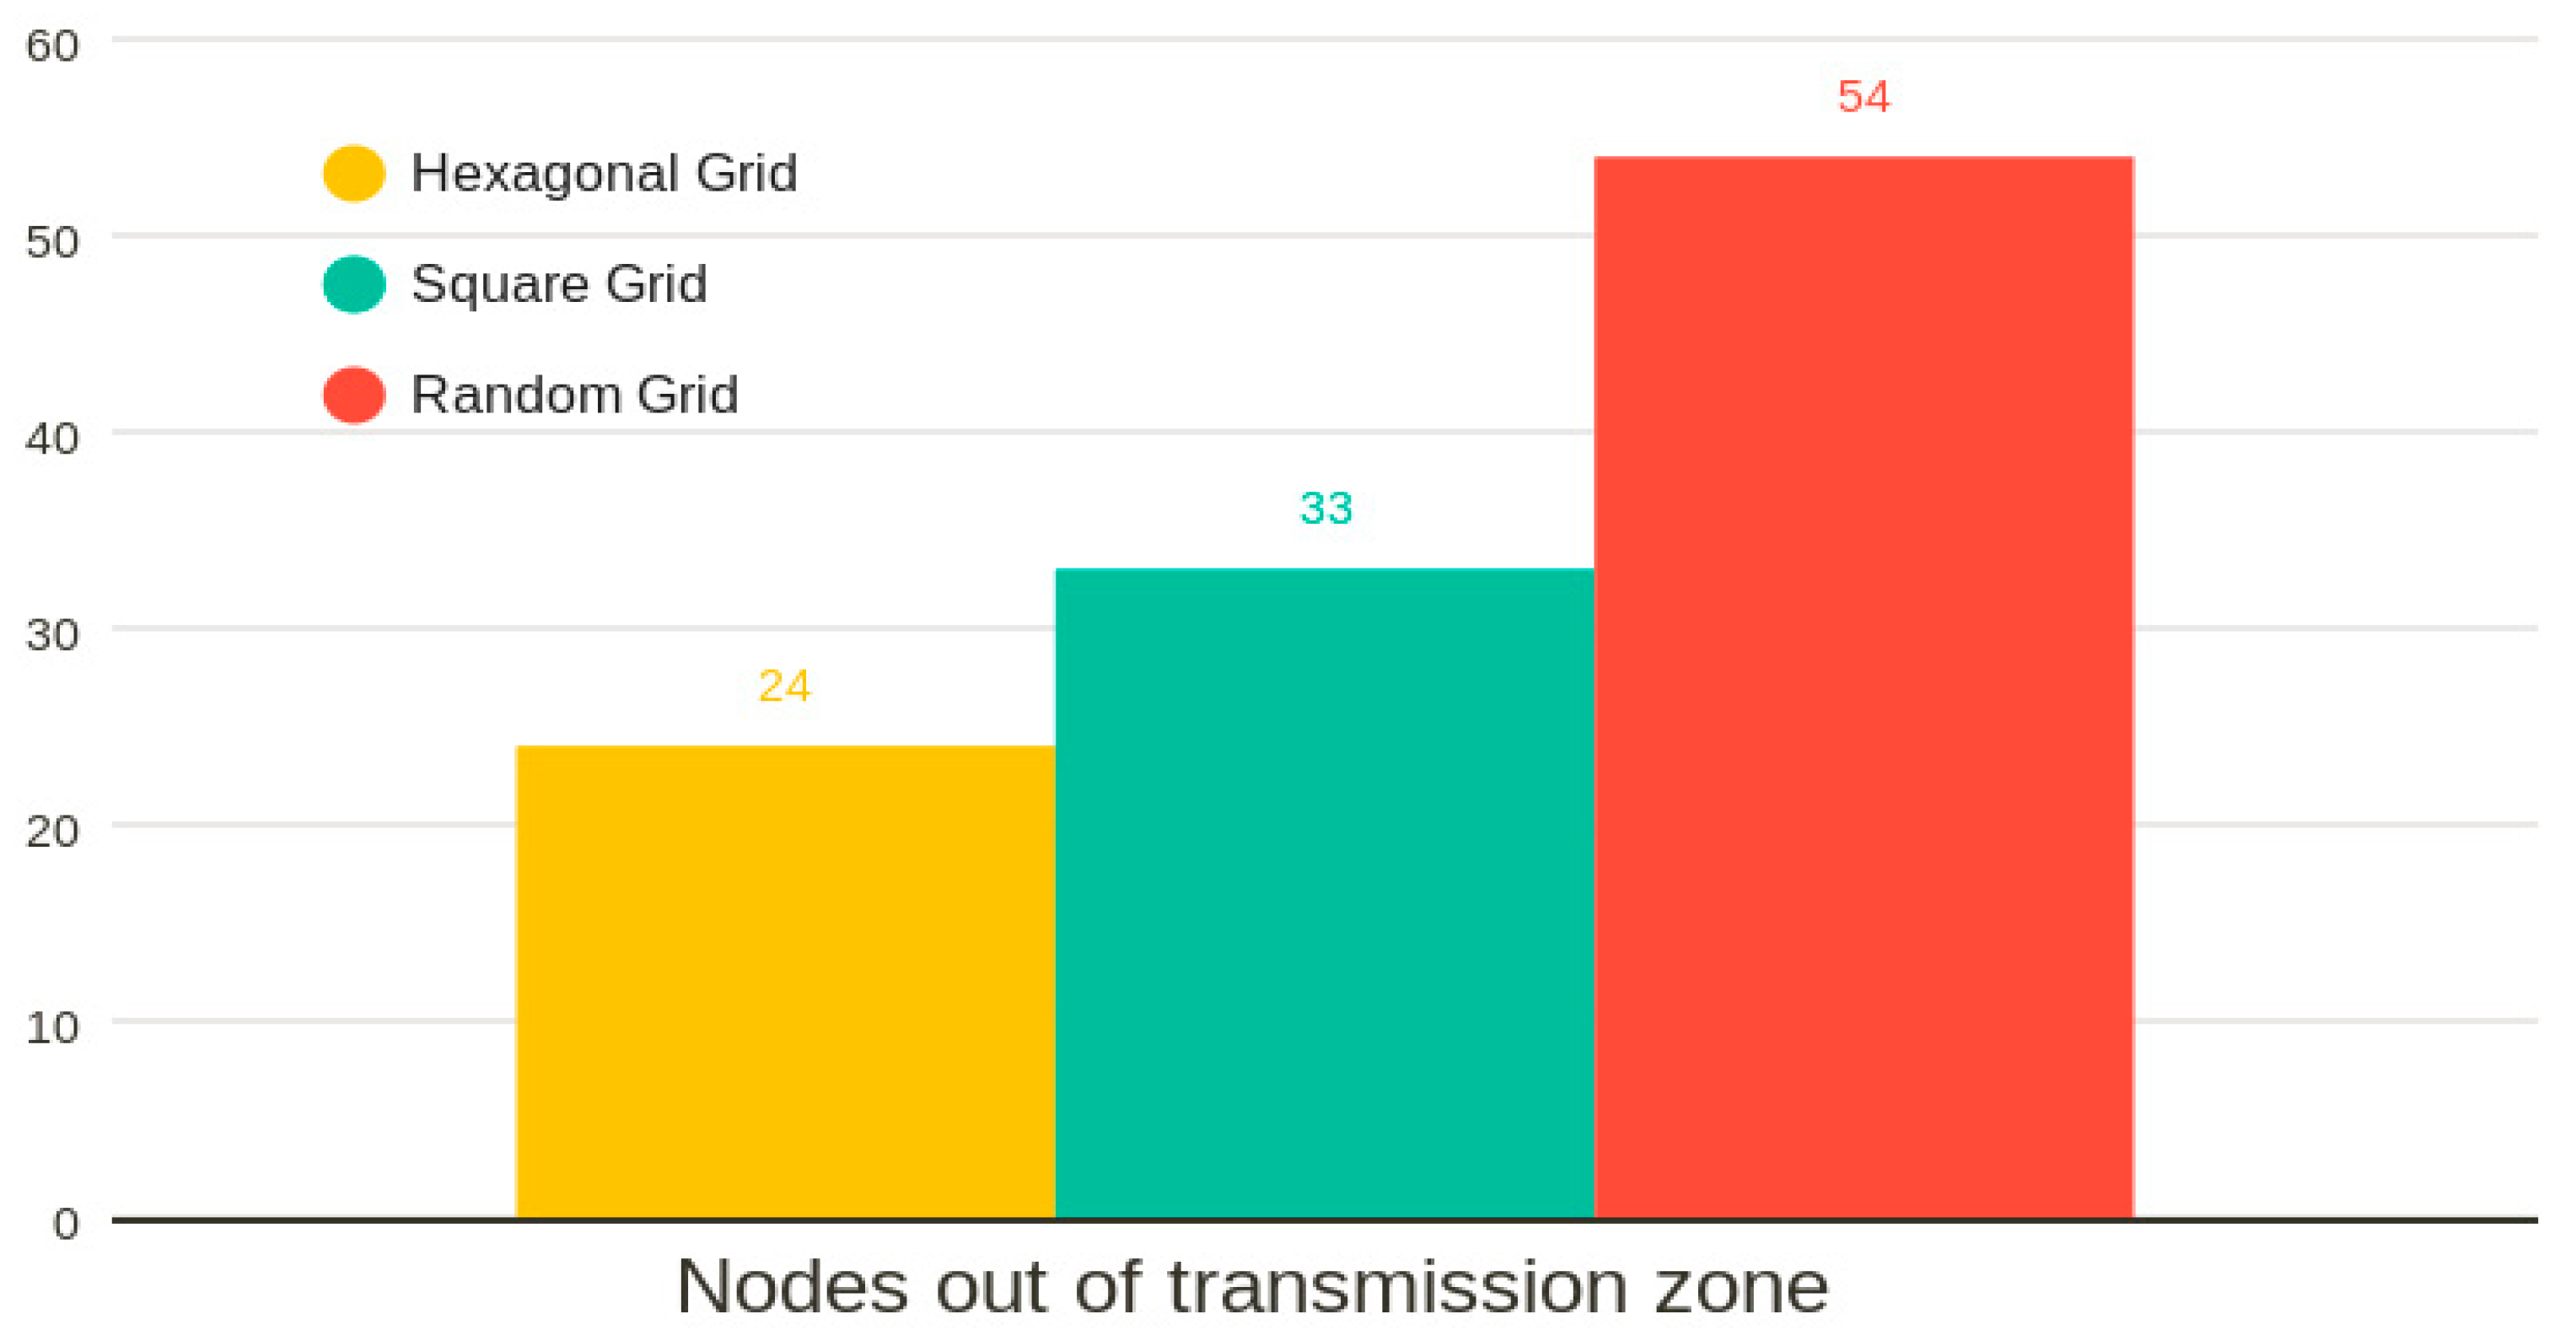
Relay Node Coverage: Figure 13 provides an example of the number of nodes that remain outside the transmission range for each relay node placement method. The results indicate that the hexagonal grid achieves the best coverage compared to all other methods, as it has the fewest number of nodes left without a relay node association. This is due to the more efficient packing of relay nodes in the hexagonal configuration. It is considered that the relay nodes can transmit messages up to 707 m, so they all communicate with the gateway.
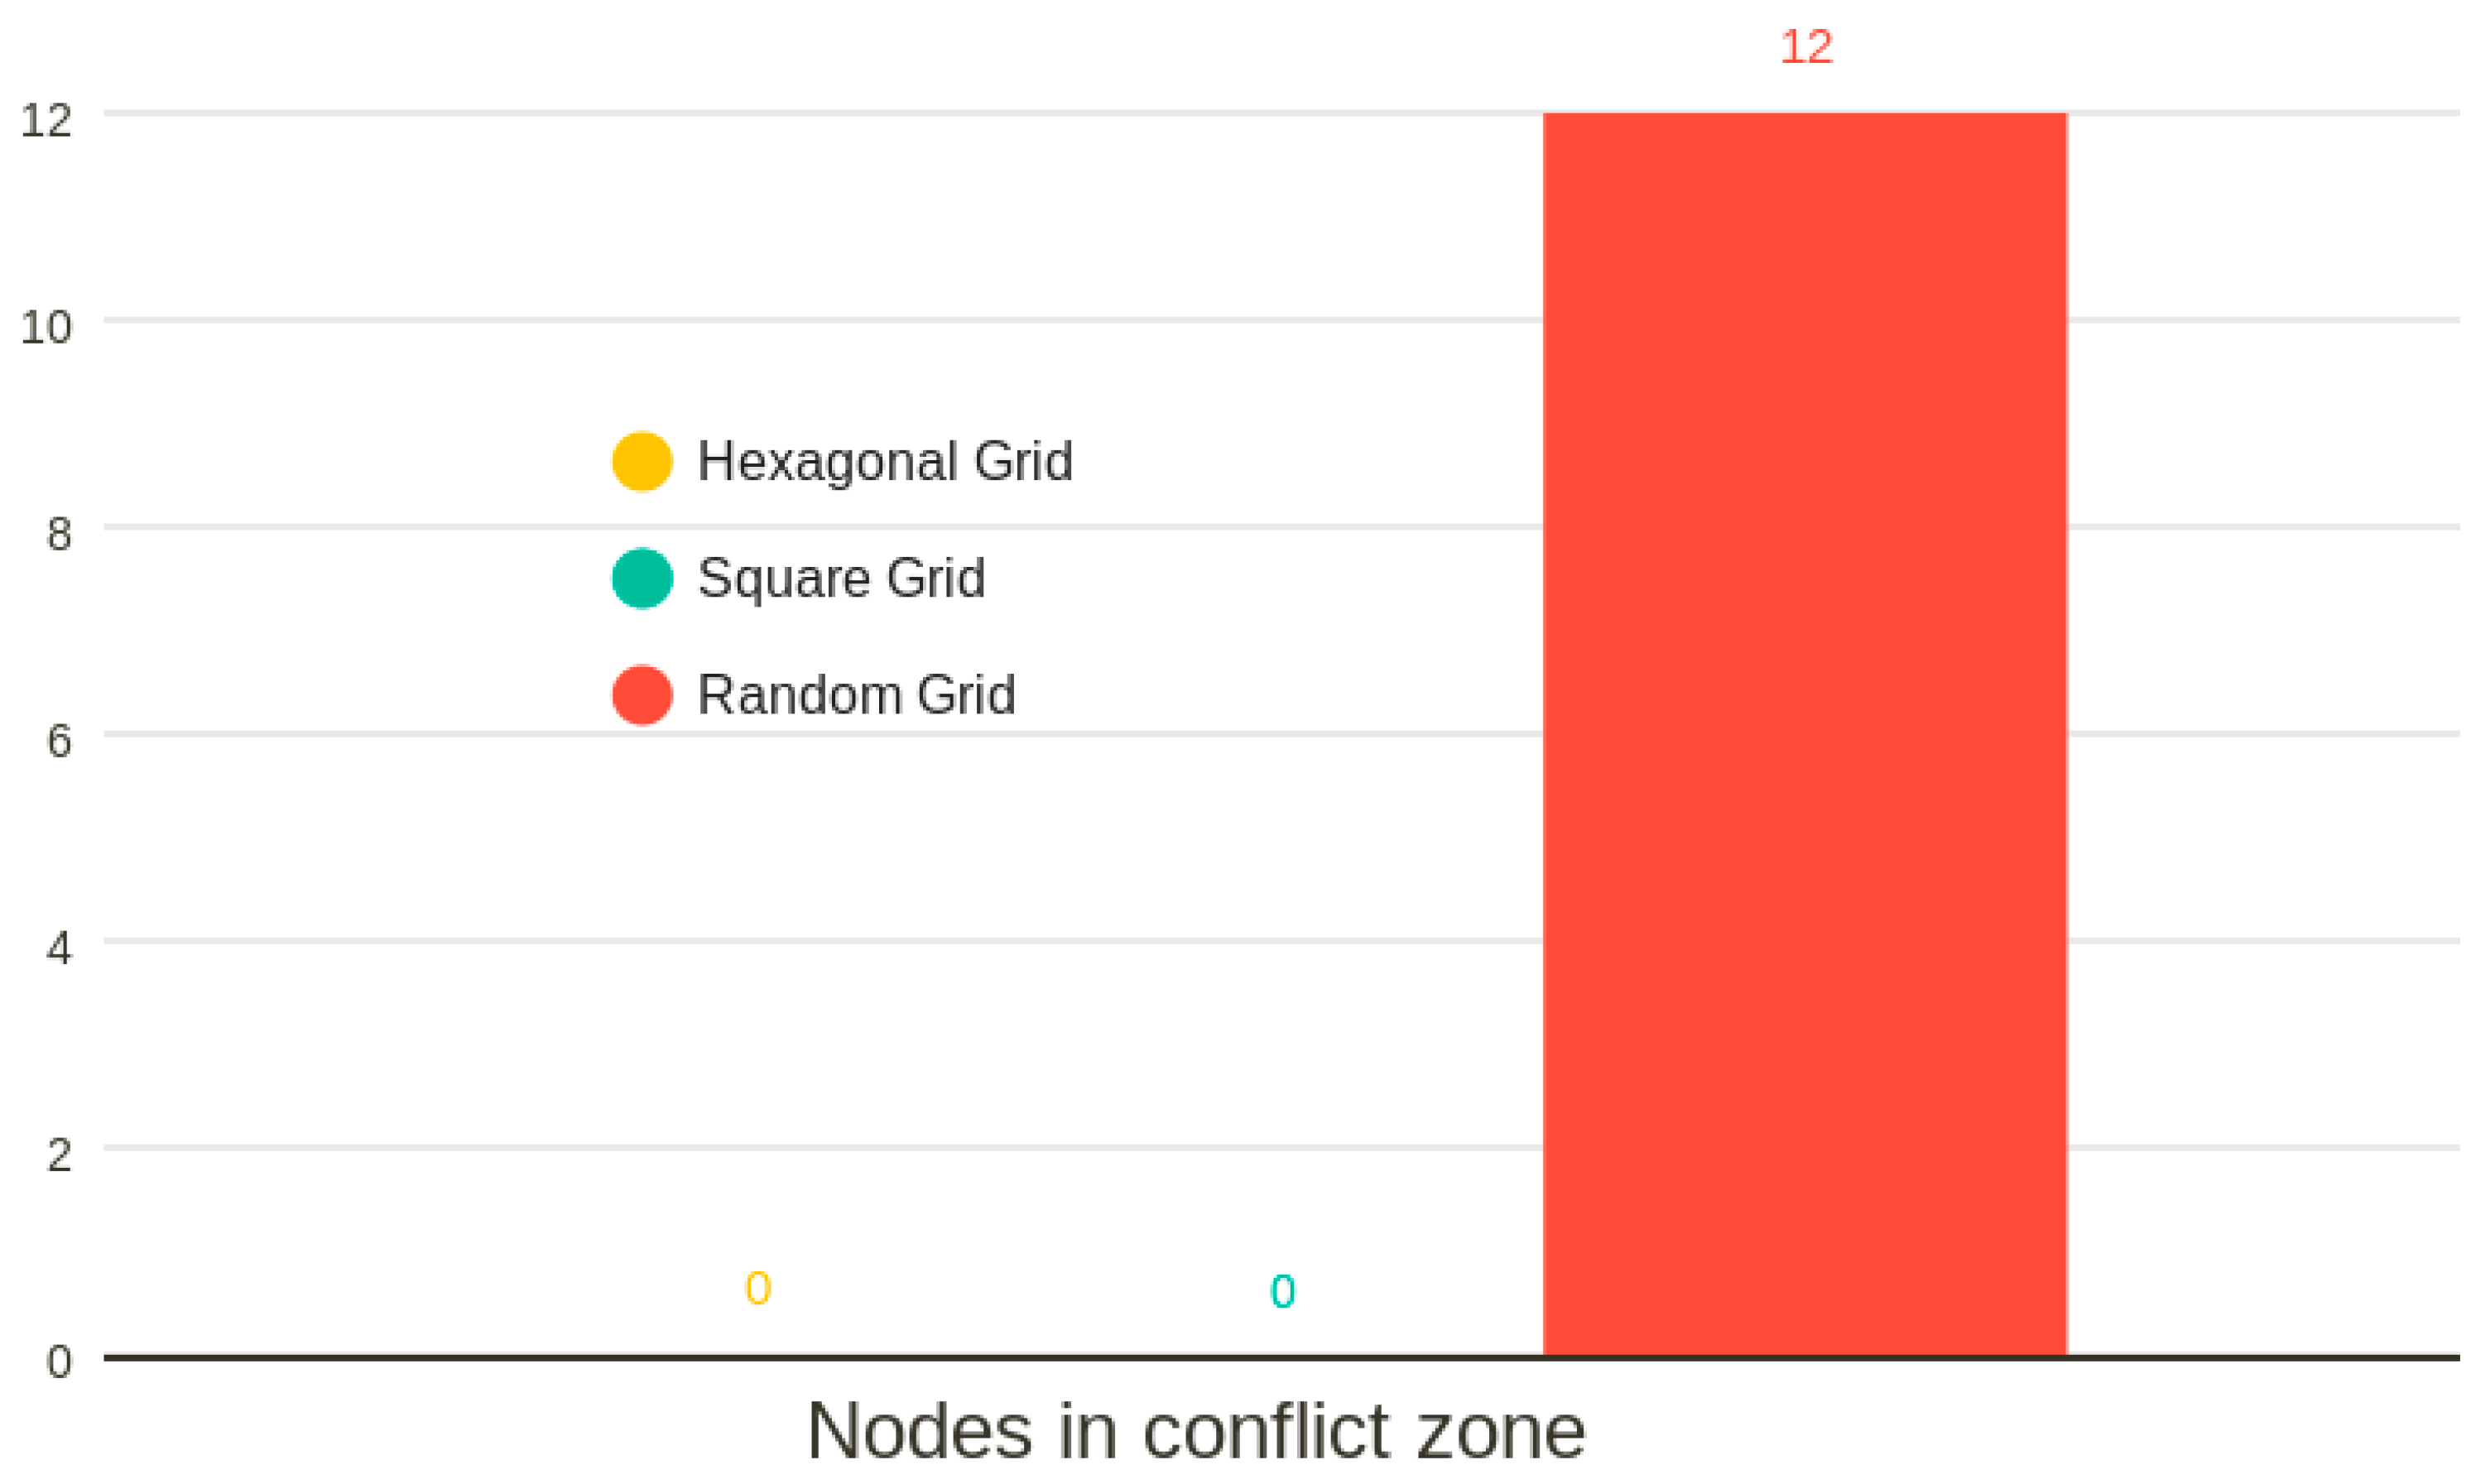
Conflict-Free Transmission: Figure 14 highlights that in both the hexagonal and square grid configurations, no nodes fall within conflict zones—areas where multiple relay nodes might overlap in coverage. This is in contrast to the random placement method, where such conflicts occur. In the hexagonal and square grid topologies, each node is associated with a single relay node, ensuring conflict-free transmission. The relay nodes are always in the middle of the circles, and the message cannot reach a neighboring relay node (unless they are at the intersection of two circles). It is conceivable for the transmission to reach a node that corresponds to another relay node; however, we presume that simple nodes just broadcast packets and do not receive them, thus no interference will occur.

5. Conclusions

This study analyzed the effect of relay node placement on multi-hop LoRaWAN networks under a dual-layer MAC scheme combining Slotted ALOHA and TDMA. Through simulations, we showed that the hexagonal grid topology significantly reduces collisions, decreases delay, and increases throughput compared to random and square grids. Additional contributions include a mechanism for out-of-range nodes and sensitivity analysis of retransmission backoff values. The findings highlight the importance of structured relay placement and layered MAC design in developing scalable, reliable IoT and wireless sensor network deployments. While the hexagonal layout provides the most efficient coverage, we acknowledge its idealized nature, serving as a best-case benchmark for assessing spatial efficiency. The presented results serve as a controlled benchmark for spatial efficiency and MAC-layer interaction, rather than a full physical-layer emulation of LoRaWAN deployments.

6. Future Work

Future extensions will involve irregular node placement and adaptive relay selection. Real-world deployments often include obstacles, missing relays, and irregular topologies; therefore, we plan to simulate these non-ideal scenarios to evaluate performance degradation relative to the hexagonal benchmark. Specifically, future research will explore denser and partially overlapping relay layouts (10–20% overlap) and adaptive placement strategies to improve performance under fluctuating network conditions. Additionally, we aim to enhance the propagation model to incorporate fading, obstacles, interference and reflections (e.g., capture effect, Rayleigh fading) to increase the realism of the simulation framework.

Author Contributions

Conceptualization, K.S. and G.P.; methodology, K.S. and P.N.; software, K.S.; validation, K.S. and K.K.; formal analysis, K.S. and K.K.; investigation, K.S.; resources, K.S. and P.N.; data curation, K.S. and A.V.; writing—original draft preparation, K.S.; writing—review and editing, K.S. and P.N.; visualization, K.S. and G.B.; supervision, K.S. and G.P.; project administration, K.S. and P.N. All authors have read and agreed to the published version of the manuscript.

Funding

This research received no external funding.

Data Availability Statement

The original contributions presented in this study are included in the article. Further inquiries can be directed to the corresponding author.

Conflicts of Interest

The authors declare no conflict of interest.

Abbreviations

The following abbreviations are used in this manuscript:
TDMATime Division Multiple Access
LoRaWANLong-Range Wide Area Network
MACMedia Access Control
RISReconfigurable Intelligent Surface
DSDVDestination-Sequenced Distance Vector
LoRaLong-Range
RSARandom Sequential Adsorption
MANETMobile Ad Hoc Networks
IoTInternet of Things

References

  1. Wu, Q.; Zhang, R. Towards smart and reconfigurable environment: Intelligent reflecting surface aided wireless network. IEEE Commun. Mag. 2019, 58, 106–112. [Google Scholar] [CrossRef]
  2. Wang, K.; Yang, J. Fault-tolerant relay node placement in wireless sensor networks for surveillance of overhead transmission lines. Math. Probl. Eng. 2022, 2022, 6077374. [Google Scholar] [CrossRef]
  3. Georgiou, O.; Raza, U. Low power wide area network analysis: Can LoRa scale? IEEE Wirel. Commun. Lett. 2017, 6, 162–165. [Google Scholar] [CrossRef]
  4. Van den Abeele, F.; Haxhibeqiri, J.; Moerman, I.; Hoebeke, J. Scalability analysis of large-scale LoRaWAN networks in ns-3. IEEE Internet Things J. 2017, 4, 2186–2198. [Google Scholar] [CrossRef]
  5. Adelantado, F.; Vilajosana, X.; Tuset-Peiro, P.; Martinez, B.; Melia-Segui, J.; Watteyne, T. Understanding the limits of LoRaWAN. IEEE Commun. Mag. 2017, 55, 34–40. [Google Scholar] [CrossRef]
  6. Pantazis, N.A.; Nikolidakis, S.A.; Vergados, D.D. Energy-efficient routing protocols in wireless sensor networks: A survey. IEEE Commun. Surv. Tutor. 2013, 15, 551–591. [Google Scholar] [CrossRef]
  7. Zhang, Y.; Liu, W.; Lou, W.; Fang, Y. Securing mobile ad hoc networks with certificateless public keys. IEEE Trans. Dependable Secur. Comput. 2006, 3, 386–399. [Google Scholar] [CrossRef]
  8. Alhomyani, H.; Fadel, M.; Dimitriou, N.; Bakhsh, H.; Aldabbagh, G. Modeling the performance of a multi-hop LoRaWAN linear sensor network for energy-efficient pipeline monitoring systems. Appl. Sci. 2024, 14, 9391. [Google Scholar] [CrossRef]
  9. Sheikhi, H.; Hoseini, M.; Sabaei, M. k-connected relay node deployment in heterogeneous wireless sensor networks. Wirel. Pers. Commun. 2021, 120, 3277–3292. [Google Scholar] [CrossRef]
  10. Akyildiz, I.F.; Kasimoglu, I.H. Wireless sensor and actor networks: Research challenges. Ad Hoc Netw. 2004, 2, 351–367. [Google Scholar] [CrossRef]
  11. Dias, A.; Grilo, A. Multi-hop LoRaWAN uplink extension: Specification and prototype implementation. IEEE Internet Things J. 2020, 7, 9646–9655. [Google Scholar] [CrossRef]
  12. Cotrim, J.R.; Kleinschmidt, J.H. LoRaWAN Mesh Networks: A Review and Classification of Multihop Communication. Sensors 2020, 20, 4273. [Google Scholar] [CrossRef] [PubMed]
  13. Aslam, M.S.; Khan, A.; Atif, A.; Hassan, S.A. Exploring multi-hop LoRa for green smart cities. IEEE Netw. 2020, 34, 225–231. [Google Scholar] [CrossRef]
  14. Cotrim, J.R.; Margi, C.B.; Kleinschmidt, J.H. Design of a gateway-based relay node for LoRaWAN multihop networks. In Proceedings of the 2022 Symposium on Internet of Things (SIoT), São Paulo, Brazil, 24–28 October 2022; IEEE: Piscataway, NJ, USA, 2022; pp. 1–4. [Google Scholar] [CrossRef]
  15. Samarathunga, C.; Abouelseoud, M.; Sakoda, K.; Hashemi, M. On the benefits of multi-hop communication for indoor 60 GHz wireless networks. arXiv 2020, arXiv:2009.00205. [Google Scholar] [CrossRef]
  16. Samarathunga, C.; Abouelseoud, M.; Sakoda, K.; Hashemi, M. Multi-hop routing with proactive route refinement for 60 GHz millimeter-wave networks. arXiv 2020, arXiv:2011.02053. [Google Scholar]
  17. Xiong, R.; Lu, J.; Zhang, J.; Liu, M.; Dong, X.; Mi, T.; Qiu, R.C. Design and optimization on successive RIS-assisted multi-hop wireless communications. arXiv 2024, arXiv:2407.10080. [Google Scholar]
  18. Soleimani-Nasab, E.; Coleri, S. A unified framework for multi-hop wireless relaying with hardware impairments. arXiv 2023, arXiv:2311.17617. [Google Scholar] [CrossRef]
  19. Zhao, Z.; Perazzone, J.; Verma, G.; Chan, K.; Swami, A.; Segarra, S. Joint task offloading and routing in wireless multi-hop networks using biased backpressure algorithm. arXiv 2024, arXiv:2412.15385. [Google Scholar] [CrossRef]
  20. Marini, R.; Mikhaylov, K.; Pasolini, G.; Buratti, C. Lorawansim: A flexible simulator for lorawan networks. Sensors 2021, 21, 695. [Google Scholar] [CrossRef] [PubMed]
  21. Durand, T.G.; Booysen, M.J. Performance Evaluation of a Mesh-Topology LoRa Network. Sensors 2025, 25, 1602. [Google Scholar] [CrossRef] [PubMed]
Figure 1. Multi-Hop Network Topology.
Applsci 16 02698 g001
Figure 2. State diagram of the proposed algorithm.
Applsci 16 02698 g002
Figure 3. Example of a communication frame with stacked Slotted ALOHA and TDMA subframes.
Applsci 16 02698 g003
Figure 4. Random Grid illustration with 16 Relay Nodes.
Applsci 16 02698 g004
Figure 5. Square Grid illustration with 16 Relay Nodes.
Applsci 16 02698 g005
Figure 6. Hexagonal Grid illustration with 16 Relay Nodes.
Applsci 16 02698 g006
Figure 7. Direct communication of out-of-range end nodes with the gateway in the square grid layout.
Applsci 16 02698 g007
Figure 8. Mean delay versus traffic load for (a) 10% backoff, (b) 2.5% backoff and (c) 1% backoff.
Applsci 16 02698 g008
Figure 9. Throughput versus traffic load for (a) 10% backoff, (b) 2.5% backoff and (c) 1% backoff.
Applsci 16 02698 g009aApplsci 16 02698 g009b
Figure 10. Evaluation of the impact of backoff on mean delay for a fixed traffic load value (G = 0.1).
Applsci 16 02698 g010
Figure 11. Throughput versus traffic load for a fixed backoff value (10%) in the square grid.
Applsci 16 02698 g011
Figure 12. Throughput versus traffic load for a fixed backoff value (10%) in the hexagonal grid.
Applsci 16 02698 g012
Figure 13. Number of nodes out of transmission range in each relay node placing method.
Applsci 16 02698 g013
Figure 14. Number of nodes in conflict zone in each relay node placing method.
Applsci 16 02698 g014
Table 1. Simulation Variables.
Number of nodes100
Number of Relay nodes16
Number of Gateways1
Transmission range (m)125 (node-to-relay), 750 (relay-to-gateway)
Space dimensions (m)1.000 × 1.000
Nodes placementRandom
Gateway placementCentral
Uplink/rx1Delay/Ack (ms)50/40/10
Packet size40 bytes
Traffic generation modelPoisson arrivals, mean load G = 0.1
Slot duration (ms)100
Simulation duration (slots)10.000
Propagation modelLog-distance path loss, no fading
Disclaimer/Publisher’s Note: The statements, opinions and data contained in all publications are solely those of the individual author(s) and contributor(s) and not of MDPI and/or the editor(s). MDPI and/or the editor(s) disclaim responsibility for any injury to people or property resulting from any ideas, methods, instructions or products referred to in the content.