Article

Effect of Water Quality Produced at Each Stage of the Seawater Desalination Process on Hydrogen Production in Water Electrolysis


1
Interdisciplinary Graduate School of Agriculture and Engineering, University of Miyazaki, 1-1 Gakuen Kibanadai-nishi, Miyazaki 889-2192, Japan
2
Graduate School of Engineering, University of Miyazaki, 1-1 Gakuen Kibanadai-nishi, Miyazaki 889-2192, Japan
3
Faculty of Science and Engineering, Chuo University, 1-13-27 Kasuga, Bunkyo-ku, Tokyo 112-8551, Japan
4
Faculty of Engineering, University of Miyazaki, 1-1 Gakuen Kibanadai-nishi, Miyazaki 889-2192, Japan
5
GX Research Center, University of Miyazaki, 1-1 Gakuen Kibanadai-nishi, Miyazaki 889-2192, Japan
*
Author to whom correspondence should be addressed.
Appl. Sci. 2026, 16(5), 2622; https://doi.org/10.3390/app16052622
Submission received: 5 February 2026 / Revised: 27 February 2026 / Accepted: 4 March 2026 / Published: 9 March 2026
(This article belongs to the Section Energy Science and Technology)

Abstract

Hydrogen production via water electrolysis using desalinated seawater offers a sustainable energy solution and has attracted considerable attention in recent years. However, its efficiency depends heavily on the quality of water. Many studies have not explored the relationship between treated water quality and hydrogen generation efficiency at each stage of the seawater desalination process. This study examines a three-step seawater desalination process comprising softening with ballasted flocculation (SBF) as a pretreatment, reverse osmosis (RO) as the main desalination step, and ion exchange as a polishing step to provide high-quality water for electrolysis. Water from each purification stage was supplied to the electrolyzer to compare the impact on water quality and hydrogen generation efficiency. The SBF process removed magnesium (Mg) and calcium (Ca) from seawater, as well as turbidity and bacteria, but hydrogen production via water electrolysis continued for no more than 10 h. However, when feeding RO water and RO water processed by ion exchange after the SBF process, hydrogen was generated stably and continuously for 70 h, achieving high efficiency comparable to that of commercial pure water. High production of green hydrogen by water electrolysis is possible through RO seawater desalination combined with SBF pretreatment.

1. Introduction

Global warming and environmental pollution exacerbate climate change, a critical issue further intensified by population growth and lifestyle changes. Consequently, the transition to renewable energy sources has become essential. The large-scale production of CO2-free hydrogen through water electrolysis powered by electricity from renewable sources such as solar power is a promising avenue for sustainable energy development. Hydrogen is also a vital sustainable fuel for a wide range of applications. The use of hydrogen in fuel cells enables high-efficiency power generation with no greenhouse gas emissions, making it an essential component in decarbonizing transportation, industry, and housing [1]. Furthermore, stationary fuel cell systems and hydrogen fuel cell vehicles (FCVs) have gained popularity as alternatives to fossil-fuel-based technologies, helping the world meet net-zero-carbon goals. Therefore, producing high-purity hydrogen from renewable sources, such as water electrolysis, is crucial to expanding hydrogen’s role in the global energy transition [2]. Both catalyst layer design and membrane structural optimization play a critical role in determining the performance of the water electrolysis cell and its durability under non-ideal feedwater conditions [3,4].
In water electrolysis systems, using pure water, a key raw material, is crucial. It is necessary to obtain large quantities of pure water, and water treatment costs must be managed to ensure they do not exceed hydrogen production costs. According to the Strategic Roadmap for Hydrogen and Fuel Cells [5], the current hydrogen supply cost is higher than that of other energy sources, including fossil fuels, and Japan aims to lower the hydrogen cost to 20 yen/Nm3 to enable low-cost hydrogen procurement and expand its utilization. However, supplying large quantities of pure water for hydrogen production is often challenging due to freshwater shortages and geographical constraints. The U.S. Geological Survey (USGS) states that approximately 2.5% of Earth’s water is freshwater, including ice caps, glaciers, groundwater, and surface water, while the remaining 97.5% is saltwater in the oceans [6].
In this context, obtaining pure water through desalinating abundant seawater is crucial for hydrogen production. Reverse osmosis (RO) is an energy-efficient, cost-effective desalination technology that achieves a high freshwater recovery rate [7,8,9]. The RO membrane process is commonly used in desalination facilities [10], and the importance of seawater desalination technologies using RO membranes is well recognized. However, seawater desalination through RO membranes is prone to membrane fouling [11,12]. The primary mechanism of membrane fouling is blockage caused by scale formation from Ca2+ and Mg2+, which are present at high concentrations in seawater, along with inorganic substances such as silica and carbonates. Another problem is the blockage caused by organic matter and bacterial biofilms contained in seawater [13,14,15]. RO membrane fouling reduces membrane lifespan, increases operating costs [16], reduces flow rate [17], extends the time required to wash the membrane, lowers the water permeation flux [18], and deteriorates permeate water quality. These issues significantly reduce freshwater production [19]. Therefore, prior to the RO process, substances that cause fouling must be removed through a pretreatment process [20]. Modern conventional pretreatments include adding an acid and scale inhibitor to seawater to lower its pH and prevent scale generation by inorganic substances [21,22,23]. Additionally, suspended solids and colloidal particles can be removed using combined coagulation and ultrafiltration [24], coagulation and sand filtration [25], dual-media filtration with sand, and cartridge filters [26]. However, these pretreatment processes cannot remove high concentrations of Ca2+ and Mg2+ from seawater, leading to scale formation in the liquid phase [27]. In water electrolysis for hydrogen production, the quality of the supply water, including the presence of Ca2+ and Mg2+, which are divalent cations, inhibits the function of the electrode membrane [28].
Previously, Ayoub et al. (2014) [29] introduced seawater softening as a pretreatment process for RO membrane desalination. In the softening method, alkaline agents such as sodium hydroxide or calcium hydroxide are used to precipitate Ca2+ and Mg2+ ions as insoluble salts. This process effectively removes Ca2+ and Mg2+ from seawater and also decreases turbidity and bacterial counts by agglutinating insoluble hydroxides and carbonates. Thus, softening is an attractive pretreatment option for RO membranes in desalination [30]. Moreover, Veolia Water Technologies developed a process that combines softening with ballasted flocculation to reduce hardness in both drinking and industrial water [31,32]. By applying these pioneering technologies, we found that fine precipitates of insoluble hydroxides and carbonates formed during softening can settle rapidly in seawater via ballasted flocculation [33].
In addition to the efficient removal of Ca2+ and Mg2+, this SBF can simultaneously remove suspended particles and microorganisms, essential for conventional RO membrane processes, and achieve disinfection [34]. However, the specific purification process required to consistently produce pure water that supports continuous hydrogen production remains unknown. To establish a hydrogen production plant that incorporates SBF, it is crucial to have a fundamental understanding of the seawater desalination and purification processes that reliably produce such pure water. There was limited literature on the effectiveness of scalable, low-energy pretreatment methods specifically optimized for commercial seawater purification in real-world hydrogen production systems. In this study, we applied the SBF process before RO seawater desalination to easily obtain pure water for hydrogen production via water electrolysis. The water treated with SBF was subsequently processed with an RO membrane and further purified through ion exchange (RO–ion exchange) to produce pure water. A water electrolysis experiment was then conducted using water treated by SBF, the RO membrane, and the RO–ion exchange process to evaluate the feed water quality for hydrogen production.

2. Materials and Methods

2.1. Seawater Desalination Process

2.1.1. Seawater Preparation

To conduct a basic investigation into softening and ballasted flocculation, it is necessary to use raw water of consistent quality. Table 1 details the composition of the artificial and natural seawater, with Ca2+ and Mg2+ concentrations of 459 mg/L and 1642 mg/L, respectively. For practical application testing, natural seawater was collected from the surface layer at Aoshima Port, a small fishing port adjacent to a tourist beach, and transported to the laboratory in a polyethylene bottle for further experimental analysis.

2.1.2. Alkaline Agents

Softening agents were prepared by adding calcium hydroxide (Ca(OH)2) and sodium carbonate (Na2CO3) using the lime–soda method to soften the water [35,36]. In the Ca(OH)2 + Na2CO3 agent, the concentrations of Ca(OH)2 and Na2CO3 were set to 1.7 and 2.0 mol/L, respectively, based on the conventional softening protocol concerning the Ca2+ and Mg2+ concentrations in artificial seawater.

2.1.3. Silica Sand and Polymer Flocculants Employed for Ballasted Flocculation

Silica sand (quartz content > 98%, specific gravity = 2.6, particle size = 53–212 µm, V7 type; Mikawakeiseki Co., Okazaki, Japan) was used as ballast in the microsand. An anionic polymer flocculant (AP825B, Mitsubishi Chemical Corporation, Tokyo, Japan) was used. Stock solutions of each polymer flocculant were prepared by dissolving each in distilled water and adjusting the concentration to 0.1% (w/v). The polymer flocculant contains carboxylate functional groups, which enhance the aggregation of insoluble salts and suspended solids during the softening process.

2.1.4. SBF

To ensure the production of insoluble salt suspensions during the softening process, silica sand and polymer flocculant were consistently stirred and mixed. Four baffle plates, each measuring 15 mm in width and 140 mm in height, were installed within the beaker [37]. An alkaline agent (40 mL) was added to 1000 mL of the sample in a 1000 mL beaker placed in a jar tester. The sample pH was adjusted to greater than 12 by stirring rapidly at 200 rpm for 1 min. Subsequently, silica sand was added directly into the solution at a concentration of 10 g/L. After 2 min, the polymer flocculant was injected into the samples at a prescribed dosage of 20 mg/L. The mixture was stirred for an additional 3 min at 140 rpm. A syringe was then used to collect 100 mL of the supernatant (treated water) for water quality analyses. The remaining supernatant (approximately 700 mL) was collected by decantation and aerated with carbon dioxide gas to neutralize the SBF-treated water. This aeration process was conducted at a flow rate of 0.5 L/min for 10 min. The SBF procedure was repeated until the required amount of SBF-treated water was obtained for use in water electrolysis and RO membrane filtration experiments.

2.1.5. RO Membrane Filtration

The SBF-treated water was filtered in crossflow mode at constant pressure using a lab-scale flat membrane device. The SEPA CF II system (Suez Water Technologies & Solutions, Paris, France) featured a plastic spacer with a mesh width of 1.5 mm and a seawater desalination membrane area of 140 cm2, achieving a nominal salt rejection rate of 99.9%. The SBF-treated water was supplied at 5 MPa and a crossflow rate of 2.0 m/s, and the concentrate was recirculated to the feed tank. The temperature of the SBF water was maintained at 25 °C by chilling the feed tanks. A digital flowmeter monitored the membrane penetration flow rate during continuous operation, noting a decrease of almost 30% from the initial 10 mL/min. The electrical conductivity of the permeate as RO-treated water was constant throughout the operation.

2.1.6. Ion Exchange Processing

Ion-exchange resin was used to treat the RO membrane-treated water to remove any remaining Na+, K+, Cl, SO42−, and Br residues. An Econo-Column Chromatography Column (500 mm long, 30 mm inner diameter; Bio-Rad Laboratories, Inc., Tokyo, Japan) was packed with an ion exchange resin (AMBERJET EG-4A-HG; Organo Co., Tokyo, Japan). Subsequently, the RO membrane-treated water was passed through the ion exchange column using a peristaltic pump (SJ-1211 II-H, ATTO Co., Tokyo, Japan) at a flow rate of 0.6 L per hour. The RO–ion-exchange water collected for use in water electrolysis experiments served as the final purified water.

2.1.7. Water Quality Analysis

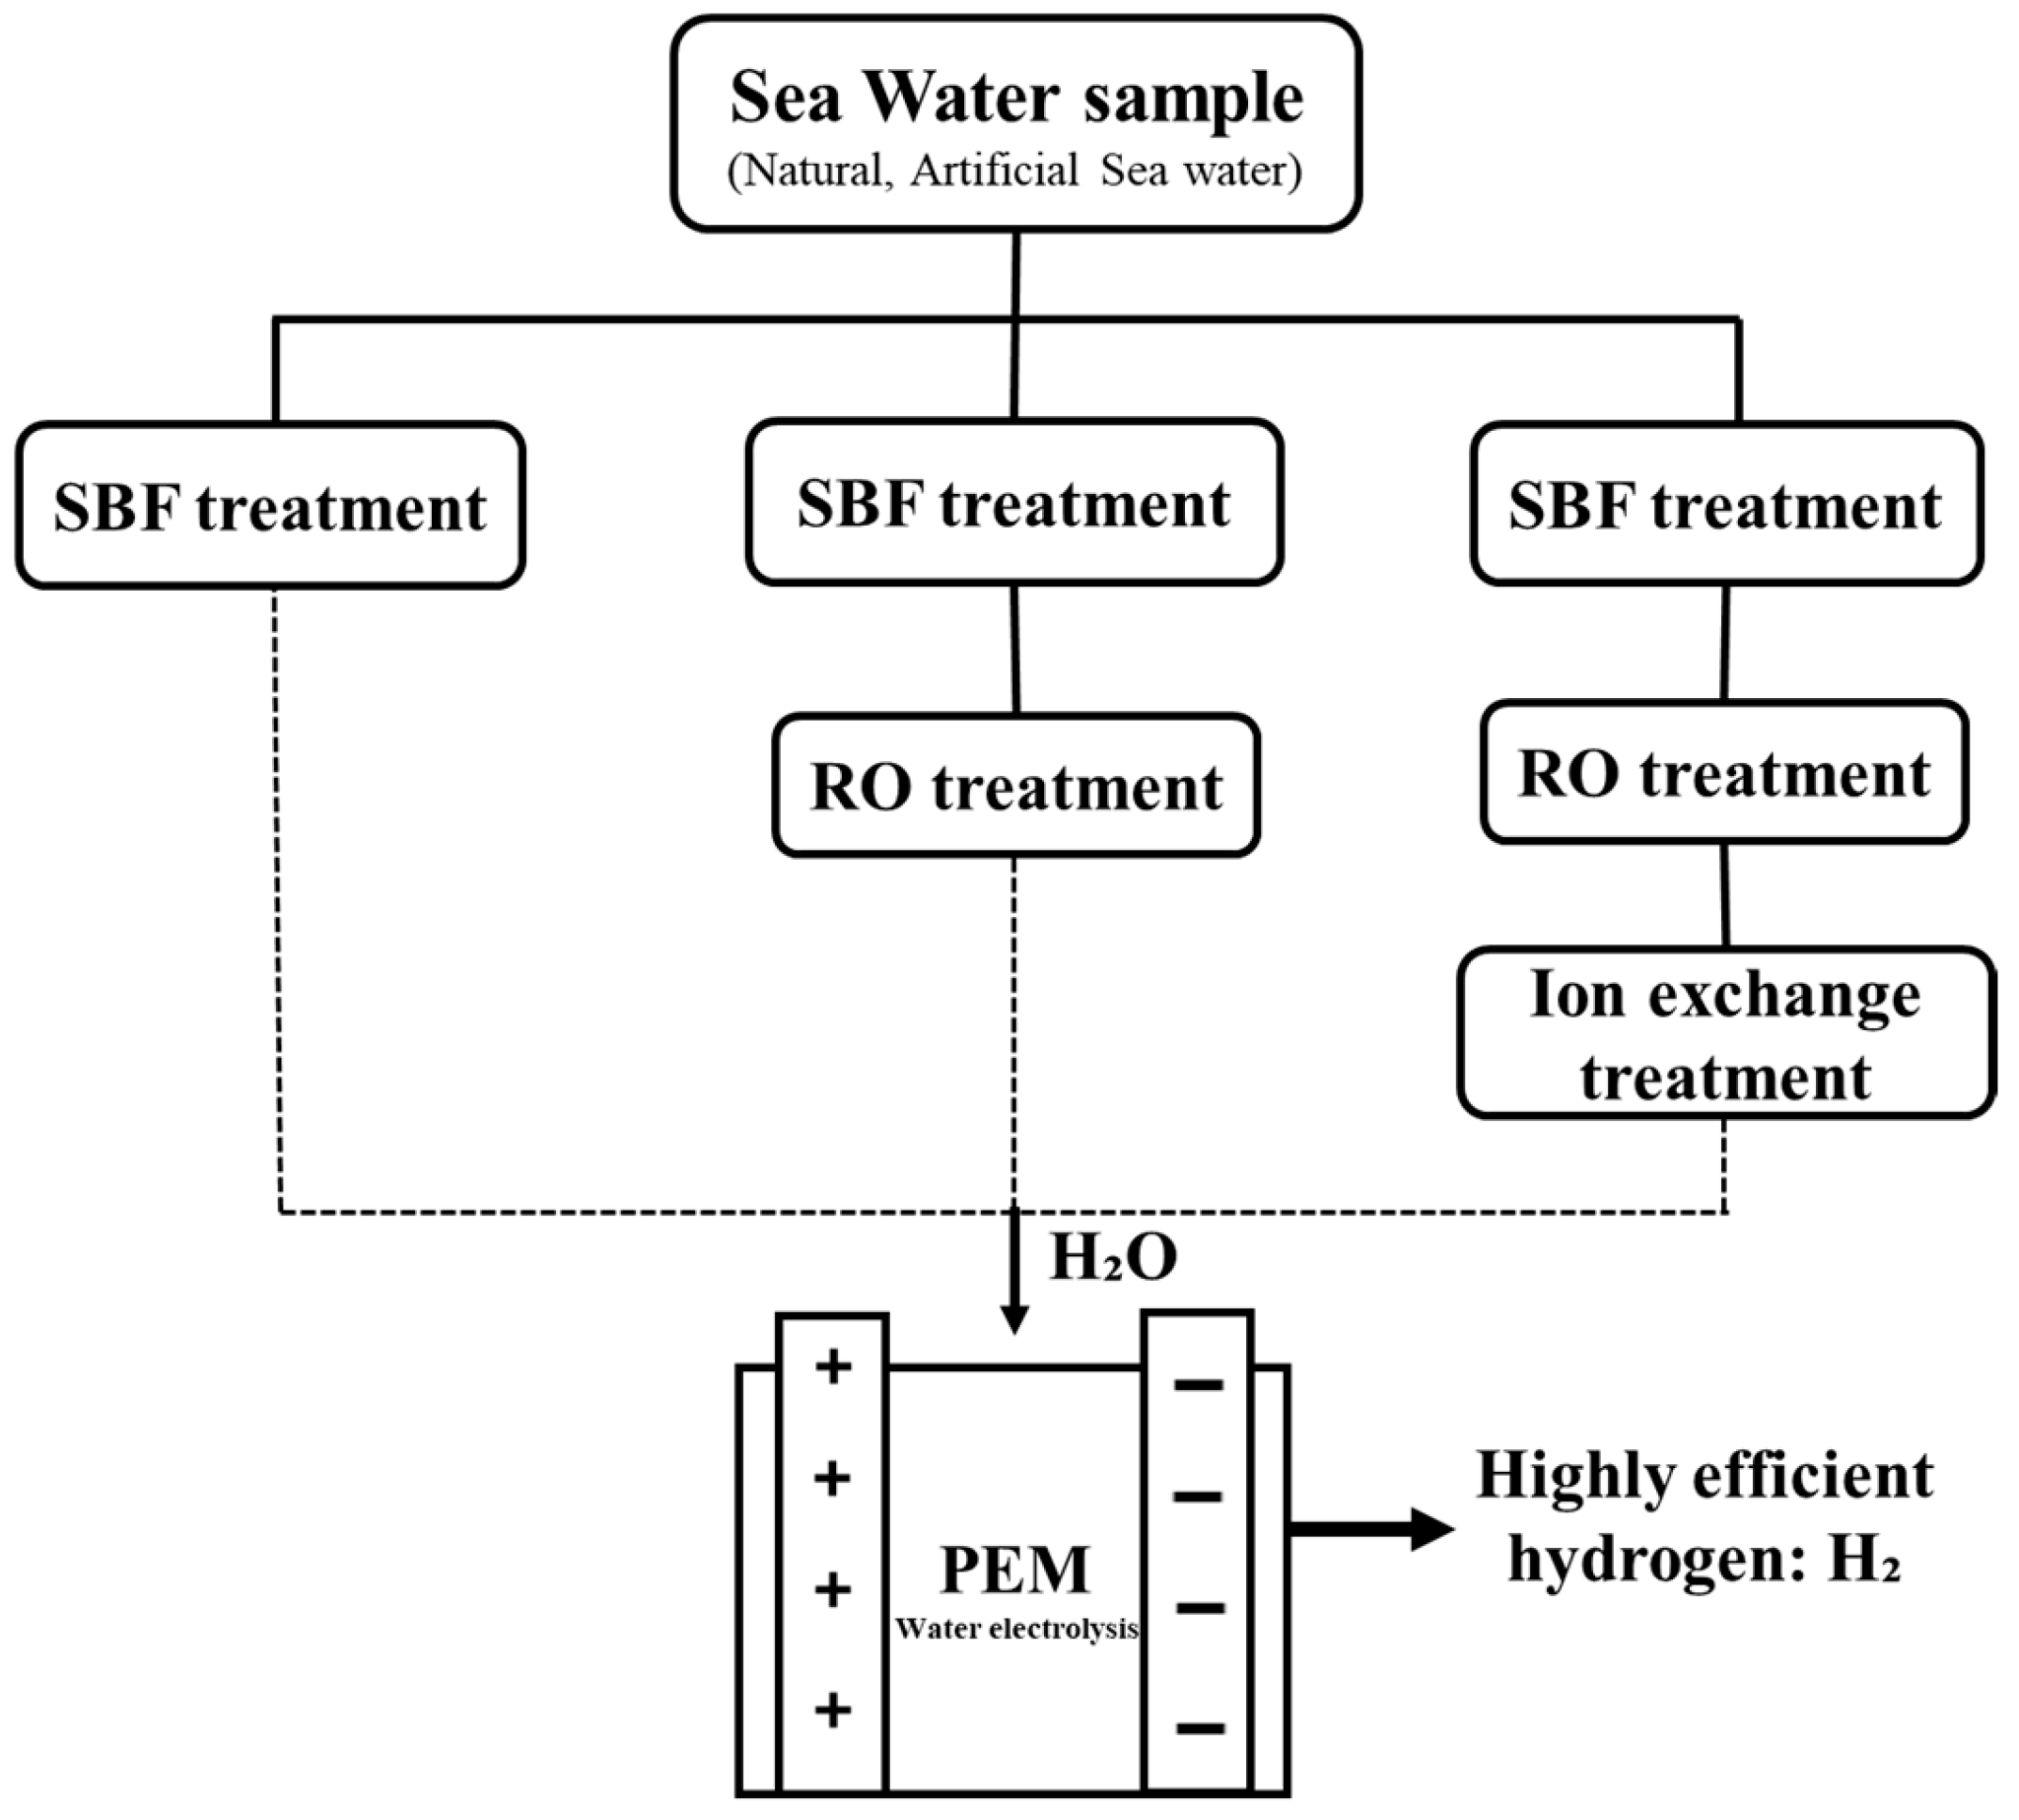
The pH and electrical conductivity of the samples were determined using a water quality analyzer (LAQUA F-74, Horiba Co., Kyoto, Japan), and turbidity was measured using a turbidity meter (PT-200, Nittoseiko Analytech Co., Kanagawa, Japan). The concentrations of Na+, K+, Mg2+, and Ca2+ were analyzed using an inductively coupled plasma emission spectroscopic analyzer (ICPS-8100, Shimadzu Corporation, Kyoto, Japan) after the samples were diluted 100-fold in distilled water. The amounts of Cl, SO42−, and Br were detected using an ion chromatography system (ICS-3000, Thermo Scientific Dionex, Sunnyvale, CA, USA) with an anion column (Dionex IonPac AS12A, Thermo Scientific Dionex, Sunnyvale, CA, USA). The concentration of SiO2 was measured using a portable absorptiometer (DR-2800, Hach C., Loveland, CO, USA) based on the silicate molybdic acid method. Suspended solids (SS) were quantified by filtering 50 mL of the sample through a glass fiber filter (GF/F, diameter 47 mm, Whatman, Merck, Germany) and drying at 105 °C for 2 h. Bacterial content in actual seawater samples was assessed by counting Escherichia coli and total coliform colonies after growth on CHROMagar ECC agar plates (CHROMagar, Paris, France). Specifically, 100 mL of each water sample was filtered through a 0.45 μm pore membrane filter (47 mm diameter, sterile, mixed cellulose ester; Advantec, Tokyo, Japan). The filters were then incubated on ECC agar plates for 24 h at 37 °C. The mauve colonies were categorized as various coliform species, while the blue colonies were identified as E. coli. Heterotrophic bacteria were enumerated on agar plates (1.5% agar, Difco Marine Broth 2216; Becton, Dickinson and Company, Franklin Lakes, NJ, USA). The seawater and treated water were spread over the plates and incubated at 22.5 °C for 7 days. After incubation, all colonies were counted as heterotrophic bacteria. The numbers of coliforms, E. coli, enterococci, and heterotrophic bacteria in all samples were determined from the mean colony-forming unit (CFU) counts of three replicates, expressed as CFU/100 mL of water. Figure 1 shows the experimental flow diagram of the seawater desalination and electrolysis process, including a three-step treatment and water electrolysis.

2.2. Hydrogen Production Method

A single-cell test for hydrogen production was conducted using a Proton Exchange Membrane (PEM) water electrolyzer (Enoah Inc., Aichi, Japan, EHC 070). PEM water electrolysis is particularly valued for its high current density, high efficiency, and rapid start–stop functionality compared to other water electrolysis [38,39]. A polymer electrolyte membrane (PEM) and noble metal catalyst layers form the membrane electrode assembly (MEA), which is surrounded by bipolar plates and a porous current collector, and is connected to an external power source [40]. Proton (H+) movement is selectively facilitated by the PEM, which is usually made of ionomers based on perfluorosulfonic acid (PFSA), such as Nafion. At the same time, electrons and gases are blocked. Through the membrane’s hydrophilic domains, proton conduction occurs, allowing protons to migrate from the anode to the cathode [41]. Platinum (Pt) is utilized at the cathode for the hydrogen evolution process (HER) because of its high catalytic activity and chemical stability, whereas iridium (Ir) is usually used at the anode to catalyze the oxygen evolution reaction (OER). These two catalyst layers are attached to both sides of the PEM. The electrolysis experiments were carried out under a constant current of 9 A over an effective MEA of 11.34 cm2, corresponding to a current density of 0.79 A/cm2. In the experimental setup, various types of treated water were introduced to the lower part of the cells. In terms of moles, the same amount of water is required as hydrogen. To produce 1 kg of hydrogen by water electrolysis, about 9 L of pure water are required. However, this value does not account for water losses during pretreatment, RO, and ion exchange processes. In practical seawater RO systems, recovery rates are typically 40–50%, meaning that to obtain 9 L of pure water, approximately 20–23 L of seawater must be processed, considering all process losses [8,42]. In a water electrolysis system, water is split into hydrogen, and the overall chemical reaction is as follows:
2 H 2 O   ( L ) + electrical   energy 2 H 2   ( g ) + O 2   ( g )
The above equation shows that two moles of liquid water produce two moles of hydrogen gas and one mole of oxygen gas, indicating a direct 1-1 molar relationship between the water consumed and the hydrogen generated. In our experiments, the treated water was used directly to generate hydrogen in a PEM electrolyzer (Enoah Inc., Aichi, Japan, EHC 070) [38]. Oxygen and unreacted water were discharged from the anode, whereas hydrogen and transferred water were discharged from the cathode. The operating voltage was recorded using a high memory logger. The produced hydrogen was dried with a molecular sieve, and its flow rate was measured with a mass flow meter (M-100SCCM-D, Alicat Scientific, Tucson, AZ, USA). The experimental procedures were conducted under conditions outlined in our previous studies [28,43].

3. Results

3.1. Treated Water Quality of Each Processing

Table 2 and Table 3 show the water quality characteristics of SBF-treated, RO membrane-treated, and ion-exchange-treated waters for both artificial and natural seawater from Aoshima Port, Miyazaki. The SBF process alone nearly completely removed the divalent cations Mg2+ and Ca2+, which significantly inhibit the RO membrane process, from both types of seawater, achieving 100% removal efficiency. The K removal efficiency was notably low (<11%), and the Na+ removal efficiency was zero. In fact, the Na+ concentration increased in the treated seawater, likely due to the presence of Na+ in the alkaline agent used in the SBF process. Since Na+ and K+ are not removed by the SBF process, their removal is addressed in the subsequent RO membrane process. Moreover, the suspended solids in natural seawater were effectively aggregated by the formation of Magnesium hydroxide (Mg(OH)2) and CaCO3, leading to high turbidity removal efficiency by softening. Lower turbidity indicates a reduced presence of suspended solids and colloidal particles, which are known to be major contributors to membrane fouling and scaling. According to previous studies, effective turbidity removal is expected to extend the operational lifespan of RO membranes and lower overall cost of desalination system [8,44]. Additionally, E. coli and total coliforms were not detected in the treated seawater, and the number of heterotrophic bacteria was reduced by 99.6%. Ayoub et al. (2014) [29] reported the complete removal of total and fecal coliforms at a pH above 10.5. After SBF, the pH of the alkaline-softened water was easily adjusted to 6.7–6.8 by neutralization with carbon dioxide gas aeration [33]. Thus, the SBF process effectively removed Mg2+, Ca2+, suspended solids, and bacteria from seawater. However, the monovalent cations Na+ and K+ remained in the SBF-treated water, which were then removed during the RO membrane process.
After the RO process, the electrical conductivity (EC) was significantly reduced to 0.51 mS/cm, removing 99.0% of Na+ and 98.5% of K+ from the SBF-treated water. Additionally, troublesome dissolved SiO2 fractions were also completely eliminated. However, small amounts of Na+ (152 mg/L in artificial seawater, 122 mg/L in natural seawater) and K+ (5.5 mg/L in artificial seawater and 4.4 mg/L in natural seawater) remain in the RO membrane-treated water. Cl concentrations were detected at 250–260 mg/L, and other anions such as Br and sulfate also persisted in the RO-treated water. While the RO membrane process can reduce EC to 0.5 mS/cm in natural seawater, ionic substances remain at markedly low concentrations.
In the polishing process, ion exchange was introduced after the RO membrane process. The pH of RO-treated water was 6.5–7.6, and it decreased slightly to 6.1–6.4 after the ion exchange procedure. This slight pH deviation can lead to buffering ions removal and cations exchange, resulting in mildly acidic water. The Nafion membrane makes PEM water electrolysis work best in acidic conditions. Therefore, minor pH deviations in this study are not expected to significantly affect electrolysis efficiency. This is consistent with previous studies indicating that feedwater pH has minimal impact on PEM electrolyzer performance within this range [38]. The remaining chemical species in RO-treated water, such as Na+, Br, and sulfate, were effectively removed by the ion-exchange process. The cation K+ was detected at low concentrations of 0.7 mg/L and 1 mg/L in the final treated water of artificial and natural seawater, respectively. The anion Cl was also detected at extremely low concentrations of less than 0.4 mg/L. Ultimately, the EC of RO–ion-exchange water reached 0.001 mS/cm, matching the EC of commercially available pure water typically used in water electrolysis experiments. SiO2 concentration showed that 86% of the raw water was removed by RO treatment. Furthermore, SiO2 was not detected (ND) in both artificial seawater and natural seawater samples after ion exchange process, confirming its effective removal. The proposed treatment flow in this study confirmed that turbidity, SiO2, Mg2+, Ca2+, and bacteria, which are thought to block RO membranes and affect PEM water electrolysis performance, can be effectively removed. On the other hand, the DOC concentration in typical seawater is 1–2 mg-C/L, significantly lower than in freshwater sources such as river water. Furthermore, since its molecular weight is larger than that of target substances, it was assumed to be easily removed by RO membranes and thus not examined in this study. However, considering continuous treatment in an actual plant, it cannot be ruled out that even trace amounts of DOC could potentially affect PEM water electrolysis performance. When operating actual plants, the potential for DOC inhibition must also be considered.
The three main stages of the pure water production system proposed in this study are: the high-speed simultaneous removal of Mg2+ and Ca2+, suspended substances, and microorganisms by the SBF process; the highly efficient removal of cations and anions that cannot be eliminated by RO membrane process after the SBF process; and the final purification process using ion exchange after RO membrane process. The efficiency of hydrogen production via water electrolysis was examined for each treated water obtained by three procedures.

3.2. Hydrogen Production Efficiency Using Treated Water from Different Processes

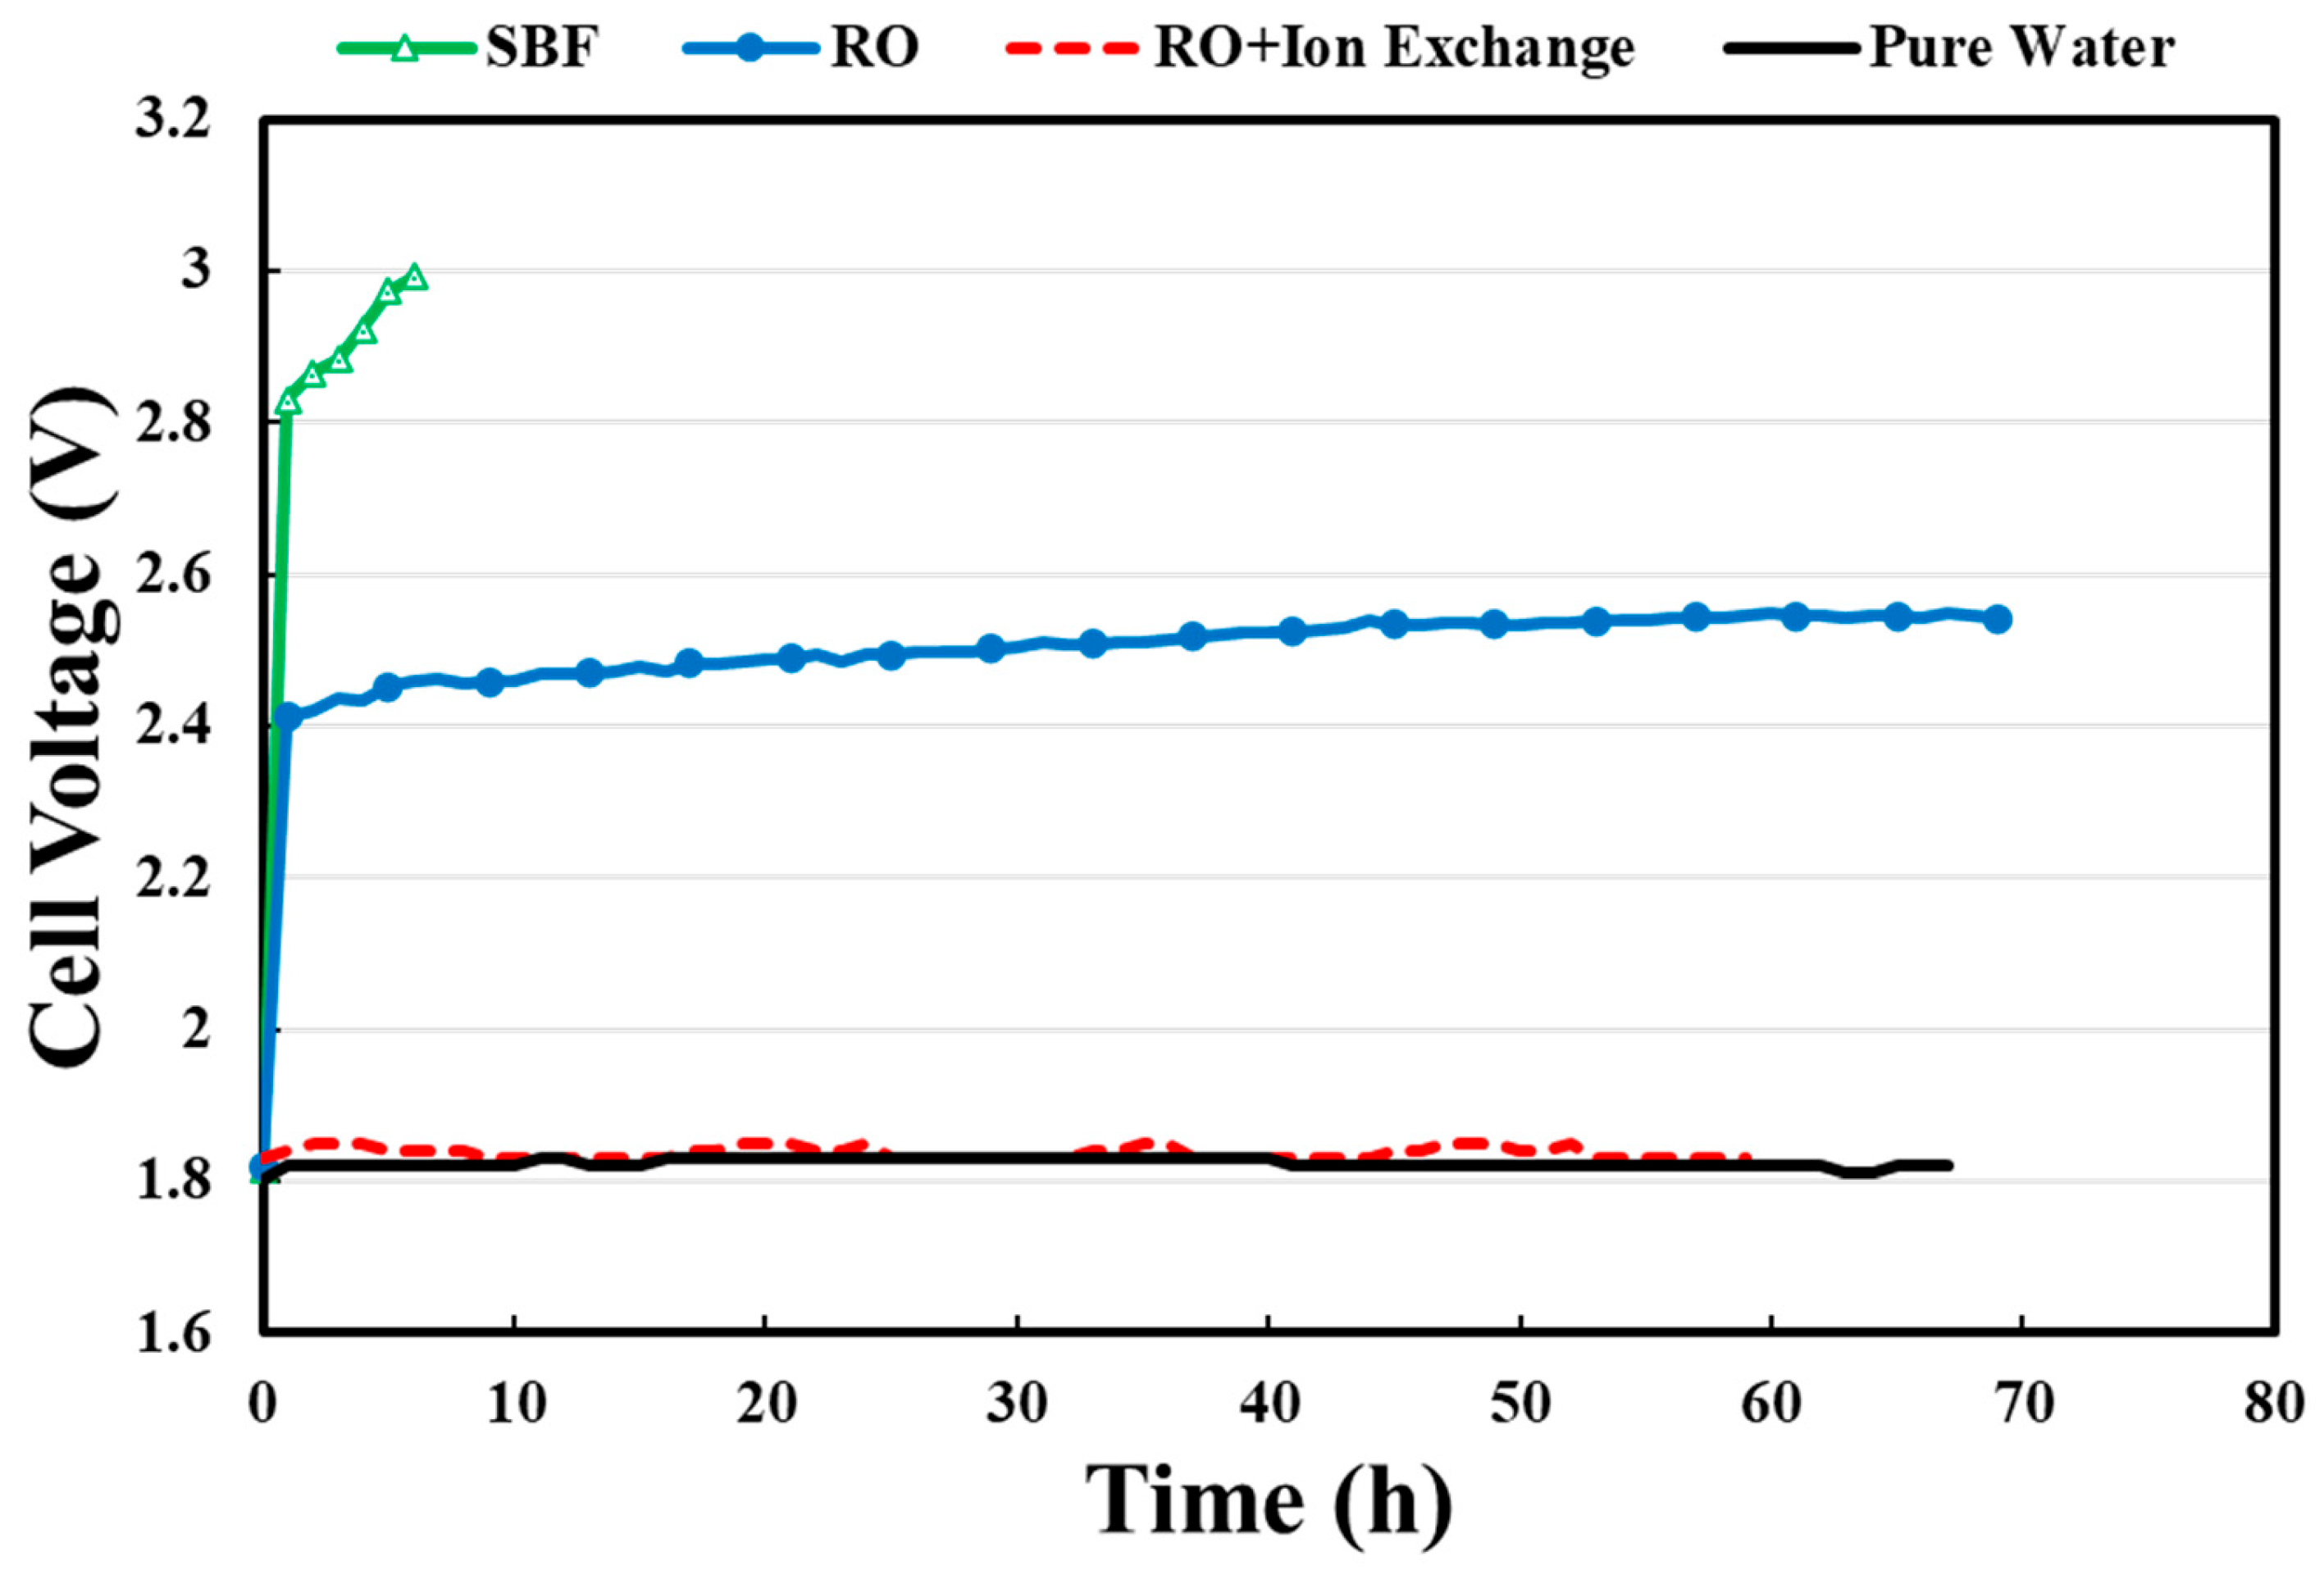
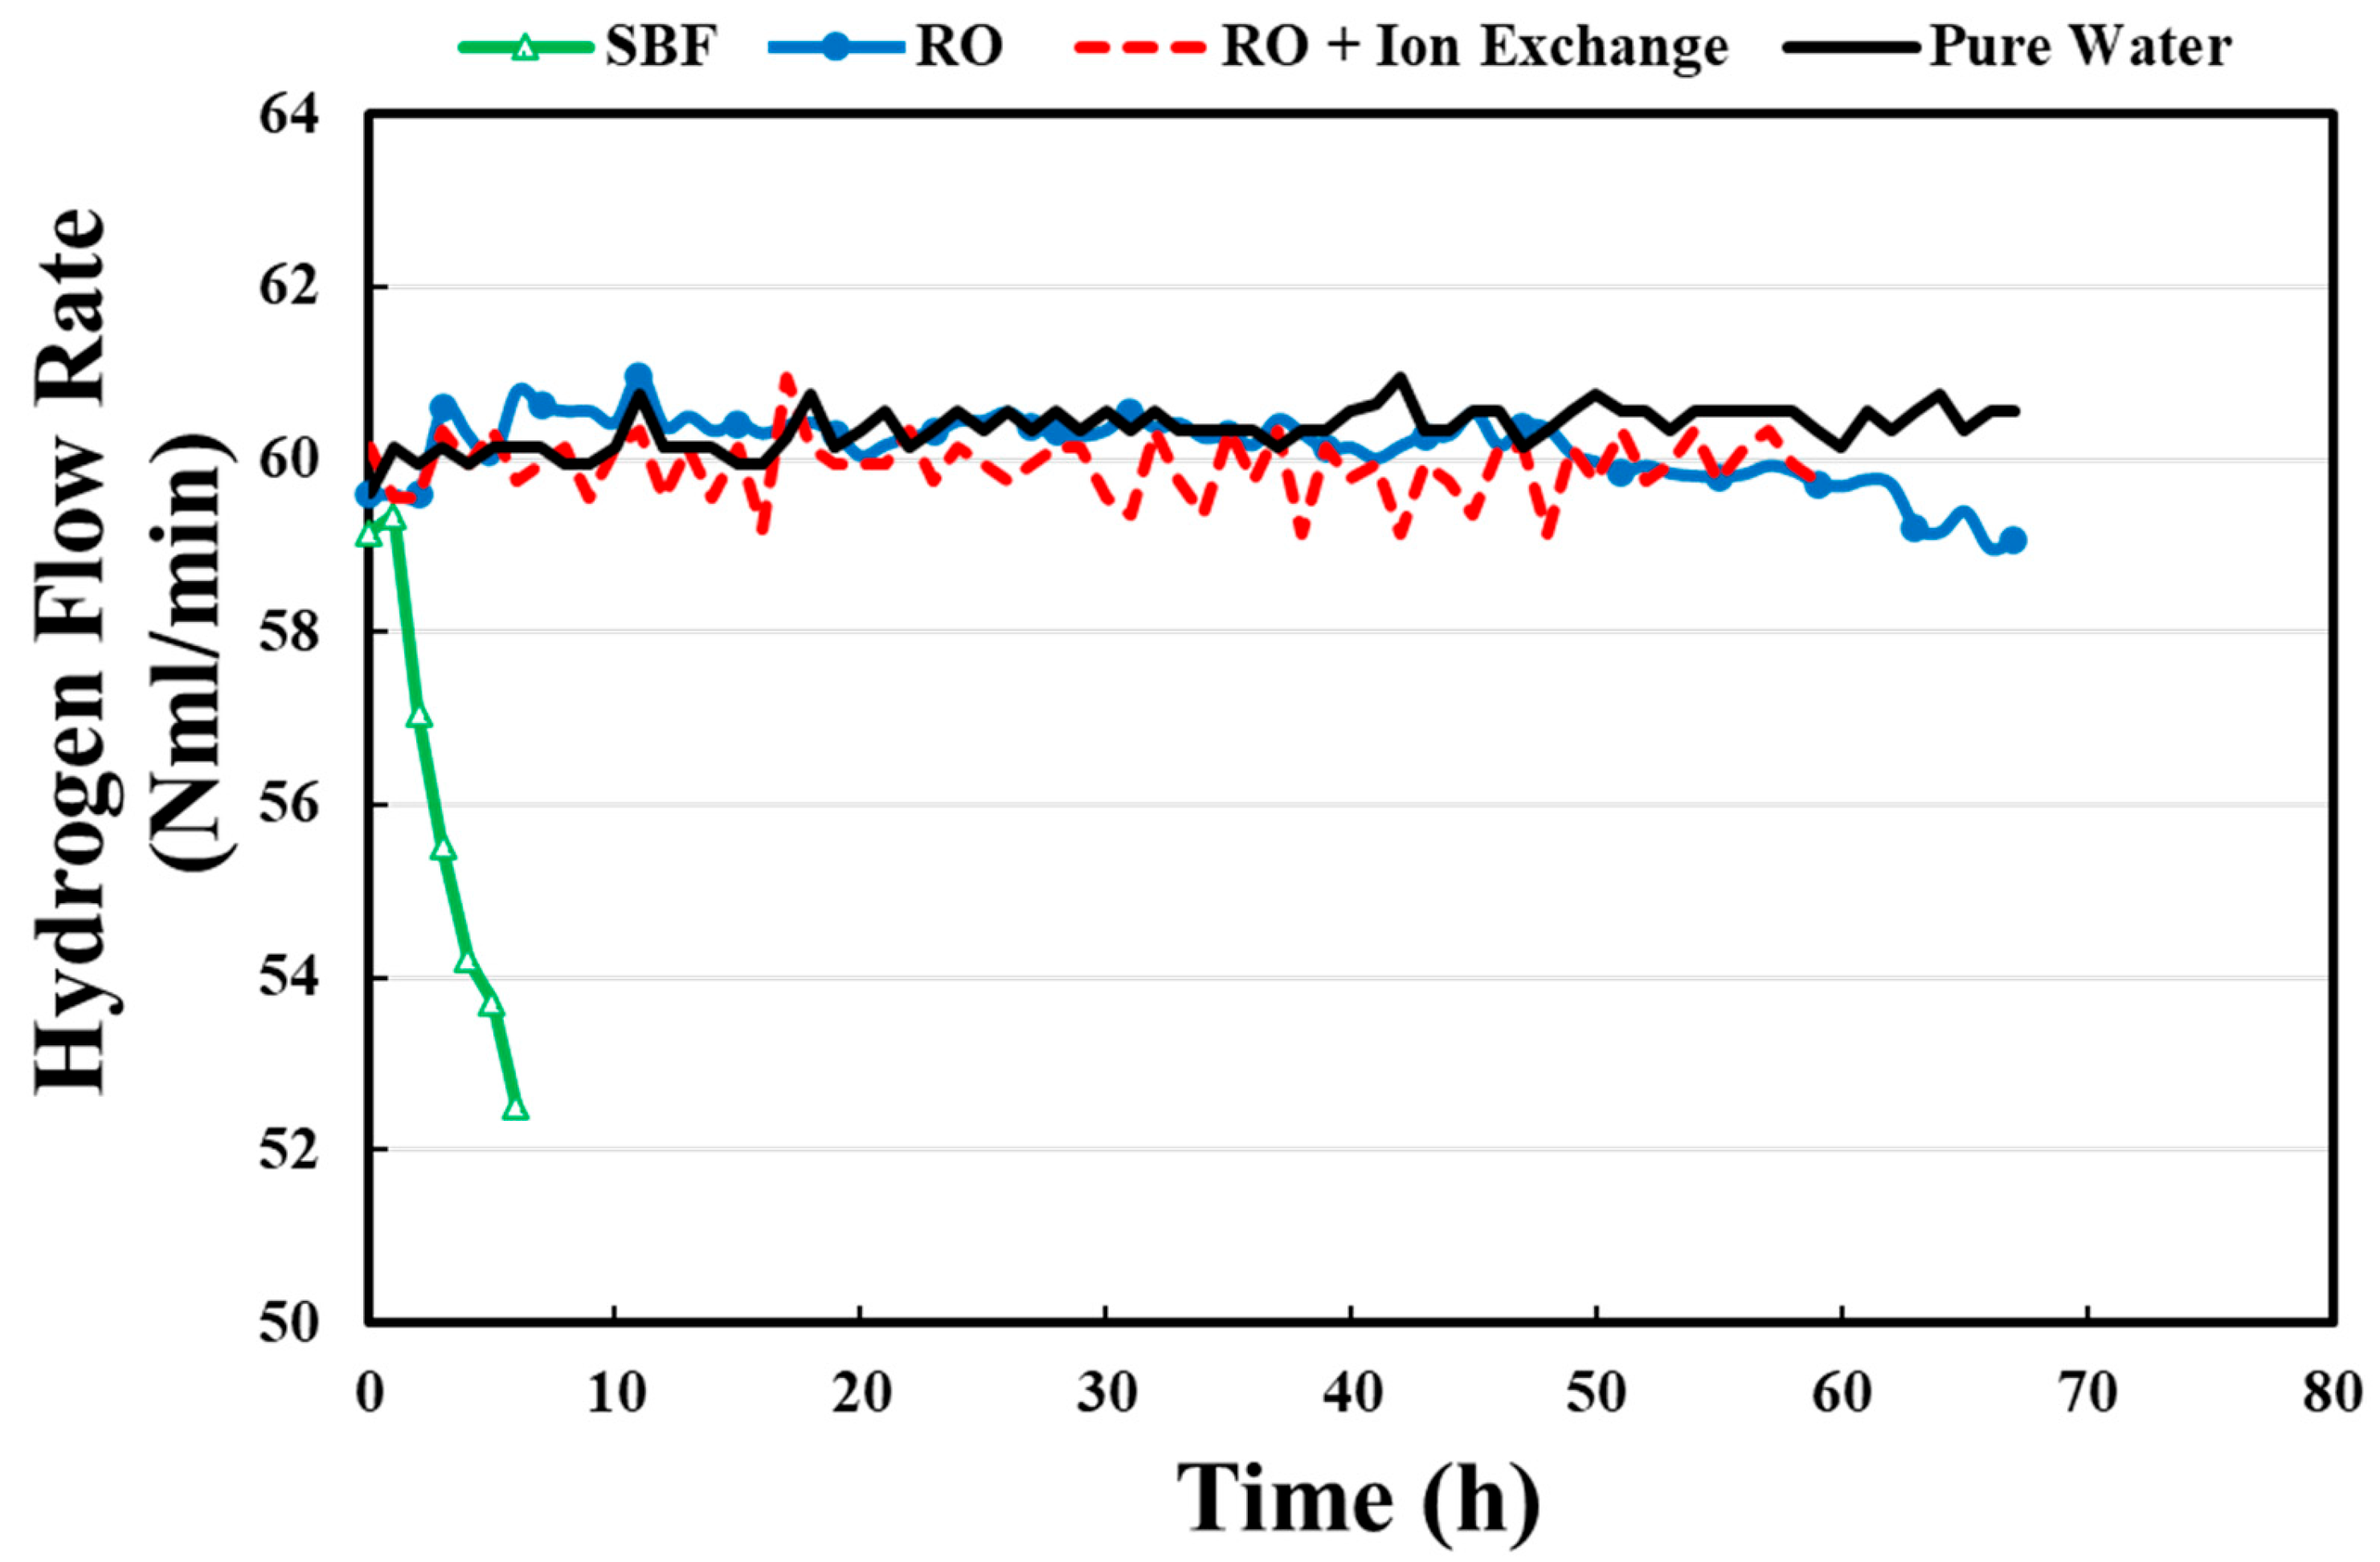
Figure 2 illustrates the impact of different water treatment processes on the operating cell’s voltage profile. When SBF-treated water was applied to the electrolysis system, the voltage initially increased to 3 V after energization. This increase in voltage suggests the presence of residual ionic species that temporarily facilitated electrochemical reactions by increasing the solution’s conductivity. Increasing the voltage and internal resistance leads to energy inefficiency and an unstable electrochemical environment, thereby hindering hydrogen-evolution kinetics. Therefore, hydrogen production decreased with increasing voltage, lasting approximately 6.3 h in the SBF-treated water process, as shown in Figure 3. Higher operating voltages and lower hydrogen-generation efficiency are undesirable for long-term electrolysis. The removal of divalent cations, Mg2+ and Ca2+, from the SBF-treated water is a critical factor, considering the reason why hydrogen production continued until the electrolyte reached a certain level of ion depletion. However, SBF-treated water contains Na+ (>10,000 mg/L) and Cl (>20,000 mg/L), which are nearly equal to the concentrations in seawater. Therefore, it is challenging to produce hydrogen by electrolysis using water treated only by the SBF process.
When RO-treated water was applied to the electrolyzer, the voltage increased to approximately 2.4 V within one hour and then remained stable for the remainder of the measurement period. Moreover, the duration of hydrogen production was significantly longer than with SBF-treated water, reaching 70 h. This stable voltage profile and continuous hydrogen production indicate that RO-treated water provides a more favourable electrolyte composition for sustained electrolysis. However, the decrease in hydrogen production efficiency was due to the presence of 150 mg/L Na+ and 270 mg/L Cl in the RO-treated artificial seawater. Recent studies have also indicated that the presence of even low concentrations of these monovalent ions significantly influences the performance of PEM cells [34]. Cation exchange at the sulfonic acid sites can lower the proton conductivity in Nafion membranes. Na+ ions migrate into the membrane and compete with protons for places to move, increasing internal resistance and overpotential. Cl ions, at concentrations above 100 mg/L, have been reported to accelerate catalyst dissolution and increase anode overpotential by 50–100 mV [45]. This result leads to catalyst corrosion and permanently harms the anode catalyst layer. It is important to keep the amounts of these ions in the feed water as low as possible. Thus, the water produced by the RO membrane treatment process was still insufficient to achieve the high-purity water required to maximize hydrogen production efficiency and minimize operating voltage in water electrolysis applications.
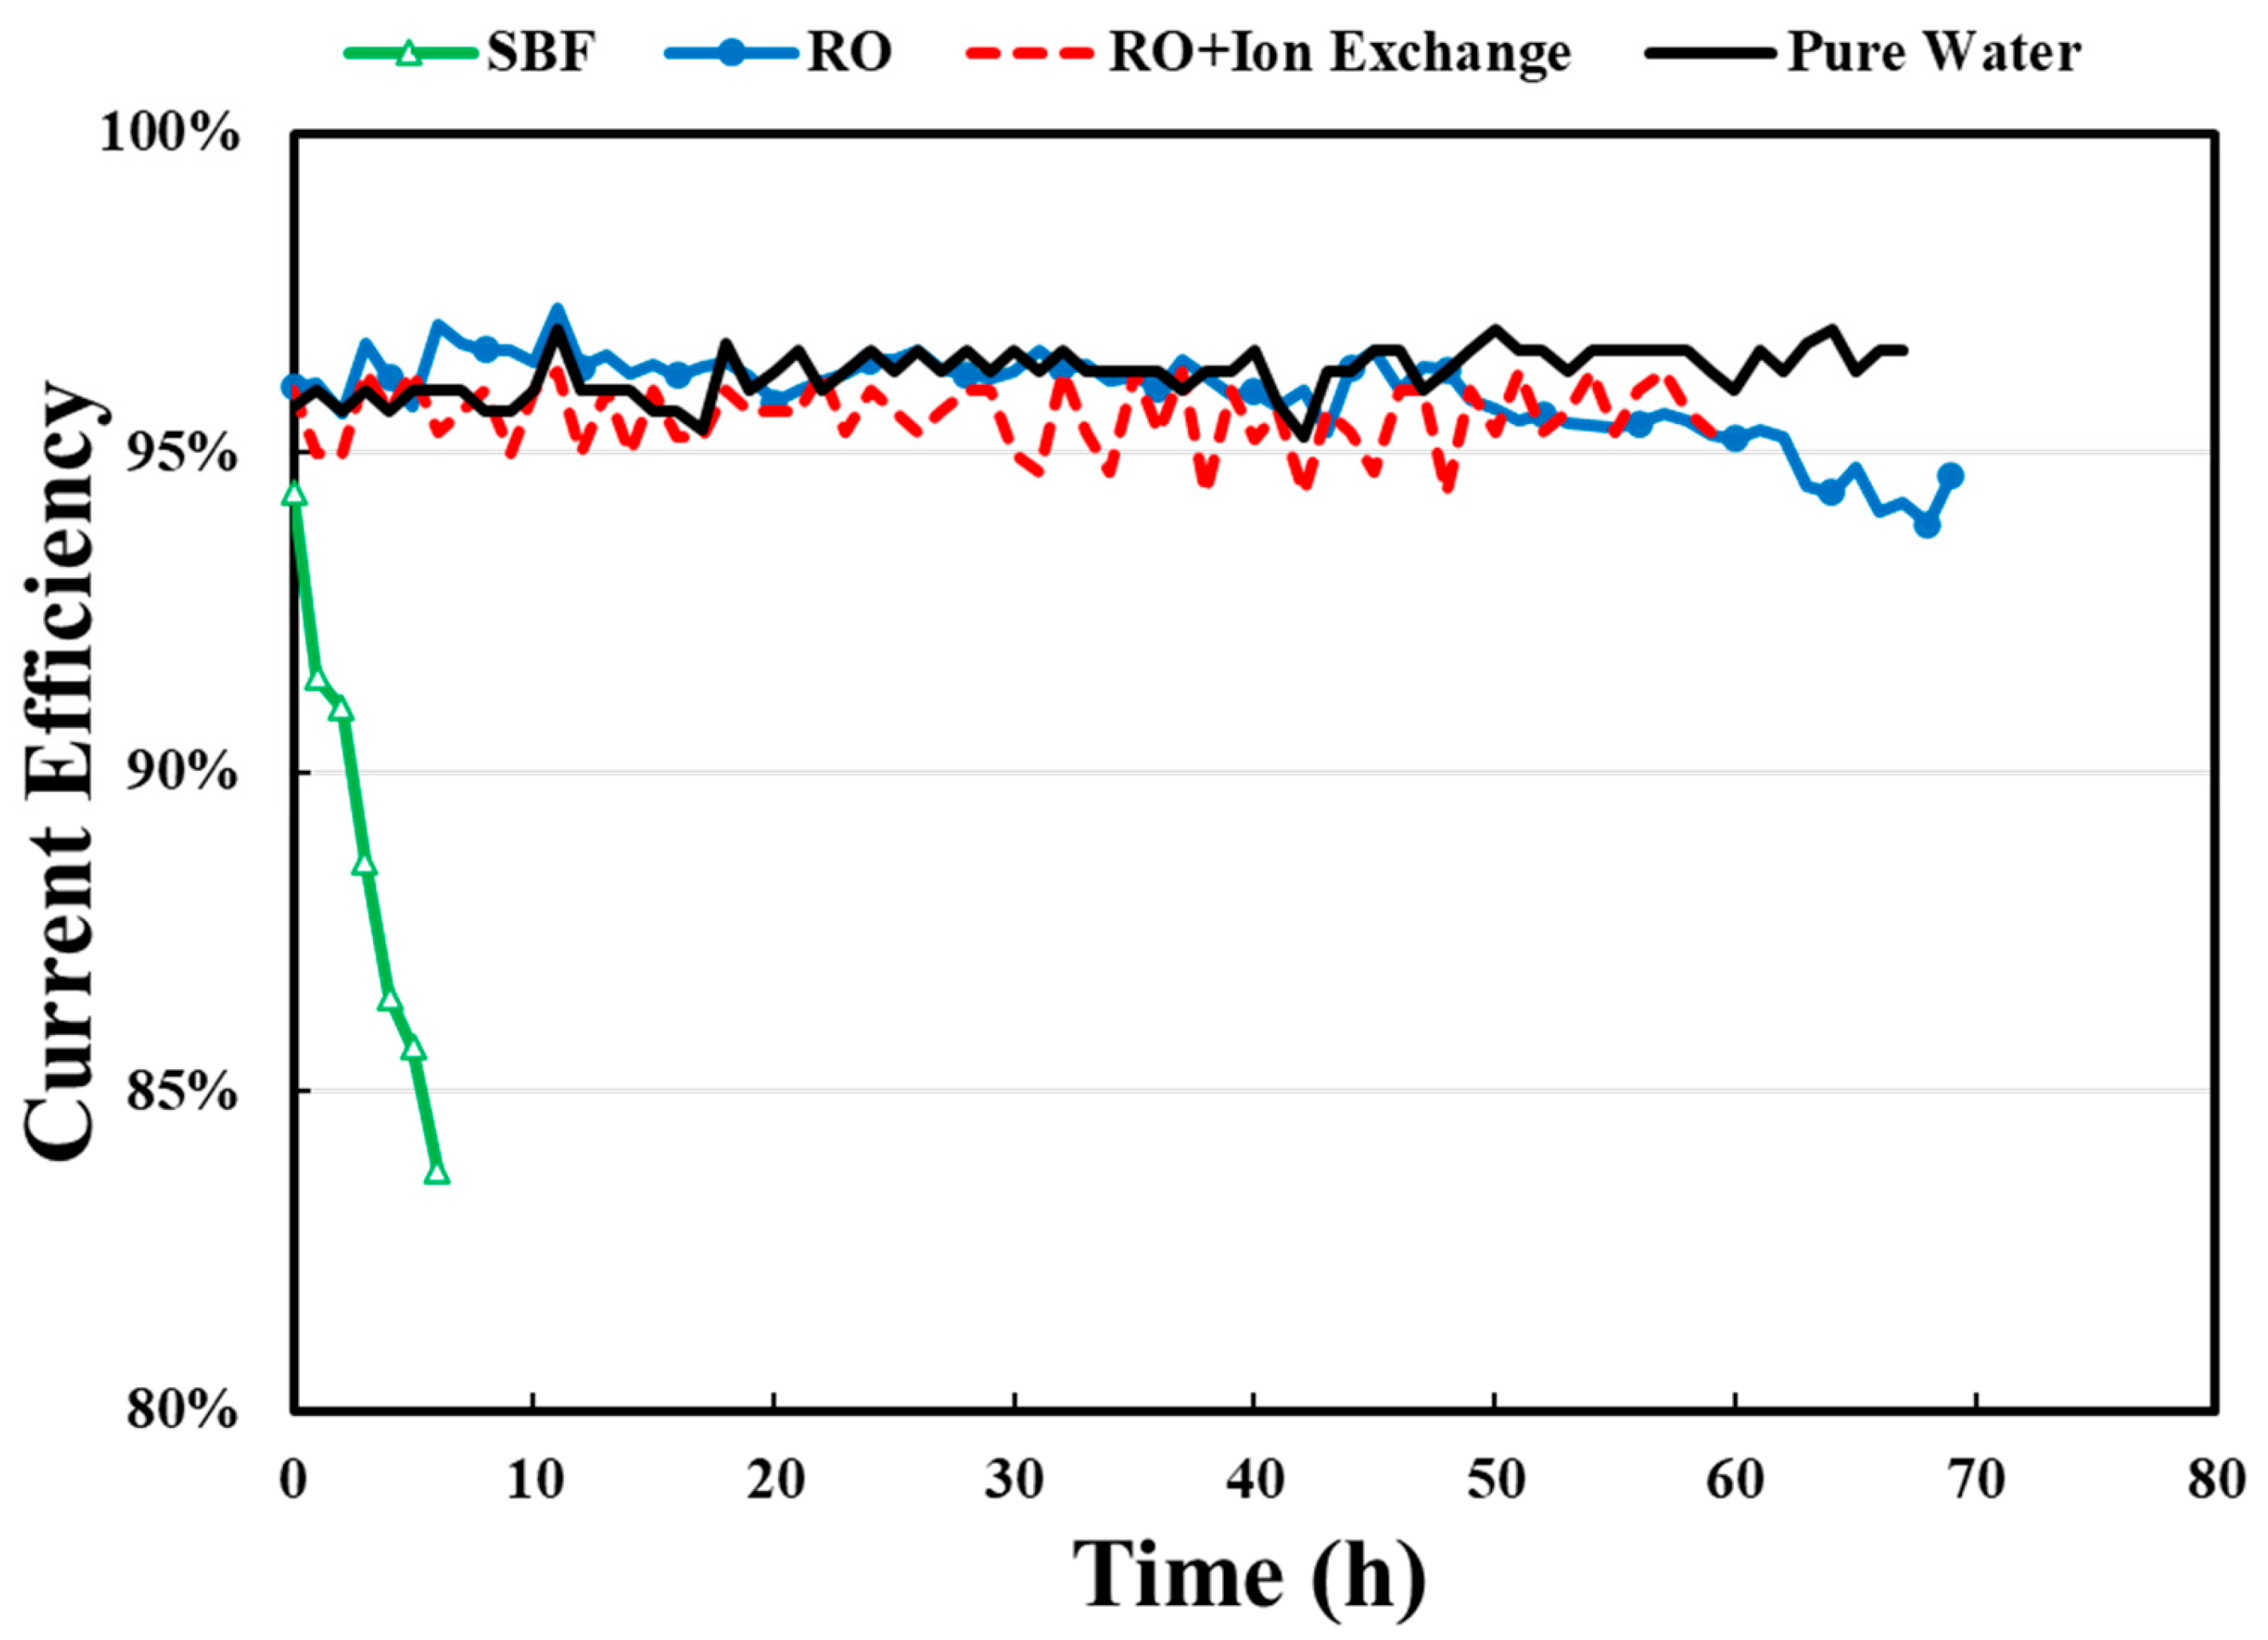
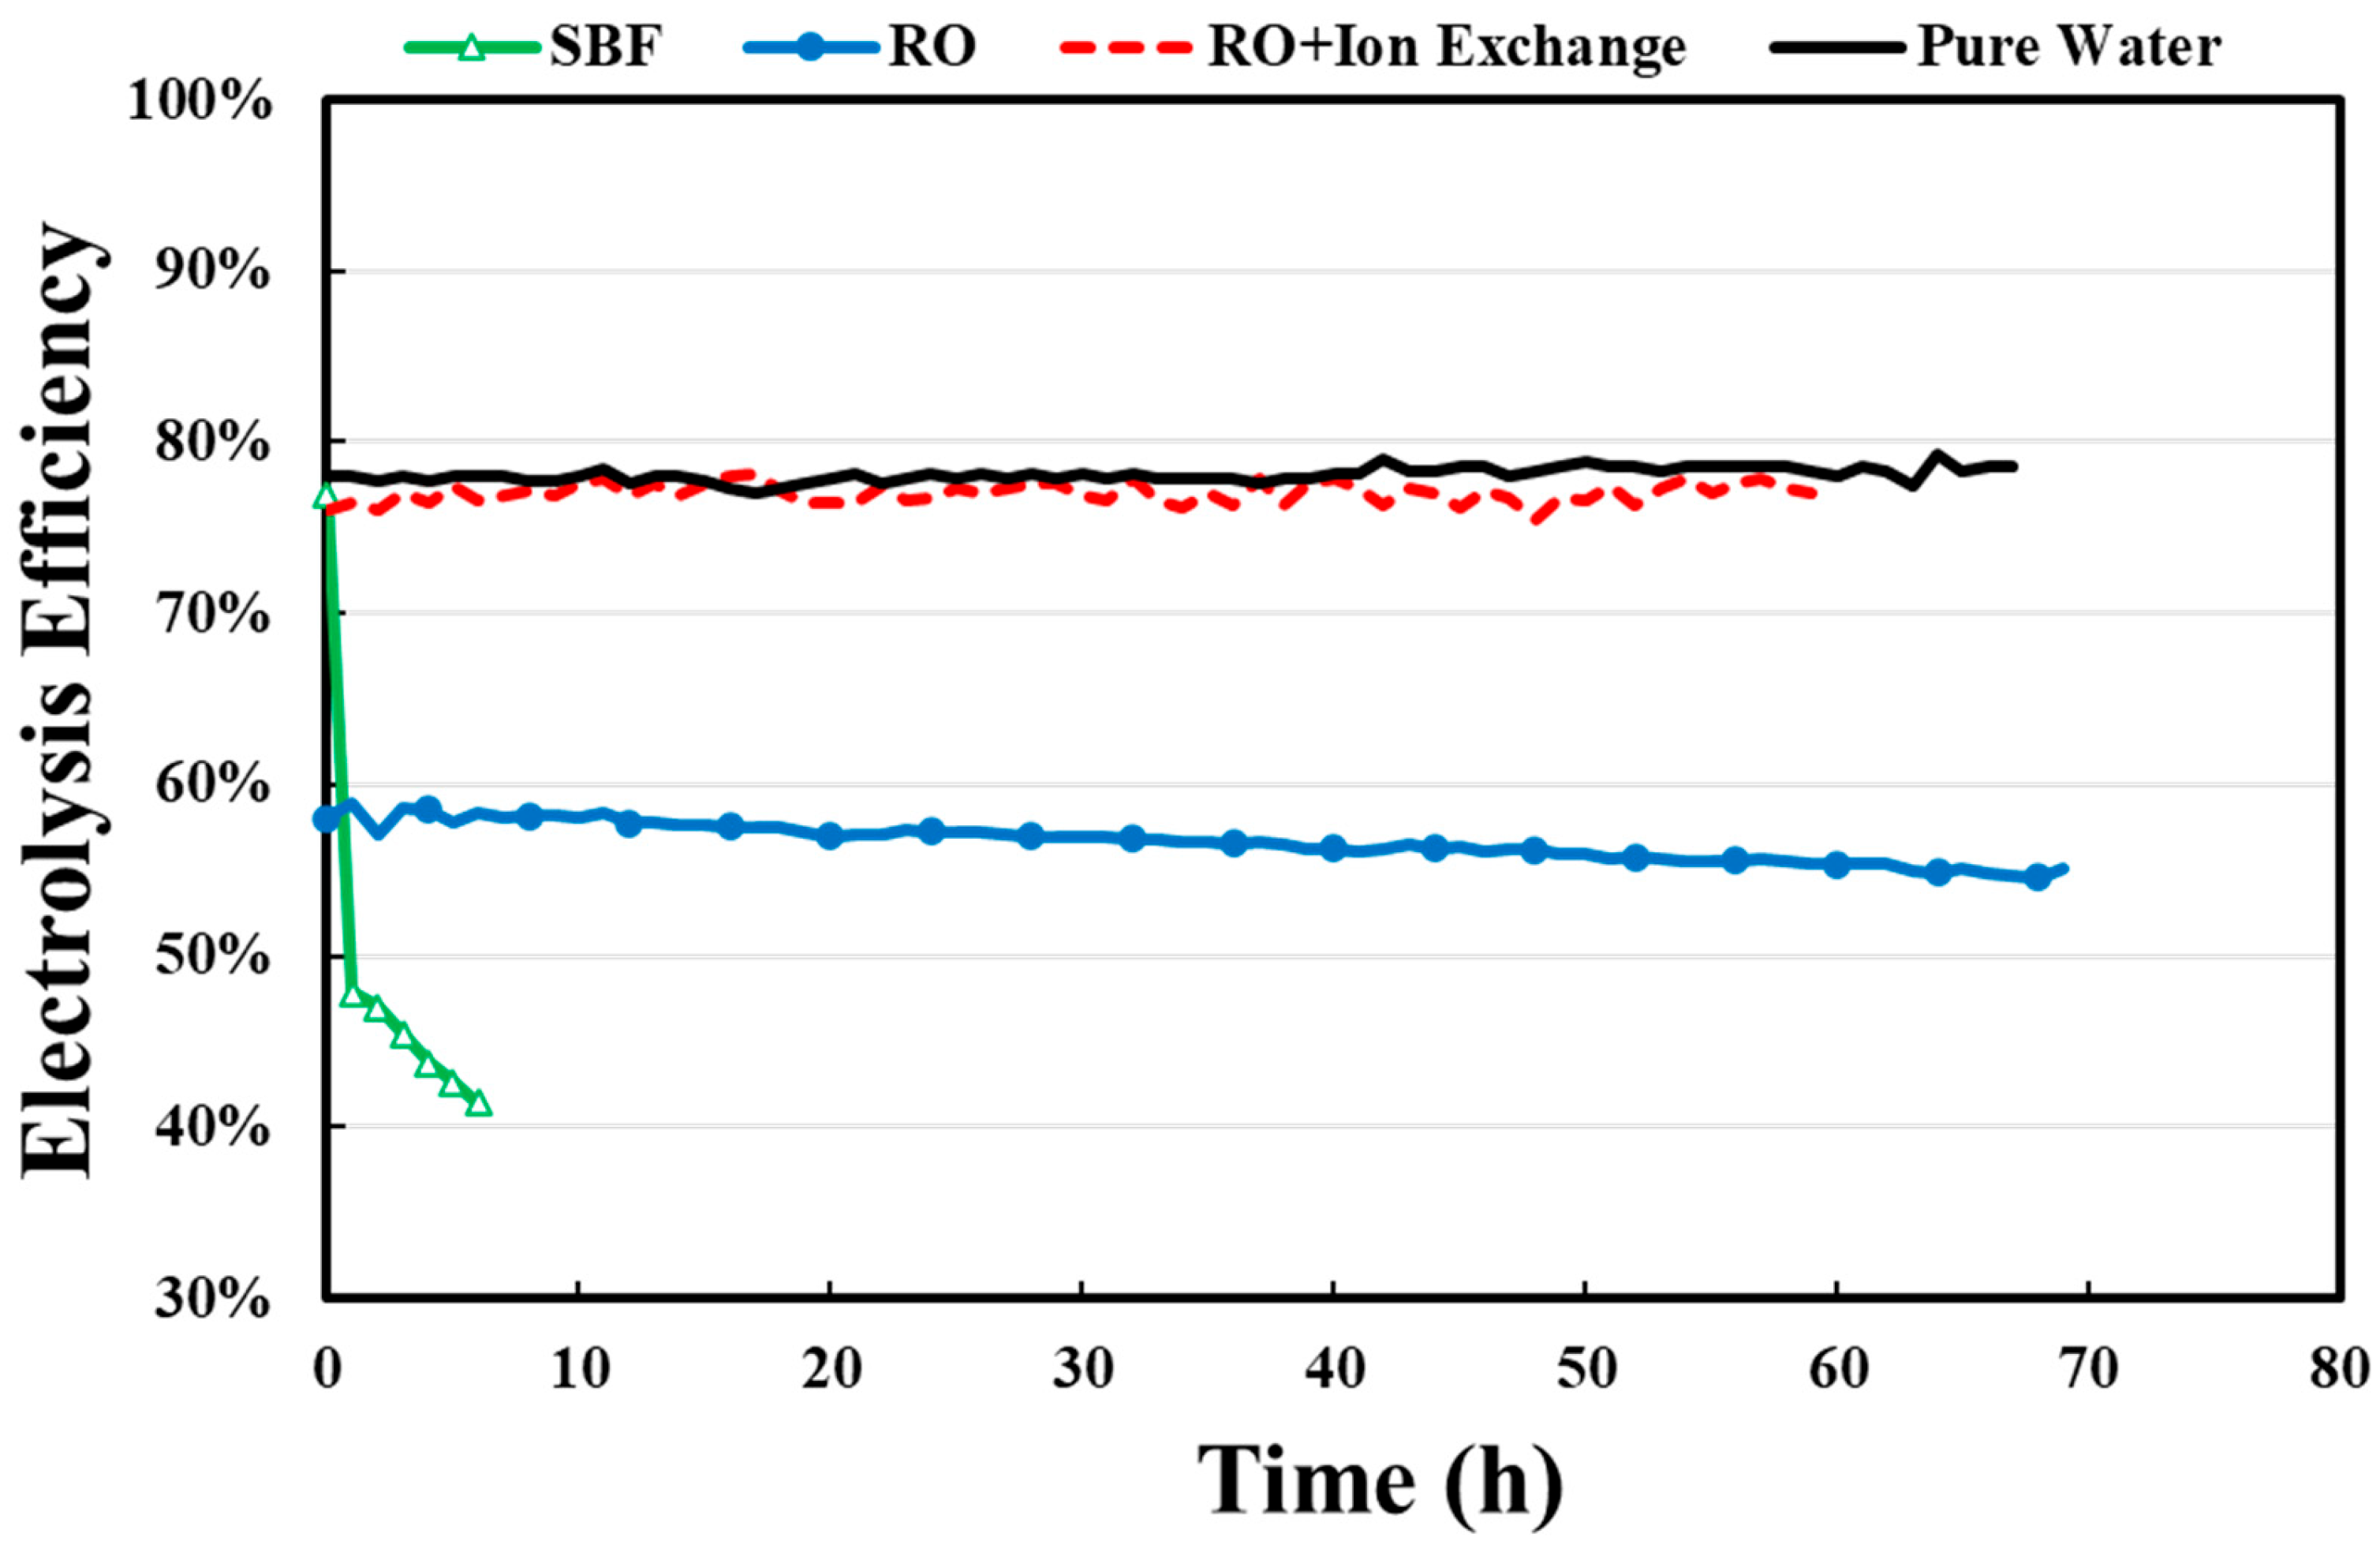
Following RO treatment, the polishing ion-exchange process removed almost all residual ions from the RO-treated water, reducing EC to 0.001 mS/cm, matching the level of high-purity water, producing the final purified water. When this purified water was fed into the electrolyzer, hydrogen production was continuous, and the voltage remained low throughout the 60 h experimental period. The voltage and hydrogen production curves of the final purified water were comparable to those of the purchased pure water. Moreover, the experimental results demonstrated significant improvements in both the current efficiency and electrolysis efficiency of the final treated water, as shown in Figure 4 and Figure 5. While this study indicated short-term stability during the experiment period, long-term operation and further studies for degradation pathways such as membrane thinning, catalyst dissolution, and ion accumulation are required for practical and industrial applications. The electrolysis efficiency was influenced by both the operating cell voltage and current efficiency, indicating that the ion-exchange-treated water effectively minimized the overpotential and optimized the electrolyte composition. The electrolysis efficiency was calculated using the following equation (Equation (1)):
Water   electrolysis   efficiency = 1.48   V ( Cell   voltage ) × Current   efficiency ,
where 1.48 V is the minimum required voltage for water electrolysis, 0 ( Current   efficiency ) 1 , and 0 < ( Cell   voltage ) < 1.48   V .
A basic experiment confirmed that hydrogen production performance can be enhanced through water electrolysis with a comprehensive seawater desalination and purification system using SBF, RO membranes, and ion-exchange processes. This finding is consistent with recent mechanistic insights mentioning the role of advanced catalyst materials, membrane modification, and the impacts of trace ionic contaminants on both efficiency and durability [46,47].
To further contextualize these findings, it is important to compare the proposed process with conventional seawater pre-treatment methods. Coastal and beach seawater as raw water contains high concentrations of cations such as Na+, Mg2+, Ca2+, and K+, and anions such as Cl, SO42−, HCO3, and Br, along with other organic and inorganic suspended solids and microorganism characteristics of each water source. Because RO seawater desalination requires pressurizing the RO membrane above osmotic pressure, removing as many substances that inhibit osmosis as possible is essential in the first stage of the RO process. Conventional pre-treatment processes are divided into two categories: physical and chemical. Actual plants often appropriately combine these two treatment processes [36]. Physical pre-treatment essentially involves mechanical sieving of particulate matter through screens and filters. Chemical pre-treatment includes coagulation with flocculants, the addition of scale inhibitors with pH adjustment, and disinfection with chlorine as the main operations [20]. The primary advantages of conventional treatment processes are that they are well established, easy to adopt, and have long been used [37]. The main objective of these processes is to remove suspended particles prior to the RO membrane process. However, existing pre-treatment processes require large spaces for coagulation and sedimentation, as well as various other treatment steps and substantial amounts of treatment chemicals. The treated water obtained from the pre-treatment process often had high turbidity and silt density index (SDI) values compared to the acceptable levels for the RO process [43,48,49].
In contrast, the SBF proposed in this study has several outstanding features that make it a viable alternative to conventional pre-treatment processes. It can quickly, efficiently, and simultaneously remove Mg2+, Ca2+, suspended particles, and disinfect microorganisms. The settling velocity of flocs in SBF (3.5 cm/s) [30] is 40–70 times higher than that of coagulation–sedimentation flocs using conventional aluminum coagulants (0.05 cm/s) [44,50,51], which allows for significant space savings in sedimentation ponds. The materials used in the SBF treatment include alkaline agents for softening, sand as a ballast, polymer flocculant, and carbon dioxide gas for neutralization. Sodium hydroxide, used as an alkaline agent, is less expensive than the ferric or aluminum coagulants typically used in conventional chemical pre-treatment, and the sand can be recovered from the sludge and reused. The dosage of polymer flocculants is similar to that used in conventional chemical treatments. Although the costs of SBF are currently difficult to assess, it is assumed that the introduction of ballasted coagulation can significantly reduce costs compared with existing coagulation–sedimentation processes, which are analogous to chemical pre-treatment in water purification and wastewater processes [31]. An important advantage is that introducing SBF as a pre-treatment process for seawater reverse osmosis (SWRO) is expected to reduce initial investment costs by saving space in the treatment plant.
Treatment costs for SWRO fluctuated between USD 0.5 and 5 per m3 from 2000 to 2010 but have decreased annually to USD 0.5 to 1 per m3 in 2018 [44,52]. Treatment costs are also expected to decrease due to the absence of inorganic flocculants and the elimination of the need for chlorine disinfection and dechlorination. The process from RO membrane treatment to ion exchange finishing is already widely adopted in current desalination technologies. Therefore, in the proposed desalination process consisting of SBF, RO, and ion exchange, SBF is expected to dominate in terms of energy and economic impacts. SBF is a technology that uses softening to remove Ca2+ and Mg2+ from seawater, which clog RO membranes and reduces the efficiency of water electrolysis. Therefore, SBF uses a completely different principle from existing coagulation–sedimentation and sand filtration, making it difficult to compare their energy and economic impacts at this time. However, the chemical costs of the alkaline agent used for softening and the coagulant are roughly equivalent, and SBF sludge, which contains Mg(OH)2 as a resource, is more useful in terms of the sludge generated. A notable feature of SBF is its high treatment speed. The settling velocity of flocs formed in SBF is 3.5 cm/s, approximately 146 times faster than that of existing coagulation–sedimentation methods, making it significantly faster. The settling velocity of the flocs controls the water surface loading rate, so the area of the settling tank in an actual plant can be reduced to 1/146, achieving an extremely small footprint compared to existing pretreatment processes. Excluding the cost-effectiveness of this ultra-compact design, introducing the final polishing process of SBF, RO, and ion exchange, treatment cost and overall energy consumption may increase due to the introduction of alkaline agent, polymer flocculant, and sand recovery in the SBF process and additional resin regeneration and periodic replacement in the ion exchange process. Preliminary estimates suggest that this combined process may consume 10–20% more energy per cubic meter of treated water and have an estimated operational cost in the range of USD 0.8–1.2 per m3 compared to conventional treatment and the operational cost. These values are predicted based on the current literature and pilot-scale data, and detailed techno-economic analysis is recommended for future work [53,54,55].

4. Discussions

This study demonstrated the feasibility of using seawater as a raw material for hydrogen production through water electrolysis, employing a multistage purification process. The SBF process effectively removes 100% of divalent ions (Mg2+ and Ca2+), reduces turbidity from 4.8 to 1.7 ppm, and eliminates 99.6% of heterotrophic bacteria and all coliforms, though monovalent ions like Na+ increase due to the alkaline agent. However, the RO membrane process after the SBF process further lowered the EC from 30.6 to 0.51 mS/cm and eliminated over 98% of Na+, K+, and SiO2, with trace salts remaining. Furthermore, ion exchange as the polishing process brought EC to 0.001 mS/cm, achieving ion concentrations comparable to those of pure water used in conventional electrolysis systems, and yielded the highest hydrogen production efficiency at the lowest voltage. Building on these outcomes, we propose integrating this water treatment process with high-efficiency photovoltaic power systems to enable sustainable hydrogen production in coastal areas. The integration of renewable energy can significantly enhance economic and environmental sustainability, since energy use accounts for a large share of SWRO costs. Future work should focus on scaling up the system, optimizing costs, and evaluating long-term stability and economic viability for industrial applications. The objective was to obtain fundamental knowledge and information regarding the effects on PEM water electrolysis performance, specifically hydrogen production, using both artificial seawater and natural seawater. The coastal seawater in the region where water electrolysis is envisioned in this study is likely to experience salinity fluctuations due to the influence of freshwater. SBF can adjust the amount of alkali agent required for softening based on salinity [33], making it adaptable to seawater salinity variations. High removal efficiency for the target substances was achieved even in three types of seawater with significantly different salinity and water quality characteristics. However, substances affecting PEM water electrolysis performance may still be present due to geographical location, seasonal changes, and regional pollution. To confirm the broad applicability of this study and advance practical implementation, additional studies using seawater from diverse sources are recommended, considering the potential for significant seawater composition variations due to geographical location, seasonal changes, and regional pollution. This approach offers a promising pathway for utilizing seawater as a feedstock for green hydrogen, contributing to the development of future energy systems.

Author Contributions

Conceptualization, Y.S. and K.N.; Methodology, Y.S. and Y.O.; Validation, P.P.S.S. and T.Y.; Formal analysis, P.P.S.S., T.Y. and Y.S.; Data curation, P.P.S.S. and Y.O.; Resources, H.Y.; Writing—original draft preparation, P.P.S.S. and Y.S.; Writing—review and editing, P.P.S.S., Y.S. and Y.O.; Supervision, K.N. All authors have read and agreed to the published version of the manuscript.

Funding

This research received no external funding.

Institutional Review Board Statement

Not applicable.

Informed Consent Statement

Not applicable.

Data Availability Statement

The data presented in this study are available on request from the corresponding author.

Acknowledgments

Nishihara Environment Co., Ltd. provided experimental materials. We extend our gratitude to all individuals involved for their cooperation. This study did not receive any specific grants from funding agencies in the public, commercial, or nonprofit sectors.

Conflicts of Interest

The authors declare that they have no competing financial interests.

Abbreviations

ECelectrical conductivity
FCVfuel cell vehicle
HERhydrogen evolution process
MEAmembrane electrode assembly
OERoxygen evolution reaction
PEMPolymer Electrolyte Membrane
PFSAperfluorosulfonic acid
ROreverse osmosis
RO–ion exchangeRO membrane and further purification through ion exchange
SBFsoftening with ballasted flocculation
SDIsilt density index
SWROseawater reverse osmosis
USDU.S. dollar
USGSU.S. Geological Survey

References

  1. Zhang, R.; Xie, A.; Cheng, L.; Bai, Z.; Tang, Y.; Wan, P. Hydrogen Production by Traditional and Novel Alkaline Water Electrolysis on Nickel or Iron Based Electrocatalysts. Chem. Commun. 2023, 59, 8205–8221. [Google Scholar] [CrossRef]
  2. Kumar, S.S.; Lim, H. Recent Advances in Hydrogen Production through Proton Exchange Membrane Water Electrolysis—A Review. Sustain. Energy Fuels 2023, 7, 3560–3583. [Google Scholar] [CrossRef]
  3. Yakoub, S.E.; Kashyout, A.E.-H.B.; Shoueir, K.; El-Kemary, M. Design and Performance Analyses of Graphene-Nano Plasmonic Devices for Wireless Gas Sensor Applications. Int. J. Hydrogen Energy 2023, 48, 10299–10314. [Google Scholar] [CrossRef]
  4. Wang, L.; Hao, Y.; Pan, J.; Bi, S.; Hung, S.-F.; Peng, K.-S.; Wang, A.-Y.; Chen, T.-Y.; Li, S.; Ling, C.; et al. Tailored Water–Surface Interactions on Cobalt Oxide for Stable Proton-Exchange-Membrane Water Electrolysis. Nat. Catal. 2026, 9, 123–133. [Google Scholar] [CrossRef]
  5. Hydrogen and Fuel Cell Strategy Council. The Strategic Road Map for Hydrogen and Fuel Cell; Hydrogen and Fuel Cell Strategy Council: Tokyo, Japan, 2019.
  6. U.S. Geological Survey. How Much Water Is There on Earth? Available online: https://www.usgs.gov/water-science-school/science/how-much-water-there-earth (accessed on 27 January 2026).
  7. Chougradi, A.; Zaviska, F.; Abed, A.; Harmand, J.; Jellal, J.-E.; Heran, M. Batch Reverse Osmosis Desalination Modeling under a Time-Dependent Pressure Profile. Membranes 2021, 11, 173. [Google Scholar] [CrossRef] [PubMed]
  8. Peñate, B.; García-Rodríguez, L. Current Trends and Future Prospects in the Design of Seawater Reverse Osmosis Desalination Technology. Desalination 2012, 284, 1–8. [Google Scholar] [CrossRef]
  9. Ren, J.-T.; Chen, L.; Wang, H.-Y.; Tian, W.-W.; Yuan, Z.-Y. Water Electrolysis for Hydrogen Production: From Hybrid Systems to Self-Powered/Catalyzed Devices. Energy Environ. Sci. 2024, 17, 49–113. [Google Scholar] [CrossRef]
  10. Gao, L.; Yoshikawa, S.; Iseri, Y.; Fujimori, S.; Kanae, S. An Economic Assessment of the Global Potential for Seawater Desalination to 2050. Water 2017, 9, 763. [Google Scholar] [CrossRef]
  11. Tu, K.L.; Chivas, A.R.; Nghiem, L.D. Effects of Membrane Fouling and Scaling on Boron Rejection by Nanofiltration and Reverse Osmosis Membranes. Desalination 2011, 279, 269–277. [Google Scholar] [CrossRef]
  12. Fortunato, L.; Alshahri, A.H.; Farinha, A.S.F.; Zakzouk, I.; Jeong, S.; Leiknes, T. Fouling Investigation of a Full-Scale Seawater Reverse Osmosis Desalination (SWRO) Plant on the Red Sea: Membrane Autopsy and Pretreatment Efficiency. Desalination 2020, 496, 114536. [Google Scholar] [CrossRef]
  13. Susanto, H.; Franzka, S.; Ulbricht, M. Dextran Fouling of Polyethersulfone Ultrafiltration Membranes—Causes, Extent and Consequences. J. Membr. Sci. 2007, 296, 147–155. [Google Scholar] [CrossRef]
  14. Bucs, S.S.; Valladares Linares, R.; Vrouwenvelder, J.S.; Picioreanu, C. Biofouling in Forward Osmosis Systems: An Experimental and Numerical Study. Water Res. 2016, 106, 86–97. [Google Scholar] [CrossRef] [PubMed]
  15. Miyakawa, H.; Maghram Al Shaiae, M.; Green, T.N.; Ito, Y.; Sugawara, Y.; Onishi, M.; Fusaoka, Y.; Farooque Ayumantakath, M.; Saleh Al Amoudi, A. Reliable Sea Water Ro Operation with High Water Recovery and No-Chlorine/No-Sbs Dosing in Arabian Gulf, Saudi Arabia. Membranes 2021, 11, 141. [Google Scholar] [CrossRef] [PubMed]
  16. Shih, W.-Y.; Rahardianto, A.; Lee, R.-W.; Cohen, Y. Morphometric Characterization of Calcium Sulfate Dihydrate (Gypsum) Scale on Reverse Osmosis Membranes. J. Membr. Sci. 2005, 252, 253–263. [Google Scholar] [CrossRef]
  17. Tang, C.Y.; Kwon, Y.-N.; Leckie, J.O. Fouling of Reverse Osmosis and Nanofiltration Membranes by Humic Acid—Effects of Solution Composition and Hydrodynamic Conditions. J. Membr. Sci. 2007, 290, 86–94. [Google Scholar] [CrossRef]
  18. Ling, B.; Xie, P.; Ladner, D.; Battiato, I. Dynamic Modeling of Fouling in Reverse Osmosis Membranes. Membranes 2021, 11, 349. [Google Scholar] [CrossRef]
  19. Pontié, M.; Rapenne, S.; Thekkedath, A.; Duchesne, J.; Jacquemet, V.; Leparc, J.; Suty, H. Tools for Membrane Autopsies and Antifouling Strategies in Seawater Feeds: A Review. Desalination 2005, 181, 75–90. [Google Scholar] [CrossRef]
  20. Henthorne, L.; Boysen, B. State-of-the-Art of Reverse Osmosis Desalination Pretreatment. Desalination 2015, 356, 129–139. [Google Scholar] [CrossRef]
  21. Prihasto, N.; Liu, Q.-F.; Kim, S.-H. Pre-Treatment Strategies for Seawater Desalination by Reverse Osmosis System. Desalination 2009, 249, 308–316. [Google Scholar] [CrossRef]
  22. Yurt, A.; Aykın, Ö. Diphenolic Schiff Bases as Corrosion Inhibitors for Aluminium in 0.1 M HCl: Potentiodynamic Polarisation and EQCM Investigations. Corros. Sci. 2011, 53, 3725–3732. [Google Scholar] [CrossRef]
  23. Popova, A.; Christov, M.; Vasilev, A. Mono- and Dicationic Benzothiazolic Quaternary Ammonium Bromides as Mild Steel Corrosion Inhibitors. Part II: Electrochemical Impedance and Polarisation Resistance Results. Corros. Sci. 2011, 53, 1770–1777. [Google Scholar] [CrossRef]
  24. Guigui, C.; Rouch, J.C.; Durand-Bourlier, L.; Bonnelye, V.; Aptel, P. Impact of Coagulation Conditions on the In-Line Coagulation/UF Process for Drinking Water Production. Desalination 2002, 147, 95–100. [Google Scholar] [CrossRef]
  25. Sun, C.; Xie, L.; Li, X.; Sun, L.; Dai, H. Study on Different Ultrafiltration-Based Hybrid Pretreatment Systems for Reverse Osmosis Desalination. Desalination 2015, 371, 18–25. [Google Scholar] [CrossRef]
  26. Baig, M.B.; Al Kutbi, A.A. Design Features of a 20 Migd SWRO Desalination Plant, Al Jubail, Saudi Arabia. Desalination 1998, 118, 5–12. [Google Scholar] [CrossRef]
  27. Zeino, A.; Albakri, M.; Khaled, M.; Zarzour, M. Comparative Study of the Synergistic Effect of ATMP and DTPMPA on CaSO4 Scale Inhibition and Evaluation of Induction Time Effect. J. Water Process Eng. 2018, 21, 1–8. [Google Scholar] [CrossRef]
  28. Yoshimura, R.; Wai, S.; Ota, Y.; Nishioka, K.; Suzuki, Y. Effects of Artificial River Water on PEM Water Electrolysis Performance. Catalysts 2022, 12, 934. [Google Scholar] [CrossRef]
  29. Ayoub, G.M.; Zayyat, R.M.; Al-Hindi, M. Precipitation Softening: A Pretreatment Process for Seawater Desalination. Environ. Sci. Pollut. Res. 2014, 21, 2876–2887. [Google Scholar] [CrossRef]
  30. Kodamatani, H.; Kubozono, K.; Kanzaki, R.; Tomiyasu, T.; Fujioka, T. Reverse Osmosis Membrane-Based Pretreatment for the Quantification of N-Nitrosodimethylamine Concentrations in High-Matrix Water Samples. Environ. Sci. Water Res. Technol. 2023, 9, 2553–2560. [Google Scholar] [CrossRef]
  31. ACTIFLO® Softening. Available online: https://www.veoliawatertech.com/en/technologies/actiflo-softening (accessed on 27 January 2026).
  32. Denieul, M.-P.; Mauchauffée, S.; Barbier, E.; Calvez, G.L.; De Laval, A.; Coste, M. Industrial Waste Waters Re-Use: Application of 3FM® High Speed Filtration and High Rate Softening as Pre-Treatment of Wastewaters from the High Water Consuming Pulp&Paper Sector. Proc. Water Environ. Fed. 2011, 2011, 5136–5150. [Google Scholar] [CrossRef]
  33. Yadai, T.; Suzuki, Y. Development of Softening and Ballasted Flocculation as a Pretreatment Process for Seawater Desalination through a Reverse Osmosis Membrane. NPJ Clean Water 2023, 6, 7. [Google Scholar] [CrossRef]
  34. Liu, C.; Guo, Y.; Zhang, J.; Tian, B.; Lin, O.; Liu, Y.; Zhang, C. Tailor-Made High-Performance Reverse Osmosis Membranes by Surface Fixation of Hydrophilic Macromolecules for Wastewater Treatment. RSC Adv. 2019, 9, 17766–17777. [Google Scholar] [CrossRef]
  35. Comstock, S.E.H.; Boyer, T.H.; Graf, K.C. Treatment of Nanofiltration and Reverse Osmosis Concentrates: Comparison of Precipitative Softening, Coagulation, and Anion Exchange. Water Res. 2011, 45, 4855–4865. [Google Scholar] [CrossRef]
  36. Lu, T.; Liu, Y.; Xu, X.; Pan, L.; Alothman, A.A.; Shapter, J.; Wang, Y.; Yamauchi, Y. Highly Efficient Water Desalination by Capacitive Deionization on Biomass-Derived Porous Carbon Nanoflakes. Sep. Purif. Technol. 2021, 256, 117771. [Google Scholar] [CrossRef]
  37. Suzuki, Y.; Kaku, R.; Takahashi, K.; Kanai, M.; Tamai, S.; Annaka, Y.; Chuganji, N. Optimum Conditions for High-Speed Solid–Liquid Separation by Ballasted Flocculation. Water Sci. Technol. 2023, 88, 35–46. [Google Scholar] [CrossRef] [PubMed]
  38. Carmo, M.; Fritz, D.L.; Mergel, J.; Stolten, D. A Comprehensive Review on PEM Water Electrolysis. Int. J. Hydrogen Energy 2013, 38, 4901–4934. [Google Scholar] [CrossRef]
  39. Grigoriev, S.A.; Millet, P.; Volobuev, S.A.; Fateev, V.N. Optimization of Porous Current Collectors for PEM Water Electrolysers. Int. J. Hydrogen Energy 2009, 34, 4968–4973. [Google Scholar] [CrossRef]
  40. Mauritz, K.A.; Moore, R.B. State of Understanding of Nafion. Chem. Rev. 2004, 104, 4535–4586. [Google Scholar] [CrossRef]
  41. Mandal, M.; Moore, M.; Secanell, M. Measurement of the Protonic and Electronic Conductivities of PEM Water Electrolyzer Electrodes. ACS Appl. Mater. Interfaces 2020, 12, 49549–49562. [Google Scholar] [CrossRef]
  42. Ghaffour, N.; Missimer, T.M.; Amy, G.L. Technical Review and Evaluation of the Economics of Water Desalination: Current and Future Challenges for Better Water Supply Sustainability. Desalination 2013, 309, 197–207. [Google Scholar] [CrossRef]
  43. Shwe Sin, P.; Wai, S.; Ota, Y.; Nishioka, K.; Suzuki, Y. Performance Recovery of Proton Exchange Membrane Electrolyzer Degraded by Metal Cations Contamination. Int. J. Hydrogen Energy 2024, 53, 86–92. [Google Scholar] [CrossRef]
  44. Greenlee, L.F.; Lawler, D.F.; Freeman, B.D.; Marrot, B.; Moulin, P. Reverse Osmosis Desalination: Water Sources, Technology, and Today’s Challenges. Water Res. 2009, 43, 2317–2348. [Google Scholar] [CrossRef] [PubMed]
  45. Ran, Q.; Feng, H.; Chang, G.; Luo, M.; Xu, S. Thymine-Mediated Electrochemical Aptasensor for Sensitive and Simultaneous Detection of Hg2+ and CH3Hg+ in Fish Samples. Electrochim. Acta 2023, 461, 142406. [Google Scholar] [CrossRef]
  46. Wu, L.; Xu, Y.; Wang, Q.; Zou, X.; Pan, Z.; Leung, M.K.H.; An, L. Direct Seawater Electrolysis for Green Hydrogen Production: Electrode Designs, Cell Configurations, and System Integrations. Energy Environ. Sci. 2025, 18, 4596–4624. [Google Scholar] [CrossRef]
  47. He, X.; Li, Z.; Yao, Y.; Luo, F.; Sun, X.; Tang, B. Surface and Interfacial Engineering of Electrocatalysts for Seawater Electrolysis. Acc. Chem. Res. 2026, 59, 518–528. [Google Scholar] [CrossRef]
  48. Kavitha, J.; Rajalakshmi, M.; Phani, A.R.; Padaki, M. Pretreatment Processes for Seawater Reverse Osmosis Desalination Systems—A Review. J. Water Process Eng. 2019, 32, 100926. [Google Scholar] [CrossRef]
  49. Pearce, P. Trickling Filters for Upgrading Low Technology Wastewater Plants for Nitrogen Removal. Water Sci. Technol. 2004, 49, 47–52. [Google Scholar] [CrossRef]
  50. Ebrahim, S.; Abdel-Jawad, M.; Bou-Hamad, S.; Safar, M. Fifteen Years of R&D Program in Seawater Desalination at KISR Part I. Pretreatment Technologies for RO Systems. Desalination 2001, 135, 141–153. [Google Scholar] [CrossRef]
  51. Jamaly, S.; Darwish, N.N.; Ahmed, I.; Hasan, S.W. A Short Review on Reverse Osmosis Pretreatment Technologies. Desalination 2014, 354, 30–38. [Google Scholar] [CrossRef]
  52. Kurihara, M. Sustainable Seawater Reverse Osmosis Desalination as Green Desalination in the 21st Century. J. Membr. Sci. Res. 2020, 6, 20–29. [Google Scholar] [CrossRef]
  53. Li, M. Effects of Finite Flux and Flushing Efficacy on Specific Energy Consumption in Semi-Batch and Batch Reverse Osmosis Processes. Desalination 2020, 496, 114646, Corrigendum in Desalination 2022, 540, 116032. https://doi.org/10.1016/j.desal.2022.116032. [Google Scholar] [CrossRef]
  54. Nandikes, G.; Pathak, P.; Karthikeyan, M.; Abahussain, A.A.M.; Singh, L. Mesoporous LaFeO3 Perovskite as an Efficient and Cost-Effective Oxygen Reduction Reaction Catalyst in an Air Cathode Microbial Fuel Cell. Int. J. Hydrogen Energy 2024, 52, 627–641. [Google Scholar] [CrossRef]
  55. Abyar, H.; Nowrouzi, M.; Rezaei, H. Comparative Assessment of Ion-Exchange/Reverse Osmosis and Ultrafiltration/Reverse Osmosis for Seawater Desalination: Environmental, Economic, and Operational Perspectives. Environ. Sci. Pollut. Res. 2024, 31, 65220–65232. [Google Scholar] [CrossRef]
Figure 1. Experimental flow diagram of seawater treatment and electrolysis process.
Applsci 16 02622 g001
Figure 2. Operating cell voltage profile after treatment processes.
Applsci 16 02622 g002
Figure 3. Hydrogen generation rate for each treatment process.
Applsci 16 02622 g003
Figure 4. Current efficiency for each water treatment process.
Applsci 16 02622 g004
Figure 5. Electrolysis Efficiency for different water treatment processes.
Applsci 16 02622 g005
Table 1. Composition of Artificial Seawater and Natural Seawater.
SampleNa (mg/L)Mg (mg/L)Ca (mg/L)K (mg/L)
Artificial Seawater10,5801642459395
Natural Seawater90801049302331
Table 2. Artificial Seawater quality metrics after each treatment process.
ParameterUnitArtificial Seawater
Raw WaterSBF-Treated WaterSBF-Treated Water (Neutralization)RO Membrane-Treated WaterRO + Ion Exchange-Treated Water
Mean ± SD *
(n = 3)
Mean ± SD
(n = 3)
Mean ± SD
(n = 3)
Mean ± SD
(n = 3)
Mean ± SD
(n = 3)
pH-8.0 ± 0.03112.0 ± 0.0186.7 ± 0.216.5 ± 4.96.1 ± 0.054
ECmS/cm40.0 ± 0.22-41.0 ± 0.300.73 ± 0.0130.001 ± 0.24
SiO2mg/L1.7 ± 0.20-0.8 ± 0.160.23 ± 0.12ND
Mg2+mg/L1642 ± 7.4-NDNDND
Ca2+mg/L459 ± 1.0-NDNDND
Na+mg/L10,583 ± 65.6-12,339 ± 74.5152 ± 2.20.01 ± 0.01
K+mg/L395 ± 1.2-353 ± 2.25.5 ± 0.040.7 ± 0.01
Clmg/L22,676 ± 464.4-20,681 ± 407.0267 ± 59.60.29± 0.017
Brmg/L51.5 ± 3.9-47.4 ± 2.60.68 ± 0.13ND
SO42−mg/L2173 ± 33.4-1961 ± 33.96.7 ± 1.5ND
* SD: Standard deviation; ND: Not detected.
Table 3. Natural Seawater quality metrics after each treatment process.
ParameterUnitNatural Seawater from Aoshima Port
Raw WaterSBF-Treated WaterSBF-Treated Water (Neutralization)RO Membrane-Treated WaterRO + Ion Exchange-Treated Water
Mean ± SD *
(n = 3)
Mean ± SD
(n = 3)
Mean ± SD
(n = 3)
Mean ± SD
(n = 3)
Mean ± SD
(n = 3)
pH-8.2 ± 0.0612.9 ± 0.0116.8 ± 0.0297.6 ± 0.0436.4 ± 0.13
ECmS/cm41.3 ± 0.90-30.6 ± 0.120.51 ± 0.0160.001 ± 0.097
Turbidityppm4.8 ± 0.18-1.7 ± 0.290.000.00
SiO2mg/L3.3 ± 0.47-2.9 ± 0.210.20 ± 0.082ND
Mg2+mg/L1049 ± 0.028-NDNDND
Ca2+mg/L302 ± 59.9-NDNDND
Na+mg/L9082 ± 42.9-11,113 ± 67.4122 ± 0.8ND
K+mg/L331 ± 1.1-309 ± 0.494.4 ± 0.011.0 ± 0.04
Clmg/L--Not determined258 ± 2.00.39 ± 0.069
Brmg/L--Not determined0.66 ± 0.05ND
SO42−mg/L--Not determined6.7 ± 0.0560
E. coliCFU/100 mL31.0 ± 8.2-NDNDND
ColiformsCFU/100 mL87.3 ± 8.2-NDNDND
Heterotrophic bacteriaCFU/100 mL87,000 ± 8200-330 ± 470NDND
* SD: Standard deviation; ND: Not detected.
Disclaimer/Publisher’s Note: The statements, opinions and data contained in all publications are solely those of the individual author(s) and contributor(s) and not of MDPI and/or the editor(s). MDPI and/or the editor(s) disclaim responsibility for any injury to people or property resulting from any ideas, methods, instructions or products referred to in the content.