Article

LightGBM-CH Prediction Method for Fatigue Life of Elastic Wheel on Soft Ground


1
School of Electrical Engineering and Control Science, Nanjing Tech University, Nanjing 211816, China
2
School of Instrument Science and Engineering, Southeast University, Nanjing 211189, China
*
Author to whom correspondence should be addressed.
Appl. Sci. 2026, 16(5), 2329; https://doi.org/10.3390/app16052329
Submission received: 24 January 2026 / Revised: 21 February 2026 / Accepted: 25 February 2026 / Published: 27 February 2026
(This article belongs to the Section Mechanical Engineering)

Abstract

The operational reliability of the elastic wheel, essential for specialized vehicle mobility on complex terrain, is critically constrained by fatigue failure under multi-axis ground loads. While high-fidelity physics-based simulation provides an accurate assessment, its “one-simulation-per-test” paradigm is inefficient for exploring multi-condition, multi-parameter designs. Conversely, purely data-driven methods are hindered by the scarcity of high-quality fatigue data. This paper proposes LightGBM-CH, an integrated framework that couples Discrete Element Method–Multi-Body Dynamics (DEM-MBD) simulation with an enhanced LightGBM model to overcome these limitations. The framework first converts high-fidelity simulations into a configurable data generator, producing batches of dynamic load–stress response data. A physics-informed feature engineering scheme then extracts 122 discriminative features characterizing six-dimensional loads, fatigue damage metrics, and load–stress coupling. To address the “small-sample, high-dimensional” challenge, a tailored training strategy incorporating robust scaling, correlation-based feature selection, and stability-constrained hyperparameter optimization is developed. Simulation experiments demonstrate that the LightGBM-CH model achieves a determination coefficient of 0.9251 and a root mean square error of 67.06, significantly outperforming benchmark models in accuracy and generalization. The study validates the framework’s engineering efficacy, identifies key influencing factors such as peak–stress ratio, and provides an intelligent, data-informed pathway for fatigue-resistant elastic wheel design.

1. Introduction

It is evident that elastic wheels possess a number of advantageous properties, including outstanding vibration-damping capabilities and terrain adaptability. Consequently, they hold significant application potential across a range of domains, including interstellar exploration, specialized vehicles, and agricultural equipment [1,2,3]. When traversing loose, unstructured ground, the wheels can effectively reduce ground pressure through their own elastic deformation, thereby enhancing traction and traversal performance. Consequently, they have evolved into a pivotal element of highly mobile platforms designed for navigating complex terrains [4]. However, soft ground media exhibit discrete, non-linear, and highly random mechanical behavior. During the process of continuous rolling, the wheels are subjected to high-frequency, asymmetric dynamic loads that can readily induce structural fatigue damage, thereby directly impacting both operational safety and service life. Consequently, accurately and efficiently assessing the fatigue life of elastic wheels in soft ground environments has become a critical challenge for enhancing vehicle reliability, design, and operational adaptability [5,6].
The extant research on this issue is principally based on a physics-based modeling evaluation paradigm, which can be categorized into two approaches: physical experiments and high-fidelity numerical simulations. With regard to physical experiments, researchers obtain load spectra through bench testing or in-service measurements [7], combining these with material S–N curves and Miner’s linear cumulative damage theory for calculation. While various nonlinear cumulative damage models (e.g., Corten–Dolan theory) have been developed to account for load sequence effects, Miner’s linear rule remains widely used in engineering practice due to its simplicity and reasonable accuracy for many high-cycle fatigue applications. For instance, Huang [8] conducted strength assessments for a metro elastic wheel by integrating multi-axis fatigue testing with finite element simulation, employing a triaxial loading fatigue test rig for fatigue damage analysis. Zou [9] provided validation of the mechanical properties and load-bearing capacity of a flexible metallic wheel for manned lunar rovers under diverse operating conditions. This was achieved through vertical loading, tangential force, and lateral force tests on test benches. While this approach is reliable, it is costly, time-consuming, and difficult to replicate complex and variable ground conditions systematically. With regard to high-fidelity numerical simulation, the coupled Discrete Element Method (DEM) and Multi-Body Dynamics (MBD) techniques provide powerful tools for detailed modeling of wheel–soil interactions [10,11,12]. Wang [13] developed a wear-incorporated physical model for intelligent tires, which provides improved accuracy for tire–soil interaction analysis. For instance, Yan [14] established a wheel–soil DEM-MBD coupled simulation model to analyze the durability of a Mars rover wheel with different biomimetic tread structures on gravel-soil mixed terrain. While such methods overcome experimental limitations, yield detailed dynamic stress responses, and enable direct fatigue life calculation via software-embedded fatigue modules, their substantial computational cost per simulation severely restricts the obtainable volume of effective data samples covering diverse design and operational parameters. This engenders an inherent dilemma of ‘high fidelity, small sample size’. This limitation renders traditional simulation methods unsuitable for engineering practice that demands exploration of extensive design parameter spaces, rapid iterative optimization, or uncertainty quantification analysis, as they are confined to case-specific calculations of ‘one simulation, one lifespan’.
It is noteworthy that data-driven methods, such as LightGBM and BP, have demonstrated formidable capabilities in extracting complex patterns from high-dimensional time-series data across other domains, including battery life prediction and aviation engine lifespan assessment [15,16,17,18]. For instance, Zhu [19] successfully predicted the screening efficiency and impurity rate of variable–amplitude screening mechanisms using EDEM–RecurDyn coupled simulation integrated with a BP neural network, achieving a model coefficient of determination of 0.999. Kang [20] constructed a model for predicting the remaining life of an aircraft engine. This model was based on PLSR-iTransformer, and it achieved a high level of accuracy, with an RMSE of only 8.45 on the NASA turbofan engine dataset. Nevertheless, the systematic introduction and application of data-driven methods to fatigue life prediction within the strongly coupled scenario of an elastic wheel on soft ground—aimed at resolving the ‘high fidelity, small sample size’ dilemma—remains an unexplored research frontier.
In order to address the aforementioned issues, this paper proposes a fatigue life prediction method (LightGBM-CH) that integrates discrete element–multibody dynamics simulation with feature-based LightGBM optimization, with a view to exploring a novel pathway merging physical simulation with data-driven approaches. The approach initially establishes a high-fidelity model of elastic wheel–softened ground interaction through coupled discrete element and multibody dynamics simulations, acquiring dynamic load and stress response data. Subsequently, a 122-dimensional physical feature system oriented towards fatigue damage is constructed, alongside a relevance-based feature selection and stability-constrained hyperparameter optimization strategy, which effectively enhances LightGBM’s predictive accuracy and generalization capability under small-sample conditions. The simulation-based validation of the LightGBM-CH method demonstrates its superiority in terms of prediction accuracy and generalization performance when operating in typical soft ground conditions. Furthermore, the application of feature importance analysis provides explicit guidance for the design of wheel structures that are resistant to fatigue.
The proposed LightGBM-CH method offers several advantages, including the ability to integrate high-fidelity simulation with data-driven modeling, effectively addressing the ‘high-dimensional, small-sample’ challenge, and providing interpretable feature importance for structural optimization. However, as a simulation-data-driven approach, its performance is highly contingent on the fidelity of the DEM-MBD model and the accuracy of its parameter calibration. Consequently, a key limitation of the current methodology is that its predictions are primarily derived from numerical simulations without corresponding physical experimental validation. Furthermore, its applicability under extreme environmental or dynamic conditions requires further confirmation and calibration with experimental data.

2. Elastic Wheel—Coupled Simulation and Fatigue Analysis for Soft Ground

In order to evaluate the fatigue life of an elastic wheel on soft ground, it is necessary to establish a high-fidelity wheel–soil coupled simulation model alongside a reliable fatigue analysis methodology. Firstly, a parametric wheel model and soil discrete element model were developed through a coupled discrete element and multibody dynamics approach, utilizing SolidWorks 2021, RecurDyn 2023, and EDEM 2021.2. The utilization of bidirectional coupled simulations resulted in the generation of dynamic load and stress data. Secondly, the integration of the rainflow counting method, Goodman’s average stress correction, and Miner’s cumulative damage theory has resulted in the development of a fatigue life calculation method based on stress–life curves. This method provides data labels for subsequent machine learning predictions.

2.1. Construction of the Elastic Wheel Model

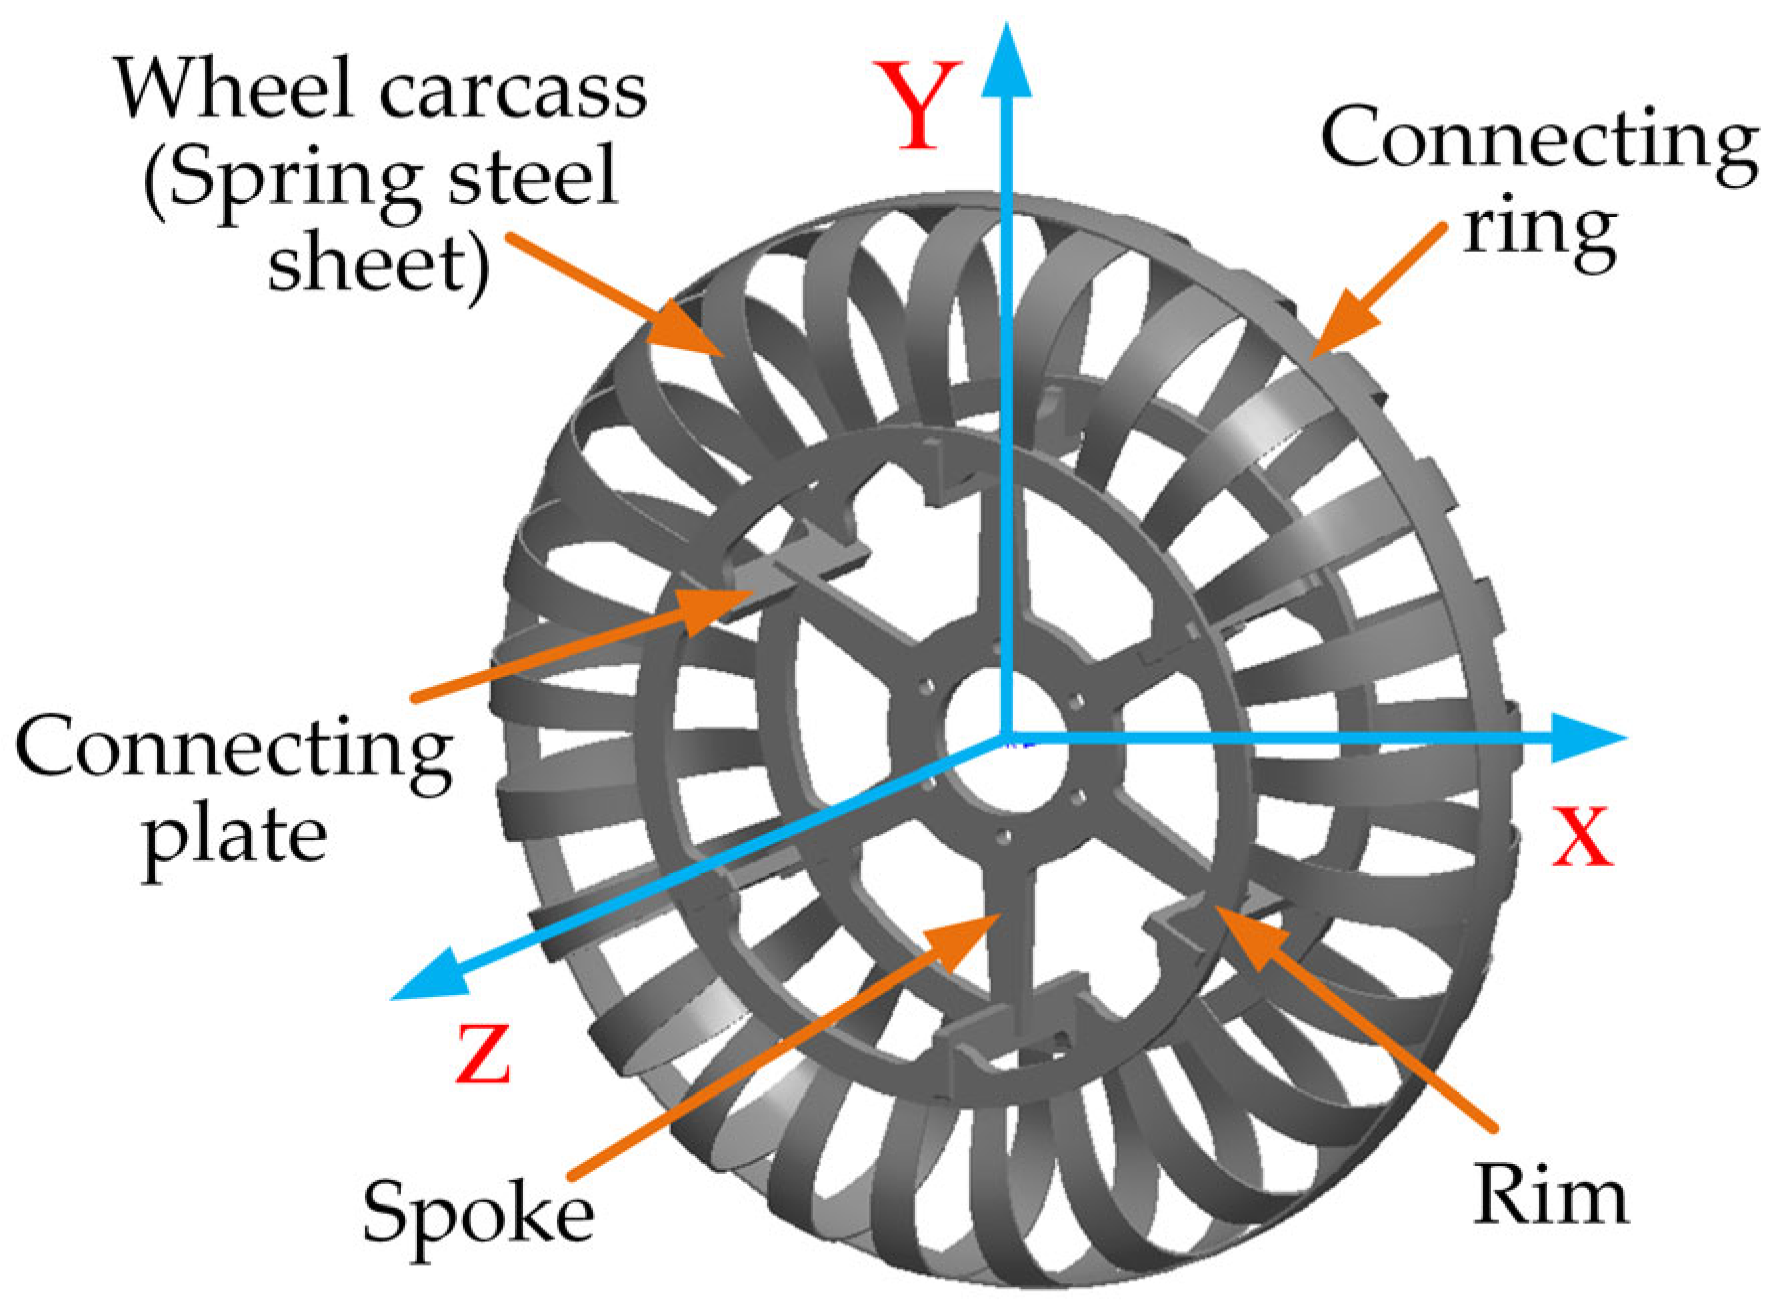
The selected spring steel–leaf elastic wheel structure is widely adopted in the literature due to its proven performance in soft terrain applications [1,9,21,22] and serves as a representative benchmark for investigating fatigue behavior under multi-axis loading. The study’s primary research subject was a standard steel spring–leaf elastic wheel. The SolidWorks software platform was utilized to complete three-dimensional parametric modeling of a single-tread elastic wheel with a diameter of 510 mm, following established parametric design principles for complex mechanical structures as implemented in standard CAD textbooks [23], as illustrated in Figure 1. The wheel structure is composed of three primary components: the rim, the elastic tread, and the connecting mechanism. The elastic tire body comprises 25 spring steel plates (60Si2Mn) arranged circumferentially at 14.4° equal angular intervals. The transition of an involute curvature effectively mitigates stress concentration. The plate’s thickness, measured at 2.0 mm, is a crucial factor in the design’s functionality. It enables the plate to undergo elastic deformation when in contact with soft ground, thereby ensuring both adequate connection strength and the ability to adapt to variations in terrain.
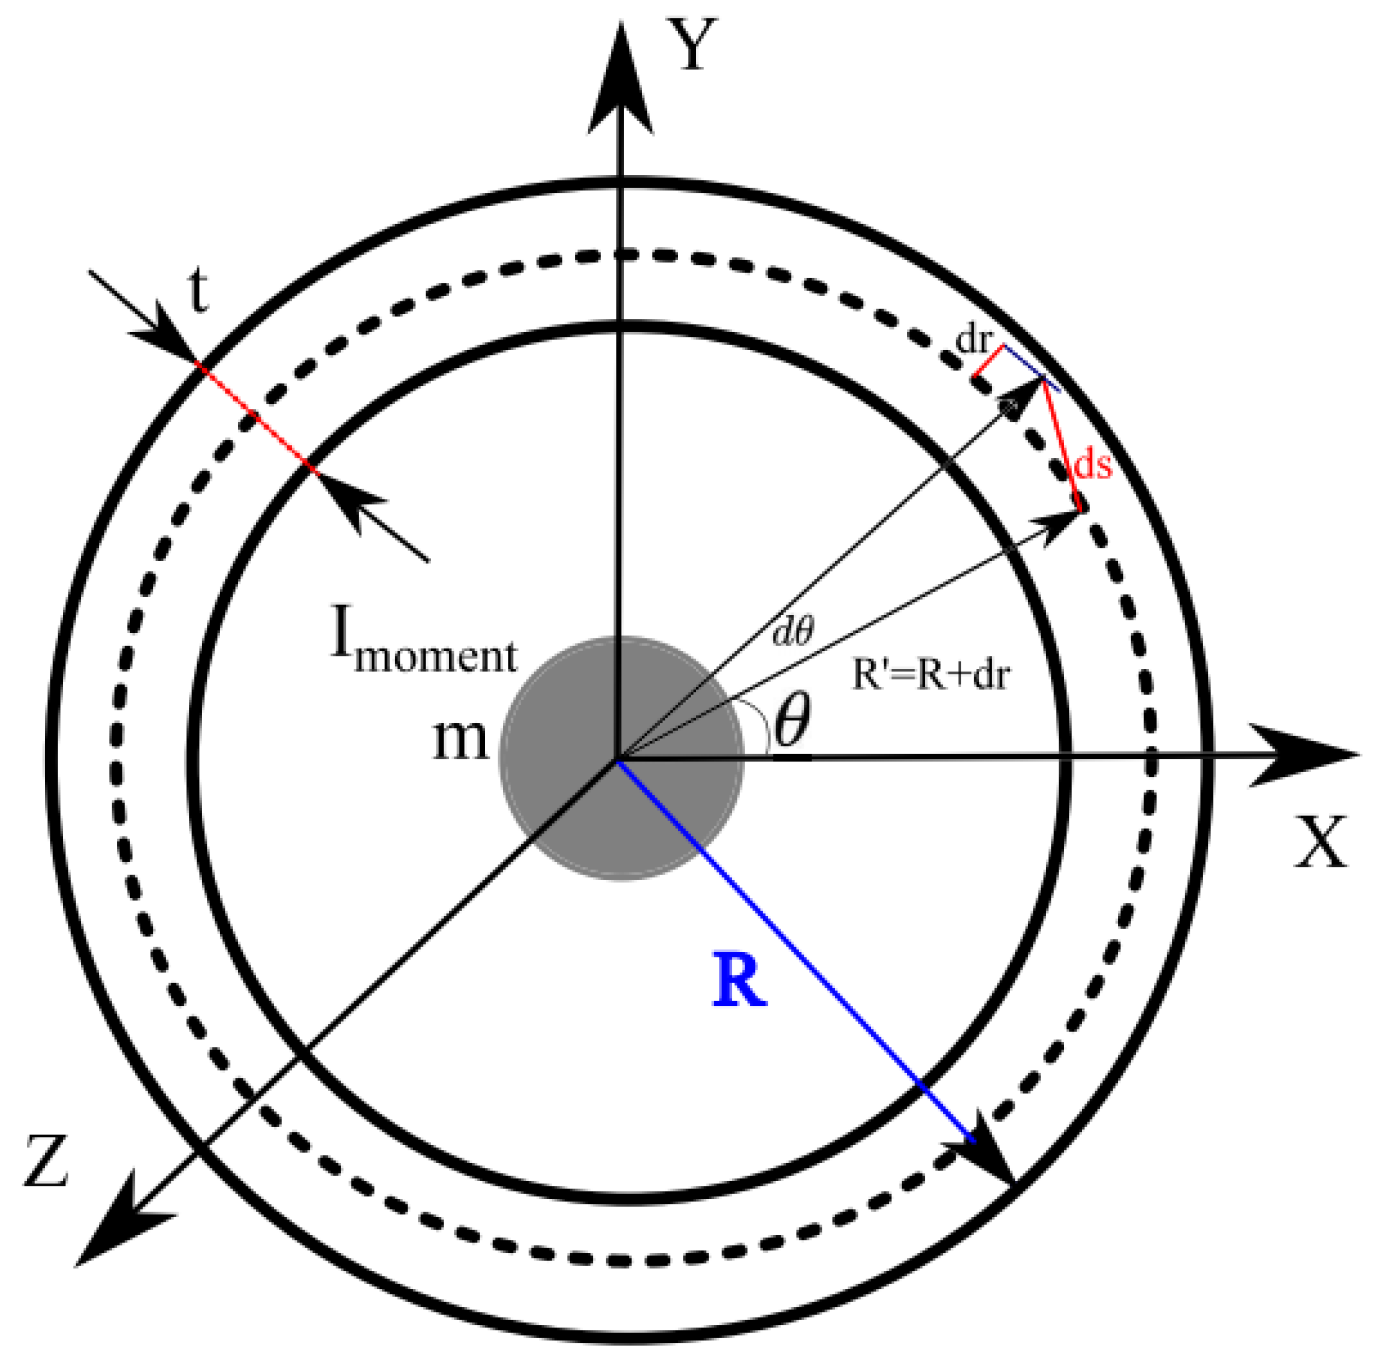
In order to establish a theoretical framework for the comprehension of the deformation mechanisms of the elastic wheel under load, this section presents a simplified geometric model based on thin ring theory. As demonstrated in Figure 2, the elastic wheel is conceptualized as a thin elastic ring with mean radius R and thickness t (assuming t     R ), subjected to small radial and tangential displacements. The wheel mass m is distributed uniformly along the circumference, and I m o m e n t represents the mass moment of inertia about its rotational axis. The illustration depicts an arbitrary material point on the ring prior to and subsequent to deformation, thereby emphasizing the alteration in its position resulting from the application of external forces. Infinitesimal radial increments ( d r ) and circumferential increments ( d θ ) are indicated to describe the local kinematics of deformation, thereby enabling precise analysis of the strain-displacement relationship. The schematic underlines the manner in which minor alterations in radius and angular position give rise to normal and shear strains within the tire structure, thus furnishing a cogent conceptual foundation for the modeling of tire deformation under dynamic loading conditions.
In accordance with thin shell theory, the strain-displacement relationships for the ring can be expressed as:
ε θ = 1 R ( v θ + u )
κ θ = 1 R 2 ( u θ 2 v θ 2 )
where ε θ represents the circumferential strain, κ θ represents the curvature change, u is the radial displacement, and v is the tangential displacement. This theoretical framework provides a foundation for understanding the deformation behavior of the elastic wheel on soft ground in the subsequent DEM-MBD simulations, helping to elucidate how external loads are transformed into local stress responses that ultimately affect fatigue life.
Within the RecurDyn framework, the wheel geometry was treated as elastic and meshed using high-order tetrahedral elements. Through mesh independence verification, the final mesh size was determined to be 149,704 elements, thus balancing computational accuracy with computational cost. The generated elasticity file contains mass, stiffness, and modal information, accurately reflecting the wheel’s dynamic response under actual operating conditions.
In terms of structural design, the elastic wheel incorporates several features to enhance fatigue resistance. Firstly, the spring leaves are composed of 60Si2Mn high-strength spring steel, which offers excellent fatigue strength. Secondly, the transition curve at the root of each leaf is designed as an involute profile, the purpose of which is to effectively mitigate stress concentration. Thirdly, the 25 independently arranged spring leaves distributed circumferentially share the load collectively, thus preventing local overloading. The combination of these design features is known to result in enhanced fatigue life under conditions of complex loading.

2.2. Construction of Soil Discrete Element Model

The soil particle model was constructed using the EDEM platform, with the employment of spherical particles serving to simulate loose ground media. The Discrete Element Method (DEM) approach, as originally proposed by Cundall and Strack [24] for granular materials, has been extensively validated for soil mechanics applications and is effectively implemented in software like EDEM [25]. In order to achieve a balance between the efficiency of the simulation and the computational accuracy, the particle size was set to 3 mm, thus avoiding the excessive computational demands that would otherwise have been caused by overly fine-grained sizes. The mechanical parameters of soil particles were referenced from [26], ‘Research on Measurement and Calibration Methods for Soil Parameters Used in the Discrete Element Method’, thereby ensuring that the fundamental mechanical response of the simulated soil aligns with real-world conditions. Core parameters encompass basic physical properties and contact characteristics, with specific settings detailed in Table 1. The Hertz–Mindlin with JKR (Johnson–Kendall–Roberts) model was selected for the purpose of determining particle contact. This model builds upon the classical Hertz–Mindlin non-cohesive contact theory by incorporating cohesive effects, thereby enabling precise characterization of adhesive effects between particles arising from surface energy and van der Waals forces.

2.3. EDEM-RecurDyn Bidirectional Coupling Configuration

A bidirectionally coupled simulation platform was established using EDEM 2020 and RecurDyn V9R2, thereby enabling real-time bidirectional transfer of motion states and mechanical loads between the elastic wheel and loose soil particles. The efficacy of this coupled DEM-MBD approach has been demonstrated in recent wheel–terrain interaction studies [27,28]. This platform has been developed to simultaneously support dynamic visualization of the elastomer–particle interaction and monitoring of the interaction process. In order to achieve a balance between computational stability and simulation efficiency, the time step was optimized specifically: the EDEM side was configured to 1 × 10⁻⁶ s (in order to satisfy the elevated precision requirements of granular micro-movements), whereas the RecurDyn side was set to 1 × 10⁻⁴ s (in order to align with the macro-dynamic response of the elastic wheel). The employment of dual-time-step coordination has been demonstrated to enhance the overall reliability and computational efficiency of the simulation.
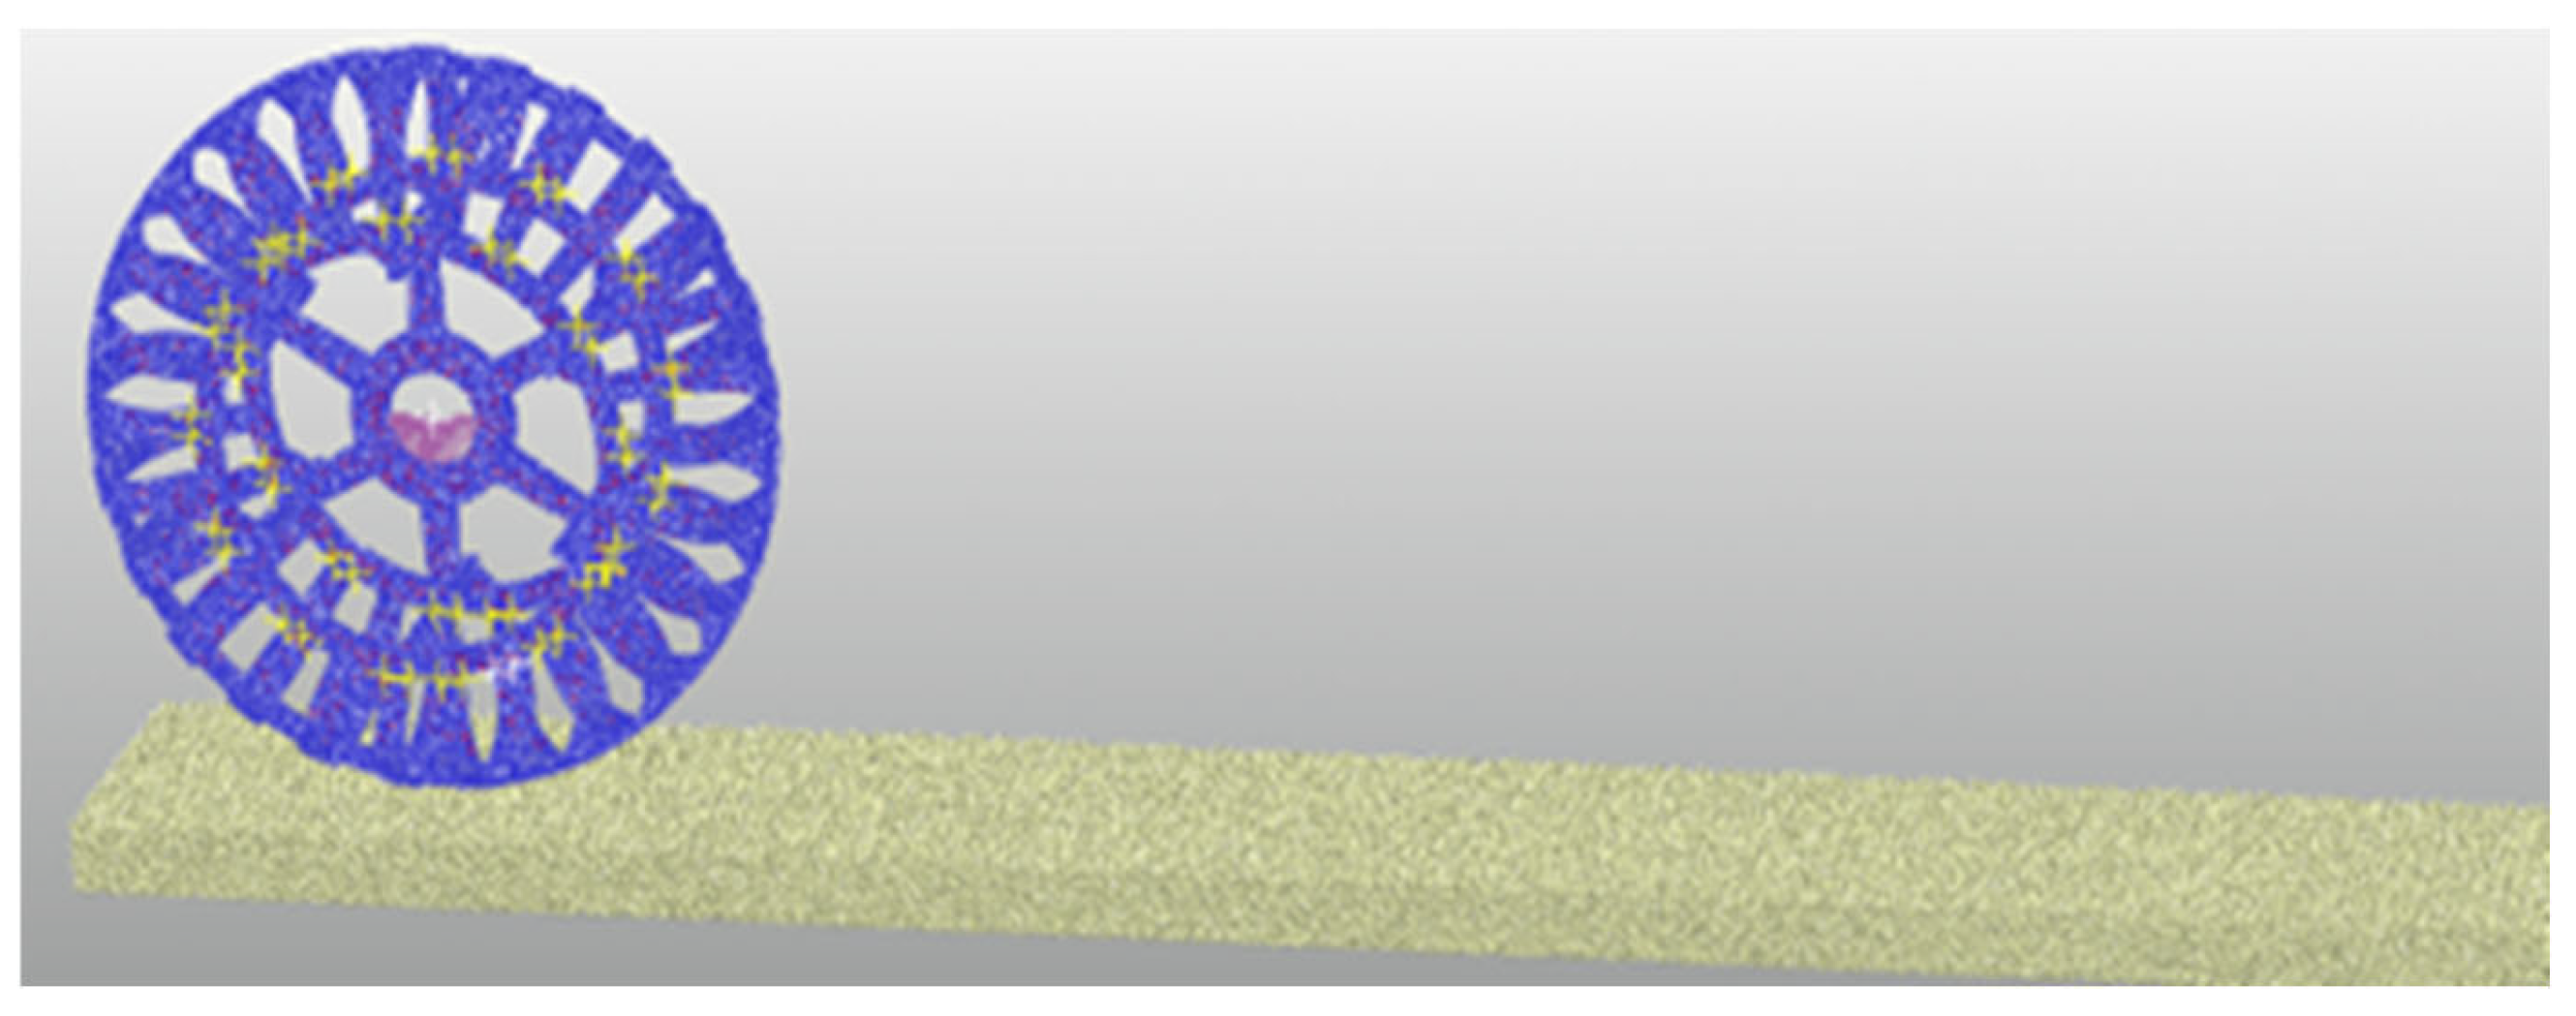
The elastic wheel was modeled as an elastic body within the RecurDyn framework, with its motion defined using the CMotion (constrained motion) function. The motion of the object was found to be in a straight line, with an angular velocity of 2 rad/s. This angular velocity is equivalent to the ideal rolling speed for a wheel diameter of 510 mm, as illustrated in Figure 3. In order to acquire critical data for subsequent fatigue analysis, virtual sensors were positioned at the wheel hub center to record the time history of triaxial forces (longitudinal force F x , vertical force F y , and lateral force F z ) and triaxial moments (yaw moment T x , roll moment T y , and torque T z ) during the driving process.

2.4. Fatigue Life Calculation

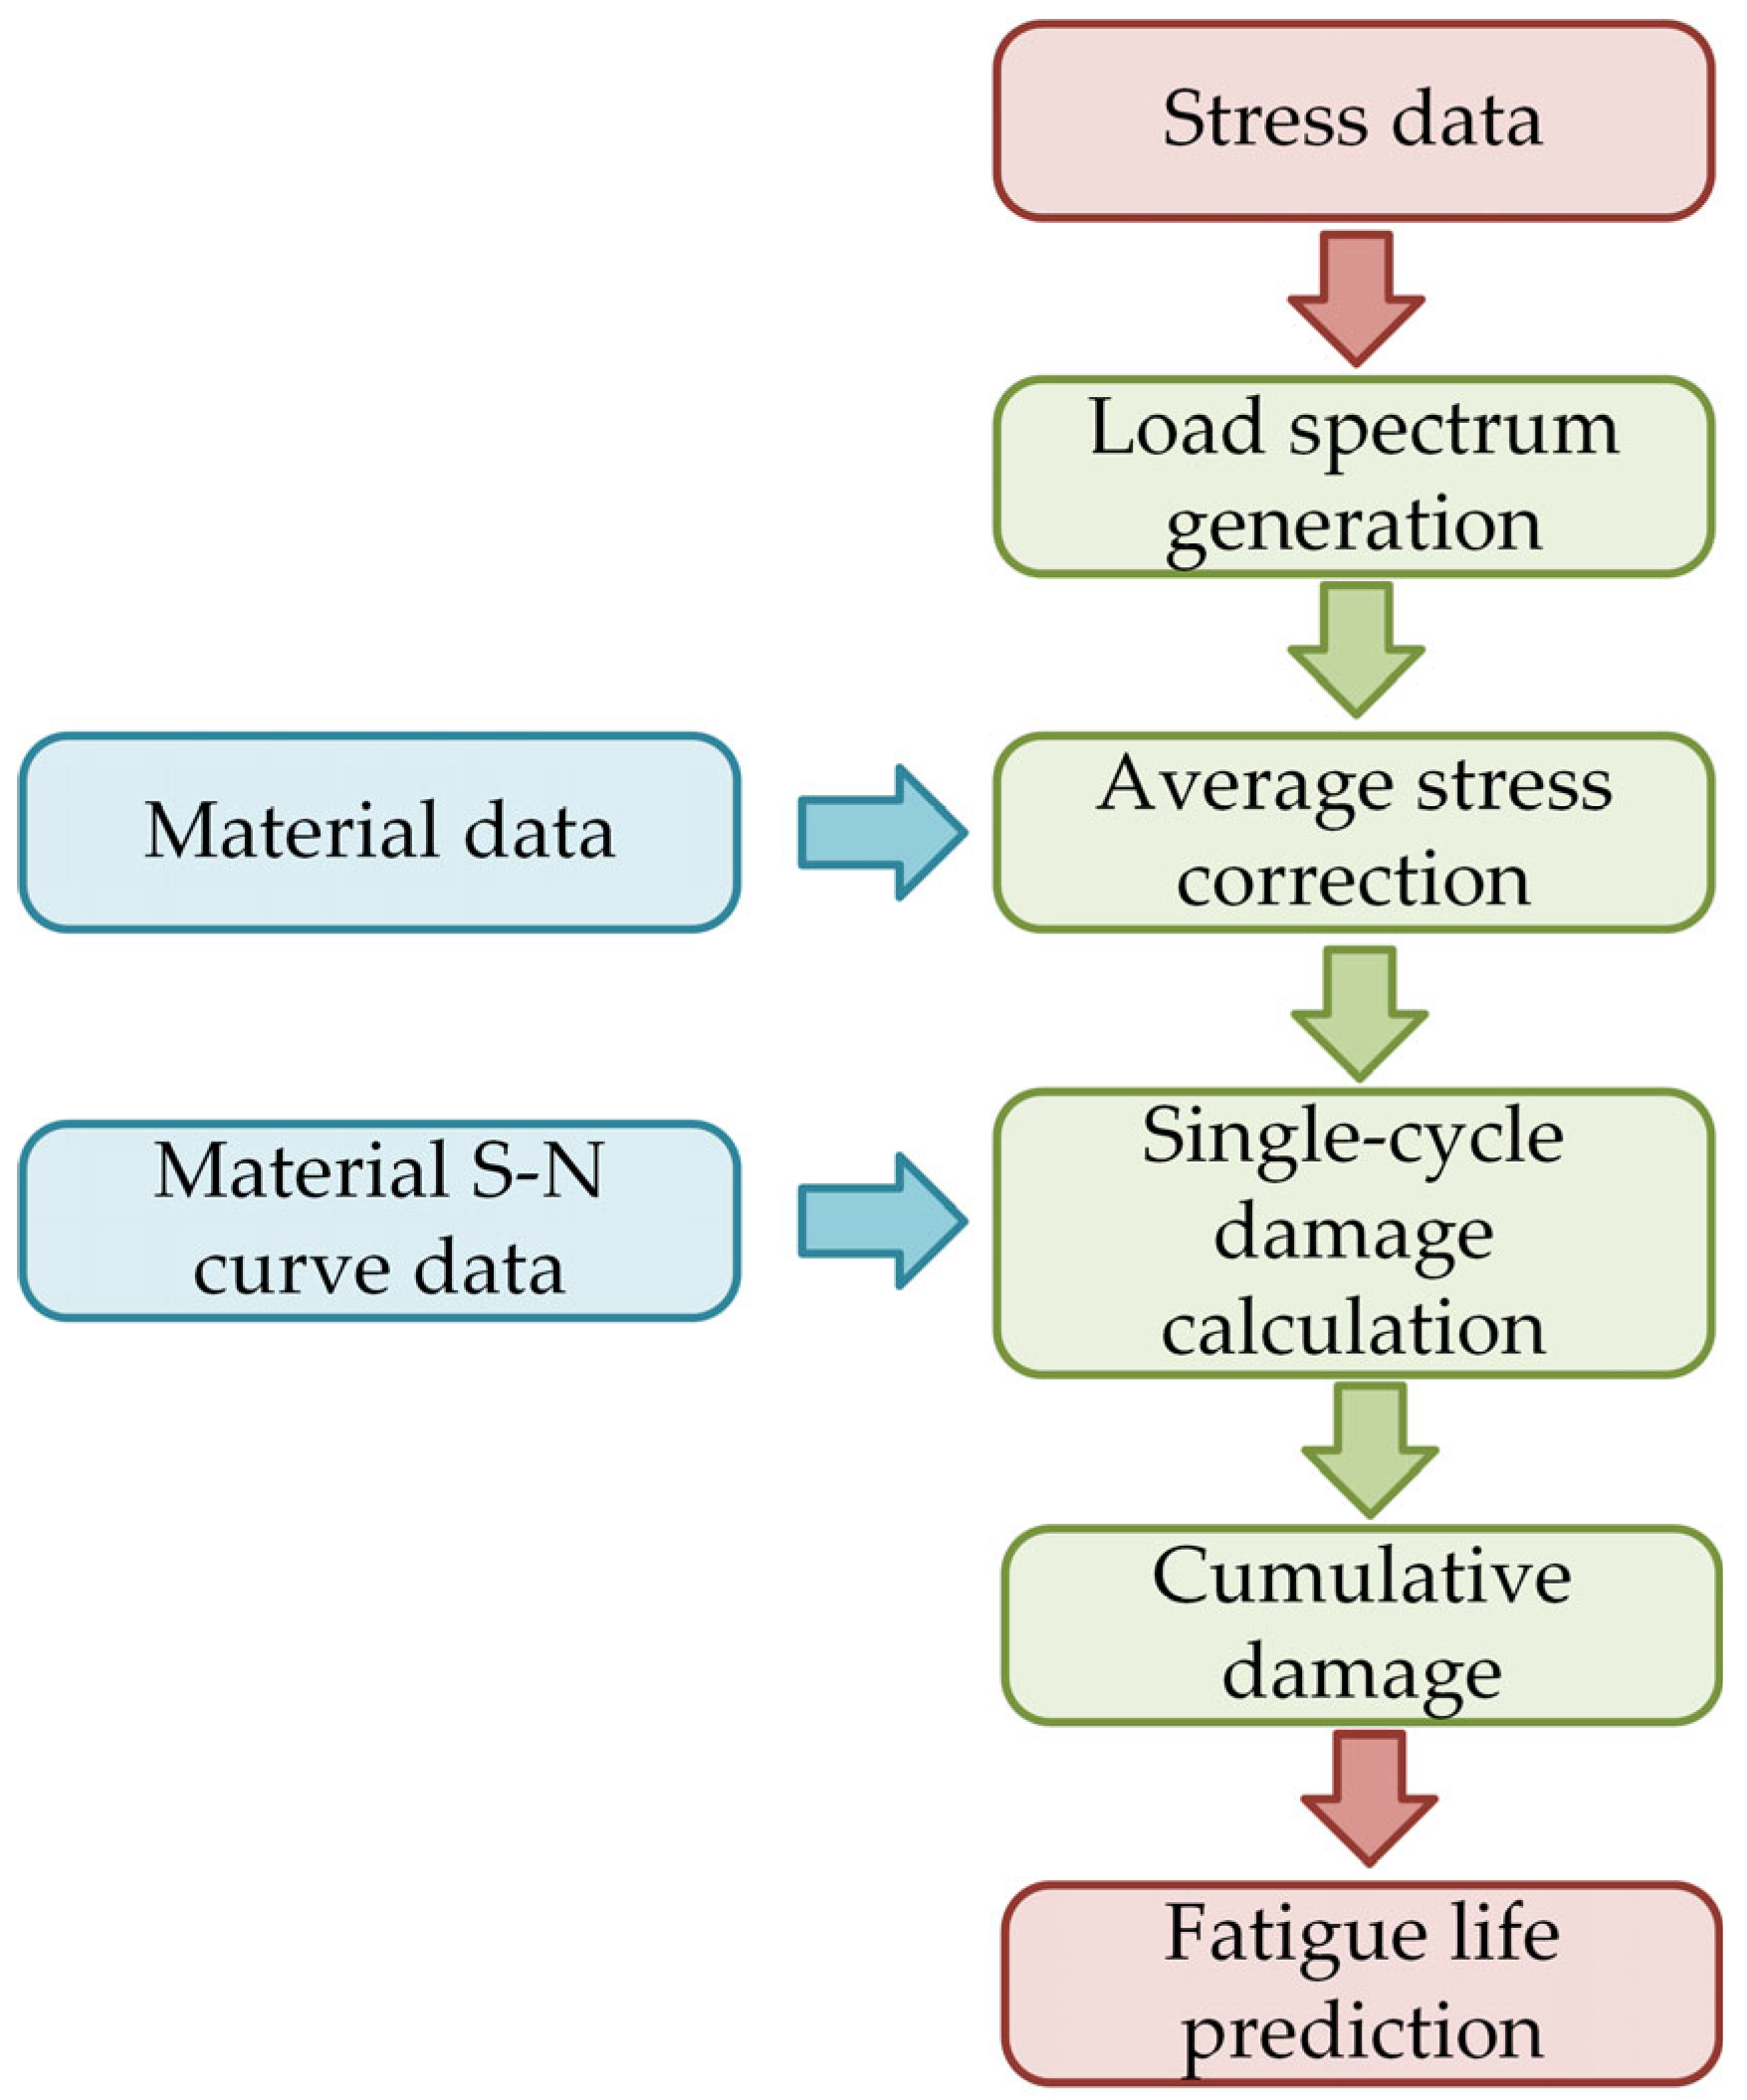
This study utilized the RecurDyn 2023 software to conduct fatigue life calculations, employing the equivalent stress–time history at the critical point of the reed root extracted from the coupled simulation as the underlying data. This approach is in accordance with the standards established for high-cycle fatigue analysis, and the material fatigue performance data presented in the literature review, titled ‘Experimental Study on Mechanical Properties of 60Si2Mn Spring Steel for Railway Fastening Clips’ [29], has been incorporated. The calculation workflow is illustrated in Figure 4.
The fatigue life of the elastic wheel is calculated using the following procedure, which integrates load spectrum generation, mean stress correction, damage calculation, and cumulative life assessment.
1.
Load spectrum generation: The Rainflow method, which is incorporated into RecurDyn, enables the analysis of continuous stress time histories through a process of cyclic decomposition and statistical analysis. This process converts them into a discrete load spectrum matrix comprising stress amplitude σ a , mean stress σ m , and cycle count. This methodology has been demonstrated to be effective in the identification of complete stress cycles within random loads.
2.
Mean stress correction: In consideration of the inherent asymmetry in actual load cycles, the load spectrum is subject to correction through the implementation of Goodman’s criterion. This criterion incorporates the influence of mean stress into the stress amplitude, with the correction formula expressed as:
σ a , e q = σ a 1 σ m σ u
where σ a , e q denotes the equivalent symmetrical stress amplitude, and σ u represents the tensile strength of the material (for 60Si2Mn, σ u = 1430 MPa).
3.
Single-cycle damage calculation: The reed material is composed of 60Si2Mn spring steel. It is evident from the extant literature that the median S–N curve under symmetric cycling ( R = 1 ) is expressed by the following three-parameter formula:
( l g   N ) = 9.3344 2.1424 l g   ( σ m a x 740 )
where N denotes the number of failure cycles and σ m a x represents the maximum stress (MPa). For symmetrical cycles corrected by Goodman, σ m a x = σ a , e q . This curve yields a fatigue limit of 740 MPa, consistent with the material’s high-cycle fatigue behavior.
4.
Cumulative damage and life assessment: The Miner linear damage theory is applied to linearly superimpose damage from all cycles within the load spectrum. The total damage index, denoted by D , is calculated as follows:
D = i = 1 k n i N i
where n i denotes the actual number of cycles under the i-th equivalent stress amplitude. When the cumulative damage index D 1 , the structure is deemed to have undergone fatigue failure, with the corresponding total number of cycles representing the predicted fatigue life N f .
In order to assess the robustness of the computational results, this study employed the relative Miner criterion (with critical damage value D f = 1.0 ) for comparative validation. The discrepancy between the two sets of results was less than 5%, indicating that under the load spectrum characteristics examined herein, the fatigue life prediction outcomes based on the aforementioned classical methods possess sufficient engineering credibility.
It is important to note that while several nonlinear cumulative damage theories (e.g., Corten–Dolan theory) exist to account for load sequence effects, the classical Miner linear damage rule was adopted in this study. This choice was made due to its simplicity, widespread acceptance in engineering practice for high-cycle fatigue, and its suitability for establishing a reliable baseline dataset from high-fidelity simulations for our proposed data-driven framework. The investigation of nonlinear damage models to further improve prediction accuracy under complex loading conditions is a key direction for our future research.

3. LightGBM-CH Fatigue Life Prediction Method

3.1. Overall Scheme Design

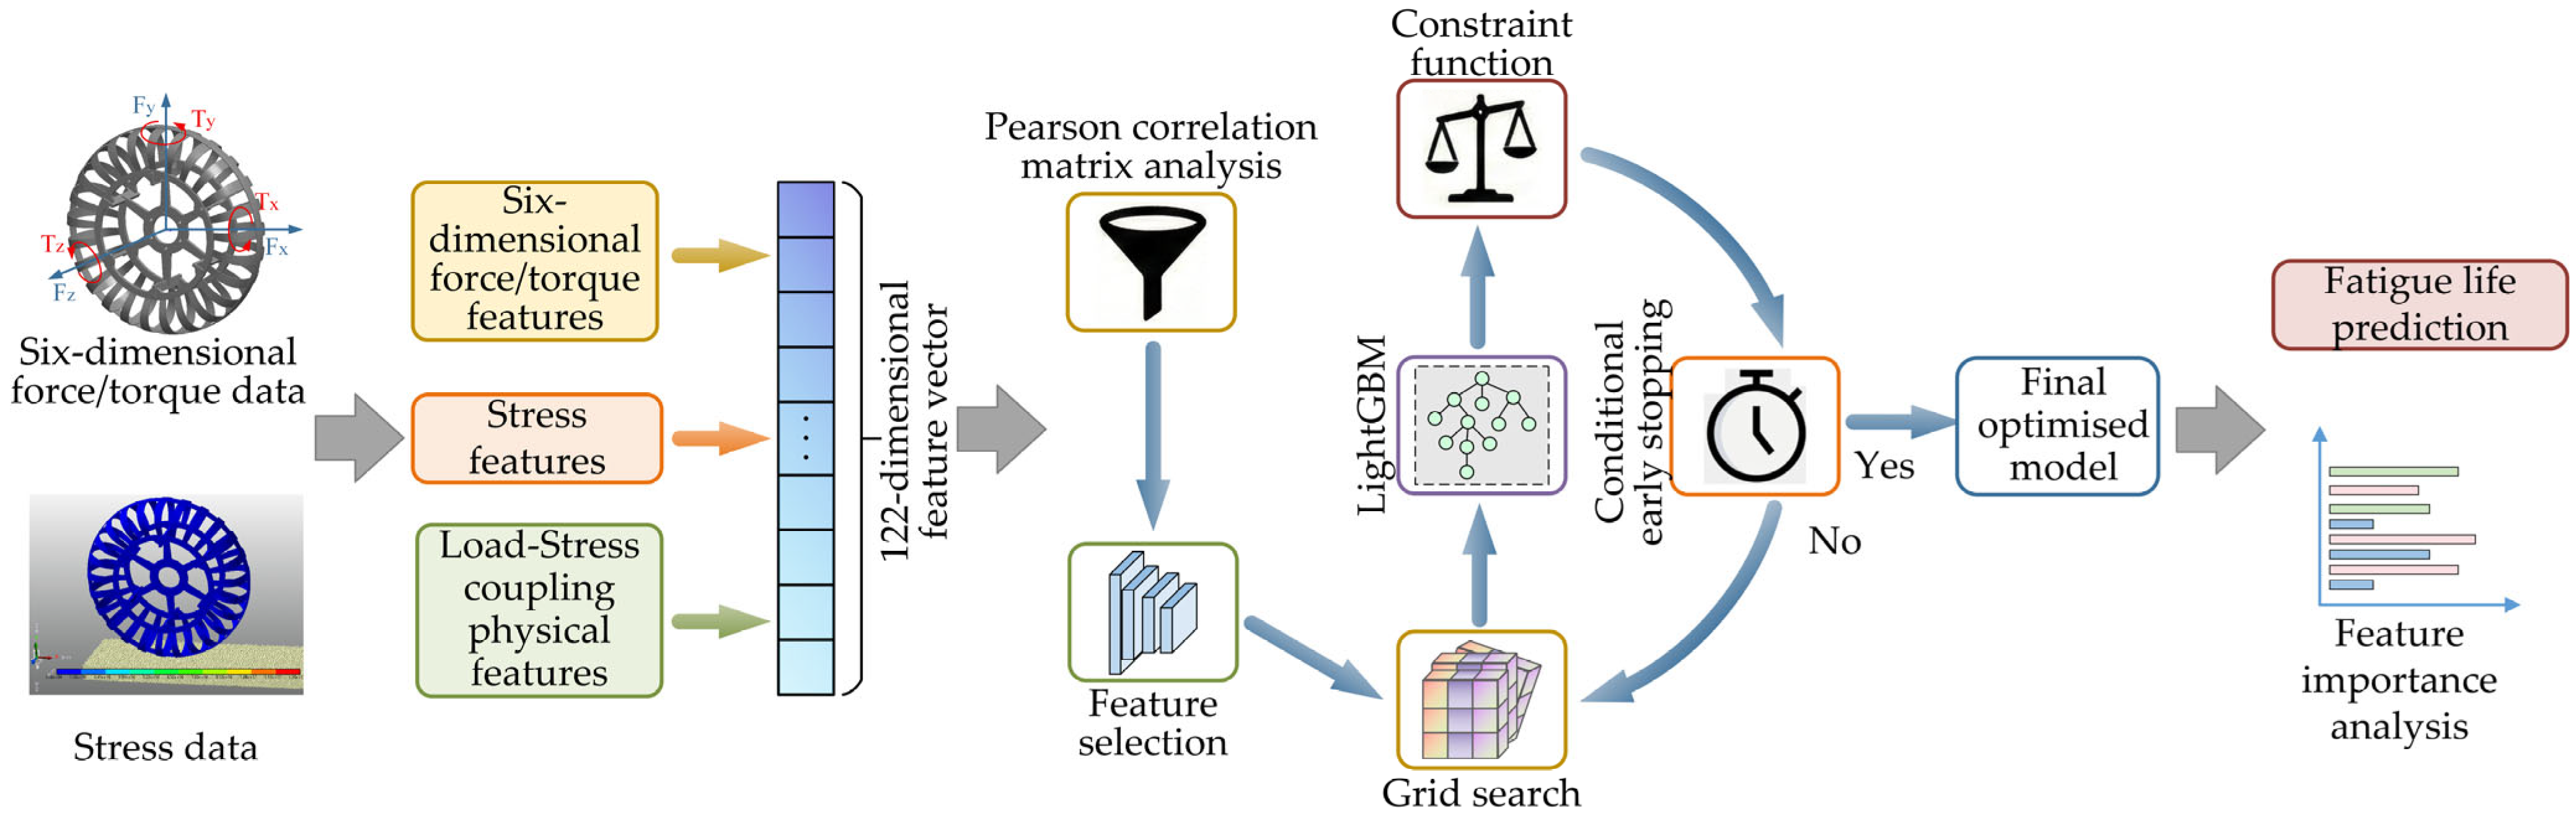
The fatigue life of the elastic wheel exhibits complex nonlinear coupling relationships with soil particle characteristics, driving conditions, and structural parameters. Simulation datasets present the characteristics of ‘high-dimensional features coupled with small sample sizes’. In order to address this challenge, the present paper proposes a fatigue life prediction method (LightGBM-CH) that integrates discrete element–multibody dynamics simulation with feature-optimized LightGBM. The integration of multidimensional feature engineering with optimization strategies enables the attainment of high-precision life prediction under conditions of limited data.
The computational workflow of the LightGBM-CH method is illustrated in Figure 5, comprising three core stages:
  • Physical feature extraction: The process of decoupling deep features from the six-dimensional force flow field and stress damage field within raw simulation data is of paramount importance in constructing a hybrid feature space. This is achieved by encompassing statistical, wave, cumulative damage, and multi-field coupling characteristics.
  • Correlation filtering and dimensionality reduction: The employment of Pearson correlation coefficient matrices is a methodology employed in order to diagnose collinearity and eliminate redundant features in high-dimensional data. This process enables the identification of key physical quantities that are most sensitive to fatigue life.
  • Stability-Constrained Grid Search: The integration of the LightGBM gradient-boosted decision tree algorithm in this step employs parallel computation with multiple random seeds and a training-test difference penalty mechanism to identify hyperparameter combinations that deliver both high accuracy and robustness under small sample sizes.
The mathematical modeling of the LightGBM-CH fatigue life prediction method can be expressed as follows:
y ^ = F ( T ( X ) )
where X denotes the original input data matrix, T ( X ) represents the feature engineering transformation function, and F ( T ( X ) ) signifies the enhanced LightGBM prediction function. The prediction function adopts an additive model form:
F ( T ( X ) ) = k = 1 K f k ( T ( X ) )
where K denotes the number of decision trees, and f k represents the output of the k-th decision tree. Each tree recursively partitions the feature space into multiple regions, with each region corresponding to a predicted value.

3.2. Multi-Dimensional Feature Engineering

The present paper proposes a multidimensional feature system comprising 122 features with a view to comprehensively characterizing the fatigue failure process of elastic wheels. This system is capable of fully representing the complex relationship between load, stress, and damage, thereby providing robust data support for the prediction of fatigue life.

3.2.1. Six-Dimensional Force/Torque Features

The six-dimensional forces ( F x , F y , and F z ) and torques ( T x , T y , and T z ) acting on the wheel constitute the external excitation sources inducing structural fatigue. For each load channel and its composite vector, the following key statistical descriptors are extracted:
1.
Fundamental statistical features: These include mean, standard deviation, maximum value, minimum value, and peak-to-peak value. The mean value indicates the average load level, the standard deviation reflects the load fluctuation intensity, and the peak-to-peak value indicates the load variation range. Collectively, these features delineate the fundamental amplitude characteristics of the load.
2.
Distribution morphology features: The former of these is known as skewness, whilst the latter is referred to as kurtosis. The skewness is calculated using the following formula [30]:
γ 1 = 1 N i = 1 N   ( x i x ¯ ) 3             σ 3  
where x ¯ denotes the sample mean, and σ denotes the standard deviation. Positive skewness indicates a long tail to the right of the distribution, while negative skewness indicates a long tail to the left. The formula for calculating kurtosis is [30,31]:
γ 2 = 1 N i = 1 N   ( x i x ¯ ) 4             σ 4 3
A kurtosis greater than 0 indicates a distribution that is more peaked than a normal distribution, while a value less than 0 indicates a flatter distribution. Collectively, these two characteristics delineate the morphological properties of the load distribution [31].
3.
Quantile characteristics: The median, the 10th percentile, and the 90th percentile are all used in this way. The median is indicative of the intermediate level of the load, the 10th percentile is representative of the low load level, and the 90th percentile is representative of the high load level. Quantile characteristics are of particular significance for non-Gaussian load sequences.
4.
Energy characteristics: These comprise the root mean square value and the absolute mean value.

3.2.2. Stress-Based Features

It is evident that, upon consideration of the equivalent stress time history at the hazard point, a strong correlation exists between fatigue characteristics and Miner’s linear cumulative damage theory, as well as S–N curves.
1.
Stress Level Characteristics: The stress-related parameters comprise maximum equivalent stress σ_(max), minimum equivalent stress σ m i n , stress range σ = σ m a x σ m i n , mean stress σ ¯ , and stress standard deviation σ σ . These characteristics delineate the fundamental statistical properties of stress.
2.
Fatigue Key Parameters: Representing the innovative focus of this study, systematically introducing wheel life prediction for the first time. Stress amplitude σ a = ( σ m a x σ m i n ) / 2 , as the primary driver of fatigue damage, directly determines the position of the material’s S–N curve. Mean stress σ m = ( σ m a x + σ m i n ) / 2 influences the calculation of equivalent stress amplitude through the mean stress effect. Stress ratio R = σ m i n / σ m a x describes the symmetry of load cycles and significantly influences fatigue crack initiation and propagation.
3.
Peak statistical characteristics: The innovative introduction of the concept of threshold analysis is a significant contribution to the field. The following formulas are used to calculate the peak fraction at 90% and 80% thresholds:
μ 90 = 1 N i = 1 N   I ( σ i > 0.9 σ m a x )
μ 80 = 1 N i = 1 N   I ( σ i > 0.8 σ m a x )
where I ( · ) denotes the indicator function. These two characteristics quantify the proportion of time spent at elevated stress levels, providing critical inputs for damage-based life prediction.
4.
Fluctuation characteristics: These include the zero-crossing frequency, peak-to-peak density, and coefficient of variation. The zero-crossing frequency is indicative of the rapidity of stress fluctuations, the peak-to-peak density characterizes the density of fluctuation events, and the coefficient of variation C V σ = σ σ / σ ¯ measures the relative amplitude of stress fluctuations. The following features are indicative of the time-frequency characteristics of stress fluctuations.

3.2.3. Load–Stress Coupling Physical Features

It is evident that a solitary load or stress statistic is inadequate in elucidating the dynamic transmission mechanism whereby external excitation is transformed into internal damage. In order to characterize the ‘load-structure’ interaction of elastic wheels under complex conditions on soft ground, this paper constructs three types of higher-order features reflecting multiphysics coupling effects:
1.
Dynamic stress concentration factor: In order to quantify the structure’s sensitivity to external impact loads, the dynamic stress concentration factor is defined as a dimensionless descriptor of the structure’s non-linear response.
K d = σ m a x F t o t a l , m a x
where σ m a x denotes the maximum equivalent stress, while F t o t a l , m a x represents the maximum magnitude of the resultant force.
2.
Critical phase load vector: In order to capture the instantaneous load state that is causing maximum structural damage, the six-dimensional force instantaneous values corresponding to the moment of peak stress are extracted.
3.
Load–stress cross-correlation: In order to ascertain the linear synchronization between external load components and internal stress responses, the Pearson correlation coefficient is calculated between each load channel L i ( t ) , and the stress time history σ ( t ) .
ρ L i , σ = c o v ( L i , σ ) σ L i σ σ
The high correlation coefficient indicates that load fluctuations in this direction are the dominant factor driving stress variations, thereby providing clear physical attribution for the model.

3.3. Optimization Strategy for LightGBM-CH

The inherent challenges of simulation data, characterized by ‘high-dimensional features and small sample sizes’, have been identified as a major problem. It has been demonstrated that standard LightGBM models are prone to overfitting and insufficient generalization capabilities. The proposed methodology is outlined as follows: firstly, robust preprocessing is employed, followed by statistical filtering for dimensionality reduction. Next, stability objectives are formulated, and a global grid search is conducted. The objective of this approach is to extract highly reliable physical principles from limited data.

3.3.1. Robust Standardization Process

Conventional Z-score normalization is susceptible to outliers, leading to skewed feature distributions due to singularities arising from transient impacts within the fatigue simulation data. In order to address this issue, the RobustScaler method is employed. This method is based on the interquartile range, and it performs robust normalization on the 122-dimensional raw feature matrix. For any given feature x, the transformation formula is as follows:
x = x Q 2 Q 3 Q 1
where Q 1 , Q 2 , and Q 3 are used to denote the 25th, 50th, and 75th percentiles of the feature distribution, respectively. This method employs scaling based on the median and interquartile range, thereby effectively suppressing the distortion of feature scales caused by extreme outliers while preserving the true physical distribution characteristics of soft ground loads.

3.3.2. Pearson Correlation Feature Reduction

In order to address the ‘curse of dimensionality’ that arises from small-sample, high-dimensional data, a filtering-based feature selection method that utilizes Pearson’s correlation coefficient is employed. This approach is model-agnostic and objectively quantifies the linear coupling strength between physical features and fatigue life.
The calculation of the correlation coefficient r x y between each dimensional feature x j and the fatigue life target vector y is then required.
r x y = ( x i x ¯ ) ( y i y ¯ ) ( x i x ¯ ) 2 ( y i y ¯ ) 2
The initial step involves the establishment of a feature retention threshold, which is then utilized in conjunction with the SelectKBest algorithm. This algorithm is employed to identify and retain a subset of features that exhibit the maximum r x y values. This step rapidly eliminates redundant noise weakly correlated with fatigue damage, compressing the feature space onto a low-dimensional manifold and laying the groundwork for subsequent high-precision modeling.

3.3.3. Global Grid Optimization

The performance of LightGBM models demonstrates a high degree of sensitivity to hyperparameters. In order to ascertain the absolute global optimum within a finite parameter space, this paper employs a global grid search strategy.
  • Parameter space discretization: The construction of a multi-dimensional parameter grid is imperative, with a focus on the number of decision trees, leaf nodes, and regularization coefficient.
  • Cross-Validation polling: Employ 5-fold cross-validation, whereby the dataset is partitioned into mutually exclusive subsets. For each parameter node θ i in the grid, the average composite score S ¯ across the five validation rounds must be computed.

3.3.4. Construction of Stability-Constrained Objective Functions

The primary challenge in the context of small-sample learning pertains to the propensity of models to exhibit overfitting on the training set, consequently leading to suboptimal engineering generalization capabilities. The present paper proposes a comprehensive stability scoring function S incorporating a “generalization gap penalty term” with the aim of addressing this issue.
S ( θ ) = R t e s t 2 λ · | R t r a i n 2 R t e s t 2 |
where θ denotes the model hyperparameter combination; R t e s t 2 represents the prediction accuracy on the test set, reflecting the model’s fitting capability; | R t r a i n 2 R t e s t 2 | characterizes the gap between training and testing performance, i.e., the risk of overfitting; λ is the penalty weight (set to 0.5 in this study).

3.3.5. Conditional Early Stopping Mechanism

In order to enhance the efficiency of optimization, a performance-threshold-based conditional early stopping mechanism has been designed. The search is terminated when all three conditions are satisfied concurrently:
1.
Accuracy condition: The test set coefficient of determination R test 2 0.70 , ensuring the model meets fundamental accuracy requirements.
2.
Generalization condition: Training-test performance gap R train 2 R test 2 < 0.15 , controlling overfitting.
3.
Stability condition: Cross-validation standard deviation < 0.05 , guaranteeing model performance stability.
The experimental validation process has confirmed that this mechanism significantly enhances computational efficiency. This, in turn, has resulted in a substantial reduction in the overall time required for model optimization, without compromising the final performance of the model.

3.4. Reproducibility Details

In order to guarantee complete reproducibility of the proposed methodology, the subsequent simulation settings and software configurations are specified:
  • DEM-MBD simulation: EDEM 2020, RecurDyn V9R2; time step: EDEM 1 × 10⁻⁶ s, RecurDyn 1 × 10⁻⁴ s; wheel angular velocity: 2 rad/s; soil particle size: 3 mm; JKR surface energy: 0.04 J/m2; contact parameters as listed in Table 1.
  • Feature fxtraction pipeline: Full Python 3.13 implementation of the 122-dimensional feature engineering scheme, including statistical, morphological, fatigue-critical, and load–stress coupling features.
  • LightGBM-CH model: Hyperparameters: n_estimators = 350, learning_rate = 0.05, num_leaves = 20, subsample = 0.8, colsample_bytree = 0.8, reg_alpha = 0.1, reg_lambda = 0.2; StandardScaler; Pearson correlation-based feature selection (top k = 30); stability-constrained objective function (λ = 0.5); conditional early stopping mechanism.
The complete source code for feature extraction, model training, validation, and visualization will be made publicly available via GitHub and archived on Zenodo upon publication. The extracted feature set and corresponding fatigue life labels used in this study are also provided in the repository.

4. Results and Discussion

The present study proposes a novel simulation analysis method, the feasibility and effectiveness of which will be systematically validated. In addition, the comprehensive experimental results throughout the entire process will be presented and analyzed. These results will be in comparison with those obtained from the LightGBM-CH fatigue life prediction approach.

4.1. Dynamic Load and Stress Response Analysis

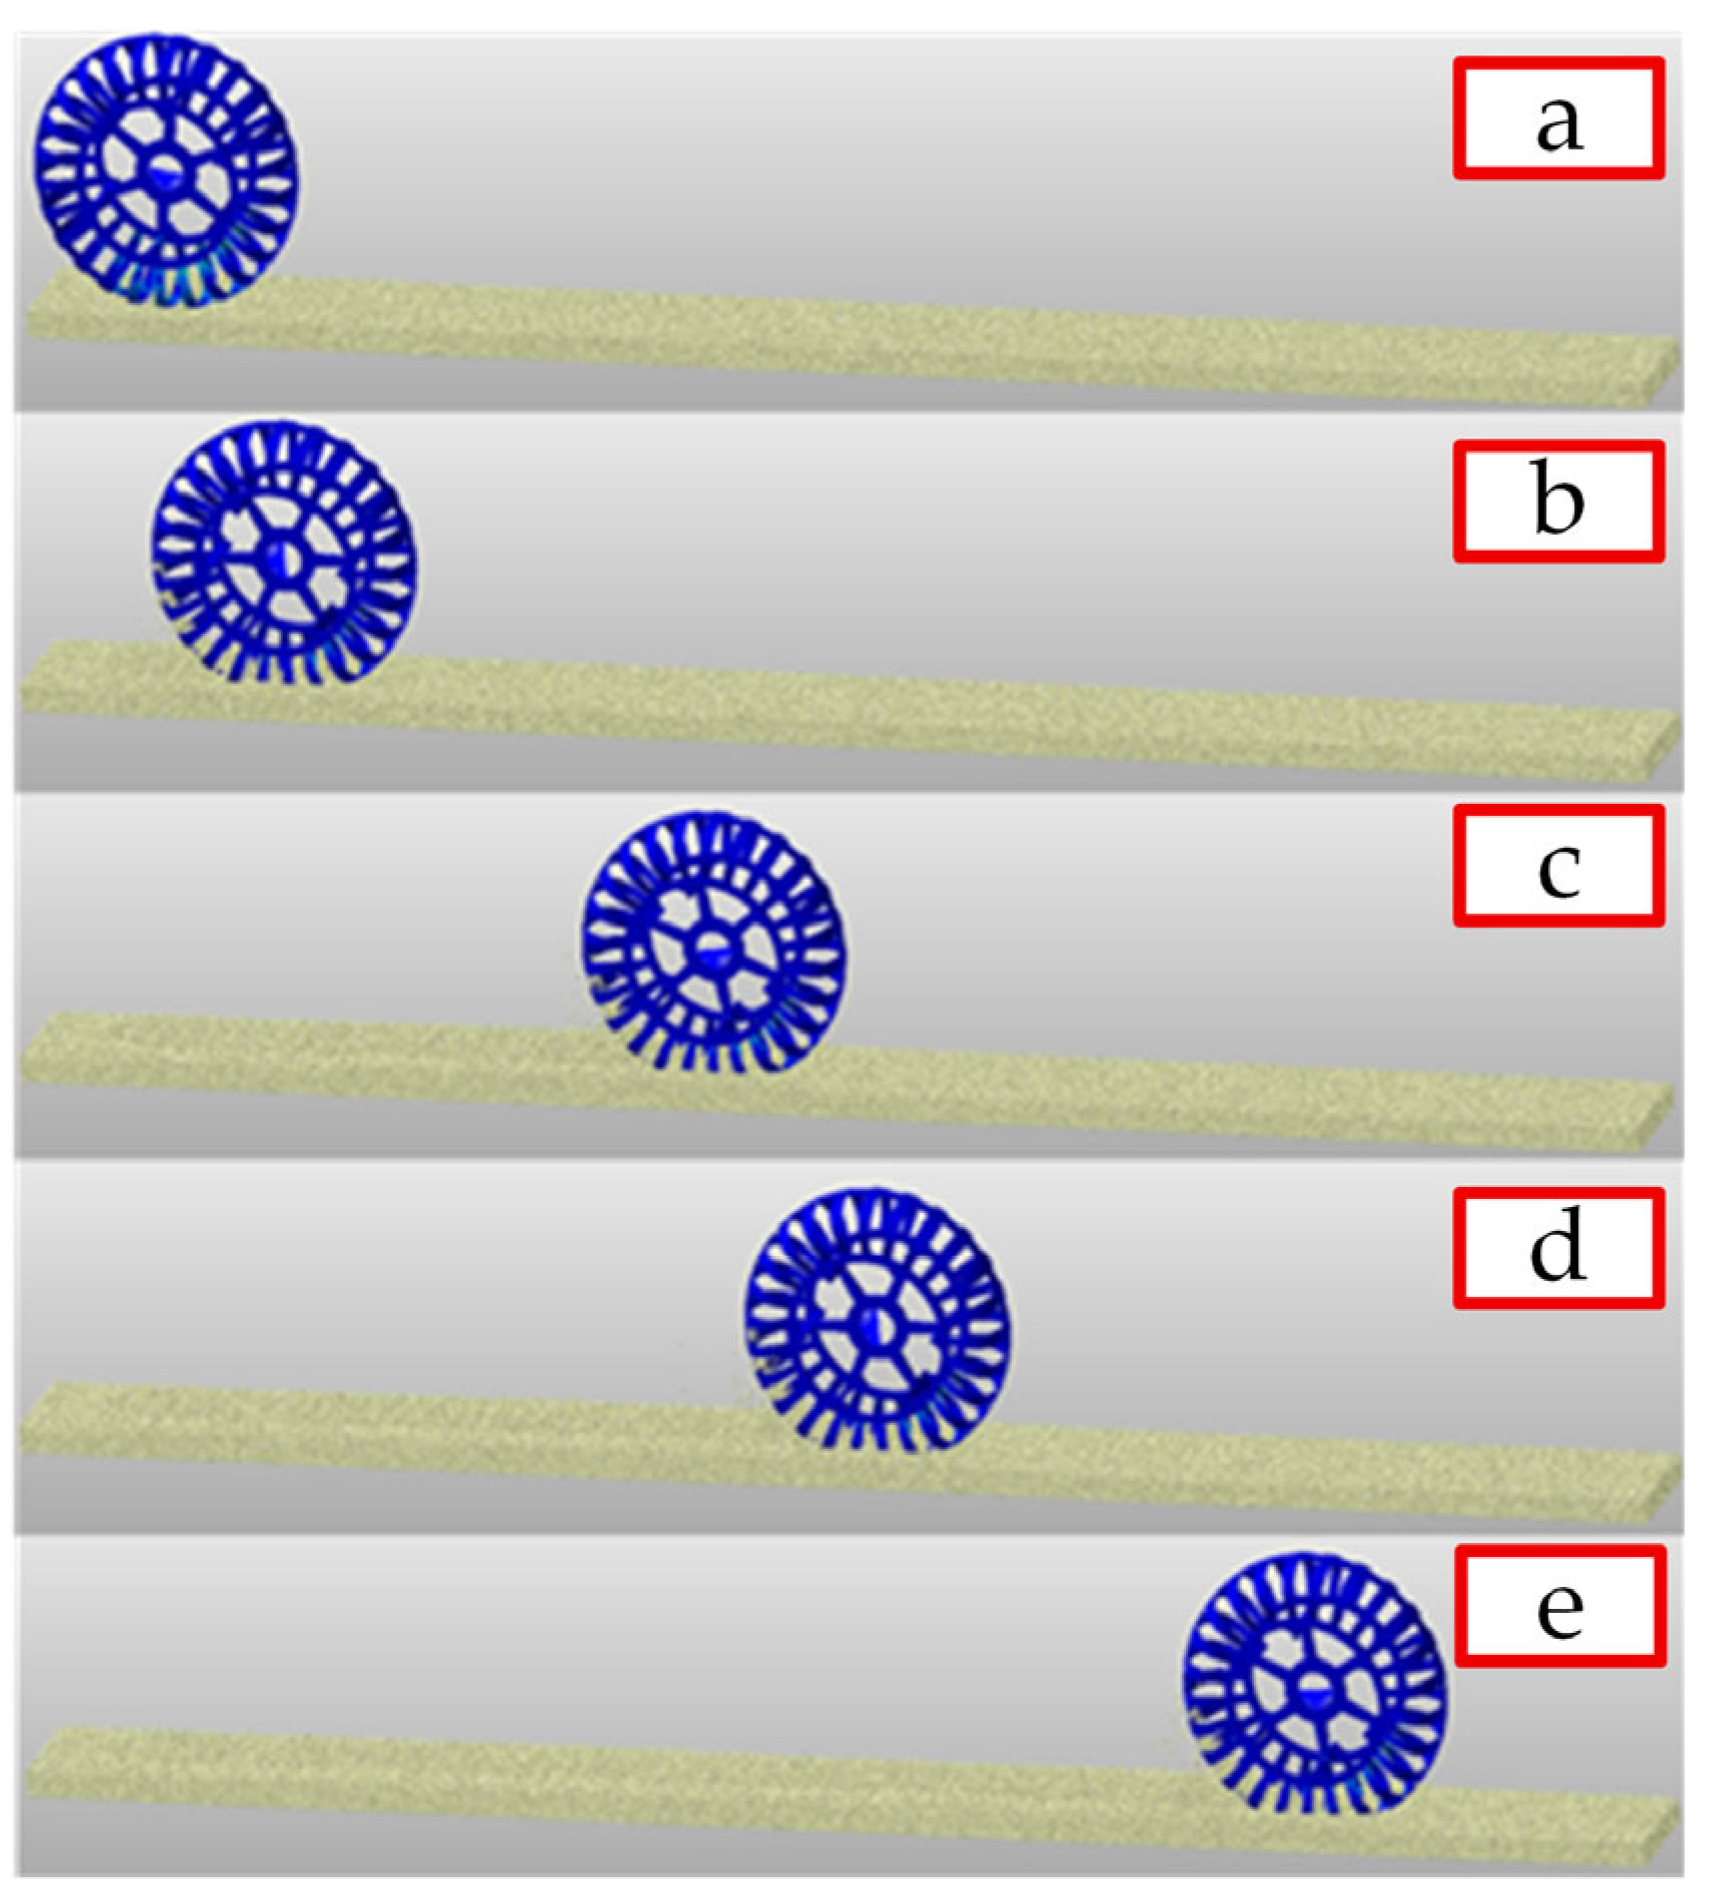
Utilizing the EDEM–RecurDyn bidirectionally coupled simulation platform, the linear travel process of elastic wheels on loose soil media was simulated. As demonstrated in Figure 6, the wheels demonstrated continuous interaction with discrete particles during the rolling process, exhibiting pronounced sinking and bulldozing effects. This verifies the model’s capability to reproduce the mechanical behavior of soft ground.
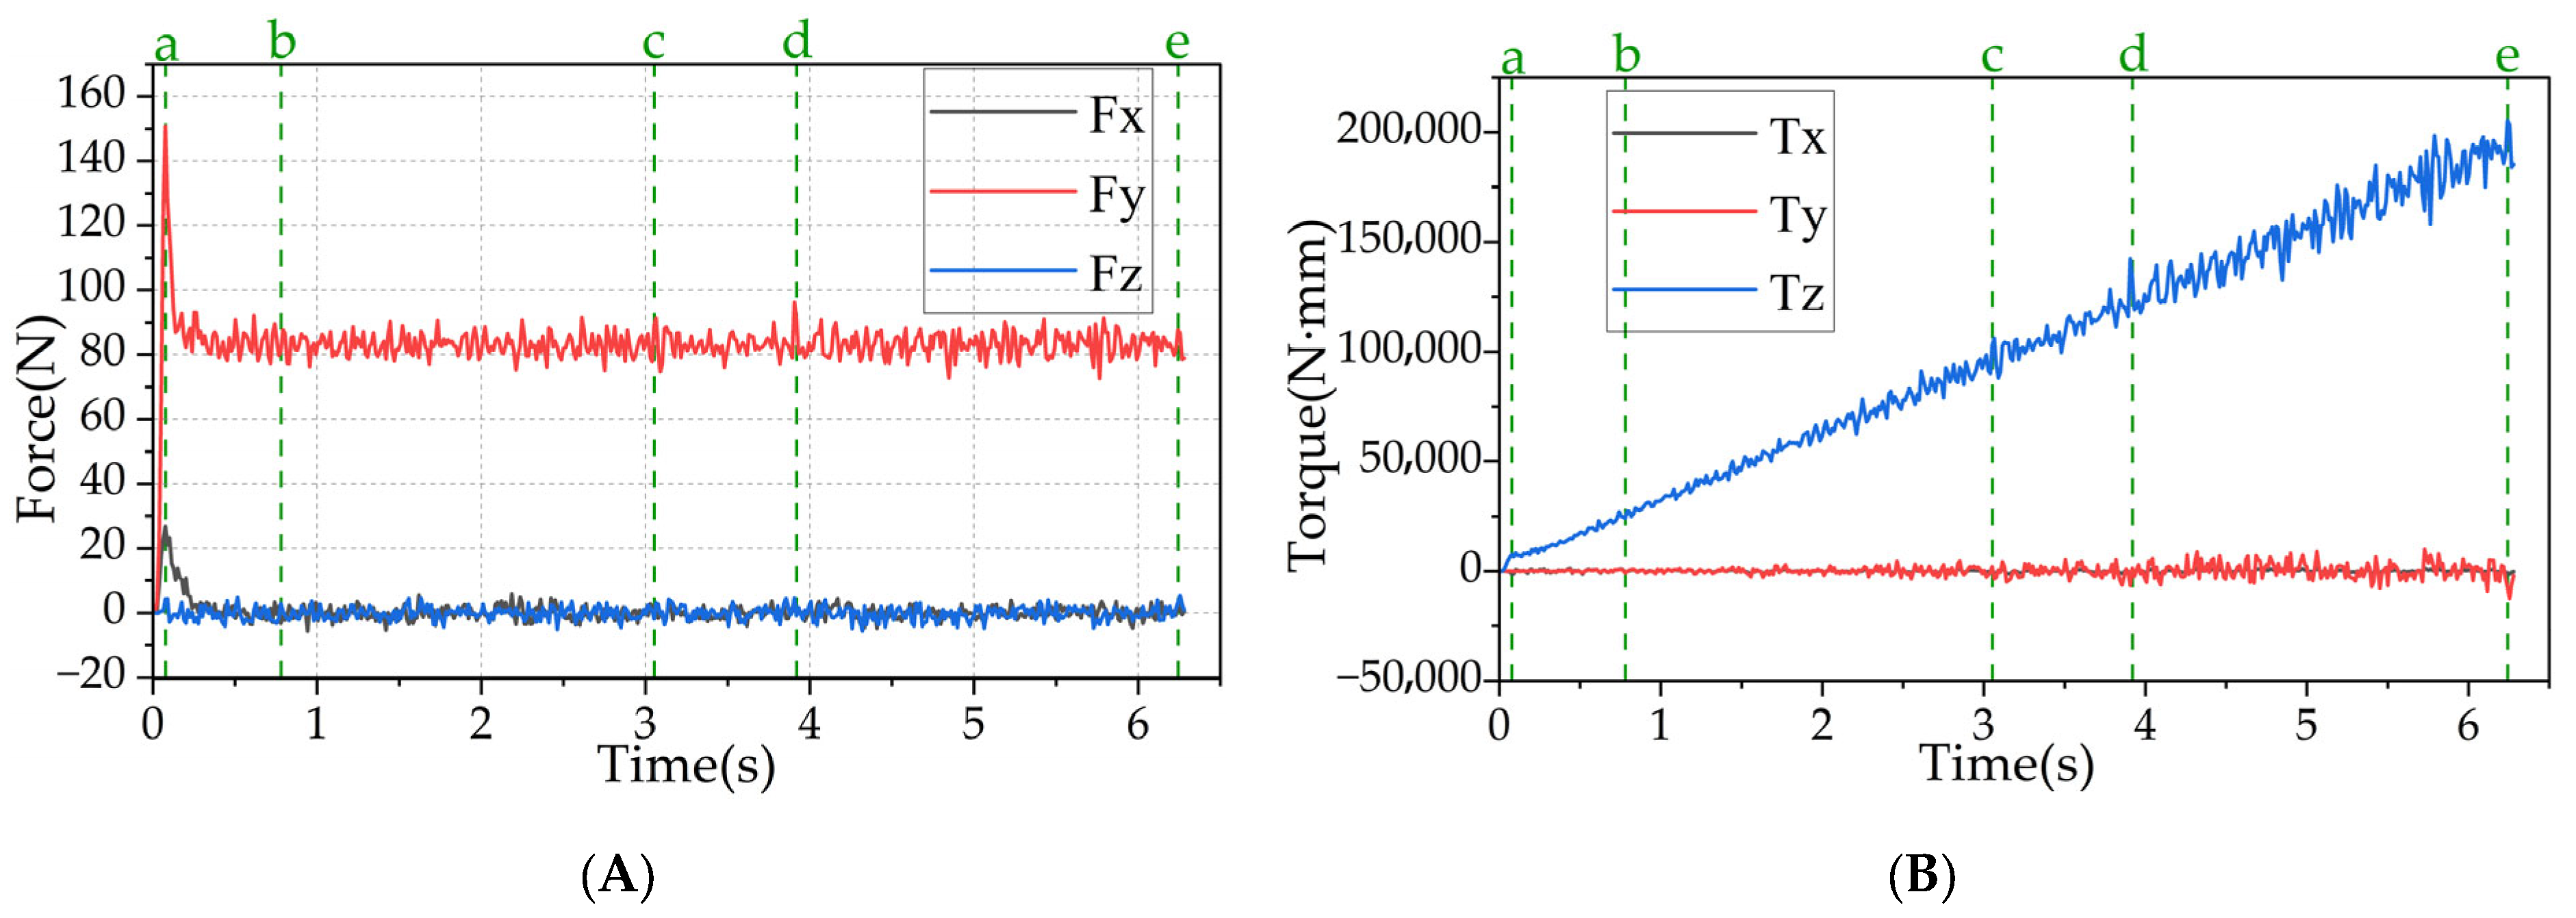
In order to conduct an in-depth analysis of the force conditions experienced by wheels in complex soil media, a virtual sensor was positioned at the hub center to record three-dimensional force and three-dimensional moment time–series signals throughout the entire journey. As illustrated in Figure 7, the time–history curves for each component are presented. The results indicate that the vertical force F y exhibits the most pronounced fluctuations, reflecting the impact characteristics caused by uneven support on soft ground. In contrast, the longitudinal force F x and lateral force F z exhibit low-frequency oscillatory behavior, correlating with wheel slip and lateral displacement. It is evident that within the torque signals, the driving torque T z manifests pulsations corresponding to driving resistance. In addition, the roll moment T x and the yaw moment T y are indicative of dynamic imbalance during wheel operation on uneven surfaces.
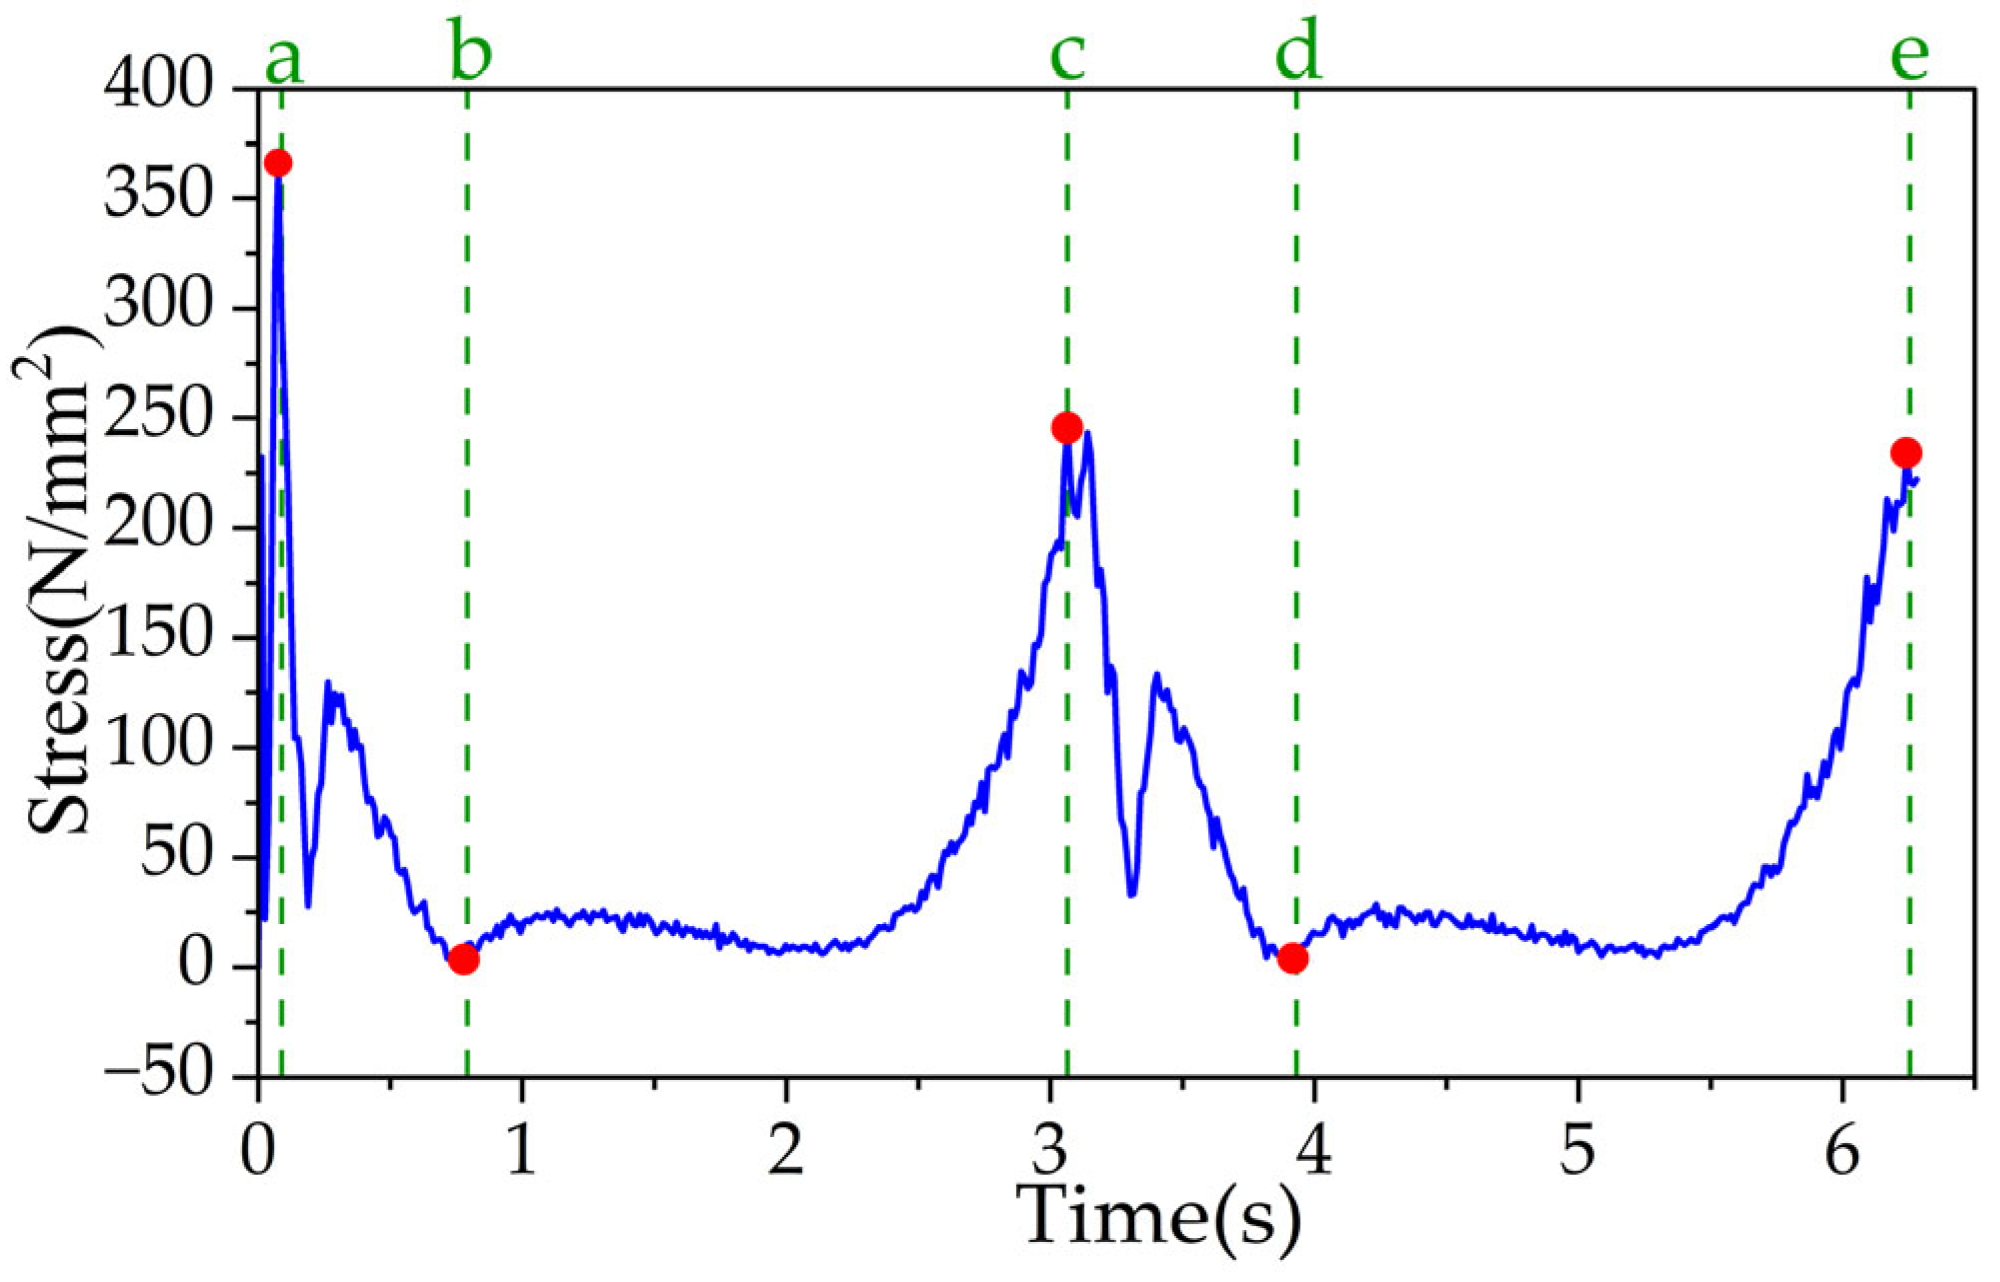
The equivalent stress distribution on the elastic tire body surface was extracted, with the maximum stress occurring at the transition zone near the spring leaf root. The simulated macroscopic peak equivalent stress observed was 367 MPa, as illustrated in Figure 8. This peak stress of 367 MPa is substantially lower than both the yield strength (≈1176 MPa) and the ultimate tensile strength ( σ u = 1430 MPa) of 60Si2Mn steel. This confirms that the wheel operates within its elastic limit under these conditions, precluding instantaneous macroscopic failure and validating the application of high-cycle fatigue analysis based on cumulative damage theory. This value remains significantly below the material’s yield strength, confirming that the wheel undergoes purely elastic deformation under these operating conditions.

4.2. Fatigue Life Simulation Results Analysis

4.2.1. Load Spectrum Characteristics and Damage Mechanism

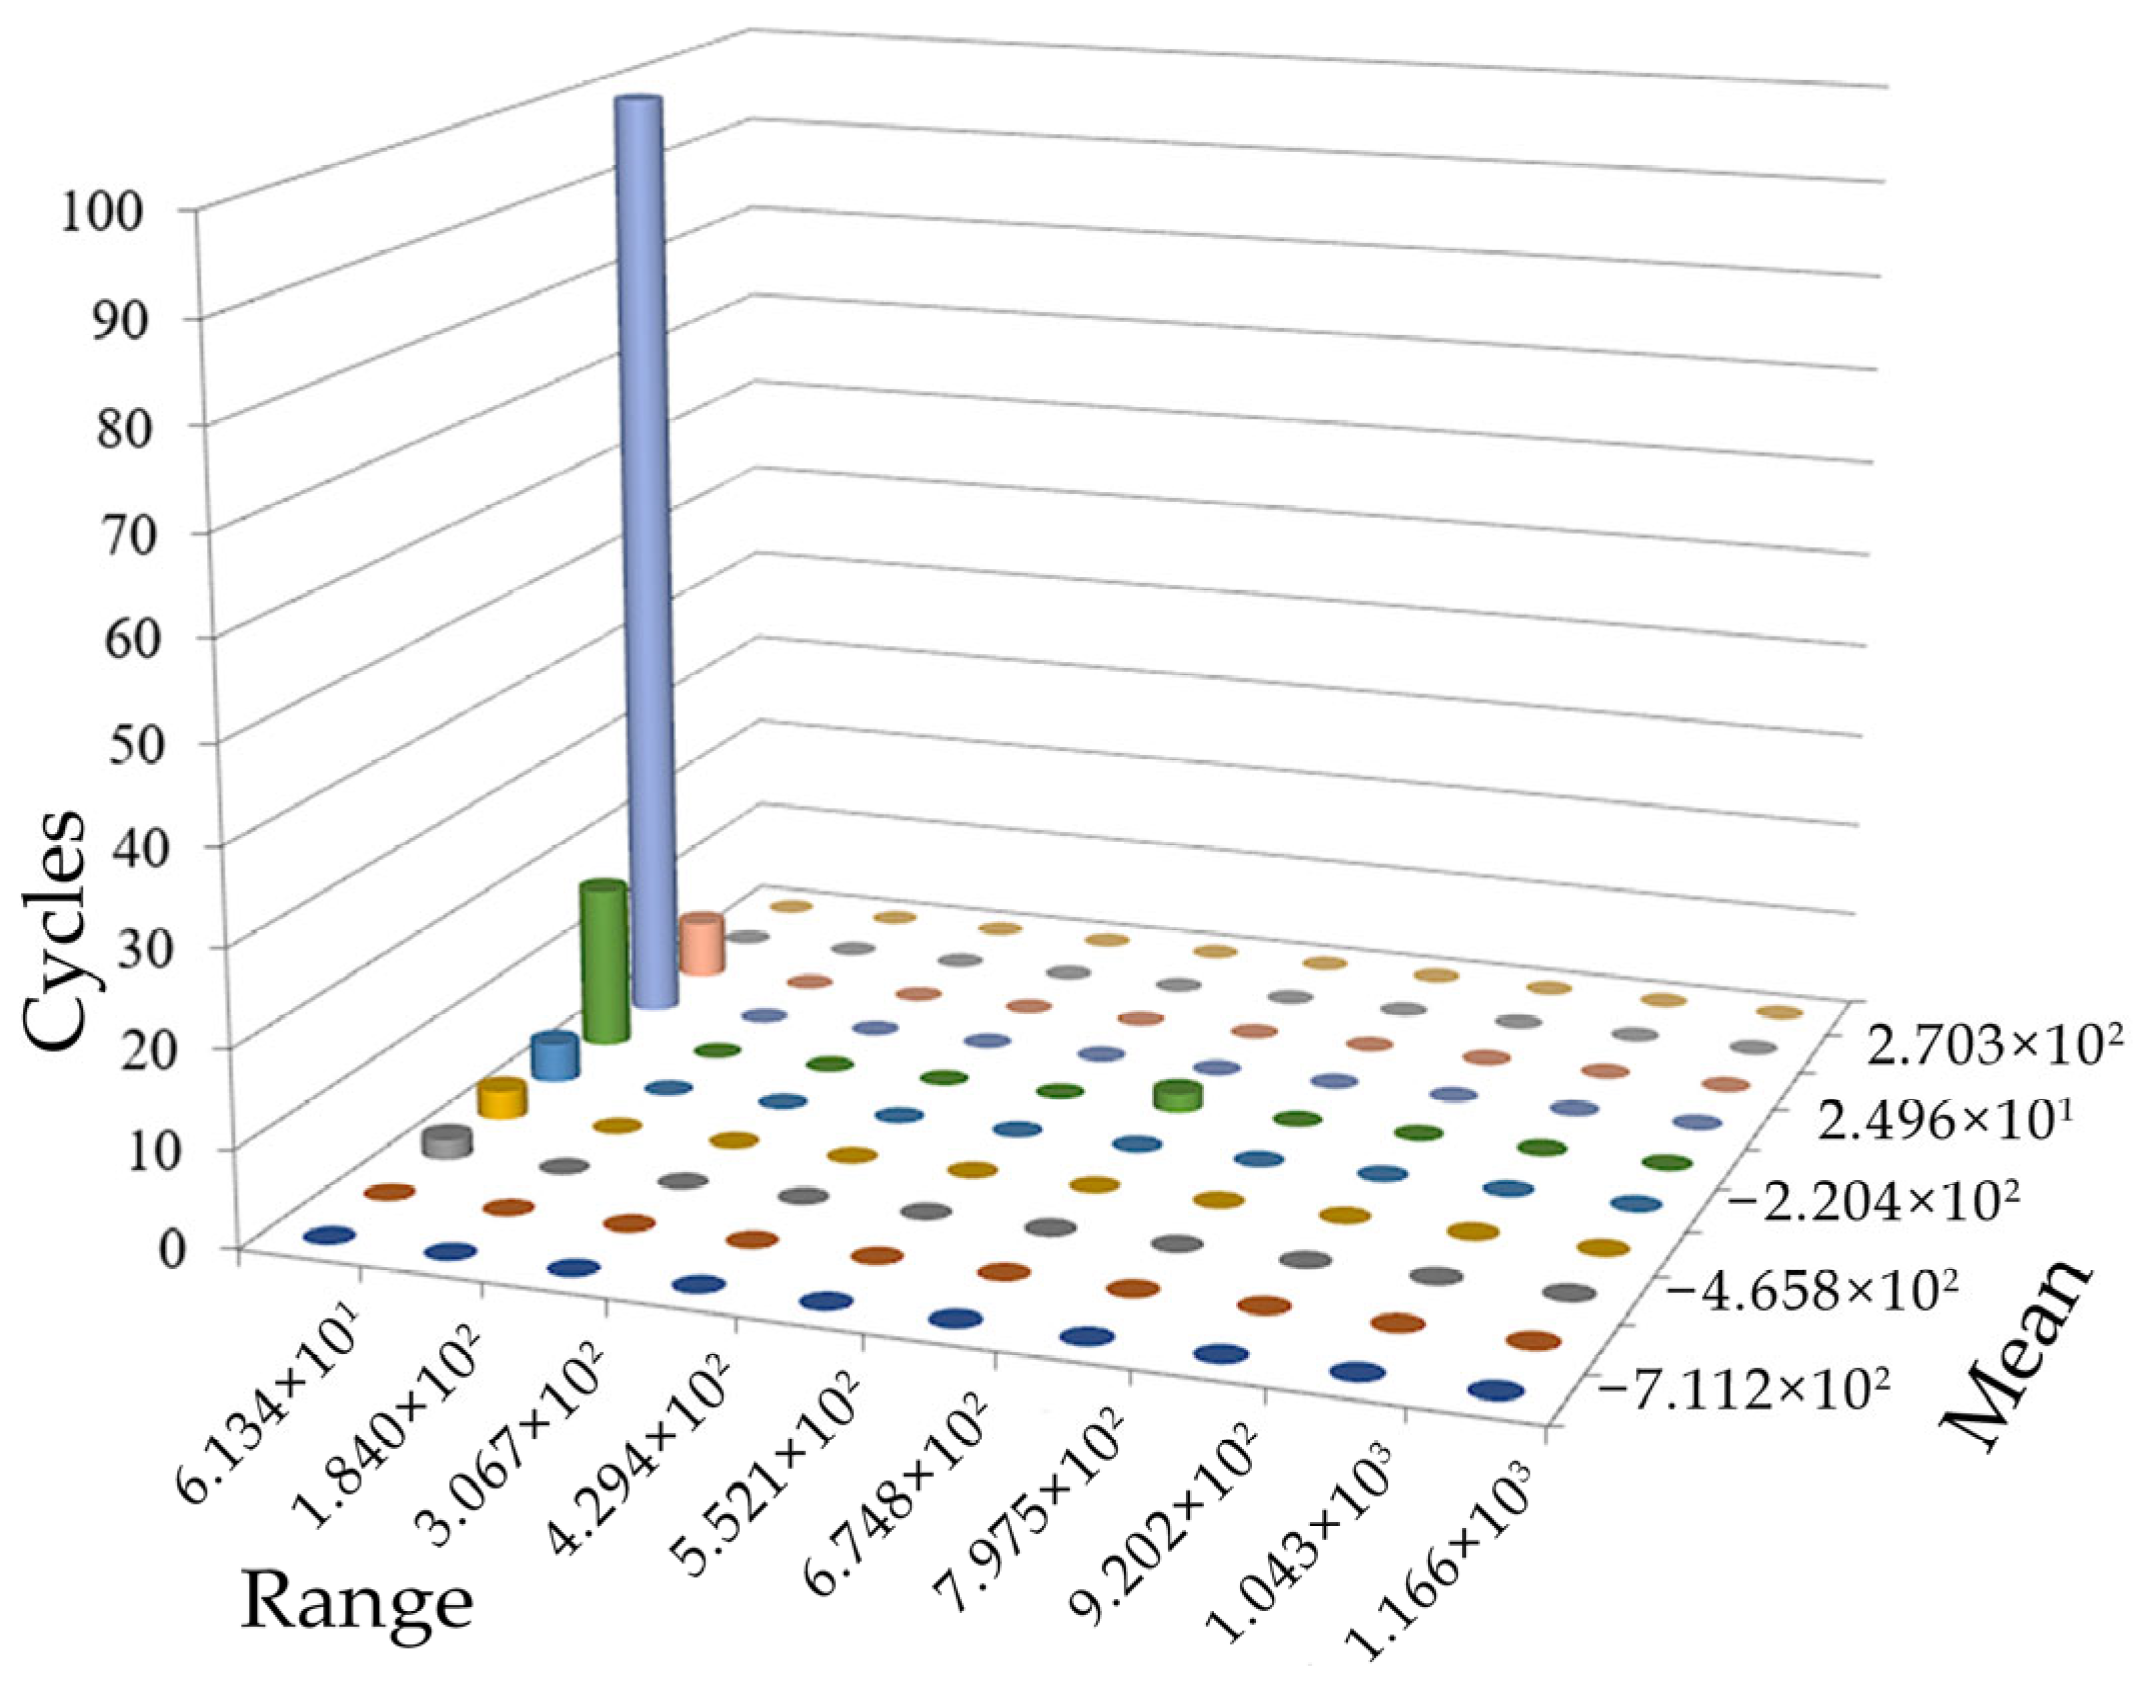
The cyclical statistics of equivalent stress histories were conducted using the rainflow counting method, with the results presented in Figure 9. The stress amplitude distribution demonstrates a marked right-skewed characteristic, with the majority of cycles concentrated in the low stress amplitude region. Despite the fact that cycles in the high-stress amplitude region constitute less than 5% of the total, their contribution to single-cycle damage exceeds 60% of the total damage.
On flat, hard surfaces, fatigue damage typically follows a ‘high-cycle, low-damage’ pattern, where a large number of low-amplitude stress cycles gradually accumulate to cause failure. In contrast, the soft ground condition in this study exhibits a ‘low-cycle-high-damage’ mechanism, wherein a small number of high-amplitude stress events—caused by terrain irregularities—dominate the total damage. This distinction is critical for guiding fatigue-resistant design.
This finding suggests that the fatigue damage mechanism of elastic wheels on soft ground exhibits a typical ‘low-cycle-high-damage’ impact-dominated characteristic, fundamentally differing from the ‘high-cycle-low-damage’ cumulative pattern commonly observed on flat, hard surfaces.
A subsequent analysis of the damage accumulation process reveals that high-amplitude stress events predominantly correspond to transient processes such as wheel engagement in localized depressions or compaction of hard particles. This emphasizes the amplifying effect of soft medium granularity on fatigue loads. Consequently, enhancing fatigue life under such operating conditions should prioritize improving the structure’s capacity to dissipate impact loads and implementing designs that mitigate localized stress concentrations.

4.2.2. Fatigue Life Calculation Results

The utilization of the RecurDyn 2023 dynamic simulation software has yielded the conclusion that the predicted fatigue life of the elastic wheel under typical operating conditions is N f = 3.25 × 10 5 cycles. The simulation parameters of driving speed (2 rad/s) and wheel circumference (diameter 510 mm) were utilized to convert the cycle count to an equivalent driving distance of approximately 830 km. This fatigue life value falls within the reasonable range for high-cycle fatigue of 60Si2Mn material, validating the fundamental reliability of the wheel structure design under the target operating conditions.
In order to assess the conservatism of the computational method, a modified calculation employing the relative Miner criterion (based on critical damage values) yielded a fatigue life of N f = 3.41 × 10 5 cycles. A comparison of this result with the classical Miner criterion reveals a deviation of only 4.9%, which falls within the engineering acceptable error range of ±5%. This finding suggests that, within the present soft ground load spectrum, the loading sequence exerts minimal influence on fatigue damage accumulation, thereby further substantiating the credibility of the simulation results.
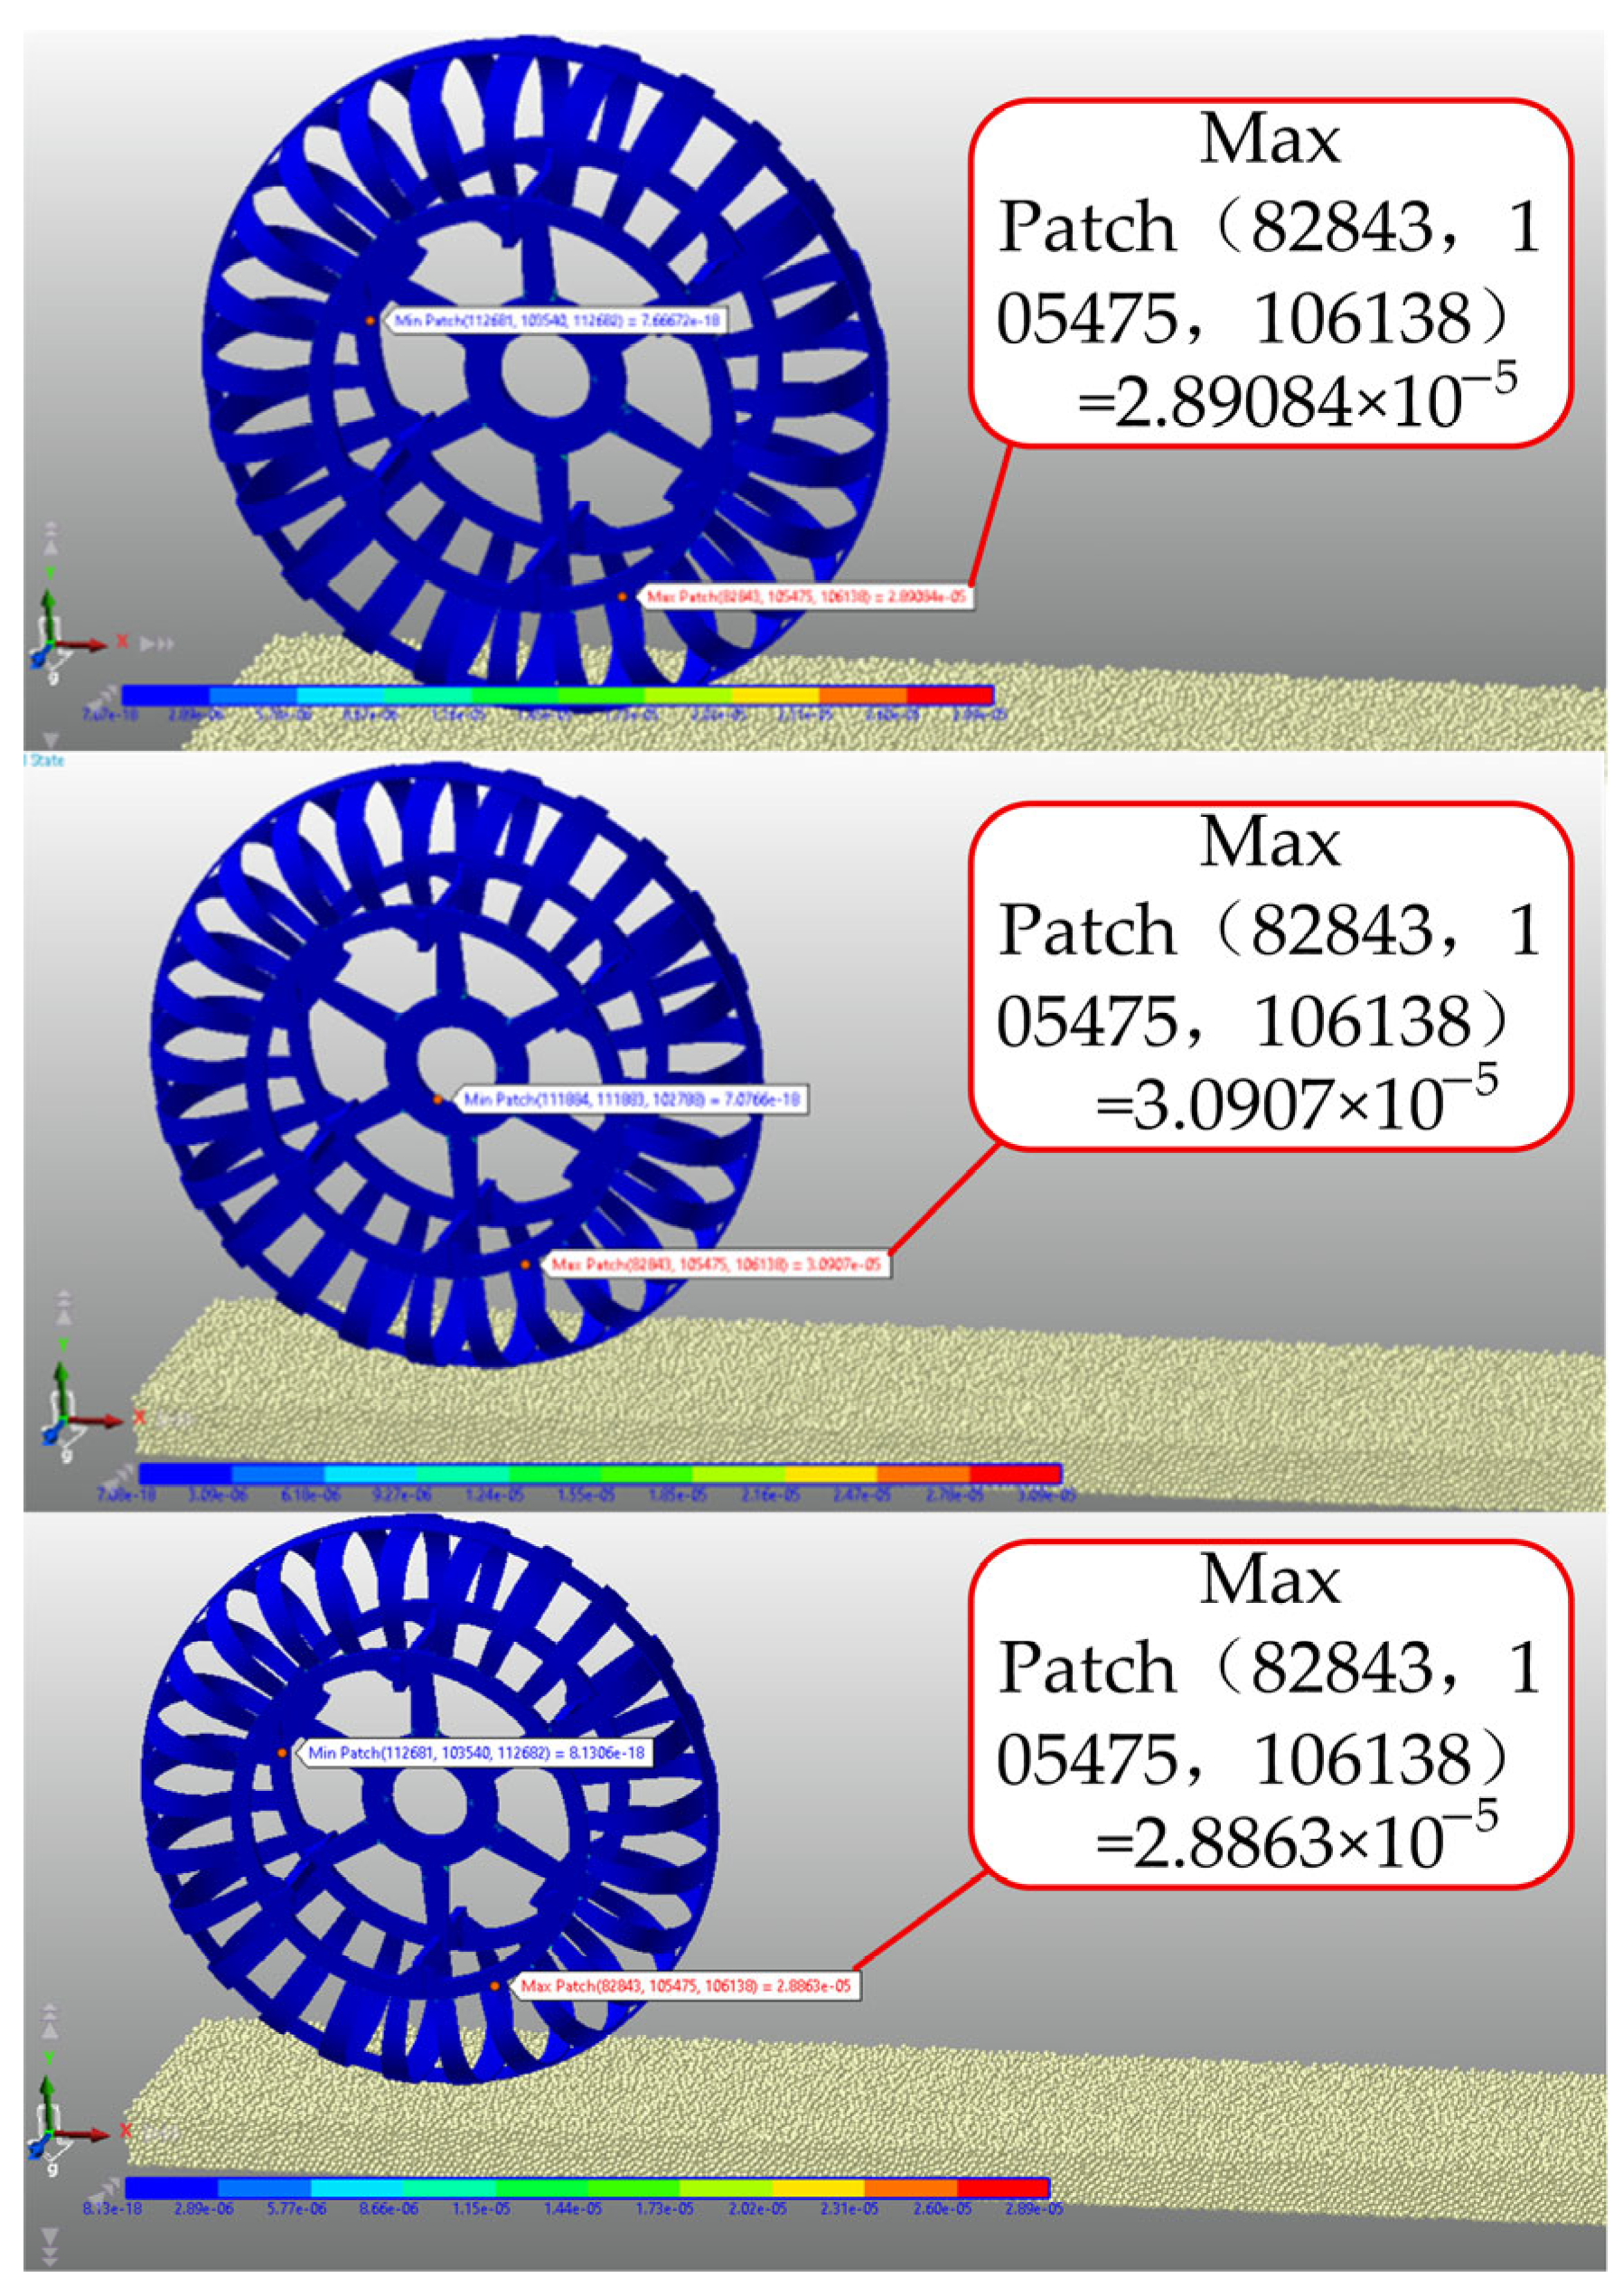
The fatigue damage output from the RecurDyn post-processing, as demonstrated in Figure 10, indicates that the maximum damage occurs at the transition arc connecting the root of the diaphragm to the hub. The values of damage decrease progressively outward from this region, confirming that this location is the most critical area for the initiation of fatigue cracks. This finding provides a robust engineering rationale for subsequent structural optimization measures, such as refining the transition radius design or implementing localized surface strengthening.

4.3. LightGBM–CH Predictive Model Performance Validation

4.3.1. Prediction Accuracy Assessment

In order to provide a comprehensive analysis of the effectiveness of the selected methods, three metrics were selected for the evaluation of model performance: the coefficient of determination ( R 2 ), the root mean square error (RMSE), and the mean absolute error (MAE). The calculation formulas are as follows:
R 2 = 1 i = 1 n   ( y i y i ^ ) 2 i = 1 n   ( y i y i ¯ ) 2
R M S E = 1 n i = 1 n   ( y i y i ^ ) 2
M A E = 1 n i = 1 n | y i y i ^ |  
where y i denotes the i-th actual value, y i ^ represents the i-th predicted value, and n indicates the number of samples.
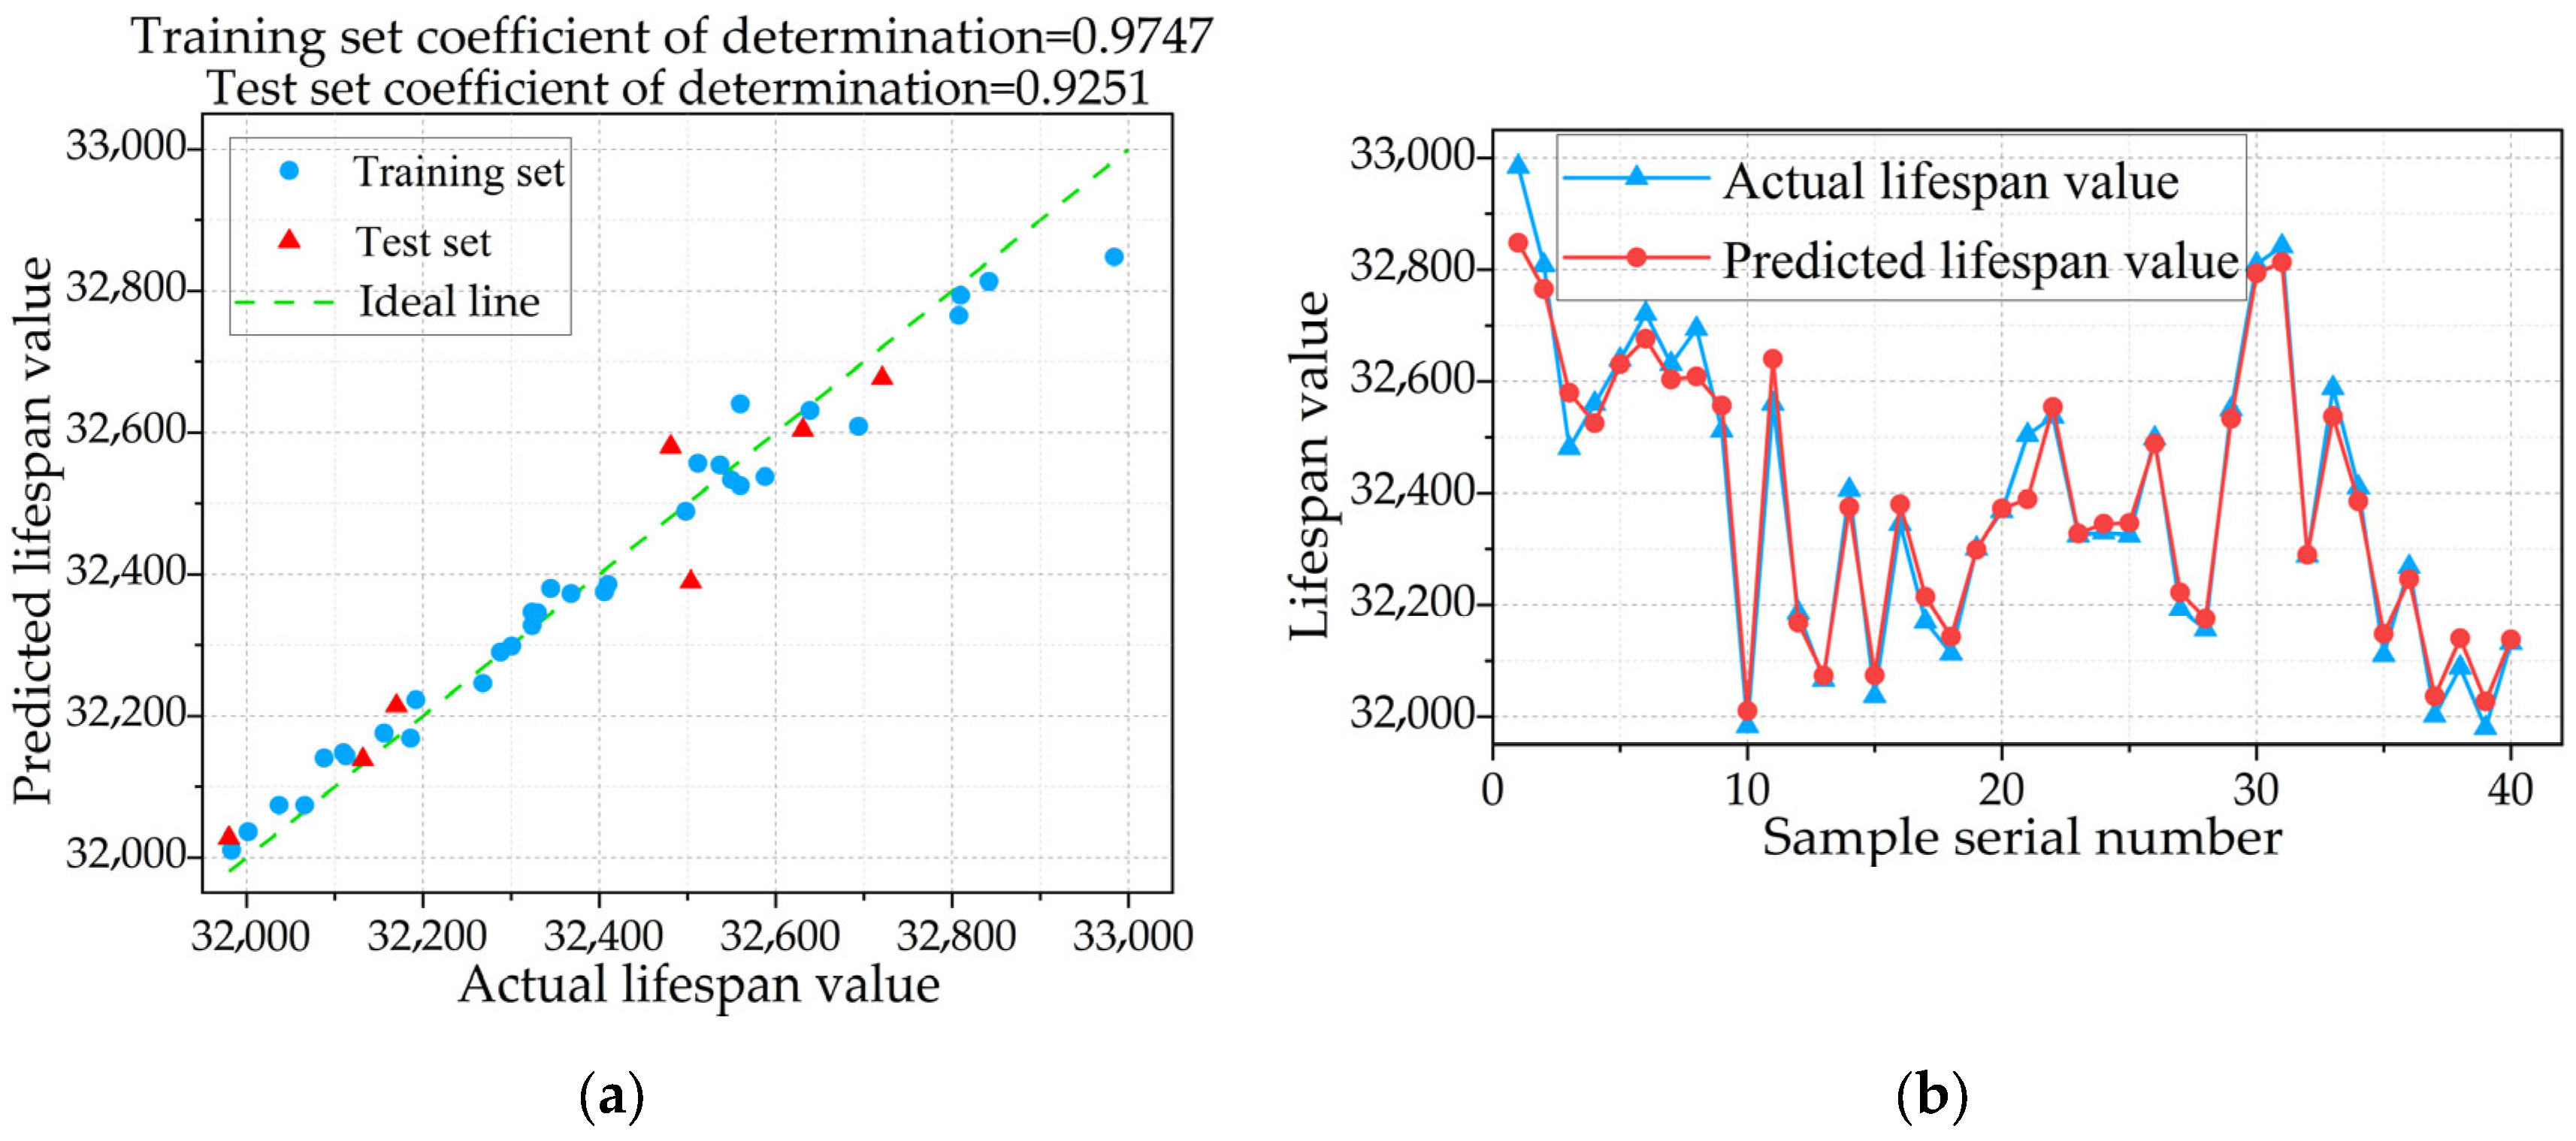
Figure 11 shows the model’s prediction results on the training and test sets. The training set achieved an R 2 of 0.9747, while the test set attained an R 2 of 0.9251. This indicates that the model strikes a balance between strong fitting capability and sound generalization performance. The test set’s MAE and RMSE were 58.89 and 67.06, respectively, indicating low absolute error values and concentrated distribution. This further confirms the model’s predictive stability under conditions of a small sample size.

4.3.2. Comparative Experimental Analysis

In order to demonstrate the superiority of the LightGBM-CH approach, three mainstream ensemble learning models were selected as baselines for comparative experiments: Random Forest (RF), Support Vector Machine (SVM), and standard LightGBM. Each model was trained and tested on the same dataset using a consistent cross-validation strategy. The results of the performance comparison are presented in Table 2.
The results demonstrate that LightGBM-CH significantly outperforms the comparison models across all metrics. Its R2 improved by 21.9% compared to Random Forest and by 12.8% compared to standard LightGBM; RMSE and MAE decreased to 67.06 and 58.89, respectively, representing merely 93.7% and 85.7% of standard LightGBM’s values. This fully validates the effectiveness of the proposed multidimensional feature engineering and triple optimization strategy in mitigating overfitting on small samples and enhancing predictive accuracy.
In order to statistically validate the performance superiority of LightGBM–CH over baseline models, we conducted paired t-tests on the prediction residuals across 10 repeated 5-fold cross-validation runs. The findings suggest that the enhancements in R2, RMSE, and MAE attained by LightGBM-CH are statistically significant (p < 0.01) in comparison to conventional LightGBM, RF, and SVM methods.

4.3.3. Ablation Study

In order to conduct a more in-depth investigation into the contribution of the various feature groups in the LightGBM-CH framework, a comprehensive ablation study was conducted. The 122-dimensional feature vector was decomposed into eight semantic components, as demonstrated in Table 3, based on its physical meaning.
Two computational experiments were conducted using 5-fold cross-validation with five repeats:
Computational experiment A: Forward incremental addition. Components are added sequentially, as illustrated in Table 3. Subsequent to each addition, the SelectKBest feature selection (k = 20) is applied within each fold, and the model is evaluated. This experiment demonstrates how performance improves as more feature groups are incorporated.
Computational experiment B: The principle of “leave-one-component-out” is to be followed. Each component is then extracted sequentially from the comprehensive 122-dimensional feature set. Subsequent to the removal process, the identical feature selection and evaluation procedures are to be applied. The experiment revealed the performance degradation caused by the absence of each component.
The results of the study are presented in Table 4 and Table 5.
  • The Force–Stress Interaction (C8) feature group is of the utmost importance. In the forward experiment, the incorporation of C8 results in the most significant enhancement (ΔR2 = +0.157). In the leave-one-out experiment, the removal of C8 results in the most significant performance degradation (R2 loss = 0.157). This finding is consistent with the underlying physics of wheel fatigue, where the fatigue life of a wheel is fundamentally governed by how external loads translate into local stress responses at critical hotspots.
  • Stress_Fatigue (C6) is the second most significant component, contributing +0.023 in forward addition and causing a loss of 0.035 when removed. This finding serves to substantiate the hypothesis that fatigue-specific parameters (stress amplitude, mean stress, and stress ratio) play a crucial role in accurate life prediction.
  • The Force_Correlation (C3) and Stress_SkewKurt (C7) feature groups demonstrated minimal contribution, indicating their potential as candidates for further reduction in future work. This would allow for the simplification of the feature set without significant performance degradation.
  • The negative absolute R2 values observed in some configurations are expected given the small sample size (n = 40) under cross-validation. Nevertheless, the relative differences (ΔR2) between configurations remain valid and informative for ranking component importance. The progressive improvement trend, coupled with the consistent identification of critical components across both experimental designs, provides substantial evidence for the efficacy of the proposed feature engineering scheme.

4.3.4. Feature Importance Analysis

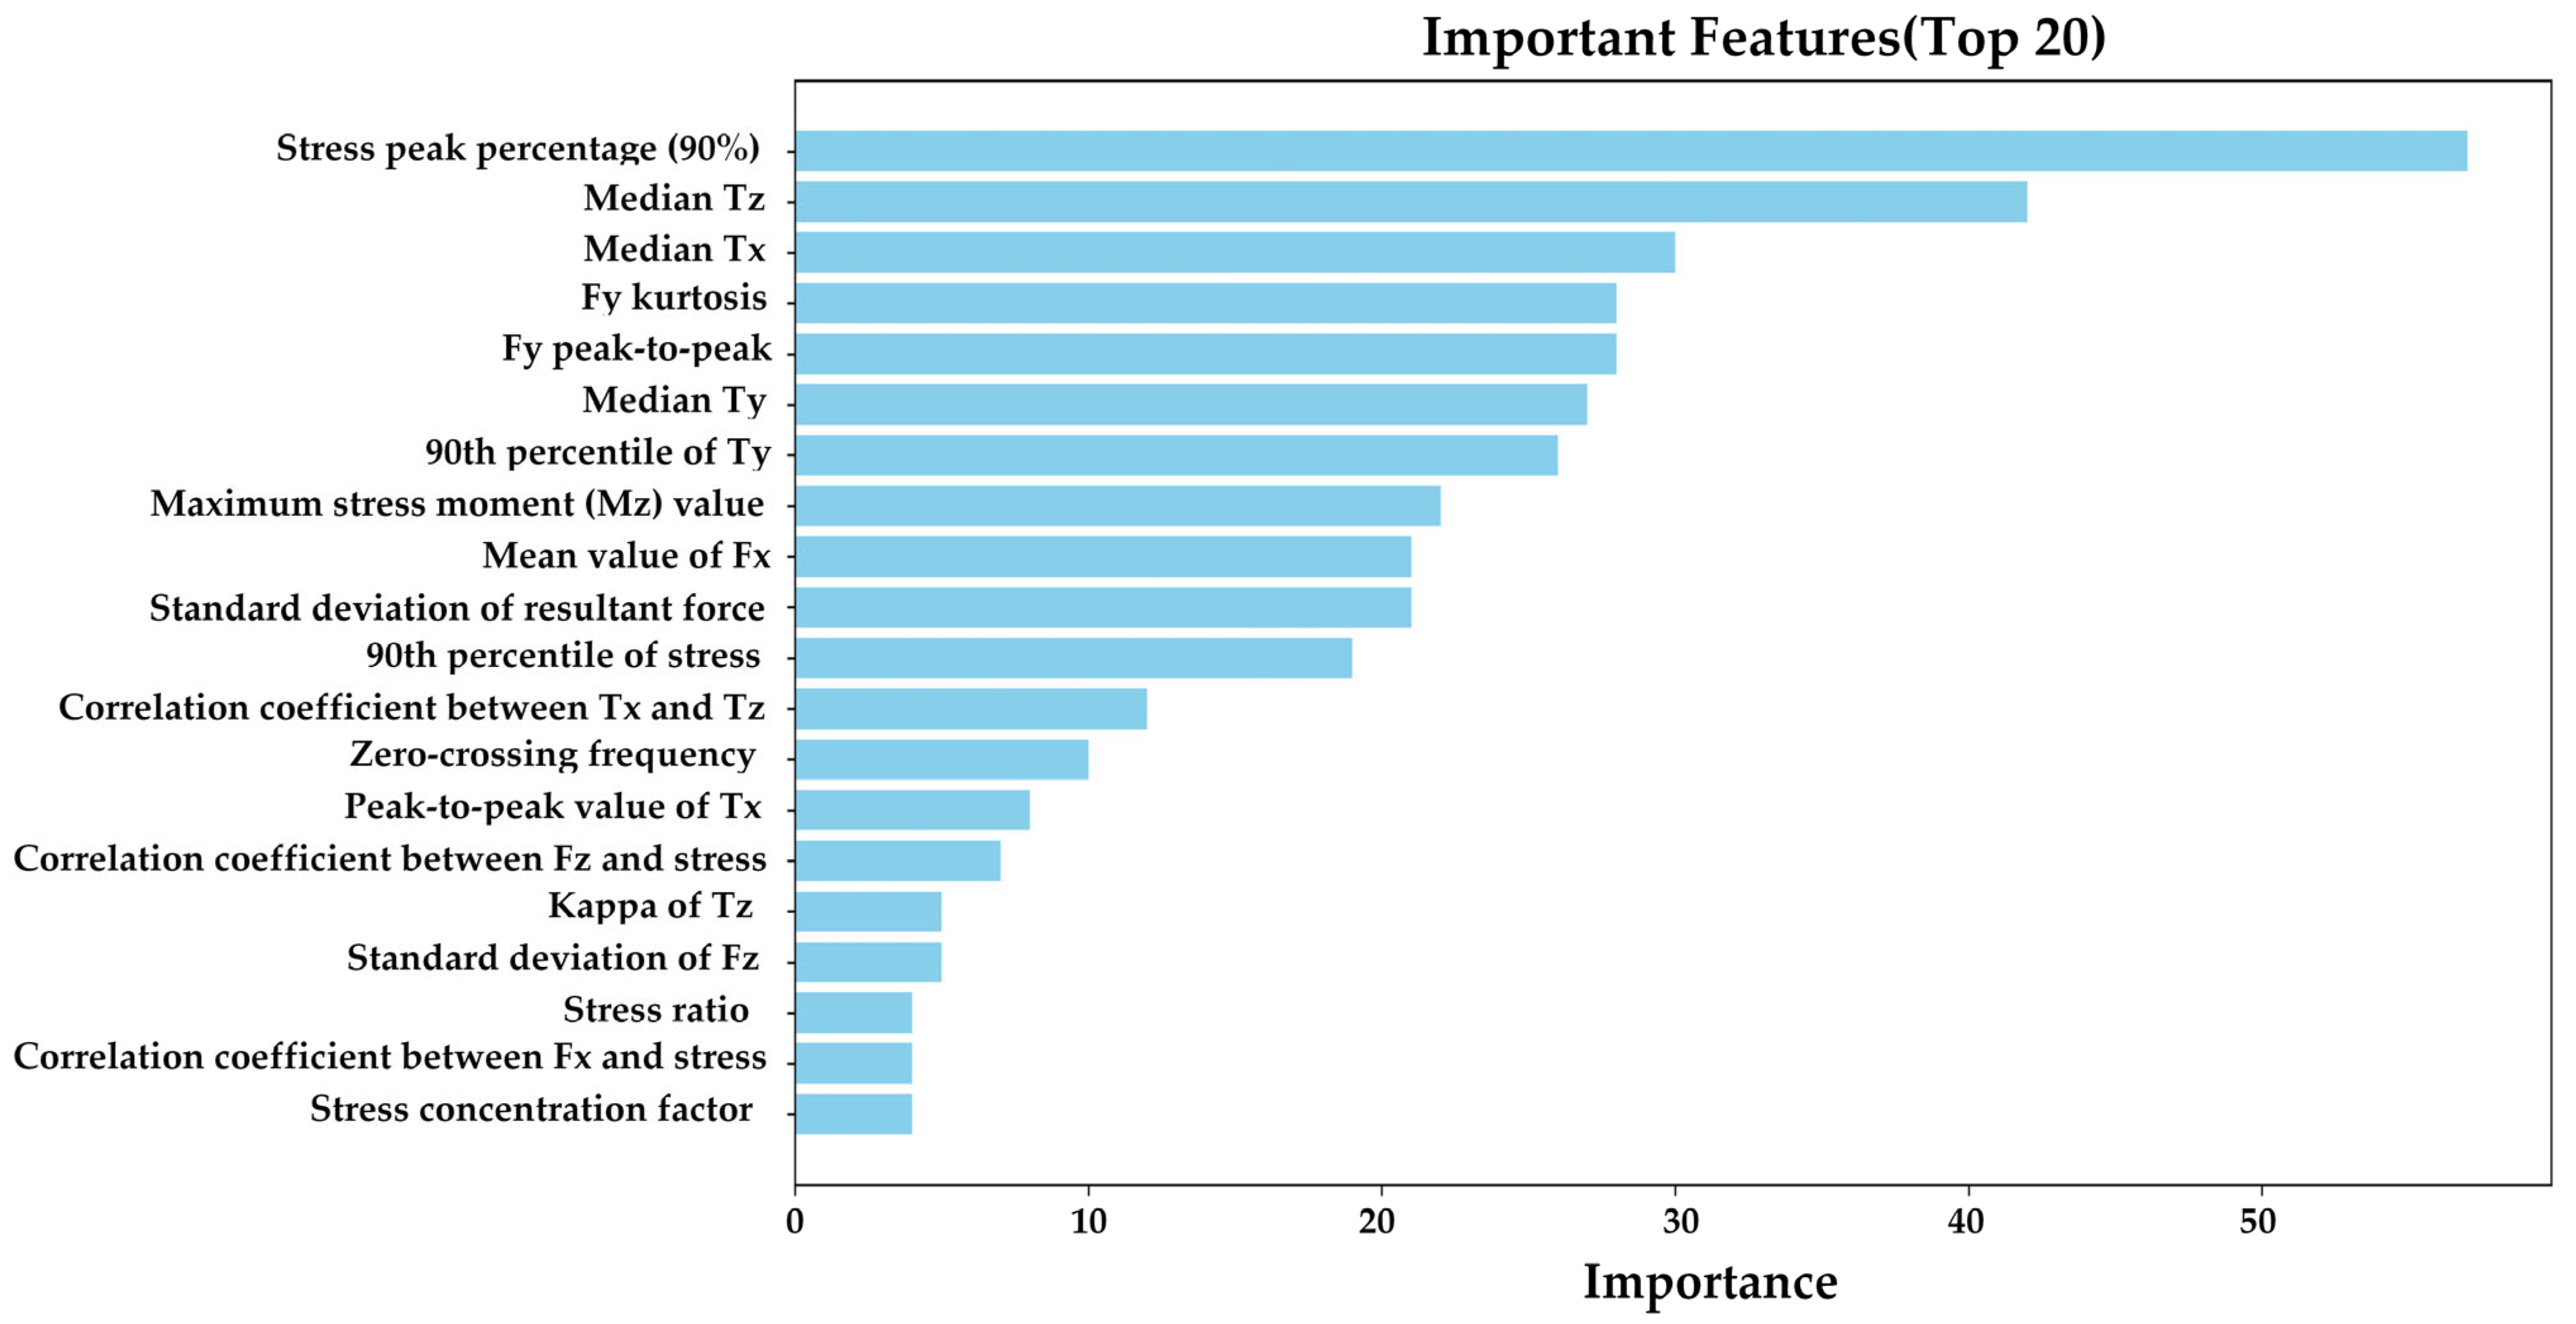
The analysis of feature importance is a process by which key factors influencing fatigue life prediction can be identified. This, in turn, provides a basis for structural optimization. As illustrated in Figure 12, the distribution of contributions from the top 20 features is depicted. The total importance value of 365 (the sum of all feature importance values) is obtained from the CSV file, with the cumulative contribution of the top 20 features reaching 93.95%.
The stress characteristics of the subject are found to play a dominant role in the prediction of fatigue life, with the peak stress contribution (90%) ranking first at 15.57%, indicating that high stress duration is a key factor influencing life. This finding is consistent with the theory of fatigue damage accumulation. It is evident that moment-type characteristics generally exhibit greater significance than force characteristics, with medium-to-high load levels of T x and T z demonstrating heightened influence. Lateral loads exert a more pronounced effect than longitudinal forces, revealing the significant impact of lateral load fluctuations on service life and providing optimization directions for suspension and tire design. The contribution of maximum stress moment load conditions is 6.01%, emphasizing the importance of load configuration under extreme operating conditions and supporting the design verification concept based on critical operating conditions.
It is noteworthy that the ablation experiments (Section 4.3.3) and the feature importance analysis revealed complementary insights. Feature importance analysis identified peak stress share as the most influential single feature (contributing 15.57%), confirming the hypothesis that stress levels are a direct cause of fatigue damage. In contrast, the experimental investigation revealed that the load–stress interaction feature set—defined as the manner in which external loads are translated into stress responses—emerged as the most significant collective contributor. This finding suggests that, while peak stress is the primary catalyst for fatigue, the underlying mechanism is situated within the load-to-stress transfer process. In other words, a more fundamental approach may be to understand and optimize how loads induce stresses at critical points, as opposed to merely monitoring stress values.
These two analyses validate the same physical principle at different levels: fatigue life is influenced by stress levels (the direct cause) and governed by the load-to-stress transfer mechanism (the fundamental cause). This discovery provides dual guidance for fatigue-resistant wheel design: focus on controlling peak stresses at critical points while also optimizing the transfer pathway from external loads to internal stresses.

5. Conclusions

The present paper proposes a fatigue life prediction method (LightGBM-CH) integrating discrete element–multibody dynamics simulation with feature-optimized LightGBM in order to address the challenges of high-frequency random impact loads and fatigue failure risks encountered by elastic wheels operating on soft ground. The difficulties of high-fidelity simulation costs and scarce data samples are also discussed. The following key conclusions are drawn from this analysis:
  • The establishment of a bidirectionally coupled simulation model of elastic wheels and soft ground using EDEM-RecurDyn has enabled the achievement of high-fidelity dynamic simulation of wheel–soil interaction. The following data is presented: six-dimensional force/torque and stress response data from the wheel. The fatigue life under typical operating conditions was calculated on the basis of rainflow counting and Miner’s cumulative damage theory. The result of this calculation was approximately 3.25 × 10⁵ cycles, which is equivalent to a mileage of approximately 830 km. This approach ensures the provision of reliable, labeled data, which is fundamental for the subsequent development of data-driven models.
  • In addressing the characteristics of simulation data, namely its ‘high-dimensional and low-sample-sized’ nature, a 122-dimensional feature system was constructed. This system encompassed load statistics, fatigue key parameters, and physics-guided composite features. A strategy for optimization was devised, integrating robust processing, correlation-based feature selection, and stability-constrained hyperparameter optimization. This strategy significantly mitigated the issue of overfitting and enhanced LightGBM’s predictive robustness under low-sample conditions.
  • The simulation results demonstrate that the LightGBM–CH model achieved a coefficient of determination of 0.9251 on the test set, with a root mean square error of merely 67.06. This result indicates that the LightGBM–CH model exhibits significantly superior predictive performance compared to benchmark models such as Random Forest, SVM, and standard LightGBM. Feature importance analysis further revealed that the proportion of peak stress and the high load level during torque cycles are the most critical factors influencing fatigue life, providing explicit guidance for the fatigue-resistant structural optimization of elastic wheels.
The methodology proposed herein provides an efficient and reliable solution for assessing the fatigue life of elastic wheels on soft ground by integrating physical simulation with data-driven approaches. In addition, valuable insights are offered for intelligent prediction and optimization of similar complex mechanical systems. Nevertheless, this study has several limitations that must be acknowledged, and future work will address them through the following directions:
  • Physical Experimental Validation: The present study is entirely based on simulation-driven data, and the fatigue life predictions have not yet been validated through physical experiments. Although the DEM-MBD coupling framework has been calibrated with reference parameters from established literature, this absence remains a limitation. In future work, we plan to conduct bench-scale fatigue tests using a custom-built wheel–soil interaction test rig. This rig will provide physical load spectra and failure data to further validate and refine the proposed LightGBM–CH model.
  • Multiphysics Coupling Effects: The current study does not account for the effects of ambient temperature on the mechanical behavior of the wheel material and the soil. Temperature variations influence fatigue life by altering material properties and soil characteristics, which in turn affects wheel–soil interaction. Subsequent endeavors will entail the incorporation of multiphysics simulations to methodically assess the impact of temperature, with a view to integrating these as supplementary features into the predictive model.
  • Wear-Induced Geometry Evolution: The model does not currently account for abrasive wear of the wheel caused by continuous interaction with soil particles. Over a large number of cycles, this wear can alter the wheel’s macroscopic geometry, potentially affecting dynamic load distribution and fatigue life. Incorporating a physics-based wear model into the DEM-MBD framework represents a crucial next step to enhance the fidelity and long-term predictive capability of our approach.
  • Methodological and Scope Enhancements: Future work will pursue several methodological enhancements to improve model robustness and generalizability. These include: (a) expanding the feature space to include material parameters and environmental factors; (b) increasing data diversity through multi-condition simulations covering extreme terrain and transient dynamic maneuvers; (c) comparing with additional physics-informed baselines and incorporating uncertainty quantification; and (d) exploring nonlinear cumulative damage theories (e.g., Corten–Dolan) beyond the Miner’s rule used in this baseline study.
  • Structural and Material Innovations: Beyond methodological improvements, we plan to explore advanced wheel geometries (such as thin ring designs, variable thickness configurations, and multi-layer architectures) to further enhance fatigue resistance and impact absorption. We also intend to investigate emerging material systems, including graphene-reinforced composites, carbon nanotubes, and bio-based elastomers, which offer potential improvements in fatigue life and environmental sustainability.
Addressing these limitations will not only strengthen the engineering applicability of the LightGBM–CH framework for elastic wheels but also provide a more comprehensive pathway for the intelligent design and optimization of complex mechanical systems operating in challenging environments.

Author Contributions

Conceptualization, X.Y. and L.F.; methodology, X.Y.; investigation, X.Y. and D.W.; data curation, X.Y. and M.S.; writing—original draft, X.Y. and L.F. All authors have read and agreed to the published version of the manuscript.

Funding

The research leading to these results received funding from the National Natural Science Foundation of China (Grant No. 62103184) and the Jiangsu Province Science and Technology Plan (Grant No. BZ2024057).

Data Availability Statement

All data were generated during the experimental research process.

Conflicts of Interest

The authors declare no conflicts of interest.

References

  1. Wang, K.; Yuan, B.F.; Zhu, J.Z.; Jin, J.F.; Ni, W.C.; Zou, M. Review on High-performance Wheels in Planetary Rovers. Manned Spacefl. 2022, 28, 392–401. [Google Scholar] [CrossRef]
  2. Sharma, S.K.; Sharma, R.C.; Choi, Y.; Lee, J. Experimental and Mathematical Study of Flexible–Rigid Rail Vehicle Riding Comfort and Safety. Appl. Sci. 2023, 13, 5252. [Google Scholar] [CrossRef]
  3. Wang, Z.; Yang, H.; Ding, L.; Yuan, B.; Lv, F.; Gao, H.; Deng, Z. Wheels’ performance of Mars exploration rovers: Experimental study from the perspective of terramechanics and structural mechanics. J. Terramech. 2020, 92, 23–42. [Google Scholar] [CrossRef]
  4. Dong, X.J. Research on Design and Passa Bility of Soil-Plowing Wheel Facing Deformable Terrain. Master’s Thesis, Jilin University, Changchun, China, 2024. [Google Scholar]
  5. Tang, S.; Gu, J.; Tang, K.; Zou, R.; Sun, X.; Uddin, S. A Fault-Signal-Based Generalizing Remaining Useful Life Prognostics Method for Wheel Hub Bearings. Appl. Sci. 2019, 9, 1080. [Google Scholar] [CrossRef]
  6. Xiao, Z. Structural Strength Analysis and Durability Study of Mechanical Elastic Safety Wheel. Ph.D. Thesis, Nanjing University of Aeronautics and Astronautics, Nanjing, China, 2019. [Google Scholar]
  7. Tang, S.Y.; Gao, X.R.; Peng, J.P.; Zhang, X. Research on dynamic induction thermography defect detection for wheel treads. Chin. J. Instrum. Meas. 2022, 43, 163–170. [Google Scholar] [CrossRef]
  8. Huang, X.Q.; Chen, G.; Liu, Z.; Xiao, F.; Pan, S.L.; Zou, Q.; Gao, W. Stress Analysis and Multi-Axial Fatigue Evaluation of Resilient Wheel. Mech. Strength 2022, 44, 1232–1237. [Google Scholar] [CrossRef]
  9. Zou, M.; Zhu, J.; Wang, K.; Lin, Y.; Jin, J.; He, L.; Qi, Y. Design and mechanical behavior evaluation of flexible metal wheel for crewed lunar rover. Acta Astronaut. 2020, 176, 69–76. [Google Scholar] [CrossRef]
  10. Guo, X.B.; Zheng, Z.M.; Zang, M.Y.; Chen, S. A multi-sphere DE-FE method for traveling analysis of an off-road pneumatic tire on irregular gravel terrain. Eng. Anal. Bound. Elem. 2022, 139, 293–312. [Google Scholar] [CrossRef]
  11. Lu, Y.; Feng, C.; Cheng, P.D.; Zhang, Y.M. CDEM-DEM analysis of the coupled wheel-ground dynamics behavior. Opt. Precis. Eng. 2023, 31, 746–756. [Google Scholar] [CrossRef]
  12. Zeng, H.Y.; Xu, W.; Zang, M.Y.; Yang, P. Calibration of DEM-FEM model parameters for traction performance analysis of an off-road tire on gravel terrain. Powder Technol. 2020, 362, 350–361. [Google Scholar] [CrossRef]
  13. Wang, G.; Li, X.; Jing, Z.; Wang, X.; Zhang, Y. Improvement in and Validation of the Physical Model of an Intelligent Tire Considering the Wear. Sensors 2025, 25, 2490. [Google Scholar] [CrossRef] [PubMed]
  14. Yan, Y.P. Bionic Optimization and Endurance Experiments of Wheels for Mars Rovers. Master’s Thesis, Jilin University, Changchun, China, 2018. [Google Scholar]
  15. Cao, X.; Cheng, S.; Ma, Q.; Lin, K. Structural Performance Assessment Method for the Entire Service Life Cycle of Telescopic Cranes Based on Digital Twins. Appl. Sci. 2025, 15, 10121. [Google Scholar] [CrossRef]
  16. Li, W.J.; Wang, Z.G. Improved LightGBM soil pollution prediction model based on mixed strategy. Electron. Meas. Technol. 2023, 46, 10–15. [Google Scholar] [CrossRef]
  17. Guo, M.; Zhang, H. Remaining useful life prediction method of lithium-ion battery in multiple time-varying states based on an improved Bi-LSTM network. Int. J. Electron. Meas. Technol. 2023, 42, 59–68. [Google Scholar] [CrossRef]
  18. Chang, J.K.; Lv, N.; Zhan, Y.D. Prediction of PEMFC remaining life based on XGBoost-RFECValgorithm and LSTM neural network. J. Electron. Meas. Instrum. 2022, 36, 126–133. [Google Scholar] [CrossRef]
  19. Zhu, Y.L.; Ma, Z.; Chen, S.R.; Traore, S.N.; Li, Y.M.; Jiang, S. Study on BPNN prediction of variable amplitude anti-blocking screening performance: Based on EDEM—RecurDyn simulation. Chin. J. Agric. Mech. Chem. 2022, 43, 75–80. [Google Scholar] [CrossRef]
  20. Kang, Q.Z.; Xue, P.; Lu, X. Remain Useful Life prediction method of aircraft engine based on PLSR-iTransfoemer. J. Beijing Univ. Aeronaut. Astronaut. 2026, 1–14. [Google Scholar] [CrossRef]
  21. Brittan, Y.B. Reconfigurable Wheels: Re-Inventing the Wheel for the Next Generation of Planetary Rovers. Master’s Thesis, Massachusetts Institute of Technology, Cambridge, MA, USA, 2018. [Google Scholar]
  22. Favaedi, Y.; Pechev, A.; Scharringhausen, M.; Richter, L. Prediction of tractive response for flexible wheels with application to planetary rovers. J. Terramech. 2011, 48, 199–213. [Google Scholar] [CrossRef]
  23. Schilling, P.; Shih, R.H. Parametric Modeling with SOLIDWORKS 2025; SDC Publications: Ulaanbaatar, Mongolia, 2025. [Google Scholar]
  24. Cundall, P.A.; Strack, O.D.L. A discrete numerical model for granular assemblies. Géotechnique 1979, 29, 47–65. [Google Scholar] [CrossRef]
  25. Kotrocz, K.; Kerenyi, G. Numerical Discrete Element Simulation of Soil Direct Shear Test. In Proceedings of the 31st European Conference on Modelling and Simulation (ECMS), Budapest, Hungary, 23–26 May 2017; pp. 510–515. [Google Scholar]
  26. Pang, J.; Lin, X.J.; Chen, S.T.; Geng, L.X.; Zhou, H.; Jin, X. Study on Measurement and Calibration Methods of Soil Parameters Used in Discrete Element Method. Anhui Agric. Sci. 2023, 51, 6–11. [Google Scholar] [CrossRef]
  27. Michael, M.; Vogel, F.; Peters, B. DEM–FEM coupling simulations of the interactions between a tire tread and granular terrain. Comput. Methods Appl. Mech. Eng. 2015, 289, 227–248. [Google Scholar] [CrossRef]
  28. Shi, H.; Klaassen, P.; Schott, D.L.; Jovanova, J. Reinventing the wheel: A simulation-aided design of a soft, shape-adapting, lugged wheel for locomotion on sandy terrains. Front. Robot. AI 2025, 12, 1686519. [Google Scholar] [CrossRef]
  29. Yan, Z.Q.; Sun, L.L.; Xiao, J.H.; Wang, Y.Z.; Liu, B.T.; Cui, S.K. Experimental study on mechanical properties of 60Si2Mn spring steel for railway fastener clips. J. Railw. Sci. Eng. 2023, 20, 127–135. [Google Scholar] [CrossRef]
  30. Press, W.H.; Teukolsky, S.A.; Vetterling, W.T.; Flannery, B.P. Numerical Recipes: The Art of Scientific Computing, 3rd ed.; Cambridge University Press: Cambridge, UK, 2007. [Google Scholar]
  31. Stephens, R.I.; Fatemi, A.; Stephens, R.R.; Fuchs, H.O. Metal Fatigue in Engineering, 2nd ed.; John Wiley & Sons: New York, NY, USA, 2000. [Google Scholar]
Figure 1. Three-dimensional model of an elastic wheel.
Applsci 16 02329 g001
Figure 2. Schematic diagram of an elastic wheel model illustrating the strain-displacement relationship. The wheel is idealized as a thin elastic ring with mean radius R and thickness t , subjected to radial displacement u and tangential displacement v . Mass m is uniformly distributed along the circumference, and I m o m e n t represents the mass moment of inertia. Infinitesimal increments d r and d θ describe local deformation kinematics (adapted from reviewer’s personal communication).
Applsci 16 02329 g002
Figure 3. EDEM-RecurDyn bidirectional coupled simulation.
Applsci 16 02329 g003
Figure 4. Fatigue life calculation procedure.
Applsci 16 02329 g004
Figure 5. LightGBM-CH fatigue life prediction method.
Applsci 16 02329 g005
Figure 6. Simulation sequence of elastic wheel linear motion on soft ground showing wheel–soil interaction at different time steps:(a) 0.075 s; (b) 0.766 s; (c) 3.065 s; (d) 3.919 s; (e) 6.242 s.
Applsci 16 02329 g006
Figure 7. (A) Three-dimensional force–time history curve for elastic wheel; (B) three-dimensional torque–time history curve for elastic wheel.
Applsci 16 02329 g007
Figure 8. Stress–time history data at the point of maximum stress in elastic wheel.
Applsci 16 02329 g008
Figure 9. Rainflow count chart.
Applsci 16 02329 g009
Figure 10. Point of maximum damage to elastic wheel during multiple simulations.
Applsci 16 02329 g010
Figure 11. LightGBM–CH model performance: (a) regression curve showing predicted vs. actual fatigue life on training set and test set. (b) Comparison of actual and predicted fatigue life values for all 40 samples (training and test sets combined).
Applsci 16 02329 g011
Figure 12. Contribution distribution of the top 20 most important features.
Applsci 16 02329 g012
Table 1. Key parameters of the soil discrete element model.
Parameter TypeParameter NameValue
Basic Parameters of Soil ParticlesParticle size3 mm
Solid density2500 kg/m3
Modulus of elasticity1.923 MPa
Poisson’s ratio0.3
Shear modulus5 MPa
Inter-Particle Contact ParametersCoefficient of restitution0.28
Static coefficient of friction0.49
Dynamic coefficient of friction0.24
Surface energy0.04 J/m2
Soil–Wheel Contact ParametersCoefficient of restitution0.59
Static coefficient of friction0.67
Dynamic coefficient of friction0.13
Note: All parameters calibrated for sandy loam soil based on reference [26].
Table 2. Comparative analysis of the comprehensive performance of four predictive models.
Model R 2 MAERMSE
RF0.7590790.821069.22
SVM0.641411.71520.97
LightGBM0.8202239.44248.35
LightGBM-CH0.925158.8967.06
Table 3. Feature grouping based on physical meaning.
Component IDComponent NameNumber of FeaturesDescription
C1Force_Basic_Stats60Basic statistical features of six-dimensional forces/torques
C2Resultant_Force8Resultant force and torque magnitudes
C3Force_Correlation8Correlation features among force/torque channels
C4Stress_Basic5Basic statistical features of stress time history
C5Stress_Quantiles7Quantile features of stress distribution
C6Stress_Fatigue13Fatigue-critical parameters (stress amplitude, mean stress, stress ratio, etc.)
C7Stress_SkewKurt2Skewness and kurtosis of stress distribution
C8Force_Stress_Interaction17Load–stress coupling features (dynamic stress concentration factor, critical phase load vector, cross-correlation)
Table 4. The results of the forward incremental addition computational experiment.
Component AddedCumulative FeaturesR2 (CV Mean)RMSEMAEΔR2
C1: Force_Basic_Stats60−0.322256.66207.61—(baseline)
+C2: Resultant_Force68−0.364259.91210.79−0.042
+C3: Force_Correlation76−0.364259.91210.790.000
+C4: Stress_Basic81−0.351257.77208.52+0.013
+C5: Stress_Quantiles88−0.351257.76208.490.000
+C6: Stress_Fatigue101−0.328255.71208.57+0.023
+C7: Stress_SkewKurt103−0.393260.91212.12−0.066
+C8: Force_Stress_Interaction120−0.236244.21198.94+0.157
Table 5. The results of the leave-one-component-out computational experiment.
Removed ComponentRemaining FeaturesR2 (CV Mean)R2 Loss
C1: Force_Basic_Stats60−0.184−0.052
C2: Resultant_Force112−0.2870.051
C3: Force_Correlation112−0.2360.000
C4: Stress_Basic115−0.225−0.011
C5: Stress_Quantiles113−0.234−0.002
C6: Stress_Fatigue107−0.2700.035
C7: Stress_SkewKurt118−0.2480.012
C8: Force_Stress_Interaction103−0.3930.157
Disclaimer/Publisher’s Note: The statements, opinions and data contained in all publications are solely those of the individual author(s) and contributor(s) and not of MDPI and/or the editor(s). MDPI and/or the editor(s) disclaim responsibility for any injury to people or property resulting from any ideas, methods, instructions or products referred to in the content.