Article

Study on Residual Subsidence Prediction of Goaf in Steeply Inclined Multi-Seam Based on Simulation Analysis


1
Key Laboratory of CBM Resources and Reservoir Formation Process, Ministry of Education (China University of Mining and Technology), Xuzhou 221008, China
2
Xuzhou China Mining Geotechnical Technology Co., Ltd., Xuzhou 221114, China
3
School of Resources and Geosciences, China University of Mining and Technology, Xuzhou 221116, China
*
Author to whom correspondence should be addressed.
Appl. Sci. 2026, 16(5), 2328; https://doi.org/10.3390/app16052328
Submission received: 26 January 2026 / Revised: 23 February 2026 / Accepted: 23 February 2026 / Published: 27 February 2026
(This article belongs to the Section Earth Sciences)

Abstract

Particle Flow Code (PFC) numerical simulations were adopted to simulate the mining process and the process of goaf collapse and to predict the residual subsidence of abandoned goafs in steeply inclined multi-seam coal mines, taking the No. 101 Coal Mine in the Xishan Mining Area of Urumqi, China, as an example. Scaled physical simulations were also employed to simulate the evolution of voids in the coal–rock mixture in the goaf. The results show that after mining, the roof of shallow coal seams becomes unstable and collapses in the anti-dip direction, causing the materials within the unconsolidated layer to fall and backfill the goaf, which further leads to ground subsidence. The mining of deep coal seams is also accompanied by the overall movement of overlying strata along the dip direction of the coal seams and surface subsidence. The content of voids within the broken coal–rock mass in the goaf tends to decrease with increasing pressure, showing a negative exponential correlation. Based on the observed relationship between displacement and void content obtained from the simulation experiments, it is inferred that the residual displacement under the current conditions of the study area accounts for approximately 10.5% of the total displacement. Combining the results of the PFC simulation and the evolution law of void content, the residual subsidence of the goaf in the study area since mine closure is predicted to range from 0 to 1 m, with a high-value zone distributed in the northeastern part of the study area. Deep goafs within the B7–B11–12 and B14–B18 coal seam groups mainly contribute to the residual subsidence. The distribution of goaf collapse pits, as revealed by field investigation, also verifies the reliability of the prediction results.

1. Introduction

The problem of goaf stability is prevalent in many abandoned mining areas in China. The overlying strata structures of goafs are diverse, which affects the distribution of residual cavities and voids [1]. In the absence of mining and monitoring data related to goafs, substantial costs are incurred for monitoring to ensure the safety of land resource reuse in these goaf areas [2,3].
In some complex tectonic regions in western and southern China, coal seams occur in a steeply inclined (high-dip angle) manner, and the subsidence and failure characteristics of overlying strata in their goafs differ significantly from those of gently dipping coal seams. Gangue in the goafs of steeply inclined coal seams slides downward along the dip direction for filling, forming an inverted triangular free face in the upper-middle area of the working face [4]. The surrounding rock movement in the goafs exhibits two modes, namely, “extrusion-bend down” and “crush-dumping” [5]. As the overlying strata undergo caving, rotation, sliding, and subsidence, the combination of key blocks can form two distinct configurations—dip accumulation and anti-dip accumulation [6]—eventually developing into a “厂”-shaped moving arch structure [7]. During mining of steeply inclined and closely spaced coal seams, the advance abutment pressure reaches a maximum in the upper-middle part of the working face, and the rib spalling in thick coal seam faces is dominated by shear failure [8,9]. The roof instability mode (under coal pillars and caved deposits) is equivalent to the toppling–sliding composite failure of anti-dip slopes [10]. In addition, the stress environment of goafs in steeply inclined coal seams is more complex, and the stress distribution, deformation, and failure of roadway surrounding rocks exhibit asymmetric characteristics [11]. Discrete numerical simulation methods have aptly demonstrated the movement and deformation characteristics of overlying strata in goafs of steeply inclined coal seams [12,13]. The above is a summary of the overlying rock failure mechanism in the goaf of steeply inclined coal seams.
Previous researchers have adopted various methods to investigate the surface subsidence of goafs in steeply inclined coal seams. Some scholars established a roof fracture mechanics model based on the small-deformation theory of elastic thin plates, deriving the roof deformation equation and realizing the calculation of goaf width [14]. The traditional probability integral model is still applied. By introducing a variable mining influence propagation angle to characterize the movement of overlying strata in goafs, modified parameters are adopted to establish a surface subsidence prediction model [15]. Some scholars have employed FLAC3D to simulate surface subsidence under different mining sequences, determining the optimal mining sequence [16]. Studies based on 3DEC (Discrete Element Code for 3D) numerical simulations have shown that cavities in the overlying strata of goafs in steeply inclined coal seams propagate upward along the dip direction following a parabolic trajectory, and the resulting surface subsidence exhibits an asymmetric pattern [17]. Research on goafs in nearly vertical extra-thick coal seams using PFC (Particle Flow Code) discrete numerical simulation has indicated that with the progression of slicing mining, the overlying strata collapse gradually, initially forming a “U”-shaped subsidence zone and eventually evolving into a “V”-shaped collapse morphology [18]. PFC-based studies on goafs in steeply inclined and multi-seam coal seams have revealed that surface subsidence presents an asymmetric “W”-shape in the profile view and manifests as an asymmetric subsidence basin with zonal distribution in the plan view [19]. When predicting goaf surface deformation, analytical solutions can only estimate certain surface subsidence parameters, but cannot predict the overall surface subsidence above the goaf. In contrast, numerical simulation methods can obtain surface subsidence data above the goaf through two- or three-dimensional mining simulations. However, in previous numerical simulations, mining-induced subsidence was often assumed to occur instantaneously. In reality, the caving and compaction of the goaf are long-term processes; thus, surface subsidence will continue for a considerable period of time. Current simulation studies have not adequately addressed this issue.
Among popular numerical simulation methods, both the Finite Element Method (FEM) and the Finite Difference Method (FDM) are applicable to continuous media. In these methods, it is assumed that the material is continuous, and they do not allow fracture, separation, or large dislocations. Although FLAC (a type of FDM) has been applied to mining simulations, most studies only determined stress and displacement fields under the condition that the roadway remains undamaged [20]. In contrast, the Discrete Element Method (DEM) is suitable for discontinuous media, where the object is composed of independent elements that can separate, rotate, collide, and break. Therefore, the DEM is more suitable for simulating coal seam mining processes. PFC can effectively simulate the overburden caving and surface subsidence above the goaf through particle rolling and filling [18,19]. In addition, PFC is also flexible in constructing models with undulating ground surfaces and bedrock surfaces.
It is difficult to predict the surface residual subsidence in abandoned mining areas that have been closed for many years due to the passage of time and lack of mining data. Based on numerical simulation and physical simulation methods, combined with the geotechnical engineering investigation results of the study area, we conducted a prediction study on the surface residual subsidence of the No. 101 Coal Mine, Regiment 104 of Xinjiang Production and Construction Corps, located in the Xishan Mining Area of Urumqi, China.

2. Overview of the Study Area

2.1. Geological Background of the Study Area

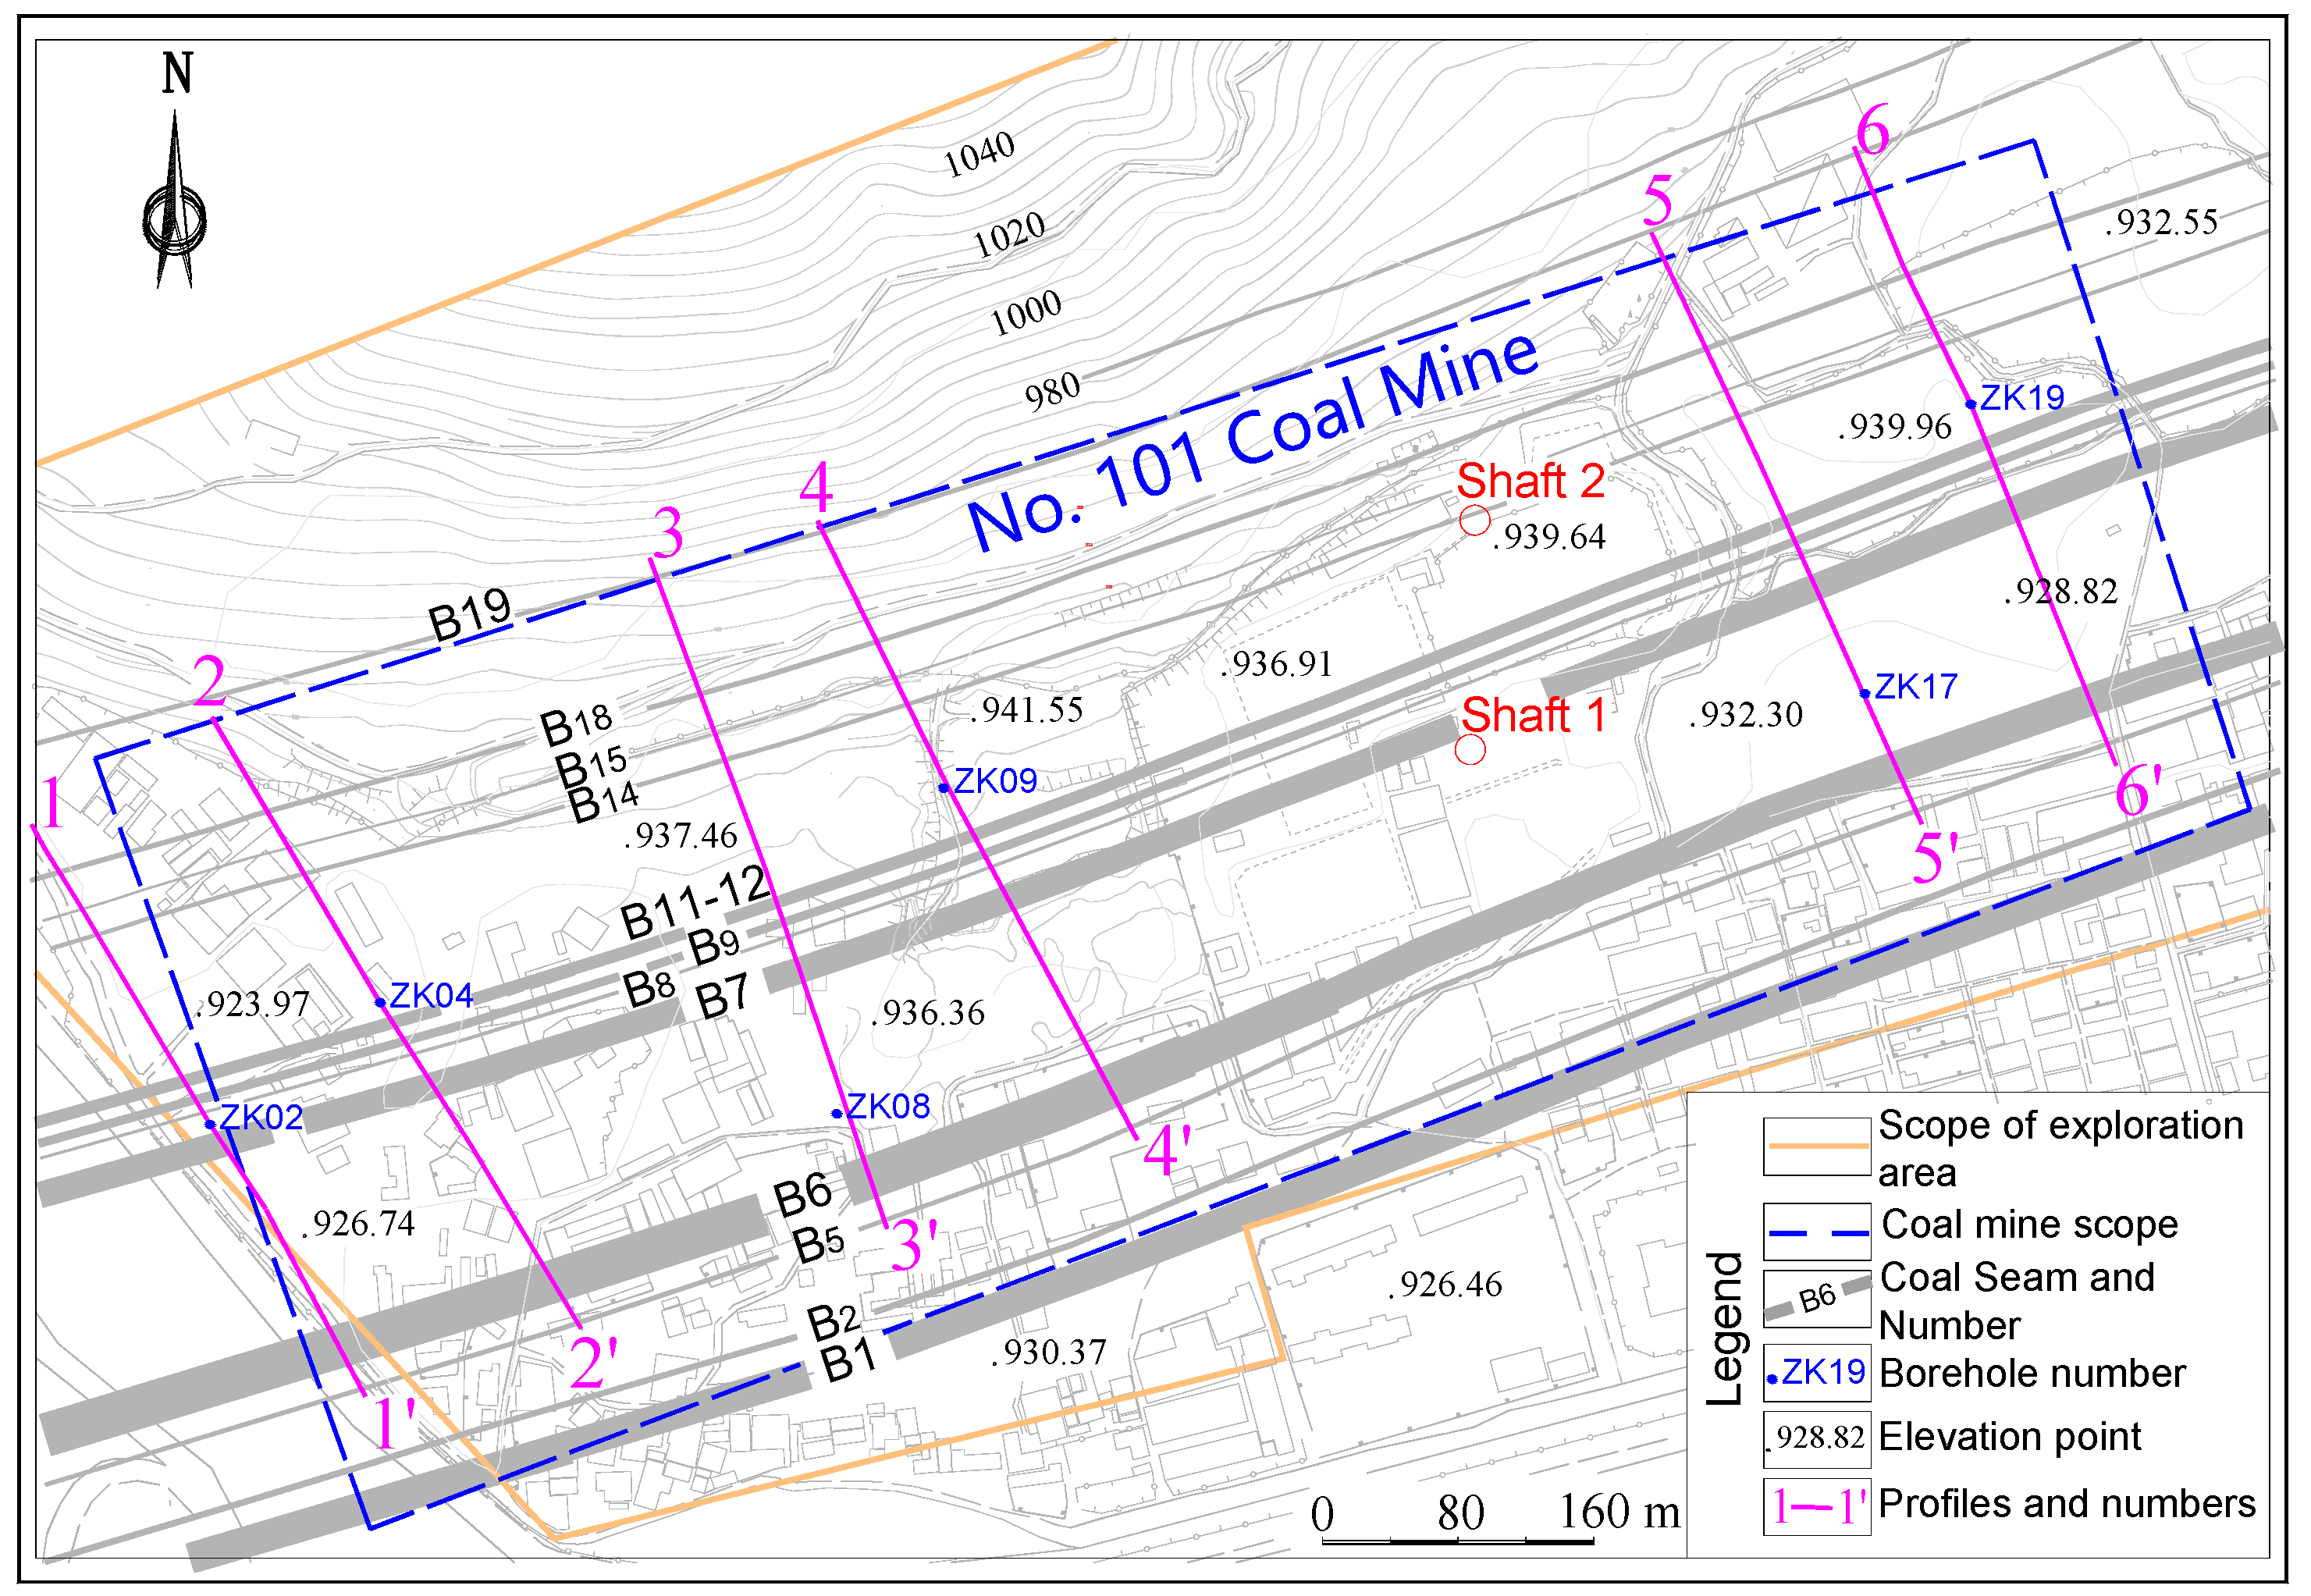
The study area is located in the southwest of Urumqi City, presenting a rectangular shape stretching in the NE–SW direction, with a length of approximately 1.20 km and a width ranging from 0.42 km to 0.48 km. The landform of the study area consists of low mountains and hills characterized by a north–high–south–low topographic trend; the highest point in the north has an elevation of about 1050 m, while the southern surface is relatively flat with an elevation of 920–940 m (Figure 1).
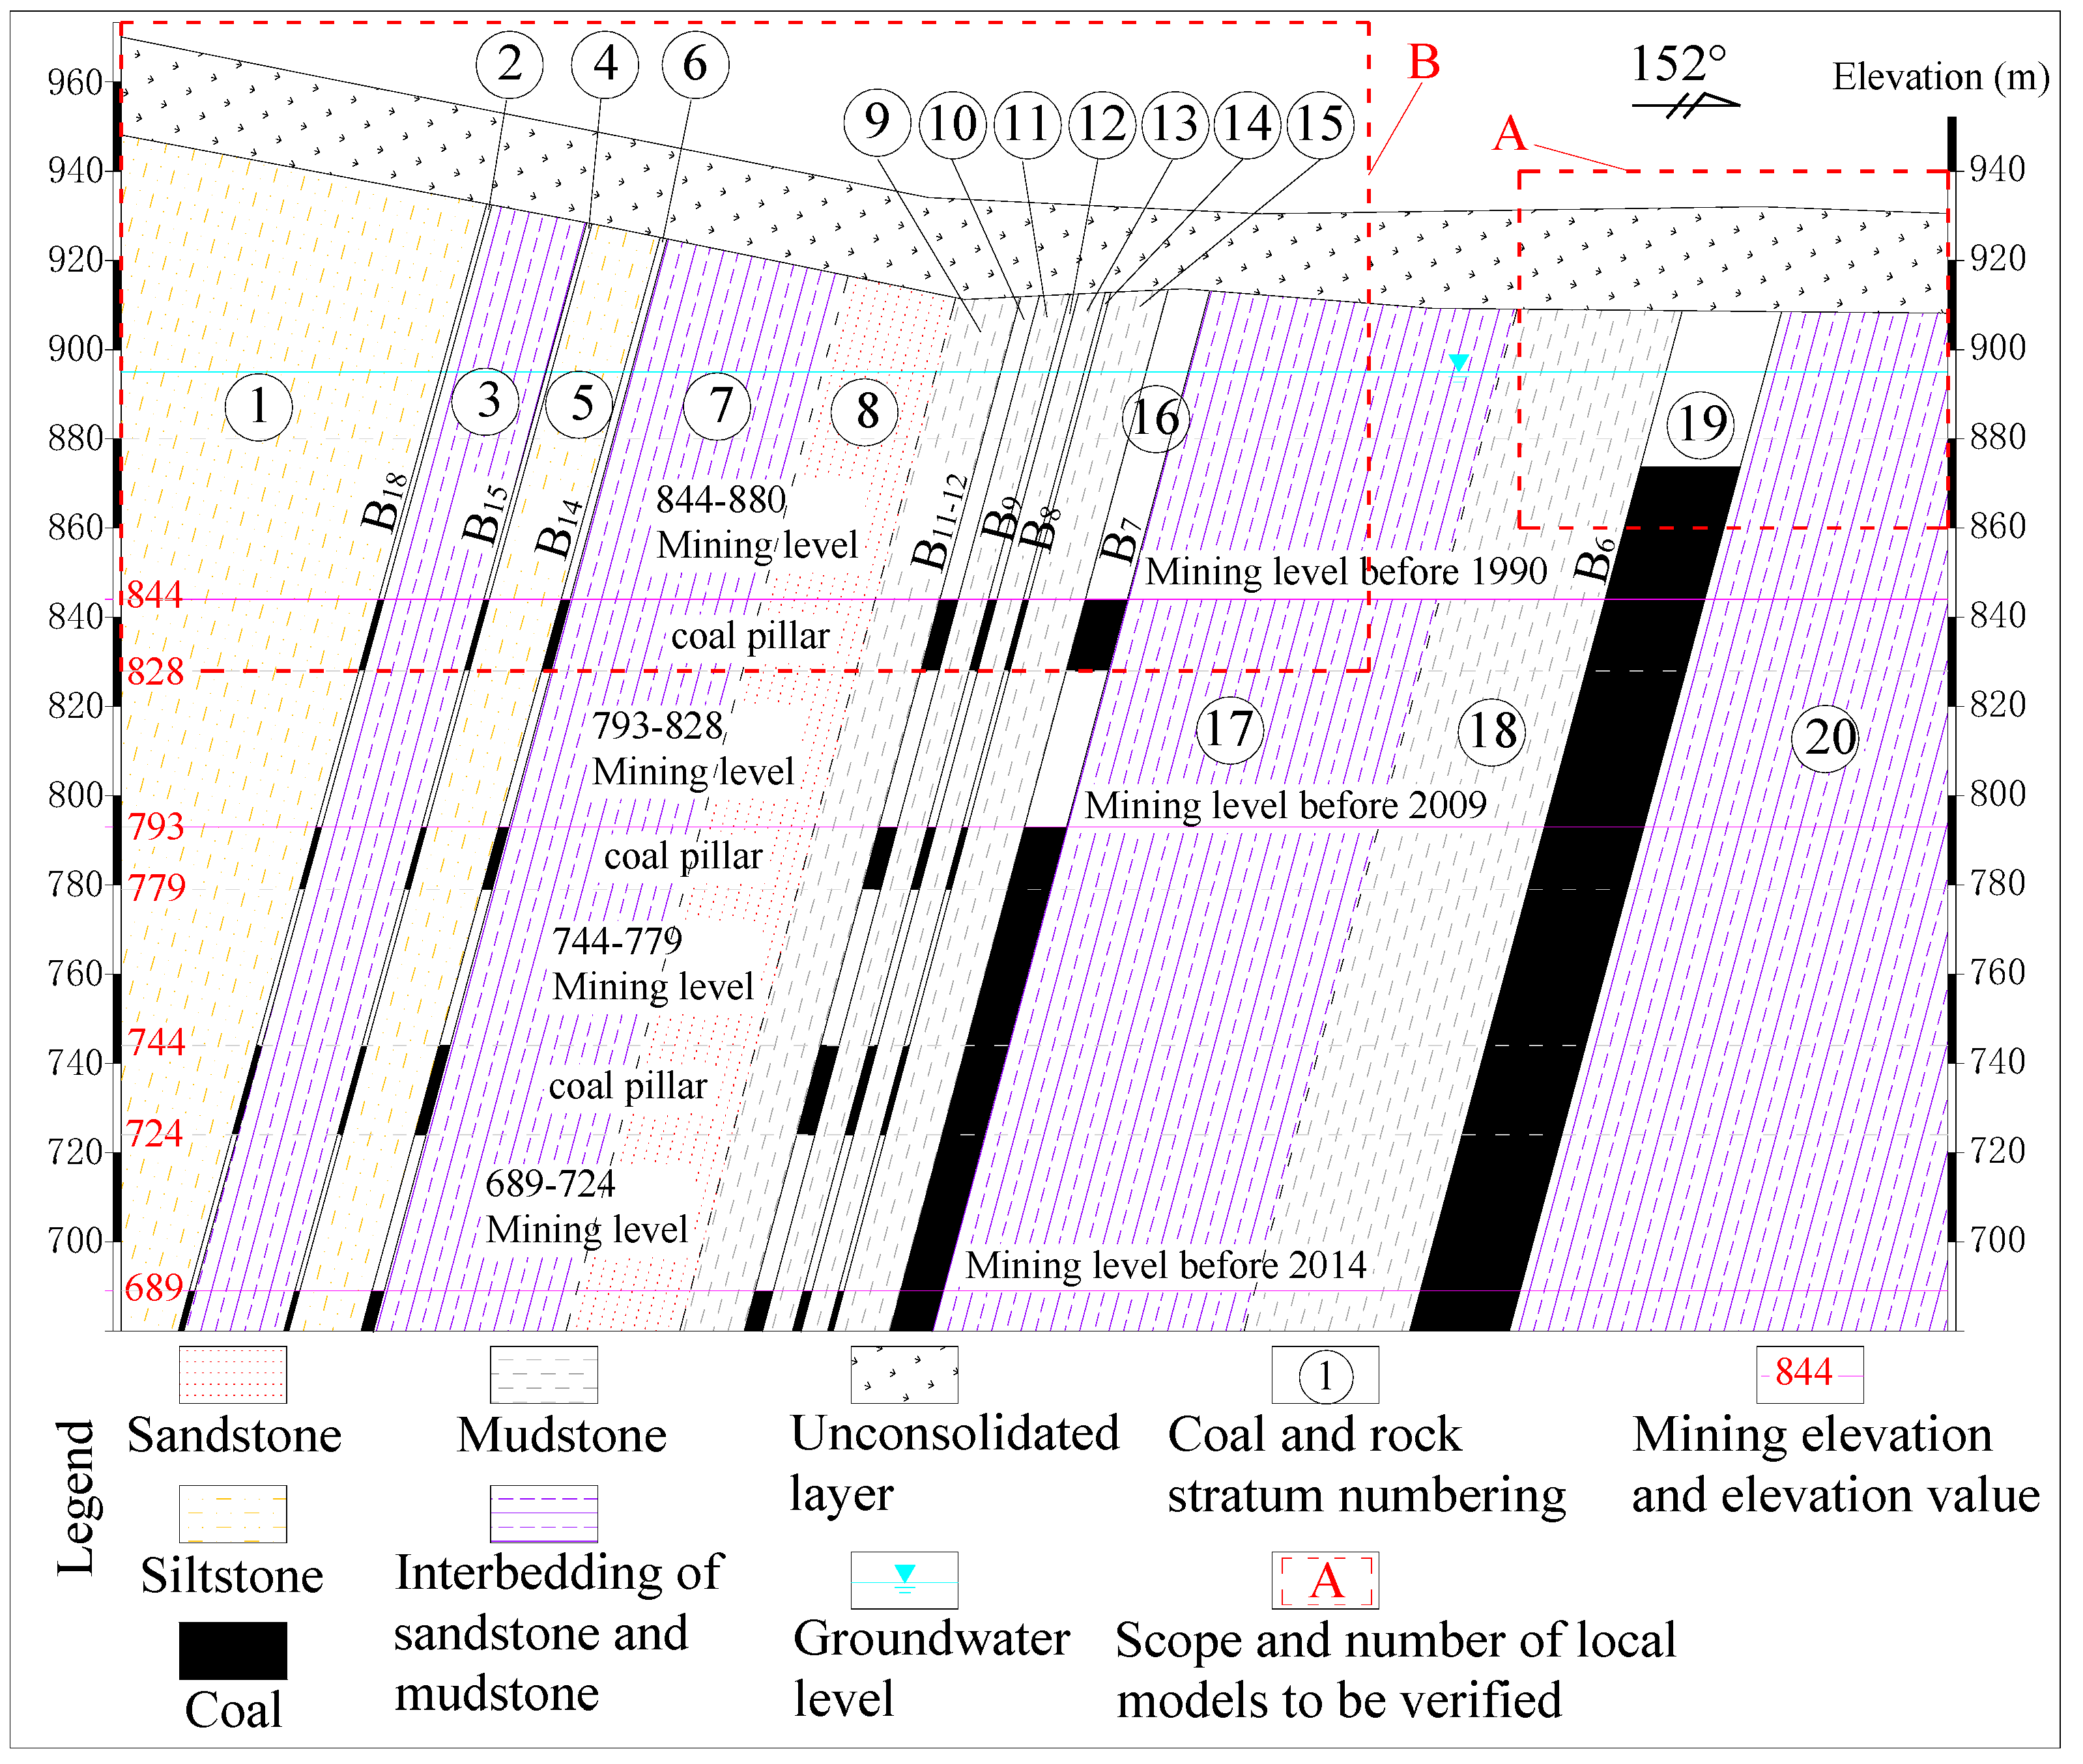
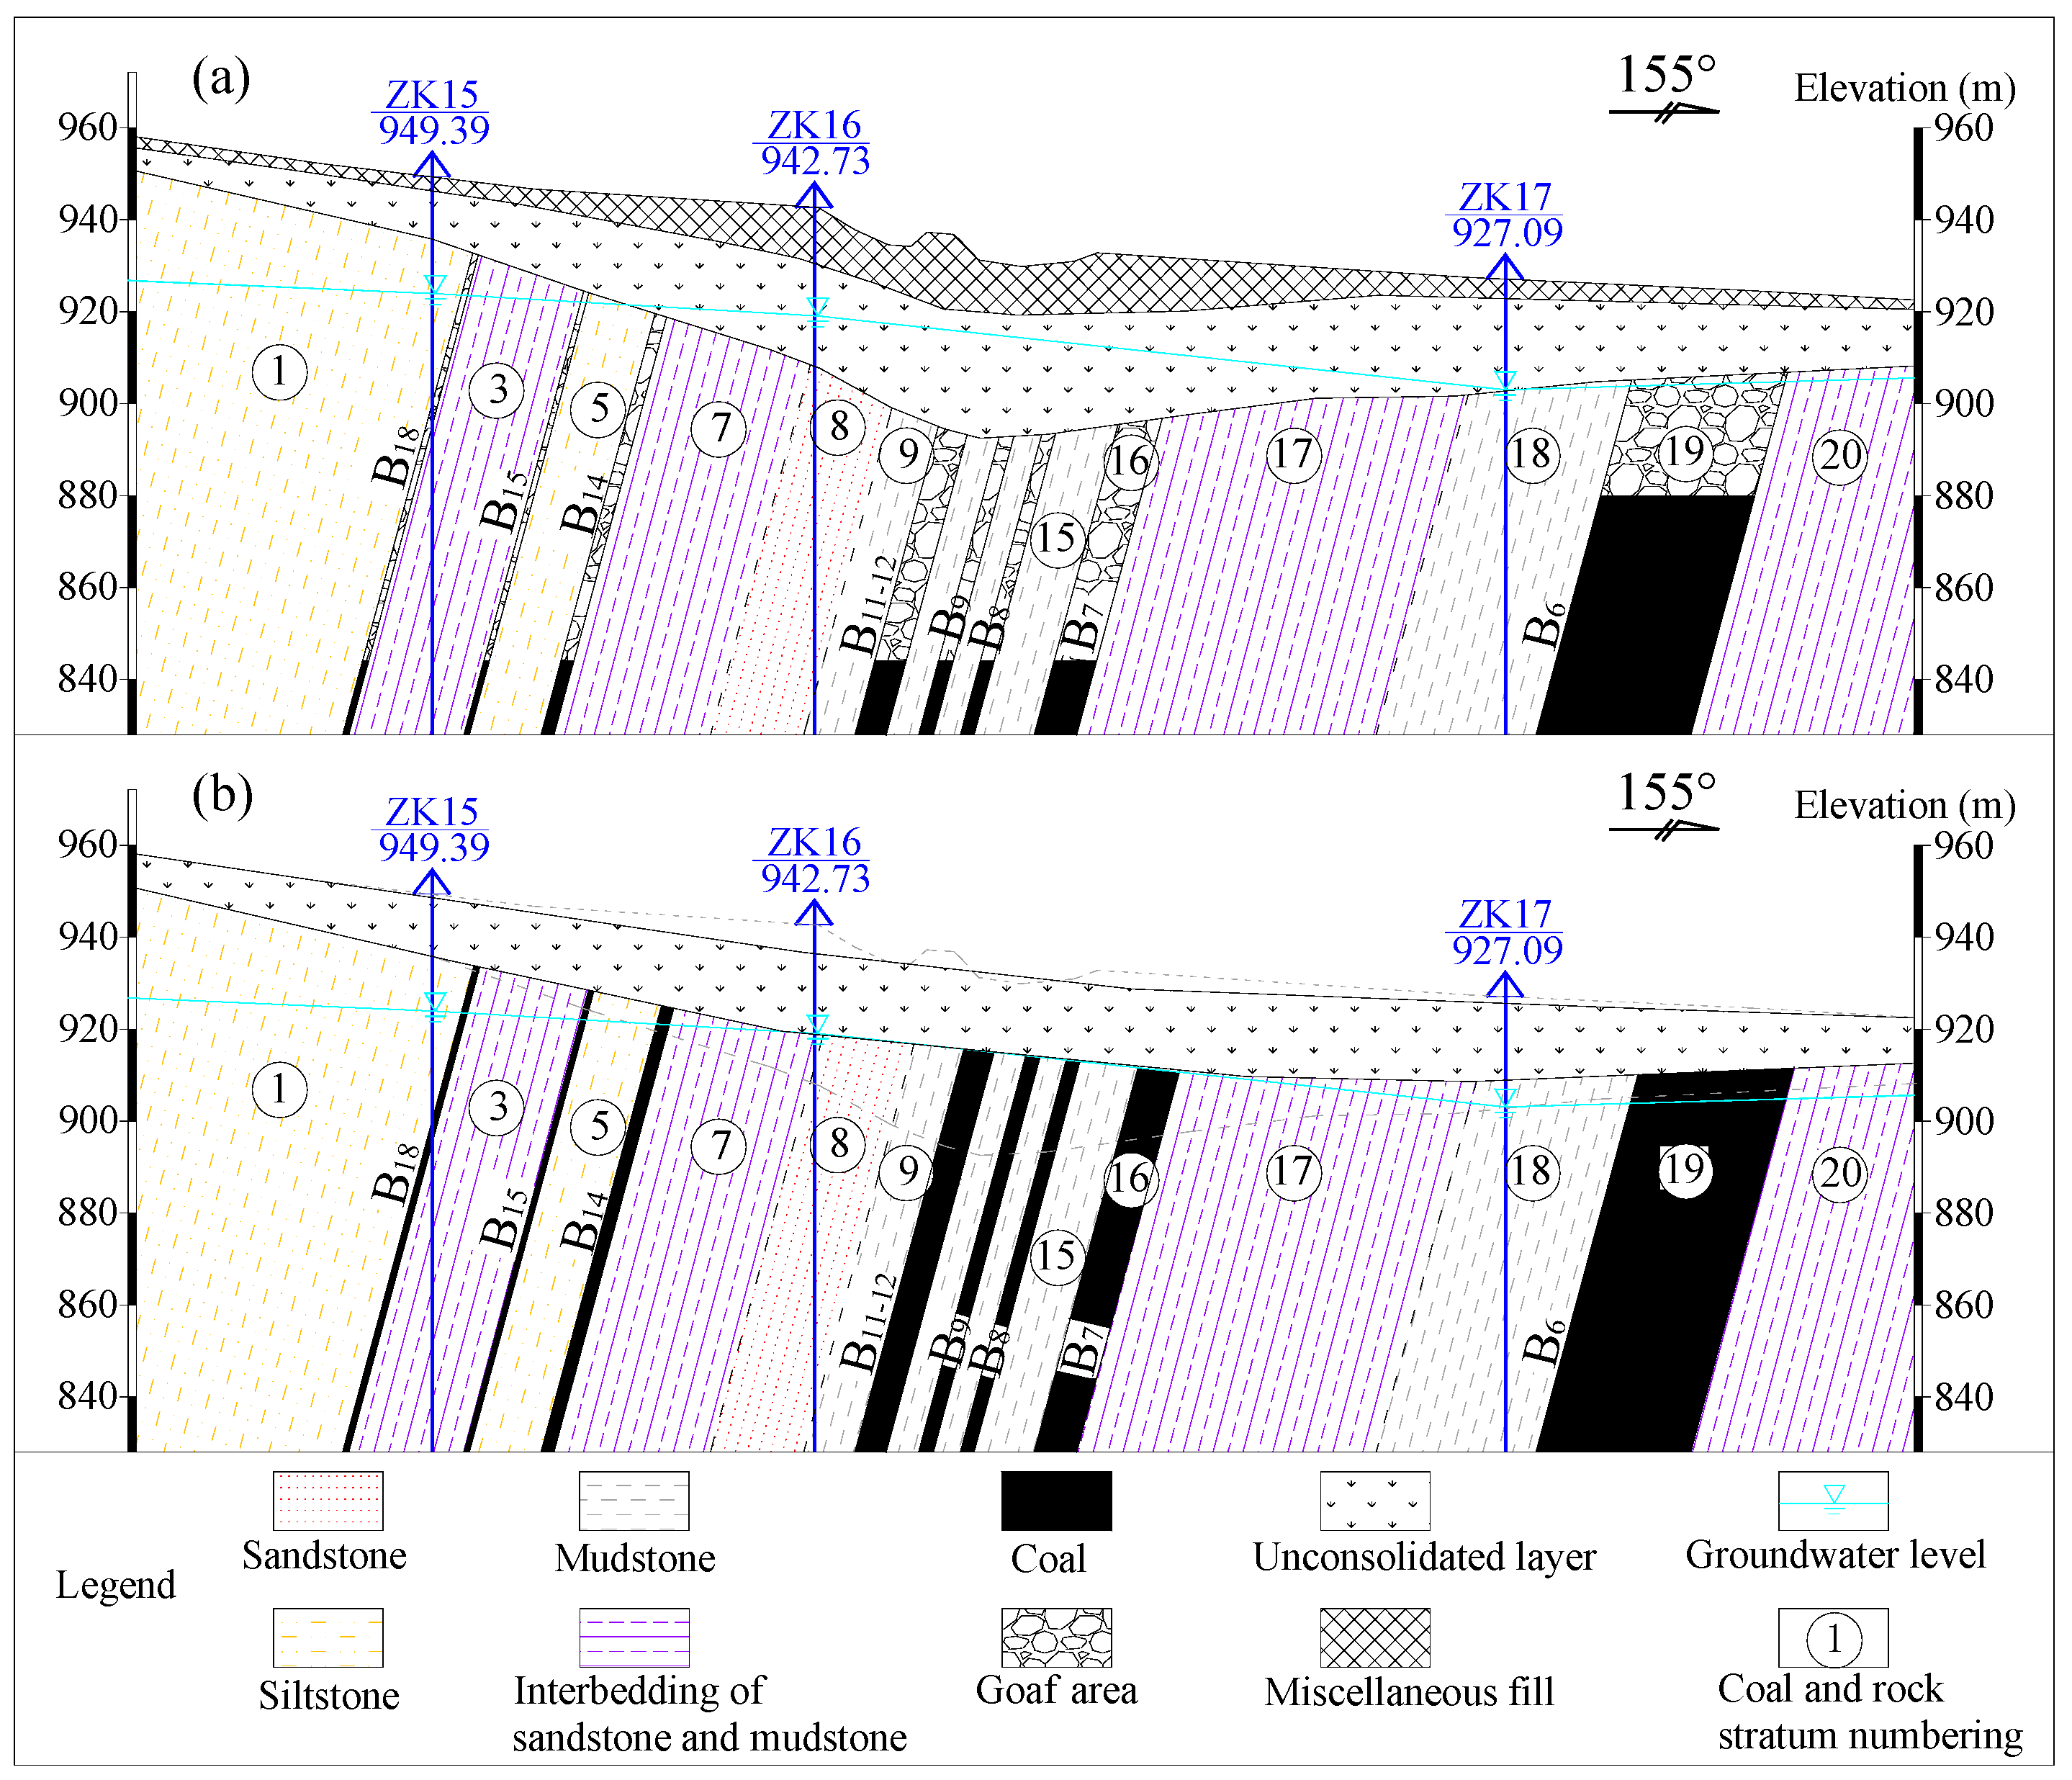
The strata in the study area are part of the Xishanyao Formation of the Middle Jurassic (J2X). According to geotechnical engineering investigation data, the strata in the study area can be divided into 20 horizontal layers. Among them are the following:
  • Layers ① and ⑤ are dominated by siltstone;
  • Layers ③, ⑦, ⑰ and ⑳ are sandstone–mudstone interbeds;
  • Layer ⑧ consists of coarse-, medium- and fine-grained sandstone;
  • Layers ⑨, ⑪, ⑬, ⑮ and ⑱ are mudstone and sandy mudstone;
  • Layers ②, ④, ⑥, ⑩, ⑫, ⑭, ⑯ and ⑲ are coal seams.
The ground surface is covered by Quaternary deposits. According to data from continuous water level monitoring in the shaft near the site, the groundwater level ranges from 894.33 m to 895.35 m throughout the year (Figure 2).

2.2. Overview of Coal Mining

From the early to mid-20th century, the B6, B7, B8, B9, B11–12, and B18 coal seams were mined by small coal pits. Due to the limitations of early mining technology, the mining depth was mostly within 60 m.
The No. 101 Coal Mine was built in 1982, mainly mining the B6, B7, B8, B9, B11–12, B14, B15, and B18 coal seams. The coal seam thickness varied slightly within the mine field; the mining details for each coal seam are listed in Table 1.
Prior to 2009, the shrinkage stoping method was adopted, with a coal recovery rate of approximately 50%. After the technical renovation in 2009, the mining method was changed to pseudo-inclined fully mechanized mining with flexible metal support, with a recovery rate of about 75%. The mine was closed in 2014.
According to the investigation, during the mining period in the study area, with the development of ground subsidence in the goaf, the subsided areas were continuously filled with construction waste and other materials. During geotechnical engineering investigation, the ground subsidence status of the goaf was evaluated based on multi-year satellite image data, but relevant ground observation data were lacking.

3. Research Methods

Since no ground subsidence monitoring was conducted during the mining period in the study area, relevant monitoring data are lacking. Moreover, the subsided areas have been continuously backfilled, the mine has been closed for more than 10 years to date, and mining-related data are also difficult to collect. Therefore, it is challenging to conduct an accurate assessment of the current status of ground subsidence and residual subsidence issues in the study area. With urban development, the study area has been incorporated into construction planning, and it is urgent to carry out research on related issues. Based on the investigation results of goaf subsidence in the study area, it is a feasible scientific method to simulate the mining and ground subsidence processes via numerical simulation and analyze the residual subsidence by integrating the results of physical simulation.
The coal seams in the study area are steeply inclined (high dip), and adjacent mining is conducted on multiple coal seams. The goaf formed by steeply inclined coal seams is significantly different from that of the commonly encountered gently inclined coal seams, and the formation and subsidence mechanisms of such goafs possess unique characteristics. This has particularly manifested in the large-distance caving and compaction of the roof strata. Therefore, the DEM based on the theory of discontinuous mechanics is more suitable.

3.1. Design of the PFC2D Model

3.1.1. Modeling Assumptions of PFC2D

PFC is based on the principles of discontinuum mechanics, with its research objects being granular assemblies of loose and bonded materials. Through the coupling of the macroscopic and mesoscopic mechanical properties of materials, it enables the analysis of the deformation, failure, and flow processes of discrete materials. Generally, the following main assumptions are included in model [21]:
(1)
Particles are uniform rigid bodies that do not deform, break, or compress. All deformation and failure processes are borne by contact and bonding. Particles are simplified as circles, and shape effects such as angularity and interlocking are compensated for through the calibration of mesoscopic parameters.
(2)
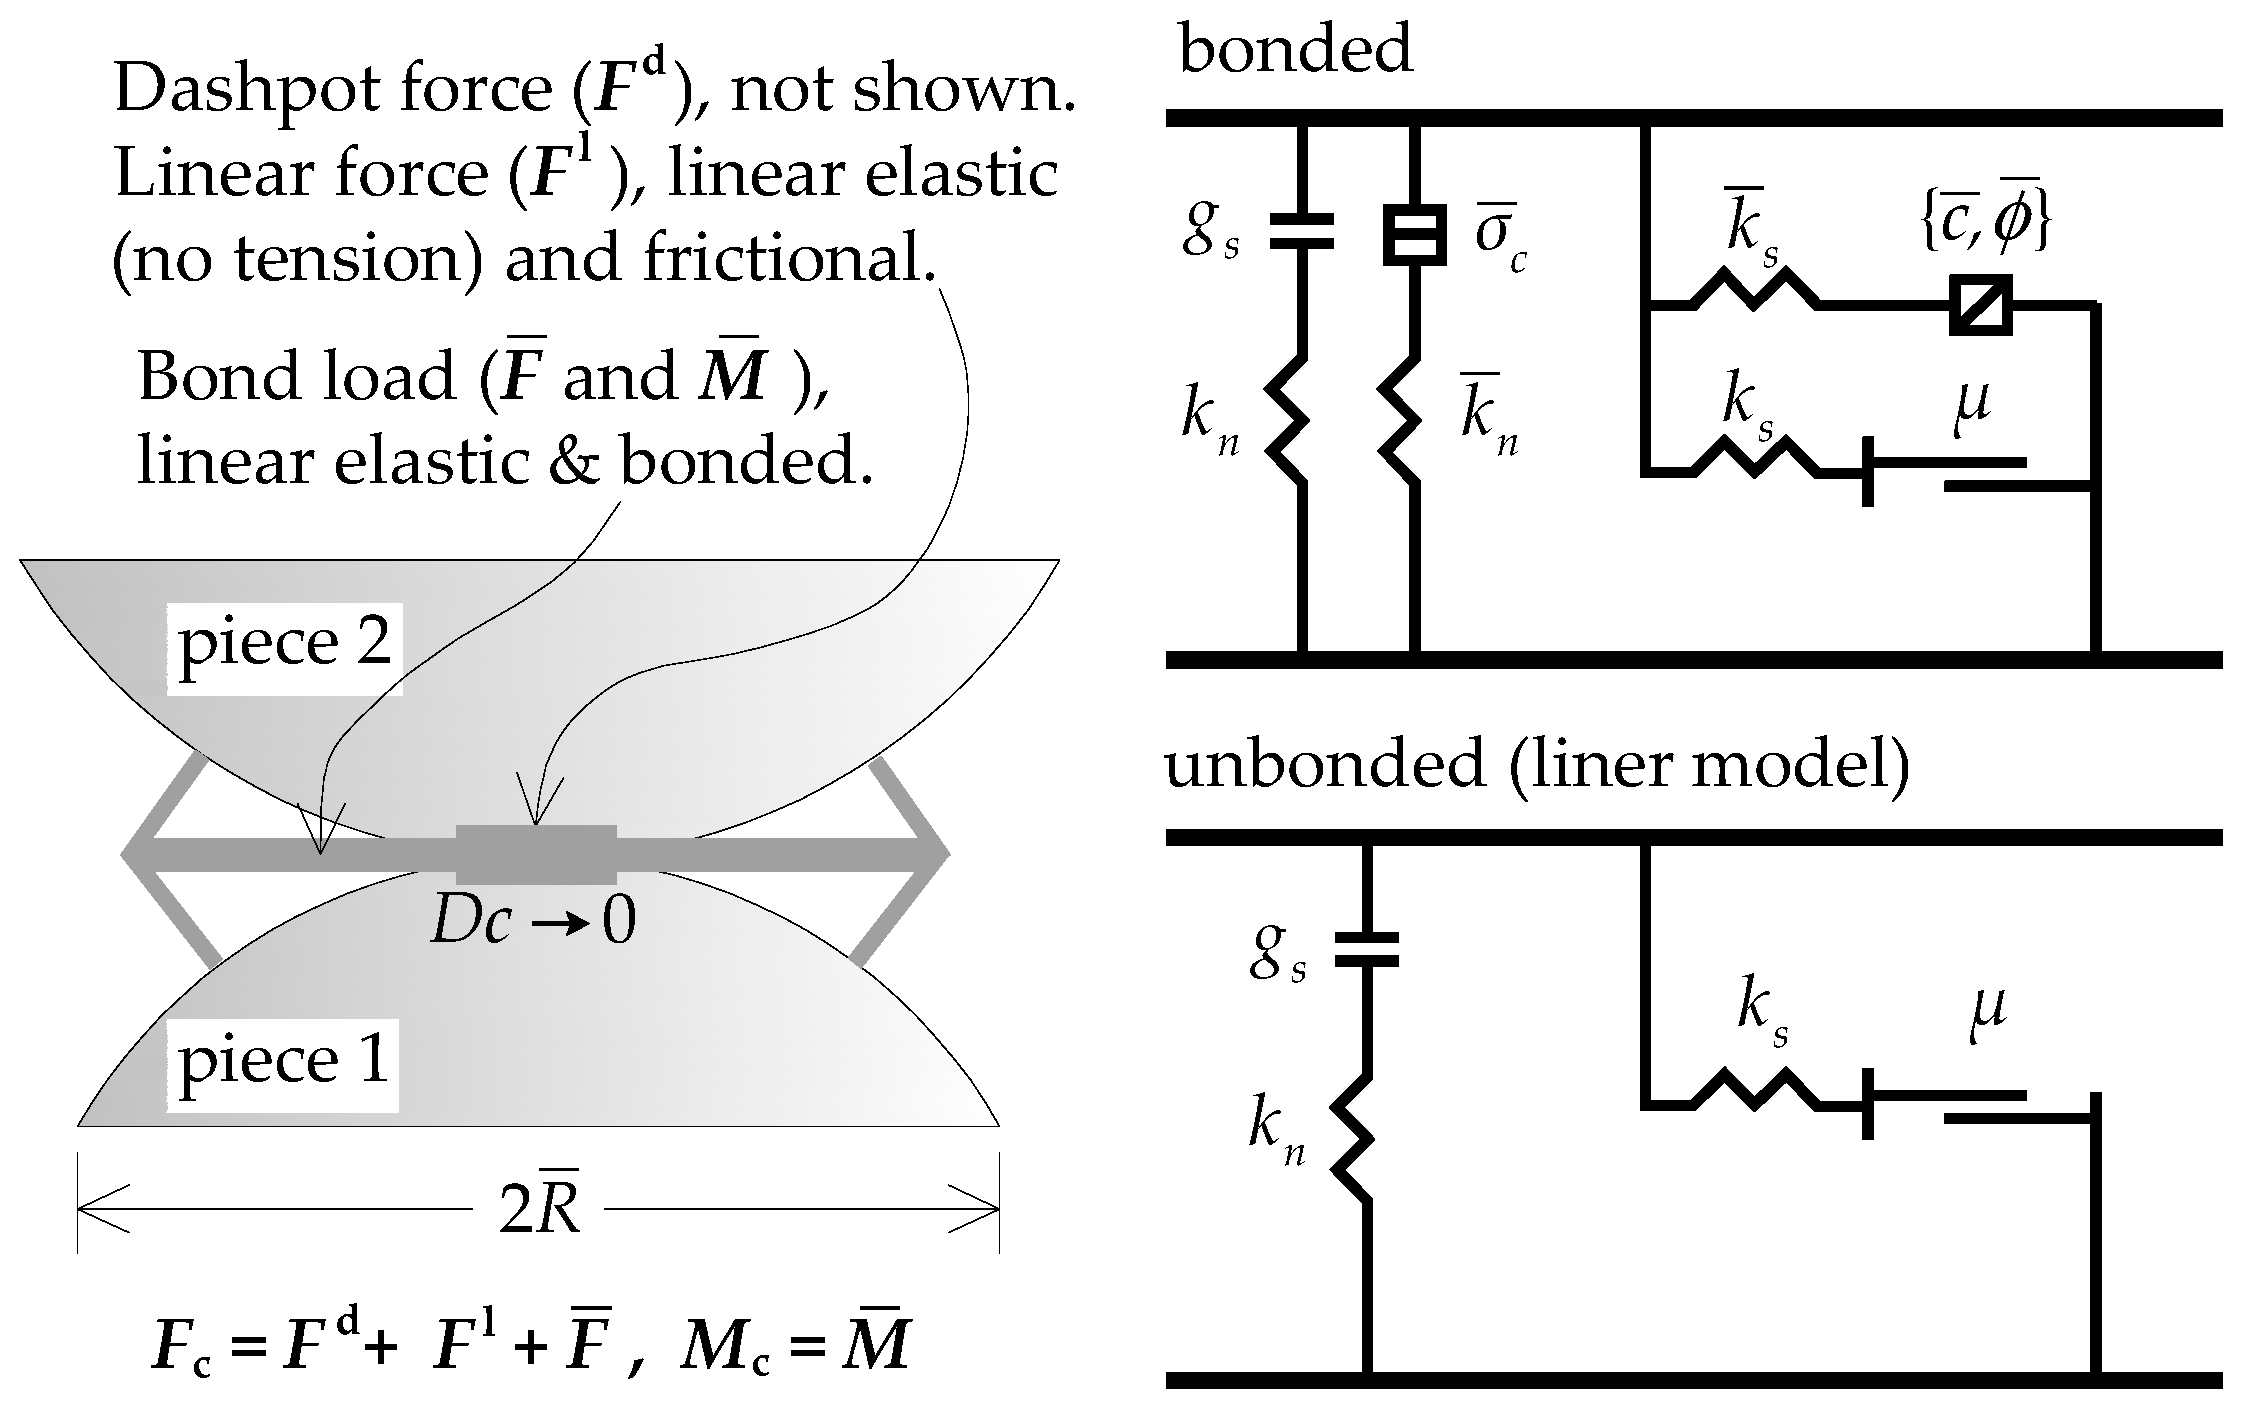
The linear parallel bond model is the most commonly used contact model for simulating brittle materials such as rock in PFC. This model describes the behavior of two interfaces: an infinitesimal, linear elastic (no-tension), and frictional interface that carries a force, and a finite-size, linear elastic, and bonded interface that carries a force and moment (Figure 3). When the tensile stress reaches the normal strength of the parallel bond (i.e., tensile strength), the bond fails in tension (Equation (1)):
σ ¯ > σ c ¯
where σ ¯ is the tensile stress; σ c ¯ is the normal strength of the parallel bond.
If the bond is not subject to tensile failure but reaches the parallel bond tangential strength (i.e., shear strength), then the bond undergoes shear failure (Equation (2)):
τ ¯ = c ¯ σ ¯ tan ϕ ¯ > τ c ¯
where τ ¯ is the shear stress; τ c ¯ is the tangential strength of the parallel bond; c ¯ is the bond cohesion; ϕ ¯ is the bond internal friction angle.
(3)
The wall does not deform or get damaged, has no displacement error, and is regarded as a rigid and smooth boundary. Only the effect of gravity is considered in this study, with no other loads applied.

3.1.2. Establishment of a PFC2D Geological Model

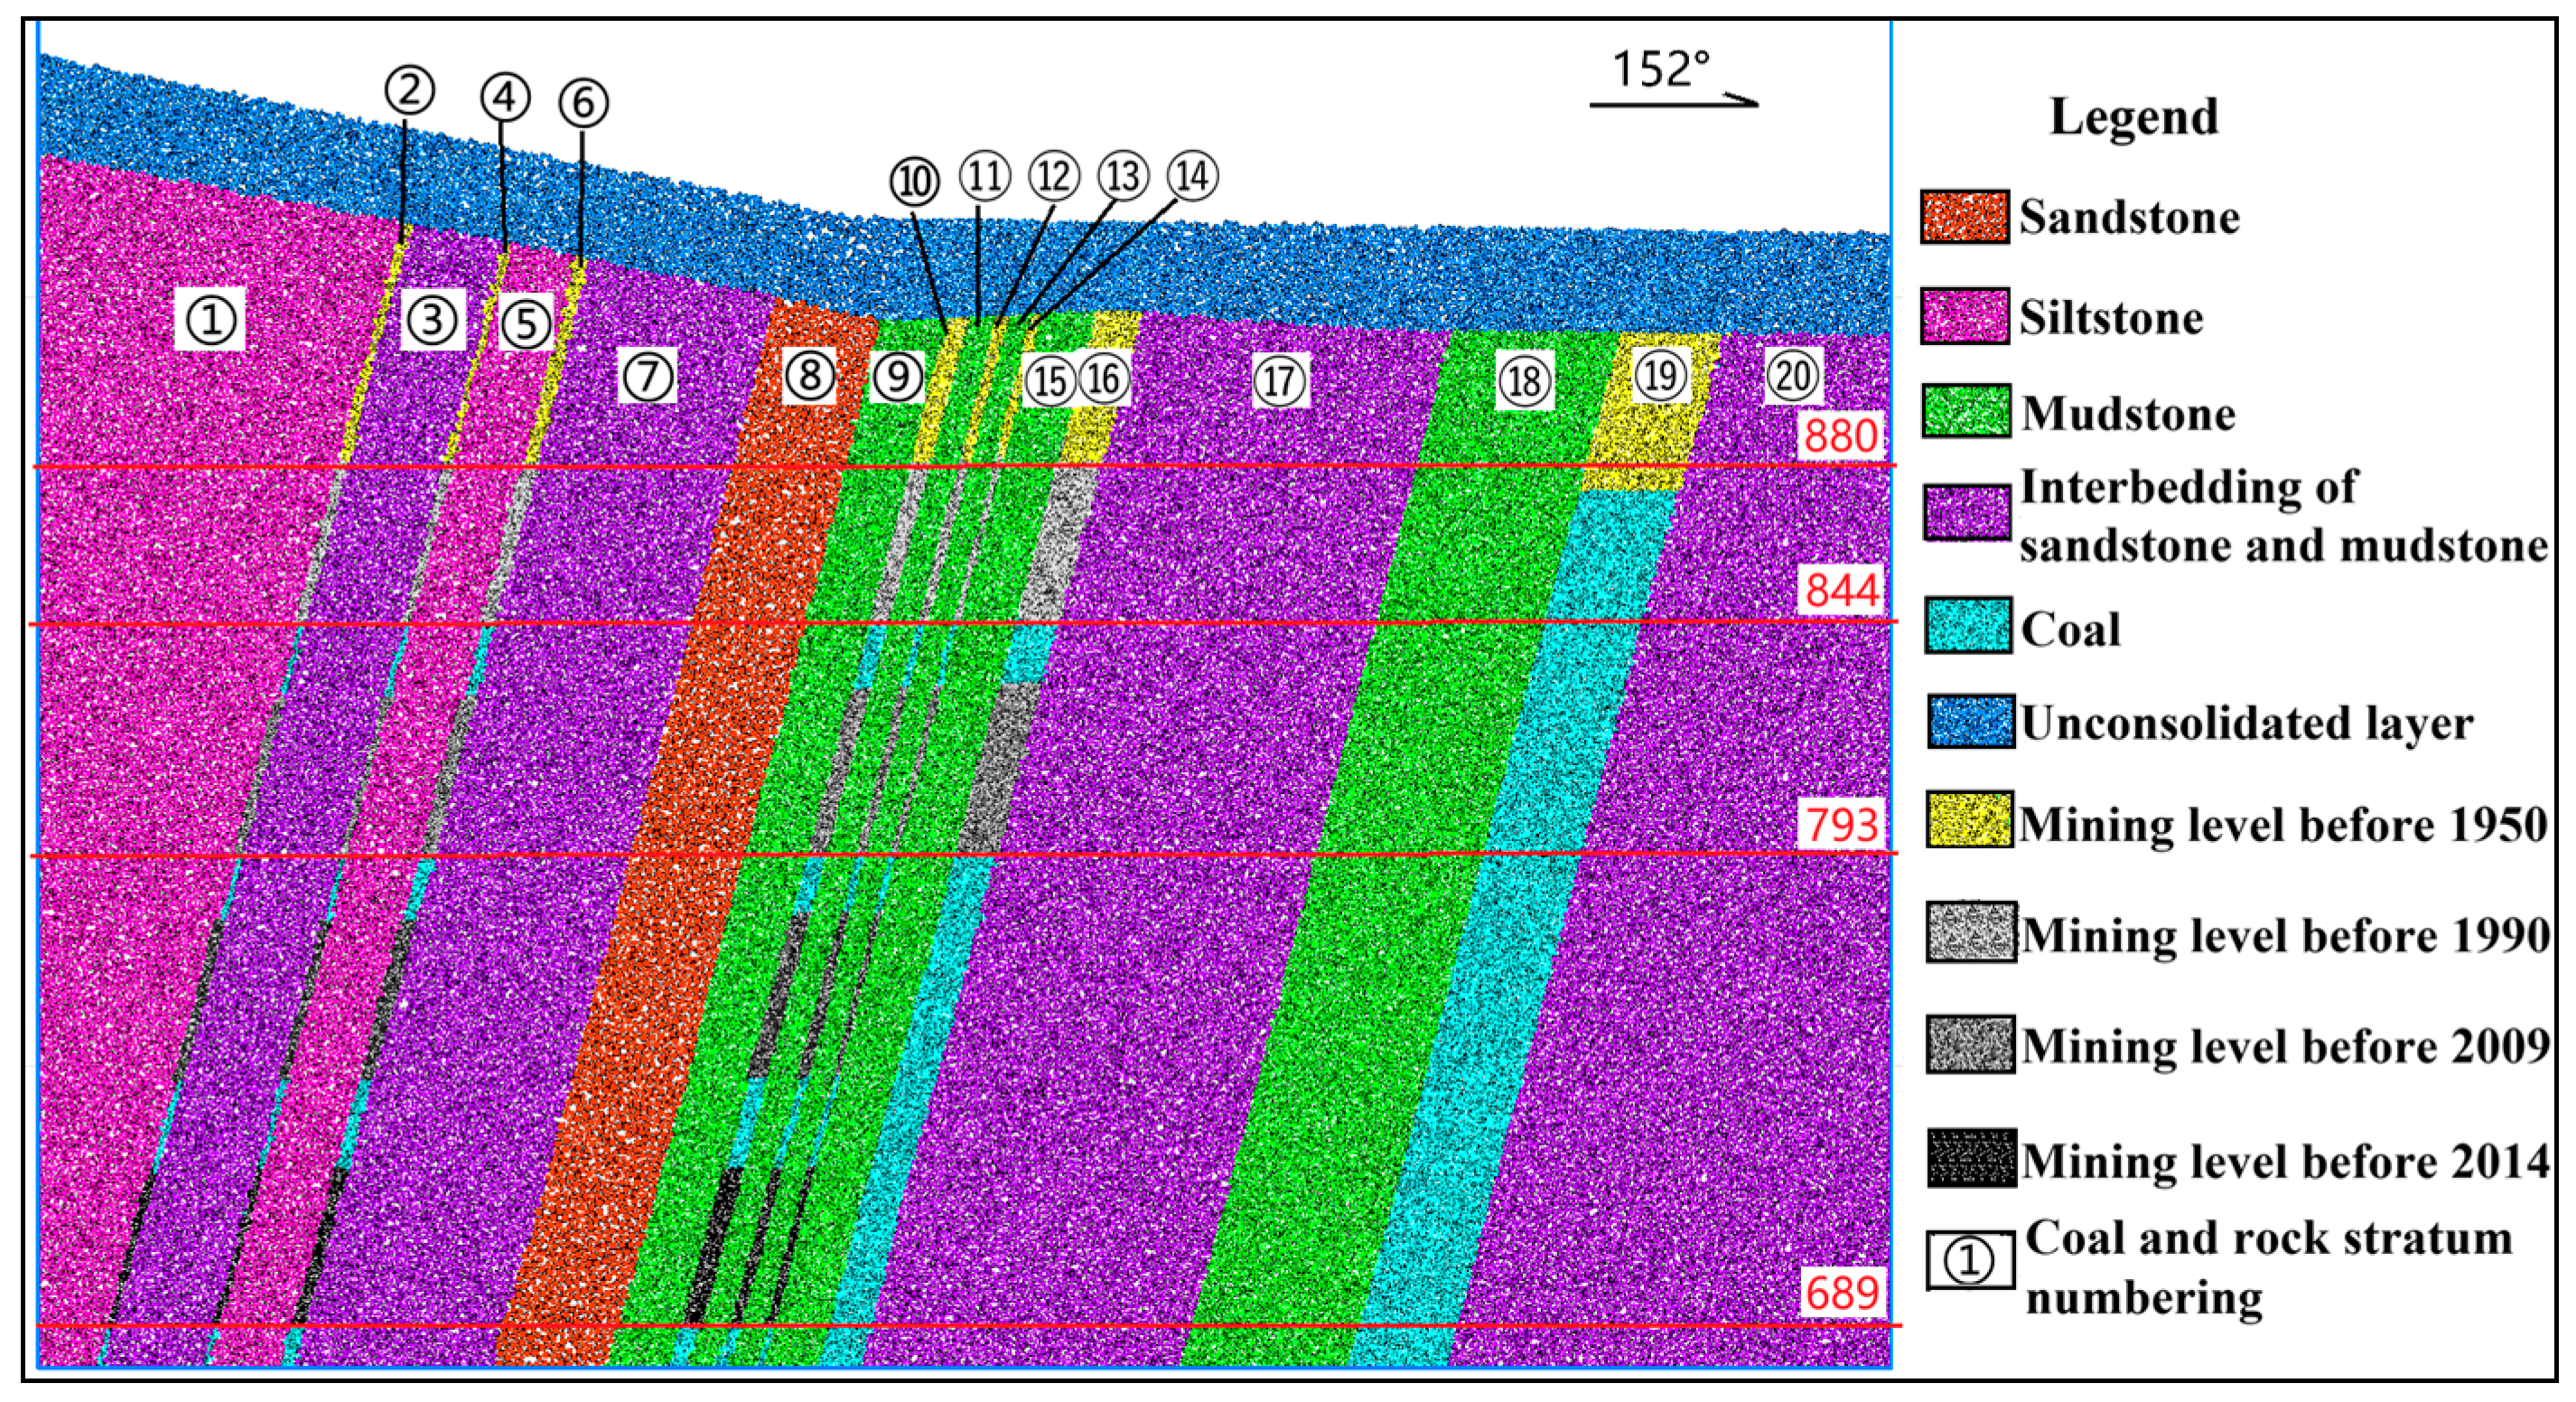
Itasca PFC has been developed with two simulation platforms, namely 2D and 3D. Given the lack of original mine excavation data in the study area, six two-dimensional geological profile models were established based on the geotechnical investigation results of the study area and the 1–1′ to 6–6′ profiles (Figure 4). Since the constructed models were based on the assumed pre-mining geological conditions, whereas the geological exploration profiles were obtained from post-mining investigations—and local bedrock surfaces have already subsided under current conditions—local restoration was carried out according to the natural slope of the bedrock surface during the modeling process to better align with the actual situation (Figure 5).
Given the complex geological conditions, the following value-taking principles were adopted during the modeling process:
  • The models were established in accordance with the actual conditions of location, strike, length, and depth of profiles 1–1′ to 6–6′ (Figure 1 and Figure 2);
  • The dip angles of rock strata in the profiles were also assigned based on the geotechnical investigation results, generally ranging from 73° to 75°;
  • Multiple coal seams were mined in the study area, and the thickness of coal seams varied slightly. Therefore, the models were constructed using the average thickness of the coal seams;
  • A total of 20 coal (rock) strata were divided according to the stratigraphic and geological conditions, and the spacing between them was determined based on the geological exploration profile results;
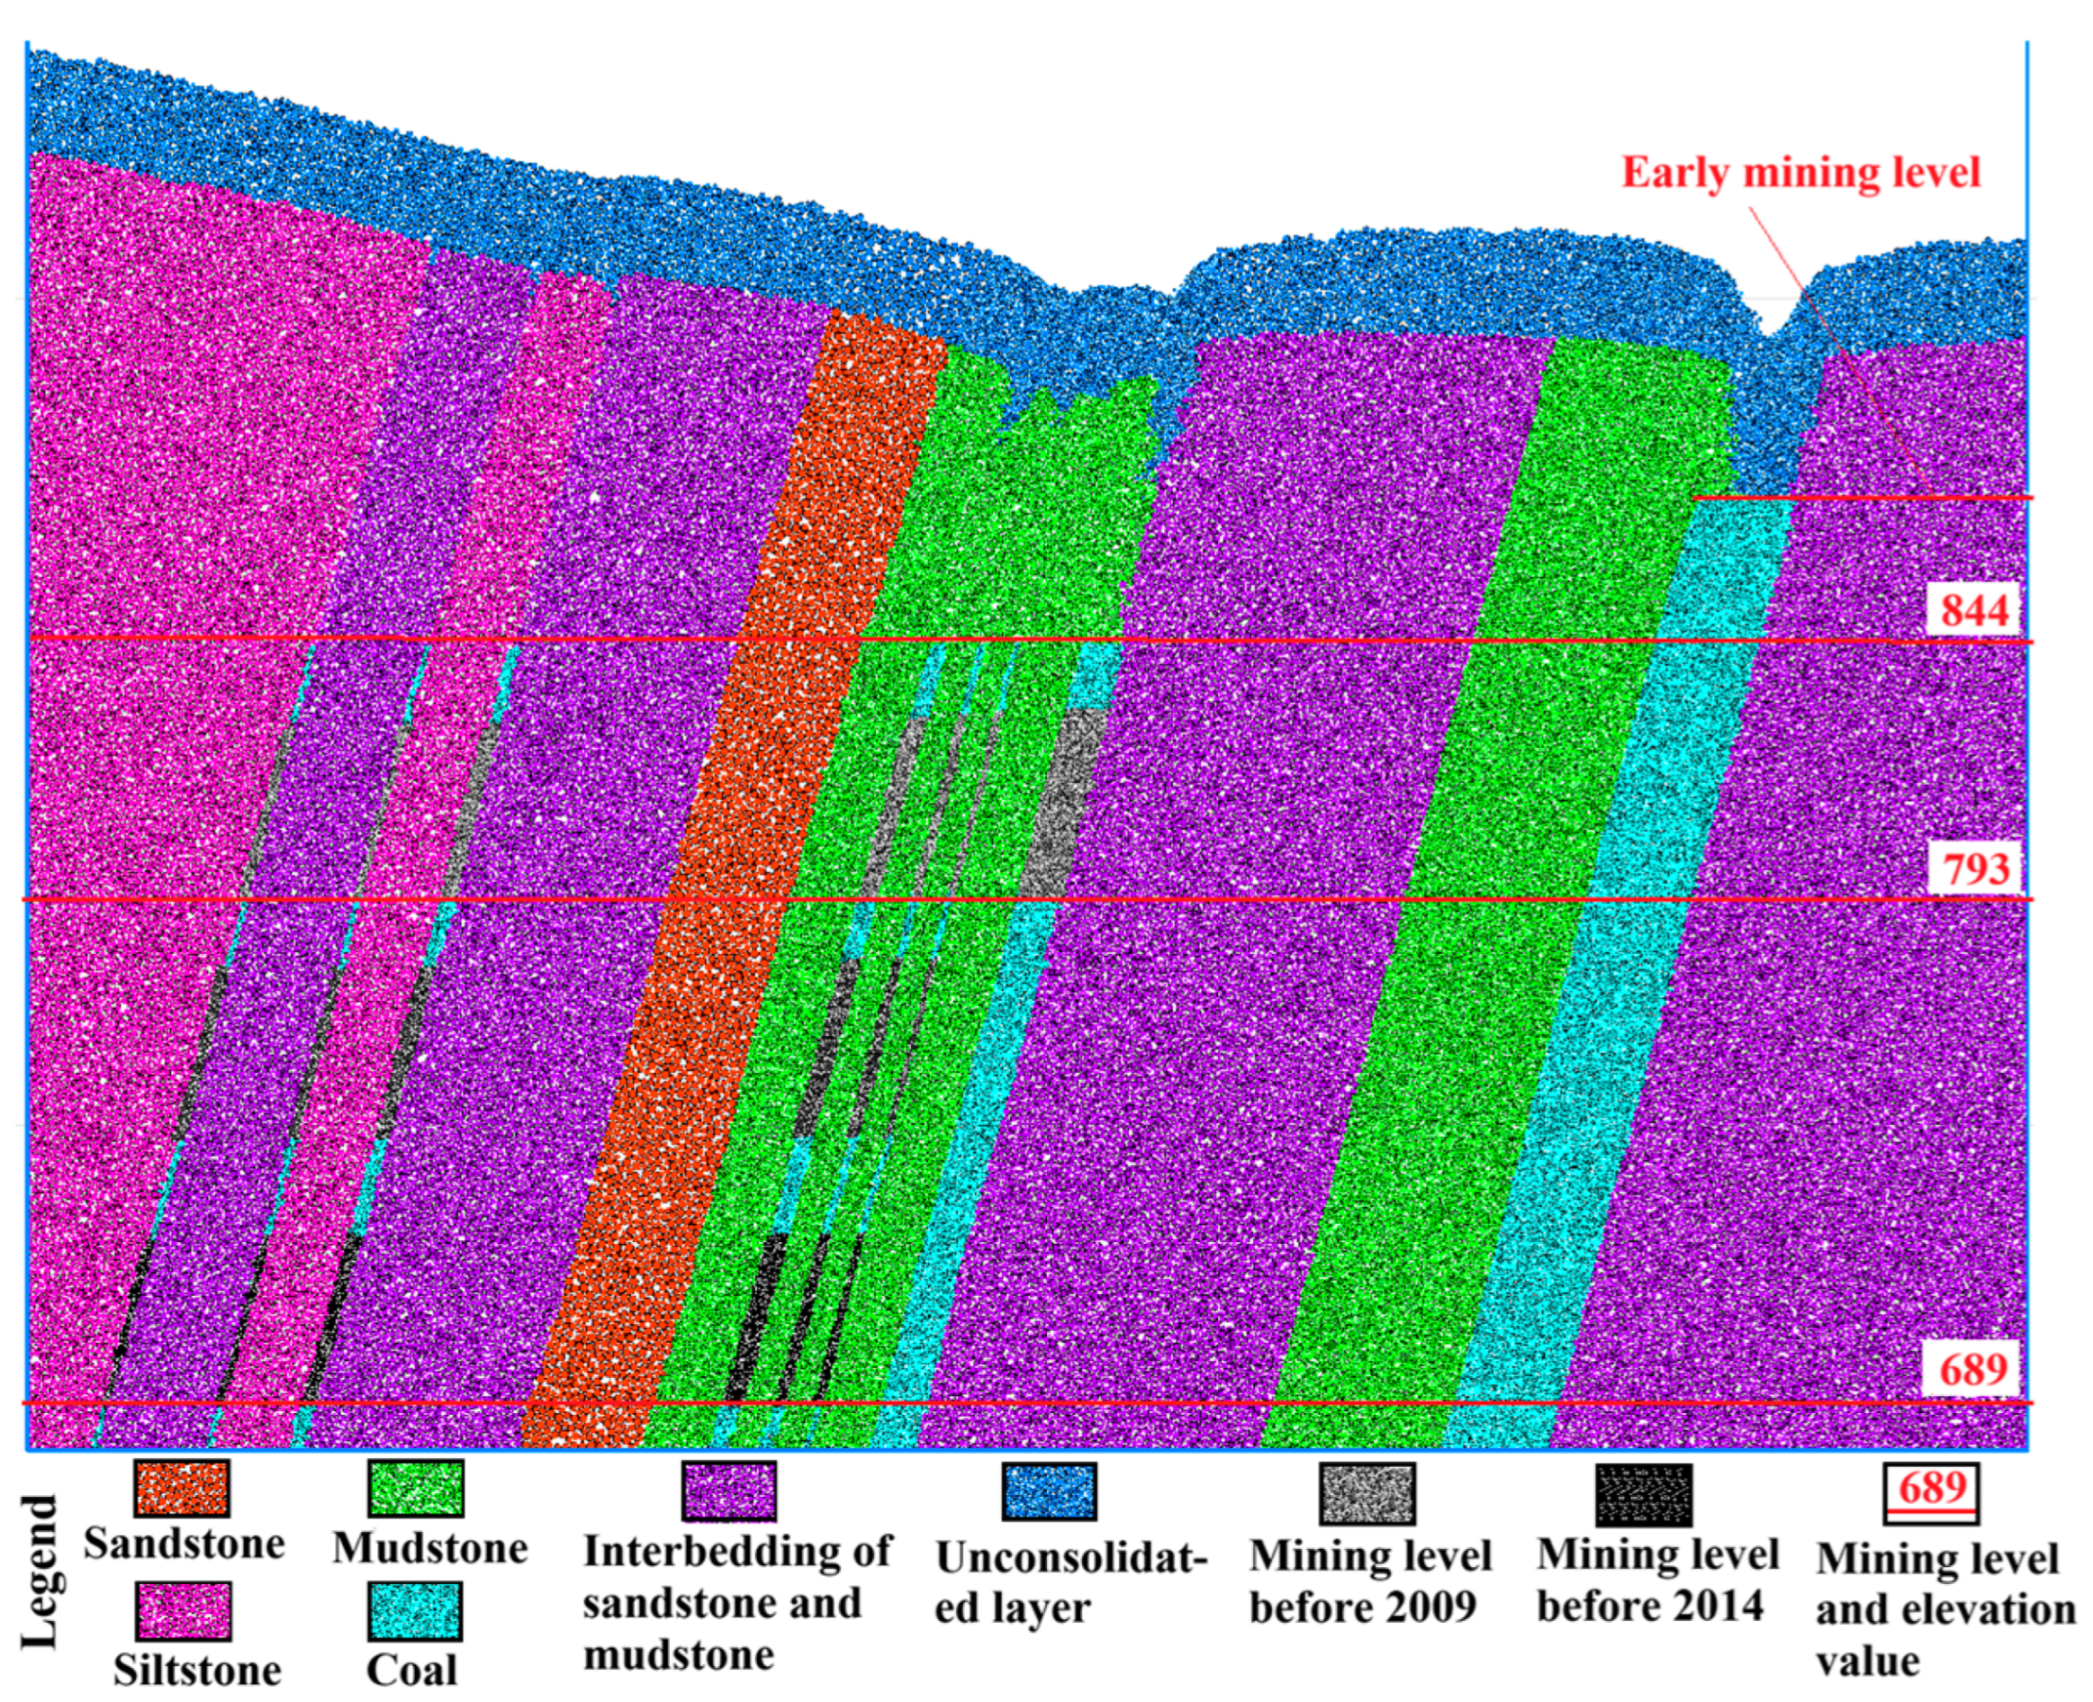
  • According to the survey and investigation findings, four mining levels at elevations of 880 m, 844 m, 793 m, and 689 m were set, and their respective mining periods were determined based on the survey data (Figure 4).

3.2. Calibration of Particle Physico-Mechanical Parameters

3.2.1. Calibration of Mechanical Property Parameters

In PFC simulations, it is first necessary to determine the similarity of mechanical properties between the microscopic granular assemblies and the macroscopic rock–soil mass to ensure the reliability of the former in representing the latter. The parallel bond model in PFC is generally adopted to carry out numerical servo experiments for calibrating relevant parameters. Many scholars have conducted specialized research on this aspect, such as the trial-and-error method under certain control conditions [22,23,24], the Plackett–Burman design experiment method [25,26], the stepwise rapid calibration method [27], and the analysis of variance method [28]. Based on the correlation analysis between the results of macroscopic rock mechanics experiments and PFC numerical experiments, Wang et al. [29] proposed conversion formulas for macroscopic and mesoscopic parameters (Equations (3)–(6)), which have been frequently cited [18,19,30,31]:
E E c = a + b ln k n k s
ν = c ln k n k s + d
σ c σ ¯ = a τ ¯ σ ¯ 2 + b τ ¯ σ ¯ , 0 < τ ¯ σ ¯ 1 c , τ ¯ σ ¯ > 1
σ t σ ¯ = d τ ¯ σ ¯ 2 + e τ ¯ σ ¯ , 0 < τ ¯ σ ¯ 1 f , τ ¯ σ ¯ > 1
where:
  • E—Macroscopic elastic modulus/GPa;
  • Ec—Particle contact modulus/GPa;
  • kn/ks—Normal-to-tangential stiffness ratio;
  • ν—Poisson’s ratio;
  • σc—Uniaxial compressive strength/MPa;
  • σt—Tensile strength/MPa;
  • σ c ¯ —Parallel bond normal strength/MPa;
  • τ c ¯ —Parallel bond tangential strength/MPa;
In Equations (3) and (4), a = 1.652, b = −0.395, c = 0.209, and d = 0.111;
In Equations (5) and (6), a = −0.965, b = 2.292, c = 1.327, d = −0.174, e = 0.463, and f = 0.289.
The lithology of strata in the study area is mainly divided into five types: sandstone, siltstone, mudstone, coal, and unconsolidated layers. Drawing on previous research, numerical servo experiments were carried out on four types of rocks in the study area, namely, sandstone, siltstone, mudstone, and coal. Based on the results of physico-mechanical tests on the rock in the study area, the mesoscopic parameters were determined using the calculation methods presented in Equations (3)–(6). For parameters that cannot be directly calculated via formulas, values were assigned within the range recommended in Ref. [28]. For unconsolidated layers, parameters were directly determined based on empirical values (Table 2).
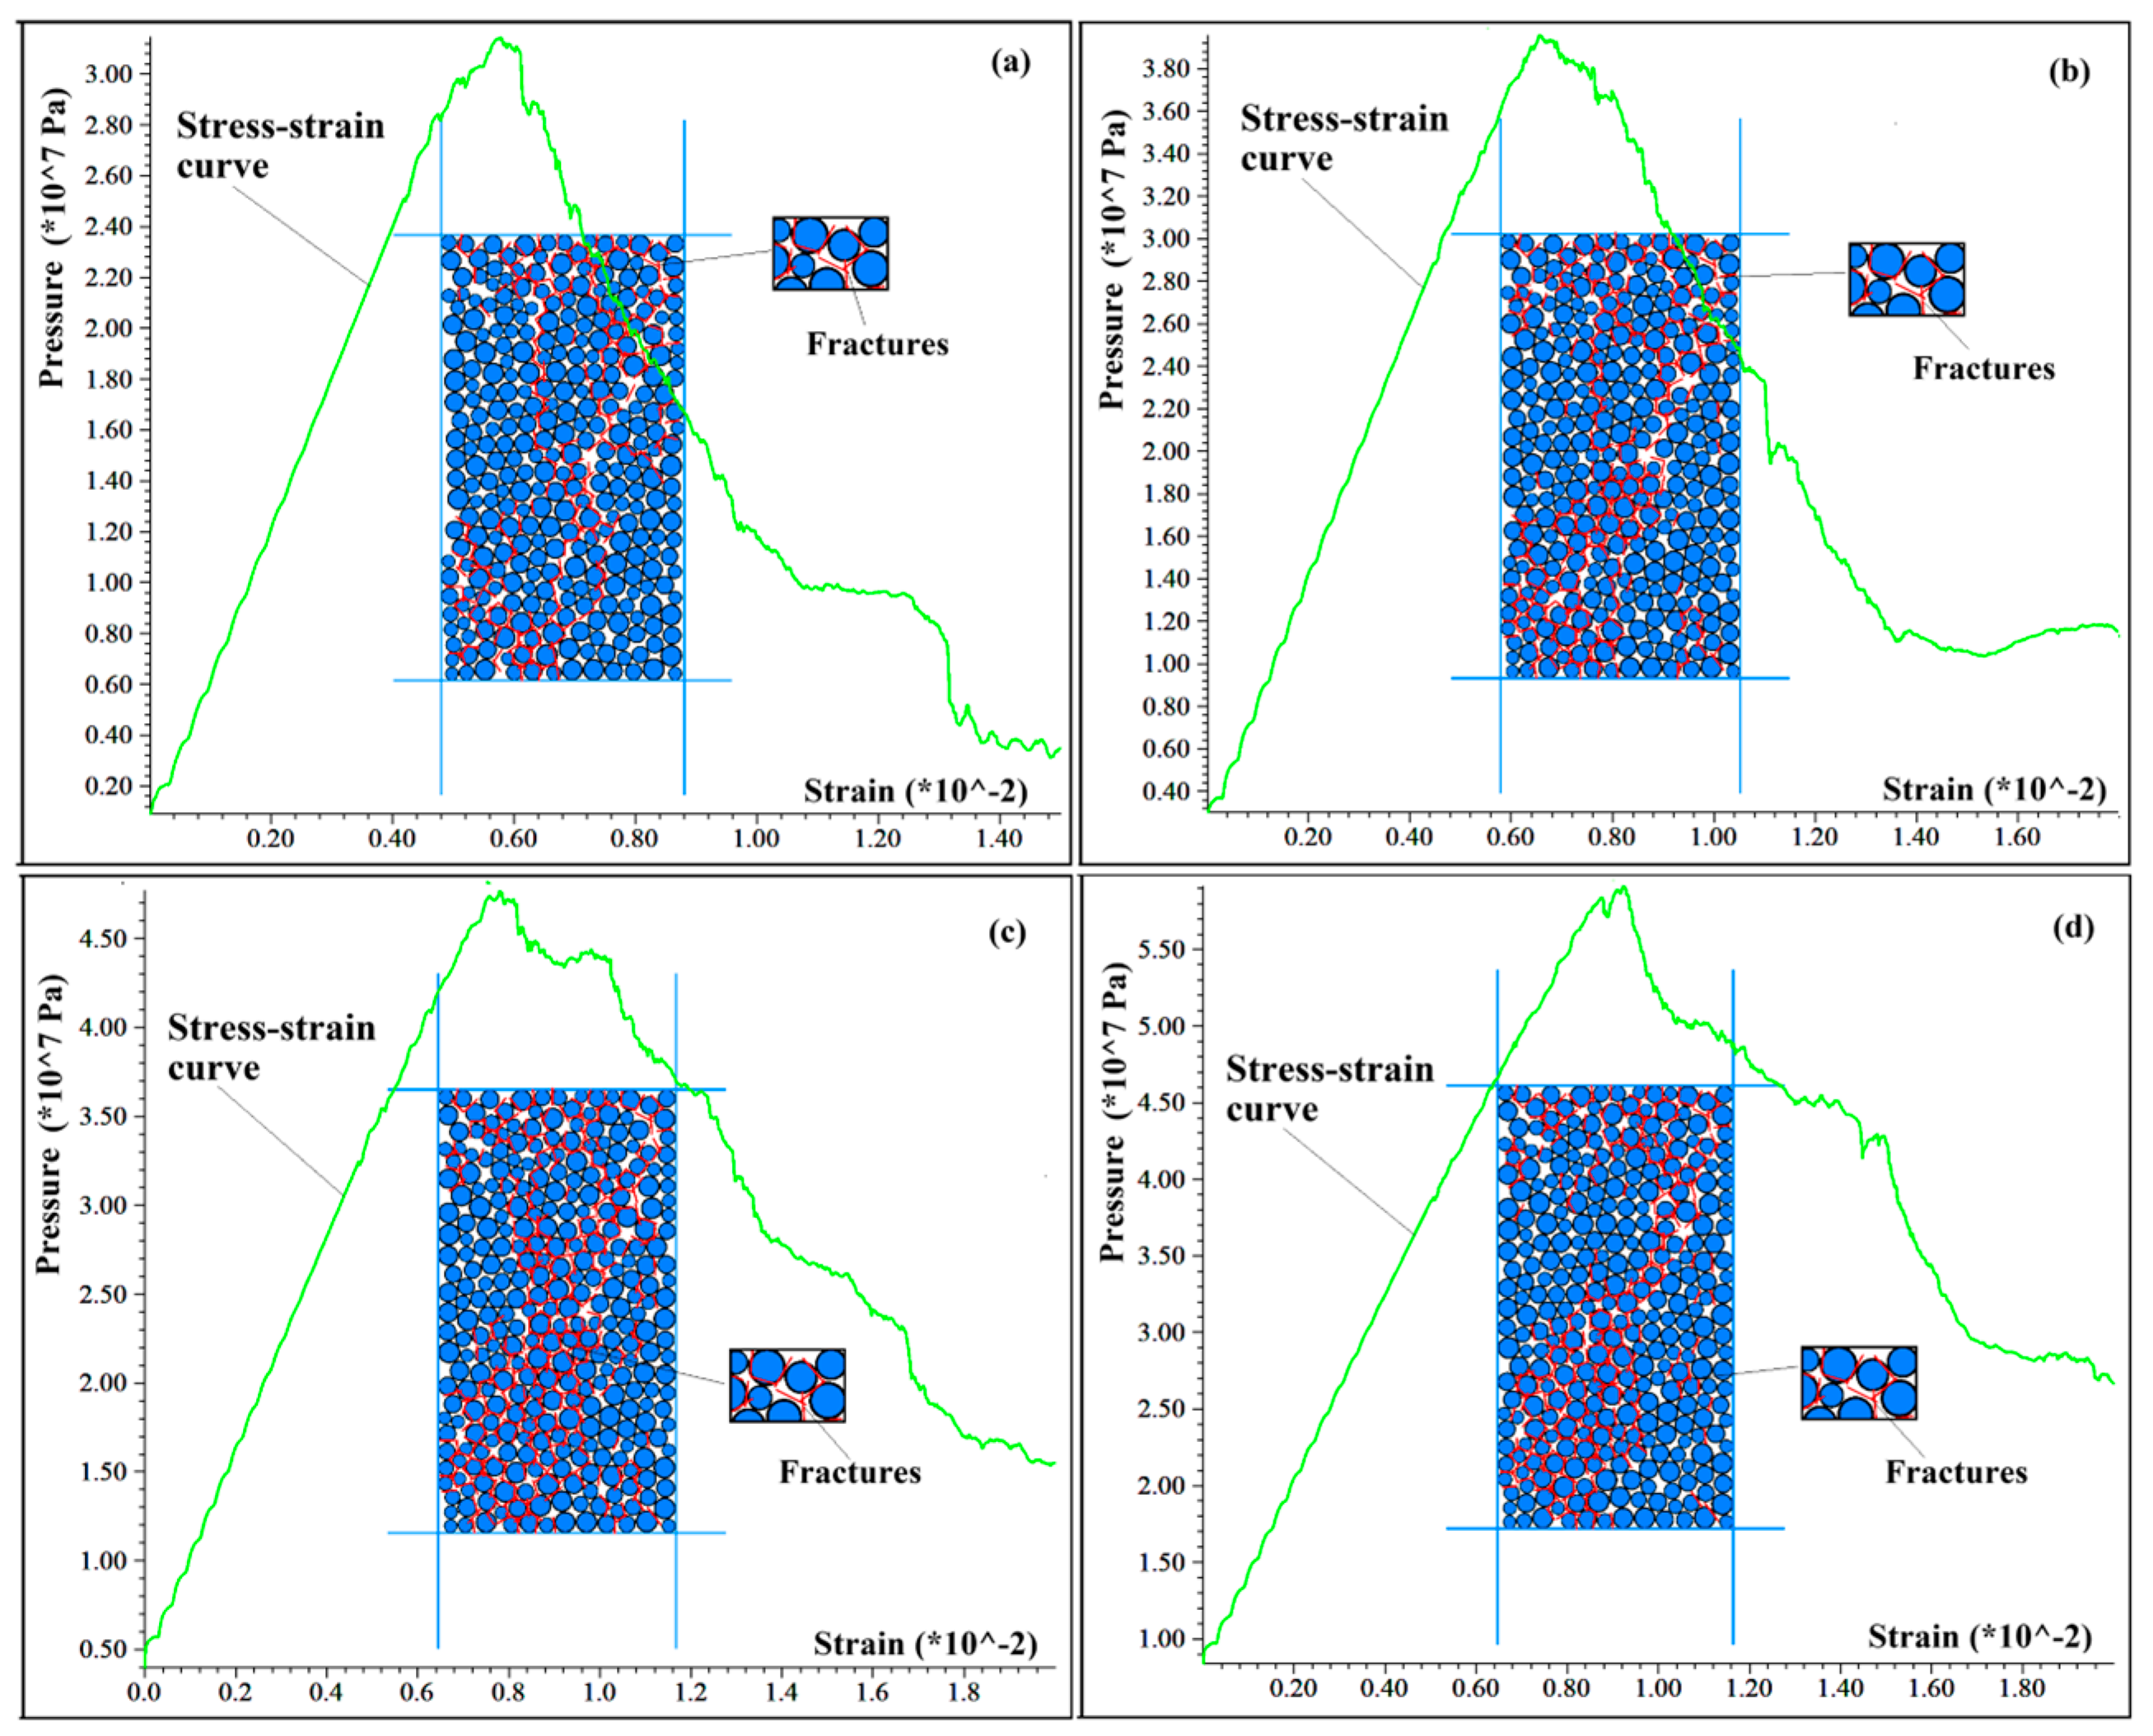
In the numerical tests, confining pressures of 0.5, 2.0, 4.0, and 8.0 MPa were set, respectively, and the tests were completed through processes including sample preparation, prepressing, cementation, and loading. After the tests, stress–strain curves and stress Mohr circles under different confining pressures were plotted, and the macroscopic mechanical parameters of the rock, namely, elastic modulus, Poisson’s ratio, cohesion, and internal friction angle, were obtained. The peak strength under low confining pressure (0.5 MPa) was taken as the uniaxial compressive strength (UCS) value (Figure 6).
After trial calculation and minor adjustments to individual parameters, the calibrated results were compared with the statistical values obtained from laboratory rock mechanics tests in the geological survey report. Although the results were not completely identical, all indices were similar to the laboratory test statistics, with average deviations all less than 10%, except for the cohesion of sandstone. As for the cohesion index of sandstone, it exhibited relatively large dispersion because the sandstone in the study area includes coarse- to medium-grained sandstone, fine-grained sandstone, and siltstone, which were not subdivided in the survey report. In addition, supplementary sampling was conducted on siltstone from field outcrops in this study. Siltstone was separated from sandstone and subjected to UCS tests. However, due to the limited number of samples, other test indices were unavailable; thus, only the UCS values were compared (Table 3). Despite the relatively large deviation in sandstone cohesion, the thickness of sandstone layers is small. Taking profile 4–4’ as an example, the thickness of sandstone layers accounts for only about 6% of the profile width. Therefore, the local deviation does not affect the overall trend. In summary, the results of the numerical servo experiments are generally satisfactory and acceptable as simulation conditions.

3.2.2. Calibration of Physical Property Parameters

The geometric model of particle flow requires a sufficient number of particles to obtain smooth curves in numerical tests, avoid significant fluctuations and excessive jaggedness, and ensure the reliability of calculation results. However, an excessively large number of particles will lead to lengthy computation time, excessive time consumption to achieve the required calculation accuracy, and may even cause the server to malfunction.
The samples used in numerical servo experiments are small-scale, while geological profile models are large-scale. The two differ in terms of particle size and porosity settings:
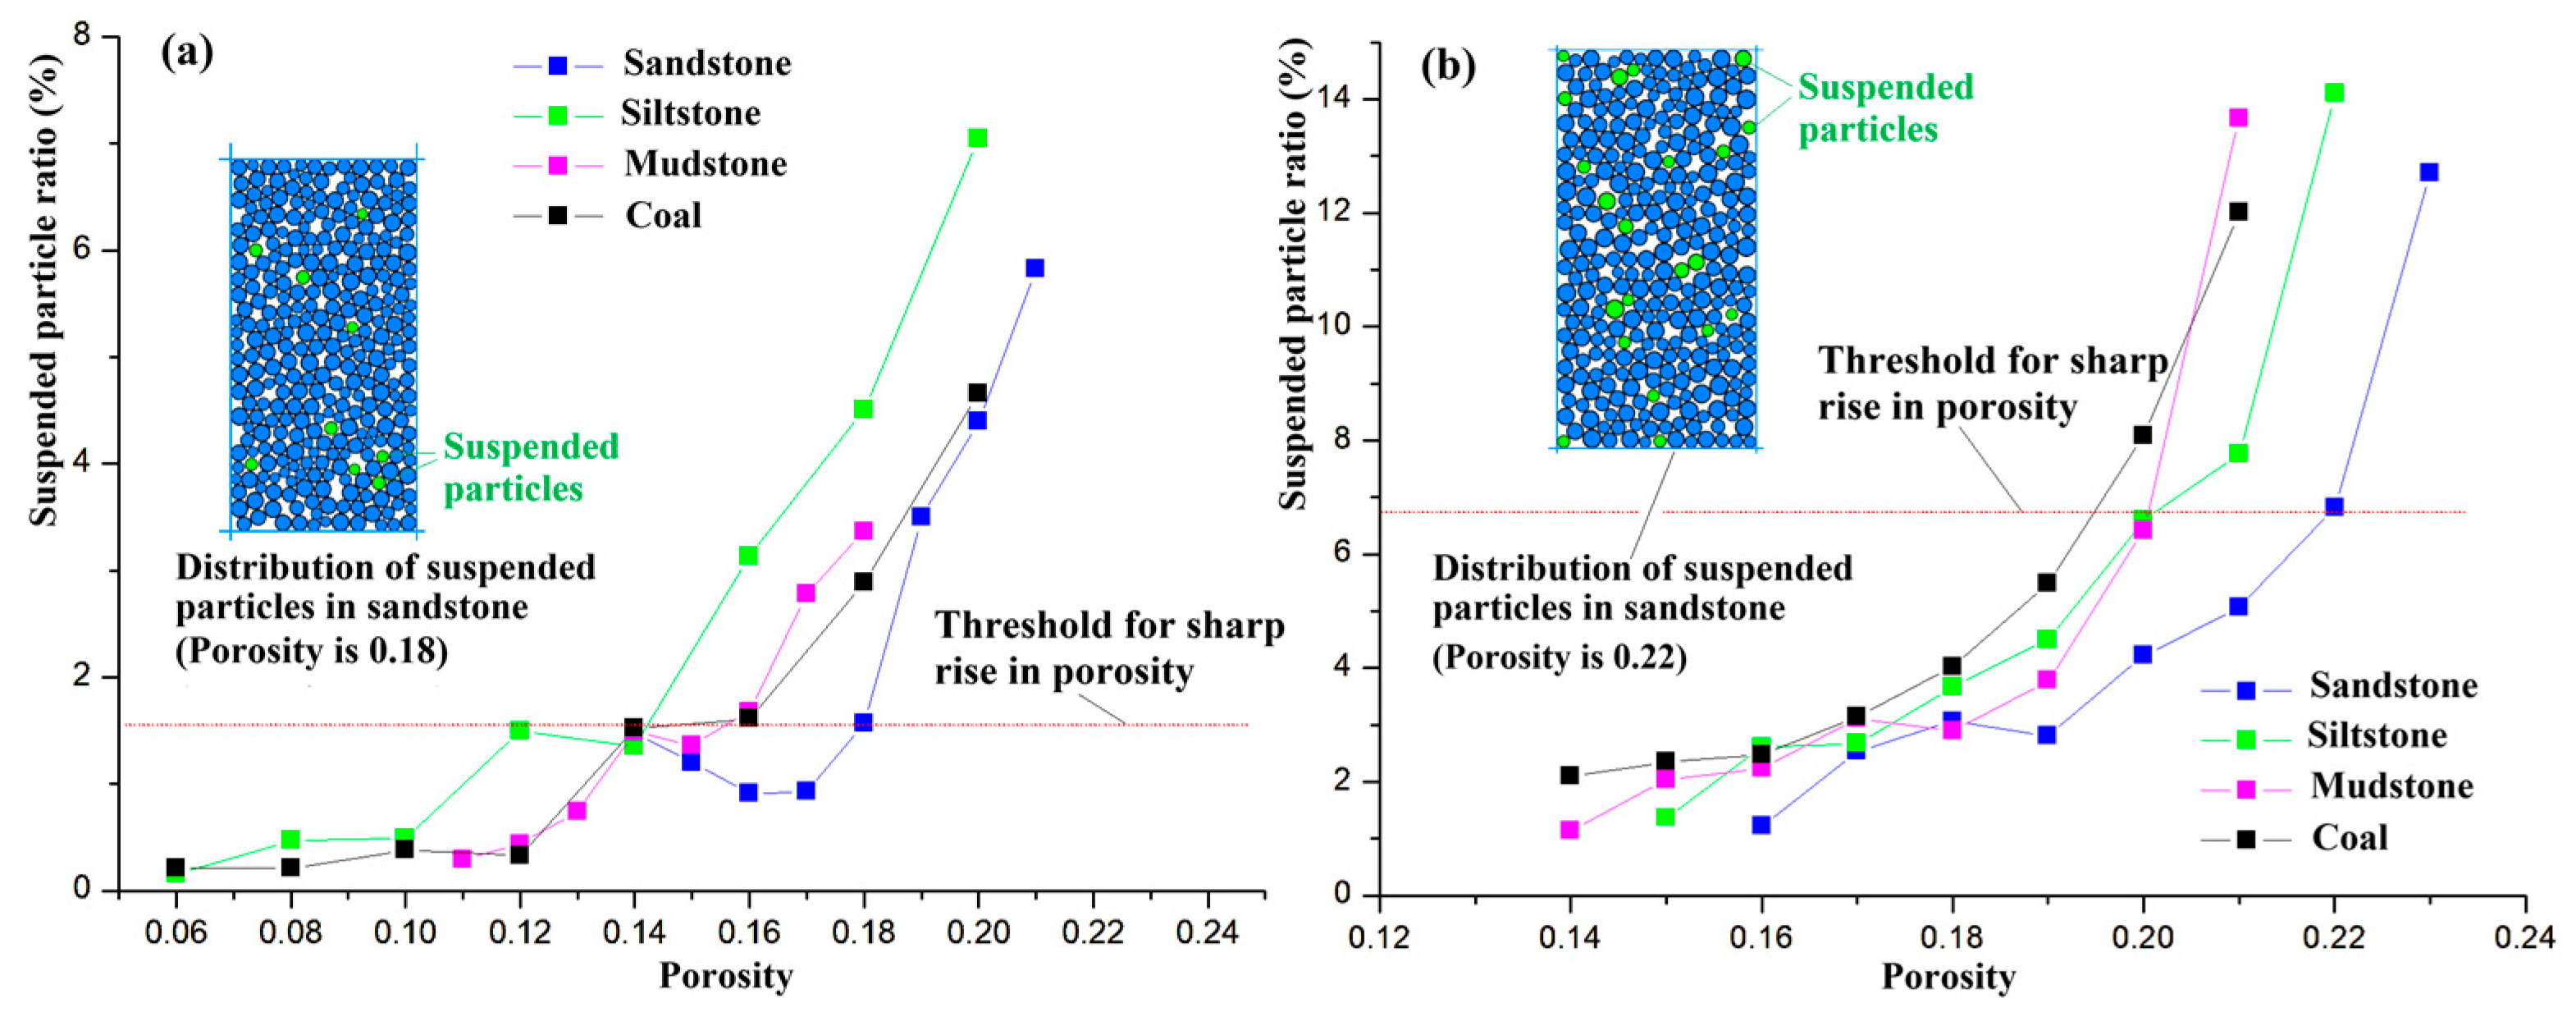
  • For the experimental samples, the particle radius and porosity should not be excessively large. An overly large particle radius will result in an insufficient number of particles, and an excessively high porosity will lead to non-contact (i.e., suspended state) between too many particles, thus rendering the calculation unfeasible.
  • For the geological profile, the particles should not be overly small. Unduly small particles will lead to an excessive quantity, which impairs computational efficiency; meanwhile, the porosity should not be too low either, as an extremely low porosity will cause the particles to bounce and scatter.
Based on the above analysis, two scales of “samples” were established: the sample applicable to numerical servo experiments was designed with a height × width of 20 × 10 m, while the sample for the geological profile model had dimensions of 40 × 20 m (i.e., scaled up by a factor of two). To reasonably calibrate the porosity of particles at these two scales, a series of simulation tests were conducted to measure the ratio of suspended particles under different porosity conditions.
According to the simulation results of large- and small-scale samples with varying porosity values, it can be observed that the proportion of suspended particles exhibits a sharp jump when the porosity exceeds a certain threshold (Figure 7). An excessively high proportion of suspended particles not only deviates from the actual characteristics of rock materials but also impairs the accuracy of calculations. Therefore, by means of comparative analysis, an appropriate porosity value was selected near the threshold prior to the abrupt rise in the suspended particle ratio. This approach can effectively control the quantity of suspended particles while ensuring that the selected value is consistent with practical conditions. Taking sandstone as an example, the porosity was set to 0.18 for small-scale samples in servo experiments, and 0.22 for large-scale geological profile simulations. Meanwhile, the particle radius for large-scale models was determined to be twice that of small-scale samples (Figure 7, Table 4).

3.3. Physical Simulation Experiment on Void Content of Goaf

The caving and compaction of overlying strata in goaf is a long-term process, and the caving and compaction process laws vary with the different geological conditions of the goaf. The void content change in the goaf of gently inclined coal seams can be derived based on the mathematical model of the continuous subsidence surface [32], or studied through physical experiment simulation using scaled-down coal and rock blocks or similar materials [33,34]. This study adopts physical experiments with solid materials to simulate the compaction process of the goaf in the study area.

3.3.1. Similarity Criteria and Similarity Ratio Design

This is a common simulation in rock mechanics and engineering; thus, the π theorem is adopted to derive the similarity criteria. Since the compaction of the goaf is a uniaxial compression of rock mass under a gravitational field, and natural coal and rock materials are directly used, the physical quantities involved are stress σ, density ρ, length L, and gravitational acceleration g. Only the Froude similarity criterion (Equation (7)) needs to be satisfied. According to dimensional analysis, the relationship of similarity ratios can be determined (Equation (8)).
π = σ ρ g L
C σ = C ρ × C g × C L
where Cσ is the stress similarity ratio; Cρ is the density similarity ratio; Cg is the gravitational acceleration similarity ratio; and CL is the geometric similarity ratio.
There are multiple coal seams in the study area with large variations in thickness. Taking a median value of 2–3 m and including the caving zone, the goaf caving space is assumed to be 4 m. Combined with the conditions of the test bench and maximum load, the geometric similarity ratio is determined to be 1:10, i.e., CL = 0.1. As can be seen from the above conditions, Cρ = Cg = 1. According to Equation (8), Cσ = 0.1. The overlying rock density of the goaf is estimated to be 2550 kg/m3, and the maximum mining depth is 200 m, indicating that the maximum overlying rock pressure of the goaf is approximately 5.1 MPa. Converted by the stress similarity ratio Cσ = 0.1, the corresponding maximum simulated pressure is 0.51 MPa.

3.3.2. Container and Experimental Materials

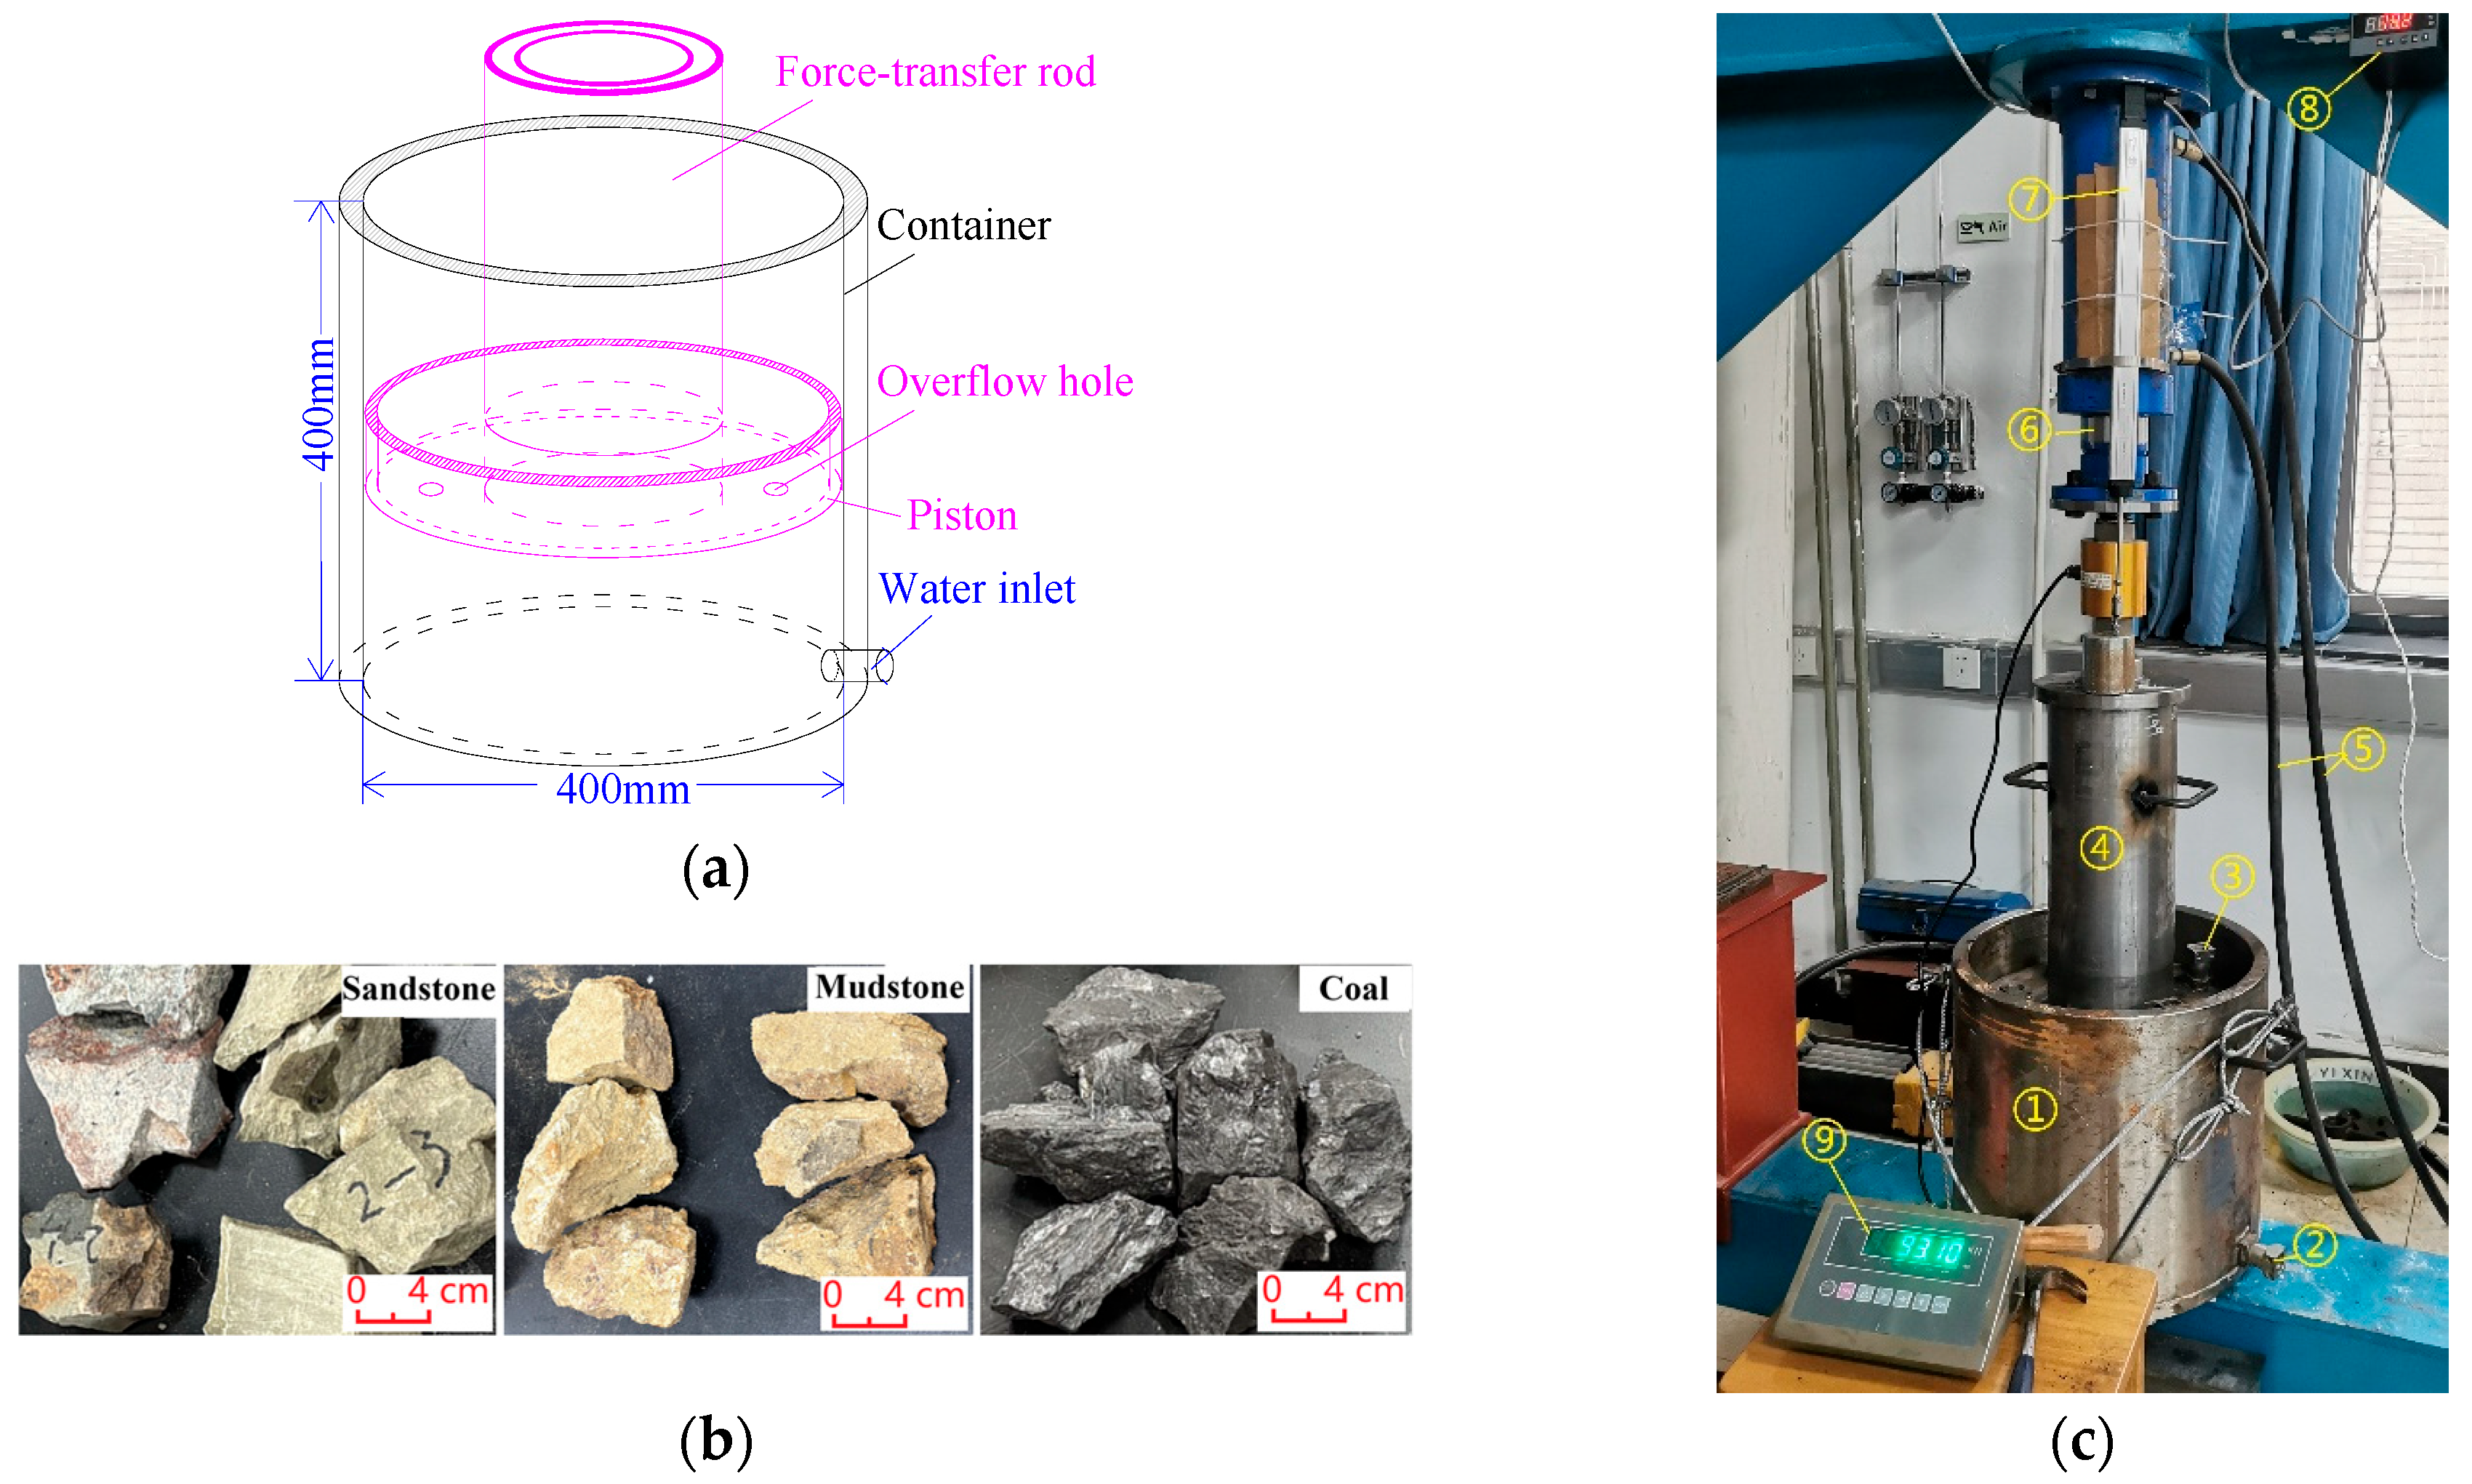
According to the design with a geometric similarity ratio CL = 0.1, a steel container with a height × diameter of 400 × 400 mm was constructed, featuring an open top equipped with a piston, a water inlet at the bottom, and an overflow hole on the piston pressure plate to simulate groundwater immersion conditions (Figure 8a).
Based on the lithology of the roof and floor of the coal seam in the study area, three types of material samples (coal, sandstone, and mudstone) were selected (Figure 8b). After crushing, the samples were graded into particle-size fractions of 0–5, 5–10, 10–15, and 15–20 cm, with the maximum particle size matching the size of the initially collapsed rock mass in the goaf at a similarity ratio of approximately 1:10. No restrictions were imposed on the gradation of different particle sizes; instead, the samples were mixed and filled according to their natural particle size fractions after crushing.
Considering the low recovery rate of shrinkage stoping (estimated at 50%), the mixing ratio of coal and rock mass in the goaf was set at 1:1. The roof and floor of the coal seam are mainly composed of sandstone or mudstone with variable combinations. Therefore, the mass ratios of coal, sandstone, and mudstone were specified as 2:1:1, 3:1:2, and 3:2:1, representing the proportions of different coal and rock components.

3.3.3. Experimental System Design and Experiments

The experimental system consists of a container, a press, a displacement meter, a pressure gauge, and auxiliary equipment (Figure 8c). The maximum pressure of the laboratory press is 150 kN (equivalent to approximately 1.2 MPa), which meets the pressure requirements of the simulation experiment.
During the experiment, the pressure was applied in 7 graded loading steps. At each step, the pressure was maintained until the displacement stabilized, after which the next level of load was applied. After loading up to the maximum load and maintaining it until stabilization, the load was removed. The samples were then soaked in water for 24 h, followed by another round of graded loading until the maximum load was reached again. The displacement values at the stabilization stage of each load level were recorded, and the void content was calculated based on the measured density values of the samples (Table 5).
The void content can be calculated by the following formulas:
N = V n S L / 1000 V t
V n = V 0 i = 1 3 m i ρ i
where
  • N—Void content/%;
  • Vn—Initial void volume/m3;
  • S—Cross-sectional area inside the container/m2;
  • L—Displacement/m;
  • Vt—Dynamic volume of the container (the actual volume of the container at a certain pressure stage)/m3;
  • V0—Initial total volume of the container/m3;
  • mi—The quality of a certain type of sample (i = 1, 2, 3, representing coal, sandstone, and mudstone respectively)/kg;
  • ρi—The density of a certain type of sample (i = 1, 2, 3, representing coal, sandstone, and mudstone respectively)/kg·m−3.

4. Results and Discussion

4.1. PFC Simulation Results and Discussion

4.1.1. Simulation of the Mining Process

According to the coal mining survey results described earlier, the mining process was simulated in five stages according to the elevation interval: shallower than 880 m (with the B6 coal seam calculated based on its actual mining elevation), 844–880 m, 793–828 m, 744–779 m, and 689–724 m (Figure 2). During the simulation, the preset mining sections in the profile were “excavated” step by step, followed by calculation until the model reached a stable state. Then, the mining section at the next elevation interval was continuously “excavated” and the calculation was performed until stability was achieved. This cycle was repeated until the excavation of the 689–724 m mining section was completed. Protective coal pillars were reserved between adjacent mining sections. After the excavation of the lower mining section, the overlying coal pillars gradually underwent damage, collapse, and compaction.
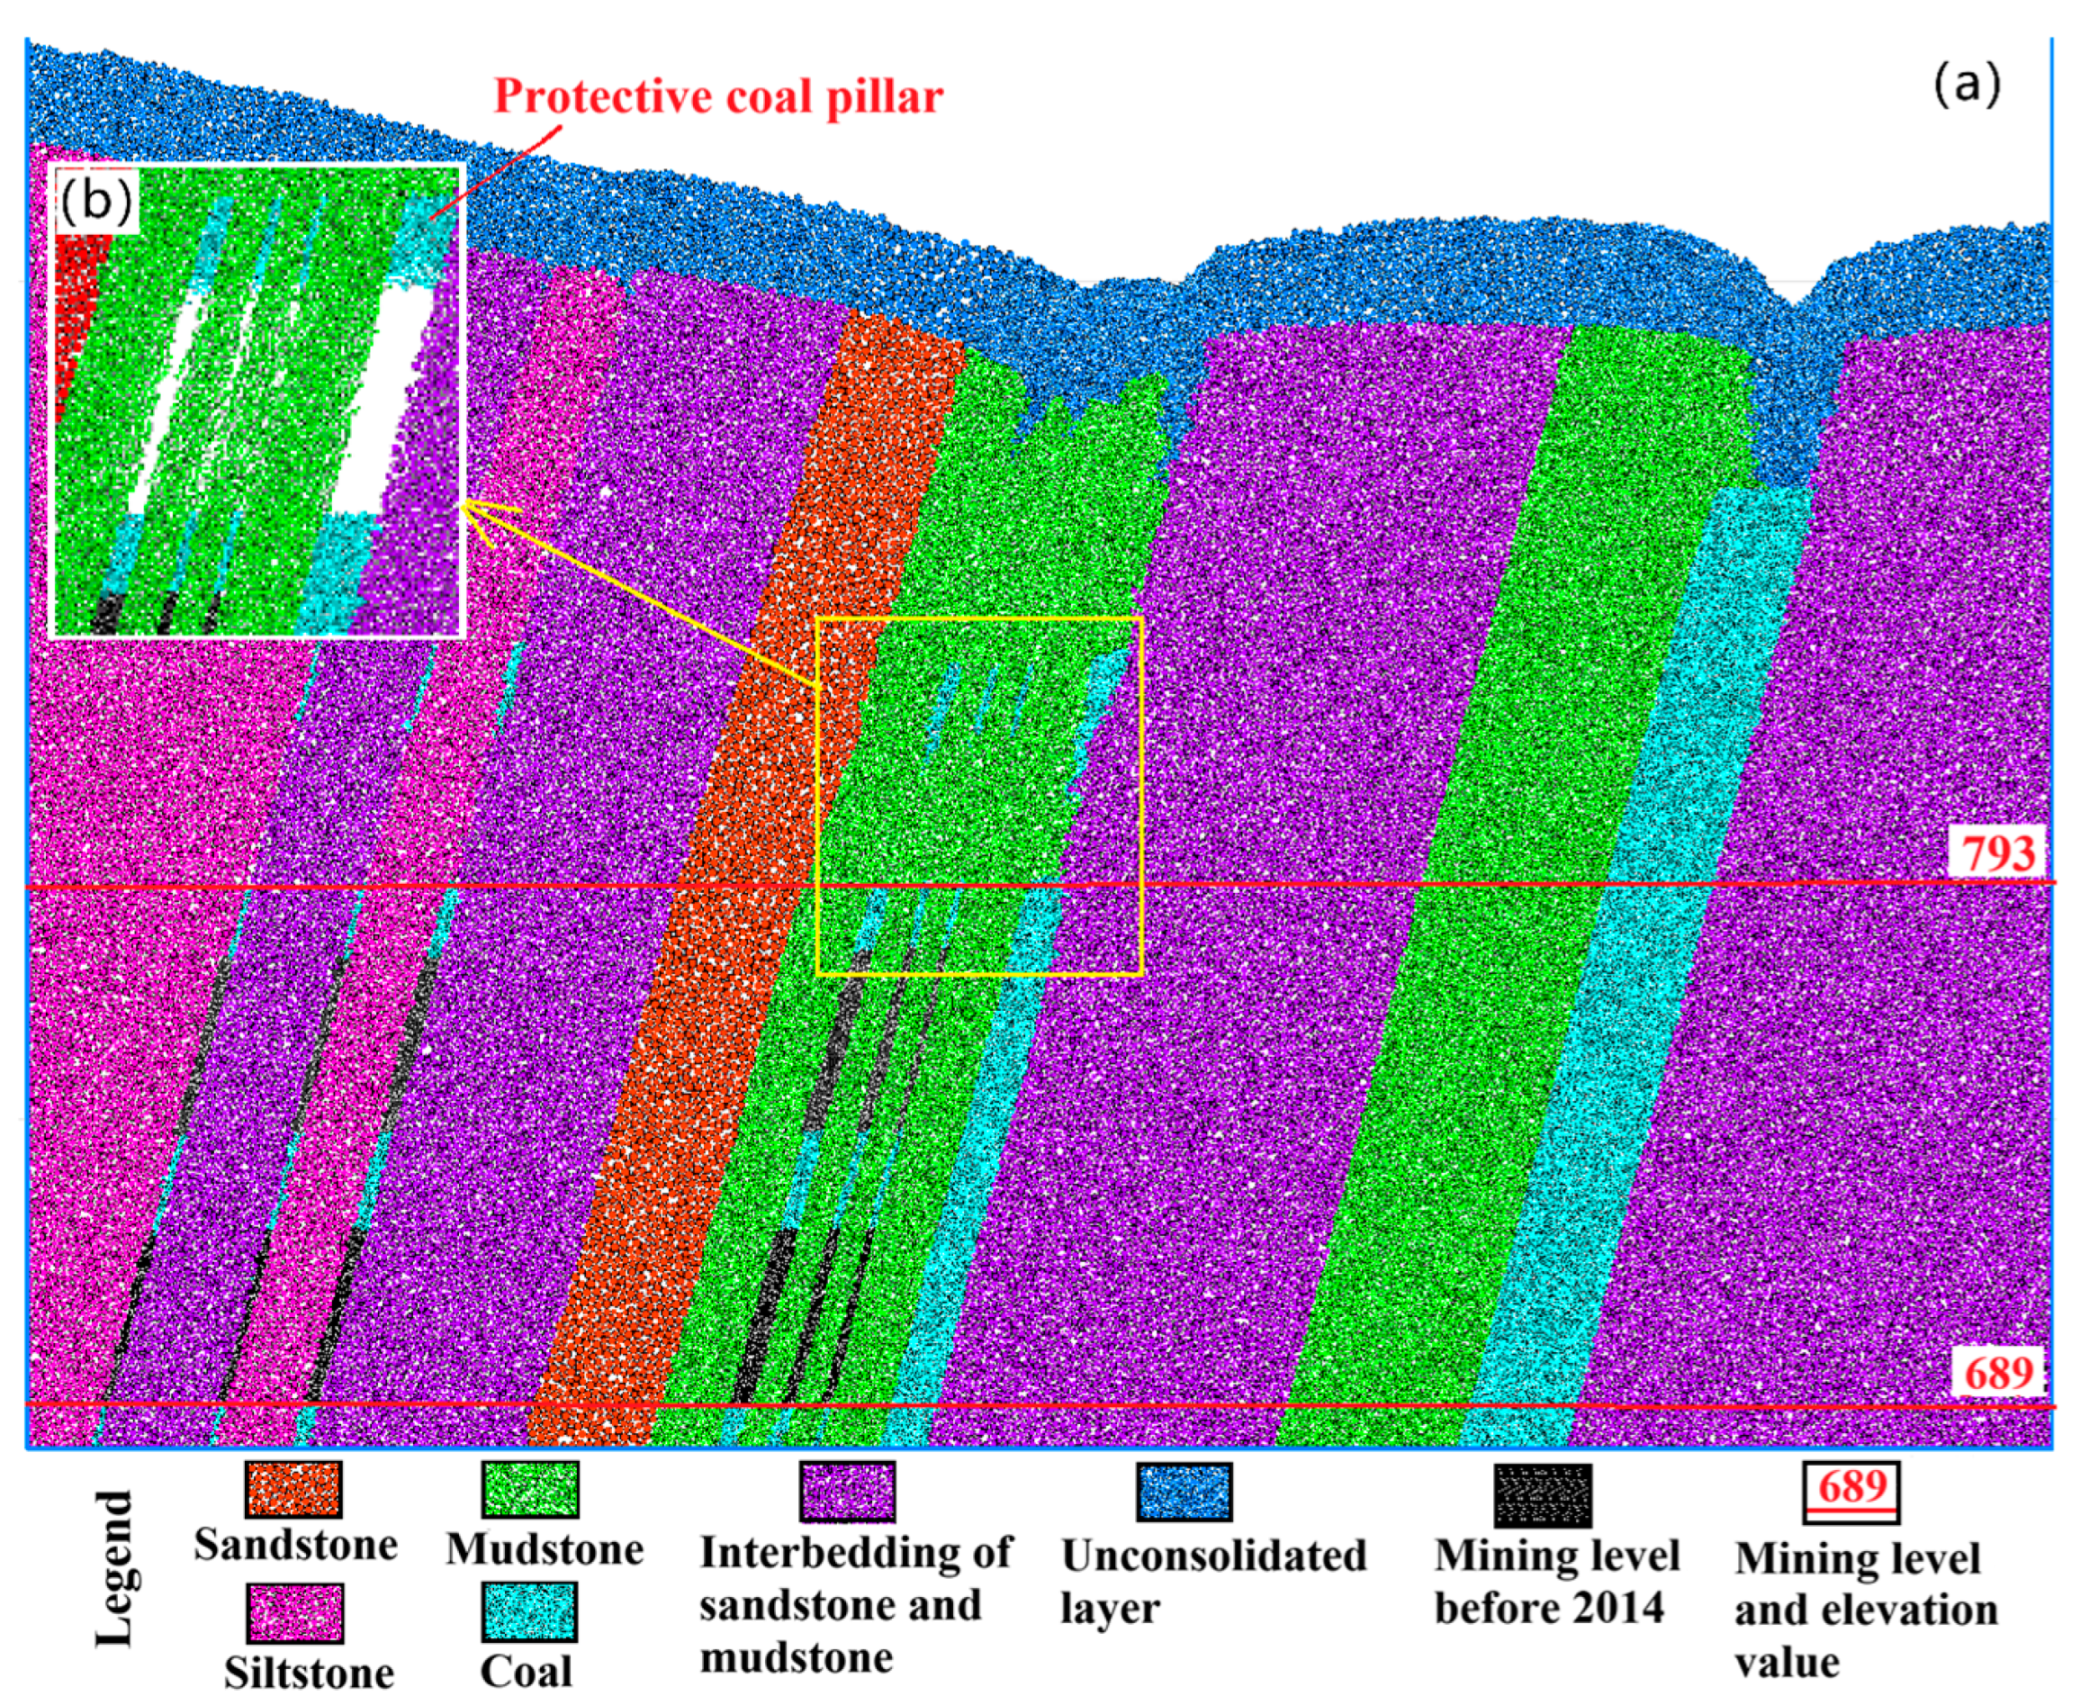
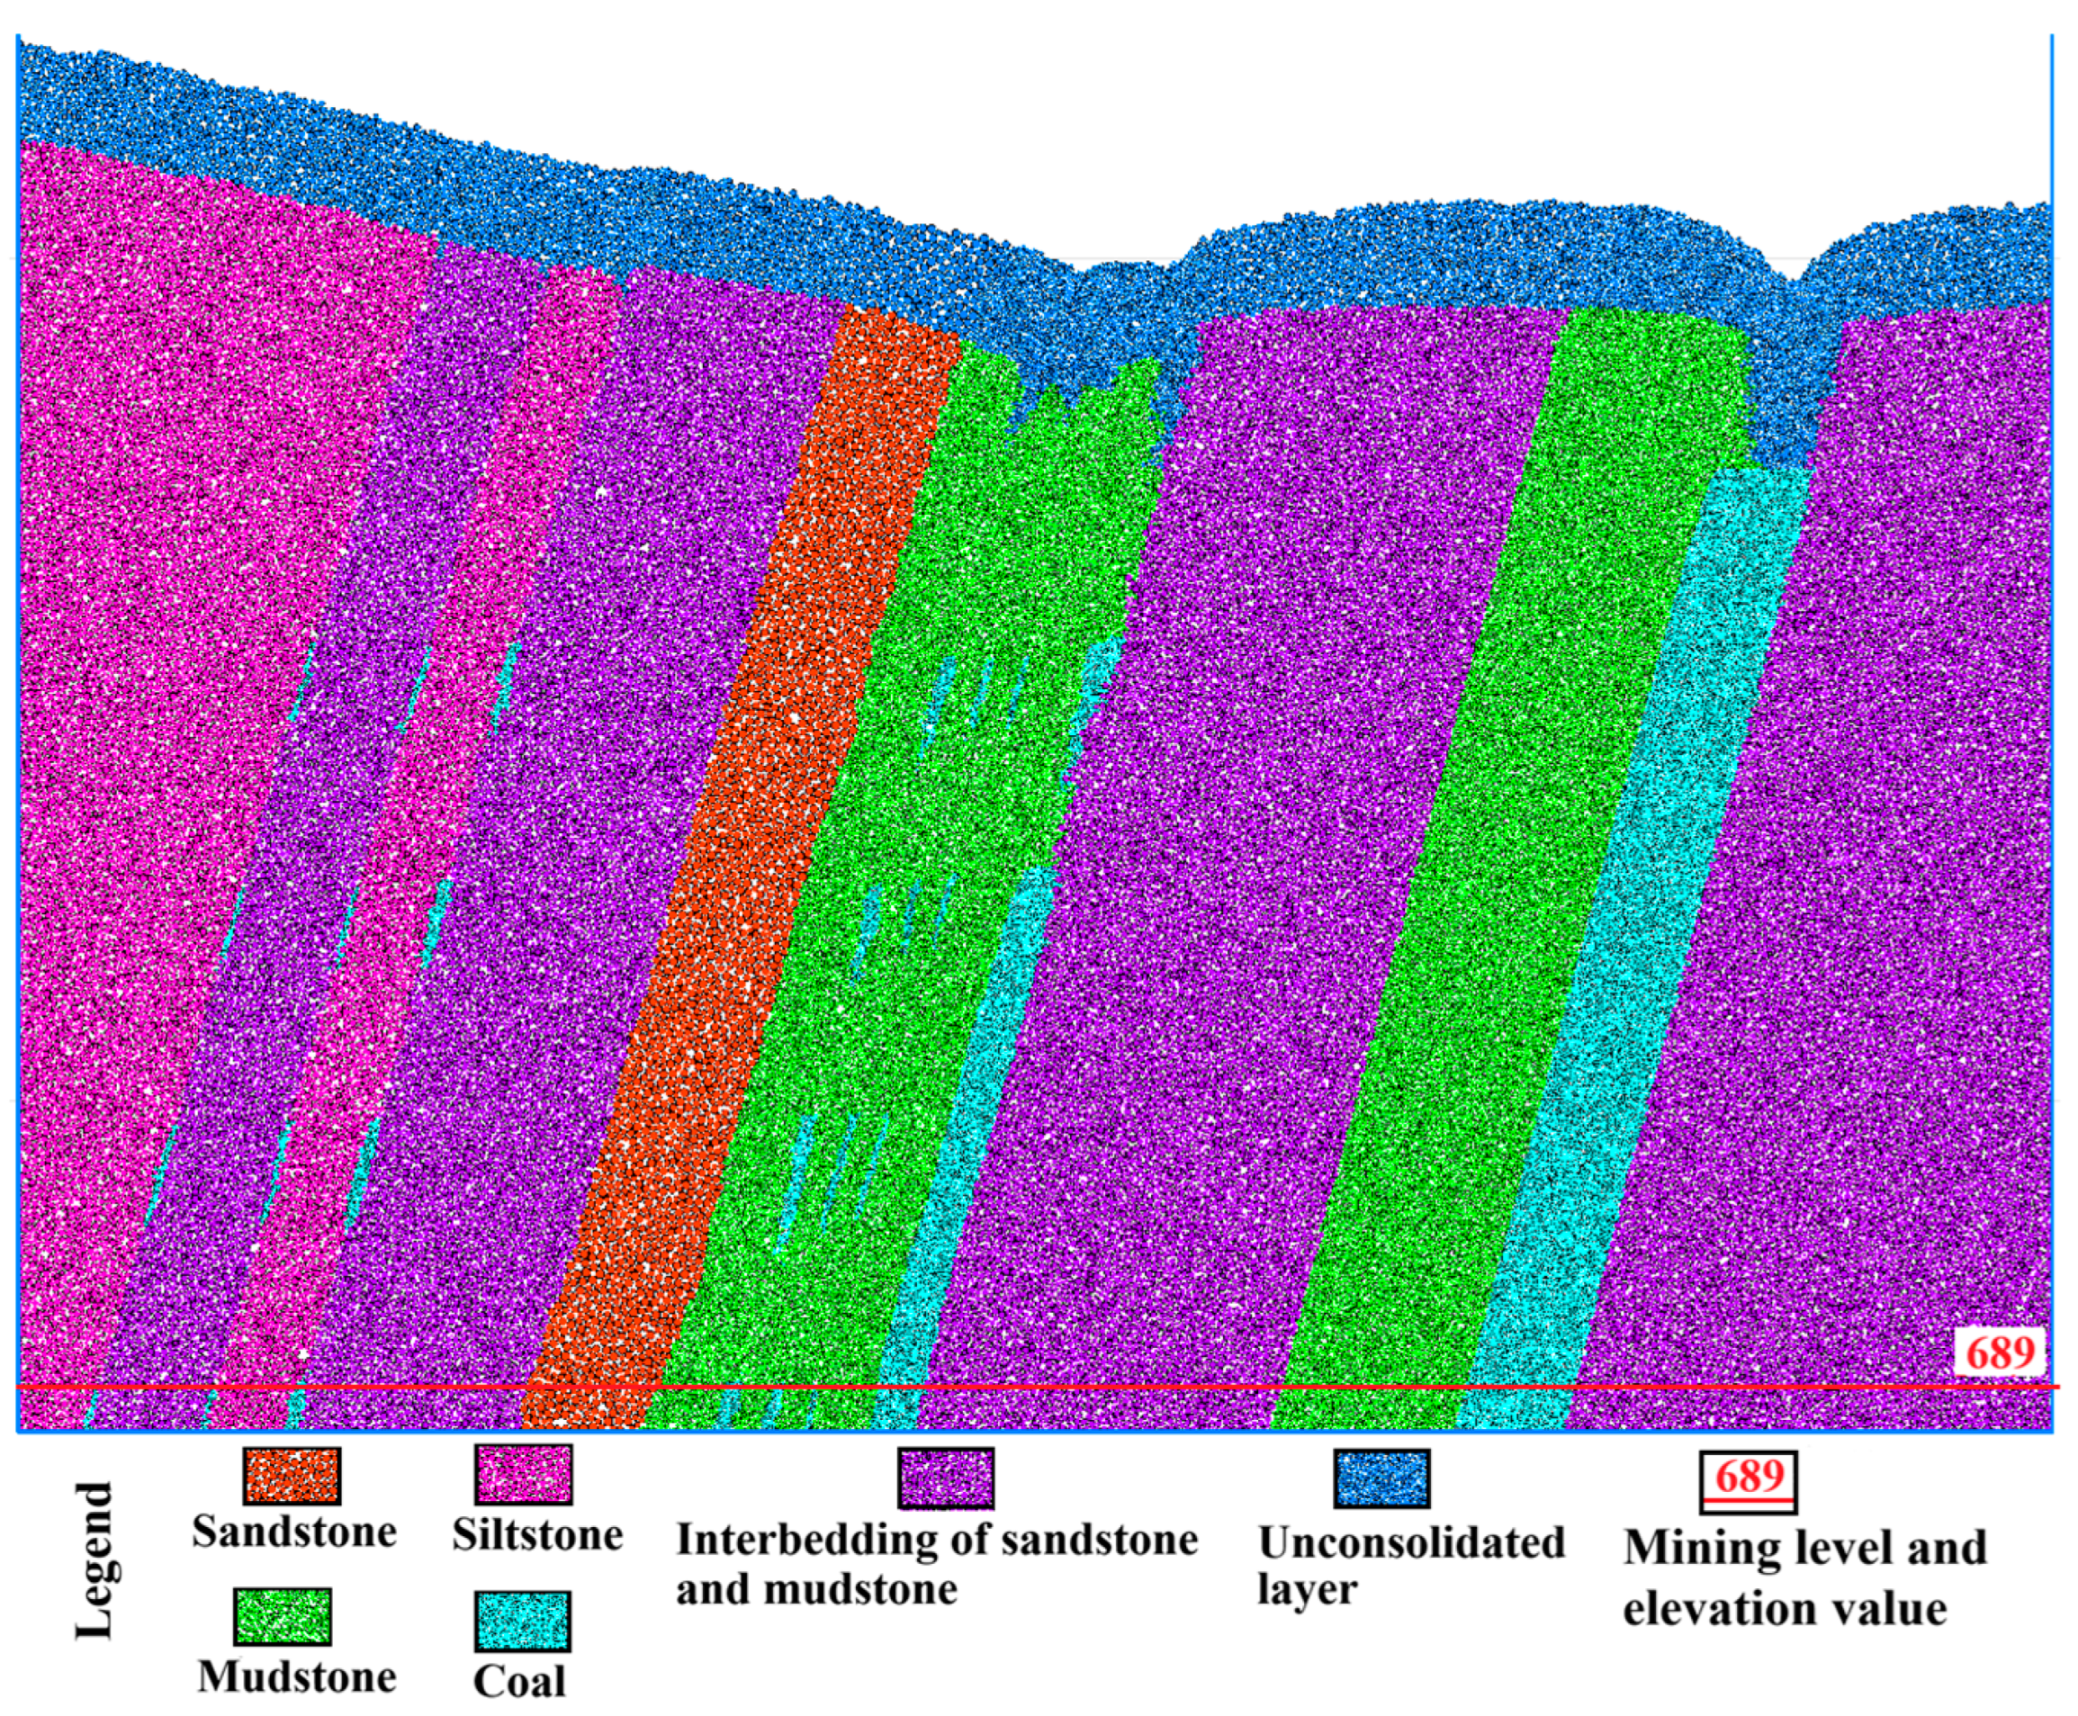
The PFC numerical simulation shows that during the mining process of steeply inclined, multi-seam, and multi-level coal seams, and after the mining of shallow coal seams, the coal seam roof becomes unstable and collapses in the anti-dip direction. The unconsolidated layer materials also fall and backfill, resulting in ground subsidence (Figure 9). After the mining of deep coal seams, in addition to the collapse of the coal seam roof in the anti-dip direction and the instability and collapse of the upper coal pillars, the overlying strata move along the dip direction of the coal seam and overall surface subsidence occurs (Figure 10 and Figure 11). The protective coal pillars have a certain self-stabilization capacity. The PFC numerical simulation indicates that under the unsupported bare rock condition, the instability of protective coal pillars lags behind that of the coal seam roof during the mining period (Figure 10b).
During program execution, the coal seams within the mining sections were completely removed to represent the “excavation” operation. Although the relevant literature indicates that the recovery rate of shrinkage stoping is relatively low, the analysis suggests that in the shrinkage stoping process, since no artificial support is installed and the roof rocks are allowed to collapse and form natural support, a large number of broken rock blocks are inevitably carried out during mining. From the perspective of underground space, the total volume of coal and rock excavated should be roughly equivalent to the volume of coal in the mining sections. Therefore, this treatment method adopted by the program is acceptable.

4.1.2. Simulation Results and Discussion

A comprehensive analysis of the historical development process of China’s coal mining industry reveals that the period before 1950 was characterized as a stage of unregulated small-scale coal mining, and the period from 1950 to 1990 consisted of small-scale mining. These two stages were characterized by relatively shallow mining depths and outdated technologies, thus being combined into the first stage (covering the elevation ranges of shallower than 880 m and 844–880 m). With the reform and opening of mines in the 1990s, the demand for means of production increased substantially and the scale of organized mining expanded gradually, though mining technology remained underdeveloped; this period was defined as the second stage (corresponding to the mining level at an elevation of 793–828 m). In 2009, technical renovations were implemented, which promoted the upgrading of coal mining technologies and further expanded the production scale. This development phase lasted until the closure of the coal mine in 2014 and was designated as the third stage (encompassing mining levels at elevations of 744–779 m and 689–724 m). Therefore, all of the calculated results were sorted and categorized into three phases for analysis: data up to 1990, data up to 2009, and data up to 2014 (Figure 4).
Taking profile 4–4′ as an example, by 1990, most coal seams above an elevation of 844 m had been mined. Significant ground subsidence with distinct gullies occurred in the B6 coal seam (with a large thickness) and the B7–B11–12 coal seam group (with small interlayer spacing) (Figure 9). By 2009, with mining at a deeper level of 793–828 m, the overall ground subsidence further increased; however, the deep gullies above the B6 coal seam were backfilled with collapsed materials, and the height difference between the gully bottoms and the ground surface slightly decreased instead (Figure 10). By 2014, as the deep coal seams were mined, the overall ground subsidence continued to rise, while the amplitude of surface undulation kept decreasing (Figure 11).
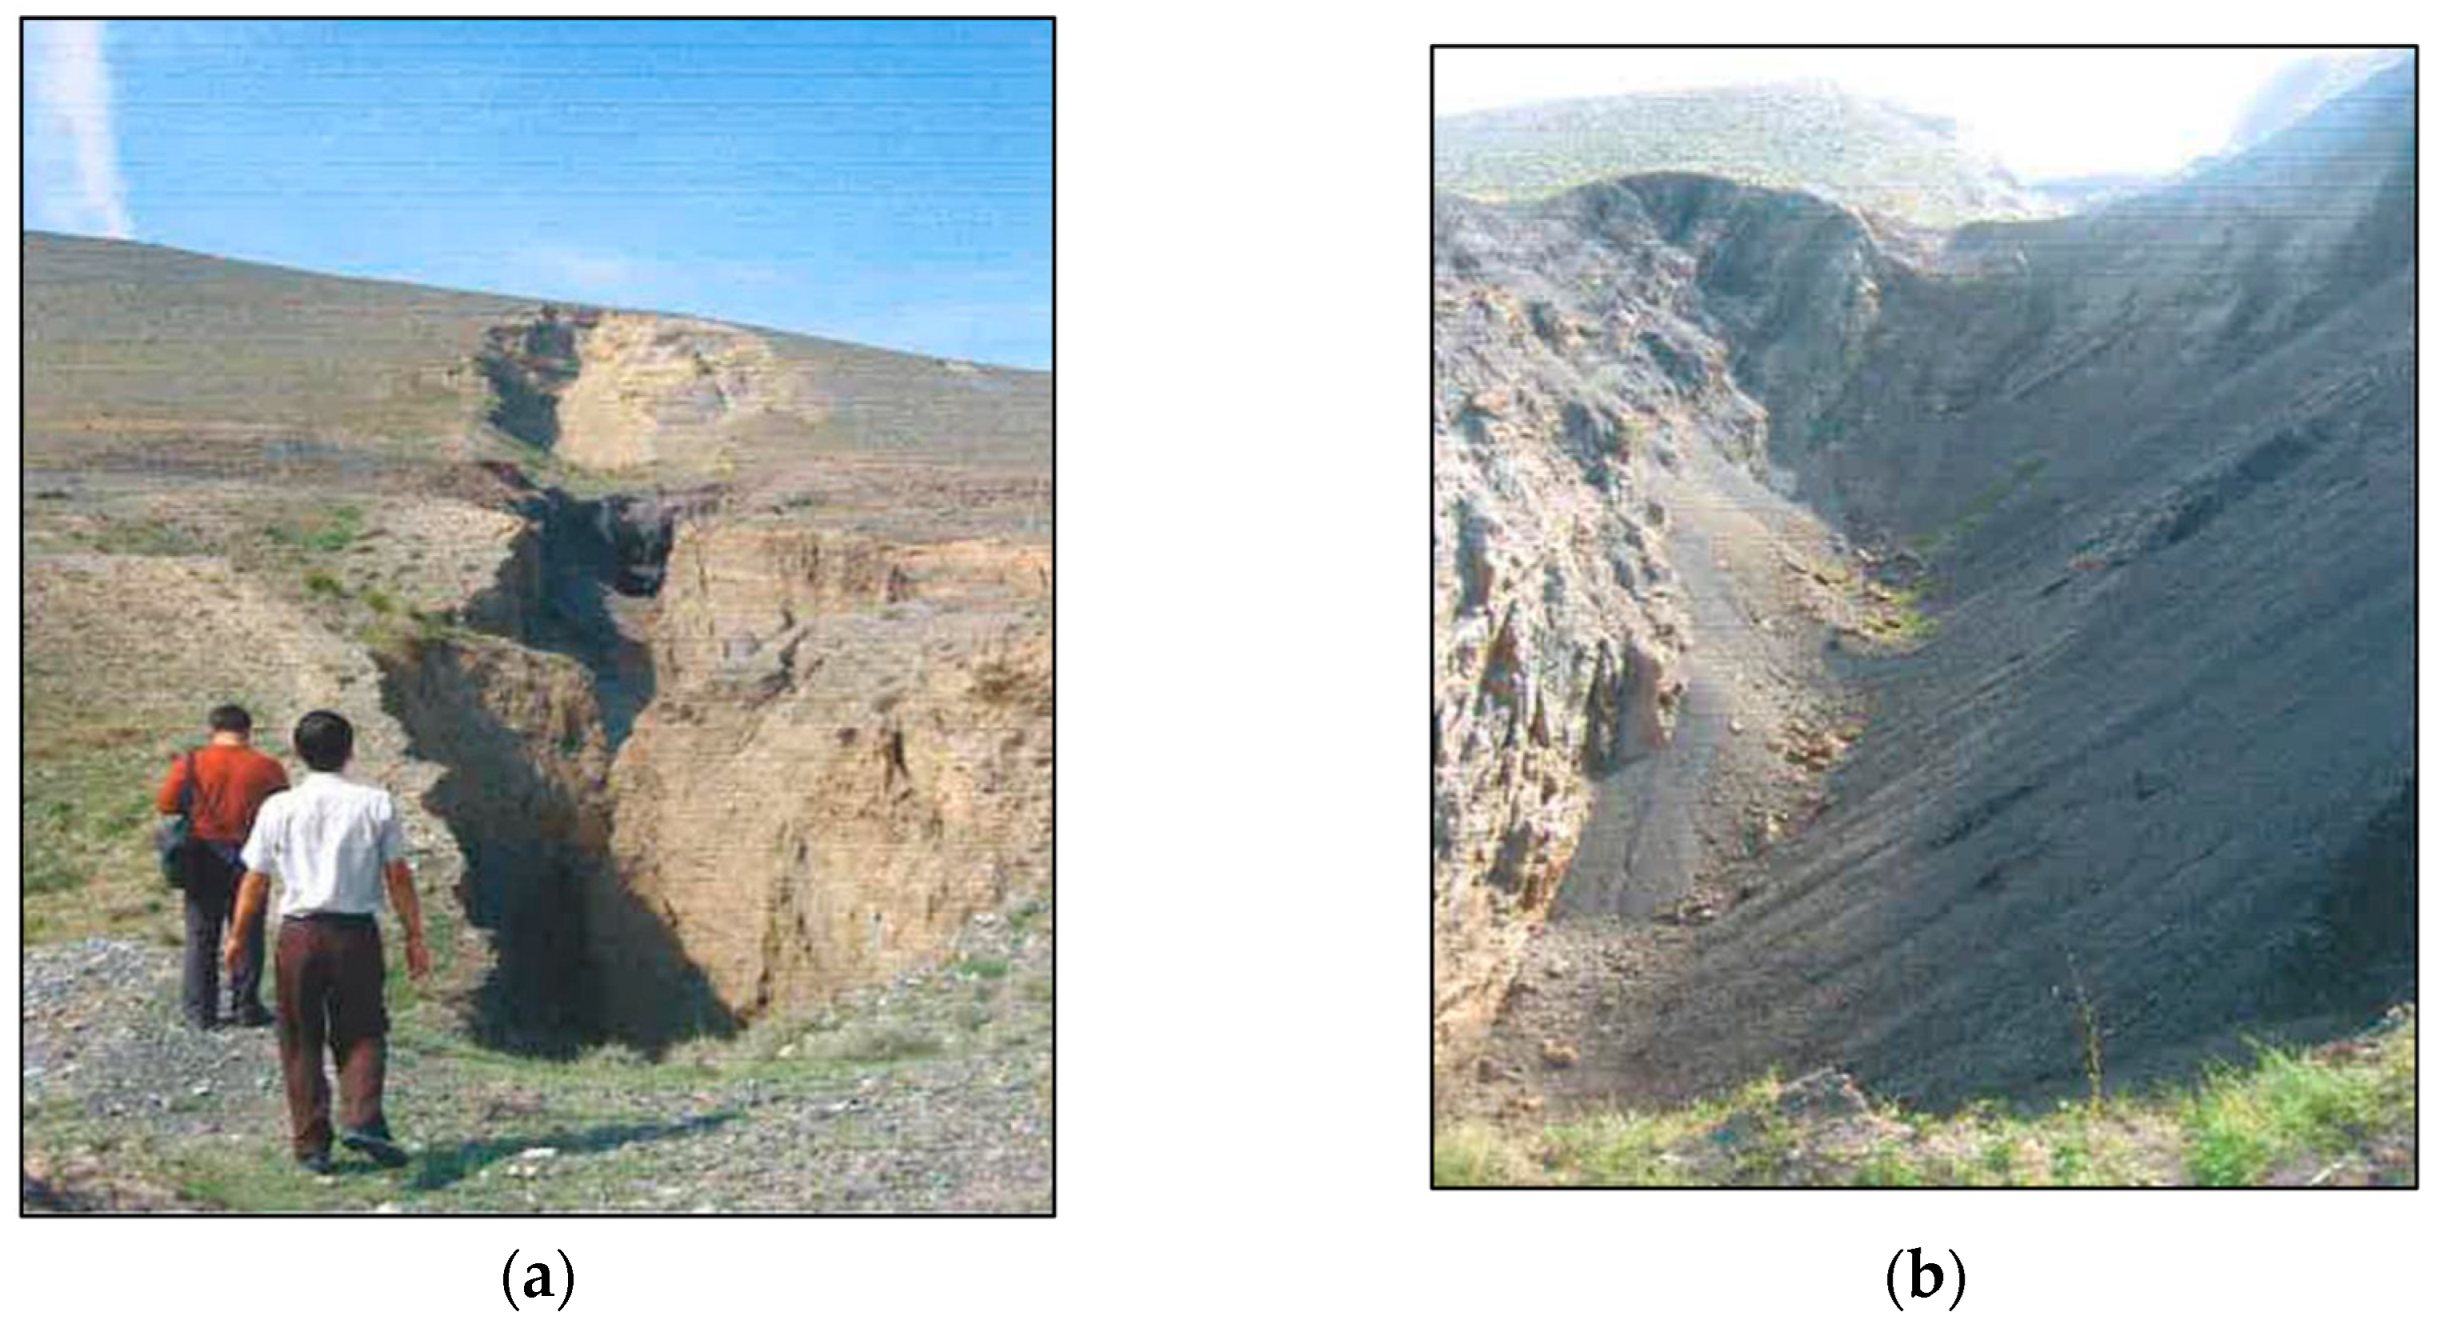
Based on the ground subsidence survey of goafs prior to 2006 provided in the geological investigation report, it can be observed that the initial goaf subsidence pits (grooves) had great depths and steep pit walls. With the collapse and backfilling of the pit walls, these formations evolved into shallow “V”-shaped depressions when reaching a stable state in the later stage (Figure 12). The simulation results are consistent with the actual conditions.

4.1.3. Reliability Analysis of the PFC2D Model

Comparative Calculation of the Maximum Subsidence Value
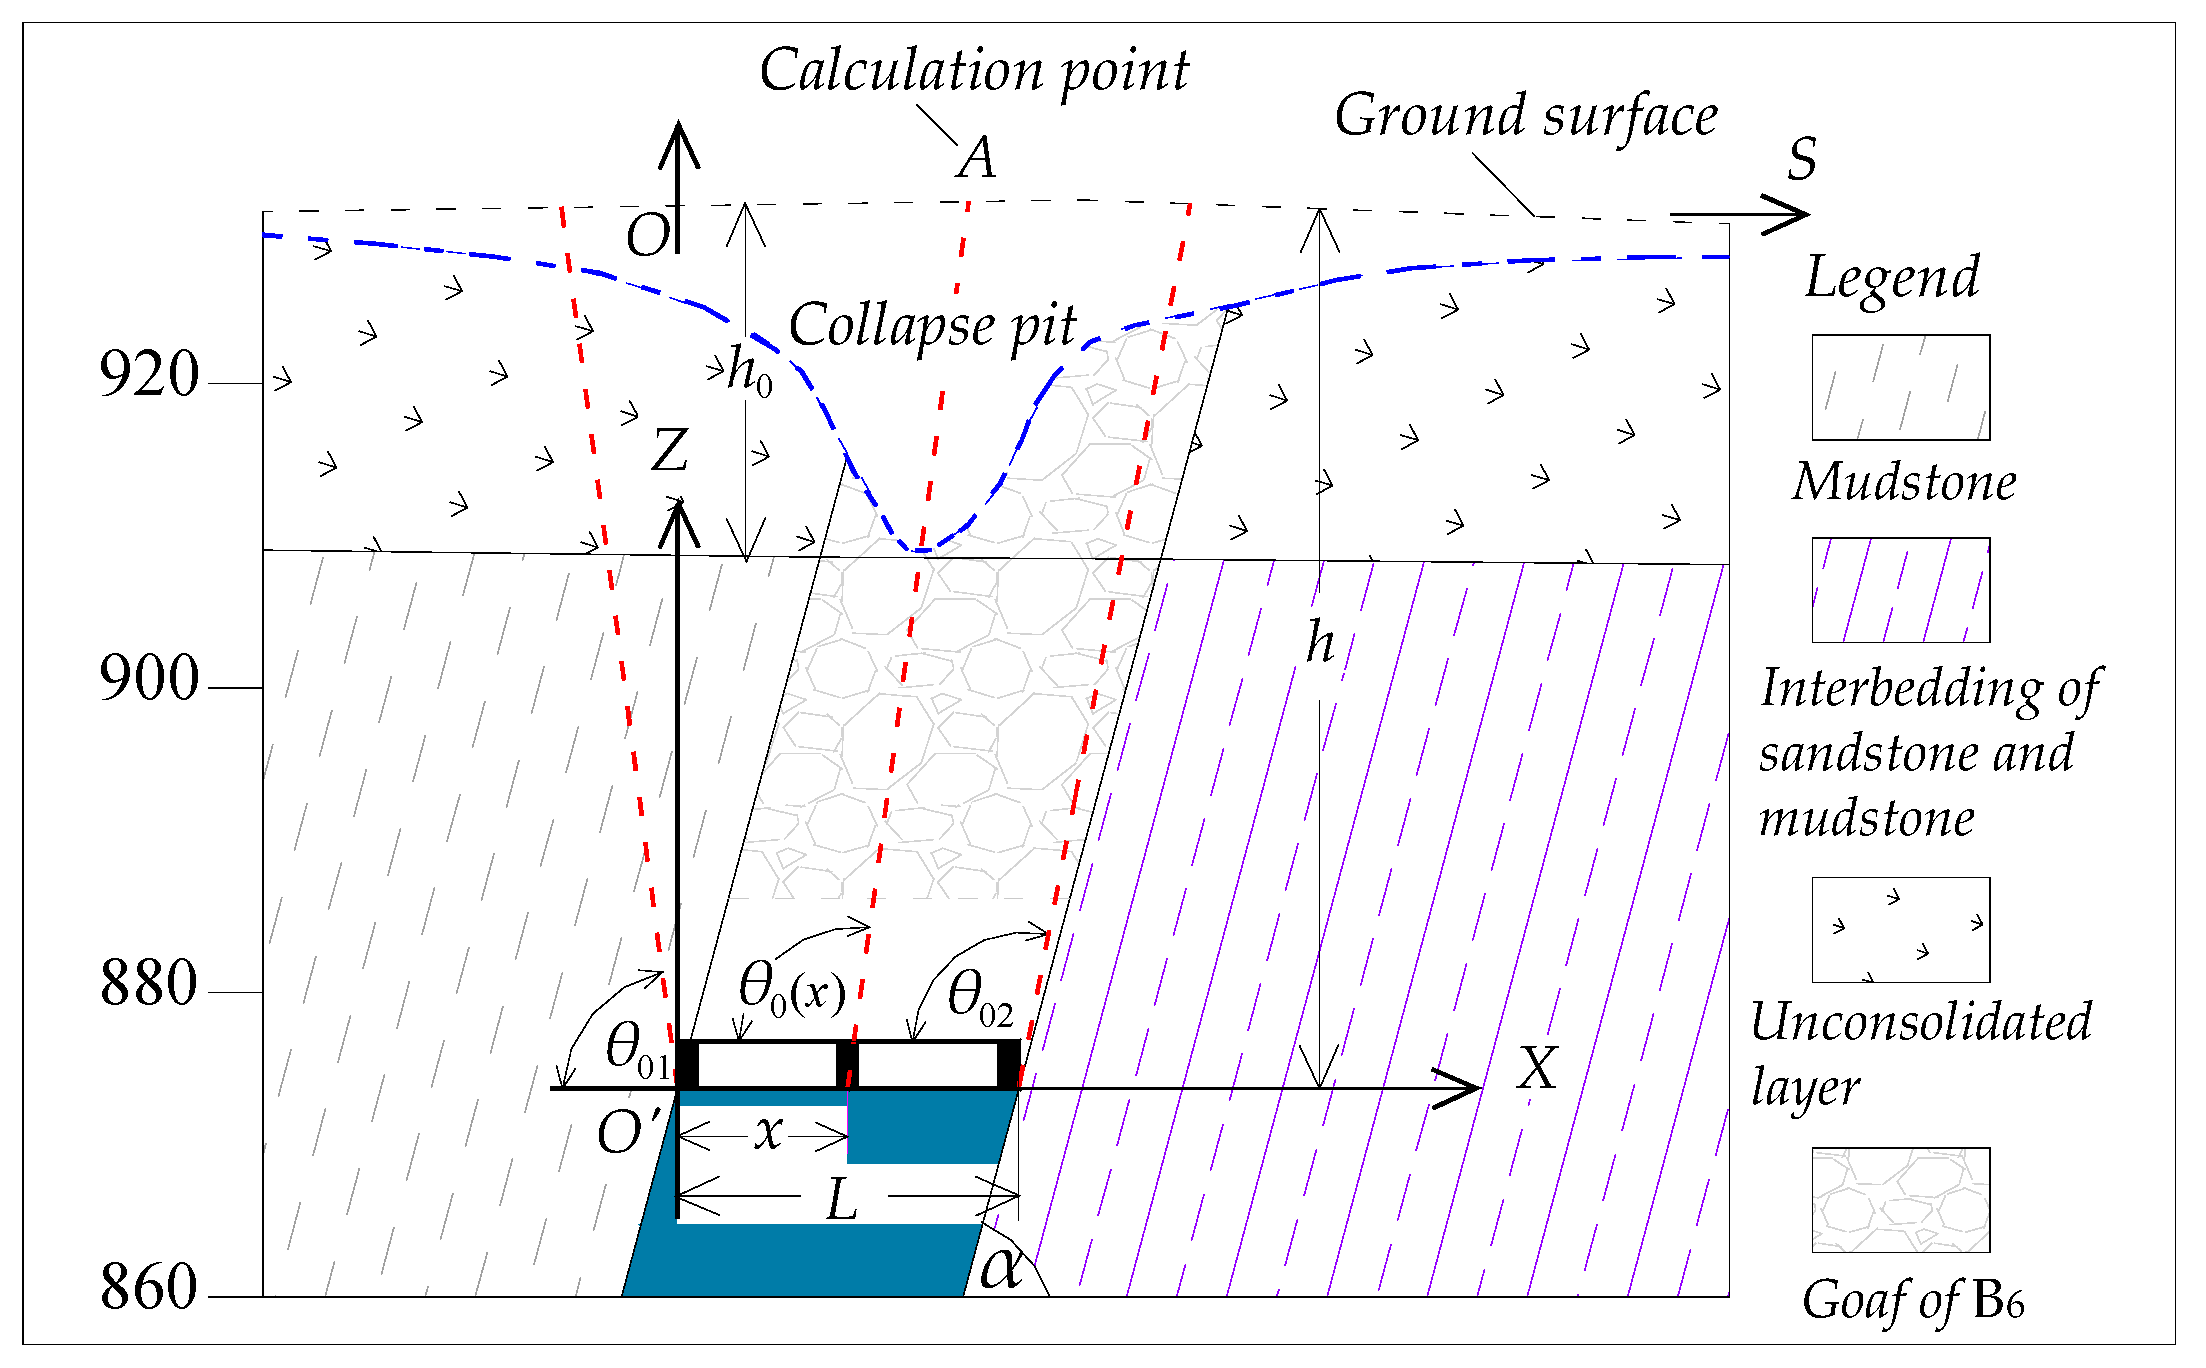
To verify the reliability of the PFC2D model in mining subsidence calculation, the method proposed in Reference [15] is adopted. Steeply inclined thick coal seams are regarded as being mined by stratified horizontal working faces, and the mining influence propagation angle is introduced to calculate the subsidence value (Equations (11)–(13)).
θ 0 ( α , x ) = θ 01 + x L ( θ 02 θ 01 ) = 90 ° [ k 1 + x L ( k 2 k 1 ) ] ( 90 ° α )
where θ0 is the mining influence propagation angle (°); θ01 and θ02 are the mining influence propagation angles of the roof and floor, respectively (°); and θ 01   = 90 ° k 1 ( 90 ° α ) , θ 02   = 90 ° k 2 ( 90 ° α ) , k1 and k2 are the mining influence propagation coefficients, respectively.
W e ( x , z ) = 1 r z exp { π [ x z cot θ 0 ( x ) ] 2 r z 2 }
where We(x,z) is the subsidence value of point (x, z) caused by unit mining; and rz is the main influence radius of the subsidence basin where the depth of the overlying rock from the working face is z. For the whole unit thickness seam mining, the subsidence value We(s) of surface point A with horizontal coordinate s, is the sum of the subsidence values caused by each unit mining in the range of 0 to L. In this case, z = h and rz = r.
W e ( s ) = 0 L 1 r exp { π [ x s h cot θ 0 ( x ) ] 2 r 2 } d x
Figure 13 shows the area enclosed by box A intercepted from Figure 2. The B6 coal seam within this mining range meets the mining conditions of extra-thick steeply inclined coal seams. In practice, the B6 coal seam above the elevation of approximately 873.7 was mined by stratified horizontal mining (Figure 13).
According to the principles of Equations (11)–(13), the B6 coal seam is regarded as being mined horizontally from its full thickness up to the surface. Using the mining influence propagation angle from the probability integral method, the maximum surface subsidence value at point A is calculated and compared with the numerical simulation results. The results indicate that the relative deviation between them is very small (Table 6).
According to the probability integral method, the mining subsidence coefficient q is calculated as follows:
q = W max M cos α
where Wmax is the maximum subsidence value (m); M is the mining thickness (m); α′ is the dip angle of the slice mining face, and α′ = 0 for horizontal slicing.
As can be seen from Figure 13, during horizontal slicing mining, the mining thickness of the B6 coal seam can be taken as M = hh0 = 34.9 m, and the maximum subsidence value from numerical simulation is Wmax = 22.9 m. Here, cosα′ = 1, so the subsidence coefficient q = 0.66 is obtained according to Equation (14).
Reference [35] provides recommended values for the subsidence coefficient, suggesting a range of 0.55–0.84 for Mesozoic medium-hard strata, which is applicable to the study area. The subsidence coefficient q = 0.66 calculated from the maximum subsidence obtained by numerical simulation lies exactly within this range. This further demonstrates the reliability of the numerical simulation results.
Through the above comparison with the probability integral method and the national standards, it can be concluded that the accuracy of the PFC numerical simulation is reliable.
Sensitivity Analysis of PFC2D Model Parameters
The calibration results of the PFC model in this study are generally satisfactory. However, the cohesion of sandstone exhibits a relatively large deviation from the laboratory test values, reaching 26.3% (Table 3). Despite the limited distribution of sandstone only in Layer ⑧, it remains unclear whether this deviation affects the simulation results and to what extent.
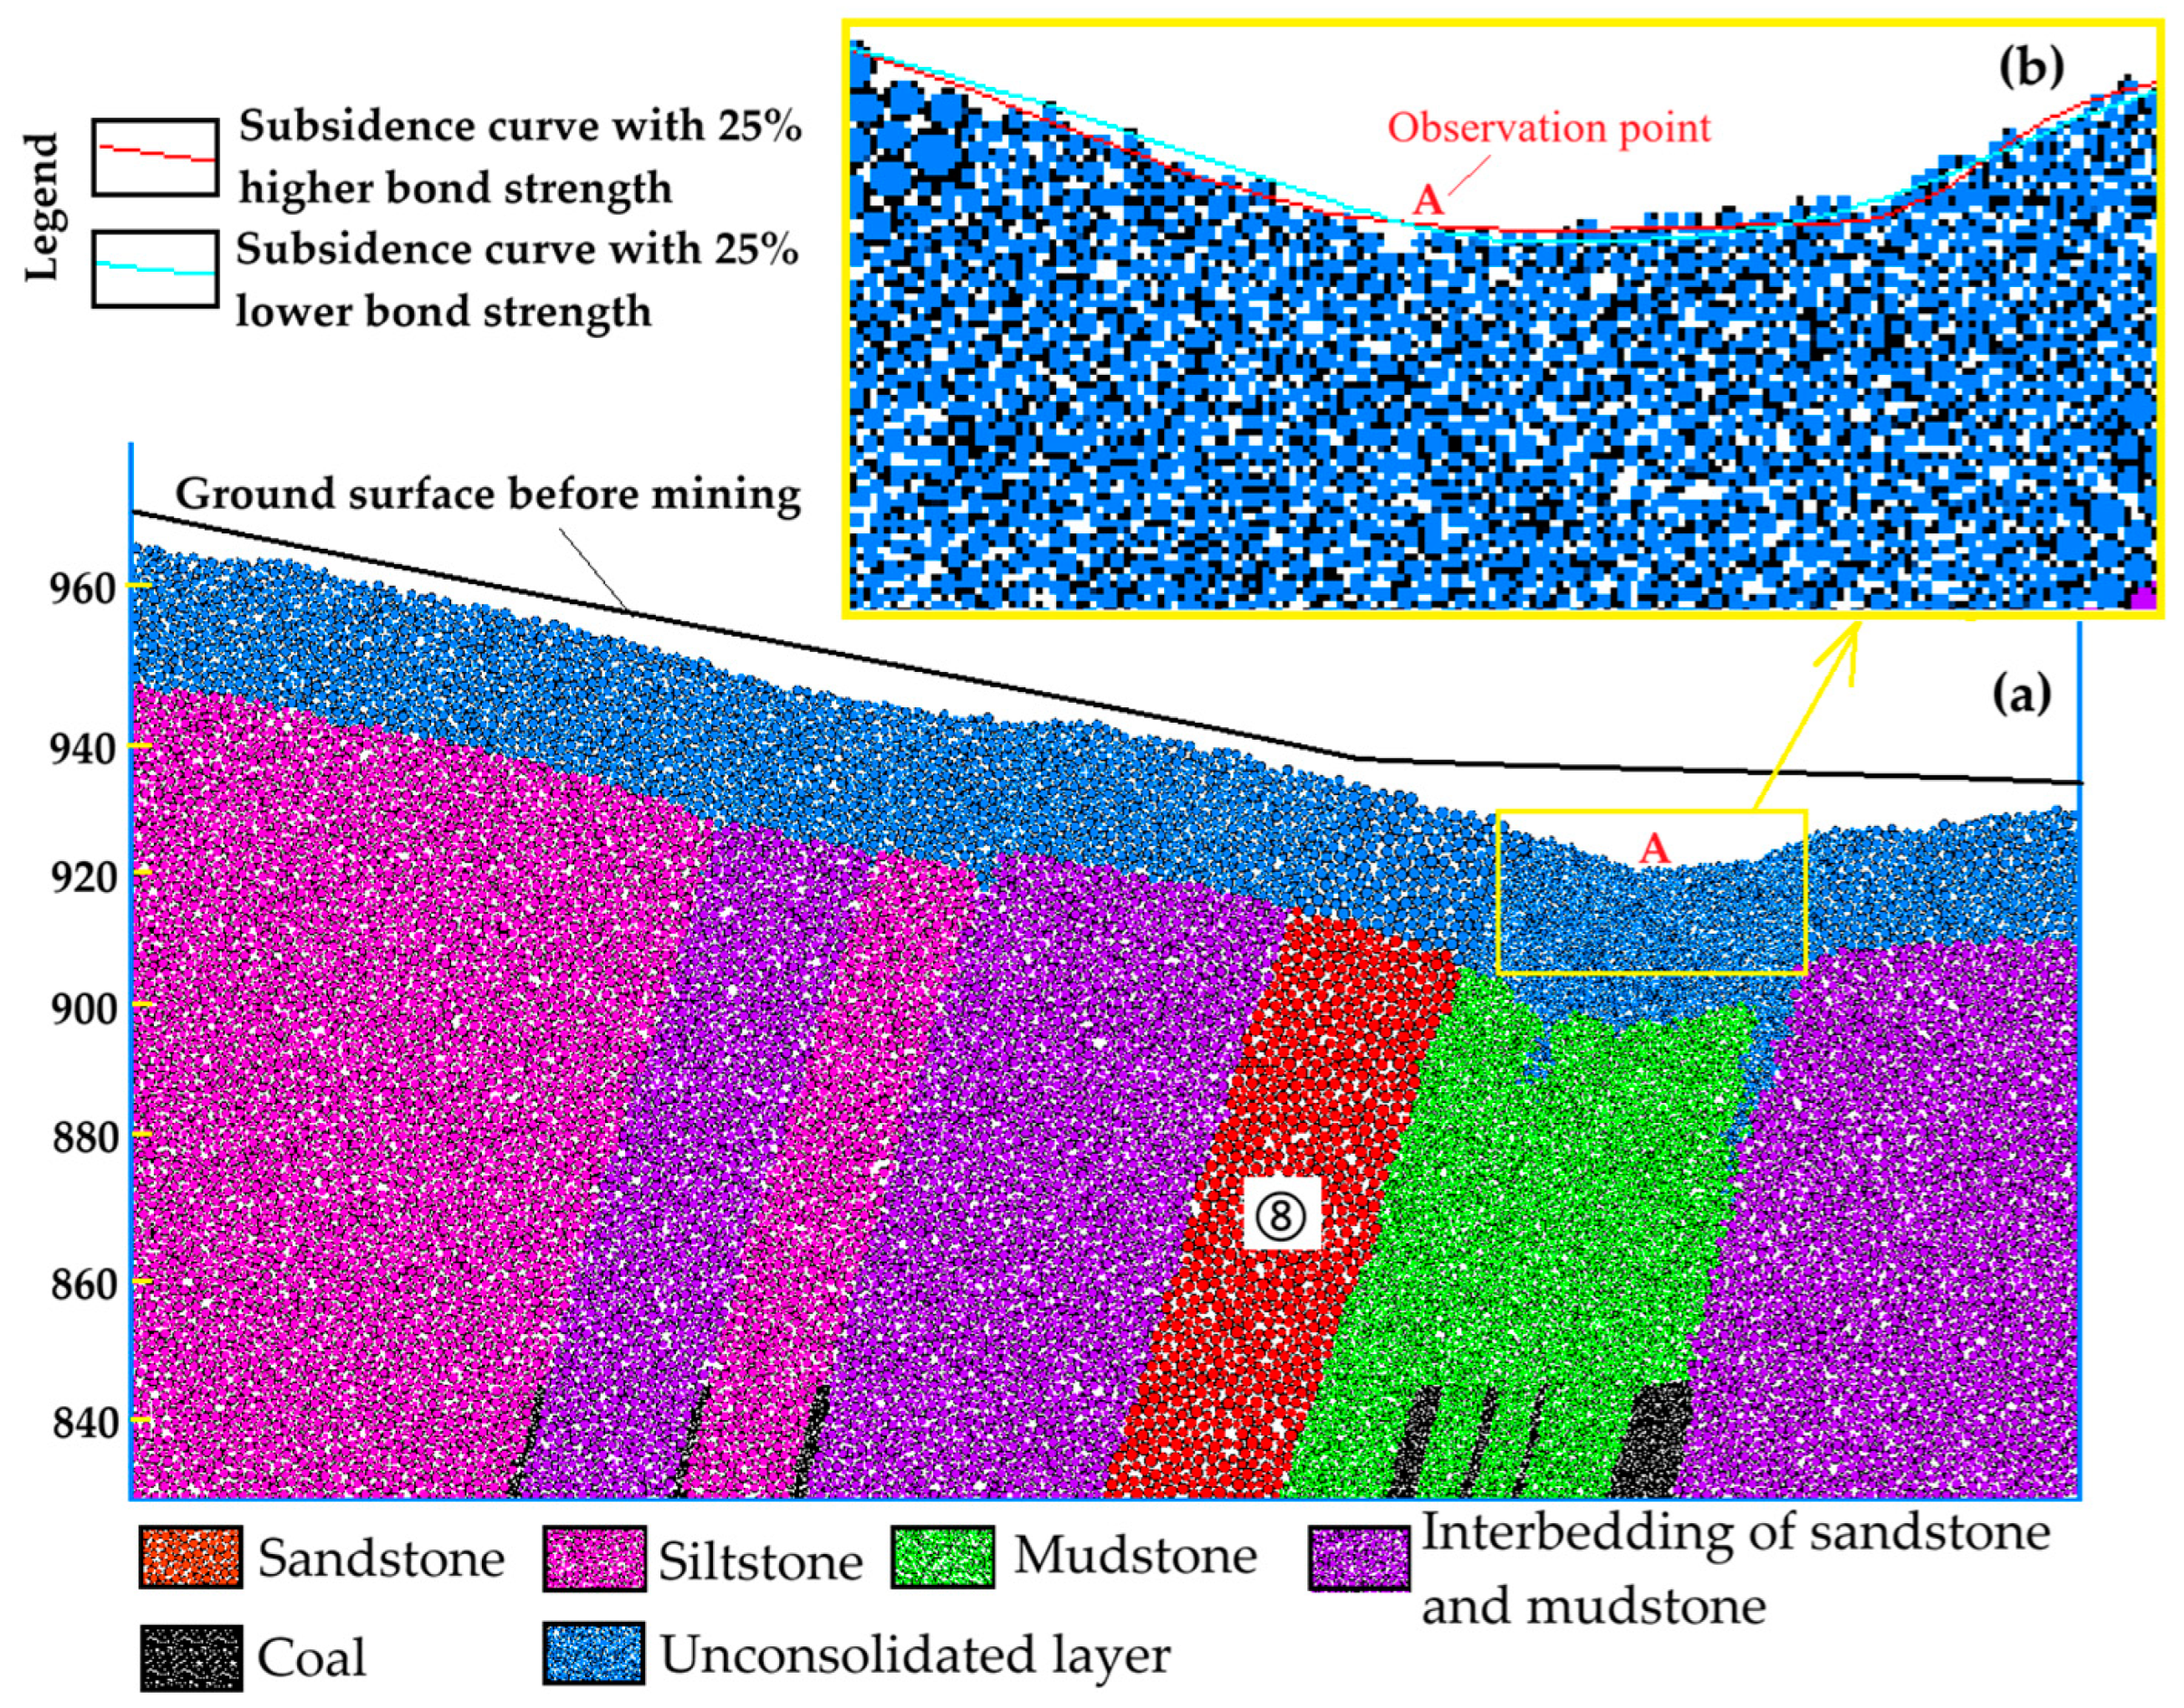
To evaluate the model sensitivity to this parameter deviation, a verification region B was extracted from Figure 2, and a small-scale numerical model was reconstructed accordingly. Within this small-scale model, the Layer ⑧ sandstone constitutes the overlying strata for the B7, B8, B9, and B11–12 coal seams, whose mechanical properties govern the mining-induced subsidence of these coal seams. As this is a validation test, the bottom boundary of the small model was set at an elevation of 828 m, and only coal seams above the 844 level were considered in the calculation.
In this model, the mesoscale parameters corresponding to the macroscopic rock cohesion are mainly the parallel bond normal strength ( σ c ¯ ) and parallel bond shear strength ( τ c ¯ ). In general, rock cohesion and elastic modulus exhibit a nonlinear but positive correlation. The mesoscale parameter corresponding to the macroscopic elastic modulus is the particle contact modulus (Ec).
Small-scale numerical simulations for parameter sensitivity verification were performed under the following three scenarios:
  • Recalculation with original parameters. The small-scale model was recalculated using the original parameters: σ c ¯ = 18.0 MPa, τ c ¯ = 9.0 MPa, and Ec = 4.22 GPa.
  • Parameter strengthening. The cohesion-related parameters were increased by 25%, and the particle contact modulus was adjusted accordingly: σ c ¯ = 22.5 MPa, τ c ¯ = 11.25 MPa, and Ec = 5.22 GPa. Since the quantitative relationship between particle contact modulus and bond cohesion is not explicitly defined, the particle contact modulus was increased by 1 GPa based on their positive correlation.
  • Parameter weakening. The cohesion-related parameters were reduced by 25%, and the particle contact modulus was decreased accordingly: σ c ¯ = 13.5 MPa, τ c ¯ = 6.75 MPa, and Ec = 3.22 GPa. The particle contact modulus was reduced by 1 GPa for the same reason.
Following the simulation of the small-scale model with the original parameters, the deformed configuration shows a large collapse pit above the B7, B8, B9, and B11–12 coal seams, with a maximum surface subsidence of approximately 14.2 m near Point A.
Based on the numerical results under parameter strengthening and parameter weakening, the corresponding surface subsidence curves are superimposed on the profile from the recalculation with original parameters. It can be seen that the overall surface deformation is minimal, with only slight differences within the large collapse pit and almost no visible variation at other locations (Figure 14a).
Upon close examination of the large collapse pit, subtle differences can be identified: to the left of Point A, the subsidence curve under parameter weakening is slightly higher than that under parameter strengthening, while the opposite trend is observed to the right of Point A (Figure 14b).
The Layer ⑧ sandstone stratum acts as a “beam”. Under parameter weakening, the supporting effect of the beam is diminished, making it more susceptible to toppling toward the anti-dip direction. This behavior pushes the overlying unconsolidated layer and induces a certain extent of uplift. Nevertheless, above the goaf of the B7 coal seam, the collapse effect outweighs the pushing effect because of the greater thickness of the B7 coal seam and the more intense goaf collapse, leading to larger subsidence.
Under parameter strengthening, the beam-like supporting effect of the Layer ⑧ sandstone is more pronounced, and the goafs associated with the B7–B11–12 coal seam group are dominated by collapse.
Although subsidence differences exist between the parameter-strengthened and parameter-weakened cases, the actual magnitude of discrepancy remains minor: about 0.65 m to the left of Point A and 0.45 m to the right. These values correspond to only 3.2–4.6% of the maximum subsidence (14.2 m) in the large collapse pit. Relative to the results of recalculation with original parameters, the deviations are even smaller.
These results demonstrate that even if some deviation exists in the cohesion of the Layer ⑧ sandstone during the modeling process, its impact on subsidence is small and localized. Consequently, this deviation can be neglected for the global model, confirming that the numerical simulation results are credible and robust.

4.2. Simulation Results and Discussion on Goaf Compaction

4.2.1. Simulation Results of Goaf Compaction

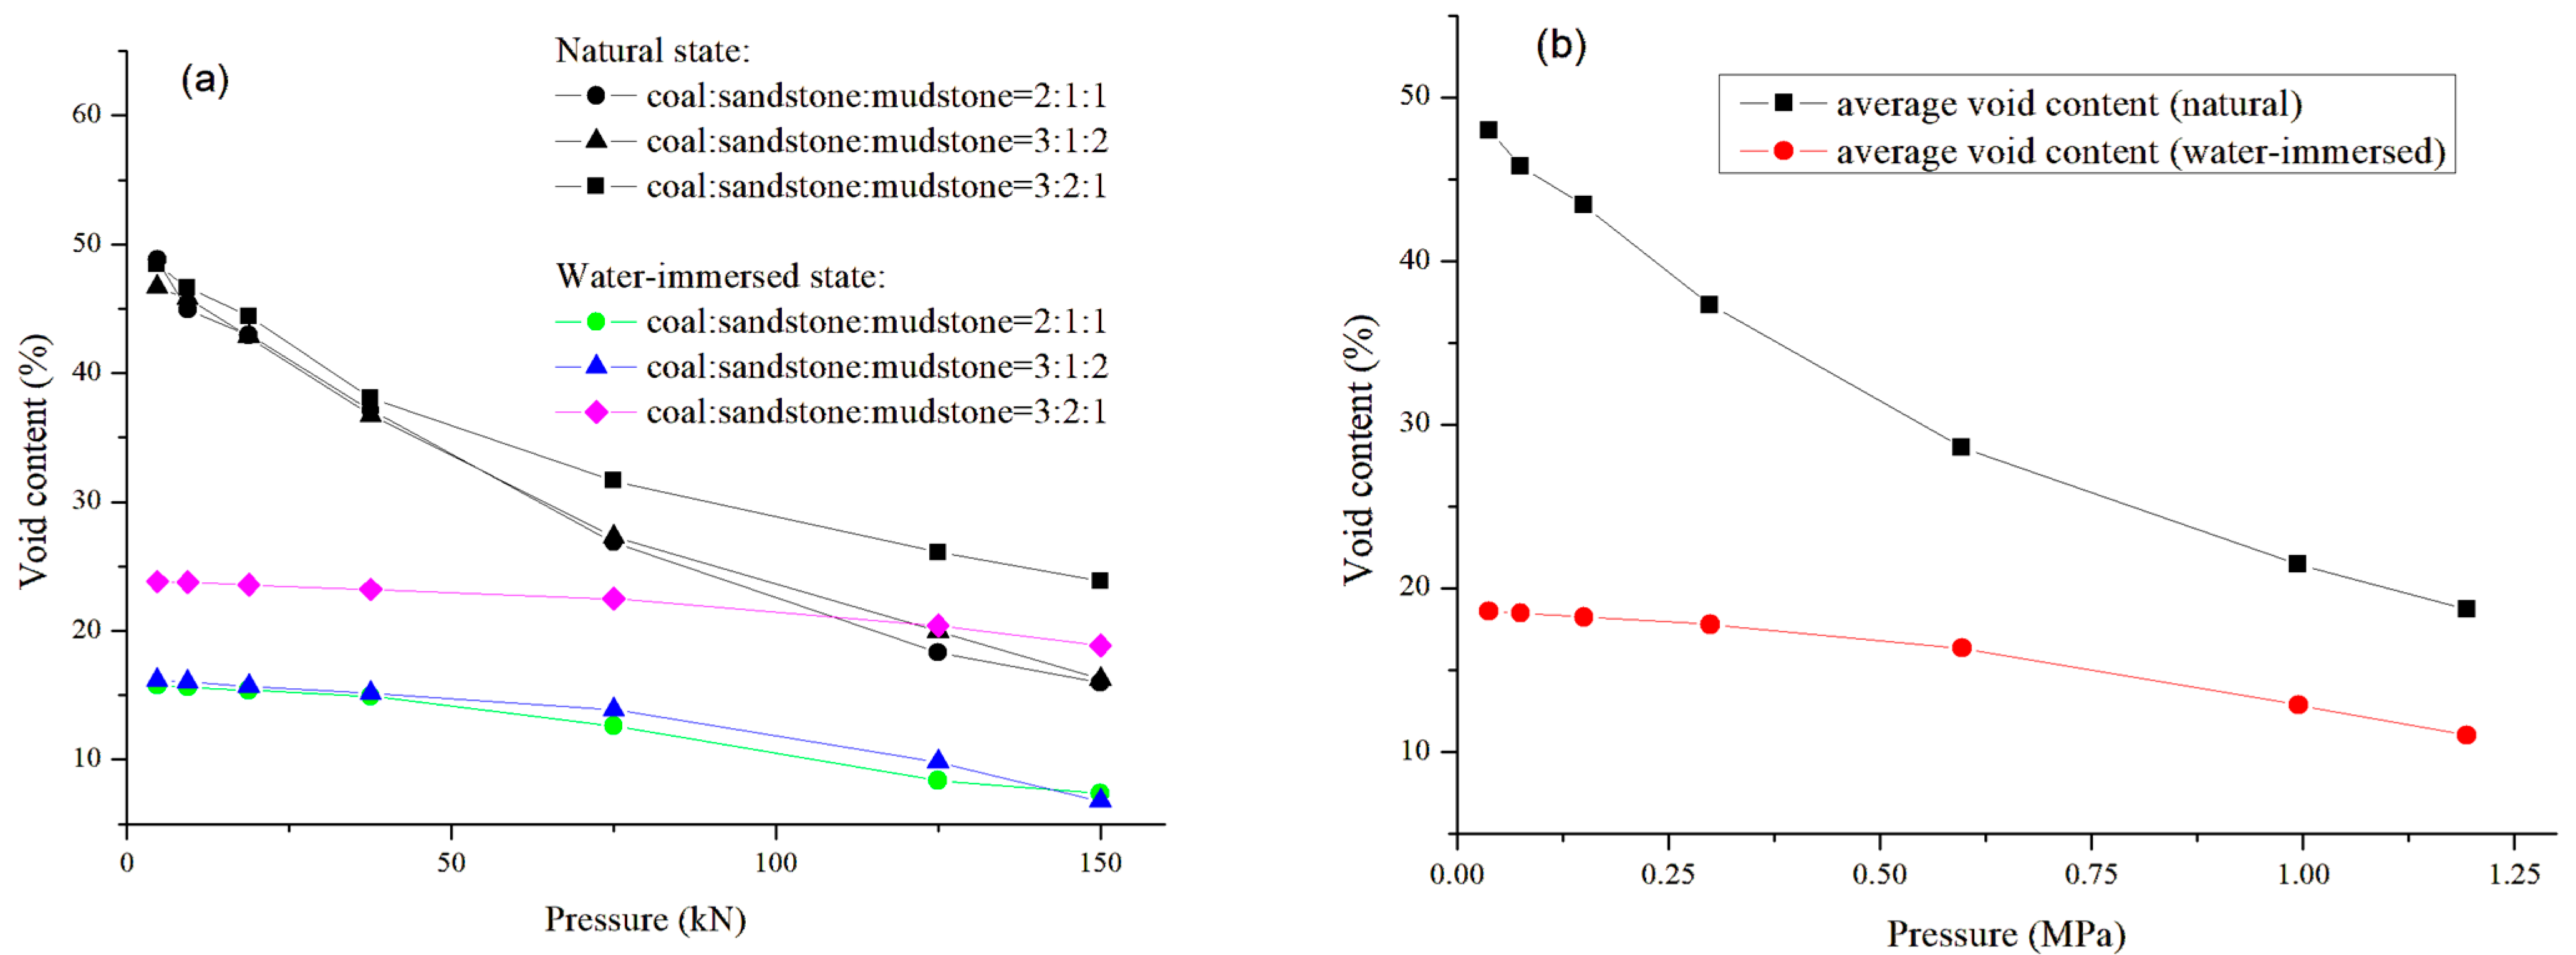
Referring to the recovery rate of shrinkage stoping, the initial void content was set at 50%. The pressure–void content variation curve of the coal–rock mixture was derived from the physical simulation experimental data. It can be observed that under different coal–rock proportion conditions, the pressure–void content curves of the samples in the natural state are relatively close. However, after 24 h of water immersion, the void content under the condition of coal/sandstone/mudstone = 3:2:1 is relatively high, which should be attributed to the poor softening properties of sandstone (Figure 15a). According to the geological survey data, the maximum mining depth of the coal mine is approximately 200 m. After conversion based on the overlying rock density and similarity ratio, this depth is roughly equivalent to a load level of 75 kN (0.597 MPa) in the physical simulation experiment of void content. The corresponding natural void content of the goaf is about 28.60%, and the void content under water-immersed conditions is about 16.33% (Table 7, Figure 15b).
Whether the samples are in a natural state or a water-immersed state, the relationship between the average void content and pressure shows a negative exponential correlation. Through curve fitting, the relational expressions between void content and pressure for natural samples and water-immersed samples can be obtained, respectively:
N 0 = 48.483 e 0.818 P ( R 2 = 0.9967 )
N s = 19.588 e 0.436 P ( R 2 = 0.9472 )
where
  • N0—Void content of natural samples/%;
  • Ns—Void content of water-immersed samples/%;
  • P—Vertical pressure of the container/MPa.

4.2.2. Relationship Between Displacement and Void Content and Discussion

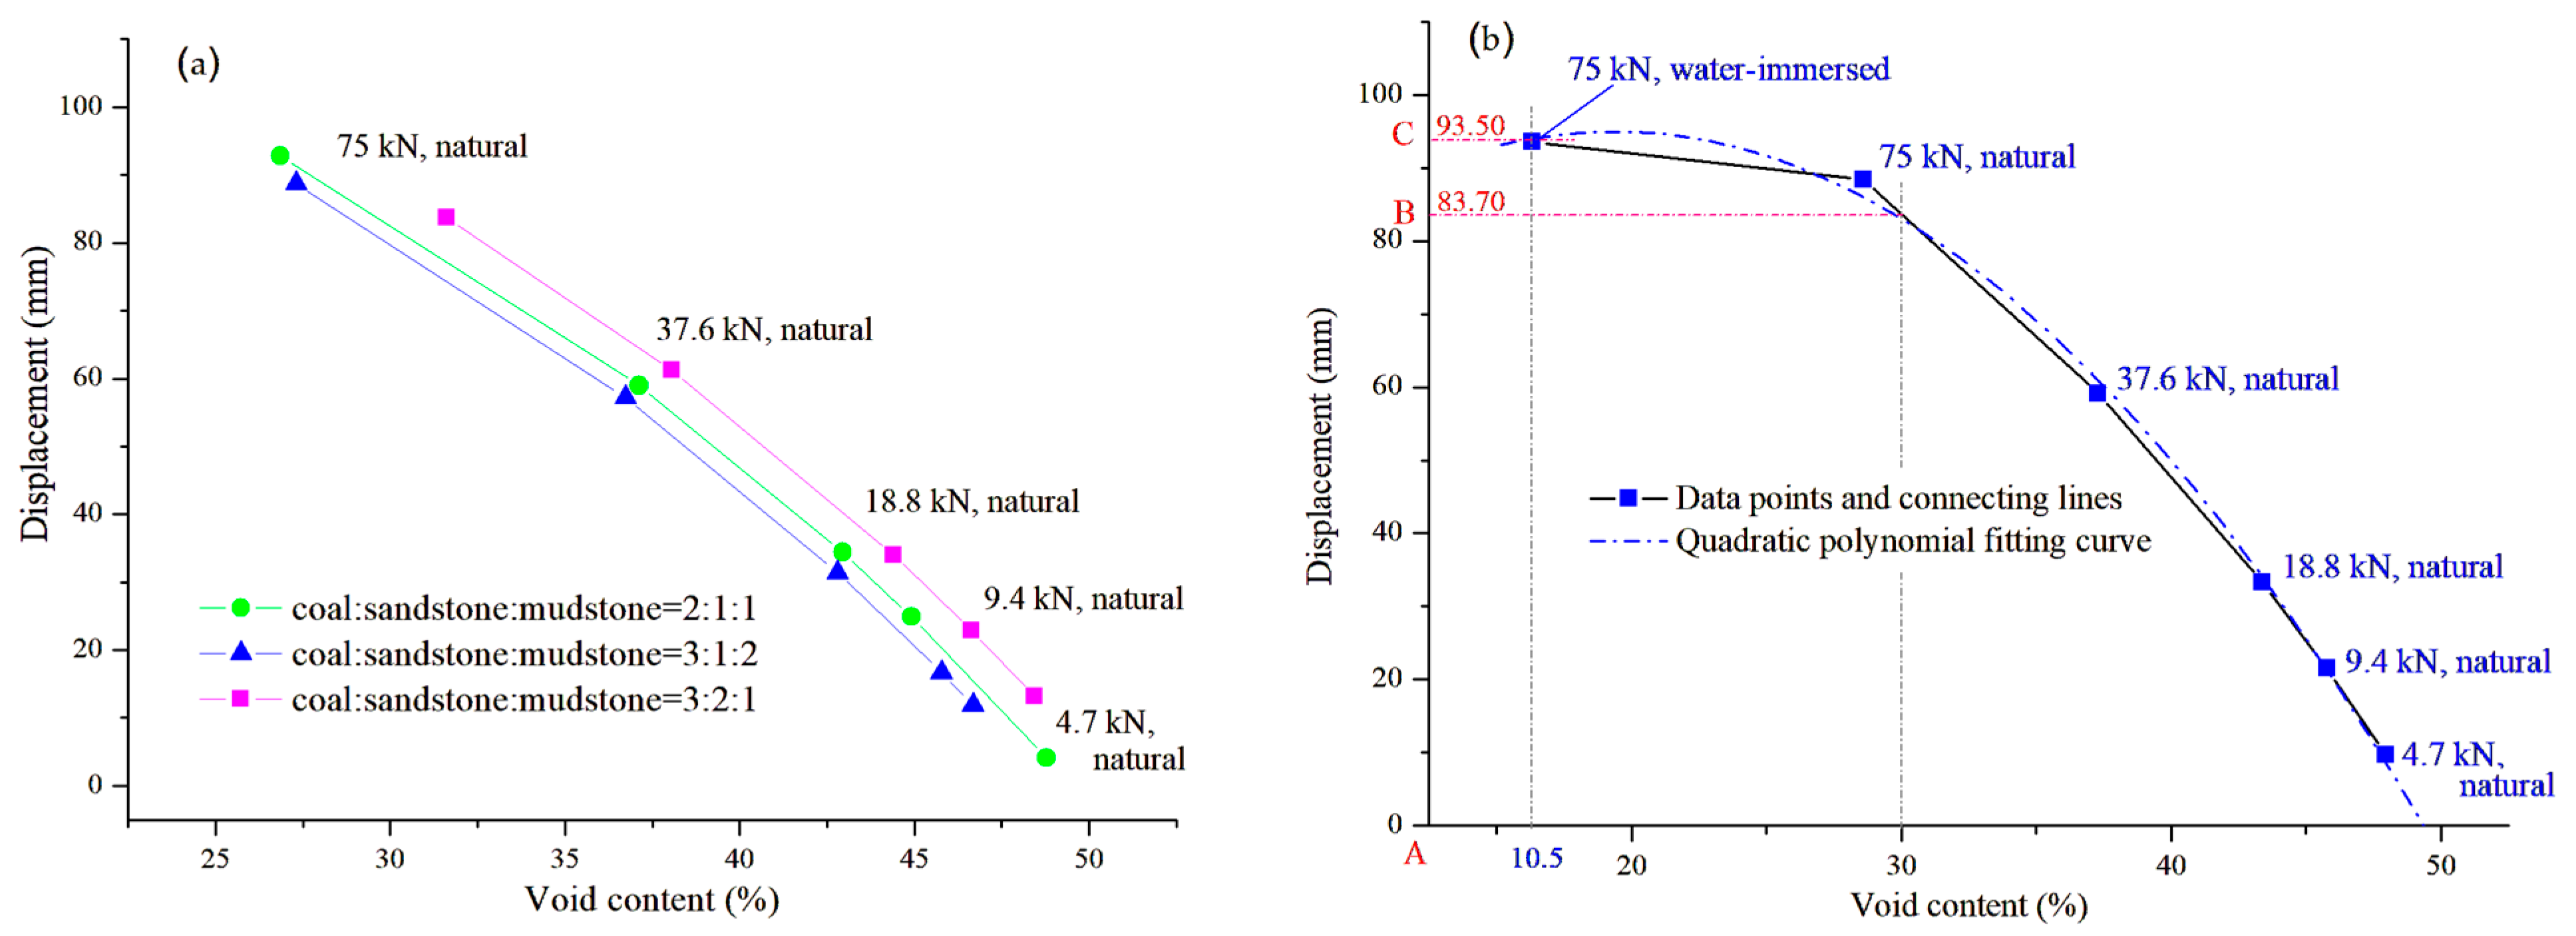
As mentioned above, the experimental pressure equivalent to the maximum mining depth is 75 kN. From the scatter plot of void content and displacement, it can be seen that there is a very high linear correlation between displacement and void content. The correlation coefficients of the linear fitting are 0.9887 (coal: sandstone: mudstone = 2:1:1), 0.9931 (coal: sandstone: mudstone = 3:1:2), and 0.9947 (coal: sandstone: mudstone = 3:2:1), respectively (Figure 16a).
It can be seen from Equations (9) and (10) that there are only two variables in the formulas: displacement (L) and void content (N). Therefore, there must be a linear correlation between them. The void content can be calculated from the change in displacement, and conversely, the displacement can also be calculated back from the void content. Following this line of thinking, the remaining subsidence of the goaf can be inferred based on the void content.
Based on the survey data of the study area, the average void content of the rock mass in the caving zone of the goaf under current conditions is 30%. According to the results of the simulation experiment, the final void content of the goaf could reach 16.33% under the conditions of groundwater level recovery. On this basis, the corresponding displacement value can be calculated from the “displacement–average void content” curve: the total displacement corresponding to a void content of 16.33% is 93.50 mm (AC), and the displacement under the current conditions corresponding to a void content of 30% is 83.70 mm (AB). Therefore, BC represents the residual displacement. After calculation, BC/AC ≈ 0.105. It can thus be concluded that the residual displacement under the current conditions in the study area accounts for approximately 10.5% of the total displacement (Figure 16b).

5. Prediction of Ground Residual Subsidence in Goafs

5.1. Prediction Result

The mining depth corresponding to the elevation of 844 m is about 80 m (equivalent to the mining level up to 1990). Given that this mining level is relatively shallow and has a mining history of more than 30 years, the ground subsidence of the goaf above this mining level is considered to have stabilized. Therefore, the residual subsidence of the goaf shallower than the elevation of 844 m is not taken into account, and only the subsidence of the goaf deeper than the elevation of 844 m is evaluated.
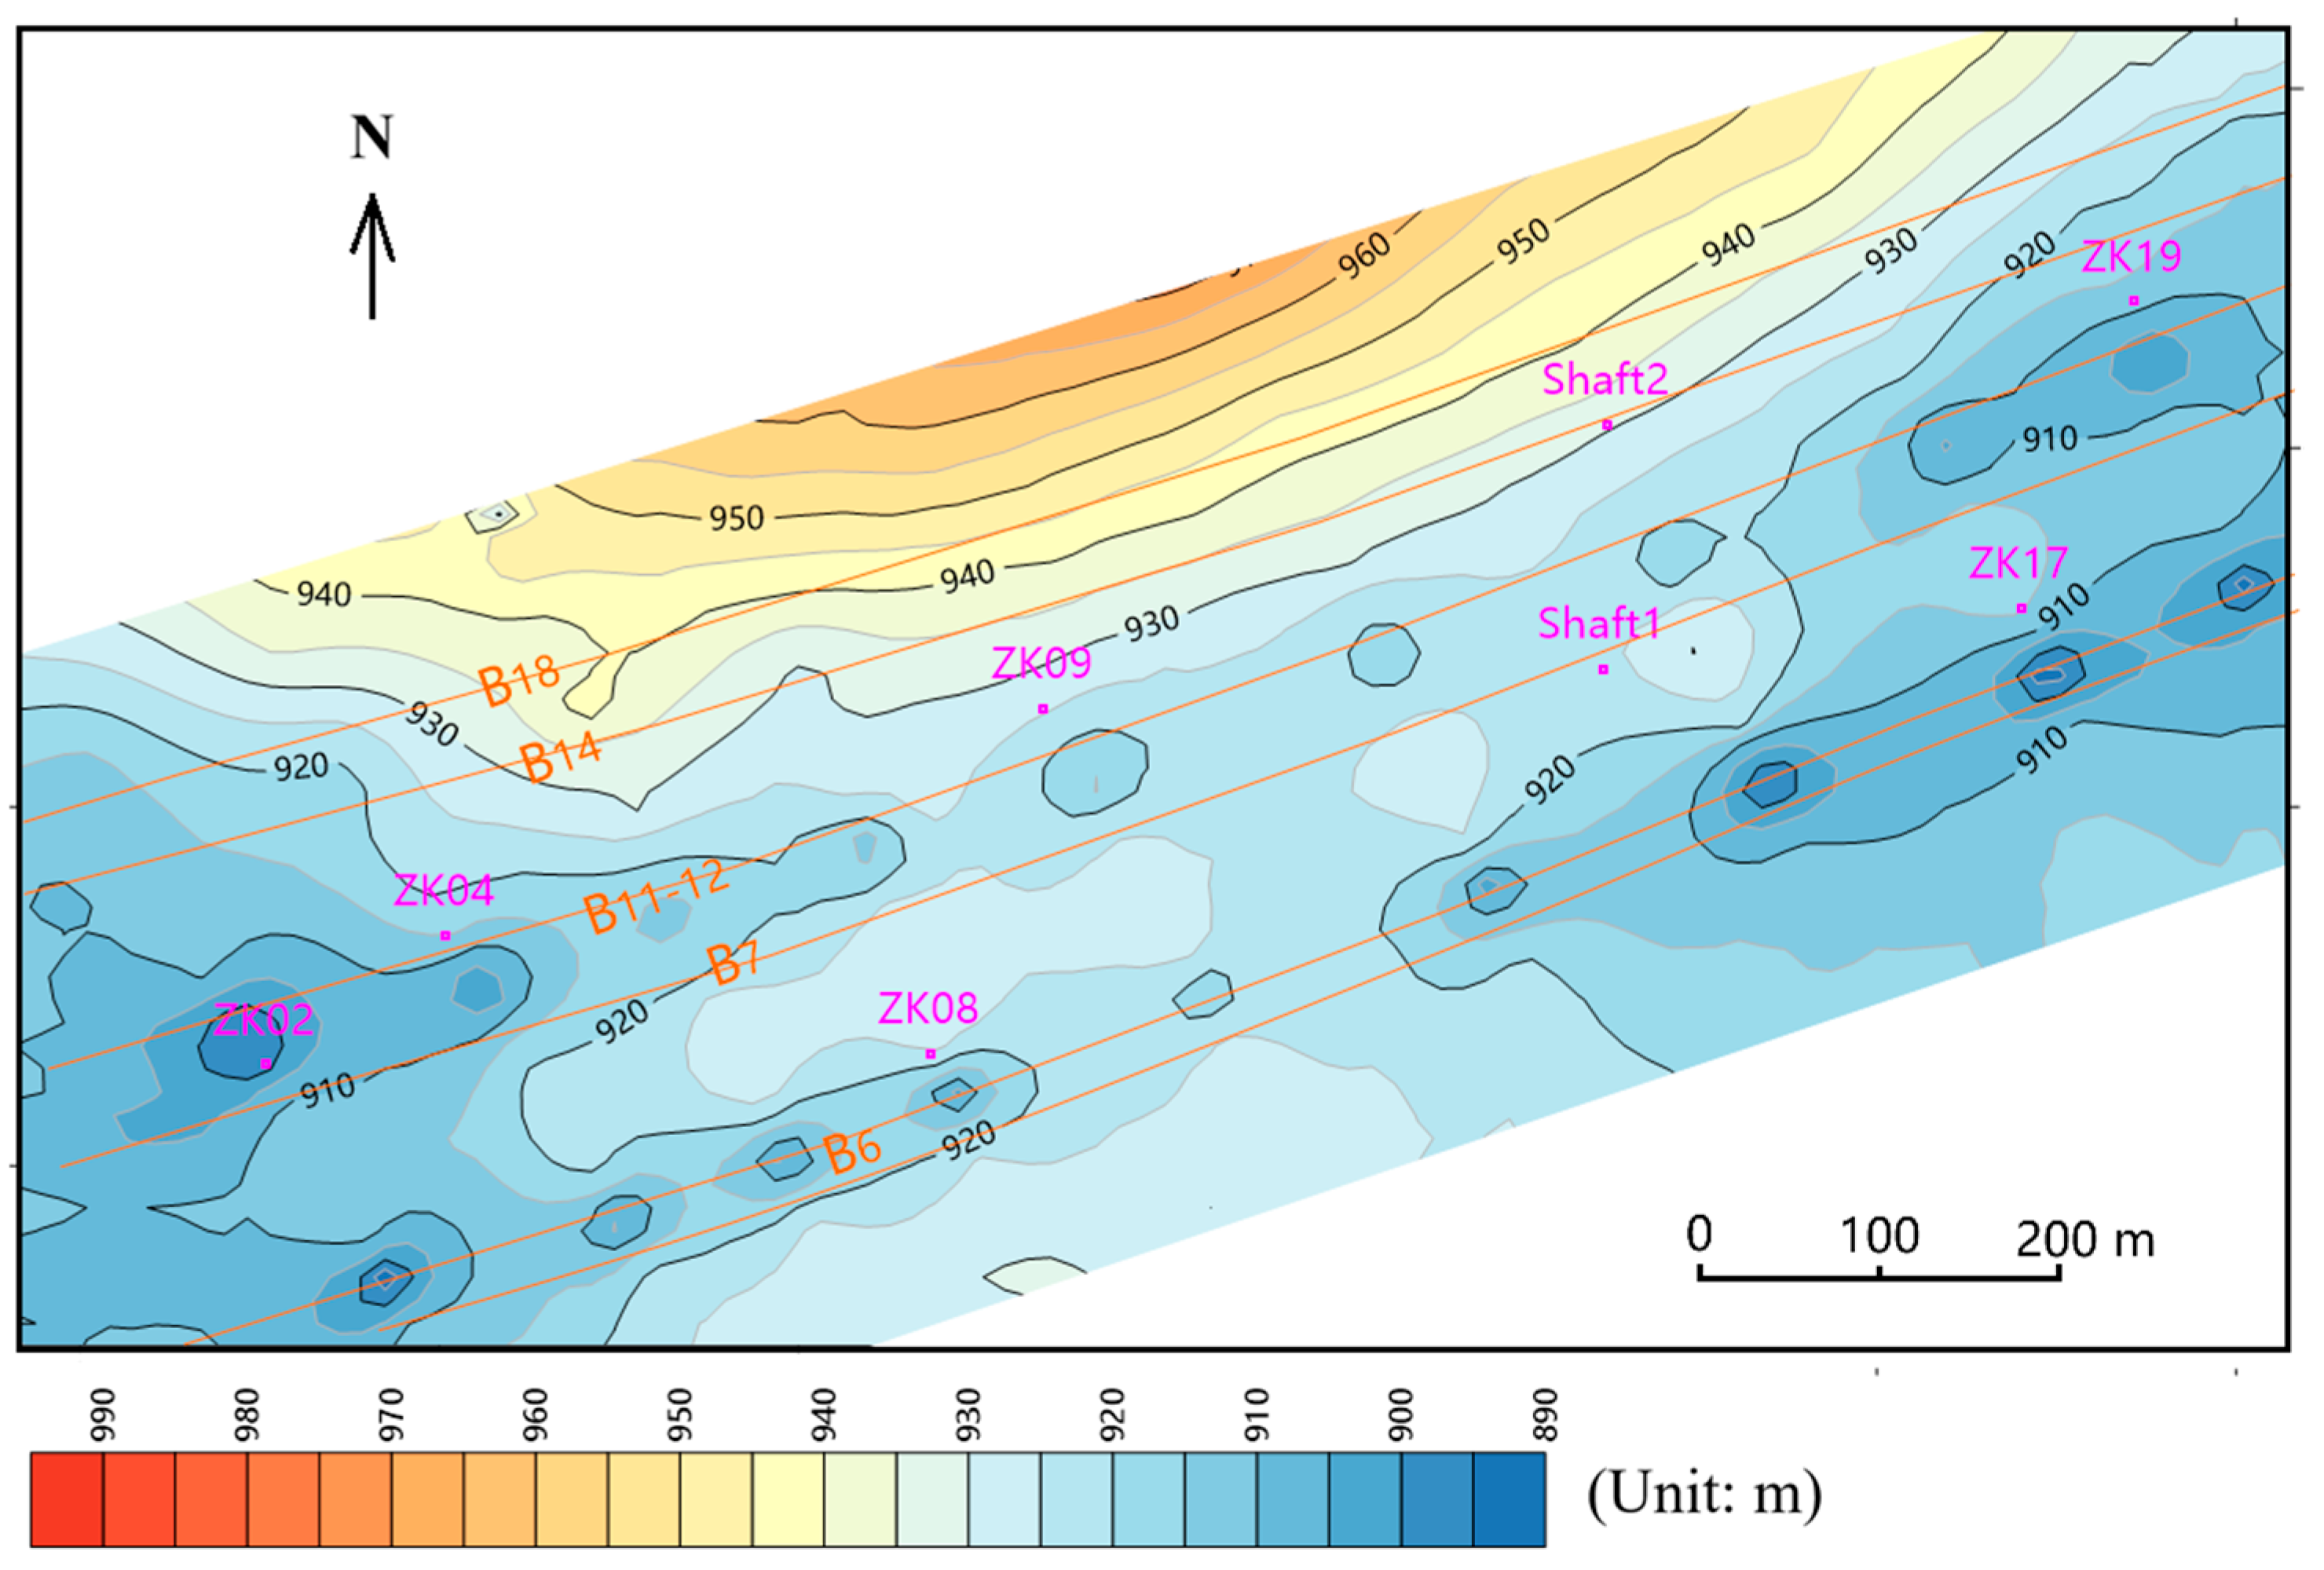
By measuring the subsidence values of subsidence curves at various stages on the profile map and determining the coordinates of the measurement points, contour lines and subsidence isolines can be plotted on the plane map. Taking the elevation of 689 m as the final mining level, the final ground elevation of the study area after the stabilization of subsidence can be obtained according to the simulation results. If the ground surface is not subsequently filled and leveled, the final ground elevation of the study area will range from 890 m to 980 m. The terrain along the outcrop lines of the B6 coal seam and the B7–B11–12 coal seam group presents as a zonal low-lying area, while the terrain on the northwest side of the study area is relatively higher (Figure 17).
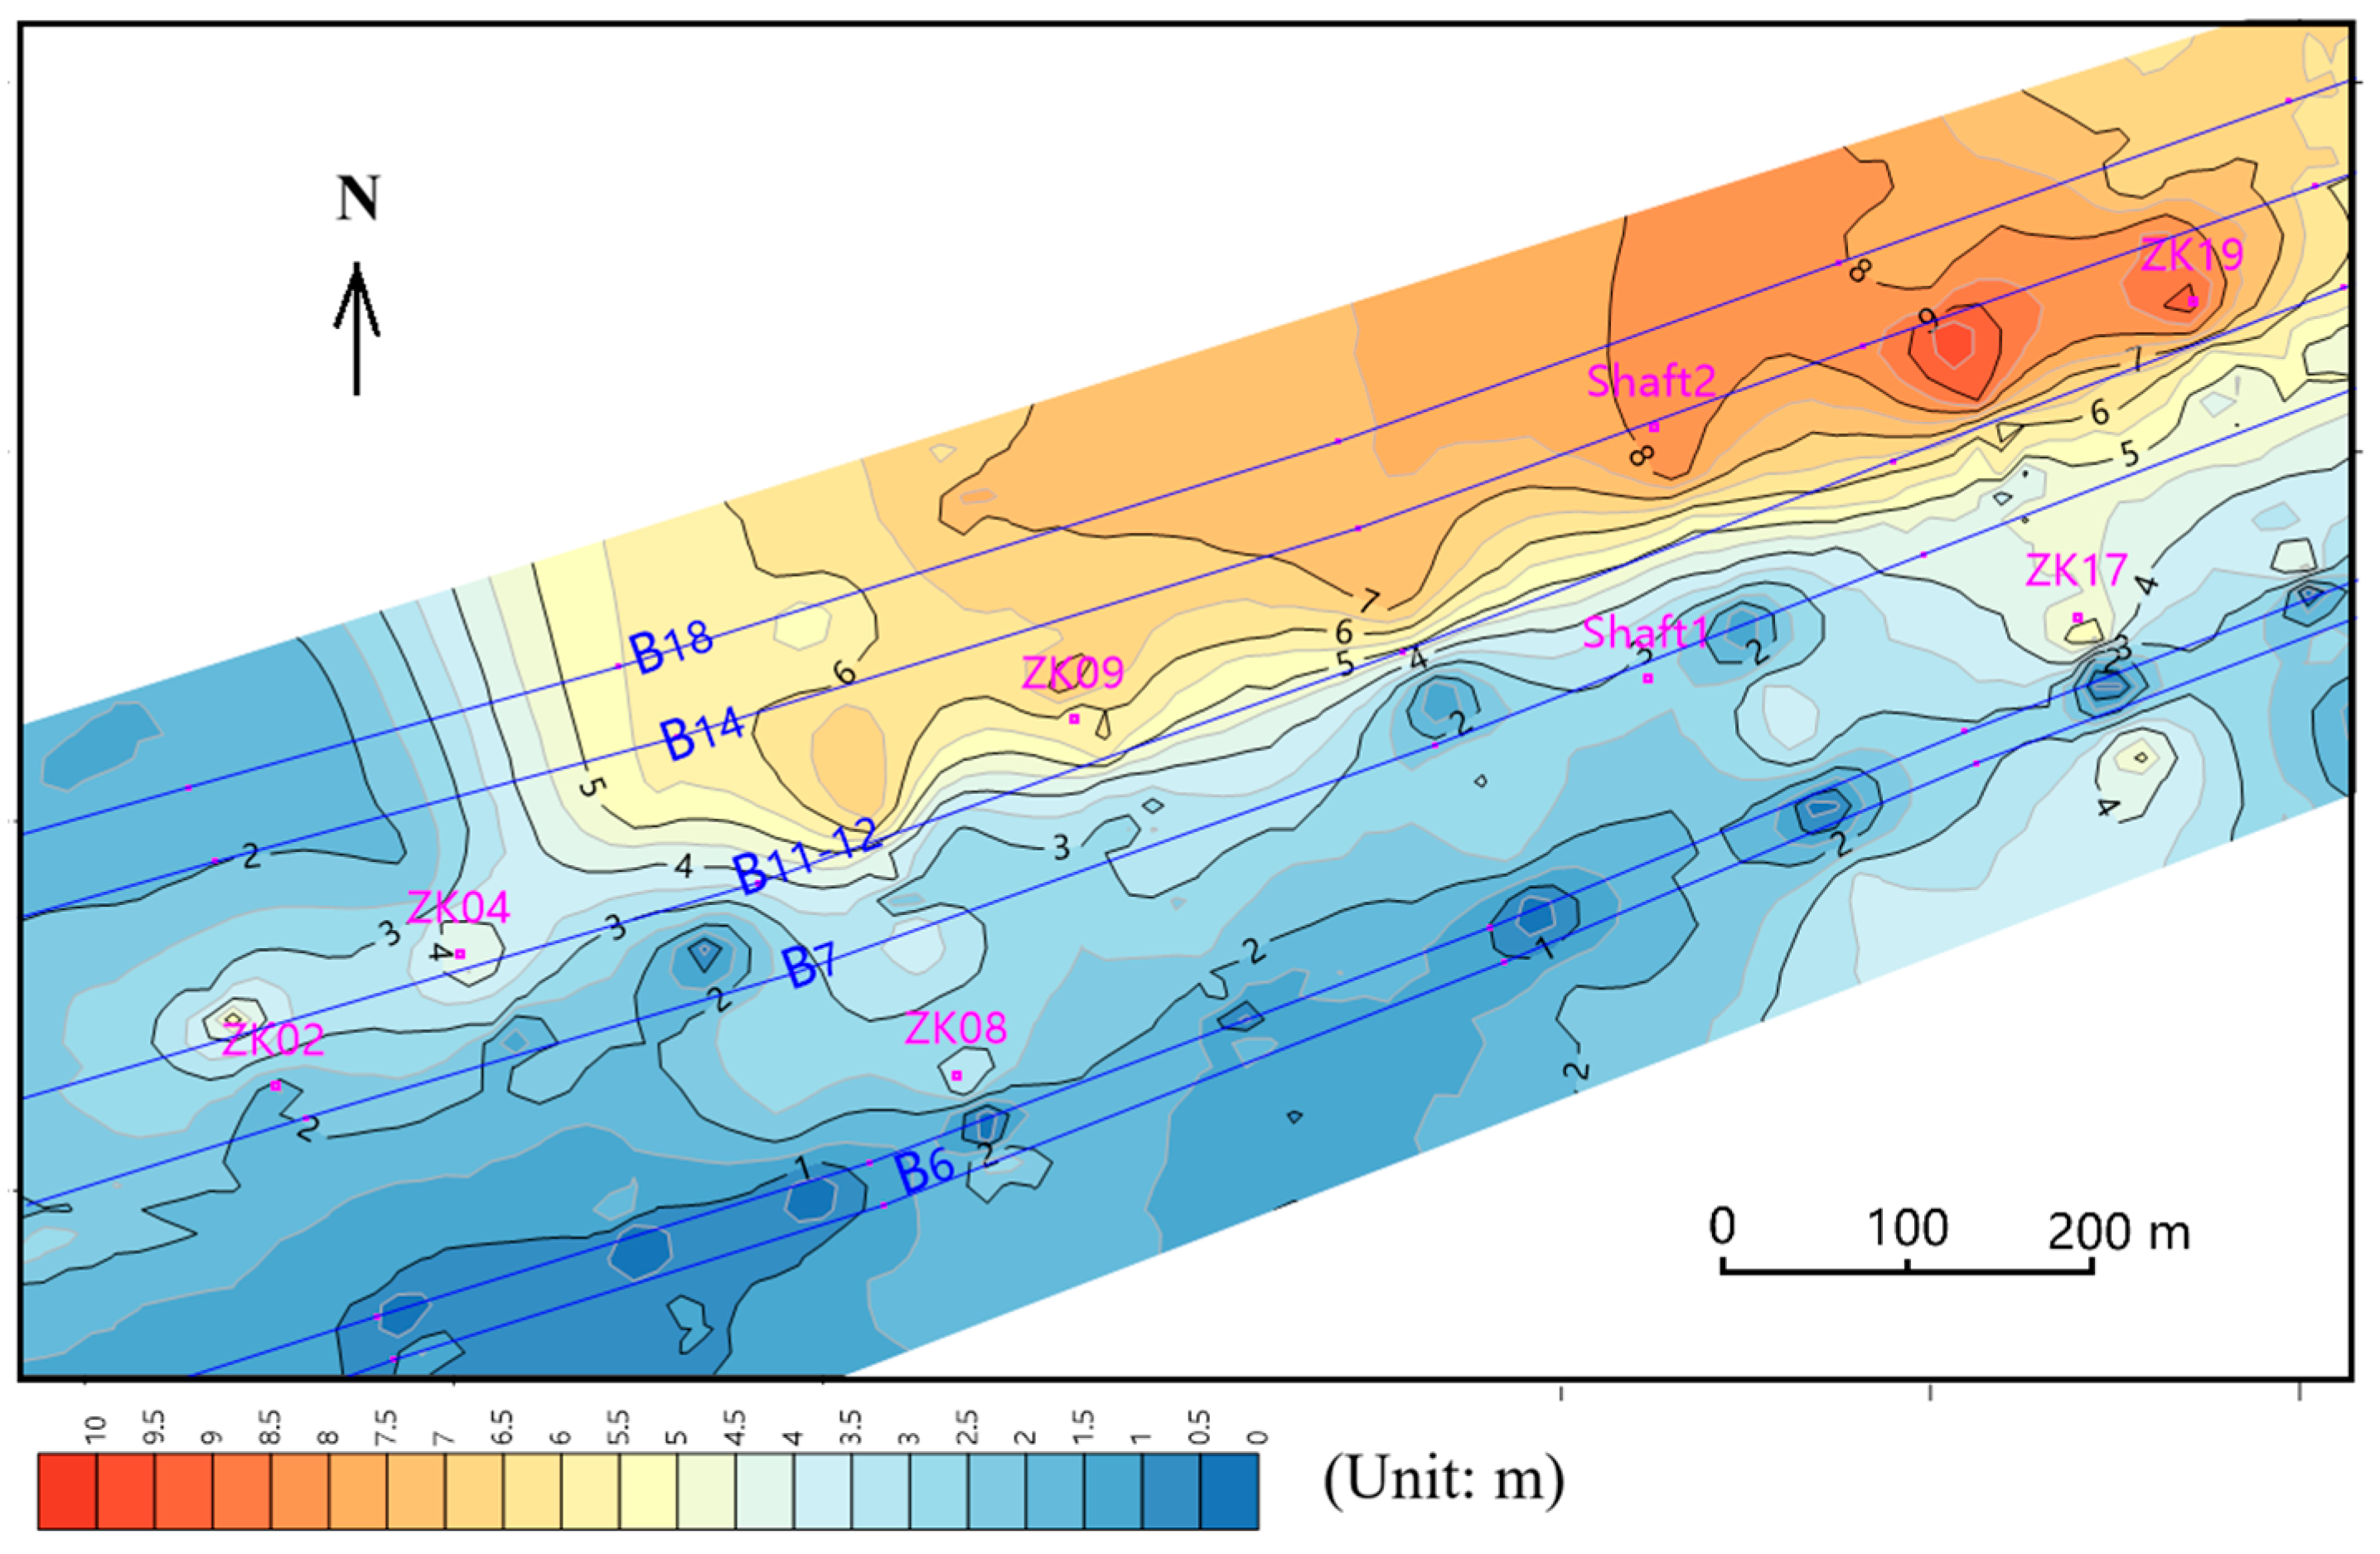
Since the analysis indicates that the ground subsidence of the goaf in the first stage (up to 1990) has stabilized, the ground elevation after the completion of mining at the elevation of 844 m is taken as the baseline to calculate the cumulative subsidence for the second and third stages, namely, the newly increased ground subsidence during the two periods 1990–2009 and 2009–2014 (mine closure). Thus, the isolines of newly increased ground subsidence in the study area after 1990 can be obtained (Figure 18).
Since the early-stage subsidence has been completed, the newly increased subsidence in the later stage is mainly contributed to by the deep goafs of the B7–B11–12 coal seam group and the B14–B18 coal seam group. The dip direction of the steeply inclined coal seams is northwest (left-hand side in the profile view), and the ground subsidence also deviates toward the dip direction of the coal seams (NW direction). If the inclined coal seam is regarded as a slope, this phenomenon can be attributed to the toppling–sliding composite failure of the anti-dip slope [10]. Therefore, the actual ground subsidence occurs in the area north of the B11–12 coal seam and along the outcrop line of the B14–B18 coal seams (Figure 18). In addition, since the mining depth along the 1–1′ and 2–2′ profiles (Figure 1) only reaches the elevation of 793 m (with no mining conducted in the third stage), the newly increased subsidence in the northwest corner area where boreholes ZK02 and ZK04 are located in the study area is also relatively small (Figure 18).
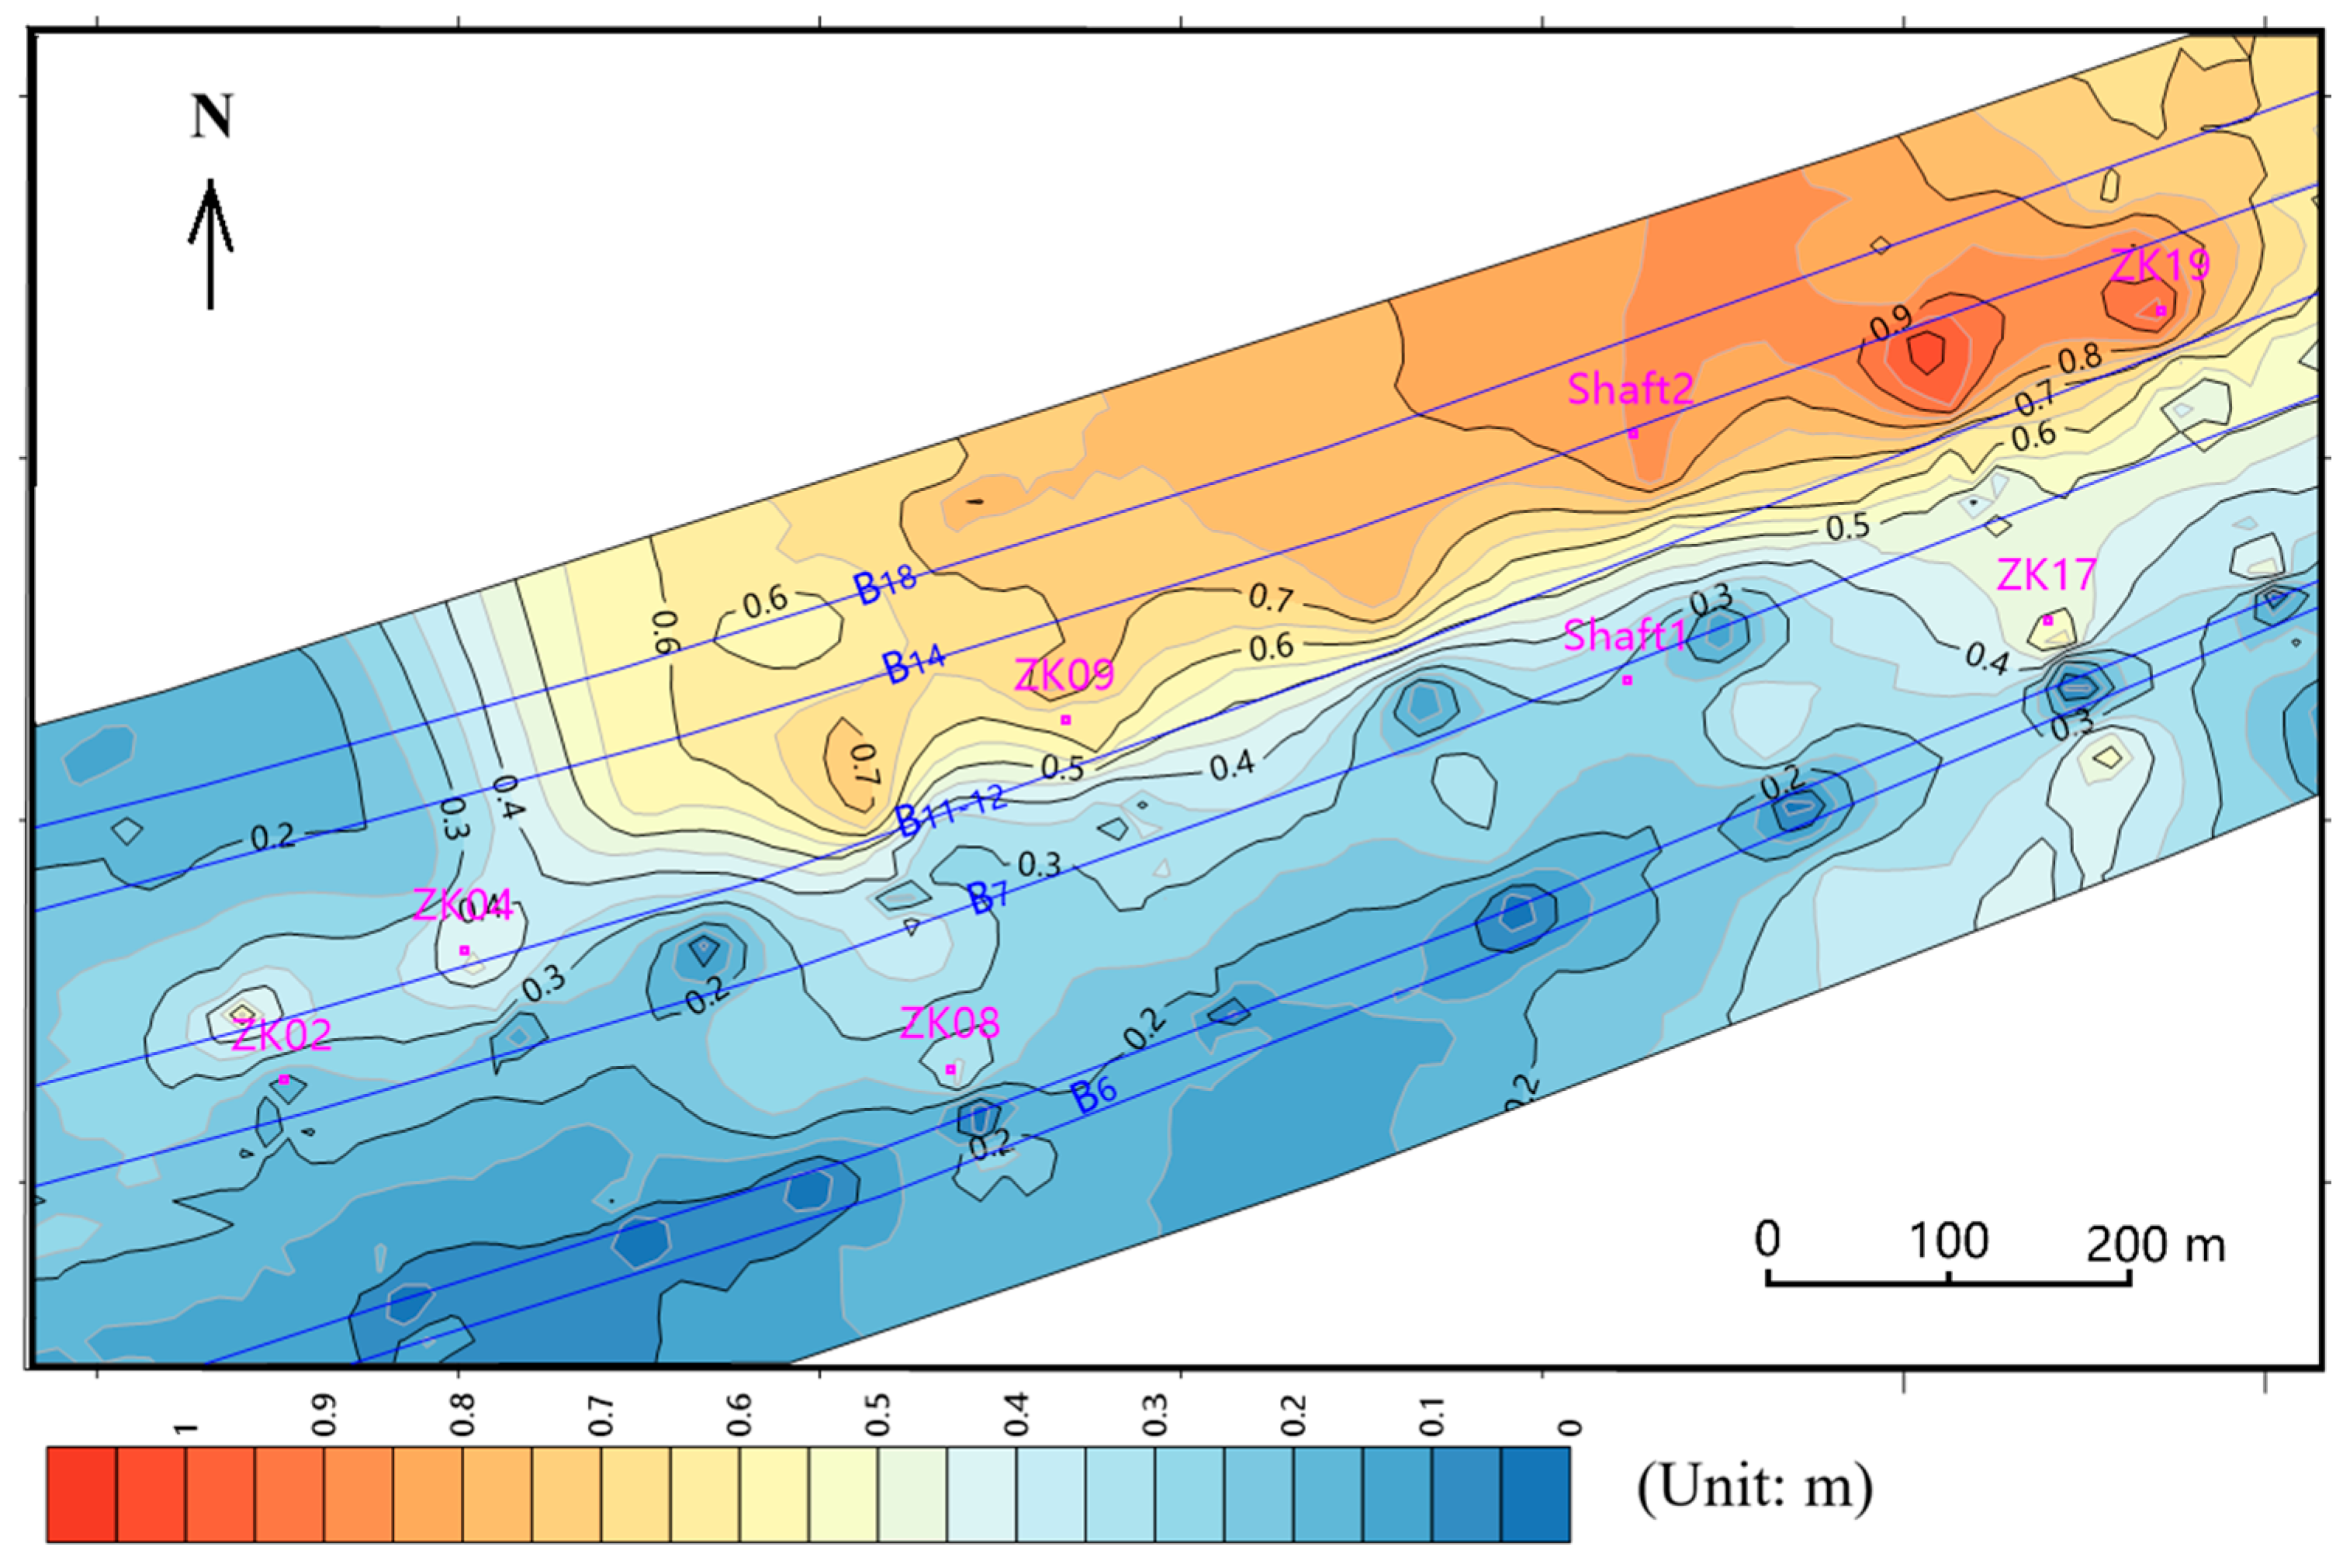
Based on the results of the physical simulation experiment on the void content of goafs, the ratio of residual subsidence to newly increased subsidence in the study area is 10.5%. Therefore, on the basis of the newly increased subsidence, the ground residual subsidence of the study area is calculated, and the isolines of ground residual subsidence in the study area are plotted. The residual subsidence ranges from 0 to 1 m, and its distribution trend is roughly consistent with that of the newly increased subsidence (Figure 19).
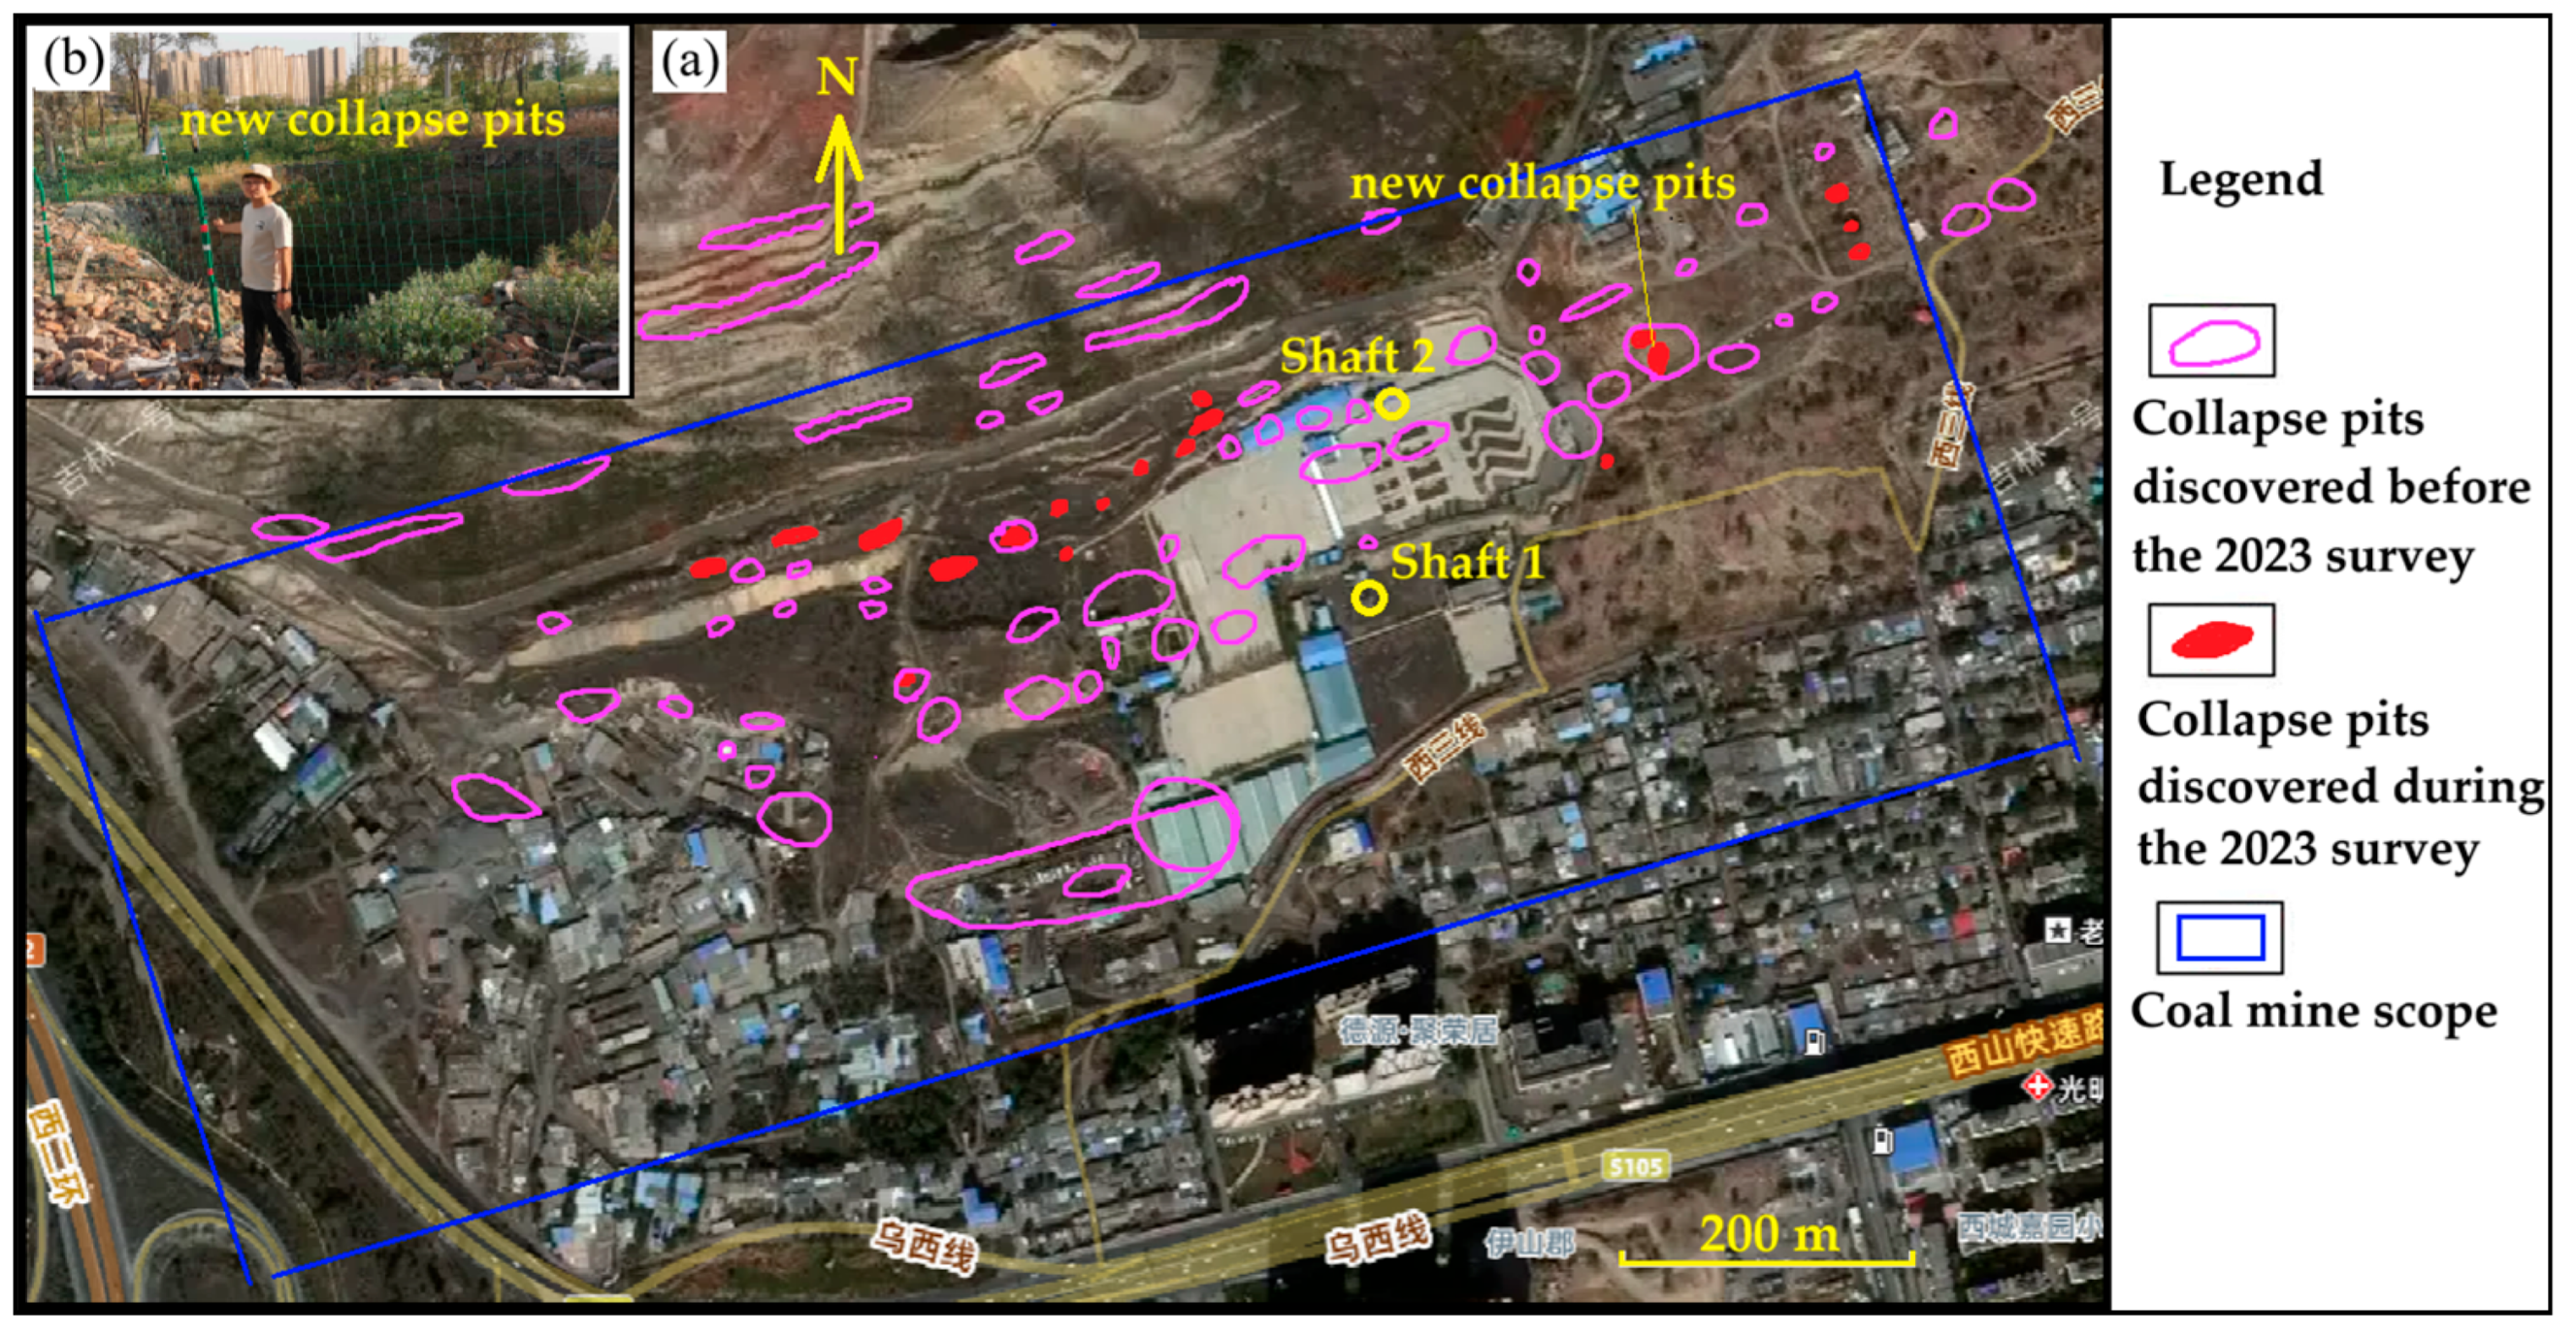
During the 2023 field investigation of the study area, Survey Report (Achievement Report on Comprehensive Management of Coal Mining Subsidence Area and Human Settlement Construction Project in Xishan New District (Detailed Investigation, Bid Section I), Shanxi Metallurgical Geotechnical Engineering Investigation Co., Ltd., May 2023), pre-2023 and newly discovered collapse pits were identified using satellite imagery from 2005, 2010, 2015, 2020, and 2023. While these features do not capture all surface collapses, they adequately characterize the overall pattern of surface subsidence in the study area (Figure 20a). Most collapse pits are concentrated within the high-subsidence regions (yellow to brownish-red zones) illustrated in Figure 18 and Figure 19, which supports the reliability of the predictions derived from physical and numerical simulations.
The existence of newly formed collapse pits was confirmed by the author during a 2024 field investigation. They lie east of Shaft 2 (Figure 20a,b), a zone of high predicted residual subsidence.

5.2. Research Limitations and Prospects

Mining of steeply inclined coal seams is easy at shallow depths but more difficult at greater depths. Usually, multiple mining stages and methods are used in such mines, including unregulated small coal mine exploitation, outdated shrinkage stoping, and improved modern mining techniques. Moreover, these mining areas are often characterized by long-term closure, incomplete mining records, and artificial surface backfilling. All these factors bring substantial difficulties to predicting current residual surface subsidence above goafs. In this study, using limited geotechnical investigation data, residual subsidence for such goafs is predicted by employing PFC numerical simulation integrated with goaf compaction simulations. The proposed method can thus provide a useful reference for goaf sites under similar geological and mining conditions.
The residual subsidence ratio was determined as 10.5%. Although this value is obtained from physical simulation tests, the coal seams in the study area were formed in the Middle Jurassic of the Mesozoic Era (approximately 175–161 Ma). Compared with Paleozoic coal measures (around 254 Ma or earlier), the rock cementation degree is relatively weak. Coal seams from different regions have different formation ages, lithological assemblages of the roof overburden, and possible mining methods. Accordingly, the compaction mechanisms of goafs will also vary. Therefore, the residual subsidence ratio obtained in this case is not universally applicable.
The research methodology adopted in this study still has certain imperfections that warrant further exploration and improvement:
(1)
A PFC2D simulation was employed in this research, primarily due to the lack of critical data such as underground working face extensions and roadway layout details. The mining process could only be reconstructed based on the exploration profiles provided by the investigation report and field surveys of mining conditions. Although the 2D model may introduce certain deviations in reflecting the subsidence characteristics of overlying strata and the ground surface, it is not expected to affect the overall evolutionary trend of subsidence.
Additionally, computational processes indicated that PFC simulations impose high demands on computer hardware resources. A complete calculation of the 2D model in this study typically took more than 10 h (processor: Intel(R) Core(TM) i9-14900K (3.20 GHz); RAM: 64.0 GB). In Reference [18], the authors established a 3D model with dimensions of 320 × 300 × 200 m and particle diameters ranging from 1.8 to 3.0 m. For the case study in this paper, constructing a 3D model with dimensions of 1200 × 400 × 280 m and particle diameters of 0.2–1.0 m would result in an extremely large computational load. Thus, the computational capacity of computer hardware is also a key factor that must be considered during model establishment.
(2)
Although the goaf compaction simulation experiments comply with the similarity theory, size effects may potentially exist. To date, no relevant studies have reported on size effects in goaf compaction simulations, which merits in-depth investigation in future research.
(3)
In the numerical simulation, stratigraphic division was relatively coarse, constrained by the insufficiency of available data. If more detailed stratigraphic division and more comprehensive data can be obtained, the accuracy of the numerical simulation will undoubtedly be further improved.

6. Conclusions

(1)
The Particle Flow Code (PFC2D) numerical simulation method was employed to simulate the mining process of steeply inclined, multi-seam, and multi-level coal seams in the study area. After the mining of shallow coal seams, the roof of the coal seams becomes unstable and collapses in the anti-dip direction, causing materials from the unconsolidated layer to fall and backfill the goaf, which further leads to ground subsidence. After the mining of deep coal seams, this is also accompanied by the overall movement of overlying strata along the dip direction of the coal seams and the overall surface subsidence.
(2)
The results of the goaf compaction simulation experiment show that the void content of the broken coal and rock mass in the goaf tends to decrease with the increase in pressure. Whether in the natural state or water-immersed state, the relationship between the void content and pressure generally presents a negative exponential correlation. Under water immersion conditions, the void content of the coal and rock mass in the goaf is further reduced. The range of goaf void content variation with pressure is also related to the lithological composition of the coal and rock mass in the goaf; when the proportion of sandstone in the mixed coal and rock mass is relatively high, the void content of the goaf will increase to a certain extent. Based on the results of the relationship between displacement and void content obtained from the simulation experiment, it is inferred that the residual displacement under the current conditions of the study area accounts for approximately 10.5% of the total displacement. However, this value may vary for coal seams in different geological regions and of different geological ages, requiring specific analysis of the actual conditions.
(3)
Combining the results of PFC numerical simulation and physical simulation of goaf void content evolution, the residual subsidence of the goaf in the study area since the mine closure was predicted. The residual subsidence ranges from 0 to 1 m, and its high-value zone is distributed in the northeastern part of the study area (i.e., the north side of sections 3–3′ to 6–6′). The residual subsidence is mainly contributed to by the deep goafs of the B7–B11–12 and B14–B18 coal seam groups. The reliability of the predicted results is verified by the distribution of mining collapse pits obtained from satellite image monitoring and field investigation.
(4)
Generally, multi-stage and diverse mining methods are used in coal mining areas with steeply inclined and multi-seam coal seams, and are often accompanied by problems such as having been closed for a long time, a lack of mining data, and artificial backfilling of the surface. By using limited geotechnical engineering investigation data and adopting a method combining PFC numerical simulation and goaf compaction simulation, the residual subsidence of the goaf can be effectively predicted. This is a new method worthy of application for predicting the subsidence of goafs under similar conditions.

Author Contributions

Conceptualization, J.W. and S.W.; methodology, J.W.; software, J.W. and W.C.; validation, W.C. and Z.C.; formal analysis, J.W. and W.C.; investigation, J.W. and Z.C.; data curation, W.C. and Z.C.; writing—original draft preparation, J.W.; writing—review and editing, J.W.; visualization, W.C.; supervision, S.W. All authors have read and agreed to the published version of the manuscript.

Funding

This research was funded by Intelligent Perception and Evolution Mechanism of Residual Deformation in Goaf and Ecological Environment, grant number 2023YFC3804201.

Institutional Review Board Statement

Not applicable.

Informed Consent Statement

Not applicable.

Data Availability Statement

All data in this paper have been fully presented in the text, and no additional raw data can be provided.

Acknowledgments

During the course of this research, Mingliang Li, Xinyao Huang, and Jibiao Shi provided significant support, and we hereby express our gratitude. In addition, the translation and typesetting of this article were completed using Doubao 1.84.8 and DeepSeek-V3.2 software.

Conflicts of Interest

Authors Jilin Wang, Wan Cao, Zhuo Chen, and Shenglin Wu were employed by the company Xuzhou China Mining Geotechnical Technology Co., Ltd. All authors declare that the research was conducted in the absence of any commercial or financial relationships that could be construed as potential conflicts of interest.

References

  1. Zhang, H.Z. Study and Application on the Distribution Law of Old Goaf Residual Cavity and Void. Ph.D. Thesis, China University of Mining & Technology, Xuzhou, China, 2013. [Google Scholar]
  2. Cai, G.; Sui, W.; Wu, S.; Wang, J.; Chen, J. On-site monitoring for the stability evaluation of a highway tunnel above Goaves of multi-layer coal seams. Appl. Sci. 2021, 11, 7383. [Google Scholar] [CrossRef]
  3. Dai, G.L.; Li, H.J.; Liu, C.; Li, H.Z.; Chang, Y.W.; Chen, Y.; Gao, Y.D.; Yuan, Y.F.; Huo, W.Q. Goaf site stability detection in the overlap area of coal mining subsidence and urban construction. Adv. Civ. Eng. 2024, 2024, 5375733. [Google Scholar] [CrossRef]
  4. Luo, S.H.; Tian, C.Y.; Wu, Y.P.; Xie, P.S.; Wang, H.W. Characteristics of loading and failure of overlying rock at working face advancing direction in longwall mining of steeply inclined seam. J. China Coal Soc. 2021, 46, 2227–2236. [Google Scholar] [CrossRef]
  5. Wu, Y.P.; Huangfu, J.Y.; Xie, P.S.; Hu, B.S.; Liu, K.Z. Mechanism of instability of section coal pillar in steeply dipping seam based on large–scale strata control technology. J. China Coal Soc. 2018, 43, 3062–3071. [Google Scholar] [CrossRef]
  6. Zhang, H.D.; Hu, G.Z.; Zhao, G.C. Research on the movement law of roof structure in large-inclined coal seam working face: A case study in Liu.Pan.Shui, mining area. Shock Vib. 2022, 2022, 6328851. [Google Scholar] [CrossRef]
  7. Yang, F. Study on Overburden Strata’s Movement Pattern and Mechanism of Mining Steeply Inclined Seams. Ph.D. Thesis, Liaoning Technical University, Fuxin, China, 2006. [Google Scholar]
  8. Yang, K.; Kong, X.Y.; Lu, W.; Liu, S. Study of strata pressure behaviors with longwall mining in large inclination and thick coal seam under close distance mined gob. Chin. J. Rock Mech. Eng. 2015, 34, 4278–4285. [Google Scholar] [CrossRef]
  9. Yang, K.; He, X.; Liu, S.; Lu, W. Rib spalling mechanism and control with fully mechanized longwall mining in large inclination “three-soft” thick coal seam under closed distance mined gob. J. Min. Saf. Eng. 2016, 33, 611–617. [Google Scholar] [CrossRef]
  10. Chen, Z.; Wu, S.L.; Wang, J.L.; Shi, J.B.; Li, M.L.; Cao, W.; Song, H. Study on the synergistic effect of coal pillars and caved deposits in chamber-type mining of steeply inclined coal seams. Appl. Sci. 2025, 15, 13188. [Google Scholar] [CrossRef]
  11. Xie, P.S.; Wu, Y.P. Deformation and failure mechanisms and support structure technologies for goaf-side entries in steep multiple seam mining disturbances. Arch. Min. Sci. 2019, 64, 561–574. [Google Scholar] [CrossRef]
  12. Wei, Z.X.; Zhao, M.; Xie, F.H.; Cao, S.H.; Dong, J.H.; Dong, Y.D. Detection of former goaf and analysis of deformation characteristics of overburden in Dameidong coal mine. Front. Earth Sci. 2023, 11, 1111745. [Google Scholar] [CrossRef]
  13. Xie, P.S.; Huang, B.F.; Wu, Y.P.; Luo, S.H.; Jiao, J.Q.; Tian, C.Y.; Chen, J.J. Stability analysis of rock fracture and support performance in steeply dipping ore deposits with massive mining stopes. Geomat. Nat. Hazards Risk 2023, 14, 2250529. [Google Scholar] [CrossRef]
  14. Tu, H.S.; Tu, S.H.; Zhu, D.F.; Hao, D.Y.; Miao, K.J. Force-fracture characteristics of the roof above goaf in a steep coal seam: A case study of Xintie coal mine. Geofluids 2019, 2019, 7639159. [Google Scholar] [CrossRef]
  15. Huang, C.F.; Li, Q.; Tian, S.G. Research on prediction of residual deformation in goaf of steeply inclined extrathick coal seam. PLoS ONE 2020, 15, e0240428. [Google Scholar] [CrossRef] [PubMed]
  16. Shi, Z.Y.; Wang, Q.B.; Wang, P.; He, D.L.; Bai, Y.; You, H.Y. Time series effect on surface deformation above goaf area with multiple-seam mining. Symmetry 2020, 12, 1428. [Google Scholar] [CrossRef]
  17. Wang, H.B. The Overburden and Surface Movement Research Induced by Multi-Steep-Seam Mining. Ph.D. Thesis, China University of Geosciences (Beijing), Beijing, China, 2020; pp. 74–127. [Google Scholar] [CrossRef]
  18. Li, H.C.; Liu, K.L.; Xie, S.L.; Wang, G. Study on overburden caving law in segmented mining of near vertical ultra-thick coal seam. J. Shandong Univ. Sci. Technol. (Nat. Sci.) 2024, 43, 13–24. [Google Scholar] [CrossRef]
  19. He, Y.Y. Stability and Instability Process Analysis of Steep Coal Seam of No. 104 Group in Urumqi, Xinjiang. Master’s Thesis, Xi’an University of Science and Technology, Xi’an, China, 2020. [Google Scholar]
  20. Zhang, B.C.; Zhang, S.C.; Shen, B.T.; Li, Y.Y.; Song, S.L.; Han, X.X.; Dang, J.M. Simulation and on-site monitoring of deformation characteristics of roadway excavation along goaf in soft and thick coal seams in western mining areas. Appl. Sci. 2024, 14, 7760. [Google Scholar] [CrossRef]
  21. Itasca Consulting Group, Inc. PFC 2D, Version 5.00.25[CP]; Itasca Consulting Group, Inc.: Minneapolis, MN, USA, 2015.
  22. Chen, Y.K. Stability Analysis of Tailing Dam Based on DEM with PFC. Master’s Thesis, Central South University, Changsha, China, 2012; pp. 16–56. [Google Scholar] [CrossRef]
  23. Tian, W.L.; Yang, S.Q.; Fang, G. Particle Flow Simulation on mechanical behavior of coal specimen under triaxial cyclic loading and unloading. J. China Coal Soc. 2016, 41, 603–610. [Google Scholar] [CrossRef]
  24. Li, X. Experimental Study and Particle Flow Simulation on Mechanical Properties of Yellow Sandstone with Different Bedding Angles. Master’s Thesis, China University of Mining and Technology, Xuzhou, China, 2021; pp. 11–88. [Google Scholar] [CrossRef]
  25. Yoon, J. Application of experimental design and optimization to PFC model calibration in uniaxial compression simulation. Int. J. Rock Mech. Min. Sci. 2007, 44, 871–889. [Google Scholar] [CrossRef]
  26. Deng, S.X.; Zheng, Y.L.; Feng, L.P.; Zhu, P.Y.; Ni, Y. Application of design of experiments in microscopic parameter calibration for hard rocks of PFC3D model. Chin. J. Geotech. Eng. 2019, 41, 655–664. [Google Scholar] [CrossRef]
  27. Shi, C.; Zhang, Q.; Wang, S.N. Numerical Simulation Technology and Application with Particle Flow Code (PFC5.0); China Architecture & Building Press: Beijing, China, 2018; pp. 249–299. [Google Scholar]
  28. Hao, B.Q.; Zhang, C.S.; Wang, C.L.; Ren, C. Study on determination micro-parameters of rock PFC2D model. Coal Sci. Technol. 2022, 50, 132–141. [Google Scholar] [CrossRef]
  29. Wang, T.; Zhou, W.B.; Chen, J.H.; Xiao, X.; Li, Y.; Zhao, X.Y. Simulation of hydraulic fracturing using particle flow method and application in a coal mine. Int. J. Coal Geol. 2014, 121, 1–13. [Google Scholar] [CrossRef]
  30. Shi, Y.; Xing, Z.Z.; Zhan, K.L.; Li, S.G.; Zhao, P.X.; Xue, J.H. Research on spatial-temporal evolution law of transverse fractures in upward long-distance protected layer based on PFC. J. Min. Saf. Eng. 2025, 42, 229–238. [Google Scholar] [CrossRef]
  31. Wu, M.M.; Wang, G.; Wang, R.; Li, W.X.; Chu, X.Y. Space-time porosity distribution on overlying strata above a shallow seam. J. China Coal Soc. 2017, 42, 112–121. [Google Scholar] [CrossRef]
  32. Wang, S.F.; Wang, D.M.; Cao, K.; Wang, S.L.; Pi, Z.Z. Distribution law of 3D fracture field of goaf and overlying strata. J. Cent. South Univ. (Sci. Technol.) 2014, 45, 833–839. [Google Scholar]
  33. Xu, S.B. Compaction Characteristic and Void Rate Evolution of Fractured Coal and Rocks in Goaf. Master’s Thesis, Inner Mongolia University of Science & Technology, Baotou, China, 2023; pp. 9–64. [Google Scholar] [CrossRef]
  34. Yue, Z. Long-Term Deformation Numerical Simulation Prediction of Goaf Considering Creep Characteristics of Rock Mass in Caving Zone. Master’s Thesis, China University of Geosciences (Beijing), Beijing, China, 2022; pp. 19–32. [Google Scholar] [CrossRef]
  35. State Administration of Work Safety; State Administration of Coal Mine Safety; National Energy Administration; National Railway Administration. Specification for Coal Pillar Retention and Coal Mining Under Buildings, Water Bodies, Railways and Main Roadways (2017 Edition); Coal Industry Press: Beijing, China, 2017. [Google Scholar]
Figure 1. Schematic map of topography and landforms in the study area.
Applsci 16 02328 g001
Figure 2. Geological exploration profile 4–4′ of study area.
Applsci 16 02328 g002
Figure 3. Behavior and rheological components of the linear parallel bond model with inactive dashpots (According to Reference [21]).
Applsci 16 02328 g003
Figure 4. Study area PFC2D modeling diagram (using the 4–4′ profile as an example).
Applsci 16 02328 g004
Figure 5. Restoration of unconsolidated layers and bedrock surfaces in modeling (using the 5–5′ profile as an example). (a) Existing profile as determined by geological exploration; (b) restored original profile.
Applsci 16 02328 g005
Figure 6. Numerical servo test curves under different confining pressure conditions (using sandstone as an example). (a) Confining pressure is 0.5 MPa; (b) confining pressure is 2.0 MPa; (c) confining pressure is 4.0 MPa; (d) confining pressure is 8.0 MPa.
Applsci 16 02328 g006
Figure 7. Control of suspended particles and determination of porosity (using sandstone as an example). (a) Porosity curve of small-sized sample (20 × 10 m) for numerical servo experiments; (b) porosity curve of large-sized sample (40 × 20 m) for geological profile model.
Applsci 16 02328 g007
Figure 8. Goaf compaction simulation test system and samples: (a) void content physical simulation container; (b) rock samples for physical simulation; (c) composition of the physical simulation system. ① Container; ② water inlet; ③ overflow hole; ④ force-transfer rod; ⑤ hydraulic pipe; ⑥ pressure-applying shaft; ⑦ displacement scale; ⑧ displacement gauge; ⑨ pressure gauge.
Applsci 16 02328 g008
Figure 9. Simulation results of mining and ground subsidence as of 1990 (based on the 4–4′ profile).
Applsci 16 02328 g009
Figure 10. Simulation results of mining and ground subsidence as of 2009 (based on the 4–4′ profile). (a) Overall model; (b) instability during mining of B7–B11–12 coal seam group.
Applsci 16 02328 g010
Figure 11. Simulation results of mining and ground subsidence as of 2014 (based on the 4–4′ profile).
Applsci 16 02328 g011
Figure 12. Ground subsidence pit (trough) morphology prior to 2006 (based on data source (Detailed Investigation Report on Comprehensive Management of Coal Mining Subsidence Area and Human Settlement Construction Project in Xishan New District (Section II), Tiandi Science and Technology Co., Ltd., June 2023.)). (a) Initial state of ground collapse in the goaf area; (b) stable state of the ground collapse pit in the goaf area.
Applsci 16 02328 g012
Figure 13. Surface subsidence of unit extra thick steeply inclined horizontal slice coal seam mining.
Applsci 16 02328 g013
Figure 14. Local model calculation results and comparison for parameter sensitivity tests of Sandstone Layer ⑧. (a) Overall deformation before and after model mining; (b) local enlarged view of deformation at the large collapse pit.
Applsci 16 02328 g014
Figure 15. Pressure–void content relationship curve. (a) Measured pressure–void content relationship curve; (b) pressure–average void content relationship curve.
Applsci 16 02328 g015
Figure 16. Void content–displacement relationship curve. (a) The relationship curves for different sample ratios; (b) the averaged relationship curve for different sample ratios.
Applsci 16 02328 g016
Figure 17. Predicted final ground elevation after subsidence stabilization in the study area (the markings in this figure have the same meaning as those in Figure 1).
Applsci 16 02328 g017
Figure 18. Newly increased ground subsidence caused by mining activities during the period from 1990 to 2014 (the markings in this figure have the same meaning as those in Figure 1).
Applsci 16 02328 g018
Figure 19. Prediction of residual ground subsidence in the study area (the markings in this figure have the same meaning as those in Figure 1).
Applsci 16 02328 g019
Figure 20. Distribution of collapse pits in the study area before and in 2023 (according to (Achievement Report on Comprehensive Management of Coal Mining Subsidence Area and Human Settlement Construction Project in Xishan New District (Detailed Investigation, Bid Section I), Shanxi Metallurgical Geotechnical Engineering Investigation Co., Ltd., May 2023)). (a) Collapse depictions based on satellite photographs; (b) new collapse pits were discovered during the field investigation.
Applsci 16 02328 g020
Table 1. Average thickness and mining status of each coal seam.
Layer No.Coal Seam No.Average Thickness (m)Mining Status of Coal Seam
B623.31It was generally mined down to 880 m, extending to 858–844 m in the eastern part of the minefield.
B713.07It was mined throughout down to 793 m.
⑭, ⑫, ⑩B8, B9 and B11–122.03, 3.82, and 6.47Most were mined down to 689 m, with only local areas in the western part of the minefield mined down to 793 m.
⑥, ④, ②B14, B15 and B181.25, 0.96, and 1.24Most were mined down to 689 m, while local areas in both the eastern and western parts extended to 793 m.
Table 2. Calibration of mesoscopic parameters for mechanical properties of various rock types.
Parameter Name/UnitSymbolReference Value RangeSandstoneSiltstoneMudstoneCoalUnconsolidated Layer
Particle Contact Modulus/GPaEc10~704.221.251.000.700.04
Particle Stiffness Ratiokn/ks1~42.242.242.352.473.14
Friction Coefficientμ0.2~0.80.80.80.80.80.8
Parallel Bond Modulus/GPa E c ¯ Same as Ec4.221.251.000.700.04
Parallel Bond Stiffness Ratio k n ¯ / k s ¯ Same as kn/ks2.242.242.352.473.14
Mean Parallel Bond Normal Strength/MPa σ c ¯ 18.010.03.882.770.08
Mean Parallel Bond Tangential Strength/MPa τ c ¯ 10~1009.05.01.941.380.04
Parallel Bond Strength Ratio τ c ¯ / σ c ¯ 0.5~2.022222
Bond Internal Friction Angle/°ϕ0~603030303025
Table 3. Comparison of calibration results for rock deformation and strength parameters.
Rock TypeNumerical ComparisonUCS/MPaElastic Modulus/GPaPoisson’s RatioCohesion/MPaInternal Friction Angle/°
SandstoneLaboratory Test Value34.55.370.286.5738
Calibrated Value31.45.900.308.3034
Deviation9.0%9.9%7.1%26.3%10.5%
SiltstoneLaboratory Test Value16.7
Calibrated Value18.92.100.225.0033
Deviation13.2%
MudstoneLaboratory Test Value8.81.820.282.1537
Calibrated Value9.41.900.251.9139
Deviation6.8%4.4%10.7%11.2%5.4%
CoalLaboratory Test Value5.81.370.300.9739
Calibrated Value6.41.200.281.0937
Deviation10.3%12.4%6.7%12.4%5.1%
Average Deviation of Single Indicator9.8%8.9%8.2%16.6%7.0%
Table 4. Calibration of microscopic parameters for physical properties of various rock types.
Parameter Name/UnitSymbolSandstoneSiltstoneMudstoneCoalUnconsolidated Layer
Sample particle radius (min–max)/mRmin~Rmax0.30~0.500.20~0.400.15~0.250.15~0.20
Profile particle radius (min–max)/mRmin~Rmax0.60~1.000.40~0.800.30~0.500.20~0.400.30~0.80
Sample porosityn0.180.140.140.14
Profile model porosityn0.220.210.200.200.30
Particle density/kg·m−3ρ25602550252012401800
Table 5. Graded compaction test data for samples with different mix proportions.
Pressure/kNCoal/Sandstone/Mudstone = 2:1:1Coal/Sandstone/Mudstone = 3:1:2Coal/Sandstone/Mudstone = 3:2:1
Disp/mmV/%Disp/mmVw/%Disp/mmV/%Disp/mmVw/%Disp/mmV/%Disp/mmVw/%
4.74.148.79 0.415.77 11.946.68 0.216.16 13.148.45 0.123.81
9.424.944.92 0.715.63 16.745.78 0.516.02 22.946.63 0.223.77
18.834.442.95 1.215.39 31.442.81 1.215.70 3444.40 0.723.57
37.65937.12 2.214.91 57.236.74 2.315.18 61.238.07 1.623.21
75.092.826.86 6.912.61 88.727.31 513.90 83.731.63 3.422.49
125.0114.518.31 14.98.38 108.119.96 13.19.80 99.926.09 8.420.40
150.0119.715.95 16.77.37 116.616.25 18.66.79 105.823.85 11.918.87
Note: Disp—displacement; V—void content under natural conditions; Vw—void content under water immersion conditions.
Table 6. Calculation table of maximum surface subsidence value for extra-thick steeply inclined coal seam.
Parameter NameSymbol/UnitCalculated ValueDescription
Dip angle of the coal seamα/°75Actual measurement.
The length of horizontal working faceL/m22.4Actual measurement.
Coefficients of the mining influence propagation anglek1, k20.5, 0.6Values are taken according to Reference [35].
Tangent of the major influence angletan β2.0Values are taken according to Reference [35].
Thickness of the unconsolidated layerh0/m23.3The process of stripping the unconsolidated layer is regarded as mining starting from the ground surface.
The depth of full coal thickness miningh58.2Sum of the unconsolidated layer thickness and the vertical thickness of the B6 coal seam.
Horizontal coordinate value of point A on the ground surfaces/m19.1As shown in Figure 13.
The main influence radius of the ground surfacer/m29.1Calculated according to the definition
tan β = h/r.
The number of units divided by the working facen100To approximately solve the definite integral.
Maximum surface subsidence at Point A
(Calculated result)
We1/m21.7Approximate solution of probability integral
We2/m22.9Numerical simulation result
ΔW/We25.2%Deviation between the two algorithms
Note: Since it is difficult to obtain the analytical solution of the definite integral, the integral term is approximately converted into a constant term, and the integration operation is replaced by element accumulation. The formula is: W e ( s ) = 0 L C d x = i = 1 n C × l i .
Table 7. Calculated parameter values corresponding to the graded loads in the simulation experiment.
Experimental Load/kN4.79.418.837.675125150
Piston pressure/MPa0.0370.0750.1500.2990.5970.9951.194
Mining depth converted by similarity ratio/m14.729.358.7117.3234.1390.1468.1
Average void content (Natural)/%47.9745.7843.3937.3128.6021.4518.68
Average void content (Water immersion)/%18.5818.4718.2217.7716.3312.8611.01
Note: The pressure is converted according to the cross-sectional area inside the container of 0.1257 m2; the mining depth is converted based on the average formation density of 2550 kg/m3 and the similarity ratio Cσ = 0.1; the average void content is calculated from Table 4 (with the ratios of coal/sandstone/mudstone being 2:1:1, 3:1:2, and 3:2:1, respectively).
Disclaimer/Publisher’s Note: The statements, opinions and data contained in all publications are solely those of the individual author(s) and contributor(s) and not of MDPI and/or the editor(s). MDPI and/or the editor(s) disclaim responsibility for any injury to people or property resulting from any ideas, methods, instructions or products referred to in the content.