Article

Resampling of 3D Triangular Foot Models Based on Cloth Simulation

1
School of Fashion Design & Engineering, Zhejiang Sci-Tech University, Hangzhou 310018, China
2
Hangzhou Daddylab Technology Co., Ltd., Hangzhou 310021, China
3
Zhejiang Key Laboratory of Digital Fashion and Data Governance, Zhejiang Sci-Tech University, Hangzhou 310018, China
*
Author to whom correspondence should be addressed.
Appl. Sci. 2026, 16(5), 2298; https://doi.org/10.3390/app16052298
Submission received: 12 January 2026 / Revised: 19 February 2026 / Accepted: 22 February 2026 / Published: 27 February 2026

Abstract

To improve the comparability and operability of three-dimensional (3D) triangular foot models, this study proposes a resampling method for 3D triangular foot models based on cloth simulation. This method refers to a 3D triangular foot template and 3D foot models to be resampled. The foot template is regarded as a fabric with elasticity and deformability, and the foot model to be resampled is regarded as a rigid body. First, the rigid body model is scaled down to be completely enclosed by the foot template. Then, the rigid body model gradually enlarges and returns to its original size. During the enlargement process, the rigid body model will push against the foot template. Finally, the shapes of the foot template and the rigid body model become exactly the same. The final deformed foot templates were saved as the resampled triangular foot models, which could be used as the original foot models to be resampled. In this study, the effects of different 3D triangular foot templates and various cloth simulation parameters on the resampling results were investigated. A statistical analysis of the errors of the resampled triangular foot models was conducted. The results demonstrate that the same foot template can represent 3D triangular foot models of different shapes with this resampling method. That is to say, foot models processed with the same template exhibit the same number of vertices and consistent triangular topological structure. When resampling 216 sets of 3D triangular foot models using the template with 2184 vertices, the average Hausdorff distance was calculated as 0.0466. For the template with 8085 vertices, the average Hausdorff distance of the 216 model sets was 0.0464. For the template with 19,752 vertices, the average Hausdorff distance of the 216 model sets reached 0.0494. This method can provide technical support for the automated measurement and analysis of 3D triangular foot models.

1. Introduction

As an important organ for human movement and support, the accurate acquisition of foot morphological parameters is of great significance for personalized footwear customization, medical correction, sports biomechanical analysis, and other fields [1,2,3]. With the development of 3D reconstruction technology, an increasing number of researchers have taken 3D triangular foot models as the research object to realize the acquisition of 3D triangular foot models or their morphological parameters [4,5].

1.1. Related Work on Capturing 3D Foot Models

In terms of capturing 3D foot models, high-precision 3D triangular foot models can be reconstructed from multi-view images captured by ordinary mobile phones through the structure from motion (SfM) and patch-based multi-view stereo (PMVS) algorithms [6]. Depth images collected by Kinect depth cameras can also be used to realize the reconstruction of 3D triangular foot models [7]. Novak et al. [8] used four pairs of charge-coupled device (CCD) cameras to surround the foot, scanned the foot with a laser line, and spliced a complete 3D foot model using laser multi-line triangulation [9]. Lee et al. [10] used 12 PC cameras for scanning and photographing, estimated the depth of each point on the foot through feature point matching, and then performed 3D reconstruction of 3D foot models. Gao et al. [11] adopted an active marker-based method with 10 CCD cameras to capture multi-view foot motion videos and recover 3D foot shapes. Kok et al. [12] also reconstructed 3D triangular foot models using convolutional neural networks and multi-view images of foot models. In summary, low-cost and convenient acquisition of 3D triangular foot models can be achieved through mobile phone photography, Kinect depth cameras, laser scanning, and other methods.

1.2. Related Work on Measuring and Resampling Foot Models

In terms of the measuring 3D triangular foot models, Kimura et al. [13] proposed a projector-camera system for accurately measuring the dynamic 3D shape of bare feet during movements such as walking or running. Hassan et al. [14] used 3D scanning technology to scan the 3D models of children and adolescents with Down syndrome, measured multiple sets of foot dimensions, and verified the intra-group and inter-group repeatability of the foot measurement data. Rogati et al. [15] developed a semi-automatic software to measure the main morphological parameters of the foot from 3D plantar scan data. The results showed that the average percentage errors between the software and manual measurements were 1.2 ± 0.8% for foot length, 9.1 ± 3.7% for foot width, 22.3 ± 13.5% for arch height, and 23.1 ± 12.7% for arch depth.
However, such accuracy still needs improvement, mainly due to several common issues in the collected 3D triangular foot models. First, the mesh density distribution is uneven. Sparse point clouds often occur in detailed regions (e.g., arch and toes), while redundant vertices exist in flat areas such as the sole, which impairs the accurate description of morphological features [16]. Excessively high model density leads to heavy data volume and increases computational cost in subsequent processing (e.g., morphological analysis, feature extraction, and reconstruction). Insufficient sampling on key regions (e.g., medial arch, heel edge, and toe joints) causes detail loss and fails to reflect real foot morphology. Second, noise introduced during reconstruction results in an uneven mesh surface, reducing the measurement accuracy of key parameters such as arch height and metatarsal circumference [17]. For instance, arch height deviation may shift the support position of customized insoles, and errors in plantar pressure analysis may invalidate the protection scheme for diabetic feet. Third, the mesh topological structures generated by different reconstruction methods are inconsistent, which makes it difficult to meet the needs of foot shape comparison, classification modeling, and other applications under complex conditions [18,19].
3D mesh resampling algorithms are one of the key methods to improve the quality of 3D triangular foot models. So far, most 3D mesh resampling algorithms have focused on improving the uniformity and adaptability of 3D meshes. For example, Yan et al. [20] combined Centroidal Voronoi Tessellation (CVT) with non-obtuse angle constraints, and eliminated obtuse triangles by adjusting Voronoi vertices, thereby realizing the resampling of 3D meshes. Wang et al. [21] adopted a hierarchical strategy to optimize CVT, generated more regular Voronoi cells, and improved sampling uniformity. Similar works include adaptively isotropic remeshing based on curvature smoothed field [22,23]. Besides CVT, Maximum Poisson Disk Sampling (MPS) is also widely used for resampling 3D meshes [24]. For example, Mitchell et al. [25] extended the MPS and proposed an adaptive 3D mesh resampling algorithm that can adjust the sampling density according to local geometry (such as curvature). These resampling algorithms for general models have been integrated into 3D processing toolkits such as Meshlab, InstantMesh, and Geomagic. Although they can be used for the resampling of 3D triangular foot models, they still face an important problem: existing 3D model resampling methods can only adjust the density of 3D vertices but cannot control the arrangement order of 3D vertices. Such resampling methods cannot ensure that all resampling results have the same triangular topological structure.

1.3. Our Approach

Therefore, this study focuses on the research of resampling technology for 3D triangular meshes of the foot. This approach refers to a 3D triangular foot template and 3D foot models to be resampled. The 3D triangular foot template is regarded as a fabric with elasticity and deformability, and the foot model to be resampled is regarded as a rigid body. First, the rigid body model is scaled down to be completely enclosed by the foot template. Then, the rigid body model gradually enlarges and returns to its original size. During the enlargement process, the rigid body model will push against the foot template. Finally, the 3D dimensions of the foot template and the rigid body model are exactly the same. During the deformation process of the fabric, the number of vertices and the triangular topological structure remain unchanged. Therefore, when different foot models are resampled using the same foot template, the resampled results all have the same number of vertices and triangular topology as the foot template. The foot 3D models resampled by the proposed method possess a unified topological structure, which makes the analysis of foot 3D models more convenient and diverse.

1.4. Innovation

The innovation of this study lies in the automatic resampling of 3D foot models by combining cloth simulation and rigid body scaling. Specifically, the foot template model is first endowed with 3D deformation capability using cloth simulation. The target foot model to be resampled is then regarded as a rigid body and fully wrapped by the deformed foot template. Subsequently, rigid body scaling is performed. During the scaling process, the rigid body pushes against the foot template, driving the template to match the 3D shape of the target foot model without any operations such as pulling or dragging are required. This pipeline features a high degree of automation and can generate foot models with the same topological structure as the template.

2. Materials and Methods

To clarify the technical framework and implementation details of the proposed foot 3D model resampling method, this section systematically elaborates on the key procedures, parameter settings, and evaluation protocols. Specifically, we first present the technical route of foot 3D model resampling based on fabric simulation technology, followed by the acquisition and preprocessing methods of raw foot 3D models. Subsequently, the establishment approach of the foot 3D template for resampling is described in detail. We then introduce the platform and workflow adopted for resampling implementation, along with the mechanical parameter configuration during the deformation simulation of the fabric model. Finally, the consistency assessment and error measurement methods for validating the resampled foot models are presented to verify the reliability of the proposed resampling technique.

2.1. Pipeline of Resampling 3D Triangular Foot Model

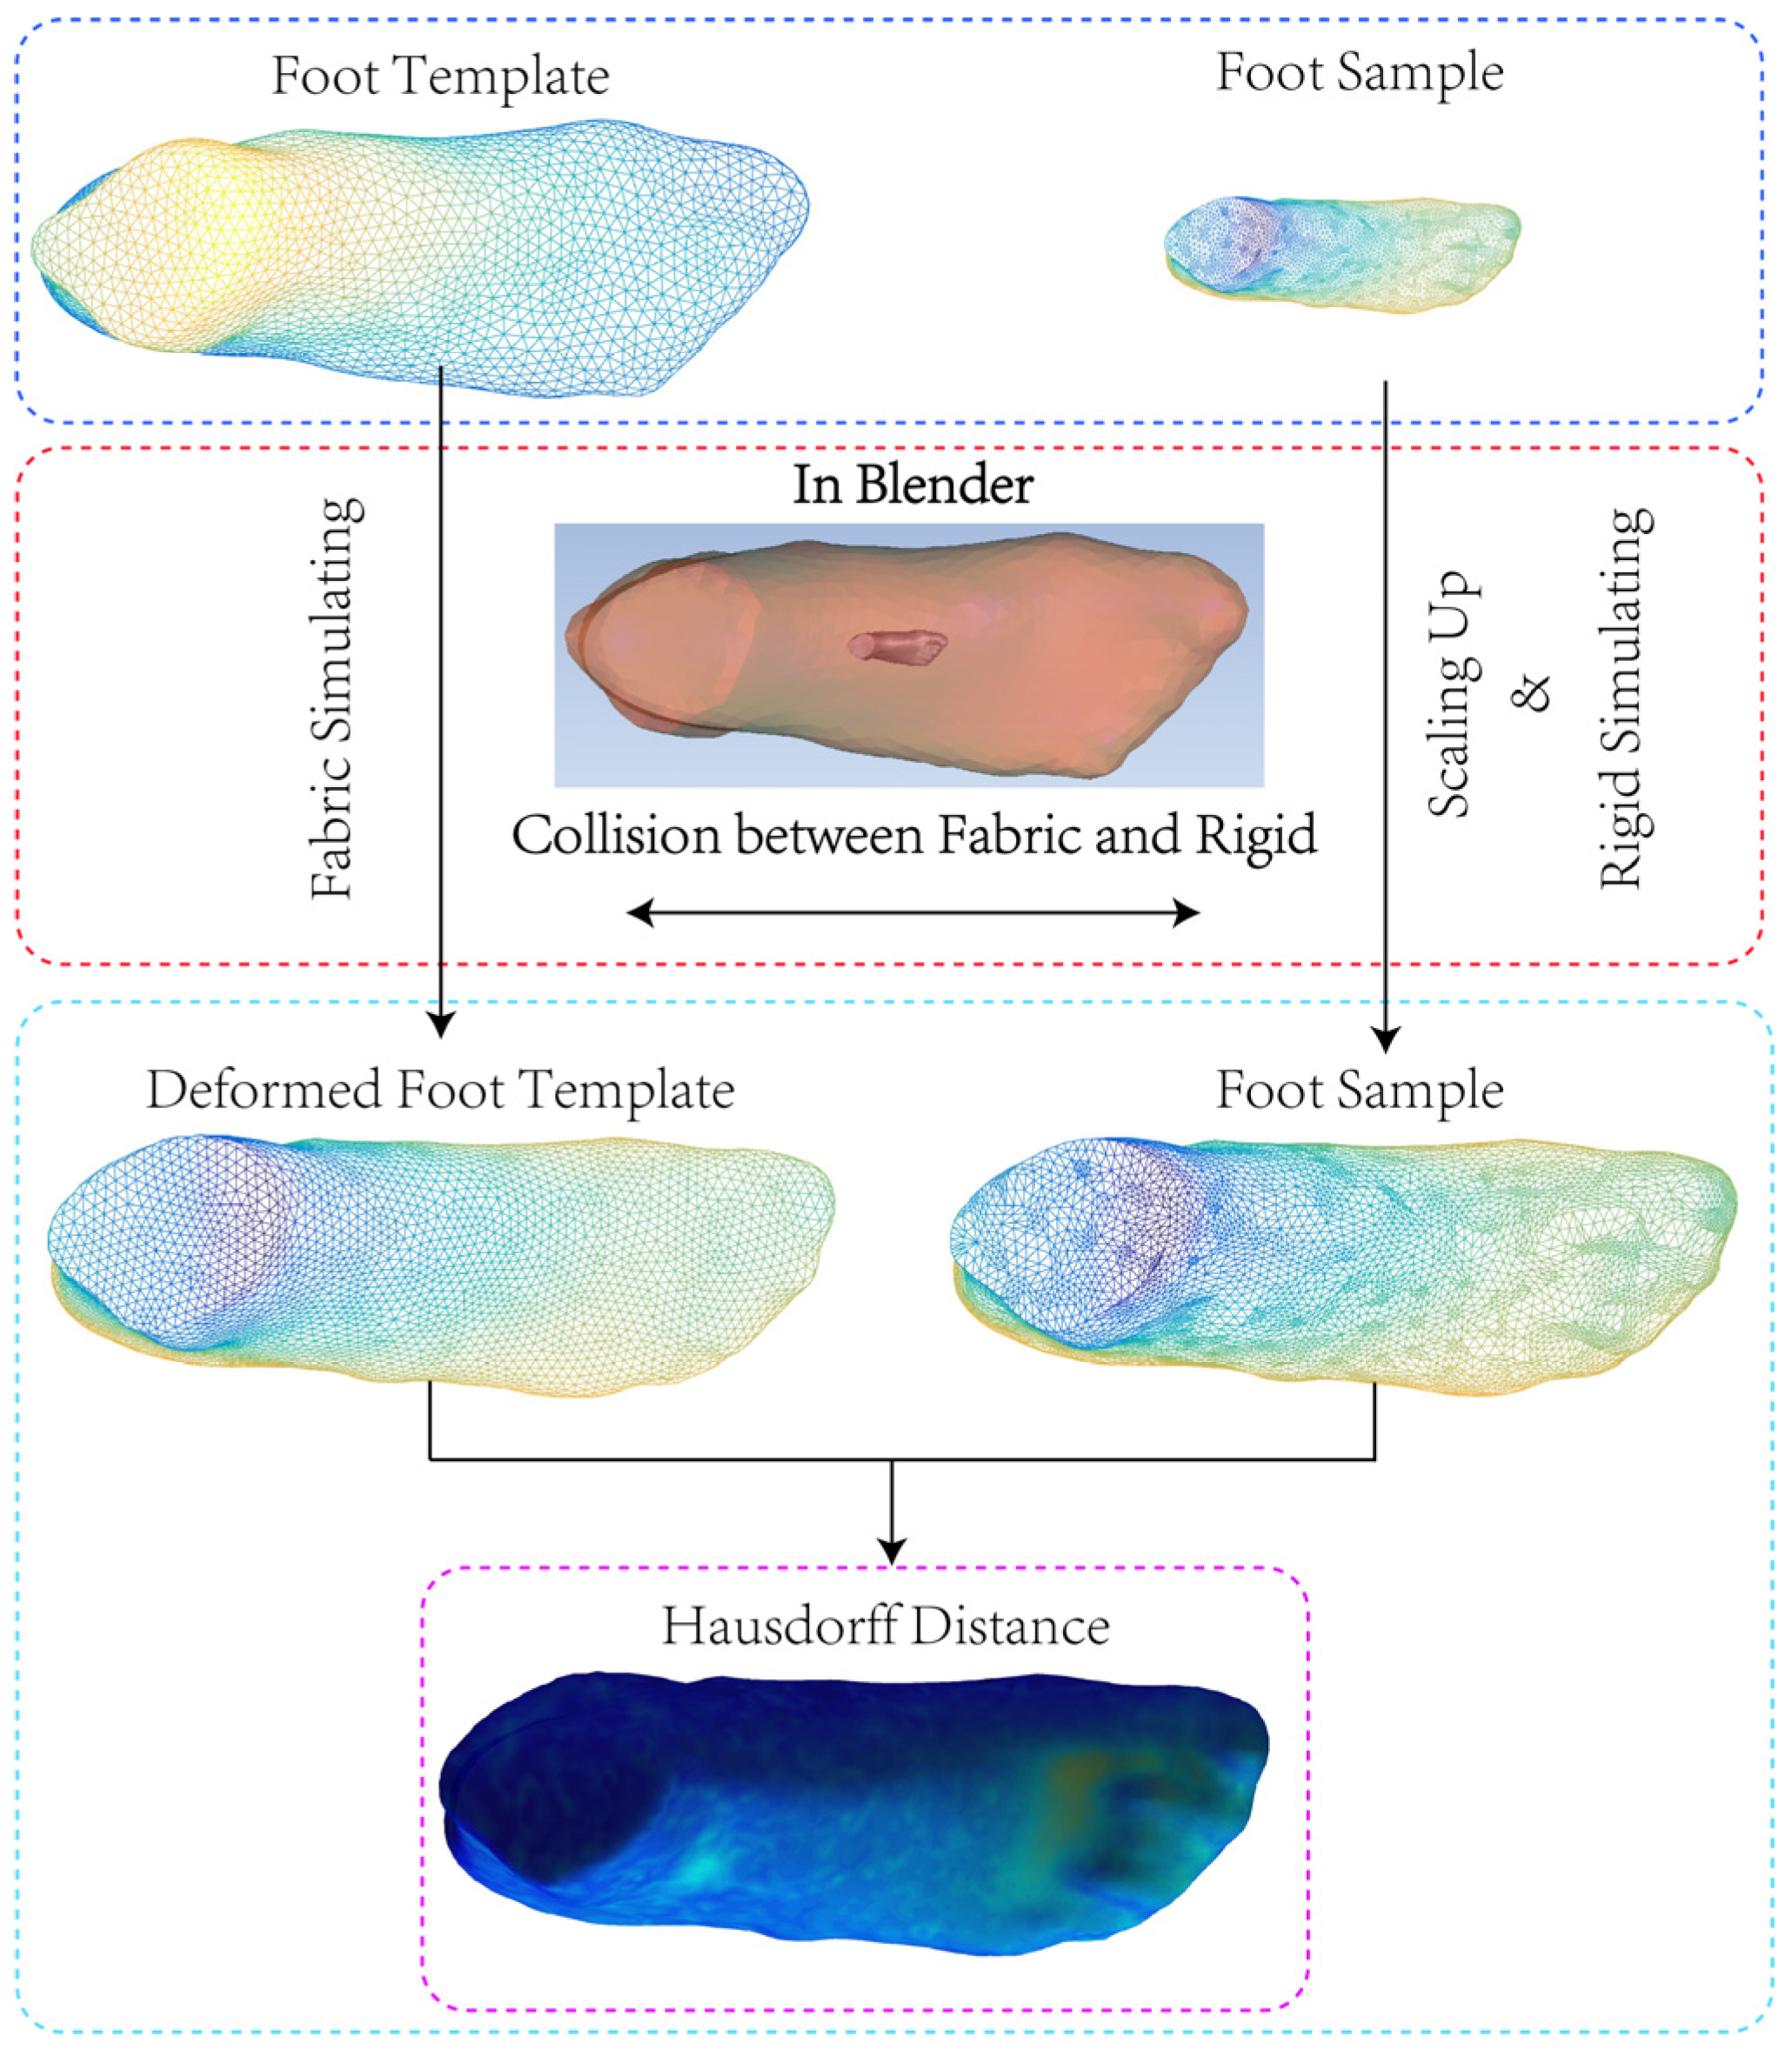
The technical roadmap of this study is illustrated in Figure 1. A Cloth Modifier was added to the imported 3D triangular foot template, enabling it to simulate the stretching, bending, and shearing behaviors of a fabric. A Rigid Body Modifier was applied to the imported foot model to be resampled, endowing it with the characteristics of a rigid body that can collide with and extrude the fabric to induce deformation. To prevent mesh penetration between the rigid body model and the cloth model, this study pre-scaled the original rigid body model to 10% of its original size upon import. The purpose of this preprocessing step was to ensure that the foot model to be resampled was completely enclosed by the 3D triangular foot template in the initial stage. Subsequently, the rigid body model was gradually scaled up to its original size from the first frame to the final frame of the simulation. Finally, linear interpolation scaling keyframe animations were added to the rigid body to simulate the size change process, allowing the rigid body model to recover from 10% to 100% of its original dimensions. Specifically, a scaling factor of (1, 1, 1) was set at the 1st frame with a corresponding keyframe inserted. A scaling factor of (10, 10, 10) was then set at the 250th frame with another keyframe inserted, achieving a 10-fold uniform scaling from the 1st frame to the 250th frame. During this process, the rigid body model recovered from 10% to its original size, while colliding with and extruding the cloth model to induce continuous deformation. At the 250th frame, the shape of the cloth model became almost identical to that of the rigid body model under the extrusion effect. The deformed state of the cloth model at the 250th frame was then saved as the resampled model. At this point, the cloth model could be used as a substitute for the original rigid body model in subsequent analyses, and this entire process constitutes the resampling of the target foot model (rigid body model). When different rigid body models are resampled using the same 3D triangular foot template, the resulting 3D foot mesh models exhibit different three-dimensional sizes but identical vertex counts and triangular topological structures.

2.2. Capturing and Preprocessing of 3D Triangular Foot Models

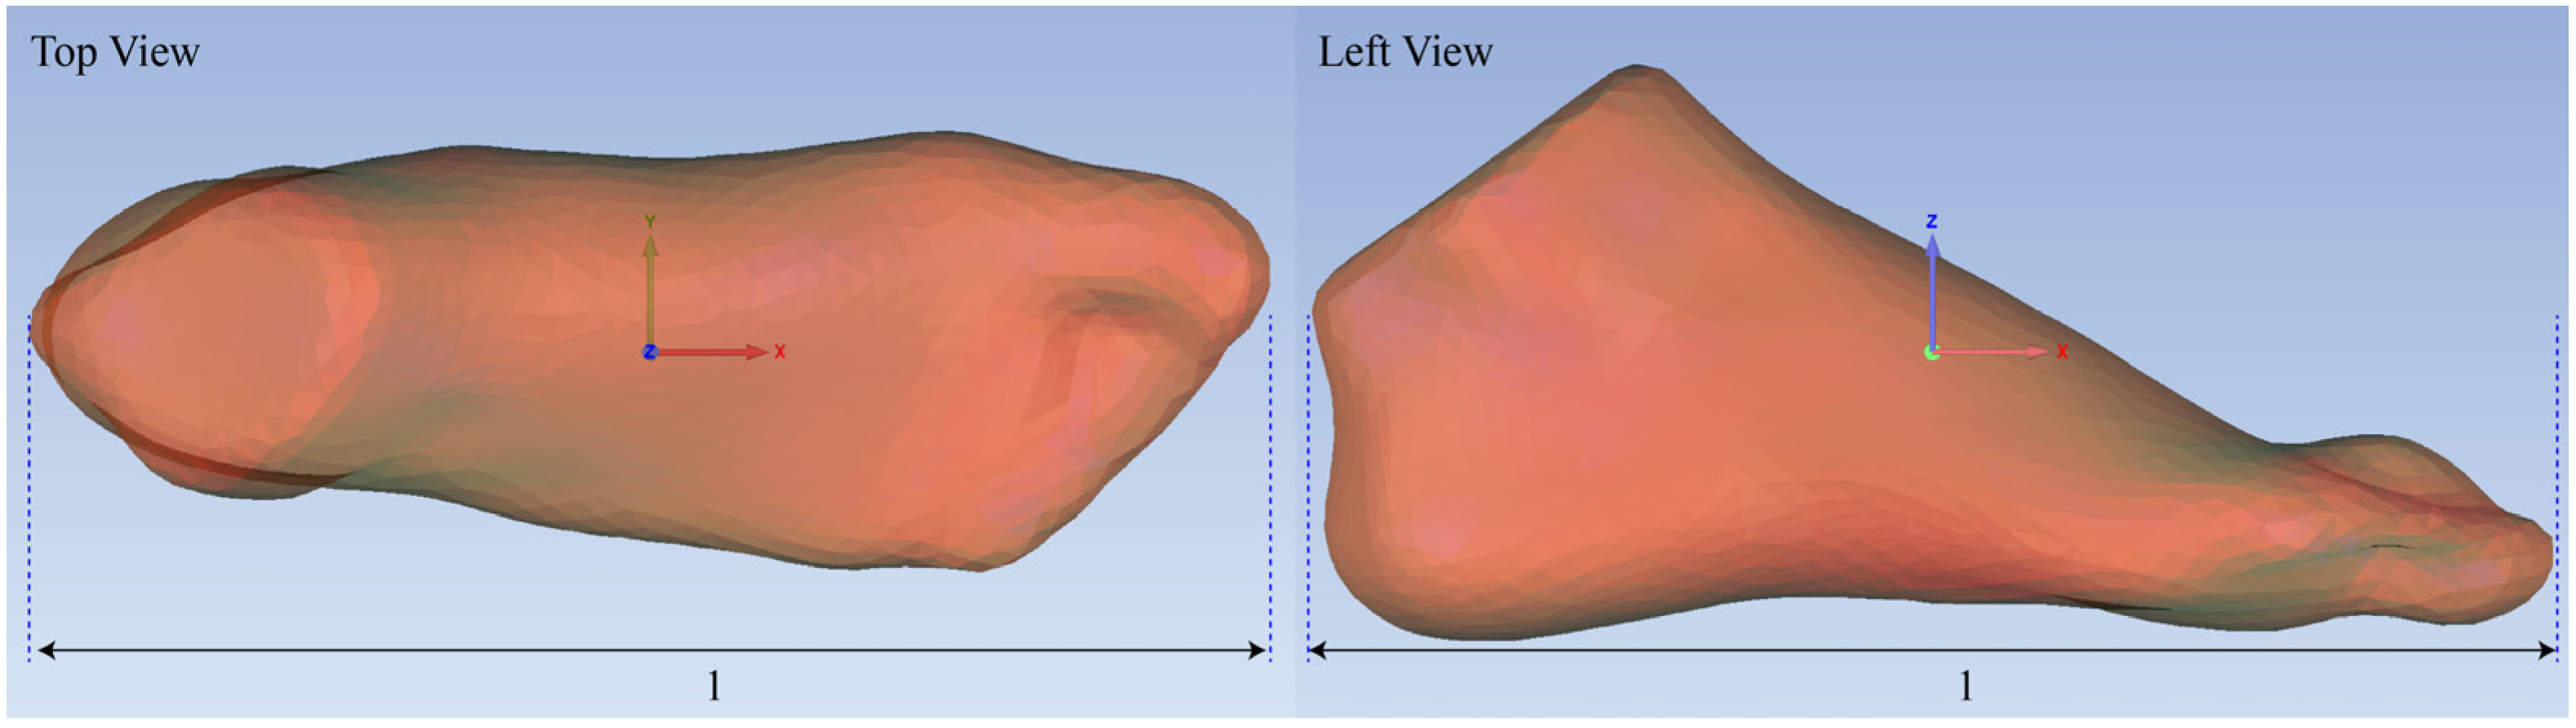
In this study, a total of 216 right-foot 3D models were collected from college students (aged 18–25 years, with no specific gender-based stratification) using the EinScan Pro 2X Plus multi-functional handheld 3D scanner (Shining 3D Tech Co., Ltd. Hangzhou, China). During the scanning process, a standard-sized reference object was placed adjacent to each foot sample for scale calibration. After all foot models were acquired, the reverse engineering software Geomagic Studio 2013 was employed to scale each 3D triangular foot model to its actual physical dimensions based on the reference object. Subsequently, in Geomagic Studio, the point clouds of the foot models were cropped to the target region and denoised to remove spurious points, before being finally meshed into closed triangular 3D surfaces. To enhance the universality and applicability of the proposed method, all 3D triangular foot models were normalized to a unit cube via uniform scaling. As illustrated in Figure 2, all preprocessed foot models were aligned with the coordinate system in a consistent orientation. The foot length was distributed along the X-axis, the foot width along the Y-axis, and the foot height along the Z-axis. Specifically, the normalized length of each foot model along the X-axis was set to 1 unit, and the centroid of each model was translated to the origin (0, 0, 0) of the 3D coordinate system.

2.3. Definition of 3D Triangular Foot Templates

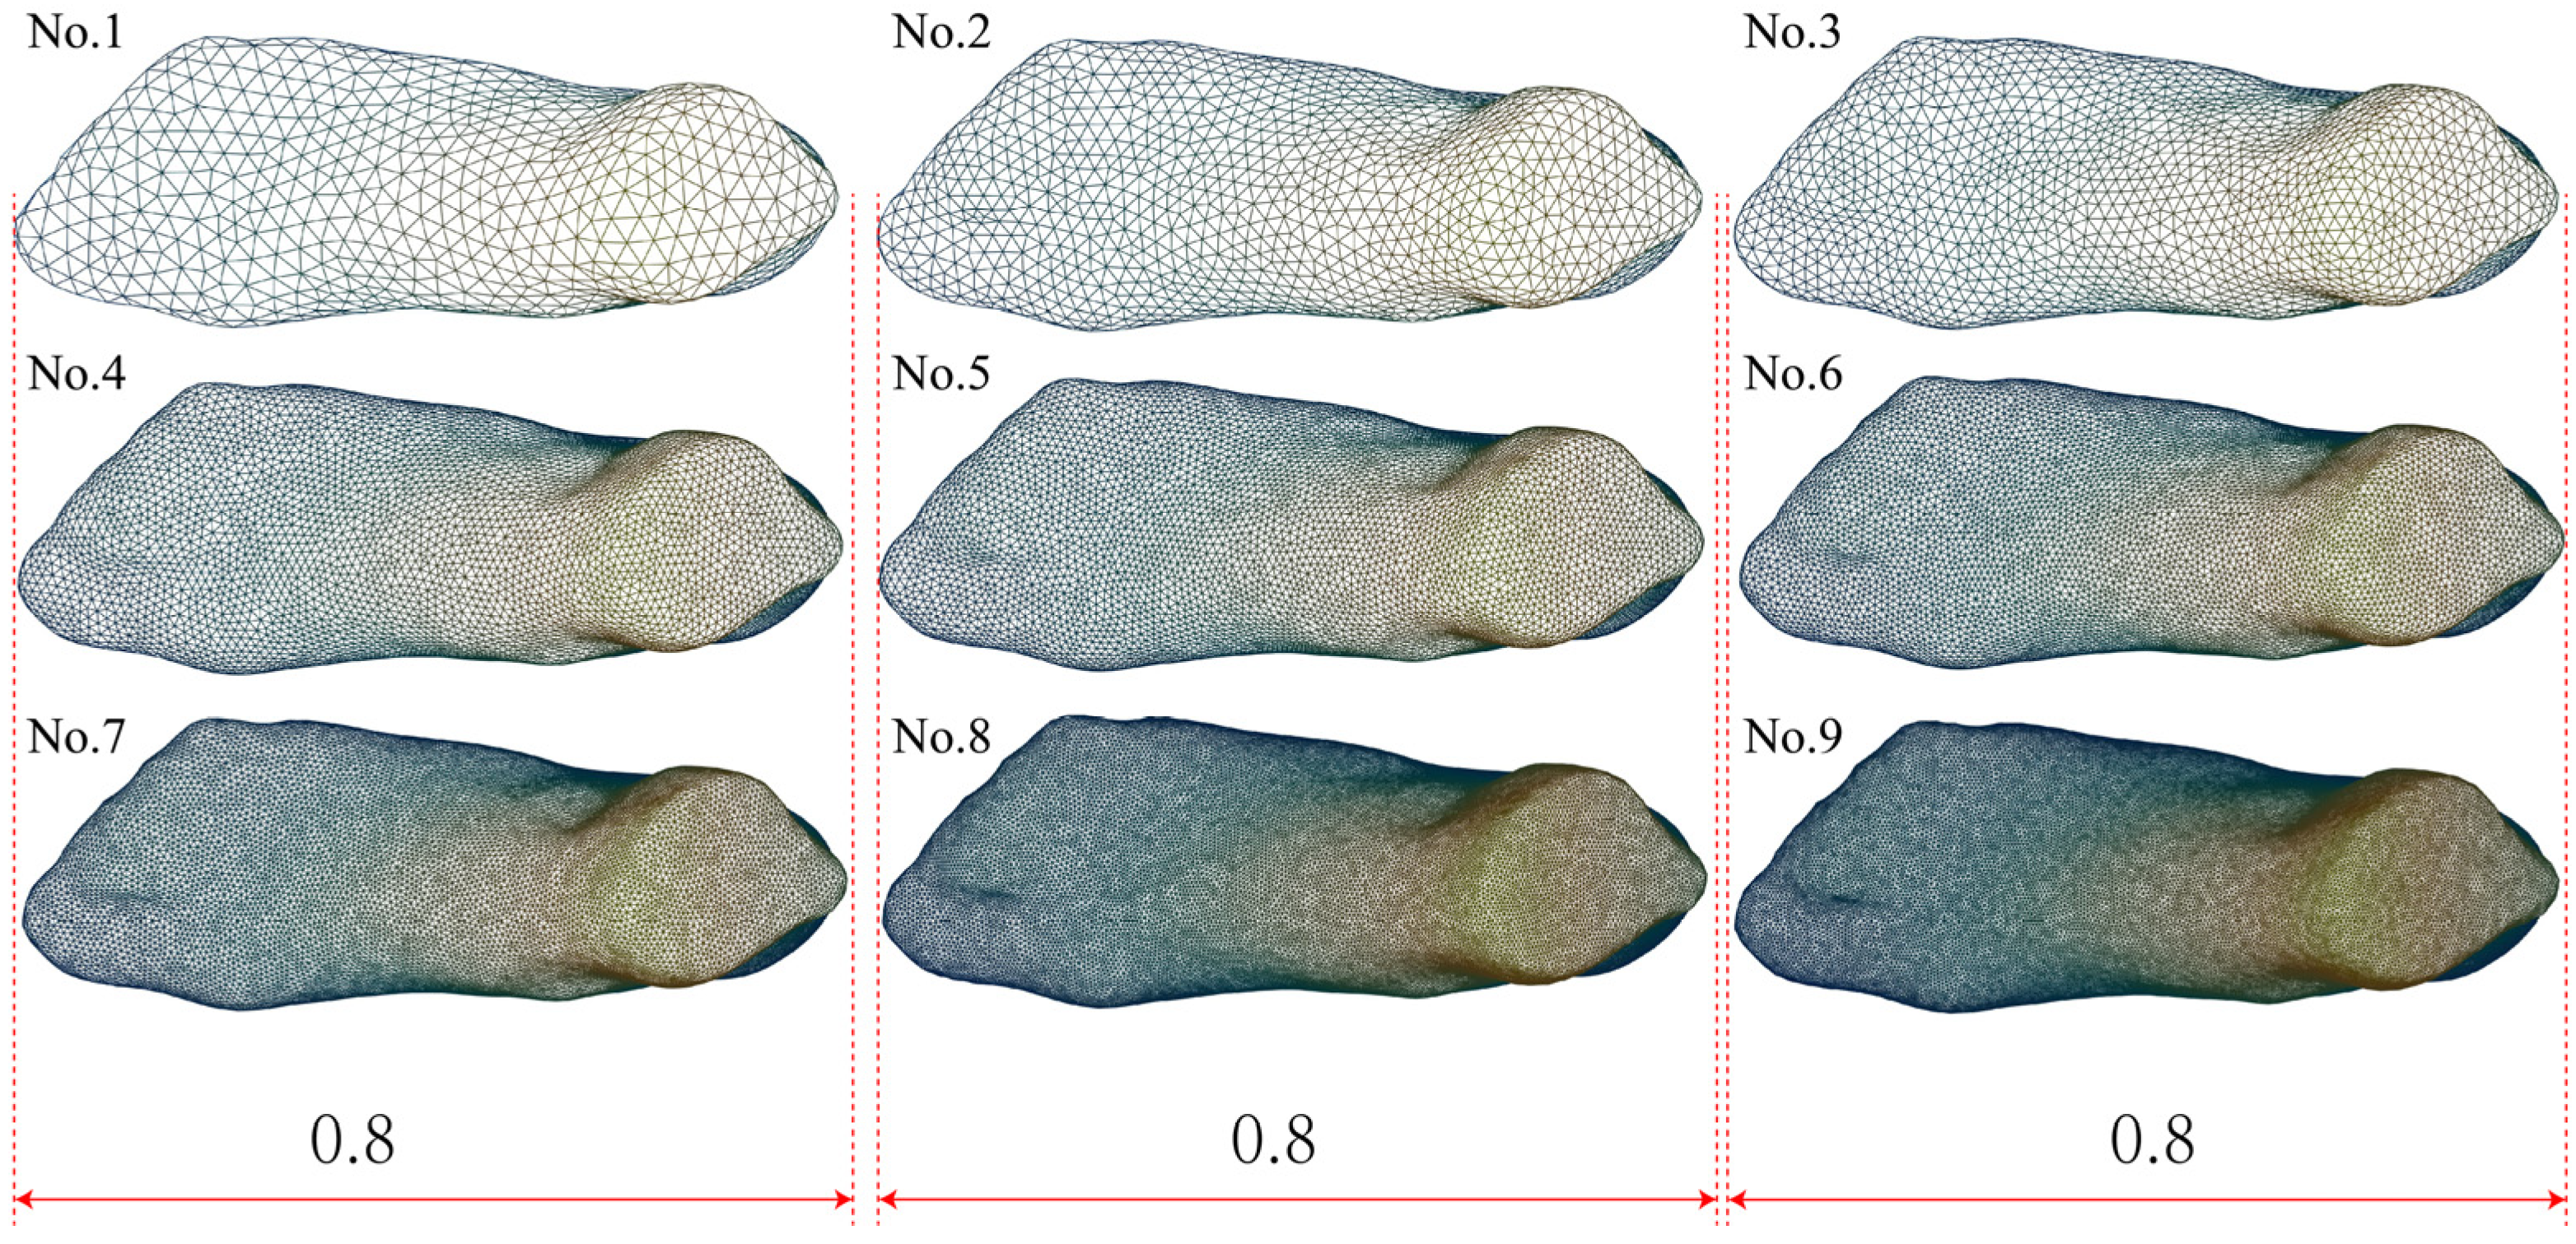
Ten 3D triangular foot models were randomly selected from the entire set of collected models. These ten selected models were then normalized to a unit scale, where the length along the foot length direction was set to 1 unit. Subsequently, the Hausdorff distances between every pair of these ten 3D triangular foot models were calculated individually; in other words, the Hausdorff distance from each model to the other nine models was computed. The 3D triangular foot model with the smallest average Hausdorff distance was selected as the initial 3D triangular foot template. This template was then subjected to remeshing in the software Geomagic Studio to generate nine sets of 3D triangular foot templates with different vertex and triangle counts, as detailed in Table 1.
As illustrated in Figure 3, all the 3D triangular foot templates were aligned with a unified coordinate system: the foot length was oriented along the X-axis, the foot width along the Y-axis, and the foot height along the Z-axis. Each preprocessed template was normalized such that its dimension along the X-axis was set to 0.8, and the centroid of the template was positioned at the origin (0, 0, 0) of the 3D coordinate system. The purpose of setting the overall scale to 0.8 was to ensure that the size of the 3D triangular foot template was smaller than that of the target foot model to be resampled. This configuration guaranteed that the target model would exert an extrusion or abutment force on the template during the subsequent resampling process, thereby reducing the resampling error.

2.4. Simulation Platform and Resampling Workflow

The simulation platform employed in this study was Blender (Version 3.6). The experiments were conducted on an MSI Raider GE77 HX laptop (Micro-Star International Co., Ltd., New Taipei, Taiwan, China), configured with an Intel Core i9-12900HX processor and an NVIDIA GeForce RTX 3080 Ti graphics card with 16 GB of dedicated video memory. The resampling of 3D triangular foot models was fully automated via custom Python v3.8 scripts in Blender(For implementation code, refer to Section S5 in the Supporting Information), which implemented the following operations:
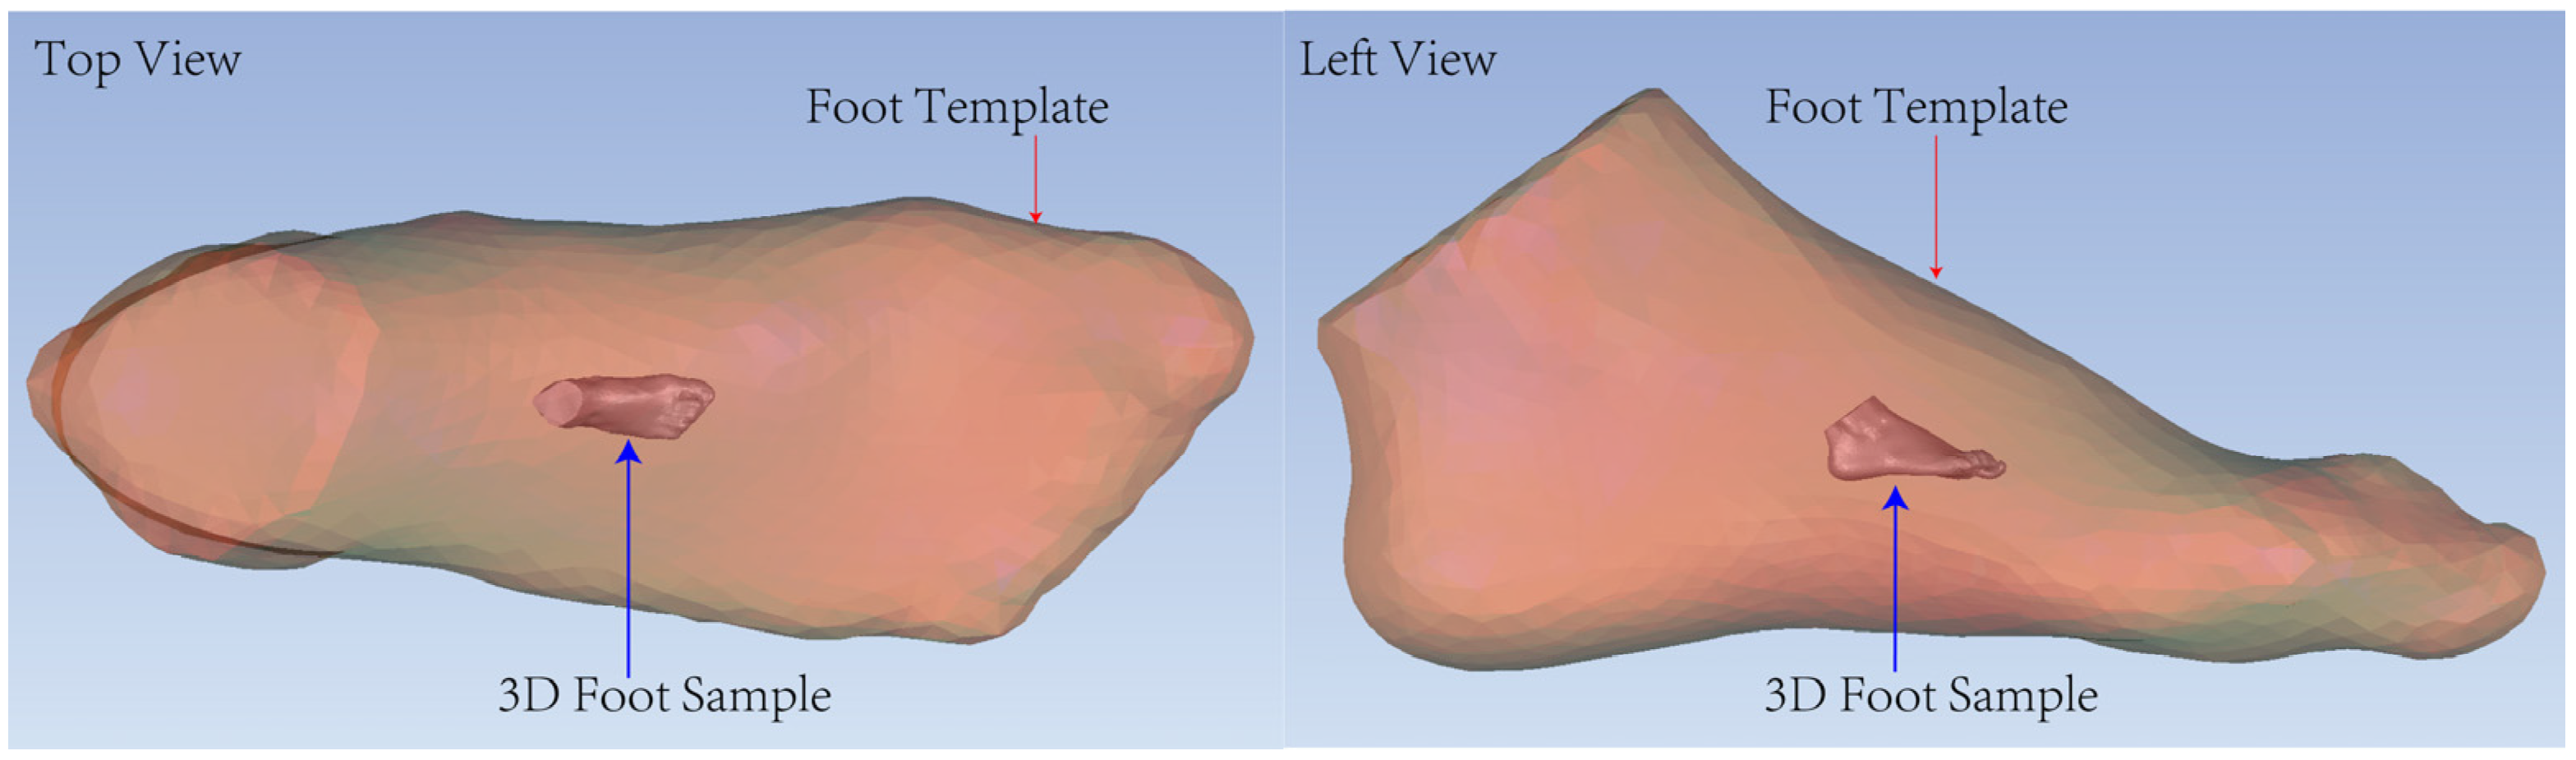
The 3D foot template was imported first. Its initial position was set to (0, 0, 0) with an initial rotation of (0, 0, 0). A uniform scaling factor of 1.0 was applied, meaning the original size of the 3D foot template remained unchanged after import, as depicted in Figure 4.
The target foot mode (3D foot sample to be resampled, as depicted in Figure 4) was imported as well. Its initial position was set to (0, 0, 0) with an initial rotation of (0, 0, 0). A uniform scaling factor of 0.1 was applied, reducing the model to 10% of its original size. This pre-scaling step ensured that the target foot model was completely enclosed by the 3D foot template at the initial stage of the resampling.
A Cloth Modifier was added to the 3D triangular foot template to simulate the flexible mechanical properties of real fabrics, enabling the template to deform under external forces. A Collision Modifier was applied to the target foot model to be resampled, endowing it with the ability to collide with and extrude the 3D triangular foot template.
In Blender, the total simulation frame count for cloth simulation and rigid body models is set to 250 frames. At frame 1, the foot model to be resampled is scaled to 10% of its original size. Then, from frame 1 to frame 250, the foot model gradually returns to its original dimensions. During the restoration process, the model gradually pushes against the foot template, driving the template to match the 3D size of the target foot model exactly. The deformed result of the foot template at frame 250 is taken as the resampling output of the target foot model. The detailed parameters of the cloth modifier are listed in Table 2.

2.5. Setting of Mechanical Parameters for the Cloth Modifier

Mechanical parameters have a significant impact on the results of cloth simulation. Therefore, this study investigated the effects of mechanical parameters by varying the tensile strength and bending stiffness of the cloth model. The reason for only adopting tensile strength and bending stiffness in this study is that the cloth was regarded merely as a mesh object with elastic deformation capability.
Compared with tensile strength and bending stiffness, its shear stiffness had an insignificant impact on the simulation results. This phenomenon was also verified in the pre-experiments of this study. Taking tensile strength and bending stiffness as examples, this study explored the effects of mechanical parameters on the resampling results. The settings of tensile strength and bending stiffness for the cloth modifier is shown in Table S1. As shown in Table S1, the tensile strength was set to 1, 3, 5, 7, 9, 11, 13, 15, 17, 19, 21, 23, 25, 27, 29, and 31, respectively. The bending stiffness was set to 1, 10, 20, 30, 40, 50, 60, 70, 80, 90, 100, 110, 120, 130, 140, 150, 160, 170, 180, 190, and 200, respectively. It should be noted that the tensile strength and bending stiffness involved in this study are virtual mechanical parameters, not the mechanical properties measured from real fabrics. As shown in Table S1, the combinations of tensile strength and bending stiffness were numbered and sorted, resulting in a total of 336 experimental combinations.
In practice, five samples were randomly selected from the foot models to be resampled and used as the target foot models. Another five samples were randomly selected from the foot models used as foot templates. The five foot templates were wrapped onto the five target foot models to perform resampling (the foot templates and the target foot models were randomly matched). According to the mechanical parameter combinations shown in Table S1, 336 resampling operations were performed for each foot template (each foot template was randomly corresponding to one target foot model). For each of the 336 resampled triangular foot models, the maximum Hausdorff distance between the resampled model and the original target foot model was calculated. This maximum Hausdorff distance was used as the evaluation criterion for the optimal combination of mechanical parameters. A smaller maximum Hausdorff distance indicates a more optimal combination of mechanical parameters.

2.6. Validation of Triangular Topological Structure Consistency

To validate the triangular topological structure of the resampled triangular foot models, this study performed resampling on the same batch of target foot models using three 3D triangular foot templates with different vertex densities (Template 2, Template 4, and Template 7). Subsequently, within the same batch of resampling results, the vertices with the same sequence number, along with their 1-neighborhood triangles and 3-neighborhood triangles, were visualized. The positions of the vertices with the same sequence number and their corresponding 1-neighborhood and 3-neighborhood triangles were observed across different resampled triangular foot models.

2.7. Error Analysis of Resampled Triangular Foot Models

To verify the errors of the resampled triangular foot models, the Hausdorff distance between each resampled triangular foot model and its original target foot model was calculated. The Hausdorff distance is a metric used to measure the distance between two subsets in a metric space. It quantifies the maximum distance from any point in one set to the nearest point in the other set. Subsequently, the Hausdorff distance was mapped onto the 3D triangular foot models in the form of heatmaps, and statistical histograms of the Hausdorff distance were plotted simultaneously. Finally, a descriptive statistical analysis was conducted on the Hausdorff distances of all resampled triangular foot models.

3. Results and Discussion

3.1. Deformation Process of the 3D Triangular Foot Template During Resampling

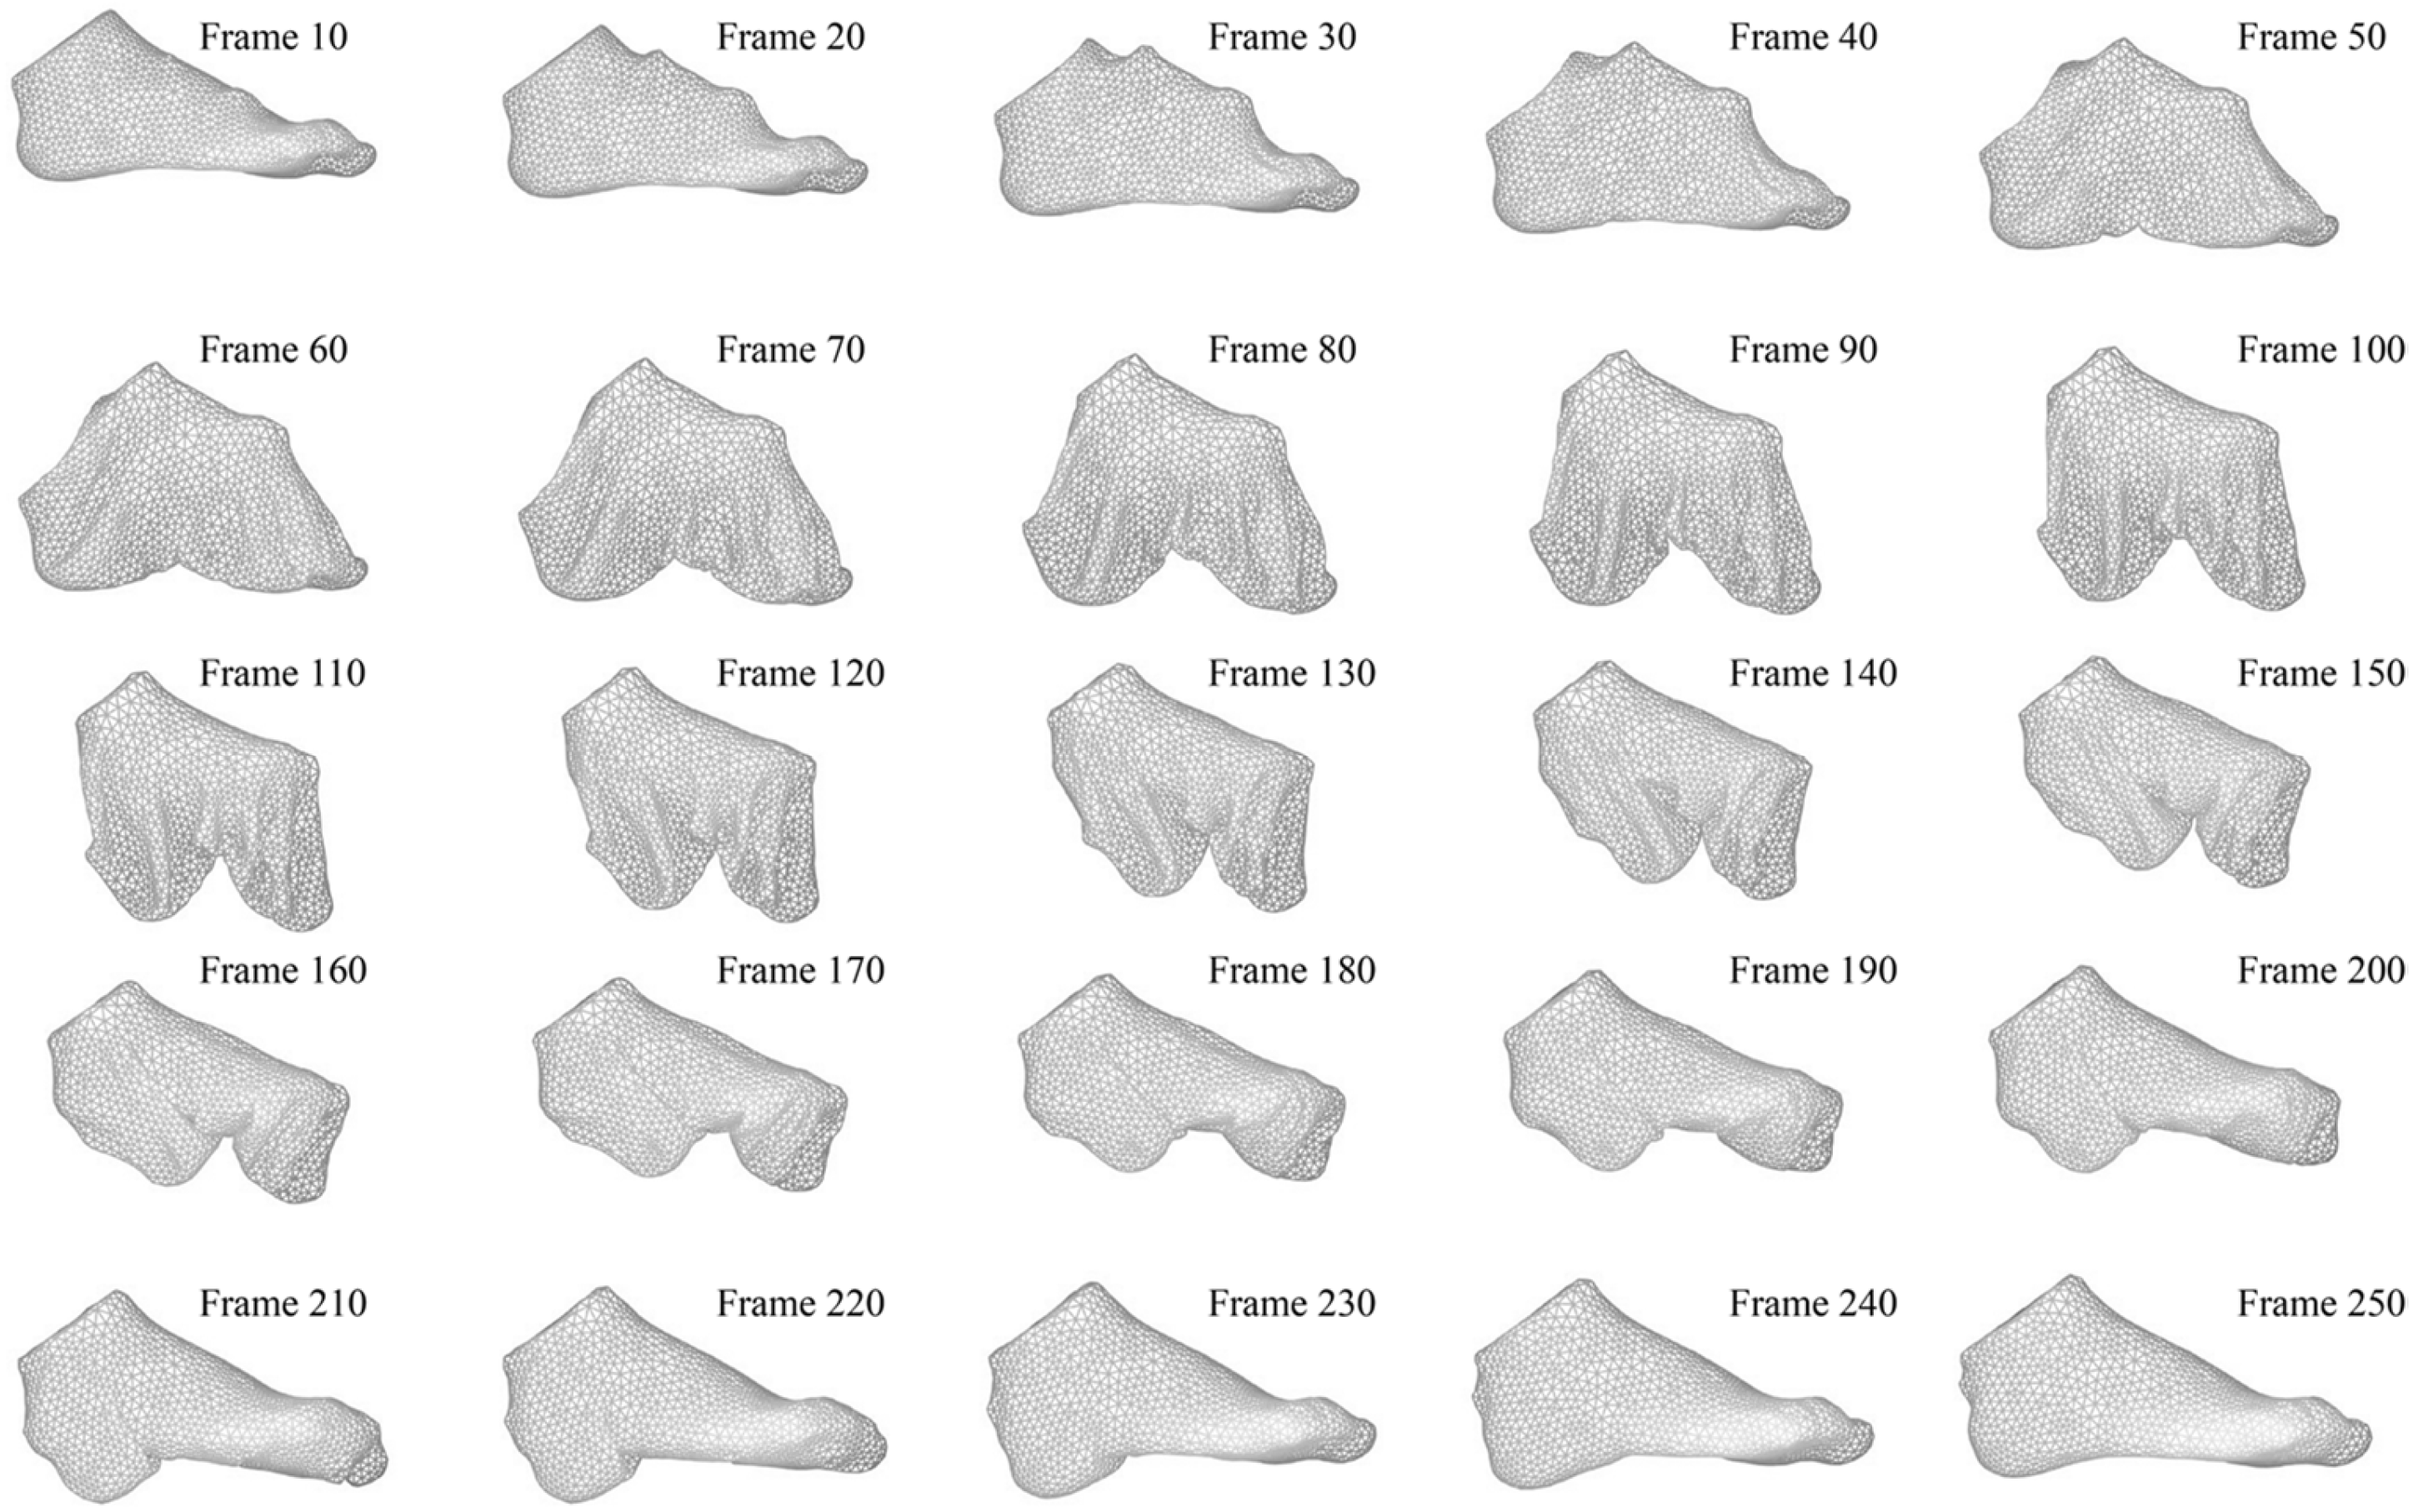
The deformation process of the 3D triangular foot template during resampling is illustrated in Figure 5.
The entire resampling process consisted of 250 frames, with each frame integrating the cloth simulation of the 3D triangular foot template and the rigid body simulation of the target foot model. At the initial stage of resampling, the target foot model was scaled to 10% of its original size and was completely enclosed within the 3D triangular foot template, thus remaining invisible in Figure 5. At this stage, the small size of the target foot model only allowed it to provide local supporting and extruding to the template. Therefore, as the number of cloth simulation steps increased, the 3D triangular foot template deformed under the action of gravity, exhibiting a phenomenon similar to the piling and draping of a fabric. With the gradual enlargement of the target foot model, it began to exert support and extrusion forces on the 3D triangular foot template, inducing the deformation of the template. When the target foot model was fully restored to its original size, it was able to provide omnidirectional support and extrusion to the 3D triangular foot template, resulting in the 3D dimensions of the template being completely consistent with those of the target model. Although the 3D dimensions of the deformed template matched those of the target foot model, its vertex count and triangular topological structure remained unchanged. Therefore, this process achieved an effect analogous to resampling.

3.2. Mechanical Parameters of Cloth Modifier and Error Distribution

The error involved in this section refers to the maximum Hausdorff distance between the resampled triangular foot model and the original triangular foot model. The Hausdorff distance at an arbitrary vertex refers to the shortest distance from a point on the resampled foot model to the original foot model. The overall Hausdorff distance of the resampled foot model is defined as the maximum value among the shortest distances of all its vertices to the original foot model.
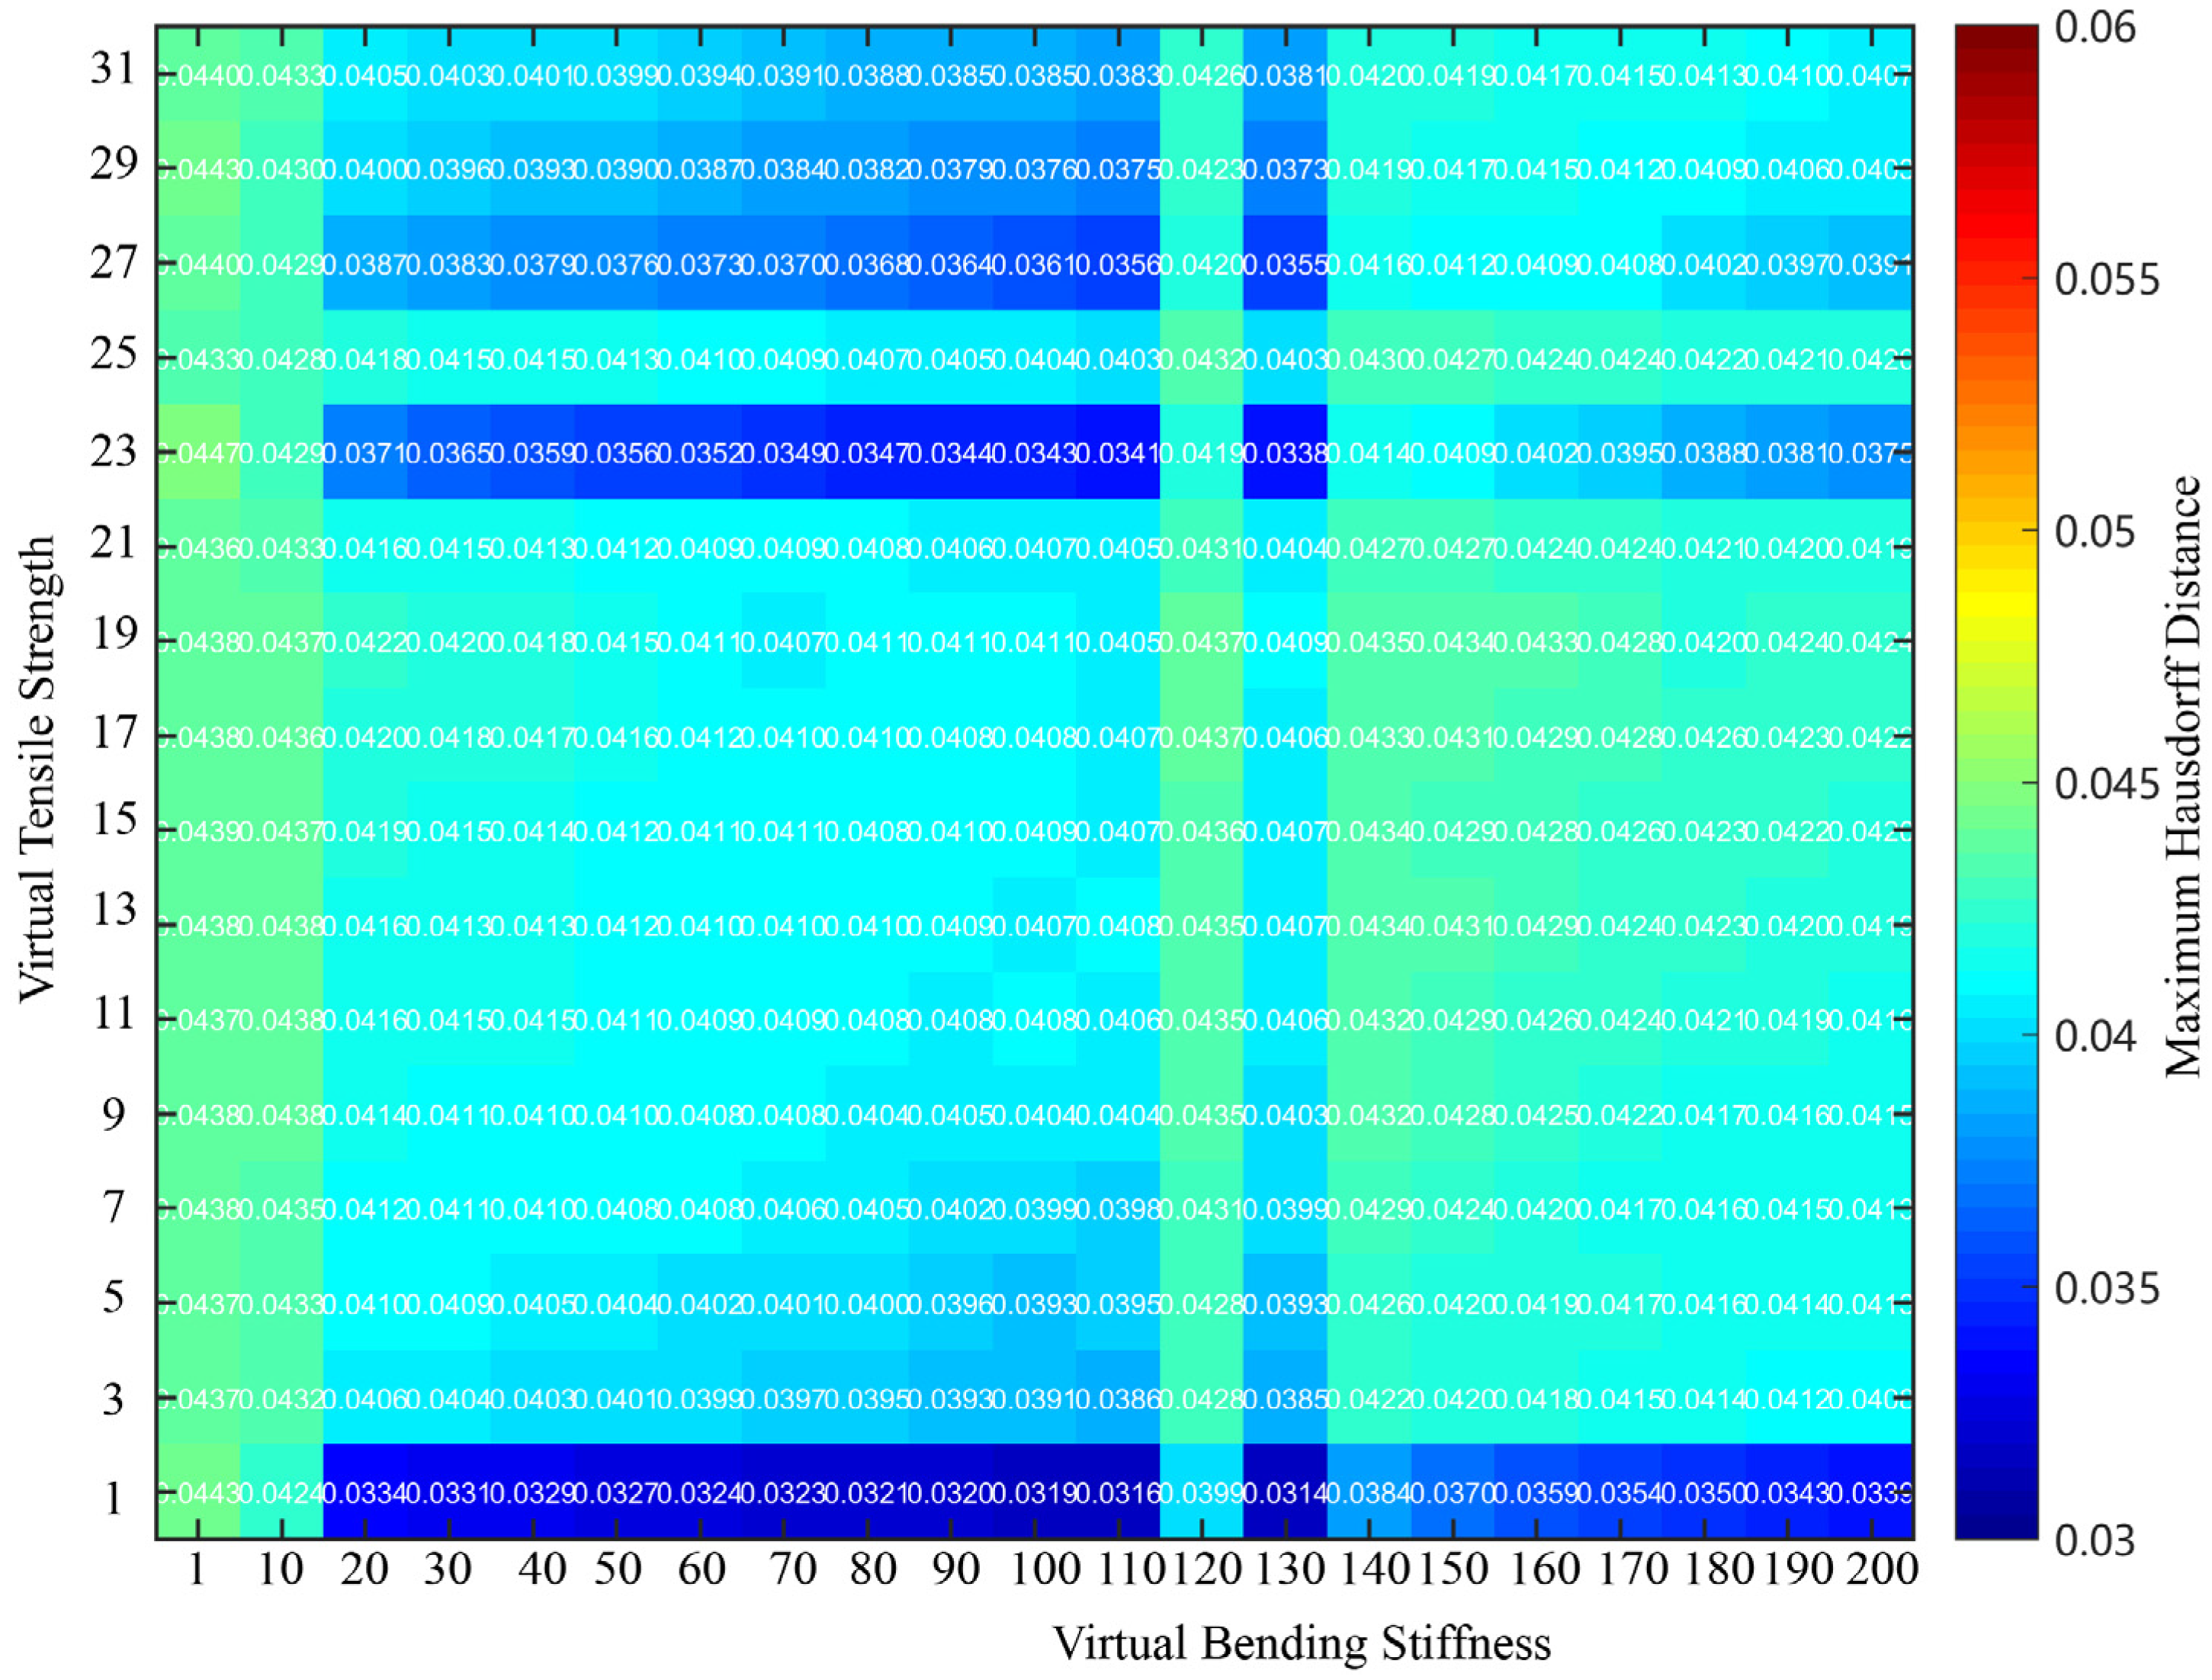
In Section 2.6, five groups of foot templates were randomly selected. Fabric simulation was performed for each group of foot templates, and each template was combined with a randomly selected foot model to be resampled. Thus, five sets of experimental results can demonstrate the relationship between the Mechanical Parameters of the Cloth Modifier and the Error Distribution. Due to space limitations, only one set of results is presented in Figure 6 in this chapter. The foot template corresponding to this set of results is shown in Figure S1a. The remaining four sets of results are displayed in Figures S2–S5. The corresponding foot templates are shown in Figure S1b (for Figure S2), Figure S1c (for Figure S3), Figure S1d (for Figure S4), and Figure S1e (for Figure S5), respectively.
It can be clearly observed from Figure S1 that the five groups of foot models exhibit significant morphological differences. The effects of tensile strength and bending stiffness on the resampling error, as shown in Figure 6 and Figures S2–S5, demonstrate that as the tensile strength increases from 1 to 21, the error of the resampled models gradually increases. When the tensile strength increased to 23, the error decreased. Thereafter, as the tensile strength increased from 27 to 31, the error of the resampled samples increased gradually again. This result indicates that increasing the tensile strength of the cloth simulation is not conducive to the resampling process involved in this study.
When the bending stiffness increased from 1 to 200, a trend of error decreasing first, then increasing, and subsequently decreasing again was observed in multiple rows. For example, when the tensile strength was set to 1, the error decreased gradually with the gradual increase in bending stiffness. When the bending stiffness increased to 120, the error fluctuated to 0.0399. This indicates that under this condition, the tensile strength and bending stiffness were mismatched, which was not conducive to the deformation of the cloth sample. Then, with the further increase in bending stiffness, the error decreased gradually again. This result shows that the synergistic effect of the tensile strength and bending stiffness under this condition is conducive to reducing the resampling error. Similar results were also observed in rows 12, 14, 15, and 16. However, compared with row 1, the corresponding errors were relatively larger. Therefore, this study determined the optimal parameters for the cloth simulation as a tensile strength of 1 and a bending stiffness of 110. All subsequent result analyses in this study were based on these simulation parameters.

3.3. Topological Consistency of Resampled Triangular Foot Models

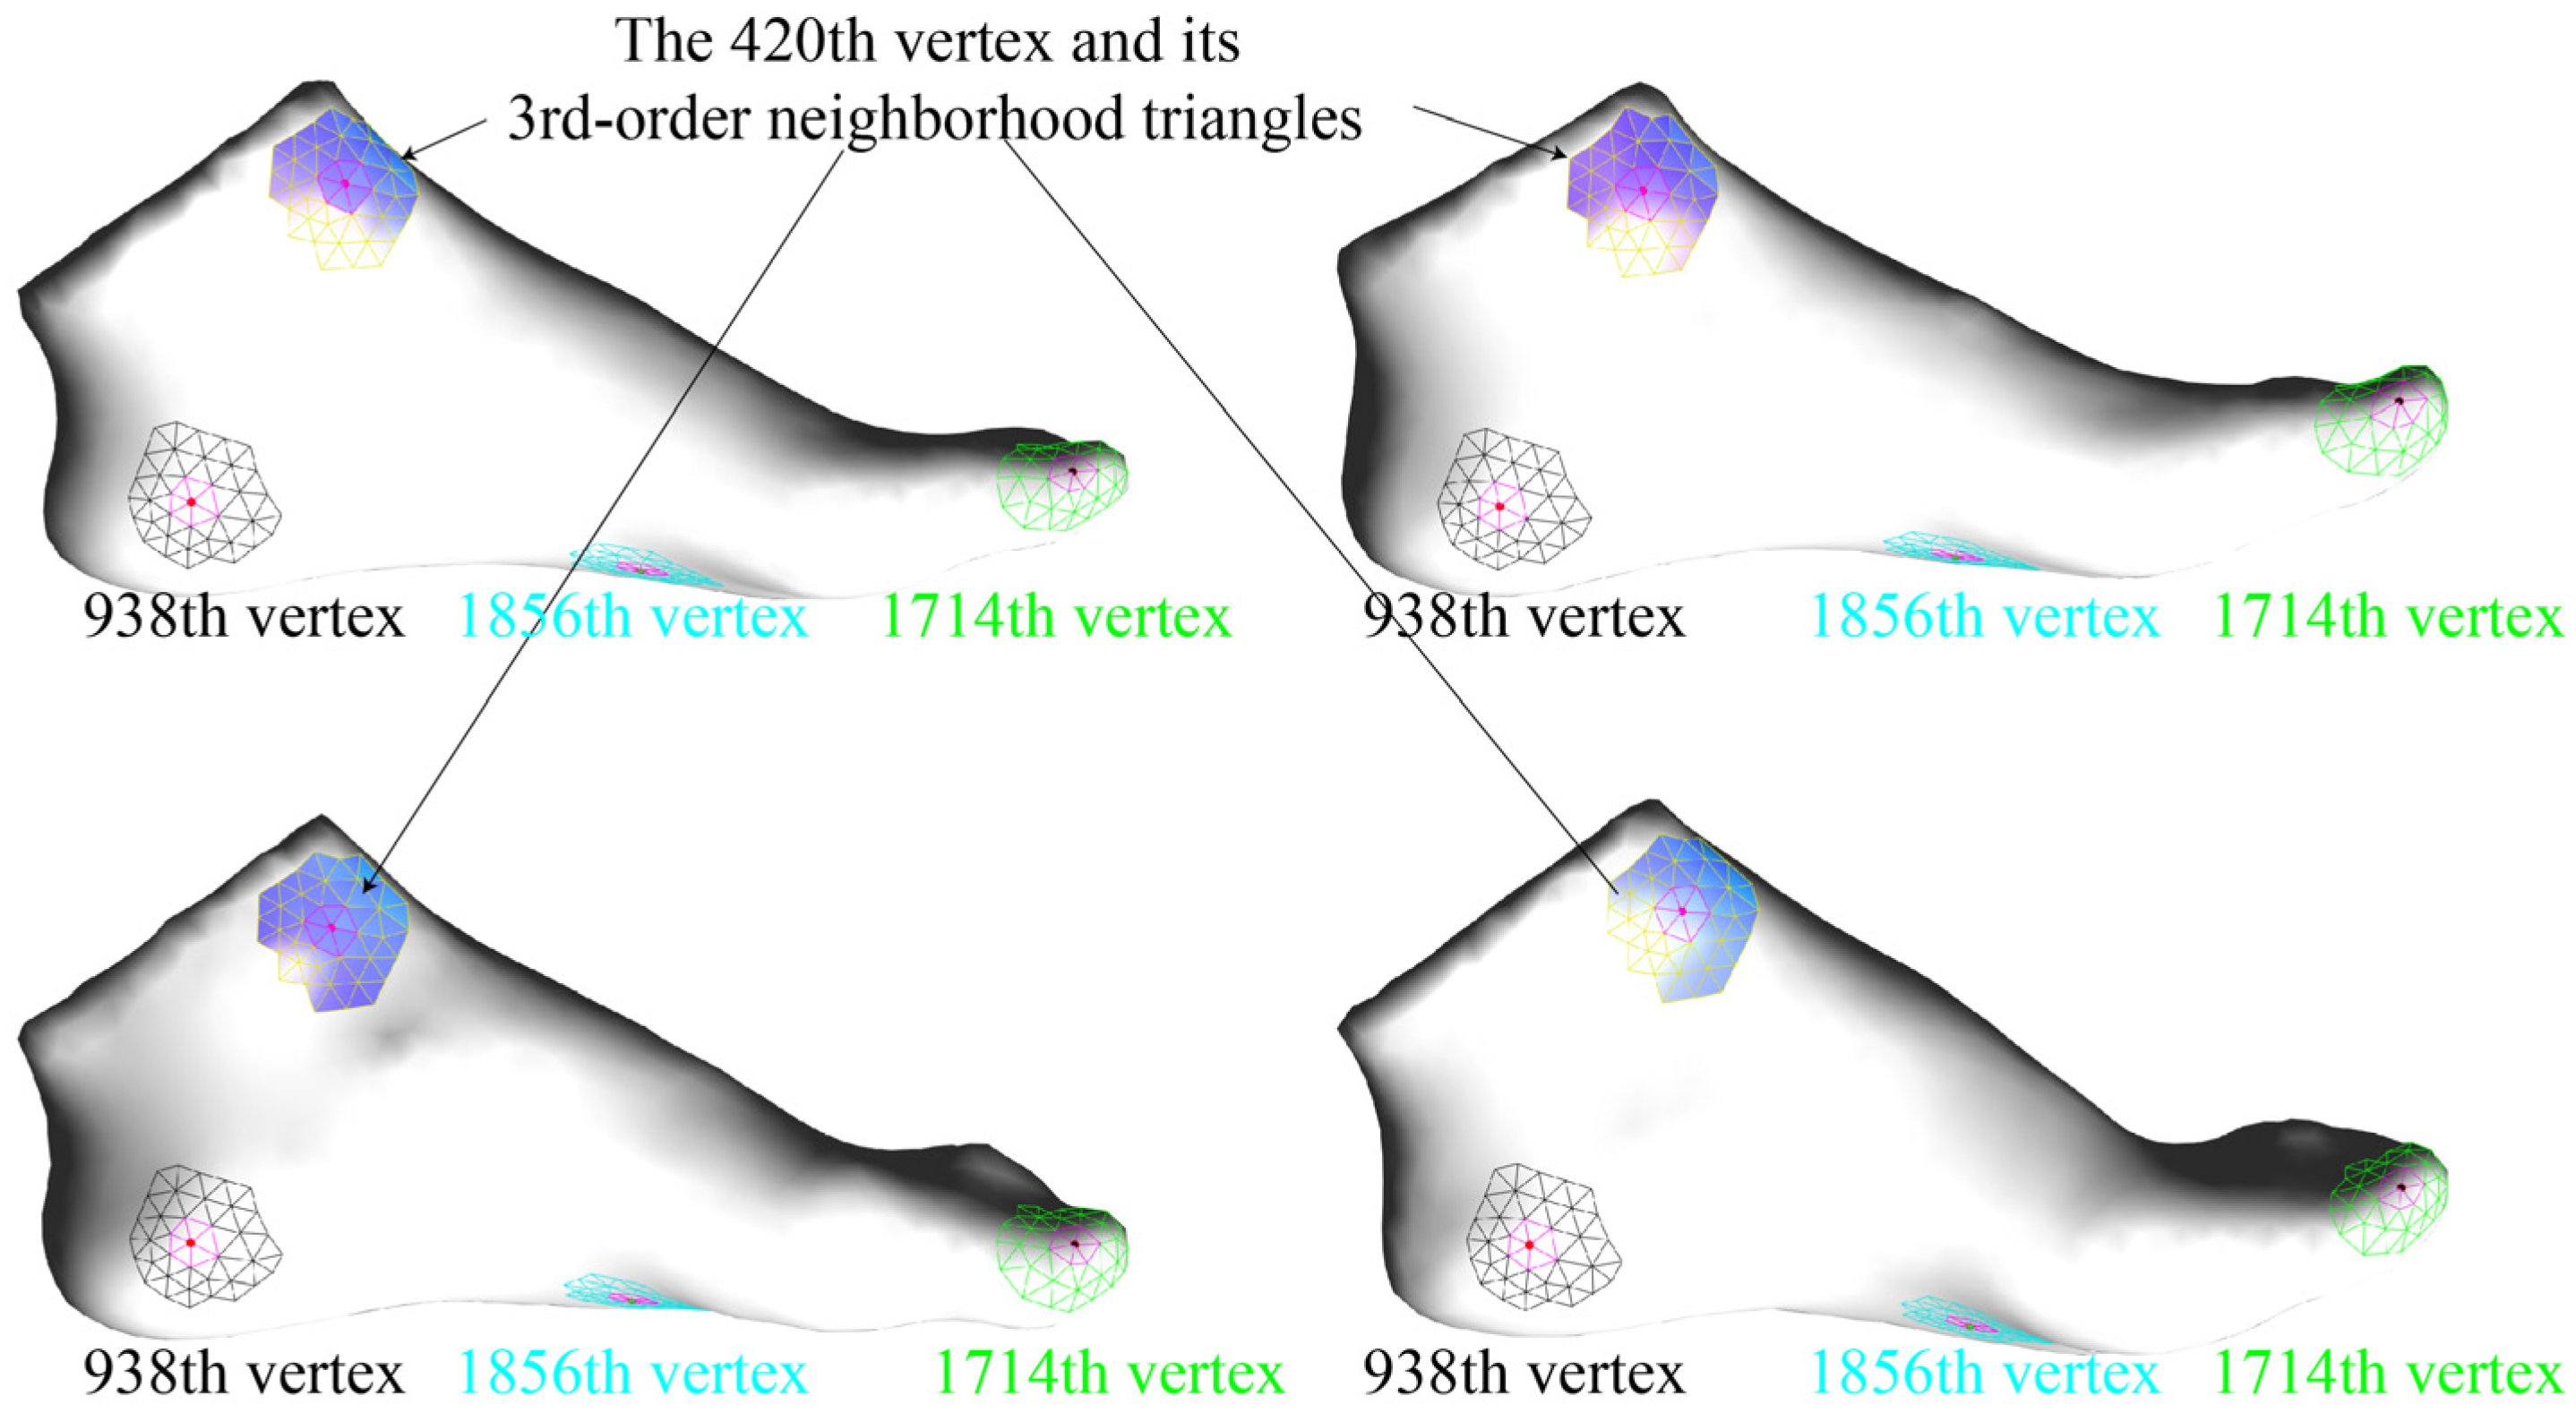
As illustrated in Figure 7 and Figure S6, four groups of foot models were resampled into three sets of foot models with different vertex counts using three 3D triangular foot templates (Template 2, Template 4, and Template 7) with distinct vertex numbers (Figure 7 and Figure S6a,b). In Figure 7, all four groups of foot models shared the same vertex count as Template 2. In Figure S6a, all four groups of foot models had the same vertex count as Template 4. In Figure S6b, all four groups of foot models possessed the same vertex count as Template 7.
It can be observed from Figure 7 that the 420th vertex (red particle) of all four groups of foot models was located at the upper part of the foot model, and their positions exhibited extremely high similarity. The 1-neighborhood triangles (red) and 3-neighborhood triangles (colored) of the 420th vertex in the four groups of foot models also showed extremely high similarity, with the same number of 1-neighborhood triangles and the same number of 3-neighborhood triangles. Furthermore, the 1714th vertex of all four groups of foot models was located at the position of the big toe, the 1856th vertex at the center of the plantar surface, and the 938th vertex at the medial side of the heel. The numbers of 1-neighborhood and 3-neighborhood triangles corresponding to these vertices were also identical.
As shown in Figure S6a, when the four groups of foot models were resampled using Template 4, the 2049th vertex of all four groups of foot models was located at the upper part of the foot. The 1-neighborhood and 3-neighborhood triangles of the 2049th vertex in the four groups of foot models exhibited extremely high similarity. Additionally, the 5543rd vertex of all four groups of foot models was located at the position of the big toe, the 4741st vertex at the center of the plantar surface, and the 3925th vertex at the medial side of the heel. This result indicates that the resampling method proposed in this study can obtain foot models with topological consistency. This conclusion was also verified by Figure S6b. As shown in Figure S6b, when the four groups of foot models were resampled using Template 7, the 5433rd vertex of all four groups of foot models was located at the upper part of the foot model, the 16,164th vertex at the position of the big toe, the 16,741st vertex at the center of the plantar surface, and the 10,840th vertex at the medial side of the heel.

3.4. Error Distribution of Resampled Triangular Foot Models

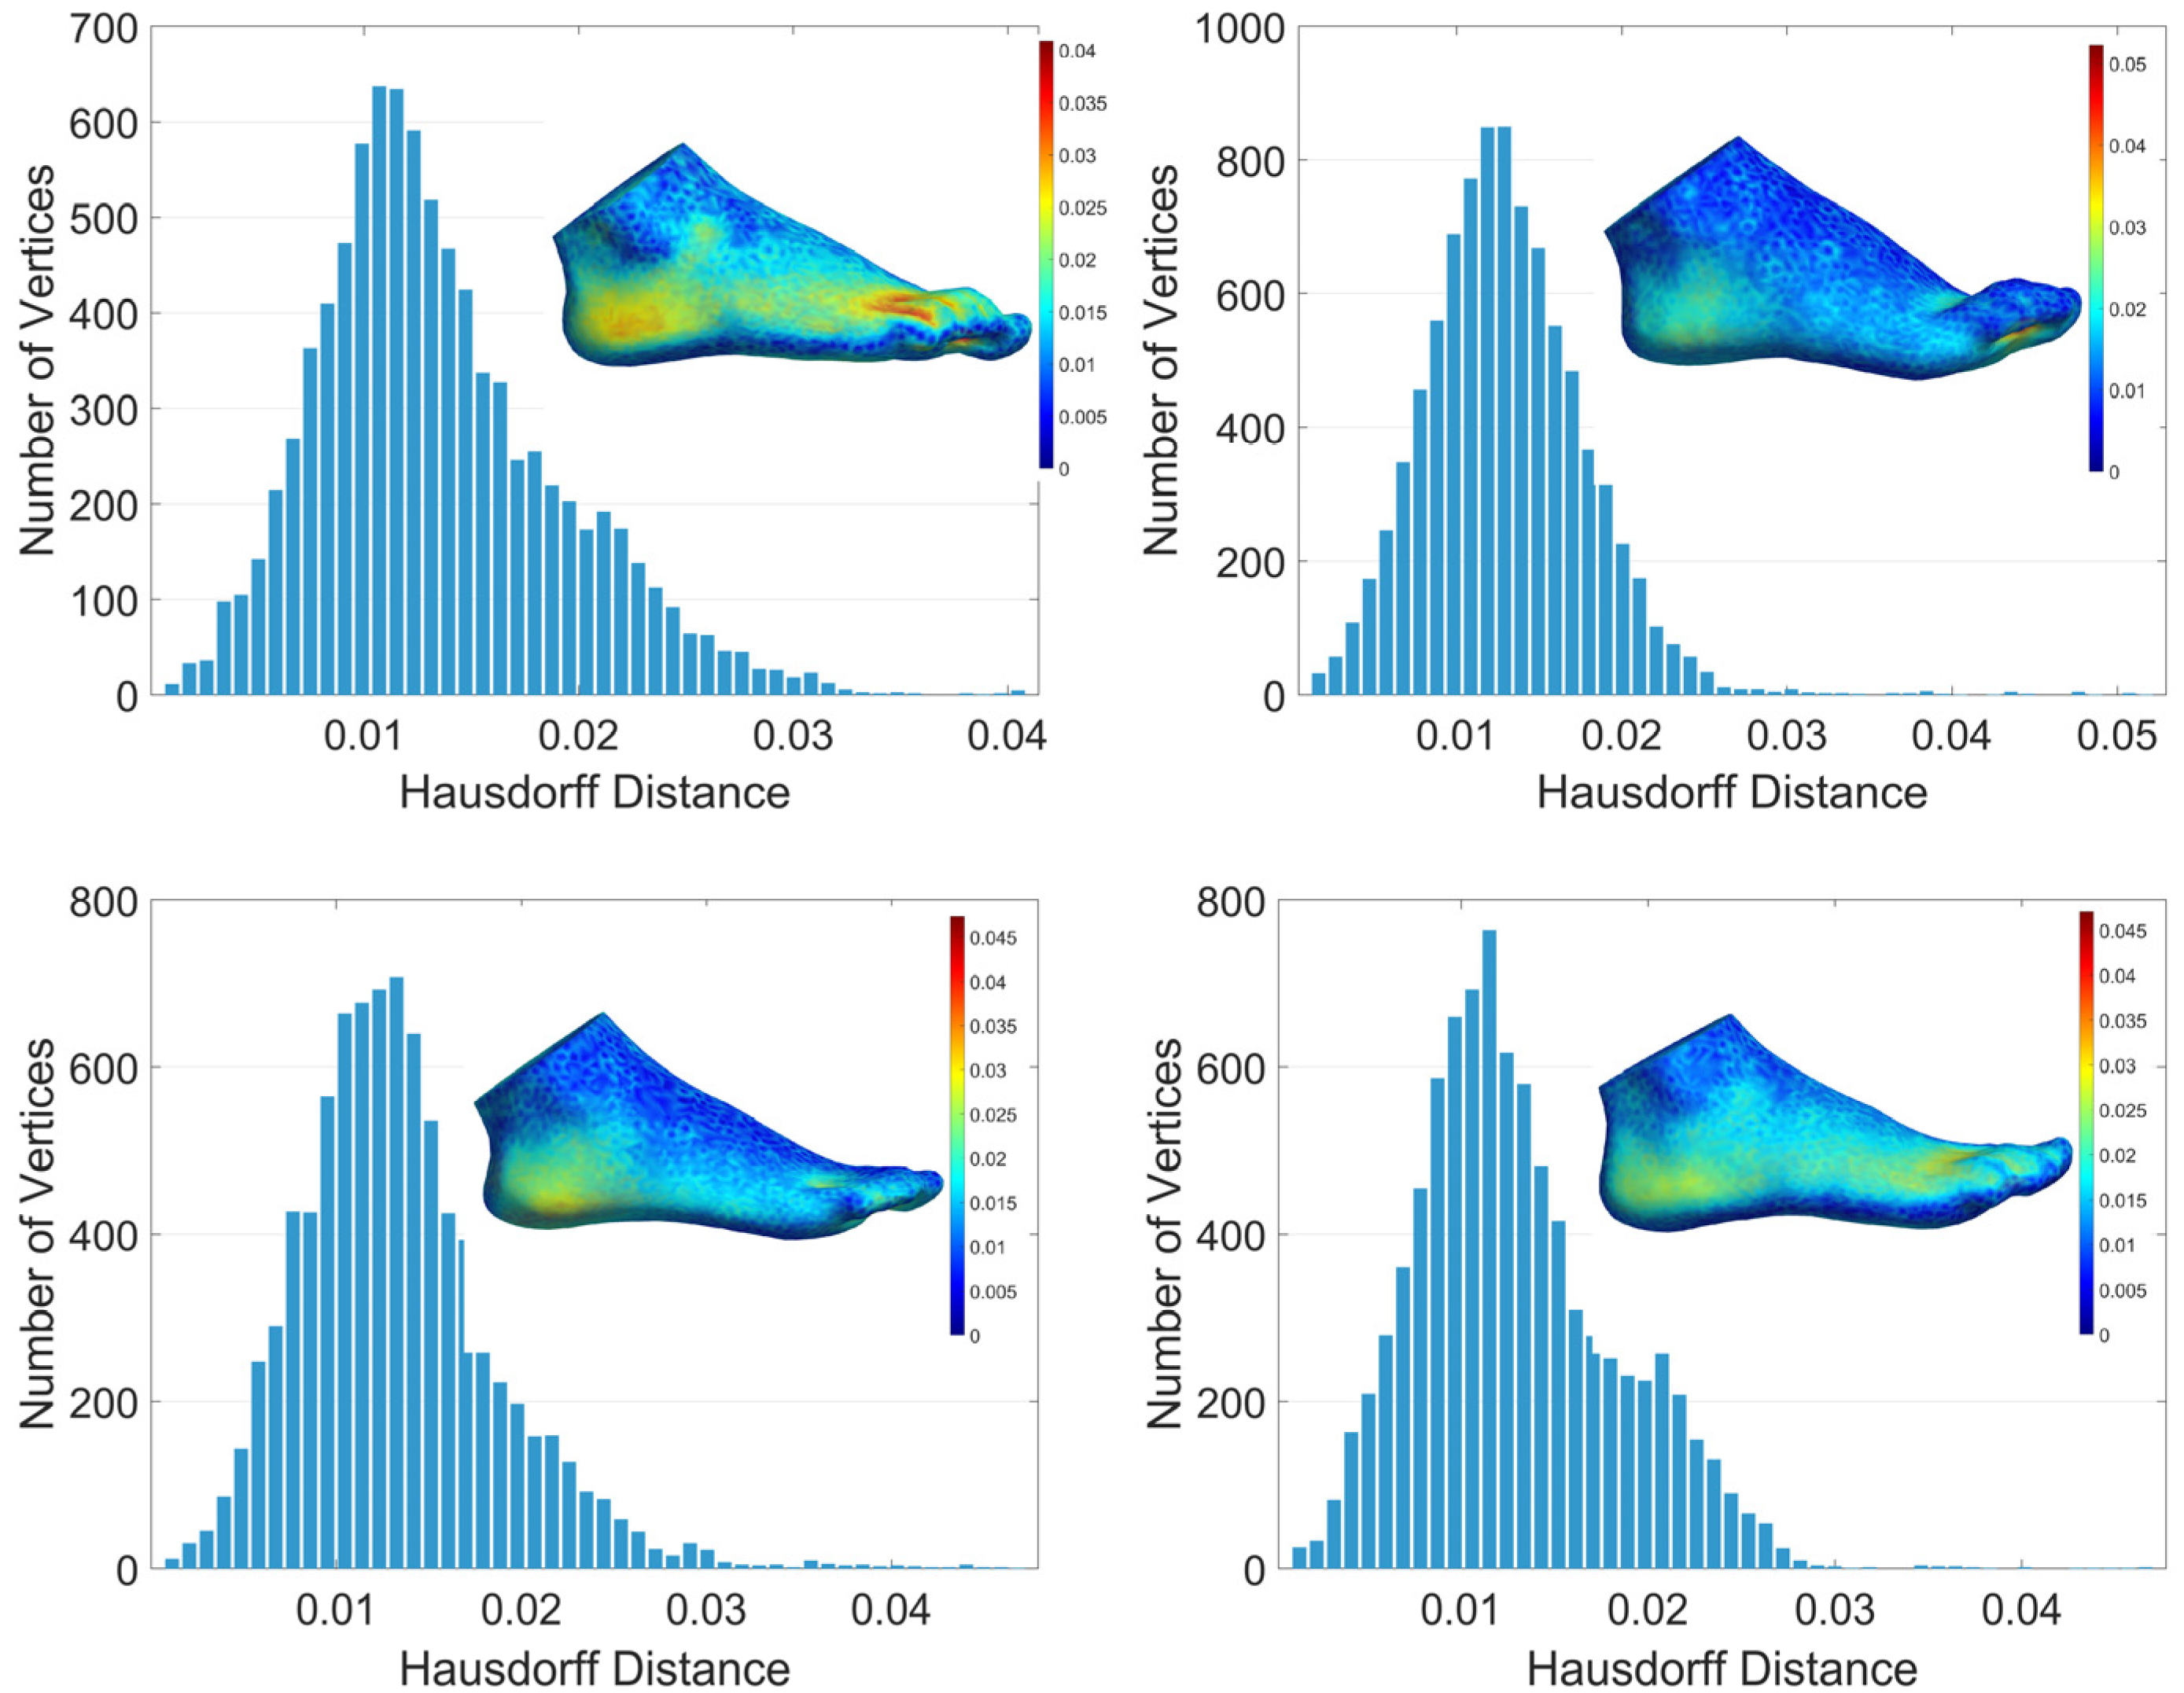
The error statistics and visualization of the foot model resampling results are presented in Figure 8 and Figure S7. Figure 8 displays the error heatmaps and statistical histograms of four groups of resampling results using 3D triangular foot template 2 as the base template. Figure S7a shows the error heatmaps and statistical histograms of four groups of resampling results based on 3D triangular foot template 4. Figure S7b presents the error heatmaps and statistical histograms of four groups of resampling results with 3D triangular foot template 7 as the reference.
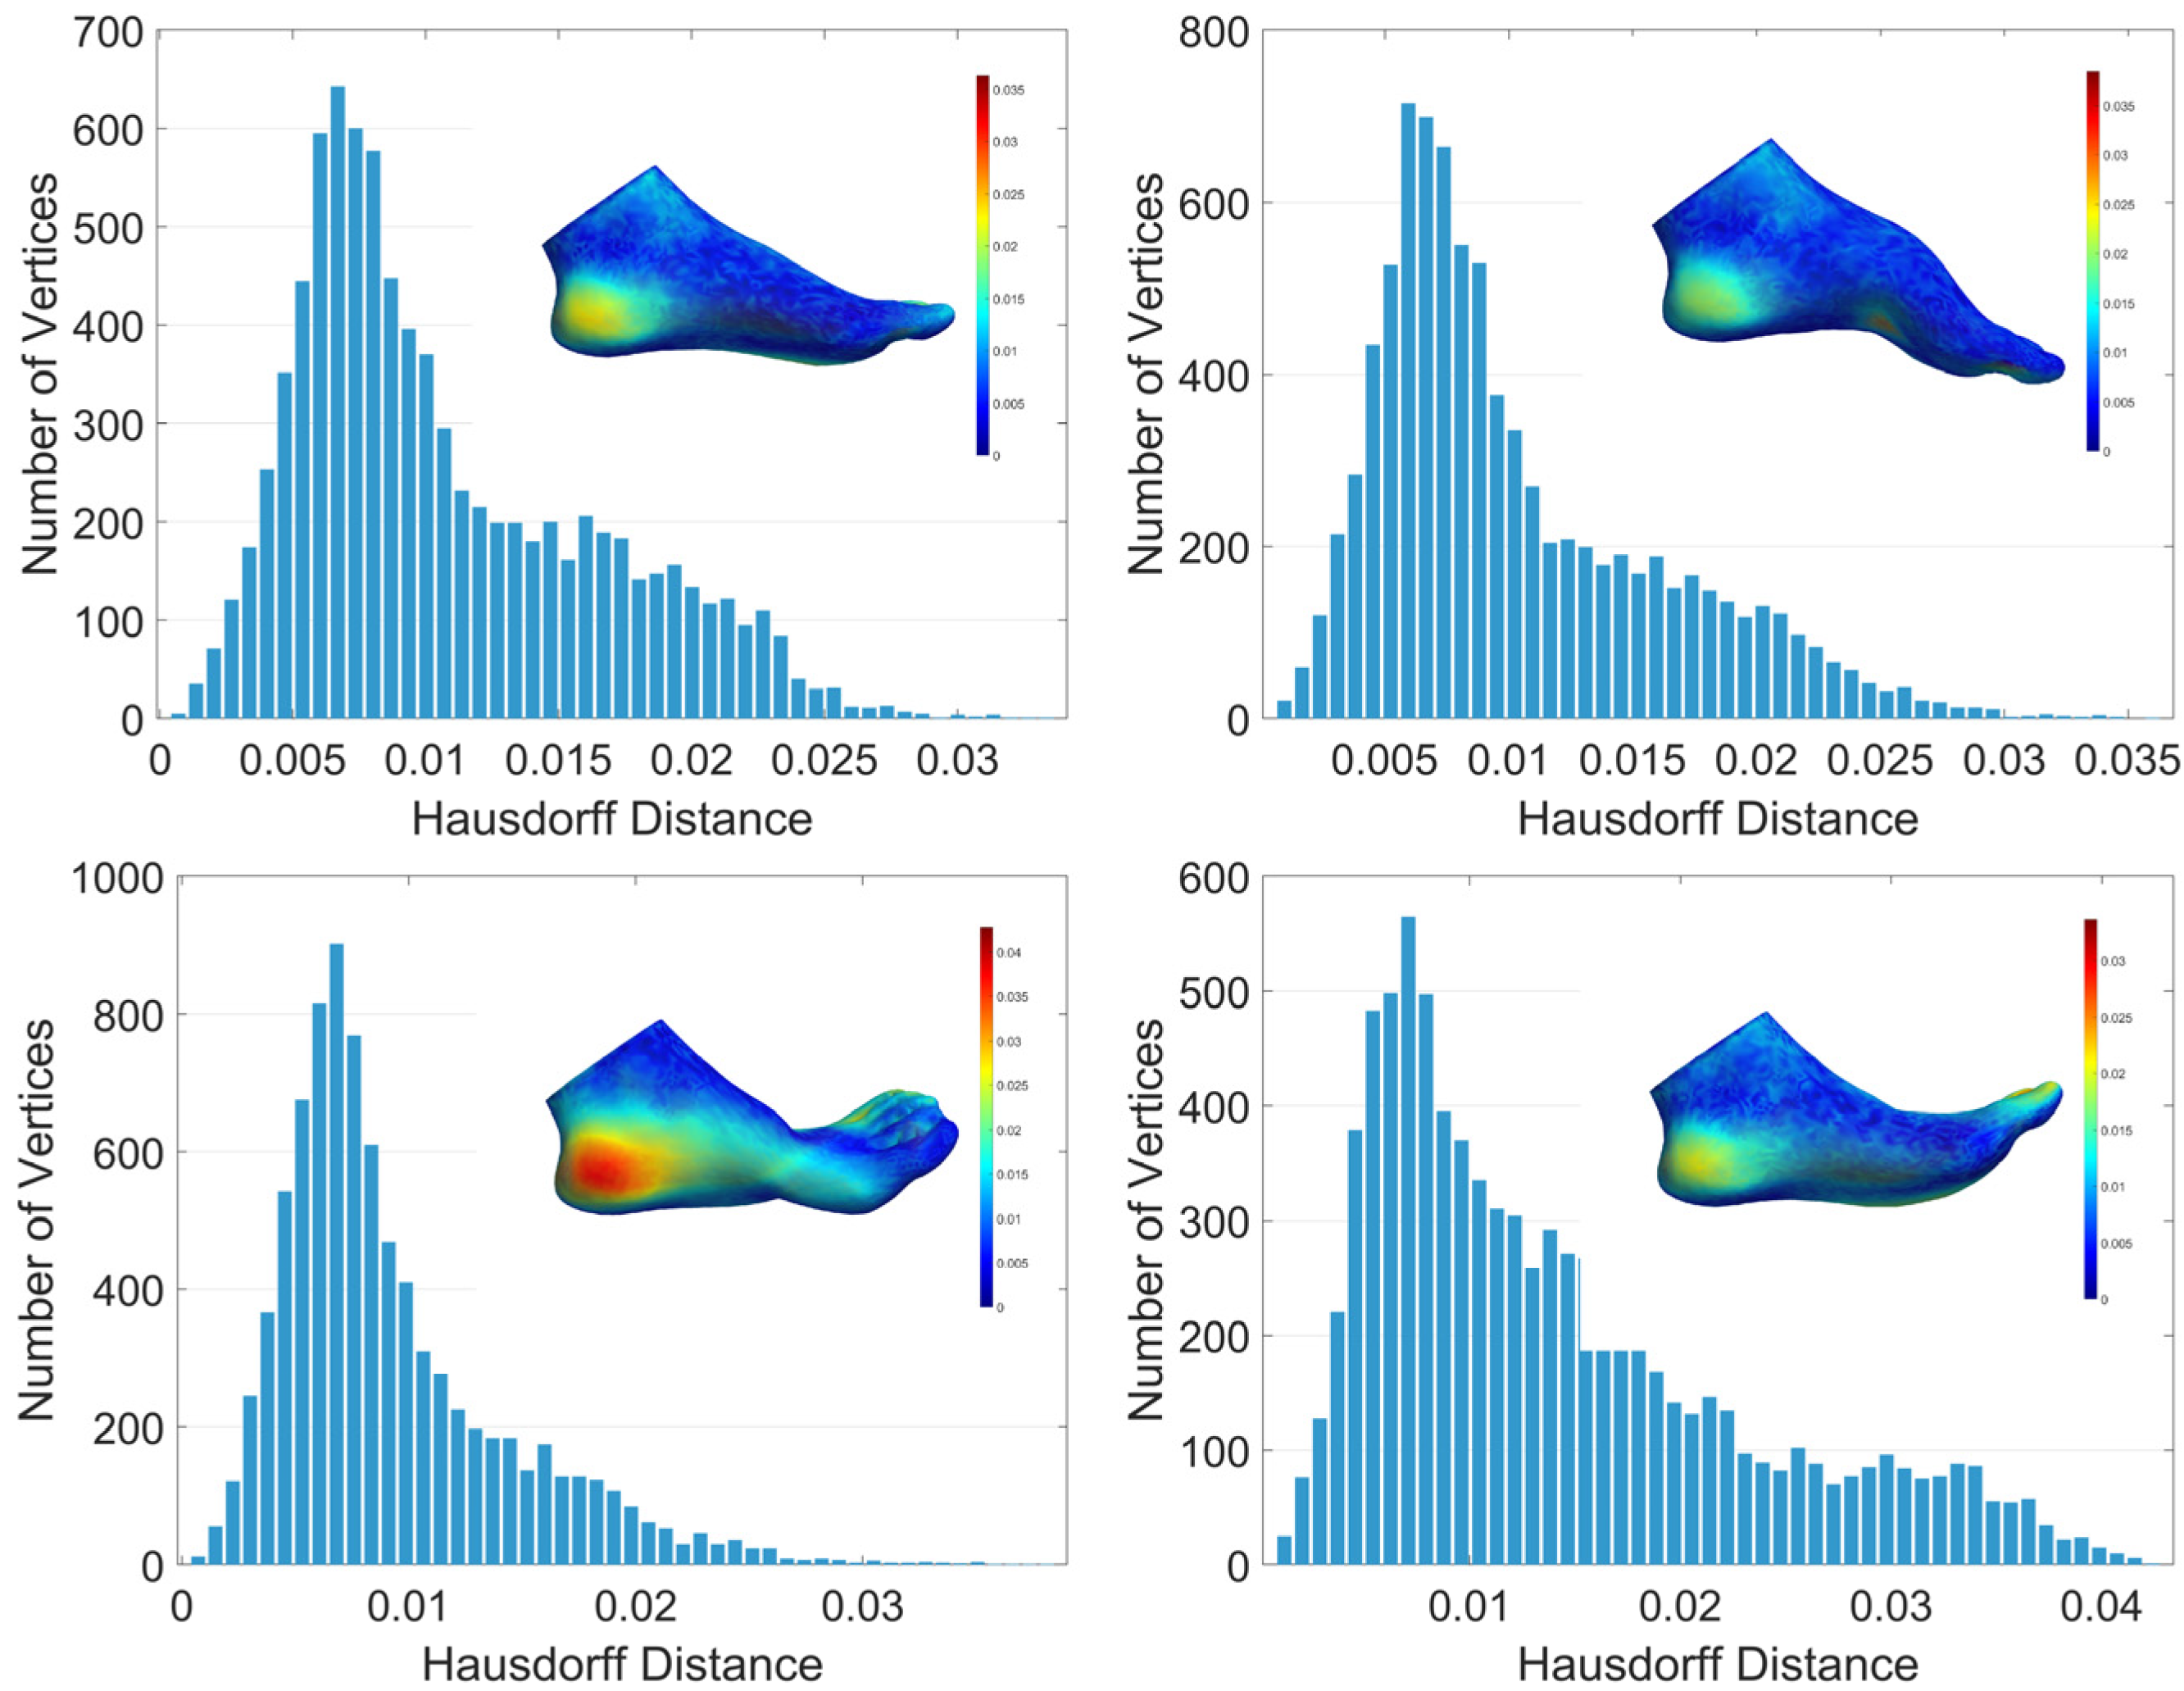
As observed in Figure 8, the maximum Hausdorff distance of all four groups of resampled triangular foot models is below 0.04. The statistical histogram of distances for each group approximates a normal distribution. The regions with the largest errors are located at the joints between the toes and the forefoot. This is mainly because the key mechanism of the resampling method proposed in this study relies on the full peripheral encapsulation of the 3D triangular foot template. When there are gaps or height discrepancies between the toes in the 3D triangular foot template, errors will be introduced in the resampled regions. However, considering that the joints between the toes and the forefoot are not critical areas in the manufacturing of shoe lasts and insoles, the impact of errors in these regions is negligible.
As shown in Figure S7a, when the number of vertices is increased to 8085, the resampling errors also approximate a normal distribution, and the distribution width of the data in the statistical histogram narrows. This result indicates that increasing the number of vertices is conducive to reducing resampling errors. This phenomenon can also be observed in Figure S7b, where the width of the statistical histogram is narrower than those in Figure 8 and Figure S7a. Meanwhile, a comparison of the three sets of results reveals that a small number of vertices in the 3D triangular foot template (e.g., Template 2) will lead to discrete errors in the resampling results. For instance, all four groups of resampling results in Figure 8 exhibit spot-like errors. This phenomenon disappears when the number of vertices in the three types of foot templates is increased to a certain threshold.
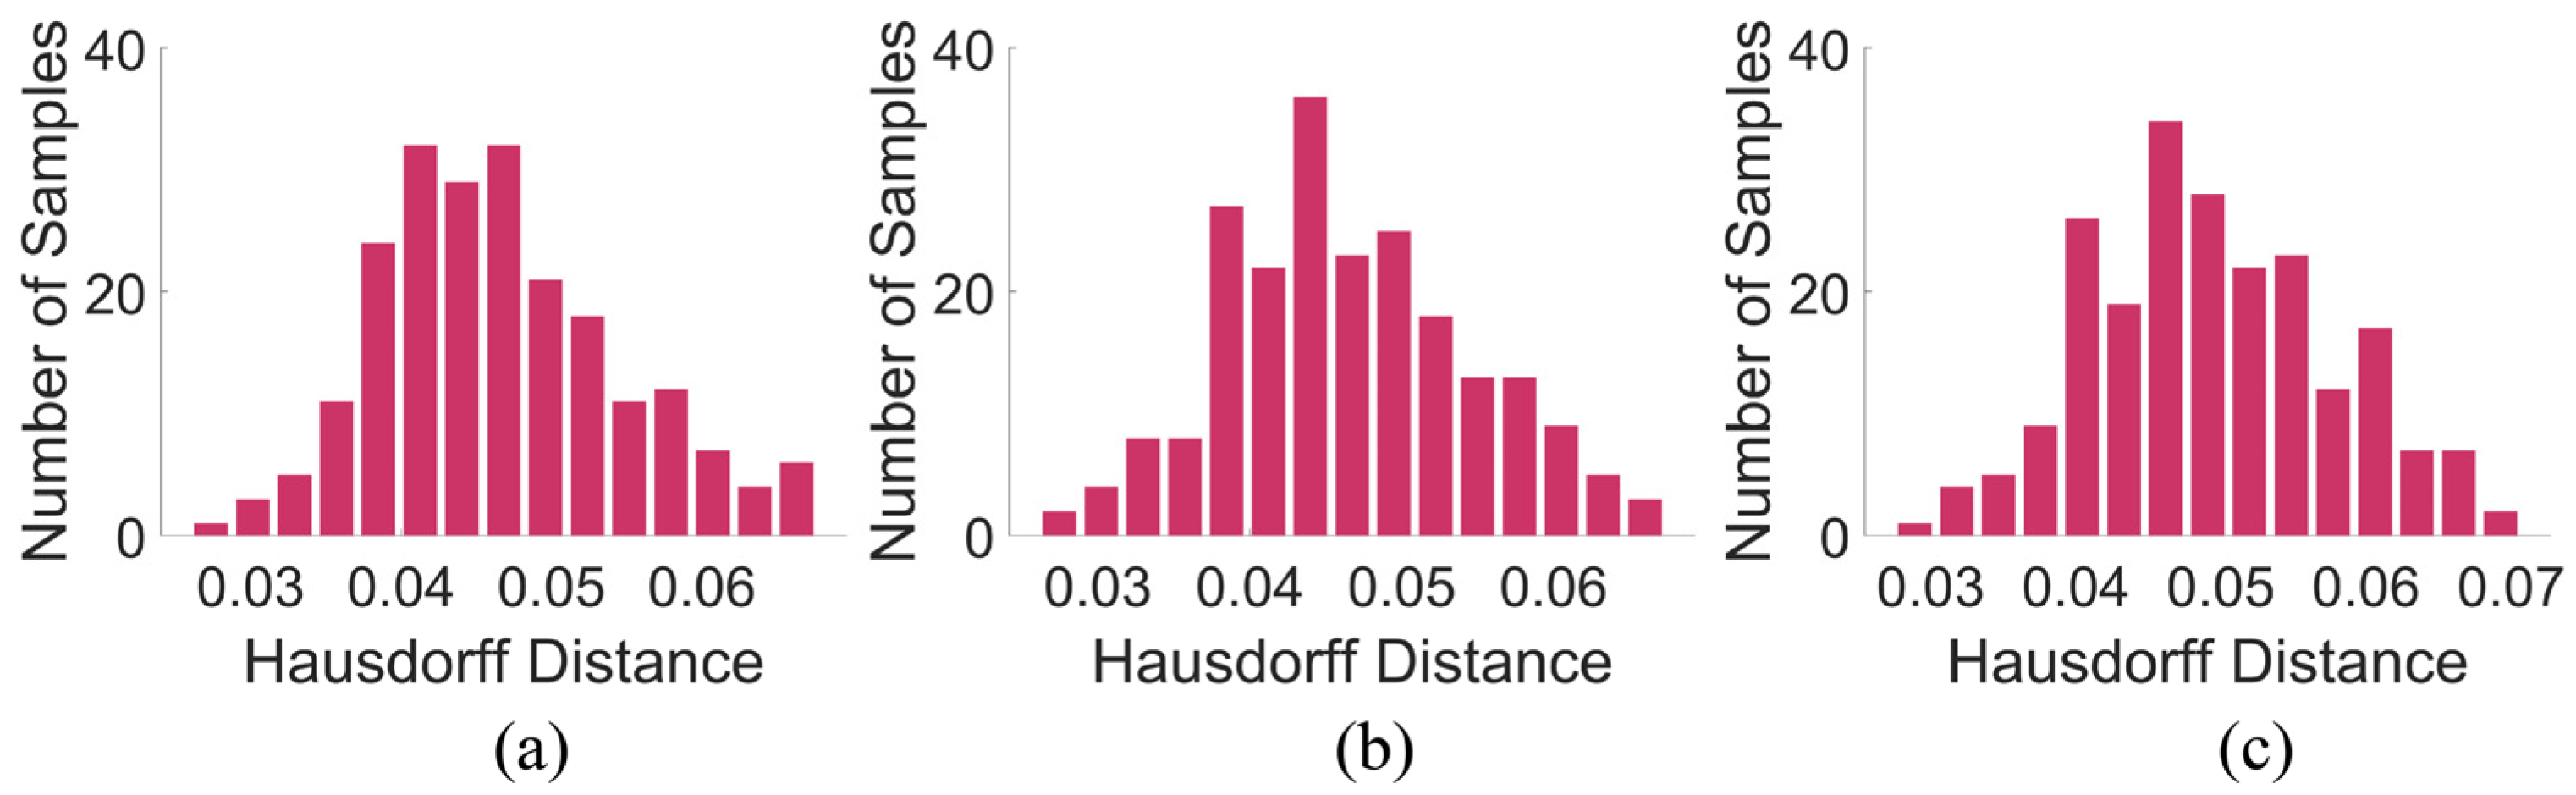
Error analysis was performed on the resampling results of 216 groups of 3D triangular foot models in this study, with the results presented in Figure 9 and Table 3. The results indicate that the error statistics of the 216 groups of 3D triangular foot models resampled using the three foot templates all exhibited a normal distribution. The average Hausdorff distance of the 216 groups of 3D triangular foot models resampled with Template 2 was 0.0466. The average value of all Hausdorff distances after resampling with Template 4 was 0.0464. The average value of all Hausdorff distances after resampling with Template 7 was 0.0494.

3.5. Relationship Between Vertex Count and Computational Time

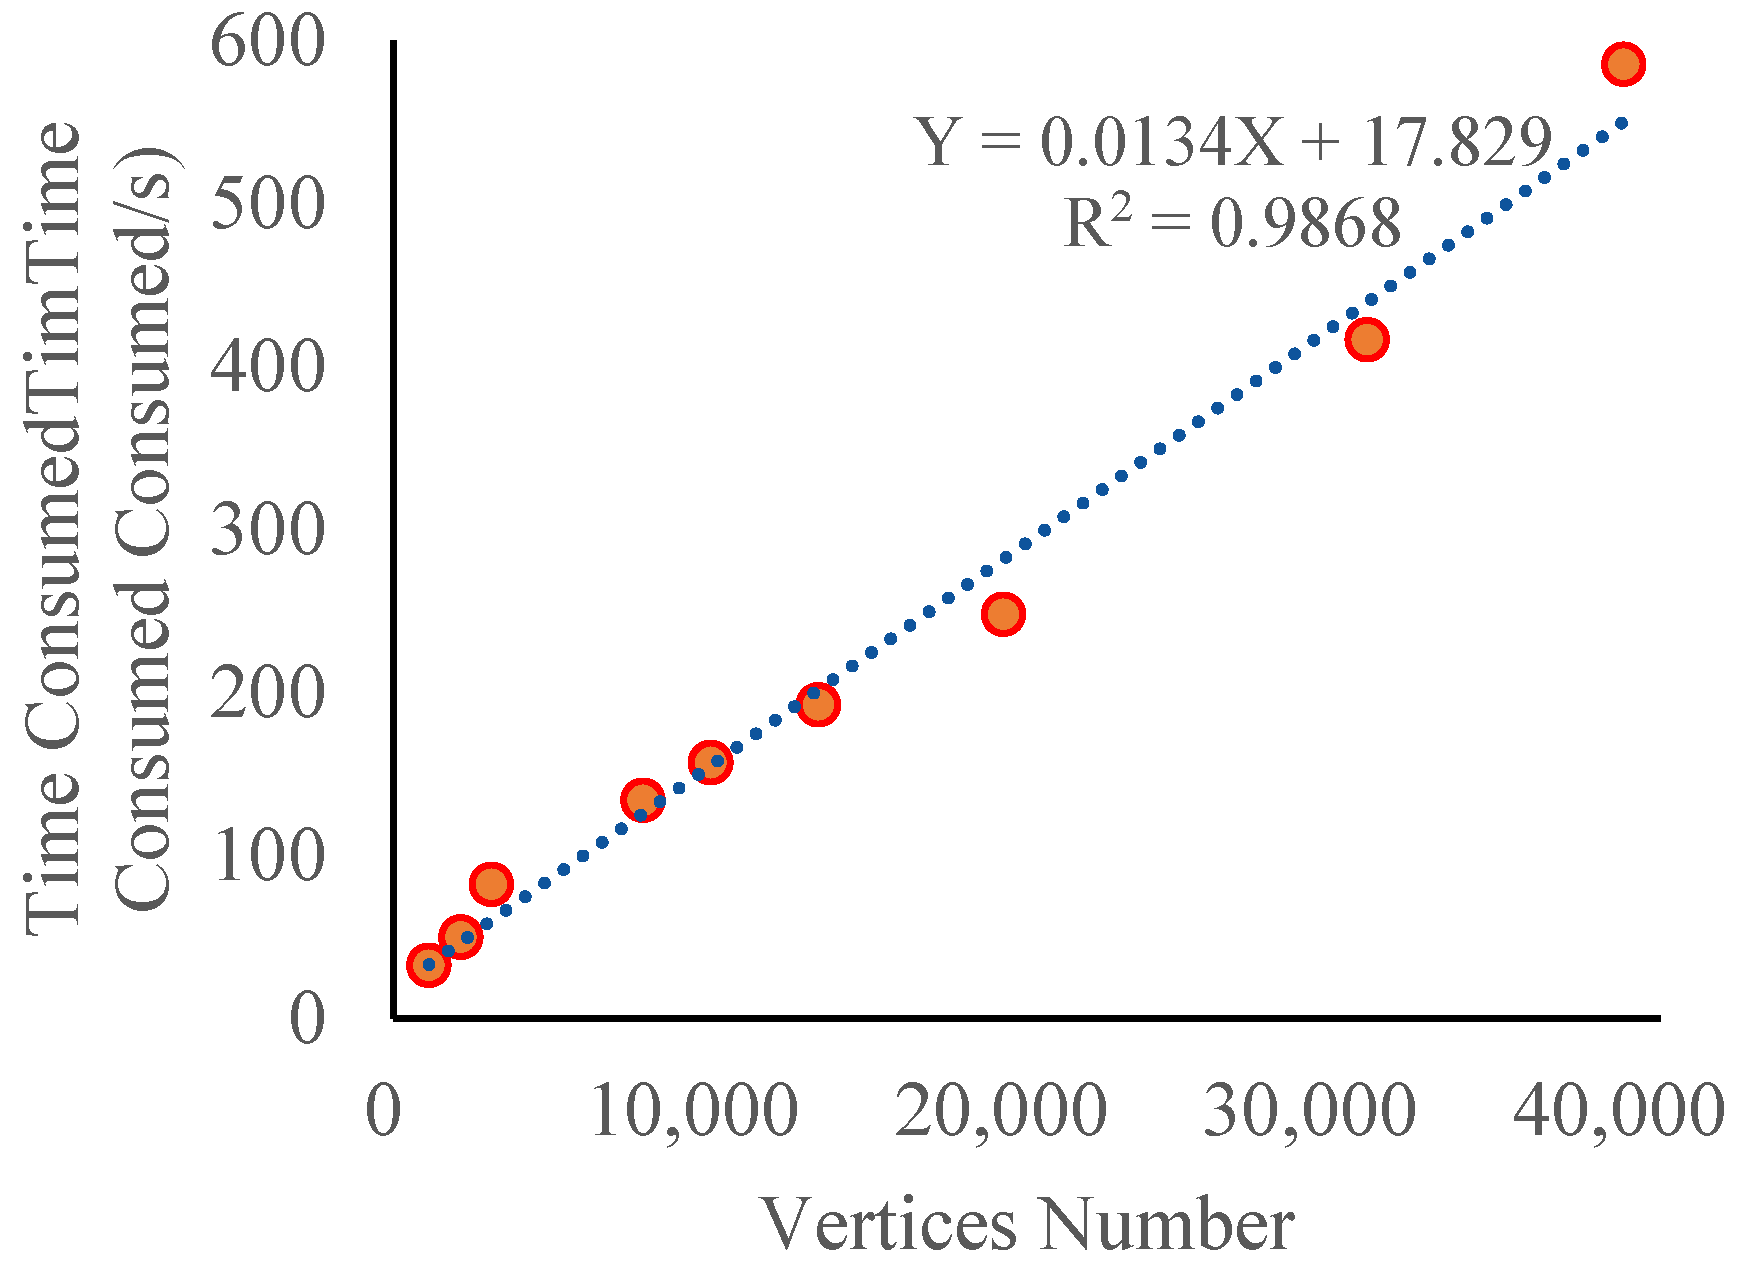
The relationship between the vertex count of the 3D triangular foot template and the resampling computational time is illustrated in Figure 10. When the vertex count of the 3D triangular foot template increased progressively from 1105 to 38,384, the corresponding computational time rose from 32.19 s to 783.04 s, indicating a significant and strong positive correlation between the two variables. Based on the computational platform adopted in this study, the fitting equation for the dependent variable Y (computational time, in seconds) and the independent variable X (vertex count) was determined as Y = 0.0134X + 17.829, with the coefficient of determination R 2 of the fitting model reaching 0.9868. This result confirms that a higher vertex count of the cloth model leads to a longer computational time for the rigid-body–cloth collision simulation, and this correlation exhibits extremely high stability. This phenomenon is mainly attributed to the fact that the cloth simulation and rigid-body simulation adopted in this study both involve collision detection. An increase in the vertex count will significantly increase the computational load of collision detection and cloth deformation calculation, while also imposing a greater demand on the computer memory resources. Therefore, the vertex count of the 3D triangular foot template should be reasonably controlled according to practical application requirements.
Based on a comprehensive analysis of the data presented in Table 1 and Figure 10, we observe that foot templates 1 and 2 in Table 1 have relatively few vertices. Using these two templates to resample foot samples would result in the loss of fine details of the foot models. Although foot templates 7, 8, and 9 in Table 1 have a larger number of vertices, Figure 10 shows that resampling foot samples with these three templates requires significantly longer computation time. Accordingly, we recommend foot templates 3, 4, 5, and 6 in Table 1 as the reasonable resolutions. Within this range, a good balance can be achieved between the detail preservation of 3D foot models and the processing efficiency.

3.6. Robustness of the Resampling Method

To verify the robustness of the resampling method proposed in this study, statistical analysis and visualization were performed on the resampling results of a single 3D triangular foot model under deformed conditions. The results are illustrated in Figure 11.
When a single 3D triangular foot model (top-left corner of Figure 11) underwent three different types of deformation, the range of its resampling errors was approximately consistent with that under the undeformed condition, with all errors being within 0.04. The resampling errors of the three groups of deformed foot models also exhibited normal distributions with similar mean values.

4. Conclusions

In this study, the pre-prepared 3D triangular foot template was wrapped around the target 3D triangular foot model to be resampled. The resampling of the target foot model was realized through the cloth simulation of the 3D triangular foot template, combined with the rigid body simulation and continuous size variation in the target foot model. The main conclusions are drawn as follows:
(1)
The resampled triangular foot models obtained by this method have the same vertex count and triangular topological structure as the original 3D triangular foot template.
(2)
The virtual mechanical parameters used in the cloth modifier can affect the resampling results. Under the experimental conditions of this study, the resampling results were relatively optimal when the tensile strength and bending stiffness were set to 1 and 110, respectively.
(3)
When resampling 216 3D triangular foot models using templates with different vertex counts, the average Hausdorff distance was 0.0466 for the template with 2184 vertices, 0.0464 for the template with 8085 vertices, and 0.0494 for the template with 19,752 vertices. The maximum errors were mainly distributed in the transition regions between the toes and the dorsum of the foot.
(4)
This method is applicable to 3D triangular foot templates with different vertex densities. Moreover, the time required for resampling exhibits an approximately linear relationship with the vertex count (and triangle count) of the 3D triangular foot template, with the correlation coefficient of the fitting equation reaching 0.997.
This study provides a resampling method suitable for 3D triangular foot models, which can serve as a reference for the feature extraction and automatic segmentation of 3D triangular foot models.

Supplementary Materials

The following supporting information can be downloaded at: https://www.mdpi.com/article/10.3390/app16052298/s1, Table S1. Settings of tensile strength and bending stiffness for the cloth modifier; Figure S1. Four of the five arbitrary groups of foot samples serve as the fabric templates (a—The foot template corresponding to Figure 6 in the main text, b—additional sample 1, c—additional sample 2, d—additional sample 3, e—additional sample 4); Figure S2. Effects of tensile strength and bending stiffness on resampling error (foot template shown in Figure S1b); Figure S3. Effects of tensile strength and bending stiffness on resampling error (foot template shown in Figure S1c); Figure S4. Effects of tensile strength and bending stiffness on resampling error (foot template shown in Figure S1d); Figure S5. Effects of tensile strength and bending stiffness on resampling error (foot template shown in Figure S1e); Figure S6. Topological consistency of resampled triangular foot models. (a) resampled feet with foot template 4; (b) resampled feet with foot template 7; Figure S7. Error statistics and visualization of resampling results. (a) 3D triangular foot template 4; (b) 3D triangular foot template 7.

Author Contributions

Conceptualization, Z.Y. and B.G.; methodology, W.Z.; software, Z.Y.; validation, J.L. and B.G.; formal analysis, Y.H.; investigation, Y.H.; resources, B.G.; data curation, Z.Y.; writing—original draft preparation, Z.Y.; visualization, W.Z.; supervision, B.G.; project administration, B.G.; funding acquisition, Z.Y. All authors have read and agreed to the published version of the manuscript.

Funding

This work was supported by the Key Laboratory of Silk Culture Heritage and Products Design Digital Technology, Ministry of Culture and Tourism, China. Zhejiang Sci-Tech University Scientific Research Fund Project under Grant No. 23072223-Y.

Institutional Review Board Statement

The study was conducted in accordance with the Declaration of Helsinki (1975, revised in 2013), and approved by the Shanghai Ethics Committee for Clinical Research (protocol code SECCR2023-63-01, approved on 28 June 2023).

Informed Consent Statement

Written informed consent was obtained from all participants prior to data collection. All personal identifying information was fully anonymized. The 3D foot model data were used only for academic research purposes, with no disclosure to third parties or commercial use. Data were stored on an encrypted server with restricted access to ensure participant privacy and data security. The study involved no invasive procedures or potential physical or psychological risks to the participants.

Data Availability Statement

The original contributions presented in this study are included in the article and Supporting Information. Further inquiries can be directed to the corresponding author.

Acknowledgments

The authors would like to acknowledge Xiaona Yu for her valuable contribution to the article through reviewing and editing the content.

Conflicts of Interest

Author Yimeng Huo was employed by the company Hangzhou Daddylab Technology Co., Ltd. The remaining authors declare that the research was conducted in the absence of any commercial or financial relationships that could be construed as a potential conflict of interest.

Abbreviations

The following abbreviations are used in this manuscript:
3DThree Dimensional
SfMStructure from Motion
PMVSPatch-based Multi-view Stereo
CVTCentroidal Voronoi Tessellation
MPSMaximum Poisson Disk Sampling
CCDcharge-coupled device

References

  1. Niu, L.; Xiong, G.; Shang, X. 3D Foot reconstruction based on mobile phone photographing. Appl. Sci. 2021, 11, 4040. [Google Scholar] [CrossRef]
  2. Saghazadeh, M.; Kitano, N.; Okura, T. Gender differences of foot characteristics in older Japanese adults using a 3D foot scanner. J. Foot Ankle Res. 2015, 8, 29. [Google Scholar] [CrossRef] [PubMed]
  3. Farhan, M.; Wang, J.Z.; Bray, P. Comparison of 3D scanning versus traditional methods of capturing foot and ankle morphology for the fabrication of orthoses: A systematic review. J. Foot Ankle Res. 2021, 14, 2. [Google Scholar] [CrossRef]
  4. Zhang, H.; Chen, Z.; Guo, S.; Lin, J.; Shi, Y.; Liu, X. Sensock: 3D foot reconstruction with flexible sensors. In Proceedings of the 2020 CHI Conference on Human Factors in Computing Systems (CHI ′20), Honolulu, HI, USA, 25–30 April 2020; Association for Computing Machinery: New York, NY, USA, 2020; pp. 1–13. [Google Scholar]
  5. Telfer, S.; Woodburn, J. The use of 3D surface scanning for the measurement and assessment of the human foot. J. Foot Ankle Res. 2010, 3, 19. [Google Scholar] [CrossRef] [PubMed]
  6. Yamashita, T.; Yamashita, K.; Sato, M. Foot-surface-structure analysis using a smartphone-based 3D foot scanner. Med. Eng. Phys. 2021, 95, 90–96. [Google Scholar] [CrossRef]
  7. Wang, M.; Wang, X.A.; Fan, Z. A 3D foot shape feature parameter measurement algorithm based on Kinect2. EURASIP J. Image Video Process. 2018, 1, 119. [Google Scholar] [CrossRef]
  8. Novak, B.; Možina, J.; Jezeršek, M. 3D laser measurements of bare and shod feet during walking. Gait Posture 2014, 40, 87–93. [Google Scholar] [CrossRef]
  9. Jezersek, M.; Mozina, J. High-speed measurement of foot shape based on multiple-laser-plane triangulation. Opt. Eng. 2009, 48, 933–956. [Google Scholar] [CrossRef]
  10. Lee, H.; Lee, K.; Choi, T. Development of a low cost foot-scanner for a custom shoe tailoring system. Symp. Footwear Biomech. 2005, 1, 1–2. [Google Scholar]
  11. Gao, F.; Wang, Q.; Geng, W.; Pan, Y. Acquisition of time-varying 3D foot shape from video. Sci. China Press 2011, 41, 659–674. [Google Scholar] [CrossRef]
  12. Kok, F.; Charles, J.; Cipolla, R. FootNet: An efficient convolutional network for multiview 3D foot reconstruction. In Proceedings of the Asian Conference on Computer Vision (ACCV 2020), Kyoto, Japan, 30 November–4 December 2020; Springer: Cham, Switzerland, 2020. [Google Scholar]
  13. Kimura, M.; Mochimaru, M.; Kanade, T. Measurement of 3D foot shape deformation in motion. In Proceedings of the 5th ACM/IEEE International Workshop on Projector Camera Systems, Marina del Rey, CA, USA, 10 August 2008; Association for Computing Machinery: New York, NY, USA, 2008. [Google Scholar]
  14. Hassan, N.M.; Buldt, A.K.; Shields, N.; Landorf, K.B.; Menz, H.B.; Munteanu, S.E. Reproducibility of foot dimensions measured from 3-dimensional foot scans in children and adolescents with down syndrome. J. Foot Ankle Res. 2020, 13, 31. [Google Scholar] [CrossRef]
  15. Rogati, G.; Leardini, A.; Ortolani, M. Semi-automatic measurements of foot morphological parameters from 3D plantar foot scans. J. Foot Ankle Res. 2021, 14, 18. [Google Scholar] [CrossRef]
  16. Mueller, J.; Richter, M.; Schaefer, K. How to measure children’s feet: 3D foot scanning compared with established 2D manual or digital methods. J. Foot Ankle Res. 2023, 16, 21. [Google Scholar] [CrossRef] [PubMed]
  17. Lee, Y.C.; Lin, G.; Wang, M.J.J. Comparing 3D foot scanning with conventional measurement methods. J. Foot Ankle Res. 2014, 7, 44. [Google Scholar] [CrossRef] [PubMed]
  18. Li, P.L.; Xiao, Q.F.; Yick, K.L. A novel deep learning approach to classify 3D foot types of diabetic patients. Sci. Rep. 2025, 15, 13819. [Google Scholar] [CrossRef] [PubMed]
  19. Alcacer, A.; Epifanio, I.; Ibañez, M.V.A. Data-driven classification of 3D foot types by archetypal shapes based on landmarks. PLoS ONE 2020, 15, e0228016. [Google Scholar] [CrossRef]
  20. Yan, D.M.; Wonka, P. Non-obtuse remeshing with centroidal voronoi tessellation. IEEE Trans. Vis. Comput. Graph. 2016, 22, 2136–2144. [Google Scholar] [CrossRef]
  21. Wang, L.; Hétroy-Wheeler, F.; Boyer, E.A. hierarchical approach for regular centroidal voronoi tessellations. Comput. Graph. Forum 2016, 35, 152–165. [Google Scholar] [CrossRef]
  22. Lv, C.; Lin, W.; Zheng, J. Adaptively isotropic remeshing based on curvature smoothed field. IEEE Trans. Vis. Comput. Graph. 2024, 30, 3196–3209. [Google Scholar] [CrossRef]
  23. Charawi, W.C.; Gruson, A.; Wu, J.; Desrosiers, C.; Thomas, D. DCCVT: Differentiable clipped centroidal voronoi tessellation. arXiv 2026, arXiv:2601.13603. [Google Scholar] [CrossRef]
  24. Ebeida, M.S.; Mitchell, S.A.; Patney, A. A simple algorithm for maximal poisson-disk sampling in high dimensions. Comput. Graph. Forum 2012, 31, 785–794. [Google Scholar] [CrossRef]
  25. Mitchell, S.A.; Rand, A.; Ebeida, M.S. Variable radii poisson-disk sampling (extended version). In Proceedings of the Canadian Conference on Computational Geometry (CCCG), Charlottetown, PE, Canada, 8–10 August 2012. [Google Scholar]
Figure 1. The technical roadmap of resampling 3D triangular foot model.
Applsci 16 02298 g001
Figure 2. Normalization of 3D triangular foot models.
Applsci 16 02298 g002
Figure 3. 3D triangular foot templates with different vertex and triangle counts.
Applsci 16 02298 g003
Figure 4. The initial arrangement of imported foot template and 3D foot sample.
Applsci 16 02298 g004
Figure 5. Deformation process of the 3D triangular foot template during resampling.
Applsci 16 02298 g005
Figure 6. Effects of tensile strength and bending stiffness on resampling error.
Applsci 16 02298 g006
Figure 7. Topological consistency of resampled triangular foot models with template 2.
Applsci 16 02298 g007
Figure 8. Error statistics and visualization of resampling results with template 2.
Applsci 16 02298 g008
Figure 9. Statistical histograms of resampling result errors for different templates. (a) 3D triangular foot template 2; (b) 3D triangular foot template 4; (c) 3D triangular foot template 7.
Applsci 16 02298 g009
Figure 10. Relationship between vertex count of 3D triangular foot template and resampling computational time.
Applsci 16 02298 g010
Figure 11. Robustness of the resampling method.
Applsci 16 02298 g011
Table 1. 3D triangular foot templates.
No. Foot Template12345
Vertices Number115021843180808510,277
Triangles Number22964364635616,16620,550
No. Template6789
Vertices Number13,76919,75231,52839,834
Triangles Number27,53439,50063,05279,664
Table 2. Detailed parameters of the cloth modifier.
Quality StepVertex MassAir ViscocityBending Model
300.3 Kg1Angular
Shear StiffnessBending StiffnessTension DampingCompression Damping
5x55
Tension StiffnessCompression StiffnessCollision ThicknessInternal Springs
x150.015False
Shear DampingBending DampingIteration NumberPressure
50.5250False
where ‘x’ reference changeable parameter.
Table 3. Descriptive analysis of resampling result errors for different templates.
MeanMinimumMaximumStandardMedian
Template 20.04660.02600.06770.00810.0458
Template 40.04640.02610.06740.00820.0456
Template 70.04940.02750.07070.00840.0487
Disclaimer/Publisher’s Note: The statements, opinions and data contained in all publications are solely those of the individual author(s) and contributor(s) and not of MDPI and/or the editor(s). MDPI and/or the editor(s) disclaim responsibility for any injury to people or property resulting from any ideas, methods, instructions or products referred to in the content.