Article

The Influence of Inter-Individual Variability on the Acute Effects of Anodal Transcranial Direct Current Stimulation on Training Volume During Velocity-Based Back Squat Exercise


by
Tai-Chih Chen
1,
David Colomer-Poveda
2,
Eduardo Lattari
3,
Gonzalo Márquez
4 and
Salvador Romero-Arenas
5,*
1
Department of Sport Science and Athletic Training, National Taitung University, Taitung 950302, Taiwan
2
Center for Sport Studies, Rey Juan Carlos University, 28933 Madrid, Spain
3
Physical Activity Sciences Graduate Program, Salgado de Oliveira University (UNIVERSO), Niterói 24030-060, Brazil
4
Department of Physical Education and Sport, Faculty of Sport Sciences and Physical Education, University of A Coruña, 15071 A Coruña, Spain
5
Facultad de Deporte, UCAM—Universidad Católica de Murcia, 30107 Guadalupe, Murcia, Spain
*
Author to whom correspondence should be addressed.
Appl. Sci. 2026, 16(5), 2231; https://doi.org/10.3390/app16052231
Submission received: 12 January 2026 / Revised: 22 February 2026 / Accepted: 25 February 2026 / Published: 26 February 2026
(This article belongs to the Special Issue Sports, Exercise and Healthcare)

Featured Application

Anodal transcranial direct current stimulation may be used as an acute neuromodulatory strategy to increase total training volume during velocity-based resistance exercise in selected individuals. These findings are relevant for strength and conditioning professionals working with velocity loss thresholds, as they highlight the importance of inter-individual responsiveness when integrating neuromodulation into resistance training practice.

Abstract

This study investigated the acute effects of anodal transcranial direct current stimulation (a-tDCS) applied over the dorsolateral prefrontal cortex (DLPFC) and primary motor cortex (M1) on neuromuscular performance during a velocity-based back squat exercise. Fifteen recreationally trained men participated in a randomized, double-blind, crossover design, completing three experimental conditions (SHAM, DLPFC, and M1 stimulation) consisting of 20 min of 2 mA a-tDCS followed by a squat protocol performed to a 15% velocity loss threshold. Total repetitions, repetitions per set, mean concentric velocity, and rating of perceived exertion (RPE) were recorded. No significant differences between stimulation conditions were observed for any outcome variable. However, two individuals showed reversed responses, consistent with previously reported inter-individual variability in response to tDCS. Given the high inter-individual variability in response to a-tDCS, we additionally performed a post hoc sensitivity analysis based on response direction relative to SHAM. This analysis indicated that a-tDCS over M1 and DLPFC resulted in a significantly greater total number of repetitions compared with SHAM, whereas repetitions per set, mean velocity, and RPE were not different between conditions. Accordingly, a systematic and individualized approach may be needed to address inter-individual variability in response to tDCS to optimize its effect on fatigue tolerance.

1. Introduction

The ability to attenuate fatigue (e.g., power loss) is crucial for exercises requiring sustained maximal effort for a specific duration (e.g., ~15–60 s) [1]. Over time, repeated exposure to specific physical training is the main intervention to achieve a chronic reduction in exercise-induced fatigue. However, other techniques, such as anodal transcranial direct current stimulation (a-tDCS), can induce faster, acute reductions in exercise-induced fatigue through cortical modulation [2,3]. This non-invasive brain stimulation technique has shown various behavioural effects on gross motor performance [4], particularly concerning muscle strength and the ability to sustain maximal or submaximal effort over a specific duration [5,6,7,8]. For example, a-tDCS allowed individuals to perform more repetitions with a reduced rate of velocity loss (VL) and perceived exertion during high-intensity resistance training (e.g., explosive bench press) before reaching failure [2]. In addition to its potentially positive impact on fatigue tolerance, a-tDCS may also enhance maximum explosive performance, such as the height of countermovement jumps (CMJs) [9,10] and sprint times [3].
Despite the improvements in fatigue tolerance and power production associated with a-tDCS, these benefits may not occur simultaneously. For instance, when the dorsolateral prefrontal cortex (DLPFC) is stimulated, the reduction in VL induced by a-tDCS (i.e., increased fatigue tolerance) is not accompanied by improved maximal power but rather by a reduction in the rating of perceived exertion (RPE) [2]. In contrast, stimulation of the primary motor cortex (M1) has shown benefits in explosive actions such as jumping [9,10] or sprinting [3], coinciding with improvements in fatigue resistance (lower rate of sprinting speed loss), but not with perceptual alteration [3]. Therefore, the ergogenic effect of a-tDCS on physical performance may depend on the stimulated area.
The DLPFC modulates the motor cortex by integrating cognitive and peripheral information, playing an important role in the inhibition of subjective fatigue [2,11]. On the other hand, the M1 is the main area controlling voluntary human movement [12]. Thus, neuromodulation of these two areas with a-tDCS may decrease fatigue (e.g., less VL) through different mechanisms. The stimulation of DLPFC might modulate perceived effort during exercise, reducing performance decline. The stimulation of the M1 might enhance the magnitude and efficacy of the supraspinal drive, increasing motoneuron recruitment and/or the firing rate [13,14]. Alternatively increased M1 excitability might reduce the input needed to generate the output necessary to recruit the motoneurons for muscle contraction [8], leading to a more efficient motor command and prolonging the ability to maintain the required motor output. Accordingly, alterations in fatigue resistance after a-tDCS might coincide with perceptual or explosive changes during exercise, depending on the stimulated areas.
An ecological approach to test the specificity of the effects of the stimulated area on behavioural components of gross motor performance is velocity-based training (VBT). VBT uses the lifting velocity of each repetition during resistance training (RT) as a proxy for instantaneous neuromuscular performance [15]. By monitoring lifting velocity, the fatigue induced by the RT stimulus can be managed by setting a VL threshold. When this threshold is exceeded, the set is stopped, indirectly influencing the number of repetitions performed in each set and the total training volume [15]. This approach allows monitoring of the effects of a-tDCS on instantaneous maximum neuromuscular performance against a submaximal load (i.e., power production) in an unfatigued state (i.e., first repetitions of the first set), while also determining its effects on the individual’s ability to withstand fatigue.
Therefore, the main objective of this study was to test the specificity of the effects of a-tDCS depending on stimulation area (DLPFC and M1) during a single VBT session. Specifically, we evaluated the effects of a-tDCS over the DLPFC and M1 on the number of repetitions performed before reaching a 15% VL threshold, the perception of fatigue during the training session (i.e., fatigue tolerance), the maximum lifting velocity in the first set, and the mean velocity across all sets (i.e., maximal neuromuscular performance against submaximal loads). We hypothesized that a-tDCS targeting the DLPFC will reduce the perception of fatigue, allowing participants to perform a greater number of repetitions before reaching a certain level of VL [2,11]. Additionally, we expected that a-tDCS targeting the M1 would improve lifting velocity and explosive performance [9,10] but not alter the number of repetitions. These combined effects could potentially optimize training volume and improve VBT-specific adaptations.

2. Materials and Methods

2.1. Study Design

A crossover randomized controlled trial design was employed in this study. The primary independent variable was the electrode placement during a-tDCS M1, DLPFC, and sham, selected based on evidence that M1 stimulation modulates corticospinal excitability and influences neuromuscular performance, while DLPFC stimulation may affect cognitive aspects of motor control and fatigue [16]. The dependent variables (i.e., total repetitions, movement velocity, and RPE) were selected for their ability to sensitively detect changes in strength and power output and for their practical relevance in resistance training settings [17,18].
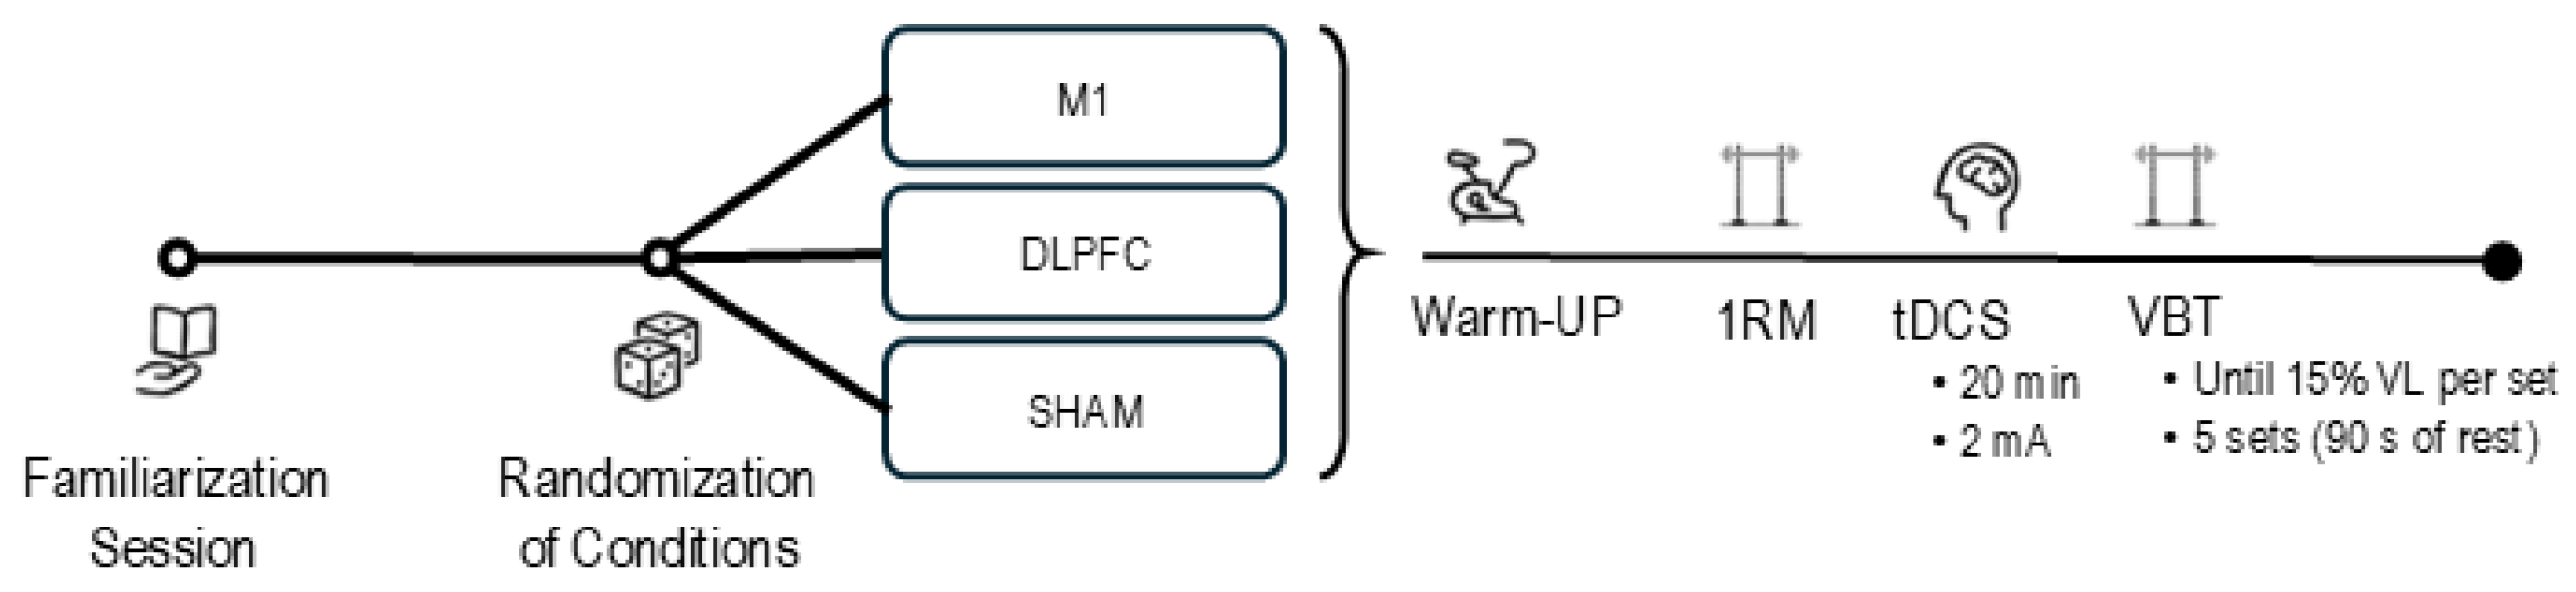
Participants attended the laboratory four times, separated by one week. To minimize variability in performance, the first visit served as a familiarization session during which participants were introduced to the a-tDCS equipment, the VBT protocol, and the Smith machine used in subsequent sessions. Foot positioning for each participant’s squat was recorded in this session and replicated in all experimental trials to avoid technical variability. During the three remaining sessions, all participants completed each of the a-tDCS conditions in a randomized order (using https://www.randomizer.org; accessed on 10 March 2024) to ensure balanced exposure across treatments. The study employed a double-blinded design: neither participants nor data-collecting researchers knew which stimulation condition was administered in each session, except for the researcher applying the intervention. As shown in Figure 1 and detailed in the next subsection, each session began with a standardized warm-up followed by an estimated 1RM test for the squat exercise on a Smith machine (Technogym, Cesena, Italy). Immediately after the 1RM assessment, the a-tDCS intervention was applied. Following stimulation, the VBT protocol was performed, during which total repetitions, peak and mean concentric lifting velocity, and RPE (OMNI-RES scale) were recorded.
To ensure consistency, all experimental sessions were conducted in the same laboratory environment under controlled temperature (19–22 °C) and humidity (50–60%) conditions. Sessions were scheduled in the morning at the same time for each participant to control circadian influences on performance. Participants were instructed to avoid strenuous exercise 48 h prior and to abstain from caffeine and alcohol intake 24 h before each session.

2.2. Participants

The sample size was calculated using G*Power (v3.1.9.7, University of Kiel, Kiel, Germany) with power (1-β) = 0.80, α = 0.05, and effect size = 0.35 [19], indicating 15 participants. Due to variability in tDCS-induced alterations of motor cortical excitability between sexes [20], only males were recruited. Fifteen young males (age: 21.8 ± 2.6 years; body mass: 77.1 ± 8.5 kg; height: 177.9 ± 6.6 cm; 1RM/body mass for squats: 1.2 ± 0.2) with 3.0 ± 1.7 years of recreational resistance training experience (questionnaire and structured interview) volunteered to participate. Weekly resistance training volume was estimated from self-reported training frequency (sessions·week−1) and typical working sets per session, yielding ~12.0 ± 1.9 total lower-body working sets·week−1.
Exclusion criteria were applied for tDCS safety [21] and included: (a) current smokers; (b) inability to perform squat and jump techniques correctly; (c) any metal implant or cardiac pacemaker; (d) history of stroke; and (e) history of epilepsy. Prior to participation, all participants provided written informed consent and completed a tDCS-specific screening questionnaire to confirm eligibility. The study protocol adhered to the Declaration of Helsinki and received approval from the Institutional Review Board (No. CE031908).

2.3. Procedures

2.3.1. Load-Velocity Test Procedure and Estimated 1RM

Each session began with a warm-up consisting of five min of cycling (ergometer) at 100–120 watts and several joint mobilization exercises (i.e., hip extension, hip abduction, hip adduction, hip rotation, and sumo squat lung rotation on each side). Thereafter, all participants were tested for their estimated squat 1RM using the Smith machine. During squats, the barbell rested across the back at the level of the acromion and upper trapezius. The squat began from an upright position with the knees and hips fully extended, feet approximately shoulder-width apart, flat on the floor either parallel or externally rotated to a comfortable degree. To avoid a rebound effect within and between each repetition, the participants were instructed to perform the squat as follows: After the verbal command “go”, participants began descending (eccentric phase) at a controlled velocity (~0.30–0.48 m/s) following a verbal pacing until reaching a 90° knee angle, and then immediately reversed the motion and ascended back (concentric phase) at maximal intended velocity to the upright position. Upon returning to the standing position, they were instructed to maintain their position until another verbal command of “go” was given. The safety catches of the Smith machine were placed at the height where the angle of participants’ knee was ~90° when they descended to the bottom of the movement. To replicate stance width, feet position, and eccentric ROM, these were recorded on the first visit (familiarization session) and individually adjusted on the subsequent visits.
A linear encoder (ChronojumpTM, Barcelona, Spain) attached perpendicularly to the barbell was used to register bar velocity and estimate the 1RM. Initial load was set at ~30–50 kg for all participants and was gradually increased in ~10 kg increments until the mean velocity was lower than ~0.60 m/s, which corresponds to ~85% 1RM [22]⁠. During the test, three repetitions were executed for light (≤50% 1RM), two for medium (50–80% 1RM), and only one for the heaviest loads (≥80% 1RM). Inter-set rests ranged from three (for light load) to five min (for heavy loads). Only the best repetition at each load, according to the criteria of fastest mean velocity, was considered for subsequent analysis. The 1RM was calculated from the lowest mean velocity (Vmin in m/s) attained against the heaviest load (Lmax in kg) lifted in the progressive loading test using the following equation [22]:
1RM = (100 × Lmax)/(−12.87 × Vmin2 − 50.71 × Vmin + 117)

2.3.2. Transcranial Direct Current Stimulation Procedure

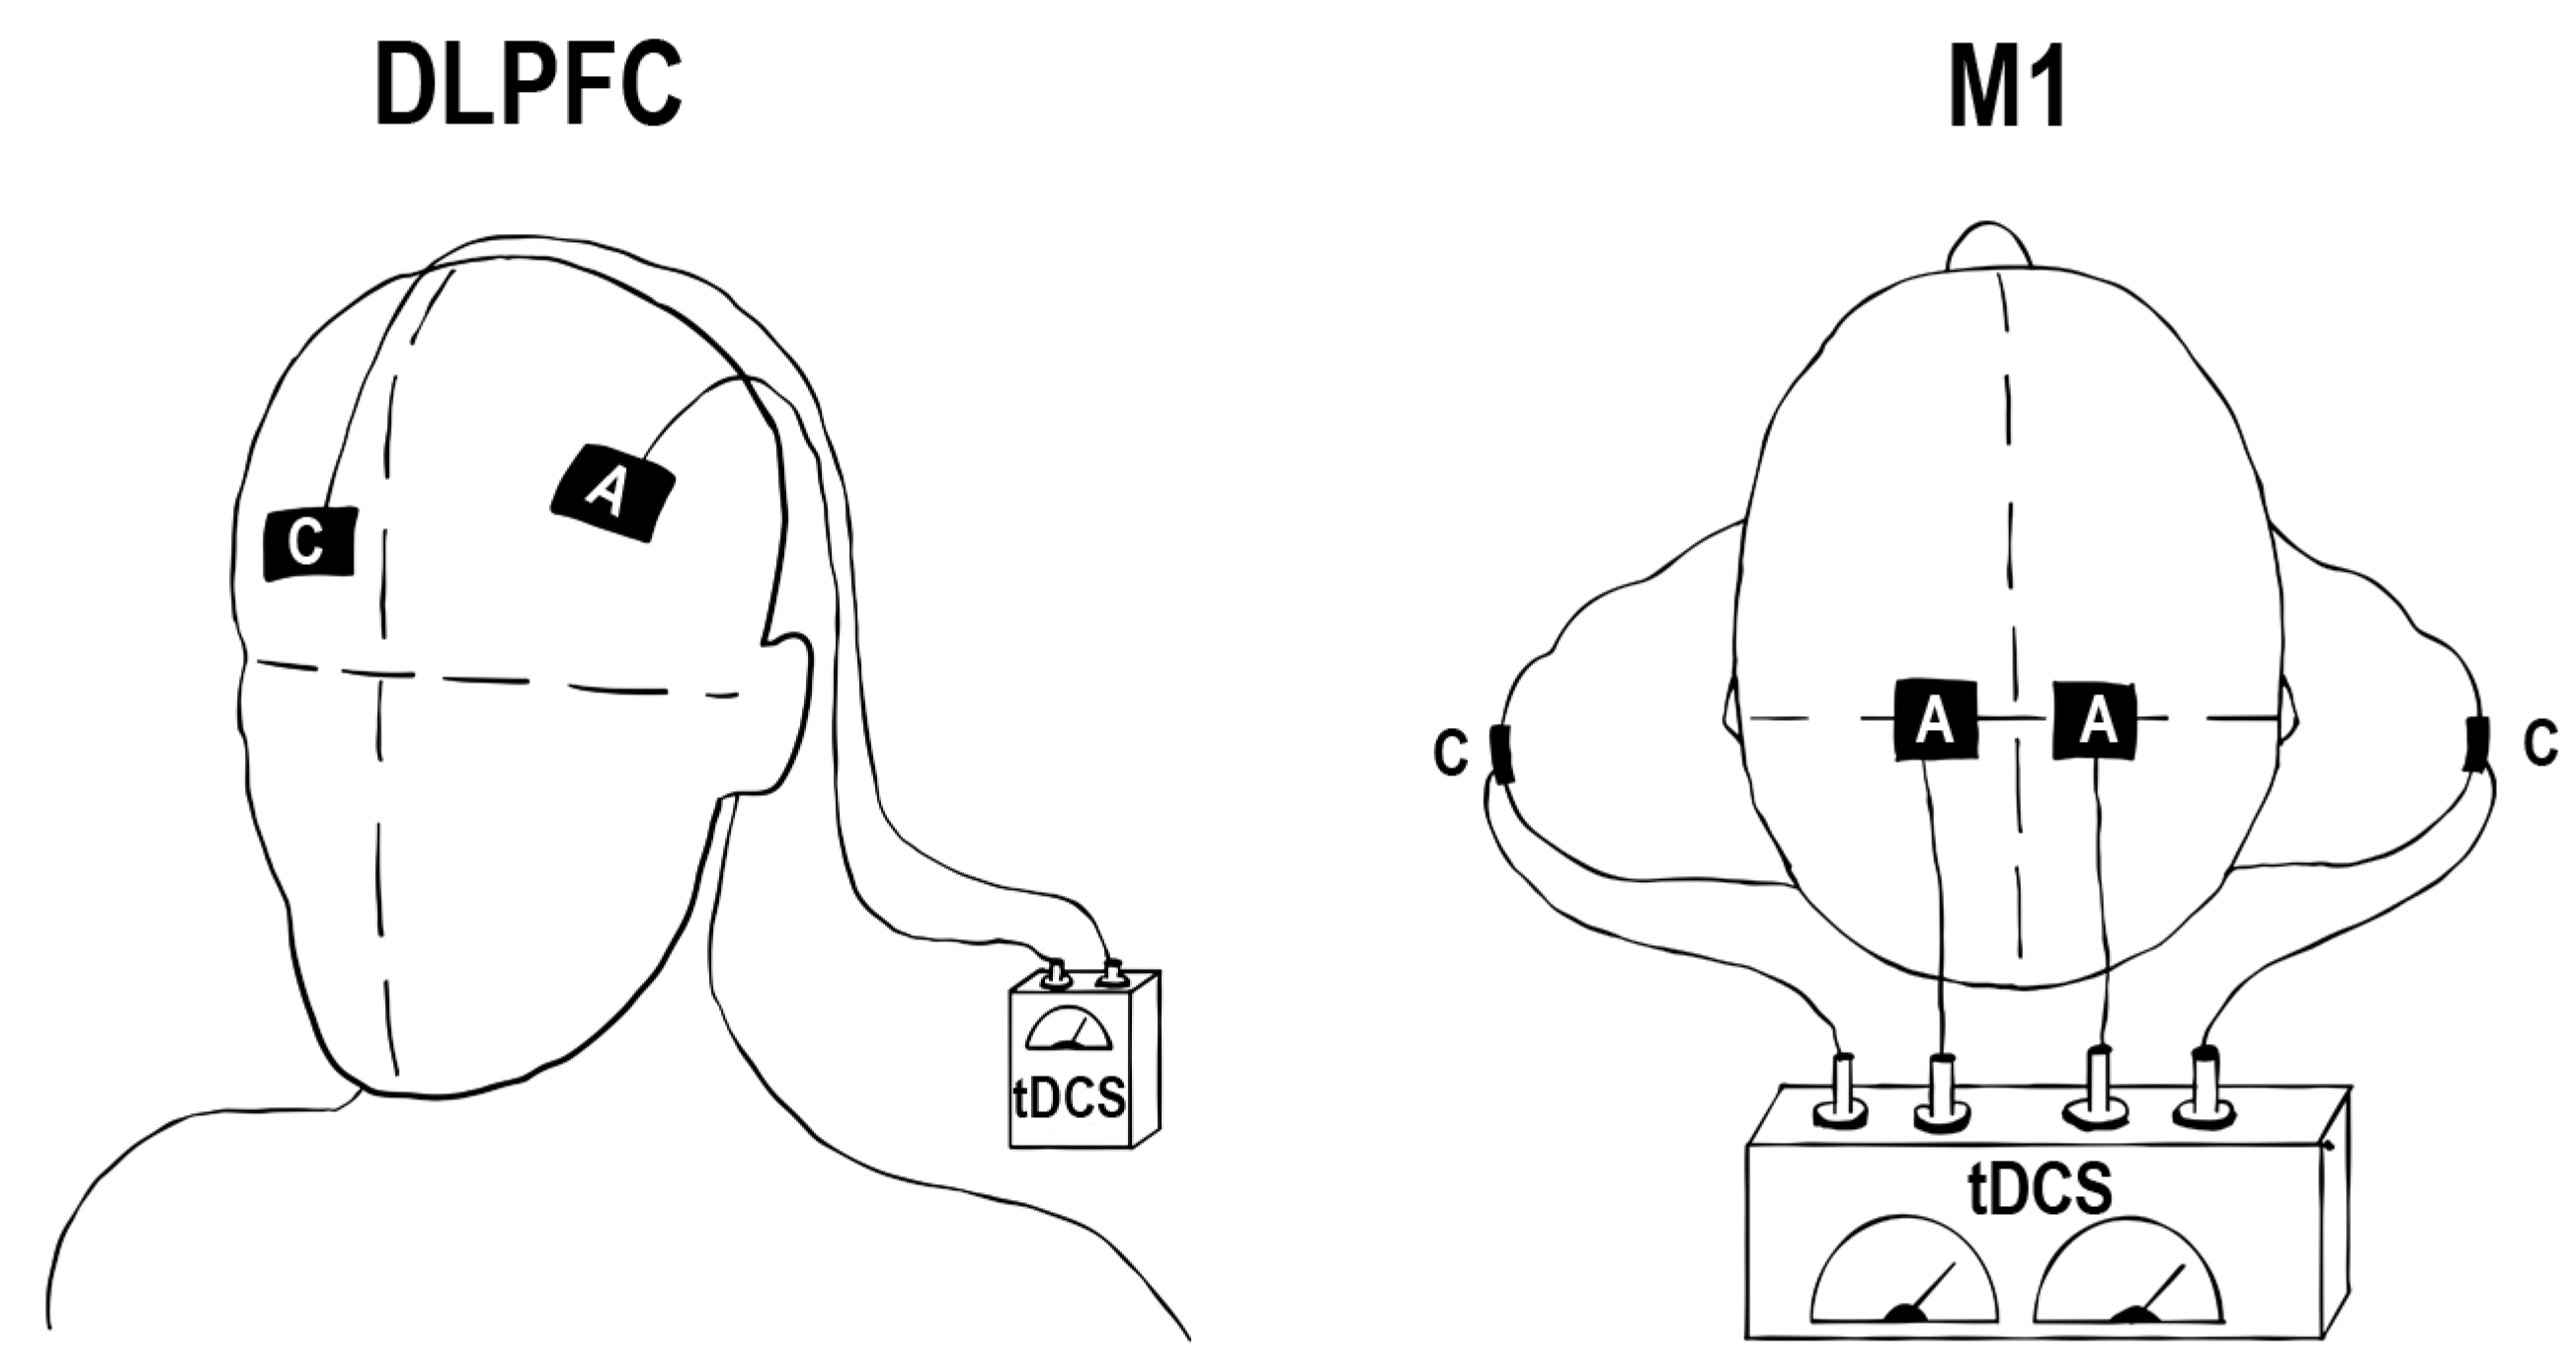
Following 1RM estimation, participants remained seated during the implementation of a-tDCS and were stimulated for 20 min at 2.0 mA. The a-tDCS was applied using a constant-current electrical stimulator (ApeX Type A 18V, ApeX Electronics, Clifton Park, NY, USA) connected to a pair of rectangular rubber electrodes (7.5 cm × 5.1 cm for the anode and 6 cm × 3.3 cm for the cathode) covered with a sponge moisturized by 0.9% NaCL saline (Figure 2). In the M1 condition, two tDCS devices were utilized to place an anodal electrode on each side of the vertex (estimated leg muscles M1 representation), and the cathodal electrodes were placed on the ipsilateral shoulders (i.e., bihemispheric M1 stimulation). This montage was found to increase performance under different exercise conditions (e.g., time to exhaustion test [8]). In the DLPFC condition, a single tDCS device was used, with the anode on the left DLPFC and the cathode on the right orbitofrontal cortex. This montage was found to increase the volume load during resistance training [2,5,6,7]. The electrode placements were determined according with the international 10–20 system EEG. The stimulation ramped up over 30 s until the target intensity of 2.0 mA was reached and then remained for 20 min before ramping back down to 0 mA over 30 s. For the placebo stimulation condition (SHAM), the electrodes were placed in the same position as for the M1 or DLPFC, and the stimulation ramped up over 30 s and immediately ramped down to 0 mA to imitate the initial sensations of active stimulation and maintain participants’ blinding to the received type of tDCS. To hold the electrodes on the scalp and shoulders, the DigichargeTM adjustable elastic head strap and elastic straps with Velcro (8.3 cm × 57.3 cm) were used, respectively. The intensity used in this study is considered safe and tolerable and does not elicit any serious adverse effects.

2.3.3. Velocity-Based Training

The same Smith machine and linear encoder used for estimating the squat 1RM were used for VBT. Before VBT, participants completed the same general warm-up as performed for the 1RM test, followed by a specific warm-up consisting of two sets of eight and four repetitions (with 90 s of rest) at loads corresponding to 40% and 60% of 1RM, respectively. After a 90 s rest following the specific warm-up, participants performed the VBT comprising five sets at 70% of 1RM. During each set, participants executed as many repetitions as possible until exceeding a 15% VL (calculated relative to the fastest repetition of the set), with a 90 s rest between sets. The adoption of a 15% VL threshold during the VBT protocol was implemented to reduce fatigue accumulation and maintain higher movement velocities and force outputs throughout the sets, potentially enhancing the quality of neuromuscular stimuli [23]. Throughout the training, participants were encouraged to perform each repetition at the maximum intended lifting velocity under consistent and standardized supervision by the same researcher, ensuring comparable motivational support across all sets. The velocity of each repetition and the total number of repetitions per set were recorded, and the RPE was assessed after each set using the OMNI-RES scale (ranging from 0 to 10 points) [24] to evaluate the perceived fatigue. For neuromuscular performance analysis, the fastest mean velocity of the first set (i.e., from the first or second repetition) was used to provide a concise measure of explosive performance while minimizing fatigue effects.

2.4. Statistical Analysis

All statistical analyses were performed using JAMOVI software (version 2.3.28) and Python (version 3.12). The normality of the distributions of the dependent variables was assessed using the Shapiro–Wilk test. The inter-session reliability of the 1RM estimation under the SHAM, DLPFC and M1 conditions was assessed using intraclass correlation coefficients (ICCs) employing a mixed-effects model. ICC values were interpreted according to the following categories: <0.5 (poor reliability), 0.5–0.75 (moderate reliability), 0.75–0.90 (good reliability), and >0.90 (excellent reliability) [25].
Additionally, analyses of variance (ANOVAs) were conducted to evaluate the effect of the different stimulation conditions (SHAM, DLPFC, and M1) on the variables of interest. For the variables of repetitions per set, mean velocity, and RPE, a two-factor repeated-measures ANOVA (CONDITION × SET) was performed. This analysis allowed us to examine the main effects of CONDITION (SHAM, DLPFC, and M1) and SET (Sets 1 to 5), as well as the interaction between both factors. For variables that reflect overall performance across the session—total number of repetitions and maximum mean velocity (i.e., the fastest mean velocity recorded during the first or second repetition of the first set)—a one-factor repeated-measures ANOVA (CONDITION) was employed. The assumption of sphericity was verified using Mauchly’s test. In cases where the sphericity assumption was violated, Greenhouse–Geisser corrections were applied. When the ANOVAs revealed significant effects, post hoc tests with Bonferroni correction were performed to identify specific differences between conditions and sets. Effect sizes were calculated using partial eta squared ( η p 2 ). The η p 2 was used as a measure of effect size for the two-way ANOVA and interpreted as follows: trivial (<0.2); low (0.2 ≤ η p 2 < 0.5); moderate (0.5 ≤ η p 2 < 0.8); and large (≥0.8). The η p 2 is an effect size measure in ANOVA that represents the proportion of variance in the dependent variable explained by an independent variable, excluding the variance accounted for by other model factors. The statistical significance level was set at p < 0.05 for all tests. All data are presented as means ± standard deviations unless otherwise stated. For graphical representation, error bars indicate 95% within-subject confidence intervals calculated using the Cousineau–Morey method.
Given the high inter-individual variability in response to a-tDCS [26], we performed an additional post hoc sensitivity analysis to evaluate whether group-level estimates were influenced by participants showing an opposite response direction relative to SHAM. Individual change scores were computed for each active condition (M1 and DLPFC) as (active—SHAM) for total repetitions and mean lifting velocity. Two of the fifteen participants showed a reversed response pattern (i.e., negative change scores relative to SHAM across outcomes), and the primary analyses were therefore conducted on the full sample (n = 15) and repeated after excluding these two participants (n = 13) only as a sensitivity analysis. This subgroup was not pre-specified and any findings derived from it should be interpreted strictly as exploratory/hypothesis-generating, not as confirmatory evidence of efficacy.

3. Results

Table 1 shows the comparison of the 1RM values obtained in each experimental condition. The ICC indicated excellent reliability between the measurements performed in the different sessions. In addition, repeated-measures ANOVA revealed no significant differences in 1RM estimates between stimulation conditions.

3.1. Number of Repetitions

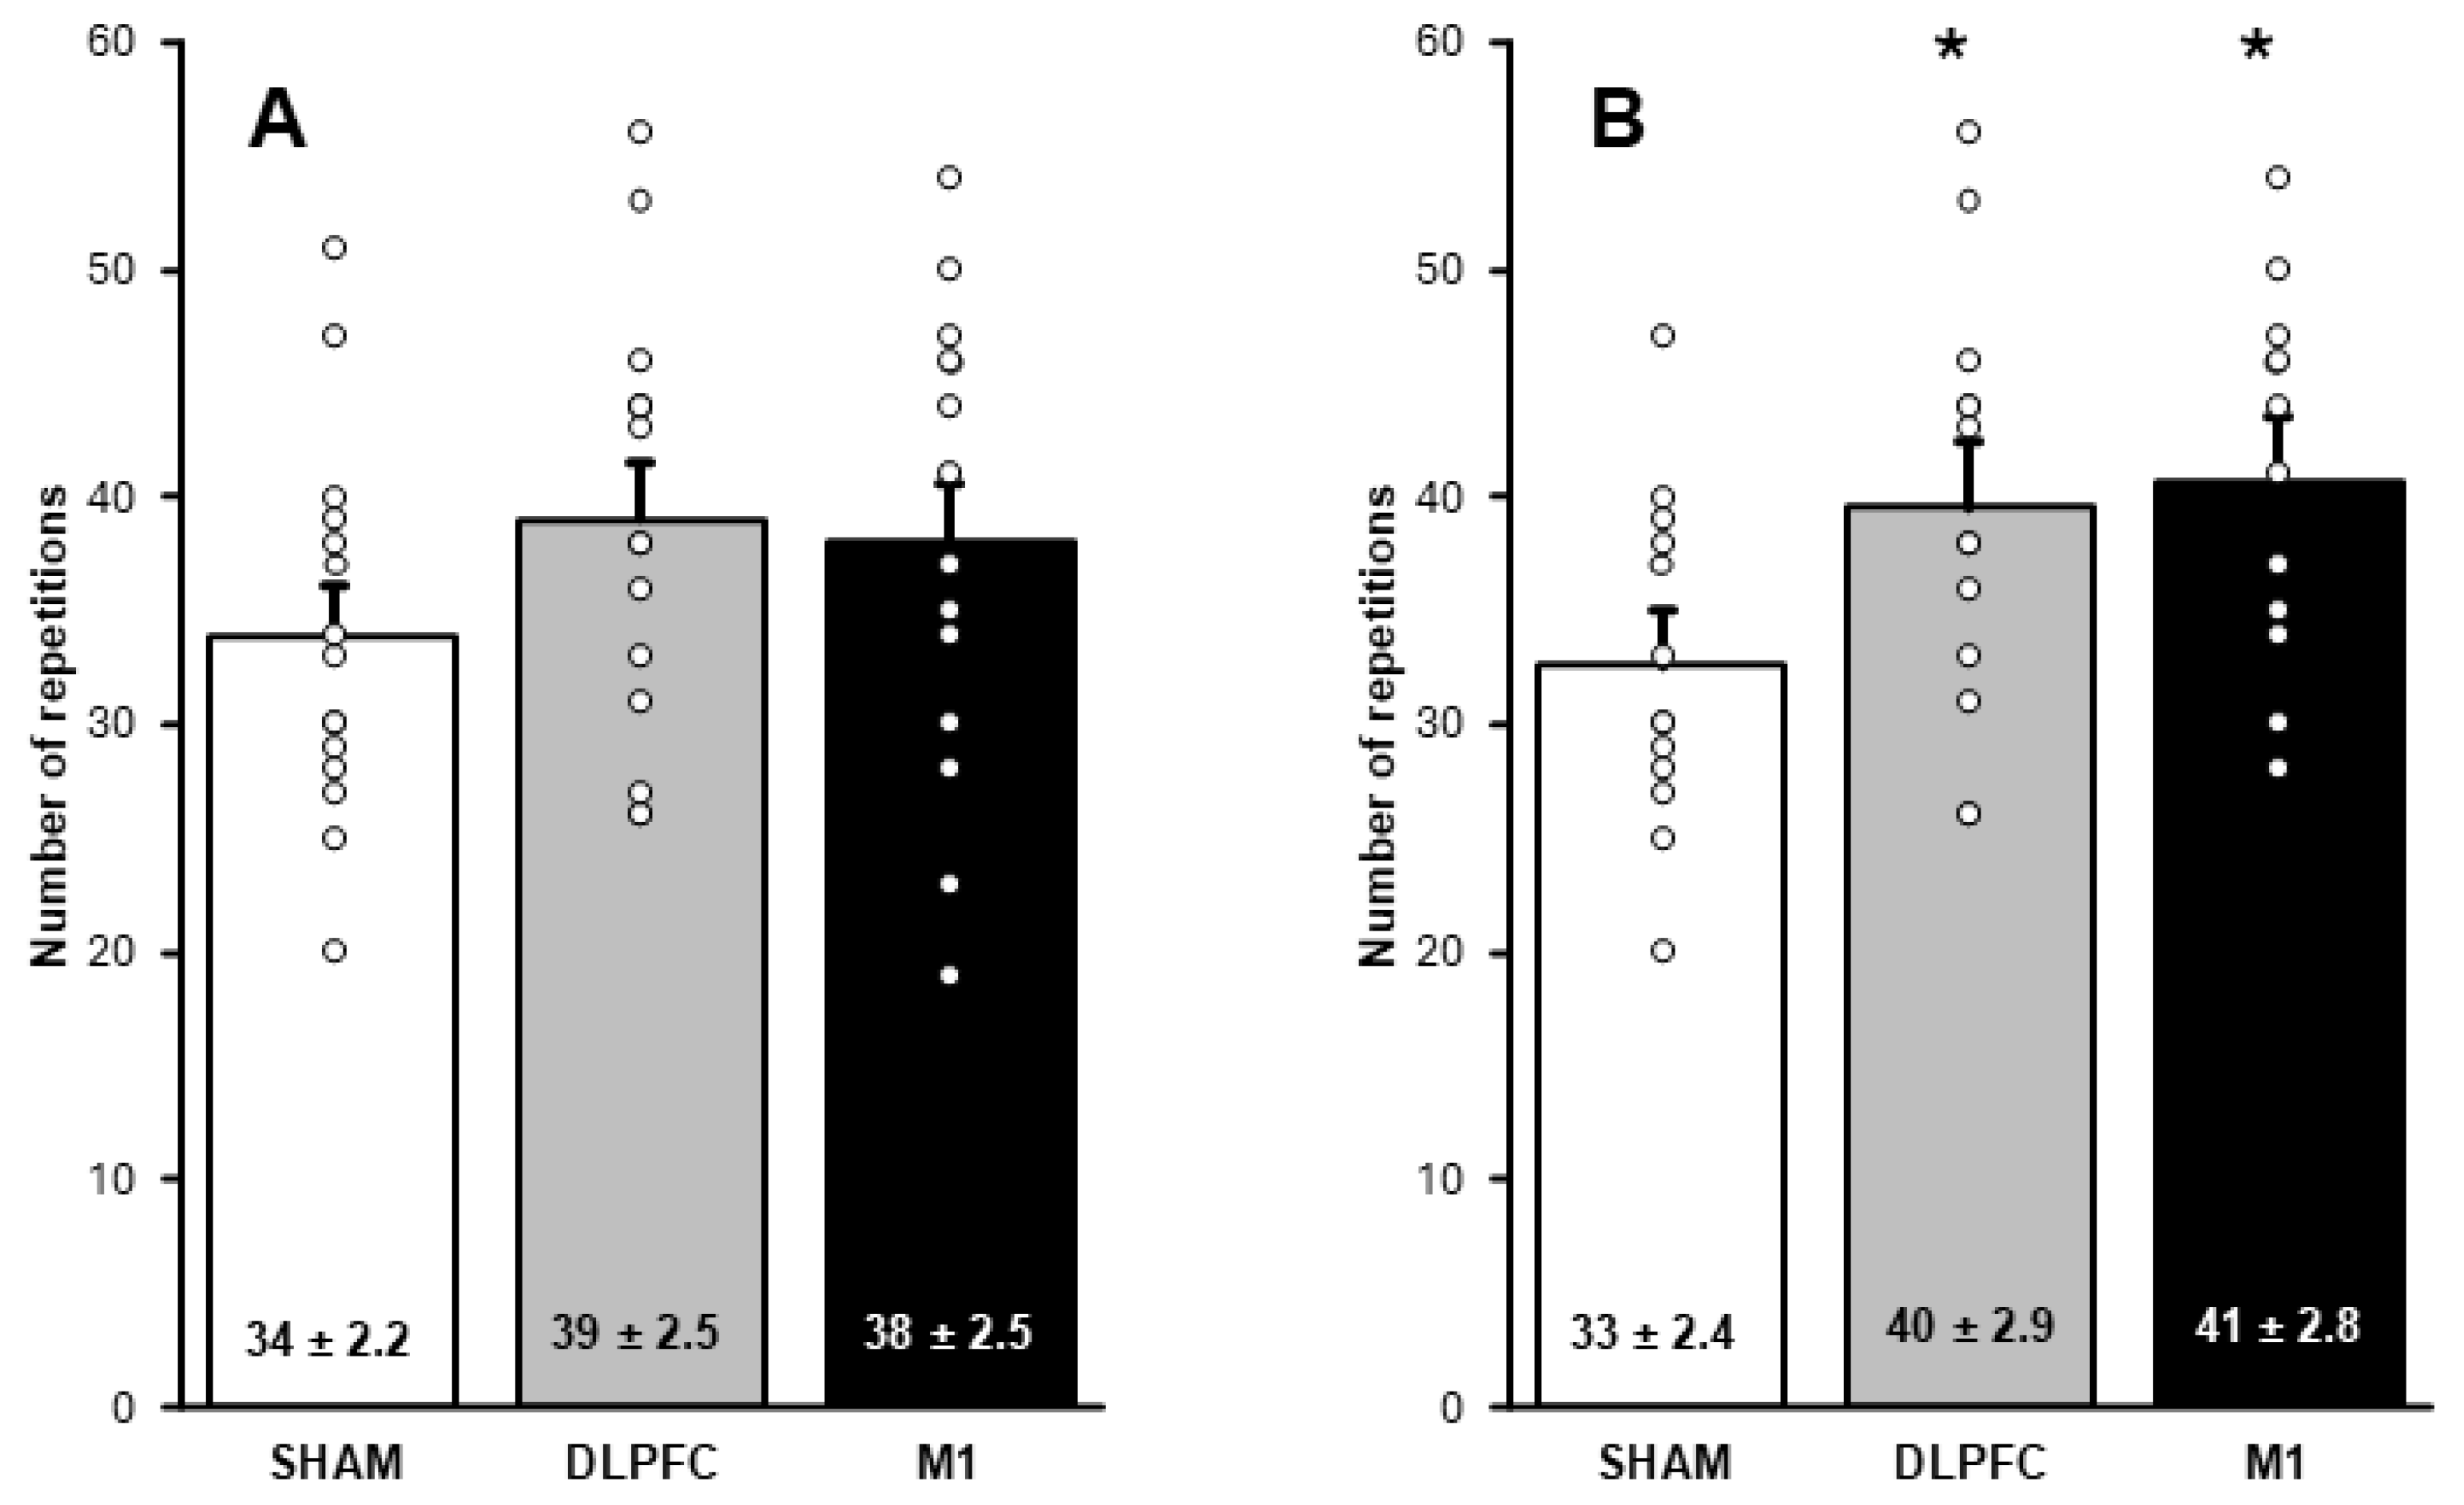
A repeated-measures ANOVA for total repetitions across all participants (Figure 3A) revealed no significant main effect of condition (F(2,28) = 2.32, p = 0.117, η p 2 = 0.142). In contrast, among the exploratory subgroup, the condition effect was significant (F(2,24) = 11.3, p < 0.001, η p 2 = 0.485), and post hoc tests showed that both DLPFC (mean difference vs. SHAM = 7.00 reps, p = 0.001) and M1 (mean difference vs. SHAM = 8.15 reps, p = 0.001) produced a higher total number of repetitions than SHAM, with no difference between the DLPFC and M1 (Figure 3B).
When examining repetitions per set in the total sample (Table 2), the repeated-measures ANOVA did not reveal a significant main effect of set (F(4,168) = 1.975, p = 0.101, η p 2 = 0.045) or condition (F(2,42) = 1.30, p = 0.282, η p 2 = 0.058) or a set × condition interaction (F(8,168) = 0.701, p = 0.690, η p 2 = 0.032). However, for the exploratory subgroup, the repeated-measures ANOVA showed a significant main effect of set (F(4,144) = 2.887, p = 0.031, η p 2 = 0.074) and condition (F(2,36) = 3.73, p = 0.034, η p 2 = 0.172), but not the set × condition interaction (F(8,144) = 0.698, p = 0.693, η p 2 = 0.037). Post hoc comparisons for the exploratory subgroup did not show statistically significant differences between sets but showed that the M1 led to a greater number of repetitions per set than SHAM (mean difference = 1.6 reps, p = 0.049). No significant differences were observed between DLPFC and SHAM (mean difference = 1.4 reps, p = 0.111) or between the DLPFC and M1 (mean difference = 0.2 reps, p = 1.000).

3.2. Lifting Velocity

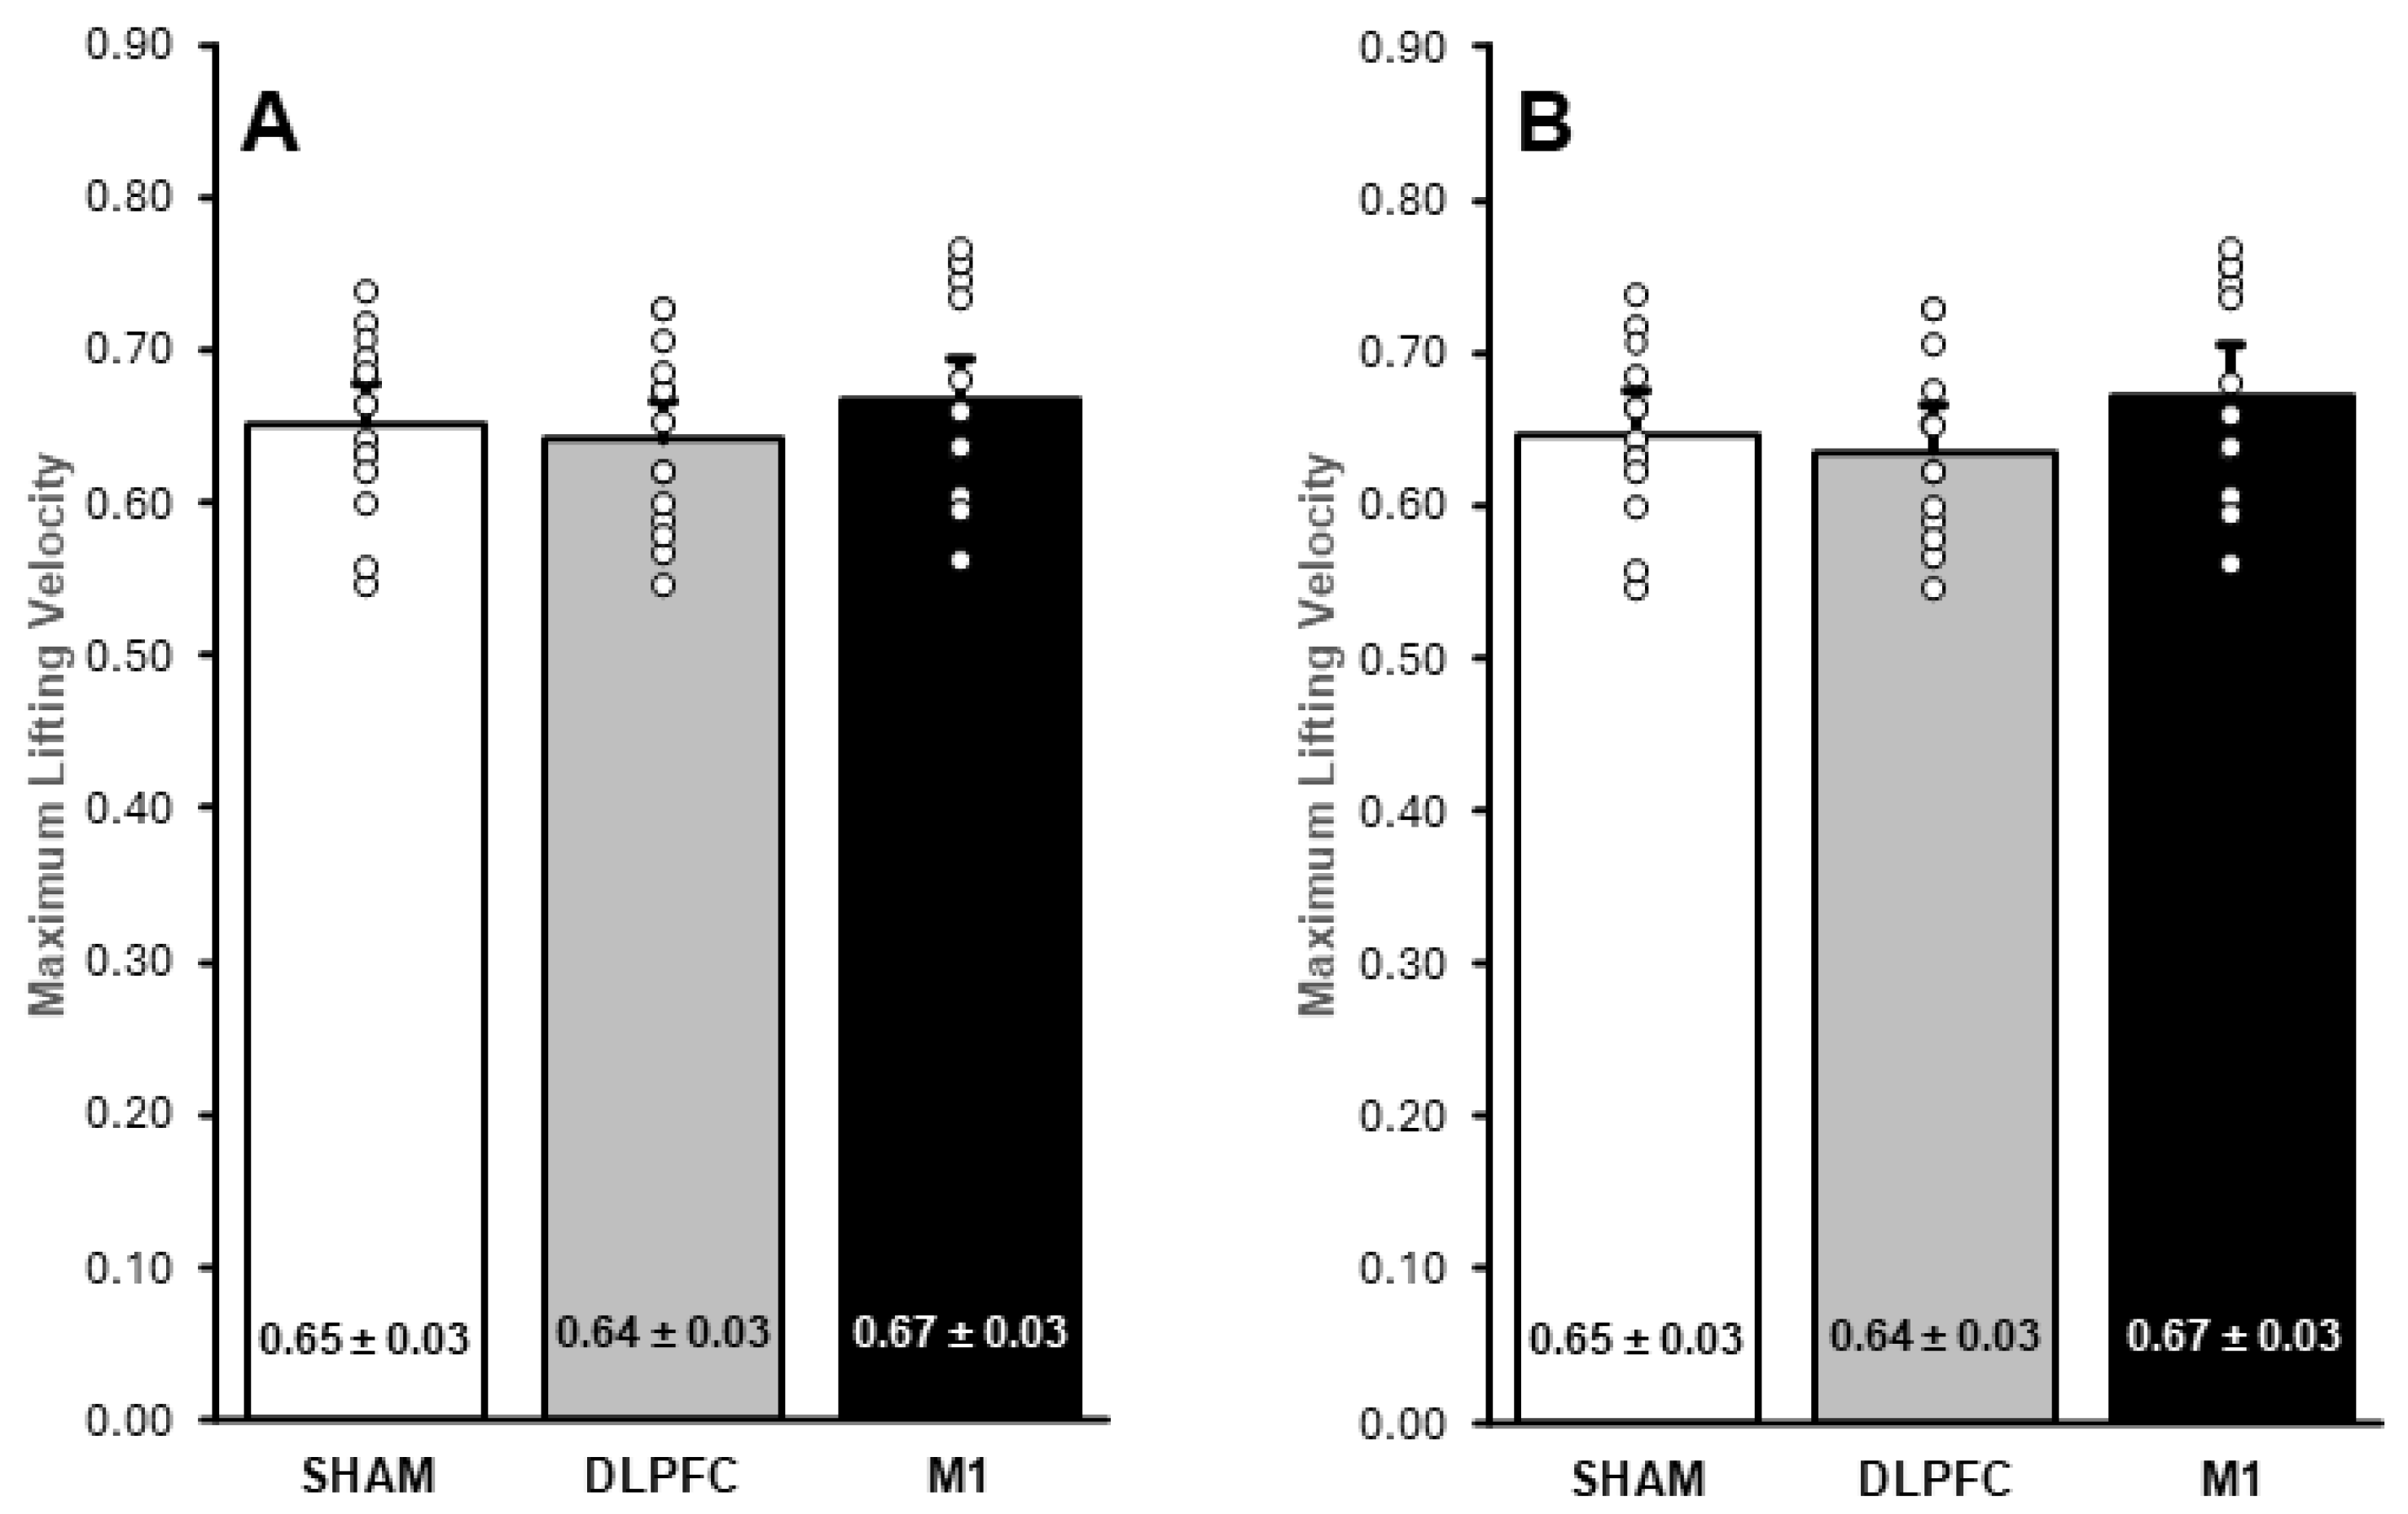
For the fastest lifting velocity, a one-factor repeated-measures ANOVA (CONDITION) revealed no significant effect (F(1.42,19.85) = 1.91, p = 0.191, η p 2 = 0.116), as illustrated in Figure 4A. Similarly, for the exploratory subgroup, Mauchly’s test was marginally significant (W = 0.633, p = 0.071), and the corresponding ANOVA did not show a significant difference across conditions (F(1.46,17.55) = 2.81, p = 0.108, η p 2 = 0.181), as shown in Figure 4B.
Lifting velocity was analyzed across sets for the total sample and the exploratory subgroup (Table 2). In the total sample, a repeated-measures ANOVA revealed a significant main effect of set (F(4,168) = 5.807, p < 0.001, η p 2 = 0.121). Post hoc comparisons indicated that the mean velocity in Set-1 was significantly higher than in Set-4 (mean difference = 0.021 m/s, p = 0.016) and Set-5 (mean difference = 0.024 m/s, p = 0.021). In contrast, there was no significant main effect of condition (F(2,42) = 0.519, p = 0.599, η p 2 = 0.024) nor a set × condition interaction (F(8,168) = 0.424, p = 0.905, η p 2 = 0.020). Similarly, in the exploratory subgroup, repeated-measures ANOVA also revealed a significant main effect of set (F(4,144) = 3.245, p = 0.014, η p 2 = 0.083), although subsequent pairwise comparisons between sets did not reach significance. Additionally, no significant main effect of condition (F(2,36) = 1.09, p = 0.348, η p 2 = 0.057) or the set × condition interaction (F(8,144) = 0.446, p = 0.892, η p 2 = 0.024) was detected.

3.3. Rating of Perceived Exertion

In the total sample, the repeated-measures ANOVA for RPE revealed a significant main effect of set (F(4,168) = 220.522, p < 0.001, η p 2 = 0.840). Post hoc comparisons showed that RPE increased significantly from Set-1 to every subsequent set, as well as between different sets (p < 0.001), suggesting a marked rise in perceived effort as fatigue accumulated (Set-2: 16.2%; Set-3: 28.5%; Set-4: 36.8%; and Set-5: 48.7%; compared to Set-1, all p < 0.001). In contrast, there were no significant differences in RPE between stimulation conditions (F(2,42) = 0.048, p = 0.953, η p 2 = 0.002), nor significant set × condition interactions (F(8,168) = 0.309, p = 0.962, η p 2 = 0.015).
Among the exploratory subgroup, a similar pattern emerged. The repeated-measures ANOVA also indicated a significant main effect of set (F(4,144) = 186.010, p < 0.001, η p 2 = 0.838), reflecting a progressive increase in RPE across the exercise sets (Set-2: 15.4%; Set-3: 27.9%; Set-4: 35.4%; and Set-5: 47.9%; compared to Set-1, all p < 0.001). As in the total sample, the exploratory subgroup showed no significant main effect of stimulation condition (F(2,36) = 0.0167, p = 0.983, η p 2 = 0.001) and no set × condition interaction (F(8,144) = 0.247, p = 0.981, η p 2 = 0.014).

4. Discussion

This study aimed to examine the acute effects of a-tDCS over the M1 and DLPFC on total repetitions, lifting velocity, and RPE during velocity-based back squat training to a 15% VL threshold. Our findings indicate no significant effects of a-tDCS over the M1 or DLPFC on total training volume (total repetitions), lifting velocity, or RPE across all participants, contrary to our initial hypotheses. Nevertheless, in a post hoc exploratory/sensitivity analysis based on response direction, 13 of 15 participants showed directionally higher total repetitions following a-tDCS over M1 and DLPFC compared with SHAM. However, this change was not accompanied by greater lifting velocity or lower RPE during training and should be cautiously interpreted due to the nature of the exploratory analysis and the reduced sample size. Specifically, the n = 13 subgroup was defined post hoc based on observed response direction, was not pre-registered, and therefore is susceptible to confirmation bias. Consequently, these subgroup findings should be interpreted strictly as hypothesis-generating, not as confirmatory evidence of a-tDCS efficacy. Future studies should pre-specify responder criteria and incorporate neurophysiological markers (e.g., cortical excitability/voluntary activation measures) to support mechanistic inference. Our findings suggest that anaerobic performance outcomes during VBT, such as fatigue resistance, lifting velocity, and perceived effort, are not uniformly responsive to a-tDCS, highlighting the complexity of these effects and emphasizing that acute a-tDCS does not consistently improve all aspects of neuromuscular performance.
Inter-individual variability in neuromuscular performance responses following tDCS has been the focus of investigation in several studies [9,27]. Some research has described subgroups showing opposite response directions, highlighting the importance of considering individual differences when evaluating the effects of tDCS. For example, Lattari et al. [9] investigated the effects of anodal tDCS on the motor cortex in individuals with advanced resistance training experience. The results showed that all participants demonstrated improvements in vertical jump performance following anodal stimulation, indicating a uniformly positive response among the participants studied. Additionally, Lattari et al. [27] examined the effects of anodal tDCS on the left DLPFC in trained individuals and found increased training volume during the elbow flexion exercise after anodal stimulation in all participants. In contrast, Lattari et al. [7] reported that, among 15 participants, 15 showed improvements in the anodal session, six in the cathodal session, and eight in the sham session with respect to training volume in the leg press exercise. Interestingly, two participants demonstrated increased training volume following the cathodal session, while seven participants showed unchanged results in both the cathodal and sham sessions. Numerous factors could influence the outcome of tDCS interventions, including cranial and brain anatomy, local inhibitory–excitatory balance, baseline neuromuscular function, psychological status, neurotransmitter systems, and genetic predispositions [11]. Such inter-individual variability in cortical responsiveness has been well-documented [28], and our data further suggest that these differences may translate into distinct performance outcomes. However, the precise neurophysiological mechanisms by which increased cortical excitability—if present—enhances or fails to enhance neuromuscular performance remain unclear. We did not assess cortical excitability directly, and previous research has yet to establish a definitive link between changes in cortical activity and acute improvements in resistance training performance [11]. Moving forward, it will be essential to integrate neurophysiological assessments alongside performance measures to identify reliable biomarkers of a-tDCS efficacy [29]. Such an approach may help clarify the mechanisms underlying those non-responders and refine individualized neuromodulation strategies, improving the likelihood of achieving meaningful performance gains in applied settings.
The numerically higher total training volume observed in the post hoc exploratory/sensitivity analysis may reflect subtle cumulative differences across sets rather than pronounced effects within each individual set. Although no significant main effect of the stimulation condition emerged for total repetitions in the entire sample, post hoc comparisons indicated that DLPFC stimulation led to approximately five additional repetitions compared to SHAM, and the exploratory subgroup exhibited substantial increases in total repetitions under both DLPFC and M1 conditions. Such findings suggest that the ergogenic effects of a-tDCS may not manifest uniformly at the set level. One plausible explanation is that any modest, centrally mediated facilitation (e.g., shifts in neuronal membrane potential and/or changes in cortical excitability) [30,31] would be expected to accumulate over repeated bouts, thereby influencing overall fatigue tolerance rather than immediate within-set performance. These results align partially with previous studies reporting that M1 stimulation can mitigate the decline in sprint performance [3] and that DLPFC stimulation can reduce velocity loss during high-intensity bench press exercises [2]. However, the exploratory results may appear to contradict our original hypothesis that a-tDCS over the M1 would improve explosive strength but not the number of repetitions. Nevertheless, from the perspective that increased M1 excitability may reduce the neural input required to generate sufficient neural drive [8] and thereby prolong the ability to maintain the required motor output, such a finding may be physiologically plausible. However, as noted above, these exploratory results were obtained from a reduced sample, and the statistical power may therefore have been insufficient to draw a firm conclusion. Furthermore, the present protocol—characterized by a 15% VL threshold—may have induced primarily peripheral fatigue, potentially masking the central effects of a-tDCS on fatigue resistance. Since a-tDCS primarily targets central mechanisms, its impact may become more evident as exercise approaches volitional failure or under conditions that elicit greater central fatigue [11,12,32]. Additionally, the chosen tDCS configuration and exercise modality may have limited the transfer of central neuromodulatory benefits into observable changes in lifting velocity or perceived exertion.
The effects of a-tDCS on explosive performance remain a topic of debate in the literature. While some studies have not reported improvements in explosive performance following a-tDCS under predefined workloads [32,33], others have shown positive effects under similar testing conditions [34], such as completing a fixed number of vertical jumps or executing a short, time-bound sprint [9,13]. For instance, Rodrigues et al. [33] showed that a-tDCS did not affect movement velocity during three sets of bench press performed at 70% of one-repetition maximum intensity, with 1 min inter-set rest intervals, in recreationally trained participants. On the other hand, Garcia-Sillero et al. [32] showed that a-tDCS over the DLPFC during three sets of 12 repetitions at 70% of one-repetition maximum, with three minutes of rest between sets in a back squat exercise, had an impact on movement velocity in well-trained individuals. However, our assessment of lifting velocity changes took place within a VBT protocol, where exercise volume was not predetermined but rather dictated by a velocity loss threshold. Under these conditions, participants faced two simultaneous objectives: maximizing lifting velocity and performing as many repetitions as possible before reaching the predefined velocity loss threshold. This dual intention may have led them to strategically modulate their effort, potentially withholding maximum lifting velocity on individual repetitions to prolong their set and thus obscuring any direct a-tDCS-induced enhancements in explosive output. Moreover, the tDCS configuration employed in our study differed in certain parameters from the setups used in other investigations reporting positive effects on explosive performance [10,13]. Such discrepancies in stimulation parameters could also limit the comparability of results and diminish the observable impact on power-related measures. Taken together, these factors highlight the importance of considering both the nature of the exercise task and the specific tDCS setup when interpreting the influence of neuromodulation on explosive performance metrics.
Considering these discrepancies in tDCS protocols and outcomes, it is worth noting that the electrode size and stimulation parameters employed in the present study were comparable to those used in previous research reporting positive effects on explosive performance [2,10,13,14]. Furthermore, our participants shared similar characteristics (e.g., healthy, young adults) and underwent stimulation intensities and durations aligned with studies where enhanced explosive strength has been observed [3,10,13,14,35,36]. Despite these similarities, the lack of a measurable effect on squat lifting velocity in our investigation suggests that other variables, such as exercise modality, intensity, or the specific demands imposed by a velocity-based training protocol, may critically modulate the impact of a-tDCS.
Differences in baseline performance levels, psychological factors, or individual susceptibility to cortical stimulation may further contribute to inter-study variability [37,38]. Likewise, subtle distinctions in tDCS waveform characteristics, electrode placements, or current density can influence cortical excitability and, in turn, performance outcomes [12,39,40]. Consequently, the absence of improved explosive squat performance in the present study underscores the multifaceted nature of neuromuscular function, highlighting the need for carefully tailored tDCS protocols that consider exercise-specific demands, participant attributes, and the interplay of central and peripheral factors governing explosive output.
Although the literature suggests that a-tDCS may decrease RPE when applied over the M1 or the DLPFC [41], our findings regarding RPE further underscore the context-dependent nature of a-tDCS effects. While previous work has shown that a-tDCS can reduce perceived effort under conditions involving significant velocity loss and exercises performed until or near failure [2], our results did not replicate this outcome. Given that perceived exertion is closely linked to central rather than peripheral fatigue [42,43], the absence of an RPE reduction may suggest that the training volume and intensity employed in our study were insufficient to elicit the level of central fatigue at which tDCS-induced modulations of effort perception become evident. Indeed, central fatigue typically emerges as exercise approaches volitional failure [44], and studies reporting reduced RPE following a-tDCS have generally involved protocols reaching that threshold [2,8], whereas intermittent, sub-failure tasks often show no such effect [3,11,12]. Thus, the mismatch between our protocol and those that have demonstrated diminished perceived exertion may explain the discrepancy in our findings. In this sense, the potential central mechanism underlying a-tDCS’s influence on perceived exertion may remain masked unless the exercise stimulus places participants closer to their neuromuscular or volitional limits. However, this assumption lacks support from direct measurement of central fatigue (e.g., supramaximal electrical stimulation) in this study. Such assessment should be incorporated into future research, along with carefully calibrated training loads, to clarify the conditions under which a-tDCS can reliably modulate RPE in velocity-based resistance training contexts.
Despite the careful considerations made in this study, several limitations may have limited the detection and interpretation of a-tDCS effects and should be addressed in future research. First, the present study only recruited recreationally trained men, limiting the generalizability of the results to other groups (e.g., women and older adults). Second, the post hoc sensitivity subgroup analysis was not pre-registered and should be interpreted as hypothesis-generating. Additionally, anatomical variability in brain regions such as the M1 and DLPFC [45,46,47] may have influenced the precision of electrode placement. Employing neuroimaging or neurophysiological techniques (e.g., TMS-based mapping) could enhance localization accuracy, ensuring more consistent stimulation of the intended cortical targets. Regarding our assessment of explosive performance, the velocity-based training task, with its dual intention of maximizing both lifting velocity and repetition count, may have diluted the clarity of neuromodulatory effects. Future studies could isolate the evaluation of maximal lifting velocity (e.g., sets limited to three repetitions) to avoid confounding motivational factors related to maximizing the number of repetitions performed. Moreover, our reliance on velocity loss thresholds as the sole criterion for repetition validity did not account for subtle technical deviations (e.g., maintaining optimal lumbar curvature), which can affect force production and overall performance [48]. Introducing standardized technique criteria and monitoring methods could reduce variability and provide a clearer understanding of how a-tDCS interacts with biomechanical and technical aspects of the exercise. Finally, incorporating neurophysiological measures of cortical and spinal excitability would help link behavioural outcomes to underlying mechanisms and better contextualize inter-individual variability.

5. Conclusions

The application of a-tDCS did not demonstrate a clear effect on training volume during velocity-based resistance exercise. However, this effect may have been influenced by substantial inter-individual variability, and its potential relationship with explosive performance or perceived exertion warrants additional investigation. To better understand the underlying neuromodulatory mechanisms, future research should integrate assessments like voluntary or cortical activation with performance outcomes. Such comprehensive approaches are essential to clarify the conditions for a-tDCS’s ergogenic benefits and to develop individualized, effective neuromodulation strategies within strength and conditioning contexts.

Author Contributions

Conceptualization, all authors; methodology, all authors; formal analysis, T.-C.C. and S.R.-A.; investigation, T.-C.C. and S.R.-A.; resources, S.R.-A.; data curation, T.-C.C. and D.C.-P.; writing—original draft preparation, T.-C.C.; writing—review and editing, all authors; supervision, S.R.-A. All authors have read and agreed to the published version of the manuscript.

Funding

This research was partially funded by Grant PID2021-128204OA-I00 by MICIU/AEI/10.13039/501100011033 and by ERDF/EU.

Institutional Review Board Statement

The study was conducted in accordance with the Declaration of Helsinki and approved by the Institutional Review Board of Universidad Católica de Murcia (protocol code CE031908).

Informed Consent Statement

Informed consent was obtained from all subjects involved in the study.

Data Availability Statement

The data presented in this study are available on reasonable request from the corresponding author.

Acknowledgments

The authors are deeply grateful to all participants for their time.

Conflicts of Interest

The authors declare no conflicts of interest.

Abbreviations

The following abbreviations are used in this manuscript:
ANOVAAnalysis of variance
a-tDCSAnodal transcranial direct current stimulation
CIConfidence interval
CMJCountermovement jump
DLPFCDorsolateral prefrontal cortex
ICCIntraclass correlation coefficient
LmaxHeaviest load
M1Primary motor cortex
RMRepetition maximum
RPERating of perceived exertion
RTResistance training
VLVelocity loss
VminLowest mean velocity

References

  1. Douglas, J.; Ross, A.; Martin, J.C. Maximal muscular power: Lessons from sprint cycling. Sports Med. Open 2021, 7, 48. [Google Scholar] [CrossRef] [Scilit]
  2. Alix-Fages, C.; García-Ramos, A.; Calderón-Nadal, G.; Colomer-Poveda, D.; Romero-Arenas, S.; Fernández-del-Olmo, M. Anodal transcranial direct current stimulation enhances strength training volume but not the force-velocity profile. Eur. J. Appl. Physiol. 2020, 120, 1881–1891. [Google Scholar] [CrossRef] [Scilit]
  3. Chen, C.H.; Chen, Y.C.; Jiang, R.S.; Lo, L.Y.; Wang, I.L.; Chiu, C.H. Transcranial direct current stimulation decreases the decline of speed during repeated sprinting in basketball athletes. Int. J. Environ. Res. Public Health 2021, 18, 6967. [Google Scholar] [CrossRef] [Scilit]
  4. Kaushalya, F.S.; Romero-Arenas, S.; García-Ramos, A.; Colomer-Poveda, D.; Marquez, G. Acute effects of transcranial direct current stimulation on cycling and running performance: A systematic review and meta-analysis. Eur. J. Sport Sci. 2022, 22, 113–125. [Google Scholar] [CrossRef] [Scilit]
  5. Rodrigues, G.M.; Machado, S.; Vieira, L.A.F.; Oliveira, B.R.R.; Abreu, M.A.J.; Marquez, G. Effects of anodal transcranial direct current stimulation on training volume and pleasure responses in the back squat exercise. J. Strength Cond. Res. 2022, 36, 3048–3055. [Google Scholar] [CrossRef] [Scilit]
  6. Vieira, L.A.F.; Lattari, E.; Abreu, M.A.J.; Rodrigues, G.M.; Viana, B.; Machado, S. Transcranial direct current stimulation improves back-squat performance in intermediate resistance-training men. Res. Q. Exerc. Sport 2022, 93, 210–218. [Google Scholar] [CrossRef] [Scilit] [PubMed]
  7. Lattari, E.; Rosa Filho, B.J.; Fonseca Junior, S.J.; Murillo-Rodriguez, E.; Rocha, N.; Machado, S. Effects on volume load and RPE in advanced weight training after transcranial direct current stimulation. J. Strength Cond. Res. 2020, 34, 89–96. [Google Scholar] [CrossRef] [Scilit]
  8. Angius, L.; Mauger, A.R.; Hopker, J.; Pascual-Leone, A.; Santarnecchi, E.; Marcora, S.M. Bilateral extracephalic transcranial direct current stimulation improves endurance performance. Brain Stimul. 2018, 11, 108–117. [Google Scholar] [CrossRef] [Scilit] [PubMed]
  9. Lattari, E.; Campos, C.; Lamego, M.K.; Legey, S.; Neto, G.M.; Rocha, N.B. Can transcranial direct current stimulation improve muscle power in individuals with advanced weight-training experience? J. Strength Cond. Res. 2020, 34, 97–103. [Google Scholar] [CrossRef] [Scilit] [PubMed]
  10. Codella, R.; Alongi, R.; Filipas, L.; Luzi, L. Ergogenic effects of bihemispheric transcranial direct current stimulation on fitness. Int. J. Sports Med. 2021, 42, 66–73. [Google Scholar]
  11. Alix-Fages, C.; Romero-Arenas, S.; Calderón-Nadal, G.; Jerez-Martínez, A.; Pareja-Blanco, F.; Colomer-Poveda, D. Transcranial direct current stimulation and repeated sprint ability: No effect on sprint performance or RPE. Eur. J. Sport. Sci. 2022, 22, 569–578. [Google Scholar] [CrossRef] [Scilit] [PubMed]
  12. Teymoori, H.; Amiri, E.; Tahmasebi, W.; Hoseini, R.; Grospretre, S.; Machado, D.G.S. Effect of tDCS targeting M1 or DLPFC on physical and cognitive function in repeated cycling. J. Neuroeng. Rehabil. 2023, 20, 97. [Google Scholar] [CrossRef] [Scilit] [PubMed]
  13. Huang, L.; Deng, Y.; Zheng, X.; Liu, Y. Transcranial direct current stimulation with halo sport enhances repeated sprint and cognition. Front. Physiol. 2019, 10, 118. [Google Scholar] [CrossRef] [Scilit]
  14. Lu, P.; Hanson, N.J.; Wen, L.; Guo, F.; Tian, X. tDCS enhances muscle strength of non-dominant knee in healthy young males. Front. Physiol. 2021, 12, 788719. [Google Scholar] [CrossRef] [Scilit]
  15. Sánchez-Medina, L.; González-Badillo, J.J. Velocity loss as an indicator of neuromuscular fatigue during resistance training. Med. Sci. Sports Exerc. 2011, 43, 1725–1734. [Google Scholar] [CrossRef] [Scilit]
  16. Nitsche, M.A.; Paulus, W. Excitability changes induced in the human motor cortex by weak transcranial direct current stimulation. J. Physiol. 2000, 527, 633–639. [Google Scholar] [CrossRef] [Scilit] [PubMed]
  17. Gonzalez-Badillo, J.J.; Sanchez-Medina, L. Movement velocity as a measure of loading intensity in resistance training. Int. J. Sports Med. 2010, 31, 347–352. [Google Scholar] [CrossRef] [Scilit]
  18. Borg, G. Borg’s Perceived Exertion and Pain Scales; Human Kinetics: Champaign, IL, USA, 1998. [Google Scholar]
  19. Machado, D.G.S.; Unal, G.; Andrade, S.M.; Moreira, A.; Altimari, L.R.; Brunoni, A.R. Effect of transcranial direct current stimulation on exercise performance: A systematic review and meta-analysis. Brain Stimul. 2019, 12, 593–605. [Google Scholar] [CrossRef] [Scilit]
  20. Kuo, M.F.; Paulus, W.; Nitsche, M.A. Sex differences in cortical neuroplasticity in humans. Neuroreport 2006, 17, 1703–1707. [Google Scholar] [CrossRef] [Scilit]
  21. Antal, A.; Alekseichuk, I.; Bikson, M.; Brockmoller, J.; Brunoni, A.R.; Chen, R.; Cohen, L.G.; Dowthwaite, G.; Ellrich, J.; Floel, A.; et al. Low intensity transcranial electric stimulation: Safety, ethical, legal regulatory and application guidelines. Clin. Neurophysiol. 2017, 128, 1774–1809. [Google Scholar] [CrossRef] [Scilit]
  22. Sánchez-Medina, L.; Pallarés, J.; Pérez, C.; Morán-Navarro, R.; González-Badillo, J. Estimation of relative load from bar velocity in the full back squat exercise. Sports Med. Int. Open 2017, 1, E80–E88. [Google Scholar] [CrossRef] [Scilit] [PubMed]
  23. Pareja-Blanco, F.; Alcazar, J.; Sanchez-Valdepenas, J.; Cornejo-Daza, P.J.; Piqueras-Sanchiz, F.; Mora-Vela, R.; Sanchez-Moreno, M.; Bachero-Mena, B.; Ortega-Becerra, M.; Alegre, L.M. Velocity loss as a critical variable determining the adaptations to strength training. Med. Sci. Sports Exerc. 2020, 52, 1752–1762. [Google Scholar] [CrossRef] [Scilit]
  24. Robertson, R.J.; Goss, F.L.; Rutkowski, J.; Lenz, B.; Dixon, C.; Timmer, J.; Frazee, K.; Dube, J.; Andreacci, J. Concurrent validation of the OMNI perceived exertion scale for resistance exercise. Med. Sci. Sports Exerc. 2003, 35, 333–341. [Google Scholar] [CrossRef] [Scilit]
  25. Koo, T.K.; Li, M.Y. A guideline of selecting and reporting intraclass correlation coefficients for reliability research. J. Chiropr. Med. 2016, 15, 155–163. [Google Scholar] [CrossRef] [Scilit]
  26. Jonker, Z.D.; Gaiser, C.; Tulen, J.H.M.; Ribbers, G.M.; Frens, M.A.; Selles, R.W. No effect of anodal tDCS on motor cortical excitability and no evidence for responders in a large double-blind placebo-controlled trial. Brain Stimul. 2021, 14, 100–109. [Google Scholar] [CrossRef] [Scilit]
  27. Lattari, E.; Andrade, M.L.; Filho, A.S.; Moura, A.M.; Neto, G.M.; Silva, J.G.; Rocha, N.B.; Yuan, T.F.; Arias-Carrion, O.; Machado, S. Can transcranial direct current stimulation improve the resistance strength and decrease the rating perceived scale in recreational weight-training experience? J. Strength Cond. Res. 2016, 30, 3381–3387. [Google Scholar] [CrossRef] [Scilit]
  28. Wiethoff, S.; Hamada, M.; Rothwell, J.C. Variability in response to transcranial direct current stimulation of the motor cortex. Brain Stimul. 2014, 7, 468–475. [Google Scholar] [CrossRef] [Scilit] [PubMed]
  29. Fernández-del-Olmo, M.; Sevilla-Sánchez, M.; Sánchez, G.; Kidgell, D.; Milot, M.H.; Selles, R.W.; Rothwell, J.; Hortobagyi, T. Neuromodulation by non-invasive brain stimulation (NIBS): A step back to move forward. Braz. J. Mot. Behav. 2021, 15, 61–64. [Google Scholar] [CrossRef] [Scilit]
  30. Okano, A.H.; Fontes, E.B.; Montenegro, R.A.; Farinatti Pde, T.; Cyrino, E.S.; Li, L.M.; Bikson, M.; Noakes, T.D. Brain stimulation modulates the autonomic nervous system, rating of perceived exertion and performance during maximal exercise. Br. J. Sports Med. 2015, 49, 1213–1218. [Google Scholar] [CrossRef] [Scilit]
  31. Edwards, D.J.; Cortes, M.; Wortman-Jutt, S.; Putrino, D.; Bikson, M.; Thickbroom, G.; Pascual-Leone, A. Transcranial direct current stimulation and sports performance. Front. Hum. Neurosci. 2017, 11, 243. [Google Scholar] [CrossRef] [Scilit]
  32. Garcia-Sillero, M.; Chulvi-Medrano, I.; Maroto-Izquierdo, S.; Bonilla, D.A.; Vargas-Molina, S.; Benitez-Porres, J. Effects of preceding transcranial direct current stimulation on movement velocity and EMG signal during the back squat exercise. J. Clin. Med. 2022, 11, 5220. [Google Scholar] [CrossRef] [Scilit] [PubMed]
  33. Rodrigues, G.M.; de Oliveira, B.R.R.; Jesus Abreu, M.A.; Gomes, F.; Machado, S.; Monteiro, W.; Lattari, E. Anodal transcranial direct current stimulation does not affect velocity loss during a typical resistance exercise session. Res. Q. Exerc. Sport 2023, 94, 444–453. [Google Scholar] [CrossRef] [Scilit]
  34. Crivoi do Carmo, E.; Renfree, A.; Nishimura Vieira, C.Y.; Ferreira, D.D.S.; Truffi, G.A.; Barroso, R. Effects of different goal orientations and virtual opponents performance level on pacing strategy and performance in cycling time trials. Eur. J. Sport. Sci. 2022, 22, 491–498. [Google Scholar] [CrossRef] [Scilit] [PubMed]
  35. Zhiqiang, Z.; Wei, W.; Yunqi, T.; Yu, L. Effects of bilateral extracephalic transcranial direct current stimulation on lower limb kinetics in countermovement jumps. Int. J. Environ. Res. Public Health 2023, 20, 2241. [Google Scholar] [CrossRef] [Scilit] [PubMed]
  36. Luo, J.; Fang, C.; Huang, S.; Wu, J.; Liu, B.; Yu, J.; Xiao, W.; Ren, Z. Effects of single session transcranial direct current stimulation on aerobic performance and one arm pull-down explosive force of professional rock climbers. Front. Physiol. 2023, 14, 1153900. [Google Scholar] [CrossRef] [Scilit] [PubMed]
  37. Mesquita, P.H.C.; Lage, G.M.; Franchini, E.; Romano-Silva, M.A.; Albuquerque, M.R. Bi-hemispheric anodal transcranial direct current stimulation worsens taekwondo-related performance. Hum. Mov. Sci. 2019, 66, 578–586. [Google Scholar] [CrossRef] [Scilit]
  38. Park, S.B.; Han, D.H.; Hong, J.; Lee, J.W. Transcranial direct current stimulation of motor cortex enhances spike performances of professional female volleyball players. J. Mot. Behav. 2023, 55, 18–30. [Google Scholar] [CrossRef] [Scilit]
  39. Sasada, S.; Endoh, T.; Ishii, T.; Komiyama, T. Polarity-dependent improvement of maximal-effort sprint cycling performance by direct current stimulation of the central nervous system. Neurosci. Lett. 2017, 657, 97–101. [Google Scholar] [CrossRef] [Scilit]
  40. Bastani, A.; Jaberzadeh, S. a-tDCS differential modulation of corticospinal excitability: The effects of electrode size. Brain Stimul. 2013, 6, 932–937. [Google Scholar] [CrossRef] [Scilit]
  41. Baharlouei, H.; Goosheh, M.; Moore, M.; Ramezani Ahmadi, A.H.; Yassin, M.; Jaberzadeh, S. The effect of transcranial direct current stimulation on rating of perceived exertion: A systematic review of the literature. Psychophysiology 2024, 61, e14520. [Google Scholar] [CrossRef] [Scilit]
  42. Berchicci, M.; Menotti, F.; Macaluso, A.; Di Russo, F. The neurophysiology of central and peripheral fatigue during sub-maximal lower limb isometric contractions. Front. Hum. Neurosci. 2013, 7, 135. [Google Scholar] [CrossRef] [Scilit] [PubMed]
  43. Sharples, S.A.; Gould, J.A.; Vandenberk, M.S.; Kalmar, J.M. Cortical mechanisms of central fatigue and sense of effort. PLoS ONE 2016, 11, e0149026. [Google Scholar] [CrossRef] [Scilit]
  44. Decorte, N.; Lafaix, P.A.; Millet, G.Y.; Wuyam, B.; Verges, S. Central and peripheral fatigue kinetics during exhaustive constant-load cycling. Scand. J. Med. Sci. Sports 2012, 22, 381–391. [Google Scholar] [CrossRef] [Scilit]
  45. Mueller, S.; Wang, D.; Fox, M.D.; Yeo, B.T.; Sepulcre, J.; Sabuncu, M.R.; Shafee, R.; Lu, J.; Liu, H. Individual variability in functional connectivity architecture of the human brain. Neuron 2013, 77, 586–595. [Google Scholar] [CrossRef] [Scilit] [PubMed]
  46. Alexander-Bloch, A.; Giedd, J.N.; Bullmore, E. Imaging structural co-variance between human brain regions. Nat. Rev. Neurosci. 2013, 14, 322–336. [Google Scholar] [CrossRef] [Scilit]
  47. Rademacher, J.; Burgel, U.; Geyer, S.; Schormann, T.; Schleicher, A.; Freund, H.J.; Zilles, K. Variability and asymmetry in the human precentral motor system. A cytoarchitectonic and myeloarchitectonic brain mapping study. Brain 2001, 124, 2232–2258. [Google Scholar] [CrossRef] [Scilit]
  48. Myer, G.D.; Kushner, A.M.; Brent, J.L.; Schoenfeld, B.J.; Hugentobler, J.; Lloyd, R.S.; Vermeil, A.; Chu, D.A.; Harbin, J.; McGill, S.M. The back squat: A proposed assessment of functional deficits and technical factors that limit performance. Strength Cond. J. 2014, 36, 4–27. [Google Scholar] [CrossRef] [Scilit] [PubMed]
Figure 1. Overview of the study protocol.
Applsci 16 02231 g001
Figure 2. Schematic diagram of electrode placement. A: anode; C: cathode; DLPFC: dorsolateral prefrontal cortex; M1: primary motor cortex.
Applsci 16 02231 g002
Figure 3. Total number of repetitions performed under each stimulation condition: (A) entire sample (n = 15) and (B) exploratory subgroup (n = 13). Bars show mean values; error bars denote 95% within-subject confidence intervals (Cousineau–Morey method); dots represent individual participants. * p < 0.05 vs. SHAM. DLPFC: dorsolateral prefrontal cortex; M1: primary motor cortex.
Applsci 16 02231 g003
Figure 4. Maximum lifting velocity under each stimulation condition. (A) Results for the entire sample (n = 15) and (B) for the exploratory subgroup (n = 13). Bars show mean values; error bars denote 95% within-subject confidence intervals (Cousineau–Morey method); dots represent individual participants. DLPFC: dorsolateral prefrontal cortex; M1: primary motor cortex.
Applsci 16 02231 g004
Table 1. Comparison of the one-repetition maximum between the different experimental conditions (n = 15).
ConditionsReliability Analysis
SHAMM1DLPFCICC (95% CI)ANOVA
95.8 ± 19.3 kg93.1 ± 18.8 kg93.5 ± 17.0 kg0.93 (0.84; 0.97)p = 0.908
ICC: intraclass correlation coefficient; CI: confidence interval; SHAM: placebo stimulus; M1: primary motor cortex; DLPFC: dorsolateral prefrontal cortex.
Table 2. Values for total number of repetitions and lifting velocity.
Number of Repetitions Per SetSet-1Set-2Set-3Set-4Set-5
Total (n = 15)
SHAM7 ± 3.16 ± 2.17 ± 2.87 ± 2.67 ± 2.2
DLPFC9 ± 3.28 ± 2.78 ± 3.47 ± 2.17 ± 2.6
M18 ± 3.28 ± 2.57 ± 2.47 ± 2.88 ± 2.9
Exploratory subgroup (n = 13)
SHAM7 ± 2.96 ± 2.06 ± 2.67 ± 2.76 ± 2.2
DLPFC10 ± 2.67 ± 2.78 ± 3.67 ± 2.27 ± 2.7
M19 ± 2.69 ± 2.47 ± 2.08 ± 2.78 ± 2.9
Mean VelocitySet-1Set-2Set-3Set-4Set-5
Total (n = 15)
SHAM0.59 ± 0.040.59 ± 0.050.58 ± 0.050.57 ± 0.060.56 ± 0.06
DLPFC0.58 ± 0.050.57 ± 0.050.57 ± 0.050.56 ± 0.050.56 ± 0.06
M10.60 ± 0.060.59 ± 0.070.59 ± 0.060.58 ± 0.070.58 ± 0.06
Exploratory subgroup (n = 13)
SHAM0.58 ± 0.040.58 ± 0.050.57 ± 0.050.56 ± 0.060.56 ± 0.06
DLPFC0.58 ± 0.050.57 ± 0.050.57 ± 0.060.56 ± 0.050.57 ± 0.06
M10.61 ± 0.060.59 ± 0.070.59 ± 0.070.59 ± 0.070.59 ± 0.05
SHAM: placebo stimulus; M1: primary motor cortex; DLPFC: dorsolateral prefrontal cortex.
Disclaimer/Publisher’s Note: The statements, opinions and data contained in all publications are solely those of the individual author(s) and contributor(s) and not of MDPI and/or the editor(s). MDPI and/or the editor(s) disclaim responsibility for any injury to people or property resulting from any ideas, methods, instructions or products referred to in the content.