1. Introduction
Recent advances in wearable sensors are driving a revolution in biomedicine, enhancing the precision and convenience of health management through the real-time, continuous monitoring of human physiological or behavioral characteristics [
1,
2,
3]. Among various sensing principles, piezoresistive pressure sensors utilize materials whose resistivity changes with applied pressure as sensitive elements. These sensors feature a simple structure, high sensitivity, and a long service life [
4,
5]. Consequently, they are widely applied in motion monitoring [
6], electronic skin [
7], and human–machine interaction [
8].
In general, the performance of flexible piezoresistive pressure sensors depends on the selection of their fabrication materials. Compared to metal and metal oxide materials, which often suffer from brittleness, rigidity, low sensitivity, and poor biocompatibility [
9], piezoresistive conductive polymer-based composites offer significant advantages in manufacturing. Concurrently, these composites exhibit favorable characteristics such as excellent stretchability, compressibility, and dynamic response [
10,
11], rendering them highly suitable for complex applications on the human skin surface, which is characterized by highly nonlinear deformation. Consequently, they have garnered extensive research attention in recent years. The sensitive layer of a flexible piezoresistive pressure sensor is typically composed of a composite of conductive materials and a flexible matrix. The conductive materials primarily include metal nanowires [
12], reduced graphene oxide (RGO) [
13], carbon nanotubes (CNTs) [
14], and two-dimensional transition metal carbides/nitrides (MXenes) [
15]. Among these, carbon-based nanomaterials, including carbon black and, notably, carbon nanotubes, have emerged as highly promising conductive fillers due to their exceptional mechanical and electrical performance [
16,
17].
Bharti [
18] investigated polylactic acid (PLA) nanocomposites with varying mass fractions of carbon nanotubes (CNTs) and confirmed that the incorporation of CNTs can effectively improve the mechanical properties of the material. Shirodkar et al. [
19] evaluated the electromechanical response of MWCNTs/PDMS and investigated the effects of adding ammonium perchlorate (AP) and conductive aluminum particles. Yildiz et al. [
20] characterized the mechanical properties of polyetherimide (PEI) containing different mass fractions of carbon nanotubes and discussed the corresponding printing parameters and testing protocols. Huang et al. [
21] successfully developed a piezoresistive strain sensor based on MWCNTs/PDMS composites that combined high flexibility with ultra-sensitivity. He et al. [
22] fabricated a wearable sensor using dual conductive fillers of CNTs and graphene (GR), showcasing its broad application prospects in smart wearable devices. Numerous studies have confirmed that CNT-based sensors possess excellent performance and demonstrate significant application potential in wearable fields such as human motion monitoring and environmental perception [
23,
24]. Therefore, as a cutting-edge functional material, carbon nanotubes continue to hold substantial research value.
To fully leverage the advantages of composite materials, researchers have developed various fabrication processes suitable for flexible sensors [
25,
26,
27]. Among these, 3D printing is a manufacturing method that constructs physical objects directly from computer models through layer-by-layer material accumulation. It features low equipment costs, rapid prototyping, and design flexibility [
28], demonstrating unparalleled advantages over traditional methods, particularly in the fabrication of personalized and customized structures [
29,
30]. Rafiee et al. [
31] utilized the Taguchi method to investigate the effects of nanotube dispersion state, mass fraction, and infill pattern on the tensile properties of 3D-printed nanocomposites. Koukouviti et al. [
32] successfully fabricated an electrochemical sensor based on biological conductive filaments doped with metal nanoparticles using 3D printing technology. Similarly, Silva et al. [
33] developed a polylactic acid (PLA) composite composed of reduced graphene oxide (RGO) and carbon black (CB), which was also fabricated into an electrochemical sensor via 3D printing to evaluate its performance. These studies collectively confirm the high feasibility and application potential of 3D printing technology in the fabrication of flexible sensors.
Composites using MWCNTs as conductive fillers typically exhibit significant shear-thinning behavior during extrusion 3D printing, a characteristic that ensures smooth material extrusion through the nozzle. However, once deposited onto the substrate, the material is required to rapidly recover high viscosity and possess sufficient structural strength to resist flow and collapse caused by gravity, thereby maintaining the morphological stability of the filaments. This ability is generally closely related to the complex modulus and the sol–gel transition characteristics of the material. Based on these rheological considerations, this study first performed systematic rheological characterization of the 1–4 wt% MWCNTs/PDMS composites, providing a feasible prerequisite for further exploration of printing process parameters. Simultaneously, the effects of process parameters such as printing speed and nozzle height on the forming quality were systematically investigated for composites with different MWCNTs mass fractions, aiming to identify a reasonable printing window and determine stable printing parameters suitable for each composition. On this basis, leveraging the excellent performance and application potential of the composite, corresponding sensor devices were fabricated. Their sensing performance was evaluated through tensile tests, and the influence of different MWCNTs mass fractions on sensor properties was systematically analyzed. Finally, three sets of experiments (palm gesture recognition and gripping tests, elbow joint motion monitoring, and continuous pressure monitoring) were conducted to verify the feasibility of the fabricated sensors in human motion monitoring, providing an experimental foundation for their further practical application.
2. Materials and Methods
2.1. Materials
Polydimethylsiloxane (PDMS, Sylgard 184), consisting of an elastomer base and a curing agent, was purchased from Dow Corning (Midland, MI, USA). MWCNTs (diameter: 3–15 nm, length: 15–30 μm) were obtained from Suiheng Graphene Technology Co., Ltd. (Shenzhen, China).
2.2. Material Configuration Method
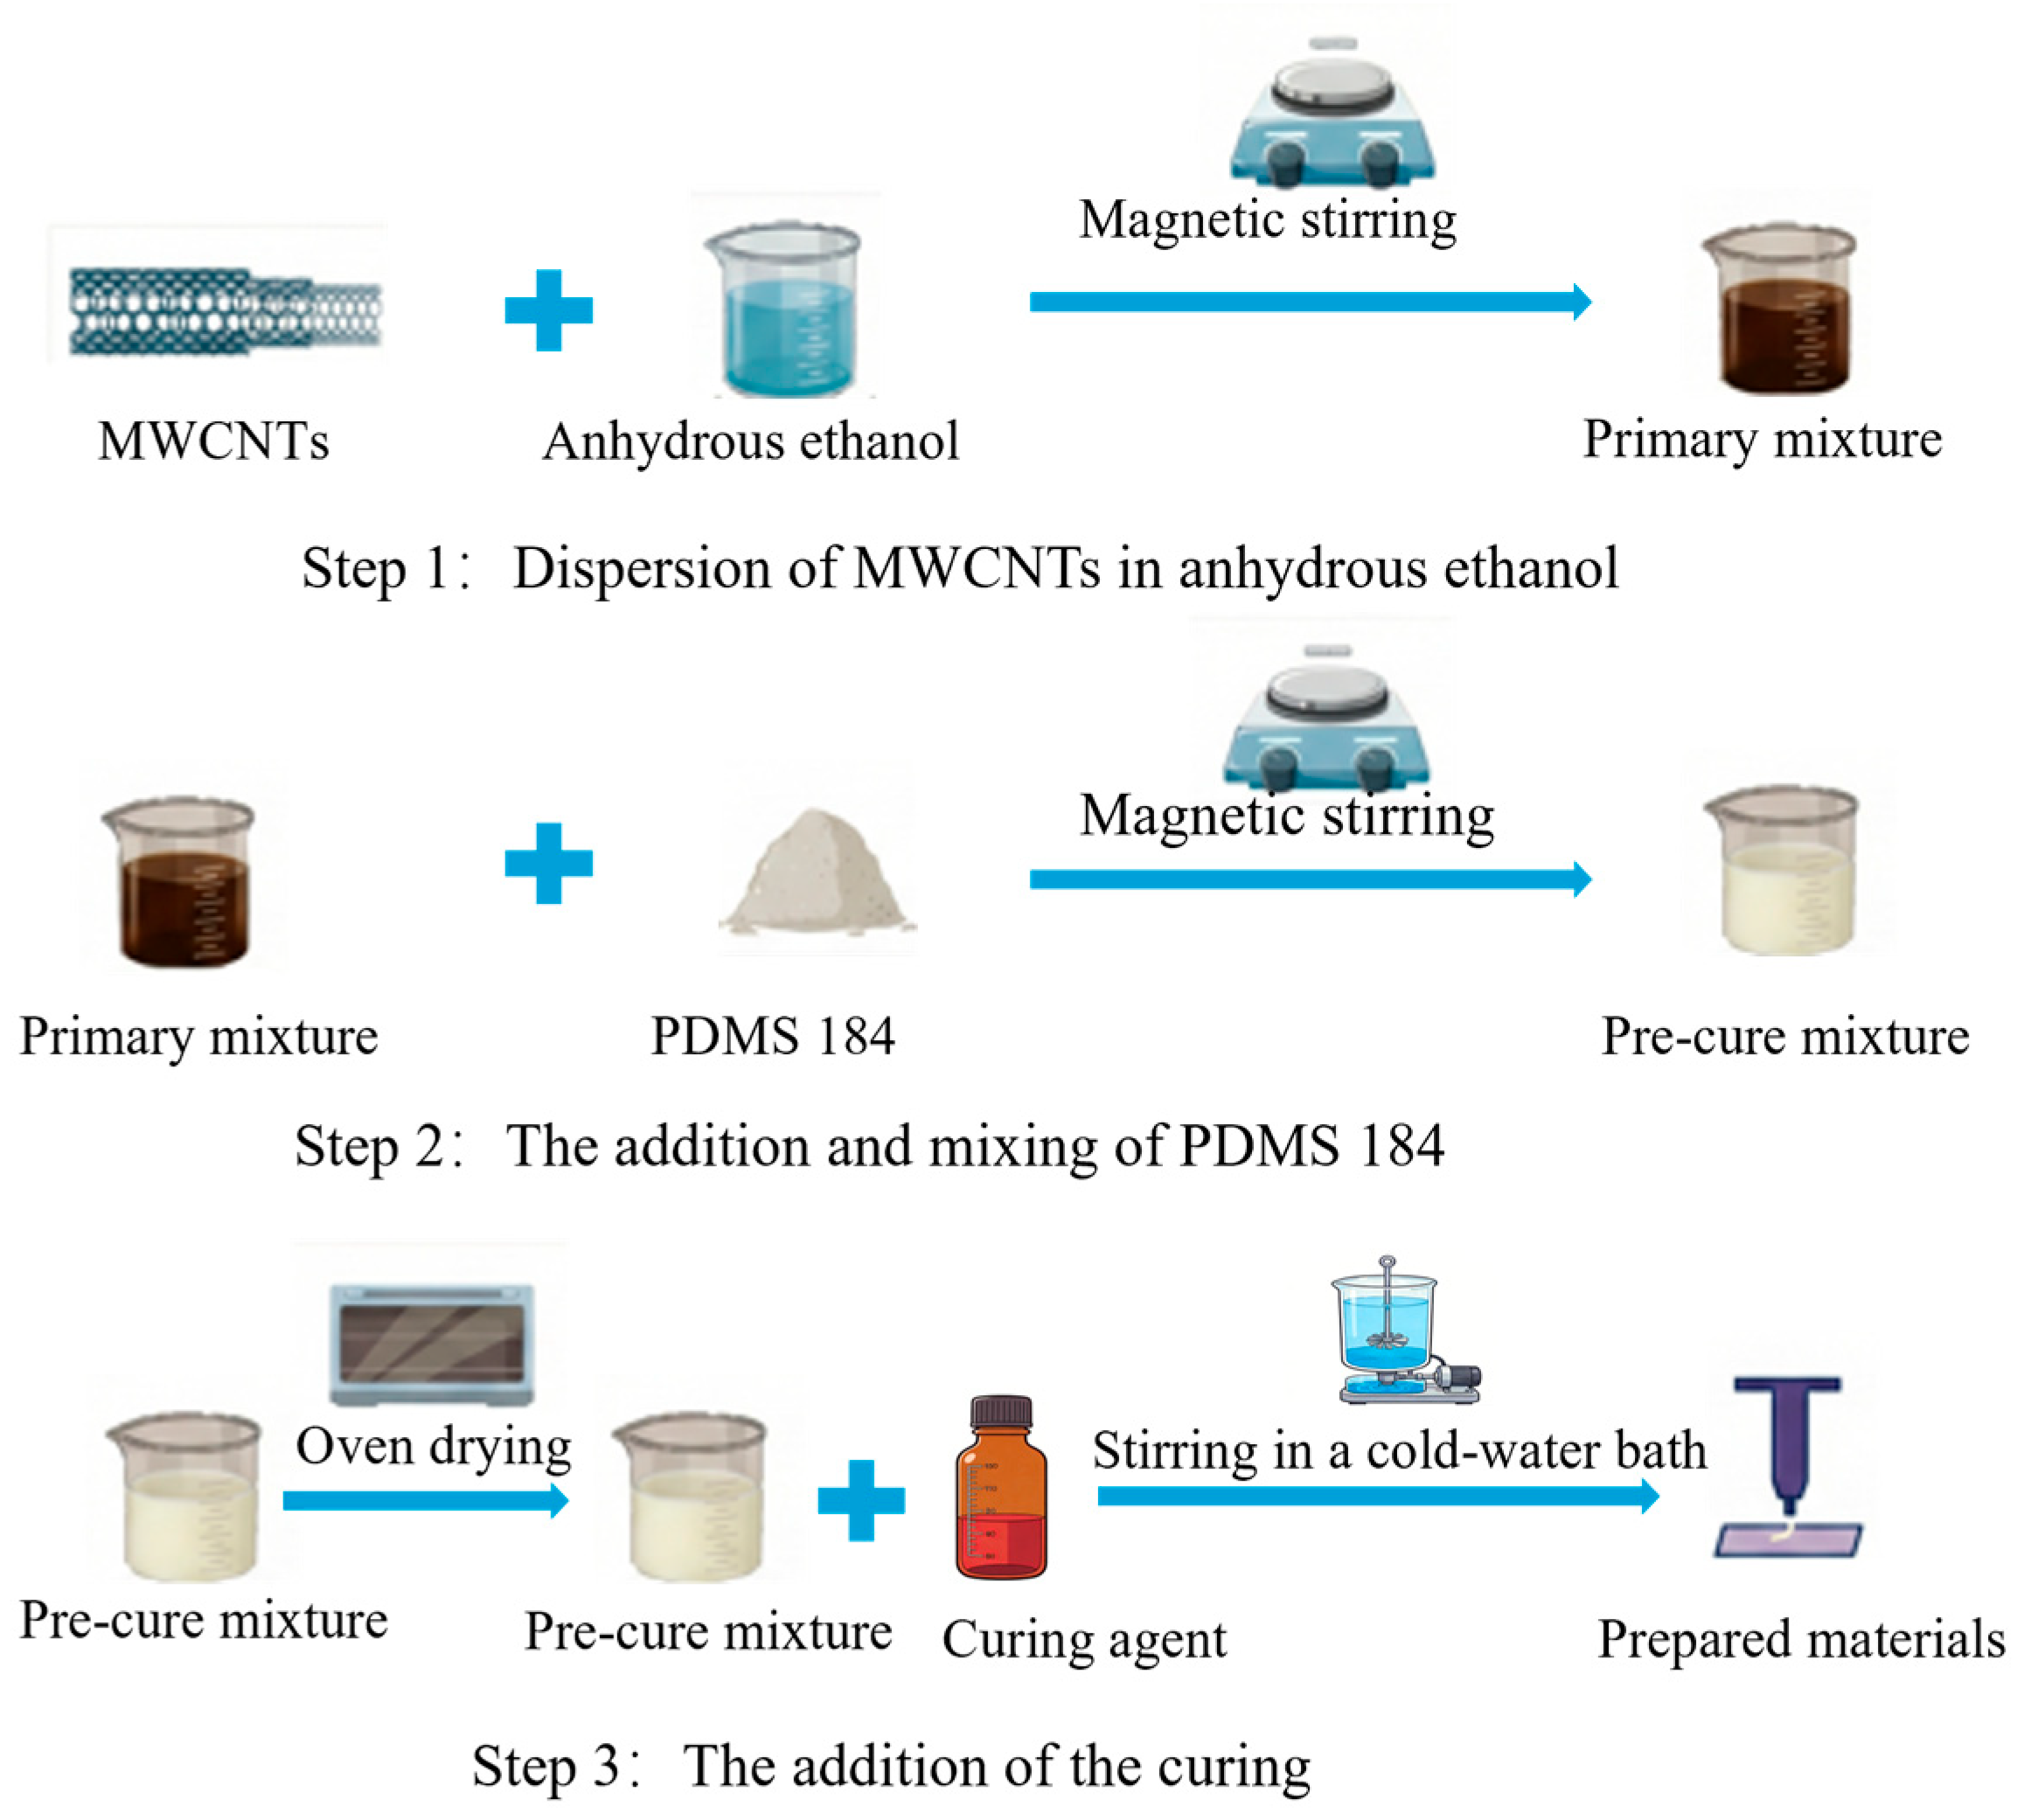
Four types of composite materials with different MWCNTs mass fractions (1 wt%, 2 wt%, 3 wt%, and 4 wt%) were prepared, the mass fraction of MWCNTs is defined as the percentage of the mass of MWCNTs relative to the total mass of the MWCNTs, the PDMS 184, and its curing agent. The preparation process is illustrated in
Figure 1, and the specific steps were as follows: Initially, MWCNTs were mixed with anhydrous ethanol at a mass ratio of 1:60 and magnetically stirred at 600 rpm for 30 min to obtain the initial mixture. Subsequently, PDMS 184 was added, followed by another 15 min of magnetic stirring at the same speed to ensure thorough integration with the MWCNTs. The resulting mixture was heated in an oven at 80 °C until the ethanol had completely evaporated. After cooling to room temperature, the curing agent was added to the mixture at a mass ratio of 10:1 (PDMS matrix to curing agent), and the blend was stirred in a cold-water bath for 15 min to ensure uniform dispersion. All experiments were conducted at a controlled room temperature of 25 °C, a DF-101SZ collector-type thermostatic heating magnetic stirrer (Shanghai, China) was employed for the stirring processes.
2.3. Rheological Characterization
Prior to 3D printing, rheological characterization of the materials was conducted to evaluate their printability. The tests were performed using a rotational rheometer (HAAKE MARS iQ AIR, Thermo Fisher Scientific, Karlsruhe, Germany) at room temperature (25 °C). A parallel-plate geometry with a diameter of 20 mm was employed, with the gap between the plates set at 1 mm. The experimental procedure consisted of two main parts: steady shear tests and complex modulus tests. The steady shear tests were completed in rotation mode, with the shear rate ranging from 0.001/s to 10/s. The complex modulus tests were conducted in oscillation mode, with a fixed oscillation frequency of 1 Hz and a strain amplitude sweep ranging from 0.1% to 100%.
2.4. Investigation of 3D Printing Process Parameters
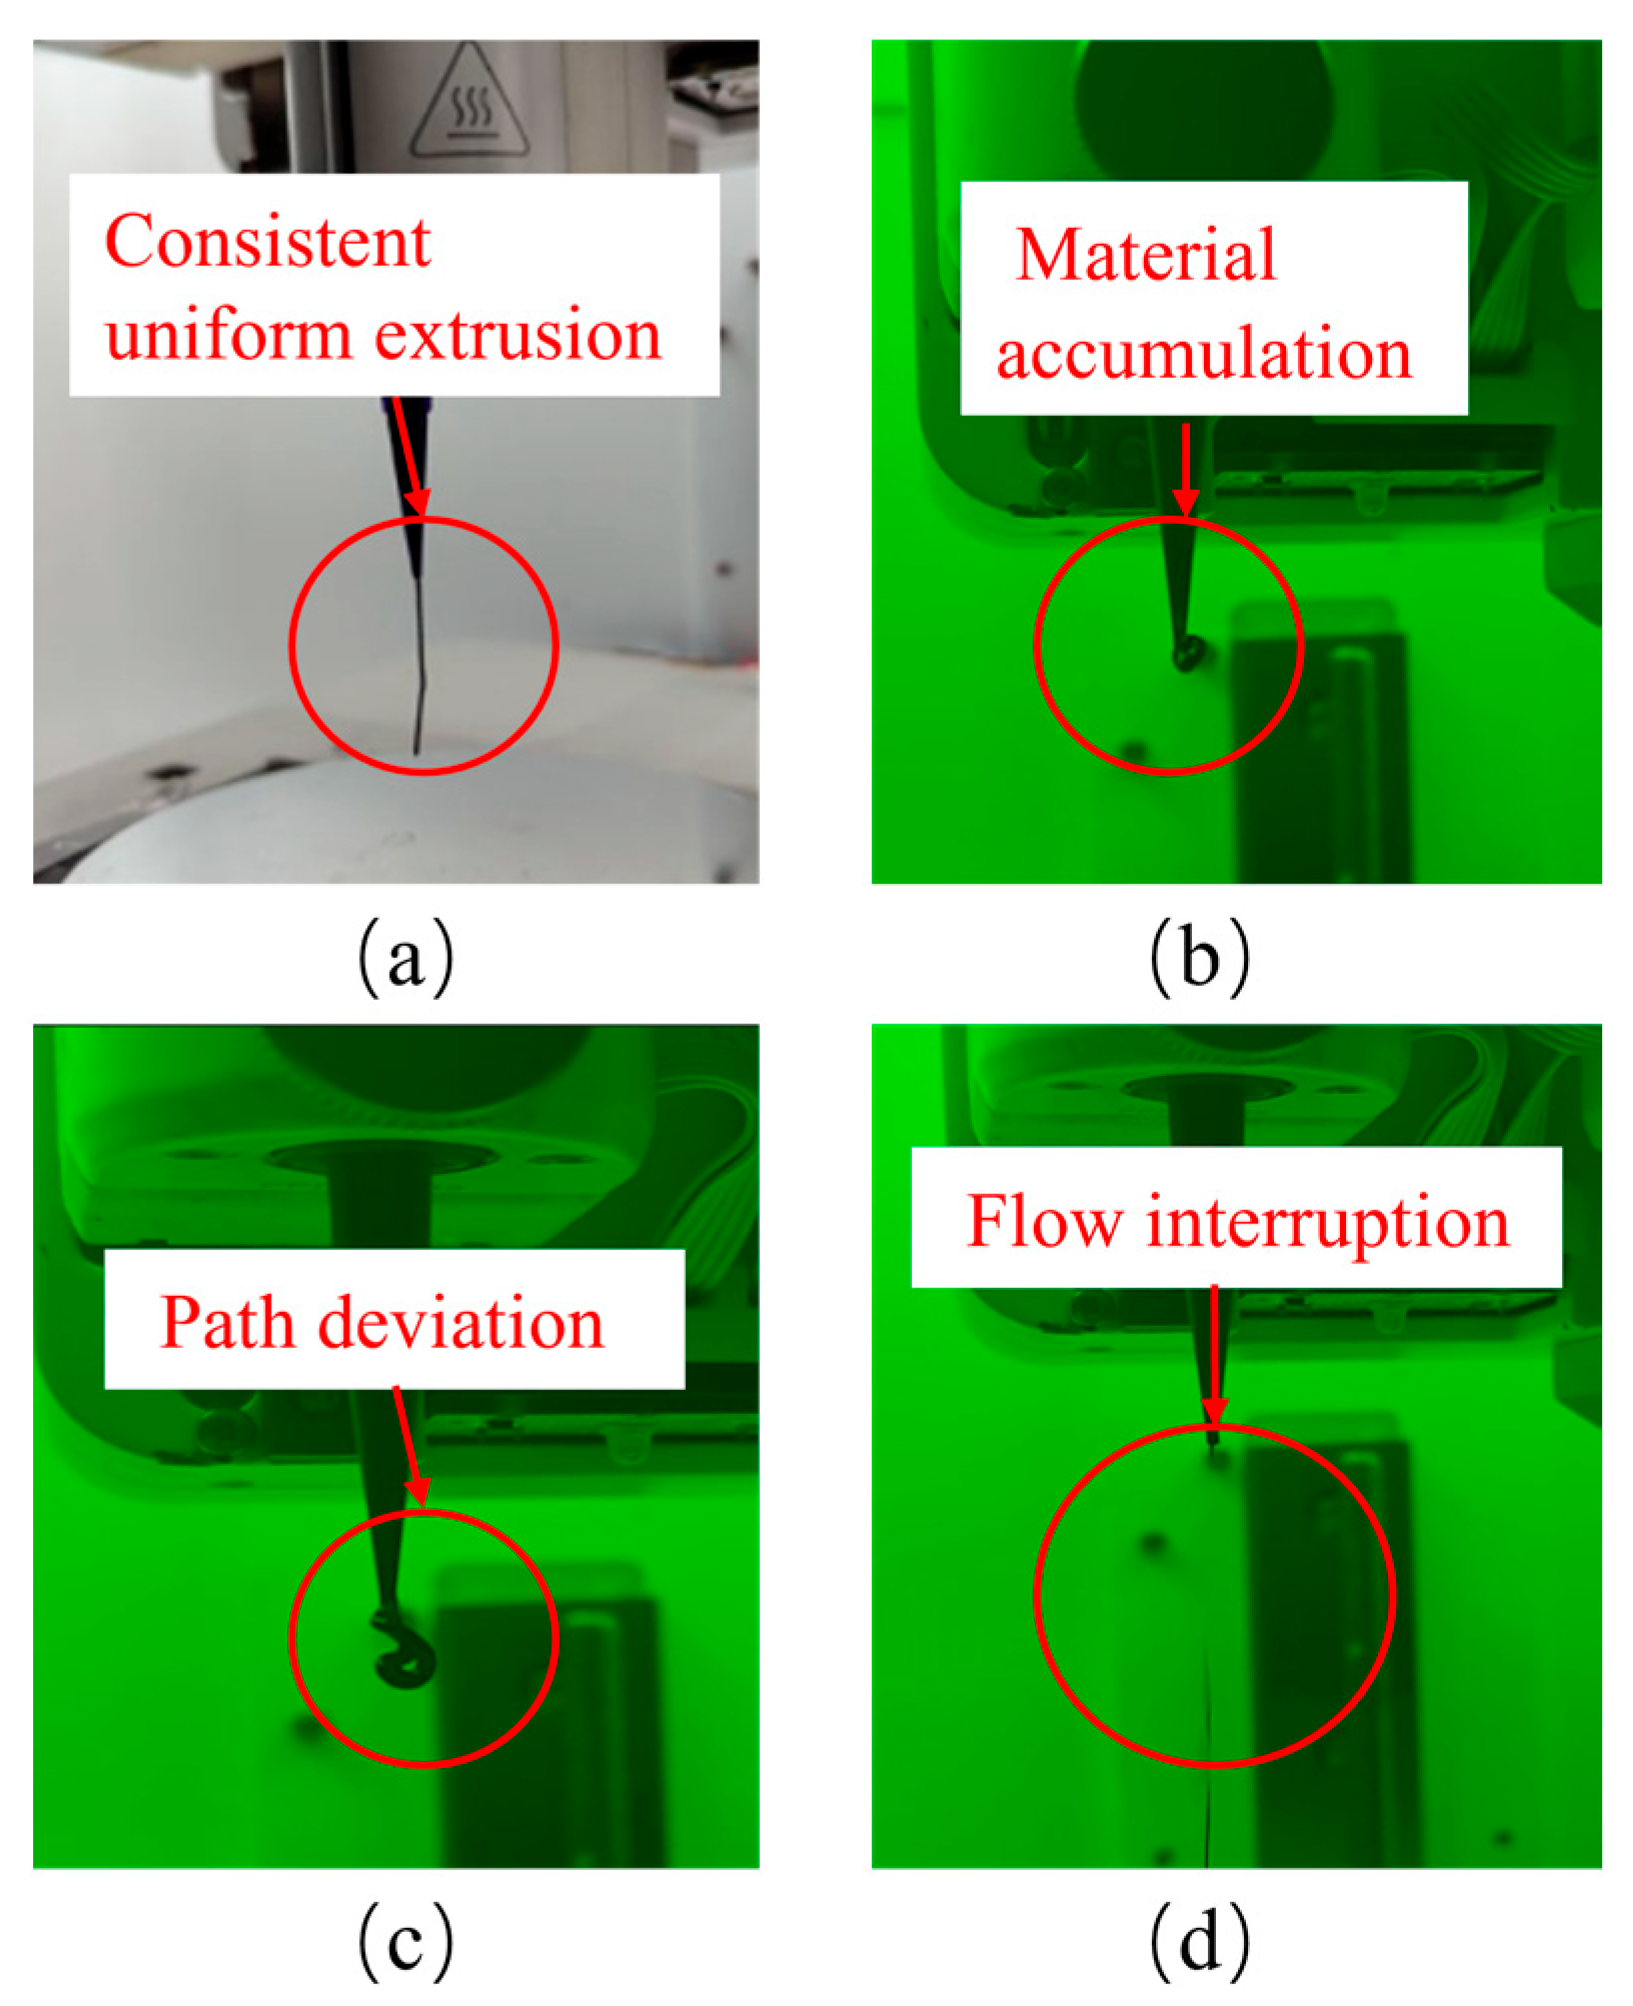
Printing experiments were performed using a Cellink BIO X pneumatic extrusion 3D printing system (Gothenburg, Sweden). During the printing process, the system moves the printhead according to a predetermined trajectory, while the material is concurrently extruded from the nozzle via pneumatic pressure and deposited into shape. Extrusion pressure is critical process parameters that influence the printing quality. To determine the optimal printing conditions, printing characterization experiments were conducted under varying process parameters. A nozzle with a diameter of 0.41 mm was selected, and composite materials with different mass fractions were extruded under incremental pressure to identify the minimum extrusion pressure required for a stable printing state. Four specific states are illustrated in
Figure 2: (a) Consistent uniform extrusion, (b) material accumulation, (c) path deviation, and (d) flow interruption. As shown in
Figure 2a, a stable printing state is defined by satisfying the following criteria simultaneously: no significant shaking of the printhead, and the continuous, uniform extrusion of the composite material from the nozzle without anomalies such as material accumulation, path deviation, or flow interruption.
Based on the determined minimum extrusion pressure required for stable printing, the influence of printing speed on the dimensions of the formed structures was further explored. For composite materials with different ratios, linear structures with a length of 15 mm were printed multiple times at printing speeds of 2, 4, 6, 8, 10, and 12 mm/s, and nozzle heights ranging from 0.2 to 0.7 mm (with an increment of 0.1 mm). After printing, the actual dimensions of the formed structures were measured using a Dino AM7515MZT CCD camera (AnMo Electronics Corporation, Taipei, Taiwan).
2.5. Performance Characterization Methods of Sensor Devices
2.5.1. Tensile Testing
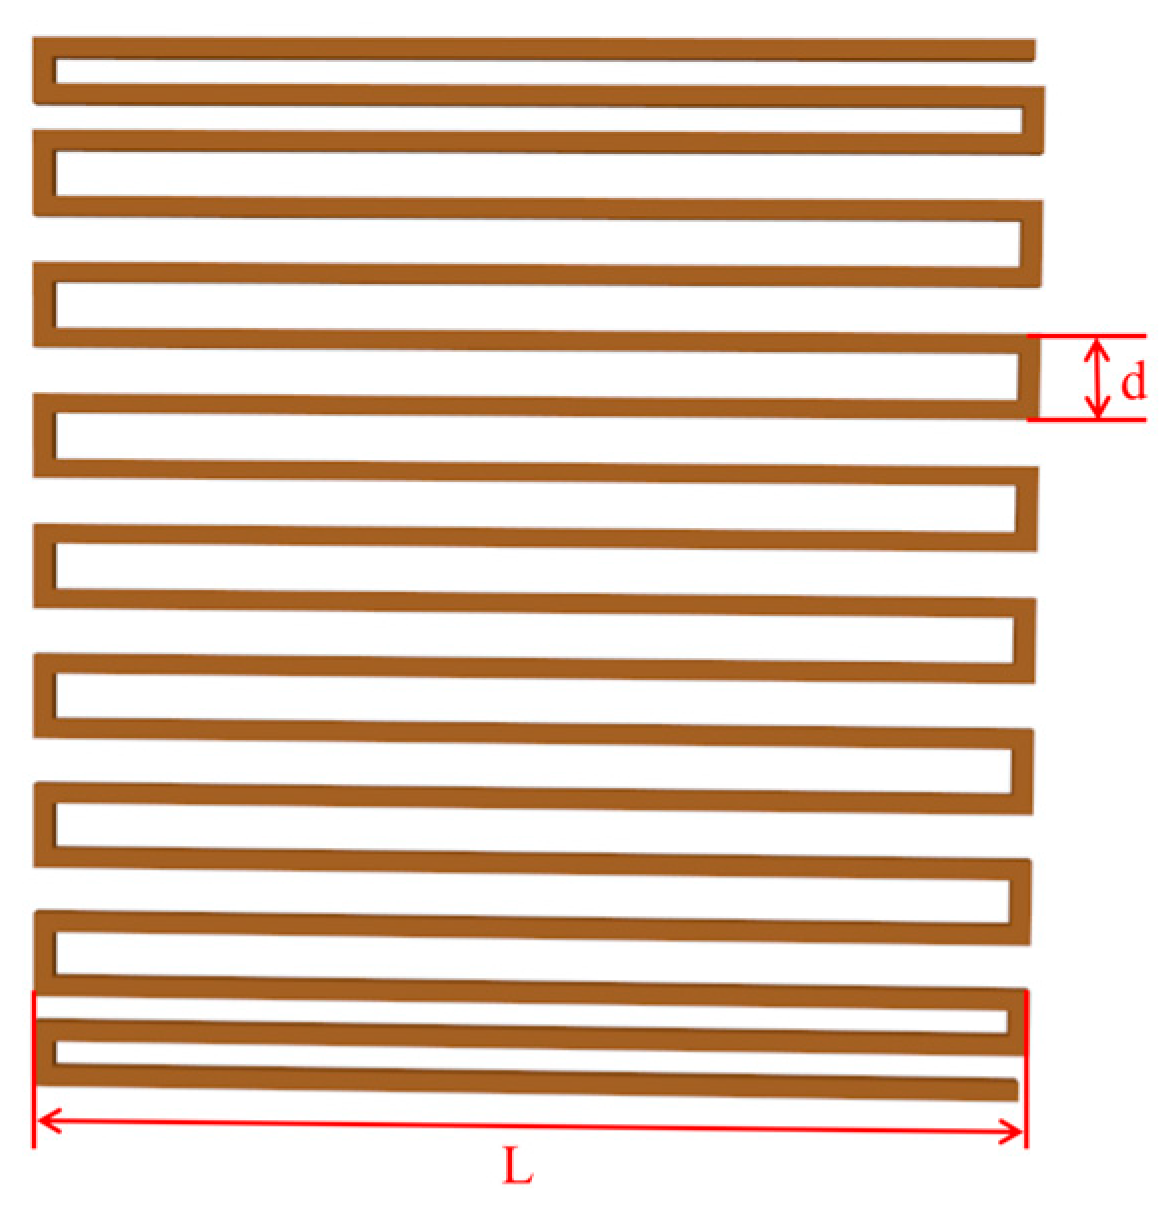
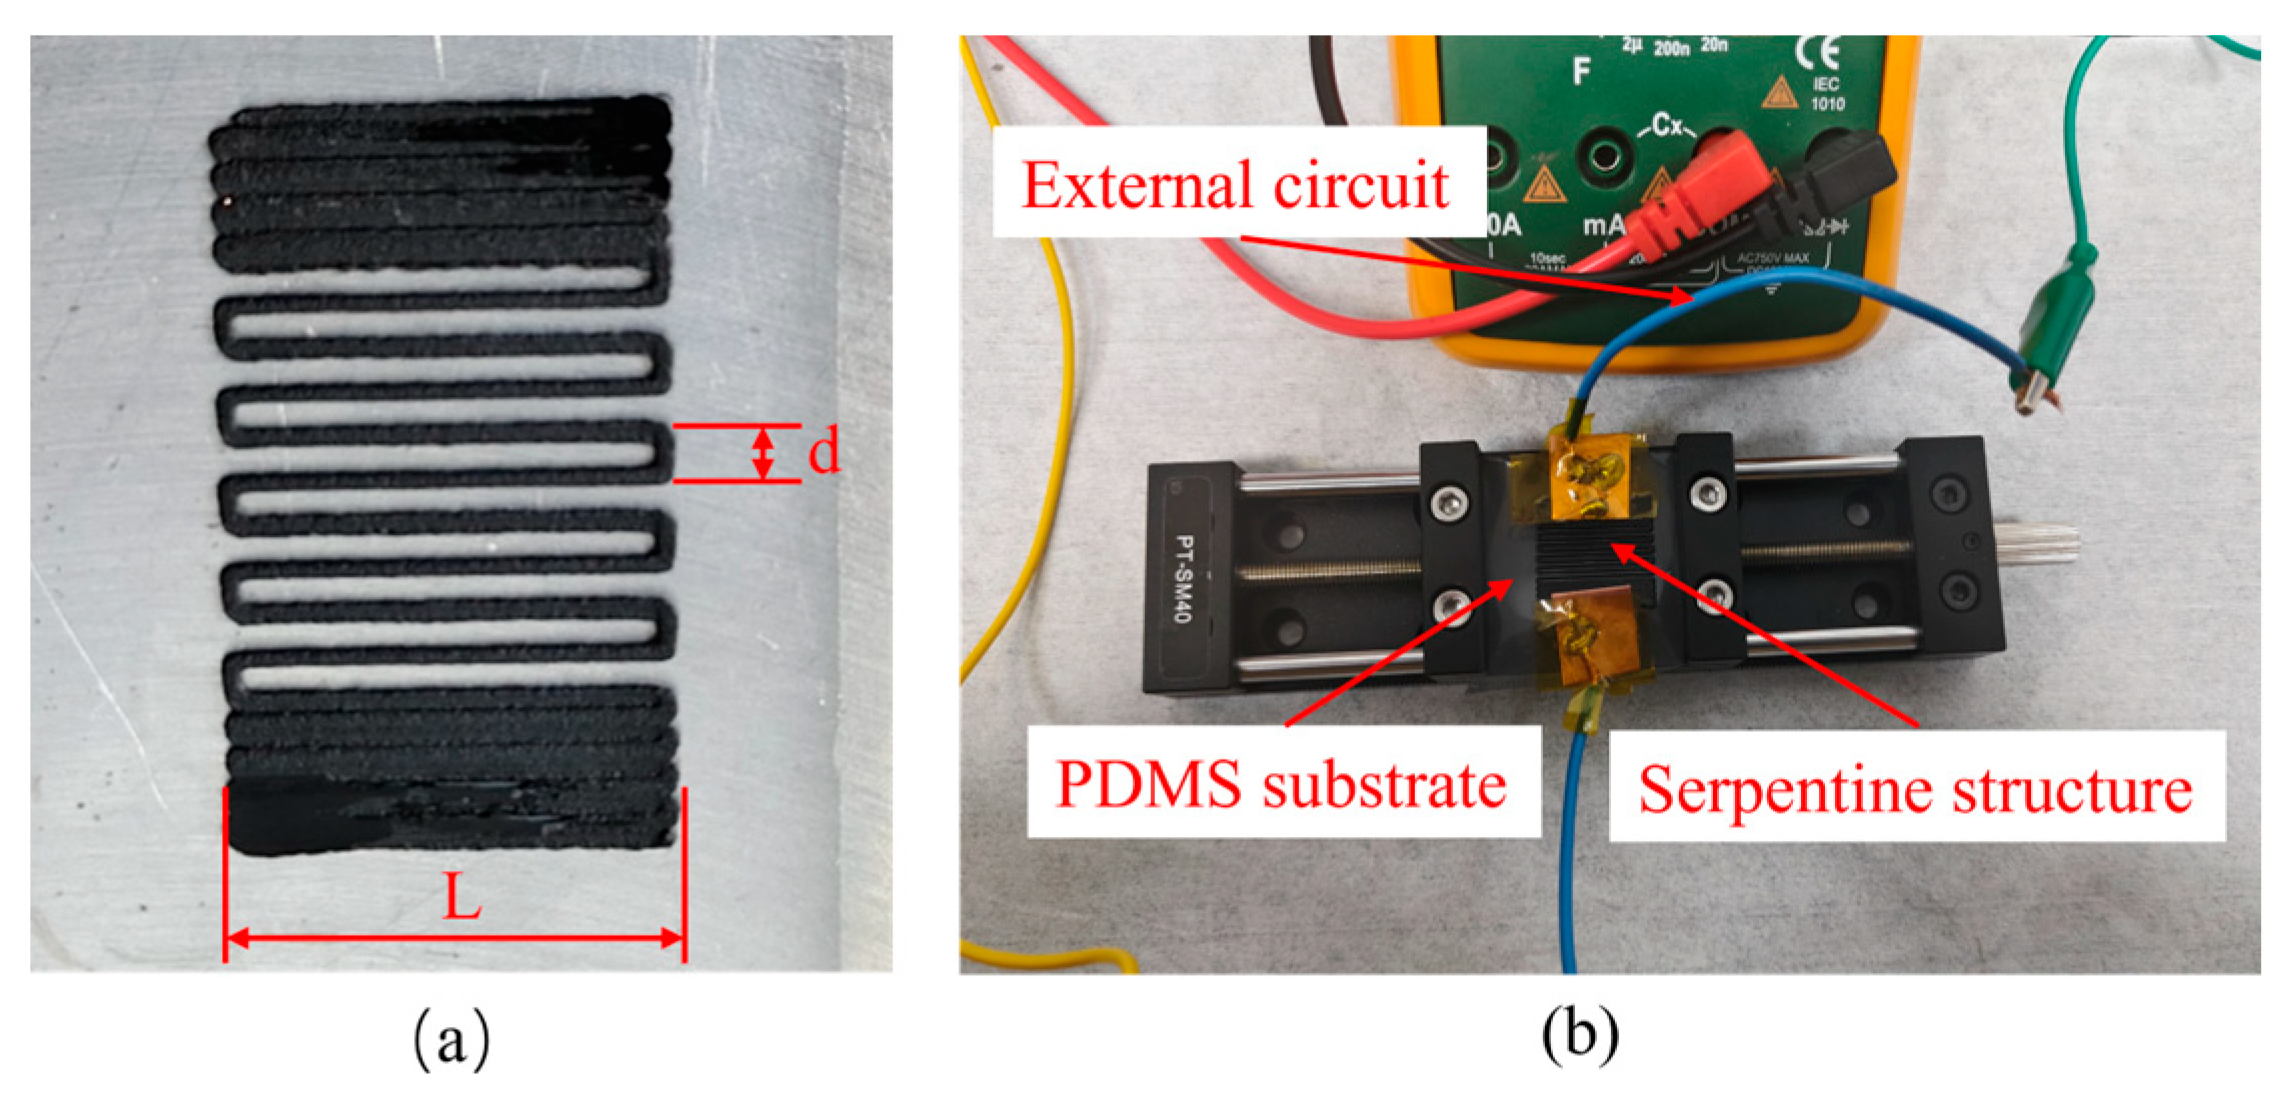
The sensor devices were fabricated using a Cellink BIO X (Cellink AB, Gothenburg, Sweden) pneumatic extrusion 3D printing system. Specifically, a continuous serpentine (S-shaped) structure was printed on a PDMS substrate, as illustrated in
Figure 3, where L and d represent the printing length and printing interval, respectively. To enable connection with external circuits, copper sheets were bonded to both sides of the structure, and conductive wires were soldered onto the copper sheets. The specimens were clamped onto a manual translation stage (PDV, PT-SM40). Incremental displacement was applied to the samples using a manual translation stage to generate corresponding strain, while the resistance variations under different stretching lengths were measured using a multimeter. To address the insulation issue between the printing materials and the manual stage, each sensor device was fabricated on an individual PDMS substrate (dimensions: 40 mm × 40 mm), with a fixed effective gauge length of 34 mm (the length of the PDMS substrate minus the clamped portions). Since the gauge length was constant, the stretching length recorded during the experiment was directly used to characterize the strain. Quasi-static loading was applied via the fine-tuning knob of the manual translation stage, with a brief hold at each target displacement to obtain stable resistance readings. To ensure statistical reliability, five independent experiments were repeated for each test condition.
To conduct the tensile tests, four groups of sensor devices with different parameter combinations were printed. The specific data for each sensor device are summarized in
Table 1.
2.5.2. Wearable Testing
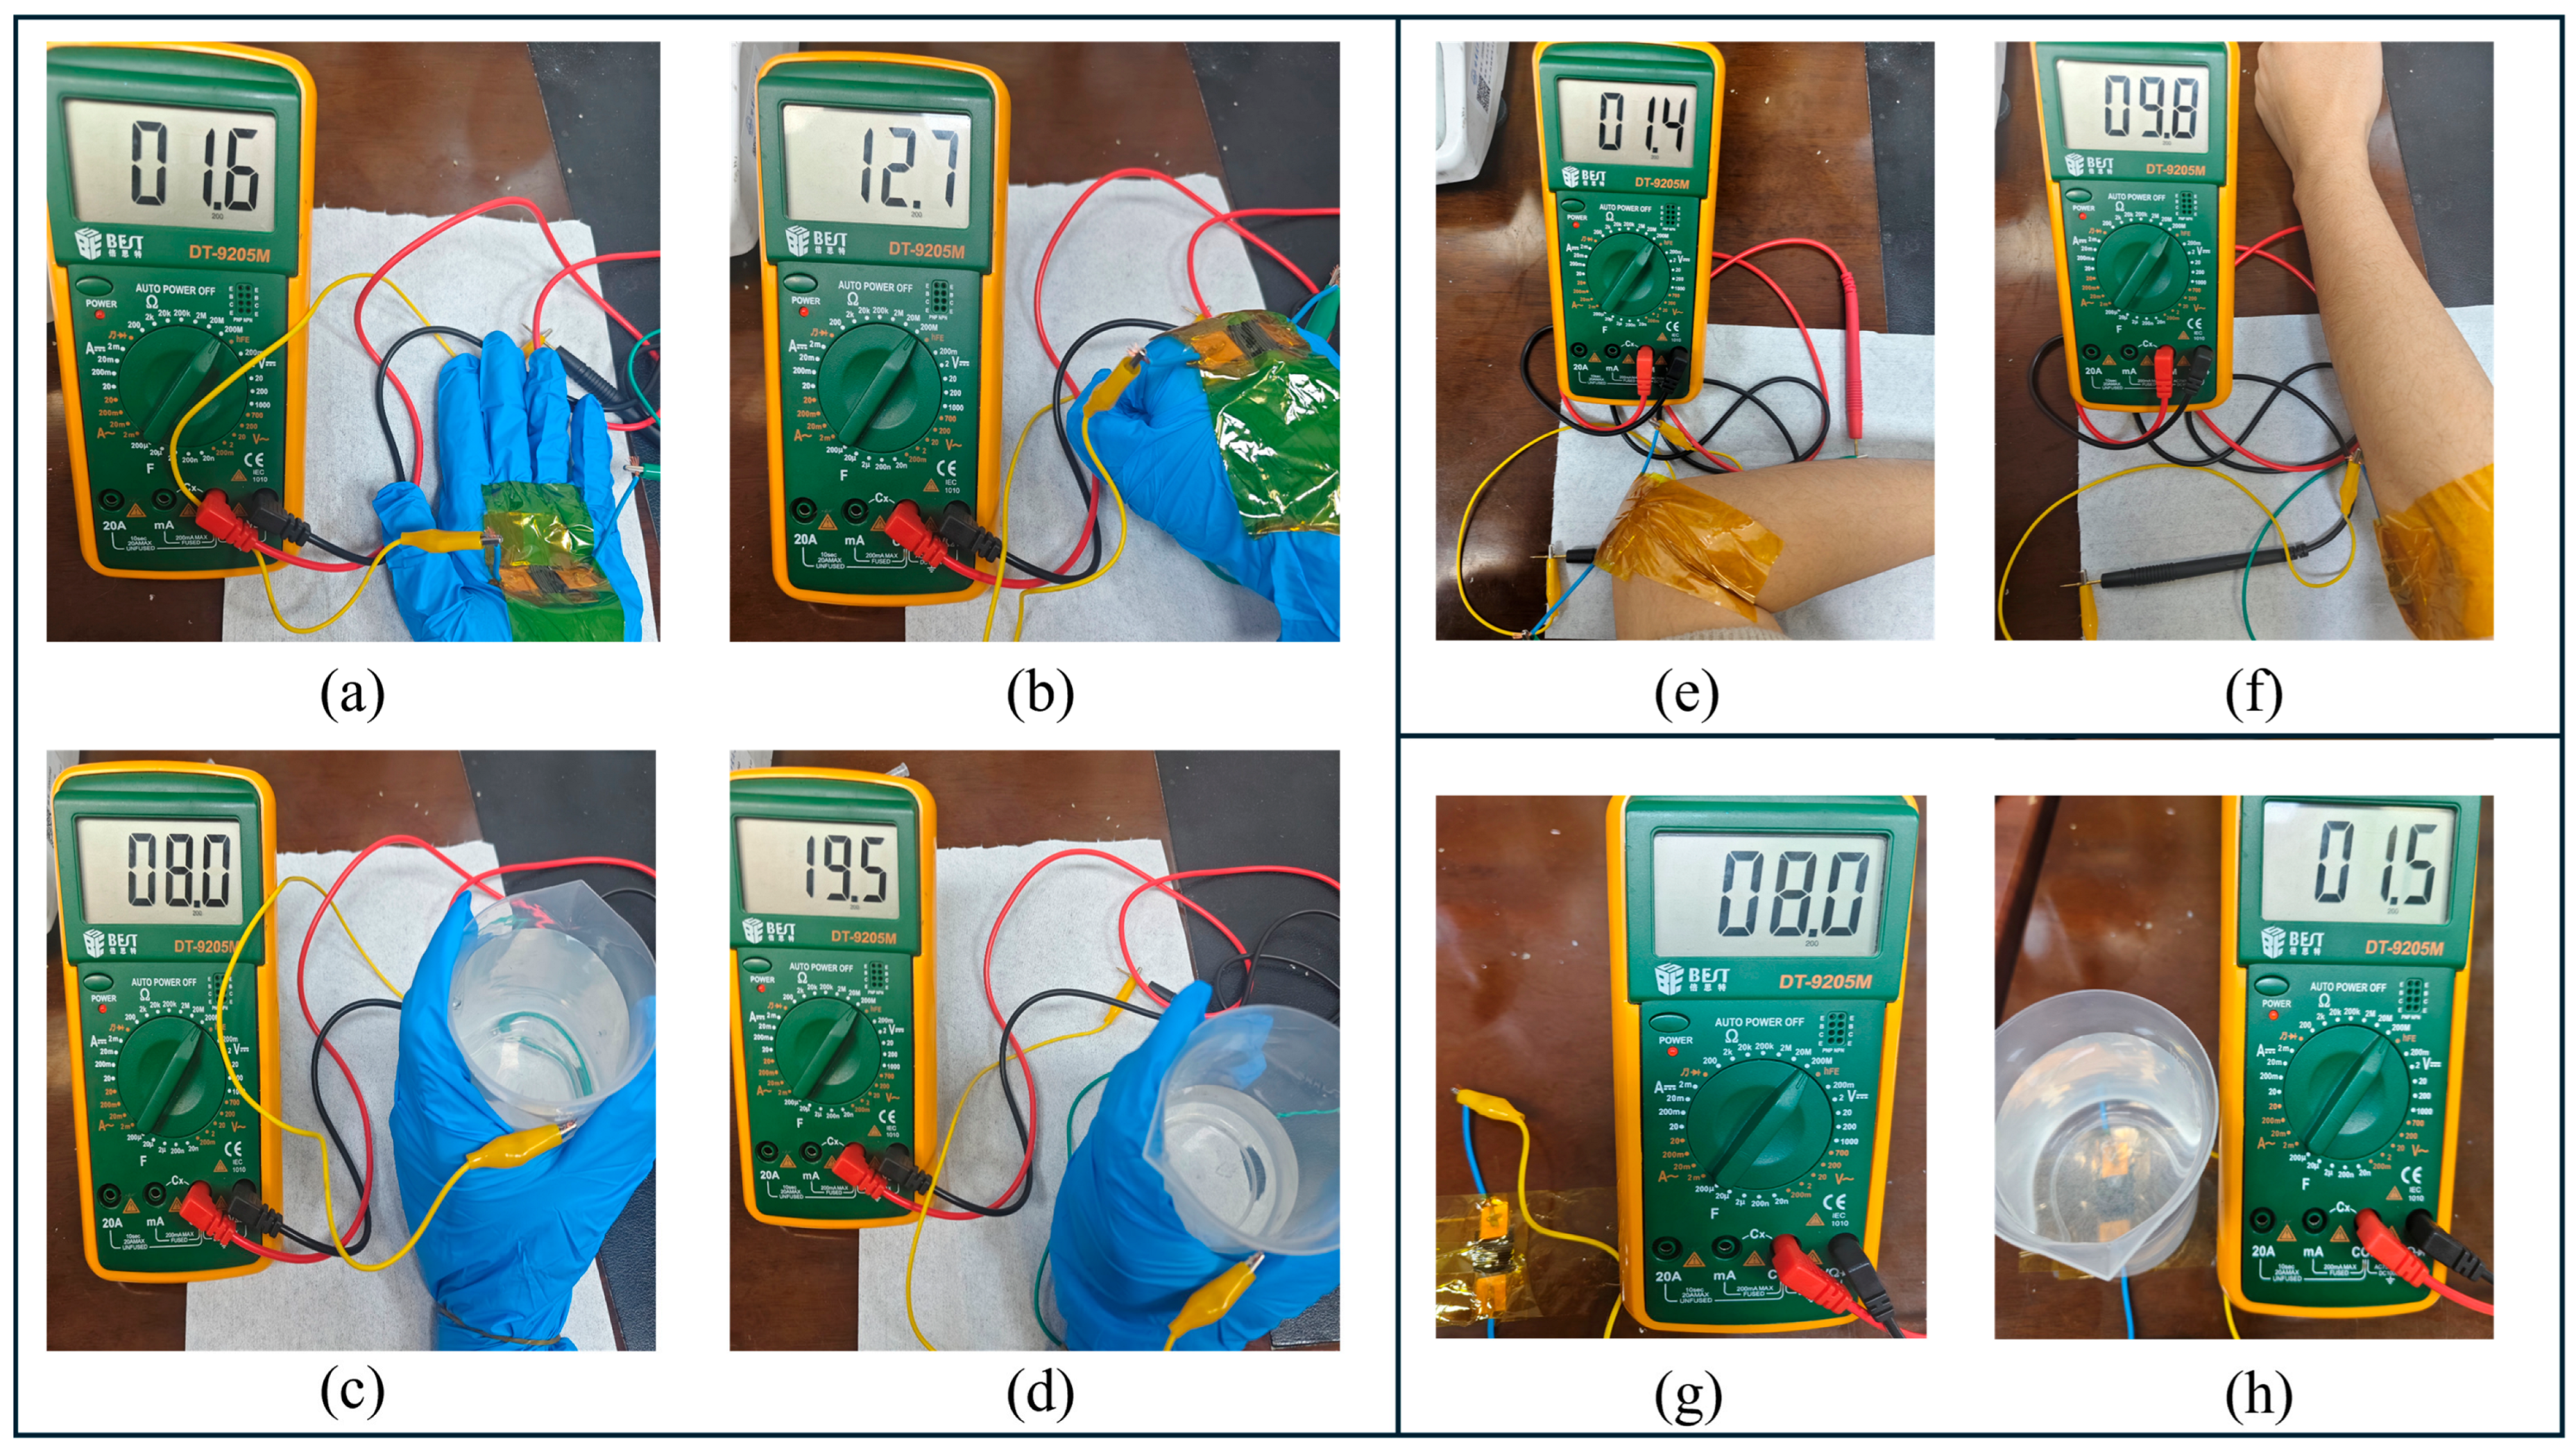
Piezoresistive sensors can distinguish pressure signals of different intensities. To systematically simulate the signal variations of the sensor under real-world conditions, a comprehensive wearable testing scheme was designed, primarily consisting of three experimental scenarios: (1) The first set involved gesture recognition and palm gripping tests. To evaluate the sensor’s ability to differentiate daily pressure levels, the sensor was attached to the primary weight-bearing area of the subject’s dominant hand. Resistance changes were recorded as the subject performed four specific static gestures [
3]: hand fully relaxed, fist clenched, gripping a cup containing 100 mL of water, and gripping a cup containing 250 mL of water. These conditions were designed to simulate two common states of the palm in daily life and the pressure progression from handling lightweight to heavier objects. (2) The second set focused on dynamic joint motion monitoring. To assess the robustness and response performance of the sensor under large strain conditions, the sensor was secured to the subject’s elbow joint using a flexible bandage. Resistance variations were measured during elbow extension–flexion movements [
5], which is crucial for human motion tracking. (3) The third set comprised static load testing [
4]. To measure the sensor’s response to a constant load, the sensor was fixed on a horizontal platform to monitor resistance changes under two states: an unloaded state and while supporting a cup filled with 250 mL of water. This static load test reflects the fundamental sensitivity of the sensor to static pressure changes and its application potential in weight sensing.
3. Results and Discussion
3.1. Analysis of Rheological Properties
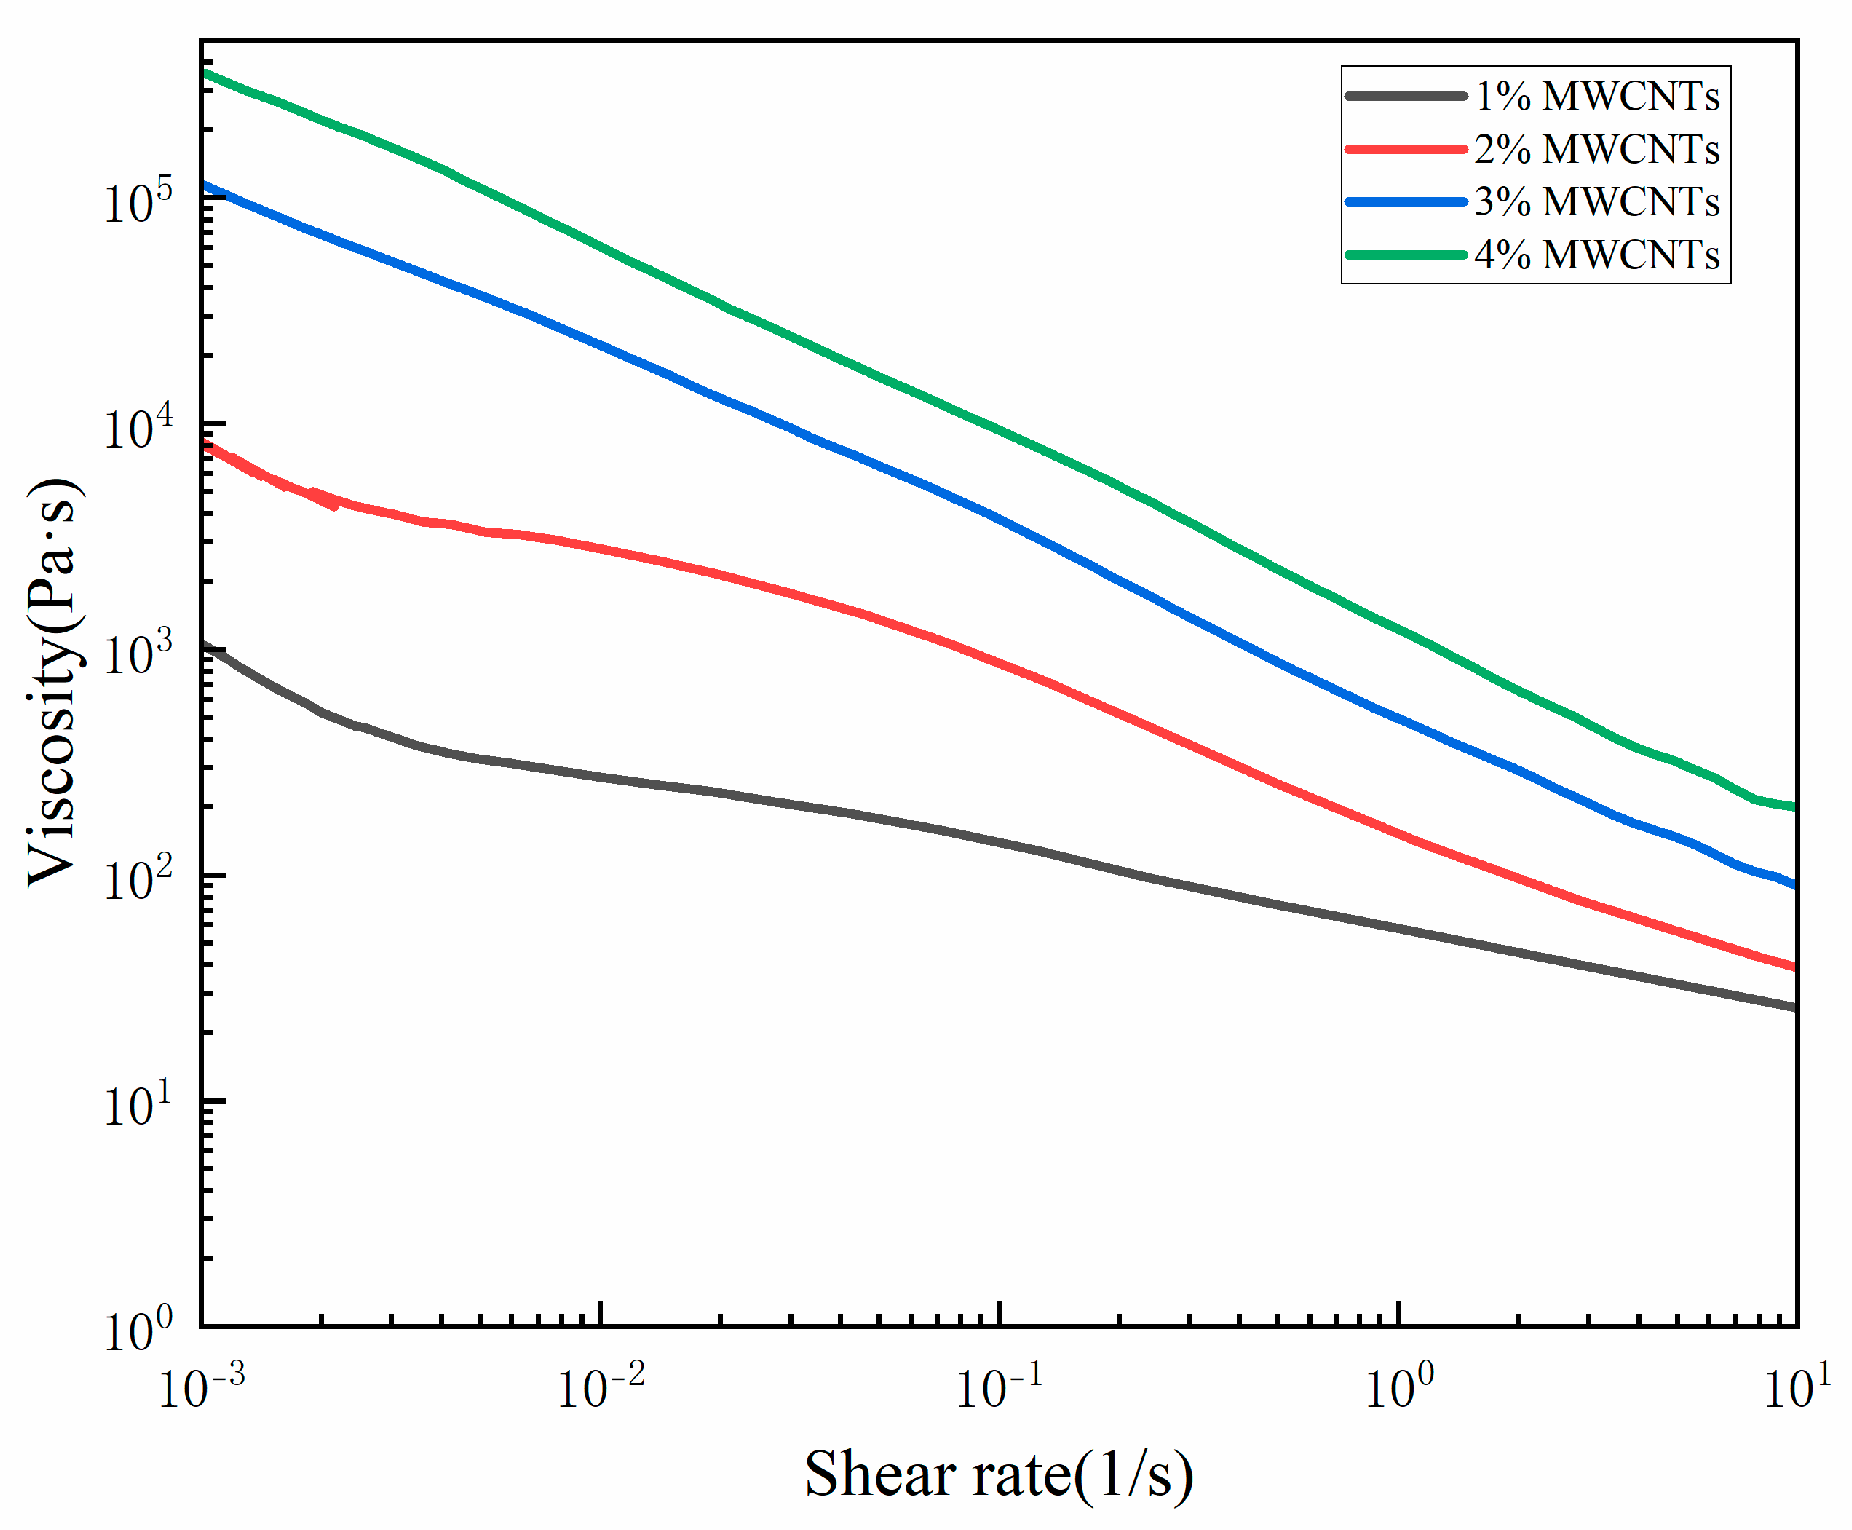
Extrusion 3D printing consists of two stages: material extrusion from the nozzle and shape retention on the substrate. The first stage is related to the shear-thinning behavior of the material, while the second stage depends on its shape retention capability. The steady shear test results for the four composites with different mass fractions are shown in
Figure 4. It is observed that the viscosity of all materials exhibits a downward trend with increasing shear rate, demonstrating typical shear-thinning behavior.
Shear-thinning is a critical rheological characteristic for extrusion 3D printing. Shear-thinning is an essential rheological property for extrusion 3D printing. When subjected to high shear rates, such as while passing through the printing nozzle, the shear forces break down the internal structure of the material, leading to a pronounced decrease in viscosity and enabling smooth extrusion. Under static or low-shear conditions, as shear diminishes, the composite reforms a stable internal structure, resulting in high viscosity and solid-like behavior. This helps maintain the stability and shape retention of the material after printing.
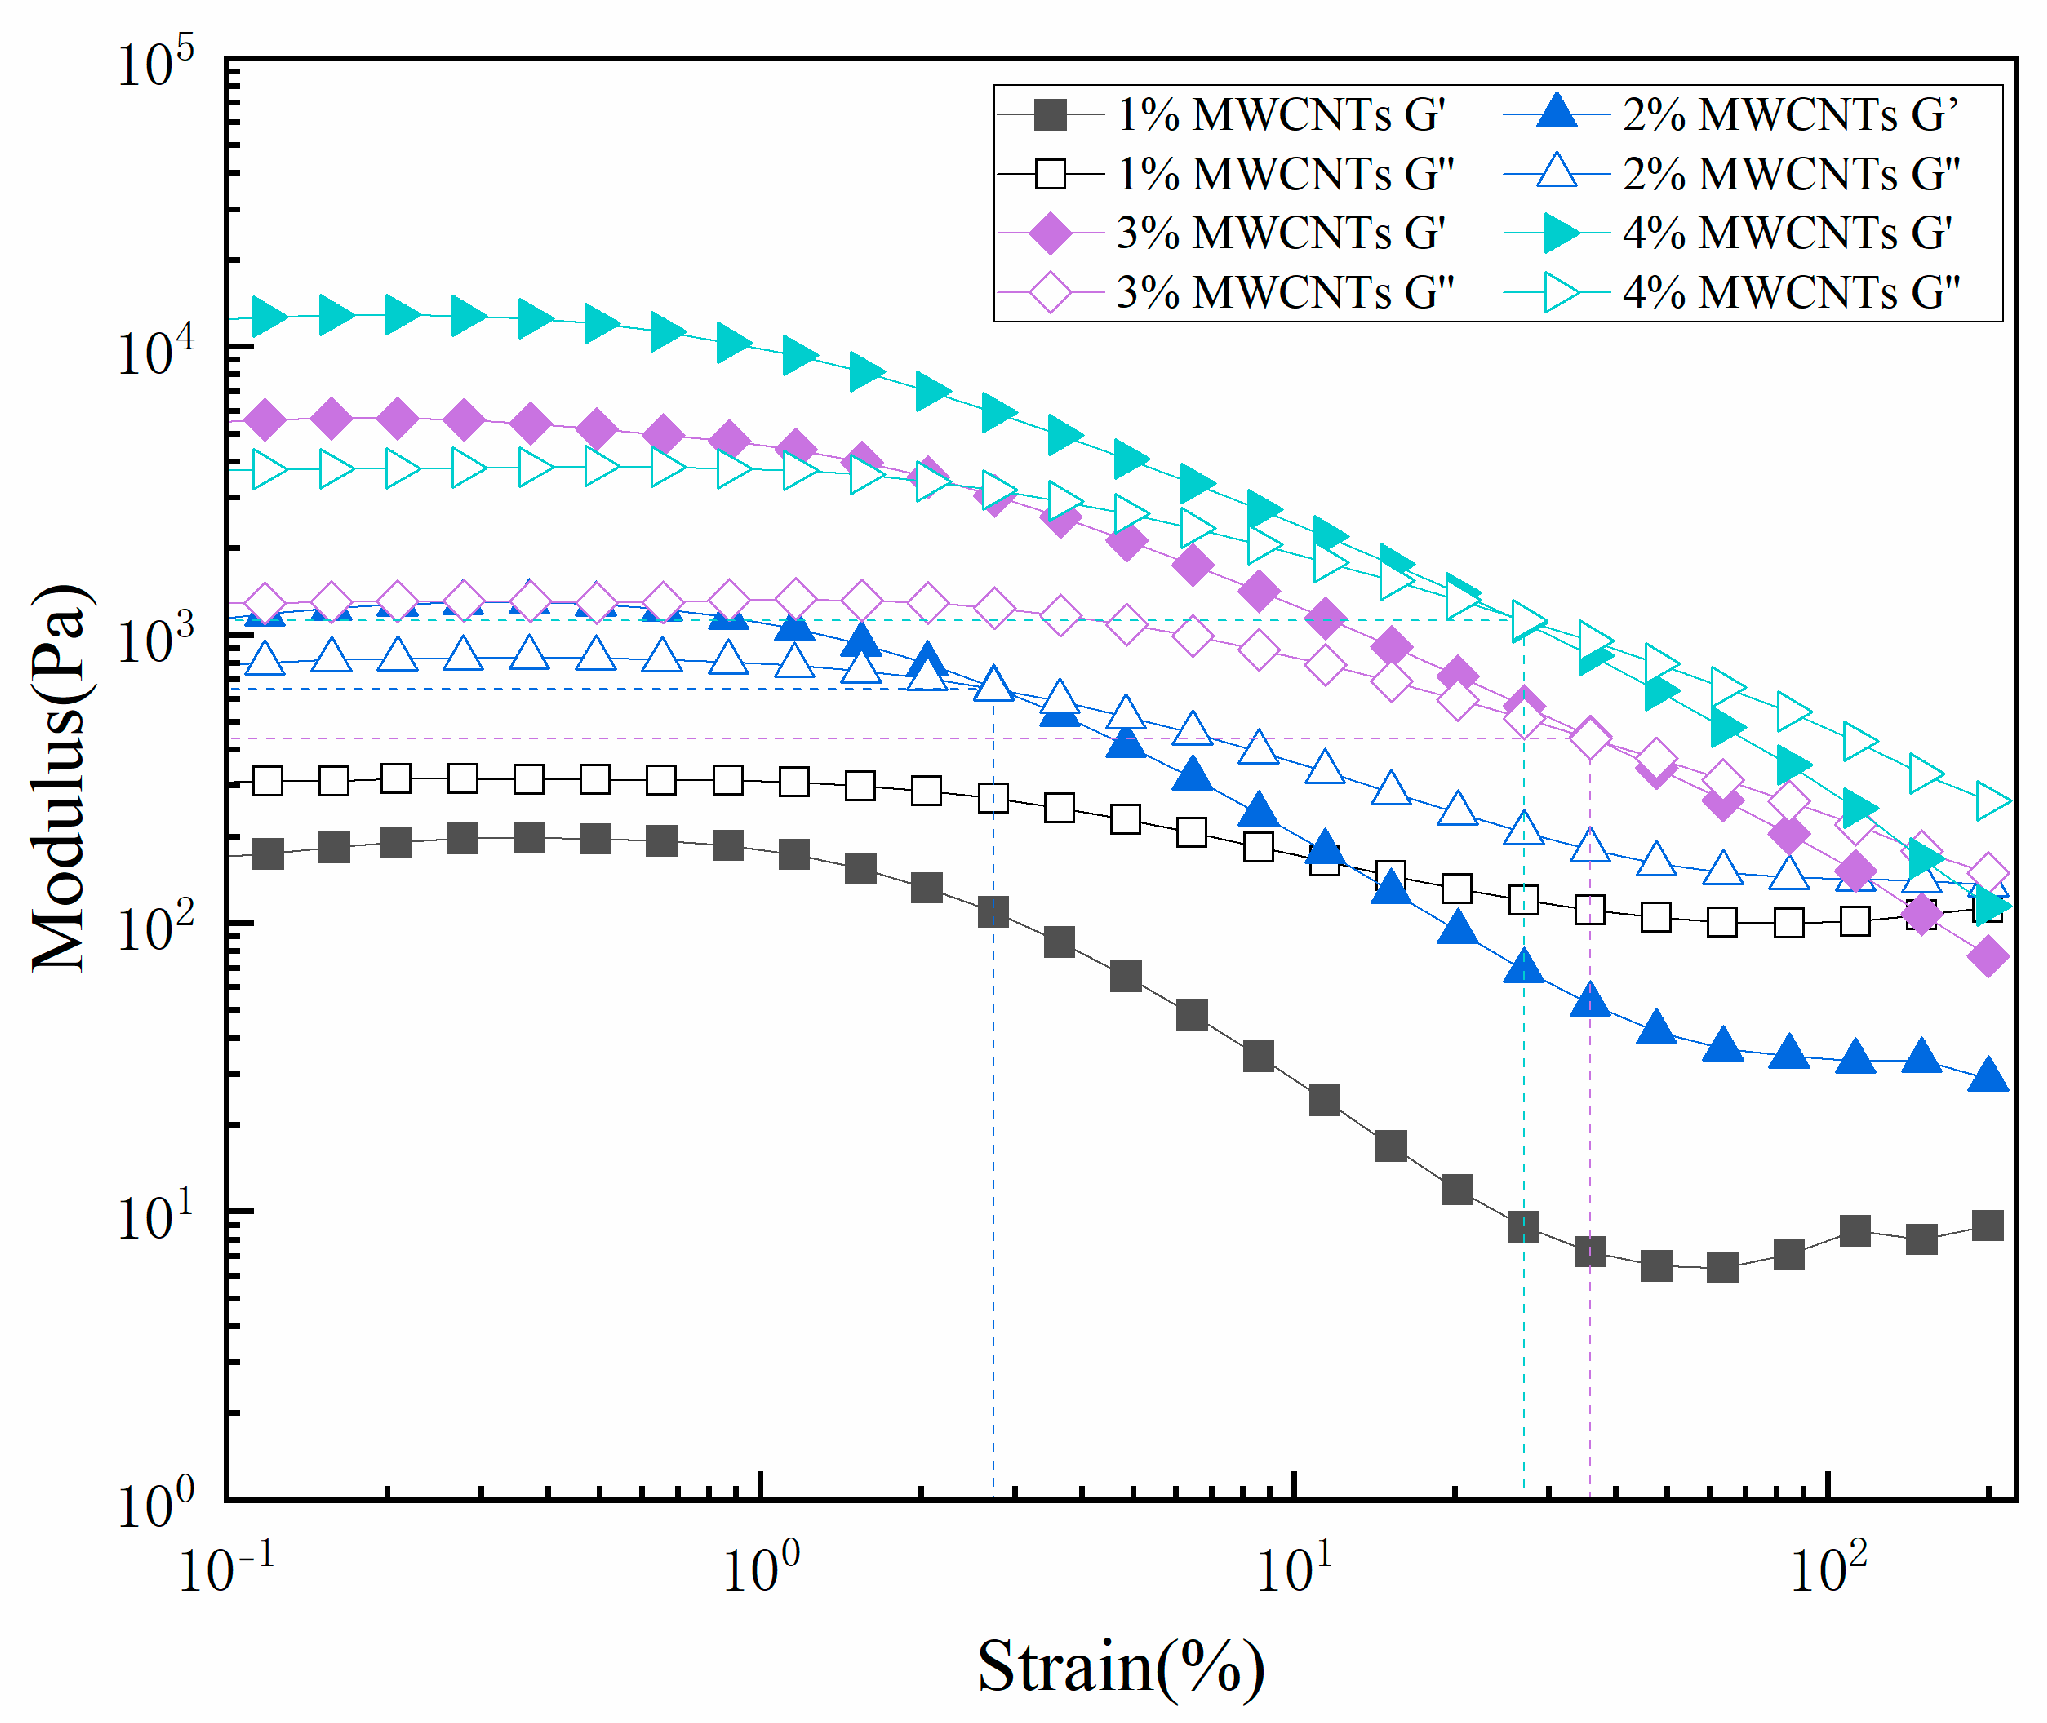
The complex modulus test results for the four composite materials with different mass fractions are presented in
Figure 5. It can be observed that the mechanical behavior of the materials undergoes significant changes as the strain rate increases. When the storage modulus (G′) is higher than the loss modulus (G″), the material deformation is dominated by elasticity, manifesting solid − like characteristics with excellent shape retention capability. As the strain rate further increases, the loss modulus gradually surpasses the storage modulus, and the material transitions to being dominated by viscous deformation, exhibiting distinct liquid-like flow properties. When the two moduli reach an equilibrium point, the material exists in a semi − solid state, which simultaneously possesses sufficient fluidity for smooth extrusion from the nozzle and maintains appropriate structural stability. This characteristic renders the material suitable for extrusion direct 3D printing technology, thereby expanding its application potential in the manufacturing field.
Furthermore, it can be observed from
Figure 5 that both the G′ and G″ of the materials increase with a higher mass fraction of MWCNTs. Concurrently, as the strain increases, the storage and loss moduli of all materials exhibit a downward trend, with the decrease in the storage modulus being more pronounced than that in the loss modulus. A higher storage modulus indicates that the material exhibits more solid-like behavior, effectively resisting flow and structural collapse caused by its own gravity. This contributes to the formation of deposited filaments with stable morphology and structural integrity. Meanwhile, a moderate loss modulus signifies a certain degree of viscous dissipation during the deformation process; this characteristic facilitates the leveling of the extruded material on the deposition substrate. It is noteworthy that it is precisely the synergistic effect of this viscoelastic behavior that results in the actual width of the printed filaments typically being larger than the nozzle diameter.
Notably, for the composite with 1 wt% MWCNT mass fraction, the G′ and G″ curves do not intersect throughout the entire testing range, with the loss modulus consistently remaining higher than the storage modulus. This indicates that, under printing−related deformation conditions, the material primarily exhibits viscous flow−dominated behavior and lacks sufficient elastic recovery to maintain the morphological stability of the filaments after extrusion. This rheological signature provides a mechanistic explanation for the material’s tendency to undergo flowing and structural collapse during the printing process, rendering it unsuitable for extrusion 3D printing technology.
3.2. Analysis of 3D Printing Process Parameters
Prior to the investigation of 3D printing process parameters, the minimum extrusion pressure required to maintain a stable printing state for composites with different mass fractions was determined. Through experimental verification, the minimum extrusion pressures for materials with 2%, 3%, and 4% mass fractions were identified as 90 kPa, 110 kPa, and 230 kPa, respectively. When the extrusion pressure required by the material is too high, the extrusion flow will exceed the controllable range, which is likely to cause compression or collapse of the already printed structure, thereby affecting the forming accuracy. Concurrently, excessive extrusion pressure imposes stability challenges on the pressure control system and accelerates the wear of the printing equipment. Consequently, the composite containing 4% MWCNTs was deemed unsuitable for the current 3D printing process due to its prohibitively high minimum extrusion pressure. Subsequent research will focus on composites with MWCNTs mass fractions of 2% and 3%, upon which the optimization of 3D printing process parameters will be conducted.
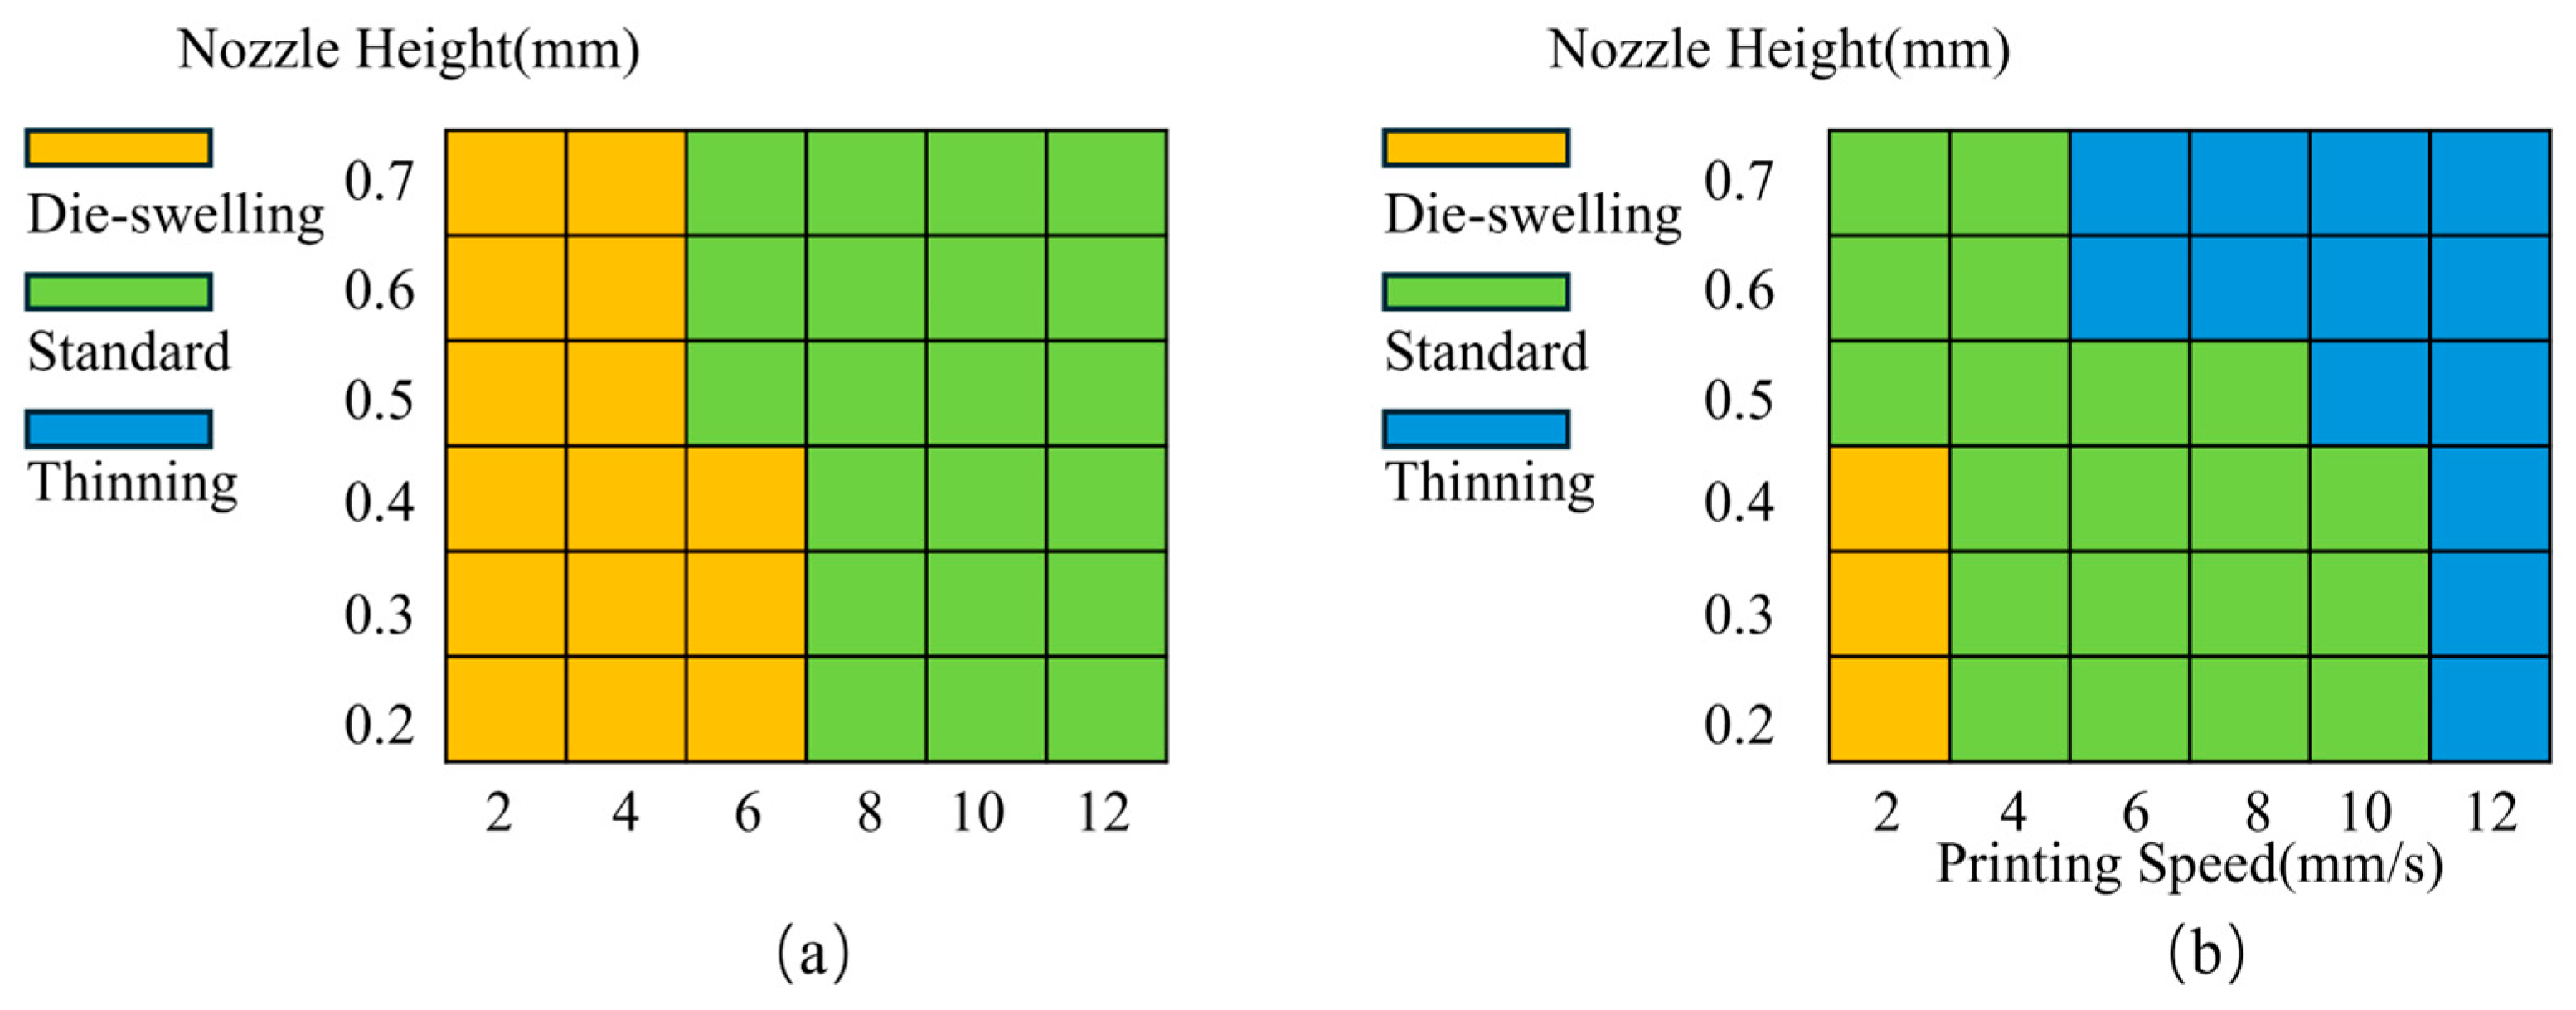
Figure 6 illustrates the printing windows for composite materials with 2 wt% and 3 wt% MWCNTs mass fractions. To quantitatively describe and analyze the morphology of the printed filaments, the line width deviation
is introduced as a key evaluation metric, calculated as follows:
where
represents the measured printing line width and
denotes the nozzle diameter (0.41 mm). Based on the numerical range of
, the printing states are categorized into three classes:
≥ 1.3 corresponds to the die-swelling state (represented in yellow); 1.3 >
> 0.3 corresponds to the standard state (represented in green); and
≤ 0.3 corresponds to the thinning state (represented in blue).
As shown in the figure, both materials exhibit suitable printability windows for extrusion 3D printing. The results further indicate that with the increase in printing speed and nozzle height, the deposition state of the materials undergoes a staged transition during the printing process: evolving from the initial over-accumulated die-swelling state, gradually transitioning to the uniform and stable standard state, and finally shifting toward the thinning state at higher speeds or heights.
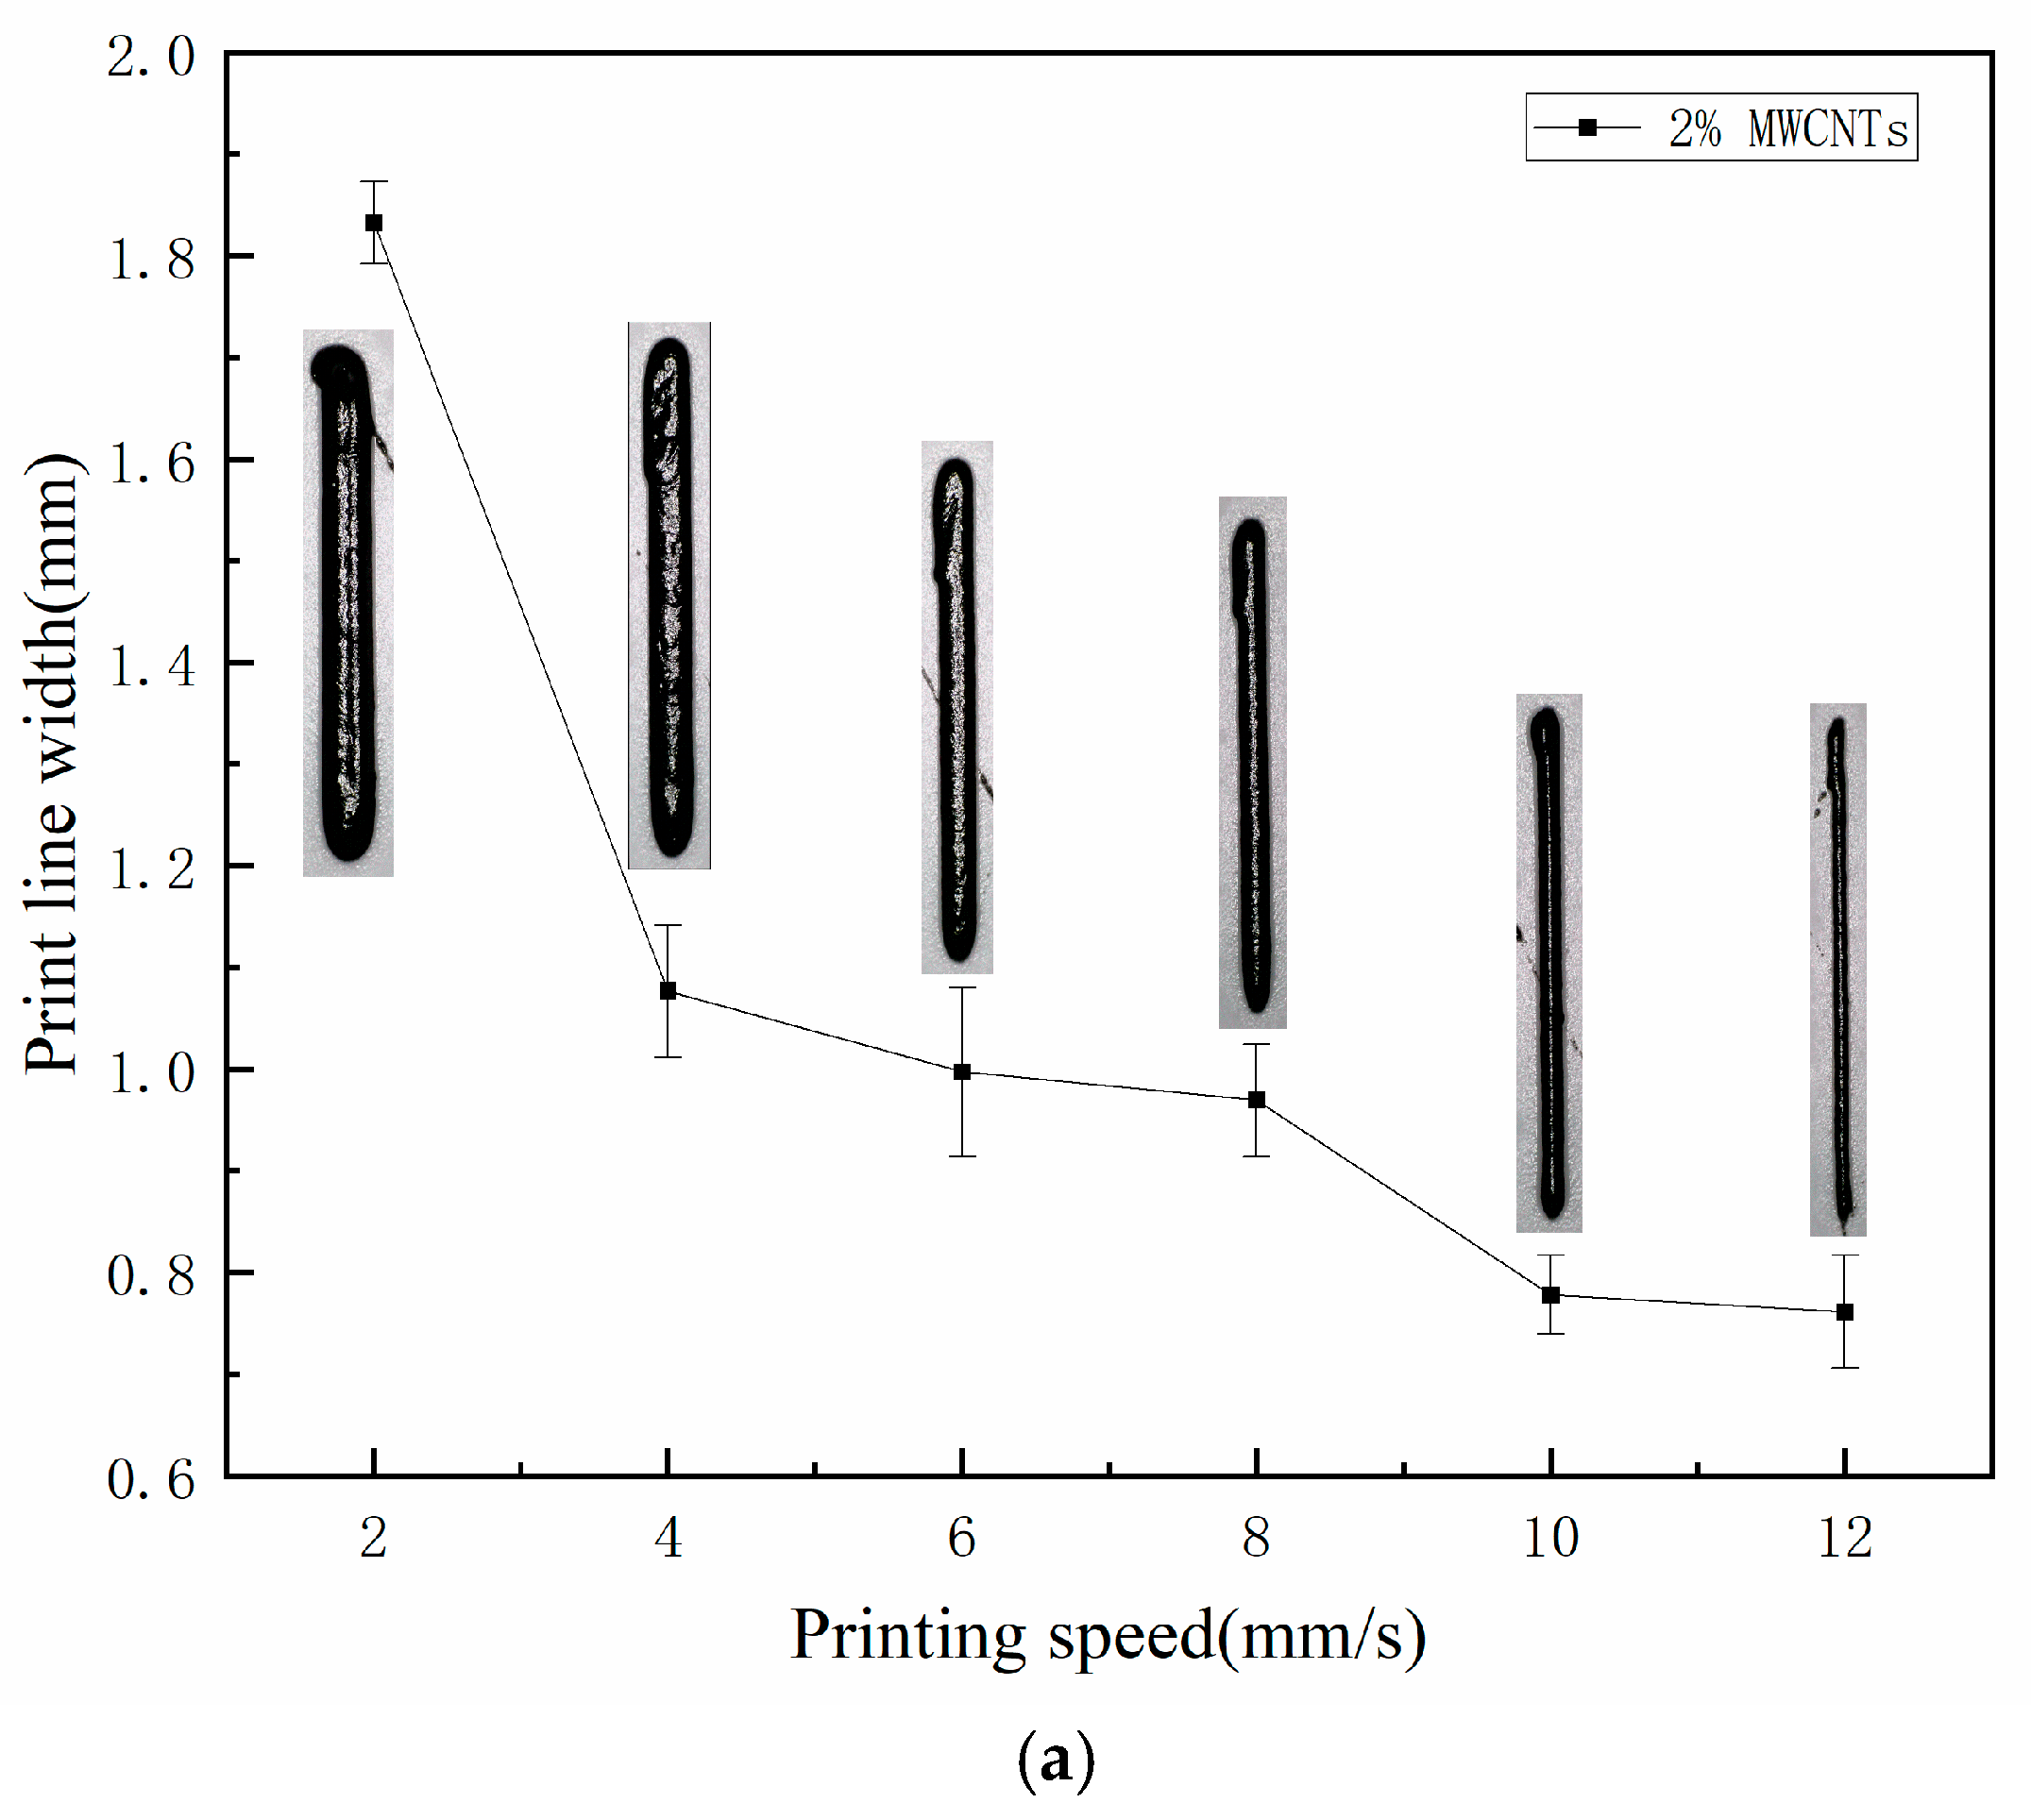
More intuitive results are illustrated in
Figure 7. Specifically,
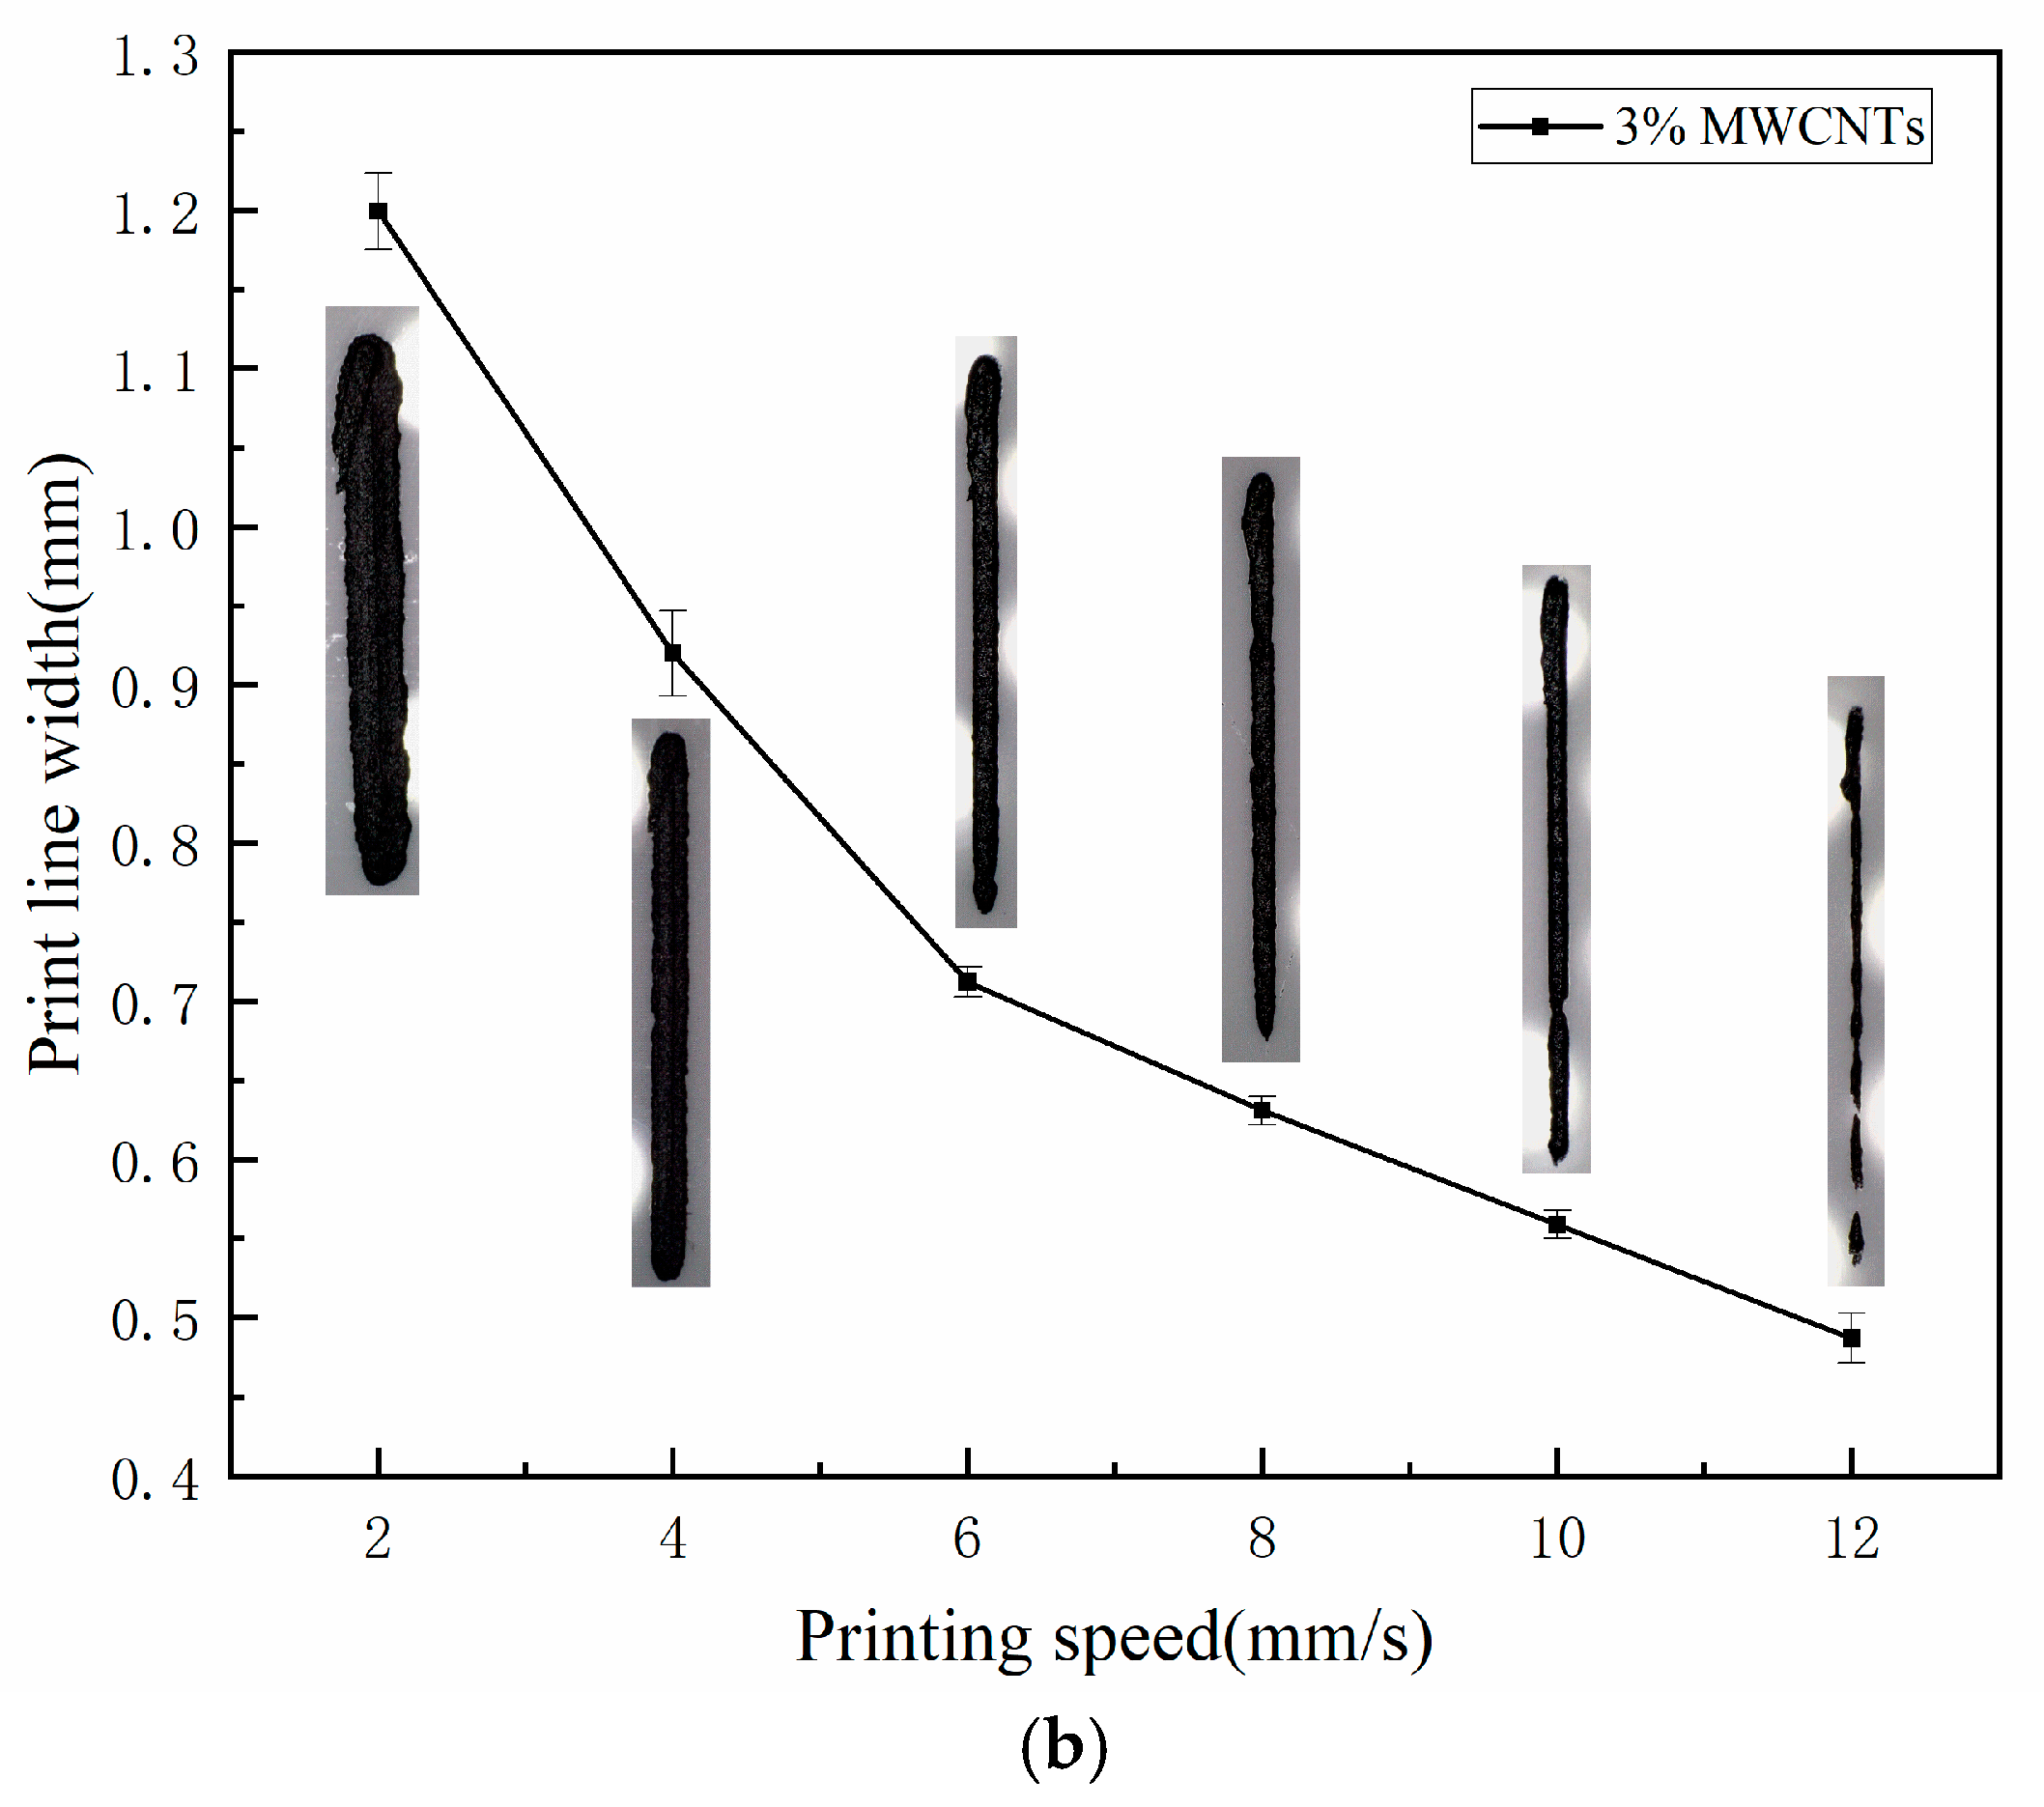
Figure 7a presents the printing performance of the 2% MWCNTs composite under the parameters of a nozzle height of 0.5 mm and a printing speed of 12 mm/s; it can be observed that the line width of the extruded material thins progressively as the printing speed increases. Similarly,
Figure 7b shows the printing status of the 3% MWCNTs composite with a nozzle height of 0.4 mm and a printing speed of 6 mm/s, where a similar thinning trend in the extruded line width was observed as the speed increased. This phenomenon further verifies the conclusions.
During the fabrication of sensor devices, varying line widths significantly affect the sensing performance. To maintain consistency in the printed line width for both composite materials, and to ensure that the extruded material can be precisely deposited at the predetermined positions with stable self-supporting formation while balancing printing efficiency, the following parameters were ultimately selected: for the 2% MWCNTs composite, an extrusion pressure of 90 kPa, a nozzle height of 0.5 mm, and a printing speed of 12 mm/s were adopted; for the 3% MWCNTs composite, an extrusion pressure of 110 kPa, a nozzle height of 0.4 mm, and a printing speed of 6 mm/s were utilized.
3.3. Analysis of Sensor Device Performance
In the assessment of material performance, stretchability serves as a critical metric for measuring the maximum deformation sustained under cyclic loading. Significant variations in stretchability are observed among different materials. In the fabrication of polymer composite strain sensors, the selection of substrates possessing superior flexibility is of paramount importance. PDMS is highly regarded due to its low YounG′s modulus, stretchability and ductility. Even when incorporated with conductive fillers, it maintains favorable tensile properties, making it an ideal substrate for sensor substrates [
34,
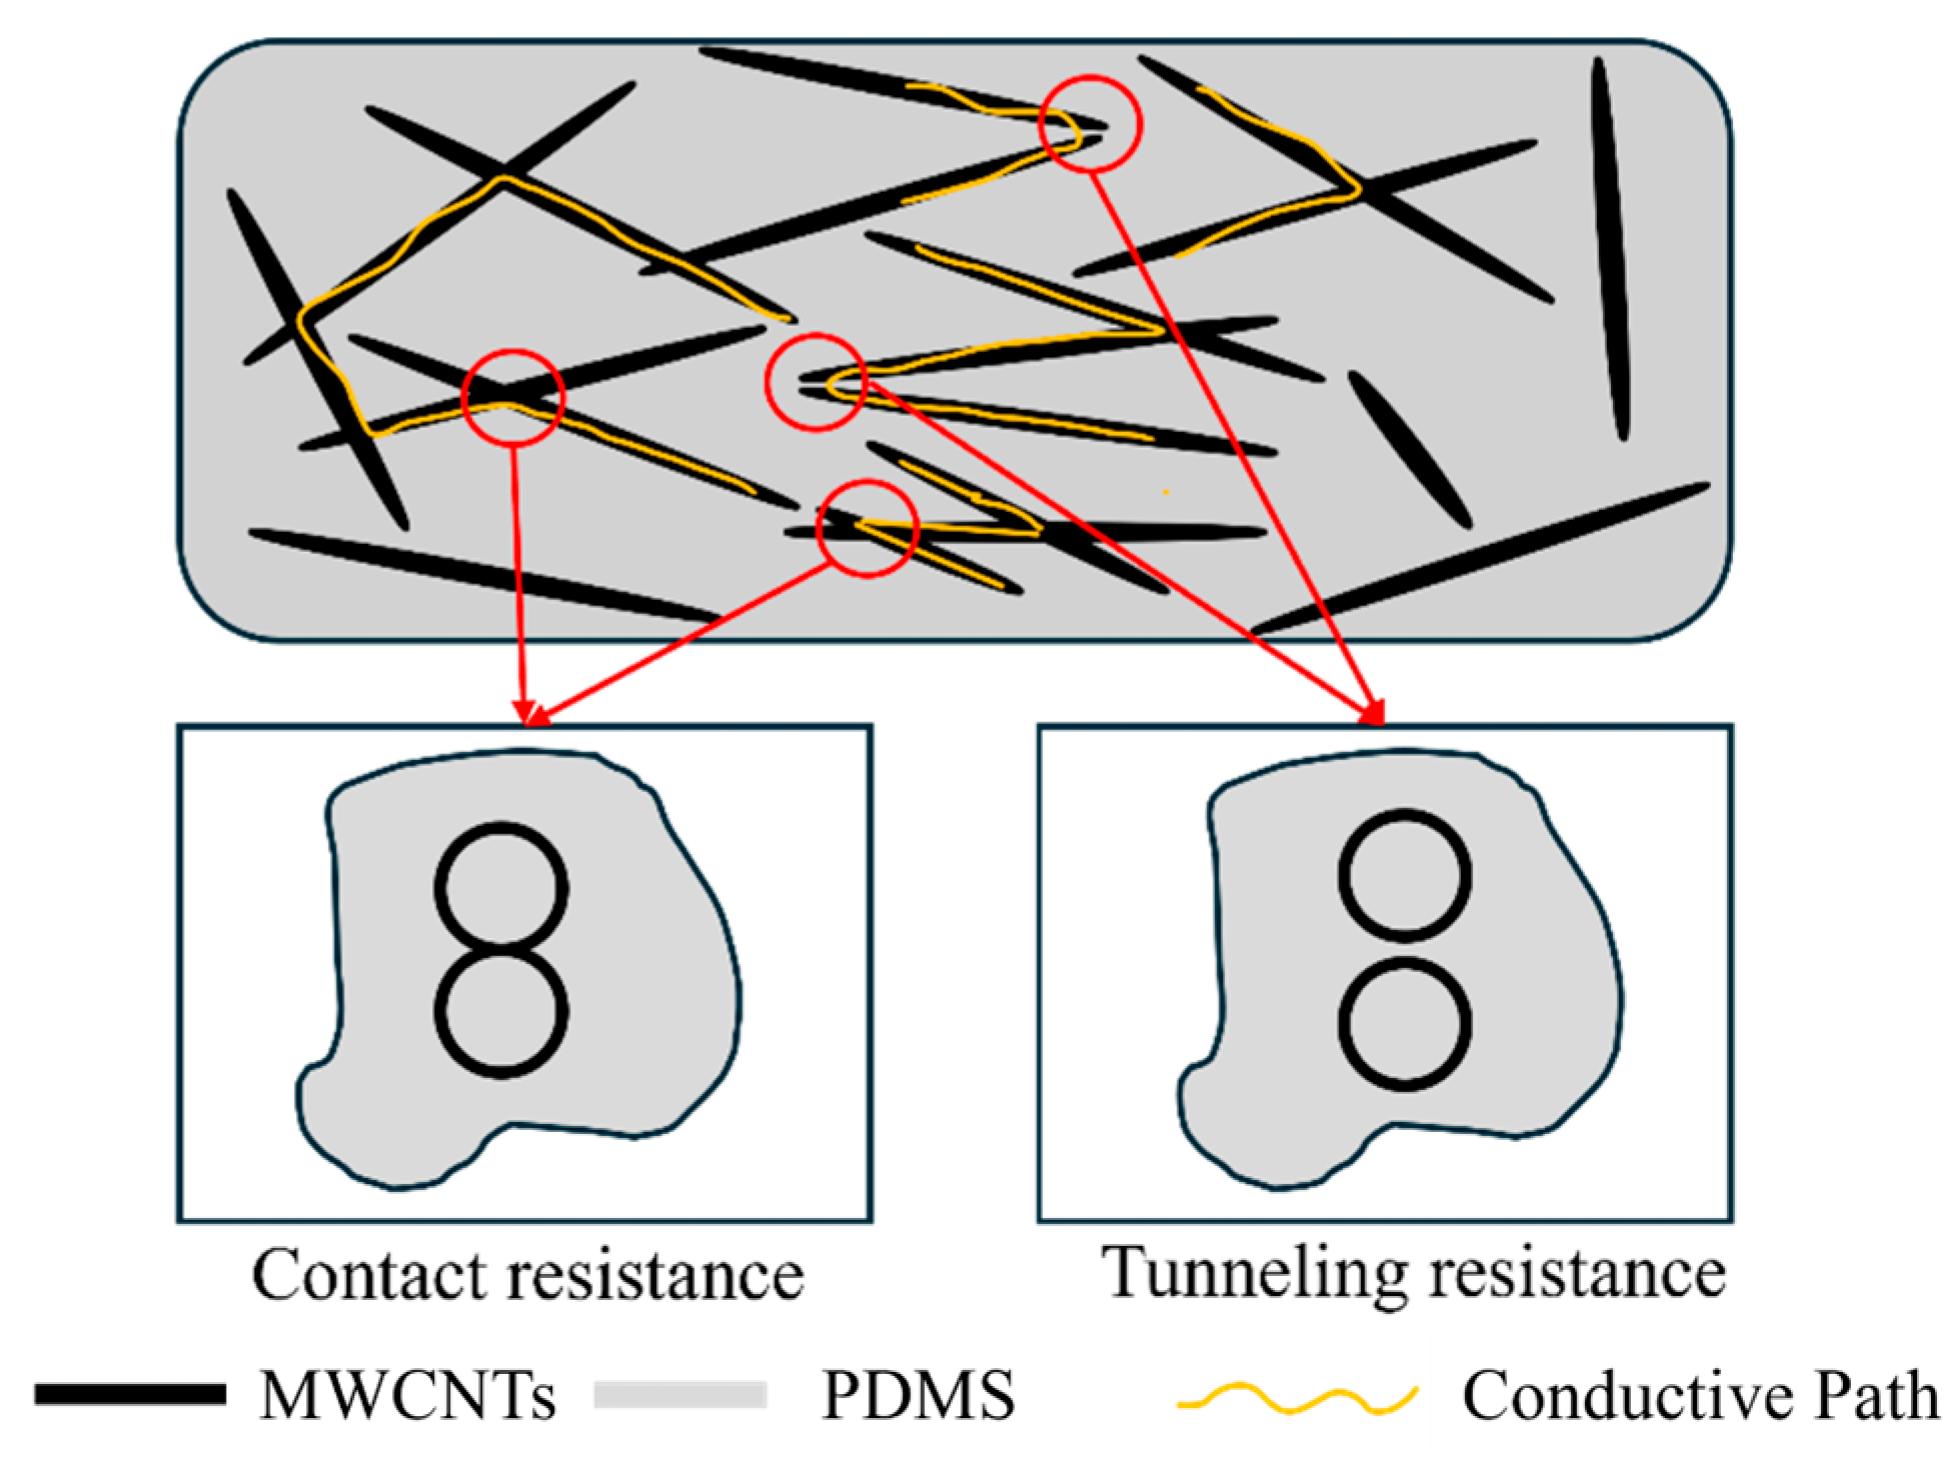
35]. The schematic cross-sectional view illustrating the spatial relationship and resistance types of the MWCNTs/PDMS mixture used in the experiments is shown in
Figure 8. In the conductive composite formed by MWCNTs and PDMS, the MWCNTs are dispersed in a disordered and random manner within the insulating PDMS matrix, constructing an interconnected three-dimensional conductive network that endows the composite with electrical conductivity. Two primary types of resistance exist within this system: contact resistance, which originates from the direct physical contact between MWCNTs and exhibits relatively low values, and tunneling resistance. Tunneling resistance occurs when the gap between MWCNTs is extremely small without direct physical contact; in such cases, electrons can cross the potential barrier formed by the insulating PDMS medium via the quantum tunneling effect, enabling charge transport across the gaps and forming conductive paths [
36].
3.3.1. Analysis of Tensile Testing Results
The shape of the sensor devices and the specific configuration of the tensile experiments are illustrated in
Figure 9a,b. During the tensile tests, the samples were progressively stretched using a manual stretching stage, while the resistance variations at different tensile lengths were measured via a multimeter to analyze the output resistance and the relative resistance change rate under various parameter combinations. To address the insulation issue between the printed materials and the manual stretching stage, a uniform layer of PDMS was configured on the printing substrate, which facilitated more effective sensors stretching while providing reasonable space for clamping. To solve the problem of loose connection between the copper sheet and the printed sample, multiple repeated experiments were conducted, and conductive silicone adhesive was used when necessary. Data analysis revealed certain limitations and deficiencies in the experiments, such as insufficient stretching length and the coarse scale of the manual stage, indicating that there remains room for further optimization.
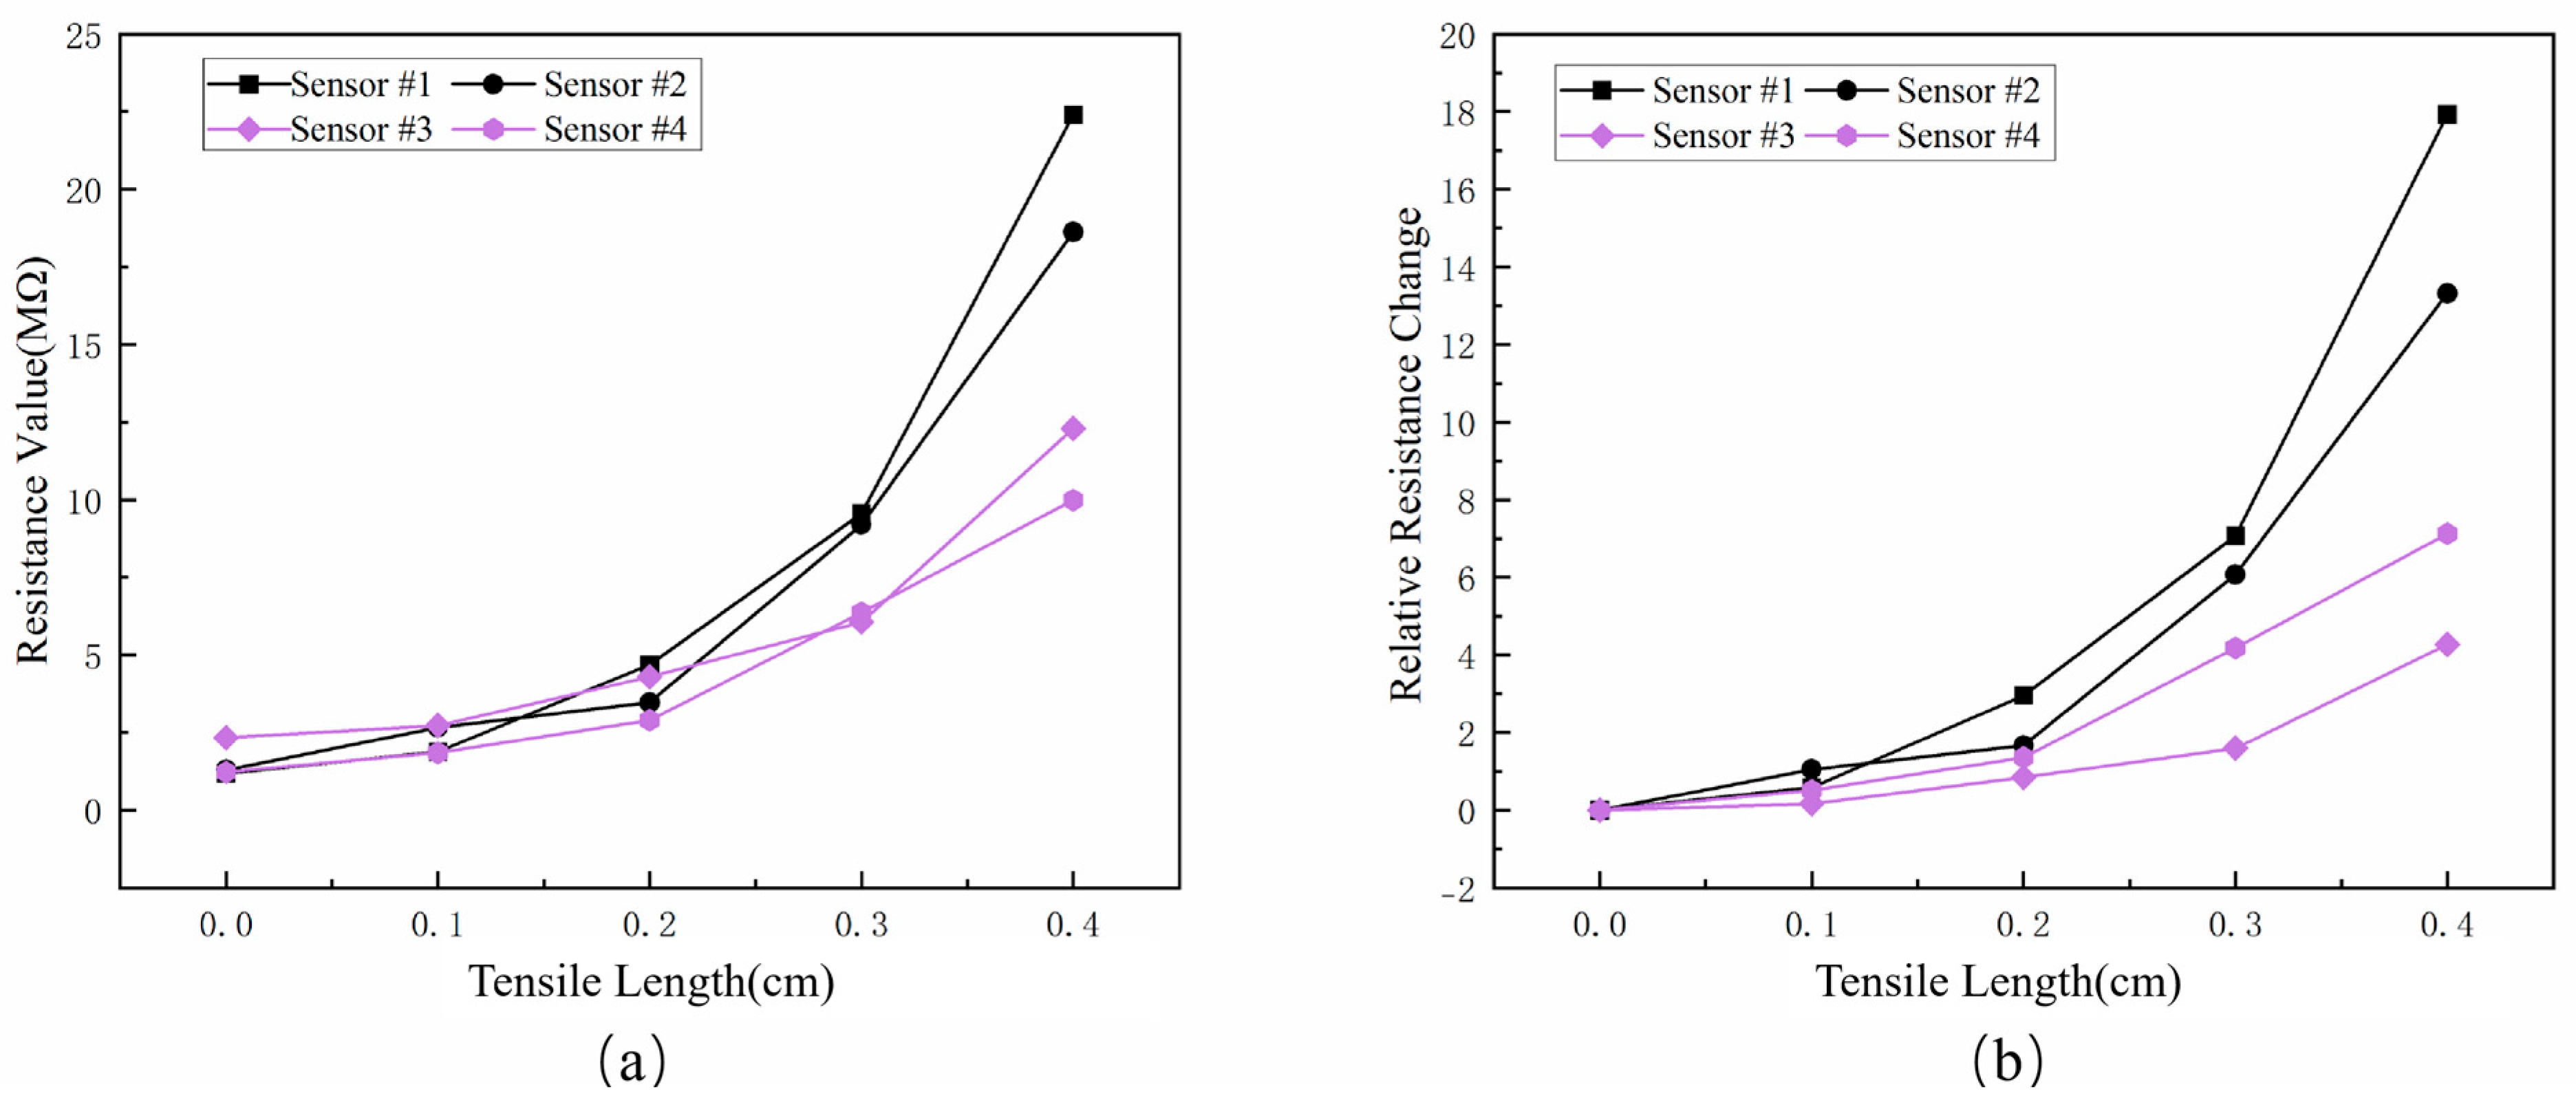
The output resistance and relative resistance change rates of composites with varying MWCNTs mass fractions under different tensile strains are illustrated in
Figure 10. By analyzing the variation of resistance during stretching, as shown in
Figure 10a, it is evident that the resistance of all sensors increases with the increment of tensile lengths, representing the potential of the material for application in sensing elements. By comparing the variations in resistance relative to tensile length across different sensors, it can be observed that the resistance of the devices decreases as the MWCNTs mass fraction increases. This phenomenon is attributed to the fact that higher MWCNTs concentrations facilitate the formation of a denser and more robust conductive network within the polymer matrix. The significant increase in the number of contact points between nanotubes within the network creates numerous pathways, thereby substantially reducing the overall electrical resistance of the composite.
Furthermore, comparing the output resistance versus tensile length for Sensors #1 and #2, as well as Sensors #3 and #4, it was observed that the electrical resistance of the sensors is not sensitive to changes in the printing interval under conditions where other process parameters and material ratios remain identical. This may be because, within the tested range, changing the print interval did not significantly change the types of resistance present. It also did not alter the microscopic structure of the conductive network. Therefore, it had only a limited effect on the material’s overall resistance. Specifically, on one hand, resistive performance primarily depends on factors such as filler dispersion, interfacial bonding, and the proportion of contact resistance to tunneling resistance; the printing interval is not a dominant variable for these factors. On the other hand, the range of variation in the set printing interval may not have reached a threshold sufficiently to induce a substantial shift in resistance.
As illustrated in
Figure 10b, at the same tensile length, the relative resistance changes of Sensors 1 and 2 are generally higher than those of Sensors 3 and 4. This discrepancy stems from the differences in the conductive network structures at varying filler contents and their evolution mechanisms under strain. During the stretching process, the internal conductive network of the sensor gradually transitions from being dominated by contact resistance to being dominated by tunneling resistance. For sensors with lower filler content (e.g., 2 wt%), the internal conductive network is relatively sparse, with a larger average spacing between the MWCNTs. Under tension, the inter-tube distance further increases, making electron transport highly dependent on the tunneling effect, which is extremely sensitive to spacing. Consequently, the resistance increases sharply with strain, exhibiting a higher relative resistance change. In contrast, sensors with higher filler content (e.g., 3 wt%) form a dense and highly interconnected conductive network, where electron transport primarily relies on direct contact paths between nanotubes—meaning contact resistance is dominant. Under tension, the network accommodates deformation through the reversible separation or sliding of contact points; therefore, the resistance change is more gradual, the response tends to be more linear, and the sensor can withstand a larger strain range. Of course, to more directly verify and quantify the dynamic evolution of the conductive network under strain, establishing corresponding quantitative models in combination with experimental techniques such as SEM observation constitutes another important task that needs to be further conducted in future research. In addition, for a more accurate evaluation of sensor performance, future work should systematically collect denser test data points and measure the resistance response changes under different loading rates. The hysteresis characteristics, signal repeatability, and dynamic response performance of the sensor should also be evaluated.
3.3.2. Analysis of Wearable Testing Results
Piezoresistive pressure sensors, characterized by their resistance-based feedback mechanism, can accurately correspond to and distinguish between diverse pressure signals, thereby demonstrating superior response performance across various motion patterns. This characteristic endows piezoresistive sensors with significant application potential and developmental prospects in multiple fields, including human–machine interaction, biomimetic contact, as well as grasping and manipulation.
Sensor #1 was selected for wearability testing, which involved posture recognition and palm grasping evaluations. The resistance changes of the sensor were measured under four distinct conditions: complete hand relaxation, fist clenching, and grasping a water cup filled with 250 mL and 100 mL of water, respectively. As illustrated in
Figure 11a,b, the sensor outputs a lower resistance during complete relaxation, whereas a significantly higher resistance was observed during fist clenching, thereby demonstrating its promising application in the field of posture recognition. Furthermore, the lightweight and shape-adjustable nature of the fabricated flexible piezoresistive pressure sensors provides substantial potential for grip force monitoring. As shown in
Figure 11c,d, the resistance exhibited marked variations when grasping cups with different water volumes. Specifically, the resistance decreased progressively as the water volume increased, indicating that the sensor possesses a good response to minor pressure stimuli.
In the tests targeting the mechanical robustness of the sensor, it was attached to a human elbow joint to monitor its response during the process of joint flexion and extension. As illustrated in
Figure 11e,f, the resistance signals of the sensor successfully tracked the state changes of the elbow joint from extension to bending. This result demonstrates that the sensor possesses the potential for practical application in dynamic human motion scenarios.
Finally, since piezoresistive sensors can distinguish pressure signals of different magnitudes, static load testing was performed. As illustrated in
Figure 11g,h, the sensor was fixed on a benchtop to monitor its resistance changes in both the unloaded state and while supporting a water cup containing 250 mL of water. The results show that the sensor outputs a higher resistance value when unloaded, whereas the resistance decreased rapidly under the pressure of the water cup; upon removing the cup, the resistance returned to a higher level. This test verifies the sensor’s response capability to weight changes, demonstrating its feasibility in application scenarios such as body weight monitoring.
Although the wearability tests in this study have preliminarily verified the functional response of the sensor in simulated daily activities, further systematic performance evaluations remain necessary in the future. These include signal repeatability analysis, drift characteristic testing, and dynamic response characterization, alongside quantitative metric comparisons with existing sensors. This study is of great significance for refining the overall research process and promoting the long-term stable application of sensor devices.
4. Conclusions
Starting from the rheological properties of the materials, this study determined the printable process window for MWCNTs/PDMS composites through a systematic exploration of 3D printing parameters. Based on this window, sensor devices were directly fabricated, followed by tensile-resistance performance testing and preliminary wearable application verification. This systematic research approach—oriented toward practical applications and integrating material characteristics, printing processes, and device functions—provides a more practical research methodology for the direct extrusion-based 3D printing of flexible electronic devices based on nanocomposites. Based on this research, the following conclusions are drawn:
(1) Through systematic rheological characterization and extrusion 3D printing experiments, this study investigated the single-line printing performance of composites incorporated with varying mass fractions of MWCNTs. The findings reveal that the material undergoes a typical phased morphological transition during the deposition process as the printing speed or nozzle height increases: evolving from the initial over-accumulated die-swelling state, gradually transitioning to the uniform and stable standard state, and finally shifting toward the thinning state at higher speeds or heights. Ultimately, by comprehensively considering critical factors such as the maximum extrusion pressure of the equipment and the forming quality of the single filament, the stable printing process parameters for composites with mass fractions of 2% and 3% were successfully determined.
(2) Sensor fabrication experiments were conducted across diverse parameter combinations. Tensile characterization results revealed that the electrical resistance of the fabricated devices increased progressively with stretching length, underscoring the significant potential of MWCNTs/PDMS composites for strain-sensing applications. At the same time, the resistance value output by the sensor device decreased with the increase of the content of MWCNTs and the resistance change rate also increased with the decrease of the content of MWCNTs.
(3) The wearability tests conducted on the sensor devices verified the feasibility of the MWCNTs/PDMS composites for flexible sensing applications. The sensor can distinguish various gestures and load changes, while also exhibiting distinct response characteristics during dynamic movements such as joint flexion and extension. These results demonstrate the application potential of the composite in human motion perception and pressure monitoring.
To further advance the application and development of composites in extrusion-based 3D printing, future research can be explored in several directions. For instance, the dispersion and interaction could be optimized through surface modification of fillers and interfacial regulation with the matrix. The introduction of external field-assisted forming technologies, such as electric, magnetic, or ultrasonic fields, could achieve active control over filler distribution and orientation. Furthermore, the combination of computational simulation methods and multi-scale structural design is expected to provide an important pathway for achieving higher performance and multifunctional integration in flexible sensors.