Article

Experimental Study on Vertical Bearing Characteristics of Post-Grouting Piles with Super-Long and Large-Diameter with Double-Load Box


1
Henan Transport Investment Jiaozheng Expressway Co., Ltd., Zhengzhou 450000, China
2
School of Water Conservancy and Transportation, Zhengzhou University, Zhengzhou 450001, China
*
Authors to whom correspondence should be addressed.
Appl. Sci. 2026, 16(4), 1947; https://doi.org/10.3390/app16041947
Submission received: 19 November 2025 / Revised: 30 December 2025 / Accepted: 30 December 2025 / Published: 15 February 2026

Abstract

To investigate the bearing characteristics of super-long and large-diameter cast-in-place piles with combined pile-end and pile-side post-grouting, double-load-box self-balanced static-load tests were conducted on two such piles of the Yellow River Bridge Project on Jiaoping Expressway both before and after grouting. This study aims to provide technical insights for the design and construction of similar pile foundations. The test results indicate that, after grouting, the ultimate bearing capacities of test piles SZ1 and SZ2 increased by 123.1% and 72.8%, respectively, with a significant reduction in pile top settlement under the same load level. Under each load level, the axial force of the pile shaft reaches its maximum near the upper load box, presenting a triangular distribution curve. Furthermore, the side frictions of SZ1 and SZ2 enhanced by 87.73% and 83.59%, respectively, after grouting, while their ultimate end resistances are improved by 362.6% and 120.6%. These findings demonstrate that post-grouting effectively optimizes the mechanical properties of the pile–soil interface and enhances the structural stiffness of the surrounding soil. Specifically, the grout hardens at the pile end, solidifies the sediment there, increases the density of the pile-end soil layer, and improves the bearing rigidity of the bearing stratum. This research validates the effectiveness of the combined pile-end and pile-side post-grouting technology in improving the bearing performance of super-long and large-diameter cast-in-place piles, providing valuable technical support for the safe and efficient construction of the Yellow River Bridge on the Jiaoping Expressway and similar engineering projects.

1. Introduction

China’s infrastructure and transportation networks are undergoing accelerated upgrading, with a marked improvement in overall infrastructure standards. Bridges traversing complex terrains, as key components of transportation lines, play a dual role in facilitating daily life and driving economic growth. The design and construction of such large-scale bridges impose stringent requirements on foundation stability and single-pile bearing capacity, thus propelling the development and application of bored piles toward the trends of super lengths and large diameters. However, due to the inherent defects of bored piles such as pile tip sediment, pile-side mud skin, and stress relaxation of the soil around the pile, its bearing capacity is significantly affected. In order to solve such problems, post-grouting technology for pile foundations is widely used because of its good engineering benefits [1,2,3].
At present, the traditional static-load method is still used to determine the ultimate bearing capacity of the single pile using a static-load test of the field test pile. The shortcomings of this method, such as its high cost, construction problems, and long construction period, have not been improved, and it is difficult to meet the static-load test requirements of large tonnage and super-long and large-diameter pile foundations. The self-balancing test method is simpler than the traditional stacking method: the site requirements are low, the test is safe and reliable, and the cost and construction period are saved [4]. There are significant differences between the self-balanced pile test method and the traditional static-load test. This difference, as well as divergence in the perception of some of the techniques, has constrained the popularization of the self-balancing test pile method and the development of the technique [5]. Based on this characteristic, domestic and foreign scholars have carried out a significant amount of research on the theory and application of using a load box in self-balancing static-load tests of pile foundations. Professor Osterberg began to systematically study the Osterberg-Cell load test method in 1985. This method uses a special load box as a loading device. By pre-burying the load box at the pile tip and applying pressure to make the pile body produce two-way displacement, the bearing capacity of the pile foundation is determined, and it was successfully applied in the bridge steel pipe pile in 1989 [6].
In the study of self-balancing static-load tests on post-grouting piles, Fellenius et al. [7] conducted a self-balanced static-load test on two large-diameter post-grouting piles in the Pingle Bridge project in Vietnam and confirmed that the post-grouting technology at the pile tip has a significant effect on improving the bearing capacity of the pile foundation. Cheng et al. [8] took the Yueqing Bay No.1 Bridge project as an example. By using the post-grouting technology at the pile tip, the self-balancing method was used to test the pile foundation before and after grouting, and the double-layer-load box test method was innovatively applied. The ultimate bearing capacity of the upper, middle, and lower sections of the pile body was successfully obtained. In the study of the buried position of pile foundation load box, Lu et al. [9] used double-load-box technology to overcome the problem of low bearing capacity caused by inaccurate determination of equilibrium point in single-load-box test in engineering applications. In order to solve the problem of determining the equilibrium point of the load box, Ping et al. [10] innovatively adopted double-load box technology in the test pile project of the Qilu Yellow River Bridge. Through the analysis of pile foundation design parameters, soil layer characteristics, and loading sequence, the bearing capacity of pile foundation before and after grouting was estimated. In a comparative study of the self-balancing method and the traditional static-load method, Deng et al. [11] used the self-balanced method to test the bearing capacity of two super-long piles of No.14 pier of the Beijing-Hangzhou Grand Canal Bridge. The results show that, compared to the traditional static-load method, the self-balancing method has higher field adaptability, and its test accuracy fully meets the engineering requirements. Based on the different geological conditions in Chengdu area, Fan et al. [12] conducted comparative tests on engineering piles by using the traditional static-load method and the self-balancing method, respectively, and studied the feasibility of the application of the self-balancing method in the Chengdu area. He et al. [13] compared and analyzed the field test results of the Qingdao Bay Bridge pile foundation self-balancing method and anchor pile method. They showed that, under the same site conditions, the self-balancing test method was simpler than the anchor pile method and can significantly save cost and time. The load–displacement curves obtained by the two methods have good consistency. In order to study the difference and reason for the load transfer law between self-balanced and traditional static-load test pile method, Cai et al. [14] carried out indoor model tests on self-balancing test piles, static pressure test piles, and uplift test piles under the same boundary conditions in granite residual soil. In the comparative analysis of the self-balancing method and numerical simulation results, Xiao et al. [15], based on an actual engineering project and using comparative analysis of a static-load test and numerical simulation of the self-balancing method of the foundation pile, found that the measured values were in good agreement with the results of the numerical simulation. Su et al. [16] carried out a self-balancing static-load test on the test pile of a large high-speed railway station, used MIDAS/GTS NX software to numerically simulate the test process, and obtained the compressive bearing capacity of the pile foundation and the optimal layout position of the load box. Liu et al. [17] established a two-dimensional axisymmetric numerical model based on PLAXIS software to simulate the mechanical characteristics and bearing mechanism of shallow rock-socketed short piles under self-balancing loading conditions and proposed a calculation method for the bearing capacity of shallow rock-socketed short piles based on the self-balancing loading test. In order to promote the application of the reverse self-balanced pile test method in practical engineering, Liu et al. [18] used the finite element analysis method to carry out a numerical simulation analysis of the reverse self-balancing pile test method. In the study of the analytical transformation method of the Q-s curve of the self-balancing test pile, based on the static-load test data of three bored piles, Yong et al. [19] verified the reliability of the self-balancing method to detect the vertical compressive ultimate bearing capacity of the single pile, and compared and analyzed the load–displacement curve after conversion. In view of the shortcomings of the current simple conversion method, Du et al. [20] studied the calculation method of the compression of the pile body. Engineering practice has proved that the improved simple conversion method is more accurate and practical. Ou et al. [21] proposed an analytical transformation method for the self-balancing test results of pile bearing capacity and theoretically verified the transformation method of this study using two sets of loading results of the anchor pile method and the self-balancing method. Ou et al. [22] proposed an analytical transformation method for the self-balancing test results of the single-pile bearing capacity in layered foundation so as to improve the applicability of self-balancing test theory in the detection of pile bearing capacity. Ou et al. [23] proposed an analytical conversion method for the self-balancing test results of bearing capacity of single pile in a clay foundation and verified the accuracy of the analytical conversion method by two groups of indoor model tests of the traditional static-load test pile and the self-balancing test pile. Wang et al. [24] used Mindlin formula to analyze the displacement difference in pile top between self-balancing test pile and static-load test pile. In order to improve the empirical formula, an equivalent conversion method for determining the bearing capacity of the self-balancing test piles was proposed. In terms of research on conducting self-balancing tests in engineering piles, Huang et al. [25] conducted self-balancing static-load tests on pile foundations of the Liyuetuo Bridge, and the tests showed that the self-balancing method was ideal for static-load tests of pile foundations subjected to large loads, but it is necessary to carry out self-balancing static-load tests in engineering piles cautiously. Using the self-balanced static-load test and statistical analysis of a large number of historical documents, Huang et al. [26] found that the problems of equilibrium point position, pile breaking, and combined jack in the self-balancing static-load test have not been perfected in theory and practice and should be used with caution or not in engineering pile static-load tests.
In summary, for the study of the load box self-balancing method in static-load tests on pile foundations, domestic and foreign researchers have carried out in-depth research on pile-tip grouting piles, the buried position of the load box, comparative analysis with the traditional static-load method and numerical simulation results, the analytical conversion method of the test results, and the applicability of the static-load test for the engineering pile. However, there are few studies on the static-load test of the double-load box in the super-long and large-diameter pile tip + pile side combined post-grouting pile, and the application of the existing self-balancing method in the static-load test of the pile foundation is mostly in the form of a single-load box. This detection method cannot effectively determine the bearing capacity parameters required for special pile foundation projects [27].
In order to explore the feasibility of the double-load box self-balancing method in the static-load test of super-long and large-diameter post-grouting bored piles, the double-load box self-balancing method was used to carry out the static-load test of two super-long and large-diameter post-grouting piles with different pile tip + pile side combinations in the complex stratum of the test pile site of the Yellow River Bridge, and the internal force changes in the pile body during the static-load test were monitored using an optical fiber strain gauge. By comparing and analyzing the results of the self-balancing static-load test of the double-load box before and after grouting, the bearing characteristics of the grouting pile after super-long and large-diameter combination are explored. The load-settlement relationship of pile foundation, the transfer law of axial force of pile body, and the exertion characteristics of pile-side friction resistance and pile-tip resistance are emphatically analyzed.

2. Project Overview

The main bridge of the Yellow River Bridge in the Jiaozuo-Xingyang section of the Jiaoping Expressway is 3656 m. It is the key control project of the project. The upper structure adopts the steel–concrete composite beam, and the lower structure is a vase pier and cap pile foundation. There are 380 pile foundations of the main bridge. It is the largest cantilever span and the first in scale and volume among the bridges under construction in China. After the completion of the project, it is of great significance to speed up the construction of the national central city of Zhengzhou, accelerate the deep integration of Zheng Jiao integration, promote the development and integration of tourism resources, and promote the economic development of the region along the route.
Due to the tight construction period, large scale, difficult construction, and high technical requirements of the project, especially the No.157~168 pier of the main bridge of the Yellow River Bridge that is located in the main channel of the Yellow River (the rest of the land pile foundation is located in the Yellow River beach area), it is necessary to pass through unstable strata such as the silty soil layer, silty sand layer, fine sand layer, silty clay layer, thick pebble layer, and nodule layer. To obtain the physical and mechanical indicators of each soil layer in the exploration holes at the test pile site, indoor geotechnical tests were conducted on the soil samples collected from the on-site drilling. The physical and mechanical properties of each layer of foundation soil are presented in Table 1. There are difficulties in drilling and hole collapse in pile foundation construction. Therefore, it is necessary to carry out test piles before the formal construction of the pile foundation project and optimize the design and construction technology of the pile foundation through the test pile work to ensure the stability and safety of the pile foundation.

3. Design and Preparation of Field Test Pile

3.1. Test Pile Position and Basic Parameters

Before the official construction of the main bridge over the Yellow River, two pile foundation test piles were carried out: one for pile-side annular pipe grouting + pile-tip open grouting pile SZ1 and the other for pile-side distributed grouting + pile-tip open grouting pile SZ2. The survey boreholes were drilled in the range of 10 m near the location of the test piles, and the locations of the test piles and the basic parameters are shown in Table 2 and Table 3 and Figure 1.

3.2. Pile Forming and Post Grouting Process Flow of Test Pile

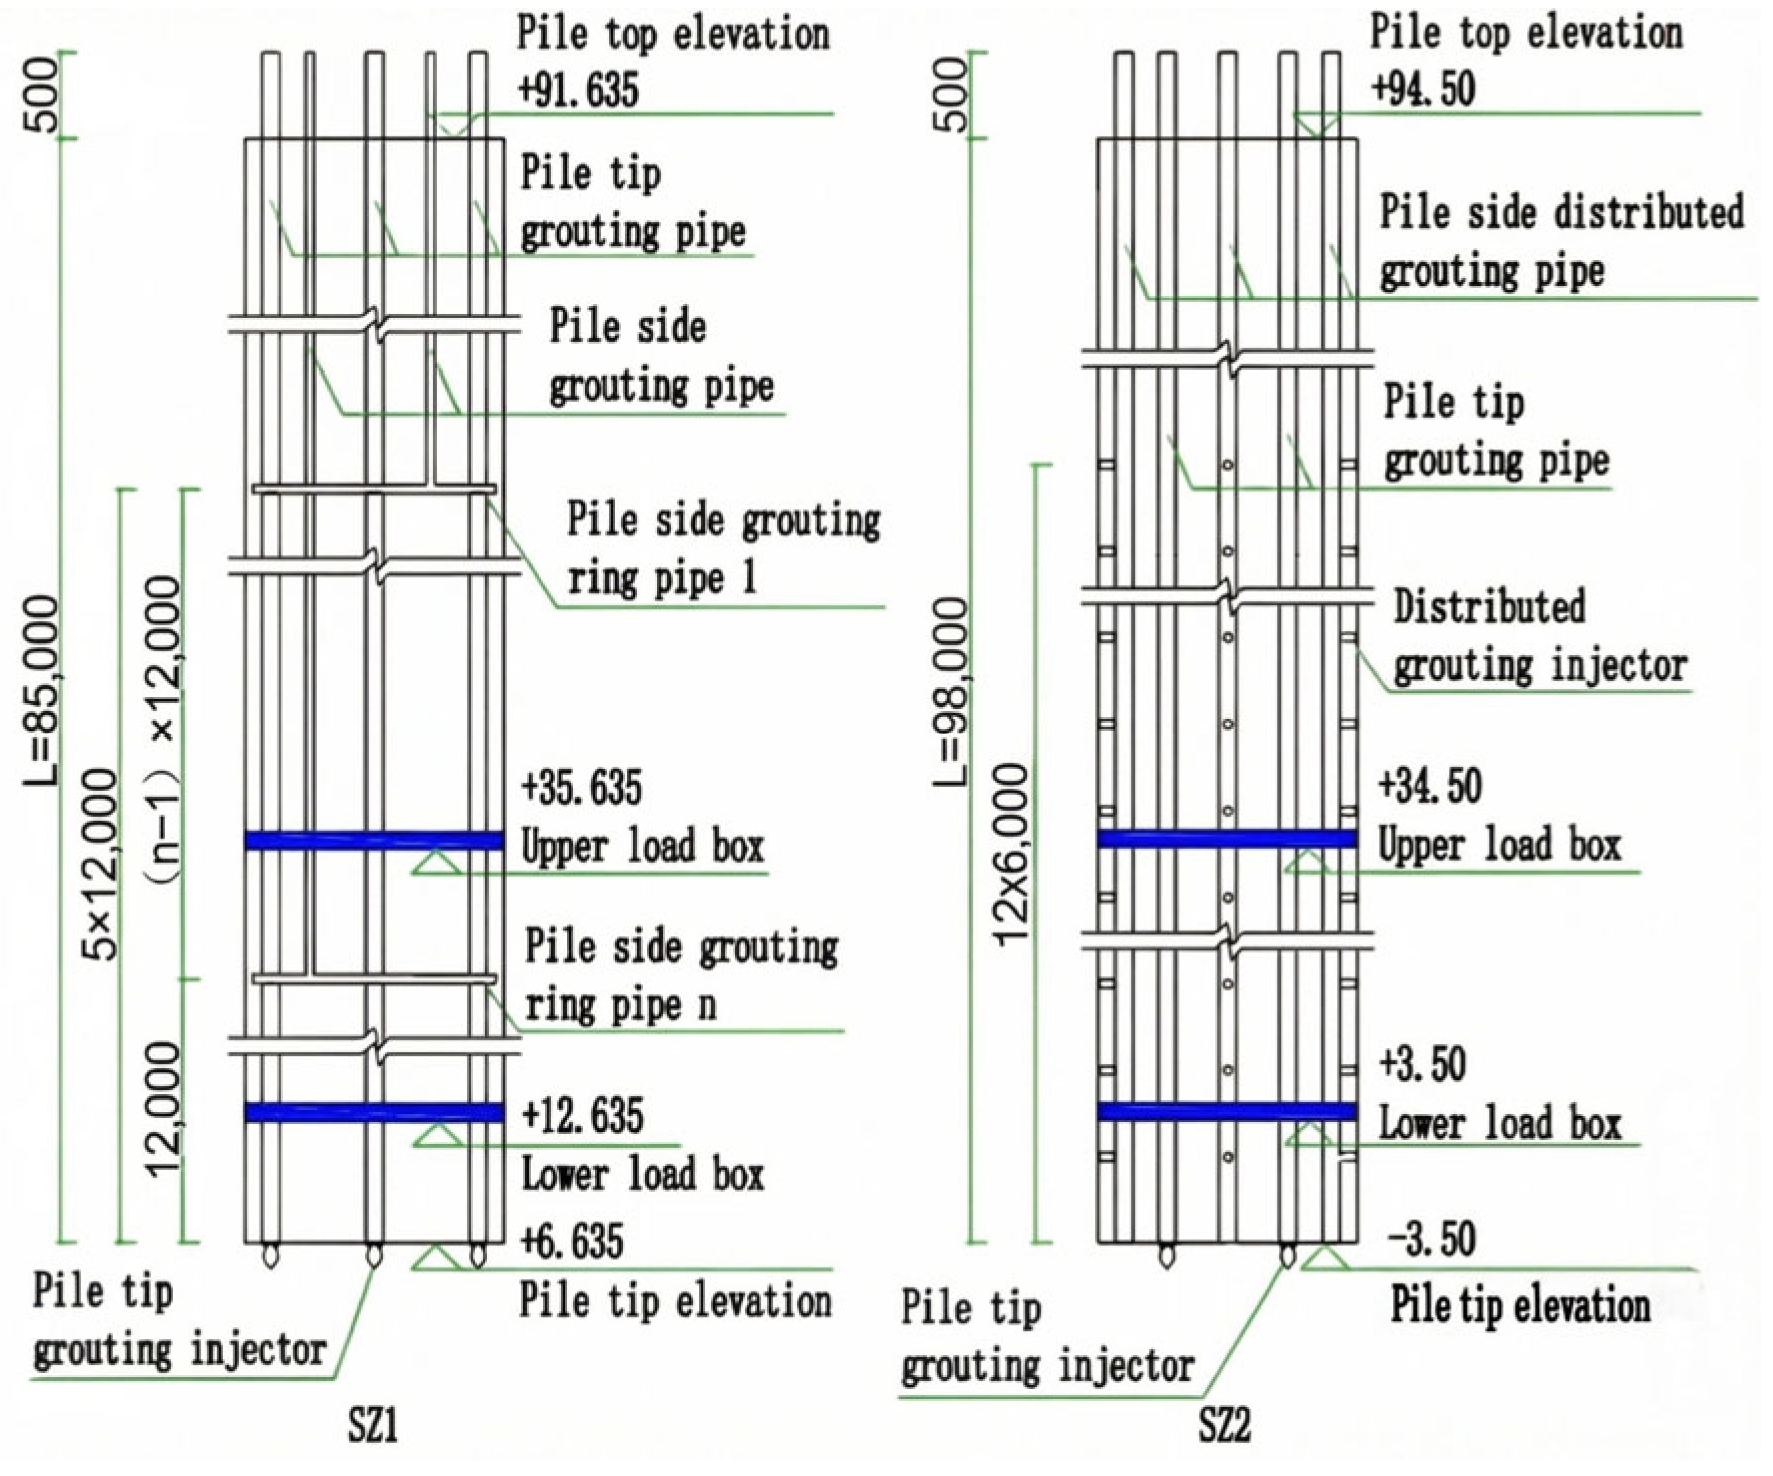
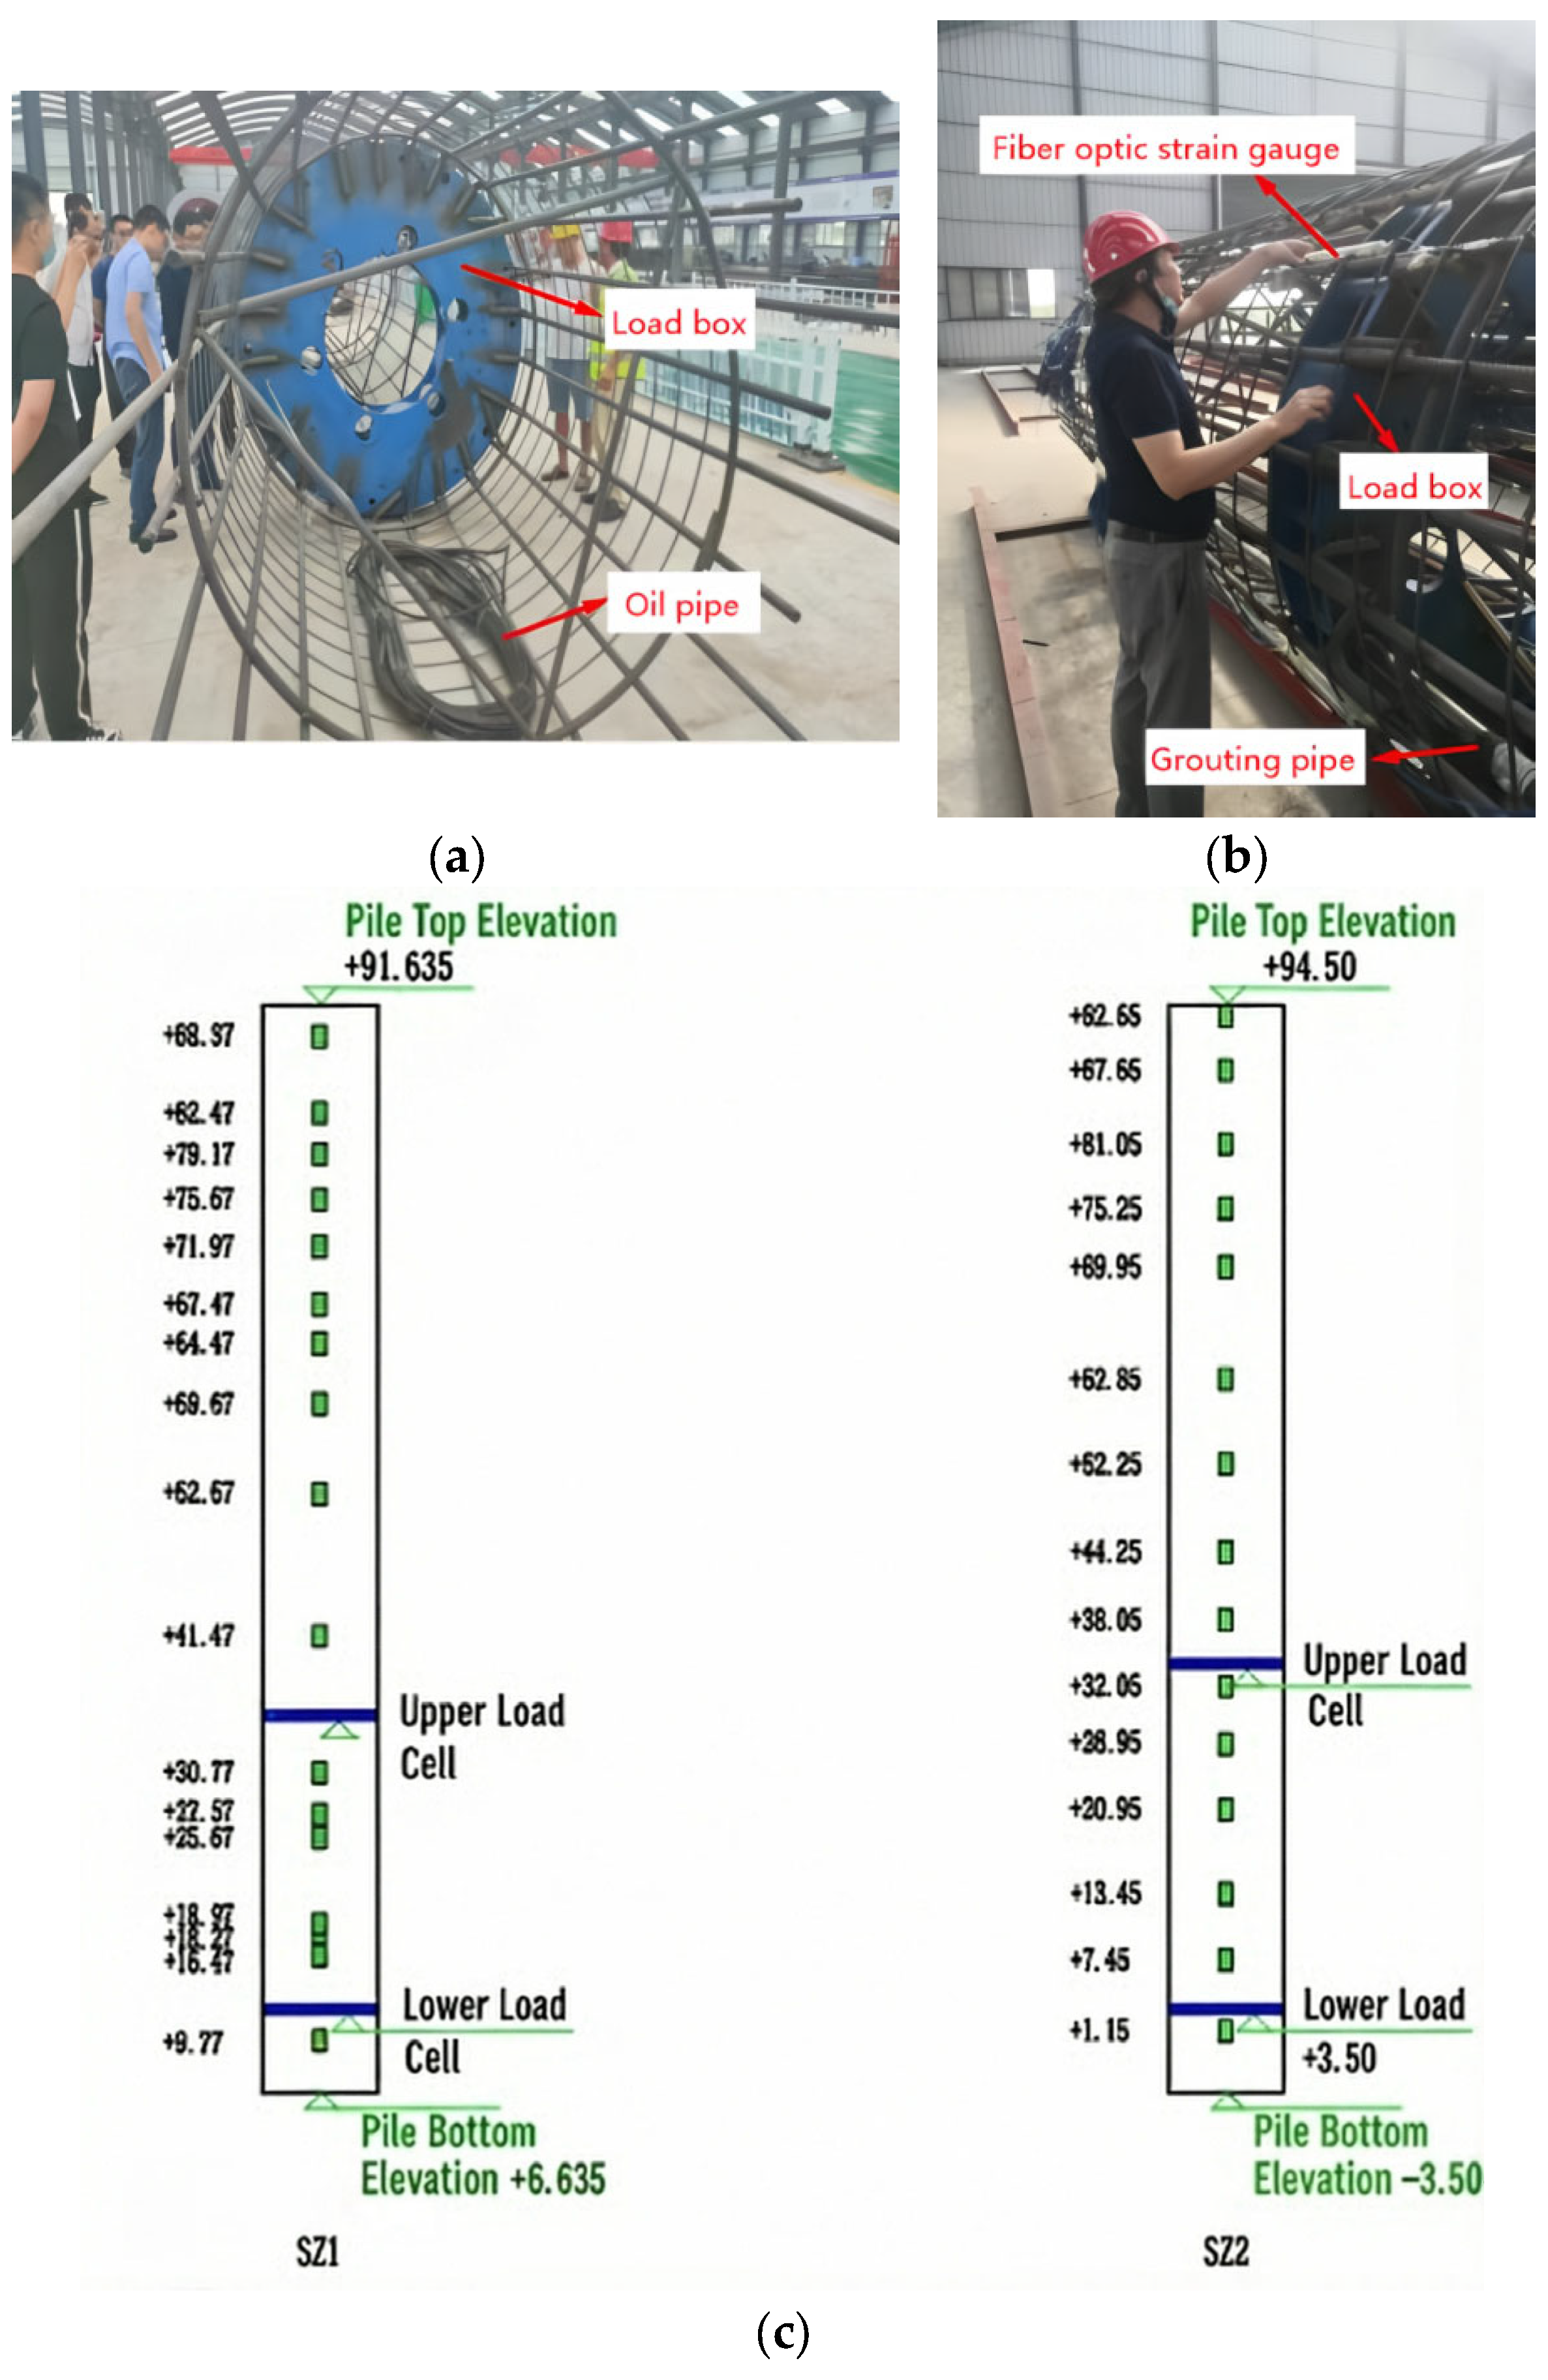
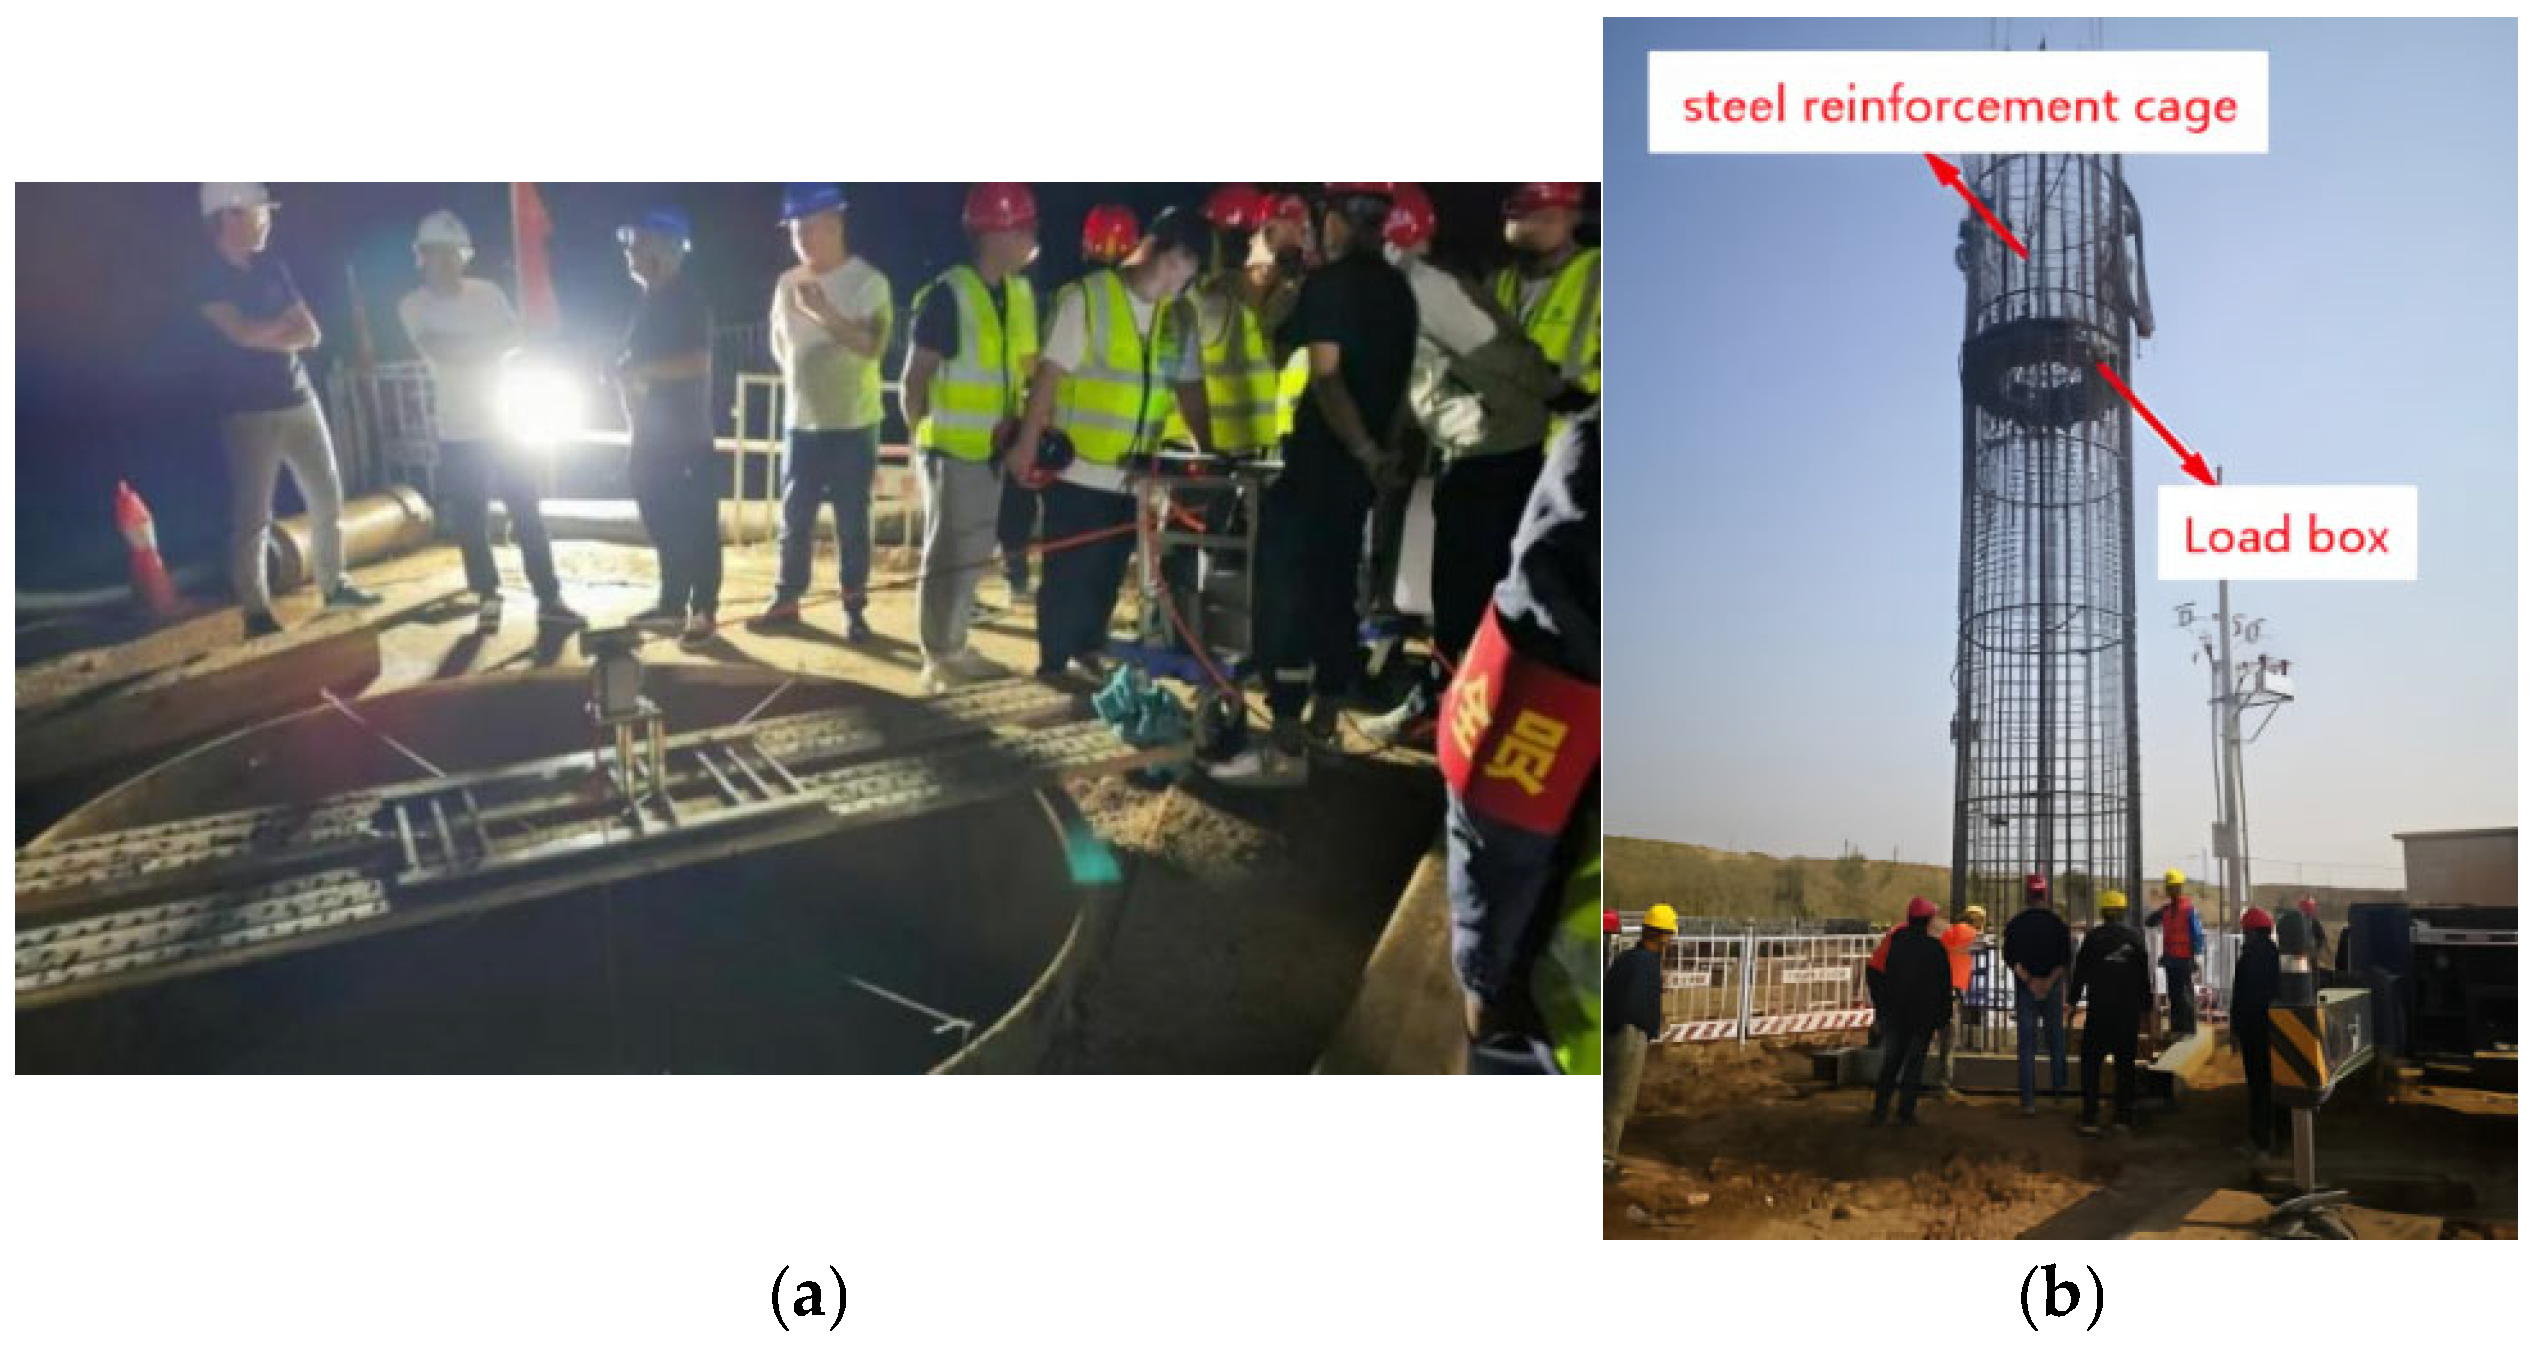
Before carrying out the drilling operation at the test pile site, it is necessary to determine the installation positions of the double-load box and the grouting pipe in advance (Table 4 and Figure 2). Before the completion of the drilling rig hole formation, hole clearing, and hole formation quality checking, the welding of the reinforcement cage and the installation and fixing of the load box, grouting pipe, optical fiber strain gauge, and other test equipment with each section of the cage need to be completed in advance (Figure 3). After completing the quality inspection of the borehole (Figure 4a), the combination of reinforcement cage, load box, grouting pipe, etc., is lowered into the borehole using the crane. During the lowering process, the connection work of each section of the steel cage, grouting pipe, and acoustic detection pipe was completed in sequence, as well as the binding and fixation work of the optical fiber strain gauge transmission line and the steel cage (Figure 4b). After the work of lowering the steel cage is completed, lower each section of the tank pipe in sequence. After fixing the tank pile pipe, the underwater concrete pouring for pile formation can be carried out. After the concrete strength of the pile body reaches the design requirements and exceeds 28 days, the integrity of the pile body can be tested, and after passing the test, the grouting equipment and materials can be stationed to carry out the post-grouting work.

3.3. Selection of Grouting Parameters

Based on practical experience and data analysis of a large number of post-grouting pile test projects, it is shown that the post-grouting quality of the pile foundation is mainly affected by many key factors such as grouting material performance, slurry mix ratio, grouting pressure control, total grouting amount, and grouting sequence. Therefore, before the post-grouting operation, the grouting materials and parameters must be scientifically determined according to the engineering characteristics and geological conditions.
  • Grouting material: P.O42.5 ordinary Portland cement is selected, and an appropriate amount of admixture can be added according to the specific conditions of different strata.
  • Slurry ratio: The water–cement ratio is controlled at 0.5 during formal grouting, and the initial stage of grouting or intermittent grouting can be appropriately adjusted.
  • Grouting pressure: Combined with the parameter suggestions of relevant standards and the construction experience under similar geological conditions, the grouting pressure at the pile tip of this project is 2.0~4.0 MPa and the grouting pressure at the pile side is 2.0~2.5 MPa;
  • Grouting amount: Refer to the relevant formulas in ‘Technical Specification for Post-grouting of Bridge Cast-in-place Piles’ (DB41/T 2465-2023) [28], Section 6.3, to calculate the grouting amount. After calculation, the grouting amount at the pile tip of the test pile SZ1 was 5.28 t, the grouting amount at the pile side was 2.0 t for a single layer, and the total grouting amount of the five layers was 10.0 t. The grouting amount at the pile tip of the test pile SZ2 was 5.94 t, the grouting amount at the pile side was 1.0 t for a single layer, and the total amount of 12 layers was 12.0 t.
  • Grouting sequence: Pile tip–pile side combination grouting adopts the sequence of “first pile side and then pile tip”. Pile-tip grouting can choose sequential equal or synchronous grouting, and pile-side grouting can implement equal amount of grouting devices in each layer to ensure uniform distribution of slurry and improve reinforcement effect.
  • The post-grouting parameters of each test pile are shown in Table 5.

3.4. Self-Balanced Static-Load Test of Pile Foundation

3.4.1. Self-Balanced Static-Load Test Scheme

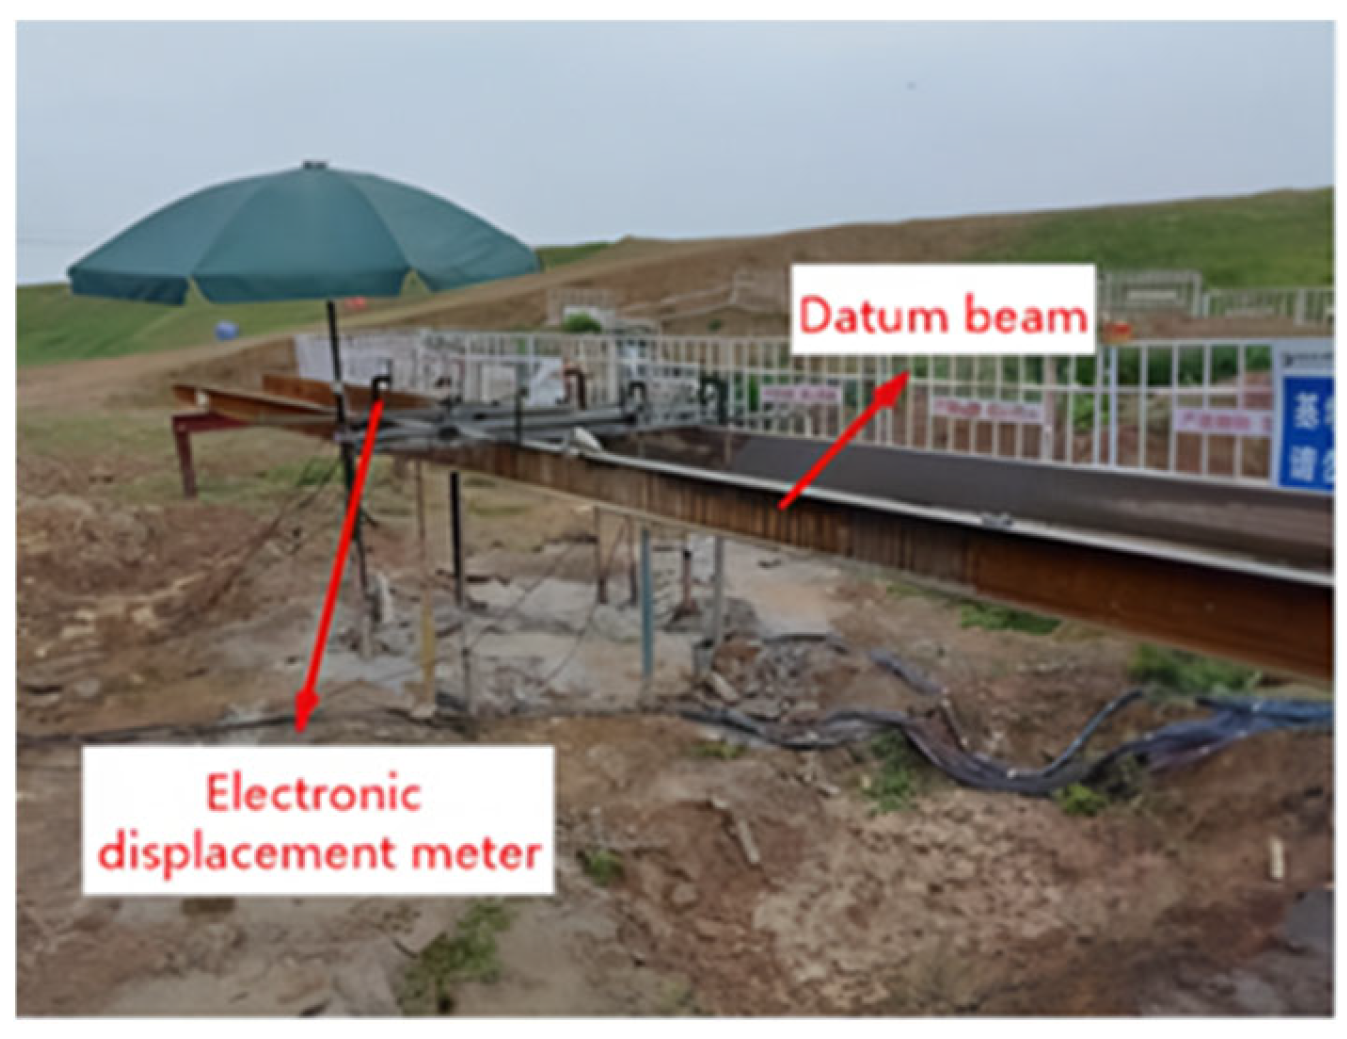
This test pile project adopts the double-load-box self-balancing test technology. During the self-balancing static-load test of pile foundation, in order to accurately analyze the bearing capacity and settlement and deformation characteristics of the piles, it is necessary to accurately measure the displacement of the pile body in the upper, middle, and lower sections of the test pile using an electronic displacement meter. The electronic displacement meter is firmly connected and fixed to the reference beam through the magnetic meter base. The arrangement of the electronic displacement meter at the top of each test pile is shown in Figure 5.
The self-balanced static-load test of the pile foundation double-load box strictly follows the relevant provisions of the ‘Technical Specification for Self-balanced Static Load Test of Building Foundation Piles’ (JGJ/T 403-2017) [29], and the slow maintenance load method is used for loading. The static-load test of the pile is divided into two stages before and after grouting: the first stage is carrying out when the concrete strength reaches the standard after the pile is formed and the benchmark data is obtained; the second stage is carrying out after the cement slurry strength reaches the standard after 28 days of grouting maintenance.
The double-load box is arranged to divide the test pile into three sections: upper, middle, and lower. The specific static-load test steps are as follows:
1.
Step 1: During the test, the upper load box is locked first, so that the upper and middle piles form a whole, and then the lower load box is filled with oil and pressurized. Due to Ql ≤ Qu + Qm, the lower pile is destroyed first, and the limit value of pile-side friction and pile tip resistance can be measured.
2.
Step 2: Keep the lower load box in the open state, so that the middle pile and the lower pile are separated, and then the upper load box is subjected to hydraulic loading. Due to Qm ≤ Qu, the middle pile will first reach the ultimate failure state, and the pile-side friction limit value of the middle pile can be measured.
3.
Step 3: In the final stage of the test, the lower load box is temporarily locked to form an overall stress system for the middle and lower piles, and then the upper load box is subjected to hydraulic loading. Due to Qu ≤ Ql + Qm, the upper pile is destroyed first, and the limit value of the pile-side friction resistance of the upper pile can be measured.
Among them, Qu, Qm, and Ql are the bearing capacity of the upper, middle, and lower sections of the pile foundation, respectively.
Loaded by the high-pressure oil pump, the oil jack inside the load box is connected in parallel to the oil separation valve through the hydraulic oil pipe and the oil separation valve is connected to the electric oil pump by a main oil inlet pipe. When the load is loaded, the electric oil pump drives the hydraulic oil to enter the oil distribution valve through the main inlet tubing. The oil distribution valve simultaneously supplies oil to the jack and drives the hydraulic jack to rise. The electric oil pump is automatically controlled by the static-load tester of the pile foundation through the voltage converter. All the work of loading, pressure compensation, load control, stability judgment, and measurement of the recorded settlement is automatically controlled by the static-load tester of the pile foundation.

3.4.2. Determination of Ultimate Bearing Capacity of Pile Foundation

According to the industry standard ‘Technical specification for self-balanced static-load test of building foundation piles’ (JGJ/T 403-2017) [29], the ultimate bearing capacity of pile foundation is shown in Equation (1).
Q u = Q u u W γ 1 + Q u m + Q u d
In the formula, Q u is the limit value of vertical bearing capacity of single pile (kN); Q u u is the ultimate load value of the upper pile (kN); Q u m is the ultimate load value of the middle pile (kN); Q u d is the ultimate load value of the lower pile (kN); W is the sum of the dead weight and additional weight of the pile on the upper section of the load box (kN); and γ 1 is the correction coefficient of the tested pile, which should be determined according to the actual situation through the comparison test under similar conditions and regional experience. The coefficient was 0.77 for SZ1 before and after grouting, and 0.70 for SZ2. When there is no reliable comparison test data and regional experience, it can be taken from 0.8~1.0.

4. Test Results and Analysis

4.1. Load–Settlement of Pile Foundation

4.1.1. Equivalent Conversion of Self-Balanced Static-Load Test Results

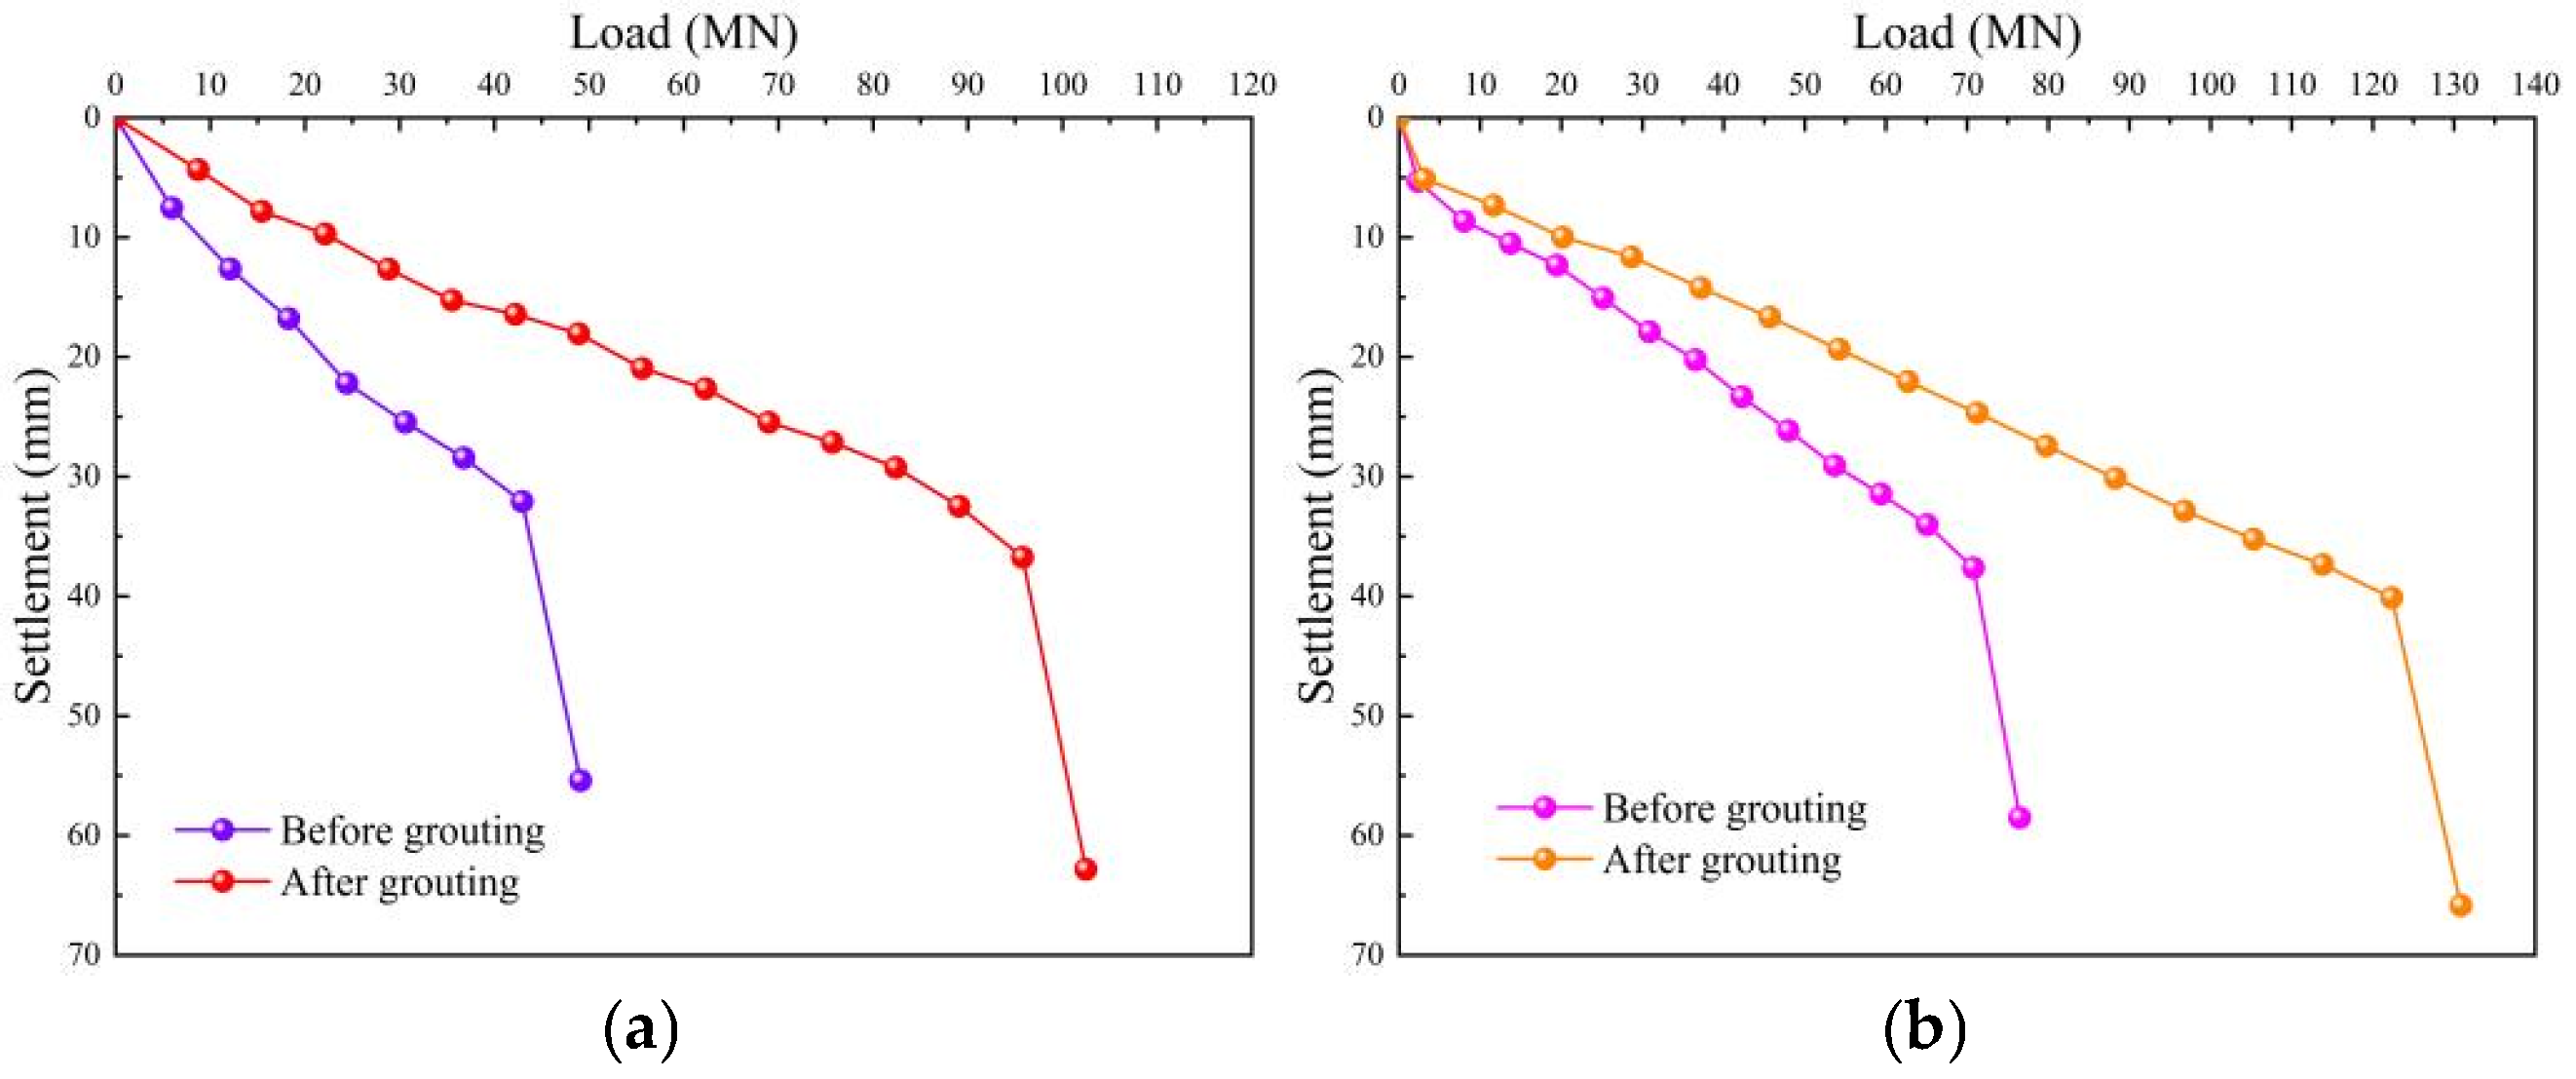
Compared to the traditional static-load test, due to the differences in test principles and loading methods, the self-balancing test results cannot be directly used for engineering design or compared to the traditional static-load test results, so equivalent conversion is required. The equivalent conversion of the results of the self-balancing static-load test is to convert the load–displacement data measured by the self-balancing method into the equivalent load–displacement curve in the traditional static-load test for engineering application and comparative analysis. According to the equivalent conversion method in ‘Technical specification for self-balanced static-load test of building foundation piles’ (JGJ/T 403-2017) [29], the results of self-balanced static-load test before and after grouting of test piles SZ1 and SZ2 are equivalently converted to obtain the load–settlement curve of pile foundation corresponding to the traditional static-load test, as shown in Figure 6.
In Figure 5, it can be seen that the load–settlement curves of the two test piles before and after grouting show similar changes, and there are obvious inflection points, that is, after experiencing gentle changes, there is a steep drop. However, the load–settlement curve after grouting is more significant in the gentle section before the inflection point, and the ultimate bearing capacity is significantly improved. In the early stage of loading, the two test piles showed a linear relationship between the settlement of the pile top and the load, but with the increase in the load, a difference in bearing capacity before and after grouting gradually appeared. Under the same load level, the settlement of the pile top of the test pile after grouting is significantly reduced compared with that before grouting, and the inflection point of the curve moves to a larger load direction, indicating that grouting effectively improves the pile–soil interface characteristics and improves the overall bearing capacity of the pile foundation. Prakash et al. [30] and Zhang et al. [31] proposed that the load at the level immediately preceding failure can be adopted as the ultimate bearing capacity of a single pile. Therefore, the ultimate bearing capacity of the test pile SZ1 and SZ2 before grouting is 42,940 kN and 70,795 kN, respectively, and the ultimate bearing capacity after grouting is 95,789 kN and 122,338 kN, respectively. The bearing capacity is increased by 123.1% and 72.8%. Under the condition that the soil characteristics and pile parameters around the pile are exactly the same, the self-balancing static-load test of the same pile before and after grouting was carried out, respectively. The test results show that the post-grouting of the pile foundation can significantly improve the bearing capacity of the pile foundation and reduce the settlement of the pile top, and the grouting effect is remarkable.

4.1.2. Comparative Analysis with the Traditional Bearing Capacity Calculation Results

Referring to the ‘Technical Code for Building Pile Foundations’ (JGJ 94-2008) [32], the vertical compressive ultimate bearing capacity values of the test piles SZ1 and SZ2 before and after grouting were calculated, respectively, and compared with the self-balancing test results.
The calculated values of the ultimate bearing capacity of the test pile SZ1 before and after grouting are 41,874 kN and 92,496 kN, respectively, and the measured values of the ultimate bearing capacity obtained by the self-balancing static-load test are 42,940 kN and 95,789 kN, respectively. The calculated values of the ultimate bearing capacity of the test pile SZ2 before and after grouting are 68,435 kN and 111,496 kN, respectively, and the measured values of the ultimate bearing capacity obtained by the self-balancing static-load test are 70,795 kN and 122,338 kN, respectively. The measured values of the self-balancing static-load test of the vertical ultimate bearing capacity of the test piles SZ1 and SZ2 are greater than the calculated values of the empirical formula, indicating that the measured values of the self-balancing static-load test have certain reliability.

4.2. Pile Axial Force

The monitoring of pile axial force is an important part of exploring the law of load transfer in pile foundation engineering. Therefore, an advanced optical fiber strain gauge is arranged inside the pile body for data acquisition. The core advantages of fiber optic strain gauges are reflected in their high measurement resolution and measurement accuracy, small size, corrosion resistance, and anti-electromagnetic interference. The axial force of the steel bar in the section under a certain load can be calculated according to Formula (2). According to the principle of deformation coordination between steel bar and concrete, combined with the relative stiffness of steel bar and pile concrete, the axial force at each section of pile body can be calculated. This calculation method is based on the assumption that the steel bar and the concrete work together and the deformation is consistent during the loading process, that is, the bonding force between the steel bar and the concrete can ensure that the two maintain the same strain under the load.
P t = K p [ ( F F 0 ) K t ( T T 0 ) ] ,
In the formula, K p is the axial force calibration coefficient, which is the ratio of the axial force of the sensor to the wavelength; K t is the temperature correction coefficient, which is the ratio of wavelength offset to temperature; F 0 is the initial wavelength before the test; T 0 is the ambient temperature before the test; F is the wavelength value under a certain load; and T is the ambient temperature under a certain level of load.
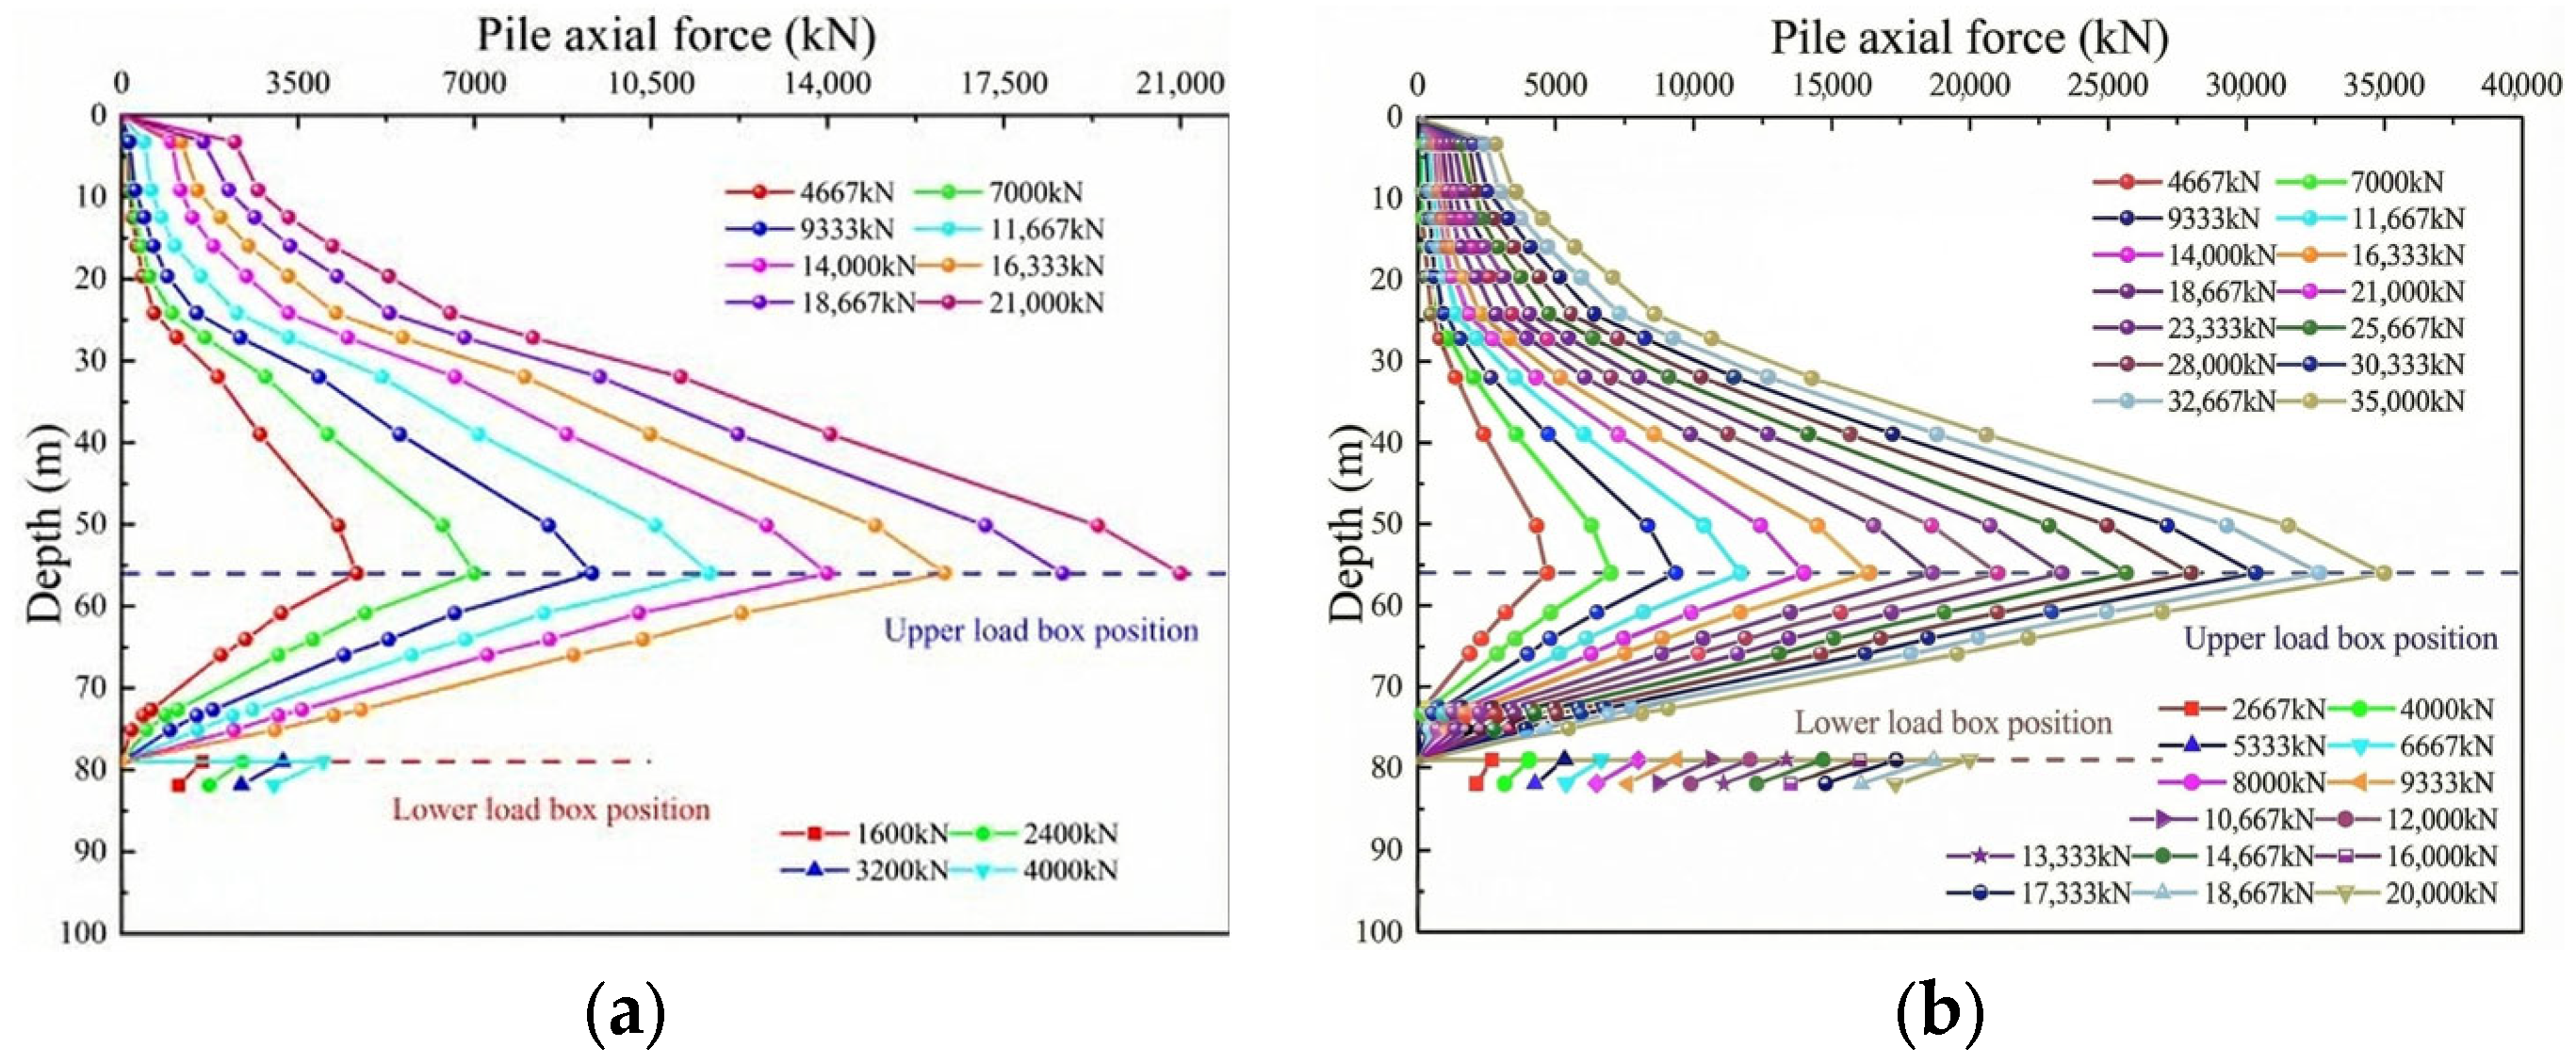
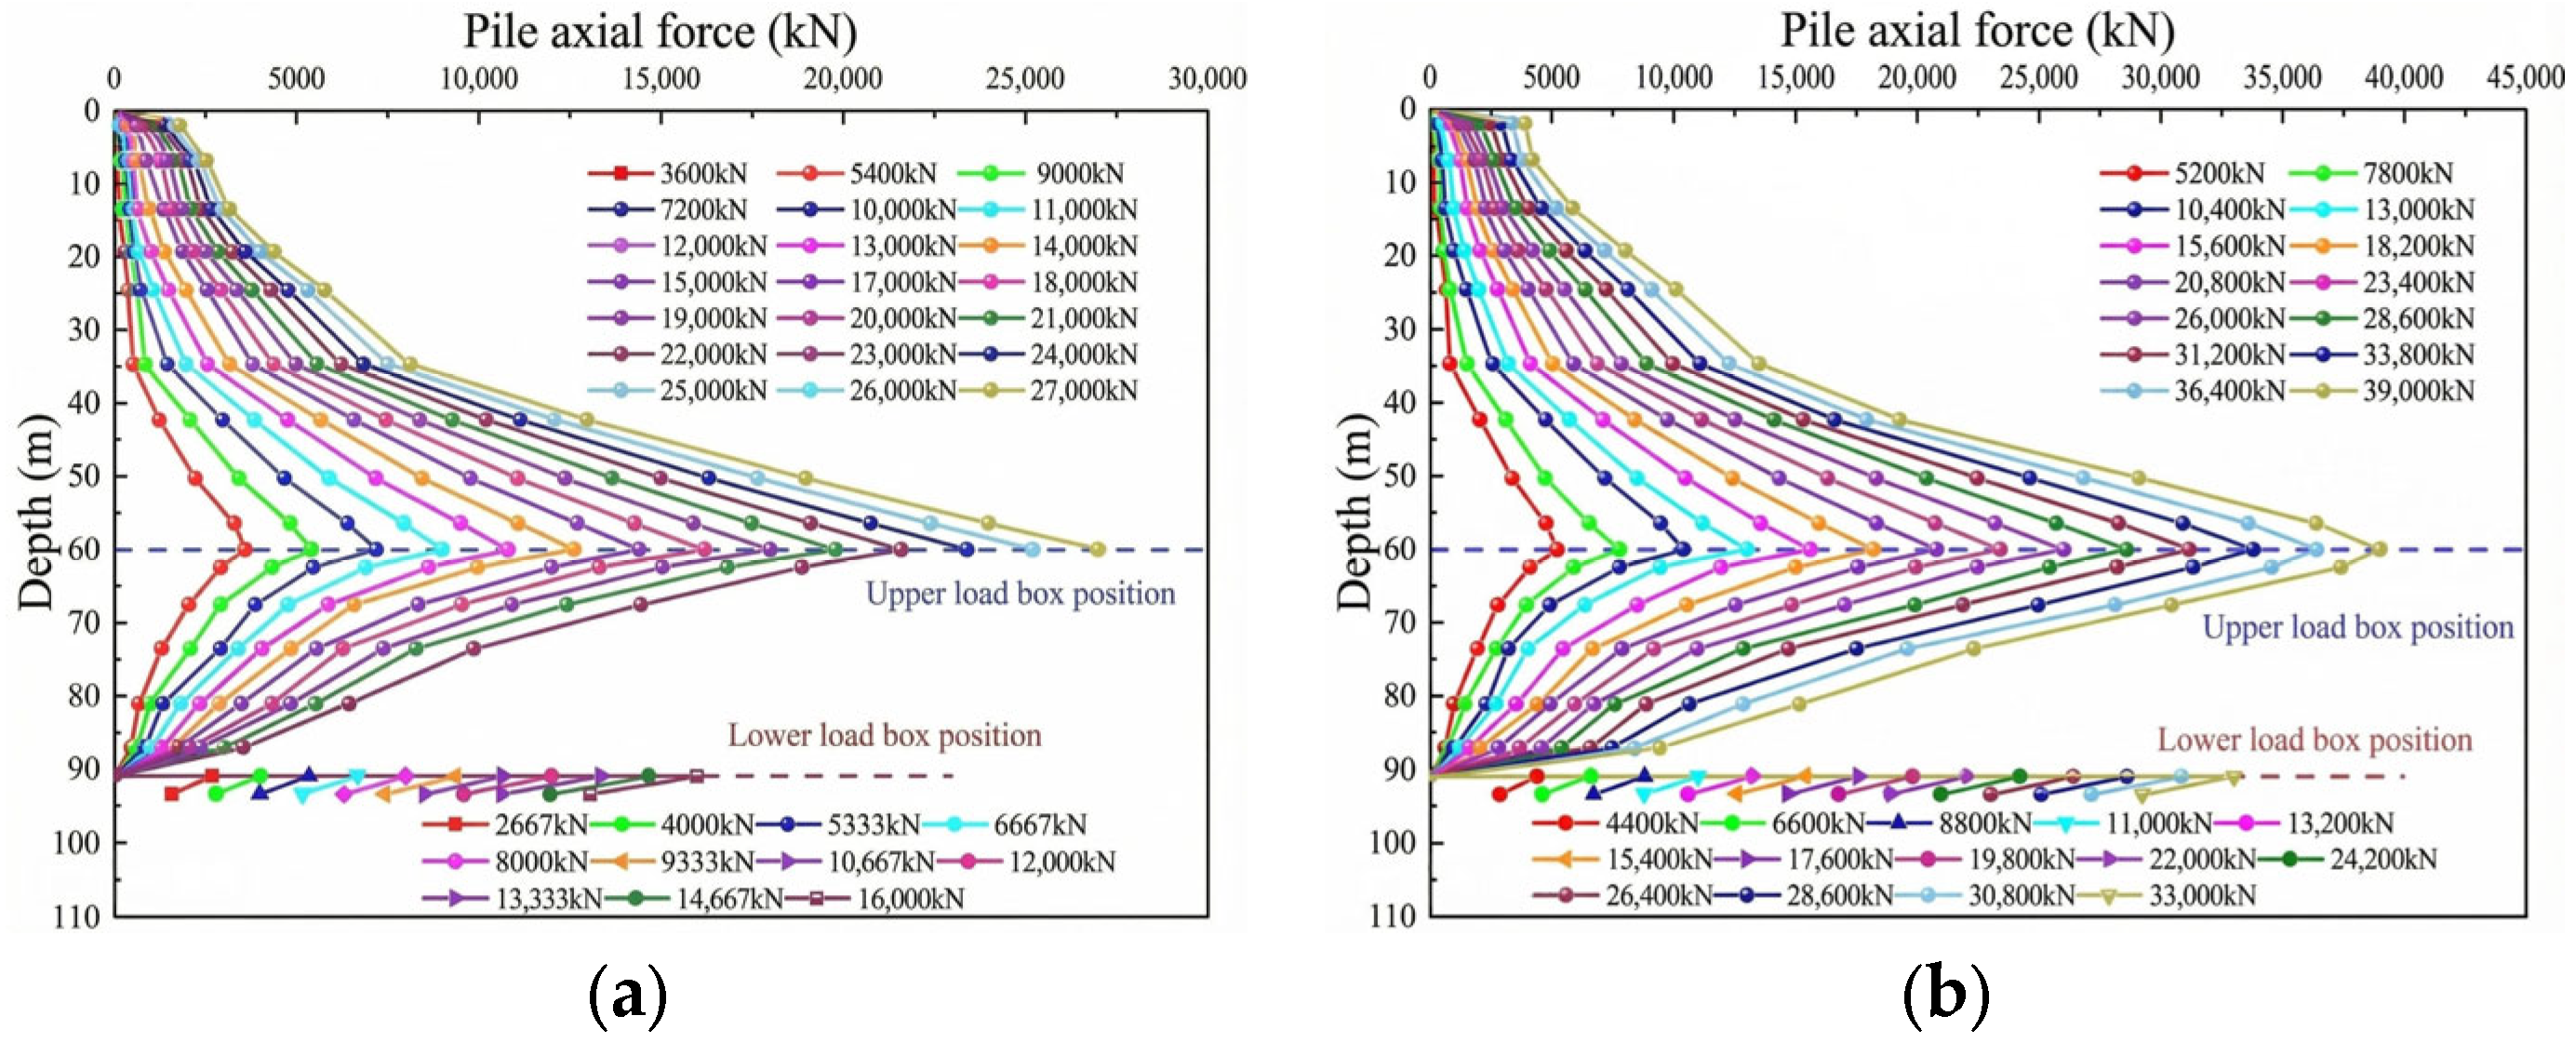
The distribution of the axial force of the test piles SZ1 and SZ2 along the depth direction is shown in Figure 7 and Figure 8.
In Figure 6 and Figure 7, it can be seen that the axial force distribution of the pile body shows significant spatial characteristics: the maximum value appears near the upper load box and decreases upward along the upper pile and downward along the middle pile. The overall distribution is similar to a triangular distribution. This distribution law reflects the load transfer mechanism: the load box position first generates stress concentration, and then the stress gradually develops along the pile body. The initial load of the test is small, and the axial force of the pile body does not change significantly along the depth. As the load increases, the side friction resistance of the soil around the pile gradually develops, the axial force of the pile body increases significantly, and the distribution characteristics are more obvious.
By comparing the axial force distribution maps of the pile body above the load box under each test pile before and after grouting, it was found that the curve after grouting is more gentle, indicating that the axial force of the pile body decreases more significantly along the buried depth of the pile foundation under the same load. This shows that the side friction resistance of the test pile is further enhanced after grouting. The pressure slurry returns or infiltrates along the pile–soil interface in the pile-side grouting section and forms a high-strength cement stone body through filling, infiltration, and compaction. The physical and mechanical properties of the soil layer around the pile improved, and the problem of mud cake on the side wall of the pile improved and was eliminated. Because the lower load box is close to the pile tip and the length of the lower pile is short, the axial force distribution characteristics of the lower pile can approximately reflect the resistance of the pile tip. By comparing and analyzing the axial force distribution diagram of the lower pile before and after grouting, it was found that the axial force of the pile body changed more significantly along the buried depth of the pile foundation after grouting, indicating that the grouting process effectively enhances the pile-side friction resistance and improves the performance characteristics of the pile tip resistance. Under ultimate load, through the comparative analysis of the axial force at the pile tip position before and after grouting, it can be clearly observed that the axial force at the pile tip after grouting significantly improved. This shows that the pile tip grouting of any combination of post-grouting methods has a good compaction effect on the pile tip soil and improves the mechanical properties of the pile tip soil. This improvement is not only reflected in the increase in soil compactness, but also in the improvement of soil shear strength and deformation modulus.

4.3. Pile-Side Friction

The side friction resistance of pile is the friction resistance generated by the relative displacement of pile–soil interface. Its performance characteristics are affected by multiple factors, including soil properties, pile-forming technology, the relative displacement of the pile–soil interface, etc. The self-balancing test method of pile foundation adopts a unique loading mechanism, which is essentially different from the traditional surcharge method and anchor pile method. During the test, the middle pile below the upper load box is subjected to positive load, and the positive friction resistance is generated on the pile side. The upper pile above the upper load box is subjected to reverse load, and the pile side produces negative friction resistance. According to the axial force difference between the two adjacent measuring points of the pile body and the area of the cross section of the pile body, the pile-side friction resistance value between the two adjacent measuring points under various loads is calculated. The calculation formula is shown in the following Formula (3):
q s i = Δ P π D L ,
In the formula, Δ P is the axial force difference between the adjacent test sections of the pile body(kN); D is the diameter of the pile(m); and L is the vertical distance between the adjacent test sections of the pile (m).
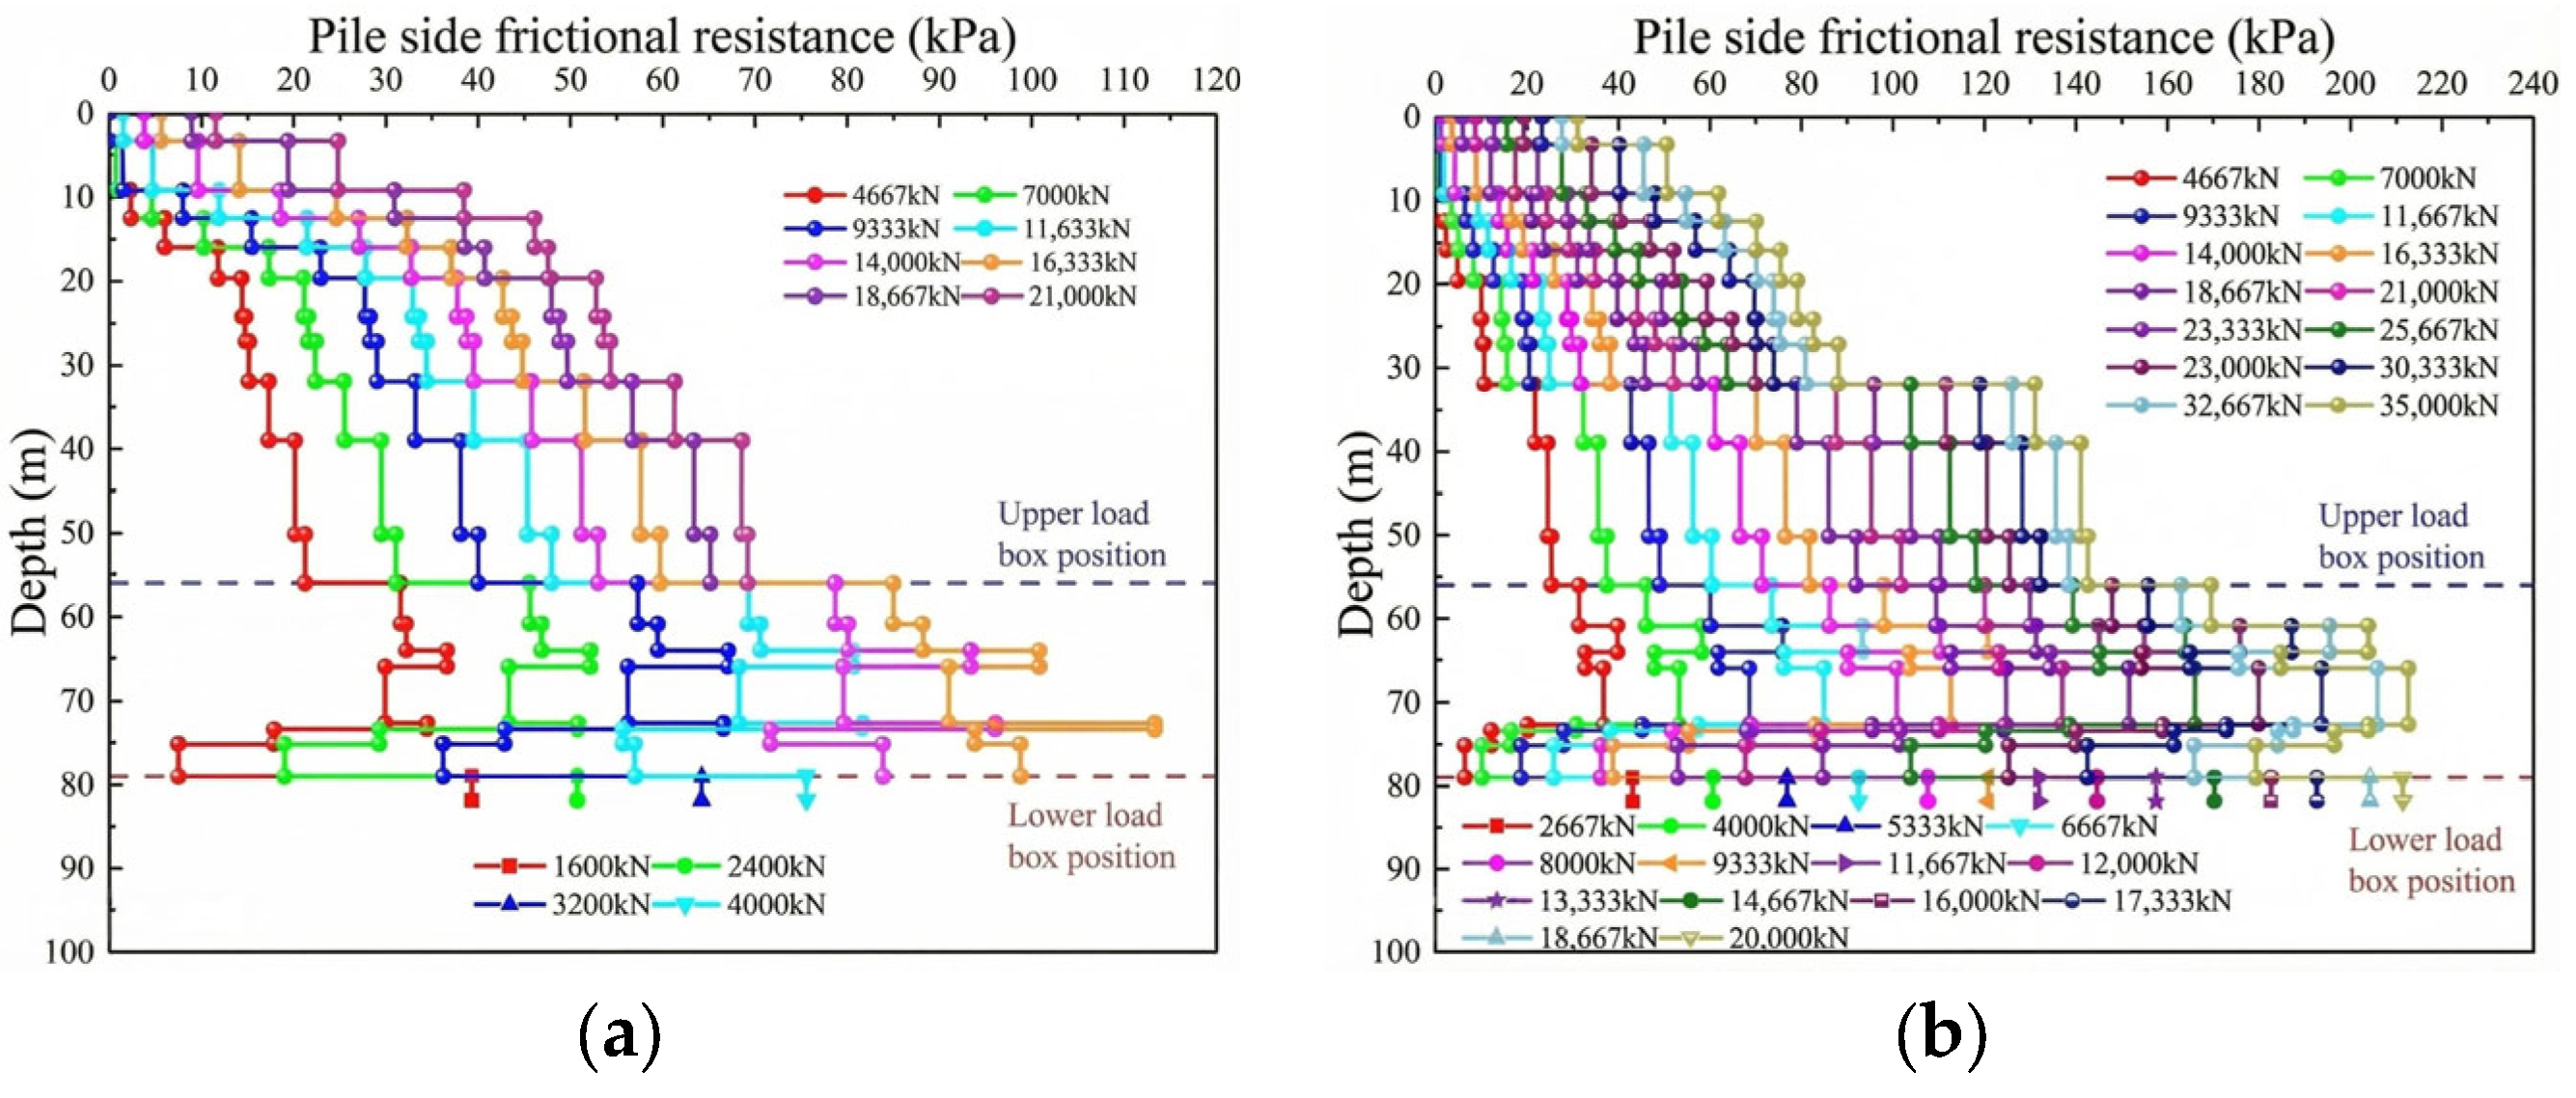
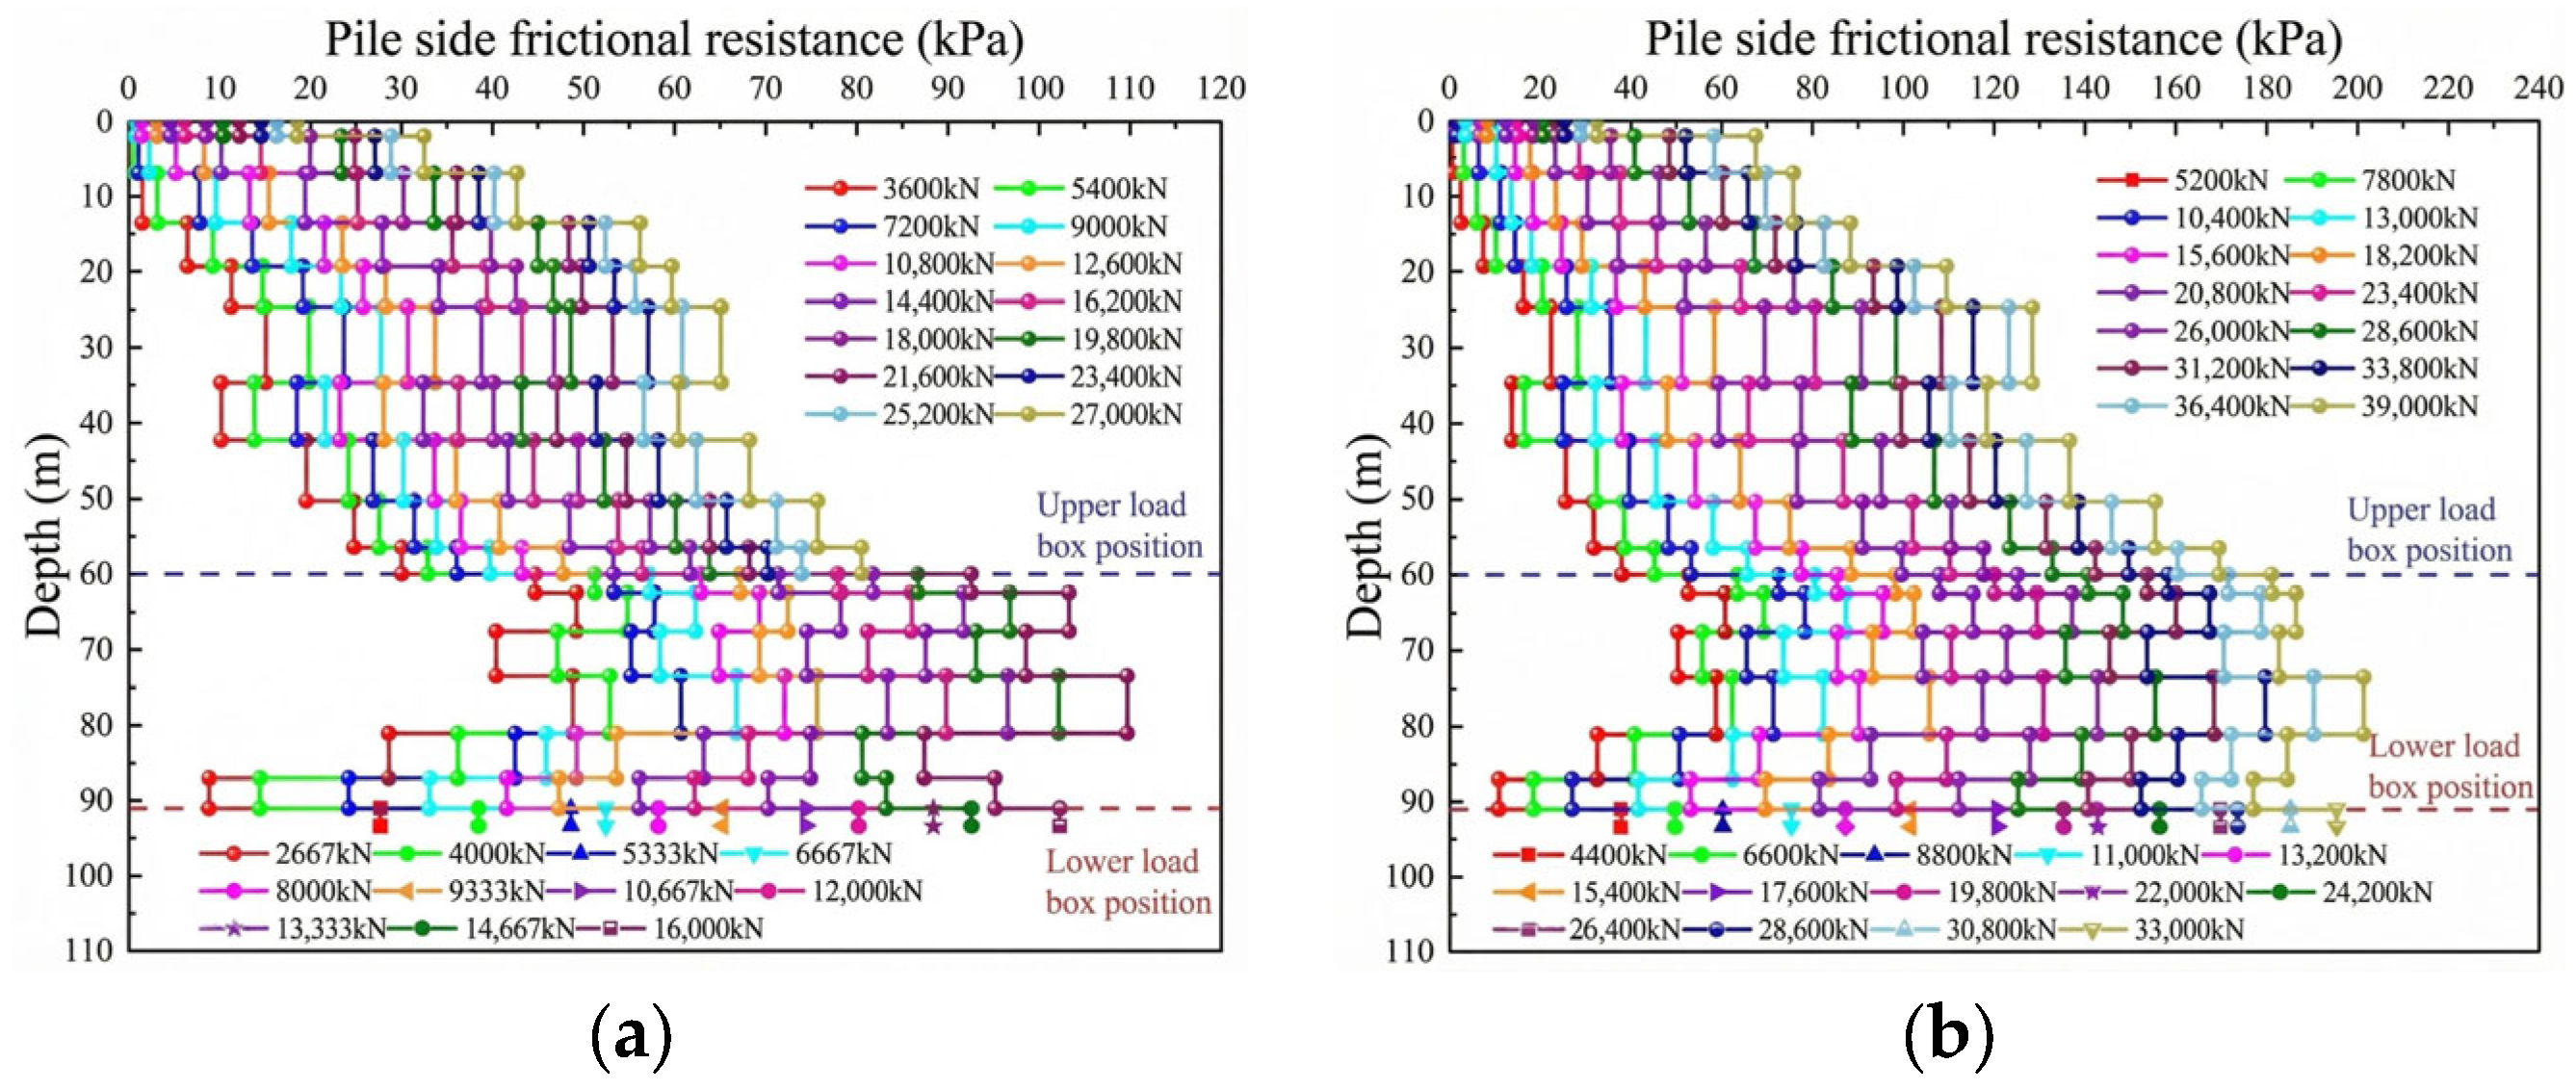
The distribution of pile-side friction resistance along the buried depth of pile foundation before and after grouting of test piles SZ1 and SZ2 under various loads is shown in Figure 9 and Figure 10.
In Figure 8 and Figure 9, it can be seen that the pile-side friction resistance of different soil layers is different due to the different nature of the soil layer and the pile-side friction resistance of the same soil layer is different due to the different location. In the process of graded loading, the pile-side friction resistance of the soil layer near the load box is the first to play, and the side friction resistance of the middle and lower piles is fully exerted while the soil friction resistance of the upper pile away from the load box area is relatively insufficient and has not yet entered the plastic state. The test shows that, under the same load, the side friction resistance of the middle and lower piles is generally higher than that of the upper piles. This phenomenon stems from the unique loading mechanism of the double-load-box self-balancing method. Different from the single-load-box method and the traditional stacking method, the double-load-box self-balancing method forms a more complex pile–soil interaction mode through the synergistic effect of the upper and lower load boxes.
Comparing the development of pile-side friction resistance before and after grouting test piles SZ1 and SZ2, the extreme value of the pile-side friction resistance of test pile SZ1 increased from 113.3 kPa before grouting to 212.7 kPa after grouting, with an increase of 87.73%. The extreme value of the pile-side friction resistance of the test pile SZ2 increased from 109.7 kPa before grouting to 201.4 kPa after grouting, with an increase of 83.59%. Comparing the changes in pile-side friction resistance of test piles SZ1 and SZ2 before and after grouting horizontally, it was found that, under the action of loads at all levels, the pile-side friction resistance of each soil layer after grouting is significantly higher than that before grouting, and the pile-side friction resistance of the soil layer near the test pile load box increases greatly. This shows that post-grouting effectively improves the stress characteristics of the pile–soil interface and the structural stiffness of the soil around the pile so that the level of pile-side friction resistance can be improved and the characteristics of pile-side friction resistance are related to the loading position of the load box.

4.4. Pile Tip Resistance

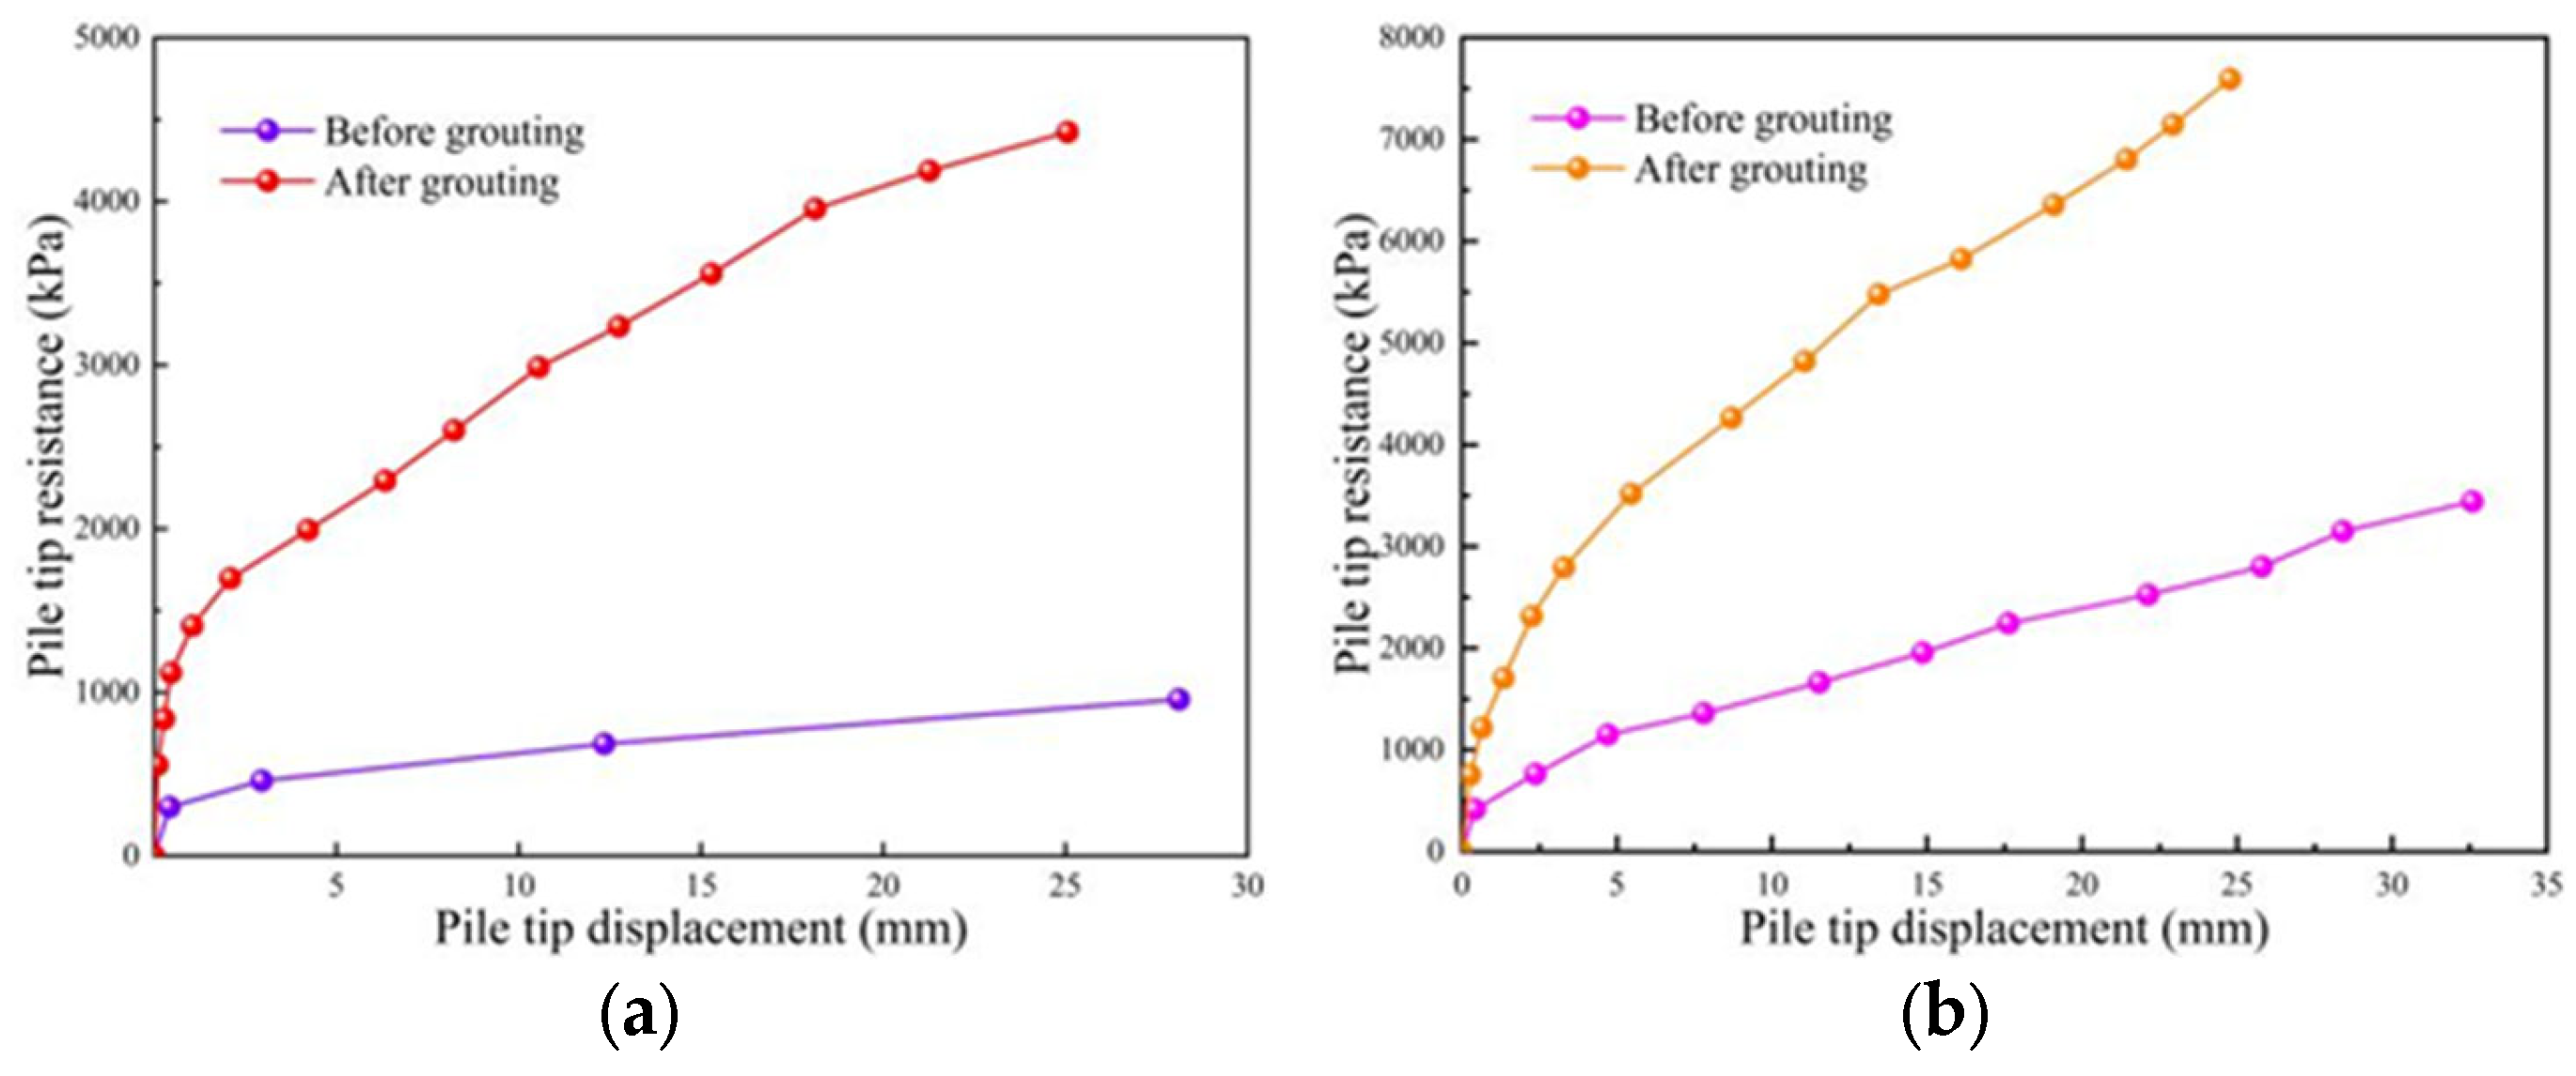
According to the principle of mechanical balance, the pile tip resistance is obtained by subtracting the side friction resistance of the lower pile from the downward load of the lower load box, and the pile tip displacement can be obtained by subtracting the pile compression of the lower pile from the maximum downward displacement of the lower load box. The pile tip resistance–pile tip displacement curves of test piles SZ1 and SZ2 before and after grouting are shown in Figure 11.
In Figure 10, it can be seen that the pile tip resistance of test piles SZ1 and SZ2 before and after grouting gradually increased with the increase in load, and the pile tip resistance-pile tip displacement curves before and after grouting showed similar trends. This phenomenon confirms that post-grouting has a reliable engineering effect and stable performance in improving the bearing capacity of pile foundation and controlling the settlement of pile top. The ultimate end resistance of the test pile SZ1 before and after grouting was 956.2 kPa and 4423.4 kPa, respectively, and the ultimate end resistance increased by 362.6%. The ultimate end resistance of the test pile SZ2 before and after grouting was 3441.1 kPa and 7592.0 kPa, respectively, and the ultimate end resistance increased by 120.6%. After grouting, the pile tip resistance of the test piles SZ1 and SZ2 under the ultimate load improved to varying degrees compared to before grouting, and the ultimate end resistance of the test pile SZ1 increased greatly. This shows that the slurry hardening after grouting forms the enlarged end of the pile tip and solidifies the sediment at the pile tip, which increases the density of the soil layer at the pile tip and the supporting stiffness of the bearing layer, resulting in a significant increase in the pile tip resistance. Meanwhile, the “lower-first-then-upper” loading sequence achieves active compaction of the soil at the pile tip by guiding the downward movement of the lower pile segment, providing a more optimal soil foundation for post-grouting reinforcement. The enlarged pile tip and solidified sediment formed by grouting further amplify the compaction effect, ultimately realizing a significant improvement in the pile tip bearing capacity. This loading sequence design is a key factor ensuring the compaction effect of the soil at the pile tip and the consistency of the test results with actual engineering conditions.

5. Conclusions

Compared to before grouting, the ultimate bearing capacity of test piles SZ1 and SZ2 increased by 123.1% and 72.8%, respectively, with a significant reduction in pile top settlement under the same load level, demonstrating remarkable grouting effectiveness; meanwhile, the measured values of the double-load-cell self-balanced static-load test for the vertical ultimate bearing capacity of SZ1 and SZ2 were greater than the calculated values from standard empirical formulas, indicating that the measured results of this test method possess certain reliability compared to traditional-bearing-capacity empirical formula calculations. After grouting, the pile foundation-bearing capacity is enhanced, the axial force distribution along the pile body becomes more gentle, and the axial force changes more noticeably under the same load, which shows that grouting improves the stress state of the soil around the pile and the exertion of pile-side friction resistance and pile tip resistance influences the transmission of axial force along the pile body. Under all levels of load, the pile-side friction resistance at each depth after grouting was higher than that before grouting, with a substantial increase in the pile-side friction resistance near the load box, and the characteristics of pile-side friction resistance were related to the loading position of the load box. Additionally, the ultimate tip resistance of SZ1 and SZ2 after grouting was 362.6% and 120.6% higher than that before grouting, respectively, among which SZ1 exhibited a more significant increase in ultimate tip resistance. The main reason for this is that there was more sediment at the pile end and the bearing stiffness of the pile-end bearing layer was relatively small before grouting, which restricted the full exertion of the pile tip resistance.
Looking forward, future research could be expanded in the following aspects to further deepen our understanding of super-long large-diameter post-grouted piles. Firstly, based on the field and indoor test data obtained in this study, numerical simulation models can be established to explore the coupling effects of grouting parameters (e.g., grouting pressure, water–cement ratio) on the reinforcement effect and reveal the multi-dimensional mechanism of slurry diffusion in complex strata. Secondly, long-term monitoring tests of post-grouted piles should be carried out to track the time-dependent evolution of bearing capacity and deformation characteristics, providing a more comprehensive basis for engineering design and maintenance. Thirdly, the application scope of the double-load-cell self-balanced test method can be extended to special strata (such as karst or collapsible loess) to optimize the layout scheme of load cells and improve the adaptability of the testing technology. Additionally, the combination of advanced detection technologies (e.g., distributed optical fiber sensing and elastic wave testing) can be further promoted to realize real-time and accurate evaluation of grouting quality, thereby enriching the theoretical system and engineering application experience of post-grouting technology for super-long large-diameter piles.

Author Contributions

Conceptualization, P.G. and R.J.; methodology, Q.M.; Experiment, J.H. and S.P.; validation, R.J., P.G., and J.H.; formal analysis, H.C.; investigation, J.H.; resources: R.J. and Q.M.; data curation, S.P.; writing—original draft preparation, H.C.; writing—review and editing, S.P. and P.G.; visualization, J.H.; funding acquisition, P.G. and Q.M. All authors have read and agreed to the published version of the manuscript.

Funding

This research was funded by the Key Research Projects of Higher Education Institutions in Henan Province (Grant No. 24A560021 (Pan Guo)), Henan Postdoctoral Foundation (Grant No. 202102015 (Pan Guo)), Henan Province Key R&D Project “Research and development of key materials for reinforcement of surface fossil cultural relics and their protection technology” (Grant No.231111321100 (Qingwen Ma)), National Natural Science Foundation (Grant No. 52108424) and Science and Technology Tackling Project of Henan Province, China (Grant No. 232102240025).

Data Availability Statement

Data available on request due to restrictions.

Conflicts of Interest

Authors Ruibao Jin and Jing Hu were employed by the company Henan Transport Investment Jiaozheng Expressway Co., Ltd. The remaining authors declare that the research was conducted in the absence of any commercial or financial relationships that could be construed as a potential conflict of interest.

References

  1. Fattahpour, V.; Baudet, B.A.; Sze, J.W.C. Laboratory Investigation of Shaft Grouting. Geotech. Eng. 2015, 168, 65–74. [Google Scholar] [CrossRef]
  2. Useche-Infante, D.J.; Aiassa-Martinez, G.M.; Arrua, P.A.; Eberhardt, M. Performance Evaluation of Post-Grouted Drilled Shafts: A Review. Innov. Infrastruct. Solut. 2022, 7, 230. [Google Scholar] [CrossRef]
  3. Thiyyakkandi, S. Post-Grouted Deep Foundations: Individual and Group Responses. Indian Geotech. J. 2024, 54, 301–314. [Google Scholar] [CrossRef]
  4. Liu, C.L.; Liu, S.W. Detection of Pile Self-Balance Method in a Certain Project. J. Qingdao Univ. Technol. 2017, 38, 24–28. [Google Scholar]
  5. Zhou, M.X.; Wang, P.; Cheng, B.H. Study of Key Problems of Pile Self-Balanced Load Test Method. Bridge Constr. 2008, 6, 68–72. [Google Scholar]
  6. Osterberg, J.O. New Device for Load Testing Driven Piles and Drilled Shafts Separates Friction and End Bearing. Piling Deep. Found. 1989, 1, 421–427. [Google Scholar]
  7. Fellenius, B.H.; Nguyen, M.H. Bidirectional Cell Tests on Non-Grouted and Grouted Large-Diameter Bored Piles. J. Geo-Eng. Sci. 2015, 2, 105–117. [Google Scholar]
  8. Cheng, Y.Z. Double Layer Load Cell Test of Self-Balanced Method for Bearing Capacity of Super-Long Bored Piles. IOP Conf. Ser. Earth Environ. Sci. 2019, 295, 042038. [Google Scholar] [CrossRef]
  9. Lu, B.; Gong, W.M.; Dai, G.L. Engineering Application of Self-Balanced Pile Loading Test Using Double Load Cells Technique. Build. Struct. 2008, 38, 35. [Google Scholar]
  10. Dong, P.S.; Wang, X.; Wang, H. Study on the Position of Load Box for Pile Foundation of Qilu Yellow River Approach Bridge. IOP Conf. Ser. Earth Environ. Sci. 2021, 787, 012120. [Google Scholar] [CrossRef]
  11. Deng, Y.S.; Gong, W.M. Application of Self-Balanced Method to Detect Vertical Bearing Capacity of Large Diameter and Super-Long Drilled Piles. Build. Struct. 2005, 35, 74–75. [Google Scholar]
  12. Fan, Y.H.; Liu, Y.G.; Ren, P. Comparative Study of Self-Balanced Method and Traditional Static Load Test of Pile. Build. Sci. 2017, 33, 75–81. [Google Scholar]
  13. He, C.L.; Gong, C.Z. Comparison and Analysis on Self-Balanced Method and Anchored Pile Method in Qingdao Gulf Bridge. Adv. Mater. Res. 2013, 838–841, 1024. [Google Scholar] [CrossRef]
  14. Cai, Y.; Xu, L.R.; Zhou, D.Q.; Deng, C.; Feng, C.X. Model Test Research on Method of Self-Balance and Traditional Static Load. Rock. Soil. Mech. 2019, 40, 3011–3018. [Google Scholar]
  15. Xiao, Y.T. Stress-Deformation Mechanism and Numerical Simulation Analysis of Pile Self-Balancing Static Load Test in Loess Region. Build. Sci. 2019, 35, 84–89. [Google Scholar]
  16. Su, H.F.; Li, R.Z.; Lv, Y.J. Research on Self Balance Test Method and Numerical Simulation of Bearing Capacity of Pile Foundation. J. Phys. Conf. Ser. 2020, 1549, 032127. [Google Scholar] [CrossRef]
  17. Liu, J.X.; Shao, X.F.; Huang, X.H.; Cao, G.Y. Study on Behavior and Bearing Capacity Computation Method of Shallow Rock-Socketed Short Piles Based on the Self-Balanced Loading Test. Comput. Intell. Neurosci. 2022, 2022, 7272219. [Google Scholar] [CrossRef]
  18. Liu, Y.L.; Liu, Z.J.; Ba, J.T.; Xiao, H.L.; Guo, B. Numerical Simulation Analysis of Reverse Self-Balanced Test Method for Pile Bearing Capacity. J. Hohai Univ. Nat. Sci. 2023, 51, 81–87. [Google Scholar]
  19. Qiu, Y.G.; Huang, C.S.; Hong, R.H.; Chen, C.H.; Yi, J.X.; Li, W.X. Comparison and Analysis of Conversion Methods for Self-Balancing Test of Pile Bearing Capacity. In Proceedings of the E3S Web of Conferences, Guangzhou, China, 25–27 June 2021; Volume 293, p. 02041. [Google Scholar]
  20. Du, S.Y.; LI, C.H. Improvement of the Simple Conversion Method for Load-Settlement Curves in Self-Balance Tests. Ind. Constr. 2021, 51, 145–150. [Google Scholar]
  21. Ou, X.D.; Bai, L.; Jiang, J.; Lyu, Z.F.; Qin, J.X. Research on Analytical Conversion Method of Self-Balanced Test Pile Results. Eur. J. Environ. Civ. Eng. 2022, 26, 7209–7225. [Google Scholar] [CrossRef]
  22. Ou, X.D.; Chen, G.Y.; Bai, L.; Jiang, J.; Zeng, Y.C.; Chen, H.L. Research on the Analytical Conversion Method of Q-s Curves for Self-Balanced Test Piles in Layered Soils. Appl. Sci. 2022, 12, 8435. [Google Scholar] [CrossRef]
  23. Ou, X.D.; Bai, L.; Lu, Z.F.; Jiang, J.; Li, S. Analytical Transformation Method of Q-s Curve and Model Test Research of Self-Balanced Pile Testing in Clay Foundation. J. Cent. South Univ. Sci. Technol. 2022, 53, 631–642. [Google Scholar]
  24. Wang, S.H.; Shi, Y.H.; Alipujiang, J.; Jiang, J.H. Research on the Self-balanced Method of Pile Bearing Capacity Considering Soil Continuity and Engineering Test. J. Northeast. Univ. Nat. Sci. 2022, 43, 1329–1336. [Google Scholar]
  25. Huang, X.B.; Wang, X.Y.; Pu, H.; Hou, S. Application of Self-Balanced Test in Li-yu Tuo Bridge. Build. Struct. 2015, 45, 87–91. [Google Scholar]
  26. Huang, X.B.; Hou, S.; Pu, H.; Wang, Z.L. Current Situation Analysis on Vertical Bearing Capacity of Pile Foundation Measured by Self-Balanced Test. Build. Struct. 2015, 45, 79–84. [Google Scholar]
  27. Chen, W.C.; Yang, W.J.; Chen, H.; Yang, J.Y. Experimental Study on Bearing Characteristics of Super-Long Foundation Piles in Sandy Soil Area Using the Double-Load Box Method. J. Rail Way Sci. Eng. 2021, 18, 1143–1154. [Google Scholar]
  28. DB41/T 2465-2023; Technical Specification for Post-Grouting of Bridge Cast-In-Place Piles. Henan Provincial Department of Transportation: Henan, China, 2023.
  29. JGJ/T 403-2017; Technical Specification for Self-Balanced Static Load Test of Building Foundation Piles. Ministry of Housing and Urban-Rural Development of the People’s Republic of China: Beijing, China, 2017.
  30. Prakash, S.; Sharma, S.; Hari, D. Pile Foundations in Engineering Practice; John Wiley & Sons: Hoboken, NJ, USA, 1990. [Google Scholar]
  31. Zhang, Q.Q.; Li, S.C.; Li, L.P. Field Study on the Behavior of Destructive and Non-Destructive Piles Under Compression. Mar. Georesources Geotechnol. 2014, 32, 18–37. [Google Scholar] [CrossRef]
  32. JGJ 94-2008; Technical Code for Building Pile Foundations. Ministry of Housing and Urban-Rural Development of the People’s Republic of China: Beijing, China, 2008.
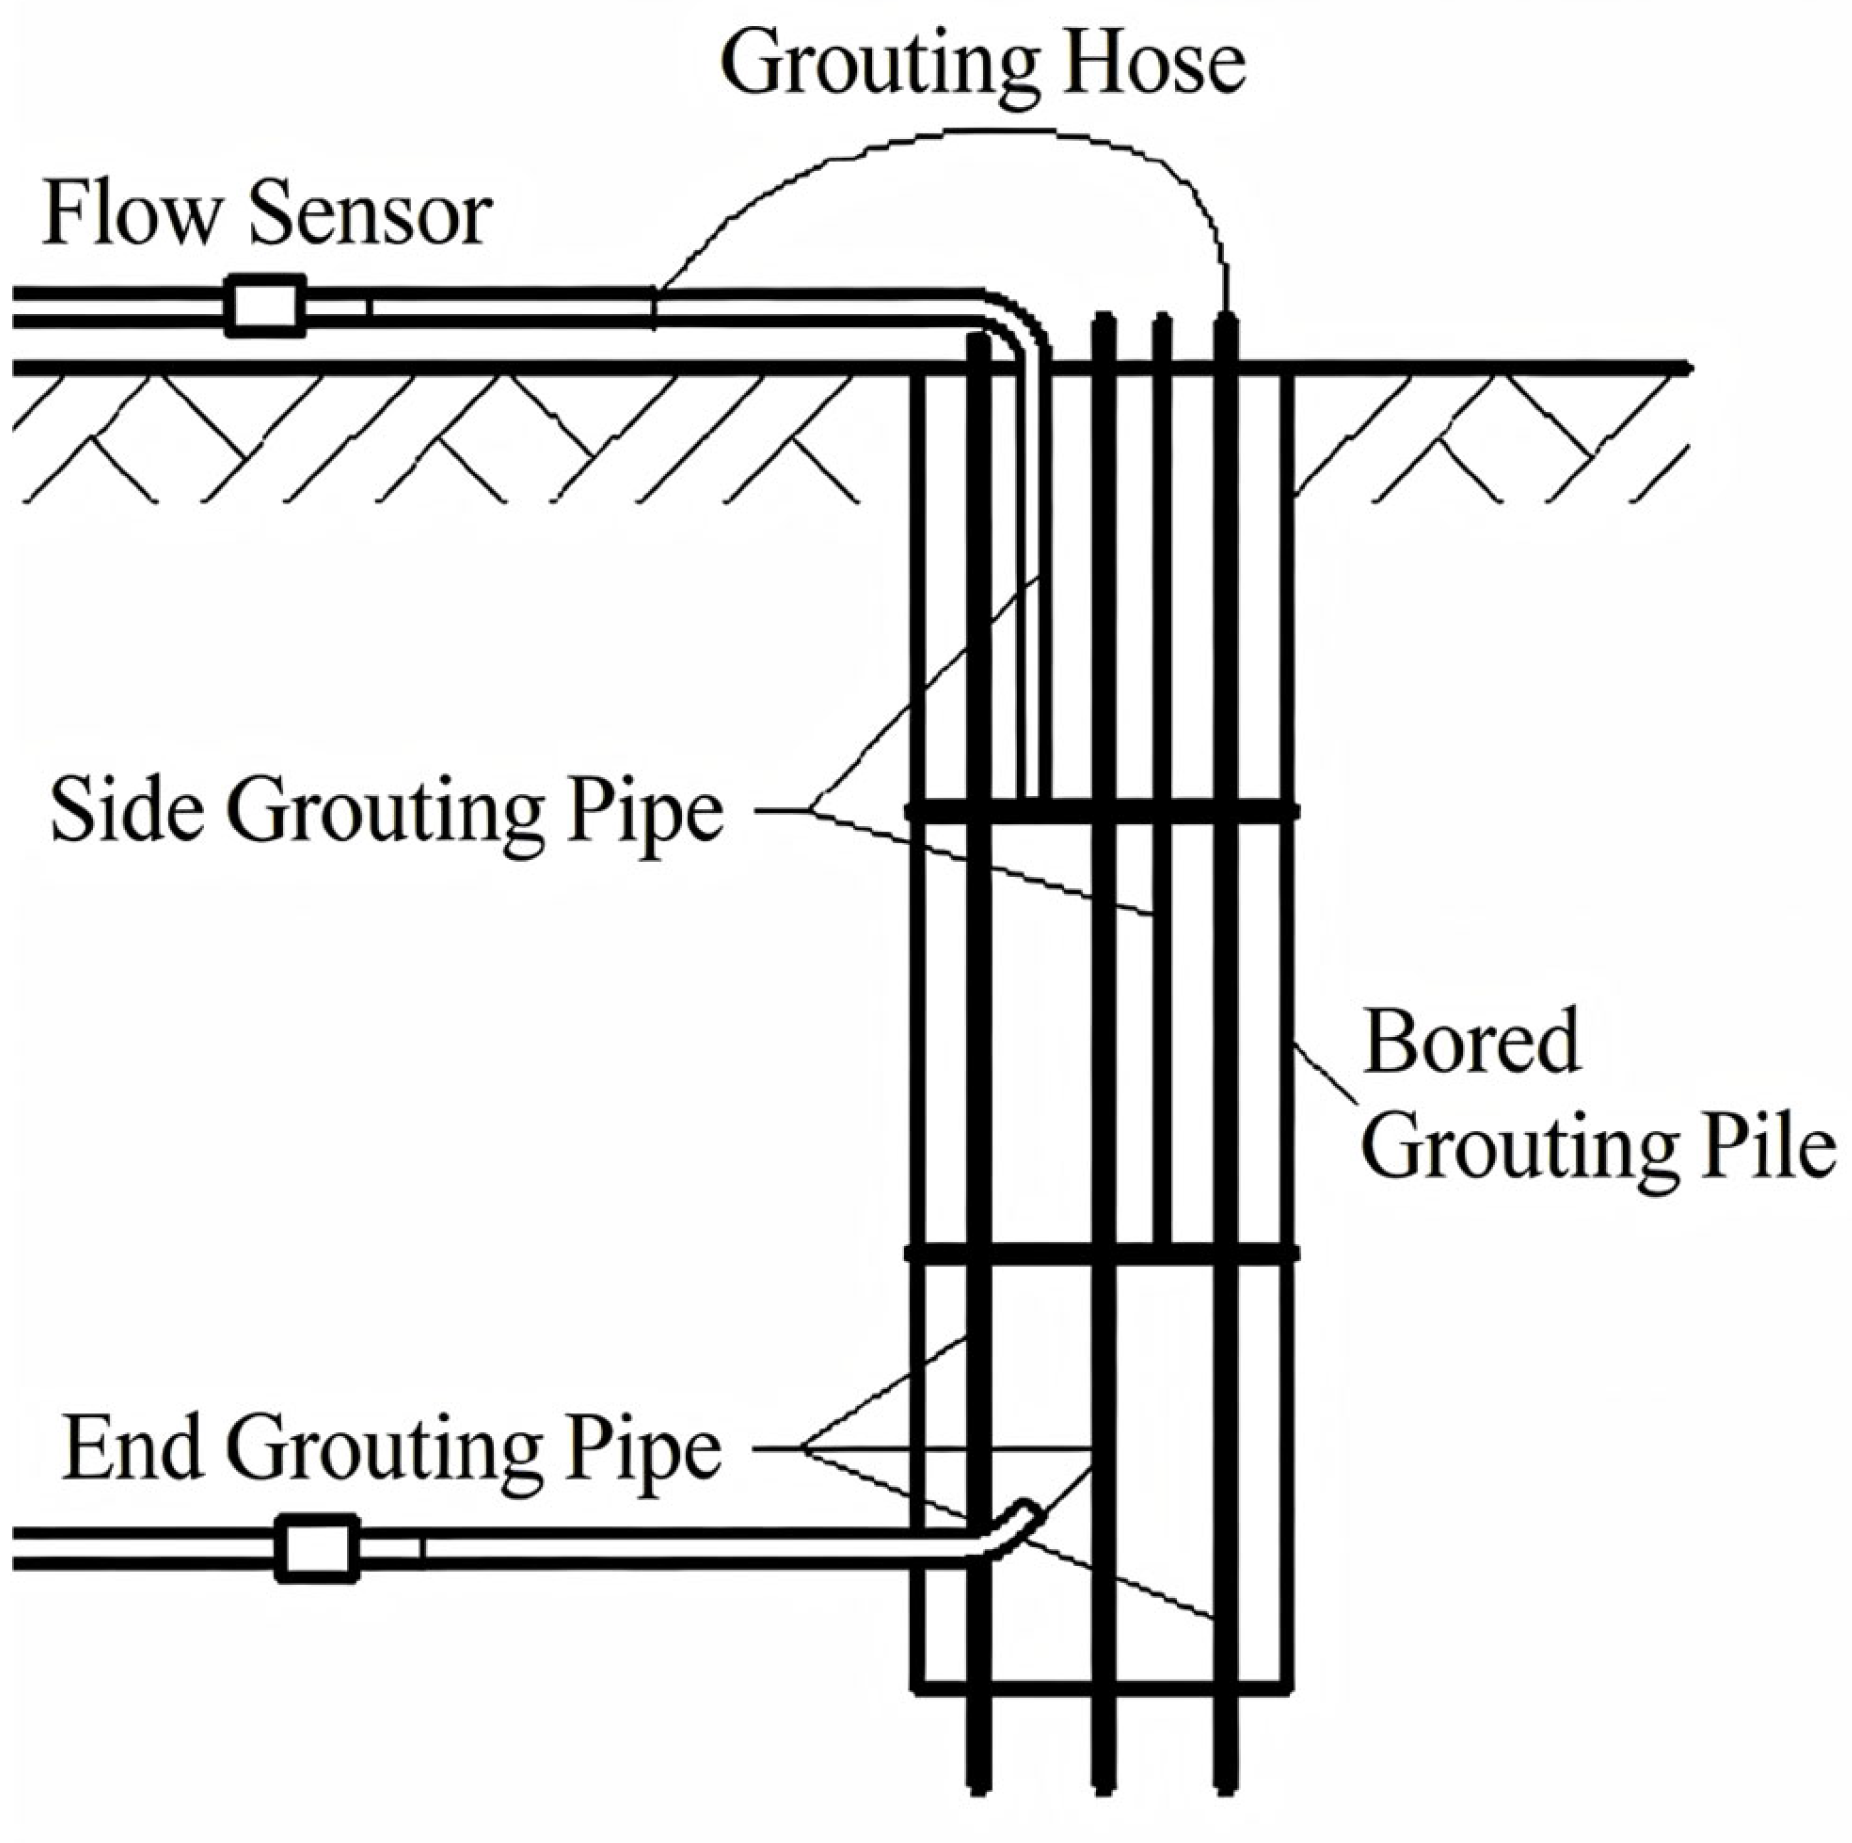
Figure 1. Schematic diagram of grouting for pile-side annular pipe.
Applsci 16 01947 g001
Figure 2. Buried position of load box, grouting pipe and acoustic tube (mm).
Applsci 16 01947 g002
Figure 3. (a) Installation of double-load box; (b) fiber optic strain gauge layout; (c) longitudinal layout diagram of fiber optic strain gauges.
Applsci 16 01947 g003
Figure 4. (a) Drilling quality inspection; (b) hoisting steel reinforcement cage.
Applsci 16 01947 g004
Figure 5. Pile top arrangement of electronic displacement meter.
Applsci 16 01947 g005
Figure 6. Equivalent conversion Q-s curves of test piles SZ1 and SZ2 before and after grouting: (a) test pile SZ1; (b) test pile SZ2.
Applsci 16 01947 g006
Figure 7. Axial force distribution of test pile SZ1 before and after grouting under different loads: (a) before grouting; (b) after grouting.
Applsci 16 01947 g007
Figure 8. Axial force distribution of test pile SZ2 before and after grouting under different loads: (a) before grouting; (b) after grouting.
Applsci 16 01947 g008
Figure 9. Distribution of side friction resistance of test pile SZ1 before and after grouting under different loads: (a) before grouting; (b) after grouting.
Applsci 16 01947 g009
Figure 10. Distribution of side friction resistance of test pile SZ2 before and after grouting under different loads: (a) before grouting; (b) after grouting.
Applsci 16 01947 g010
Figure 11. Pile tip resistance-pile tip displacement curves of test piles SZ1 and SZ2 before and after grouting: (a) test pile SZ1; (b) test pile SZ2.
Applsci 16 01947 g011
Table 1. Physical and mechanical properties of strata.
Layer No.Geotechnical NameUnit Weight (kN/m3)Cohesion (kPa)Internal Friction Angle (°)Compression Coefficient (MPa−1)Compression Modulus (MPa)Characteristic Value of Bearing Capacity (kPa)Standard Value of Frictional Resistance (kPa)
Silty Fine Sand19.0 0.0 26.0 -6.0 10025
1Plain Fill16.5 8.0 10.0 ----
2Silt18.3 9.7 20.5 0.38 5.5 10030
Silty Fine Sand19.3 2.0 28.5 -12.0 13045
1Silty Fine Sand19.3 0.0 26.0 -8.0 12040
Silty Fine Sand19.5 3.0 30.0 -15.0 16050
1Silty Clay18.6 25.0 17.0 0.35 6.9 18055
2Medium Sand19.5 3.0 35.0 -16.0 18055
3Cobble Soil20.5 2.0 39.0 -40.0 25070
Silty Clay19.2 29.0 19.0 0.24 8.2 20055
1Silt18.7 18.5 28.0 0.15 12.0 20055
2Silty Fine Sand20.0 3.0 35.0 -20.0 20055
3Silty Fine Sand19.8 3.0 33.0 -18.0 17050
4Medium Sand20.2 3.0 37.0 -23.0 24060
Silty Clay19.5 31.0 21.0 0.18 10.5 26065
1Silt18.9 19.0 28.5 0.11 15.0 22060
2Silty Fine Sand20.3 4.0 36.0 -25.0 24060
Silty Clay20.5 33.0 22.0 0.13 14.0 28070
1Silt19.3 19.5 30.0 0.10 16.5 24065
2Silty Fine Sand20.5 4.0 36.0 -28.0 30065
3Medium Sand20.5 3.0 40.0 -32.0 35070
4Gravel Soil21.0 2.0 40.0 -40.0 360100
5Cemented Layer22.0----300100
Silty Clay20.5 35.0 25.0 0.09 15.0 29075
1Silt19.6 20.0 30.0 0.08 19.0 25070
2Silty Fine Sand20.5 4.0 37.0 -30.0 30070
3Medium Sand20.5 3.0 40.0 -35.0 35075
4Cobble Soil22.0 2.0 43.0 -45.0 380140
5Cemented Layer22.0 ----300100
Silty Clay20.5 38.0 27.0 0.06 16.0 30085
1Silty Fine Sand20.5 4.0 37.0 -32.0 30075
2Medium Sand20.5 3.0 40.0 -35.0 35080
3Cemented Layer22.0 ----300100
4Cemented Layer24.0 ----1200200
Silty Clay20.5 40.0 28.0 0.05 18.0 30085
1Silty Fine Sand20.5 4.0 37.0 -32.0 30070
2Medium Sand20.5 3.0 40.0 -35.0 35080
3Cobble Soil22.0 2.0 43.0 -45.0 400160
4Cemented Layer25.0----1200200
Table 2. Test pile position.
Pile No.Mileage
Pile No.
X Coordinate
of Survey Hole
Y Coordinate
of Survey Hole
Bearing StratumReference Borehole
SZ1K31 + 3003,860,845.52517,836.92Silty ClayHHZQZK152-2
SZ2K26 + 3393,865,137.04516,203.85Silty Fine SandHHNBZK81-2
Table 3. Basic parameters of pile test.
Pile No.Pile Diameter
(m)
Pile Length
(m)
Pile Top Elevation
(m)
Pile Tip Elevation
(m)
Concrete GradePost-Grouting
Method
SZ12.285+91.635+6.635C35Pile-side ring pipe grouting +
pile tip straight pipe grouting
SZ22.298+94.5−3.5C35Pile-side distributed grouting +
pile tip straight pipe grouting
Table 4. The burial position and parameters of the double-load box.
Pile No.Load Box Elevation (m)Distance Between Load Box and Pile Tip (m)Loading Capacity of
Load Box (kN)
UpDownUpDownUpDown
SZ1+35.635+12.6352962 × 35,0002 × 20,000
SZ2+34.5+3.53872 × 39,0002 × 33,000
Table 5. Post-grouting parameters of test pile.
Pile No.Pile Tip Grouting Amount (t)Pile-Side Grouting Amount (t)Single Pile Grouting Amount (t)Grouting Pressure
(MPa)
Water Cement
Ratio
Single-Layer Grouting Amount (t)Number of Layers
SZ15.282.00515.28-0.5
SZ25.941.001217.94-0.5
Disclaimer/Publisher’s Note: The statements, opinions and data contained in all publications are solely those of the individual author(s) and contributor(s) and not of MDPI and/or the editor(s). MDPI and/or the editor(s) disclaim responsibility for any injury to people or property resulting from any ideas, methods, instructions or products referred to in the content.