Article

Seismic Response and Failure Mechanism of Radiator and Conservator Connections in a 154 kV Transformer Based on Shaking Table Tests


1
R&D Strategy Center, KEPCO Research Institute, Daejeon 34057, Republic of Korea
2
Seismic Research and Test Center, Pusan National University, Busan 46241, Republic of Korea
3
Department of Architectural and Civil Engineering, Kyungil University, Gyeongsan 38428, Republic of Korea
*
Authors to whom correspondence should be addressed.
Appl. Sci. 2026, 16(3), 1659; https://doi.org/10.3390/app16031659
Submission received: 22 December 2025 / Revised: 25 January 2026 / Accepted: 3 February 2026 / Published: 6 February 2026

Abstract

Transformers are critical components in power systems, and their functionality must be maintained during seismic events. This study conducted multi-directional shaking table tests on a full-scale 154 kV transformer to investigate the seismic response and failure mechanisms of radiator and conservator connections. Measurements of relative displacement, acceleration, and test response spectra (TRS) indicated stable responses of 0.5–1.2 g for the transformer body, whereas the bushings and radiators exhibited amplified accelerations of up to 4 g and 2 g, respectively, along with relative displacements exceeding 20 mm. Under the 500-year return period input motion, leakage was observed at the lower radiator elbow, which is attributed to the combined effects of concentrated relative displacement, acceleration amplification, frequency-dependent energy concentration, and local structural discontinuities. The observed damage patterns were consistent with leakage incidents reported during the 2024 Noto earthquake in Japan. Based on the experimental findings, this study discusses seismic performance enhancement measures for radiator connections and provides experimental evidence to support the seismic safety evaluation of transformers with similar configurations.

1. Introduction

Power transformers are critical components of electric power systems, and maintaining their functionality during earthquakes is essential. However, transformers may experience damage due to dynamic interaction effects among their components during seismic events. In particular, auxiliary components such as radiator and conservator piping connections may experience oil leakage or local failures under seismic loading due to concentrated relative motion and repeated deformation demands. Such failures may affect the stability of power systems and compromise the safe operation of critical facilities, including nuclear power plants. During the 2024 Noto earthquake in Japan, numerous leakage incidents were reported in large transformers rated at 154 kV or higher, including insulation oil leakage and radiator connection damage in auxiliary and starting transformers at the Shika Nuclear Power Plant. These cases suggest that interaction-driven relative motion between components can directly trigger functional failures, indicating that conventional seismic design based solely on simplified design coefficients may be insufficient to predict or prevent such damage. Notably, leakage or damage at piping elbows and connection regions is closely associated with localized deformation demand amplified by interaction-driven relative motion between the transformer body and auxiliary assemblies. Typical earthquake-induced functional failures include oil leakage, loosening or distress at joints and flanges, and amplified responses of attached components due to system-level interaction effects.
Previous studies have primarily focused on porcelain bushings and transformer–bushing systems. Filiatrault and Matt [1] analyzed the dynamic response of high-voltage porcelain bushings installed on transformer tanks and reported that seismic responses can be significantly amplified when the natural frequency of a bushing coincides with that of the tank. Ersoy and Saadeghvaziri [2] developed finite element models of various transformer–bushing systems and performed time-history analyses, demonstrating that transformer–bushing interaction can significantly influence the overall seismic response. IEEE 693-2005 [3] prescribes applying an amplification factor of four to the input ground motion when evaluating the seismic performance of bushings to account for these effects. Similarly, IEC TS 61463 [4] provides amplification factors considering installation conditions, height, damping ratio, and multi-mode response.
Bushings are widely used as representative components for seismic qualification of power facilities, and their seismic capacity has been extensively investigated through experiments and numerical analyses in accordance with various design standards [3,5,6,7]. However, shaking table tests on large transformers or liquid-filled reactors are often not economically feasible, and seismic experimental studies have therefore primarily focused on bushings. Amir et al. [8] and Koliou et al. [9] reported seismic experiments on large bushings rated above 500 kV. In Korea, seismic performance evaluations of bushings have also been conducted by Joe and Cho [10] and Kim et al. [11]. Nevertheless, stand-alone bushing tests cannot fully capture interaction effects with supporting structures such as transformer tanks or GIS under realistic installation conditions. Accordingly, several studies have attempted to extend bushing test results to overall equipment behavior using finite element analysis [12,13]. However, these analyses often assume an ideally fixed-base boundary condition, which limits their ability to realistically simulate foundation flexibility and the complex connection behavior observed in field installations [14].
Recent studies have expanded beyond the transformer body and bushings to examine the dynamic behavior of full-scale transformers, including radiators and conservators. Filiatrault and Matt [15] and Cao et al. [16] investigated the seismic behavior and acceleration amplification characteristics of transformer–bushing systems through shaking table tests. In contrast, Chun et al. [17] evaluated the seismic performance of multiple components, including radiators and conservators, using a full-scale 154 kV oil-filled transformer. They analyzed the acceleration amplification ratio of the bushing and experimentally demonstrated that coupling behavior between components can significantly influence response amplification.
In addition, cable terminations—representative power equipment used to connect overhead and underground lines in outdoor substations—can experience significant seismic amplification due to their cantilever-type structural characteristics. However, research on the seismic behavior of cable terminations remains limited. Jeon et al. [18] conducted static and shaking table tests on a 500 kV cable termination to evaluate its structural vulnerability. However, studies that explicitly account for interaction between the device and its supporting structure remain scarce.
Koliou et al. [19,20] showed through numerical analyses and experiments that bushings installed on transformer cover plates are more vulnerable to earthquakes than those installed on rigid foundations. They also demonstrated that reinforcement ribs on the cover plate can improve seismic performance. However, these studies primarily focused on the dynamic characteristics of bushings and transformer bodies, and detailed experimental verification addressing radiator/conservator connections or piping damage remains scarce.
In nuclear power plants, transformers supply power to essential safety systems (e.g., main control rooms, emergency power systems, and cooling systems). Seismic damage to transformers can directly reduce reactor shutdown capability and weaken accident response. Oil leakage from radiator or conservator connections may trigger fires and secondary damage due to the loss of insulating oil, posing a serious threat to the safe operation of nuclear power plants. Therefore, ensuring the seismic safety of nuclear facilities requires detailed evaluation of transformer systems that accounts for interaction among major components. Accordingly, this study conducted shaking table tests on a full-scale 154 kV transformer and measured the relative displacement and acceleration responses between the transformer body and the radiator/conservator connections. Multi-directional input motions corresponding to various return periods were applied to identify key dynamic response characteristics. In addition, comparisons with reported damage cases from the Noto earthquake were performed to provide experimental evidence supporting the seismic safety evaluation of major power equipment, including nuclear power plants.

2. Field Installation of Transformer

2.1. 154 kV Transformer and Test Foundation

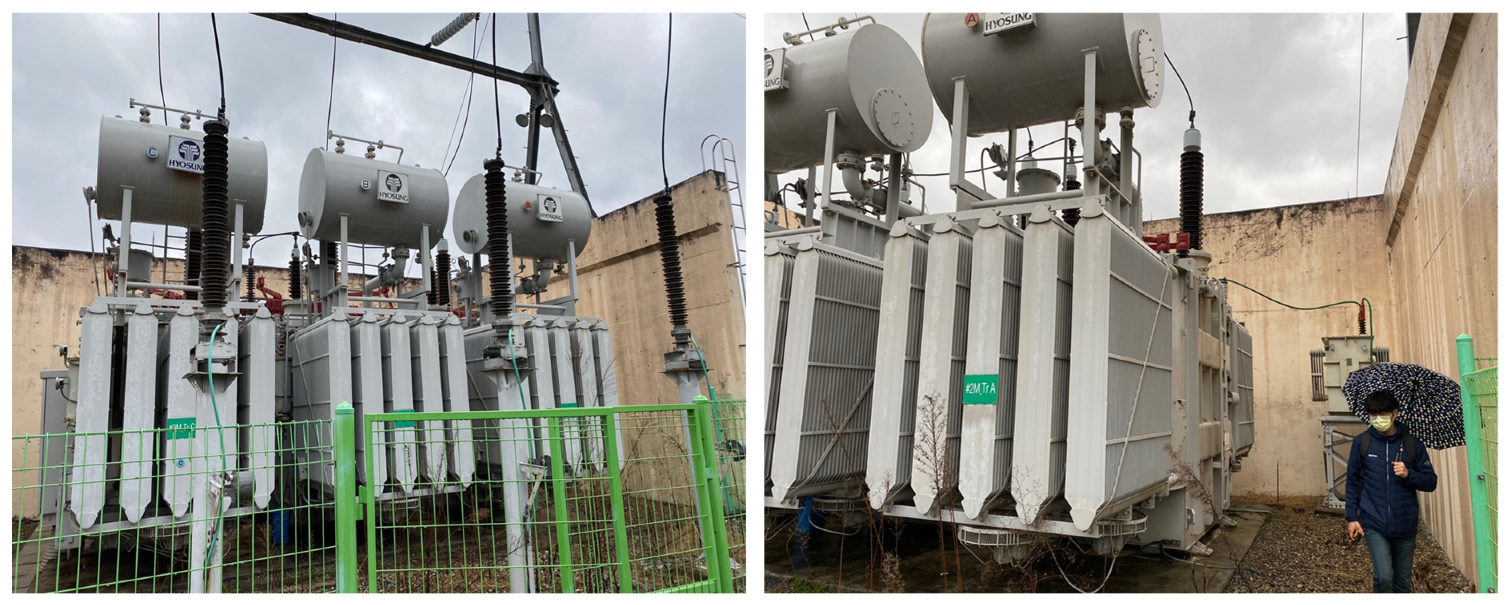
The combined weight of the 154 kV transformer and the concrete foundation was approximately 50 tons. Considering the 60-ton payload capacity of the shaking table system, a single-phase 154 kV transformer—one of the largest units that could be tested—was selected as the specimen for this study. The transformer had dimensions of 2 m × 7 m × 5 m and weighed 39 tons. For testing, the transformer was anchored to a concrete slab using anchor bolts, and the slab was rigidly fixed to the shaking table. Figure 1 shows the 154 kV transformer specimen used in the tests.
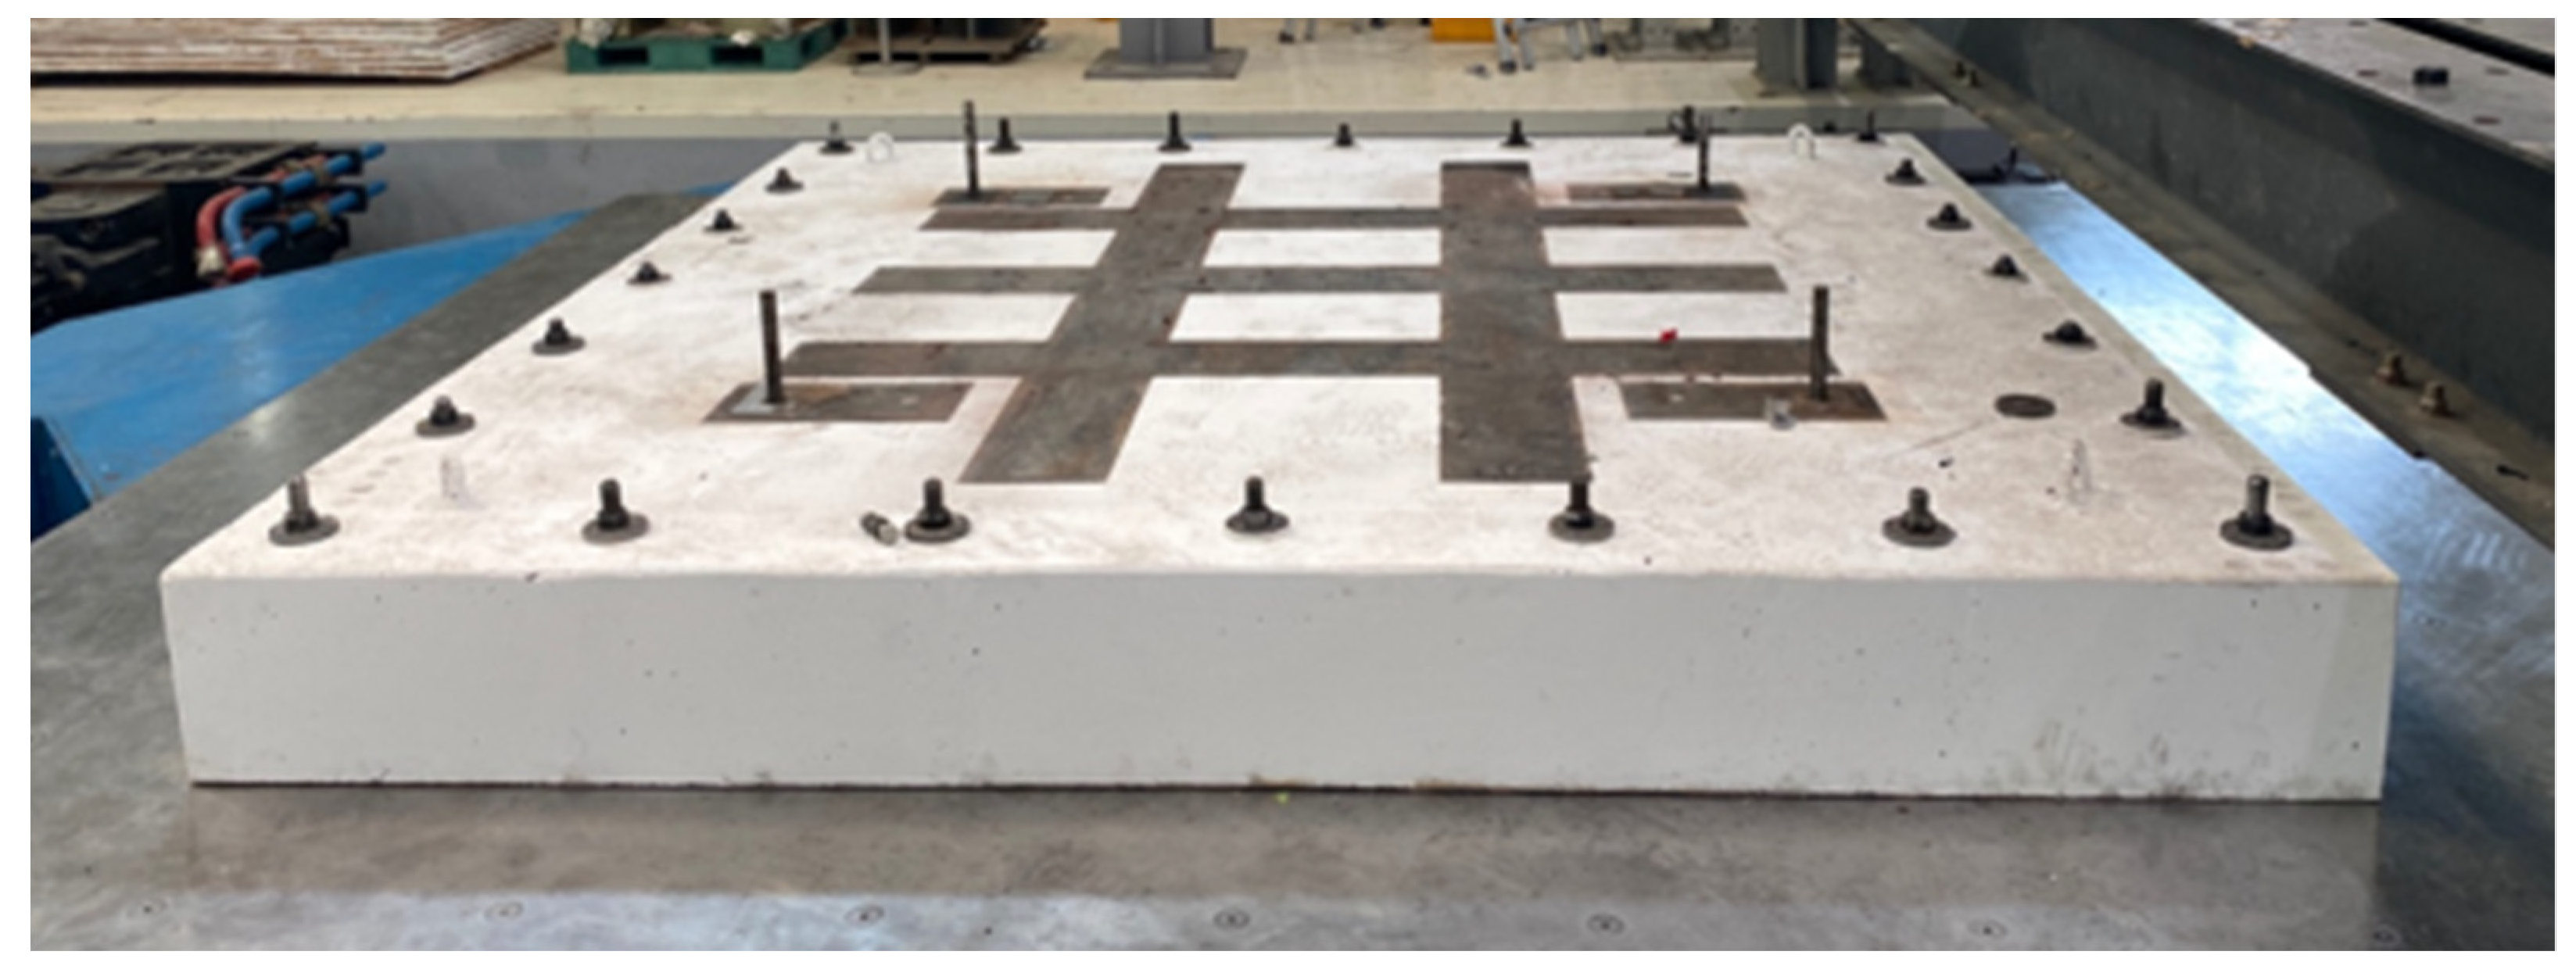
To represent field installation conditions, a foundation simulating the actual mounting environment was fabricated and installed on the shaking table (Figure 2). The transformer was secured to the foundation using pre-installed M30 anchor bolts. The foundation was rigidly fixed to the shaking table using 24 M30 bolts tightened to a torque of at least 770 N·m.

2.2. Sensor Installation

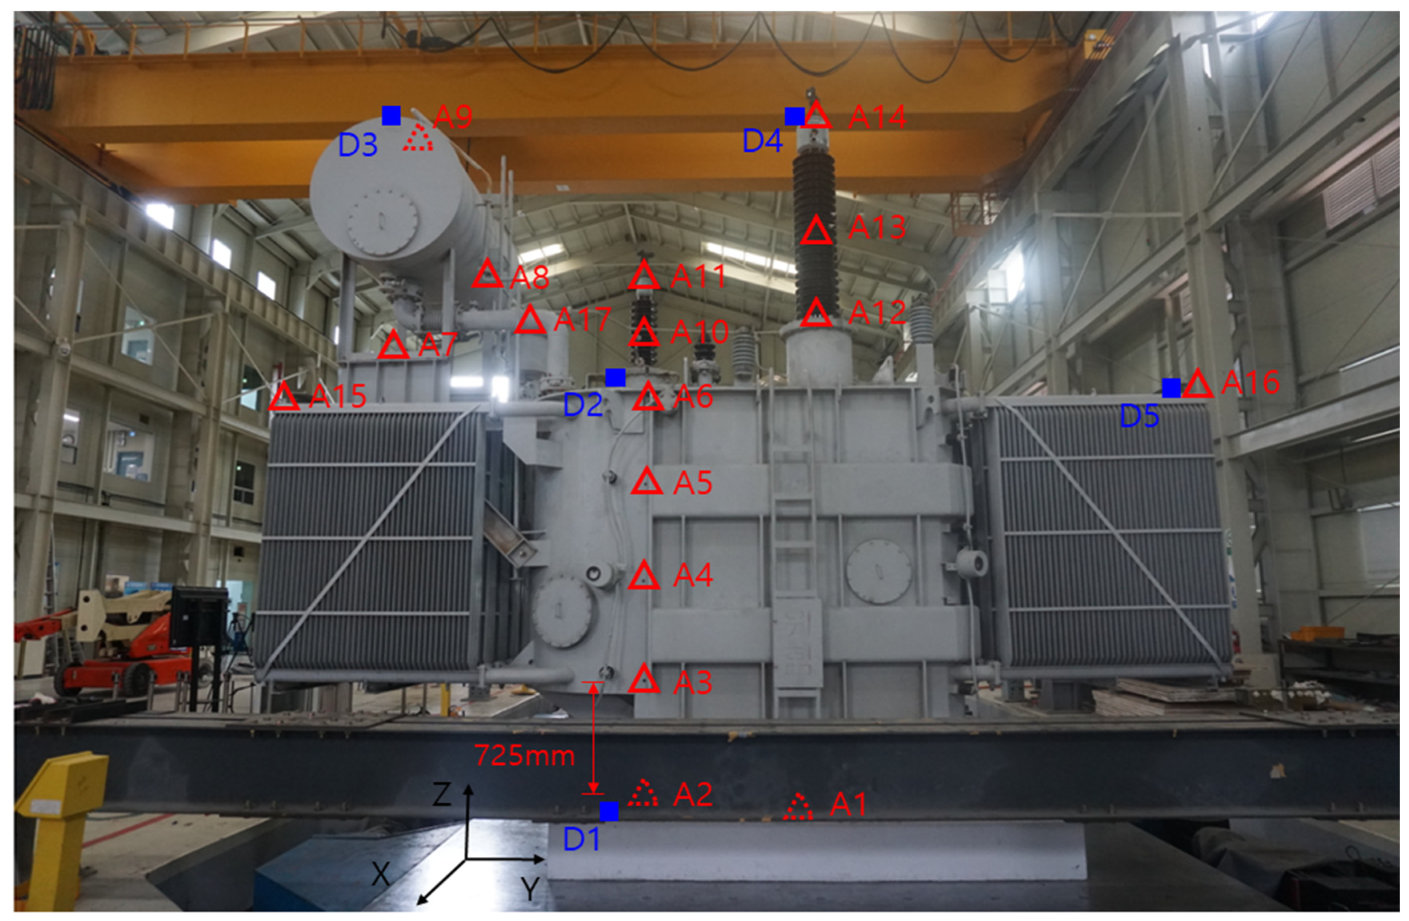
To confirm the input motion of the shaking table, accelerometers were installed on the table surface to measure acceleration in the X, Y, and Z directions. Five tri-axial accelerometers were installed along the height of the transformer. In addition, eleven tri-axial accelerometers were attached to the oil tank, bushings, radiators, and the on-load tap changer (OLTC). To measure displacement at multiple locations, five wire-type displacement transducers were installed to record movements in the X and Y directions. The locations and orientations of the measurement devices are summarized in Figure 3 and Table 1.

3. Experimental Conditions and Input Motions

The shaking table used in this seismic performance test was a three-degree-of-freedom (3-DOF) system (MTS Systems Corporation, Eden Prairie, MN, USA). The specifications and performance capacities of the shaking table system are summarized in Table 2. The experiments were conducted by gradually increasing the input motions corresponding to seismic design criteria with return periods ranging from 100 to 500 years. To focus on the linear response of the specimen, the tests were conducted up to the onset of nonlinear behavior. Table 3 summarizes the experimental program, including the return periods and ground condition categories for each test case.
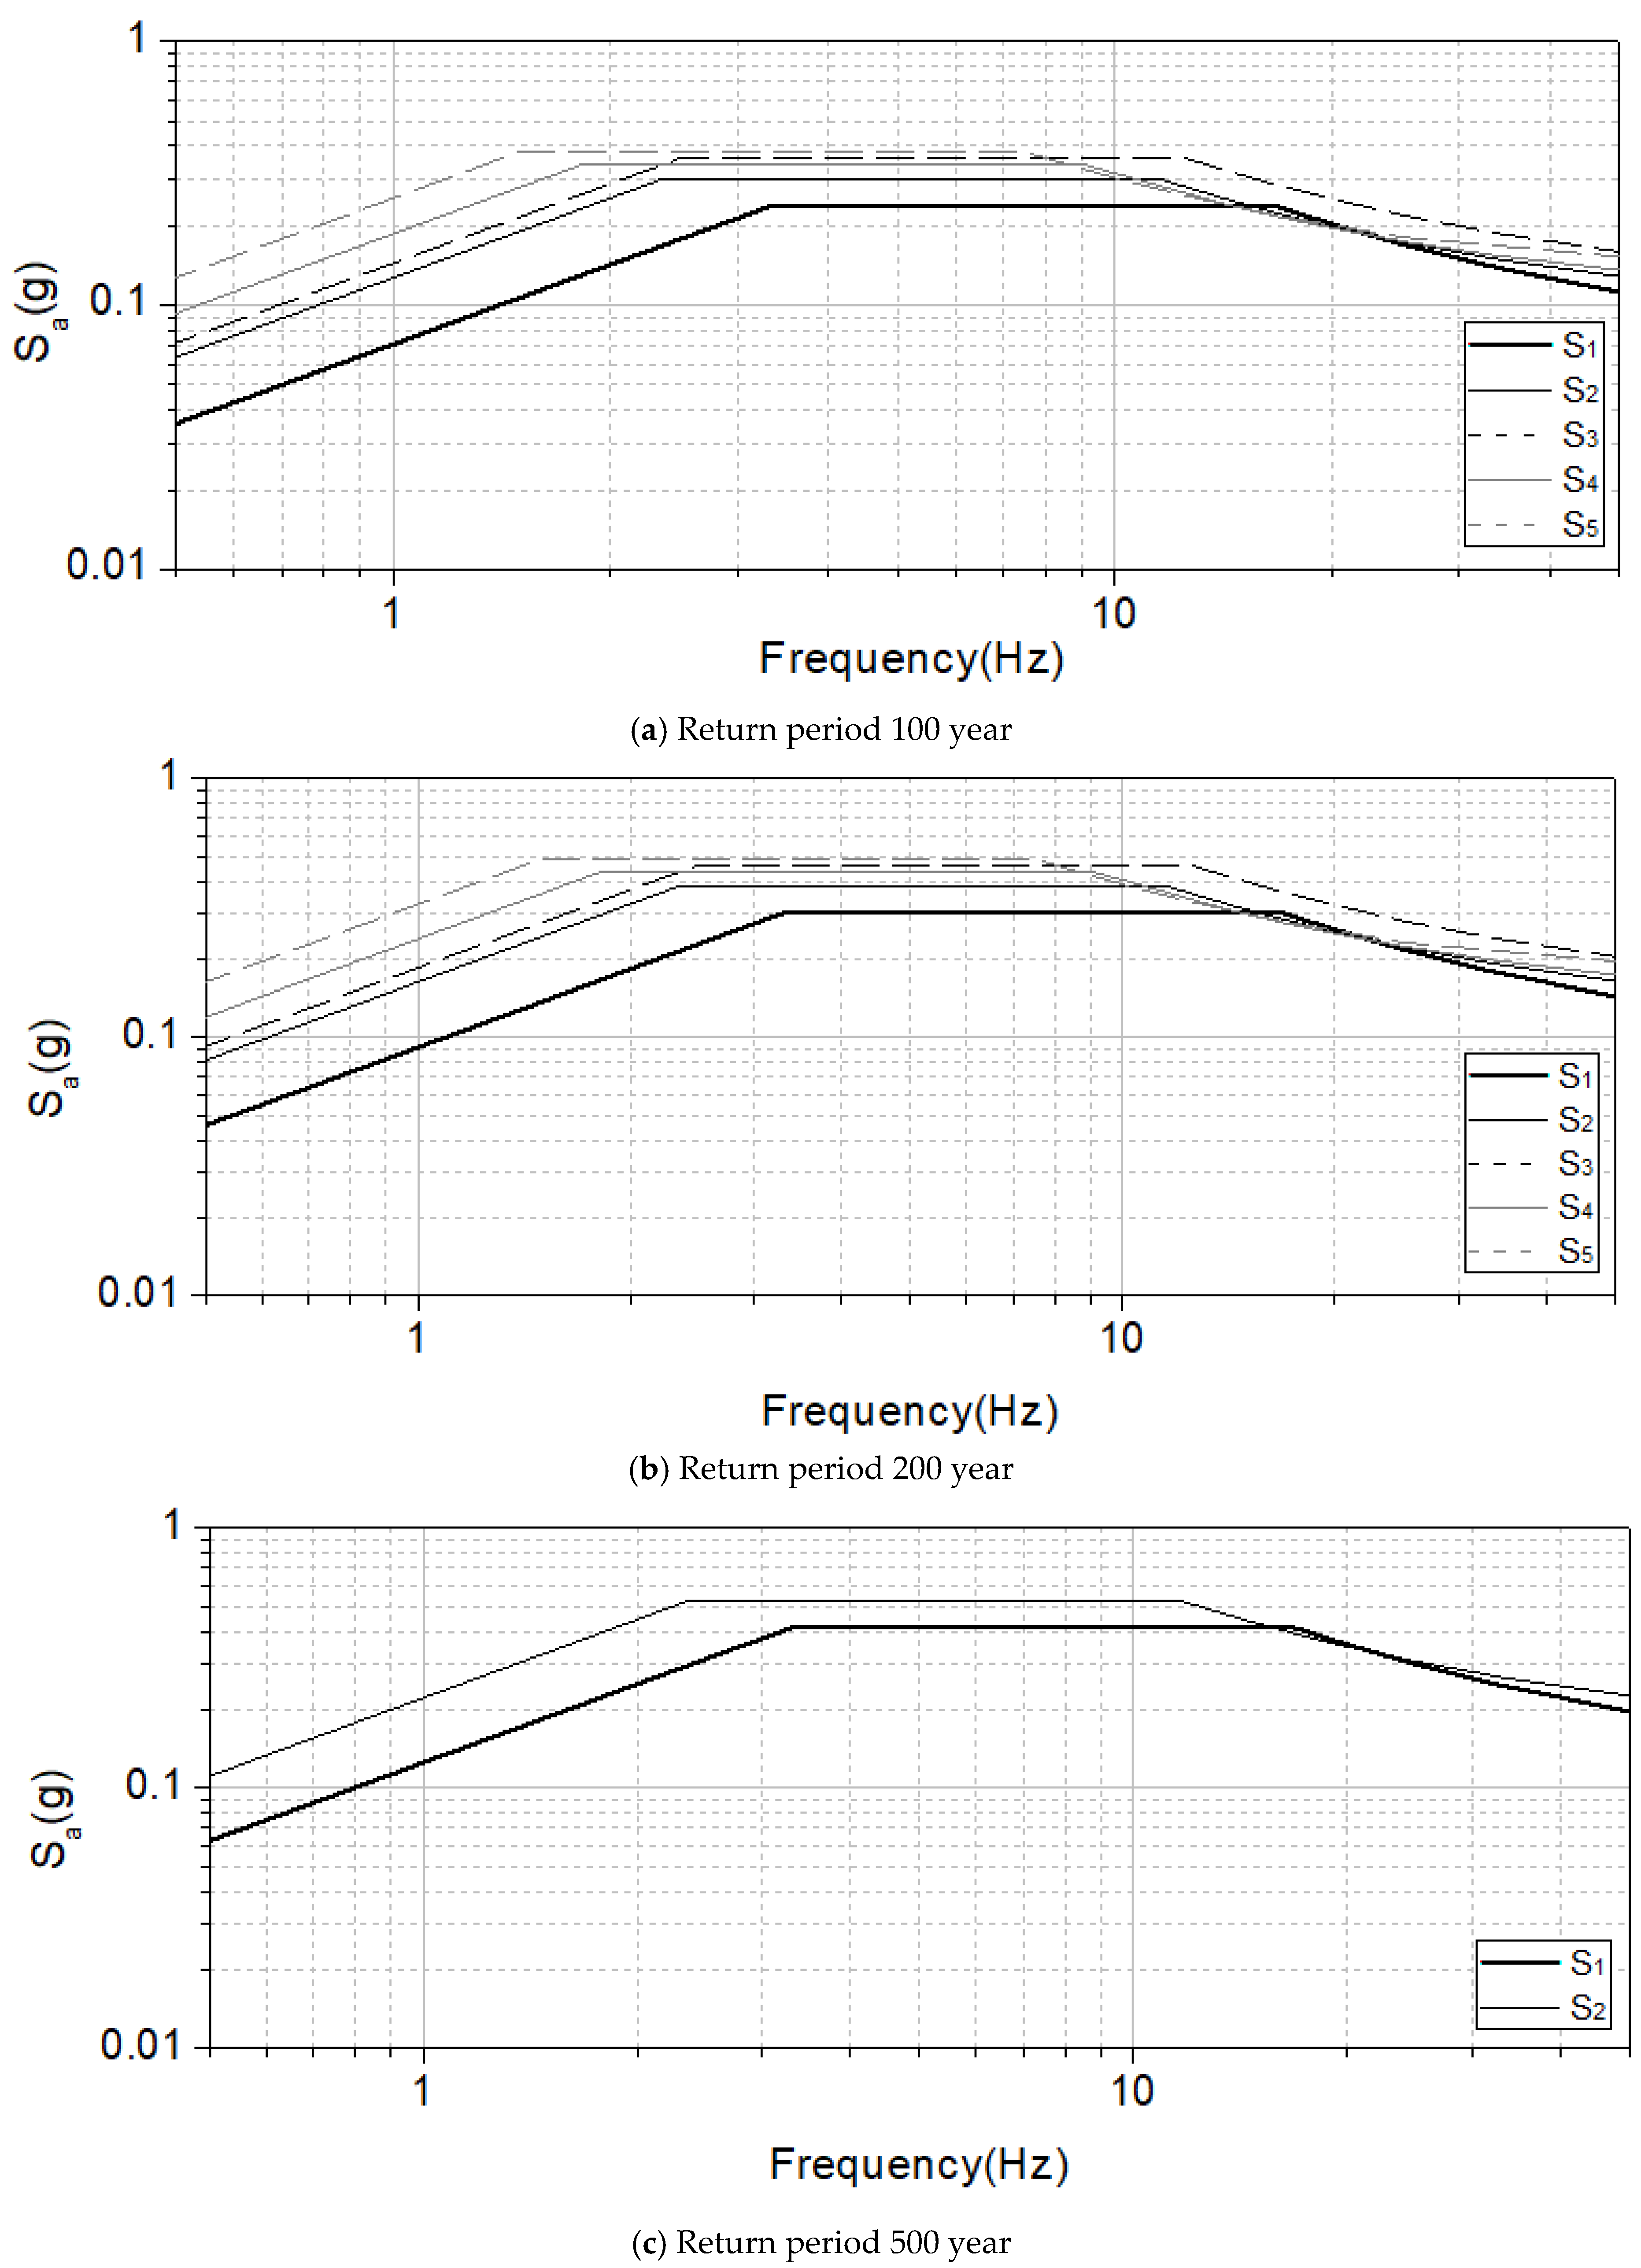
The input motions used in the seismic simulation tests were determined in accordance with the Common Application of Seismic Design Criteria [21]. In this study, the standard design response spectrum specified in the code was adopted as the Required Response Spectrum (RRS) (Figure 4). Acceleration time histories were generated using a spectral matching procedure to satisfy the target RRS for each ground condition and return period. The time histories were iteratively adjusted in the time domain until the resulting response spectra met the specified tolerance relative to the target RRS. The frequency range of the generated acceleration time histories was 0.5–50.0 Hz, with a total duration of 30 s and a strong-motion duration of 20 s. In the seismic simulation tests, the Test Response Spectrum (TRS) was required to envelop the RRS. A TRS value at an individual frequency point was permitted to be up to 10% lower than the RRS; however, consecutive points with more than a 12% shortfall were not allowed, and the total number of such points was limited to five. In addition, the cross-correlation function value was verified to remain below 0.3 [3,22,23].

4. Experiment Result

4.1. Resonance Frequency Search Test

To identify the resonance frequencies of the transformer, sine sweep tests were performed in the X and Y directions with an input acceleration level of 0.008 g. The excitation frequency was swept from 1.0 to 50.0 Hz at a sweep rate of 1 octave/min, following IEEE Std 693 [3]. The resonance frequencies were identified by peak picking based on the measured response amplification (transfer characteristics) between the shaking table input and the component responses. The results of each resonance frequency search test are summarized in Table 4. Overall, the results were similar across measurement heights within the same structure component. In addition, each structural component exhibited coherent motion along its height while maintaining its own distinct resonance frequency.

4.2. Seismic Simulation Test

The transformer was anchored to a rigid concrete foundation, representing a common installation condition in practical substations. Under fixed-base boundary conditions, the measured relative displacement primarily reflects interaction-driven differential motion between the transformer body and auxiliary components. However, soil–structure interaction (SSI) and foundation flexibility may modify the effective input motion and system dynamic characteristics, thereby altering relative displacement demands under certain field conditions.
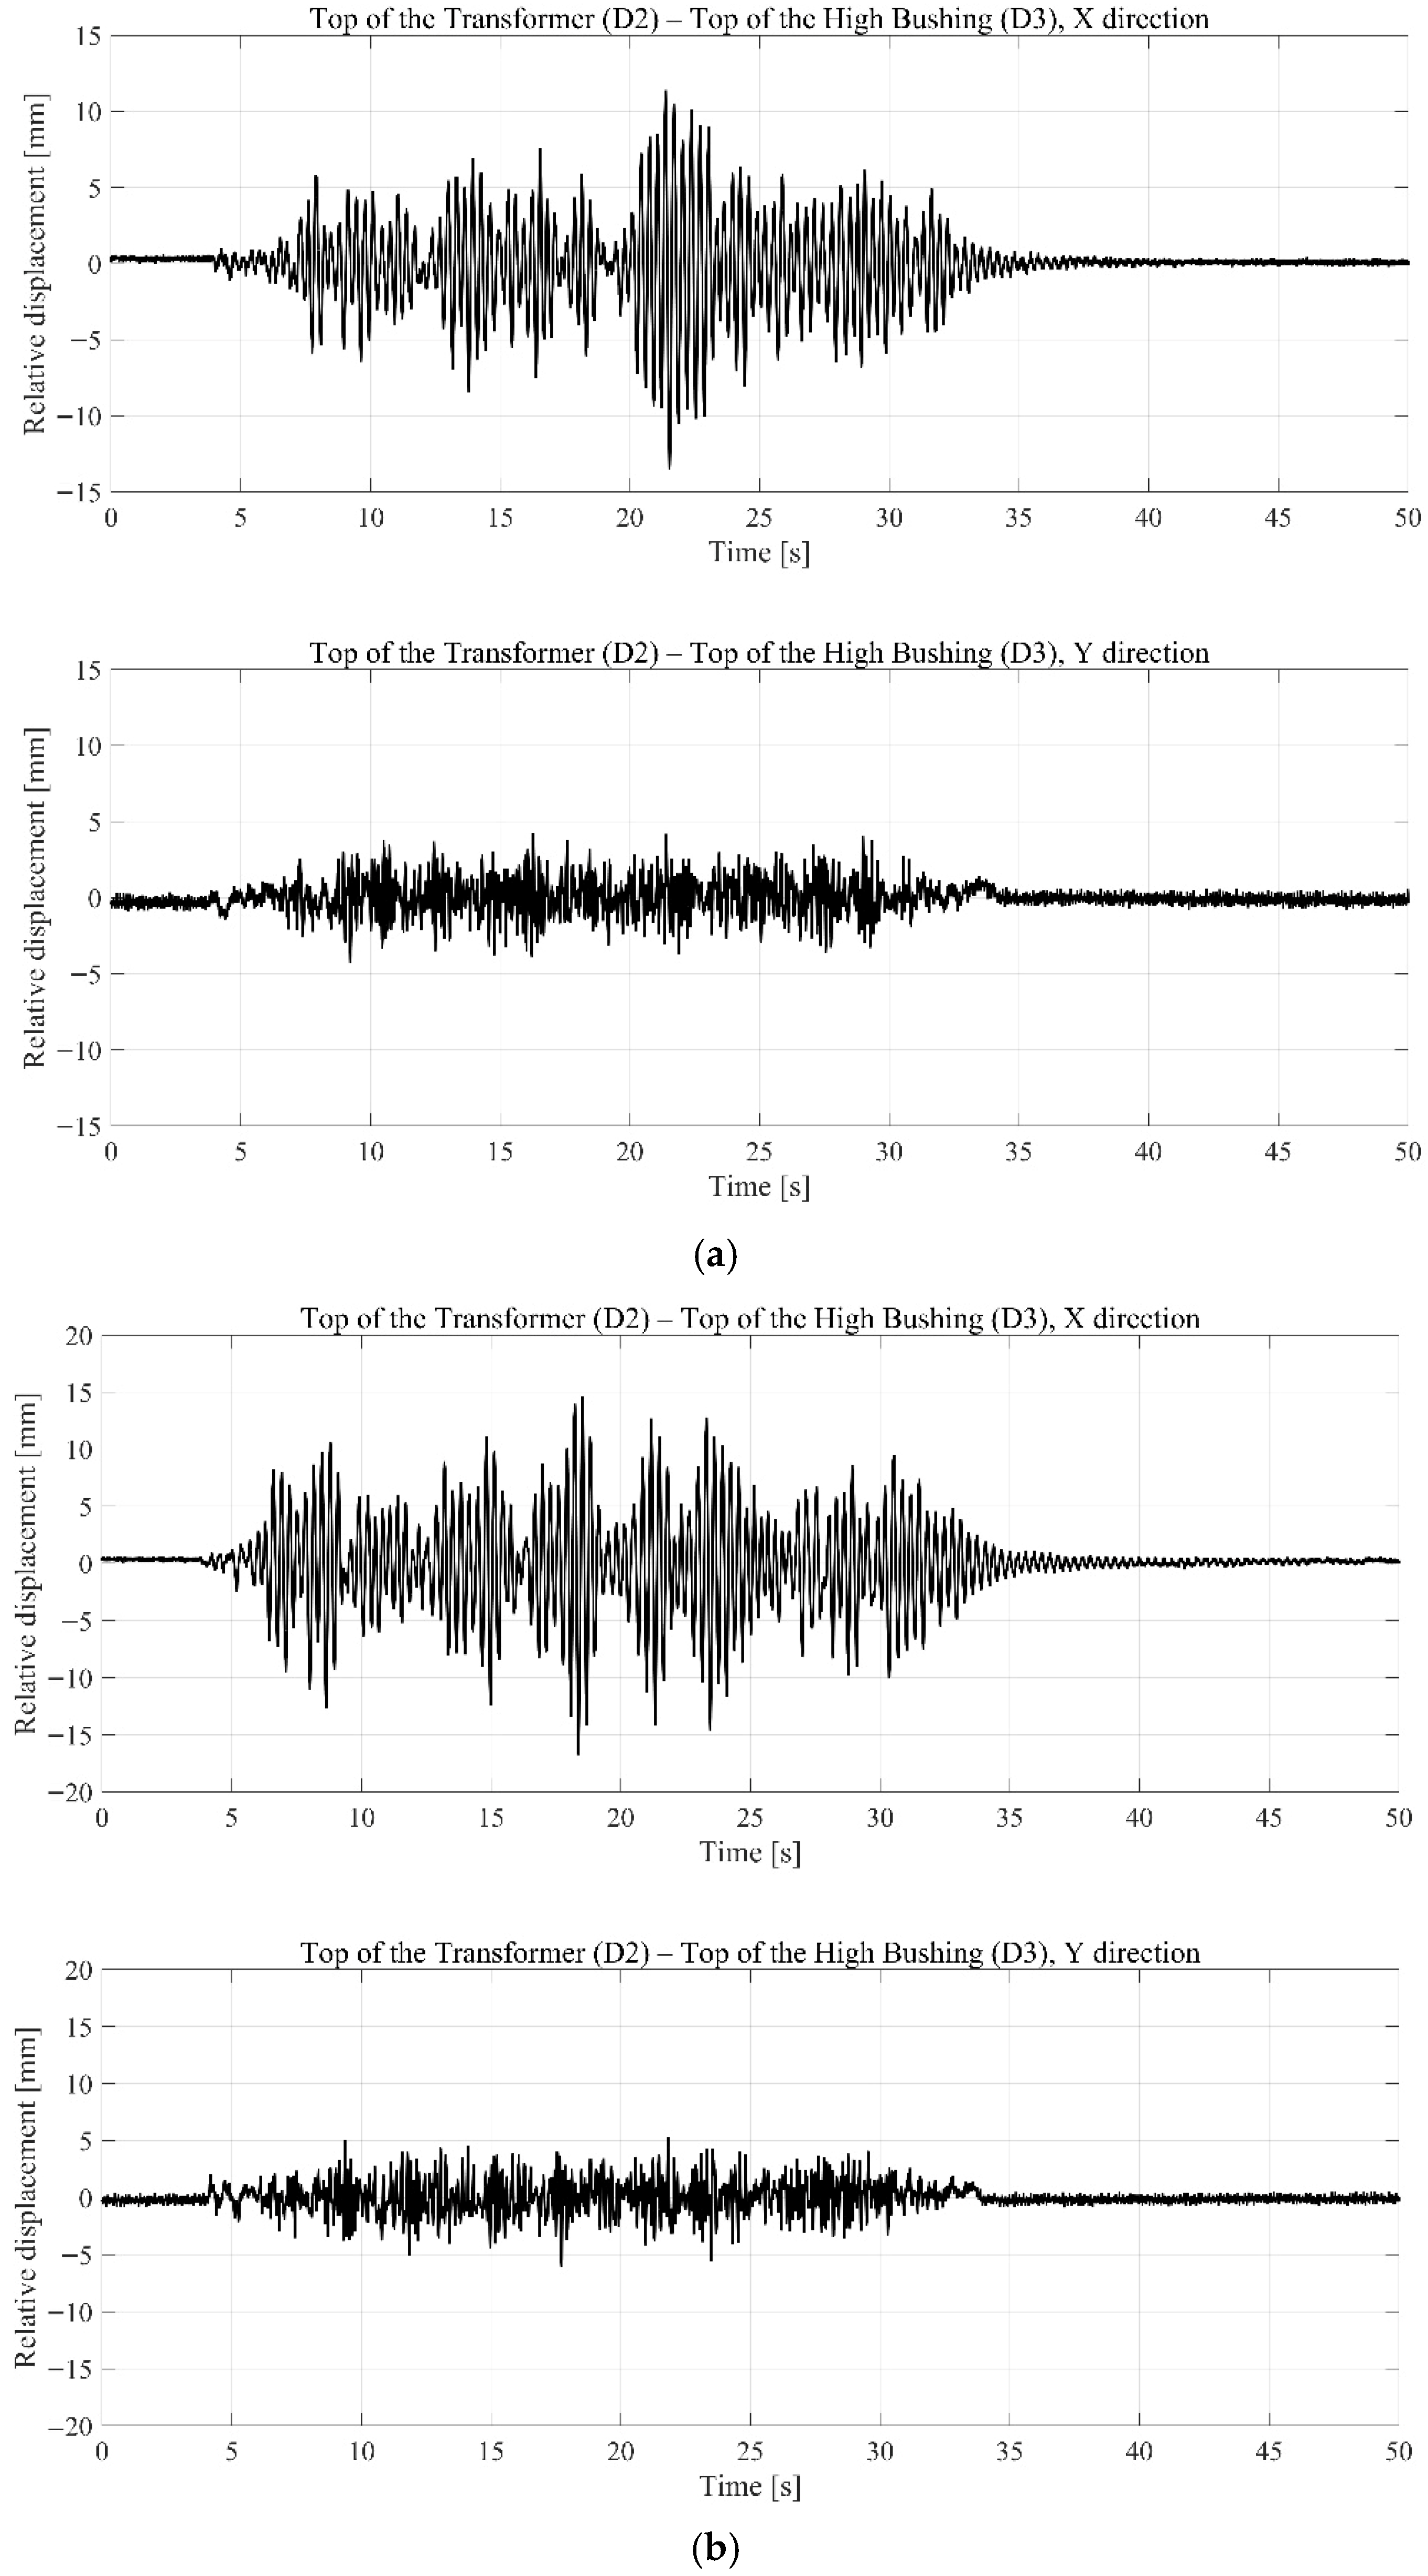
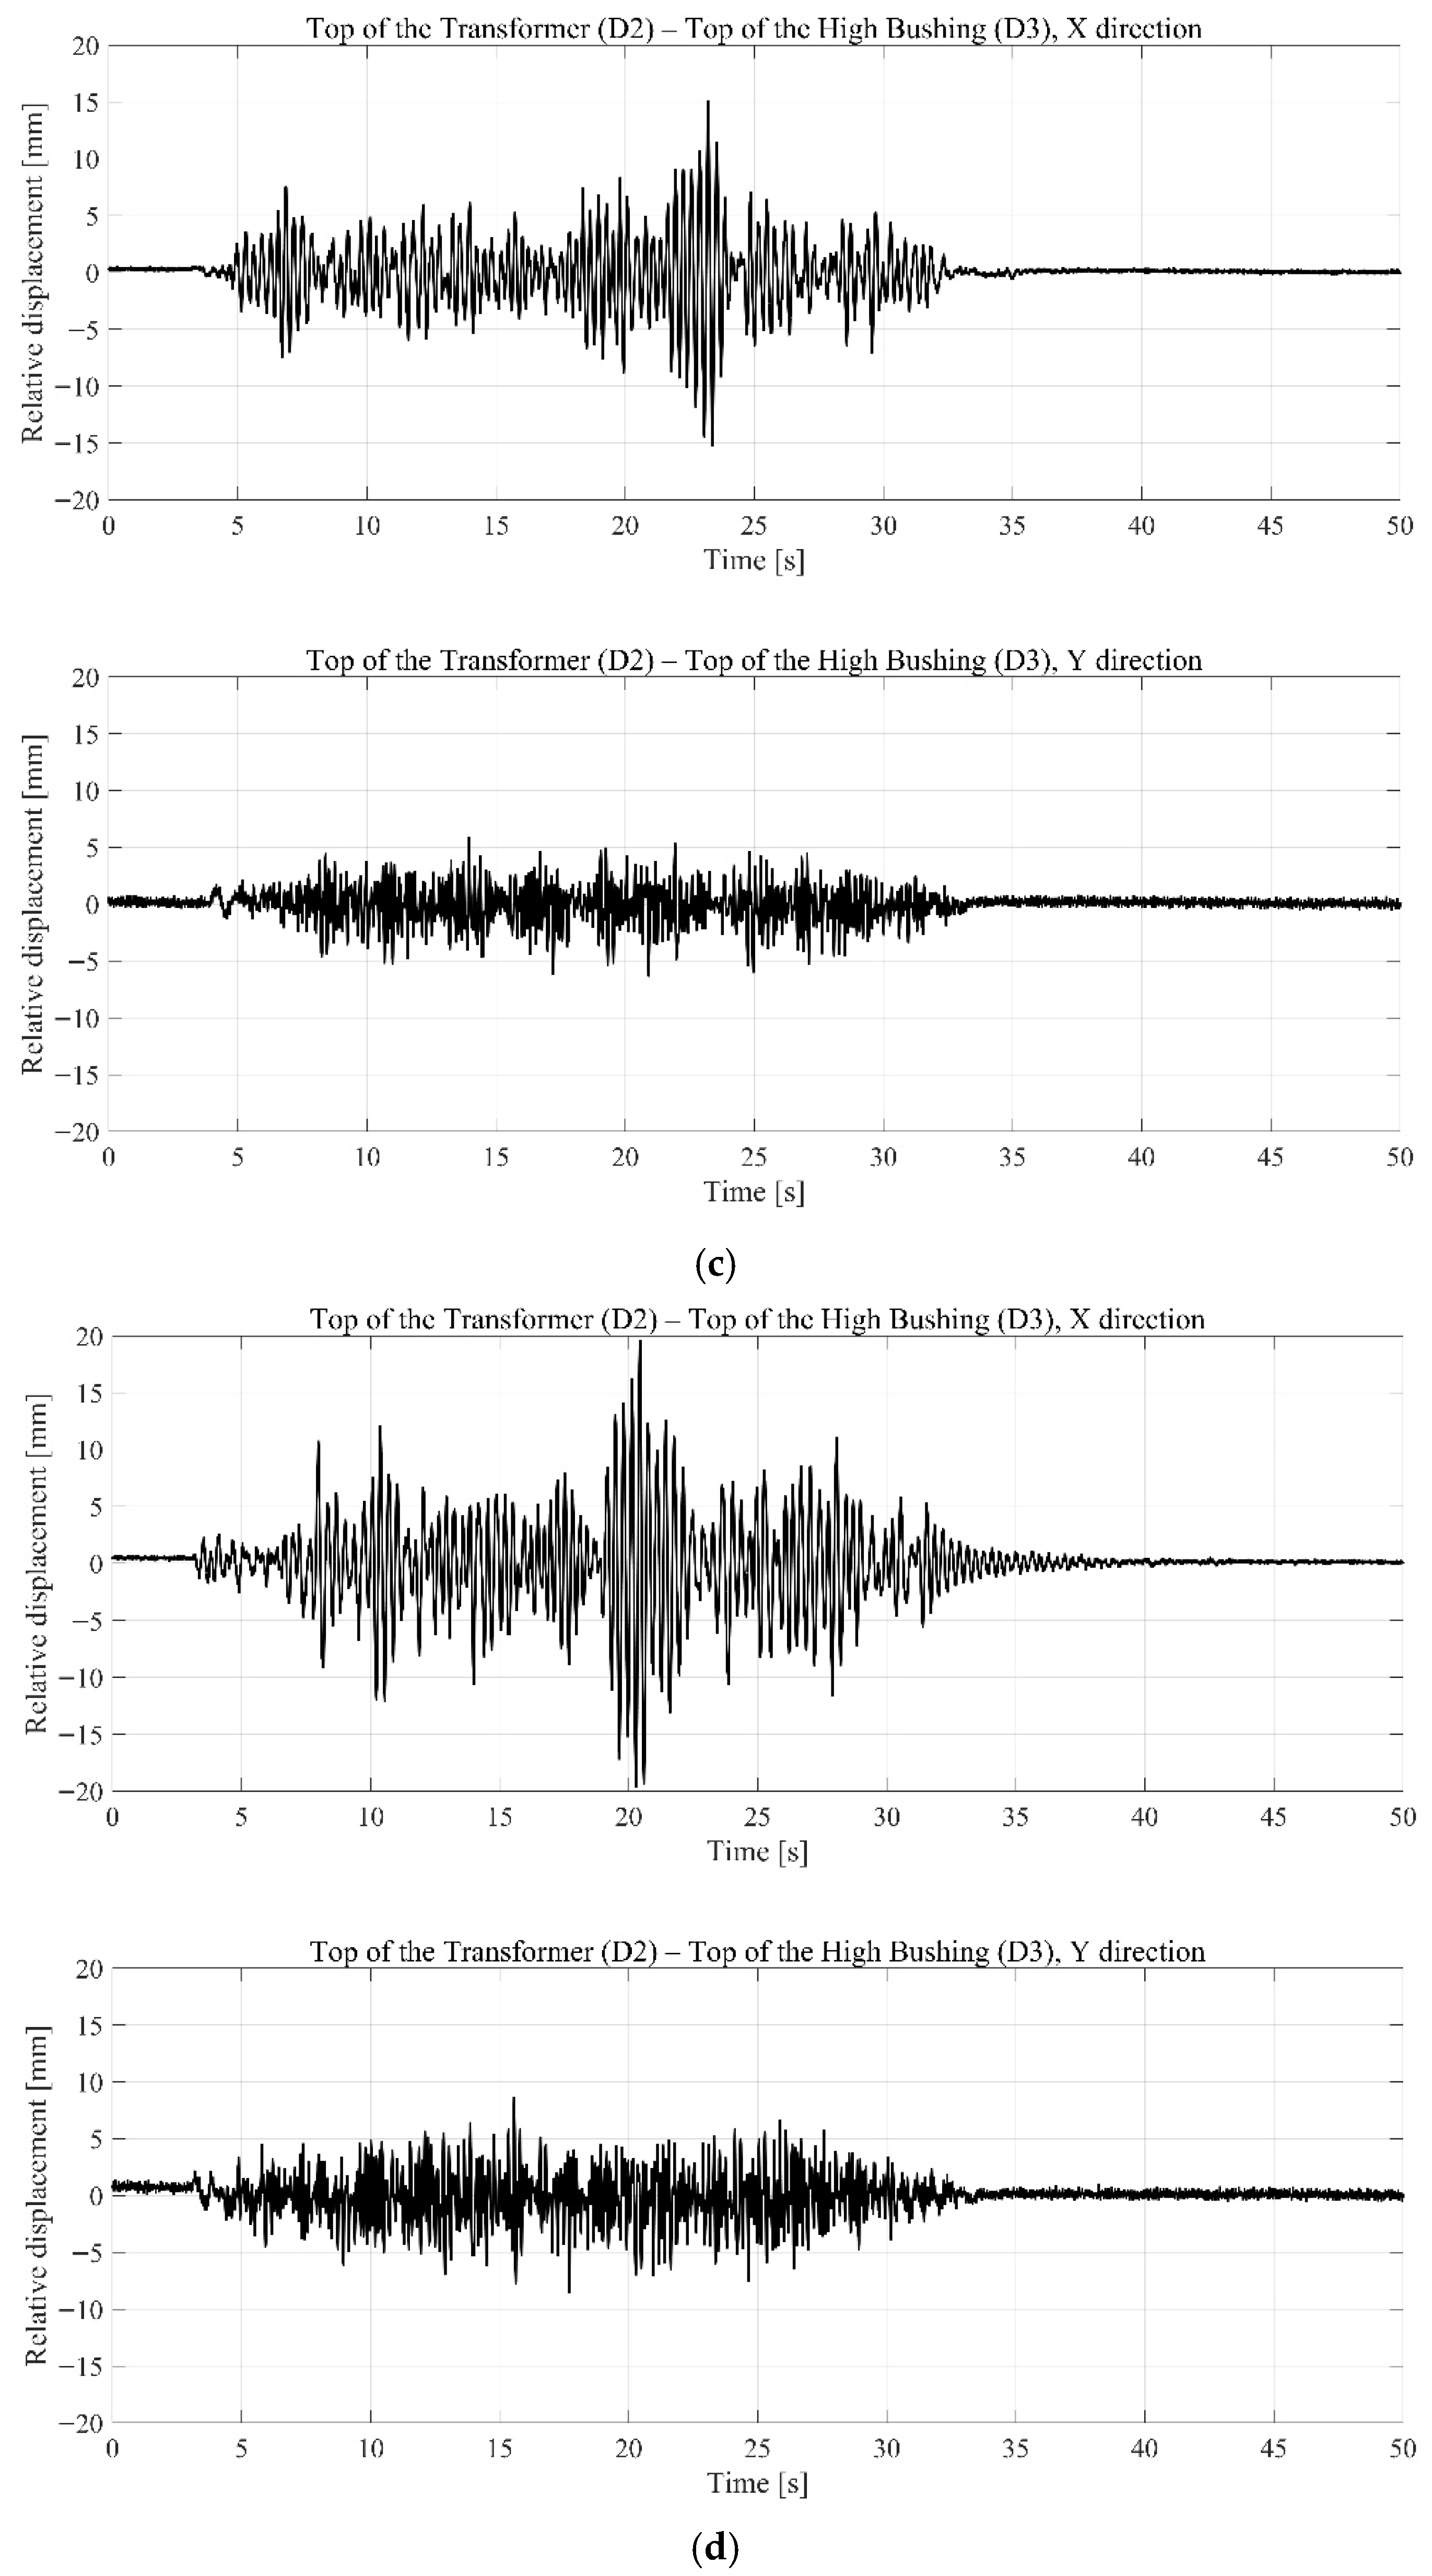
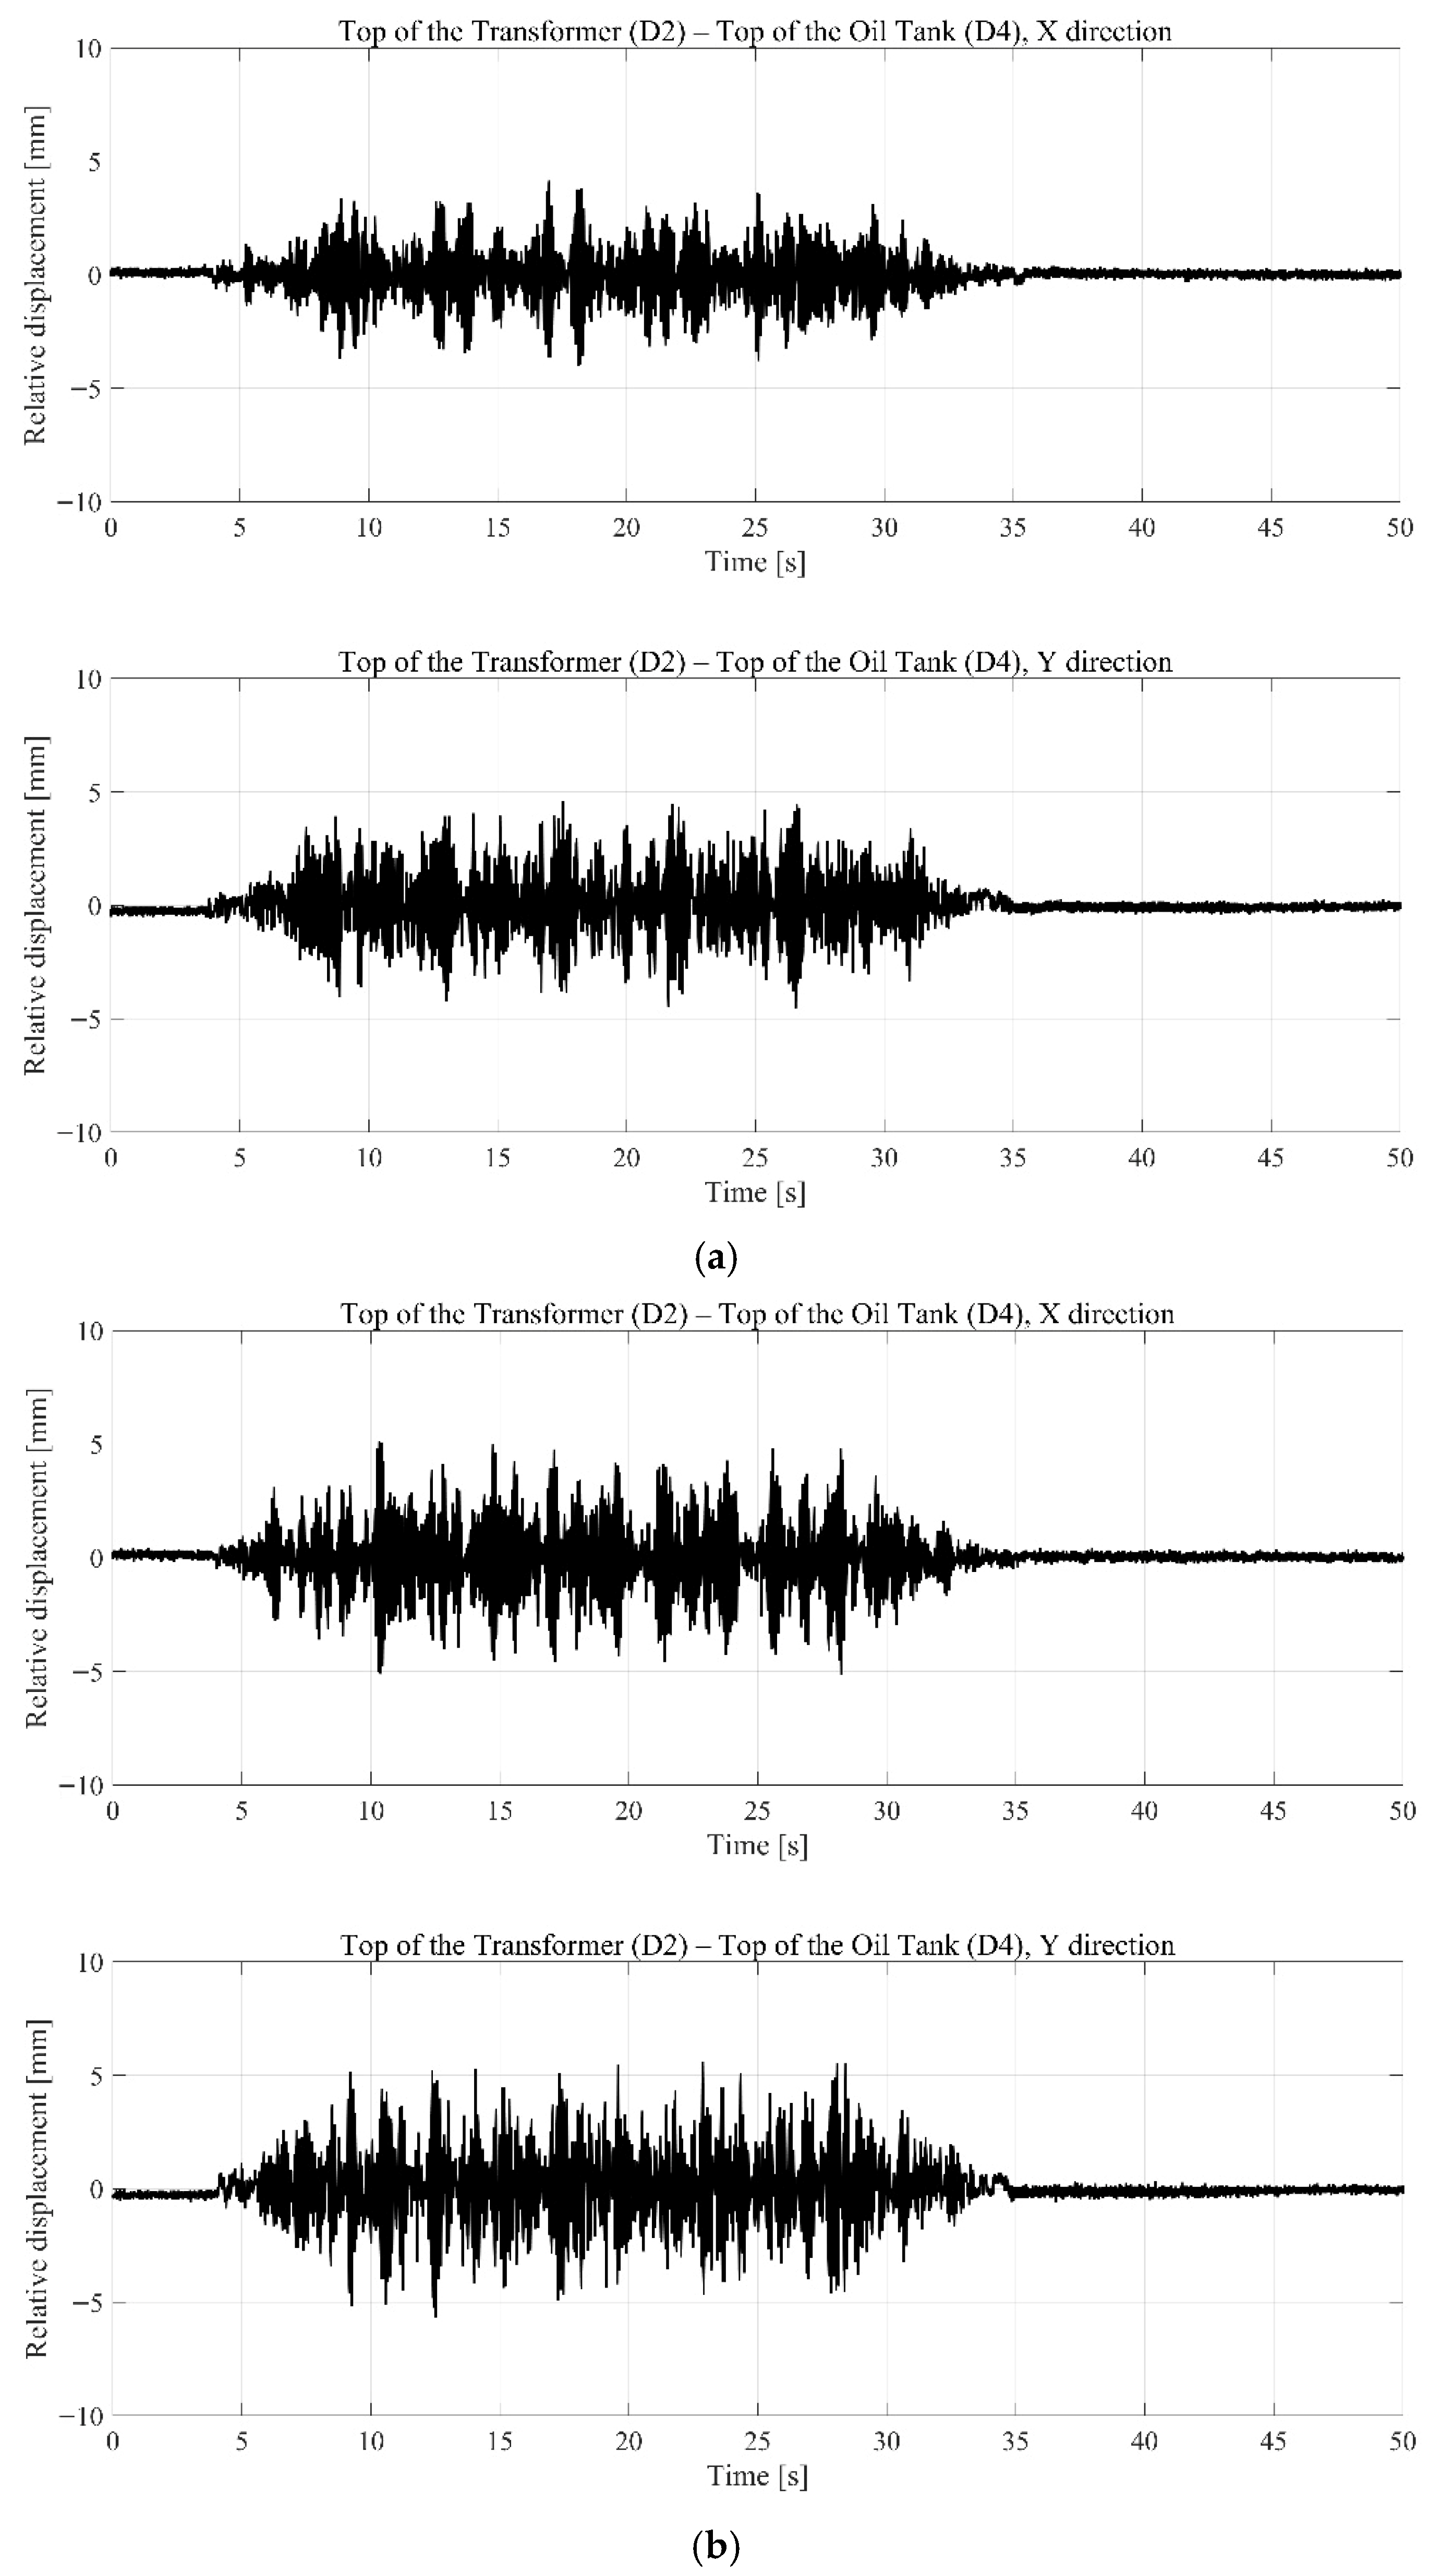
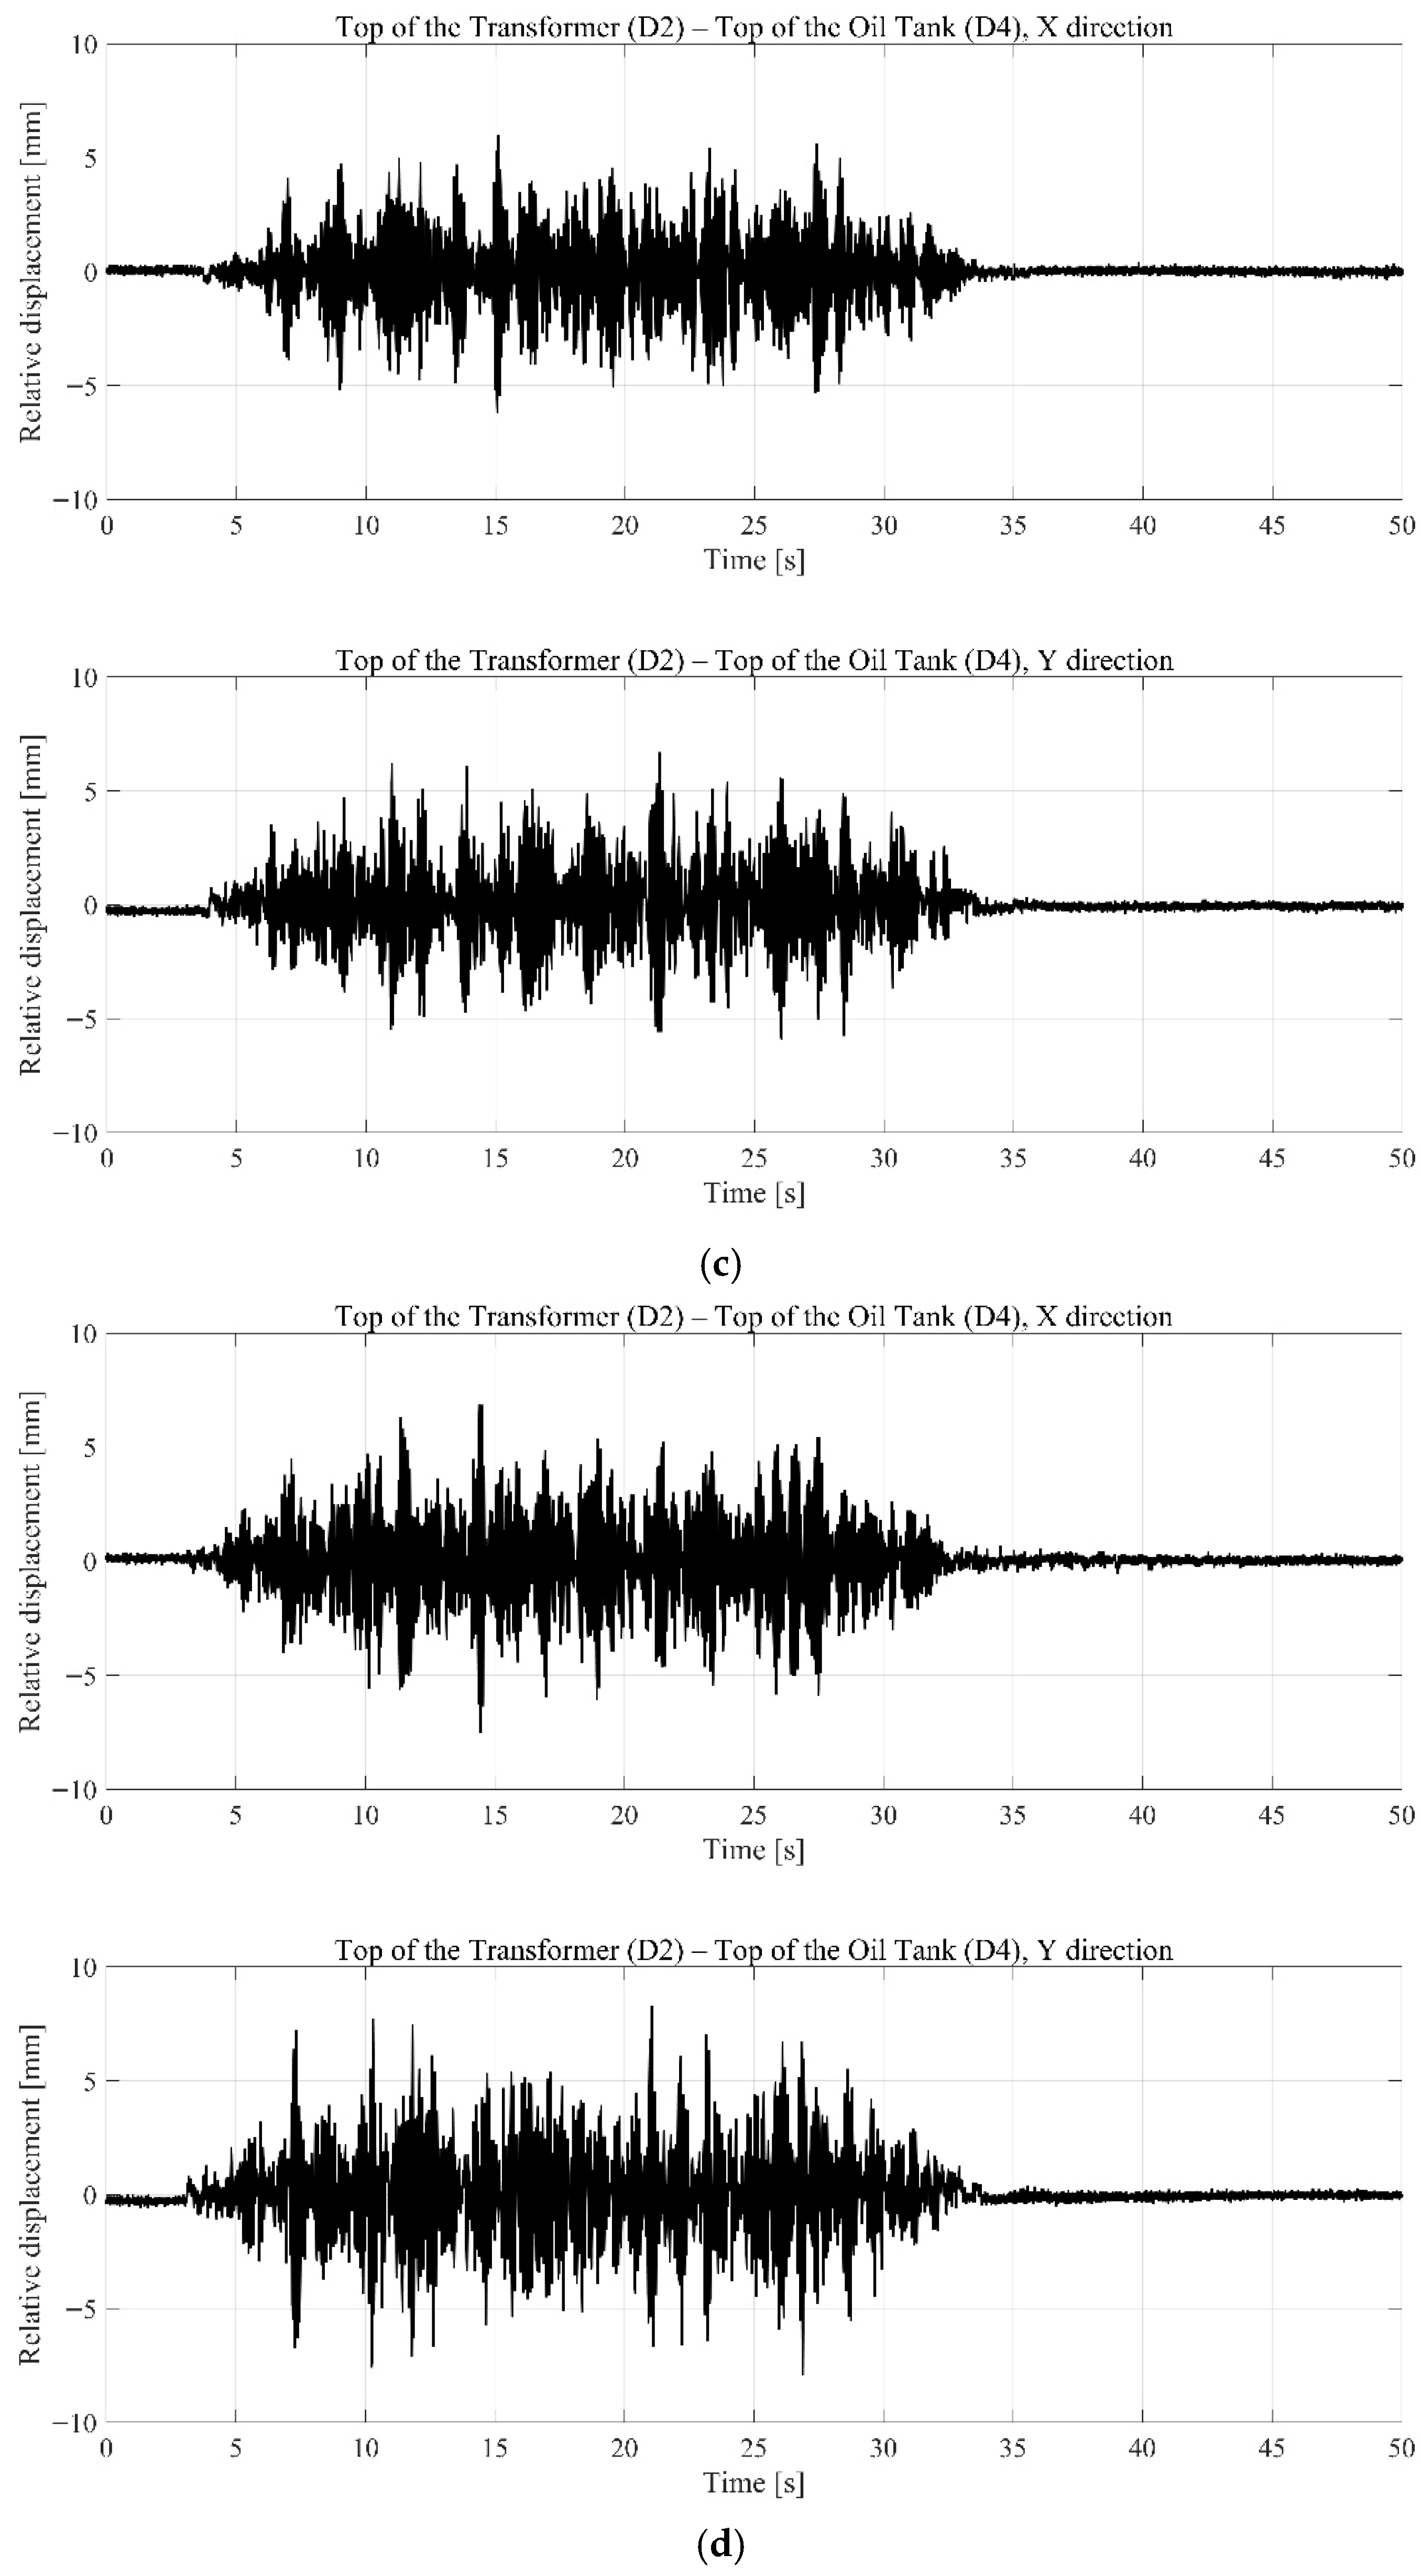
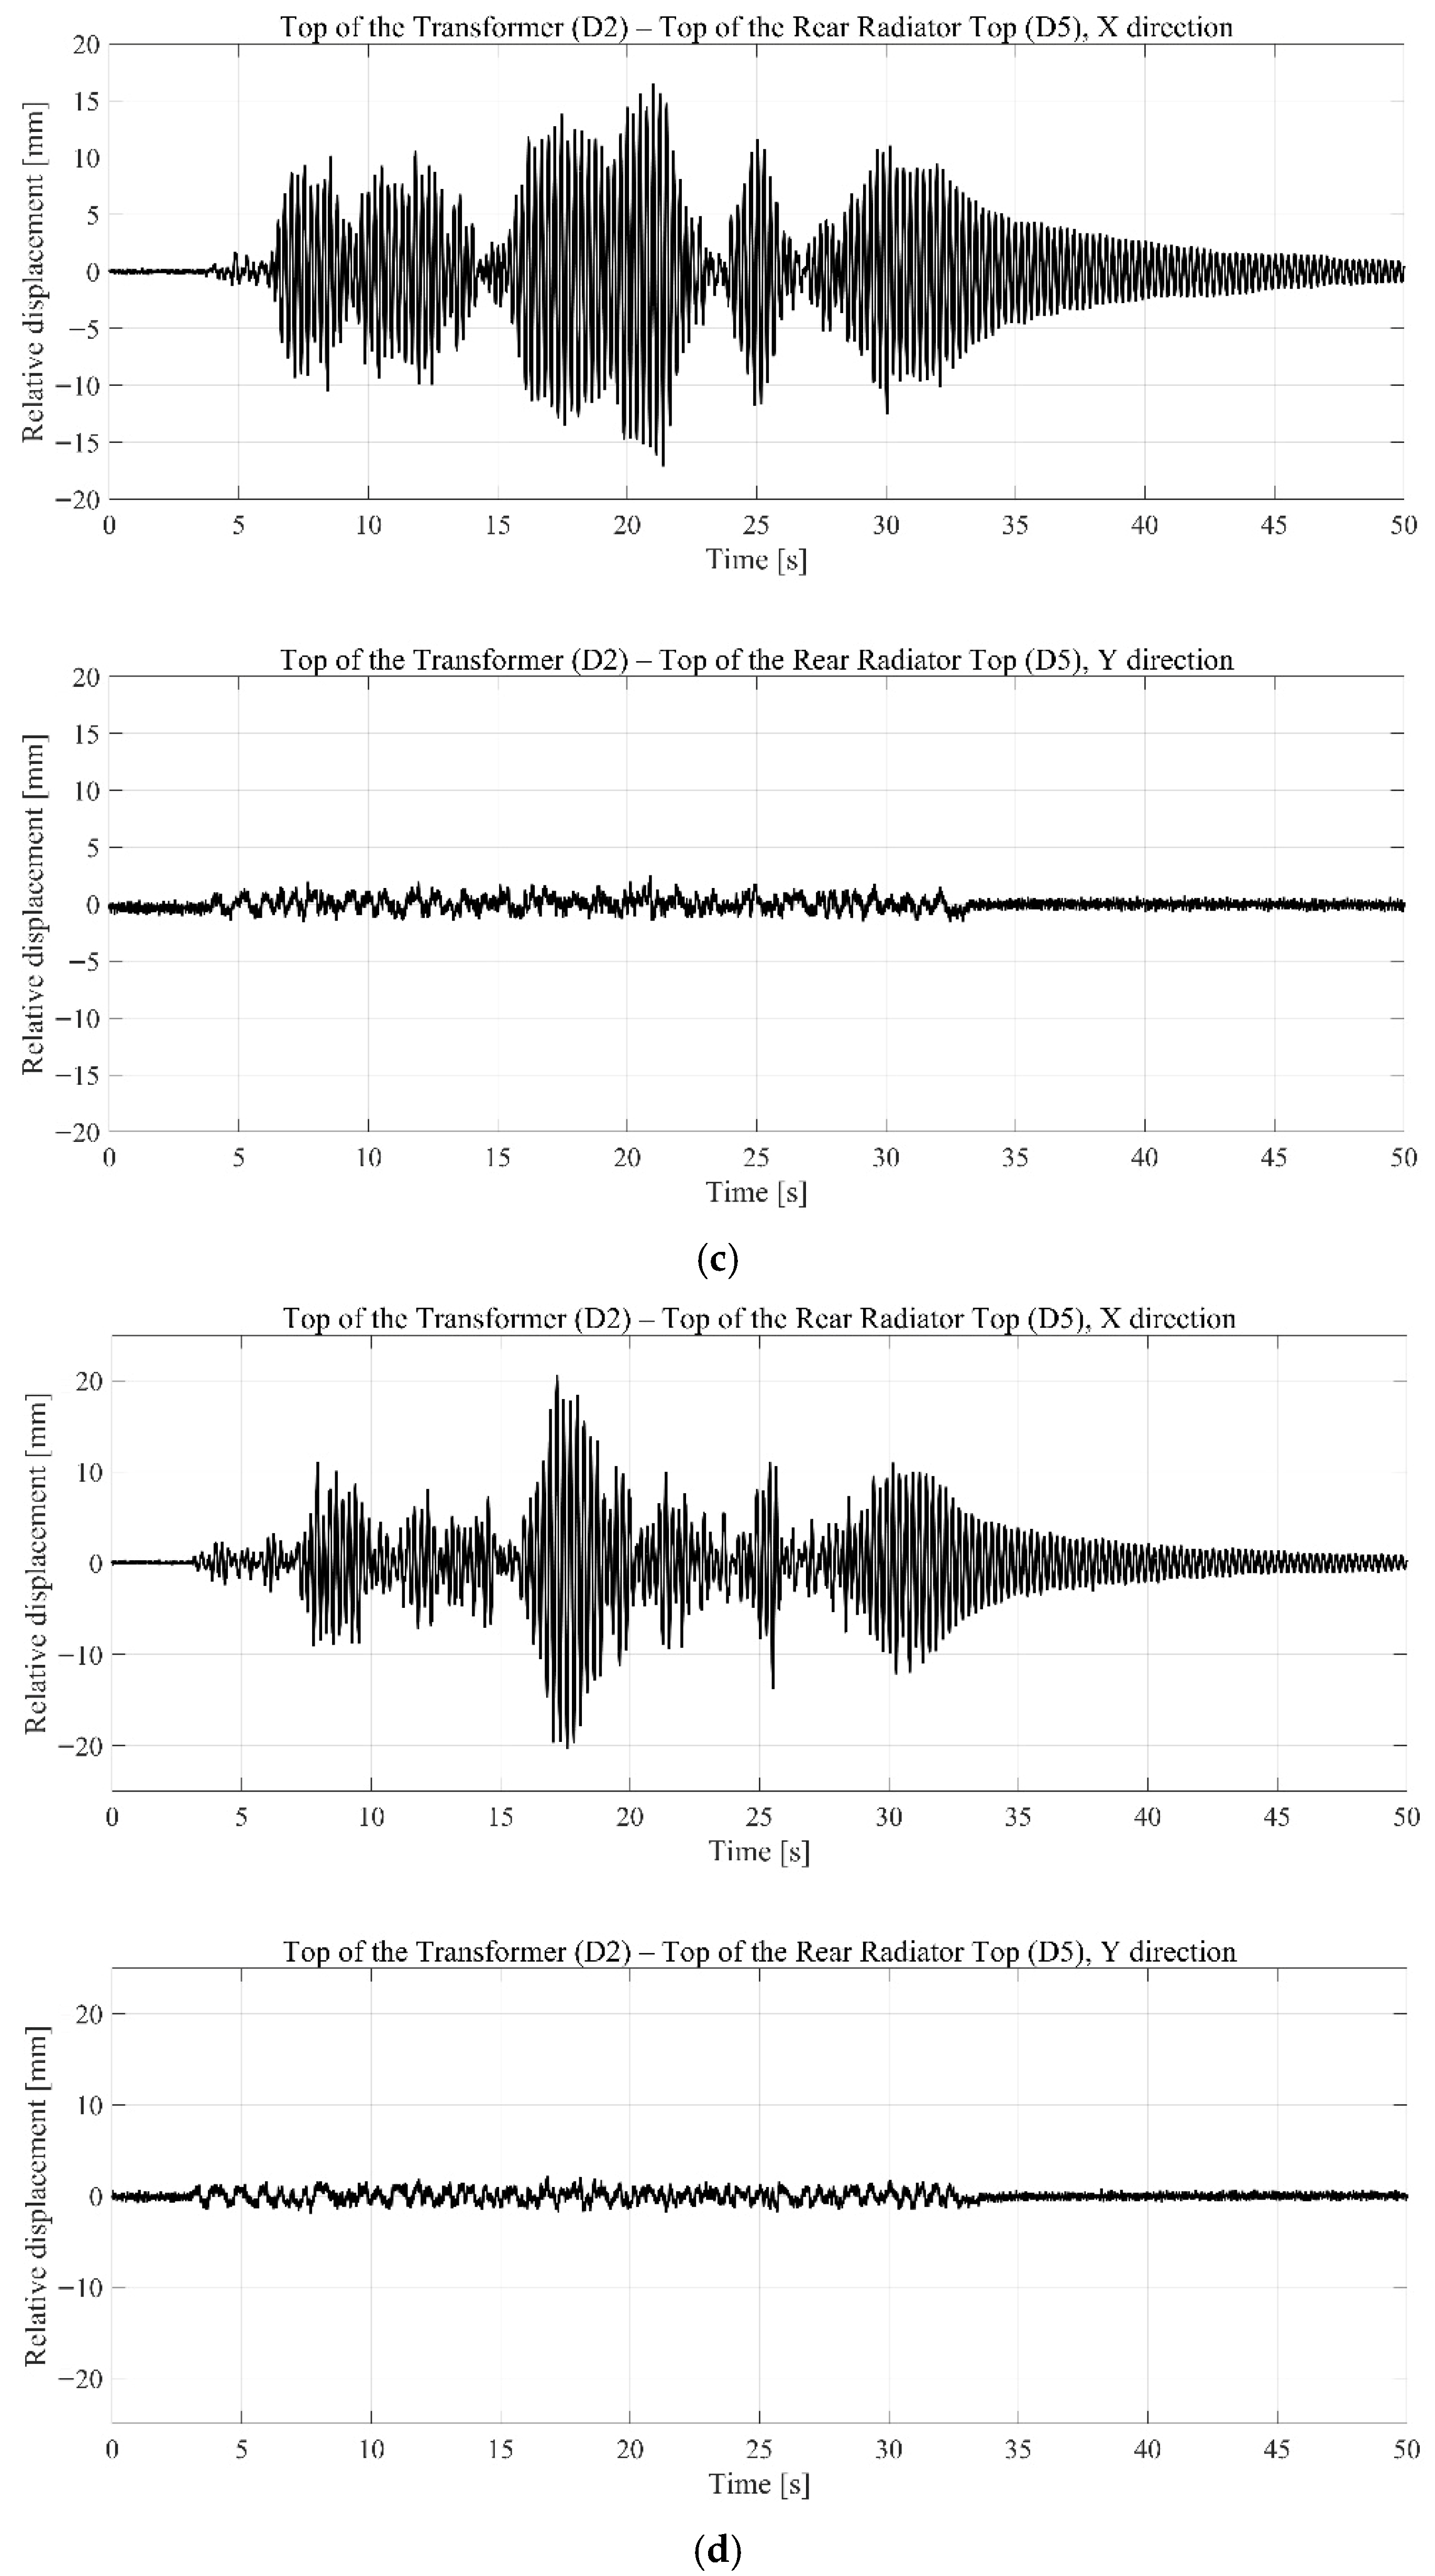
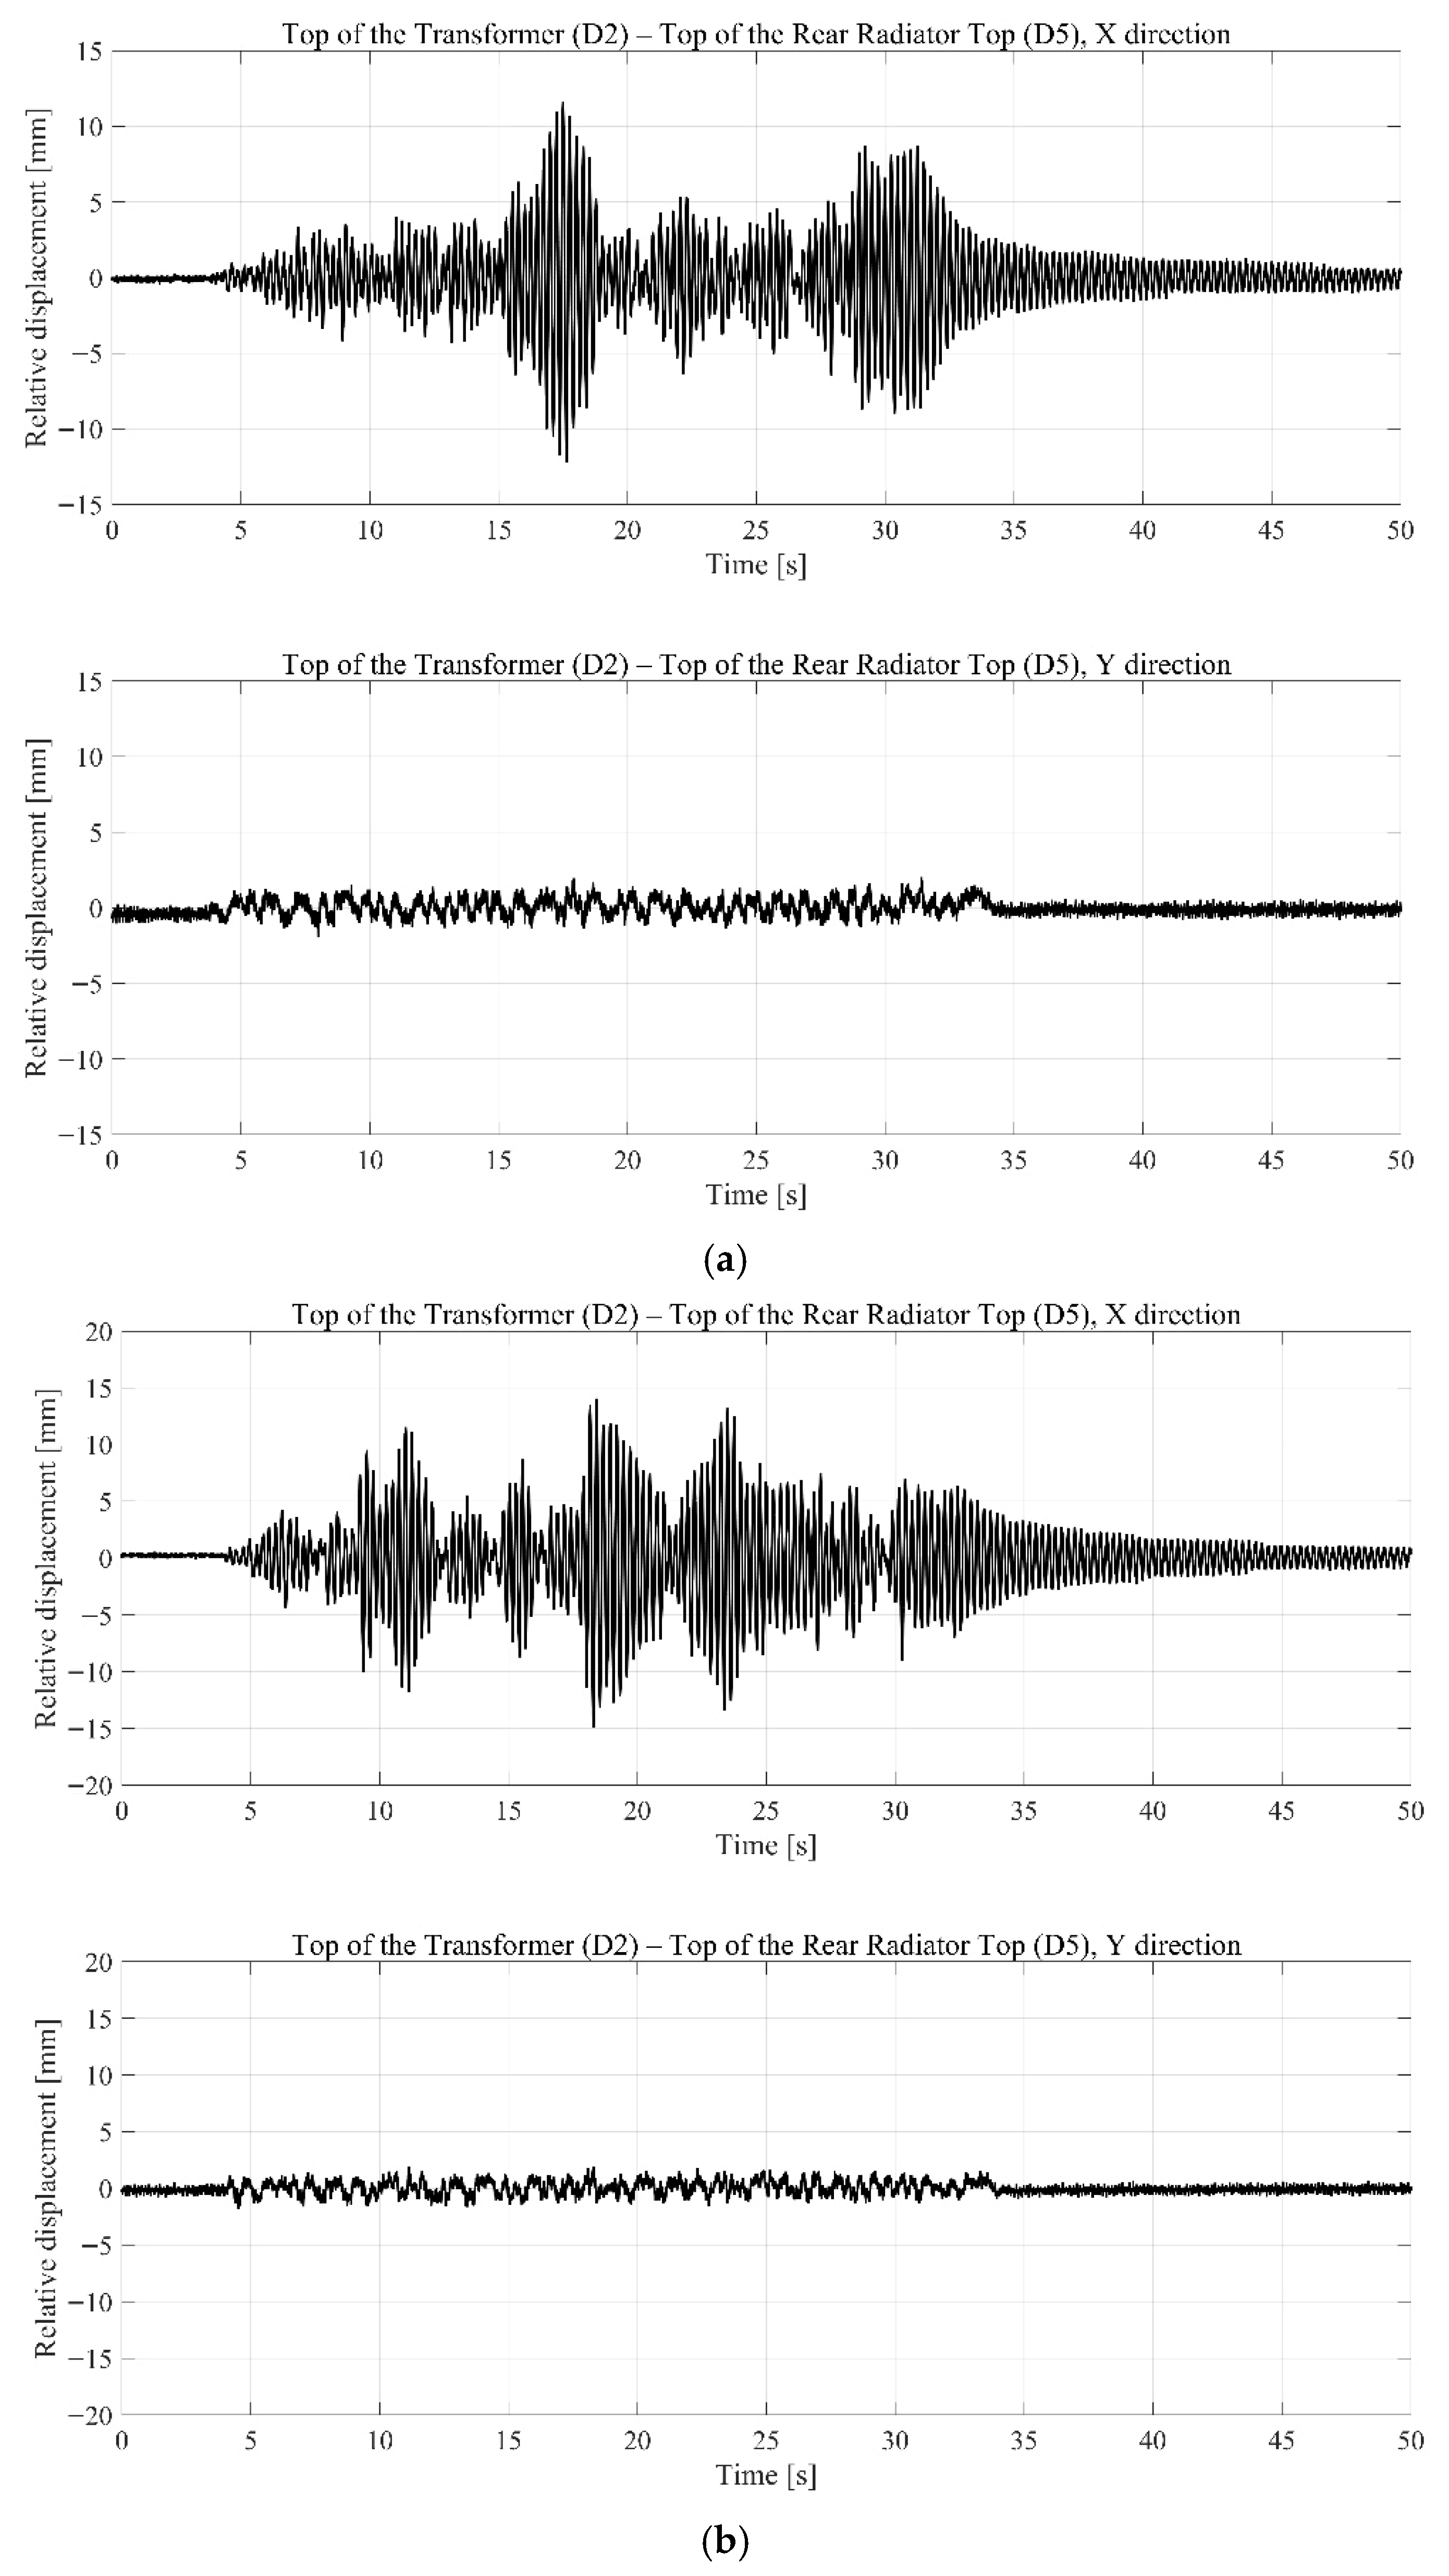
The seismic simulation test results were analyzed across the considered ground conditions and return periods. The relative displacement responses between the transformer body and auxiliary components are shown in Figure 5, Figure 6, Figure 7 and Figure 8, and the corresponding maxima are summarized in Table 5. Overall, relative displacements increased in all sections as the input motion intensity increased. Among the evaluated connections, the transformer–bushing (T–B) section exhibited the largest relative displacement, reaching 19.67 mm in the X-direction and 8.67 mm in the Y-direction in Test 12. This behavior is attributed to differences in the dynamic characteristics of the transformer body and the bushing, which induced a phase difference in their responses and amplified the resulting relative motion. Although Test 12 produced the maximum T–B relative displacement in the X-direction, the Y-direction response did not necessarily peak in the same test case. This reflects direction-dependent excitation characteristics and coupled interaction between the transformer body and the bushing, which can produce distinct amplification trends and phase relationships in each horizontal direction.
In the transformer–oil tank (T–O) section, the maximum relative displacements were 7.53 mm in the X-direction and 8.29 mm in the Y-direction, which were relatively small. However, after Test 9, the Y-direction displacement steadily increased, indicating displacement concentration due to phase differences between the oil tank and the transformer body. In the transformer–radiator (T–R) section, the X-direction displacement was notably large, exceeding 20 mm after Test 10. Although the radiator relative displacement could potentially exceed 20 mm, the measured values were limited to approximately 20 mm due to contact with the conservator support. In contrast, the Y-direction displacement remained low, with a maximum of 2.37 mm. The repeated concentration of X-direction displacement suggests that radiator connections are highly vulnerable to torsional coupling and transverse vibration effects.
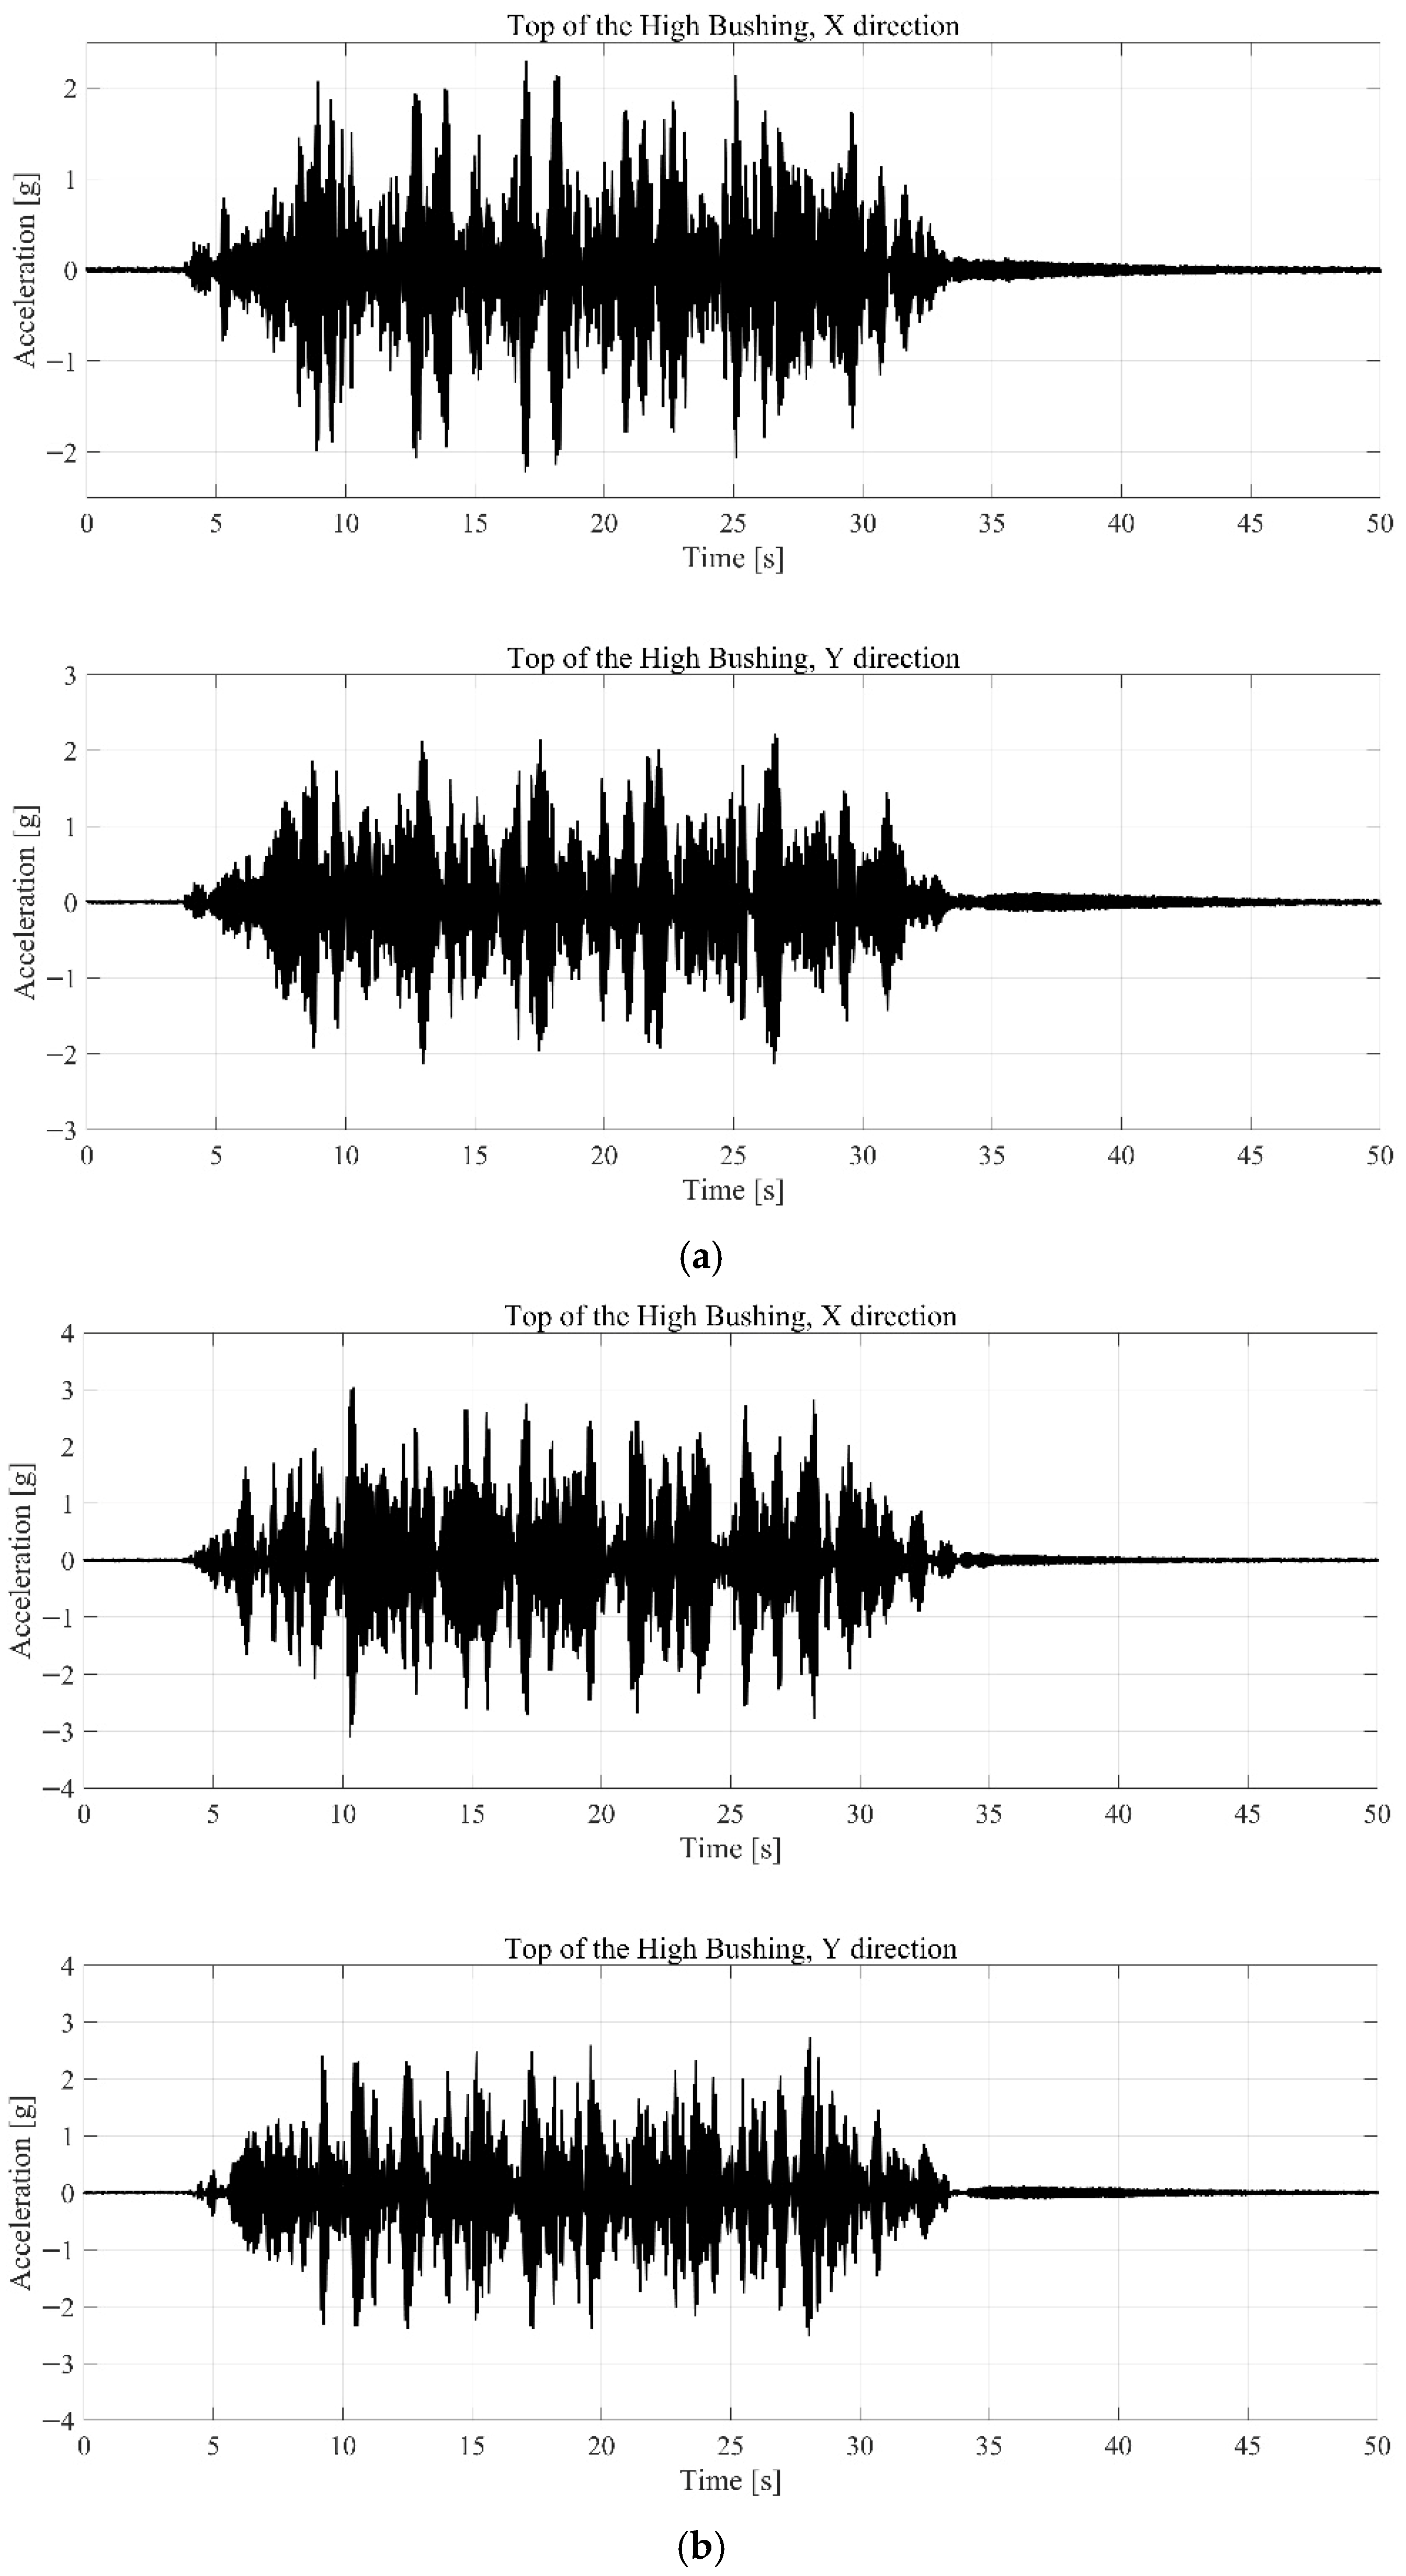
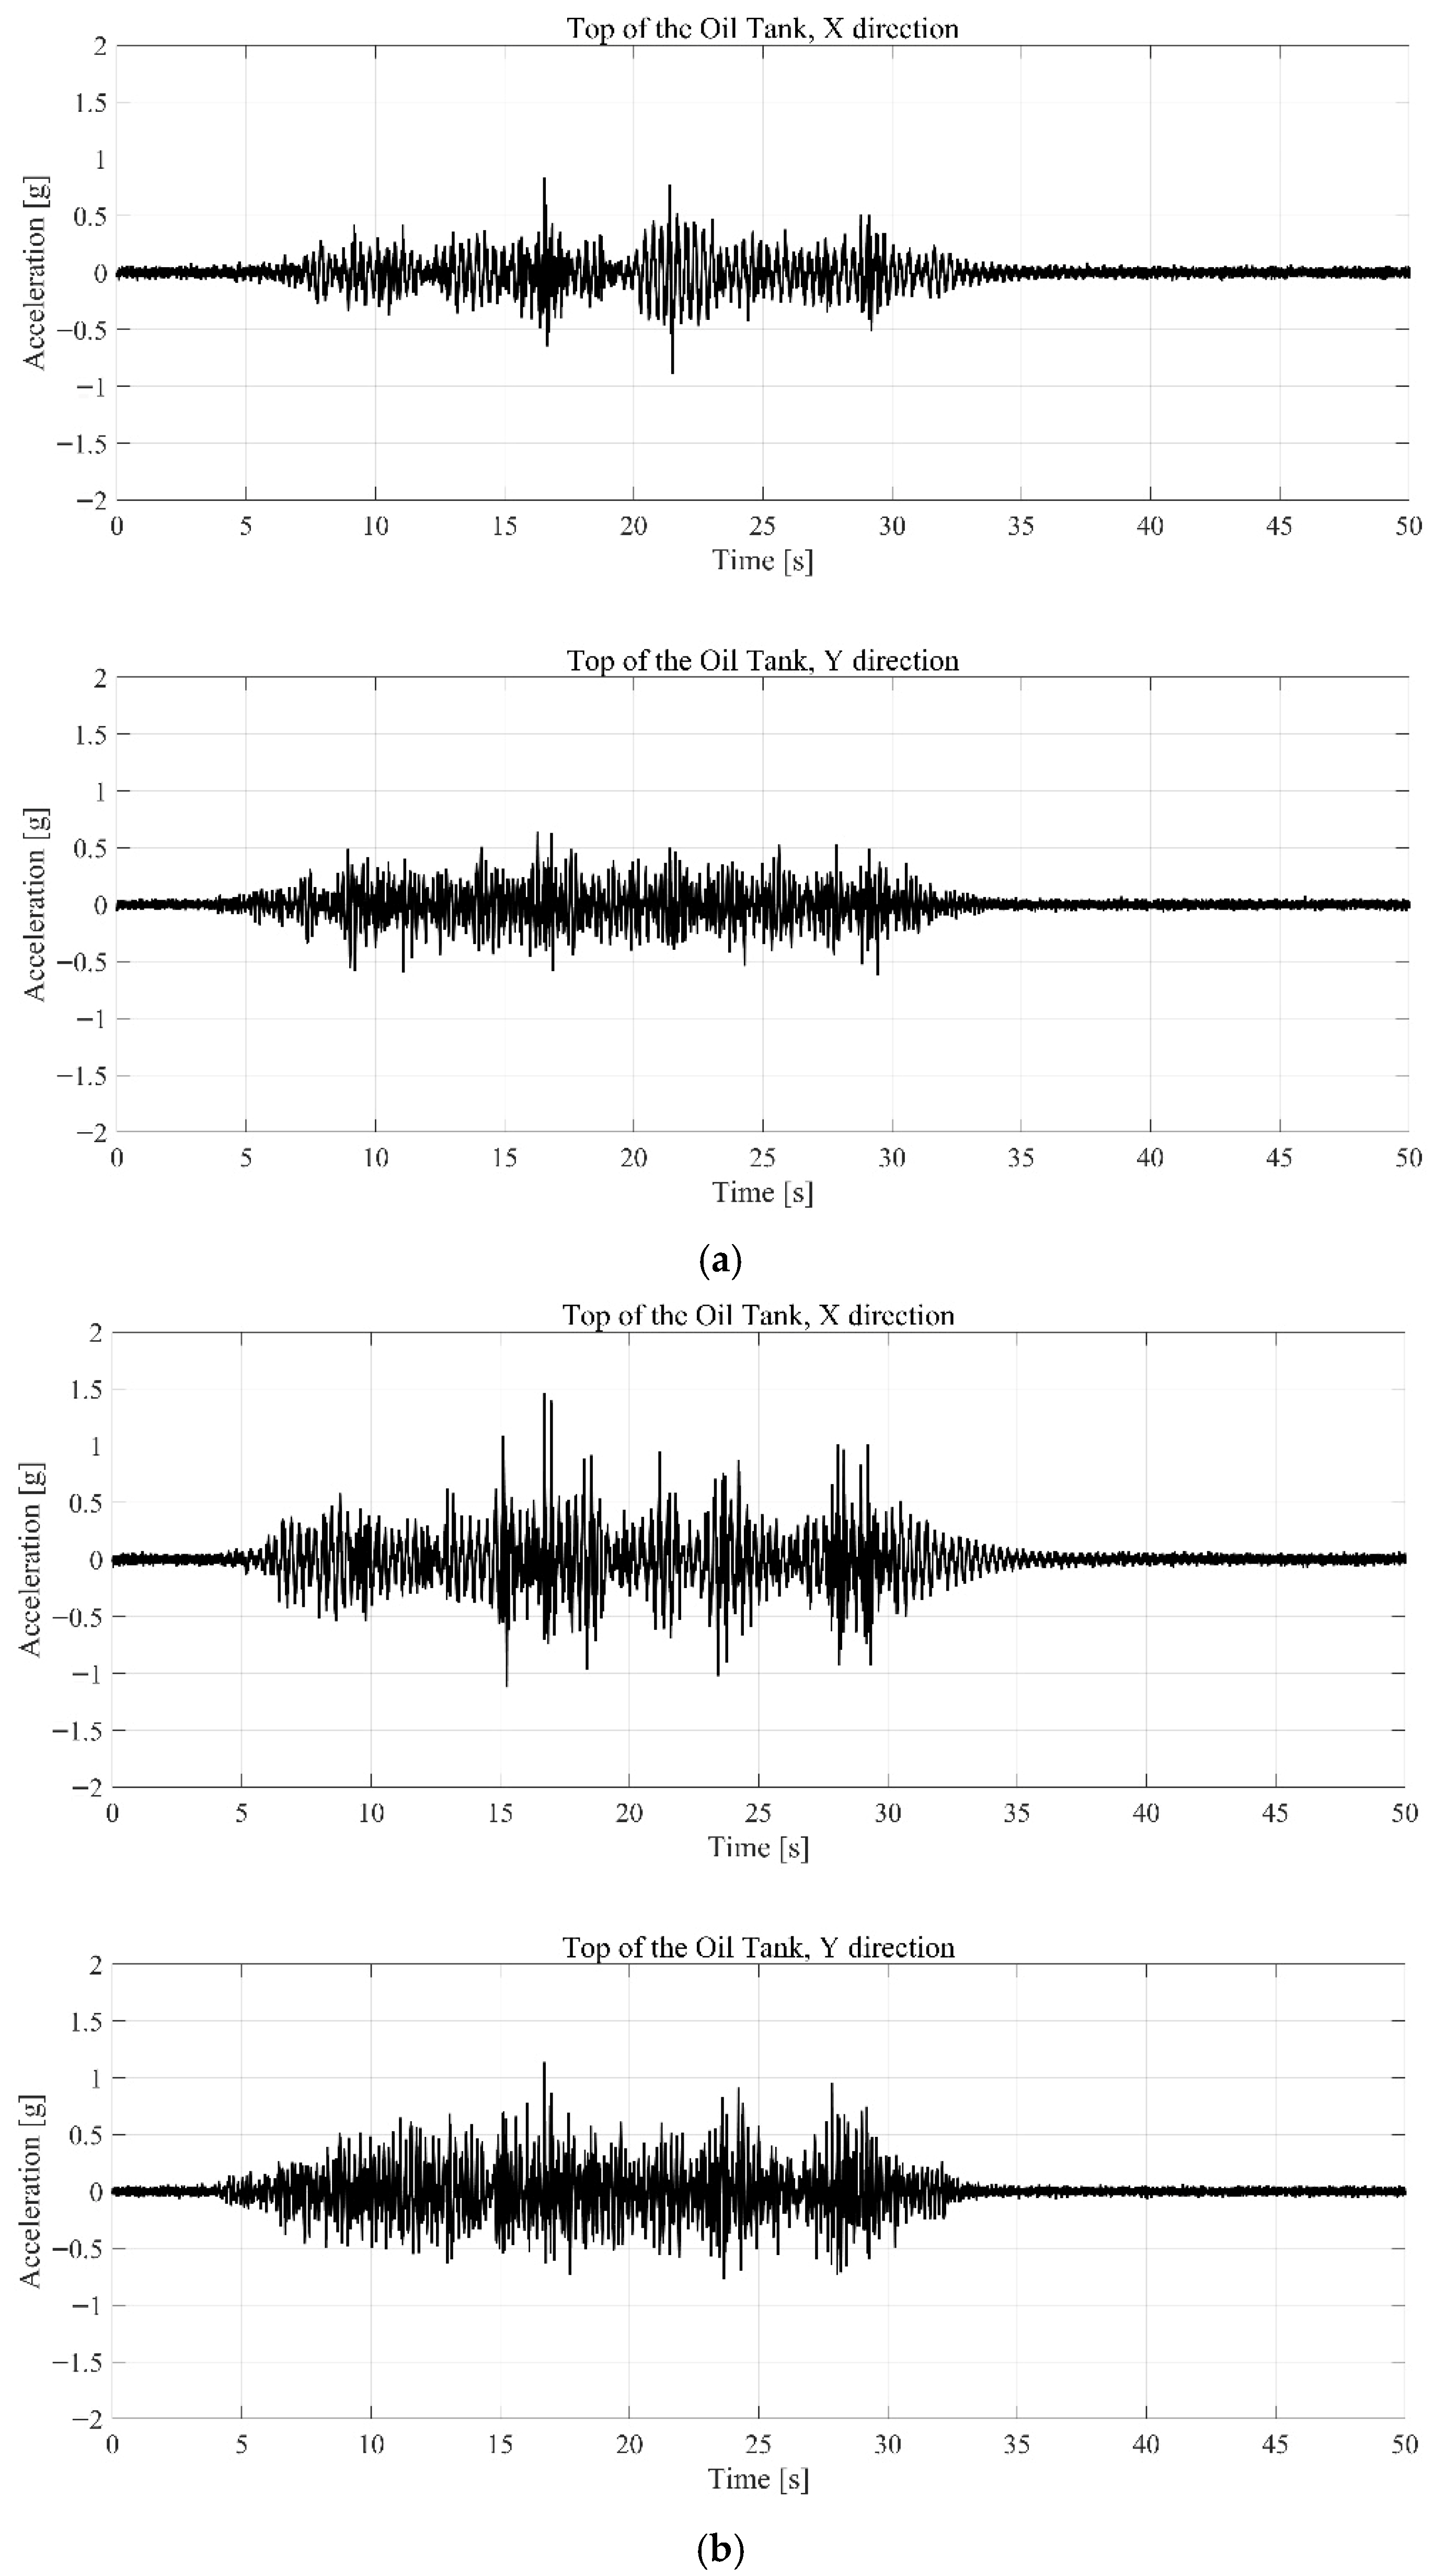
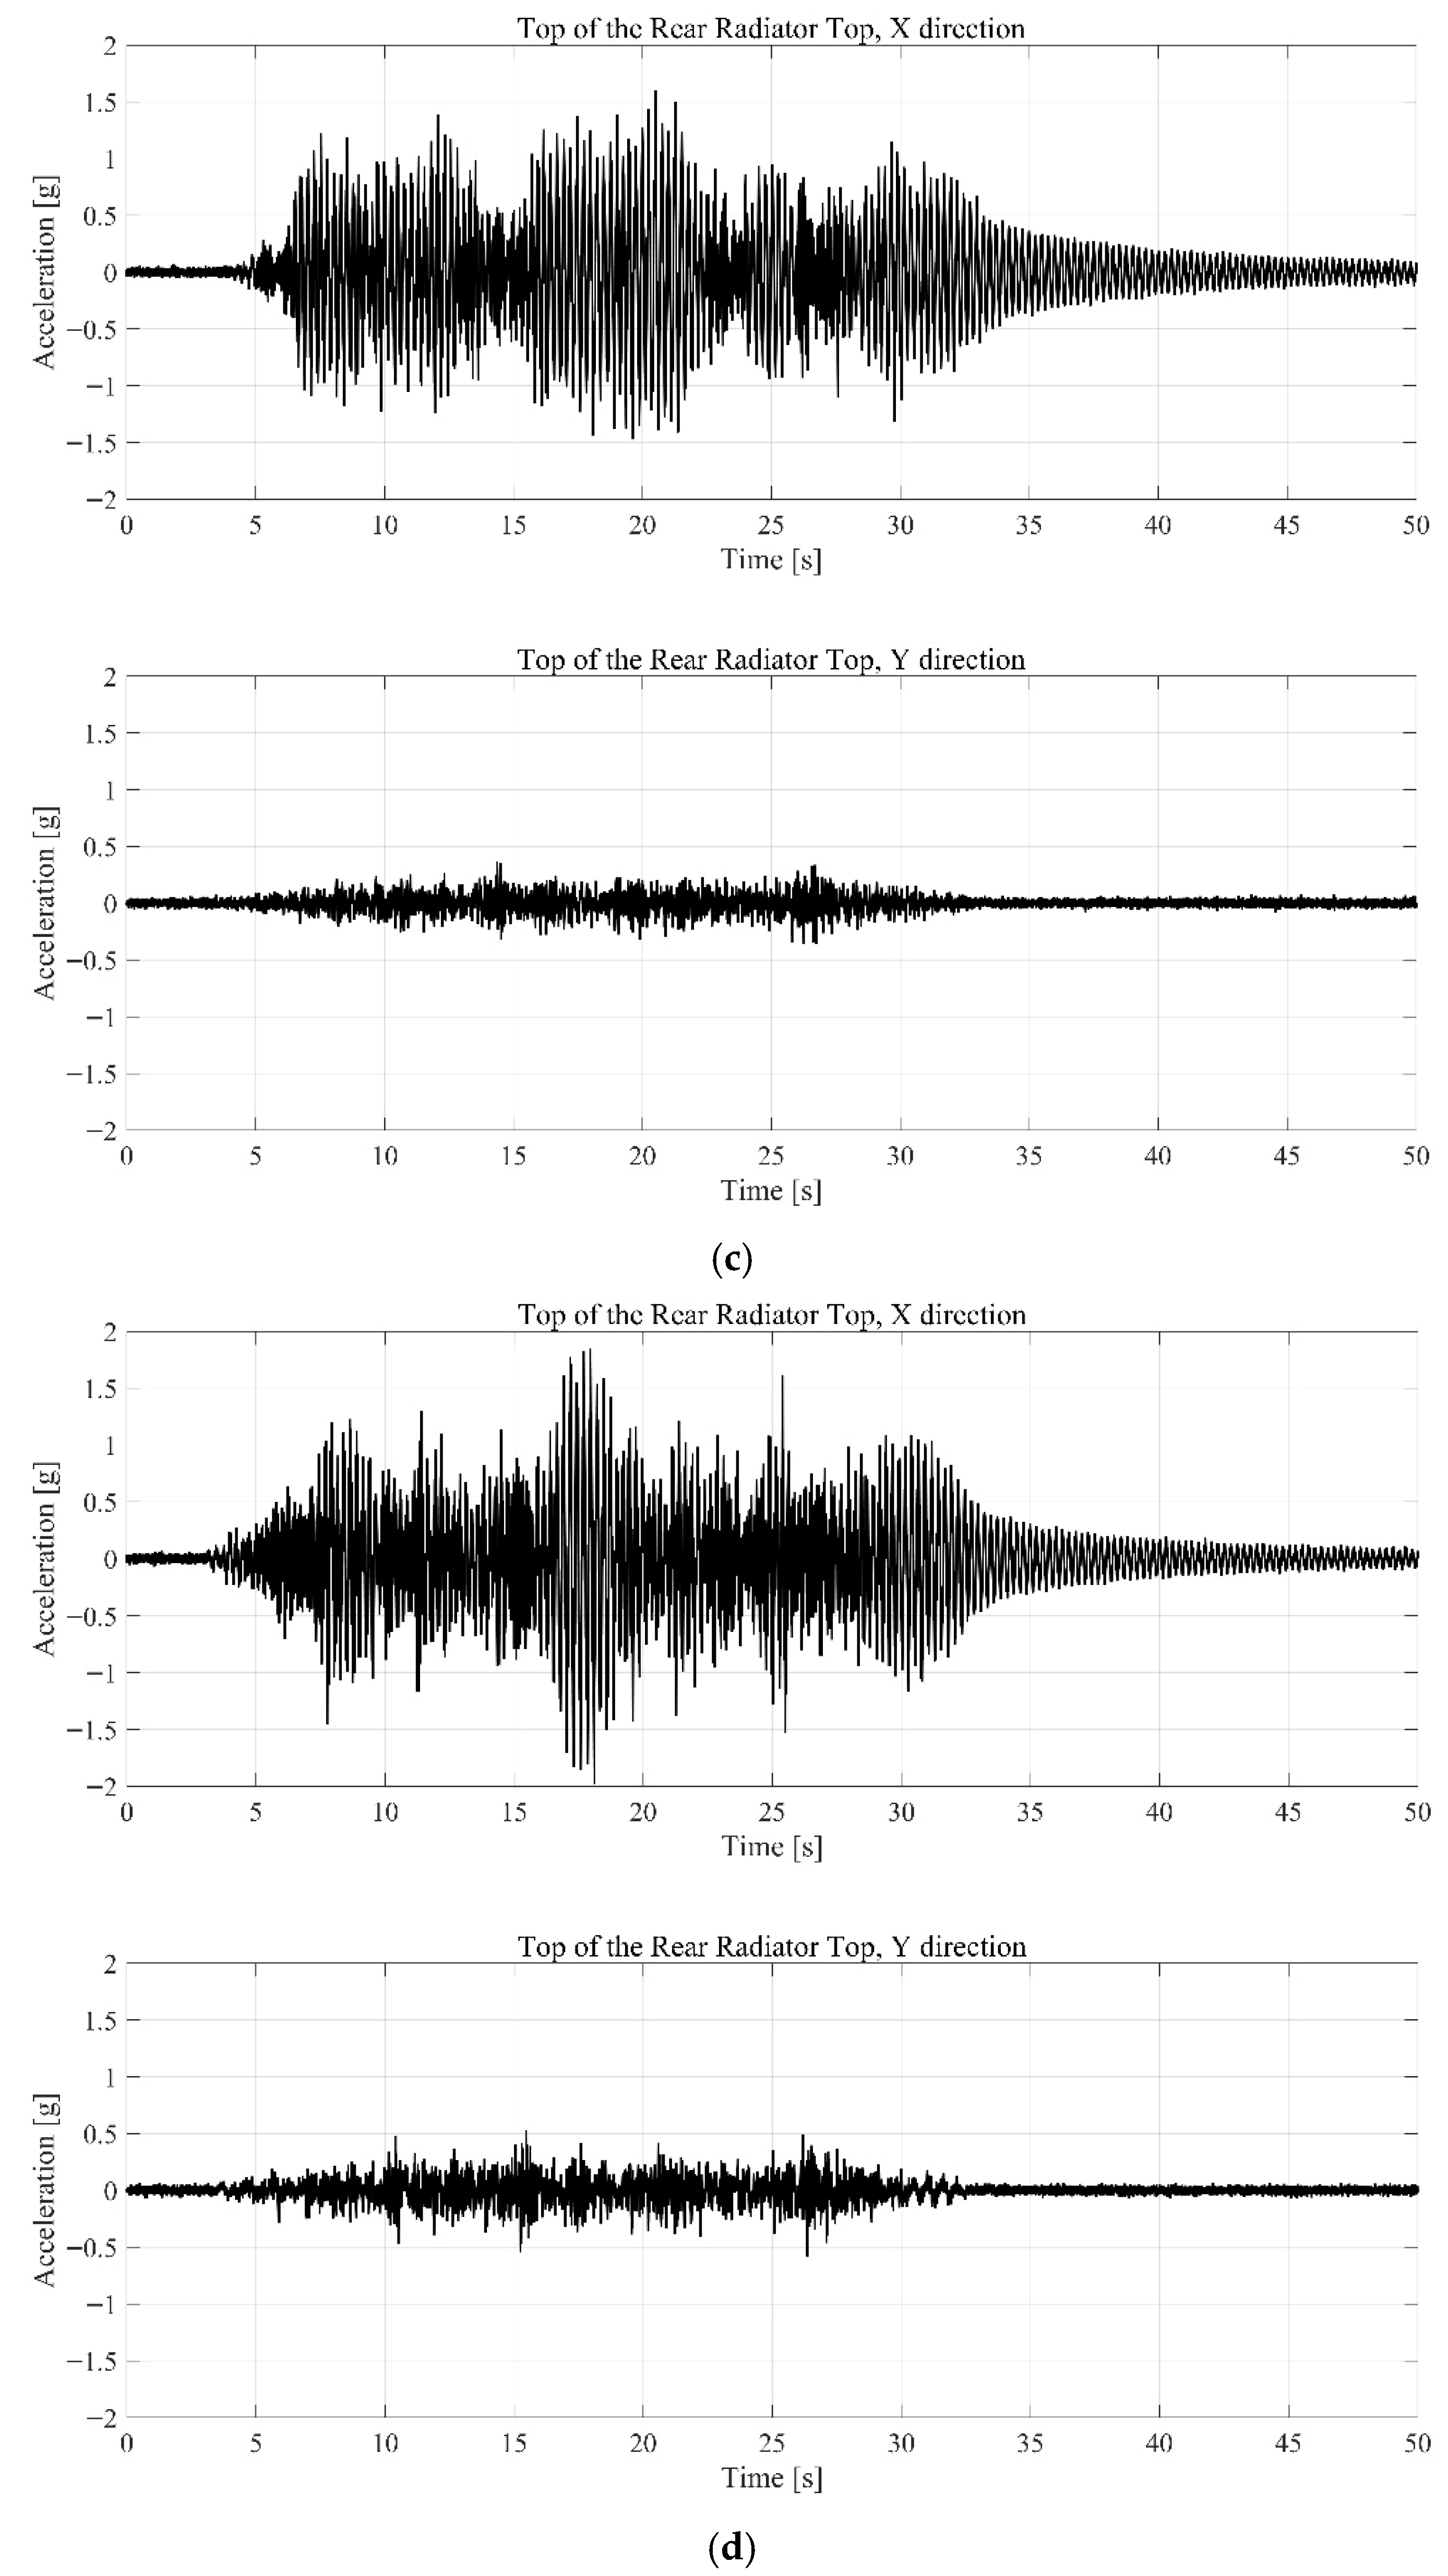
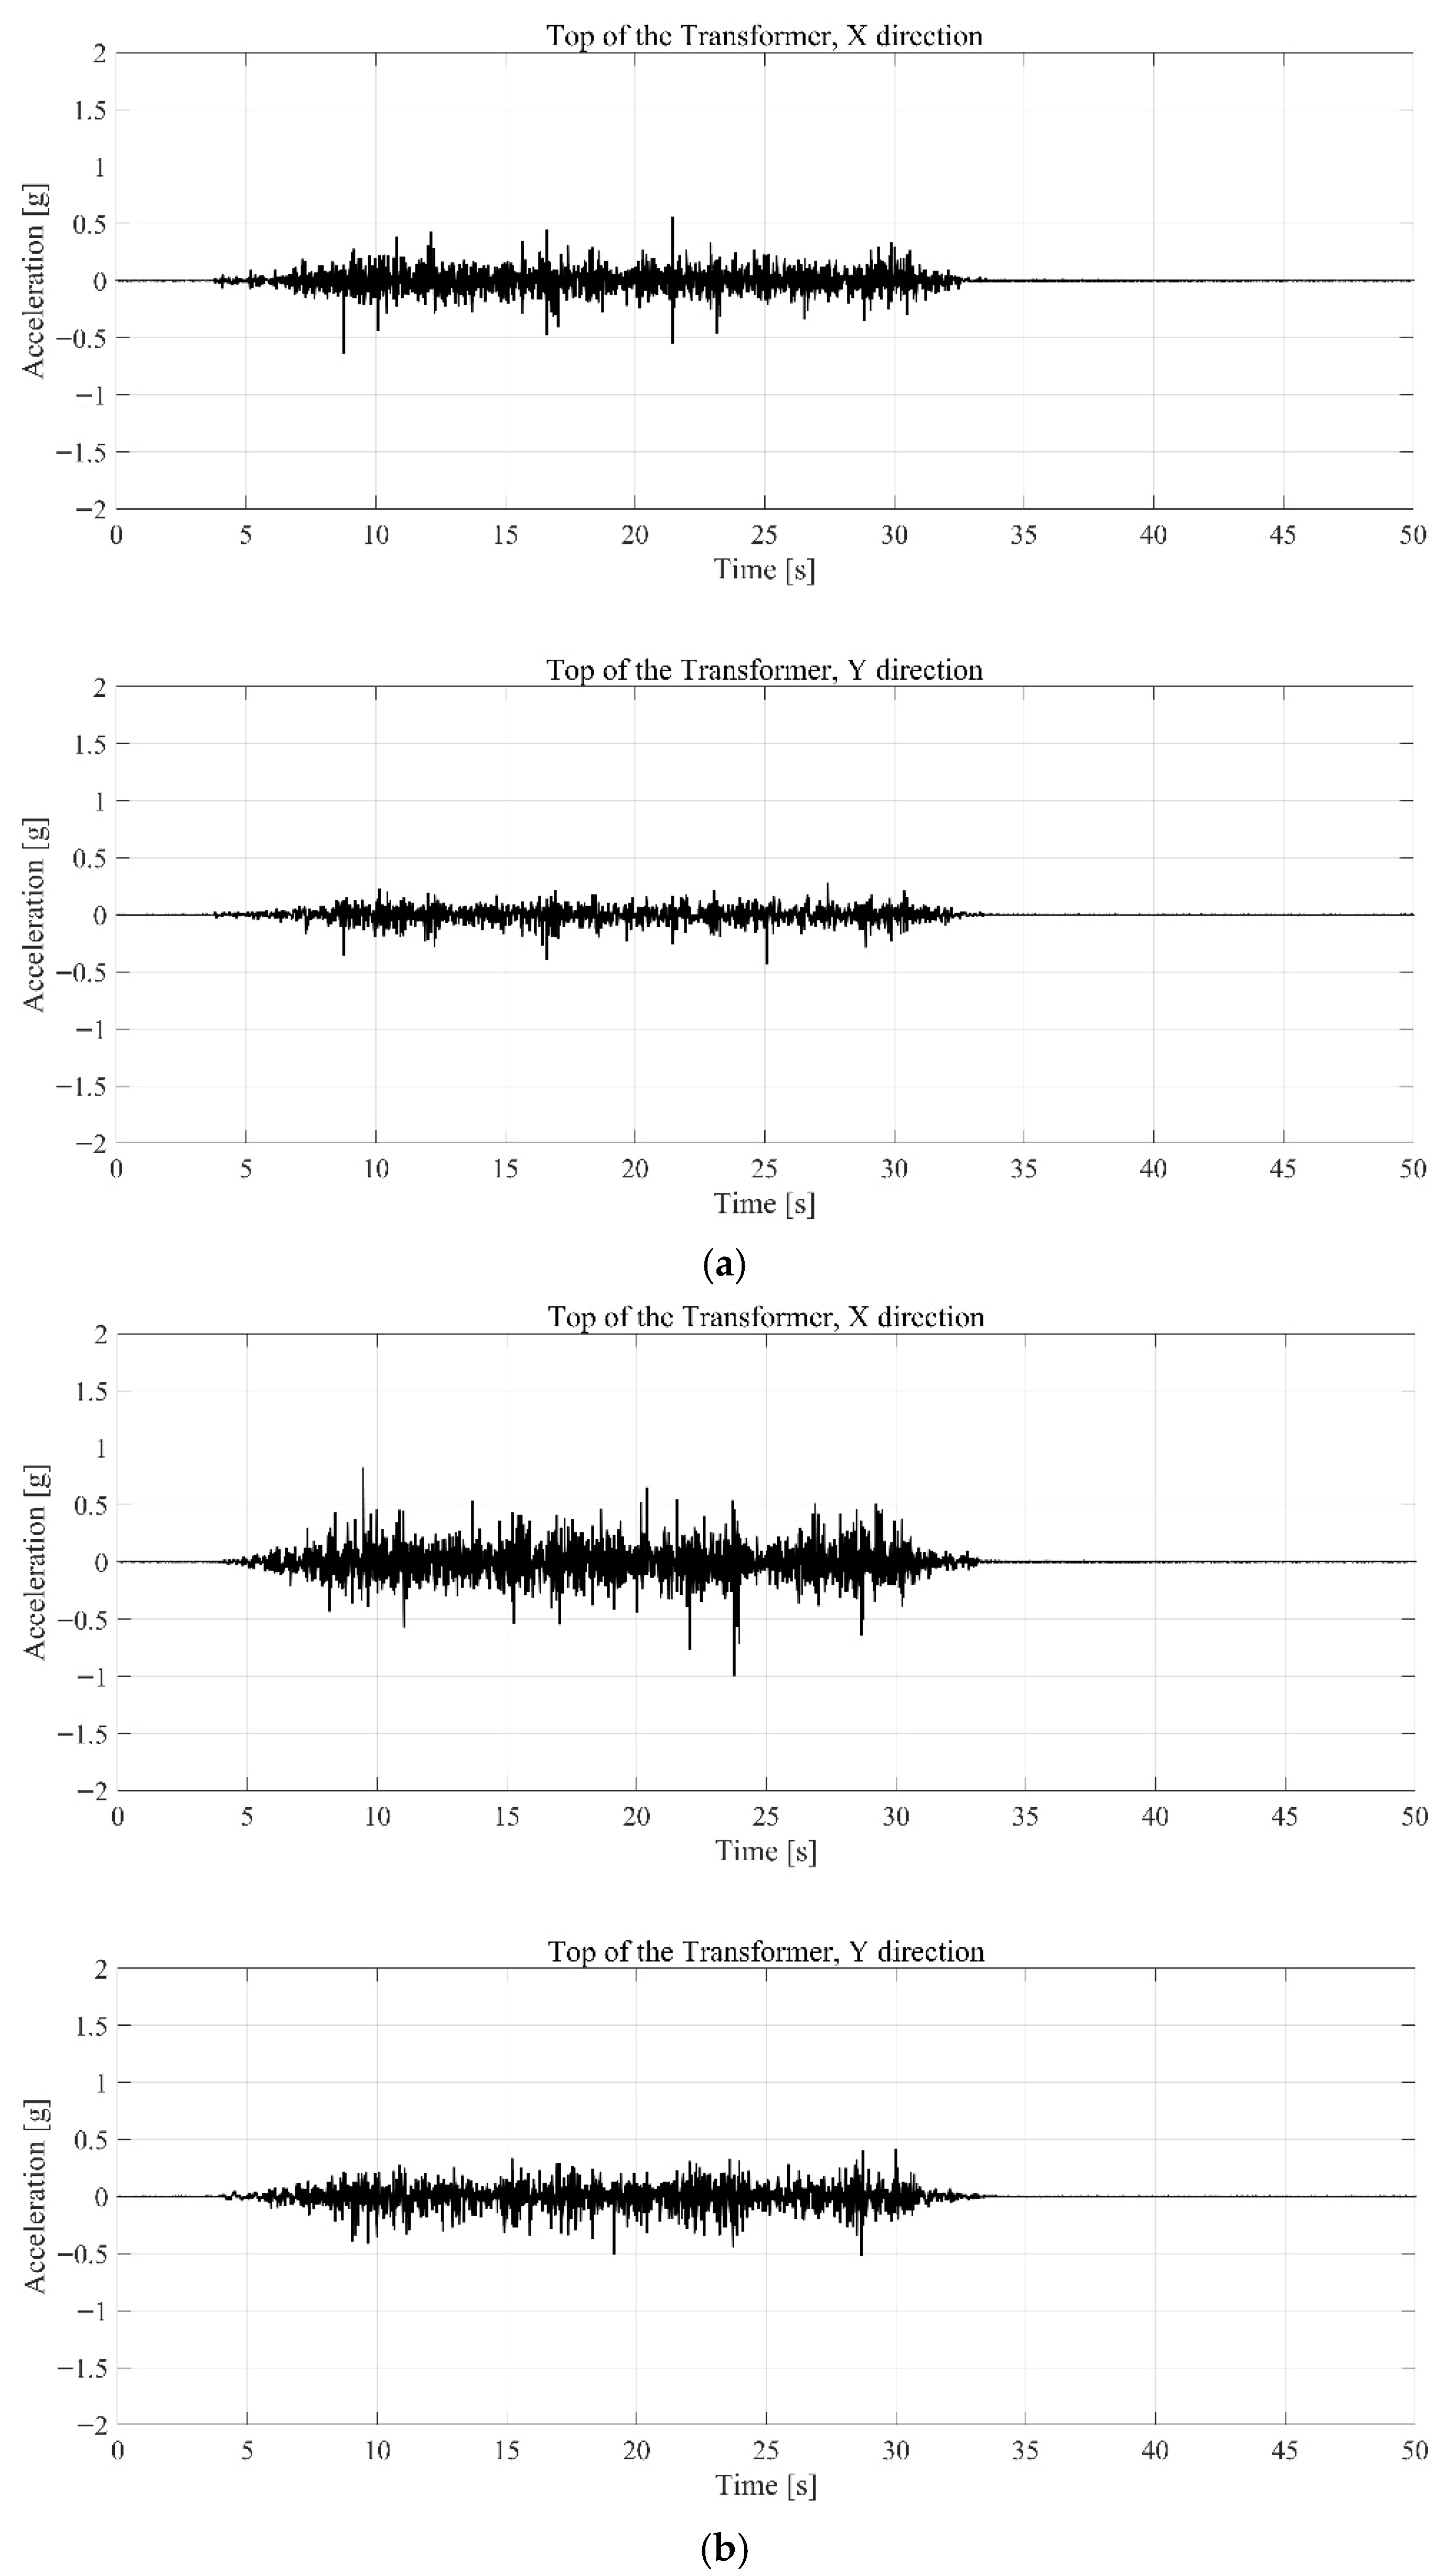
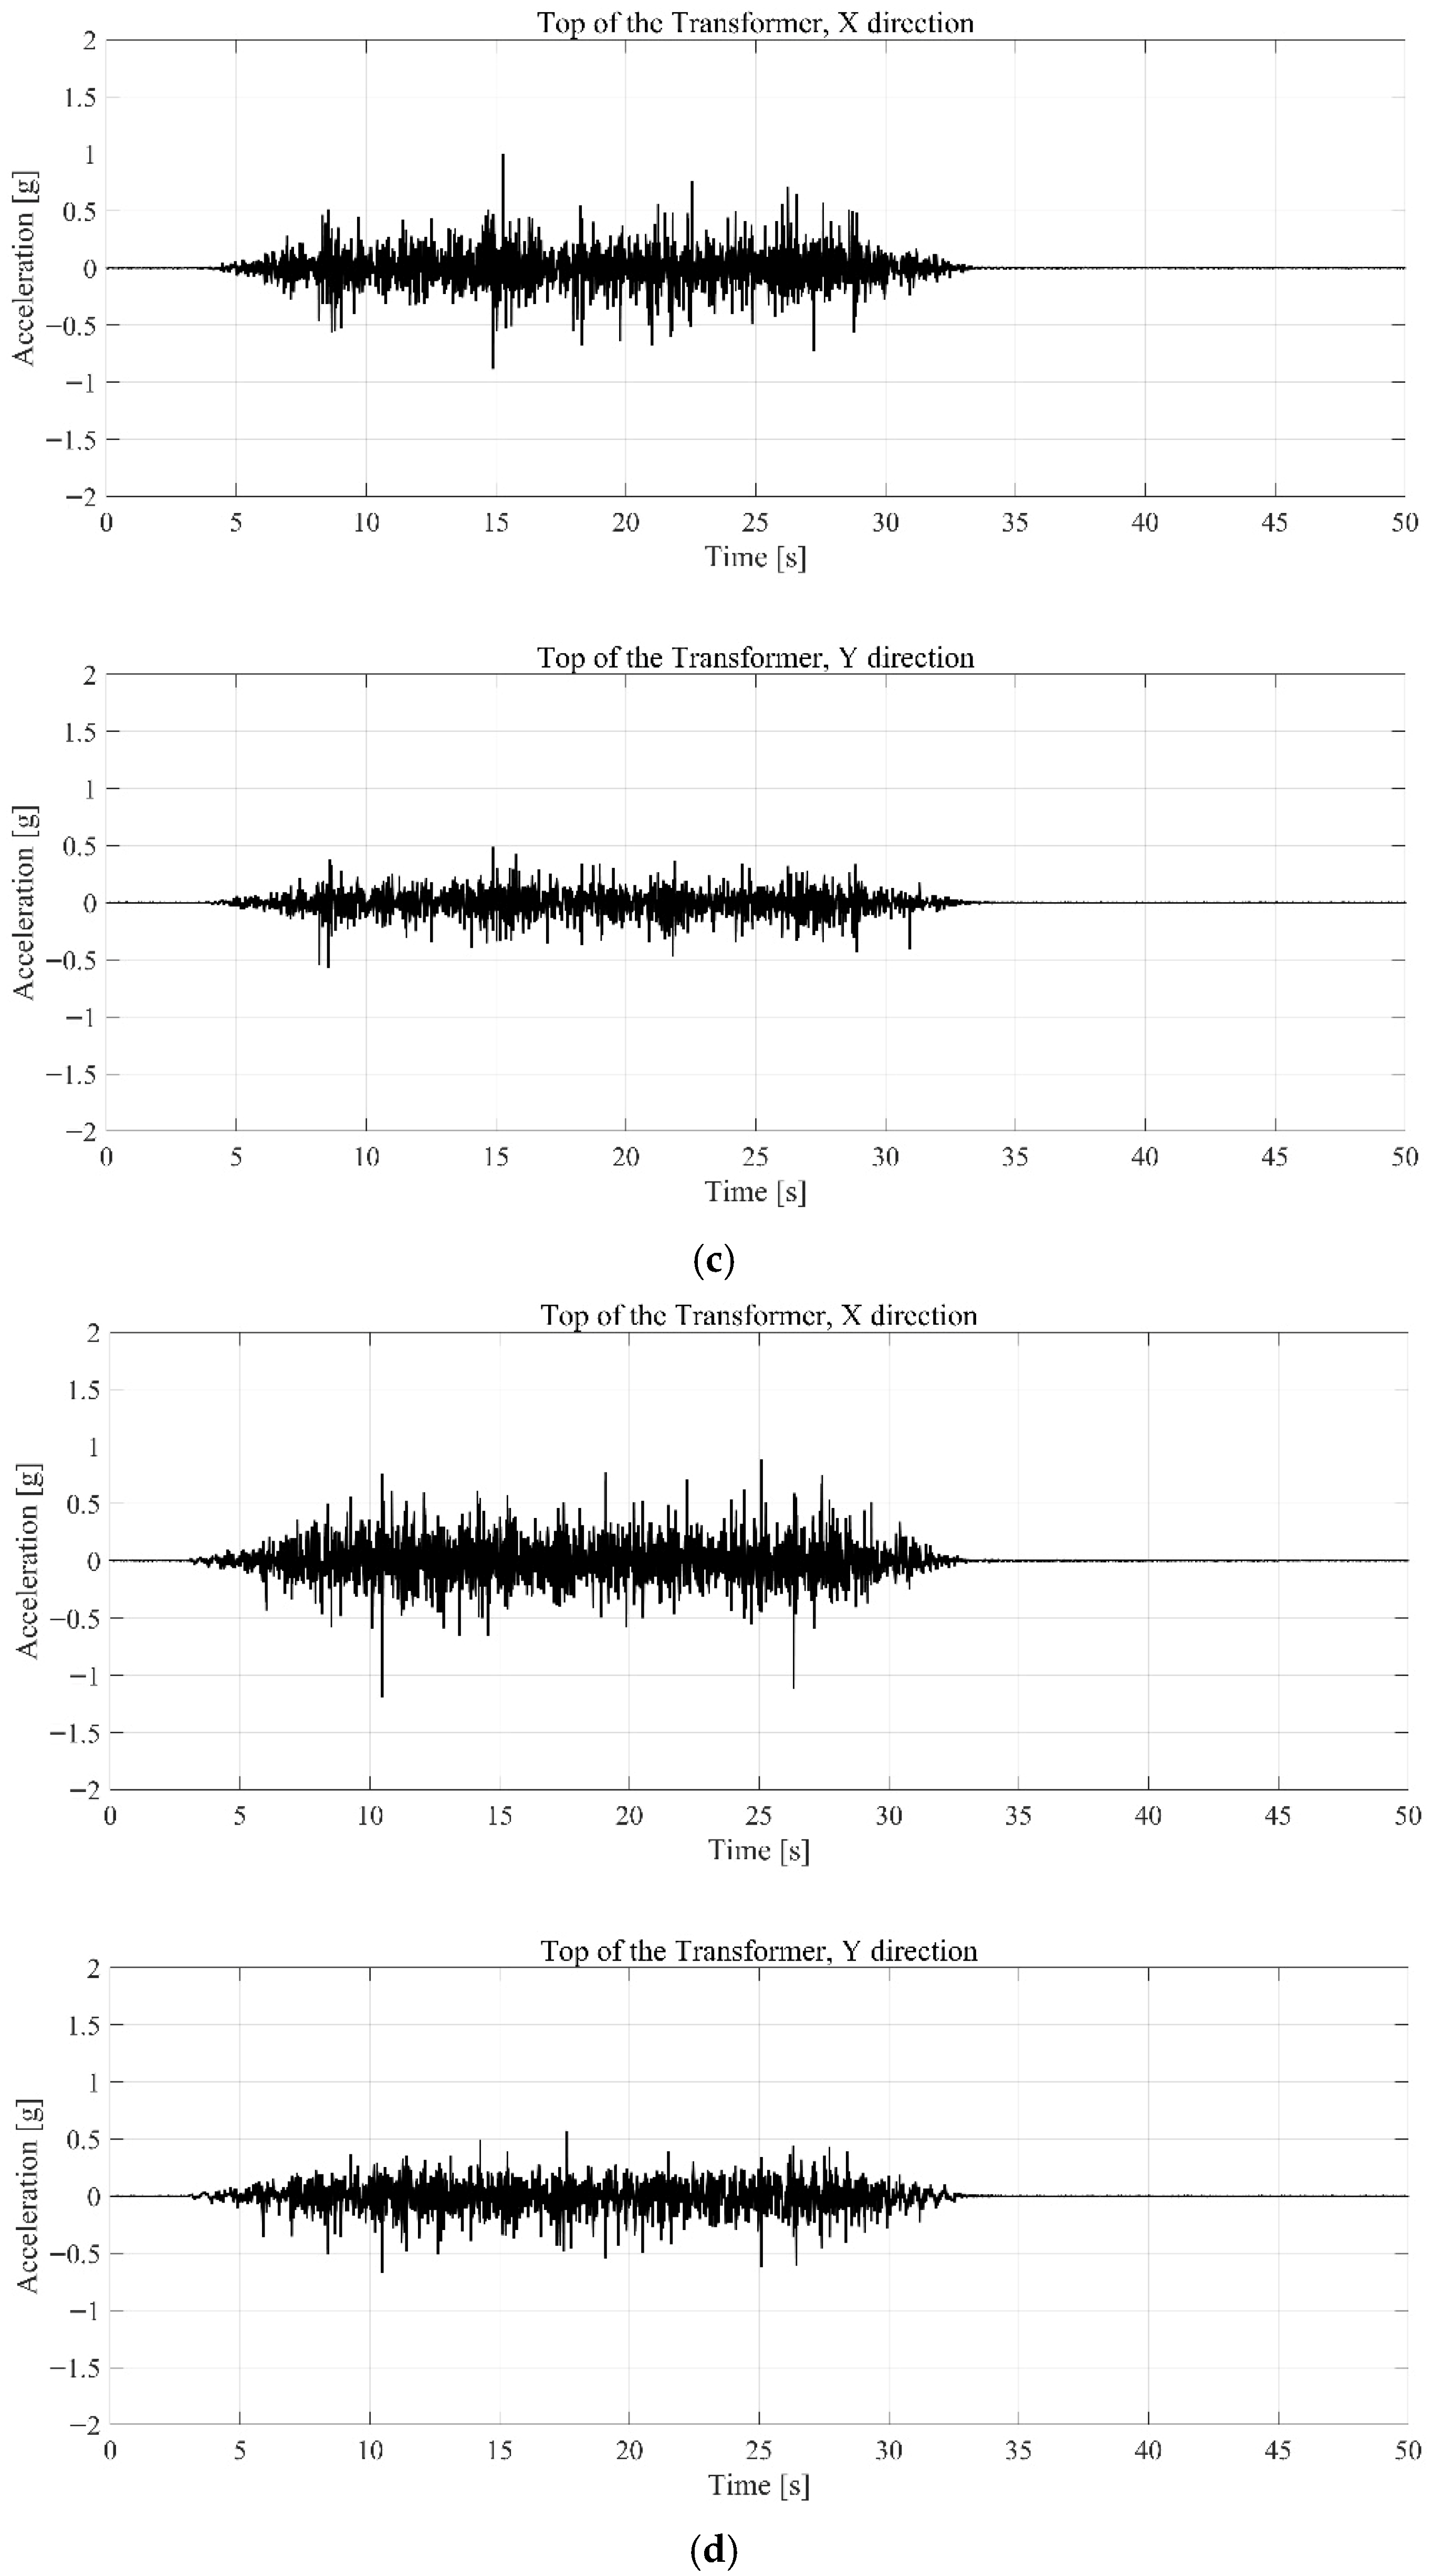
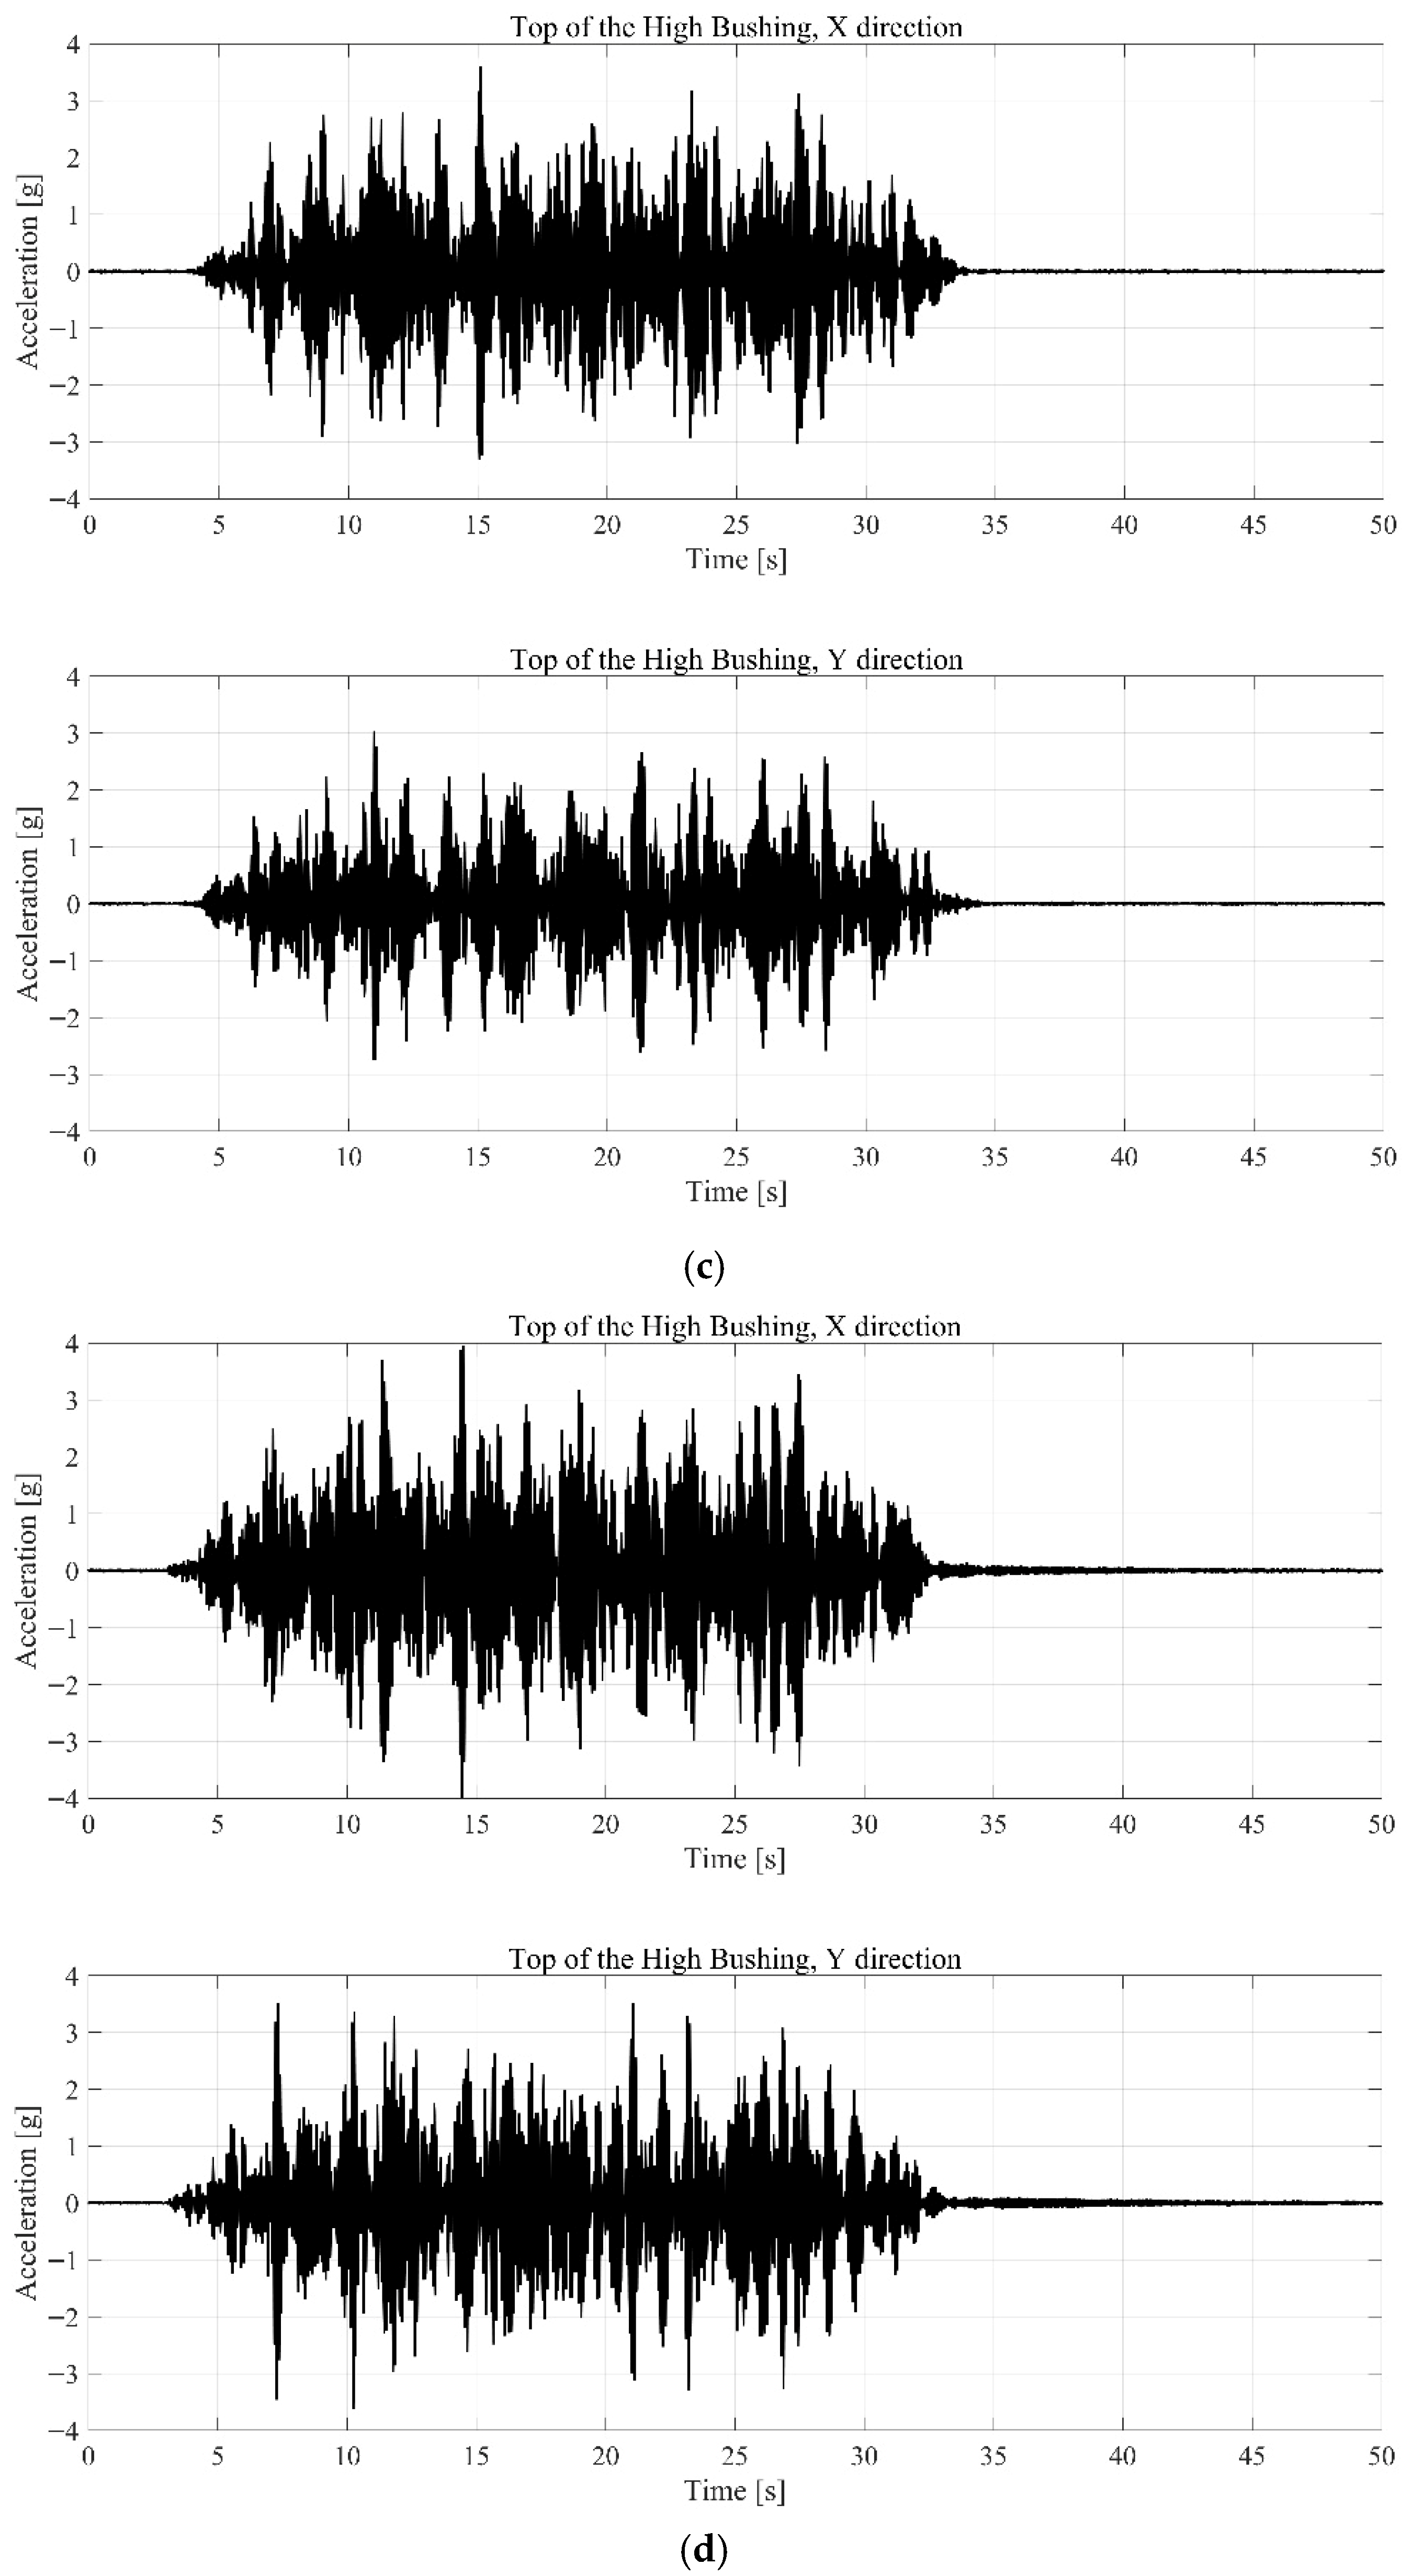
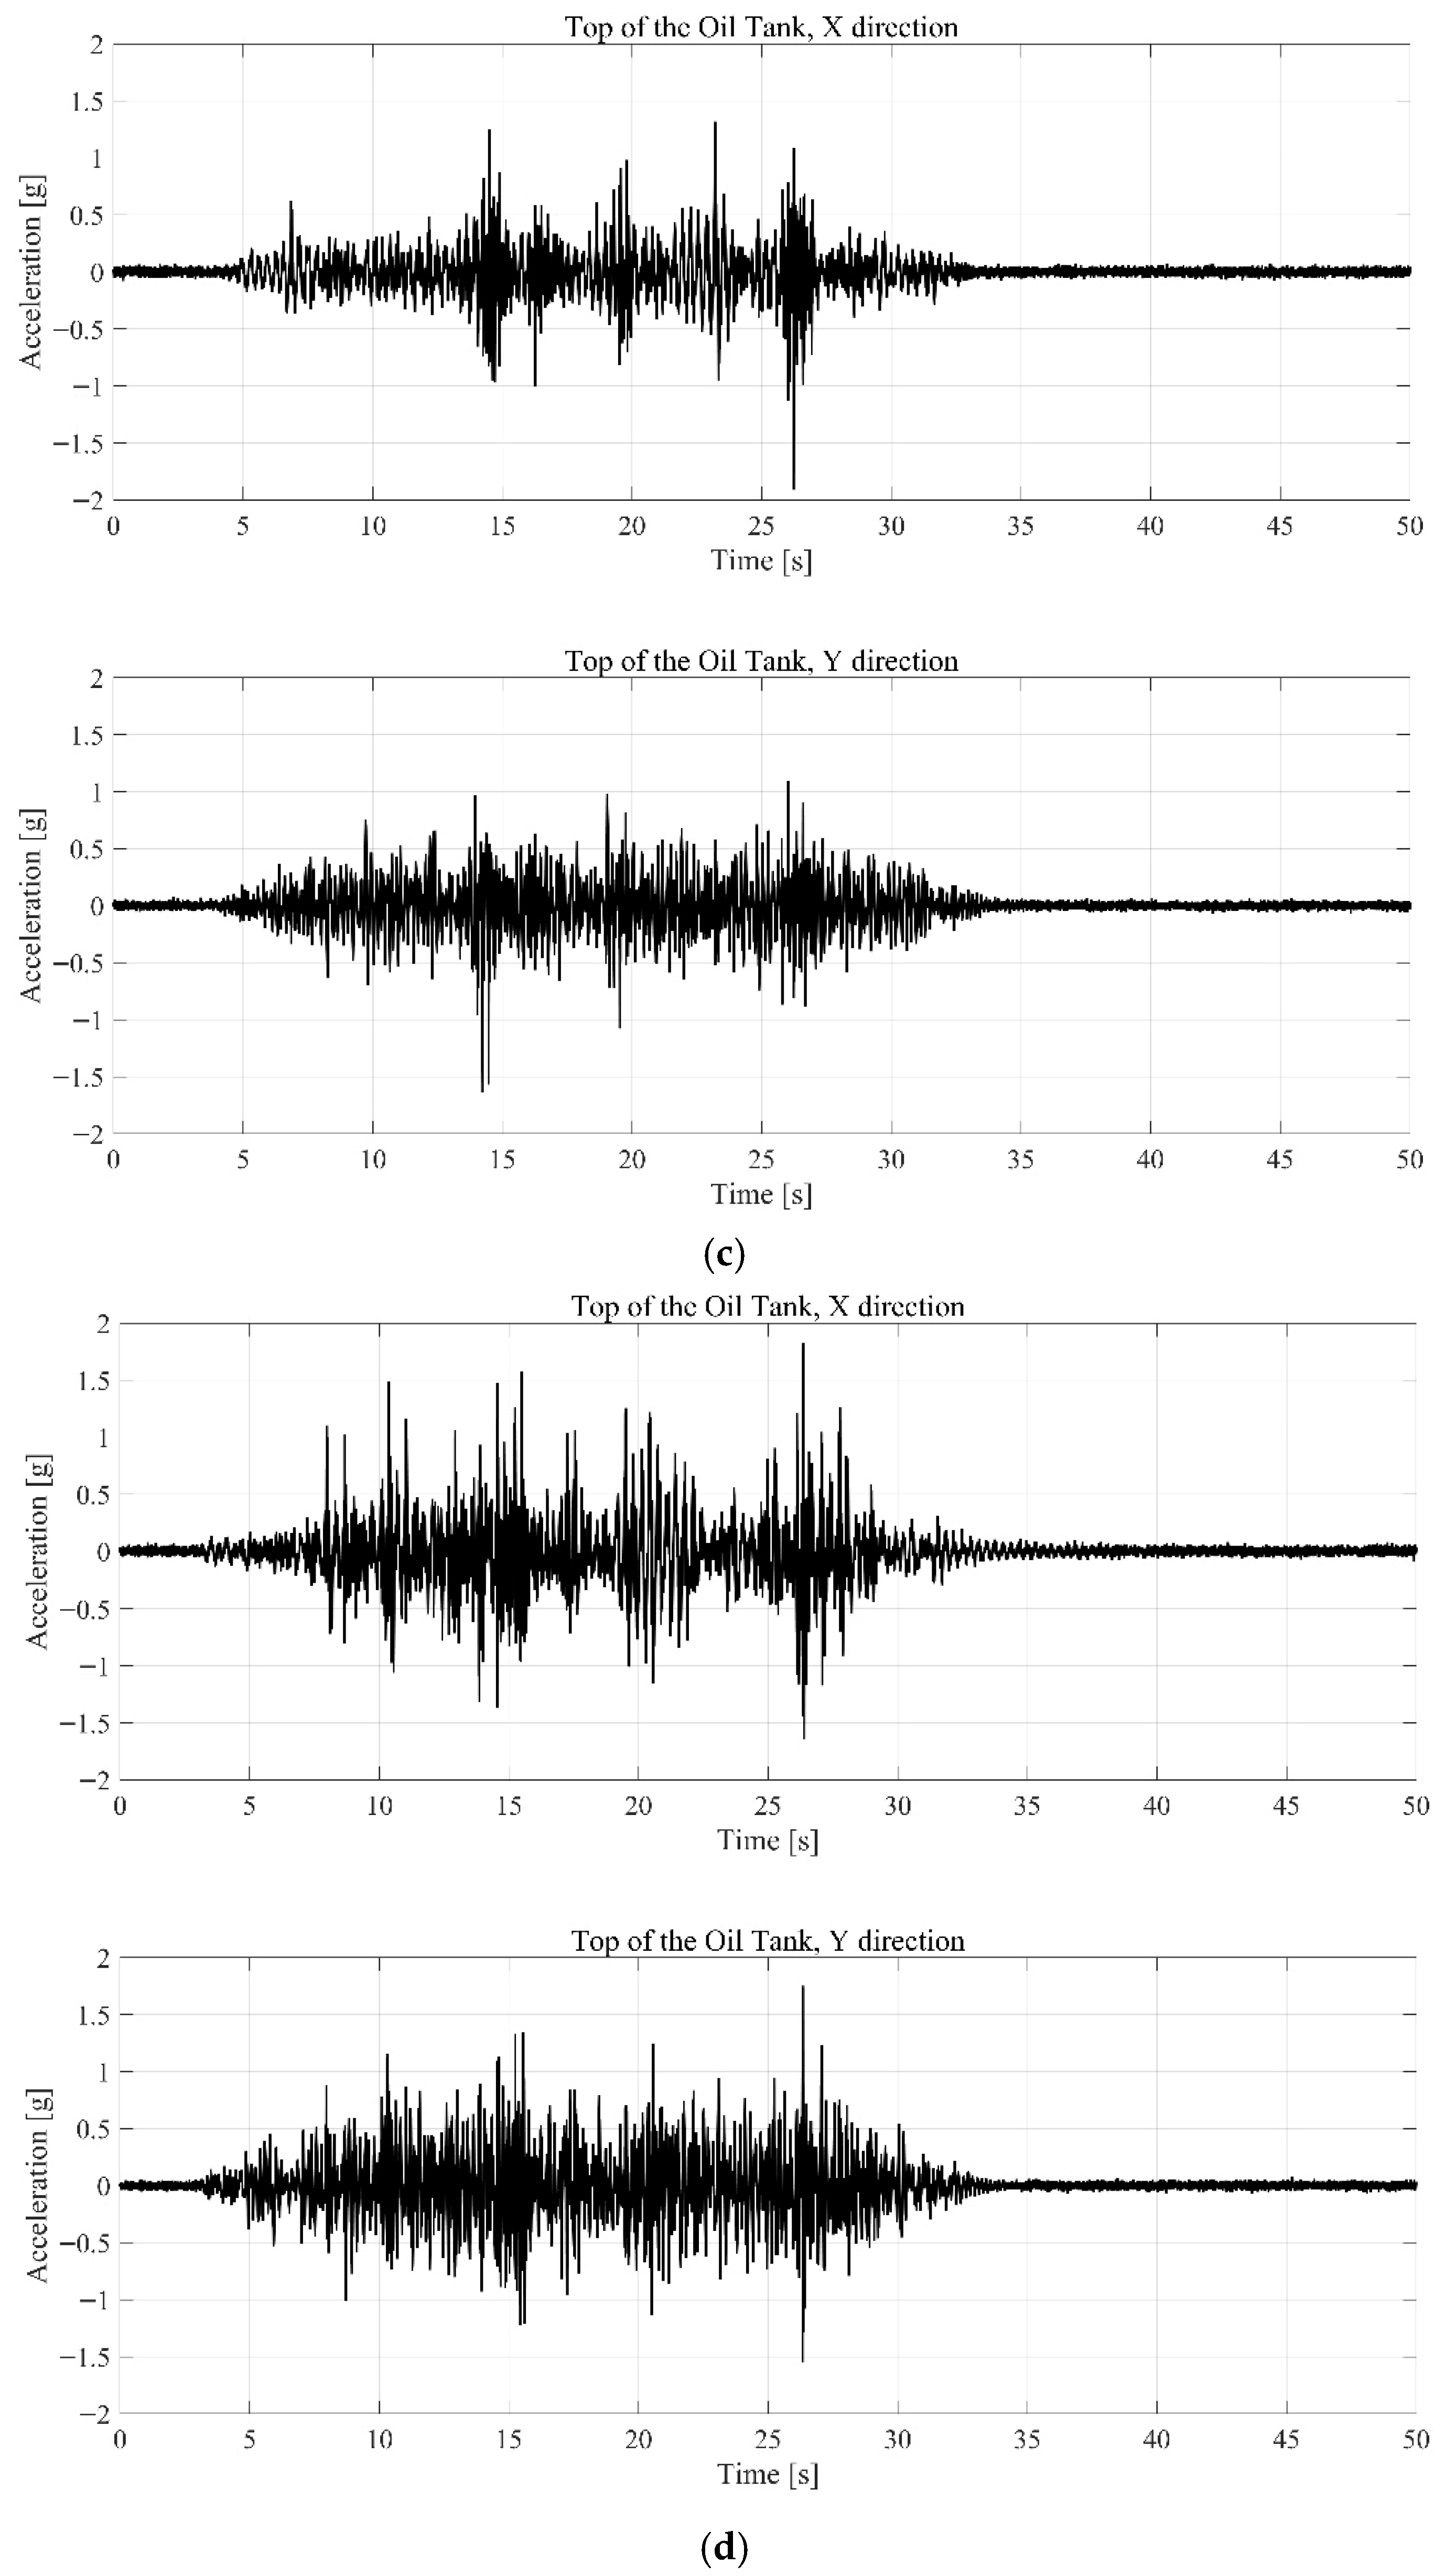
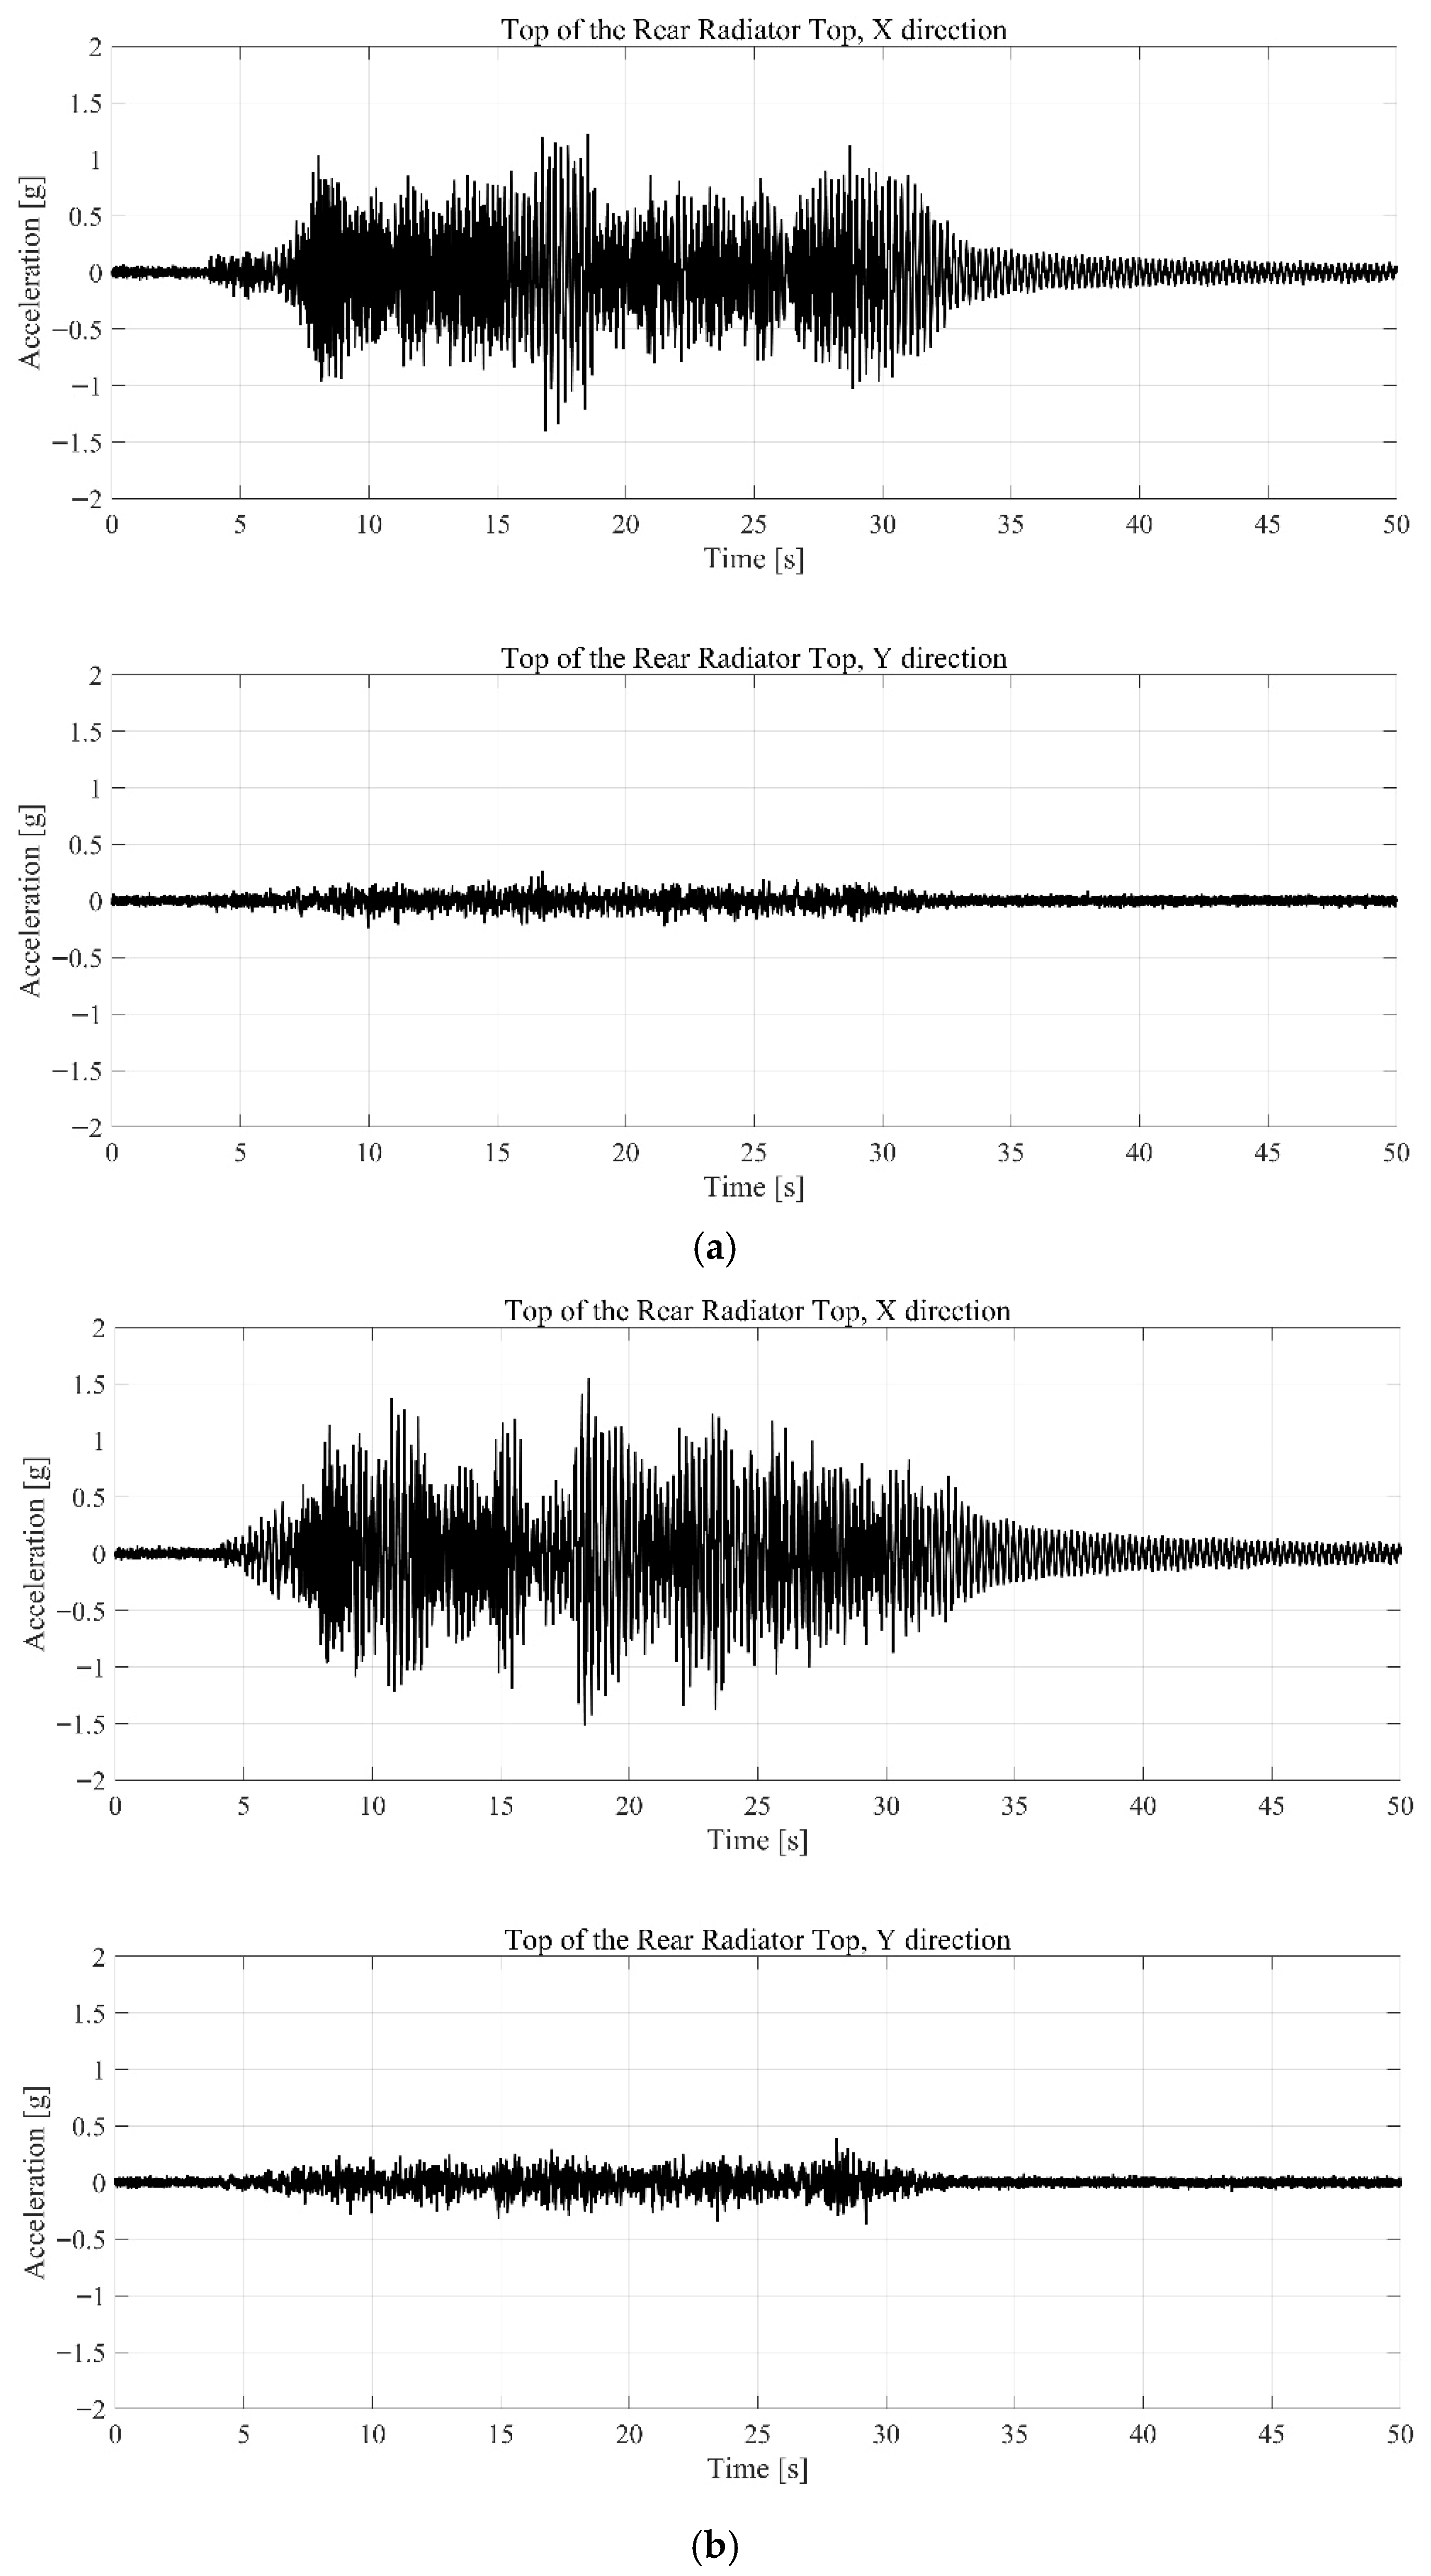
The response acceleration results are shown in Figure 8, Figure 9, Figure 10 and Figure 11, and the corresponding maxima are summarized in Table 6. The transformer body responses were generally within 0.5–1.2 g, indicating relatively low amplification compared with the auxiliary components. Because the transformer body has a large mass and is directly anchored to the foundation, its response amplification was limited relative to auxiliary components such as bushings and radiators. In Test 12, the body responses reached 1.19 g in the X-direction and 0.67 g in the Y-direction.
In contrast, the bushings exhibited significantly larger responses than the body in all tests, reaching 3.99 g (X) and 3.62 g (Y) in Test 12, which is approximately 3–4 times the body response. Notably, high accelerations exceeding 3 g repeatedly occurred in Test 3 and Tests 7–12, suggesting that phase differences accumulated through dynamic interaction between the body and the bushings, thereby amplifying the bushing responses. In Test 8, the Y-direction response (3.60 g) exceeded the X-direction response (3.47 g), indicating that under certain conditions the bushings may respond more sensitively to transverse input.
The oil tank responses ranged from 1.0 to 1.9 g, with the X-direction consistently larger than the Y-direction in all tests. In particular, during Tests 9–11, the X-direction response ranged from 1.65 to 1.91 g, showing clear amplification relative to the body. This indicates that the oil tank tended to respond more sensitively to longitudinal input than to transverse input.
For the radiator, responses increased significantly after Test 5, reaching maximum values of 2.11 g (X) and 0.58 g (Y). Overall, the radiator exhibited response accelerations approximately 1.5–2.0 times greater than those of the transformer body. This suggests that the seismic vulnerability of radiator connections should be evaluated by considering the combined effects of deformation demand induced by relative displacement and inertial demand driven by acceleration amplification, rather than relying on a single response measure.
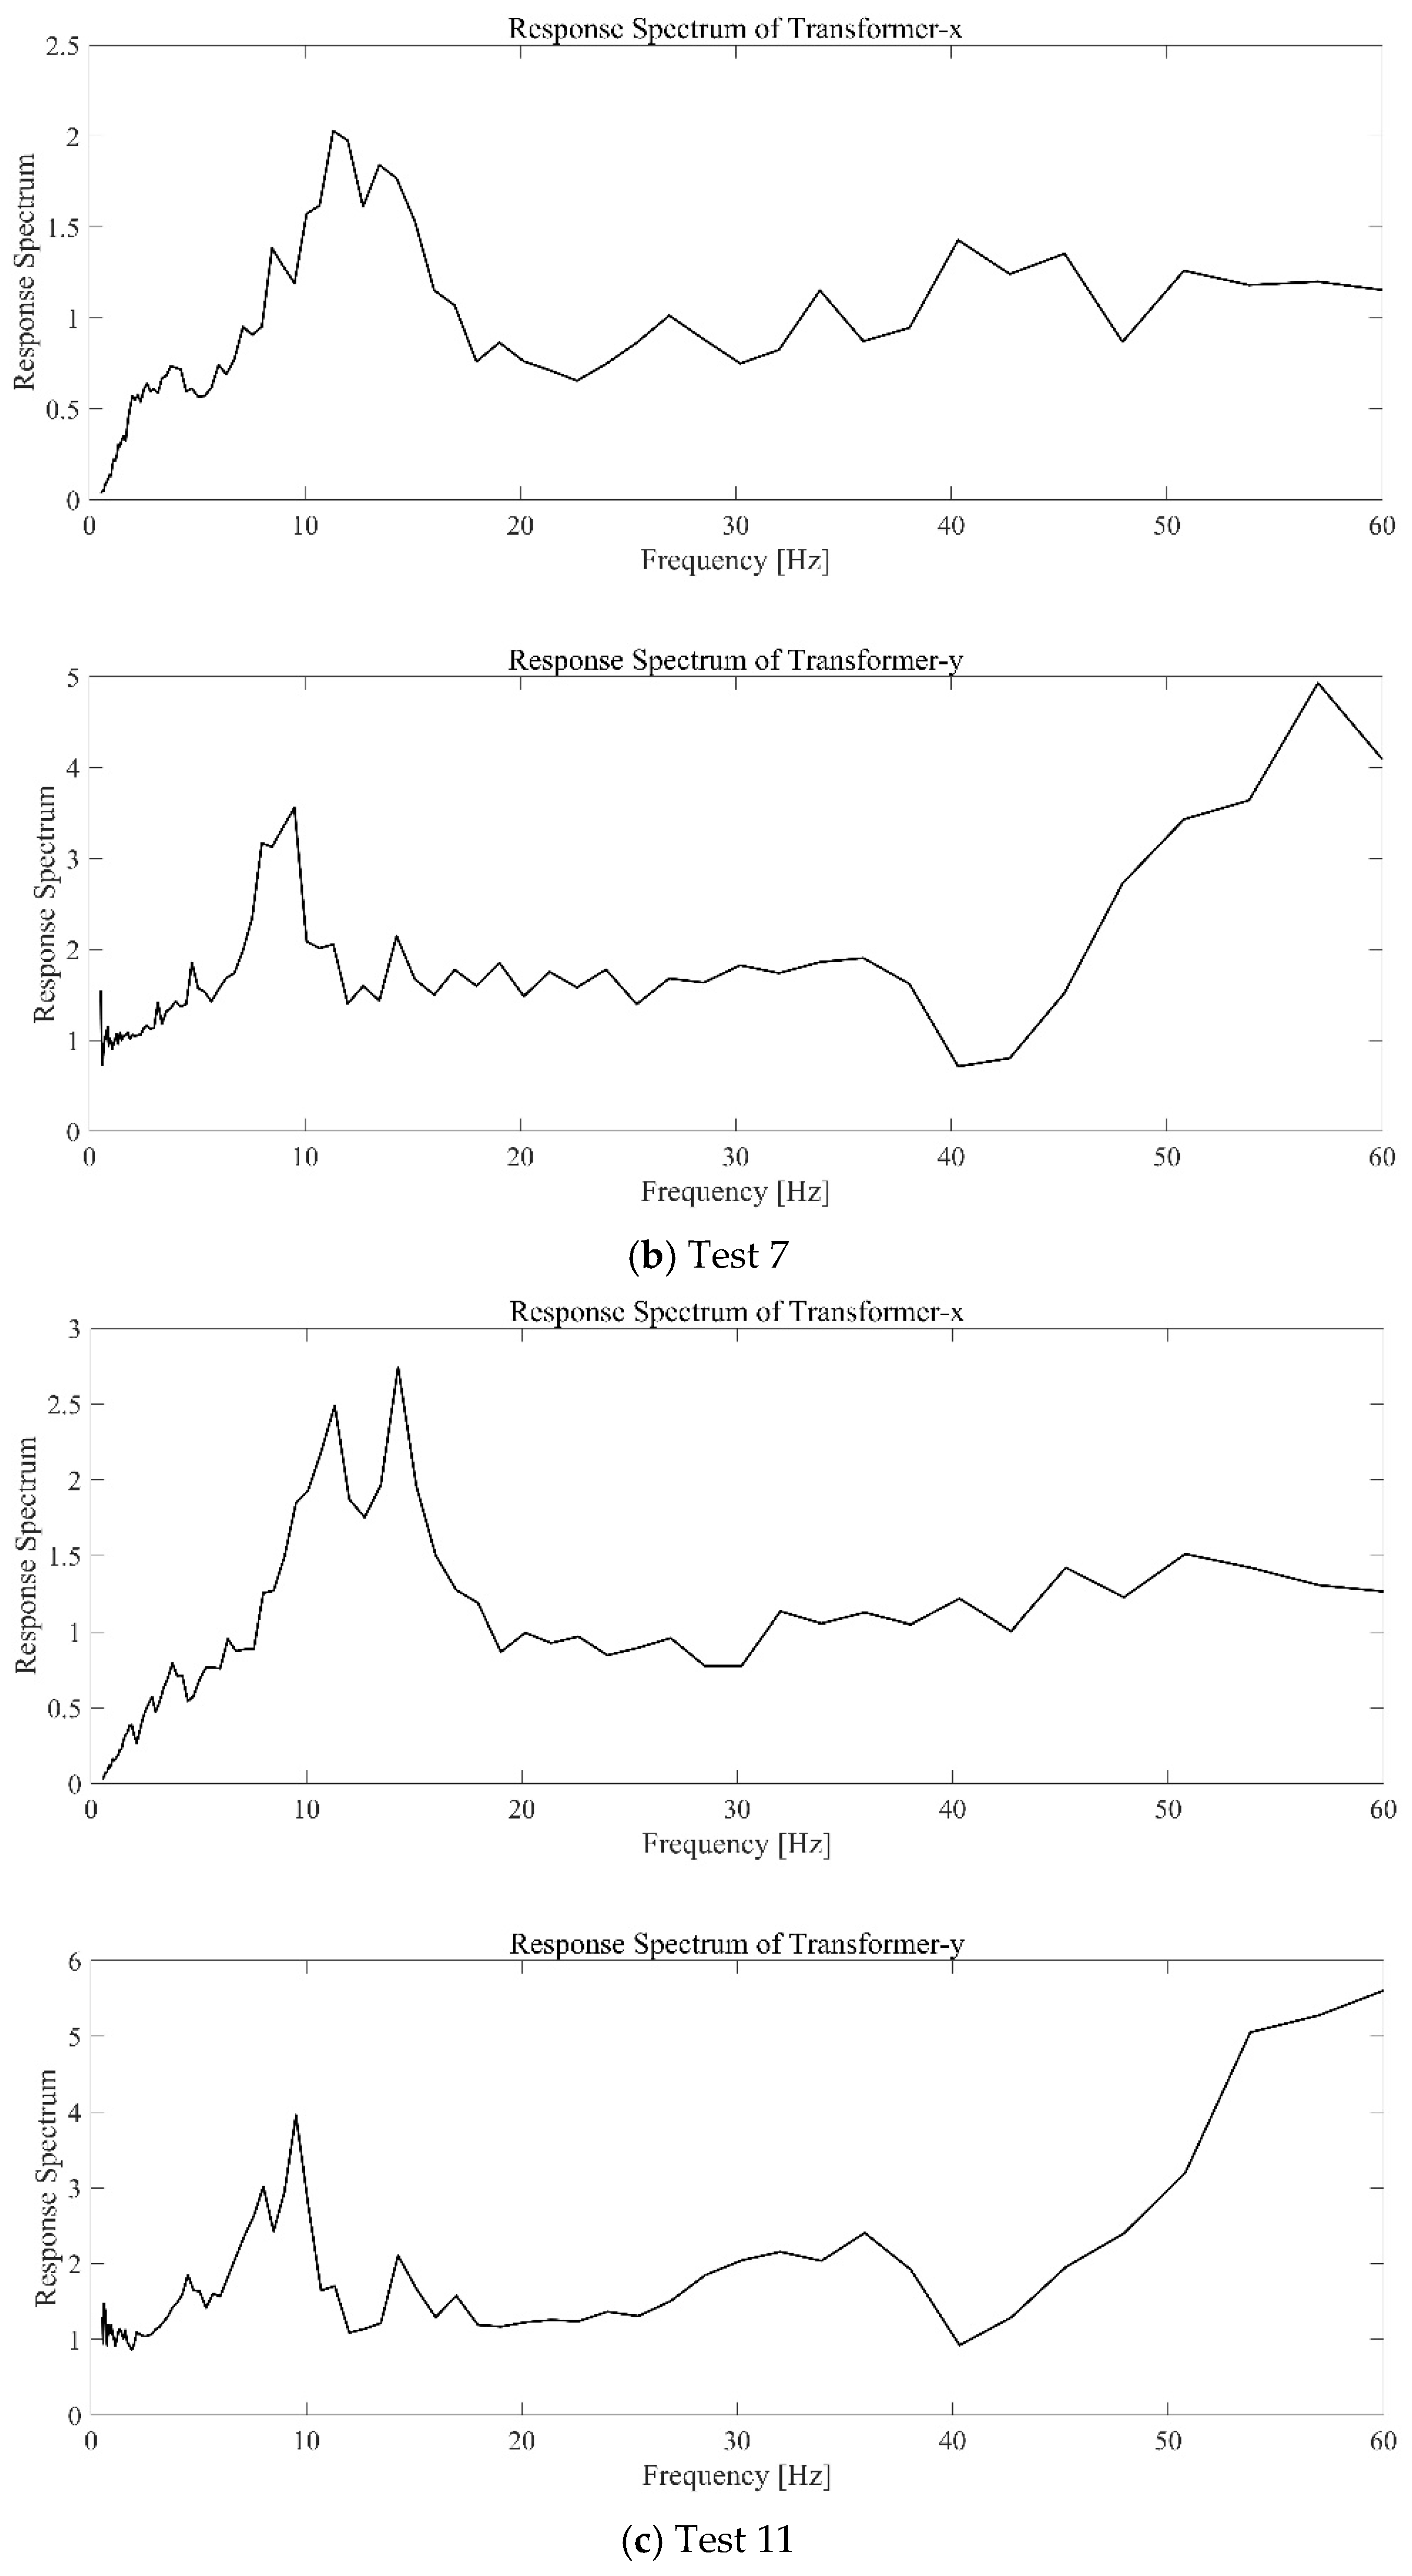
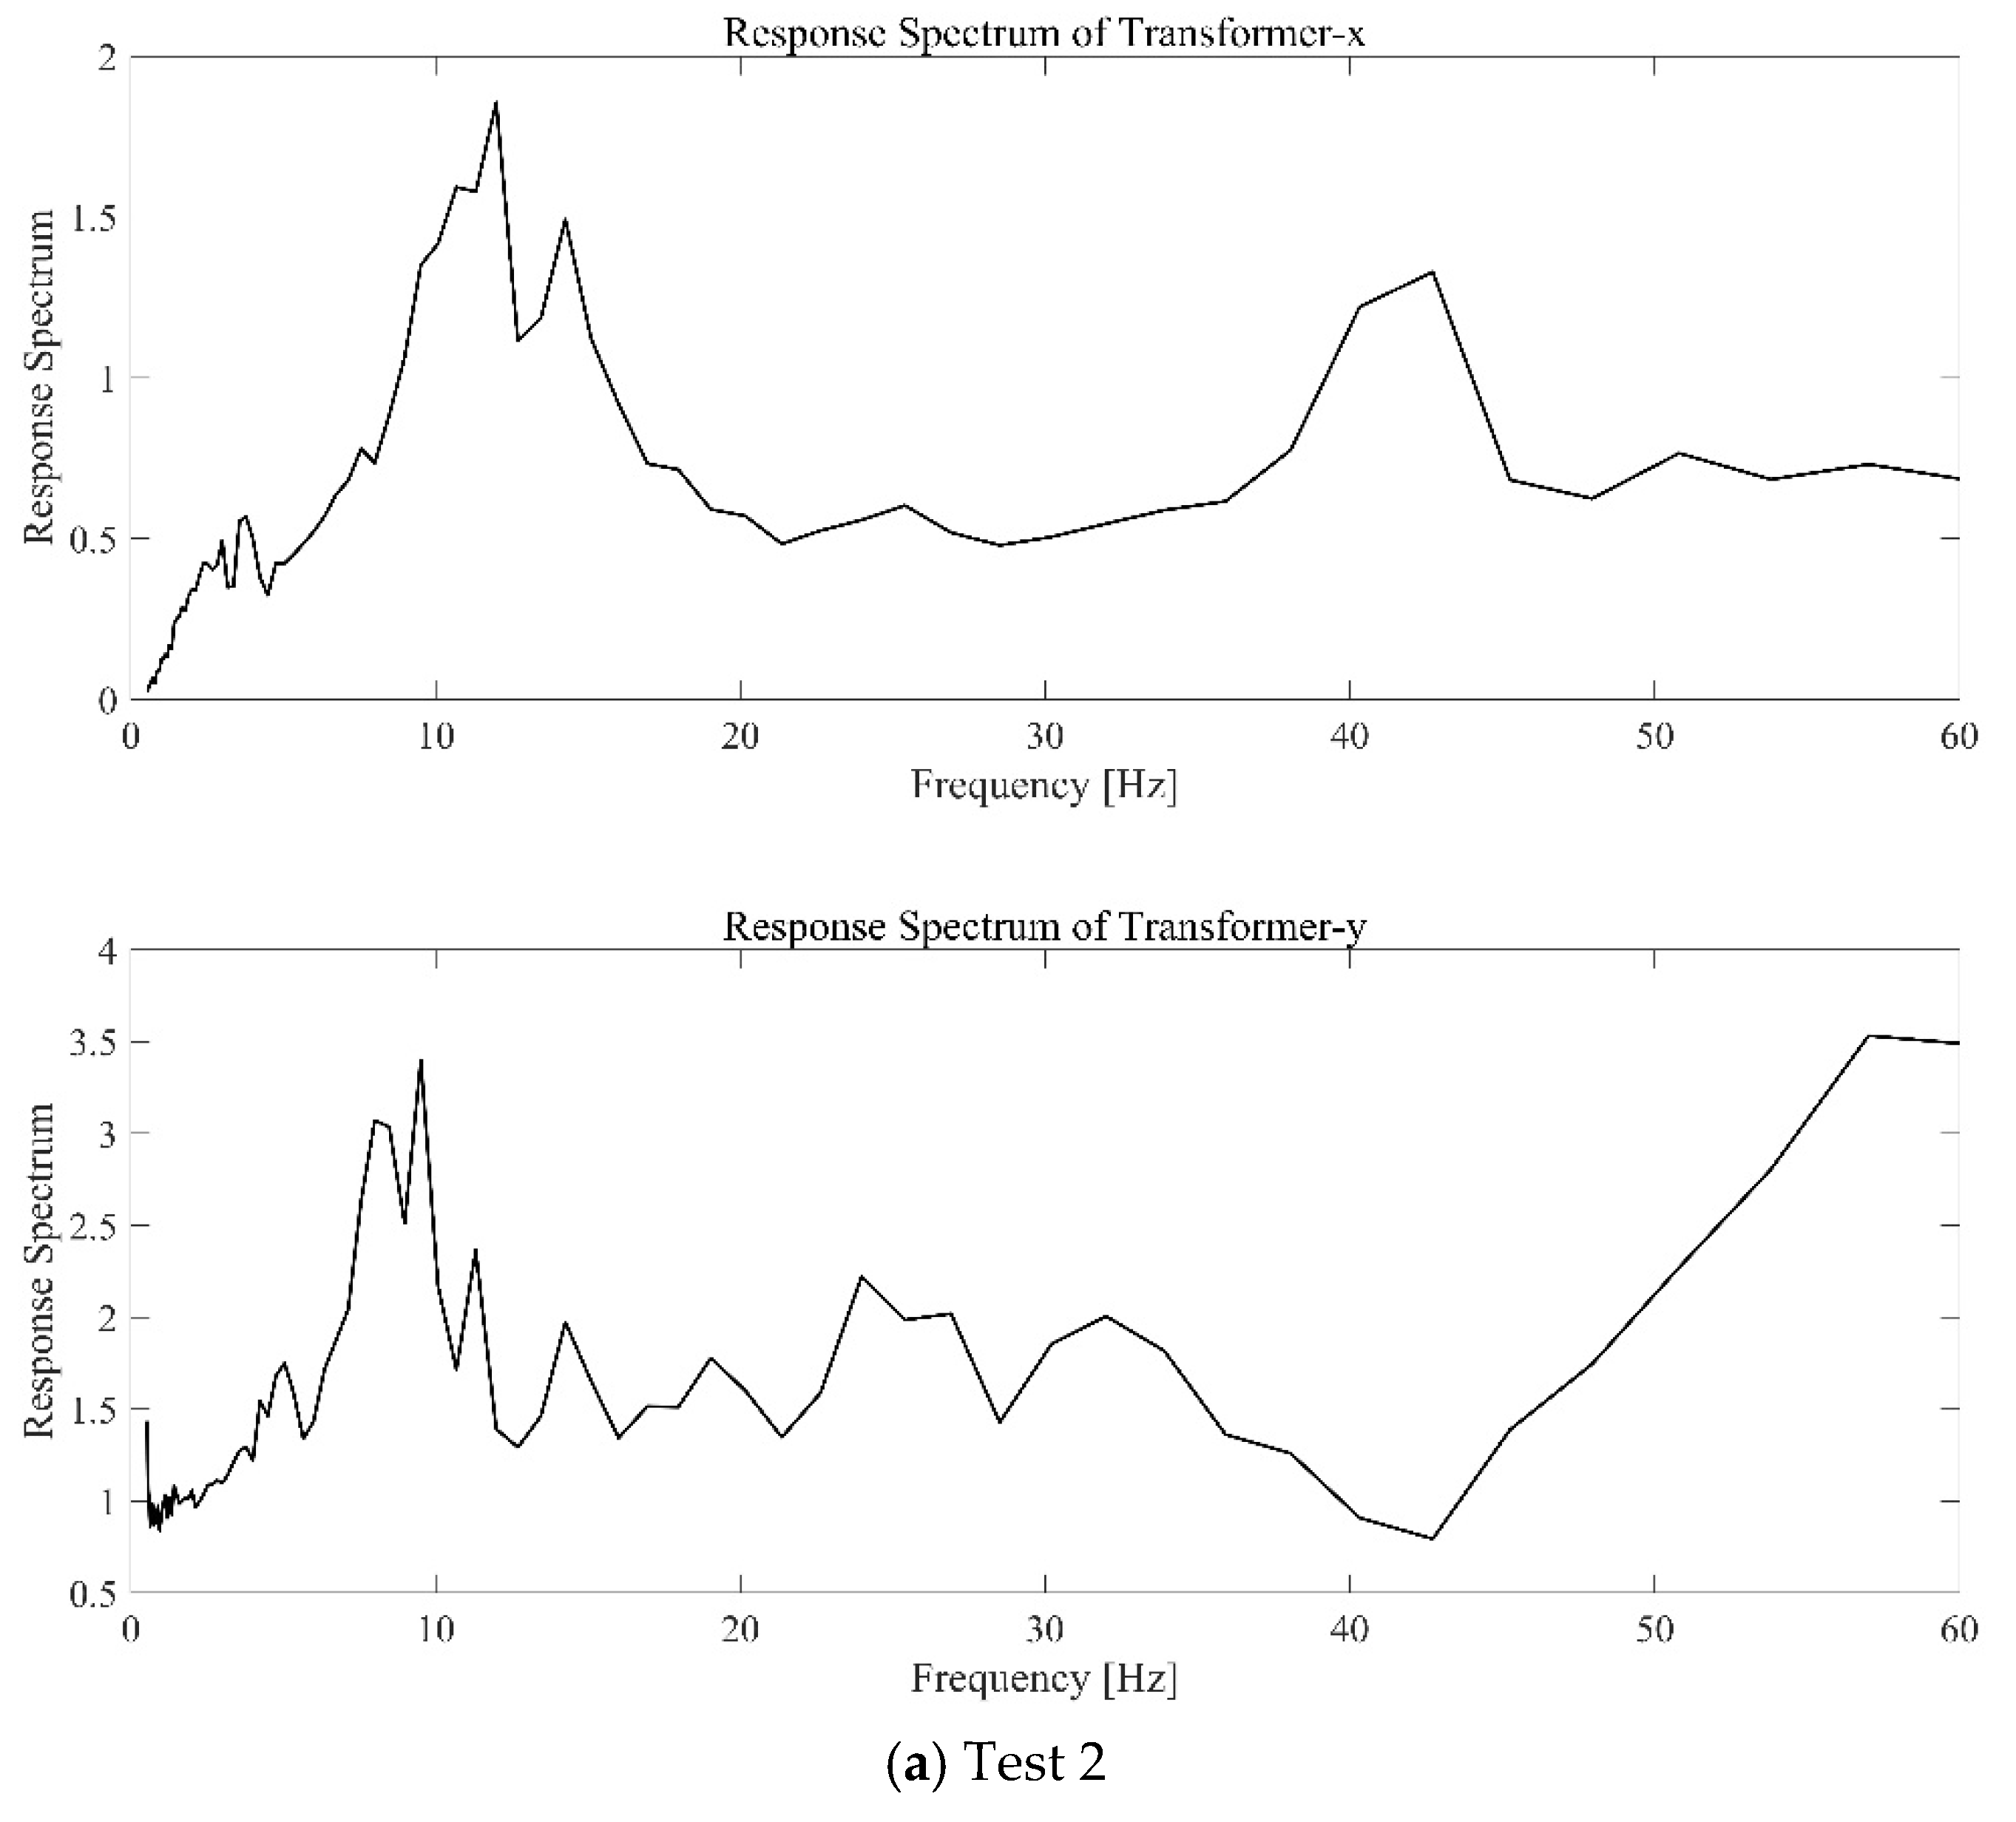
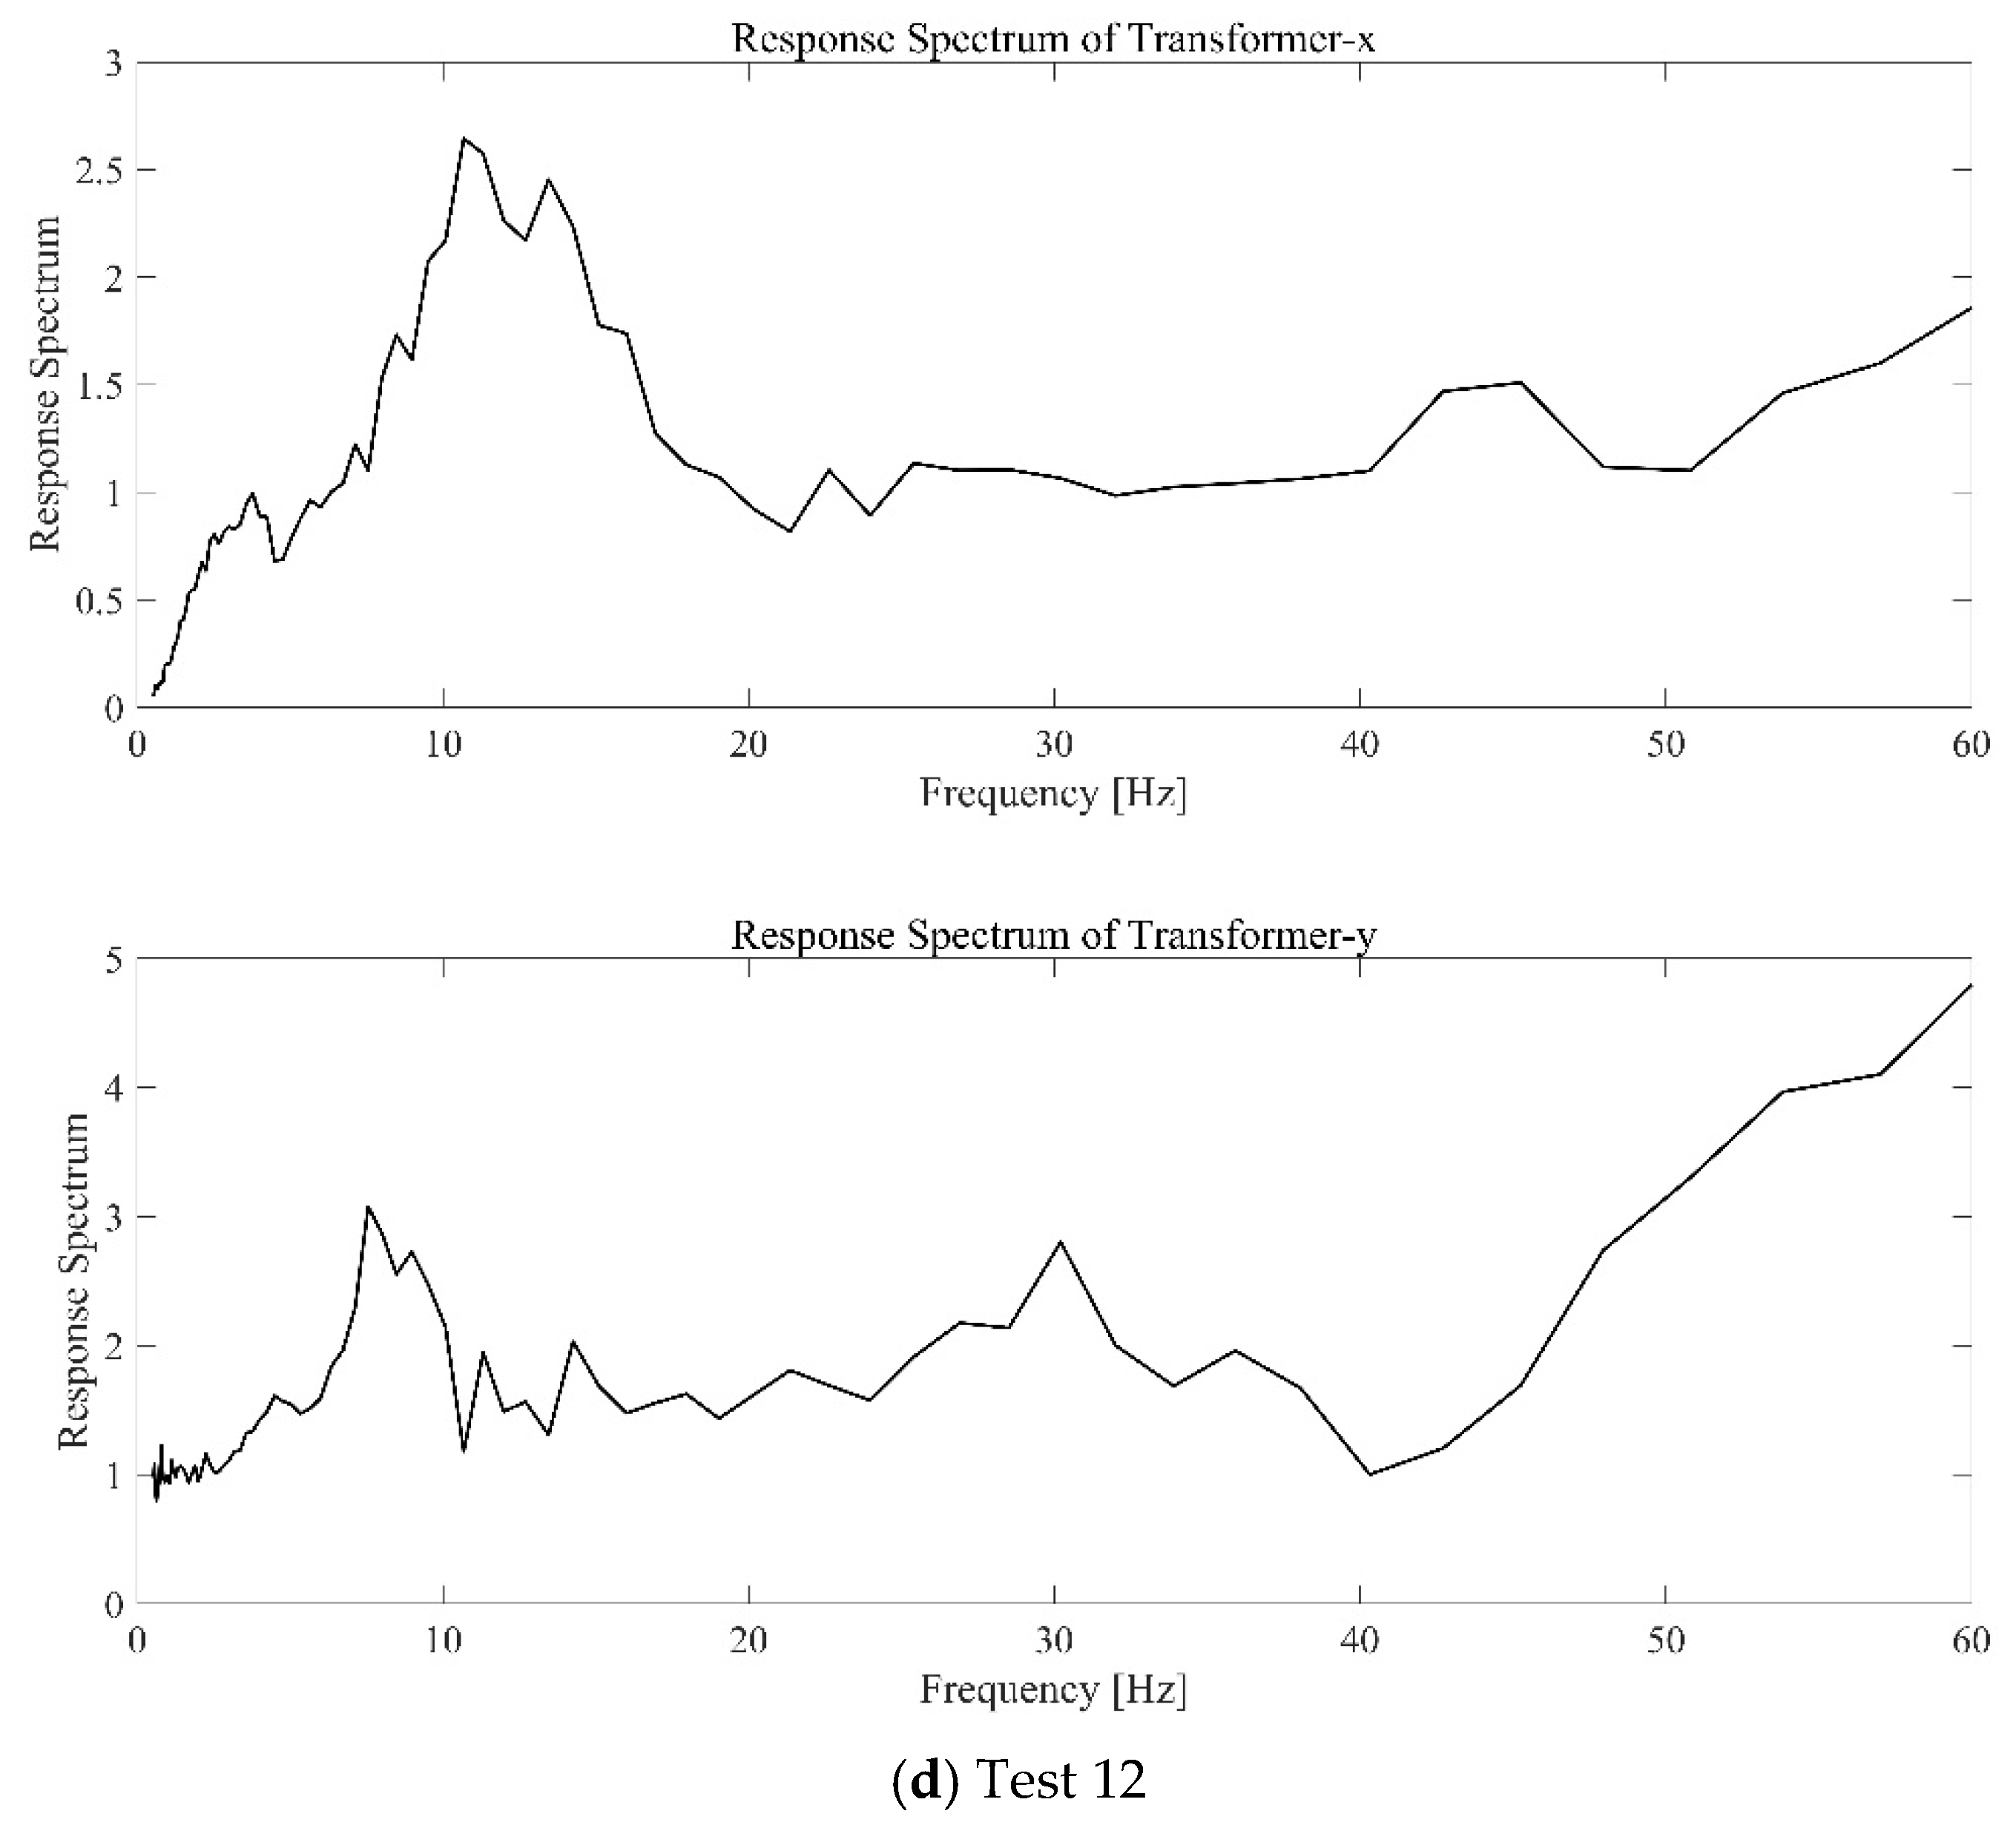
For the top of the transformer (Figure 12), the TRS generally exhibited a smooth and stable distribution concentrated in the low-frequency range. Rather than showing sharp high-response peaks, the spectra displayed broad and low-level energy distribution, indicating that the transformer body provides a baseline response level within the system. This trend is consistent with the structural characteristics of the body, where frequency-domain amplification is limited by its large mass and fixed-base boundary condition. Consequently, the transformer body contrasts with the selective band amplification observed in the bushings and radiators, supporting the finding that energy concentration within dominant frequency ranges is more pronounced in auxiliary components than in the main body.
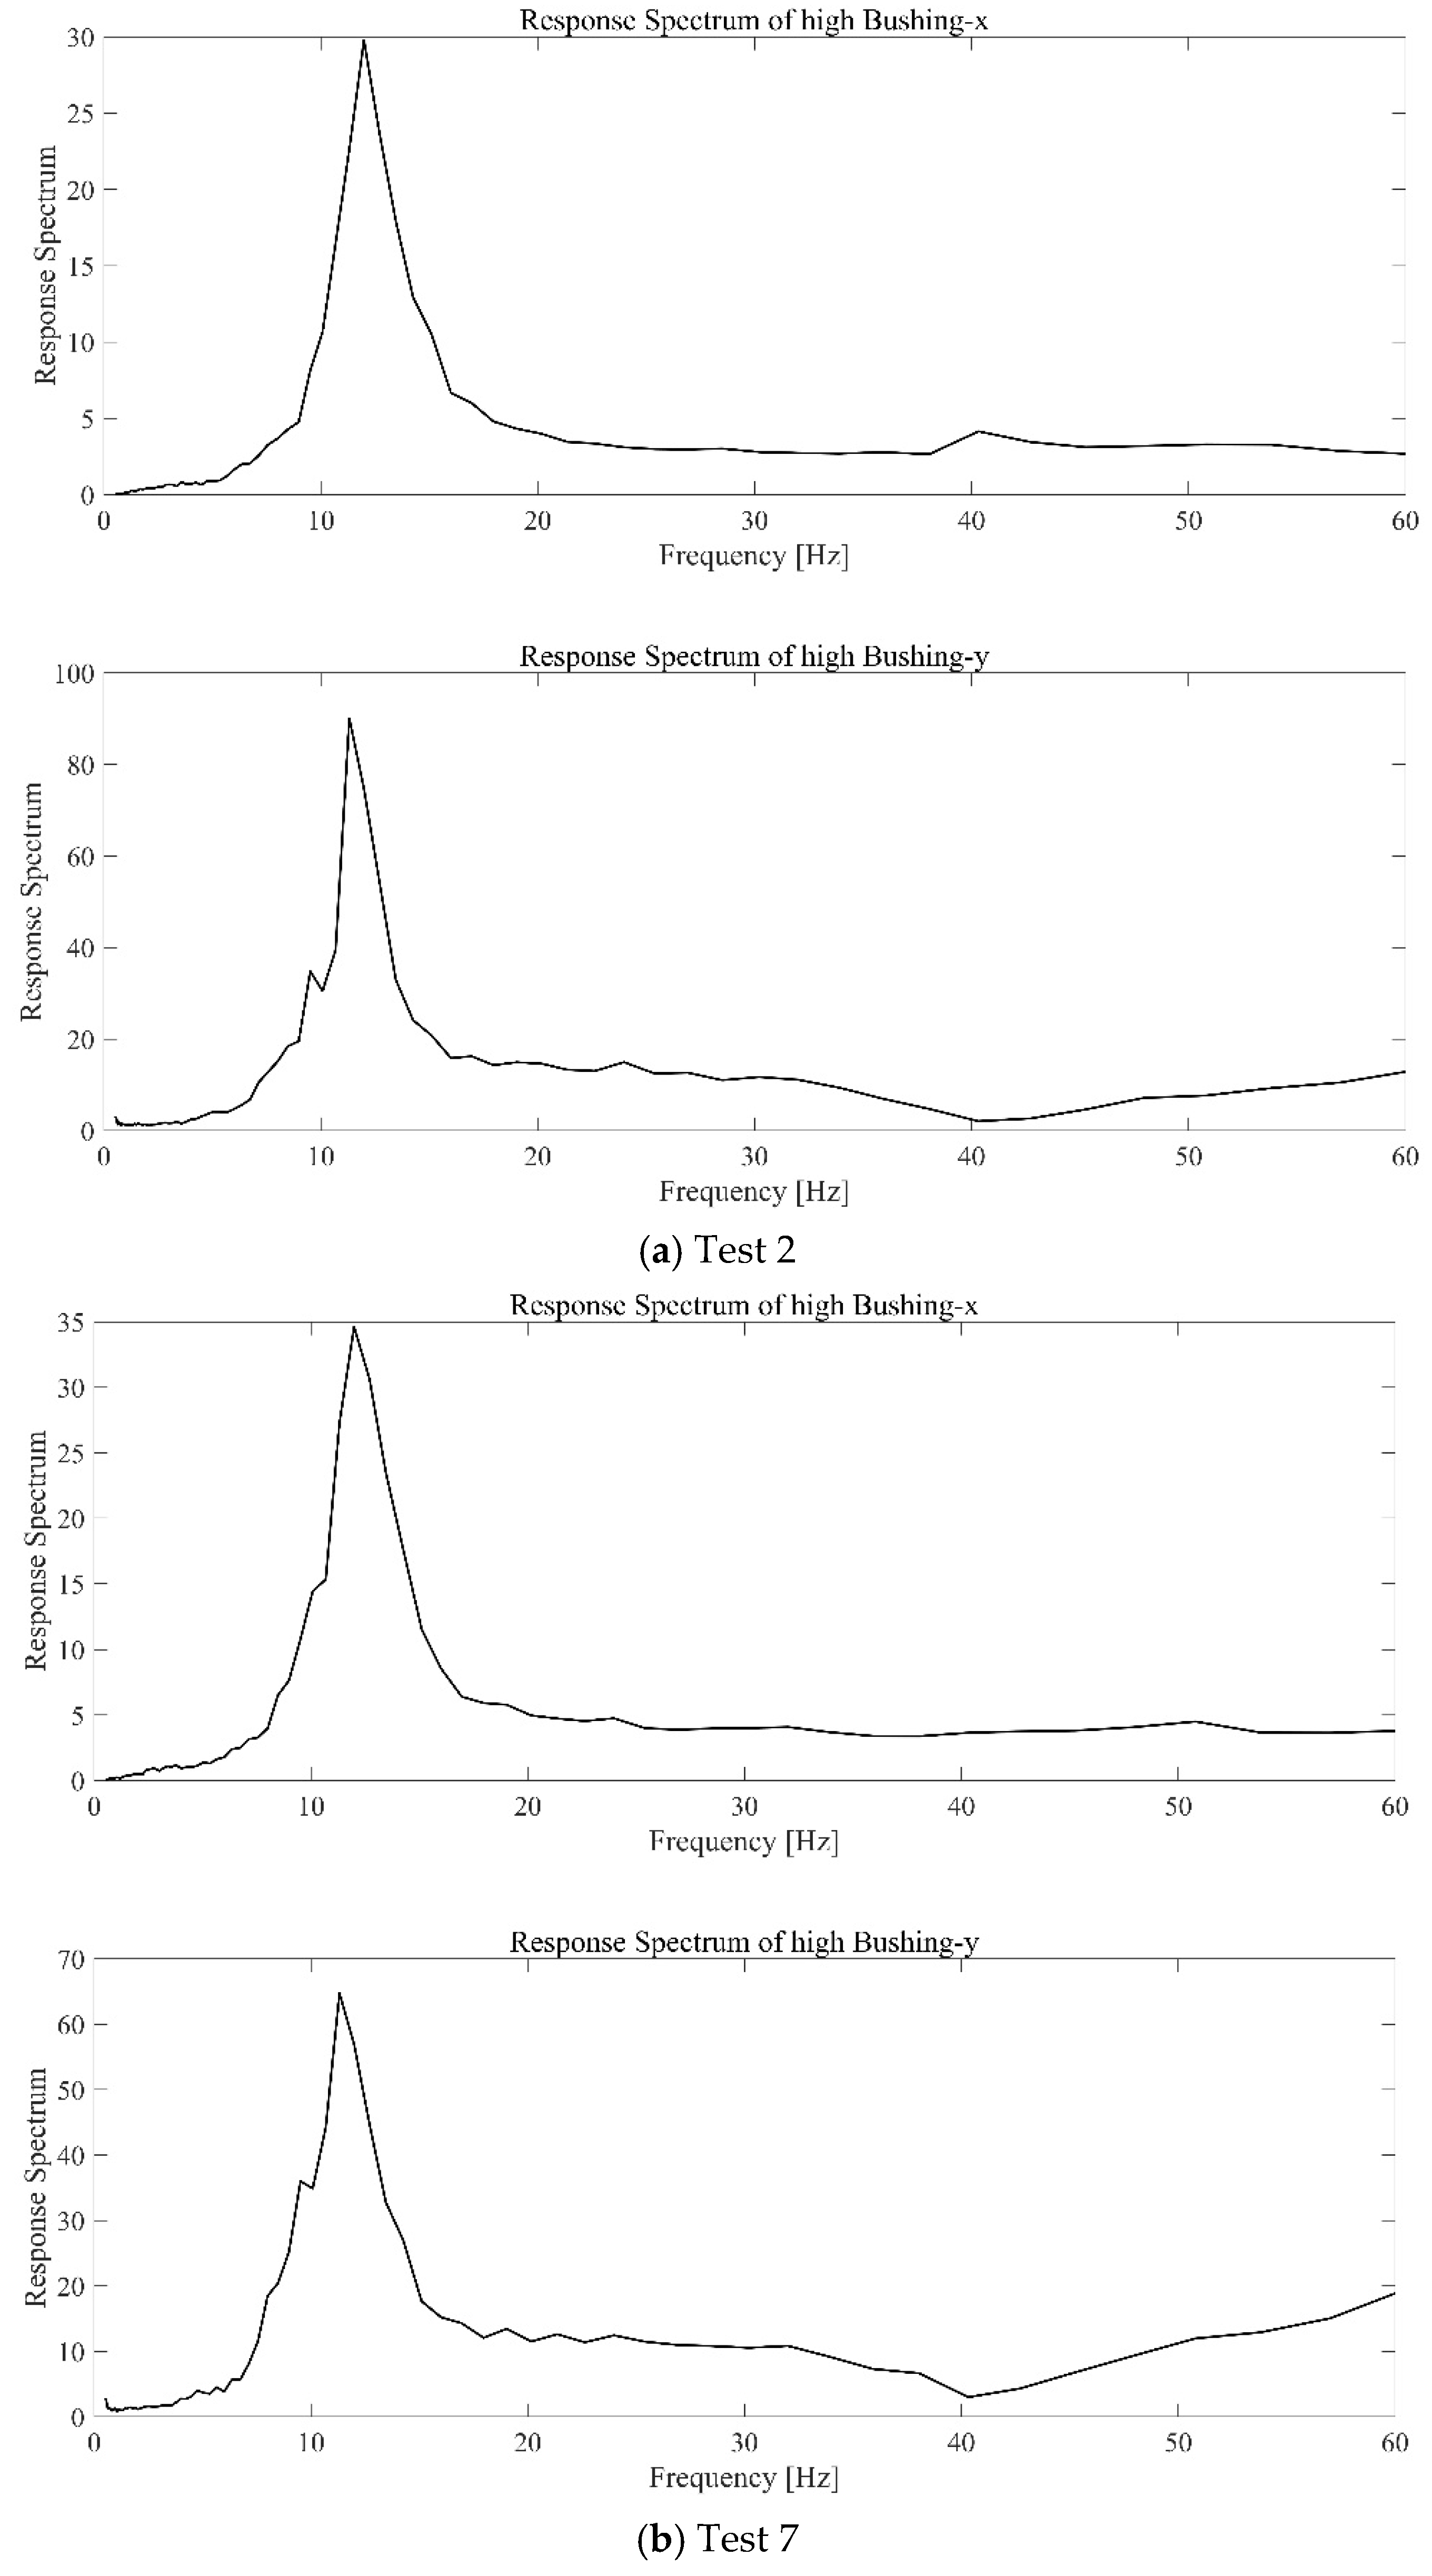
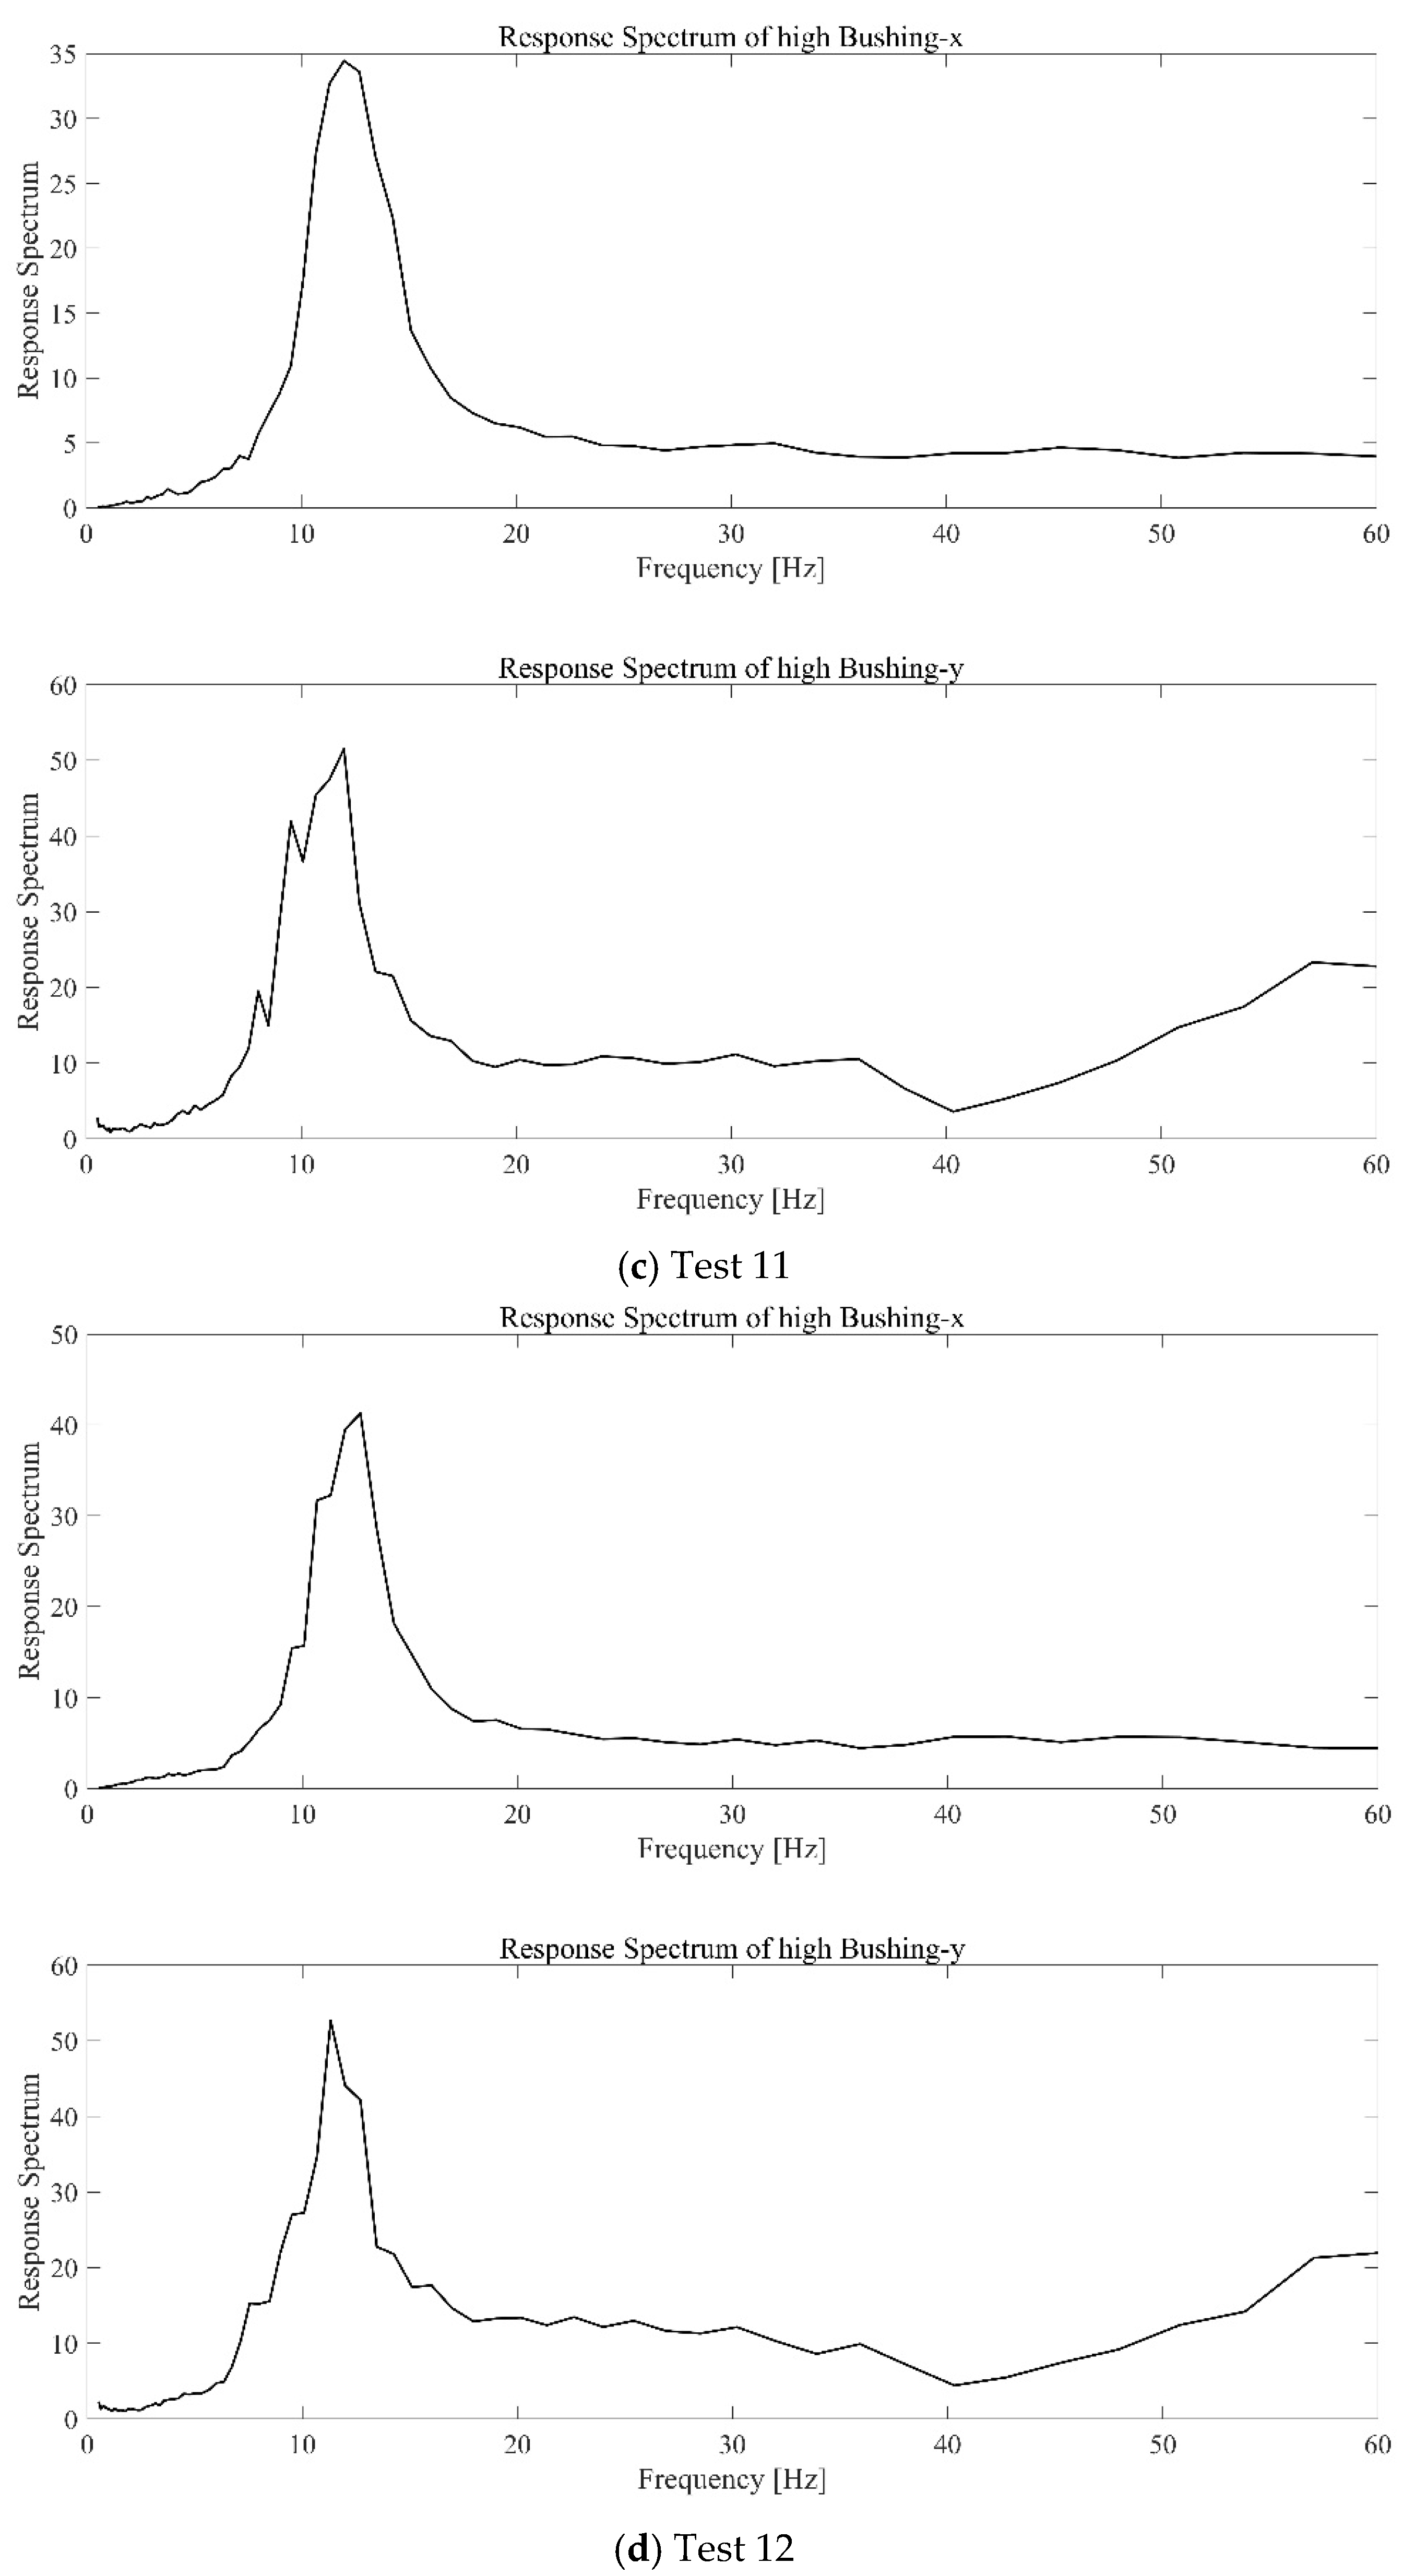
For the high bushing (Figure 13), the TRS showed repeated peaks in both the X and Y directions within the low-to-mid frequency range, and the high-response bands persisted as the input intensity increased. This pattern indicates energy concentration at specific frequencies caused by phase differences and modal coupling between the transformer body and the bushing, consistent with the amplified responses observed in the time domain. The consistent reproduction of these spectral peaks across repeated tests suggests that the upper portion of the bushing exhibits frequency-dependent vulnerability.
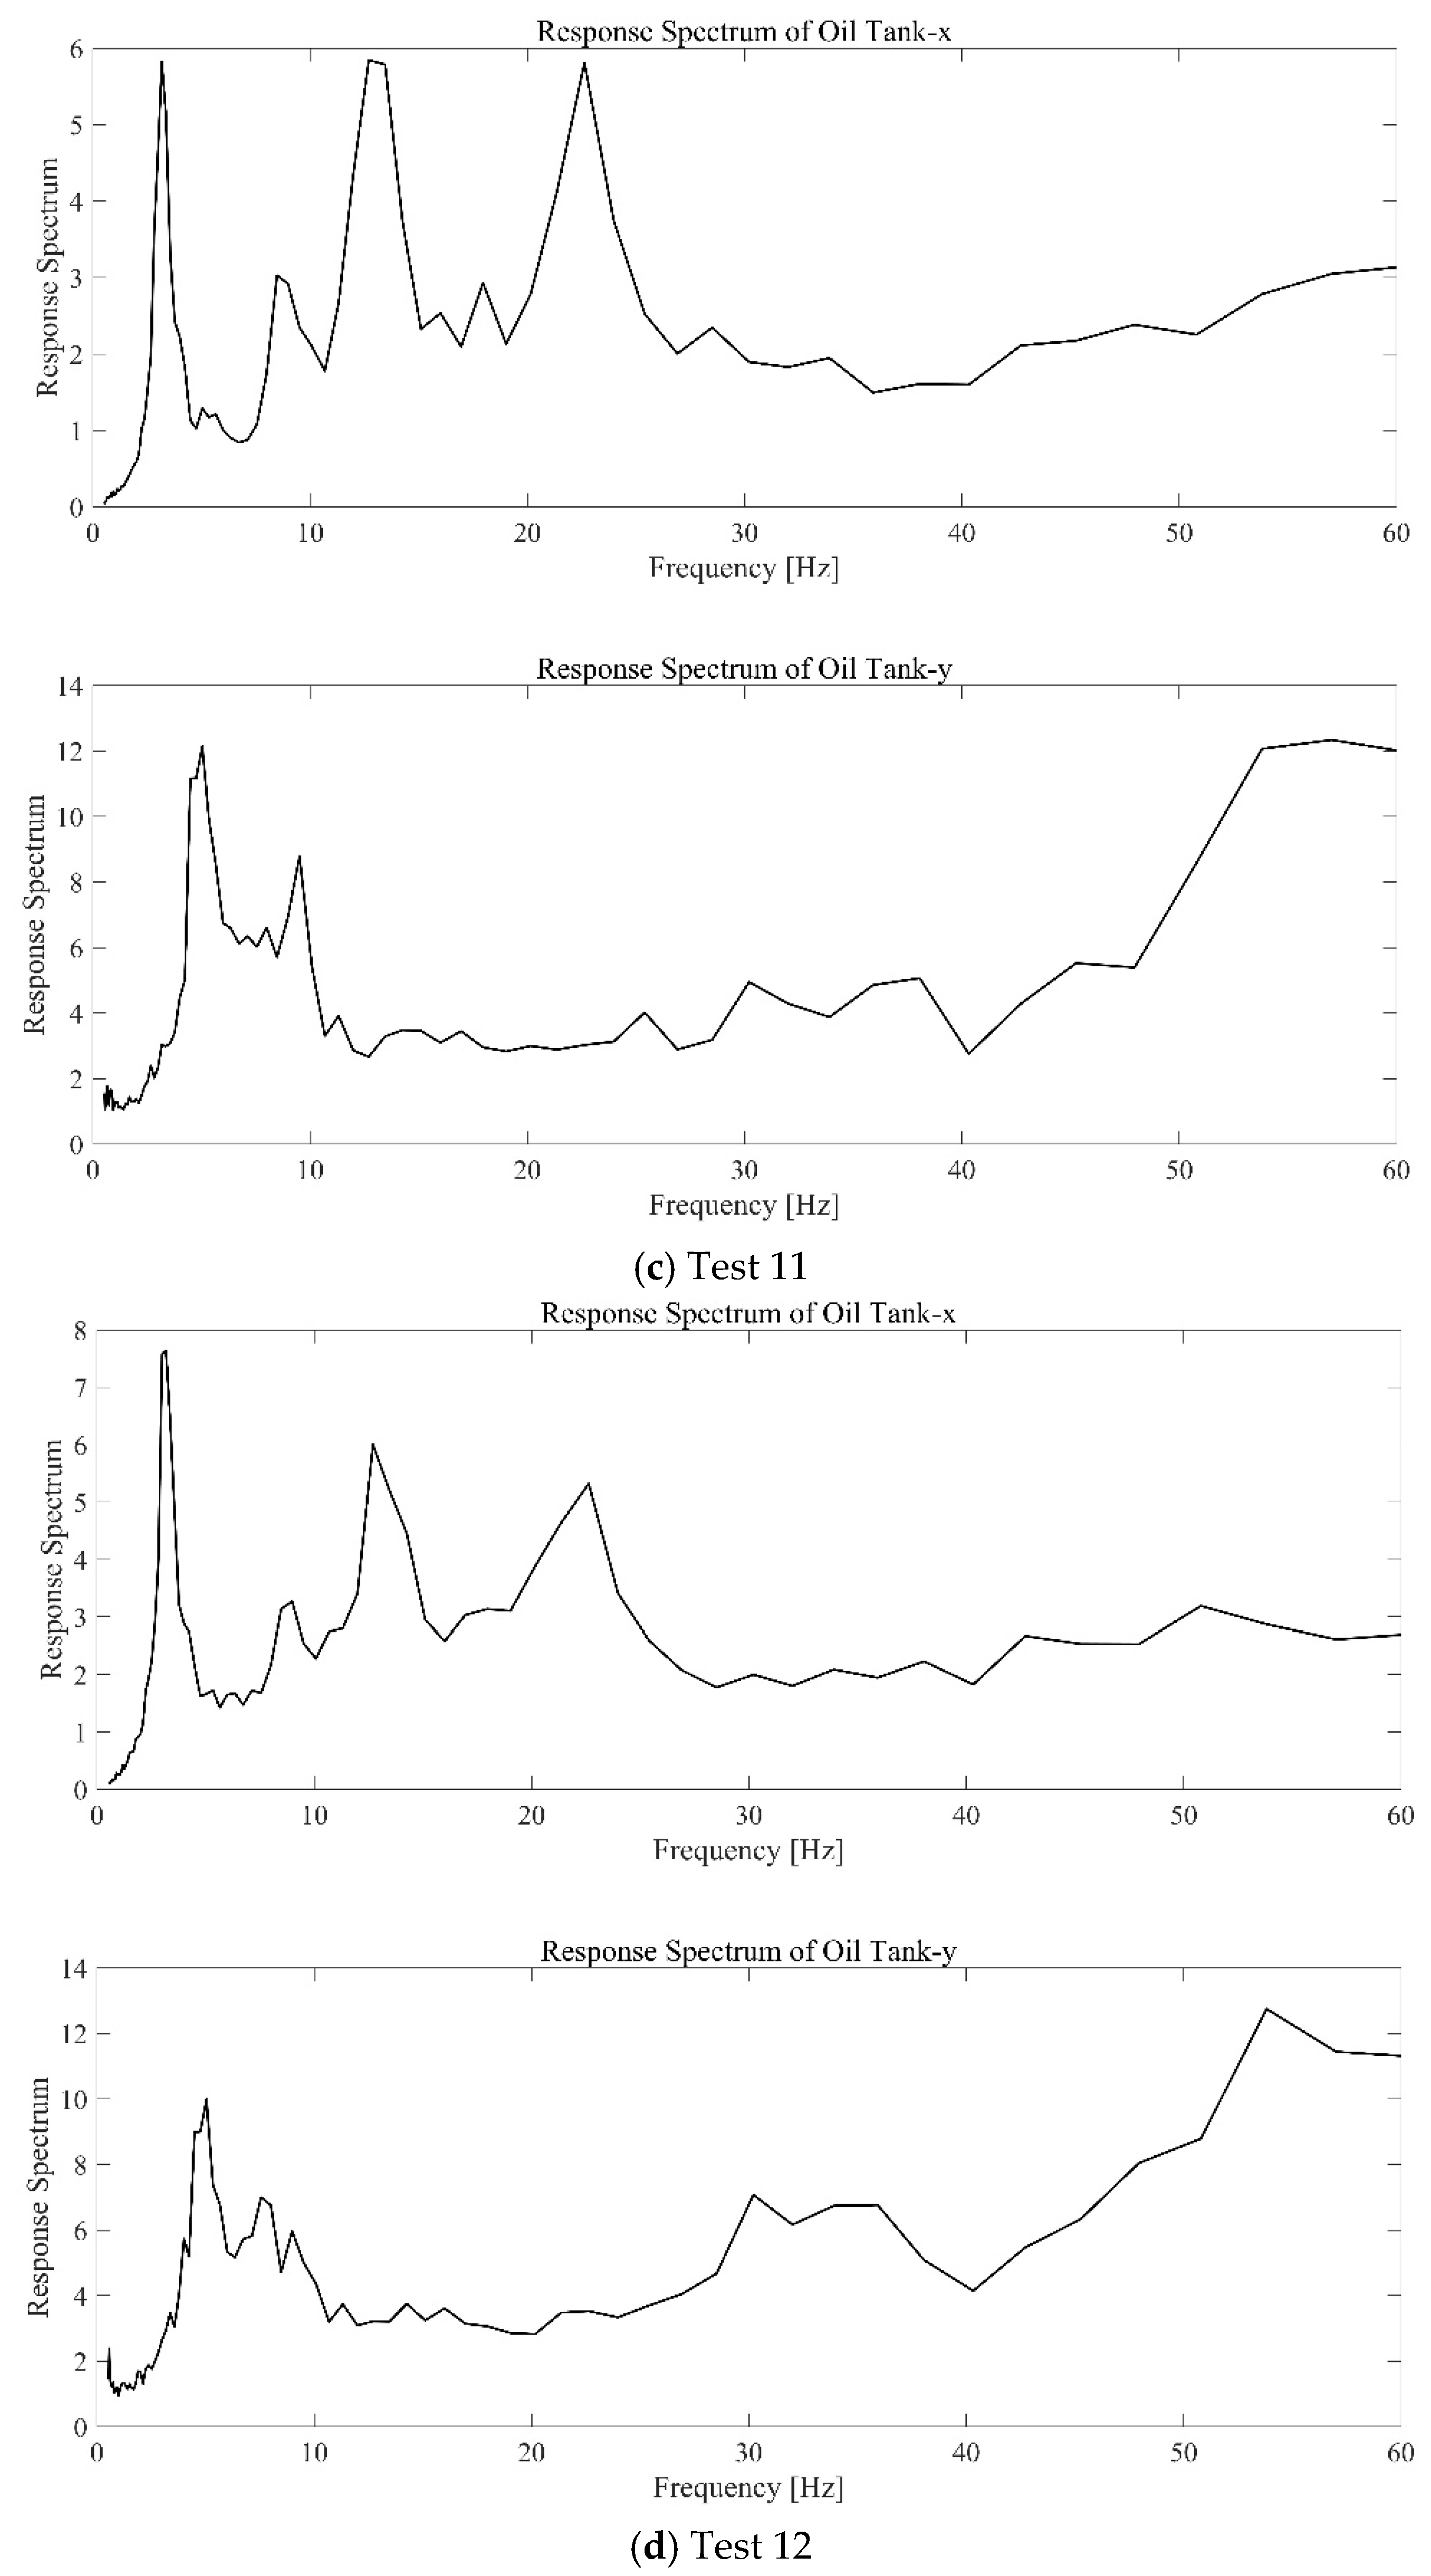
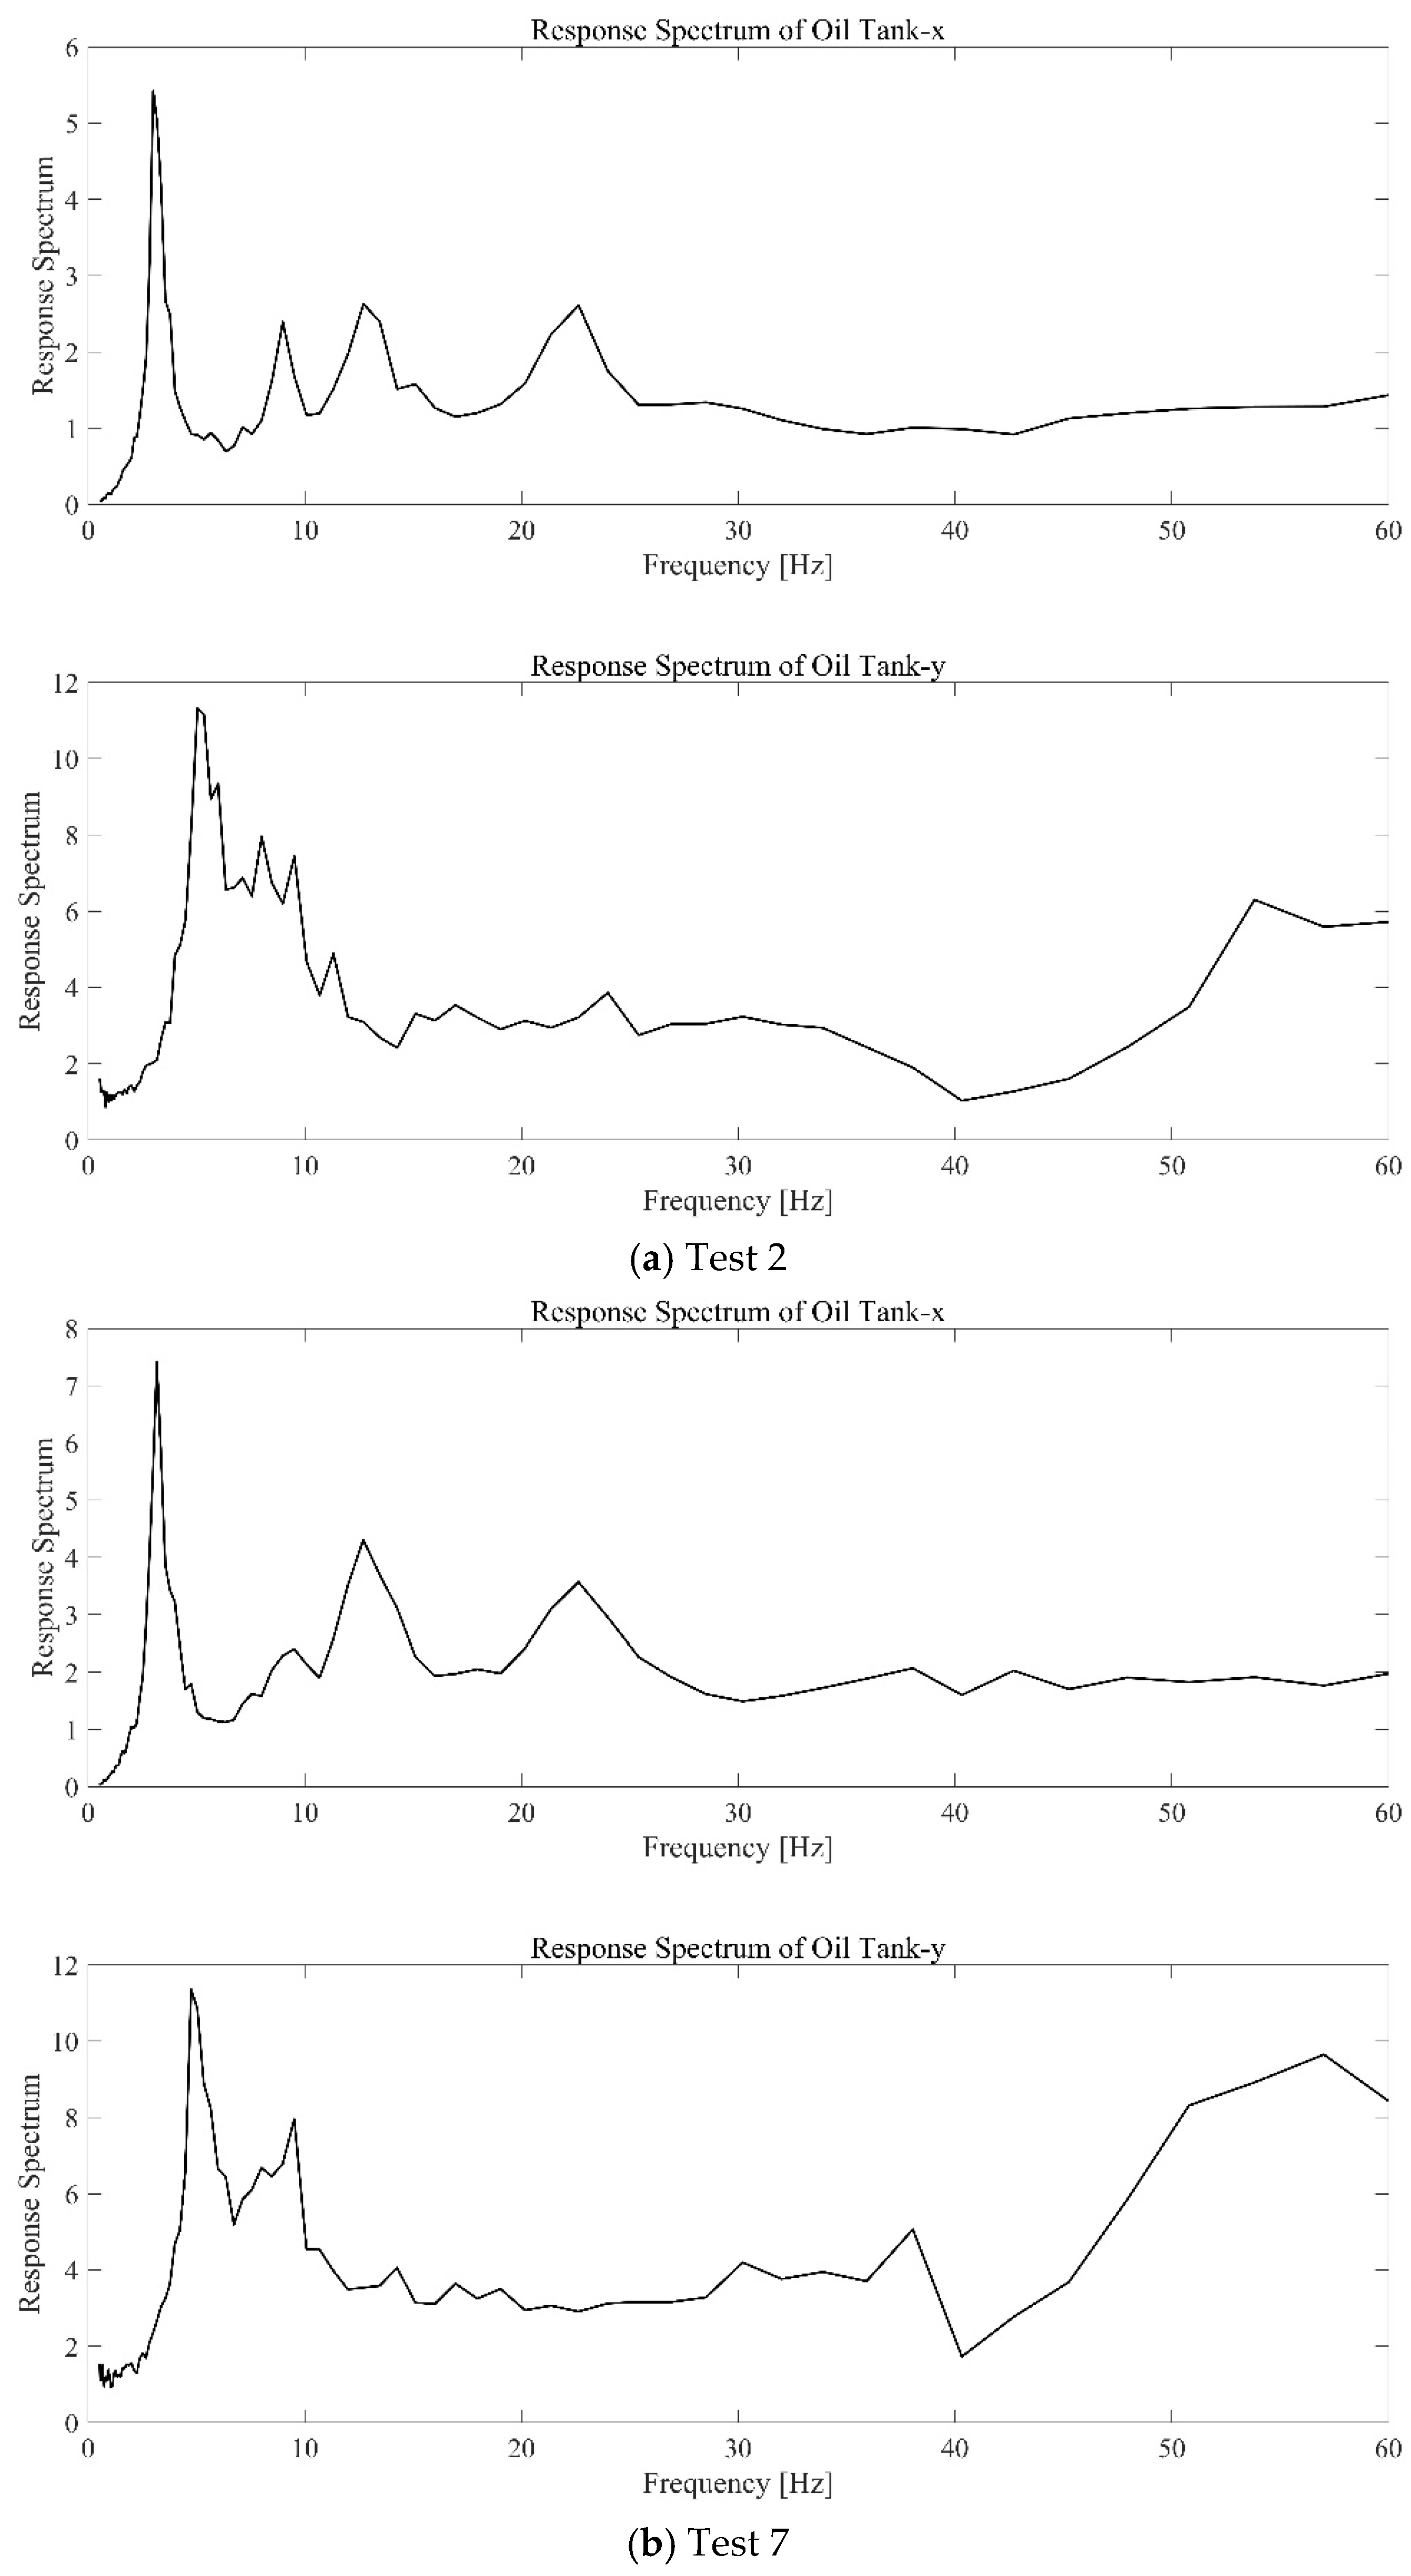
For the top of the oil tank (Figure 14), the TRS indicated that the Y-direction responses were generally larger than those in the X-direction. The spectra included a pronounced low-frequency peak near 3–5 Hz and repeated mid-frequency peaks in the 10–30 Hz range. In Tests 11 and 12, an increasing high-frequency band near 50–60 Hz was also observed in the Y-direction. These results indicate that the oil tank response sensitivity depends on both excitation direction and frequency, and that the frequency ranges associated with directional amplification vary accordingly.
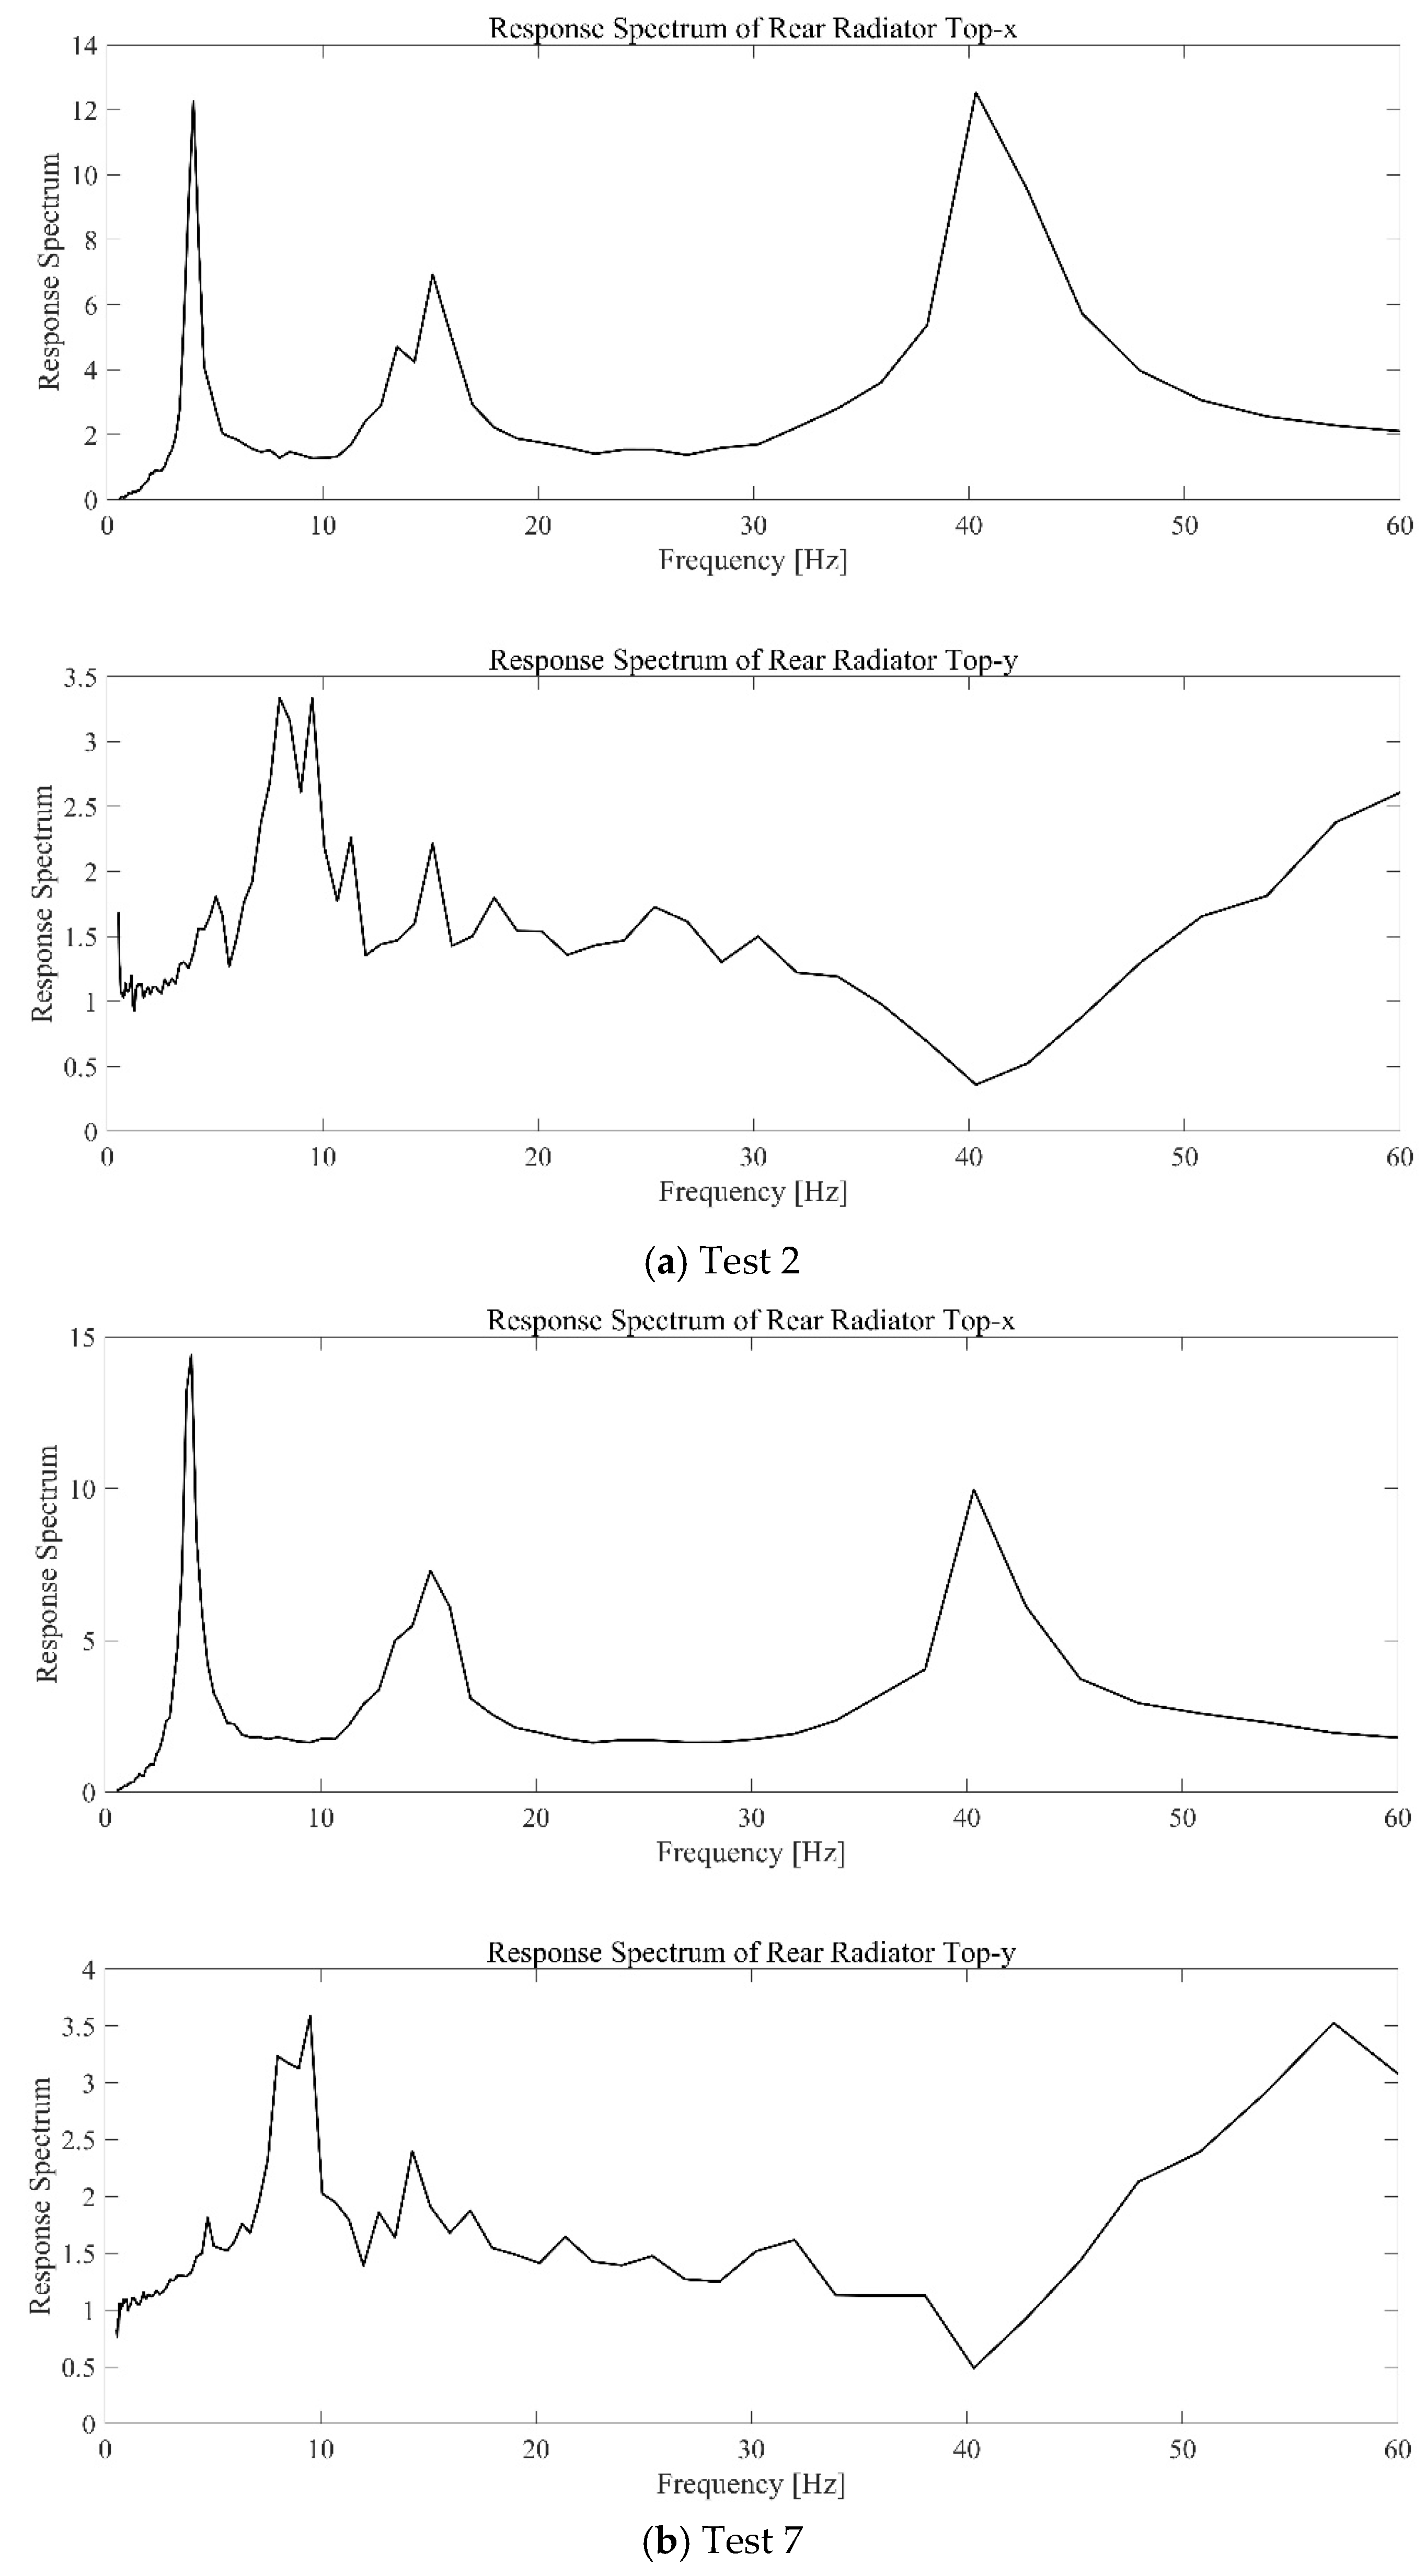
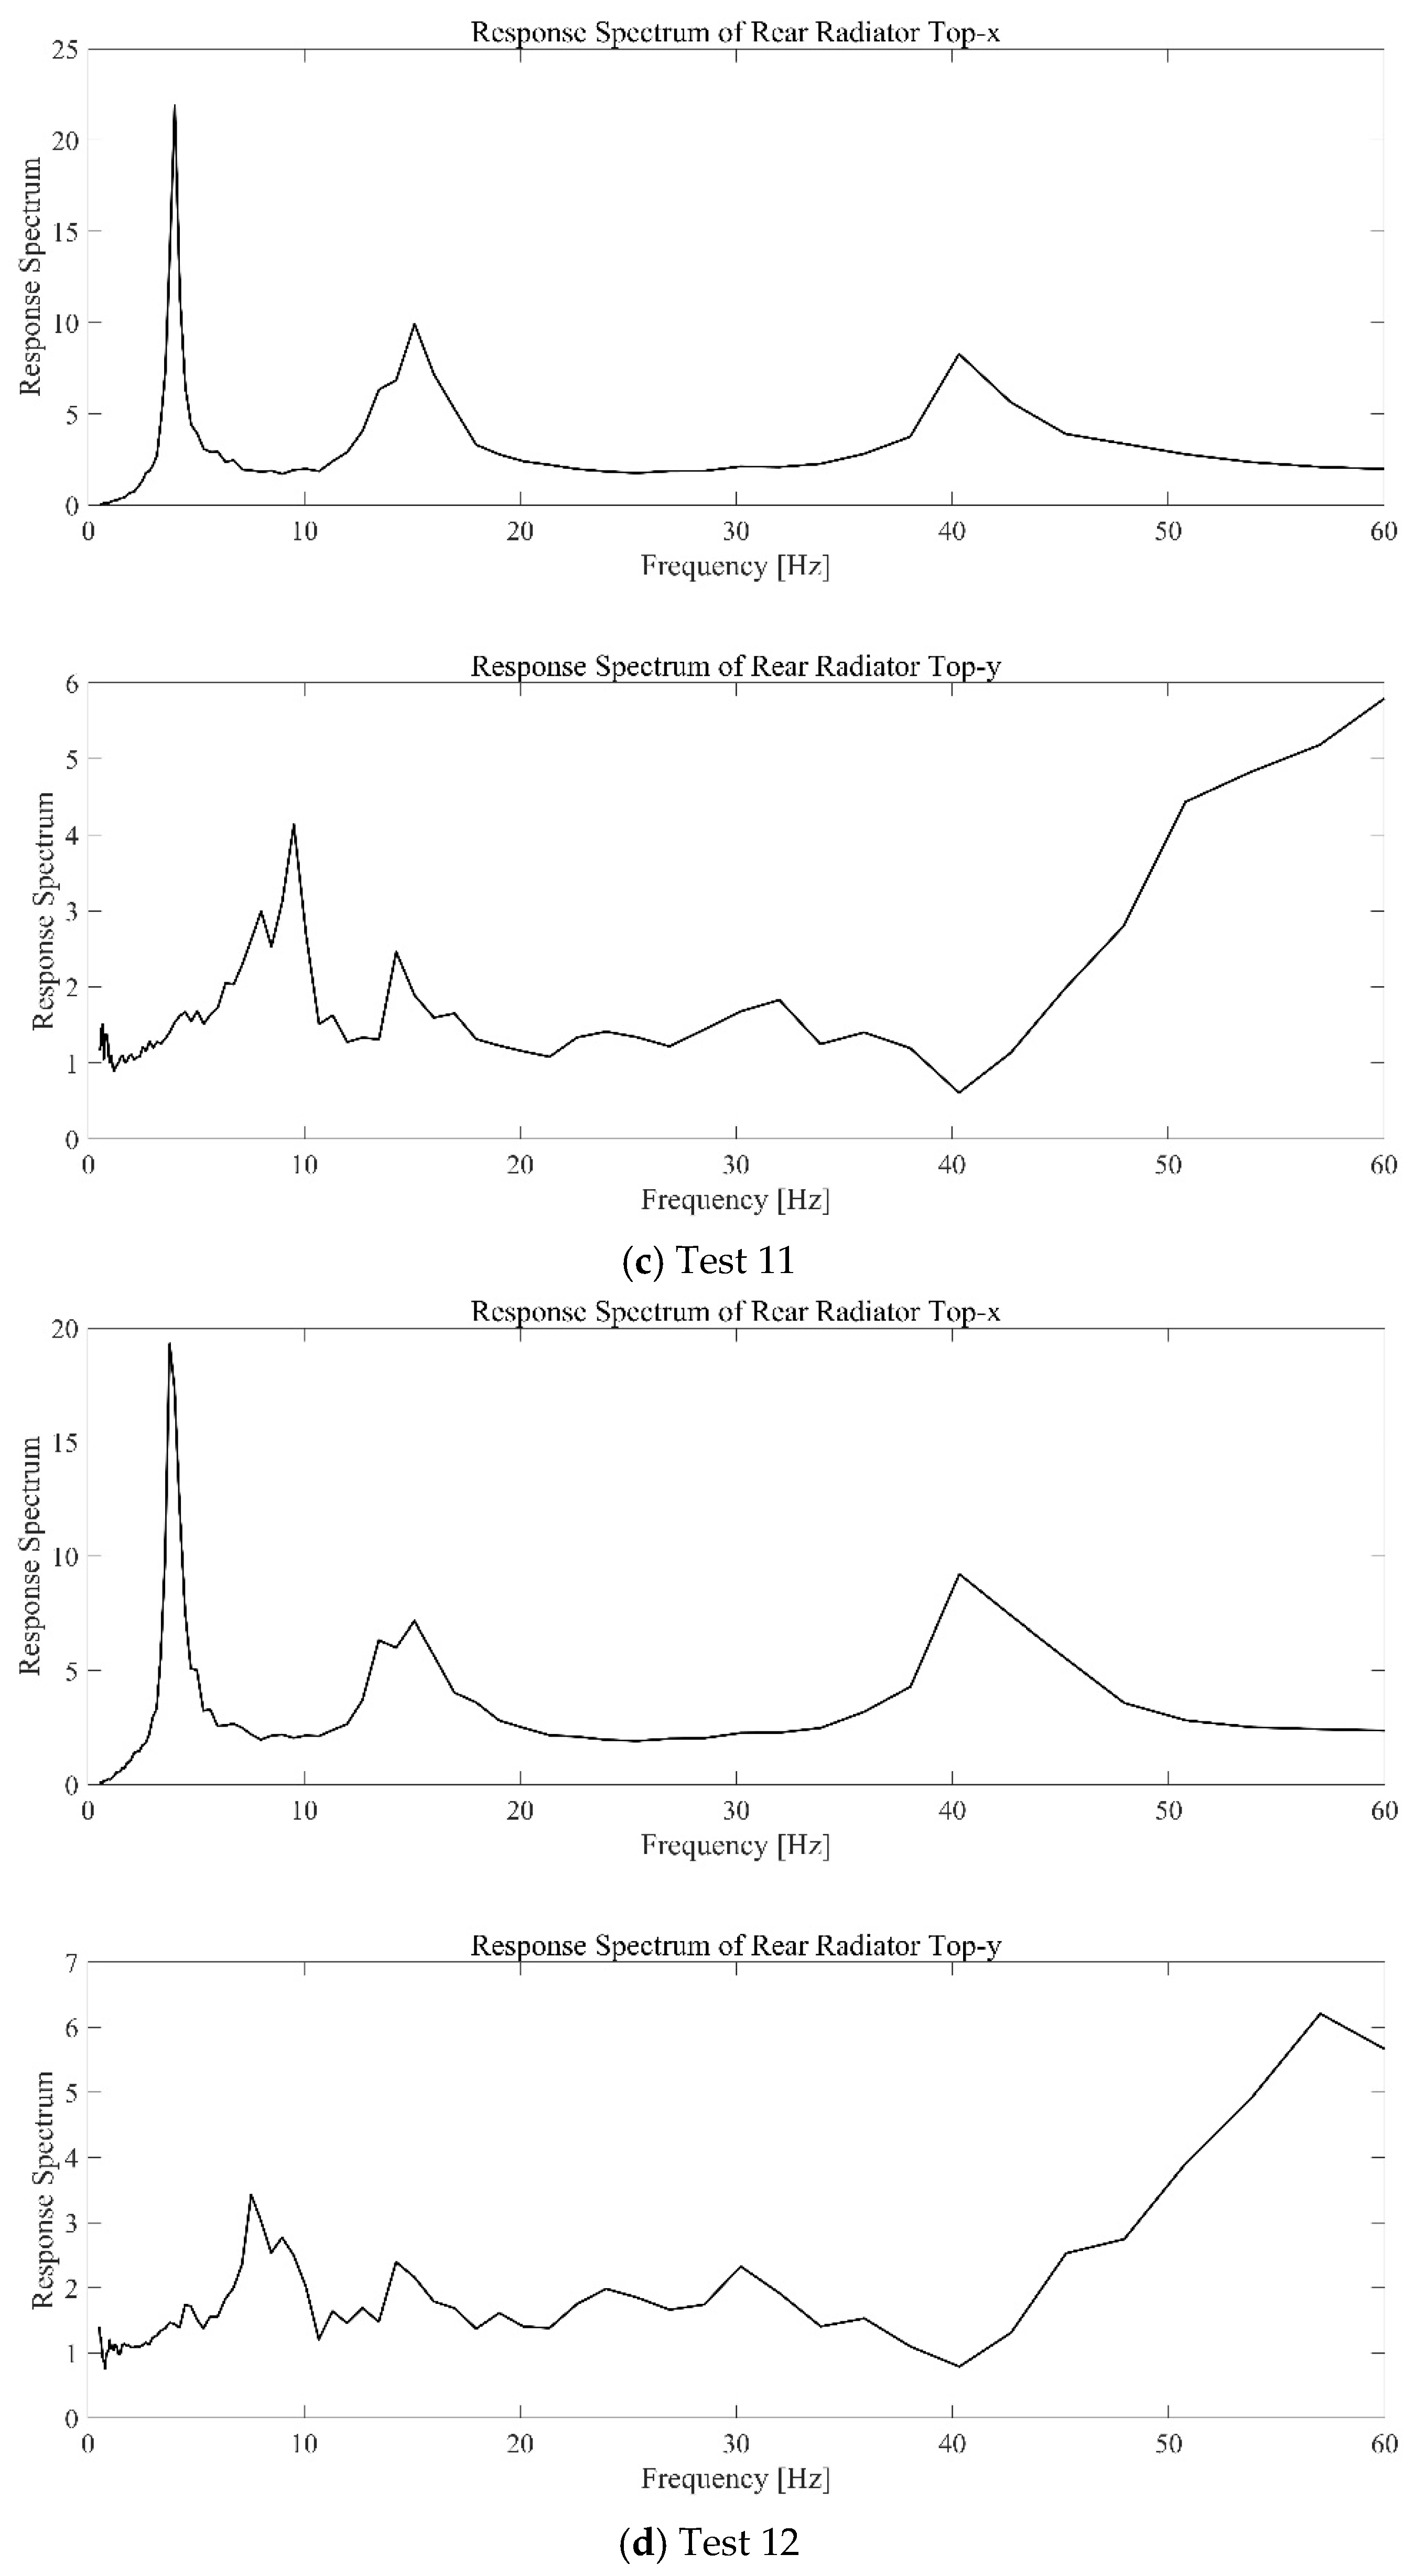
For the radiator (Figure 15), the TRS consistently showed larger responses in the X-direction than in the Y-direction across all tests. Repeated peaks were observed in the X-direction, accompanied by clear energy concentration within specific frequency bands. In contrast, the Y-direction spectra were relatively smooth and of lower magnitude, indicating limited transverse amplification. These characteristics support the observation that the radiator response is dominated by X-direction motion relative to the transformer body and highlight the frequency-dependent vulnerability of radiator connections.
Overall, the TRS analysis showed trends consistent with those observed in the time domain. The transformer body maintained a stable spectral response, whereas the bushing exhibited distinct peaks and persistent high-response bands in the low-to-mid frequency range. Similarly, the radiator displayed pronounced X-direction amplification, while the oil tank exhibited smoother spectral distributions but remained direction- and frequency-dependent in its response. These results indicate that, among the auxiliary components, bushings and radiators are particularly susceptible to frequency-dependent amplification and may therefore be more prone to seismic damage.
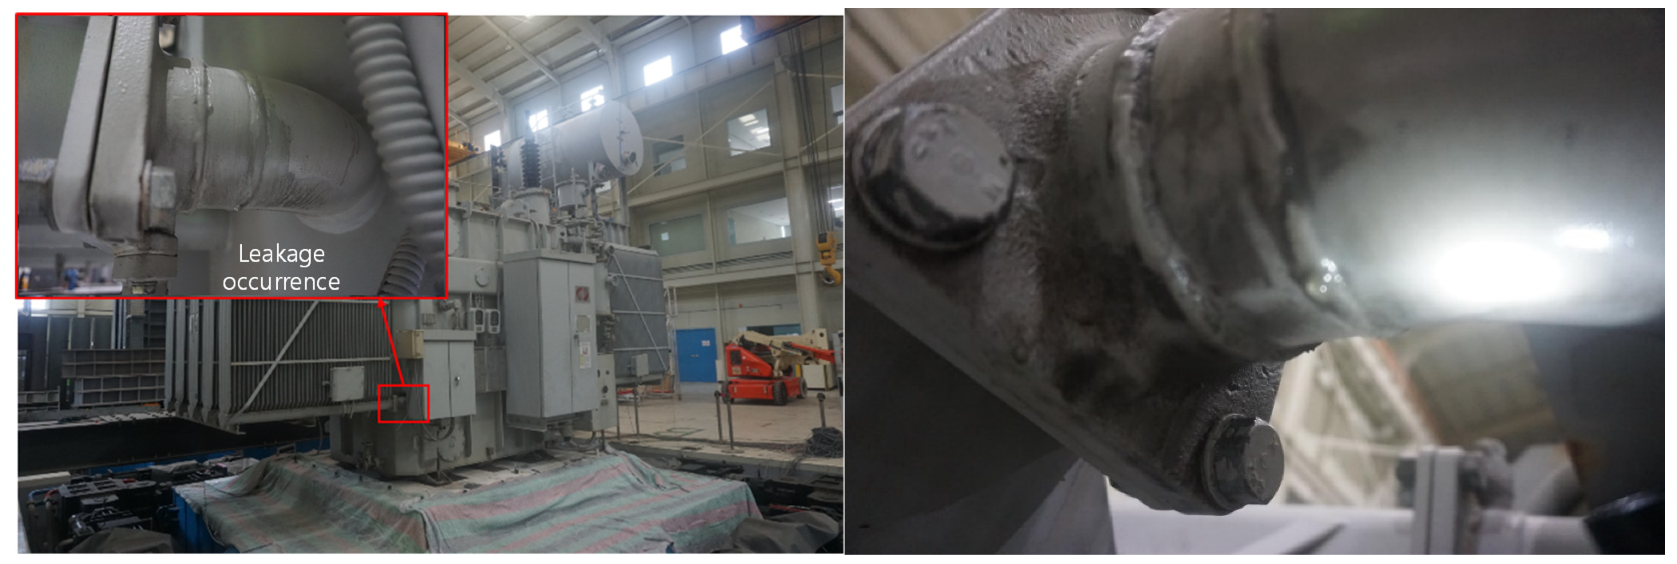
After Test 12, actual leakage was observed at the lower radiator pipe elbow (Figure 16). The leakage was first confirmed after the completion of Test 12 and is interpreted as being associated with cumulative cyclic deformation during strong shaking, rather than being solely triggered by a single isolated peak response event. The leakage is further interpreted as resulting from the combined effects of large relative displacement between the radiator and the transformer body (maximum X-direction 20.66 mm) and amplified acceleration responses (≈2 g) under strong input, which induced local stress concentration. The relative displacement and acceleration responses were measured independently using displacement transducers and accelerometers, respectively; relative displacement represents deformation demand at the connection, whereas acceleration reflects inertial force demand and dynamic amplification. The test response spectrum (Figure 15) also shows repeated distinct peaks in the X-direction and energy concentration in specific frequency bands. These spectral features are consistent with the X-direction–dominated relative-motion behavior observed in the time domain and support the conclusion that radiator connections exhibit frequency-dependent vulnerability. The X-direction-dominant response may also be influenced by torsional coupling of the transformer–radiator system arising from geometric asymmetry and eccentric distribution of auxiliary components. Although torsional response was not directly quantified in the current instrumentation, it may contribute to displacement concentration at the radiator connection, and further investigation using dedicated torsional measurements and analytical modeling is recommended. The lower radiator piping is a structurally weak and geometrically discontinuous region where relative motion with the body and repeated deformation demands at certain frequencies can overlap, making it a focal point for damage. Thus, the observed damage reflects a system-level failure mechanism arising from interactions between the transformer body and auxiliary components and from frequency-dependent amplification, rather than an isolated local component failure. The observed radiator leakage is consistent with radiator and conservator connection leaks reported during the 2024 Noto earthquake, demonstrating that the present experiments reproduce the actual transformer damage mechanism.
Although bushings reached the largest acceleration responses in all tests (up to ≈4 g), the bushing tops are not directly linked to piping or oil circuits by inertia, so their high acceleration amplification did not translate into functional leakage damage. The oil tank recorded X-direction responses of about 1.5–1.9 g and showed sensitivity to longitudinal input; however, the TRS peaks for the tank (Figure 14) were relatively mild and not confined to narrow frequency bands. The oil tank’s cross-sectional stiffness and relatively continuous connections tend to disperse rather than concentrate stresses. By contrast, the radiator exhibited repeated large X-direction relative displacements exceeding 20 mm and pronounced X-direction spectral peaks with frequency-dependent energy concentration (Figure 15). The lower radiator elbow, being of low stiffness and geometrically discontinuous, is a vulnerable location where repeated relative motion with the body concentrates. Therefore, the radiator damage likely materialized because large relative displacement, acceleration amplification, frequency-dependent energy concentration, and a structurally vulnerable geometry coincided.
These findings indicate that measures such as geometric stiffening, support-structure reinforcement, and material stiffness enhancement for radiator connections should be essential considerations to improve seismic performance.

5. Conclusions

This study conducted multi-directional shaking-table tests on a full-scale 154 kV transformer to investigate the dynamic behavior and failure mechanisms of radiator and conservator connections. The main conclusions are summarized as follows.
  • Large relative displacement was observed in the transformer–radiator (T–R) section, reaching a maximum of 20.66 mm in the X-direction, which was markedly larger than those measured in other auxiliary sections. The radiator experienced repeated deformation demands under coupled acceleration levels of approximately 2 g, indicating a high potential for structural damage.
  • Acceleration analysis showed that the transformer body top exhibited stable responses in the range of 0.5–1.2 g. By contrast, bushings reached up to approximately 4 g, indicating pronounced amplification relative to the body. The oil tank showed relatively larger responses in the longitudinal (X) direction. The radiator responses were on average 1.5–2.0 times those of the body, which, together with its relative displacement behavior, increased the likelihood of damage.
  • Test Response Spectrum (TRS) analysis indicated that the transformer body maintained a smooth and stable spectral shape at the reference level. Bushings showed distinct peaks and repeated high-response bands in the low-to-mid frequency range, and the radiator exhibited pronounced spectral amplification primarily in the X-direction. These spectral characteristics were consistent with the time-domain displacement and acceleration results and indicate that, among the auxiliary components, the radiator and bushings exhibit frequency-dependent vulnerability.
  • After Test 12, leakage was observed at the lower radiator pipe elbow (Figure 16). This damage cannot be explained solely by large relative displacement or peak acceleration. Instead, it resulted from the combined effects of concentrated relative displacement, acceleration amplification, energy concentration within specific frequency bands, and local geometric discontinuity. Therefore, radiator connections were identified as damage-prone locations within the transformer system, and the experiments confirmed a system-level failure mechanism driven by interactions between the main body and auxiliary components.
  • This study is limited to shaking-table tests on a single full-scale 154 kV transformer specimen with a specific radiator configuration and support condition; therefore, the findings have limited generalizability to transformers with different geometries, capacities, or auxiliary equipment arrangements. In addition, ground–foundation interaction and long-term repeated loading effects were not considered. Future work should include experimental validation for a wider range of radiator and conservator geometries, installation conditions, and boundary conditions, as well as verification of retrofit measures such as geometric stiffening, support-structure reinforcement, material-stiffness enhancement, and damping devices. Furthermore, the present experimental findings can be extended to probabilistic seismic vulnerability assessment, including the development of component- or connection-level fragility functions for radiator and conservator connections under various configurations. Developing component-level seismic vulnerability curves and a reliability-based framework for assessing overall transformer seismic performance is also recommended.
  • The leakage observed at the lower radiator elbow in the present full-scale tests is consistent with post-earthquake damage patterns in which radiator and conservator piping connections are prone to functional failure due to interaction-driven relative motion and localized deformation demand.
  • Current seismic qualification practices often emphasize the seismic capacity of individual components such as bushings. However, the present full-scale shaking table results indicate that radiator and conservator piping connections may represent important system-level vulnerabilities due to interaction-driven relative motion and localized deformation demand. Therefore, future qualification protocols may benefit from incorporating connection-level performance checks, such as monitoring relative displacement demand between the transformer body and auxiliary assemblies and establishing leakage-based acceptance criteria. In addition, system-level evaluation approaches that capture interaction effects between the transformer body and auxiliary components should be encouraged to enable more realistic seismic performance assessment.
  • In future work, a simplified component-/connection-level model of the radiator and conservator assemblies can be developed and validated using the present full-scale measurements, enabling quantitative evaluation of interaction-driven demands and retrofit effectiveness. This framework may be further extended to finite element or multi-body interaction models incorporating both linear and nonlinear connection behavior.

Author Contributions

Conceptualization and methodology, N.C. and B.-G.J.; investigation and analysis, S.-W.K., S.-J.C., U.-J.K. and S.-W.S.; writing—original draft preparation, B.-G.J. and S.-W.S.; writing—review and editing, N.C., B.-G.J. and S.-W.S. All authors have read and agreed to the published version of the manuscript.

Funding

This research was supported by the Korea Electric Power Corporation (KEPCO).

Institutional Review Board Statement

Not applicable.

Informed Consent Statement

Not applicable.

Data Availability Statement

The data presented in this study are available on request from the corresponding authors.

Acknowledgments

The authors would like to thank the Seismic Research and Test Center for their assistance with the test equipment.

Conflicts of Interest

Author Nakhyun Chun was employed by the company Korea Electric Power Corporation. The remaining authors declare that the research was conducted in the absence of any commercial or financial relationships that could be construed as a potential conflict of interest.

References

  1. Filiatrault, A.; Matt, H. Seismic response of high-voltage transformer–bushing systems. J. Struct. Eng. 2006, 132, 287–295. [Google Scholar] [CrossRef]
  2. Ersoy, S.; Saadeghvaziri, M.A. Seismic response of transformer–bushing systems. IEEE Trans. Power Deliv. 2004, 19, 131–137. [Google Scholar] [CrossRef]
  3. IEEE 693-2005; IEEE Recommended Practice for Seismic Design of Substations. IEEE: Piscataway, NJ, USA, 2005.
  4. IEC TS 61463; Bushing Amplification Factors—Guidance. IEC: Geneva, Switzerland, 2016.
  5. IEC 62271-207; Seismic Qualification for Gas-Insulated Switchgear Assemblies for Rated Voltages Above 52 kV. IEC: Geneva, Switzerland, 2007.
  6. IEC 62271-210; Seismic Qualification for Metal-Enclosed and Solid-Insulation-Enclosed Switchgear and Controlgear Assemblies for Rated Voltages Above 1 kV and up to and Including 52 kV. IEC: Geneva, Switzerland, 2013.
  7. IEC 60068-3-3; Environmental Testing—Part 3: Guidance—Seismic Test Methods for Equipment. IEC: Geneva, Switzerland, 1991.
  8. Amir, S.G.; Whittaker, A.S.; Fenves, G.L.; Fujisaki, E. Seismic Evaluation of 550 kV Porcelain Transformer Bushings; (PEER Report 1999/05); Pacific Earthquake Engineering Research Center: Richmond, CA, USA, 1999. [Google Scholar]
  9. Koliou, M.; Filiatrault, A.; Reinhorn, A.M. Seismic Protection of Electrical Transformer Bushing System by Stiffening Techniques; (Technical Report MCEER-12-0002); Multidisciplinary Center for Earthquake Engineering Research: New York, NY, USA, 2012. [Google Scholar]
  10. Joe, Y.H.; Cho, S.G. Modal identification and seismic performance evaluation of 154 kV transformer porcelain bushing by vibration test. J. Earthq. Eng. Soc. Korea 2006, 10, 107–115. [Google Scholar]
  11. Kim, S.W.; Park, D.U.; Jeon, B.G.; Yun, D.W. Response of a 230 kV outdoor termination according to the frequency characteristics of input seismic waves. Energy Rep. 2020, 6, 497–503. [Google Scholar] [CrossRef]
  12. Ullah, K.N.; Mohammad, A.S. Electrical and Seismic Design of Electric Supply Substation; LAP Lambert Academic Publishing: Saarbrücken, Germany, 2015. [Google Scholar]
  13. Oikonomou, K.; Roh, H.; Reinhorn, A.M.; Schiff, A.; Kempner, L. Seismic performance evaluation of high-voltage transformer bushings. In Proceedings of the Structures Congress 2010; ASCE: Reston, VA, USA, 2010; pp. 2724–2735. [Google Scholar] [CrossRef]
  14. Yang, J.; Rustogi, S.K.; Gupta, A. Rocking stiffness of mounting arrangements in electrical cabinets and control panels. Nucl. Eng. Des. 2003, 219, 127–141. [Google Scholar] [CrossRef]
  15. Filiatrault, A.; Matt, H. Experimental seismic response of high-voltage transformer–bushing systems. Earthq. Spectra 2005, 21, 1009–1025. [Google Scholar] [CrossRef]
  16. Cao, M.G.; Cheng, Y.F.; Dai, Z.B.; Zhou, F.L.; Tan, P. Parameter analysis and shaking table test on seismic isolation system of transformer with bushings. In Proceedings of the 15th World Conference on Earthquake Engineering (WCEE), Lisbon, Portugal, 24–28 September 2012. [Google Scholar]
  17. Chun, N.H.; Jeon, B.G.; Kim, S.W.; Chang, S.J.; Son, S.W. Seismic response evaluation of 154 kV transformer porcelain bushing by shaking table tests. Struct. Eng. Mech. 2022, 84, 155–165. [Google Scholar] [CrossRef]
  18. Jeon, B.G.; Jung, C.Y.; Jin, J.W.; Kim, H.H.; Cheung, J.H. Seismic performance evaluation of 500 kV EBA. Trans. Korean Soc. Noise Vib. Eng. 2015, 25, 496–502. [Google Scholar] [CrossRef]
  19. Koliou, M.; Filiatrault, A.; Reinhorn, A.M. Seismic response of high-voltage transformer-bushing systems incorporating flexural stiffeners I: Numerical study. Earthq. Spectra 2013, 29, 1335–1352. [Google Scholar] [CrossRef]
  20. Koliou, M.; Filiatrault, A.; Reinhorn, A.M. Seismic response of high-voltage transformer-bushing systems incorporating flexural stiffeners II: Experimental study. Earthq. Spectra 2013, 29, 1353–1367. [Google Scholar] [CrossRef]
  21. Ministry of the Interior and Safety (MOIS). Common Application of Seismic Design Criteria; MOIS: Sejong, Republic of Korea, 2017. (In Korean) [Google Scholar]
  22. IEEE 344; Standard for Seismic Qualification of Equipment for Nuclear Power Generating Stations. IEEE: Piscataway, NJ, USA, 2013.
  23. Acceptance Criteria 156 (AC156); Acceptance Criteria for Seismic Certification by Shake-Table Testing of Nonstructural Components. ICC-ES: Whittier, CA, USA, 2010.
Figure 1. 154 kV test transformer.
Applsci 16 01659 g001
Figure 2. Transformer foundation installation.
Applsci 16 01659 g002
Figure 3. Sensor setup—Accelerometers, LVDT.
Applsci 16 01659 g003
Figure 4. Required response spectrum (RRS).
Applsci 16 01659 g004
Figure 5. Relative displacement (T-B): (a) Test 2; (b) Test 7; (c) Test 11; (d) Test 12.
Applsci 16 01659 g005aApplsci 16 01659 g005b
Figure 6. Relative displacement (T-O): (a) Test 2; (b) Test 7; (c) Test 11; (d) Test 12.
Applsci 16 01659 g006aApplsci 16 01659 g006b
Figure 7. Relative displacement (T-R): (a) Test 2; (b) Test 7; (c) Test 11; (d) Test 12.
Applsci 16 01659 g007aApplsci 16 01659 g007b
Figure 8. Response acceleration (Top of the transformer): (a) Test 2; (b) Test 7; (c) Test 11; (d) Test 12.
Applsci 16 01659 g008aApplsci 16 01659 g008b
Figure 9. Response acceleration (Top of the high bushing): (a) Test 2; (b) Test 7; (c) Test 11; (d) Test 12.
Applsci 16 01659 g009aApplsci 16 01659 g009b
Figure 10. Response acceleration (Top of the oil tank): (a) Test 2; (b) Test 7; (c) Test 11; (d) Test 12.
Applsci 16 01659 g010aApplsci 16 01659 g010b
Figure 11. Response acceleration (Top of the rear radiator): (a) Test 2; (b) Test 7; (c) Test 11; (d) Test 12.
Applsci 16 01659 g011aApplsci 16 01659 g011b
Figure 12. Test Response Spectrum (Top of the transformer).
Applsci 16 01659 g012aApplsci 16 01659 g012bApplsci 16 01659 g012c
Figure 13. Test Response Spectrum (Top of the high bushing).
Applsci 16 01659 g013aApplsci 16 01659 g013b
Figure 14. Test Response Spectrum (Top of the oil tank).
Applsci 16 01659 g014aApplsci 16 01659 g014b
Figure 15. Test Response Spectrum (Top of the rear radiator).
Applsci 16 01659 g015aApplsci 16 01659 g015b
Figure 16. Leakage occurrence from the lower radiator pipe.
Applsci 16 01659 g016
Table 1. Measurement sensor information.
LocationDescriptionLocationDescription
Concrete slabA1Large bushing flange jointA12
0/4 height position of the transformerA2Large bushing middleA13
1/4 height position of the transformerA3Large bushing topA14
2/4 height position of the transformerA4Top of the front radiatorA15
3/4 height position of the transformerA5Top of the rear radiatorA16
4/4 height position of the transformerA6Top of OLTCA17
Angle joint under the oil tankA7Bottom of the transformerD1
Oil tank center sideA8Top of the transformerD2
Top of the oil tank A9Top of the high bushingD3
Small bushing middleA10Top of the oil tankD4
Small bushing topA11Top of the rear radiatorD5
Table 2. Shaking table characteristics.
Max. Loading60,000 kg
Table Size5.0 m × 5.0 m
Control Axes3 DOF (Translational 2 axes, Rotational 1 axes)
Max. DisplacementX-Axis = ±300 mm, Y-Axis = ±200 mm
Max. VelocityH = 1000 mm/s
Max. Acceleration at Full Payload± 1.0 g
Frequency Range(0.1~60) Hz
Excitation MechanismElectro-hydraulic Servo, 3 Variable Control
Control SoftwareMTS 469D
Table 3. Experiment program.
Test No.Return Period (Year)Ground Condition
1100S1
2100S2
3100S3
4100S4
5100S5
6200S1
7200S2
8200S3
9200S4
10200S5
11500S1
12500S2
Note: The ground condition categories (S1–S5) in Table 3 are defined as follows: S1 = Rock; S2 = Shallow stiff ground; S3 = Shallow soft ground; S4 = Deep stiff ground; S5 = Deep soft ground.
Table 4. Resonance frequency search test results (df = 0.125 Hz).
Test No.
(Direction)
Location1 (X)2 (Y)
Accelerometer
A20/4 height position of the transformer--
A31/4 height position of the transformer11.7509.750
A42/4 height position of the transformer11.7509.750
A53/4 height position of the transformer11.7509.750
A64/4 height position of the transformer11.7509.750
A7Angle joint under the conservator3.2505.625
A8Conservator center side3.2505.875
A9Top of the conservator3.2505.875
A10small bushing middle14.3759.750
A11small bushing Top14.3759.750
A12large bushing flange joint12.0009.750
A13large bushing middle12.0009.875
A14large bushing top12.0009.875
A15Top of the front radiator4.3759.750
A16Top of the rear radiator4.1259.750
A17Top of OLTC7.6258.375
Note 1 The above resonance frequency search test results were estimated by calculating the transfer function of the acceleration measured at each position of the transformer under the input load with a certain frequency component of the shaking table. Note 2 Resonance frequencies were identified by peak picking from the calculated transfer functions.
Table 5. Maximum relative displacement according to location for each experiment.
LocationT–B *1T–O *2T–R *3
Test No. X (mm)Y (mm)X (mm)Y (mm)X (mm)Y (mm)
18.353.633.314.049.651.79
213.524.314.164.5812.202.05
316.765.525.947.2014.912.00
413.605.423.884.6713.951.99
514.436.234.154.5815.811.97
612.365.134.855.2712.191.74
716.766.085.155.6914.921.90
819.257.176.237.9918.892.04
917.306.905.836.0917.532.37
1018.028.805.145.9720.332.25
1115.306.416.206.6917.122.50
1219.678.677.538.2920.662.17
*1 T–B: Top of the Transformer (D2)–Top of the high Bushing (D3); *2 T–O: Top of the Transformer (D2)–Top of the Oil Tank (D4); *3 T–R: Top of the Transformer (D2)–Top of the Rear Radiator Top (D5).
Table 6. Maximum response acceleration according to location for each experiment.
LocationTransformerBushingOil TankRadiator
Test No. X (g)Y (g)X (g)Y (g)X (g)Y (g)X (g)Y (g)
10.44730.37891.90721.73390.57520.58260.95160.2084
20.64250.43902.29532.22600.89340.64551.40270.2672
30.59820.64693.39462.81950.93220.76441.47120.3137
40.64870.45562.10332.17721.24260.76631.31500.2907
50.93590.57552.29601.80231.58710.86401.73620.3398
60.56850.43022.76142.48661.16270.84101.18920.2827
70.99800.52633.10372.73941.45961.13801.55020.3888
81.02220.61513.47223.59791.58641.28912.10850.3893
90.85180.49252.78352.52441.84961.17051.62050.4453
100.81390.53232.69842.60921.65521.50812.11720.5391
111.00050.56863.59603.02771.91171.64161.60420.3688
121.18990.67293.98683.61691.82581.75181.98460.5848
Disclaimer/Publisher’s Note: The statements, opinions and data contained in all publications are solely those of the individual author(s) and contributor(s) and not of MDPI and/or the editor(s). MDPI and/or the editor(s) disclaim responsibility for any injury to people or property resulting from any ideas, methods, instructions or products referred to in the content.