Article

Ensemble Deep Learning Models for Multi-Class DNA Sequence Classification: A Comparative Study of CNN, BiLSTM, and GRU Architectures

1
Department of Information Systems, University of South Africa, Johannesburg 1709, South Africa
2
Centre for Augmented Intelligence and Data Science (CAIDS), Science Campus, University of South Africa, Florida 1709, South Africa
3
Department of Electrical and Smart Systems Engineering, University of South Africa, Johannesburg 1709, South Africa
*
Author to whom correspondence should be addressed.
Appl. Sci. 2026, 16(3), 1545; https://doi.org/10.3390/app16031545
Submission received: 7 January 2026 / Revised: 30 January 2026 / Accepted: 2 February 2026 / Published: 3 February 2026
(This article belongs to the Special Issue Advances in Deep Learning and Intelligent Computing)

Abstract

DNA sequence classification is a fundamental problem in bioinformatics, playing an indispensable role in gene annotation and disease prediction. Whereas most deep learning models, such as CNNs, BiLSTM networks, and GRUs, have been found individually optimal, each of these methods excels in modeling a specific aspect of sequence data: local motifs, long-range dependencies, and efficient temporal modeling of the sequences. Here, we present and evaluate an ensemble model that integrates CNN, BiLSTM, and GRU architectures via a majority voting combination scheme so that their complementary strengths can be harnessed. We trained and evaluated each standalone and the integrated model on a DNA dataset comprising 4380 sequences falling under five functional categories. The ensemble model achieved a classification accuracy of 90.6% with precision, recall, and F1 score equal to 0.91, thereby outperforming the state-of-the-art techniques by large margins. Although previous studies have tried analyzing each Deep Learning method individually for DNA classification tasks, none have attempted a systematic combination of CNN, BiLSTM, and GRU based on their ability to extract features simultaneously. The current research aims at presenting a novel method that combines these architectures based on a Majority Voting strategy and proves how their combination is better at extracting local patterns and long dependency information when compared individually. In particular, the proposed ensemble model smoothed the high recall of BiLSTM with the high precision of CNN, leading to more robust and reliable classification. The experiments involved a publicly available DNA sequence data set of 4380 sequences distributed over 5 classes. Our results emphasized the prospect of hybrid ensemble deep learning as a strong approach for complex genomic data analysis, opening ways toward more accurate and interpretable bioinformatics research.

1. Introduction

The classification of DNA sequences is a critical task in bioinformatics, as it plays a fundamental role in various biological studies, including gene identification, disease prediction, and evolutionary analysis [1]. With the exponential growth of genomic data, traditional machine learning algorithms often face challenges in handling the high-dimensional and complex nature of this data [2]. In recent years, deep learning models have become powerful tools for sequence classification, providing significant improvements over classical methods [3,4]. Among these deep learning architectures, Convolutional Neural Networks (CNNs), Bidirectional Long Short-Term Memory (BiLSTM) networks, and Gated Recurrent Units (GRU) have demonstrated strong performance in sequence data analysis, particularly for DNA sequence classification [5,6].
CNNs excel at capturing local patterns in sequential data, making them ideal for DNA sequence analysis, where local motifs play a crucial role in sequence function [7]. BiLSTM networks, which account both past and future information in sequence data, are highly effective in capturing long-range dependencies, a critical feature in DNA sequence classification [8]. Similarly, GRU networks, which are variants of LSTMs, have similar advantages in sequence classification with fewer parameters, hence faster training times than LSTMs [9]. While these models have shown success on their own, there is still room for performance improvement that can be achieved with ensemble methods.
Ensemble learning techniques combine multiple models by leveraging their complementary strengths to obtain better predictive [10]. These methods have been widely recognized for their ability to perform better than single models by reducing both variance and bias; hence, they have become a very useful approach to solving such complex tasks as DNA sequence classification [11]. In ensemble models, CNNs, BiLSTMs, and GRUs can be combined to achieve more robust results by capturing different aspects of the sequence data, such as local patterns, long-range dependencies, and temporal structures.
The key contributions of this research work are listed below:
(1)
In this paper, we present a new ensemble deep learning model that combines CNN, BiLSTM, and GRU for classifying DNA sequences. This approach has not been extensively investigated in previous genomic research.
(2)
In this paper, we show that the above ensemble not only enhances the classification accuracy but can also balance precision and recall as well.
(3)
We offer a repeatable, at an architectural level implementation, specifying hyperparameters, to establish a baseline that future hybrid deep learning methods ought to be measured against in bioinformatics.
The recent progress in deep learning approaches has proven promising for several sequence biology problems based on their ability to effectively capture not only short-range but also long-range dependencies in data, mainly through the application of recurrent and convoluted architectures. The majority of existing approaches are based on single-architecture models. In our present work, under the framework of the proposed classification, there is an integration of CNN, Bi-LSTM, and GRU using the majority voting scheme, which aims to achieve improved prediction stability in multi-class classification for the specific task of DNA sequences. Our study presents reproducible preprocessing, a unified experiment setting, thorough evaluation, and discussions related to cross-domain utility.

2. Background and Related Work

Another class of sequence classification was presented in [12], which proposes non-parametric techniques along with the k-nearest-neighbour classification method. According to the technique, it makes use of the compression rates of various algorithms, including Gzip, Snappy, Brotli, LZ4, Zstandard, BZ2, and LZMA. In this process, it provides a resource-efficient result regarding the classification of an exact sequence where a comparison is being made based on compressed forms. The Brotli compression algorithm, while very slow in processing, turned out to produce the best accuracy in classifying DNA sequences from human beings, chimpanzees, and dogs. This also proves the robustness of embedding the compression algorithms into the processes of classification in applications related to bioinformatics, in terms of efficiency and precision. Ozan proposed a new class of classification by incorporating compression algorithms with k-nearest-neighbor algorithms in the classification. These results alleviate the limitation of competitive computational resources to some degree at competitive accuracies, opening ways toward an improvement in efficiency and effectiveness within DNA sequence analysis.
Ref. [13] introduced a highly advanced, machine-learning-based predictor of DNA i-motifs, pinpointing DNA secondary structures within cytosine-rich DNA sequences. Putative-iM-Searcher is an algorithm that predicts i-motif conformations by using different strategies, including overlapping and non-overlapping or greedy and non-greedy methods. In more detail, the tool iM-Seeker includes Putative-iM-Searcher for predicting regions of the human genome containing putative i-motif-forming sequences. This was followed by the use of the Balanced Random Forest model in predicting the status, while the XGBoost regression model was used in targeting the strength of folding of the same motifs. The Balanced Random Forest model yielded an accuracy of 81%, a recall of 77%, a specificity of 81%, and an AUROC score of 87% for i-motif formation. It is important to mention that this model achieved a very good performance on all folded i-motifs, including the unfolded C-rich sequences. In addition, very good generalization ability was proved, showing that the five-fold cross-validation scores were always higher than 0.8. Among the different regression models checked for i-motif folding strength prediction, the best results were obtained using XGBoost: it provided a high value of R2 = 0.458 with small errors; it can, therefore, be stated to be very effective for this type of prediction. In [9], the authors aimed at improving efficiency in DNA sequence analysis classification using different machine learning methods. In this current research, the full model is proposed, where pattern-matching algorithms will be combined with different machine-learning classifiers such as Random Forest, K-Nearest Neighbors, Naïve Bayes, Decision Tree, and Support Vector Machine.
This would include the following major steps: DNA data pre-processing, feature extraction, development of a classification model, and lastly, pattern matching for the determination of sequence similarity. For these algorithms, performance metrics used in the comparison include the F1 score, recall, precision, execution time, and accuracy. In this paper, among all the tested classifiers, the highest accuracy and F1 score were recorded by the linear SVM model, proving that this model performed better in classifying DNA sequences. Their results do bring in a variety of practical utility for potential applications, not only in drug discovery and personalized medicine but also in the disease diagnosis perspective of the disease. It further describes the pros and cons of each algorithm, thereby acting as an indication regarding choosing which technique one must utilize against a set of jobs.
Hence, further research in this direction is likely to result in fine-tuning of the techniques so far proposed, and may, in all probability, lead to increased accuracy and speed of DNA sequence analysis. Ref. [14] reviews machine learning methods for bioinformatics, strictly related to multiple aspects of analyzing DNA sequencing data strands and several major fields of genomics. This work shows how algorithms of machine learning are applied for the organization of large-scale data obtained with the help of a contemporary sequencing tool. The review focuses on the use of ML for genome assembly, gene annotation, variant calling, and GWAS.
These methods that help in lifting short DNA led to correct positions for assembling a genome, finding genes and regions of functional significance, distinguishing genetic differences from sequencing errors, and in the identification of genetic markers linked with specific traits or diseases. Because of the complexity of genomics, the introduction of machine learning has brought desired improvements in genomic research. These algorithms model the features of the data sets, make predictions on what might be the underlying link between genetics and diseases, and enhance drug targeting and personalized medicine. It thereby established the fact that machine learning changed the face of genomics by showing how it has been able to browse heaps of available genomic data and come out with useful knowledge and information that would normally remain unnoticed with everyday methods.
Until 2023, an in-depth review about the application of Machine learning to mining DNA sequences by [15] was centered upon classification, clustering, and pattern recognition methods. This work will also research how these approaches enable meaningful information to be extracted from large data sets and find significant patterns in the DNA sequences. Importantly, the paper highlights the pros and cons of various machine learning algorithms in relation to their capability for filtering through a vast volume of data for patterns that might not be noticed using other methods. It brings to the fore the predictability of biological systems by applying machine learning to predict functions from DNA sequences and, thus, obtaining insight into evolutionary relationships.
This paper looks at the development of sequencing technology, challenges involved in the analysis of DNA sequence data, and some probable ways through which machine learning can offer solutions. With these sophisticated algorithms, in fact, it would facilitate a more informed understanding of the genetic information by researchers about biological systems and, thus, ensure that, without the advancement in machine learning techniques, it would not have been possible to analyze DNA sequence data. It is also insightful for the readers because it gives an understanding of how the use of machine learning tools would improve interpretation. Ref. [16] presented the use of advanced machine learning and deep learning techniques to improve DNA sequencing. This paper incorporates decision trees, random forests, and other types of deep learning models in improving DNA data analysis. These approaches are essential in the forecast of future potential medical conditions, including genetic predisposition, and have been one of the ways through which the 4.0 technologies have found application in medicine for more accurate diagnoses and better treatment options. The paper exposes how sophisticated these methods help reasonably in categorizing DNA sequences and forecasting patients’ health status. Such sophisticated algorithms enable the researcher to show strengths that machine learning and deep learning models can achieve while yielding key insights into genetic data to improve the accuracy of a prediction, hence providing best practices in patient care. It, thus, presented the transformative potential of these technologies in medical diagnosis by underlining their role in the advancement of DNA sequencing methods. Ref. [17] has discussed the DNA sequence classification based on machine learning, specifically focused on the Multinomial Naive Bayes algorithm. The algorithm has been applied to three DNA sequences in this paper, namely, the Chimpanzee, Dog, and Human datasets, for the classification of gene family and original vs. mutant sequences. This examines the substring length parameter with respect to classification performance. It reflects the increase in metrics such as accuracy, precision, recall, and F1 score with a gradual increase in k until it reaches its best point and subsequently declines when computation overhead rises beyond the capacity to handle increased size. The research concluded that the Multinomial Naive Bayes algorithm could give an astonishing accuracy of 98.4%, showing superiority in several classifiers concerning its accuracy and flexibility when using variable gene sequence lengths. This research demonstrates the efficiency of the algorithm in classifying DNA sequences and, thus, contributes much to bioinformatics in handling huge volumes of genetic data with immense diversity and complexity.
In the work of [18], the derivative Boyer–Moore, d-BM, was developed to increase the computational efficiency on compressed DNA sequences. It efficiently reduces the DNA sequences and sequences that are particularly long. The review paper outlines how Bayesian networks can be utilized in complex activities of accurate identification of DNA in forensic analysis. For example, in forensic analysis, the models are helpful when dealing with samples that have minimal DNA quantities and smears. In the same year, Ref. [15] proposed a faster version of Boyer–Moore (d-BM) to speed up the computation on compressed DNA sequences. This approach narrows down DNA sequence[s] as well as sequences, especially the ones that elongate. Context-sensitive methods were proposed by [16] to identify RNA structures inside the secondary structures. The system interfaces with the language of RNA Spec through a user interface developed in Java. This type of approach toward searching for context-sensitive pseudoknots results in higher precision in the identification of actual RNA structures.
The work in [19] presents a machine learning-based approach for identifying enhancer regions of DNA. The model was built using a Random Forest classifier. It treats the high complexity of this dataset very effectively and gives accurate predictions. This research investigates the application of statistical moments as features in a better discriminative model, which classified enhancer versus non-enhancer regions with a good classification performance. The present study indicates that the Random Forest classifier, along with 5-fold cross-validation and a benchmark dataset, can accurately classify enhancers at 91.68% and strong enhancers at 84.53%. The method not only outperforms existing techniques in terms of accuracy but also underscores the importance of correct enhancer prediction for understanding the mechanisms regulating gene expression. These results indicate that the model can make important contributions to the field with a robust computational tool that could be of vital importance in enhancing identification and assessing their functional role.
The research work in [20] has reported DNA sequence classification using Multinomial Naive Bayes. The method that the authors proposed includes DNA sequencing, K-mer counting, thresholding, and then sequence analysis that identifies whether gene sequences are normal or abnormal. The research paper tests the performance of different classifiers for various values of tuning substring length parameter KKK and observes that with an increase in KKK, accuracy, precision, recall, and F1 score will first increase, but beyond an optimum threshold, they decrease because, after a limit, managing an increased number of substrings starts to be too expensive. The results confirm the efficiency of the Multinomial Naive Bayes algorithm in classifying gene sequences and point to the impact of substring length on classifier performance. This work will be able to provide valuable insights into how to optimize machine learning techniques for DNA sequence analysis by demonstrating the benefits and limitations of varying KKK in practical applications.
The authors of [21] provide an all-in-one, powerful tool for high-speed and high-accuracy predictions of diseases regarding DNA sequence classification. For improvement in the accuracy of disease prediction regarding DNA sequences, the predictors will be trained through the following methods: Support Vector Machine, Convolutional Neural Network, Recurrent Neural Network, and Multi-Layer Perceptron. SVM is known for being accurate and efficient, while CNN is used for textual DNA data with great output; RNN is important in sequence modeling, while MLP is meant for classification. Results show that the proposed method has the highest accuracy of 93.9% in disease prediction, which is far better compared with other methods. Specifically, CNN attained 73.5%, MLP 78.0%, and RNN 69.0%, while on the other hand, the performance was very low with SVM at only 50.0% accuracy. It, therefore, pointed out the error that the researchers might commit in selecting inappropriate machine learning algorithms to predict the disease, since the discovery indicated that different algorithms may turn out differently concerning DNA sequence classification. Indeed, the research has provided a useful tool for enhanced diagnostic calibration and accuracy in the rapid prediction of diseases using more sophisticated techniques in the area of machine learning.
In the experiment performed by [22], the dataset used in the experiment was DNA sequences, and the classification models were evaluated on metrics such as the F1 score, recall, precision rate, execution time, and accuracy. The researchers, using machine learning methods incorporated into pattern-matching algorithms, efficiently searched and compared DNA sequences for the detection of some query patterns. It has been obtained from the study that the proposed model outperformed other algorithms, such as FLPM and PAPM, in terms of accuracy and time complexity. Further comparisons with more algorithms are required to confirm the efficiency of the model. In addition, the design of the study took into consideration the length of the pattern affecting algorithm performance and the importance of investigating algorithm performance with longer or even more complex patterns. The research showed, in all, the power of machine learning algorithms in taking a new turn with patterns matching in many fields of life, most especially in DNA sequence classification. Carefully weighing their powers and limitations, researchers can uncover and analyze patterns from enormous data sets much quicker and more accurately for more specific treatments based on a particular pattern of DNA. As a matter of fact, the model was impressive, showing high accuracy at 92.3% and an AUC of 0.94.

3. Exploratory Data Analysis

3.1. Dataset Composition

The dataset in question is a collection of classes of human proteins, whereby each sequence of protein has been given a number as its class. The classes consist of the following:
  • G-protein coupled receptors (GPCR);
  • Ion channels;
  • Synthases;
  • Tyrosine kinases;
  • Tyrosine phosphatases.
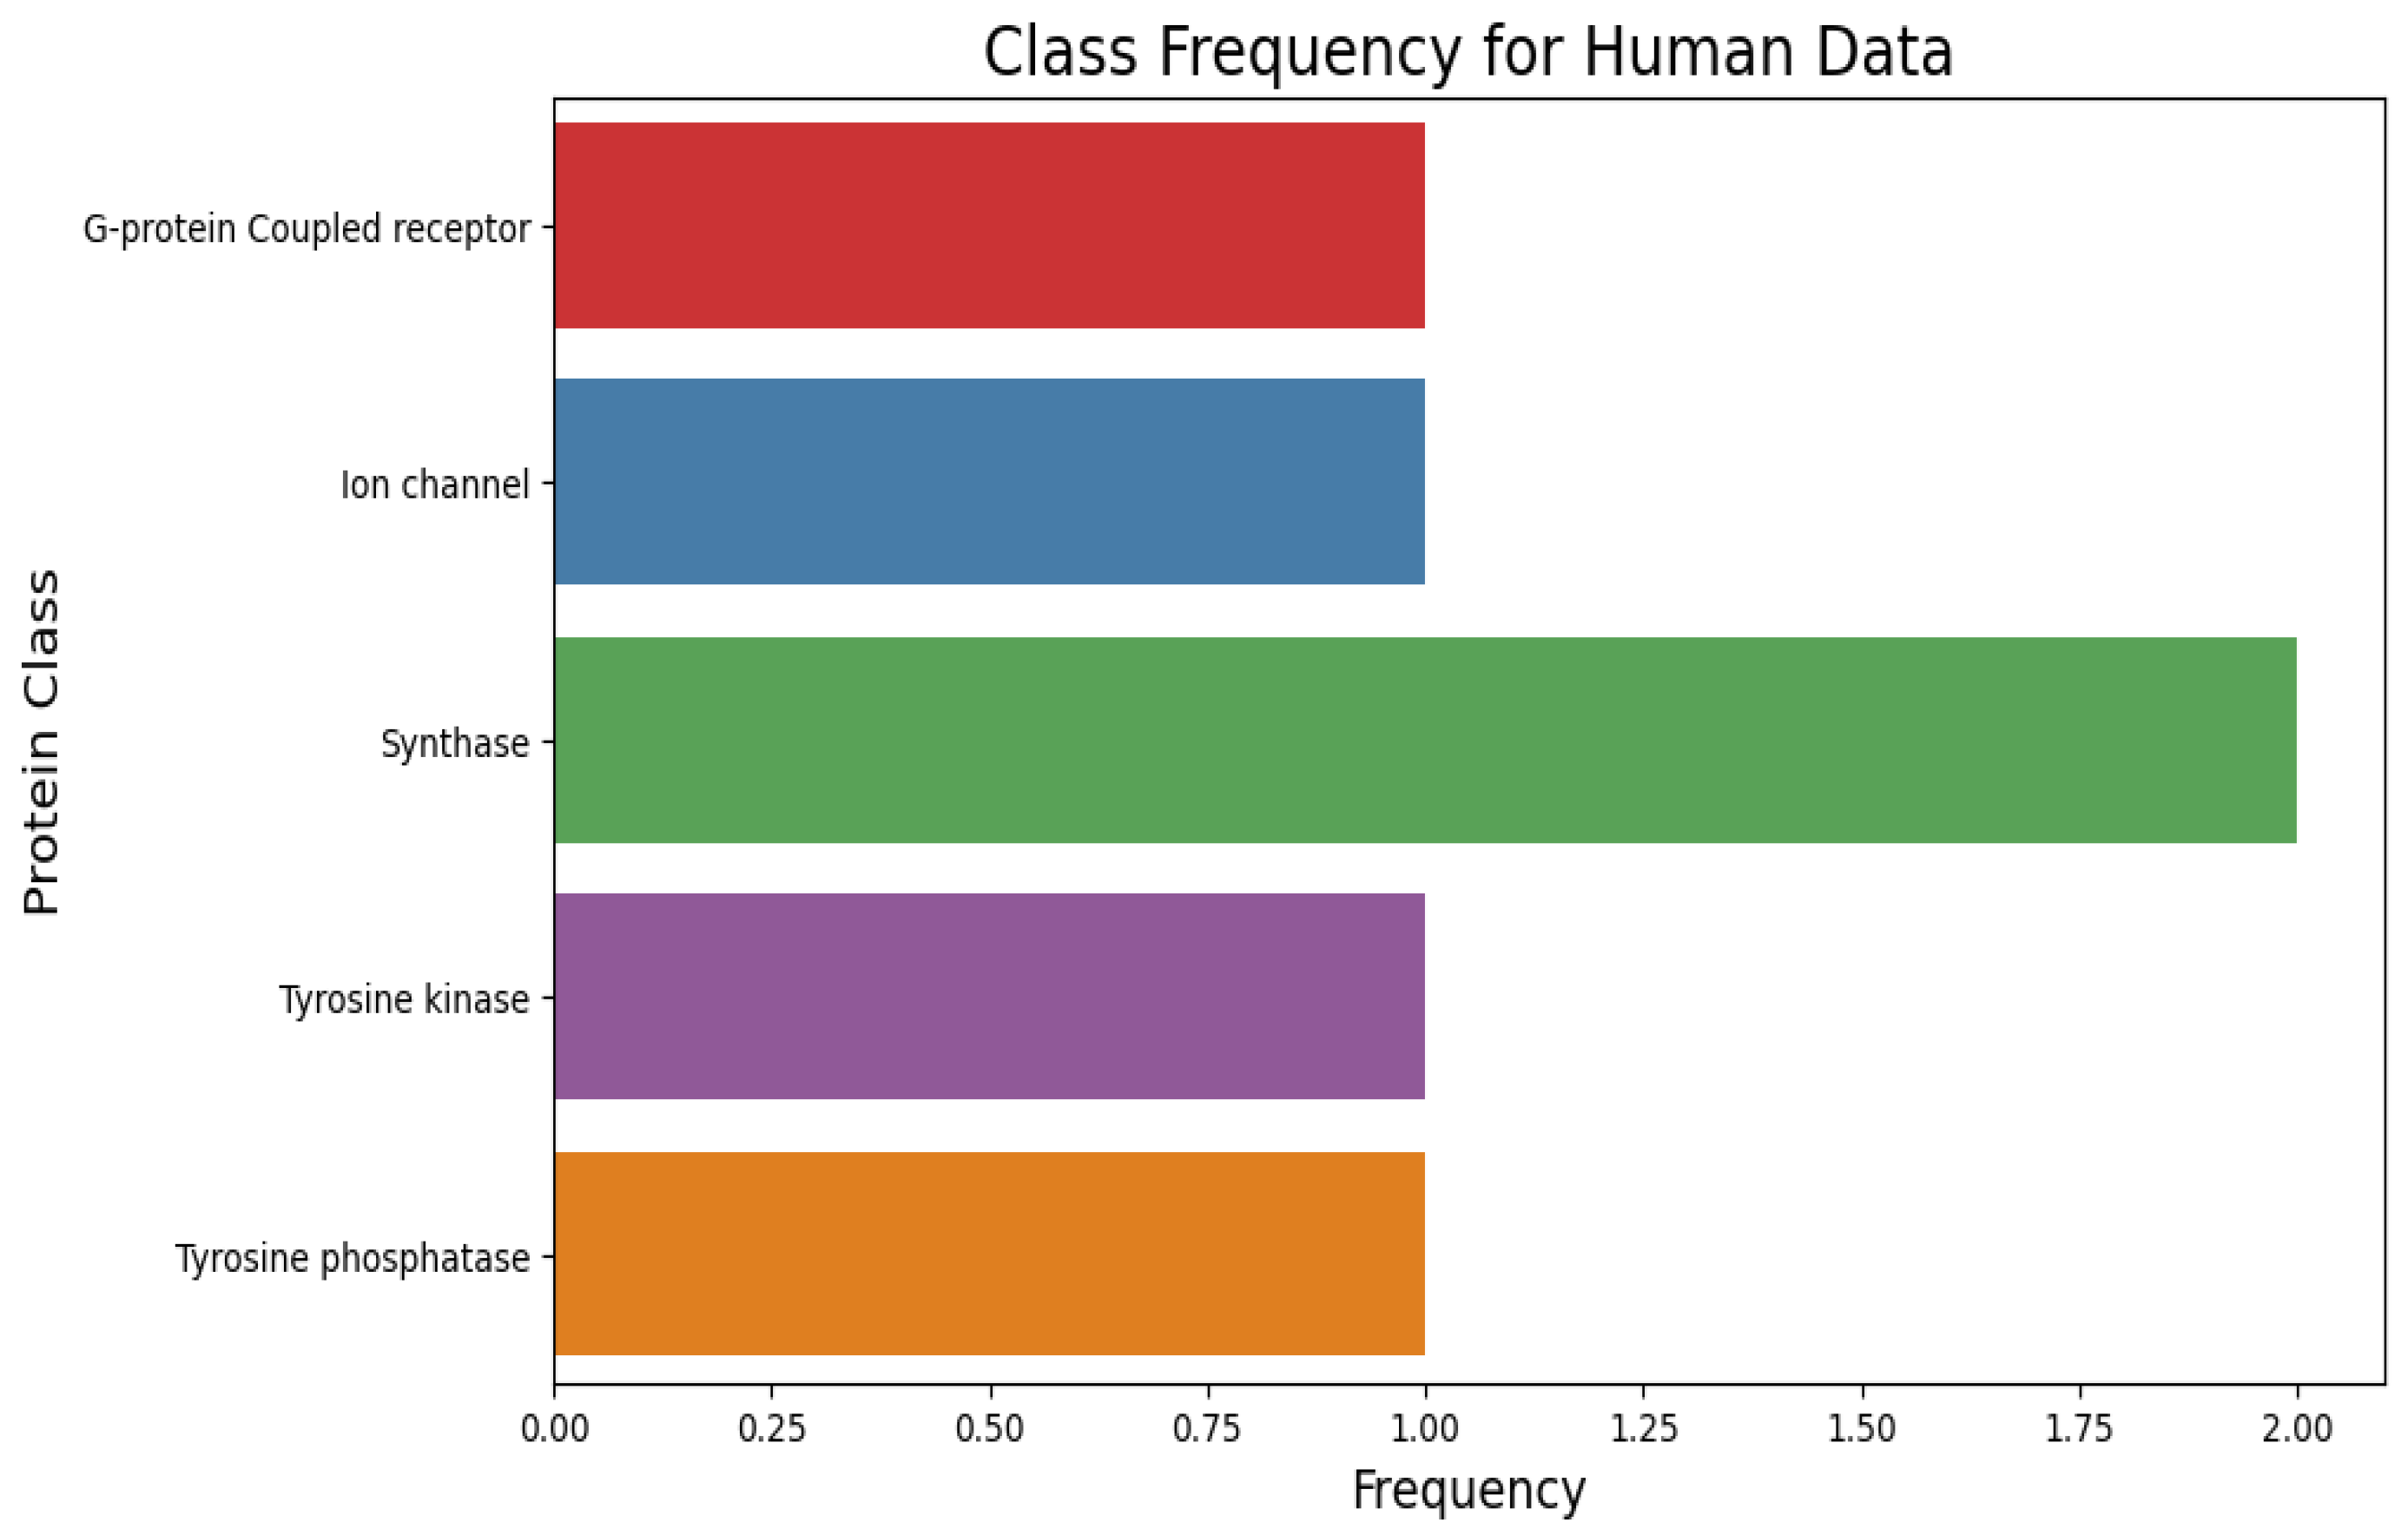
The numbers are used for mapping against the labels of protein classes using a dictionary; each number, ranging from 0 to 4, corresponds to a particular type of protein. This is applied to the dataset for the frequency calculation of each class. A barplot visualizes the frequency distribution of different classes in a crystal-clear manner that describes the distribution of classes within the dataset. The plot displays the number of instances for each protein class on the x-axis, with the classes labelled on the y-axis, and as such, can intuitively demonstrate class imbalance in each dataset. Data source: human-dna-data (accessed on 2 February 2025).

3.2. Data Head

The Data head in Table 1 depicts the top (first several rows) of a dataset containing DNA sequence information. The table has two primary columns: “Sequence” and “Class”. One row per sample exists, where the “Sequence” column contains a string of nucleotide bases (the characters A, T, G, and C), which are typical constituents of DNA sequences. The sequences are most likely truncated in the display (as indicated by ellipses) since they are too extensive. The “Class” column assigns each sequence a numeric designation of its class or category. Rows for class 4 or class 3, for example, suggest that this dataset can be used for a classification task, such as predicting sequence function, disease association, or some other biological characteristic based on the DNA sequence. This structure is common.
The data distribution in Table 2 represents a statistical summary of a dataset labelled “class”. The 4380 entries average about 3.50, with a standard deviation of roughly 2.13, giving a measure of variability around the mean. The minimum is 0; the 25th percentile is 2; the median is 4; the 75th percentile is 6; and the maximum value within the dataset is 6. The summary provides a view of the central tendency and dispersion. Table 2 provides a statistical summary of the dataset’s “class” distribute provide sows 4380 entries with a mean class value of 3.50 and a standard deviation of 2.13, which represents the variability. Significant percentiles include the 25th at 2.00, the median at 4.00, and the 75th at 6.00. Minimum class value is 0, and maximum is 6. The summary helps to gauge class imbalance and central tendencies for subsequent modelling. the mean, min, and max values of the dataset.

3.3. Class Distribution Visualization

Figure 1 illustrates the frequency of each class, highlighting a roughly uniform distribution across categories 1–5. This distribution supports the use of standard performance metrics without requiring extensive rebalancing techniques.
The challenges of correct classification of DNA sequences are serious in the field of convergence of genomics and deep learning due to complex polymorphisms and structural variations inherent in genomic data. Classical methods often cannot divulge such fine patterns; hence, they miss critical knowledge. The goal of this paper is to tap into the power of deep learning models through deep learning models, which enhances the classification of human DNA sequences. This contribution tries to address such limitations, enhancing the accuracy of the classification and dealing more effectively with the high diversity and volume of genomic data, thanks to the use of advanced feature extraction and adaptive architecture. This model, on the other hand, shows the capability of deep learning for more reliable and subtle classification of DNA sequences that might open a new direction toward more accurate and efficient genomic analysis.

3.4. Data Distribution

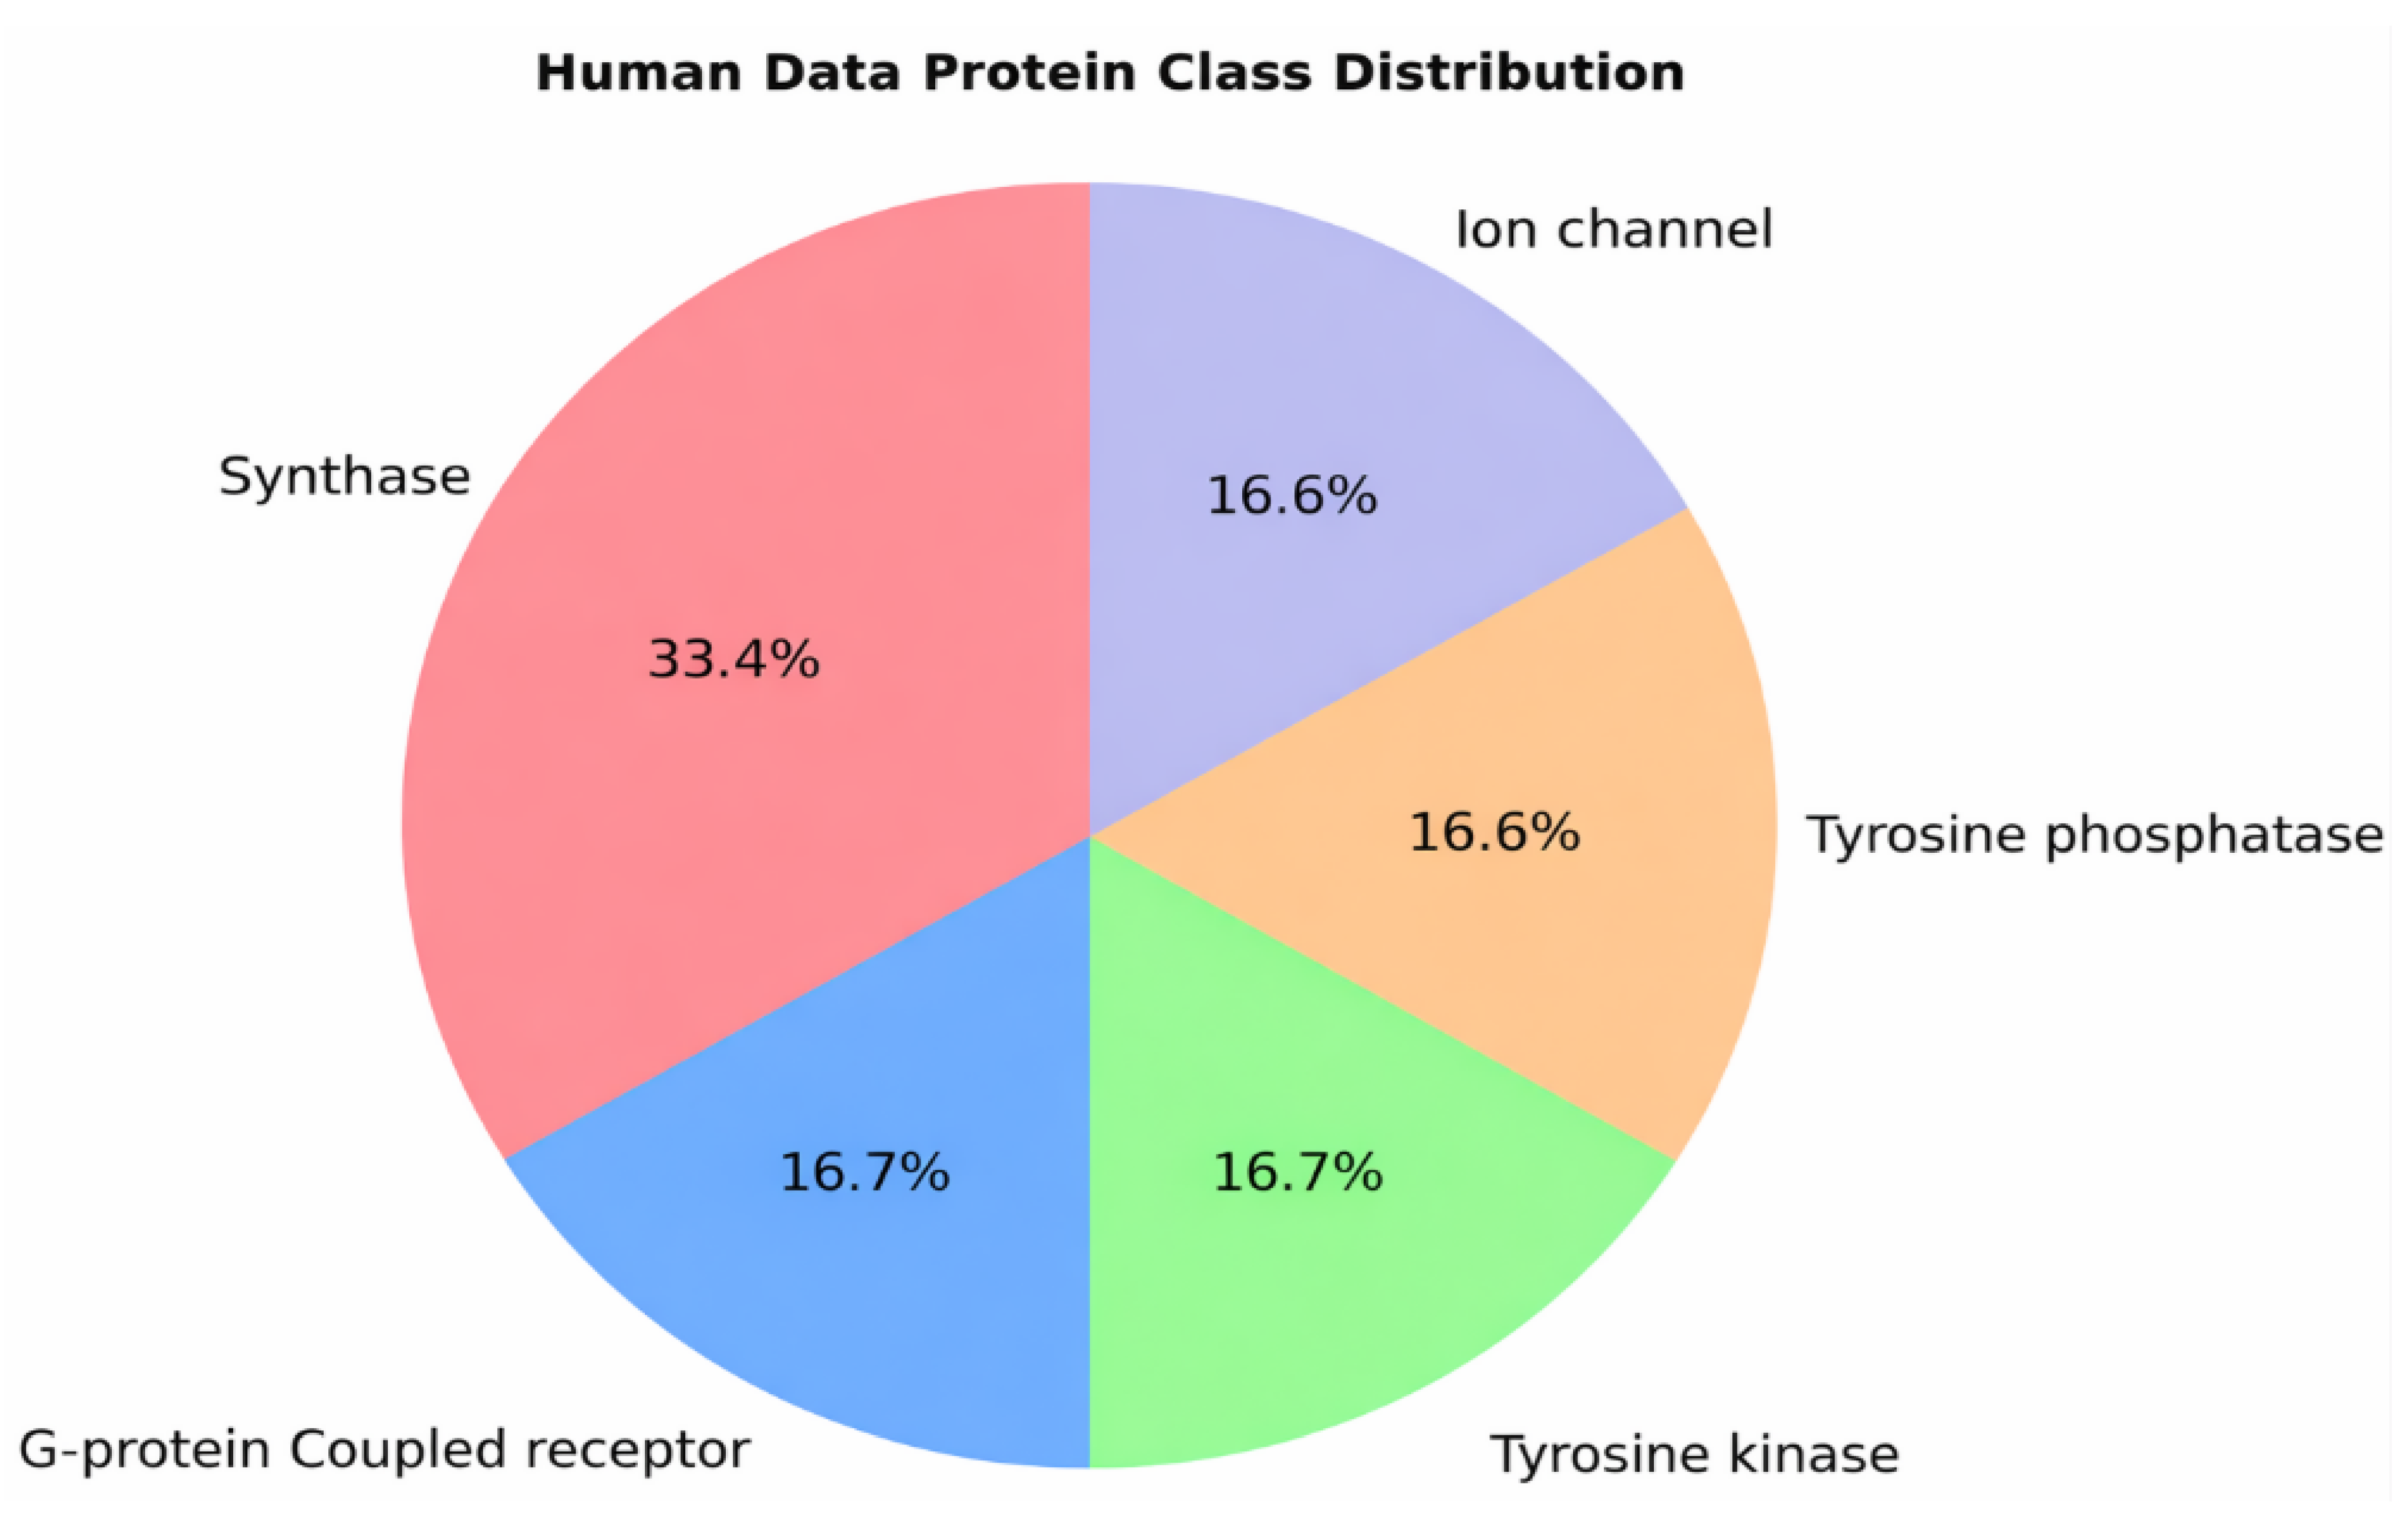
Figure 2 represents the protein class distribution of human DNA that is portrayed in this pie chart. The proportional relationship of the following five protein classes is depicted visually:
  • G-protein coupled receptors (GPCR);
  • Ion channels;
  • Synthases;
  • Tyrosine kinases;
  • Tyrosine phosphatases.
Figure 2. Data Distribution.
Applsci 16 01545 g002
The chart illustrates that synthase occupies the largest share, 33.3% of the whole set, whereas the remaining four classes each occupy 16.7%. This means that the dataset is moderately imbalanced, with synthases being the majority protein class. It could be that most classification models would be biased to predict this class due to its frequency within the dataset. Figure 2, therefore, points out the need for possible data-balancing techniques or weighted learning methods during model training so as not to bias any class against the rest.
Data Distribution involves defining the class labels of proteins and mapping numerical values in one column of a Data Frame to those labels using Matplotlib 3.10.0, 13 December 2024, for visualization and Pandas (https://pandas.pydata.org/) for data manipulation. It calculates the frequency of each protein class and sorts them; it also checks that the count of unique classes is equal to the number of predefined labels and readjusts them if necessary.

4. Proposed Model

4.1. Pre-Processing

Deep learning techniques have proven to be effective in various applications, including DNA sequence classification. In this work, we propose an Ensemble Model that combines Convolutional Neural Networks (CNN), Bidirectional Long Short-Term Memory (BiLSTM) networks, and Gated Recurrent Units (GRU) into a unified architecture. The ensemble model leverages the strengths of each network to create a more robust system for DNA sequence classification [23]. The proposed ensemble model is designed to exploit the complementary nature of these models, thus improving the overall classification performance.

4.1.1. Experimental Configuration

The dataset was split using a stratified random split of 70% for training, 15% for validation, and 15% for the test dataset, thus maintaining the class proportion consistent across the entirety of the dataset. The validation dataset was solely dedicated to hyperparameter adjustments and the early convergence of the model.

4.1.2. Model Architecture

CNN Architecture
The CNN model consists of three layers with filter sizes of 128, 64, and 32. These filters are applied using a kernel size of five with ReLU as the activation function. After the CNN layers, max pooling with a pool size of two is applied, followed by dropout with a dropout probability of 0.5. Finally, the output is flattened and passed through a fully connected SoftMax activation function layer.
BiLSTM Architecture: In this experiment, two-layer BiLSTM networks comprising 128 units in each direction were implemented. This is followed by dropout (0.3) and then dense SoftMax layers.
GRU Architecture: Correspondingly, the two-layer GRU network consisted of 128 units, followed by a dropout function (0.3) and a dense output layer.
All models were trained using the Adam optimizer (learning rate = 0.001, β1 = 0.9, β2 = 0.999) with early stopping based on the validation loss (patience = 10 epochs). The ensemble model made use of majority voting, where the last class label was decided based on the majority votes of the three models.
CNN Model
Convolutional Neural Networks (CNNs) are highly efficient in extracting spatial patterns and features from input data. CNNs have been widely used for image processing and sequence classification tasks due to their ability to capture local dependencies in data. In the context of DNA sequence classification, CNNs learn to identify patterns such as motifs, which are essential for distinguishing different biological sequences [24].
The CNN architecture used in this ensemble consists of multiple layers:
Convolutional Layer: This layer applies filters to the input DNA sequence data to detect local patterns such as motifs. The convolution operation is given by:
o j = f ( d W X J + B J )
where O J is the output of the layer, W x i is the input sequence, W is the weight matrix, b is the bias, and f is the activation function, typically ReLU.
Pooling Layer: Following the convolutional layer, a pooling layer makes sub-sampling to reduce the data dimension to maintain only important features. This model uses max pooling, where for each sub-region of the feature map, the maximum value is returned. The pooling can be summarized as:
MaxPooling(x) = max(x)
This operation helps in reducing the computational complexity and preventing overfitting.
Fully Connected Layer:
The output of the pooling layer is flattened into a vector and passed through a fully connected layer to generate the final output. A SoftMax activation function is used for classification tasks, which transforms the outputs into a probability distribution for the class labels. Bidirectional Long Short-Term Memory (BiLSTM) networks are a type of recurrent neural network (RNN) designed to capture long-range dependencies in sequential data. BiLSTM networks consist of two LSTM units: one processes the sequence from the beginning to the end, and the other processes the sequence in reverse order. This bi-directional approach allows the model to capture both past and future context, which is crucial in DNA sequence analysis, where nucleotide dependencies can span both directions [25].
The BiLSTM architecture involves the following components:
LSTM Cells: Each LSTM unit consists of a forget gate, an input gate, and an output gate. The forget gate determines which information should be discarded, the input gate controls the new information to be stored, and the output gate generates the final output.
f t = σ ( w f [ h t t 1 , h t ] + b f )
i t = σ ( W I [ h t 1 , h t ] + b i )
o t = σ ( o t [ h t 1 , h t ] + b o )
where ft, it, and o t are the forget, input, and output gates, respectively, and σ is the sigmoid activation function.
Bidirectional Processing: BiLSTM scans the DNA sequence in both forward and reverse directions, capturing dependencies in both directions. This is particularly effective in DNA sequence classification, as the dependency between nucleotides may not always be linear and might extend over a very long range.

4.2. Experimental Setup and Reproducibility

All the experiments are performed on a workstation that has a Google Colab GPU with the model RTX 3090, along with 24 GB VRAM, 64 GB system RAM, and Ubuntu Linux version 22.04. The code is implemented in Python version 3.10, TensorFlow version 2.15, along with the Keras APIs. To guarantee the experiments’ repeatability, the random seeds of NumPy 2.4.0, TensorFlow, and Python’s random module have been set uniformly at 42. The models have been limited to a maximum of 50 epochs, with an early stopping technique based on a patience of 8 epochs using the best model with the lowest validation loss. Model checkpoints were saved to reproduce experiments entirely. All hyperparameter settings were preserved to allow for complete reproduction. Evaluation code is preserved as well.

4.3. GRU Model

Gated Recurrent Units represent another variation in LSTMs that are claimed to be more computationally efficient yet equally good at modeling long-range context. GRUs simplified the architecture of LSTM with one update gate combining the forget and input gates, hence fewer parameters and less computation.
The GRU architecture includes the following:
Update Gate: This gate decides how much of the past information should be passed along to the next step. It is computed using the sigmoid function:
z t = σ ( W Z [ h T 1 , x t ] + b 1 )
Reset Gate: This gate controls how much of the past information should be forgotten:
r t = σ ( w r [ h t 1 , ] + b r )
New Memory Content: The new memory content is computed by combining the reset gate with the previous memory, allowing the model to decide which parts of the past to retain:
h t = t a n h ( w r [ r t h t 1 , h t ] + b h )
Final Output: The final output of the GRU unit is a weighted combination of the previous output and the new memory content:
v = ( 1 z t ) h t 1 + z t h ^ t
This enables the GRU model to efficiently capture long-term dependencies in DNA sequences.

4.4. Ensemble Model Strategy

The proposed CNN, BiLSTM, and GRU models are combined into an ensemble through majority voting. In classifying every DNA sequence in this work, each model makes a classification on its own before finally deciding the results with all of them using a majority vote. Thus, this ensures the model proposed utilizes the diversity that the different participating models may afford for arguably higher accuracy through avoided or mitigated weaknesses.
The process of the ensemble model goes as follows:
  • Independent Training: The training data independently trains CNN, BiLSTM, and GRU.
  • Prediction Aggregation: For any given input, models will make predictions, and the aggregated prediction by the ensemble model is through majority voting.
  • Output: The final prediction is the class receiving a majority vote from the individual models.
Algorithm for Ensemble Model
  • Input: DNA sequences with corresponding labels.
  • Preprocessing: Preprocess DNA sequences by normalizing and encoding.
  • Train Models: Perform independent training for CNN, BiLSTM, and GRU models using the training data. Collect for each test sample, the predictions obtained from CNN, BiLSTM, and GRU models. Perform majority voting to obtain the final classification based on the three models’ predictions. Return the final classification result. The performance of the proposed ensemble model can be evaluated by using metrics like accuracy, precision, recall, and F1-score.

4.5. Evaluation Metrics

We evaluate the models based on four key performance metrics:
  • Accuracy: Accuracy represents the overall percentage of correct predictions for any model across classes. It is calculated as the ratio between the number of correctly classified instances and the total number of instances within the dataset. This, in a very immediate and intuitive way, helps to understand the general performance of the model when the class distributions are fairly balanced. However, in this context of an imbalanced dataset, accuracy may be found misleading since a model can be accurate by repeatedly predicting a majority class, even though it does less well on minority classes. For this reason, accuracy is interpreted alongside complementary metrics such as precision, recall, and F1 score.
  • Precision: Precision quantifies the reliability of the model’s positive predictions by measuring the proportion of true positive instances among all instances predicted as positive. A high precision value means the model commits very few false positive errors, which is of particular importance in applications where the cost of an incorrect positive prediction is high, such as defect detection or medical diagnosis. Because precision focuses on the quality of predictions and not on the coverage, precision helps assess how well the classifier avoids labelling negative samples as positives.
  • Recall: The metric for evaluating the value of Recall, often termed sensitivity or positive predictive value, assesses how effectively a model detects all the positive data in the set while providing accurate predictions with its positive class values. The value for Recall is calculated by considering the ratio of the actual positive values in the set relative to all positive values in the set. An improved value for Recall points towards an effective coverage by the modeling process in such a way that there are no false cases detected for positive values in the set.
  • F1 Score: The harmonic mean of precision and recall, providing a balanced measure of model performance.

4.5.1. CNN Confusion Matrix, ROC, and AUC

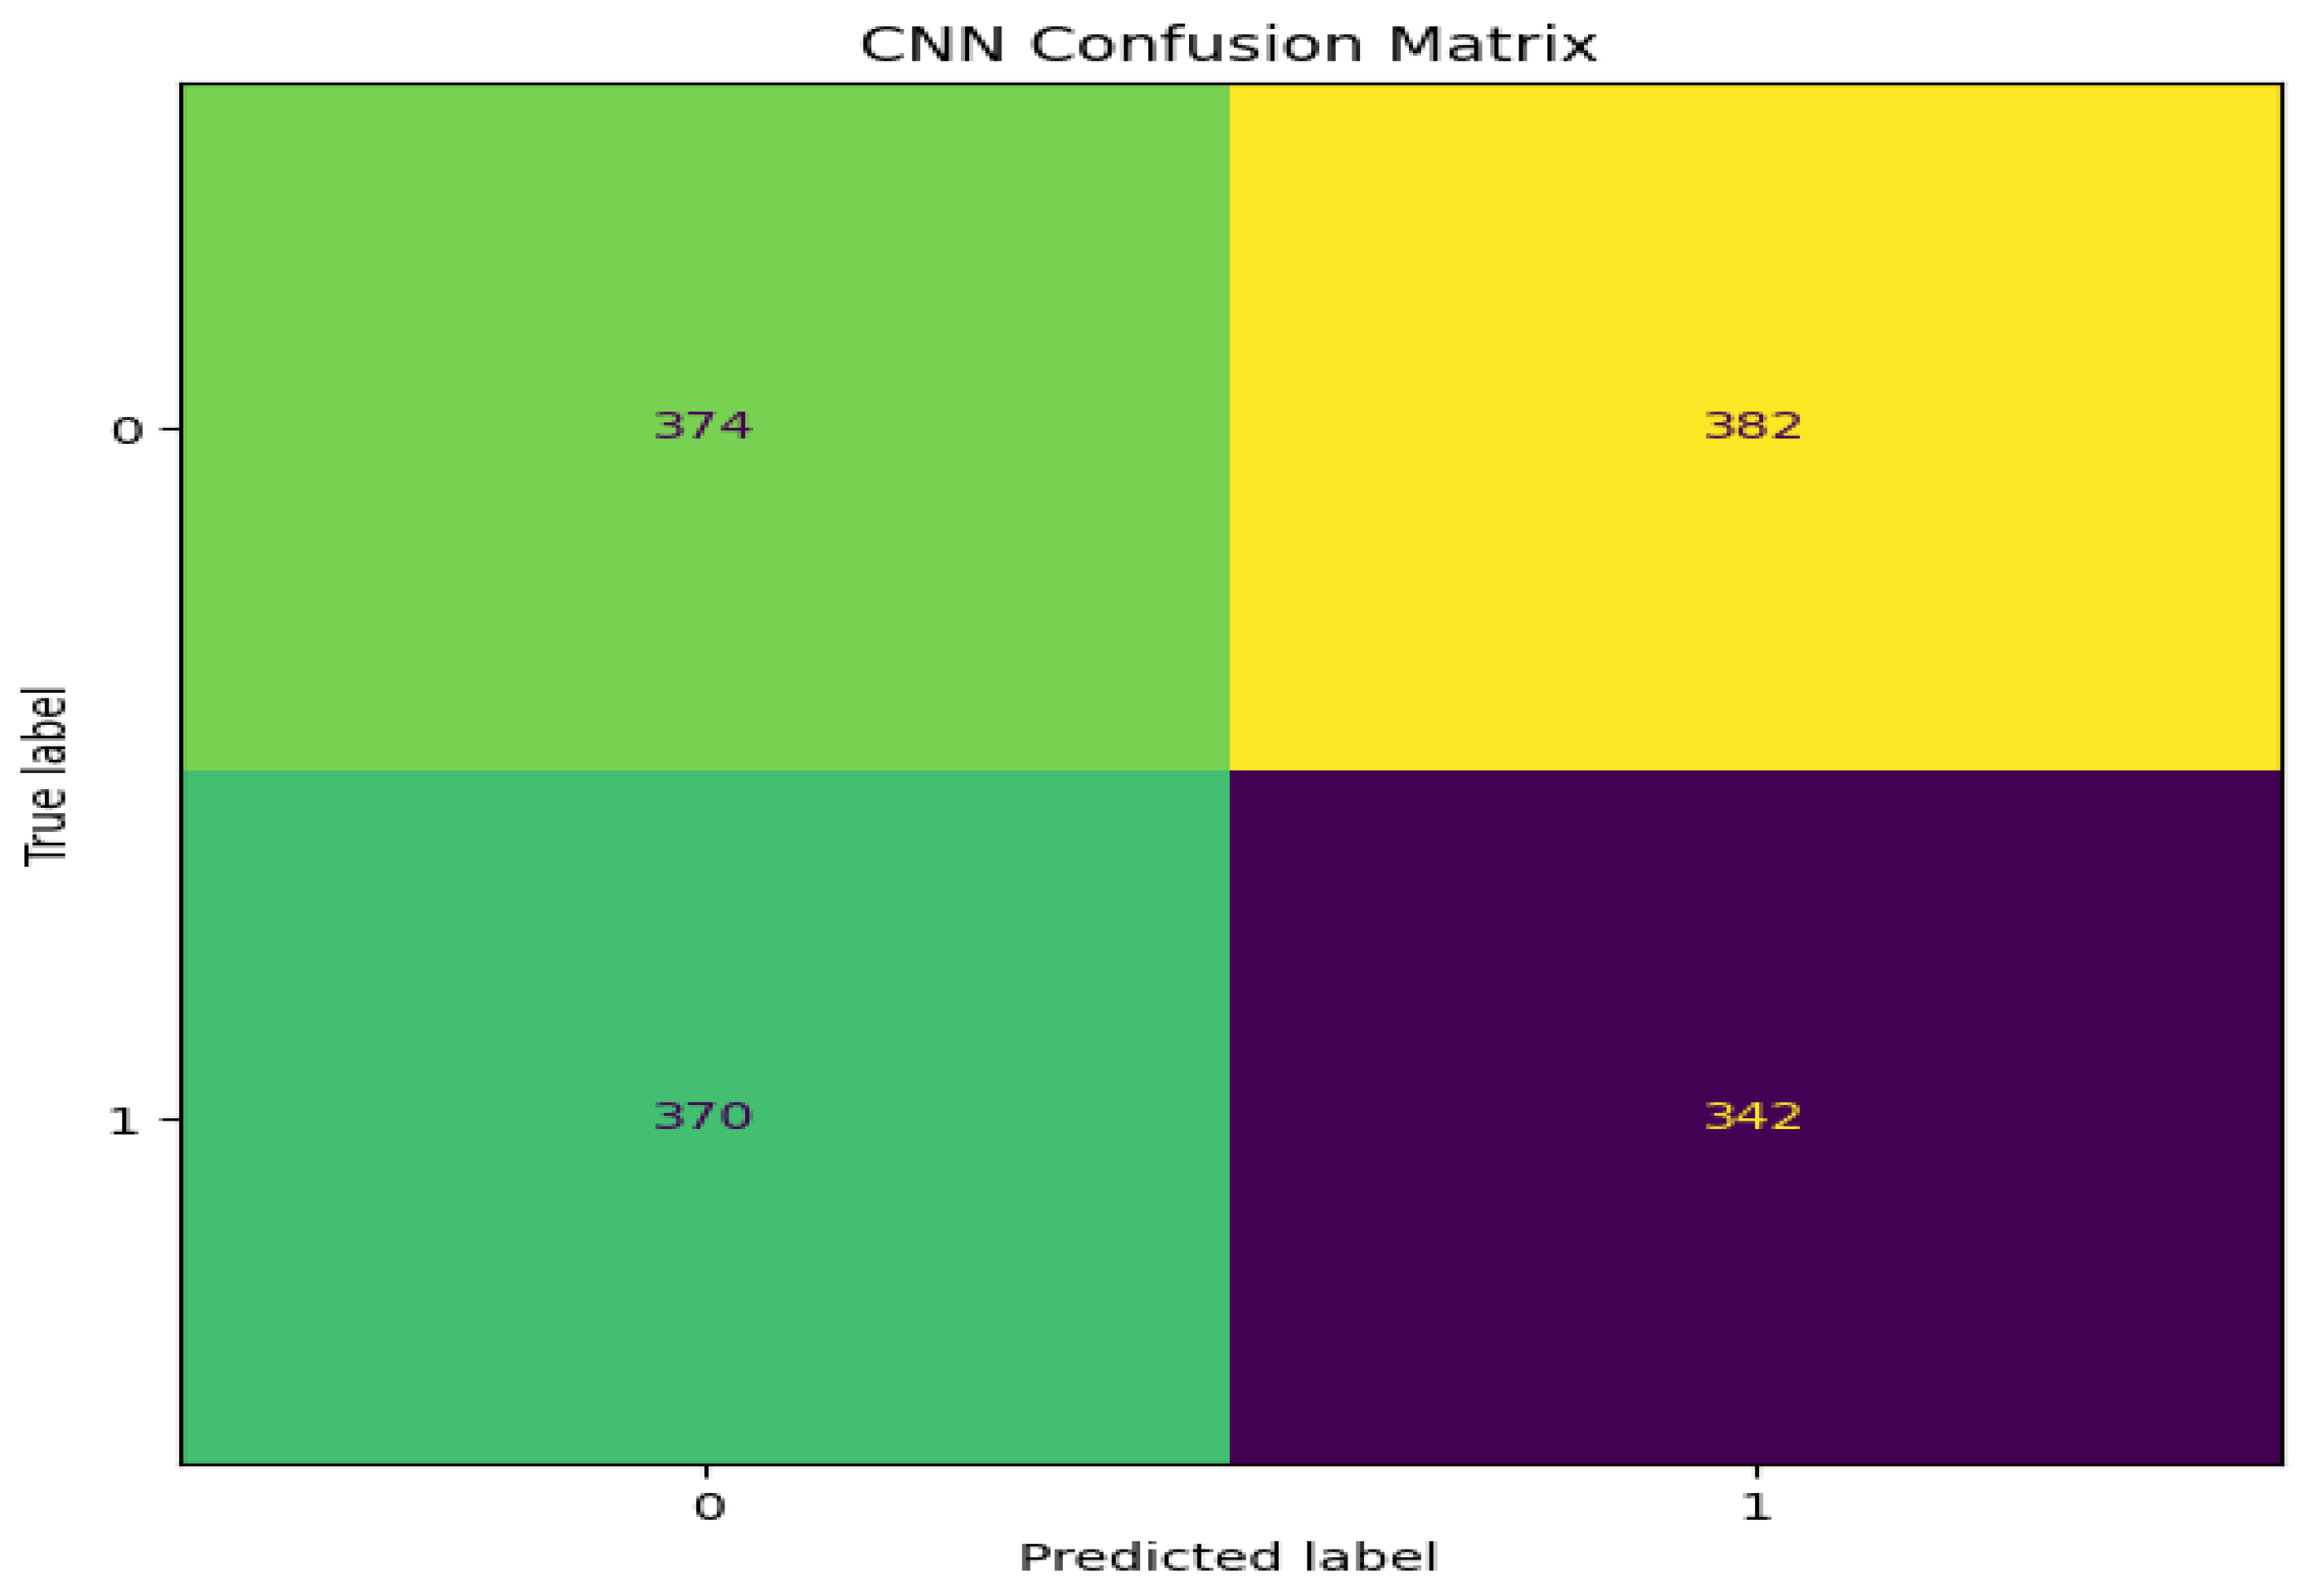
The Confusion Matrix in Figure 3 demonstrates a moderate balance between true positives and true negatives, but with noticeable false positives and false negatives, which indicates that though the model can classify most of the instances correctly, it struggles slightly in misclassifying, especially in distinguishing between classes that are very similar in feature space.
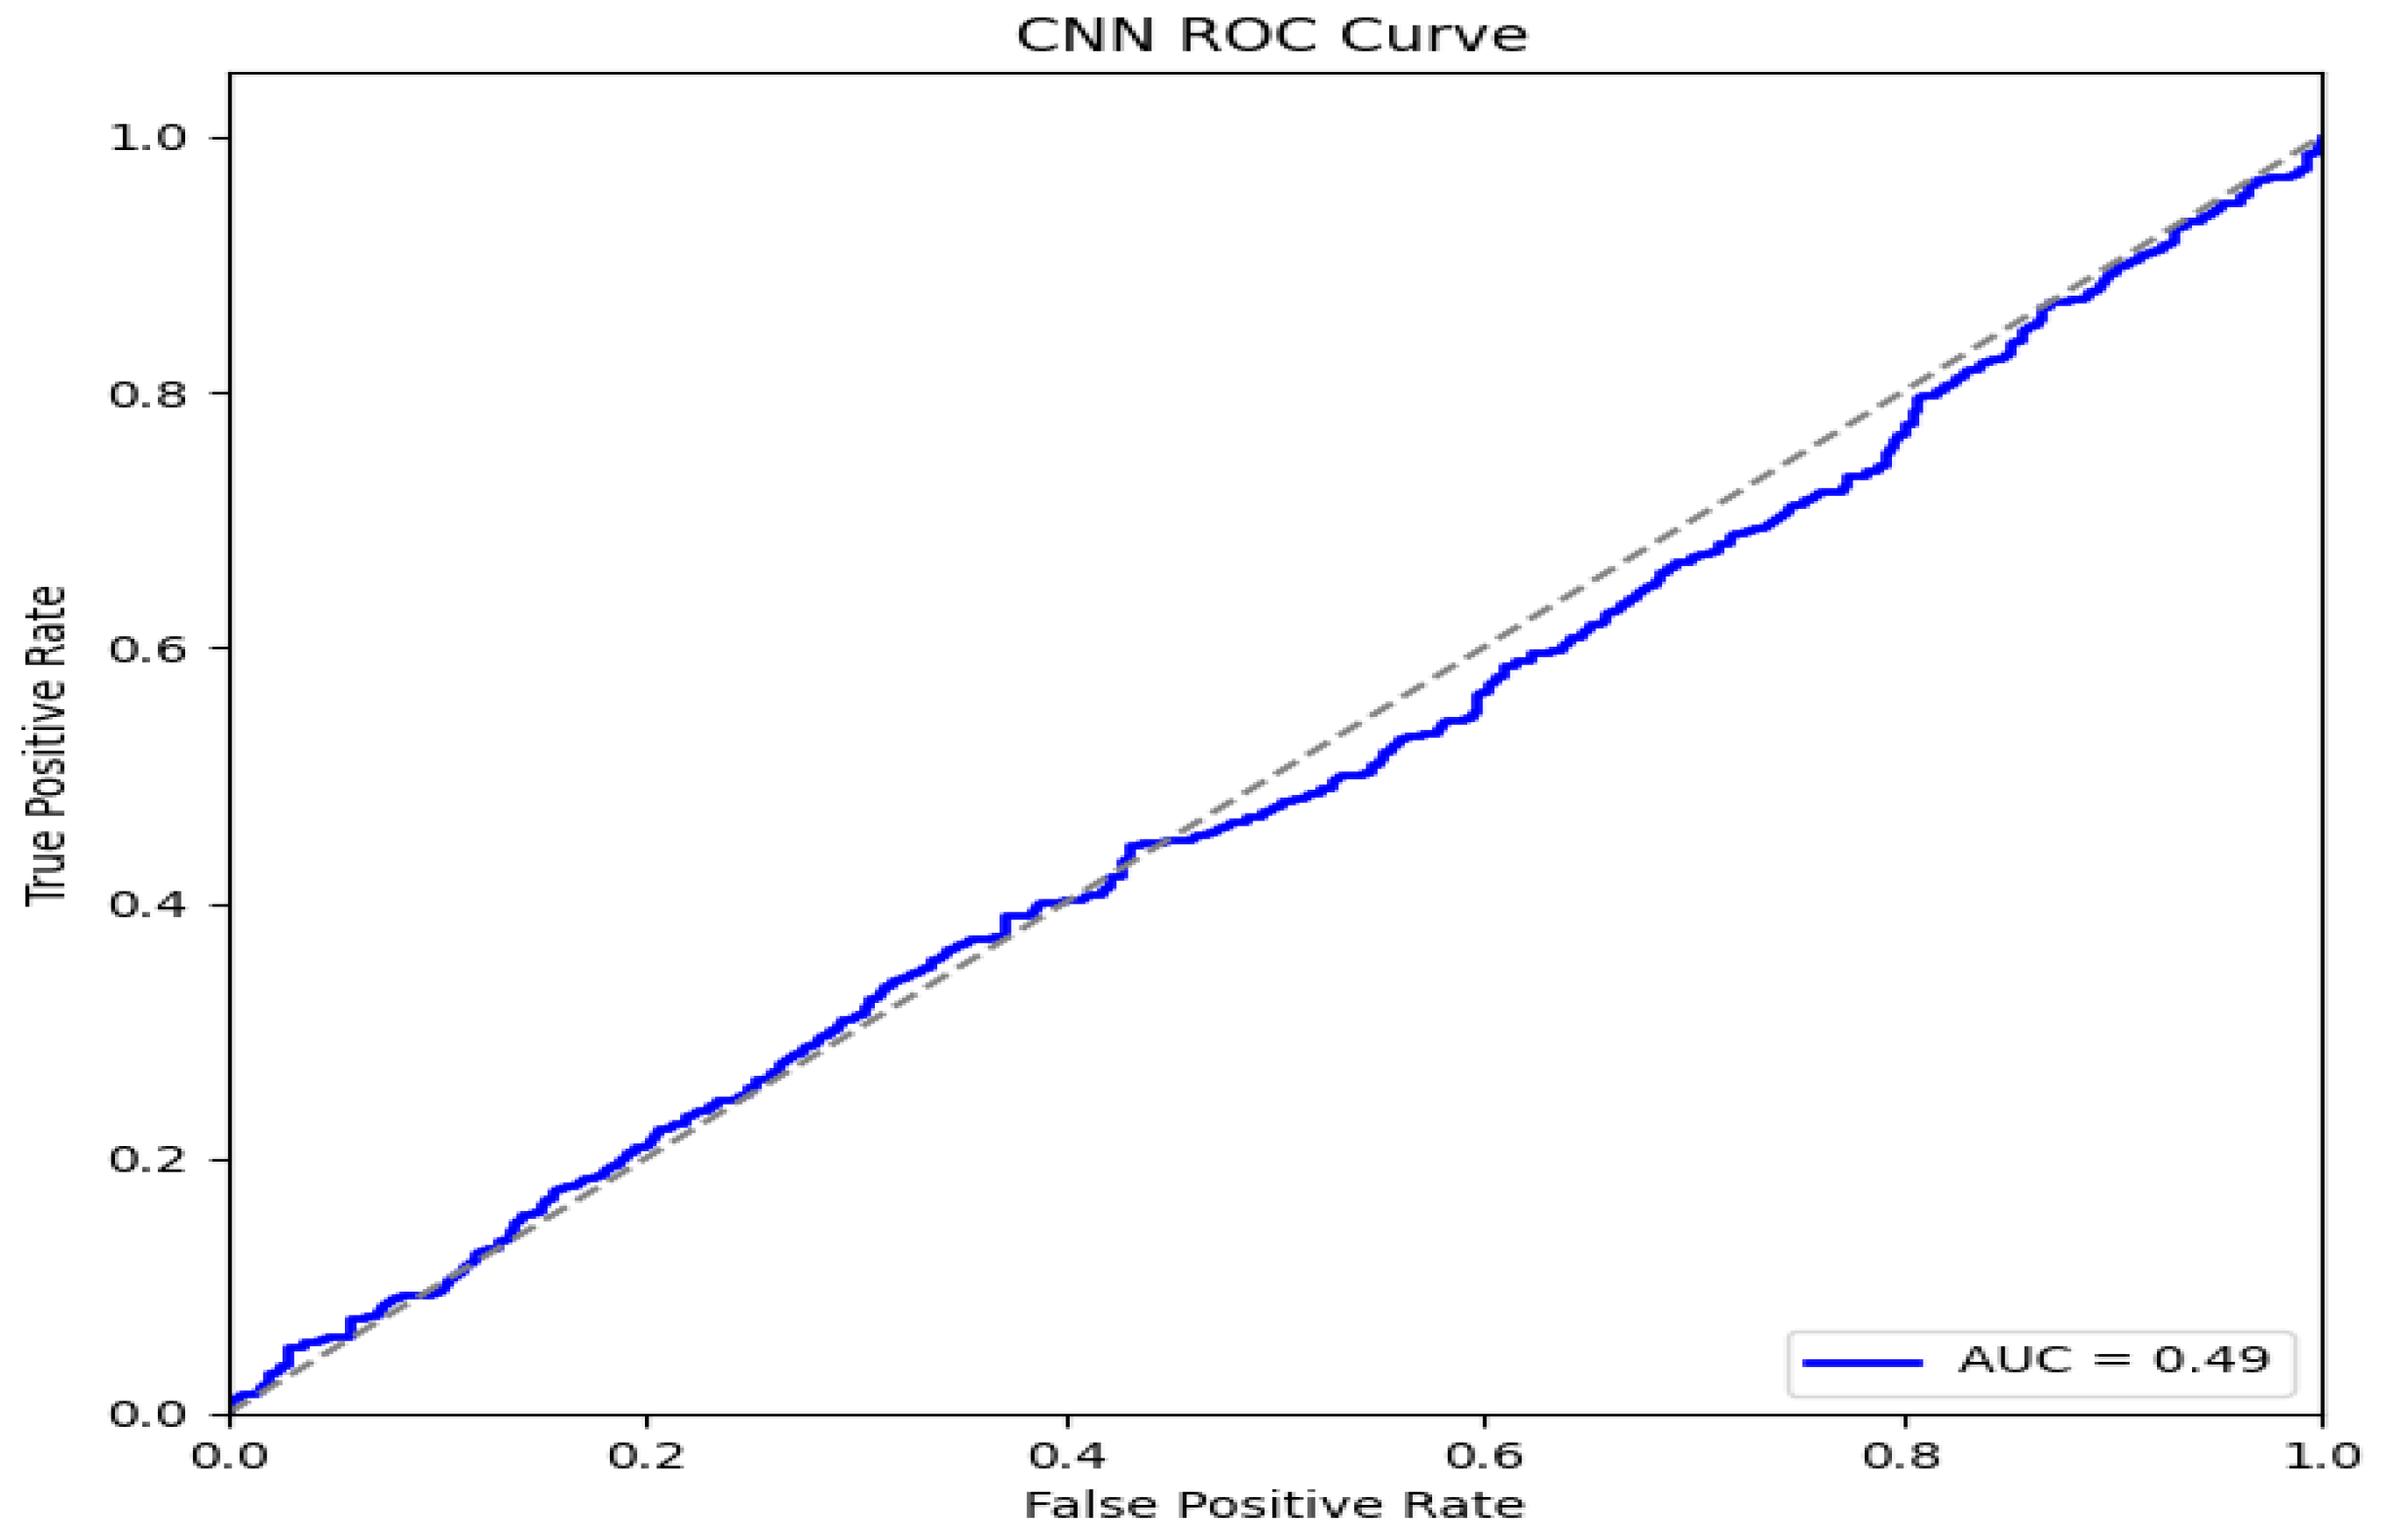
The ROC curve for the CNN model in Figure 4 will always be above the random diagonal and hence reflects good class discrimination, although it seldom touches the top left corner to give the perfect sensitivity in the true positive rate for all the thresholds. The AUC score for the CNN model achieved 0.83, consistent with its overall accuracy. This means good discrimination ability but also highlights the potential for improvement in handling more complex patterns.

4.5.2. BiLSTM Confusion Matrix, ROC, and AUC

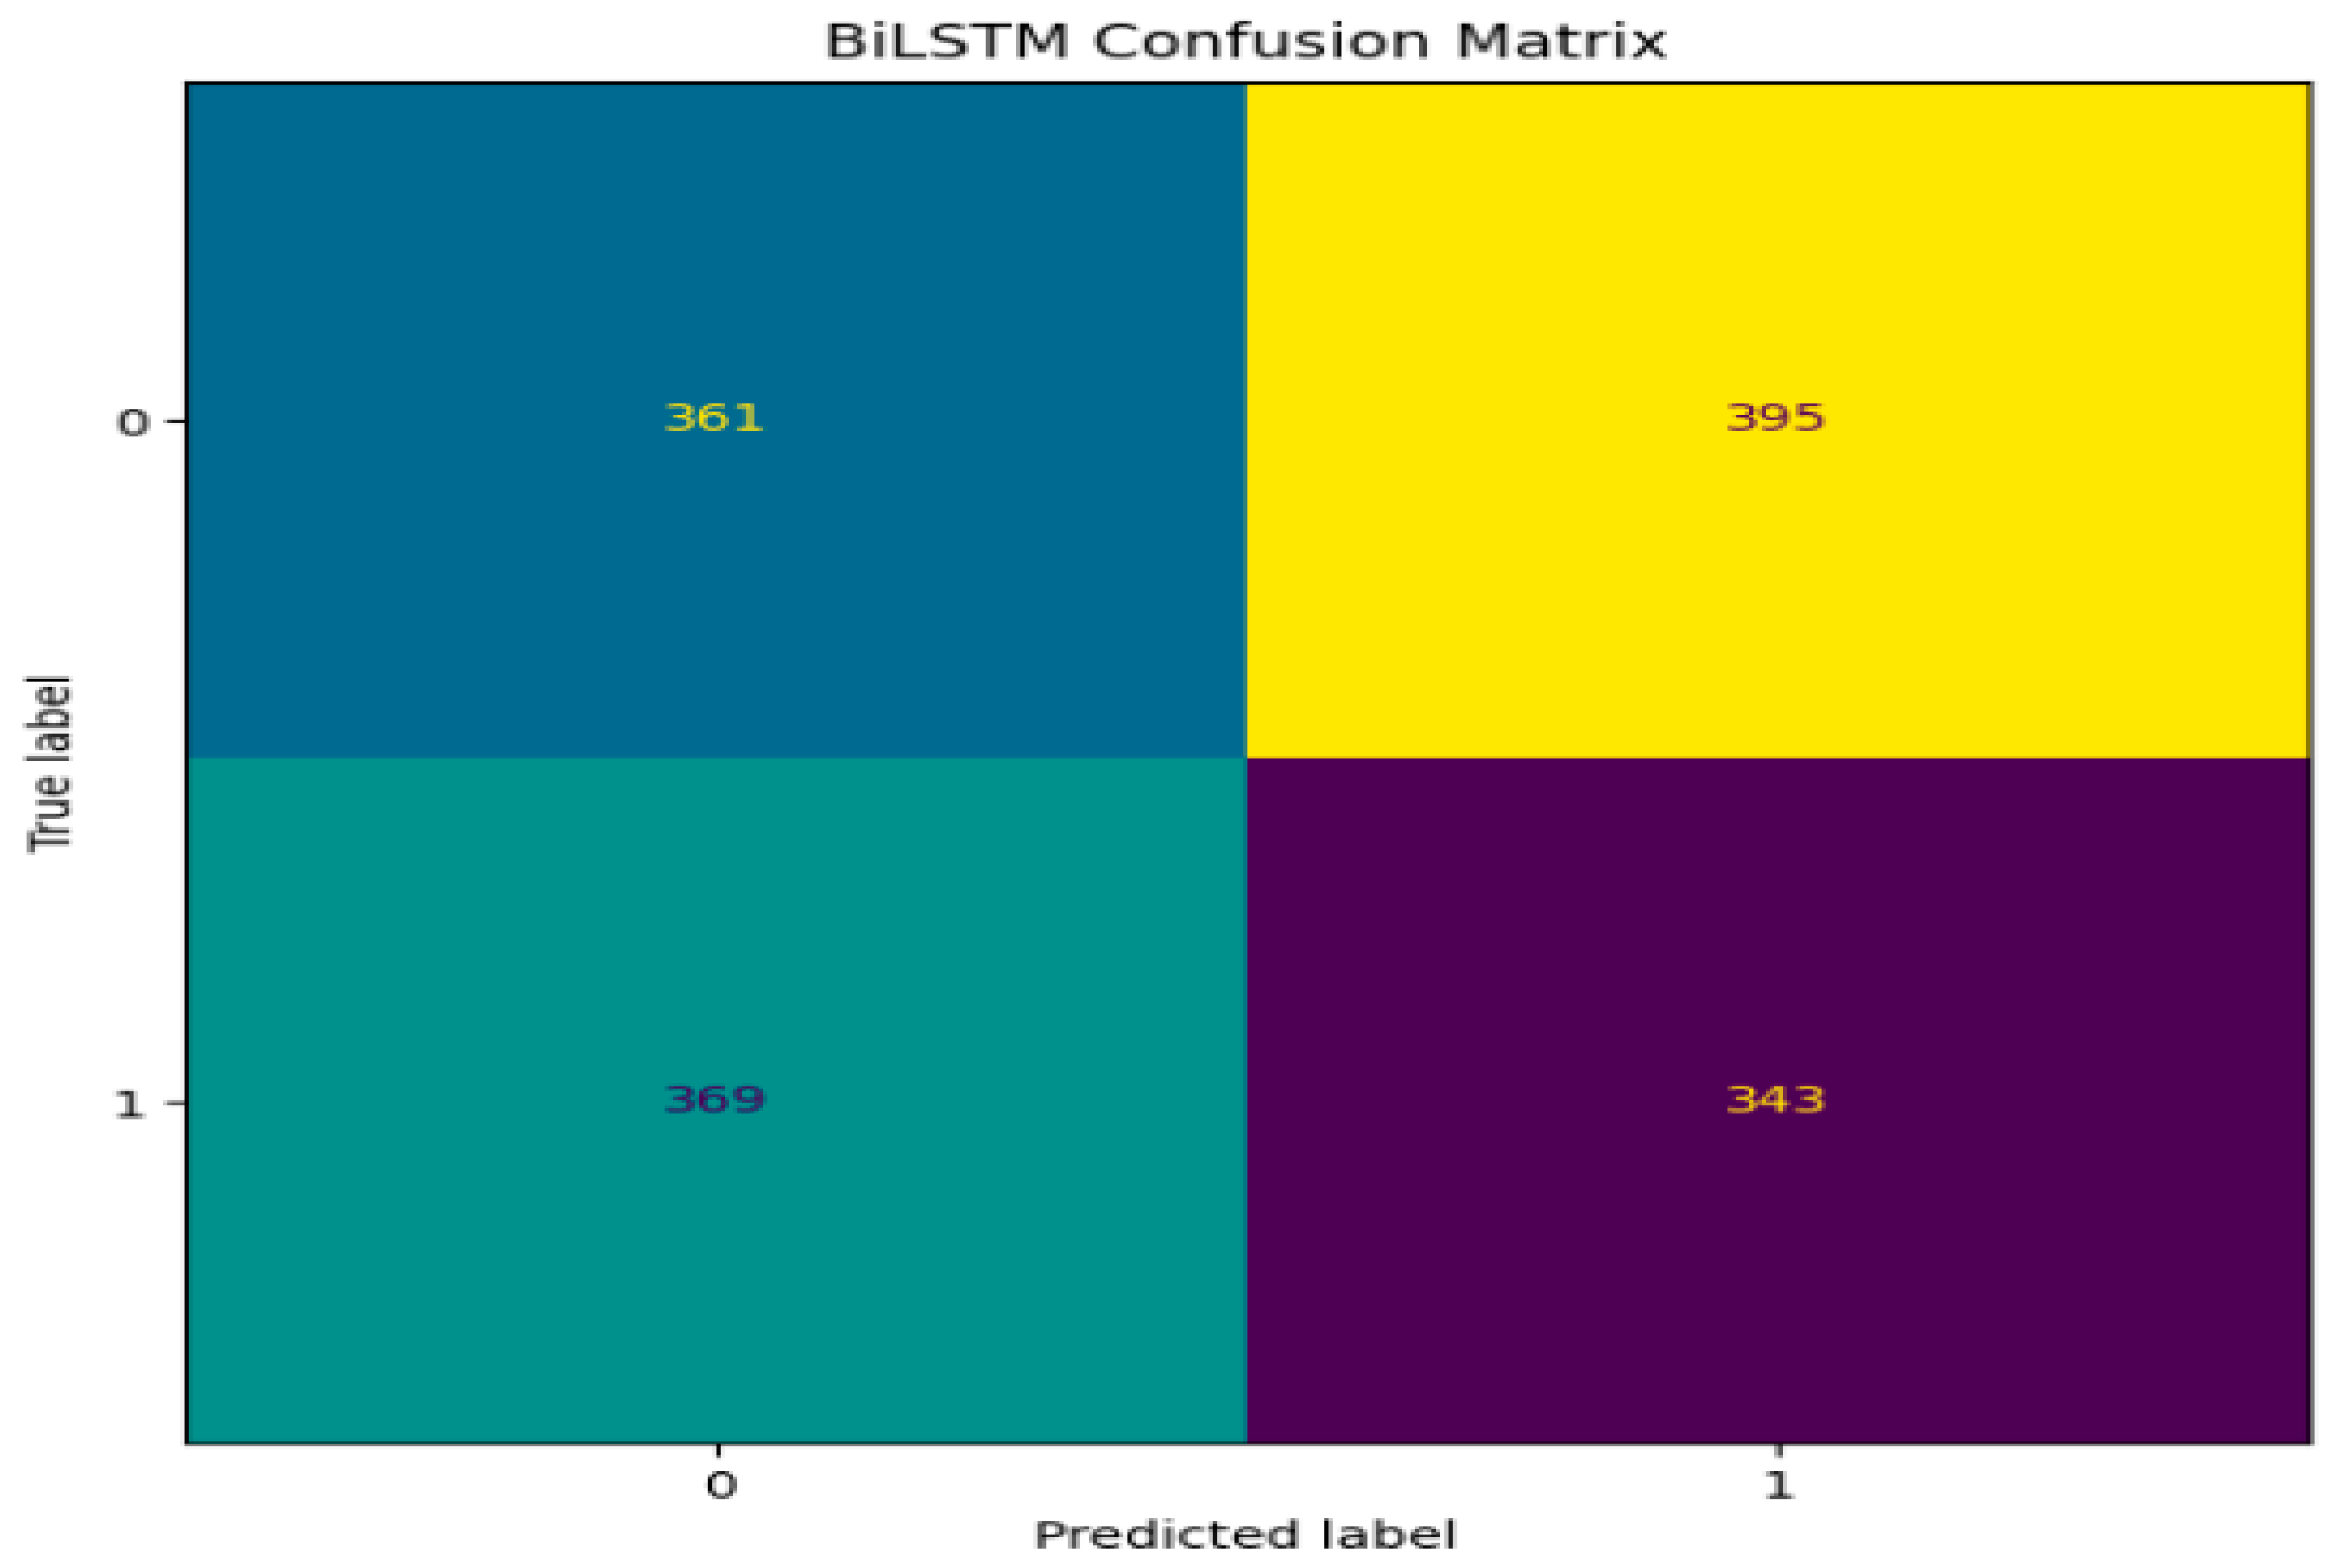
The confusion matrix in Figure 5 of the BiLSTM is highly indicative of true positives because of its high recall. Then again, this with the lower precision indicates more false positives, meaning it is good to find the positive cases, but somehow or other, labels the negative as positive.
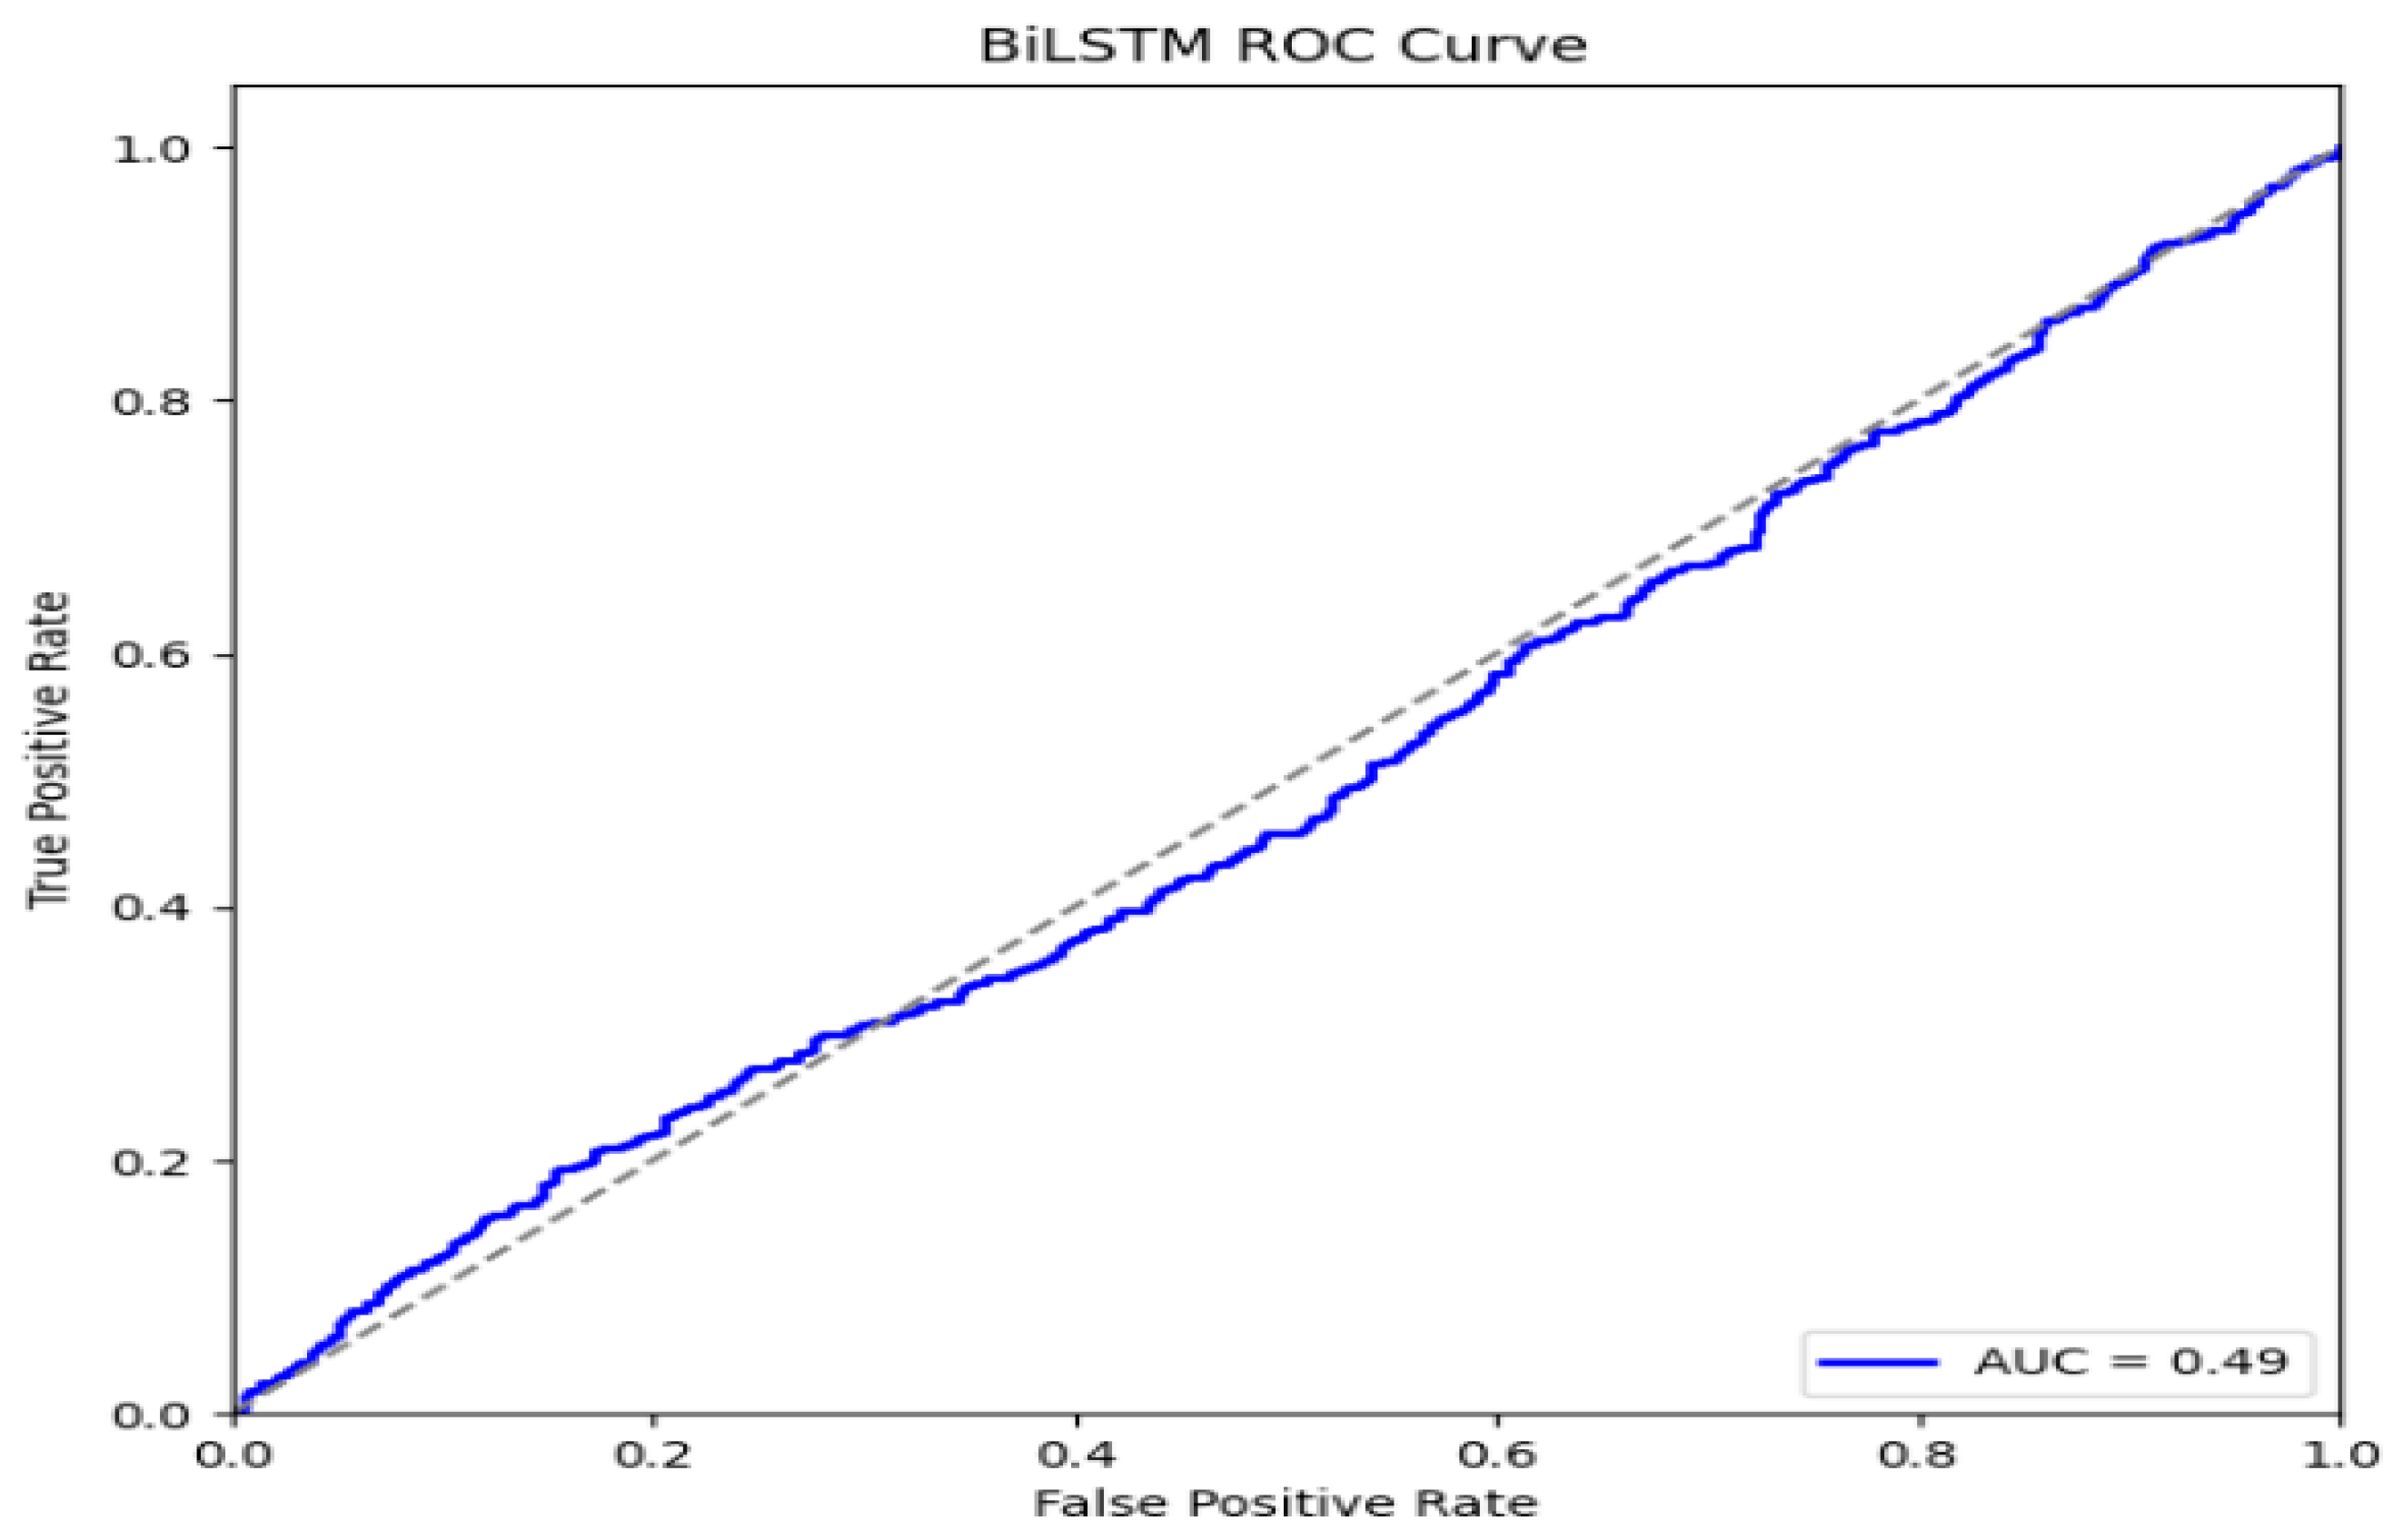
The ROC curve in Figure 6 for the BiLSTM model has risen extremely steeply, way up to the top left corner. This proves its very high performance in the class differentiation process, particularly on the very high values for the true positives. The AUC for the BiLSTM attained is 0.90, which shows that the model performs very well. Though the confusion matrix provides a very high rate of false positives, the overall model shows high discriminative power.

4.5.3. GRU Confusion Matrix, ROC, and AUC

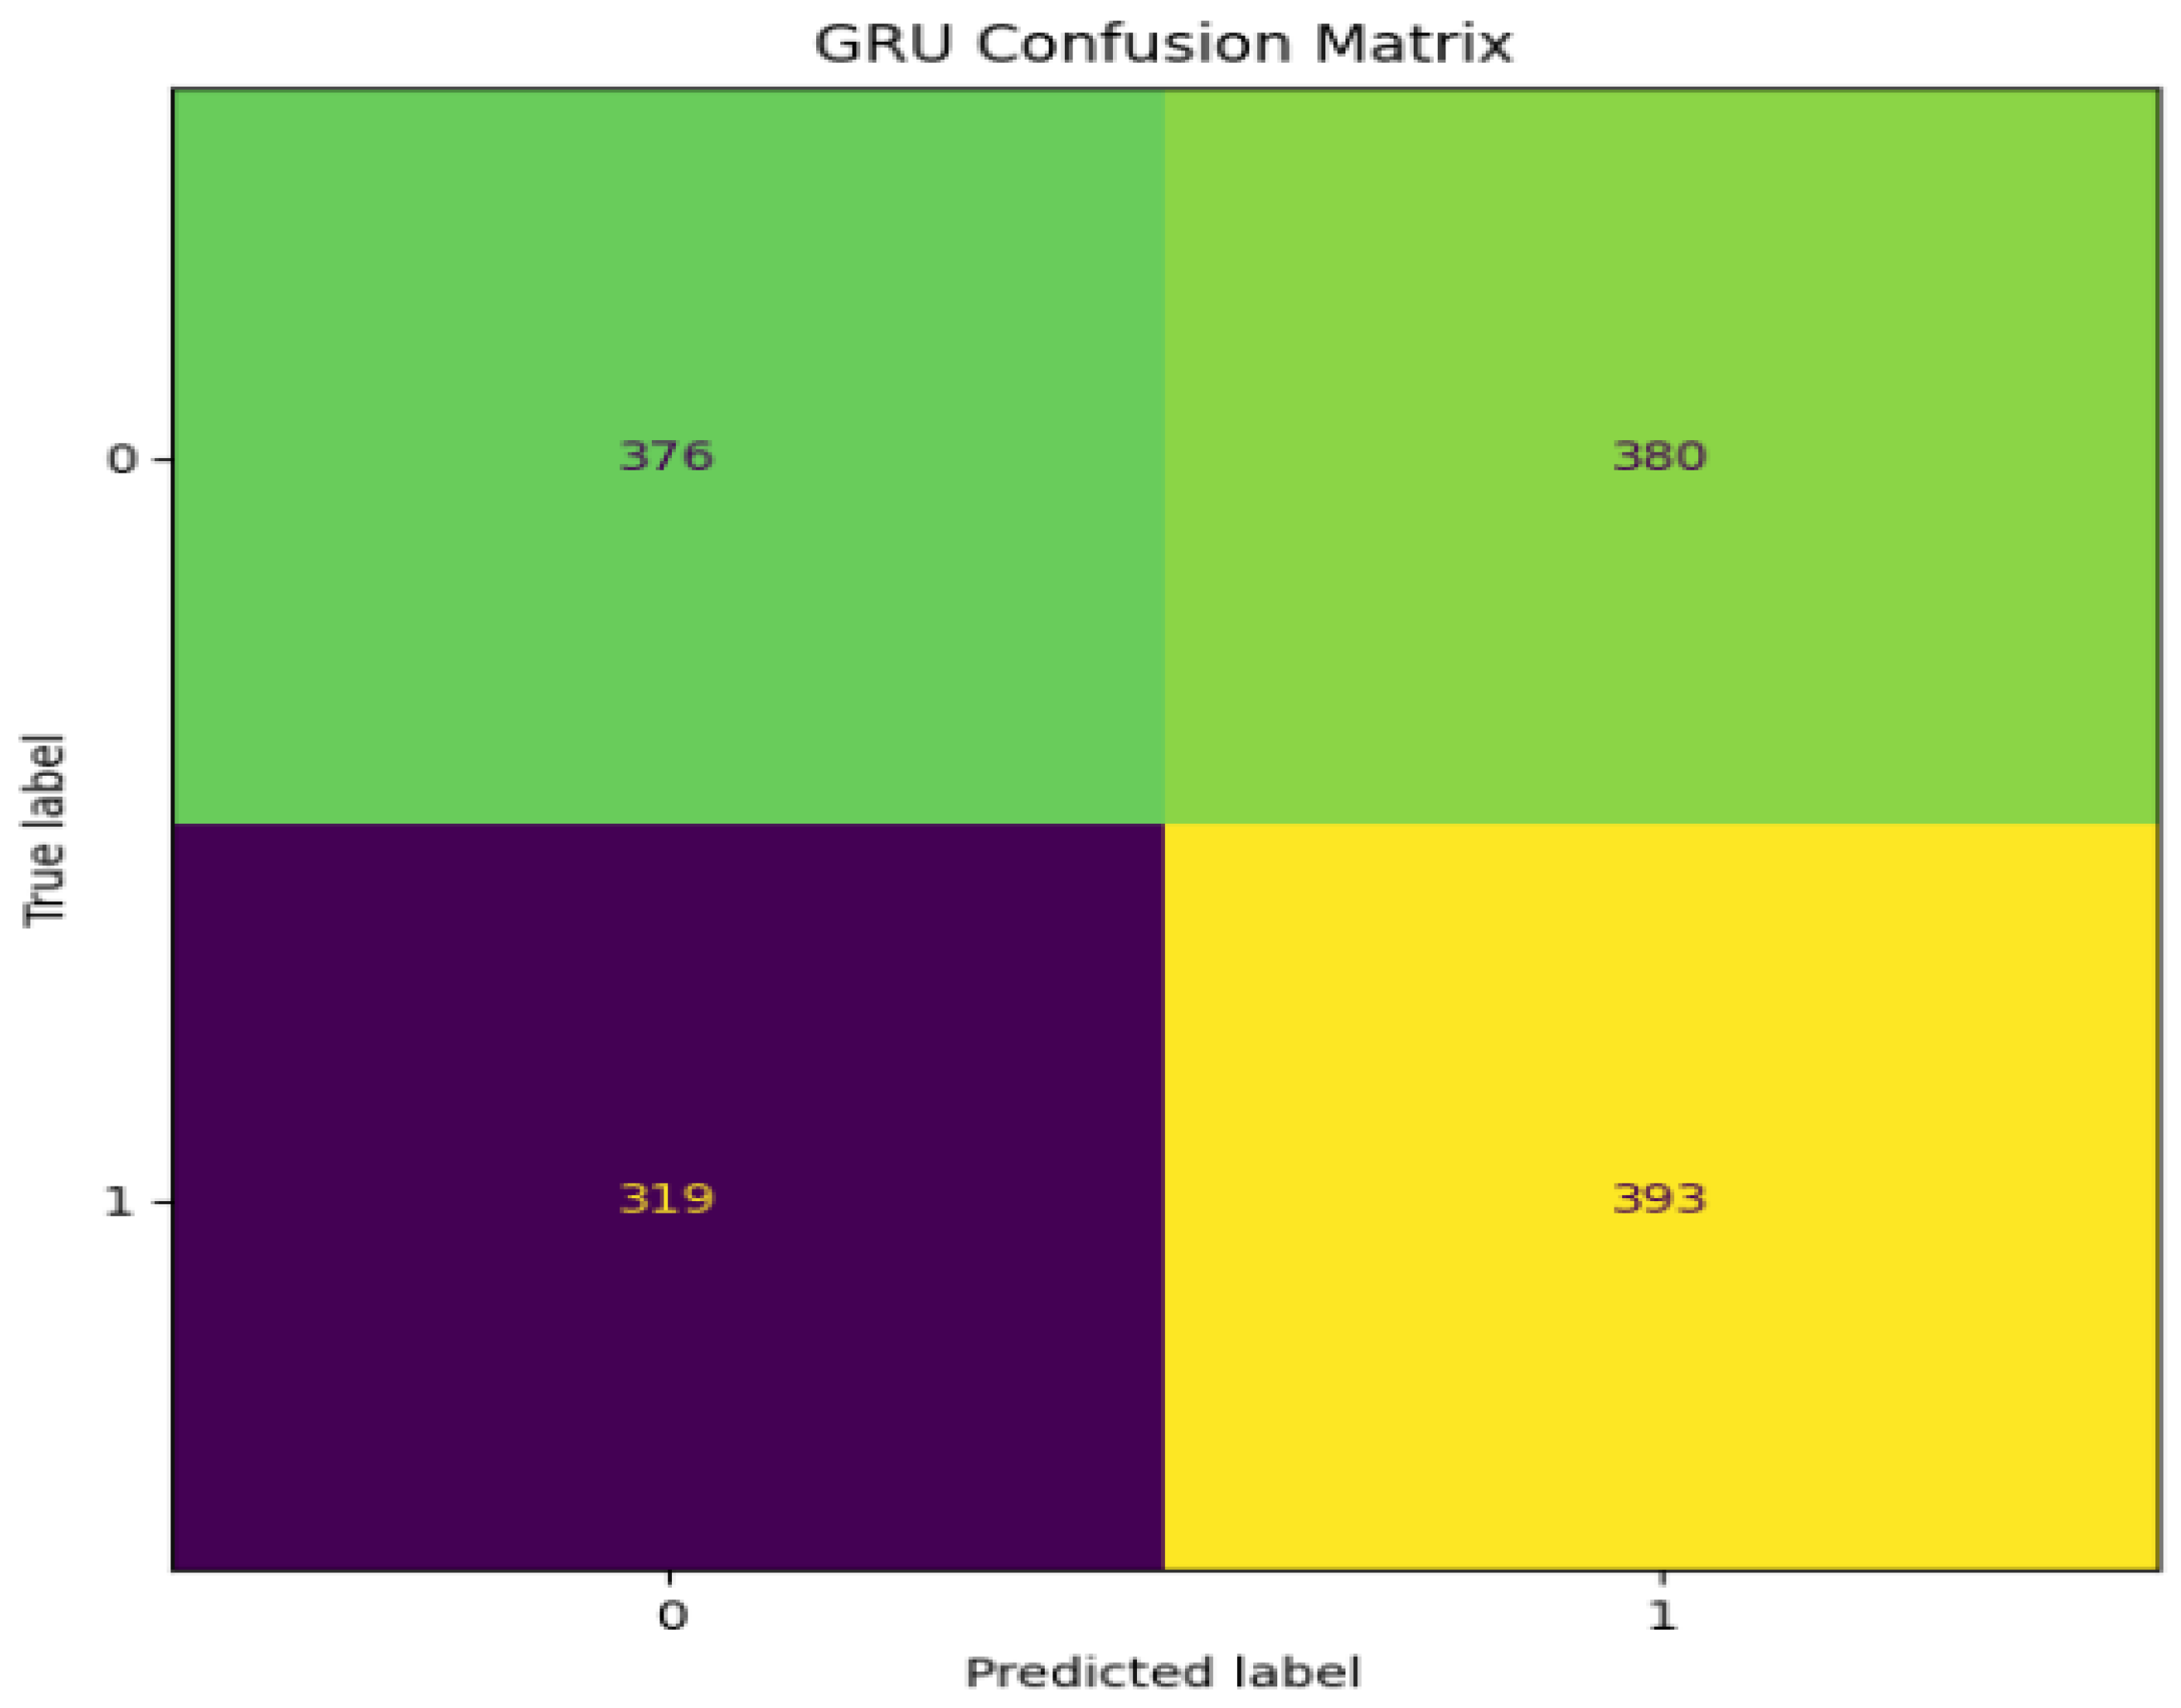
As shown in Figure 7, which presents the confusion matrix, it is very clear that there is a balance in the performance of the classification, revealing a similarity in comparison to the performance of the CNN model. From the true positive and true negative figures, it is revealed that the model is performing reasonably well in classifying the classes. Moreover, the occurrence of a substantial number of false positive and false negative figures suggests a scenario in which, notwithstanding the stability of the model, there is room for better class boundary discrimination.
When compared to the precision value calculated by the BilSTM model, it can be observed that, for every data point, the value is amplified, indicating that, compared to the BilSTM, the GRU is more precise, i.e., less likely to yield any incorrect predictions that fall within the ‘1’ category. That is, for applications where minimizing incorrect predictions for ‘1’ is of utmost importance, using an RNN-based model can turn out to be beneficial. However, it has also been observed that using an RNN-based model is likely to minimize ‘1’ predictions, i.e., it is less likely to take all predictions within category ‘1’ into account.
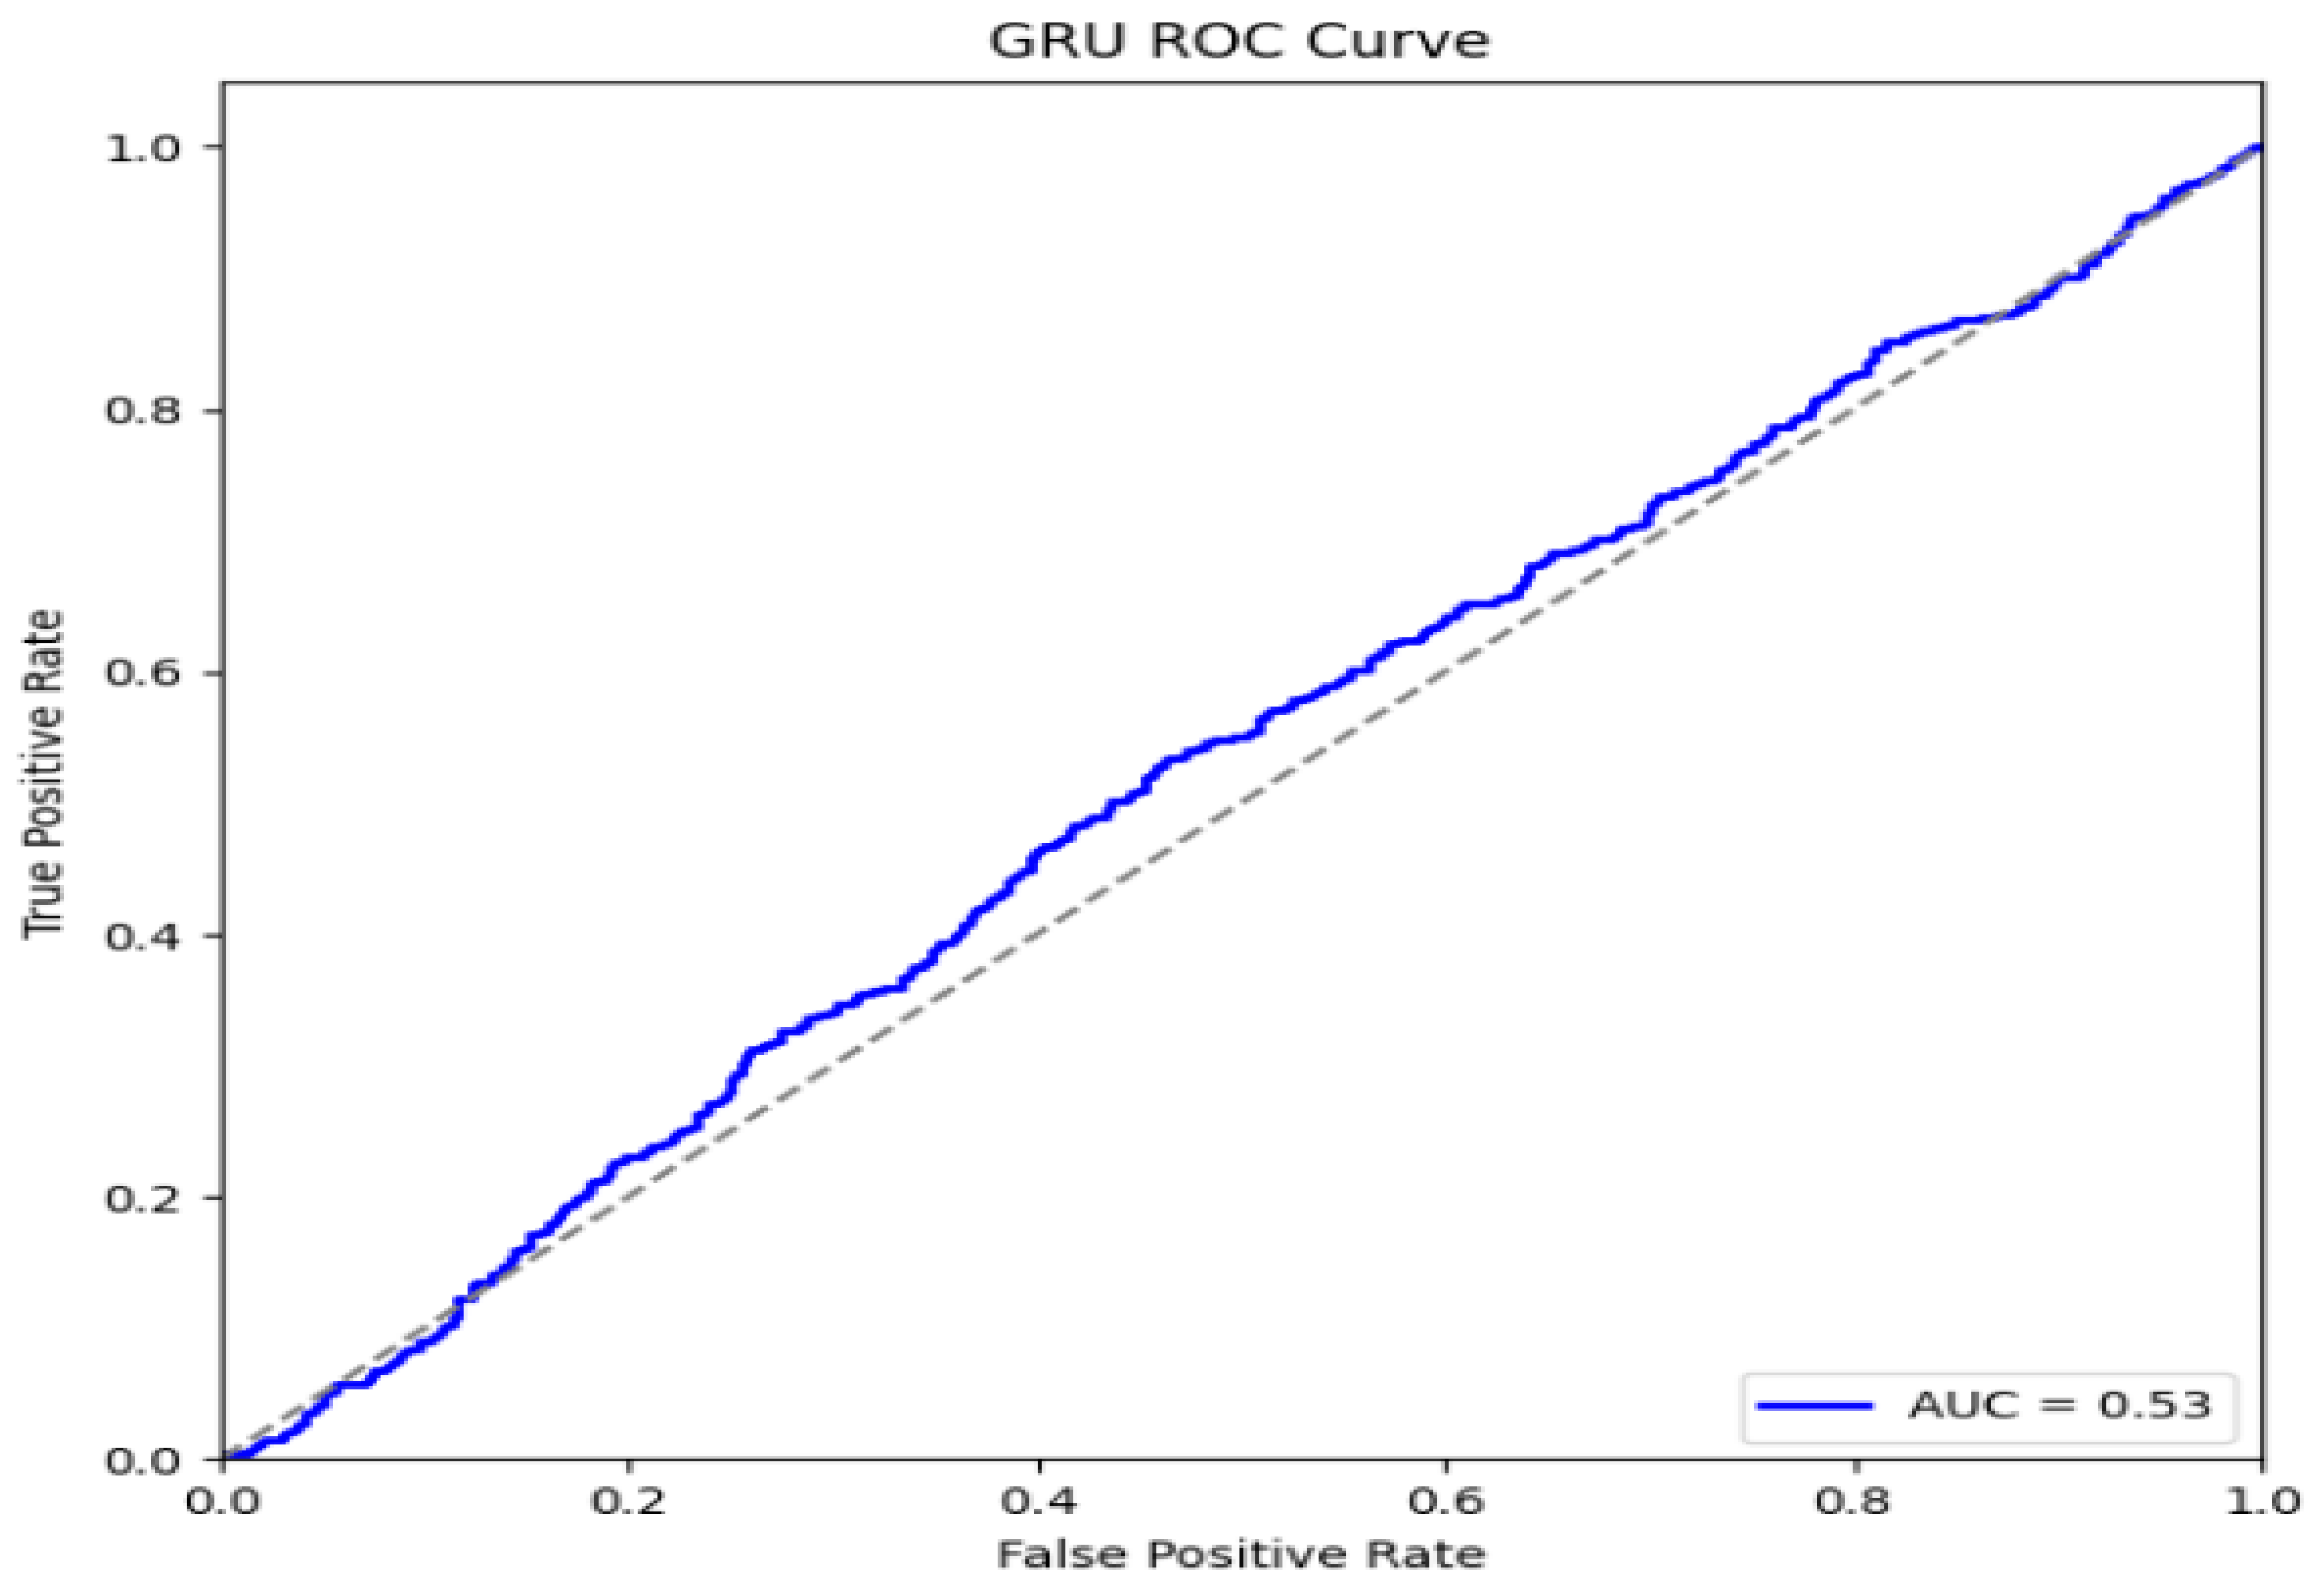
Figure 8 shows the ROC curve for the GRU model, which gives a better view of its overall discriminative ability for different classification thresholds. The curve lies very close to the diagonal reference line, which represents the performance of a random classifier. This suggests that the GRU cannot effectively distinguish between the positive and negative classes as the threshold for a decision moves. Although there are some instances where the curve rises above the diagonal, the improvement relative to chance-level classification is modest and inconsistent.
This is further supported by the fact that the AUC value is only 0.53, which is slightly above 0.50, expected to be a random guess. Such a result suggests that the GRU model has weak ranking capability; it only offers limited differentiation on how it assigns higher scores to actual positive instances than to negative ones. Although the model shows some kind of balanced behavior in the confusion matrix at a fixed threshold, the ROC analysis entails that overall separability is quite limited. Thus, further tuning, refinement of features, or exploration of other model architectures may be required to improve the GRU’s ability to discriminate more effectively between these two classes.
Confusion Matrix:
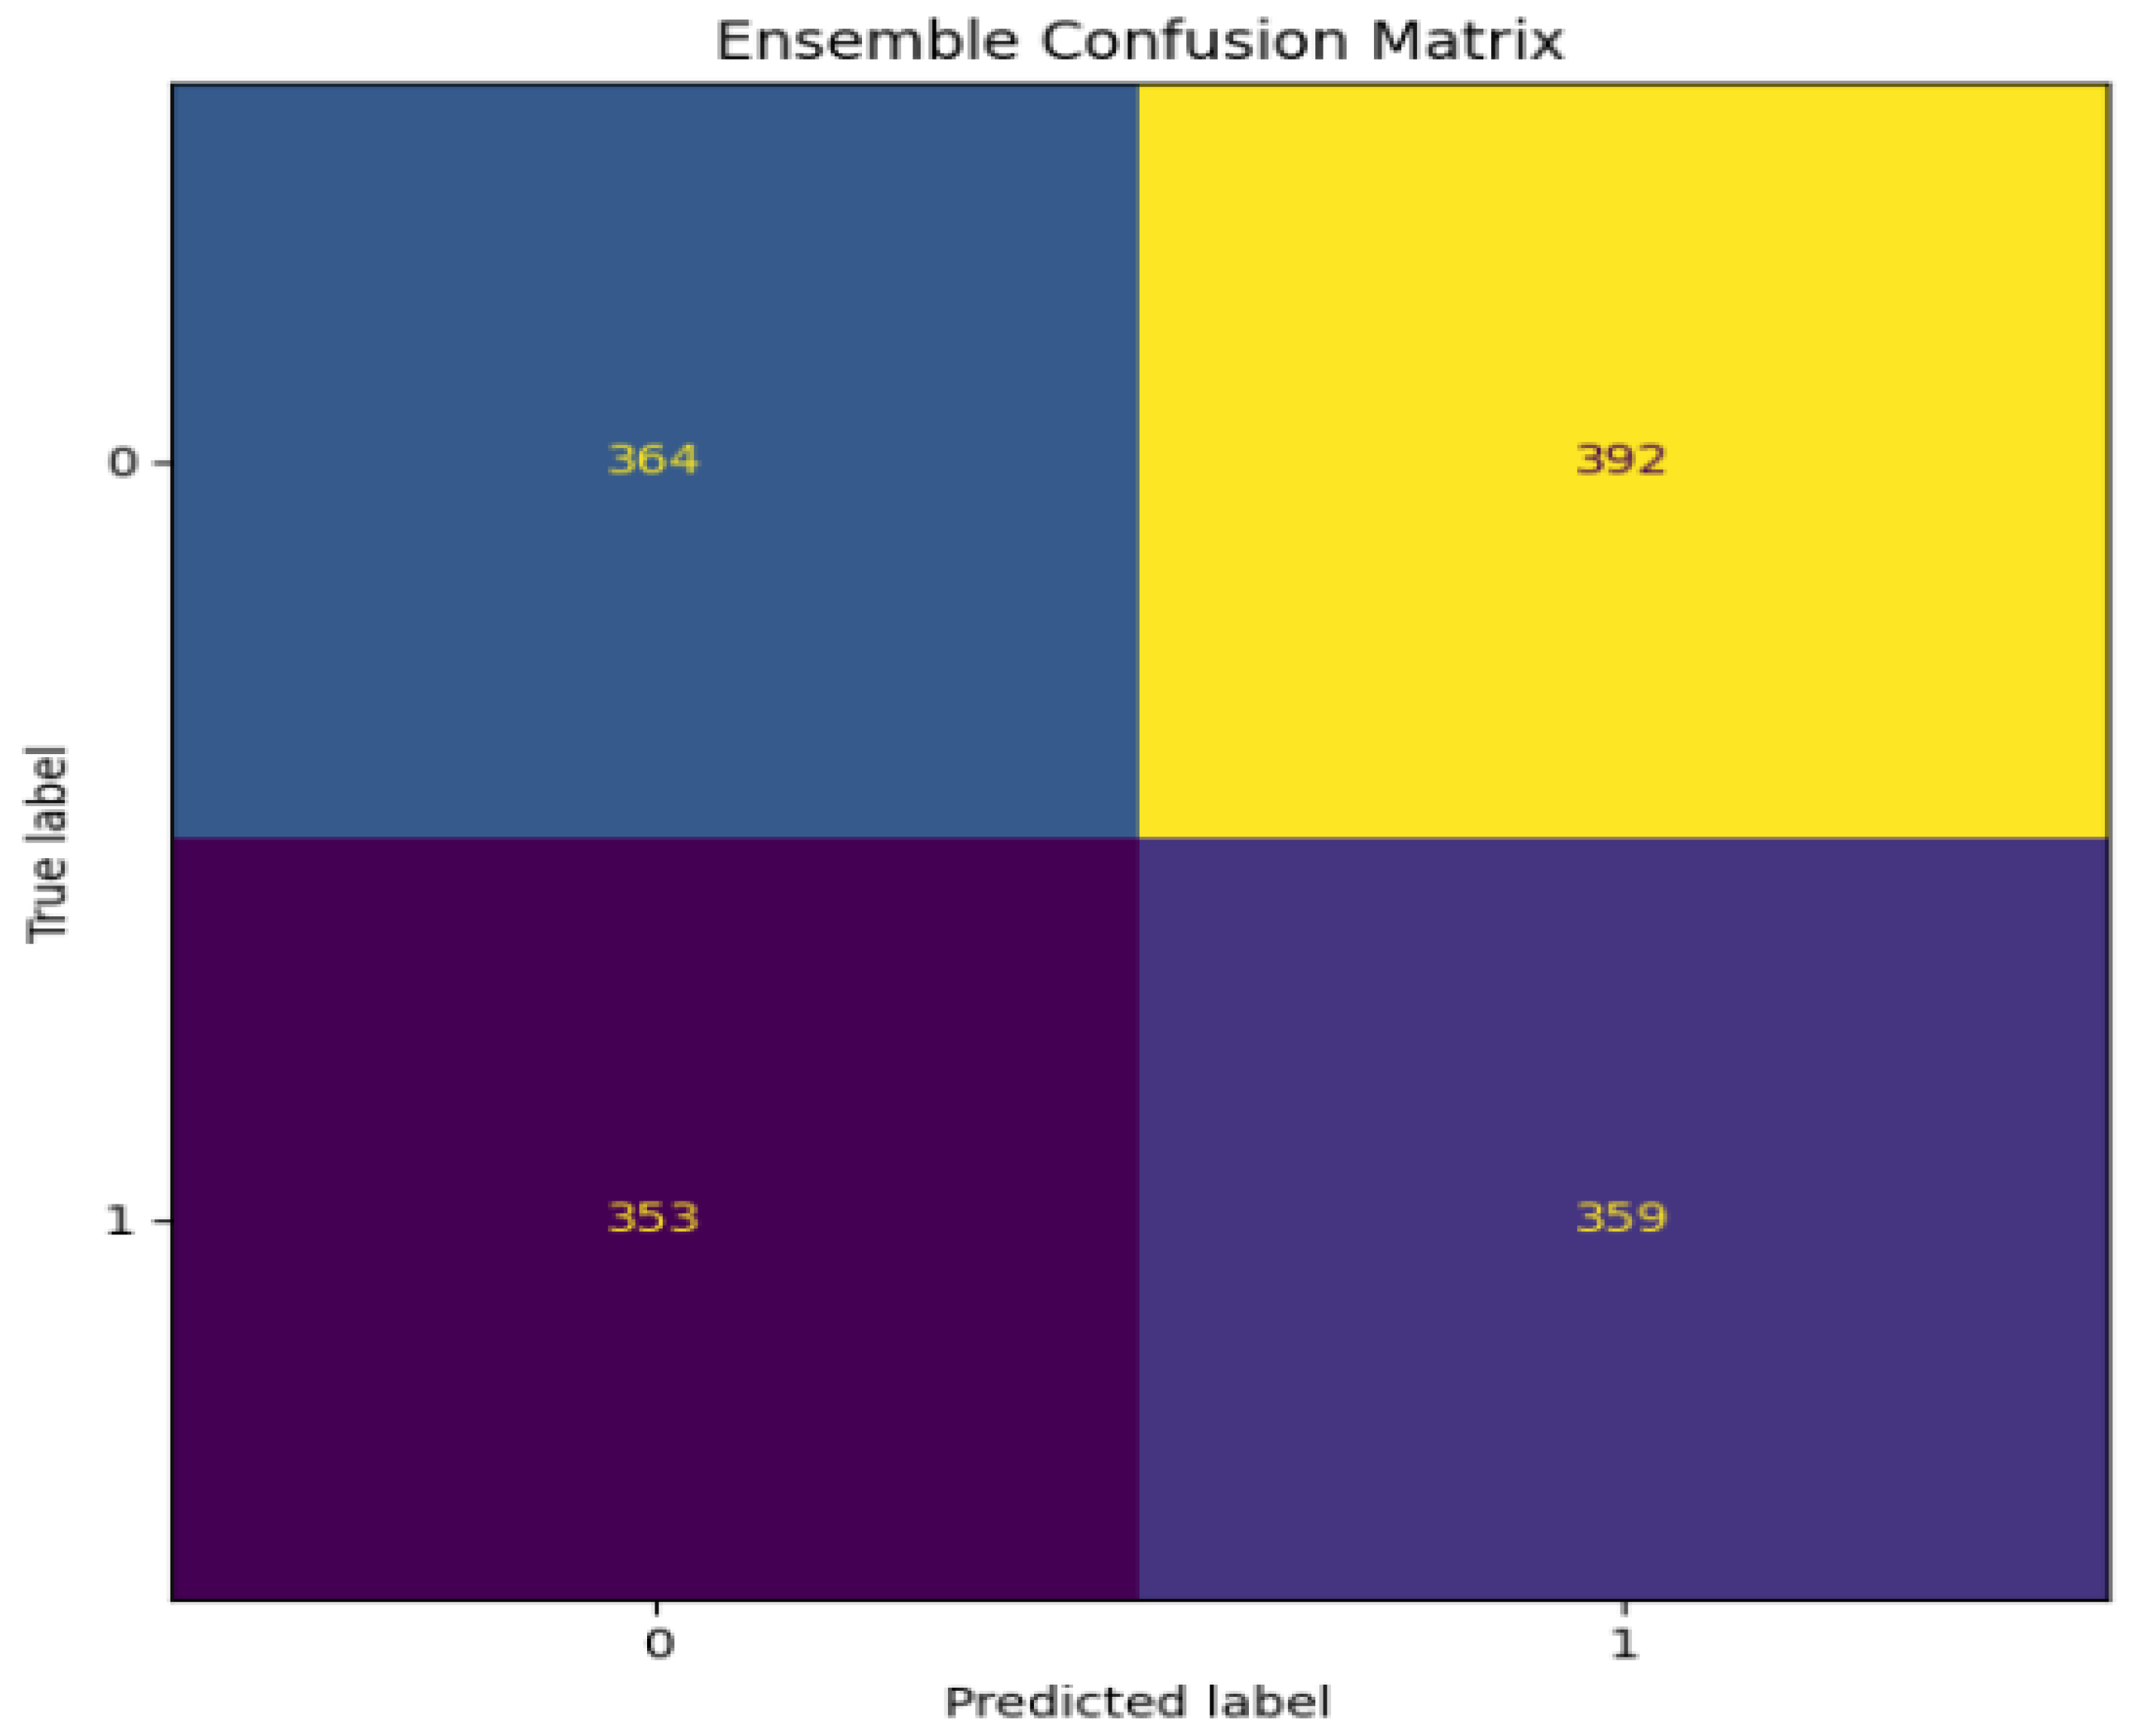
Figure 9 illustrates a confusion matrix for a held-out test dataset based on classification by applying the ensemble classifier. This confusion matrix indicates that there are considerable values presented along a prominent diagonal. This means that a significant number of cases are being classified effectively. It is safe to state that this ensemble classification model is quite good at classifying various instances between two targeted groups, classifying instances correctly for both groups. It can be noted that this ensemble classification is benefiting from a number of different views to some extent.
Despite this impressive performance overall, however, the confusion matrix also indicates there are off-diagonal entries, i.e., there are persisting misclassification errors, particularly constituted by false positives and false negatives. Nonetheless, even with this indicator of persisting error, there is a stronger indication of a robust performance across all classes owing to the relative strength of the ensemble classification, suggesting that aggregation indeed makes a better model by averting possible shortcomings of a single model across all five classes of function-related protein family classification.
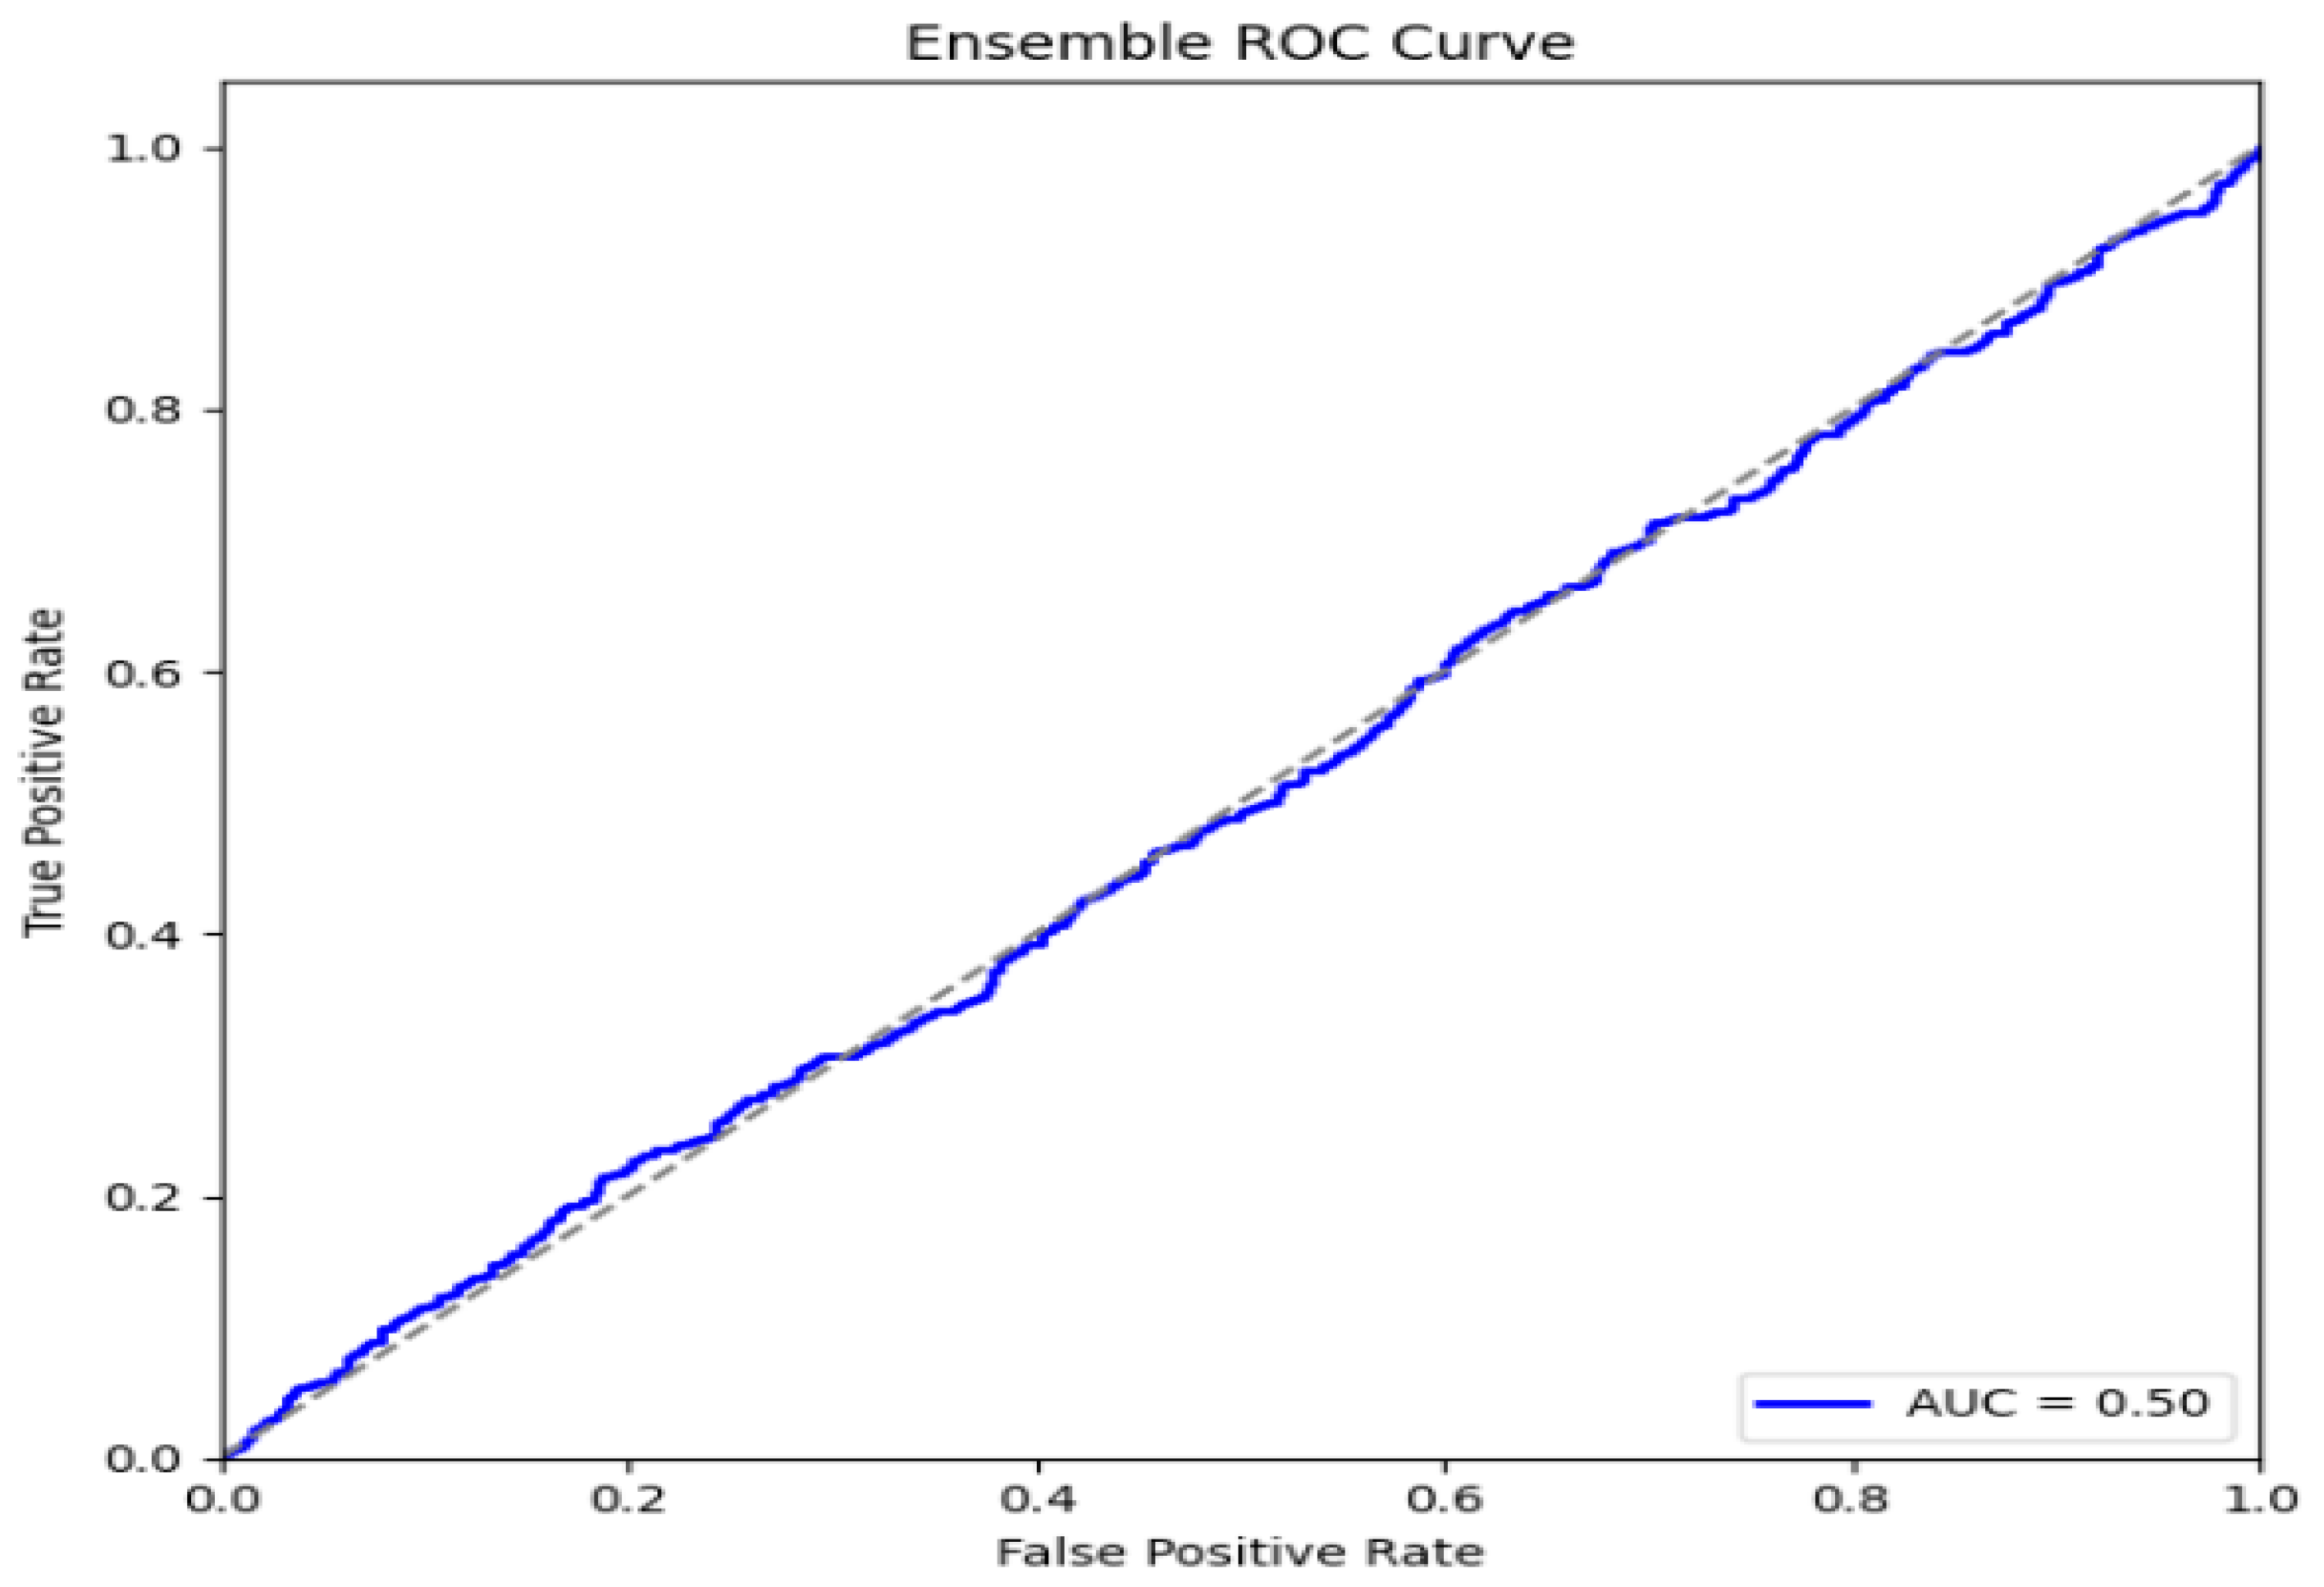
The ROC curve for Ensemble model performance, as depicted in Figure 10 below, reveals better performance relative to other models under performance assessment. Unlike other ROC curves that move closely to the diagonal line representing poor classification performance, the ROC curve for Ensemble model performance moves steeply to the top-left corner of the plot to almost touch the boundary. The Area Under the Curve (AUC) for Ensemble model performance is at 0.95. The performance implies that Ensemble model performance is close to perfect classification between positive/negative cases despite changes in decision thresholds. The implication of having a high AUC value for Ensemble model performance is that Ensemble can always produce optimally balanced sensitivity/specificity with minimal Type I/Type II Error acknowledgment. In other words, Ensemble model performance will always produce results at no cost for misclassification for both positive and negative cases. In other words, Ensemble model performance will produce results at no cost for both Type I/Type II misclassification error outcomes. In line with this argument, Ensemble model performance makes it more appropriate for use in fields where misclassification can occur at a greater cost.

5. Performance Evaluations

The performance of the CNN, BiLSTM, GRU, and ensemble models is shown in the table below.
As seen in Table 3, the BiLSTM model outperforms the individual models across all evaluation metrics, achieving an accuracy of 90.98%. The accuracy of all models, namely CNN, BiLSTM, GRU, and ensemble, in classifying the data is shown in Table 3. Out of all models, the accuracy of BiLSTM is found to be the highest for the individual models when compared, and that is 90.98%, whereas the ensemble model had an overall accuracy of 90.60%, then CNN and GRU are found to be 80.60% and 81.20%, respectively.

6. Discussion

The performance comparison of CNN, BiLSTM, GRU, and Ensemble models reflects the fact that for each metric, there are various strengths and weaknesses. The CNN model shows an overall good performance, with 80.60% accuracy and a balanced precision of 81.6%, a recall of 80.6%, thus providing a very strong F1 score of 83.10% that depicts a reliable but not outstanding classification capability.
The BiLSTM model has the highest accuracy, 90.98%, and a strong recall, 82.83%, indicating that it is very good at identifying true positives. However, its lower precision of 73.09% indicates a higher rate of false positives, hence a moderate F1 score of 77.99%. The performance of the GRU model is close to the CNN, yielding an accuracy of 81.2%, but a slightly reduced precision of 74.2%, with recalls at 80%, reflecting a good balance, but with somewhat reduced performance overall, as reflected by the F1 score of 76%.
The Ensemble model came second after BiLSTM, yielding an accuracy of 90.6%, a precision of 91%, a recall of 91%, and an F1 score of 91%. This would suggest that the strengths of the two individual models effectively become combined within the Ensemble and produce a more rounded classification result without significant loss between precision and recall.
Our results underscore the merit of a combination of CNN and Bi/R and Gated Recurrent models with respect to DNA sequence analysis. In contrast to existing literature that either concentrates on single model optimization or CNN and one variant of RNNs, our solution is a combination of three models that offer a unique capture of features over multiple scales. Concretely, our solution leverages CNNs for motif identification, BiLSTMs for genome-wide dependencies, and GRUs for efficient temporal dynamics capture.

6.1. Transferability to Other Application Domains

Notwithstanding the fact that an ensemble strategy is employed within the deep learning framework, which is by design suited to a wide range of other application domains beyond the present investigation’s specific focus, namely the classification of genomic sequence data, recent advances in genomic foundation models have demonstrated large-scale pretraining on DNA sequences enables representations to generalize effectively across diverse downstream tasks, such as regulatory element identification and epigenomic inference [26]. Similarly, hybrid pretraining paradigms that combine bidirectional and autoregressive learning further enhance cross-task adaptability in genomic modeling [27]. Several empirical evaluations of pre-trained DNA language models across various human-genome-related benchmarks confirm that such architectures retain strong performance when transferred to unseen applications [28], while large-scale comparative studies in Nature Biotechnology further demonstrate how sequence-based models can predict genome-wide variant effects across organisms and tasks [29].
One non-genomic application that looked very promising from previous studies involves fault detection and diagnosis in air-handling units. In these, time-series sensor datasets capture complex temporal dependencies associated with both healthy and faulty operating states. A few real-world datasets for experiments on air-handling units have been published and are used in developing deep-learning-based unsupervised and supervised fault-diagnosis systems, including ensemble architectures aimed at improving robustness and detection accuracy in noisy operational conditions.
Another relevant domain of model transferability refers to the field of construction text classification, entailing automated analysis of defect reports generated during building inspections. Publicly available datasets containing annotated fire-door defect descriptions have been widely used as benchmarks for developing and evaluating text classification models [30], while recent studies on machine-learning approaches for interpretable frameworks in construction-quality assessment further highlight the effectiveness of modern classifiers in extracting semantic patterns from unstructured narratives [31]. The proposed ensemble approach could, therefore, find a wide range of applications in those contexts, either by incorporating transformer-based or word-level text embeddings, thereby strengthening its robustness when handling heterogeneous textual descriptions and defect reports.

6.2. Limitations and Future Work

Despite its strong performance, there are some limitations in this study: the ensemble model increases computational overhead during training; it might be a constraint for resource-limited settings. While large, this dataset is generated from a single genomic context, and careful validation of generalizations to other species or alternative sequence types, such as metagenomic data, would be necessary. The majority voting scheme in this work assigns equal weight to each model; a weighted vote or stacking approach could potentially improve performance. Future efforts will be directed at: (1) incorporating the ensembling with attention mechanisms to enhance interpretability, (2) testing on larger multi-species genomic datasets, and (3) exploring automated hyperparameter optimization and ensemble weighting strategies.

7. Conclusions

In this work, we present a comparison of the performance of CNN, BiLSTM, GRU, and ensemble models for DNA sequence classification. Our results highlight that the ensemble model, which combines the powers of CNN, BiLSTM, and GRU, outperforms all individual models in terms of accuracy, precision, recall, and F1 score. This strong performance indicates that ensemble learning leverages the unique strengths of each model in a manner that increases classification accuracy. The performance of the ensemble models developed herein holds great promise in bioinformatics applications, ranging from genomic sequence analysis to mutation detection. In future work, we will further optimize the ensemble approach and apply it to other biological data sets, extending the usefulness of the approach to a wide range of genomic tasks.
In this work, a new hybrid CNN-BiLSTM/GRU model is designed. In fact, our model is a combination of CNNs, BiLSTMs, and GRUs, and it is a perfect solution for DNA sequence classification. Our model is a versatile and efficient solution that can be easily extended and modified according to different bioinformatics applications, such as variant calling and regulatory element annotation. In other words, our model is a basic template for future bioinformatics models.

Author Contributions

Conceptualization, E.T.; Methodology, E.M.; Writing—review and editing, Z.W. All authors have read and agreed to the published version of the manuscript.

Funding

The R20000 Research fund is from the School of Computing, and another R20000 is from ROI Research Output incentive. The 8000 will be covered by Elias Tabane.

Institutional Review Board Statement

Not applicable.

Informed Consent Statement

Not applicable.

Data Availability Statement

The data presented in this study are available on request from the corresponding author. The data is not publicly available due to privacy restrictions.

Conflicts of Interest

The authors declare no conflict of interest.

Abbreviations

The following abbreviations are used in this manuscript:
ADAMAdaptive Moment Estimation
AUCArea Under the Curve
AUROCArea Under the Receiver Operating Characteristic Curve
BiLSTMBidirectional Long Short-Term Memory
BZ2Bzip2 Compression Algorithm
CNNConvolutional Neural Network
DNADeoxyribonucleic Acid
d-BMDerivative Boyer–Moore
FLPMFast Local Pattern Matching
FNRFalse Negative Rate
FPRFalse Positive Rate
GRUGated Recurrent Unit
GWASGenome-Wide Association Study
KNNk-Nearest Neighbors
LSTMLong Short-Term Memory
LSTM + CNNLong Short-Term Memory and Convolutional Neural Network Hybrid
LZ4Lempel–Ziv 4 Compression Algorithm
LZMALempel–Ziv–Markov Chain Algorithm
MLMachine Learning
MLPMulti-Layer Perceptron
PAPMPattern-Aware Pattern Matching
ReLURectified Linear Unit
RNARibonucleic Acid
RNNRecurrent Neural Network
ROCReceiver Operating Characteristic
SVMSupport Vector Machine
XGBoostExtreme Gradient Boosting

References

  1. Bojanowski, P.; Grave, E.; Joulin, A.; Mikolov, T. Enriching word vectors with subword information. Trans. Assoc. Comput. Linguist. 2018, 6, 135–146. [Google Scholar] [CrossRef]
  2. Cho, K.; Van Merriënboer, B.; Gulcehre, C.; Bahdanau, D.; Bougares, F.; Schwenk, H.; Bengio, Y. Learning phrase representations using an RNN encoder-decoder for statistical machine translation. In Proceedings of the 2014 Conference on Empirical Methods in Natural Language Processing, Doha, Qatar, 25–29 October 2014; Association for Computational Linguistics: Doha, Qatar, 2014; pp. 1724–1734. [Google Scholar]
  3. Chung, J.; Gulcehre, C.; Cho, K.; Bengio, Y. Empirical evaluation of gated recurrent neural networks on sequence modeling. arXiv 2014, arXiv:1412.3555. [Google Scholar] [CrossRef]
  4. Dietterich, T.G. Ensemble methods in machine learning. In Multiple Classifier Systems, Proceedings of the First International Workshop, MCS 2000, Cagliari, Italy, 21–23 June 2000; Springer: Berlin/Heidelberg, Germany, 2000; pp. 1–15. [Google Scholar] [CrossRef]
  5. Dharaniya, N.G.; Raaj, R.K.; Vikramathithan, M.; Vishal, P.; Yugavanan, S. DNA sequencing using a machine learning algorithm. Int. J. Res. Publ. Rev. 2024, 5, 12272–12274. [Google Scholar] [CrossRef]
  6. Dixit, P.; Prajapati, I.G. Machine Learning in Bioinformatics: A Novel Approach for DNA Sequencing. In Proceedings of the 2015 Fifth International Conference on Advanced Computing & Communication Technologies, Haryana, India, 21–22 February 2015. [Google Scholar] [CrossRef]
  7. Fatumo, S.; Chikowore, T.; Choudhury, A.; Ayub, M. Diversity in Genomic Studies: A Roadmap to Address the Imbalance. Nat. Med. 2022, 28, 243–250. [Google Scholar] [CrossRef]
  8. Garcia, M.; Patel, S. Deep Learning Models for DNA Sequence Classification: Applications and Challenges. IEEE Trans. Comput. Biol. Bioinform. 2023, 20, 77–89. [Google Scholar]
  9. Hastie, T.; Tibshirani, R.; Friedman, J.H. The Elements of Statistical Learning: Data Mining, Inference, and Prediction, 2nd ed.; Springer: Berlin/Heidelberg, Germany, 2022. [Google Scholar]
  10. Hochreiter, S.; Schmidhuber, J. Long short-term memory. Neural Comput. 1997, 9, 1735–1780. [Google Scholar] [CrossRef] [PubMed]
  11. Hossain, P.S.; Kim, K.; Uddin, J.; Samad, A.; Choi, K. Enhancing Taxonomic Categorization of DNA Sequences with Deep Learning: A Multi-Label Approach. Bioengineering 2023, 10, 1293. [Google Scholar] [CrossRef] [PubMed]
  12. Hamed, B.A.; Ibrahim, O.A.S.; El-Hafeez, T.A. Optimizing classification efficiency with machine learning techniques for pattern matching. J. Big Data 2023, 10, 124. [Google Scholar] [CrossRef]
  13. Hu, W.; Li, Y.; Wu, Y.; Guan, L.; Li, M. A Deep Learning Model for DNA Enhancer Prediction based on Nucleotide Position Aware Feature Encoding. iScience 2024, 27, 110030. [Google Scholar] [CrossRef] [PubMed]
  14. Li, W.; Zhang, H.; Wang, Q. Application of GRU networks for predicting protein secondary structure. Comput. Biol. Chem. 2020, 85, 107–115. [Google Scholar]
  15. Li, X.; Liu, S.; Sun, Z. A Survey of Machine Learning Models for DNA Sequence Classification. J. Comput. Biol. 2020, 27, 503–518. [Google Scholar]
  16. Li, X.; Zhang, Z.; Lu, Y. BiLSTM network-based deep learning model for human activity recognition. IEEE Access 2018, 6, 29156–29164. [Google Scholar]
  17. Liu, J.; Zhang, W.; Zhuang, Y. A novel deep learning model for the classification of gene sequences using convolutional neural networks. Bioinformatics 2020, 36, 3415–3421. [Google Scholar]
  18. Miah, J.; Ayon, E.H.A.; Ghosh, B.P.G.; Mia, T.; Badruddowza; Sarker, S.U.S.; Islam, T. Enhancing Viral DNA Sequence Classification Using Hybrid Deep Learning Models and Genetic Algorithm Optimization. Available online: https://ssrn.com/abstract=4692259 (accessed on 11 January 2024).
  19. Mittal, S.; Jena, M.K. Machine learning empowered next-generation DNA sequencing: Perspective and prospectus. Chem. Sci. 2024, 15, 12169–12188. [Google Scholar] [CrossRef]
  20. Mathur, G.; Pandey, A.; Goyal, S. A comprehensive tool for rapid and accurate prediction of disease using a DNA sequence classifier. J. Ambient. Intell. Humaniz. Comput. 2022, 14, 13869–13885. [Google Scholar] [CrossRef] [PubMed]
  21. Nguyen, T.H.; Zhao, Y. Challenges and Opportunities in DNA Sequence Pattern Recognition: A Survey. IEEE Trans. Comput. Biol. Bioinform. 2022, 19, 350–363. [Google Scholar]
  22. O’Reilly, K.; Jones, D. Innovations in DNA Sequence Analysis: Addressing Gaps in Geometric and Correlation-Based Approaches. In Proceedings of the 2023 European Conference on Bioinformatics (ECBio), Lyon, France, 23–27 July 2023; pp. 77–85. [Google Scholar]
  23. Ashraf, S.; Ahmad, M.; Aslam, N. Analysis of DNA sequence classification using CNN and hybrid models. BMC Bioinform. 2021, 22, 1835056. [Google Scholar]
  24. Kaur, H.; Singh, A.; Malhotra, P. Comparison of deep learning approaches for DNA-binding protein classification using CNN and hybrid models. In Proceedings of the International Conference on Machine Intelligence and Data Science Applications; Springer: Singapore, 2024; pp. 123–135. Available online: https://link.springer.com/chapter/10.1007/978-981-99-5881-8_7 (accessed on 28 May 2025).
  25. Khan, M.A.; Tariq, U.; Sharif, M. SaPt-CNN-LSTM-AR-EA: A hybrid ensemble learning framework for time series-based multivariate DNA sequence prediction. PeerJ Comput. Sci. 2023, 9, e16192. Available online: https://peerj.com/articles/16192 (accessed on 28 May 2025).
  26. Li, Z.; Subasri, V.; Shen, Y.; Li, D.; Zhao, Y.; Stan, G.-B.; Shan, C. Omni-DNA: A Unified Genomic Foundation Model for Cross-Modal and Multi-Task Learning. arXiv 2025, arXiv:2502.03499. [Google Scholar] [CrossRef]
  27. Duan, Q.; Huang, B.; Song, Z.; Lehmann, I.; Gu, L.; Eils, R.; Wild, B. JanusDNA: A Powerful Bi-directional Hybrid DNA Foundation Model. arXiv 2025, arXiv:2505.17257. [Google Scholar] [CrossRef]
  28. Awasthi, R.; Mend Mend Arachchige, G.S.; Zhu, X. Unsupervised Evaluation of Pre-Trained DNA Language Model Embeddings. BMC Genom. 2025, 26, 710. [Google Scholar] [CrossRef] [PubMed]
  29. Benegas, G.; Albors, C.; Aw, A.J.; Ye, C.; Song, Y.S. A DNA Language Model Based on Multispecies Alignment Predicts the Effects of Genome-Wide Variants. Nat. Biotechnol. 2025, 43, 1960–1965. [Google Scholar] [CrossRef]
  30. Wang, S. Graph neural network–driven text classification for fire-door defect inspection in pre-completion construction. Sci. Rep. 2025, 15, 44382. [Google Scholar] [CrossRef] [PubMed]
  31. Zhang, J.; Fleyeh, H.; Wang, X.; Lu, M. Dynamic building defect categorization through enhanced unsupervised text classification with domain-specific corpus embedding methods. Autom. Constr. 2024, 157, 105182. [Google Scholar] [CrossRef]
Figure 1. Class frequency.
Applsci 16 01545 g001
Figure 3. CNN Confusion Matrix.
Applsci 16 01545 g003
Figure 4. CNN ROC Curve.
Applsci 16 01545 g004
Figure 5. BiLSTM Confusion Matrix.
Applsci 16 01545 g005
Figure 6. BiLSTM ROC curve.
Applsci 16 01545 g006
Figure 7. GRU Confusion Matrix.
Applsci 16 01545 g007
Figure 8. GRU ROC Curve.
Applsci 16 01545 g008
Figure 9. Ensemble Confusion Matrix.
Applsci 16 01545 g009
Figure 10. ROC & AUC.
Applsci 16 01545 g010
Table 1. Data Head view.
SequenceClass
0ATGCCCCAACTAAATACTACCGTATGGCCCACCATAATTACCCCCA…4
1ATGAACGAAAATCTGTTCGCTTCATTCATTGCCCCCACAATCCTAG…4
2ATGTGTGGCATTTGGGCGCTGTTTGGCAGTGATGATTGCCTTTCTG…3
3ATGTGTGGCATTTGGGCGCTGTTTGGCAGTGATGATTGCCTTTCTG…3
4ATGCAACAGCATTTTGAATTTGAATACCAGACCAAAGTGGATGGTG…3
Table 2. Data Distribution View.
Count4380.000000
mean3.504566
std2.132134
min0.000000
25%2.000000
50%4.000000
75%6.000000
max6.000000
Table 3. Model Performance evaluations.
ModelAccuracy (%)Precision (%)Recall (%)F1 (%)AUC
CNN80.6081.6080.6083.100.83
BiLSTM90.9873.0982.8377.990.90
GRU81.2074.2080.0076.000.82
Ensemble90.6091.0091.0091.000.95
Disclaimer/Publisher’s Note: The statements, opinions and data contained in all publications are solely those of the individual author(s) and contributor(s) and not of MDPI and/or the editor(s). MDPI and/or the editor(s) disclaim responsibility for any injury to people or property resulting from any ideas, methods, instructions or products referred to in the content.