Article

Durability and Fire Performance of Gypsum Composites Reinforced with Recycled Polyethylene Fibers


by
Leonardo Lima
1,2,*,
Alicia Zaragoza-Benzal
3,
Daniel Ferrández
3,
Evangelina Atanes-Sánchez
4 and
Paulo Santos
1,*
1
Department of Civil Engineering, ISISE, ARISE, University of Coimbra, 3030-788 Coimbra, Portugal
2
Prefecture of University Campus, Federal University of Amazonas, Manaus 69067-005, Brazil
3
Departamento de Tecnología de la Edificación, Universidad Politécnica de Madrid, 28040 Madrid, Spain
4
Departamento de Ingeniería Química, Universidad Politécnica de Madrid, 28012 Madrid, Spain
*
Authors to whom correspondence should be addressed.
Appl. Sci. 2026, 16(3), 1489; https://doi.org/10.3390/app16031489
Submission received: 19 December 2025 / Revised: 24 January 2026 / Accepted: 30 January 2026 / Published: 2 February 2026
(This article belongs to the Section Civil Engineering)

Abstract

Gypsum is a widely used building material because of its good non-structural performance and low cost. However, when exposed to moisture and other harsh environments, it may lose its strength. In this study, gypsum composites (GCs) reinforced with recycled polyethylene (PE) fibers from bird nets (BNs) were developed, exposed to wet–dry cycles and fire, and then mechanically tested to verify the influence of these exposures on their properties. The main highlights include: at 40% replacement of gypsum with BN fibers, surface hardness increased by 5%, and with a fiber content of 10%, the compressive strength showed a slight increase of 3%, and flexural strength decreased by only 9%. The 10 wet–dry cycles did not have much influence on the mechanical performance, unlike exposure to fire, which drastically reduced it. Moreover, open porosity was reduced by 19% and total water absorption by 17% with 40% BN fiber content, making them suitable as additives in GCs for application in humid environments.

1. Introduction

Gypsum is a versatile building material, the production of which emits about one-eighth the CO2 emissions of cement production, making it more environmentally friendly. Cement clinker is burned at a temperature above 1400 °C, while the calcination temperature of gypsum does not exceed 200 °C. Due to the lower amount of energy required for its production, gypsum is also an economical alternative to cement in non-structural applications [1,2]. On the other hand, its brittleness and water softening hinder its widespread utilization. Therefore, several studies have used fibers to enhance the performance of GCs and overcome these shortcomings [3]. The incorporation of fibers mostly reduces the compressive strength of GCs, but can increase flexural and shear strengths [4], as well as resistance to water and high temperatures [5], dimensional stability, and tensile strength [6].
Considering the circular economy, the European Commission’s priorities, and the Sustainable Development Goals (Agenda 2030) 9 and 12 (Industry, innovation and infrastructure; Responsible consumption and production), the construction industry has been incorporating recycled fibers from plastic waste into engineered composites [7]. Worldwide, about 415 million tons of plastic are produced annually, but only 14–18% of plastic waste is recycled [8]. Consequently, plastic waste has become one of the main environmental problems, polluting the soil, rivers, and the sea [9]. Its poor management and alarming statistics highlight the urgent need for innovative solutions for recycling plastic waste [10].
From an engineering approach, the increasing production of new building materials containing plastic waste, integrated into the circular economy, leads to better cost-effectiveness of products [11]. The plastic wastes most used in composites are PE and polyethylene terephthalate PET [12]. Regarding GCs, Wang et al. reported tensile strain capacity greater than 5% with 2% (by mass) of PE fibers [13]. In their study of high-density polyethylene (HDPE) waste, Songkhla et al. reported a decrease of 9% in compressive strength with 2% (by volume) of fibers. Notwithstanding, they also noticed an increase in strain that indicated improvement in deformability and ductility, which allowed the GCs to better withstand internal stress without cracking [14]. Moreover, a peak bending load twice that of the reference was obtained by Xu et al. with 1.5% (by volume) of ultra-high-molecular-weight polyethylene (UHMWPE) fibers. In addition, peak deflection and peak energy dissipation improved by 10 and 26 times, respectively, and the cracks exhibited a fan-shaped expansion [1].
Despite these promising achievements, GCs may suffer an eventual loss of strength when exposed to moisture, such as in chemically aggressive and sulfate-rich environments, which limit their durability [14]. This is why studies have investigated the influence of an accelerated climatic aging process on GCs, subjecting them to wetting–drying and freezing–thawing cycles [15,16]. Aldaood et al. reported a greater influence on the properties of GCs with wetting–drying cycles than with freezing–thawing cycles [17]. On the other hand, considering the polymeric composition of plastic waste, it is crucial to study its effects on the fire behavior of GCs [18]. However, only a few studies have been carried out on the consequences of fire exposure in GCs. For example, Zaragoza-Benzal et al. conducted a fire test with a barbecue grill on GCs reinforced by glass and basalt fibers [19]. Alameda et al. [20] and Ramos and Mendes [21] studied GCs reinforced with PP and HDPE fibers, respectively, exposed to high temperatures. However, the equipment setups used were furnaces without exposure to any direct fire flames.
A comprehensive literature review was performed in the Scopus database, within keywords, using the following search criteria: “Gypsum” AND (“PE” OR “polyethylene”) AND (“fiber*” OR “fibre*”) AND “Composites”. Only nine documents were found. However, when adding the keyword “fire” OR “durability”, no documents matching these keywords were found, which unequivocally proves the originality of this research and motivated it.
Considering that partition walls in light steel-framed (LSF) construction systems are one of the largest applications of GCs, this study sought to simulate climatic aging and a building on fire to verify the influence of these exposures on the mechanical properties of samples. To this end, and also aiming for sustainability, GCs reinforced with recycled PE fibers from bird nets (BNs) were developed and tested. Additionally, other physical characterization tests were performed, such as bulk density, total water absorption, and open porosity. Furthermore, since the fibers are polymeric, a theoretical estimated calculation of the amount of harmful gas emissions in case of fire was performed to verify the risk of intoxication in humans.

2. Materials and Methods

2.1. Materials

For this study, five GCs were developed and submitted to two distinct exposure situations, then mechanically tested and analyzed. They were different from each other depending on the fiber/gypsum (f/g) content, as gypsum was progressively replaced by BN fibers by volume from 10% to 40%. The materials used are described below.
  • The binder was Sival gypsum powder (Leiria, Portugal), type A according to EN 13279-1:2008 [22]. It has more than 90% purity, 0.6–0.7 g/cm3 bulk density, and pH 7.0 (manufacturer’s data).
  • For gypsum hydration, tap water (Coimbra, Portugal) in accordance with Council Directive 98/83/EC [23] was used.
  • In addition, PE fibers were used. They were extracted from BNs produced by Conmetall Meister (Conmetall Meister, Celle, Germany). First, the BNs were reduced with a paper-cutter to small pieces, which were ground by a Retsch (Retsch, Haan, Germany) cutting mill machine. After that, the ground material was sifted through sieves with meshes of 0.850 mm and 0.425 mm. The material retained on the 0.425 mm mesh sieve was characterized as BN fibers (Figure 1). The thickness of the BN fibers was 0.12 mm. Their bulk density was determined to be 0.35 g/cm3.
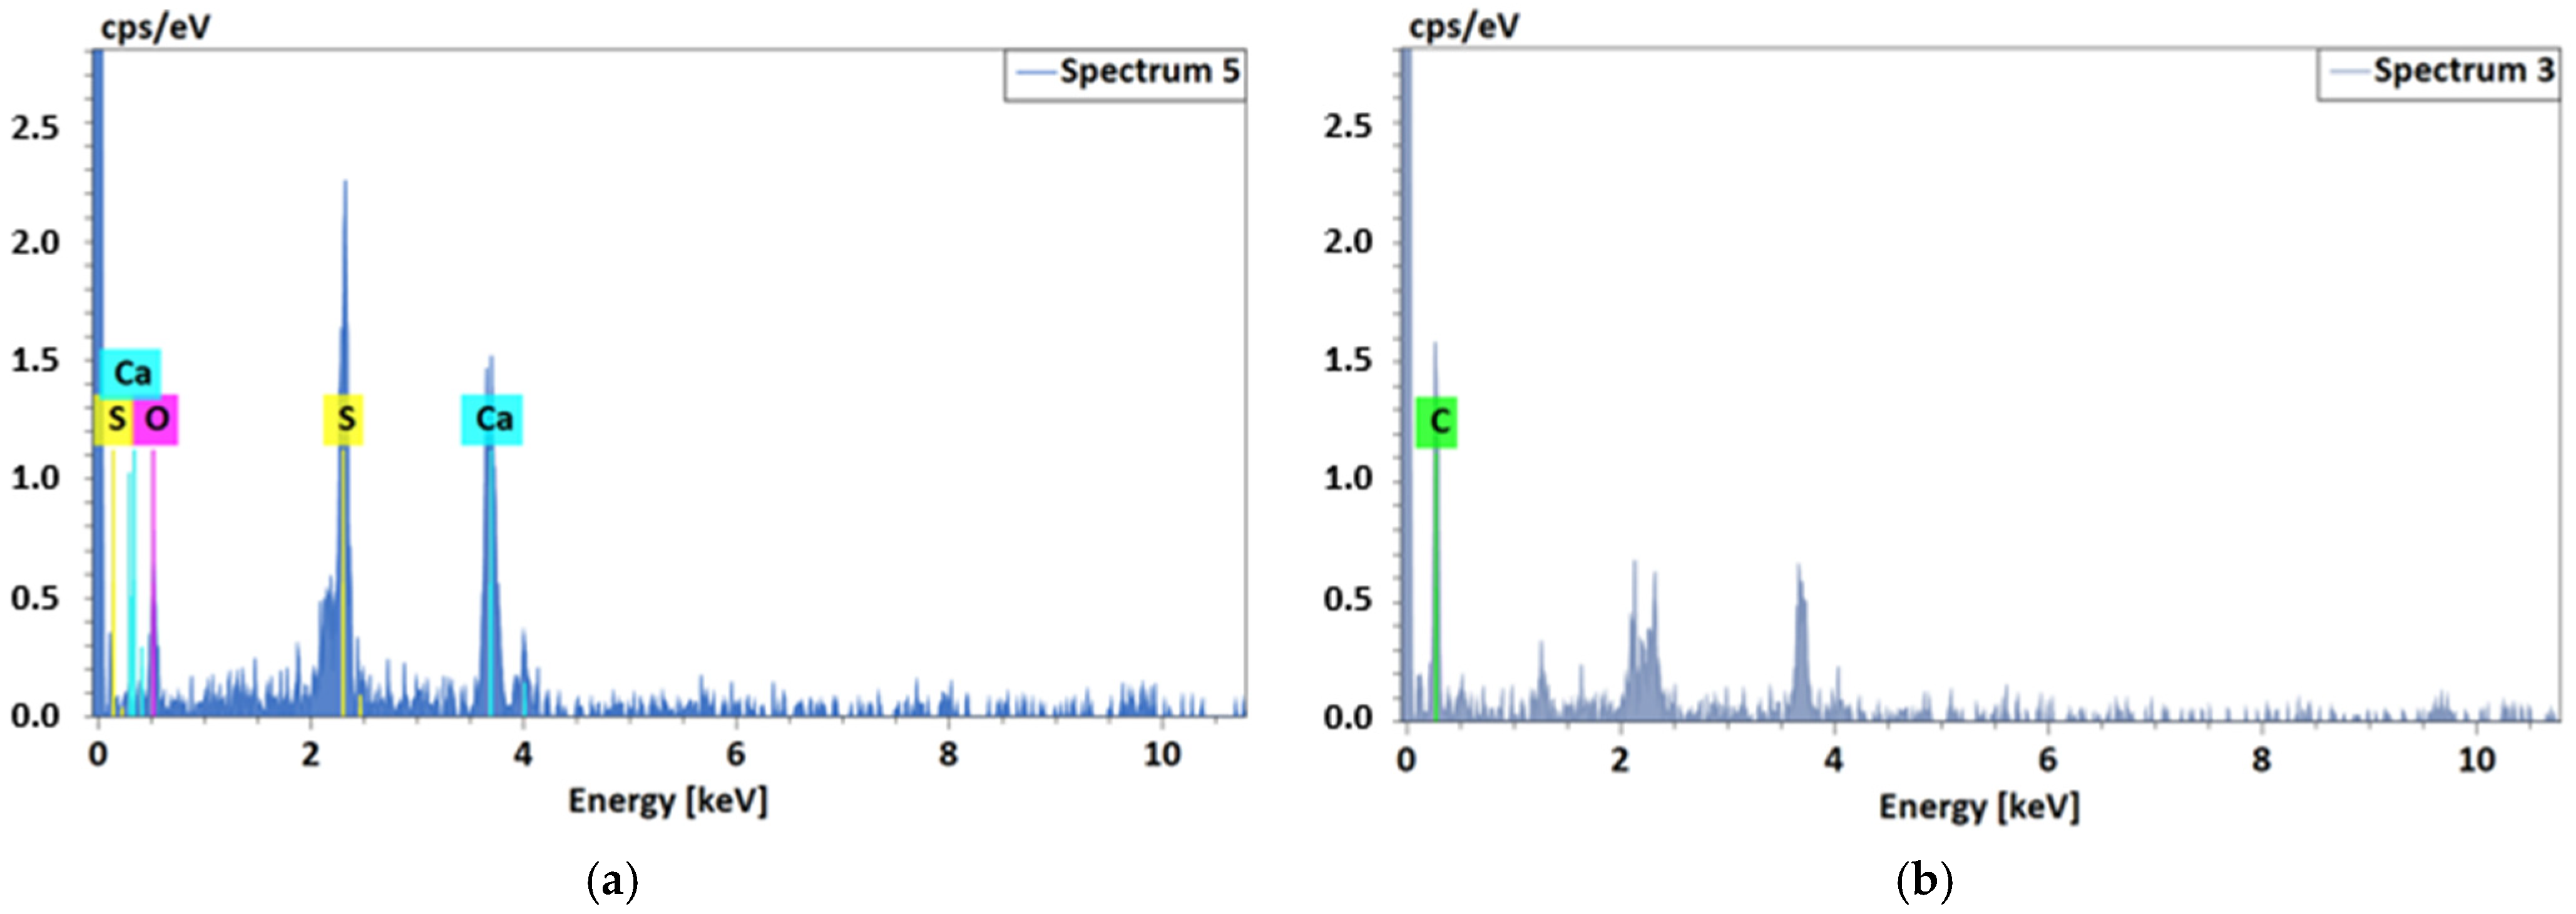
Energy dispersive X-ray (EDX) analysis was conducted to detect the constituent elements of the gypsum powder and BN fibers (Figure 2).
The elemental composition of gypsum powder (Figure 2a) showed Ca (Calcium), S (Sulfur), and O (Oxygen), elements of calcium sulfate hemihydrate (CaSO4∙0.5H2O), the main component of gypsum [20]. Figure 2b showed only C (Carbon) as the elemental composition of BN fibers, which was expected considering that PE (CH2-CH2)n is a polymeric material.
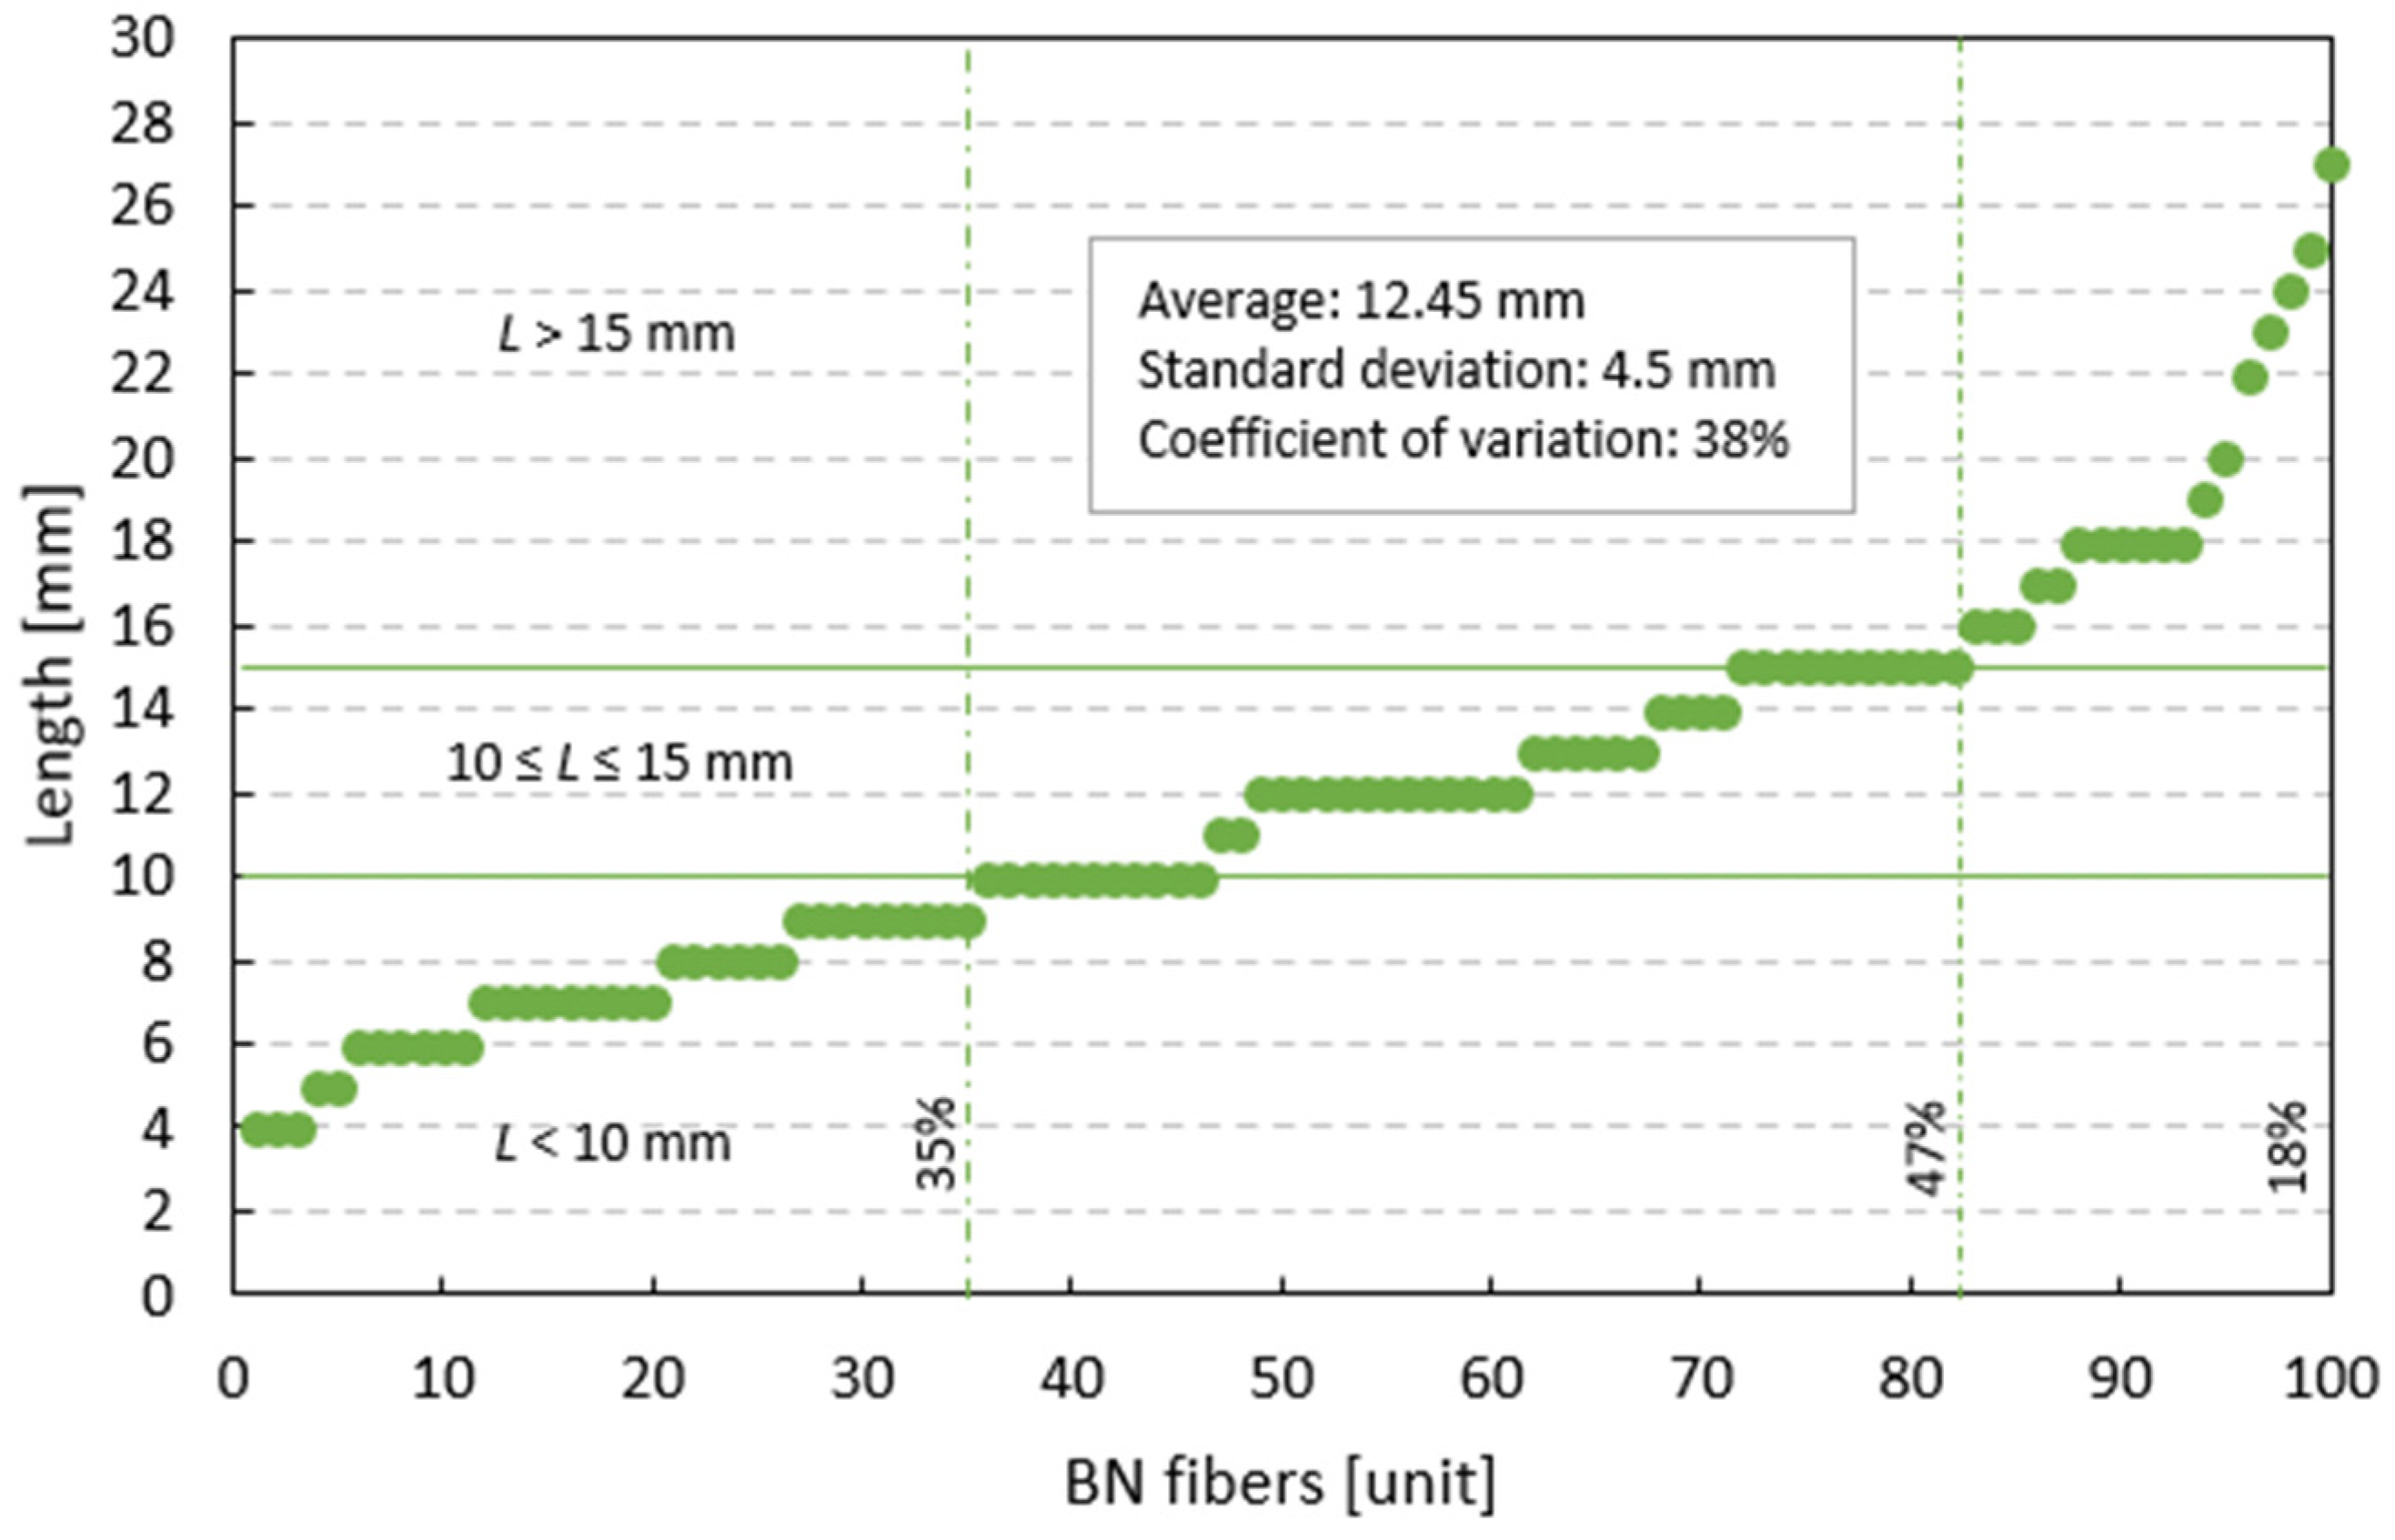
In addition, a total of 100 BN fibers were randomly selected for length analysis to correlate the physical characteristics of the GCs. According to Songkhla et al. [14], the physical distribution of fiber size can significantly influence the mechanical and durability properties of composites. Furthermore, consistency in length/width distribution offers a potential optimization point for achieving effective mechanical reinforcement without compromising workability or causing fiber clumping. The length analysis is presented in Figure 3.
Fiber lengths ranged from 4 to 27 mm. The standard deviation is 4.75 mm, and the coefficient of variation is 38%, reflecting a non-uniform distribution. However, the fibers had an average length and mode of 12 mm, with the largest quantity in the range between 10 and 15 mm, representing 47%. Fibers smaller than 10 mm comprised 35%, and those larger than 15 mm comprised 18% of the total quantity. This indicates a convergent length range (10–15 mm), resulting from the cutting/sieving process applied, which represents an optimized selection for enhancing mechanical properties, such as crack-bridging potential and uniform dispersion within the gypsum mixture [24,25].
Considering fiber lengths shorter than 5 mm (3%) and longer than 20 mm (5%), due to the low percentage, it is possible to state that these atypical values have a limited impact on the performance of the composites and may influence localized behaviors only [26].

2.2. Experimental Program

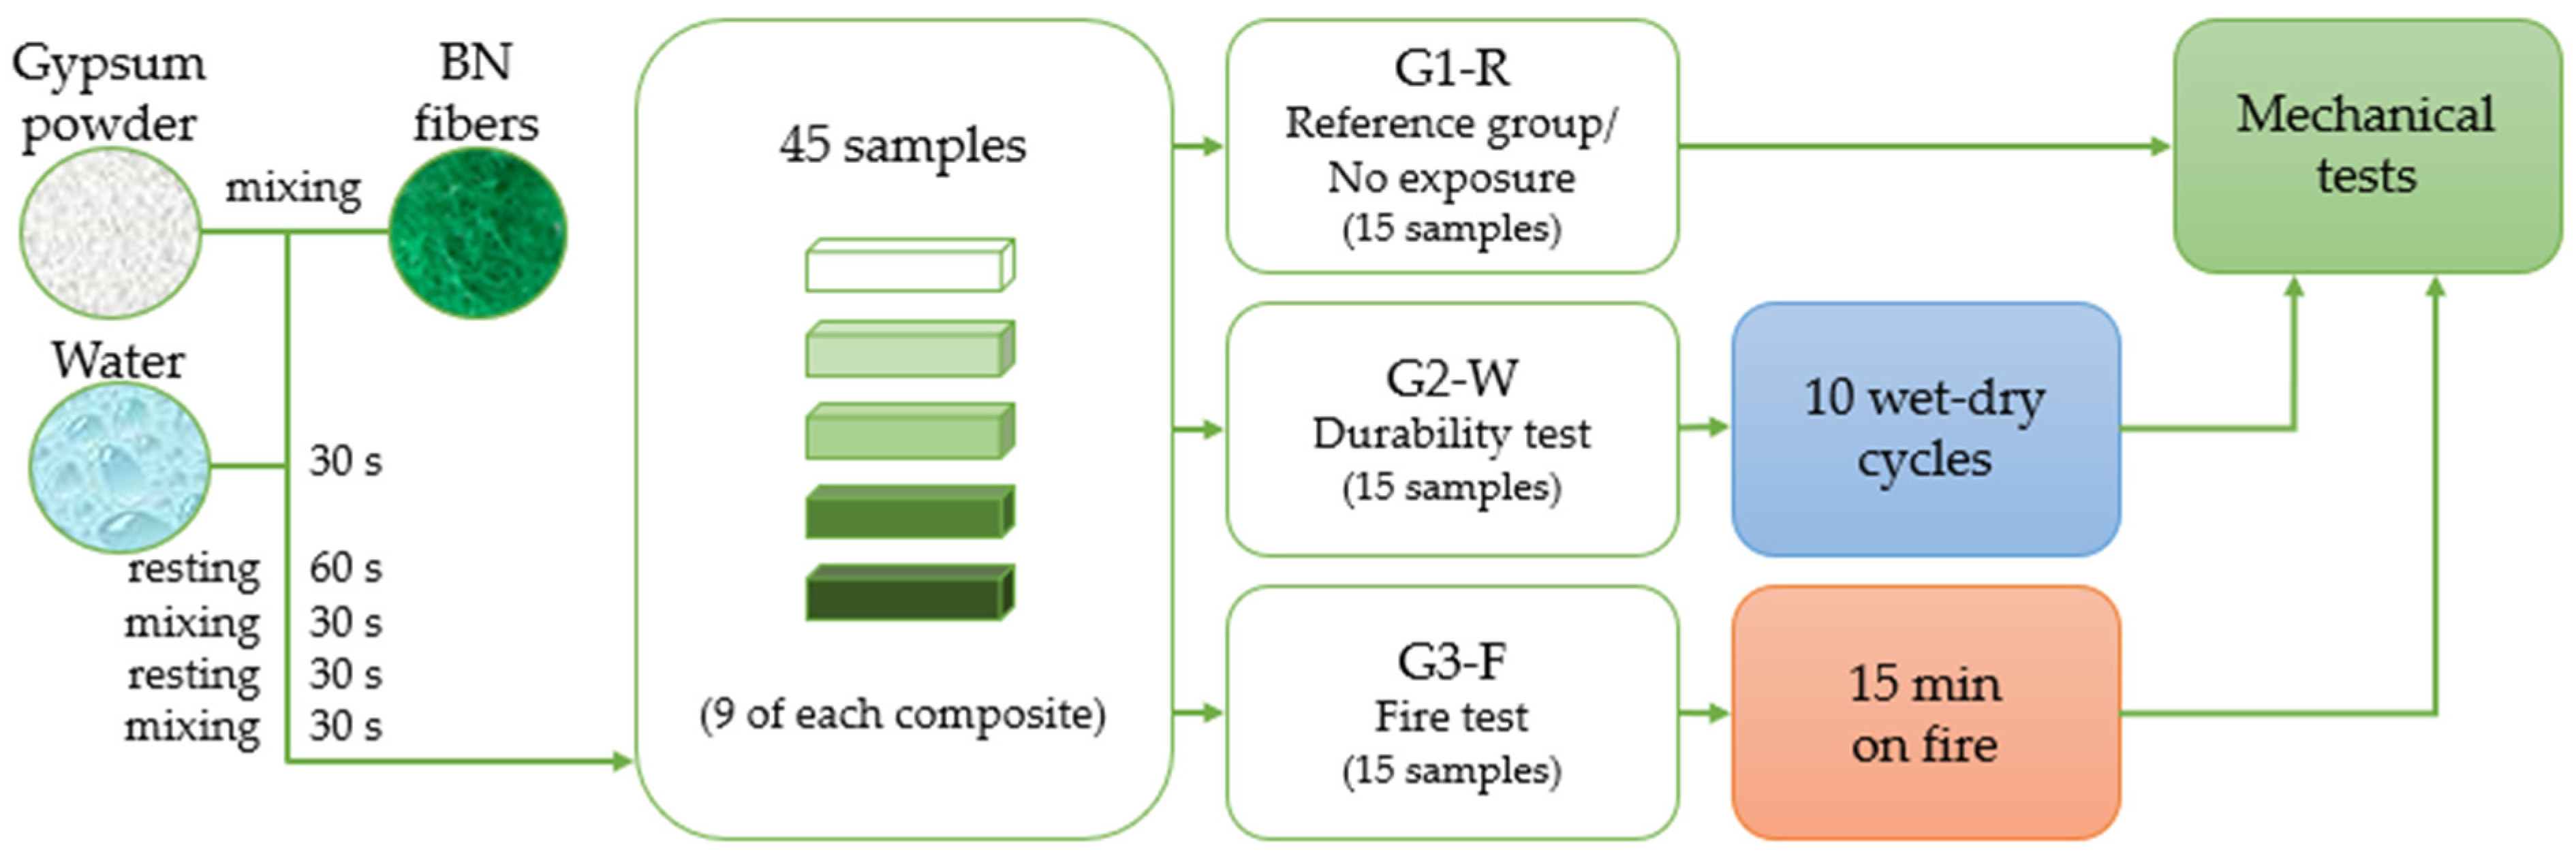
The dimensions of the samples were 160 × 40 × 40 mm, and the water/gypsum (w/g) ratio was defined to be 0.7 for all samples. The only variable in the compositions was the f/g content. Thus, it was possible to better compare the influence of the incorporation of BN fibers in each composite. Furthermore, this w/g ratio gave the fresh mixture good workability (165 ± 10 mm of flow diameter after a shaking table test) [7]. The compositions of the samples are displayed in Table 1, and the experimental program of this study is presented in Figure 4.
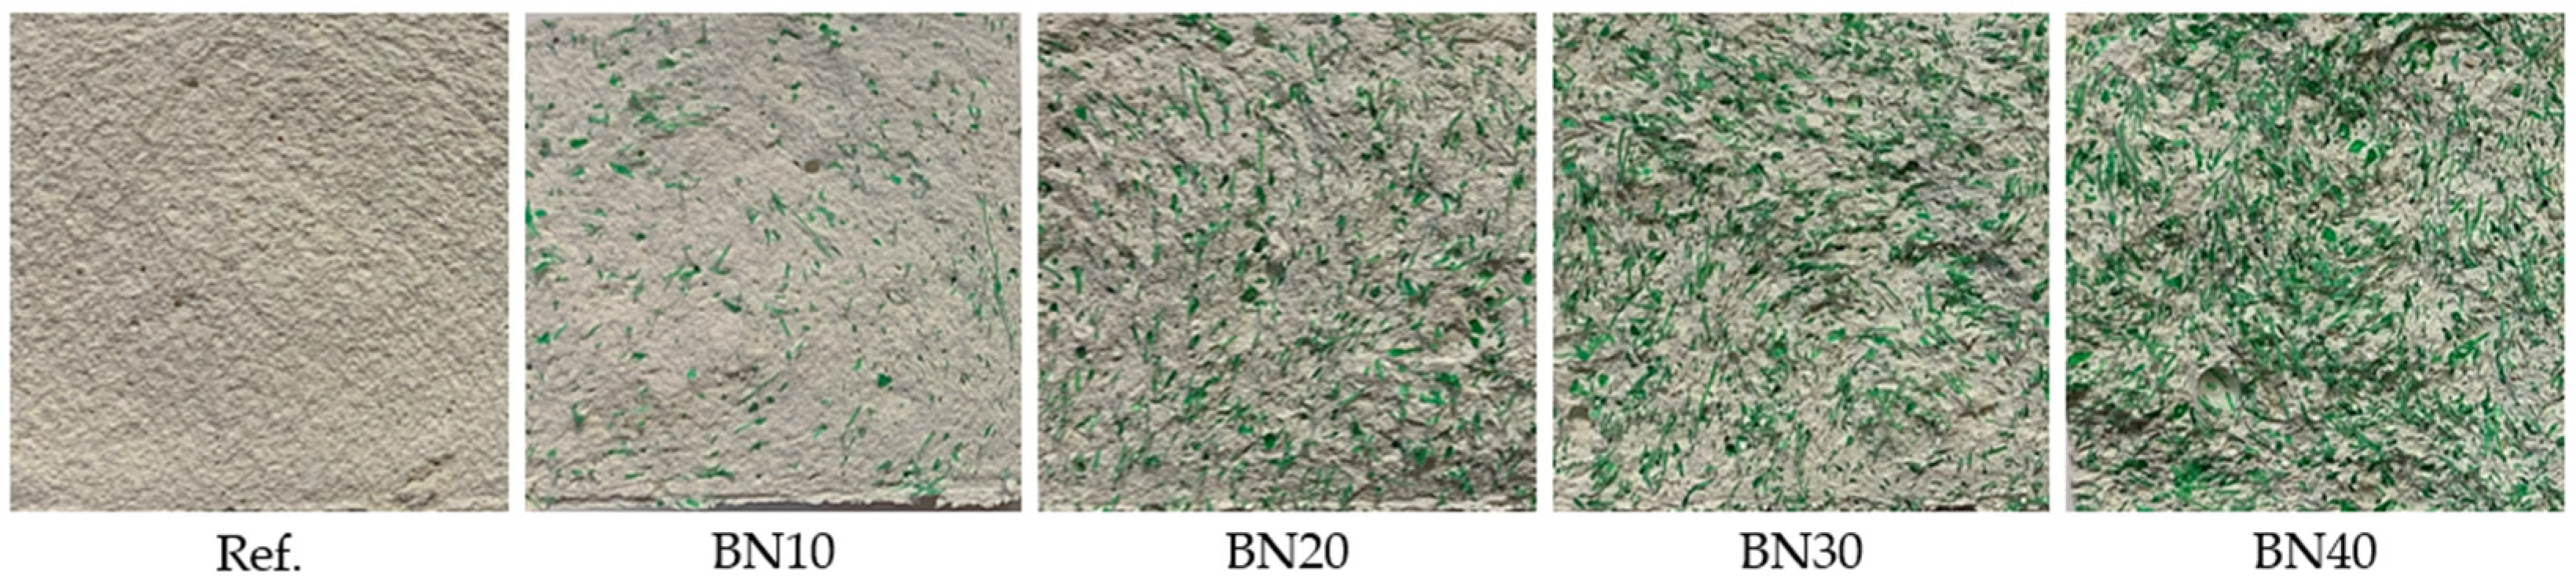
The samples were prepared in accordance with EN 13279-2:2014 [27]. Initially, the dry materials were mixed manually, and water was added for 30 s. After 60 s of resting, it was mixed for 30 s, then left to rest for 30 s, and mixed one more time for 30 s. Nine units of each composite were molded, totaling forty-five samples. All of them were placed in a controlled environment with a temperature of 23 ± 1 °C and relative humidity of 55 ± 5%. After 7 days, they were dried in an oven with a temperature of 40 ± 2 °C until a constant mass was achieved. Figure 5 shows the cross-sections of the samples, where it is possible to visualize the distribution of BN fibers within the gypsum matrix and verify that the BN fibers did not significantly agglomerate, even in the BN40 sample, the composite with the highest fiber content.
From this point on, the developed composites were divided into three representative groups, each with fifteen samples (three of each composite). Group 1 (G1-R) was the reference group and was mechanically tested following the procedures described in Section 2.2.1. Groups 2 (G2-W) and 3 (G3-F) were subjected to wet–dry cycles and fire tests described in Section 2.2.2 and Section 2.2.3, respectively. Thereafter, G2-W and G3-F were tested the same way as G1-R to verify the influence of these exposures on their mechanical properties.
Beyond that, G2-W was used to determine: (a) the bulk density (DB) by adapting EN 12859:2011 [28] test procedures. The dimensions of the samples were measured with a Powerfix (Powerfix Profi Z22855, Milomex Ltd., Bedfordshire, UK) electronic caliper, accuracy 0.01 mm, and the weights were obtained using a Vevor (Taicang Vevor Machinery Equipment Co., Ltd., Taicang, China) 176 electronic balance, accuracy 0.01 g, to calculate the mass-to-volume ratio; (b) the total water absorption (WABS) and open porosity (ρo) by adapting EN 14617-1:2013 [29] and EN 1936:2006 [30], respectively. First, the dry mass (MD) of the samples was measured, followed by the mass in water (MI) and saturated mass (MS) after 2 h of complete immersion. WABS and ρo were computed using the following expressions,
W ABS = M S M D M D × 100
ρ O = M S M D M S M I × 100

2.2.1. Mechanical Tests

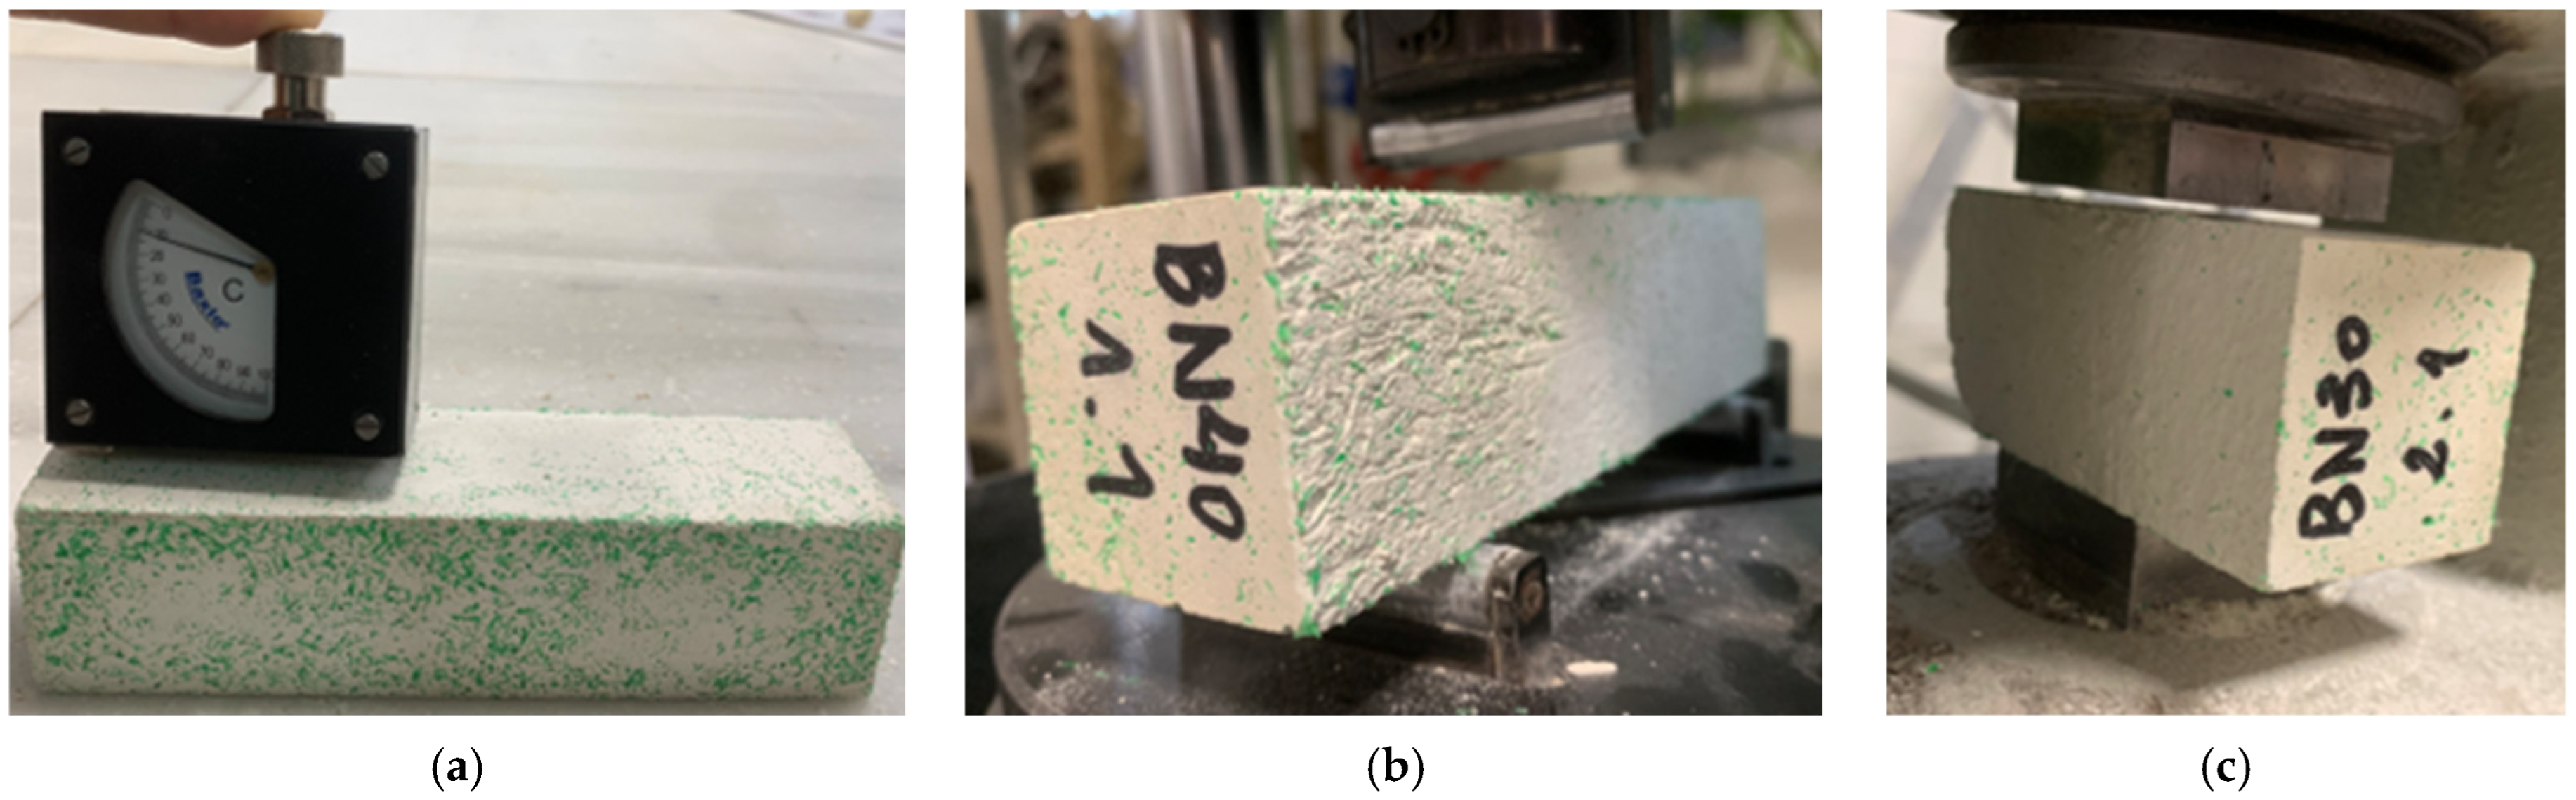
The standard EN 12859:2011 [28] was followed to evaluate the surface hardness using a Baxlo (Barcelona, Spain) Shore C durometer tester, model 53505/C-U, with a resolution of 1 degree Shore (Figure 6a). Five measurements were taken per face (on two parallel plane faces). The dynamic modulus of elasticity (E) was obtained based on ASTM C597-22 [31]. An IEP (Madrid, Spain) ultrasonic tester was used to measure the time (t) it takes an ultrasonic pulse to go through the sample in the longitudinal direction. The velocity (V) of the propagation and E were calculated using the following expressions,
V   [ m / s ] = L t
E   [ M P a ] = D B V 2 ( 1 + ν ) ( 1 2 ν ) ( 1 ν )
where L is the samples’ length [m], and ν is the Poisson coefficient.
Flexural and compressive strengths were determined according to EN 13279-2:2014 [27]. For this test, an AUTOTEST (S.A.E. IBERTEST, Madrid, Spain) 200-10SW hydraulic press was used, and it applied a progressive load (at speeds of 10 N/s for bending and 20 N/s for compression) on the samples until breakage (Figure 6b,c).

2.2.2. Wet–Dry Cycles Test

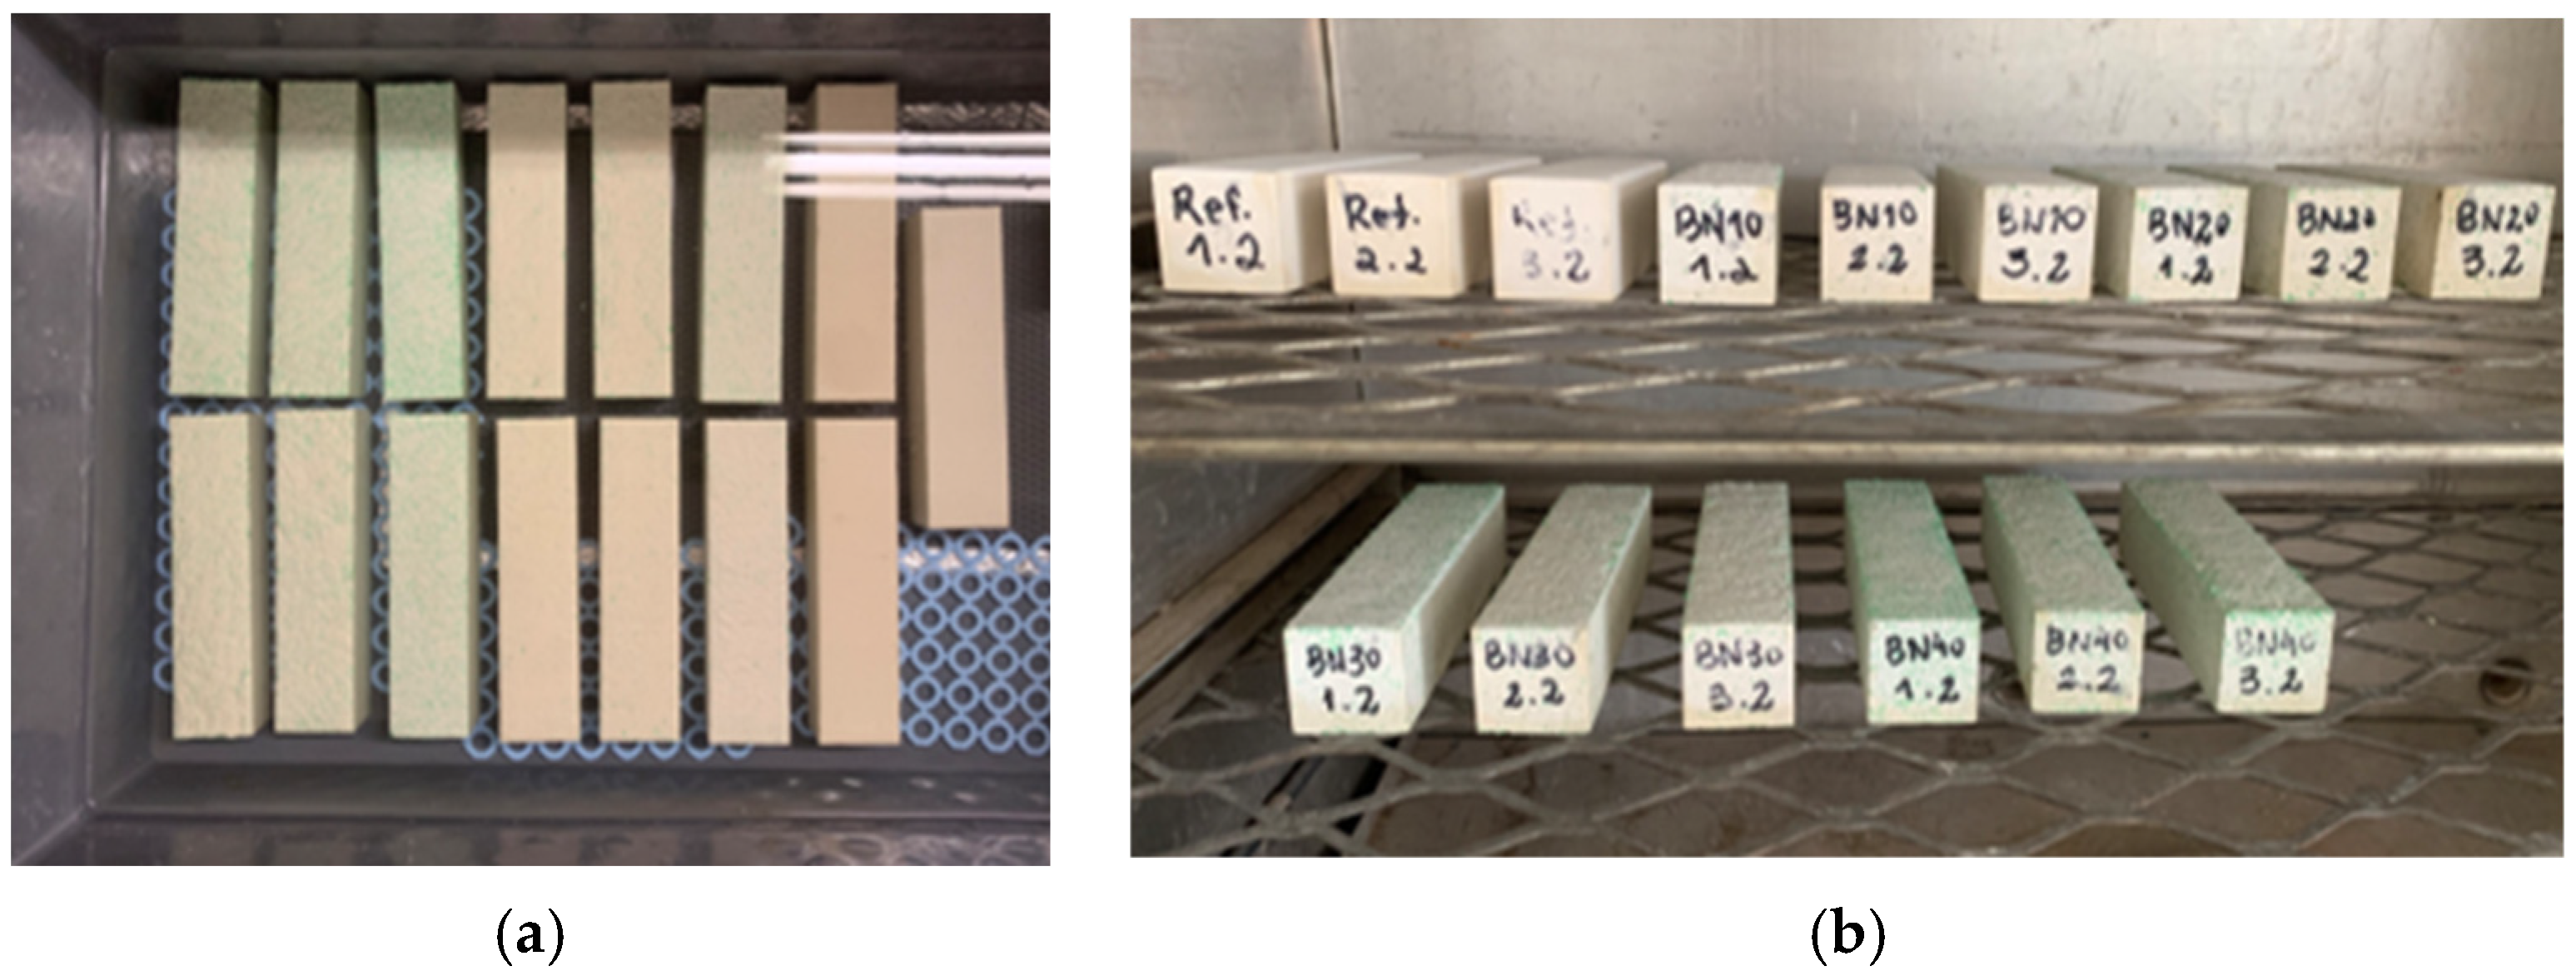
Based on ASTM D559:2012 [32], wet–dry cycles were performed to simulate climatic aging (durability test) on G2-W. A cycle consisted of completely immersing the samples in water for 24 h and then placing them in an oven for 24 h at 60 °C (Figure 7). In their study, Salih et al. [33] did not notice big variations in the mechanical properties after 5 wet–dry cycles. Therefore, for this research, 10 cycles were conducted. The dry weight of the samples of G2-W was measured before this exposure began and after each cycle.

2.2.3. Fire Test

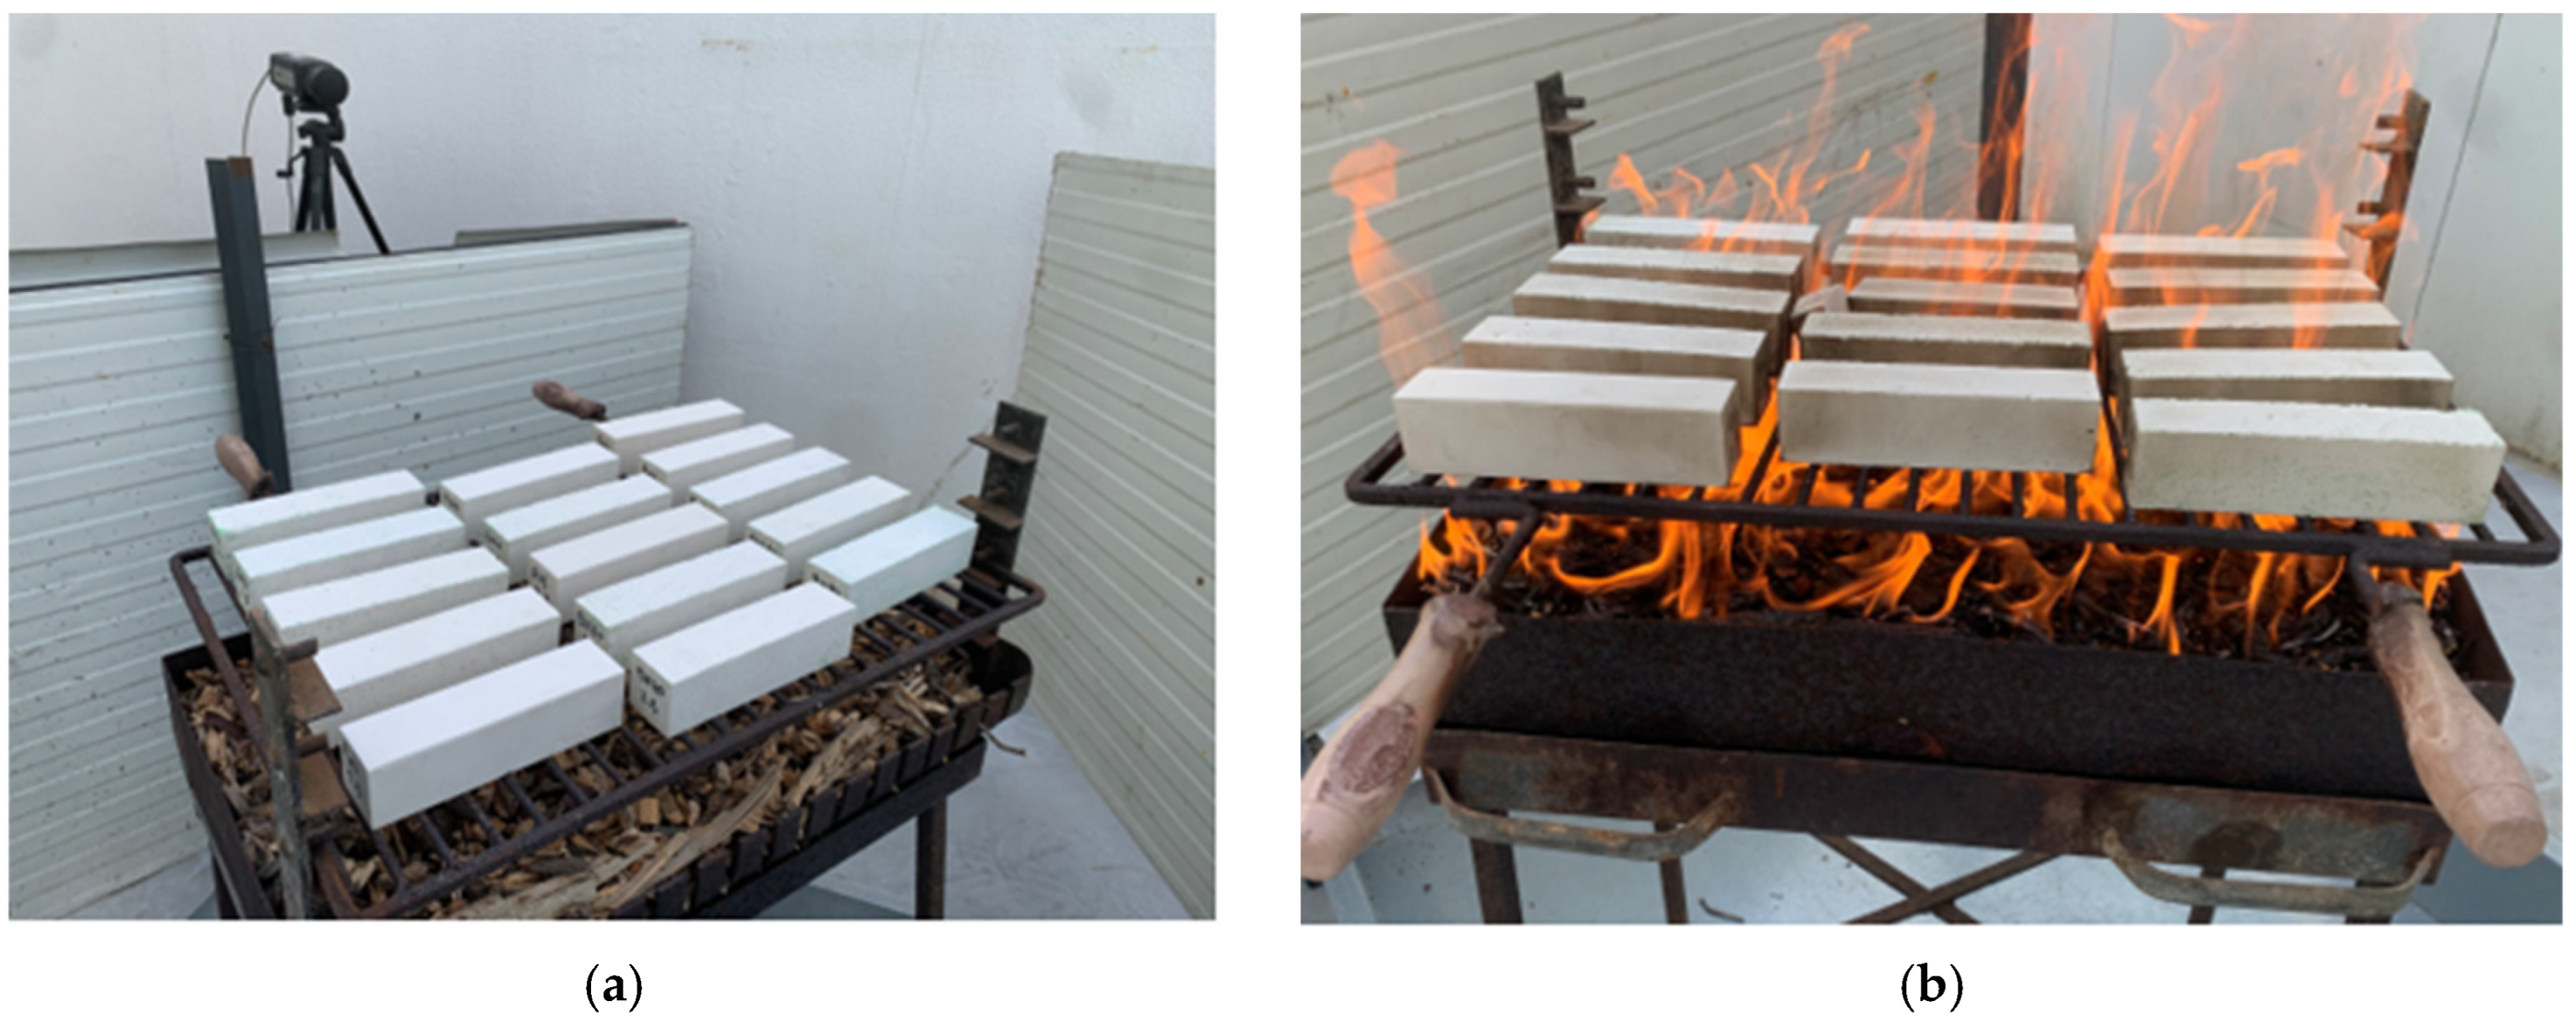
A non-standard fire exposure was conducted on G3-F samples using a barbecue grill with a wood fuel source, as used in other studies [19,34]. The test duration (approximately 15 min) was determined by the complete consumption of a fixed fuel load, not by a standard time-temperature curve. This adaptation of ISO 834-1:1999 [35] was made to verify fire exposure as closely as possible to a real-life fire flames situation (a building on fire). Approximately 0.04 m3 of pine wood was used as calorific potential, which was sprinkled with heptane. The samples were horizontally placed on a steel grid of 0.56 × 0.36 m, 7 cm above the wood. The test started with the wood ignition and lasted 15 min. Then, the samples were cooled down on site. Figure 8 depicts this fire exposure. Furthermore, the upper face temperatures of the samples were recorded during the test with a FLIR (Täby, Sweden) A600 IR thermographic camera. The averages were calculated from 3 temperatures per sample. As 3 samples of each composite (different fiber contents) were tested, a total of 9 values were obtained for each composite. The G3-F samples were weighed before and after this test to determine the mass loss.
After the fire test, some particles of the samples were taken and coated by a Cressington (Watford, UK) 108 auto evaporator with a thin layer of gold. Then, they were placed in a TESCAN Vega 4 microscope (Brno, Czech Republic) operating at 20 kV to obtain scanning electron microscopy (SEM) images, which allowed morphological analysis and a relationship with the results of the fire test.

2.2.4. Toxicity Estimation

The emission of toxic gases is the leading cause of death in fires, so it is essential to analyze their potential generation during combustion, particularly in compounds that incorporate added plastic waste [36].
A theoretical estimate has been made of the CO and CO2 emissions from the gypsum compounds produced in this research, used as interior wall panels in a typical room measuring 3.0 × 4.0 × 2.5 m3, in the event of a fire. This theoretical estimation was based on the chemical composition and thermogravimetric analysis (TGA) of the gypsum matrix and the BN fibers to better visualize the effects of high temperatures on them. It should be noted that preparing the samples for this grinding and sieving test causes the fibers in the composites to separate. The composite samples were ground in an agate mortar and sieved to 0.3 mm to obtain a homogeneous particle size. To avoid obtaining unrepresentative results, it was decided to analyze both materials separately. The analysis was conducted using TA Instruments SDT Q650 equipment (TA Instruments, New Castle, DE, USA) in a pre-filtered air atmosphere with a flow rate of 100 mL/min. The test started at room temperature and increased to 600 °C at a heating rate of 10 °C/min.

3. Results and Discussion

3.1. Total Water Absorption and Open Porosity

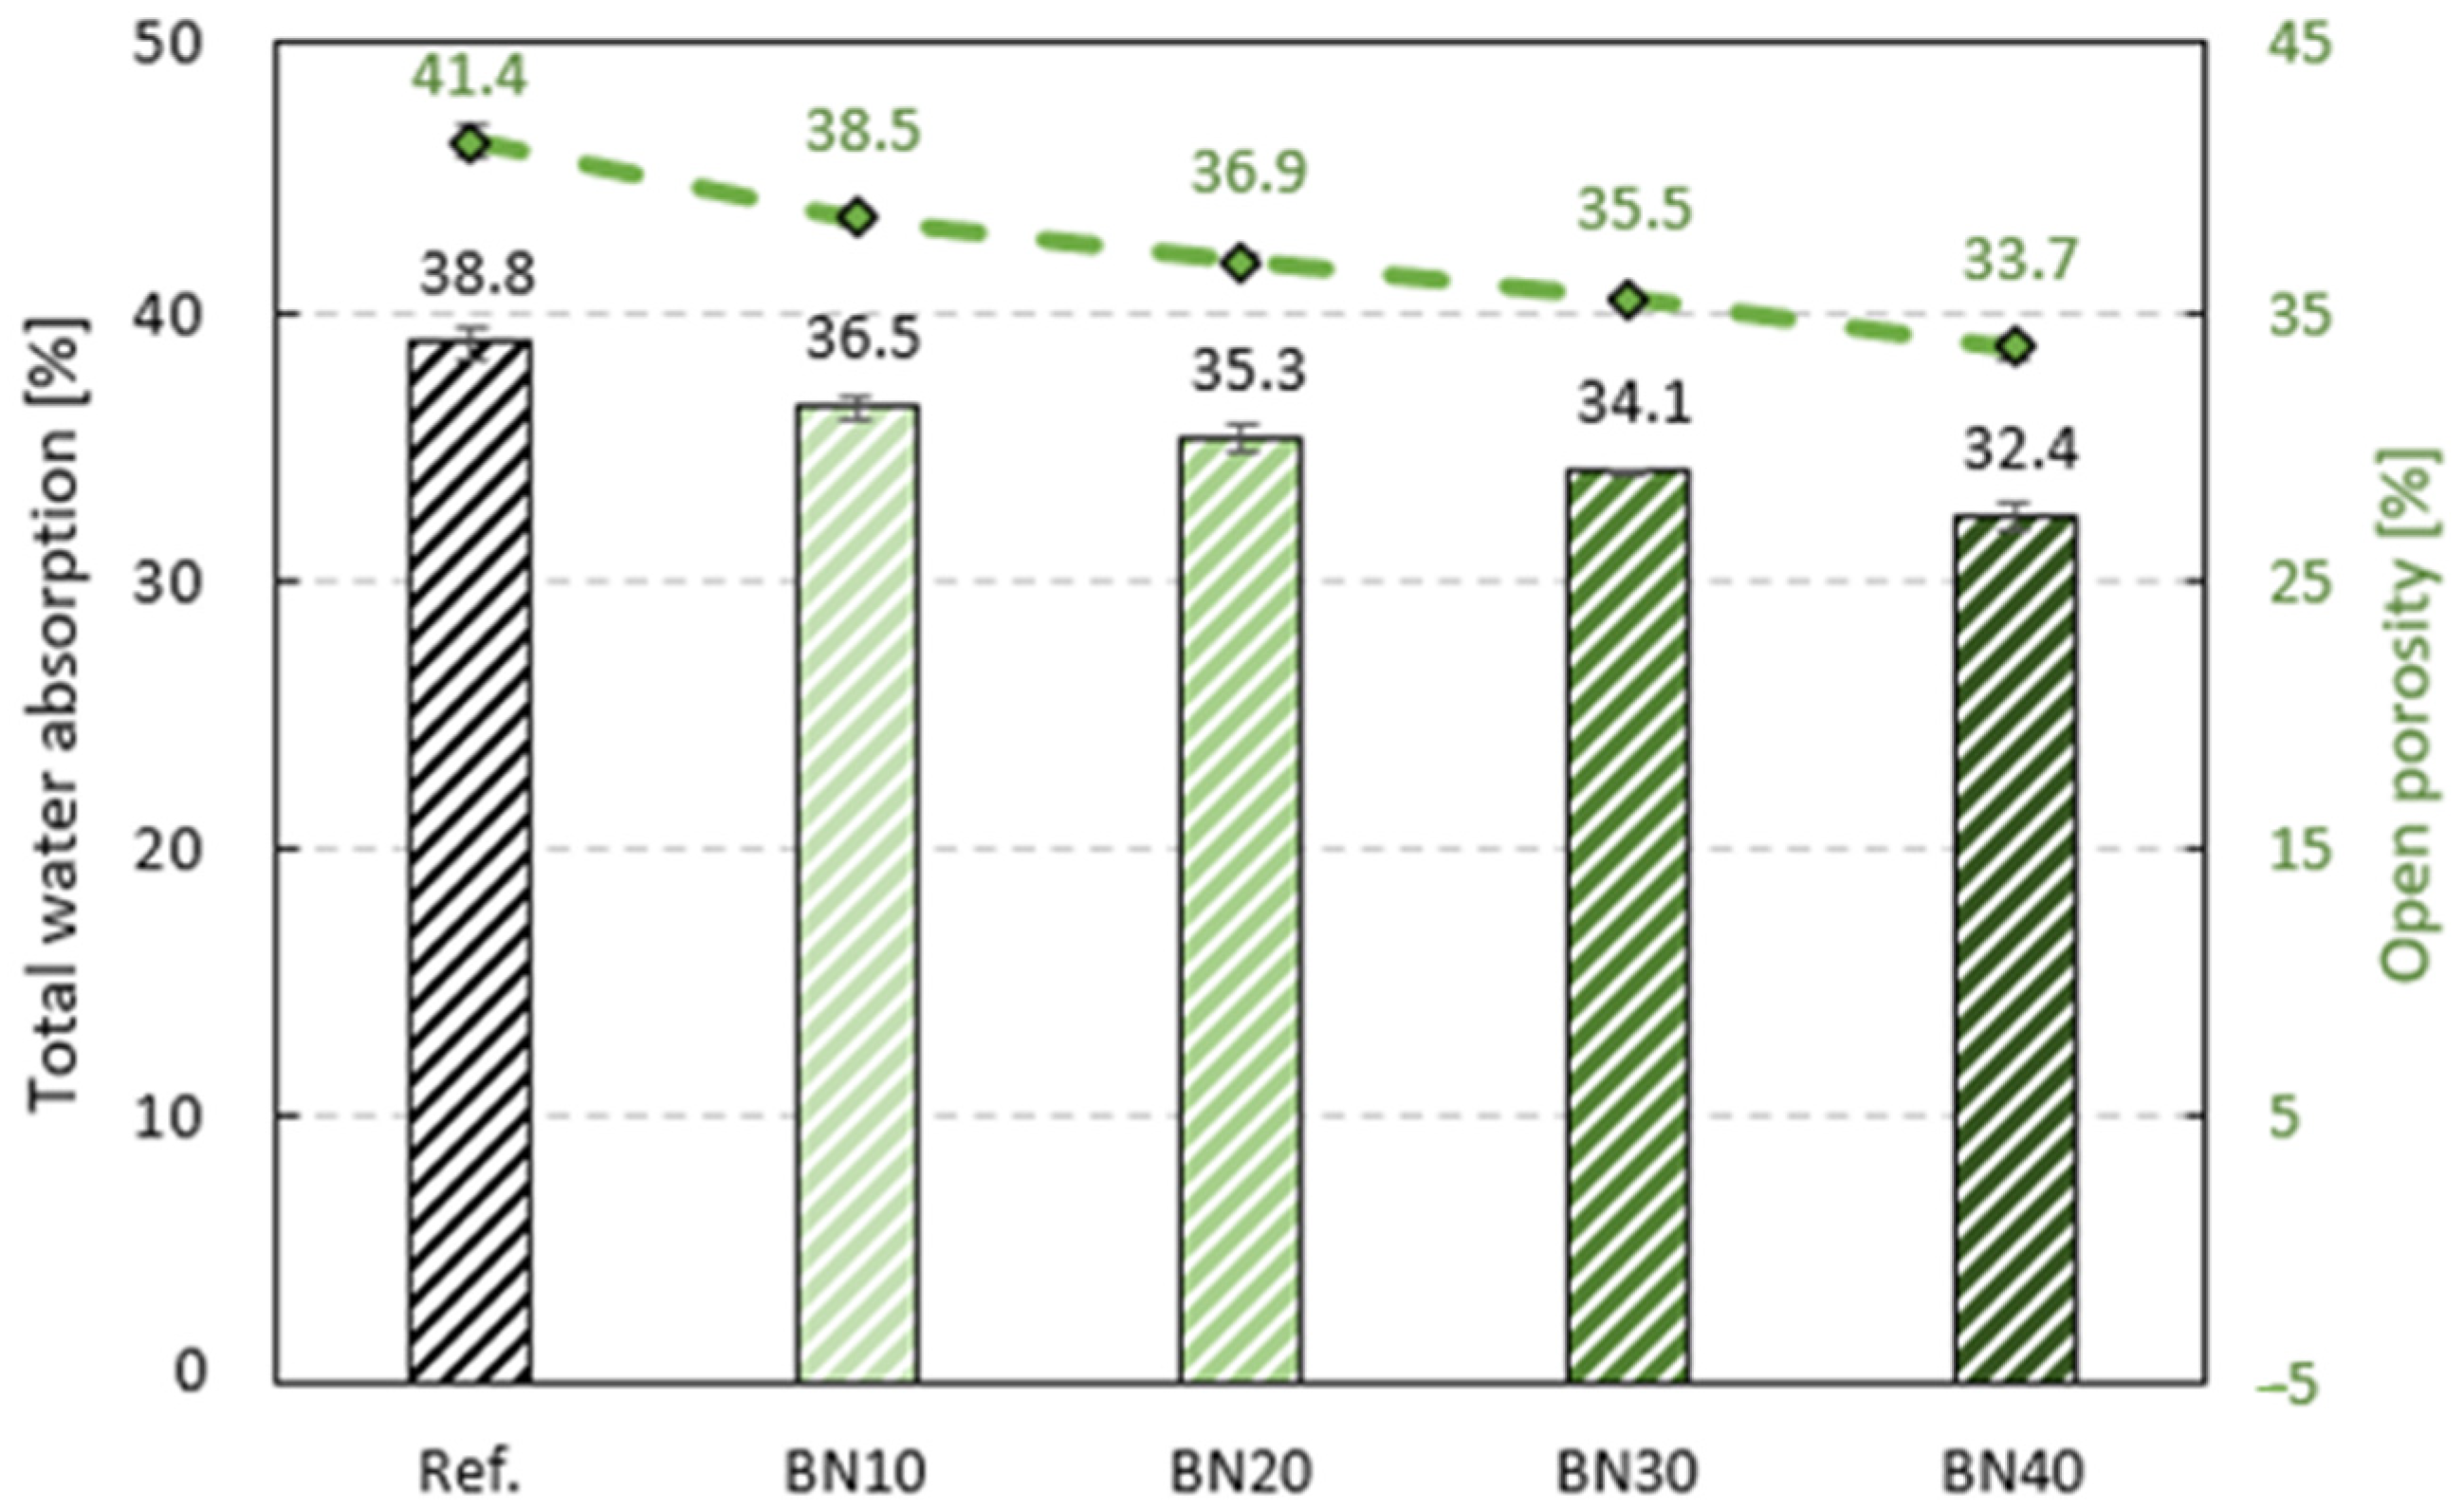
The results of total water absorption and open porosity tests (average of the values from three samples per composite) are shown in Figure 9 and Table 2.
A decreasing trend was observed in both properties (total water absorption and open porosity) with the incorporation of BN fibers in the gypsum matrix, the opposite of the results of Lima et al. [7] and Muhammed [37], where they obtained values higher than the reference values, when testing GCs reinforced with PA and PP fibers, respectively.
In this study, the higher the fiber/gypsum content, the lower the values. While the open porosity of BN10 was 7% lower than that of the reference, that of BN40 decreased by 19%. Since gypsum is a porous material, the open porosity decreased mainly because the BN fibers occupied a volume where, in the matrix without fibers, pores are normally formed. This phenomenon is known as the “filler effect” [38]. On the other hand, fiber agglomeration leads to an increase in open porosity [1]. Therefore, since this property decreased, it is possible to state that the BN fibers did not agglomerate in the matrix.
Open porosity directly influences total water absorption [39]; therefore, the latter also decreased. The total water absorption of BN40 was 17% lower compared to the reference, a behavior similar to that observed by Ferrández et al. [5]. Another factor that may have contributed to the reduction in total water absorption was the hydrophobic nature of the BN fibers. These findings favor the incorporation of BN fibers into GCs to be applied in humid environments.

3.2. Wet–Dry Cycles and Bulk Density

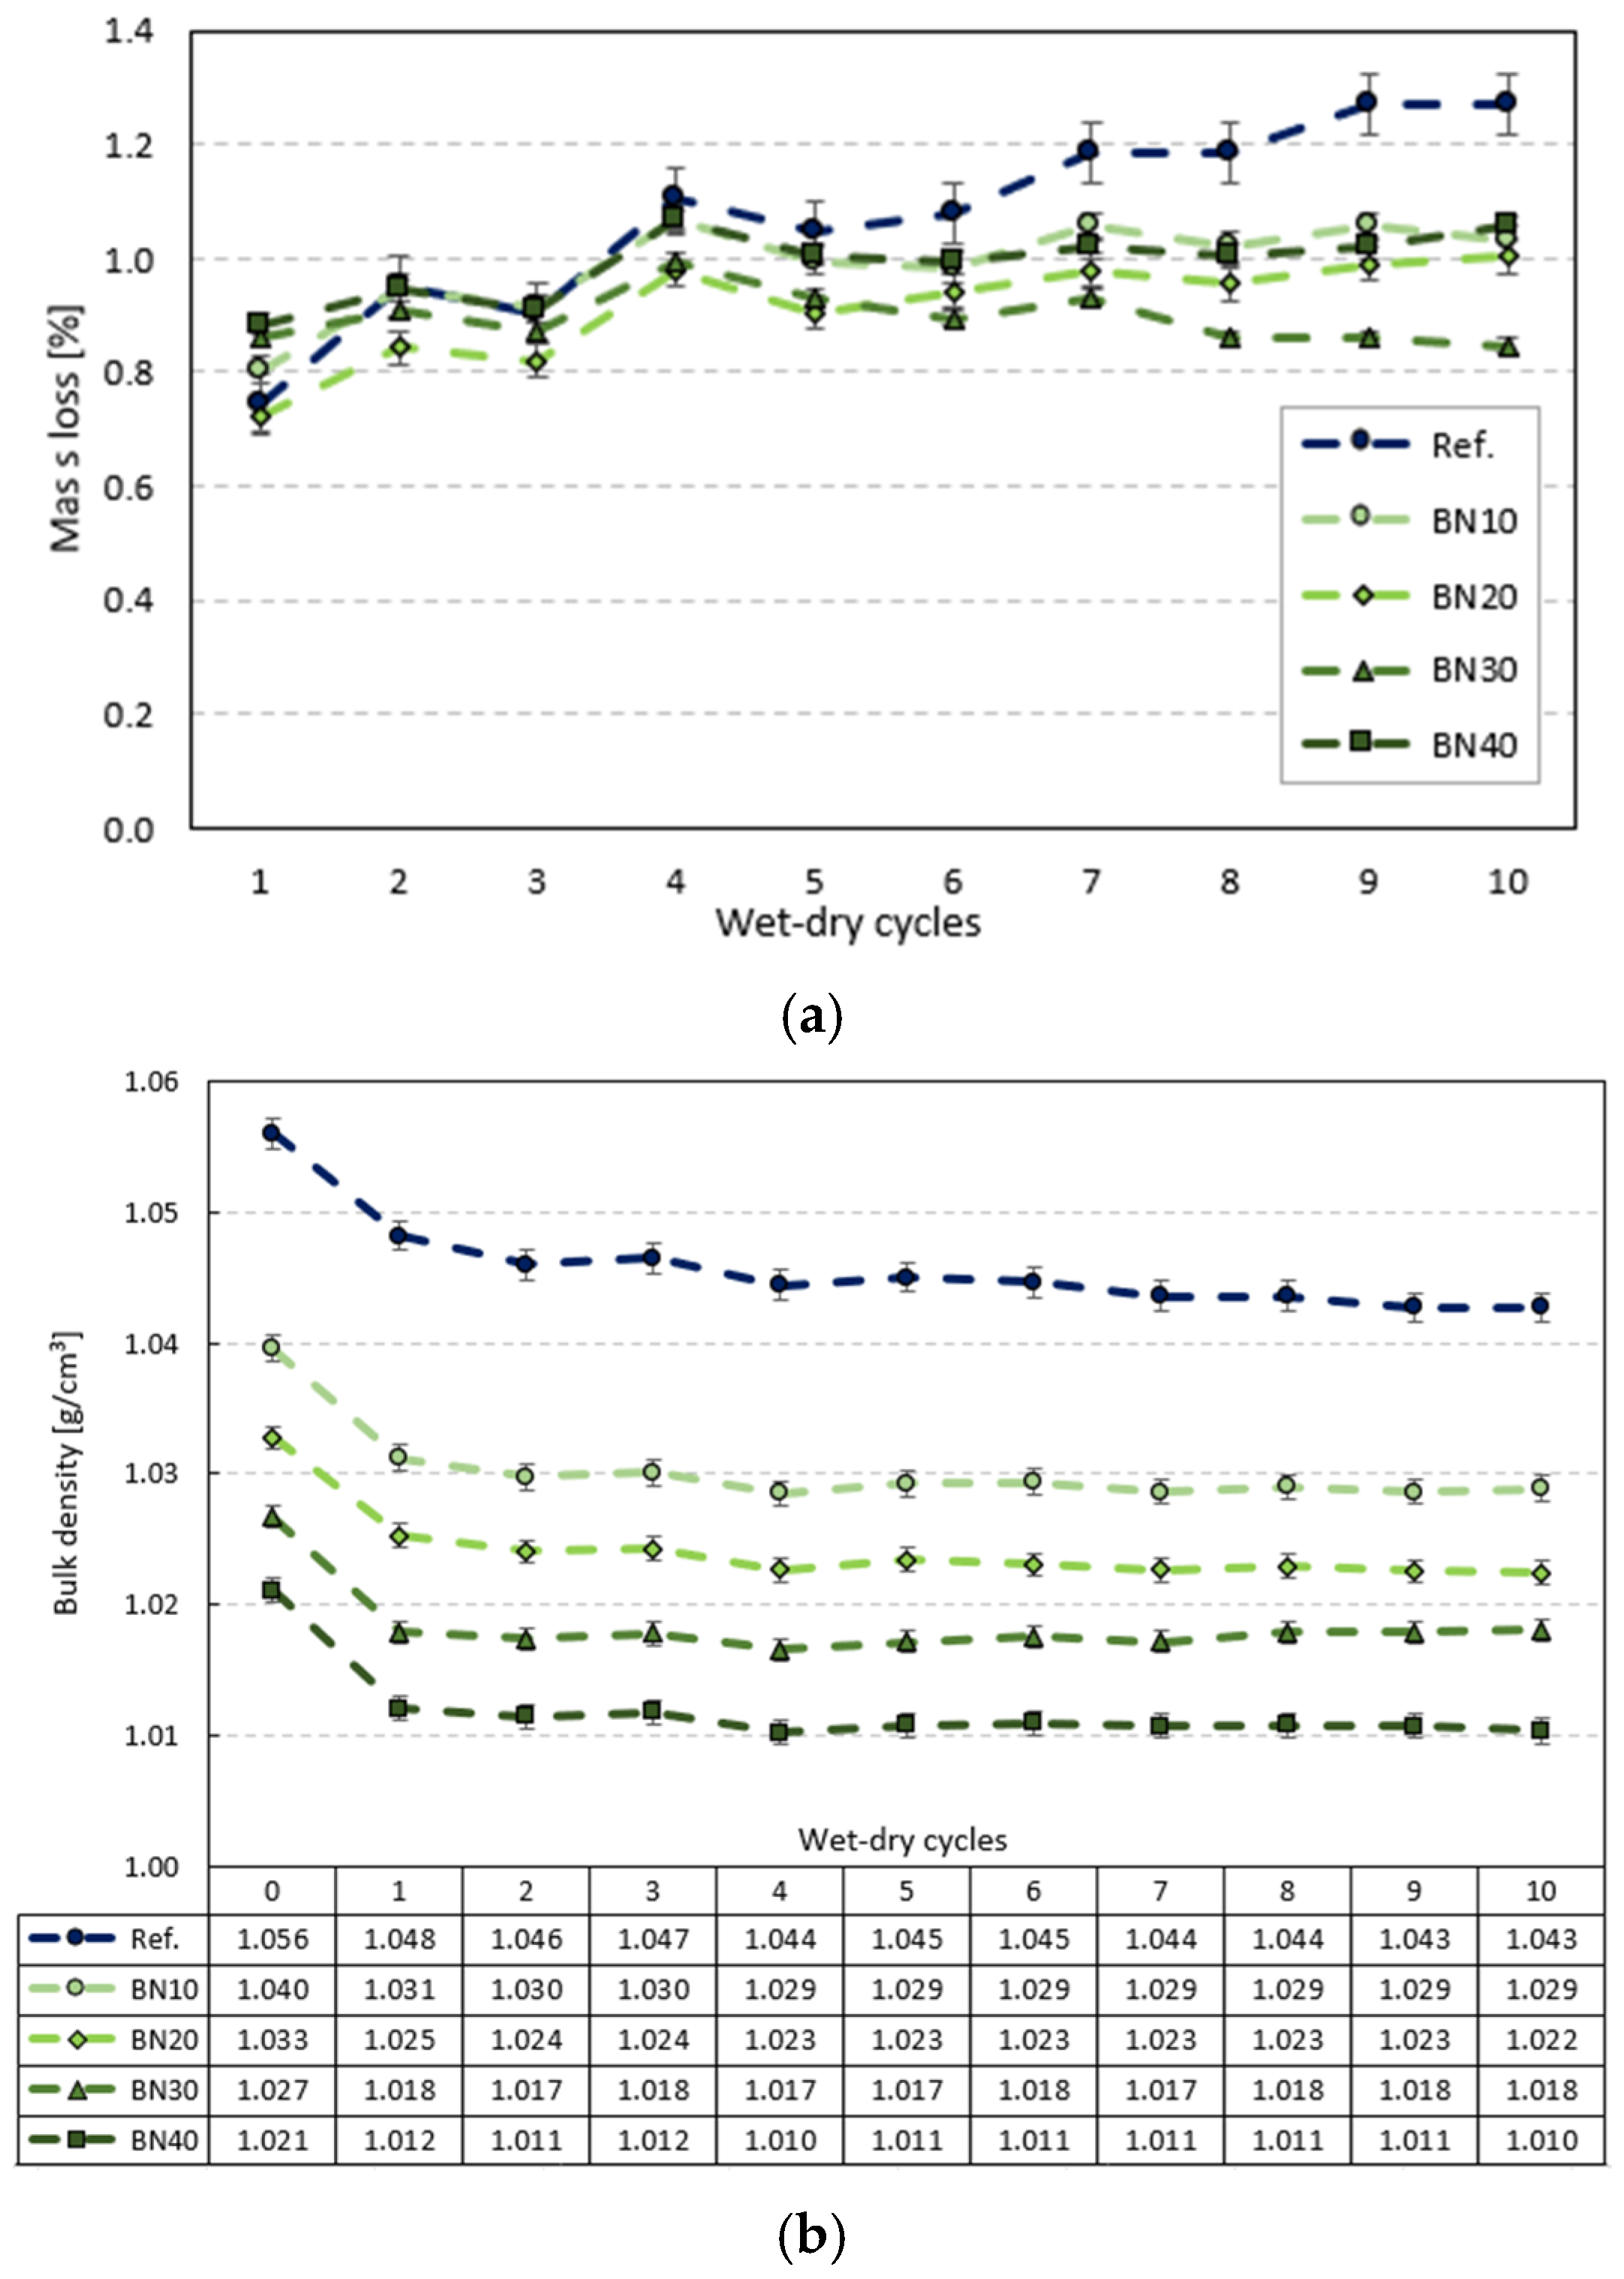
Durability tests were carried out with 10 wet–dry cycles to accelerate climatic aging of the BN fibers reinforced GCs (G2-W). The mass loss and the bulk density of the samples are shown in Figure 10. Before exposure to cycles, it can be noticed that the addition of BN fibers decreased the bulk density of the GCs. BN40 obtained the lowest value, 1.021 g/cm3, 3.3% lower than the reference value. Given the low bulk density of BN (PE) fibers, this decrease was expected, and it is better than the results achieved by Romero et al., whose recycled-fiber-reinforced GCs had a bulk density increase of 4.6% [40].
As can be seen in Figure 10b, after the first wet–dry cycle, the bulk density suffered the greatest decrease in all samples, by approximately 0.8%. Then, it tended to stabilize, with the exception of the fiber-free matrix, which only stabilized in the last two cycles, best seen in Figure 10a. Pedreño-Rojas et al. reported that wet–dry cycles lead to an increase in porosity, which consequently decreases the density and compactness of the materials [15].
At the end of this durability test, the mass loss of the reference sample was 1.3%, the same percentage as the reduction in bulk density. Those of the samples with BN fibers were reduced by around 1%, and BN30 had the lowest mass loss, only 0.8%, which was presented as the best-performing GC in the durability test. Despite these minimal reductions, it was observed that the BN fibers helped the GCs maintain the bulk density (thus retaining more mass and increasing dimensional stability) after exposure to wet–dry cycles.

3.3. Fire Behavior

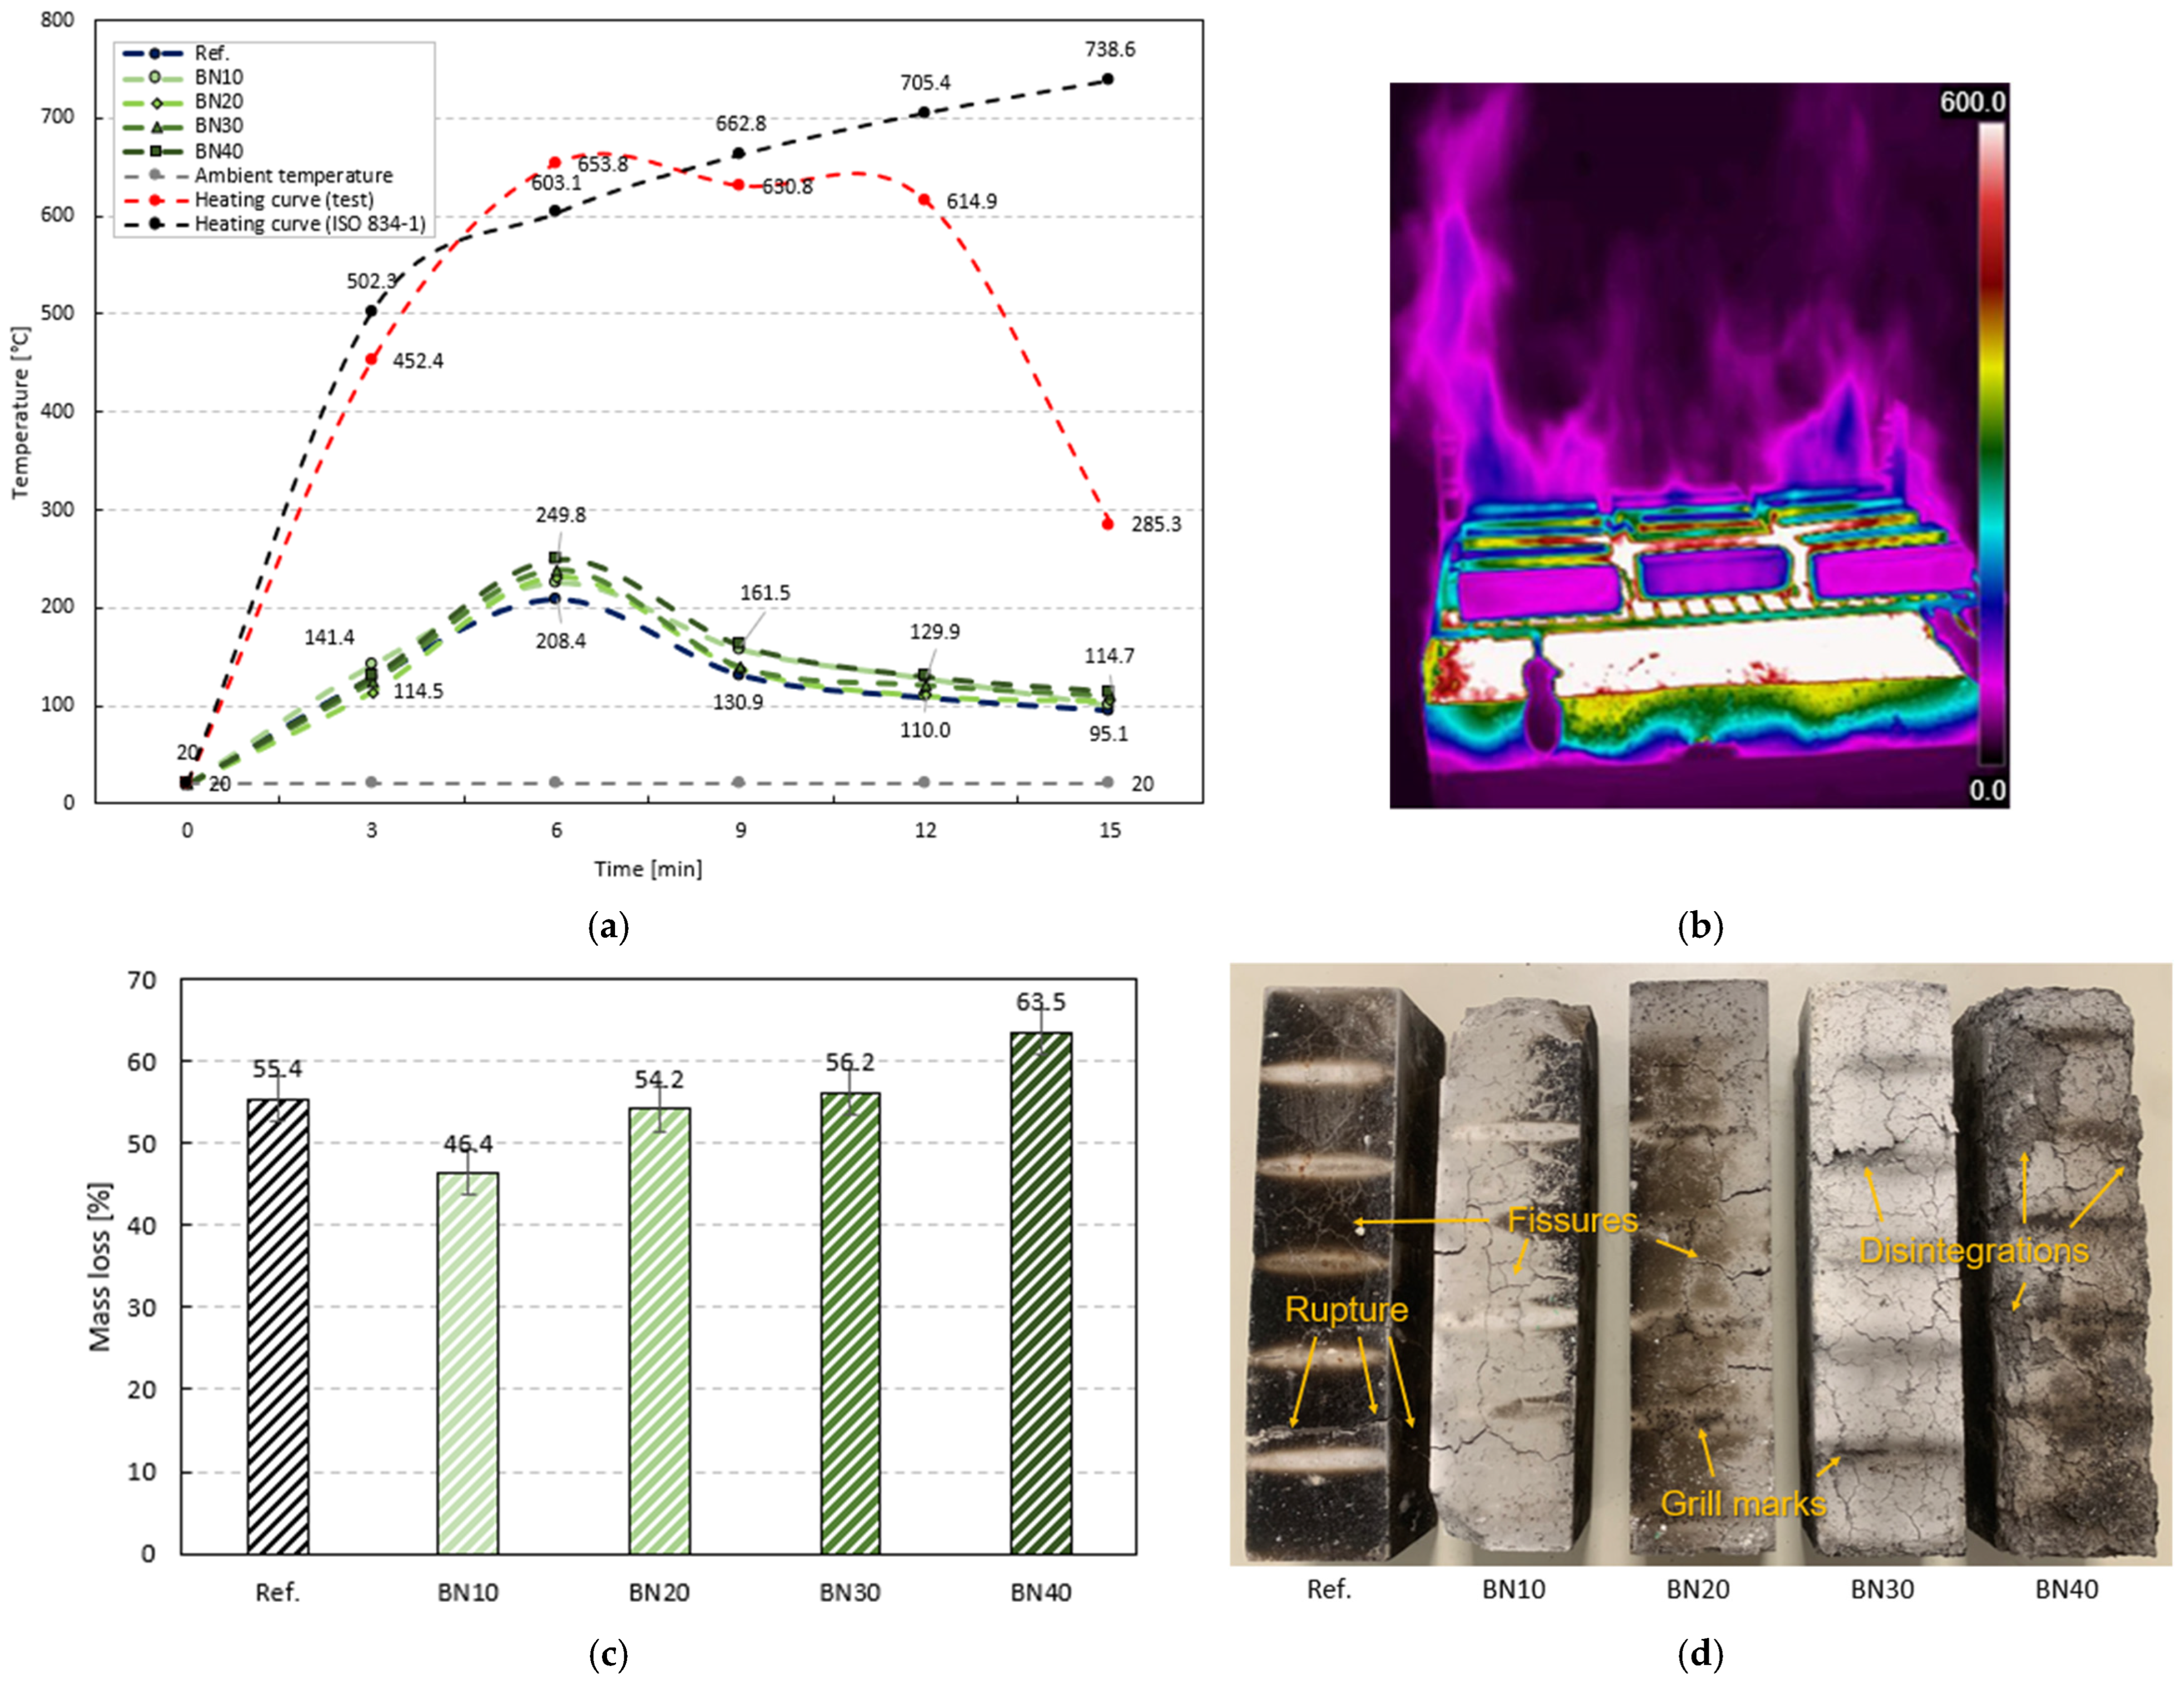
The developed GCs with BN fibers (G3-F) were subjected to real fire exposure for 15 min, and the results are presented in Figure 11.
It can be observed in Figure 11a that the heating curve of the test performed is similar to the heating curve of ISO 834-1 up to around minute 12. Figure 11a also shows that the temperature on the unexposed face of all samples increased rapidly during the first few minutes, and it was higher in samples with greater BN fiber content. This behavior was also observed by Ramos and Mendes [21] and Alameda et al. [20], although they did not use a barbecue grill for the test, but rather a furnace. After six minutes of testing (Figure 11b), the average temperature on the unexposed face of the reference samples was 208.4 °C, while that of BN40 was 249.8 °C, the highest temperature recorded. Considering the highest temperature reached (249.8 °C) and the maximum fire curve temperature (653.8 °C), we can compute an approximate value of 101 °C/cm for the corresponding peak thermal gradients. Nevertheless, the BN fibers helped prevent the samples from breaking during exposure to fire, which did not happen with the matrices without them. All three reference samples became more fragile and broke at this point. After that, the cooling phase began with the same trend. BN40 and Ref. reached temperatures of 114.7 °C and 95.1 °C, respectively, at the end of the test.
As can be seen in Figure 11c, where the average values of three samples per composite are presented, as well as the standard deviation in parentheses, BN10 lost less mass after the fire test (46.4%). Ref. and BN20 samples lost approximately the same percentage of mass (55%). BN30 and BN40 lost more mass, showing a tendency for greater loss as the BN fiber content increases, similar to the findings of Zaragoza-Benzal et al. [19]. This mass loss can be seen in Figure 11d, where samples with lower fiber content showed only fissures, while those with higher fiber content partially disintegrated after exposure to fire.
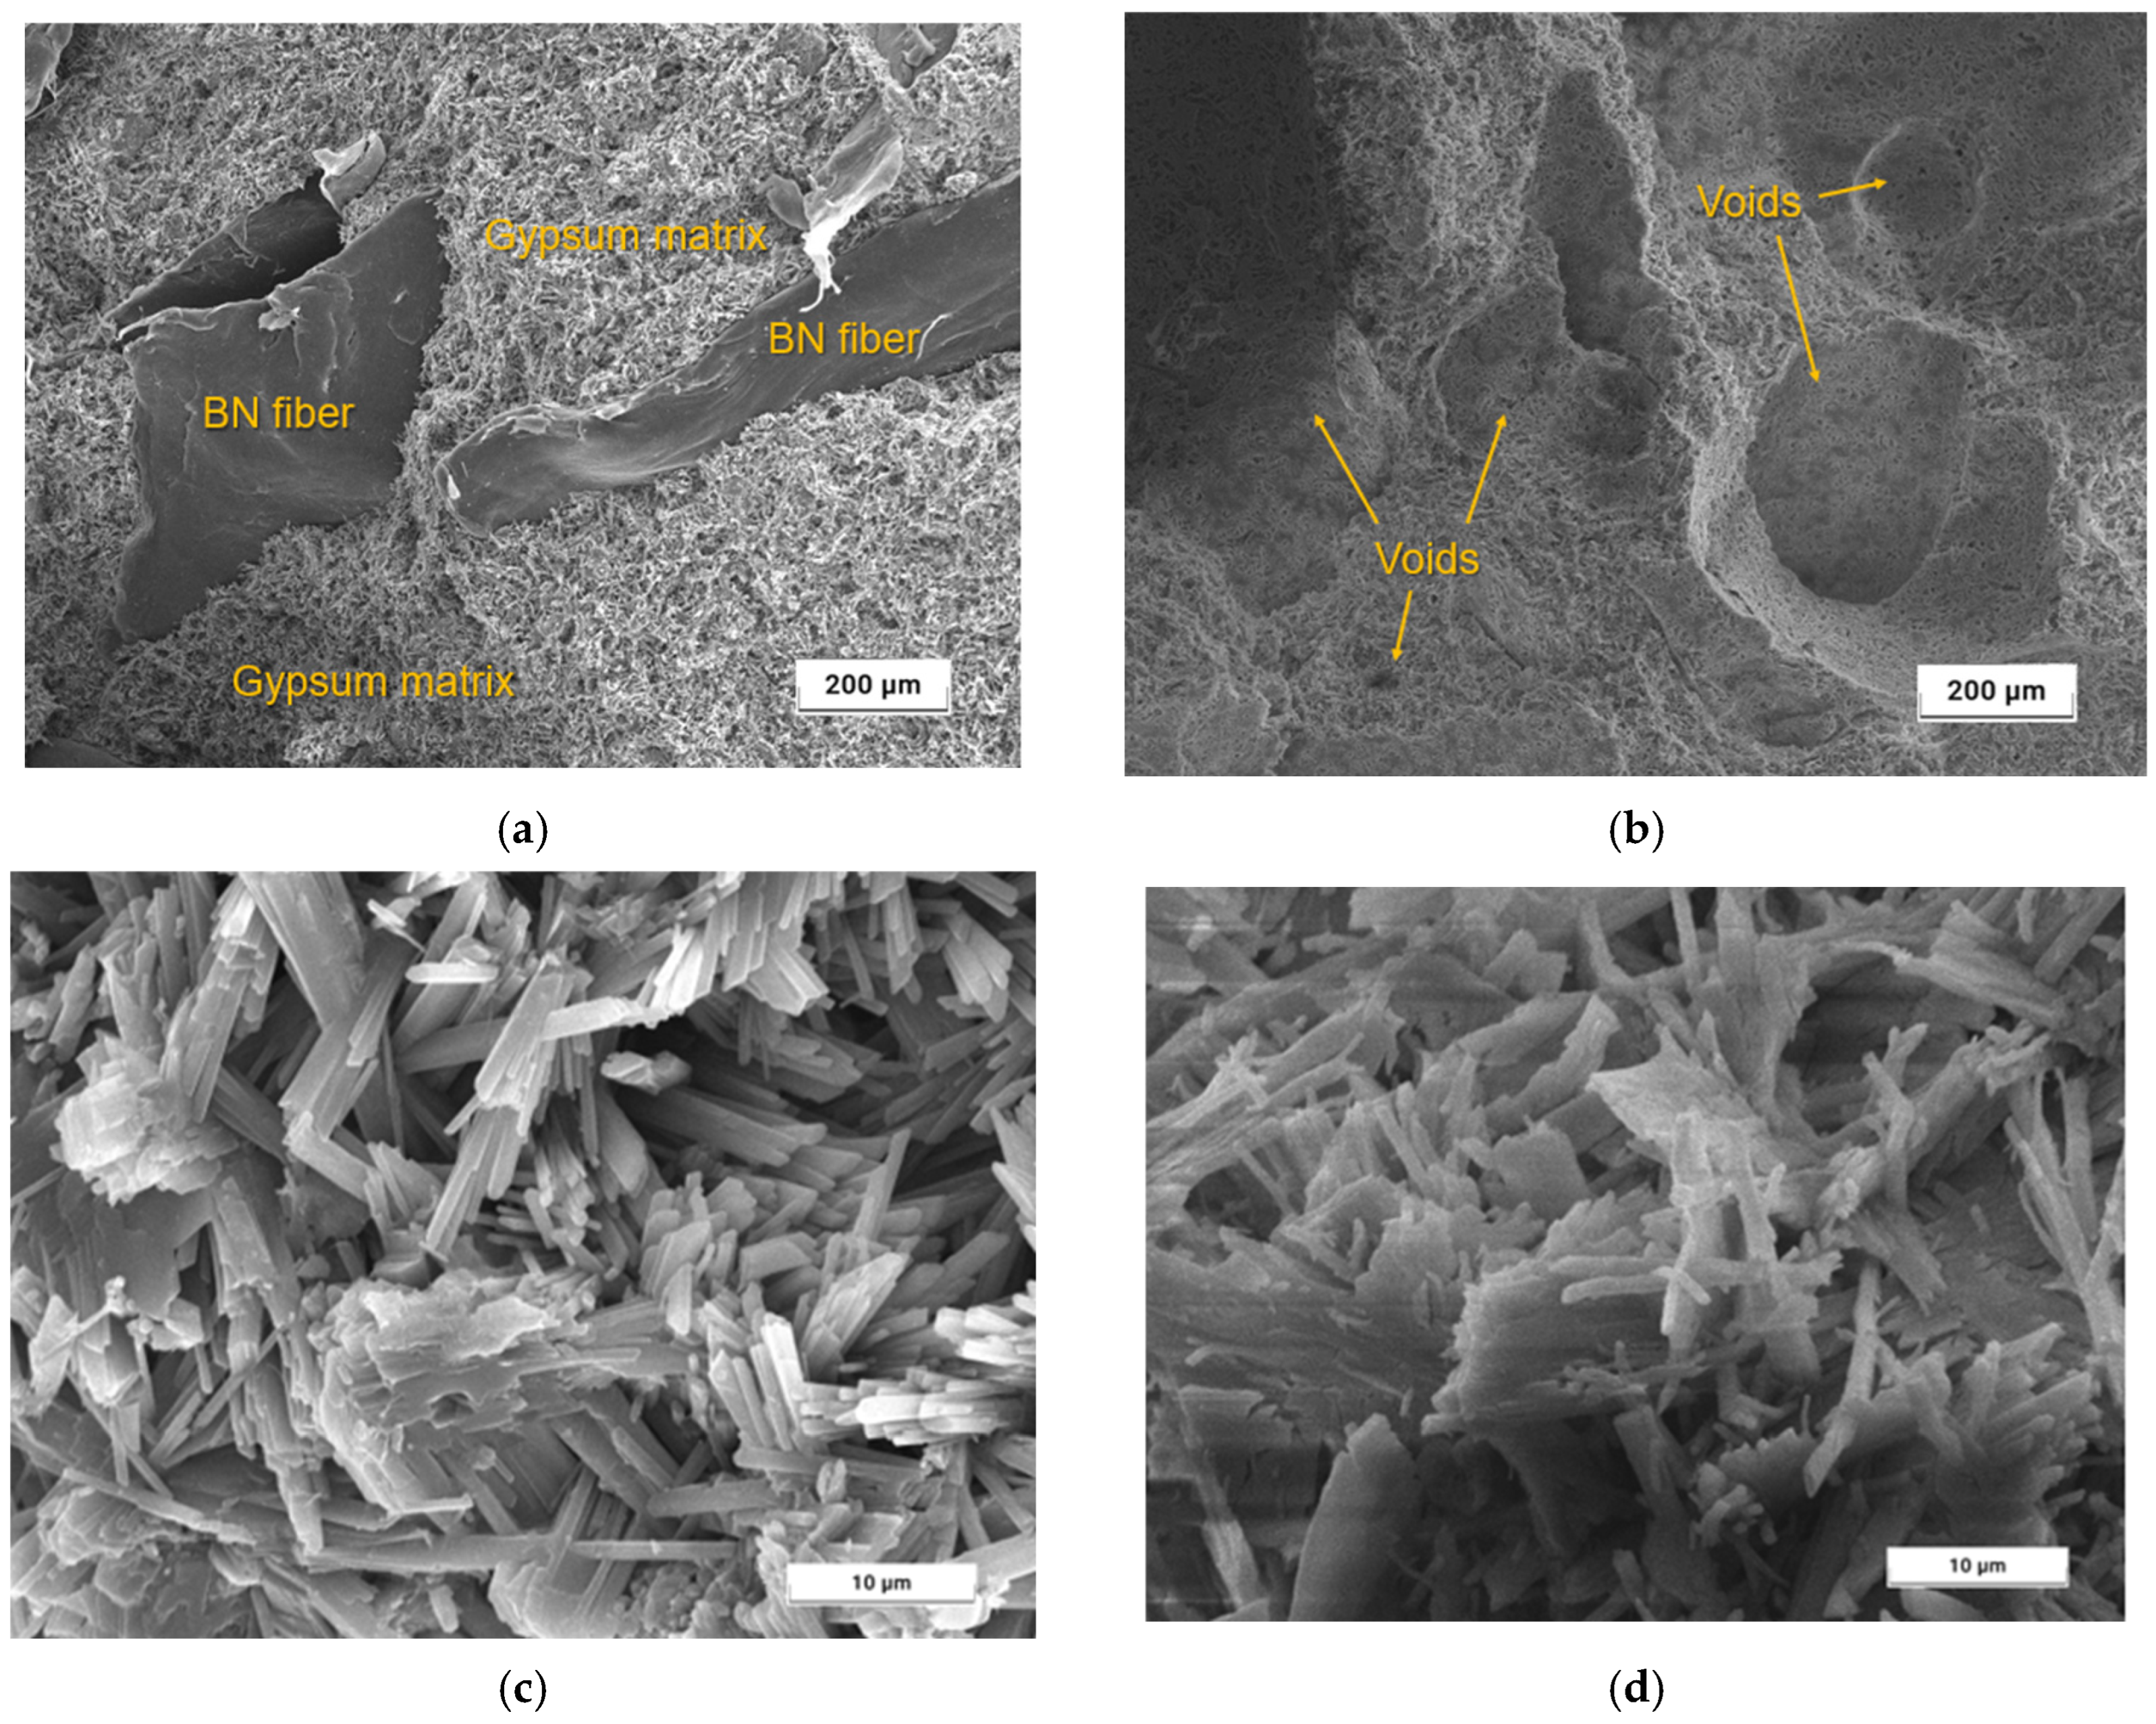
The following SEM images (Figure 12) show the internal morphological differences between BN40 samples before and after the fire test.
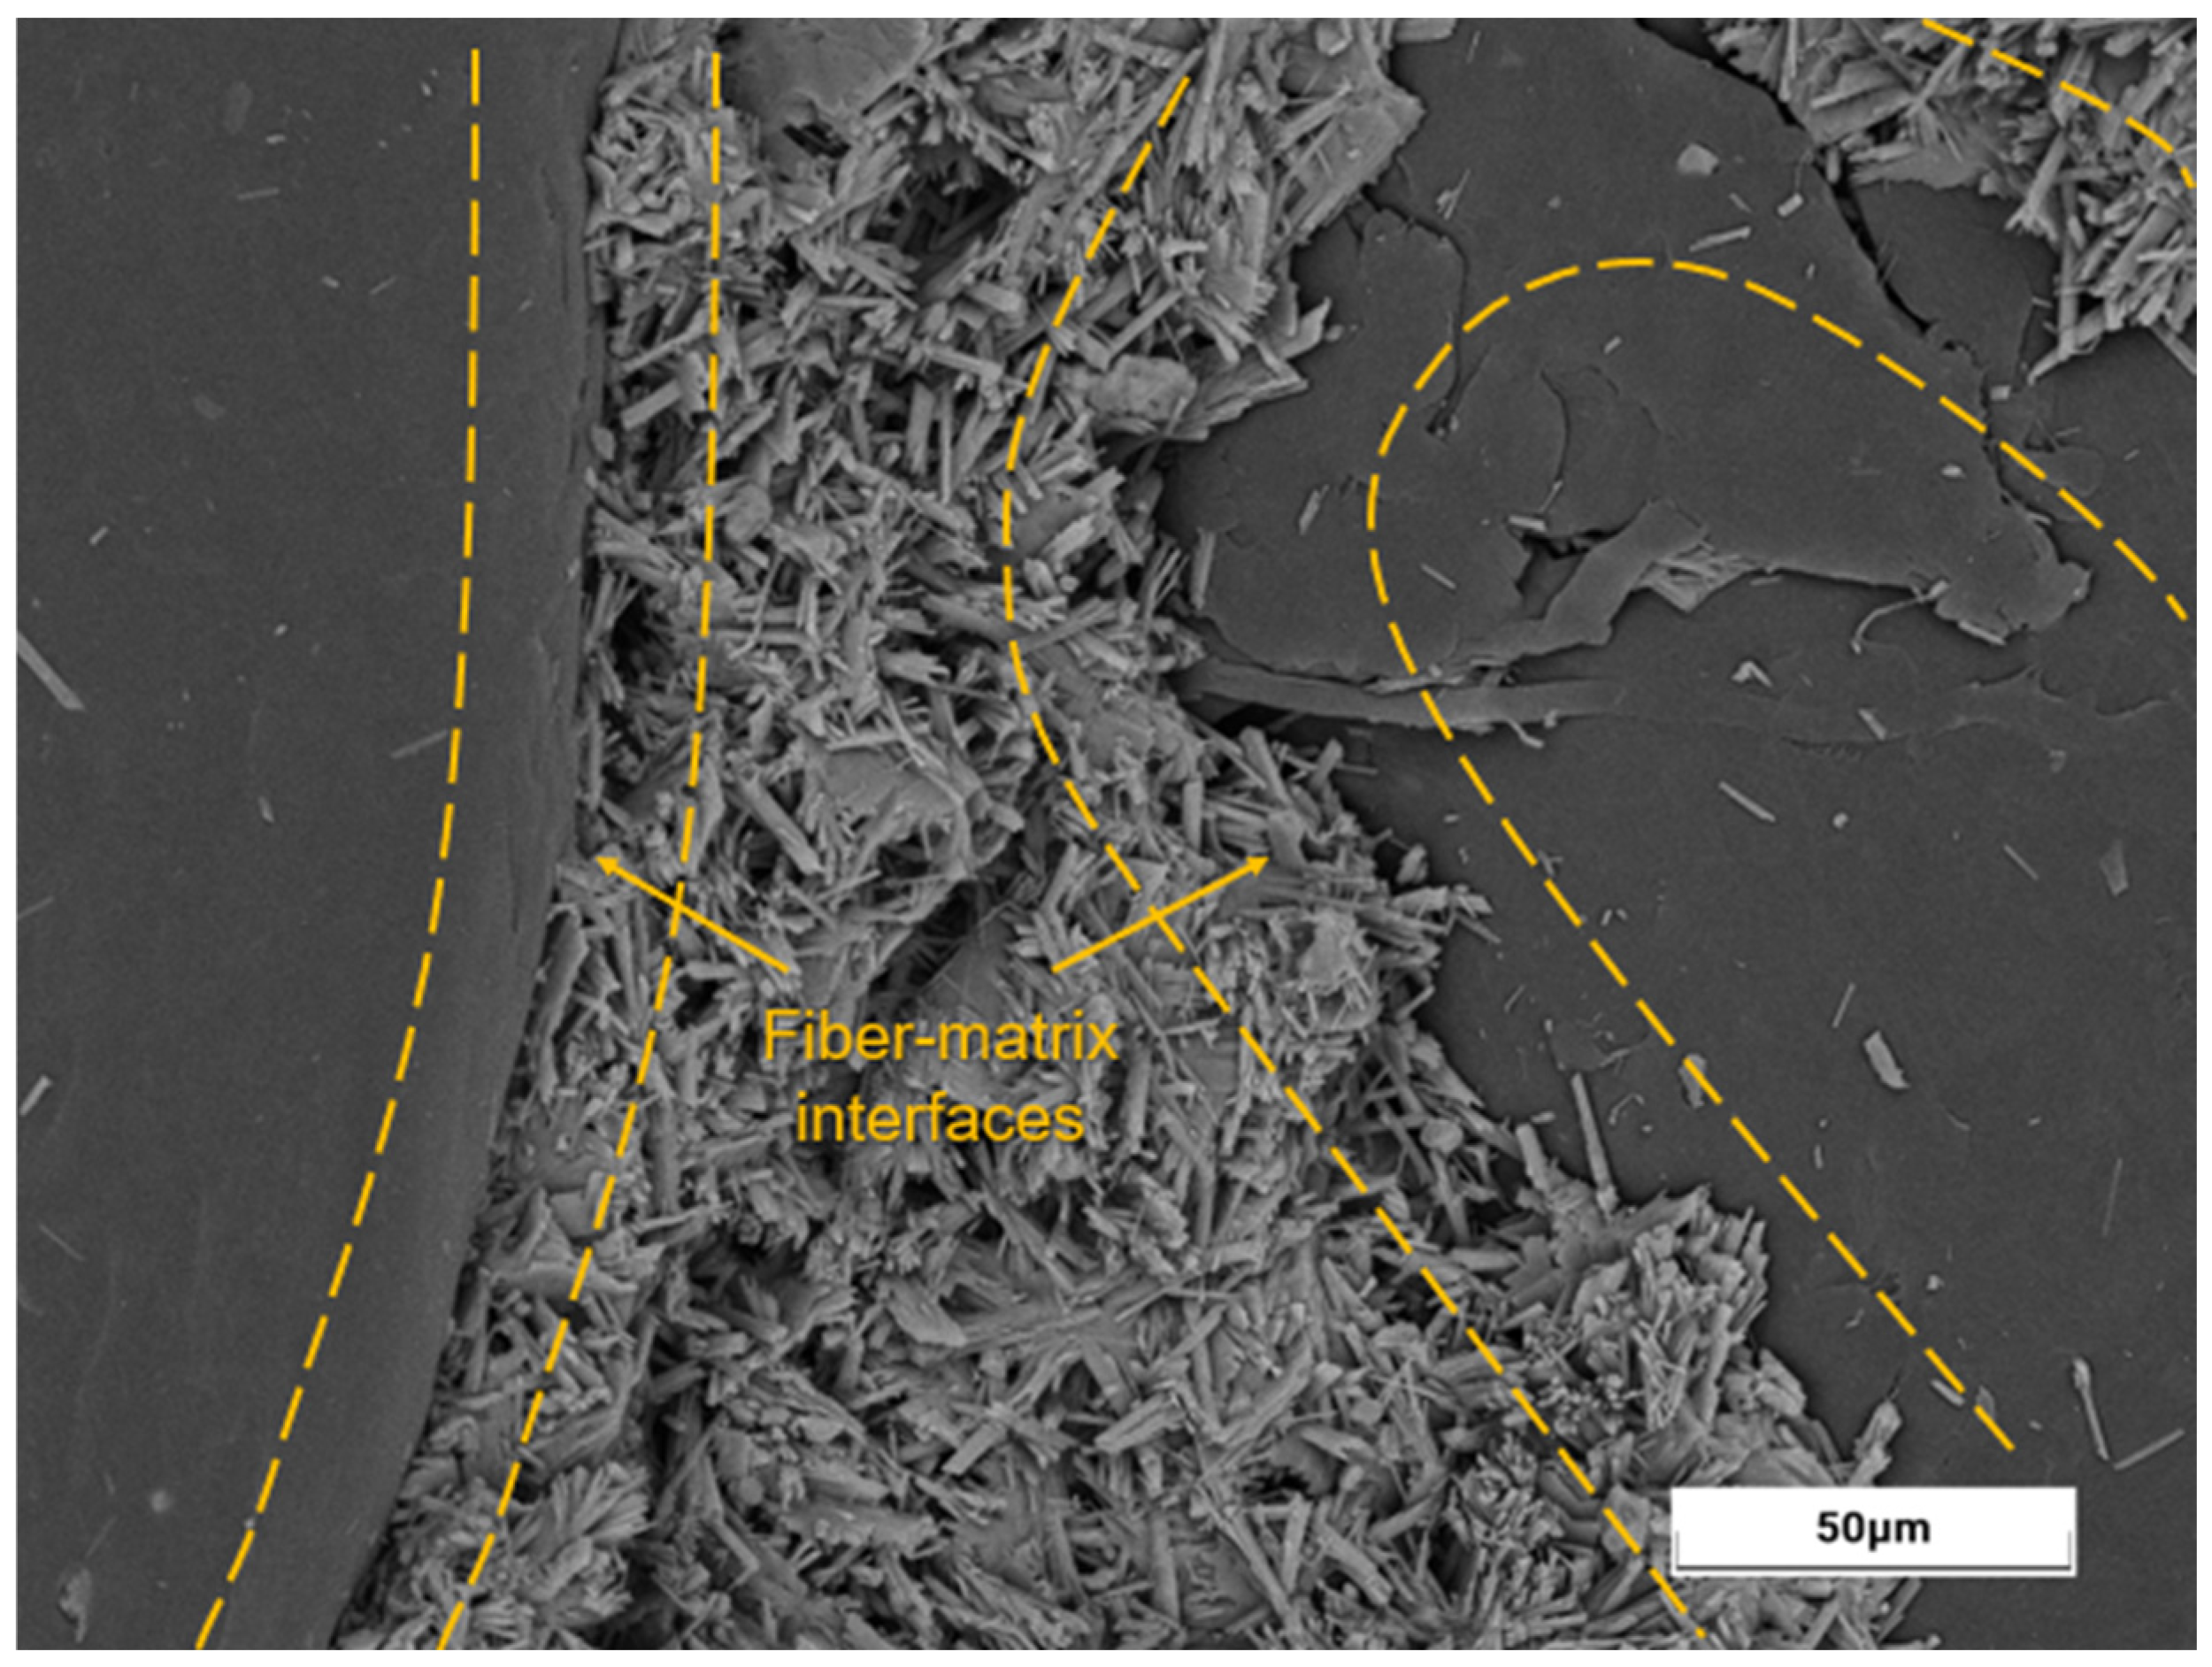
In Figure 12a, it can be observed that before fire exposure, the framework does not exhibit apparent large pores, and the BN fibers are not agglomerated. The visible pores are tiny, much smaller than the BN fibers, which reinforces the previous discussion about the “filler effect” in Section 3.1. Well-defined acicular crystals composed of calcium sulphate dihydrate (CaSO4·2H2O), a characteristic morphology of the gypsum matrix [41], are clearly visible in Figure 12c. This suggests that the incorporation of BN fibers did not significantly alter the internal structure of the GCs. In addition, a ×1000 magnification SEM image of the BN40 sample before fire exposure is provided (Figure 13), where it is possible to identify BN fibers completely surrounded by the gypsum matrix in the interfacial transition zones, free of gaps, and also crystals forming hooks around the BN fibers, indicating good mechanical adhesion [42].
After the fire exposure, numerous voids of varying sizes appeared (Figure 12b) due to the dehydration of CaSO4·2H2O, which became anhydrite (CaSO4), in addition to the voids left by the thermal decomposition of the BN fibers. Then, although the temperature on the upper face of the samples reached a maximum of 249.8 °C, the internal temperature was higher, reaching the decomposition temperature of the reinforcing material (according to the results of the thermogravimetric test in Section 3.5). Moreover, the acicular crystals showed signs of disintegration and became smaller (Figure 12d). These destructive effects of fire led to a decrease in interlocks between crystals and, consequently, to a reduction in mechanical performance [19].

3.4. Mechanical Properties

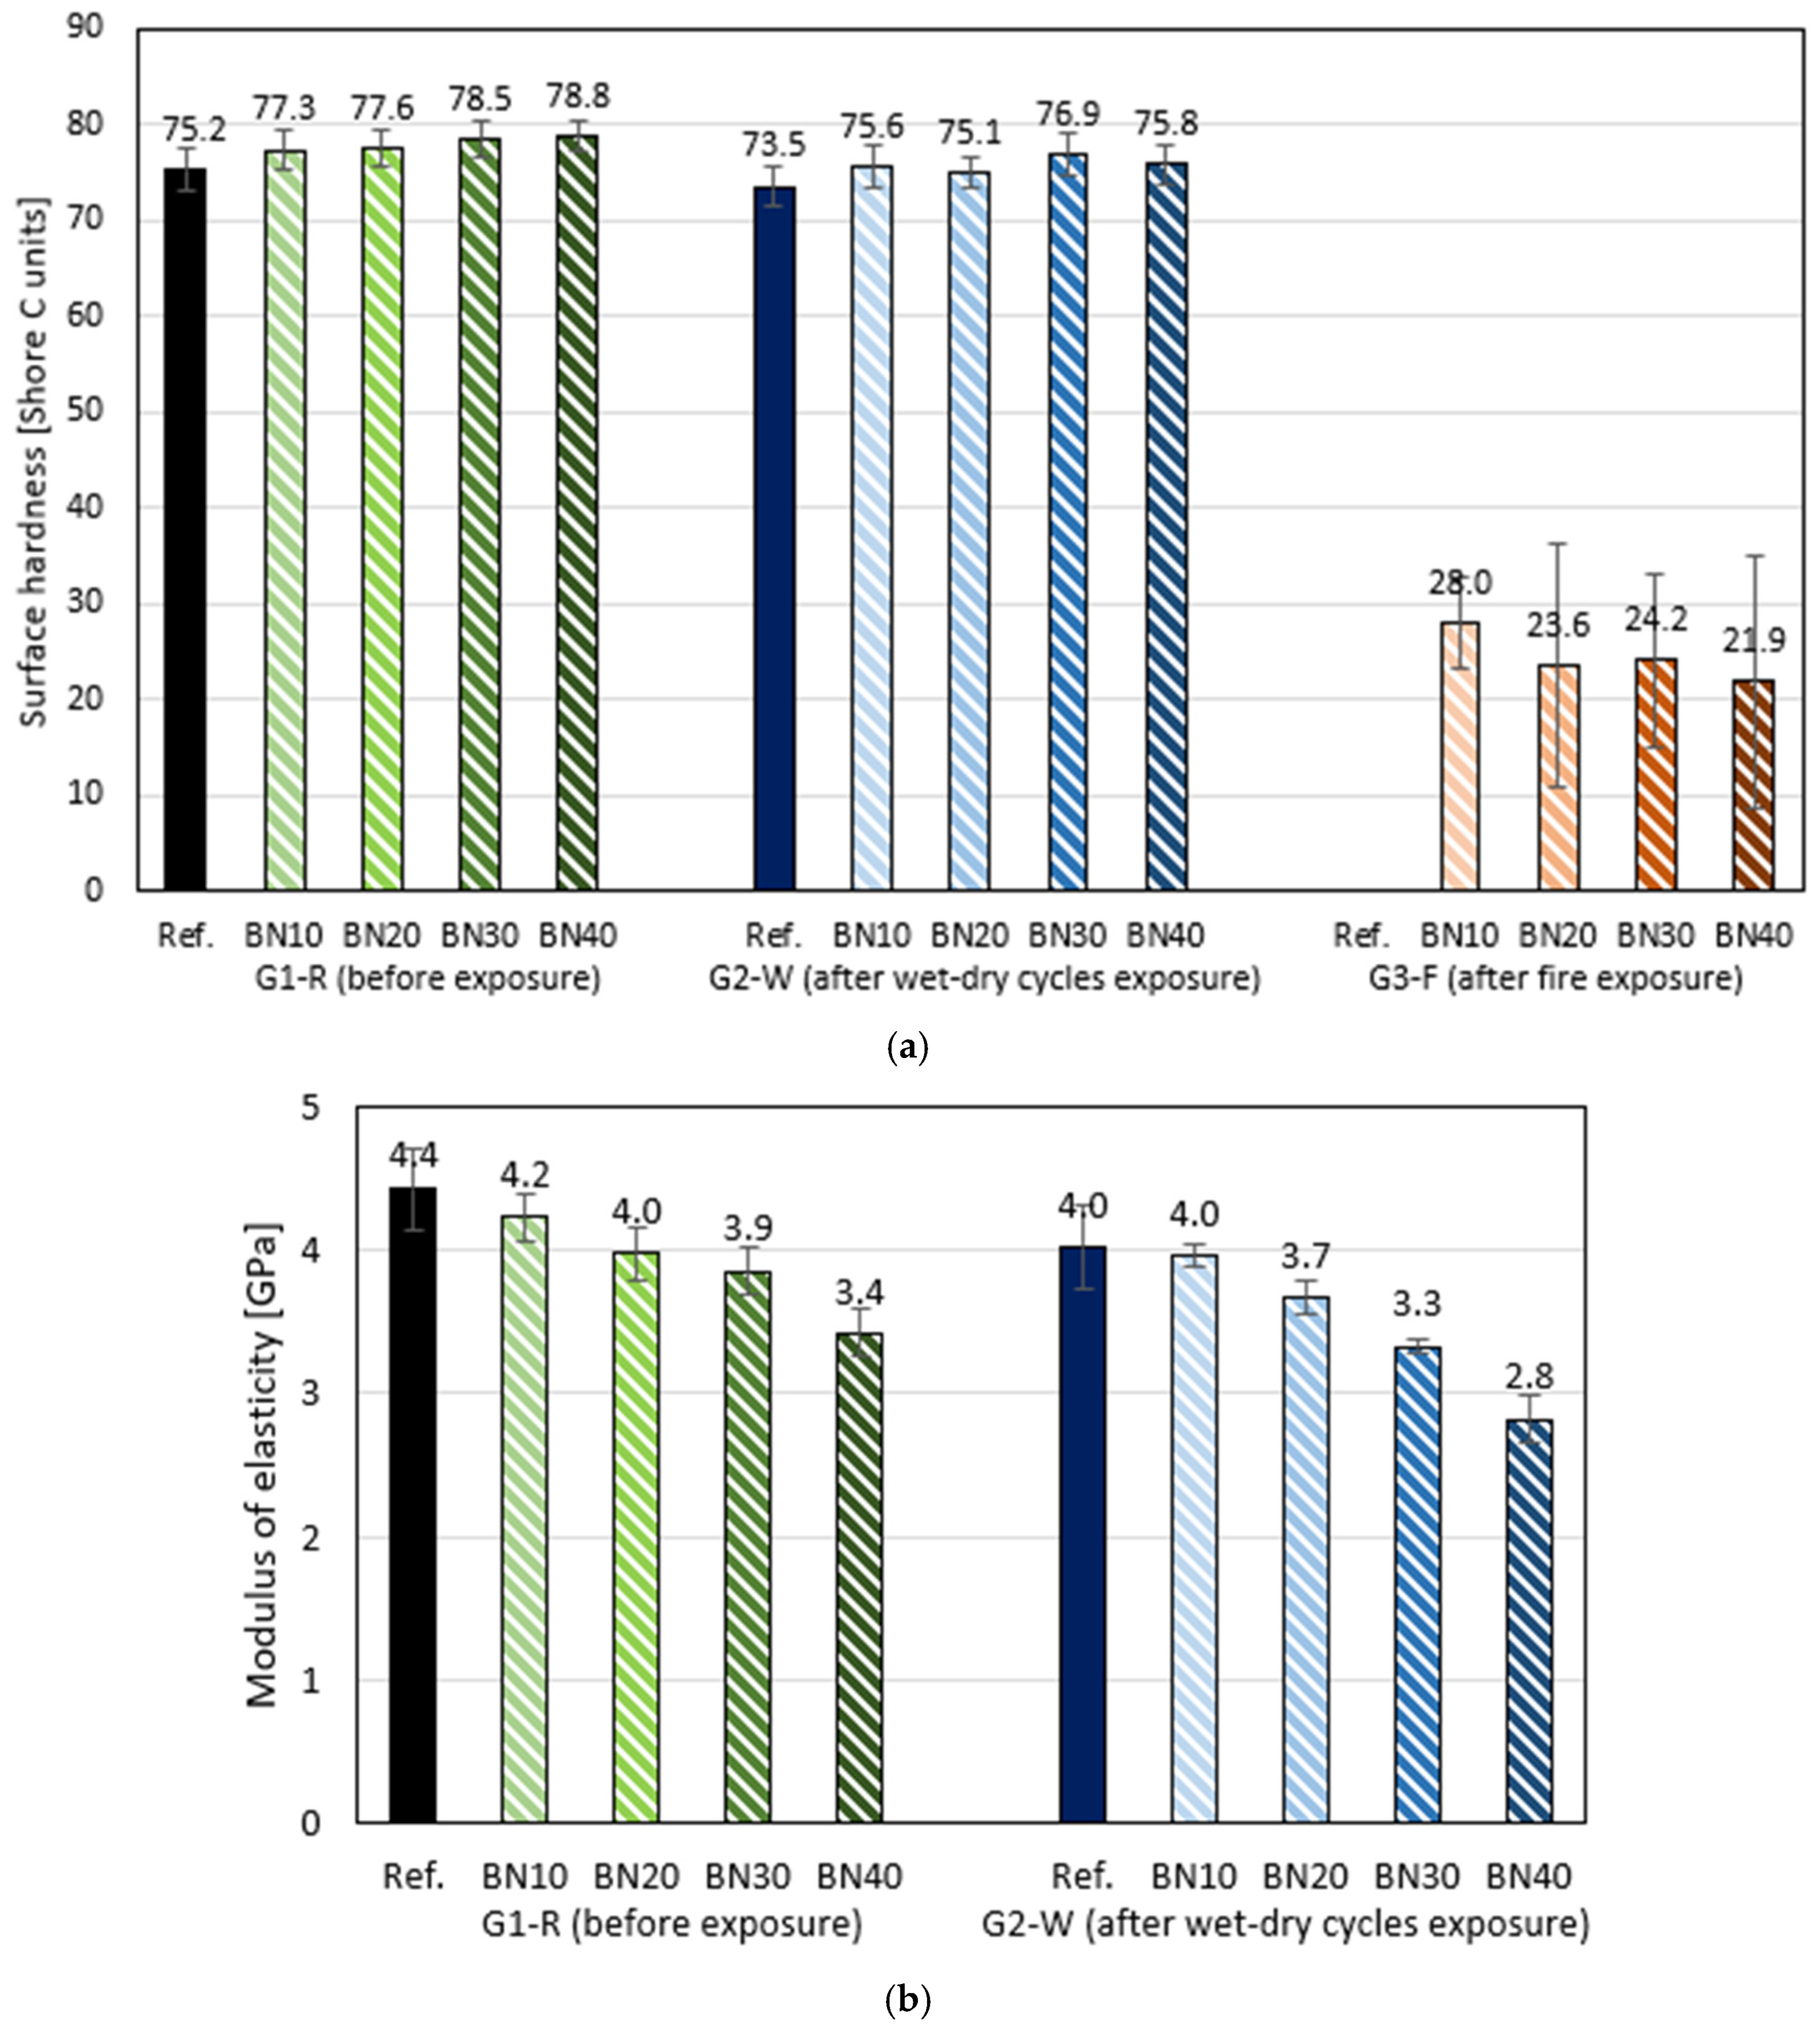
The mechanical tests were performed on the three sample groups: G1-R (reference), G2-W (wet–dry cycles), and G3-F (fire exposure). The results of surface hardness and dynamic modulus of elasticity tests are shown in Figure 14.
Five measurements of surface hardness were taken per face on two parallel plane faces, resulting in ten measurements per sample. Since there were three samples per composite, the average and standard deviation, in parentheses, were calculated considering thirty measurements per composite.
The incorporation of BN fibers into GCs, unlike most similar studies [5,7], linearly increased the surface hardness of G1-R (Figure 14a), from 75.2 (Ref.) to 78.9 (BN40) Shore C units. An increase equivalent to 5%. This confirms that the BN fibers have a higher surface hardness than hardened gypsum, which is reflected in the properties of the fiber-reinforced composites. Ardenili et al. also achieved higher surface hardness values when testing gypsum mixtures with polymer waste and a w/g ratio of 0.7, the same w/g ratio used in this study [42]. When using lower w/g ratios, the surface hardness also decreased.
Although the overall values were slightly lower than those of G1-R, after 10 wet–dry cycles, the slight increase in surface hardness in relation to the increase in fiber content was also observed in the samples of G2-W. After exposure to fire, the surface hardness of G3-F was reduced to approximately one-quarter of that of G1-R. This demonstrates that exposure to fire negatively affected the surface of the GCs much more than the exposure to wet–dry cycles. It was not possible to perform the surface hardness test on the reference samples of G3-F because of the high fragility acquired after the fire test.
Regarding the dynamic modulus of elasticity (Figure 14b), the averages and standard deviations presented refer to the values of three samples. A decreasing trend was observed with increasing BN fiber content. The value of BN40 was 23% lower than the reference value (G1-R); similar behavior was observed by Magbool [43]. Songkhla et al. explain that the addition of fibers increases the heterogeneity of the gypsum matrix, raising the number of discontinuities, which leads to a reduction in the wave propagation speed [14]. Nonetheless, this reduction may not directly affect the mechanical properties, but rather the homogeneity of the material, which can be compensated for by the toughness and energy absorption of the fibers.
After 10 wet–dry cycles, the dynamic modulus of elasticity of G2-W decreased, with a greater proportion as the BN fiber content increased. While the value of BN10 decreased by 6.3% compared to the BN10 of G1-R, the value of BN40 of G2-W decreased by 17% compared to the BN40 of the reference group. This may be due to a combination of the increased porosity of the samples after the cycles [15] and the greater heterogeneity with the addition of fibers [14].
On the other hand, as seen in the SEM images, the integrity of the samples was completely compromised after the fire test, which prevented the ultrasonic pulses from propagating through the samples [44]. Therefore, it was not possible to calculate the dynamic modulus of elasticity of G3-F.
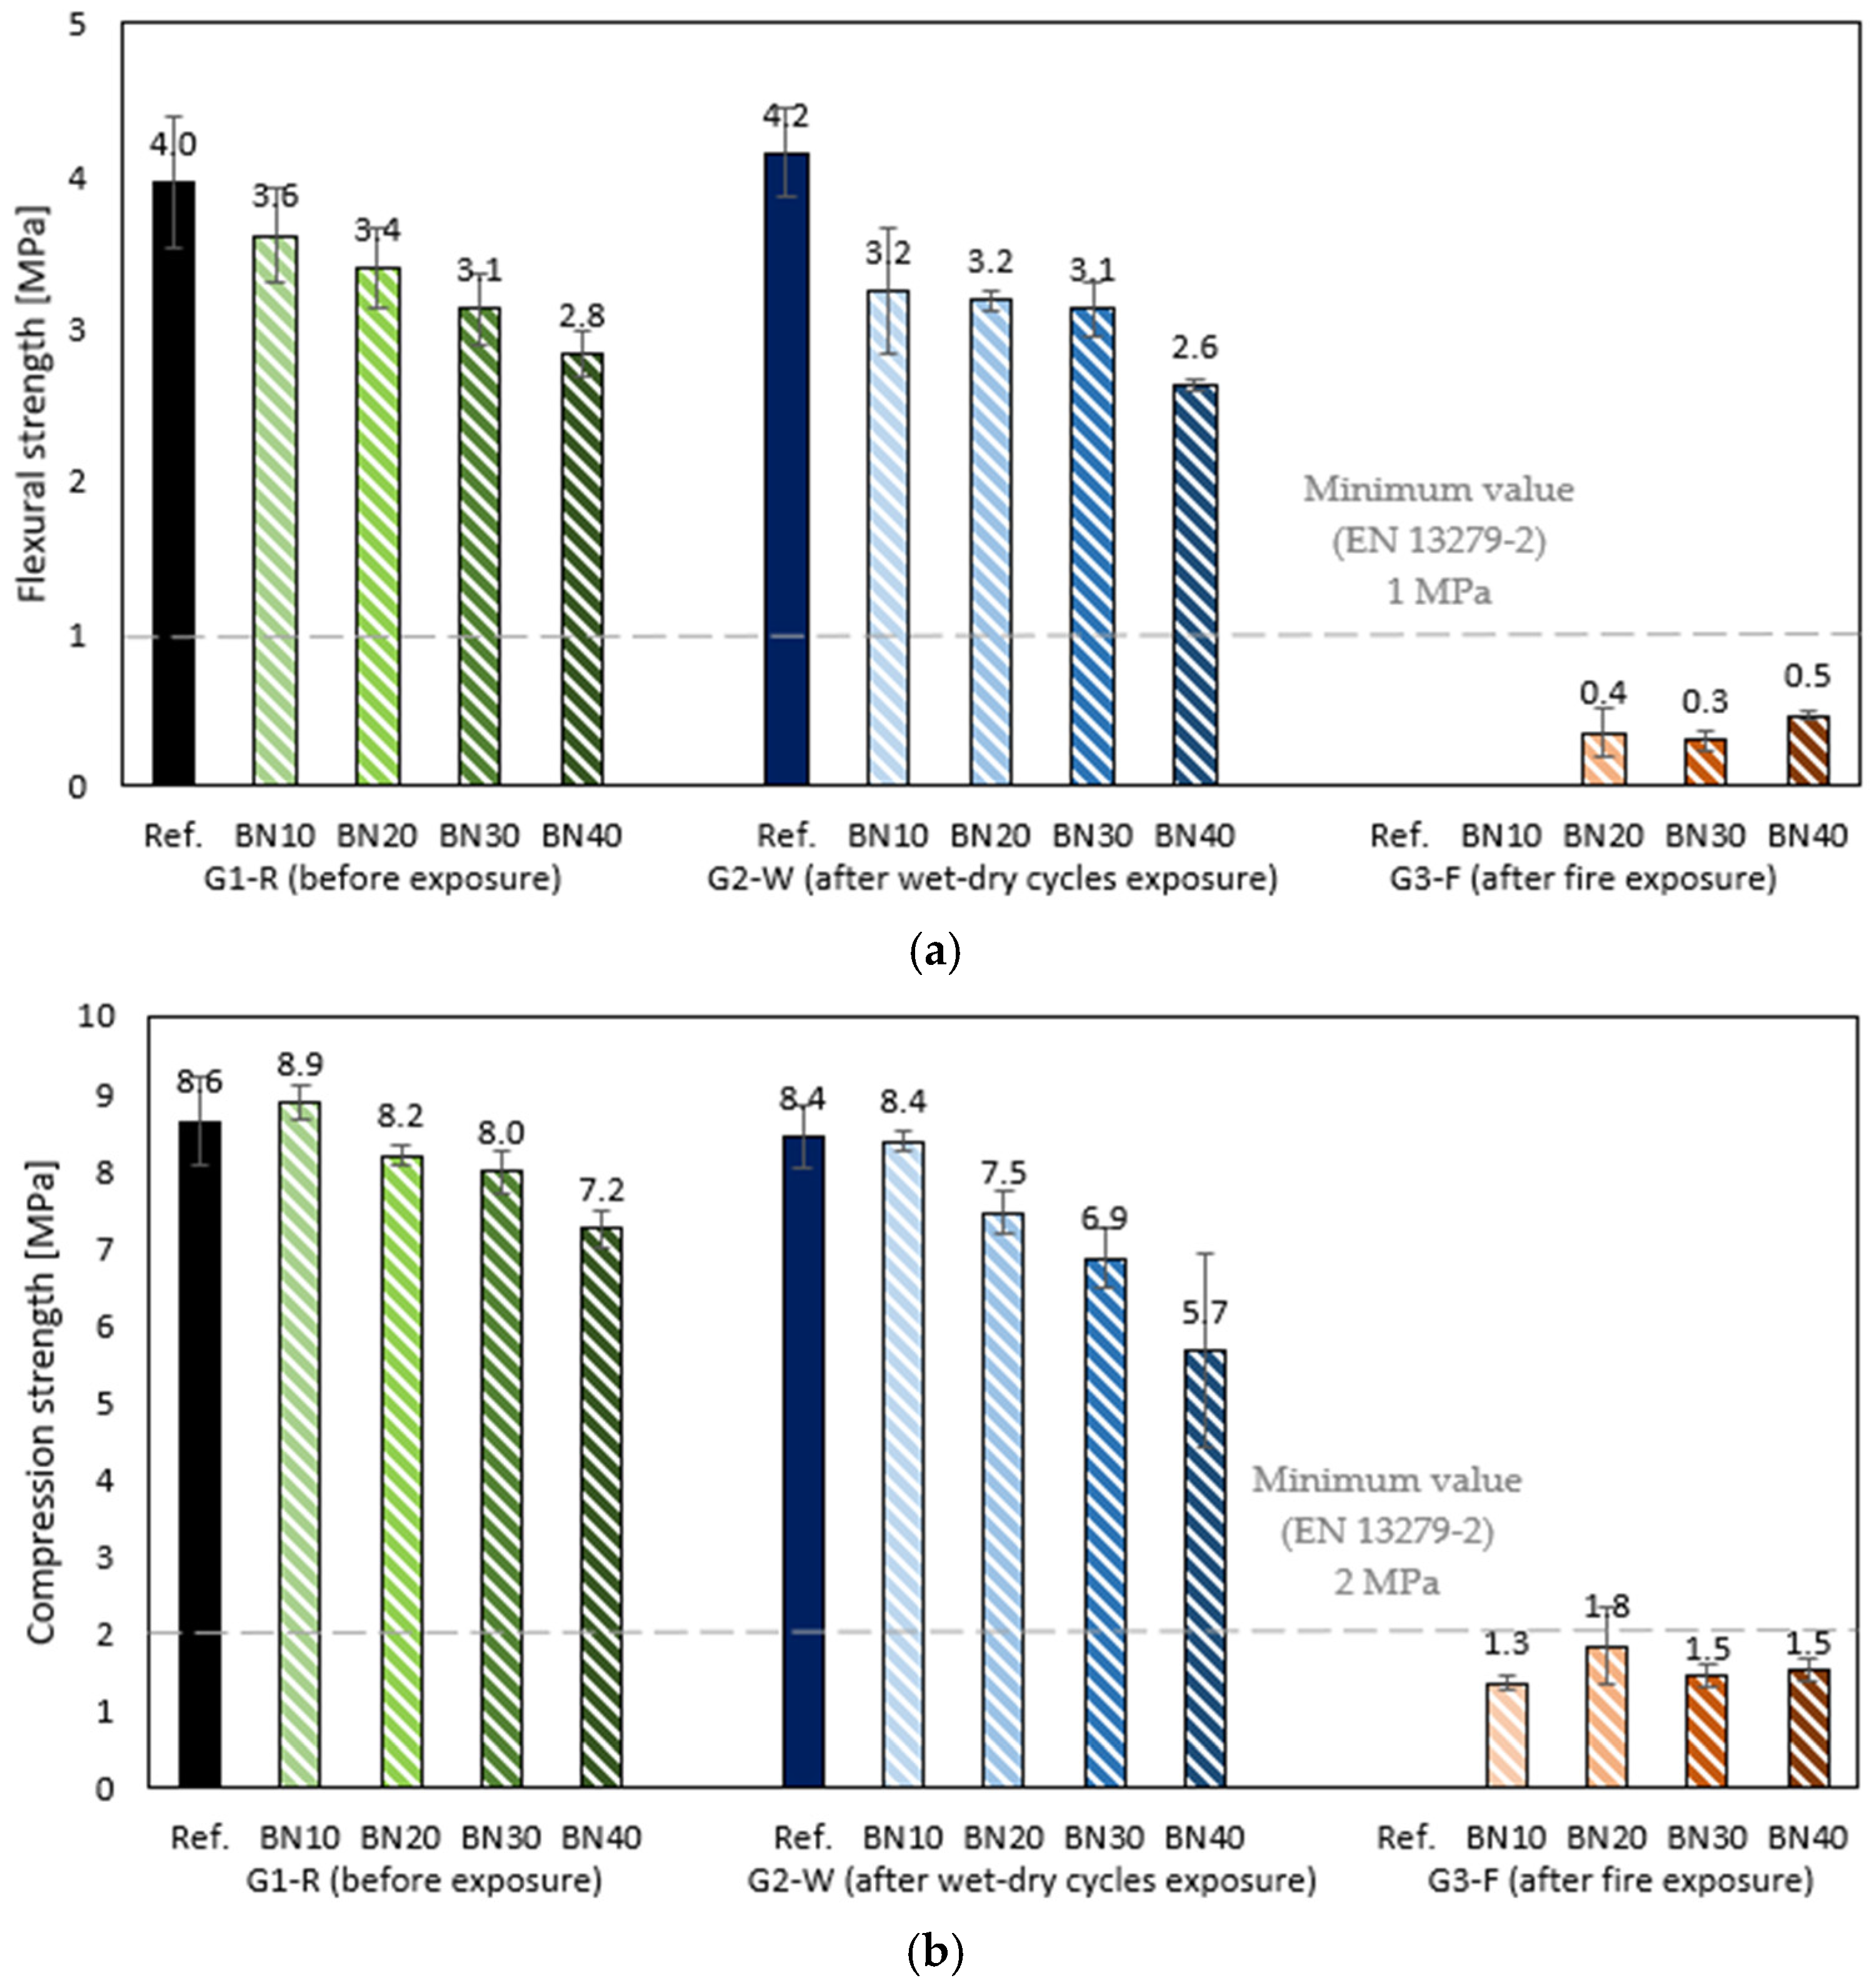
Figure 15 shows the average and standard deviations (in parentheses) of flexural (3 measurements) and compression (6 measurements) strength test results.
The flexural strength (Figure 15a) of G1-R was negatively influenced by the addition of BN fibers. BN40, being the composite with the highest f/g content, had the lowest flexural strength, with a reduction of 28% compared to the reference. In contrast, the flexural strength of BN10 decreased by only 9%, reaching a value of 3.6 MPa. When compared to the study by Bertelsen and Ottosen, this value is 12.5% higher than the GC developed by them with recycled PE fibers in a proportion equivalent to that of BN10 [45].
When analyzing other studies [1,13], it is possible to verify that when flexural strength of GCs increases, the length of the PE fibers used as reinforcement is bigger (18 cm) than the length of the BN fibers used in this study (average of 12 cm), in addition to the w/g ratio being lower, around 0.35 (the w/g factor in this study was double, 0.7).
These factors may have contributed to decreasing the flexural strength of the fiber-reinforced GCs, differently from the compressive strength (Figure 15b), where BN10 showed a slight improvement equivalent to 3% compared to the fiber-free matrix of G1-R. This result is consistent with that of Romero et al., who tested GCs with recycled PA fibers from fishing nets [40]. Regarding flexural strength, BN10 showed a reduction of only 9%. With higher BN fiber content, compressive strength decreased, but less than flexural strength. BN40 showed a 16% reduction compared to the reference. Other studies have obtained similar results [5,42]: when gypsum is replaced by a smaller percentage of polymer additives, the mechanical performance of composites improves. Conversely, with higher percentages of fibers, the strengths decrease. This happens because the fibers have lower bulk density and resistance compared to rigid gypsum, and when incorporated into composites, they can make the matrix heterogeneous and, consequently, create preferential breakpoints.
The loss of strength with increasing BN fiber content was also observed after the wet–dry cycles in both properties. However, only a slight decrease was noted in the G2-W values compared to G1-R, indicating that the durability test did not have a significant influence on the mechanical properties of the composites. This may also be related to the increase in porosity after the cycles [15]; consequently, a higher porosity may contribute to a decrease in durability under wet–dry cycling conditions [46].
Notwithstanding, all samples from G1-R and G2-W obtained values higher than the minimums set by EN 13279-2 [27]: 1 MPa for flexural strength and 2 MPa for compression strength, in contrast to the G3-F samples, where the minimum values were not reached after exposure to fire. On the other hand, the resistance tests could only be performed with the samples having the highest BN fiber content, which shows that the fibers helped to preserve the integrity of the samples.

3.5. Toxicity Estimation

Table 3 presents the TGA results for the reference sample.
As shown in Table 3, compound Ref. experiences a total mass loss of 21.6%, with the main loss occurring between 0 and 250 °C. This endothermic event corresponds to the transformation of calcium sulfate dihydrate into calcium sulfate hemihydrate (CaSO4·2H2O → CaSO4·1/2H2O). Finally, the gypsum compound is completely dehydrated, producing anhydrite (CaSO4). In the temperature range between 250 and 550 °C, the transformation of α anhydrite to β anhydrite occurs as an exothermic event. The last mass loss, between 550 and 750 °C, corresponds to the degradation of the calcium carbonate present in the gypsum material into calcium oxide.
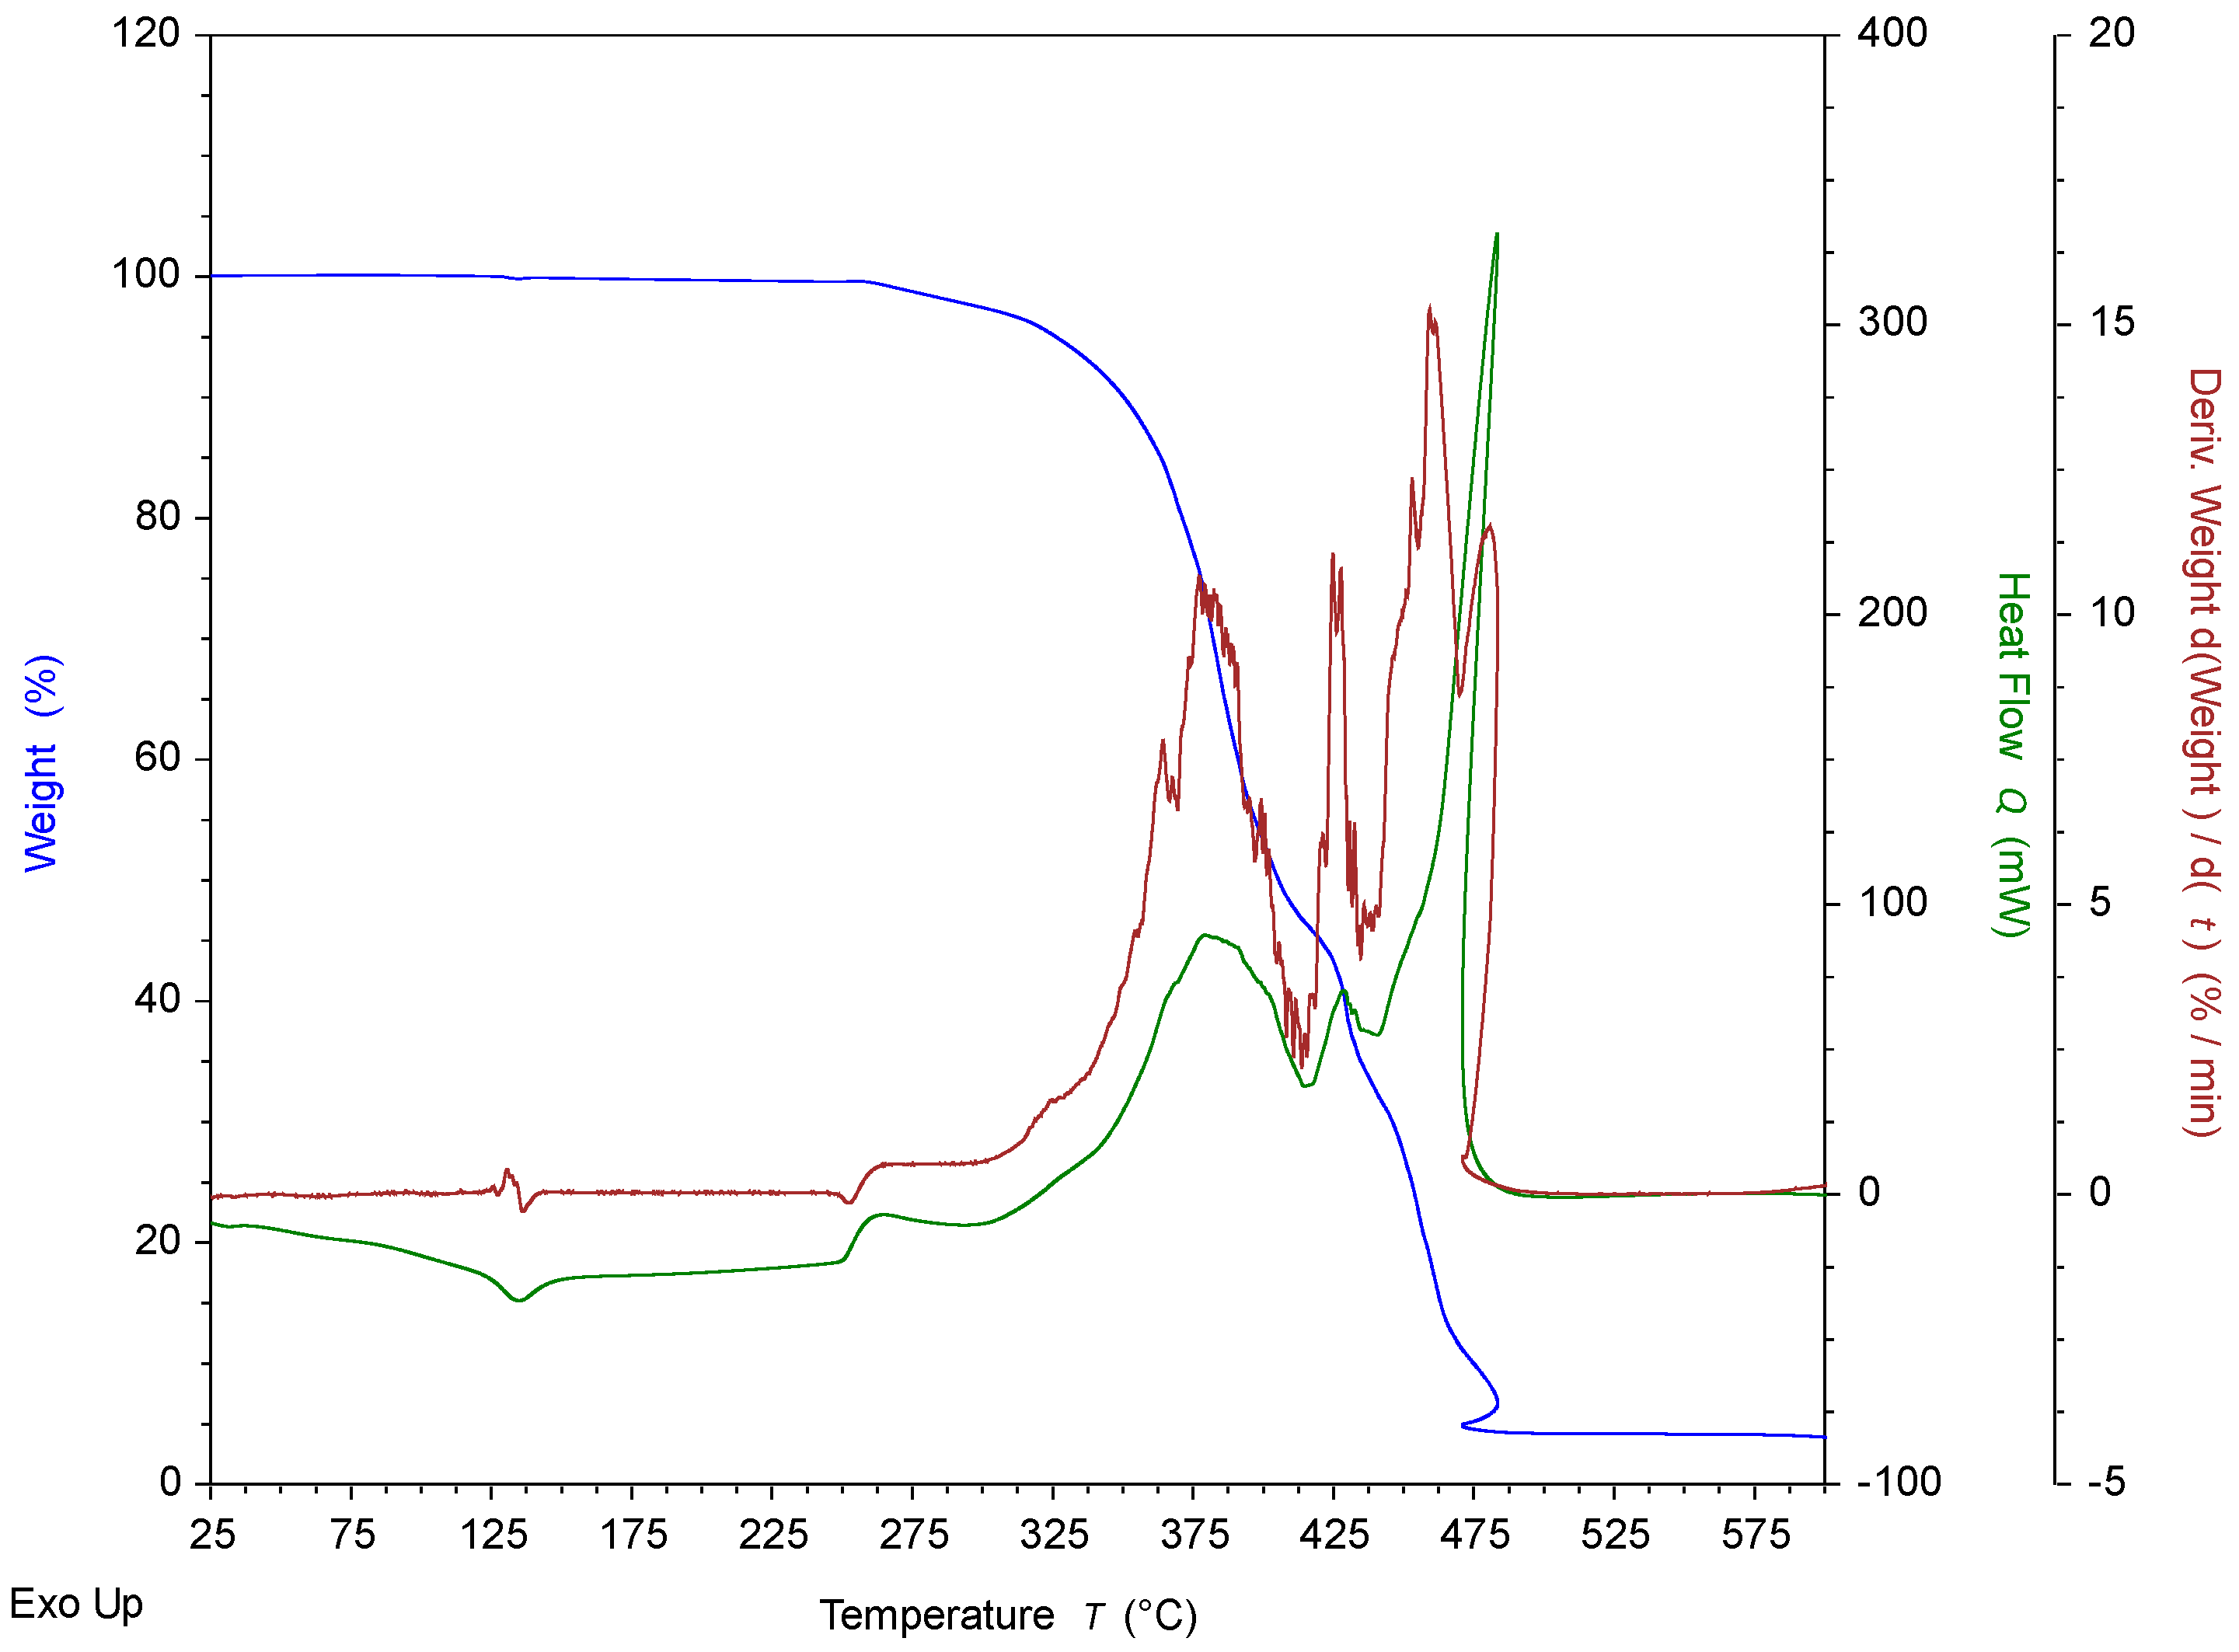
The estimation of toxic emissions from processed gypsum compounds is based on thermogravimetric analysis (TGA) of the recycled BN fibers used, with the results shown in Figure 16. It shows how the mass of BN fibers remains constant up to approximately 250 °C, where mass loss begins, ending with the almost complete combustion of the sample at approximately 500 °C, as is typical for an organic polymeric material. This mass loss occurs during an exothermic event resulting from the combustion of the material. These results indicate that the main source of harmful emissions derived from the combustion of the gypsum compounds produced in this research would correspond to the decomposition of the incorporated waste, since gypsum emits a minimal amount of inorganic carbon (<1.5%) during the decomposition of CaCO3 above 600 °C [47].
Based on the TGA results, the amounts of CO and CO2 generated by the combustion of 1 kg of BN fibers have been calculated. These fibers are composed of PE, with the chemical formula (CH2–CH2)n-. It is assumed that only CO2 is released during complete combustion, while both CO and CO2 are emitted during incomplete combustion. This estimate considers either complete or incomplete combustion to understand what would happen in extreme cases, since these would represent the most unfavorable situations in the event of a fire. However, in a real fire, an intermediate situation would occur, resulting in smaller amounts of each gas being generated.
The following steps were taken in the calculations:
  • Molecular weight of PE monomer:
12   k g   C k m o l   C · 2 k m o l   C k m o l   P E + 1   k g   H k m o l   H · 4 k m o l   H k m o l   P E = 28 k g   P E k m o l   P E
2.
Mass of CO2 emitted by the combustion of 1 kg of PE:
1   k m o l   P E 28   k g   P E · 2   k m o l   C 1   k m o l   P E · 1   k m o l   C O 2 1   k m o l   C · 44   k g   C O 2 1   k m o l   C O 2 = 3.137   k g   C O 2
3.
Since both CO and CO2 contain one carbon atom, the number of moles of both gases is the same. Therefore, to calculate the mass of CO emitted:
1   k m o l   P E 28   k g   P E · 2   k m o l   C 1   k m o l   P E · 1   k m o l   C O 1   k m o l   C · 28   k g   C O 1   k m o l   C O = 1.997   k g   C O
Next, CO and CO2 emissions were calculated considering the combustion of commercial-sized panels (2000 × 1200 × 12.5 mm3) made with the compounds developed in this study as interior finishes in a unit room (3.0 × 4.0 × 2.5 m3). These results are shown in Table 4.
As expected, the amount of toxic emissions from burning recycled BN fibers increases as their proportion in the compounds grows. In the worst case (BN40), emissions reached levels of 5483.6230 ppm and 3490.8496 ppm for CO2 and CO, respectively. Vega-Luna et al. considered that a CO concentration greater than 6400 ppm began to produce intoxication symptoms in humans, such as loss of consciousness [48]. Meanwhile, concentrations above 30,000 ppm of CO2 can begin to cause respiratory distress [49]. During the combustion of the designed compounds in this research, those levels were not exceeded, considering the complete combustion of the BN fibers within the GCs. Furthermore, it should be noted that the gypsum matrix protects the fibers, since at low temperatures gypsum mainly loses water and is considered non-flammable [19]. In the event of a fire, the interior of the compounds would reach a temperature considerably lower than the surface temperature, and, likely, some of the fibers would not reach their degradation temperature.

4. Conclusions

In this study, GCs with PE fibers from recycled BNs were developed, exposed to wet–dry cycles and fire, and then mechanically tested regarding flexural and compressive strengths, as well as surface hardness and dynamic modulus of elasticity. Other tests were also performed to determine open porosity, total water absorption, bulk density, and toxicity. The main highlights of this research study are listed below:
  • The incorporation of BN fibers reduced open porosity by 19% and total water absorption by 17% in the gypsum matrix with 40% of f/g content (BN40). This composite showed a 3.3% reduction in bulk density compared to the reference.
  • After exposure to fire, BN10 lost 9% less mass than the fiber-free matrix and showed only surface cracks. Therefore, lower BN fiber content contributed to greater fire resistance in the GCs.
  • The BN fibers helped maintain the dynamic modulus of elasticity after the durability test. The modulus of elasticity of BN40 decreased by 17%, while that of BN10 decreased by only 6%, when comparing them to the same composites before exposure.
  • Surface hardness increased with the addition of BN fibers in the GCs. BN40 had a value 5% higher than the reference. The compressive strength of BN10 increased by 3% compared to that of the reference, while the flexural strength decreased by only 9%.
  • The wet–dry cycles did not significantly influence the strengths, unlike the fire, which drastically reduced them. After the durability test, the flexural and compressive strengths of all composites, even those of BN40, reached at least double the standardized minimum required values. These minimum values were not reached after exposure to fire.
  • In case of complete combustion of the BN fibers within the GCs, the emissions of CO2 and CO do not reach the level of intoxication in humans.
The BN fibers proved to be good additions to GCs in terms of mechanical strength, even after wet–dry cycles. As a limitation of this study for the toxicity estimation, the authors can mention that the TGA tests were not performed for all the developed composite series, with only the reference (gypsum without fibers) and the plastic fibers alone tested.
As future work, it is suggested that an alternative analysis to infer interfacial thermal effects, e.g., observe the residue after fire testing, be conducted. For future studies, these composites will be characterized by thermal and acoustic behavior. A thermal conductivity test (e.g., using a guarded hot plate device) is suggested, and regarding sound absorption, it would be interesting to measure these coefficients using, for instance, an impedance tube device. Moreover, a life cycle analysis (LCA), as well as cost and logistics analysis, will be performed to further evaluate the implications of replacing gypsum with recycled BN fibers at an industrial scale. Additionally, tests such as cone calorimetry could be conducted to supplement information on the fire behavior of these compounds, which would be relevant for practitioners.

Author Contributions

Conceptualization, D.F. and P.S.; methodology, D.F.; software, P.S.; validation, D.F. and P.S.; formal analysis, A.Z.-B.; investigation, L.L.; resources, D.F. and P.S.; data curation, A.Z.-B.; writing—original draft preparation, L.L. and E.A.-S.; writing—review and editing, D.F., E.A.-S. and P.S.; visualization, L.L.; supervision, D.F.; project administration, P.S.; funding acquisition, D.F. All authors have read and agreed to the published version of the manuscript.

Funding

This research was funded by the Madrid Government (Comunidad de Madrid, Spain) under the Multiannual Agreement 2023–2026 with Universidad Politécnica de Madrid, in Line A, Emerging Researchers, grant number DOCTORES-EMERGENTES-24-NZMO4U-16-3U7Z8W (Project name: Waste2BuildIns; OTT reference: M230020126A-DFV).

Data Availability Statement

The original contributions presented in this study are included in the article. Further inquiries can be directed to the corresponding author.

Conflicts of Interest

The authors declare no conflict of interest.

Abbreviations

The following abbreviations are used in this manuscript:
GCGypsum composite
PEPolyethylene
HDPEHigh-density polyethylene
UHMWPEUltra-high-molecular-weight polyethylene
LSFLight steel-framed
BNBird net
f/gFiber/gypsum
w/gWater/gypsum
G1-RGroup 1-Reference
G2-WGroup 2-Wet–dry cycles exposure
G3-FGroup 3-Fire exposure
SEMScanning electron microscopy
SDStandard deviation

References

  1. Xu, R.; Lu, S.; Miao, J.; Tang, C.; Yu, J. Fiber-reinforced gypsum composites with ultra high ductility: Investigation of physical and mechanical properties. Constr. Build. Mater. 2024, 457, 139285. [Google Scholar] [CrossRef]
  2. Doleželová, M.; Scheinherrová, L.; Krejsová, J.; Keppert, M.; Černý, R.; Vimmrová, A. Investigation of gypsum composites with different lightweight fillers. Constr. Build. Mater. 2021, 297, 123791. [Google Scholar] [CrossRef]
  3. Jia, R.; Wang, Q.; Feng, P. A comprehensive overview of fibre-reinforced gypsum-based composites (FRGCs) in the construction field. Compos. Part B Eng. 2021, 205, 108540. [Google Scholar] [CrossRef]
  4. Hošťálková, M.; Vavřínová, N.; Longauerová, V. Mechanical properties of the gypsum composite reinforcement with wooden fibers. Int. Rev. Appl. Sci. Eng. 2019, 10, 15–21. [Google Scholar] [CrossRef]
  5. Ferrández, D.; Zaragoza-Benzal, A.; Carballosa, P.; Calvo, J.G.; Santos, P. Gypsum-Based Composites with Recycled PP/HDPE Pellets for Circular Material Development: A Comprehensive Characterisation. Materials 2025, 18, 4037. [Google Scholar] [CrossRef]
  6. Jameel, M.A.; Al-Asadi, L.S.M.; Hacheem, Z.A.; AL-Ridha, A.S.D. Effect of Chopped Carbon Fibre (CCF) on enhancing the compressive strength and density of gypsum plaster. Mater. Today Proc. 2022, 62, 4539–4544. [Google Scholar] [CrossRef]
  7. Lima, L.; Zaragoza-Benzal, A.; Ferrández, D.; Santos, P. Eco-Gypsum Panels with Recycled Fishing NET Fibers for Sustainable Construction: Development and Characterization. Materials 2025, 18, 4305. [Google Scholar] [CrossRef] [PubMed]
  8. Maitlo, G.; Ali, I.; Maitlo, H.A.; Ali, S.; Unar, I.N.; Ahmad, M.B.; Bhutto, D.K.; Karmani, R.K.; Naich, S.u.R.; Sajjad, R.U.; et al. Plastic Waste Recycling, Applications, and Future Prospects for a Sustainable Environment. Sustainability 2022, 14, 11637. [Google Scholar] [CrossRef]
  9. Murti, Z.; Soedjati, D.; Barkah, A.; Rahardjo, P. Review of the Circular Economy of Plastic Waste in Various Countries and Potential Applications in Indonesia. In IOP Conference Series: Earth and Environmental Science; Institute of Physics: London, UK, 2022. [Google Scholar] [CrossRef]
  10. Hao, G.; He, M.; Lim, S.M.; Ong, G.P.; Zulkati, A.; Kapilan, S. Recycling of plastic waste in porous asphalt pavement: Engineering, environmental, and economic implications. J. Clean. Prod. 2024, 440, 140865. [Google Scholar] [CrossRef]
  11. Romero-Gómez, M.I.; Silva, R.V.; de Brito, J.; Flores-Colen, I. Prototype of alveolar gypsum blocks with plastic waste addition for partition walls: Physico-mechanical, water-resistance and life cycle assessment. J. Clean. Prod. 2023, 432, 139810. [Google Scholar] [CrossRef]
  12. Rahat, M.H.H.; Massarra, D.C.; Wang, D.G. Using Plastic Wastes in Construction: Opportunities and Challenges. Epic. Ser. Built Environ. 2022, 3, 785–794. [Google Scholar] [CrossRef]
  13. Wang, Y.; Jian, X.; Yu, J.; Ye, J.; Dong, F. Development of gypsum-based composites with tensile strain-hardening characteristics. J. Am. Ceram. Soc. 2020, 103, 7115–7126. [Google Scholar] [CrossRef]
  14. Songkhla, W.N.; Chaikaew, C.; Chatveera, B.; Sua-iam, G. Experimental investigation of recycled HDPE waste fiber-reinforced gypsum with emphasis on durability and mechanical performance. Results Eng. 2025, 26, 105330. [Google Scholar] [CrossRef]
  15. Pedreño-Rojas, M.A.; Morales-Conde, M.J.; Rubio-de-Hita, P.; Pérez-Gálvez, F. Impact of wetting-drying cycles on the mechanical properties and microstructure of wood waste-gypsum composites. Materials 2019, 12, 1829. [Google Scholar] [CrossRef]
  16. Belayachi, N.; Hoxha, D.; Slaimia, M. Impact of accelerated climatic aging on the behavior of gypsum plaster-straw material for building thermal insulation. Constr. Build. Mater. 2016, 125, 912–918. [Google Scholar] [CrossRef]
  17. Aldaood, A.; Bouasker, M.; Al-Mukhtar, M. Impact of wetting-drying cycles on the microstructure and mechanical properties of lime-stabilized gypseous soils. Eng. Geol. 2014, 174, 11–21. [Google Scholar] [CrossRef]
  18. Romero-Gómez, M.I.; Costa-Pereira, M.F.; Dias, A.P.S.; Flores-Colen, I. Influence of high-temperature exposure on the properties of gypsum-plastic waste composites: Thermophysical and microstructural analysis. J. Build. Eng. 2023, 79, 107862. [Google Scholar] [CrossRef]
  19. Zaragoza-Benzal, A.; Ferrández, D.; Prieto, M.I.; Atanes-Sánchez, E. Fire-resistant performance of new sustainable waste-lightened composites with glass and basalt fibres reinforcement. Constr. Build. Mater. 2024, 411, 134620. [Google Scholar] [CrossRef]
  20. Alameda, L.; Calderón, V.; Junco, C.; Rodríguez, A.; Gadea, J.; Gutiérrez-González, S. Characterization of gypsum plasterboard with polyurethane foam waste reinforced with polypropylene fibers. Mater. Construcción 2016, 66, e100. [Google Scholar] [CrossRef]
  21. Ramos, F.J.H.T.V.; Mendes, L.C. Recycled high-density polyethylene/gypsum composites: Evaluation of the microscopic, thermal, flammability, and mechanical properties. Green Chem. Lett. Rev. 2014, 7, 199–208. [Google Scholar] [CrossRef]
  22. EN 13279-1:2008; Gypsum Binders and Gypsum Plasters—Part 1: Definitions and Requirements. CEN—European Committee for Standardization: Brussels, Belgium, 2008.
  23. The Council of the European Union. On the Quality of Water Intended for Human Consumption; Council Directive 98/83/EC; The Council of the European Union: Brussels, Belgium, 1998. [Google Scholar]
  24. Lin, C.; Kanstad, T.; Jacobsen, S.; Ji, G. Bonding property between fiber and cementitious matrix: A critical review. Constr. Build. Mater. 2023, 378, 131169. [Google Scholar] [CrossRef]
  25. Duraiswamy, S.; Neelamegam, P.; VishnuPriyan, M.; Alaneme, G.U. Impact of plastic waste fiber and treated construction demolition waste on the durability and sustainability of concrete. Sci. Rep. 2024, 14, 27221. [Google Scholar] [CrossRef] [PubMed]
  26. Esan, M.T. Review of gypsum reinforced composites as building materials. Discov. Civ. Eng. 2024, 1, 5. [Google Scholar] [CrossRef]
  27. EN 13279-2:2014; Gypsum Binders and Gypsum Plasters—Part 2: Test Methods. CEN—European Committee for Standardization: Brussels, Belgium, 2014.
  28. EN 12859:2011; Gypsum Blocks—Definitions, Requirements and Test Methods. CEN—European Committee for Standardization: Brussels, Belgium, 2011.
  29. EN 14617-1:2013; Agglomerated Stone—Test Methods—Part 1: Determination of Apparent Density and Water Absorption. CEN—European Committee for Standardization: Brussels, Belgium, 2013.
  30. EN 1936:2006; Natural Stone Test Methods—Determination of Real Density and Apparent Density, and of Total and Open Porosity. CEN—European Committee for Standardization: Brussels, Belgium, 2006.
  31. ASTM C597-22; Standard Test Method for Pulse Velocity Through Concrete. American Society for Testing and Materials: West Conshohocken, PA, USA, 2022.
  32. ASTM D559-12; Standard Test Methods for Wetting and Drying Compacted Soil-Cement Mixtures. American Society for Testing and Materials: West Conshohocken, PA, USA, 2012.
  33. Salih, W.T.; Yu, W.; Dong, X.; Hao, W. Study on stress-strain-resistivity and microscopic mechanism of red mud waste modified by desulphurization gypsum-fly ash under drying-wetting cycles. Constr. Build. Mater. 2020, 249, 118772. [Google Scholar] [CrossRef]
  34. Con, A.Y.; Adiciones, O.; Somolinos, R.S. Estudio del Comportamiento Frente al Fuego del Hormigón en Masa con Adición de Nanofibras de Carbono (cnfs) y su Comparación con Hormigones sin Adición y con Otras Adiciones. Ph.D. Thesis, E.T.S. de Edificación (UPM), Madrid, Spain, 2018. [Google Scholar]
  35. ISO 834-1:1999; Fire-Resistance Tests—Elements of Building Construction—Part 1: General Requirements. ISO—International Organization for Standardization: Geneva, Switzerland, 1999.
  36. Cheung, W.K.; Zeng, Y.; Lin, S.; Huang, X. Modelling carbon monoxide transport and hazard from smouldering for building fire safety design analysis. Fire Saf. J. 2023, 140, 103895. [Google Scholar] [CrossRef]
  37. Durgun, M.Y. Effect of wetting-drying cycles on gypsum plasters containing ground basaltic pumice and polypropylene fibers. J. Build. Eng. 2020, 32, 101801. [Google Scholar] [CrossRef]
  38. Chajec, A.; Królicka, A.; Rainer, J.; Pachnicz, M.; Nieświec, M.; Kaczmarczyk, O.; Walendzik, I.; Kapeluszna, E. Beyond filler effects: The role of mechanical activation in transforming quarry waste into functional cementitious components. Constr. Build. Mater. 2025, 490, 142637. [Google Scholar] [CrossRef]
  39. Li, Z.; Wang, X.; Yan, W.; Ding, L.; Liu, J.; Wu, Z.; Huang, H. Physical and mechanical properties of gypsum-based composites reinforced with basalt, glass, and PVA fibers. J. Build. Eng. 2023, 64, 105640. [Google Scholar] [CrossRef]
  40. Romero-Gómez, M.I.; Silva, R.V.; Flores-Colen, I.; Rubio-de-Hita, P. Mechanical performance of waste fishing net fibre-reinforced gypsum composites. Constr. Build. Mater. 2023, 387, 131675. [Google Scholar] [CrossRef]
  41. Gonçalves, R.M.; Martinho, A.; Oliveira, J.P. Evaluating the potential use of recycled glass fibers for the development of gypsum-based composites. Constr. Build. Mater. 2022, 321, 126320. [Google Scholar] [CrossRef]
  42. Ardebili, A.A.; Sáez, P.V.; Cortina, M.G.; Cruz, D.M.T.; Sáiz, Á.R.; Atanes-Sánchez, E. Mechanical characterization of gypsum mortars with waste from the automotive sector. Constr. Build. Mater. 2023, 370, 130675. [Google Scholar] [CrossRef]
  43. Magbool, H.M. Sustainability of utilizing recycled plastic fiber in green concrete: A systematic review. Case Stud. Constr. Mater. 2025, 22, e04432. [Google Scholar] [CrossRef]
  44. Rosell, J.R.; Cantalapiedra, I.R. Método simple para determinar el módulo de Young dinámico a partir de una excitación por impacto aplicado a morteros de cal y cemento. Mater. Constr. 2011, 61, 39–48. [Google Scholar] [CrossRef]
  45. Bertelsen, I.M.G.; Ottosen, L.M. Recycling of Waste Polyethylene Fishing Nets as Fibre Reinforcement in Gypsum-based Materials. Fibers Polym. 2022, 23, 164–174. [Google Scholar] [CrossRef]
  46. Merino, M.D.R. Elaboración y Aplicaciones Constructivas de Paneles Prefabricados de Escayola Aligerada y Reforzada con Fibras de Vidrio e y Otros Aditivos. Ph.D. Thesis, Universidad Politécnica de Madrid, Madrid, Spain, 1999. [Google Scholar] [CrossRef]
  47. Zheng, D.; Lu, H.; Sun, X.; Liu, X.; Han, W.; Wang, L. Reaction mechanism of reductive decomposition of FGD gypsum with anthracite. Thermochim. Acta 2013, 559, 23–31. [Google Scholar] [CrossRef]
  48. Luna, J.I.V.; Acosta, M.A.L.; Guzmán, G.S. Monitoreo de concentración de monóxido de carbono usando tecnología Long-Range. Ingenius 2017, 18, 73. [Google Scholar] [CrossRef]
  49. Instituto Para la Salud Geoambiental. Available online: https://www.saludgeoambiental.org/dioxido-carbono-co2 (accessed on 18 December 2025).
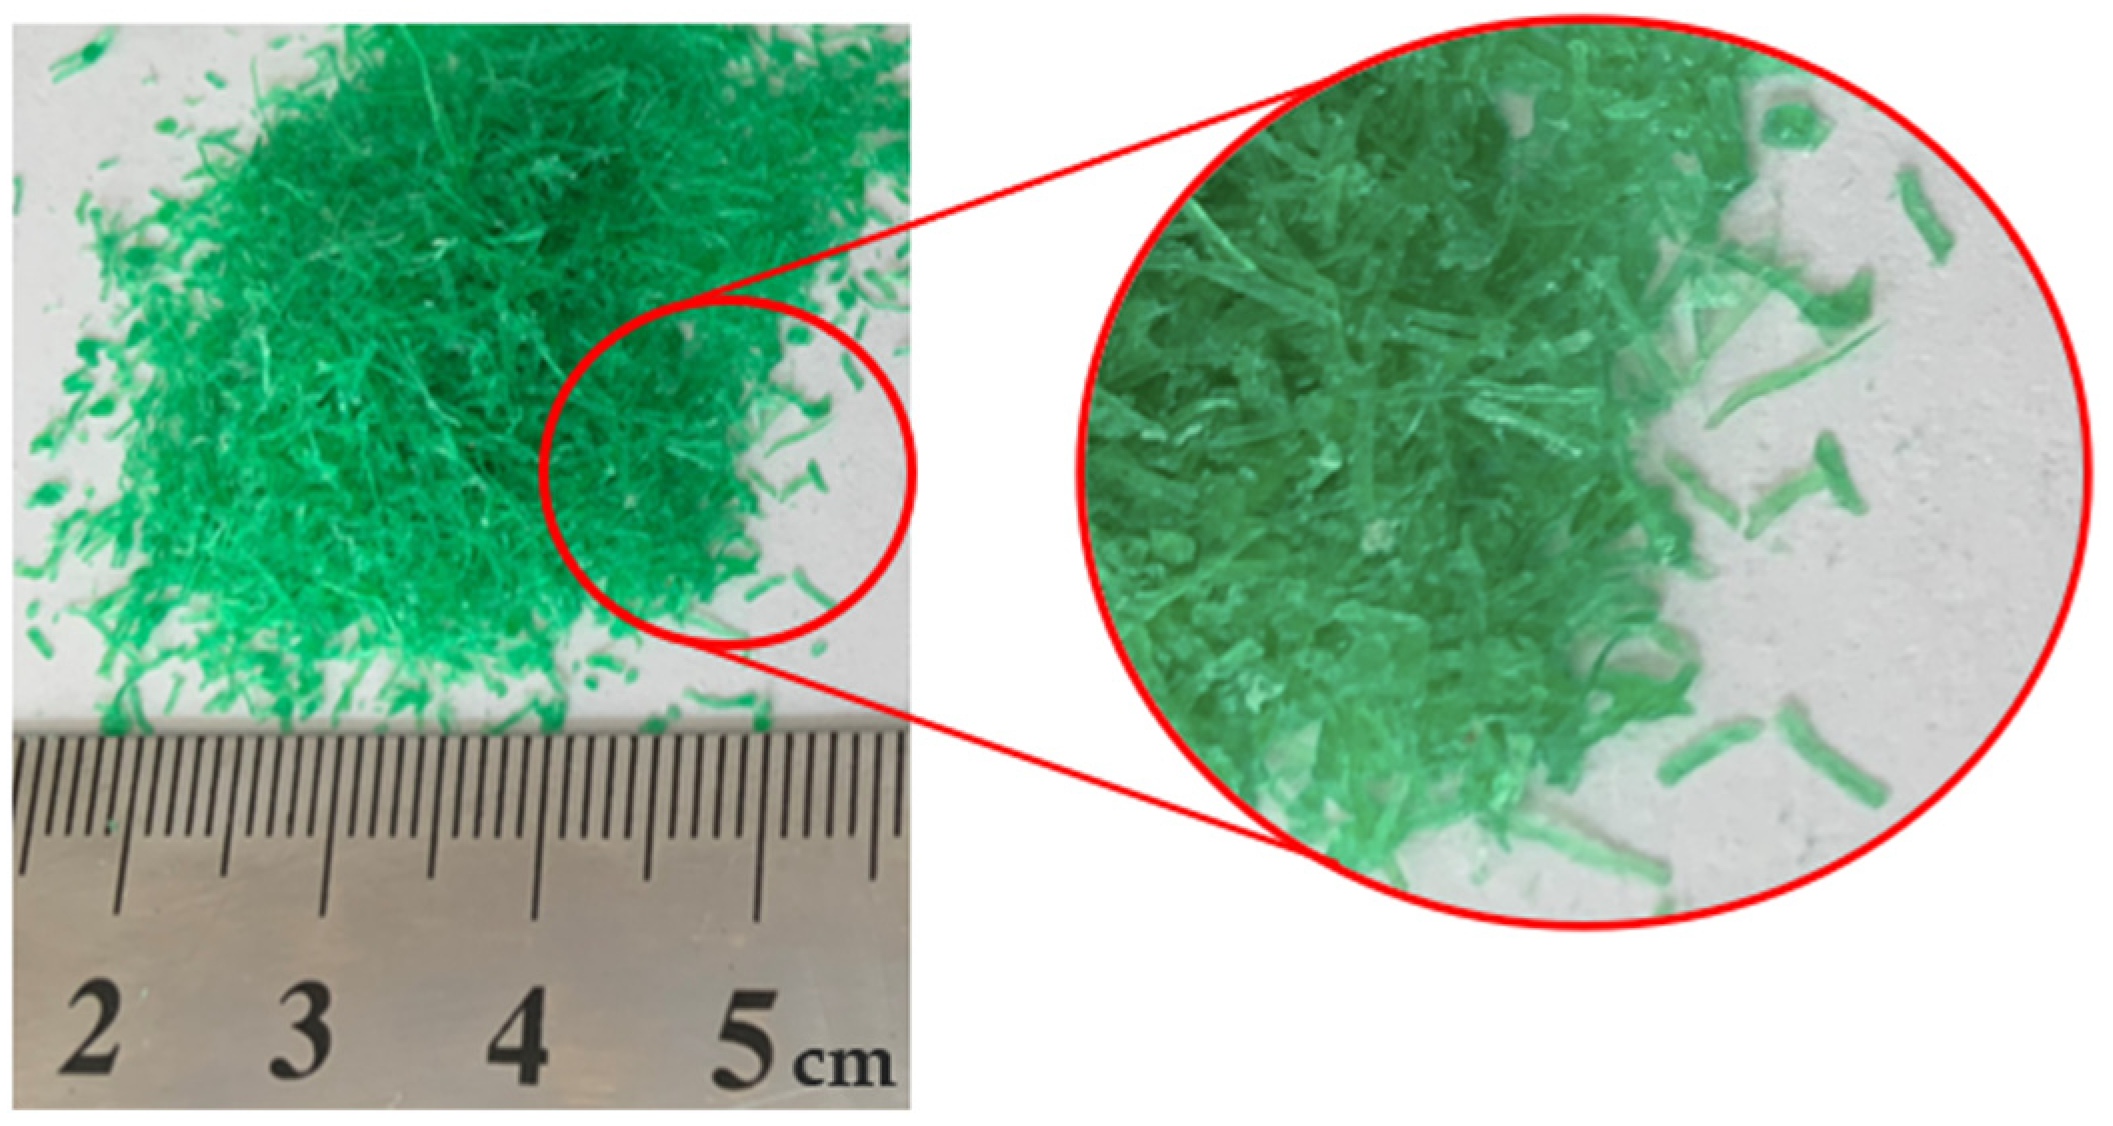
Figure 1. PE fibers from BNs (scale in cm).
Applsci 16 01489 g001
Figure 2. EDX analysis of: (a) gypsum powder; (b) BN fibers.
Applsci 16 01489 g002
Figure 3. Length analysis of BN fibers.
Applsci 16 01489 g003
Figure 4. Flowchart of sample preparation, division into groups, and test sequence.
Applsci 16 01489 g004
Figure 5. Cross-section images of the GCs with BN fibers developed in this research.
Applsci 16 01489 g005
Figure 6. Mechanical tests: (a) surface hardness; (b) flexural strength; (c) compression strength.
Applsci 16 01489 g006
Figure 7. Wet–dry exposure: (a) samples immersed in water; (b) samples in an oven at 60 °C.
Applsci 16 01489 g007
Figure 8. Fire exposure: (a) test setup; (b) latent fire.
Applsci 16 01489 g008
Figure 9. Results of total water absorption and open porosity tests.
Applsci 16 01489 g009
Figure 10. (a) Mass loss and (b) bulk density throughout wet–dry cycles.
Applsci 16 01489 g010
Figure 11. Results of the fire test: (a) graph of temperature on the unexposed face of the samples and heating curves in relation to time; (b) thermographic image at 6 min of test (scale in °C); (c) mass loss of the samples; (d) image of the exposed face of the samples after fire exposure.
Applsci 16 01489 g011
Figure 12. SEM analysis for BN40 sample: (a) ×150 magnification before fire exposure; (b) ×150 magnification after fire exposure; (c) ×5000 magnification before fire exposure; (d) ×5000 magnification after fire exposure.
Applsci 16 01489 g012
Figure 13. SEM analysis for BN40 sample before fire exposure (×1000 magnification).
Applsci 16 01489 g013
Figure 14. Results of the mechanical tests: (a) surface hardness; (b) dynamic modulus of elasticity.
Applsci 16 01489 g014
Figure 15. Results of the mechanical tests: (a) flexural strength; (b) compression strength.
Applsci 16 01489 g015
Figure 16. Thermogram obtained from the TGA of the BN fiber used in this research (blue line: mass loss as a function of time; red line: mass derivative with respect to time; green line: heat flow).
Applsci 16 01489 g016
Table 1. Evaluated samples’ compositions.
SampleGypsum [g]Water [g]BN Fibers [g]
Ref.333.3233.30.0
BN10300.0210.09.0
BN20266.7186.717.9
BN30233.3163.326.9
BN40200.0140.035.8
Table 2. Averages and standard deviations of total water absorption and open porosity.
SampleTotal Water Absorption [%]Open Porosity [%]
AverageSD *AverageSD *
Ref.38.80.6141.40.62
BN1036.50.4238.50.39
BN2035.30.5936.90.30
BN3034.10.1235.50.13
BN4032.40.4833.70.41
* SD: standard deviation.
Table 3. Main TGA results of the reference sample.
Total Mass Loss [%]Interval [°C]Maximum
Temperature [°C]
Partial Mass Loss [%]Associated Heating EffectsComments
21.60–250128.0520.3EndothermalDH to HH
137.41EndothermalHH to anhydrite
250–550354.12-ExothermalAnhydrite phase transition
550–750636.15; 661.321.3EndothermalCaCO3 to CaO
Note: Calcium sulphate dihydrate (DH); calcium sulphate hemihydrate (HH).
Table 4. Estimated CO2 and CO emissions during the combustion of panels produced from GCs and BN fibers in the unit room.
SampleTotal Fibers in the Panels for the Unit Room [kg]Estimated CO2 [kg]Estimated
CO [kg]
Estimated CO2 [ppm]Estimated
CO [ppm]
Ref.-----
BN1013.183641.356926.32761378.57877.59
BN2026.220782.254352.36272741.811745.43
BN3039.4043123.611378.69044120.382623.01
BN4052.4414164.5087104.72555483.623490.85
Disclaimer/Publisher’s Note: The statements, opinions and data contained in all publications are solely those of the individual author(s) and contributor(s) and not of MDPI and/or the editor(s). MDPI and/or the editor(s) disclaim responsibility for any injury to people or property resulting from any ideas, methods, instructions or products referred to in the content.