Article

Development of a Method for Assessing Bending Stresses in the Walls of Above-Ground Main Pipelines Based on Airborne Laser Scanning Data


by
Enver Dzhemilev
*,
Ildar Shammazov
,
Arina Khvesko
and
Margarita Mazur
Department of Transport and Storage of Oil and Gas, Saint Petersburg Mining University, 199106 Saint Petersburg, Russia
*
Author to whom correspondence should be addressed.
Appl. Sci. 2026, 16(3), 1330; https://doi.org/10.3390/app16031330
Submission received: 19 December 2025 / Revised: 17 January 2026 / Accepted: 23 January 2026 / Published: 28 January 2026

Abstract

During the operation of above-ground main oil and gas pipelines, their elastic bends occur due to the properties of the soils in which the pipeline bases are installed, climatic factors, and the intersection of geodynamic zones. Exceeding the stress values in the pipeline wall above their permissible values leads to a rupture of the wall metal and major accidents. Most methods for estimating the values of bending stresses in the pipeline wall cannot be implemented during their operation, when the pipeline already has a bend, and the installation of any additional equipment on the pipeline requires additional investments. At the same time, the most widely used method for estimating bending stresses based on data from in-pipe diagnostics does not allow for evaluation in areas with varying internal diameters of the pipeline, as well as right-angle turns. The most promising method for estimating bending stresses is aerial laser scanning of pipelines, which consists of obtaining a cloud of points on the pipeline surface, estimating its spatial position, and calculating stress values. However, this method requires the development of more accurate algorithms for processing laser scanning data, and the method is associated with a number of difficulties that can be eliminated by developing the correct sequence of actions during scanning. Within the framework of this article, an algorithm has been developed for analyzing the coordinates of a cloud of points on the pipeline surface, which makes it possible to estimate the values of bending stresses in the pipeline wall. The influence of the unevenness of the thermal insulation surface on the stress assessment results was also studied, taking into account the minimum angle of the scanned pipeline sector, which ensures the accuracy of determining stress values up to 5% using the developed method.

1. Introduction

Modern transportation infrastructure, particularly pipeline systems for hydrocarbon distribution, is indispensable for facilitating the global circulation of essential energy resources. Today the world depends on petroleum and natural gas, making the reliability and safety of these networks critical for economic stability and energy security [1,2]. However, as these systems expand in complexity and capacity, they become increasingly vulnerable to operational failures, with risks further amplified in challenging environments such as mountainous and offshore regions [3,4]. The inevitable material degradation and corrosion damage that occur during prolonged operation create localized stress concentrations and structural vulnerabilities, which in turn heighten the potential for catastrophic incidents [5,6]. Any resulting discharge of hydrocarbons not only precipitates severe and sustained ecological degradation but also generates substantial economic losses, thereby necessitating rigorous safety protocols and proactive risk mitigation strategies to inform the frameworks and fortify system resilience against future hazards [7,8].
During operation of above-ground main pipelines, deformations associated with the formation of bends in the pipeline occur [9,10]. When such bends form, bending stresses arise in the metal of the pipeline wall, the magnitude of which often exceeds the permissible values for the pipeline material, which leads to pipe rupture and accidents [11,12]. Elastic bends in above-ground pipelines are quite common along their length [13,14]. These bends are either calculated at the design stage and implemented during pipeline construction, or they form in both the vertical and horizontal planes due to the characteristics of the natural environment [15,16]. Such characteristics include extremely low and extremely high temperatures, high humidity, highly unstable soils, and significant elevation changes [17,18]. Significant difficulties arise when operating pipeline sections at the points where they intersect geodynamic zones [19,20]. This factor is particularly dangerous, since it contributes to the formation of stress values that are critical for the metal of the pipeline wall [21,22]. The lack of necessary preventive measures related to the loss of bending under such operating conditions leads to major accidents in pipeline transport [23,24].
In connection with the above, the purpose of this study is to develop a method for assessing bending stresses in the wall of above-ground main pipelines, which allows determining the values of bending stresses in the body of the pipeline with an accuracy of up to 5%.
To achieve this goal, the first step is to analyze the advantages and disadvantages of existing methods for analyzing the stress–strain state of above-ground main pipelines. Next, taking into account the identified shortcomings of existing methods, it is necessary to develop a method that will allow for the rapid and accurate determination of bending stresses in the wall of an above-ground pipeline with an accuracy of up to 5%. Finally, it is necessary to conduct an experimental study of the accuracy of the developed method for analyzing the stress–strain state of a main pipeline, taking into account possible factors that reduce the accuracy of bending stress determination.

2. Materials and Methods

2.1. Analysis of Existing Methods for Analyzing the Stress–Strain State of Above-Ground Main Pipelines

Currently, there are a large number of methods used to determine the stress–strain state of main pipelines, among which the following can be distinguished:
  • Determination of the pipeline position based on the results of in-pipe diagnostics;
  • Application of inclinometry;
  • Using fiber optic sensors;
  • Application of tacheometric survey of pipeline;
  • Application of laser scanning.
Next, we will consider each of the methods in more detail.
  • Determining the position of the pipeline based on the results of in-pipe diagnostics.
This method involves inserting a special tool (for example, pipeline inspection gauges) into the pipeline cavity, which can be used to obtain elevation data along the pipeline’s length (using odometers) and identify defects [25,26]. In-pipe robots can be classified based on locomotion, actuator, and power supply [27,28]. Furthermore, implementing this method does not require significant investment, as in-line inspection is commonly performed. The main disadvantage of this method is the possibility of the pipeline inspection gauge becoming stuck in the pipeline when passing through places of narrowing or widening of the diameter (reducers and diffusers), right-angle turns of the pipeline, which are most often used to compensate for temperature deformations of the pipeline, as well as places where tees are connected [29,30].
2.
Application of inclinometry.
The method involves installing inclinometer sensors along main pipelines to monitor their stress–strain state [31,32]. In a laboratory setting, the devices are installed along the upper generatrix of the pipe, after which the pipe is bent to take measurements [33]. After mathematical transformation of the data, elevation values are obtained, which correspond to an error of within 3% [34]. A disadvantage of this method is the need to install inclinometers on straight, unstressed sections of pipe before pipeline construction. Installing sensors during pipeline operation will not provide an objective assessment of stress due to its changed position under the influence of operational loads.
3.
Using fiber optic sensors.
Fiber-optic sensors are specialized cables that transmit information in the form of optical light signals [35,36]. Therefore, when a cable installed on a pipeline deforms [37], the light scatters, causing a change in the frequency of the light signal, allowing for stress monitoring in the pipeline wall [38]. The disadvantage of this method, as in the case of using inclinometers, is the need to install cables before the pipeline is constructed to indicate the reference point for mechanical stresses.
4.
Application of tacheometric survey of pipelines.
To implement the method, a geodetic set of instruments is used, such as electronic tacheometers and laser scanners [39,40]. In addition, this method can be used to detect and monitor landslides affecting pipelines [41]. The disadvantage of this method is the assessment of pipeline stresses based only on the vertical component of its bending, due to the complexity of implementing a tacheometric survey of a pipeline in a horizontal plane, since a tacheometric survey above a pipeline is more labor-intensive than airborne laser scanning. Therefore, a tacheometric survey does not provide an objective assessment of pipeline stresses in the case of combined bends in two planes.
5.
Application of laser scanning.
The principle of this method is to scan an object’s surface using laser scanners, resulting in point clouds whose coordinates can be used to construct digital 3D models [42,43]. Based on the time it takes for the laser beam to travel from the scanner to the object and back, the coordinates of the point on the surface of the object to which the beam was directed are calculated.
There are three groups of laser scanning:
terrestrial laser scanning;
mobile (handheld) laser scanning;
airborne laser scanning [44].
It is also important to note that airborne laser scanning allows for the simultaneous determination of a pipeline’s spatial position in both the vertical and horizontal planes by determining all three coordinates of each point on the surface of the scanned object, based on the measurement principle employed [45].
Based on the principle of measuring the distance to the object, laser scanners are divided into two groups: pulse and phase. Pulse laser scanners calculate the coordinates of a point on the surface of the scanned object based on the time it takes the laser beam to travel from the scanner to the object and back. Phase laser scanners determine the coordinates of points on the object’s surface based on the number of integer wavelengths between the scanner and the object and the phase difference between the emitted and received modulating oscillation wave.
The choice of method depends on the specific situation [46,47]. For example, for above-ground main pipelines—long objects—airborne laser scanning is used, while mobile scanning is used for individual components, and ground-based scanning is used for industrial facilities.
Terrestrial laser scanning uses tripod-mounted scanners with a long scanning range. These scanners require visibility of the entire pipeline section being surveyed.
For airborne laser scanners, basic information is provided in Table 1.
The use of airborne laser scanning can be combined with in-line inspection results to obtain more accurate data on the pipeline’s spatial position, which is used to calculate bending stress values in its wall, as well as to correlate the bending stress distribution along the pipeline with the location of wall defects obtained from in-line inspection gauges. This enables a comprehensive assessment of the severity of pipeline defects, along with the stresses occurring in each section. Furthermore, the use of two methods for determining the pipeline’s spatial position simultaneously helps minimize potential errors that arise during the measurement process and are typical for both laser scanners and in-line flaw detector sensors [26].
However, due to the limitations of using in-line inspection gauges, airborne laser scanning can be used independently to determine bending stress values in pipeline walls.
Also, to improve the accuracy of linking bending stress values to coordinates along the pipeline using laser scanning results, reflective plates installed on the pipeline at a known distance from each other can be used. This helps to minimize accumulated errors during laser scanning [46].
Based on the analysis of the listed methods, it can be concluded that the most promising method for determining the stress–strain state of above-ground main pipelines is their airborne laser scanning. However, at present, there is no universal method for processing a cloud of laser scanning points that would allow for a sufficiently accurate assessment of the bending stresses in the pipeline wall [48]. This article proposes a method for estimating the magnitude of bending stresses in the wall of above-ground pipelines based on data on the spatial position of the central axis of the pipeline obtained by processing its laser scanning data.
It is important to note that existing methods of analyzing laser scanning data to assess the spatial position of the central axis of pipelines most often come down to monitoring their deformations, identifying defects, or constructing volumetric digital models for their integration into the structure of digital twins [48]. As for the problem of calculating the values of bending stresses in the pipeline wall, it requires a more accurate analysis of the obtained point clouds than in the case of the listed problems.
One method involves scanning the entire internal surface of the pipe. A digital model of the resulting point cloud is then placed next to a cylindrical shell, representing an undeformed pipe of similar outside diameter, using specialized software. The deviations between the resulting point cloud and the cylindrical shell are then calculated, which then informs the stress magnitude in each pipe cross-section [49,50]. A similar approach is also used to analyze deformations and stresses in the wall of oil storage tanks [47,51].
Also often used is the method of estimating the spatial position of the central axis of a pipeline based on the position of its upper generatrix, the line of which consists of the peak points of its digital model obtained after filtering the point cloud and constructing a shell volumetric model of the pipe [52,53].
In addition, existing studies do not investigate the influence of factors such as the unevenness of the insulation coating and the angle of the scanned sector on the accuracy of determining the stress values in the pipeline wall.
The following factors have a significant impact on the results of assessing the stress values in the pipeline wall based on laser scanning data:
During operation of main above-ground oil and gas pipelines, irregularities in the external insulation layer may develop. Such irregularities also occur at the joints of insulation sheets and reach values from 5 to 15 mm. Laser scanning of such pipelines may result in errors in stress determination due to the influence of such irregularities on the point cloud of the pipeline surface, which is used for stress analysis.
During aerial laser scanning of a main pipeline, scanning its entire surface is impossible, as scanning can only be performed by flying over it. This scanning method allows data to be collected from a larger area in a shorter period of time, but only the upper sector of the pipeline, at a specific angle, is scanned, increasing the uncertainty in determining bending stresses in the pipeline wall.
Based on the above, it is also necessary to assess the influence of the unevenness of the insulation coating, as well as the angle of the scanned sector of the pipeline, on the accuracy of determining the values of bending stresses based on airborne laser scanning data of the pipeline.
This article develops a method for estimating bending stresses occurring in the wall of an above-ground main pipeline based on laser scanning data. This method involves aerial laser scanning of the above-ground main pipeline, generating a point cloud. The coordinates of these points are used to calculate the coefficients of a polynomial equation describing the spatial position of the pipeline’s central axis. The calculated coefficients are used to calculate the bending stresses in the pipeline wall.
Thus, the following stages of this study can be identified:
The first step is to develop a method for calculating the coefficients of a polynomial that describes the spatial position of the central axis of an above-ground pipeline based on the coordinates of its laser scanning points.
The second stage involves determining the accuracy of bending stress values based on the developed method through an experimental study. This study involves scanning an uninsulated pipe in its elastic bending state, calculating the bending stress values using the developed method, and comparing the obtained results with stresses calculated using a polynomial equation describing the actual spatial position of the pipeline’s central axis.
The third stage involves an experimental study of the accuracy of the developed method for analyzing pipeline bending stresses, taking into account the unevenness of the insulating coating and various angles of the pipeline’s scanned sector. The study involves scanning a pipe with pre-defined unevenness of the insulating coating at various angles of its scanned sector. For the point cloud obtained for each angle of the pipe’s scanned sector, the coefficients of the polynomial for its central axis are calculated, bending stresses are calculated based on the developed method, and the accuracy of the calculated stresses is determined by comparing them with stresses calculated for a pipe without an insulating coating and scanned over its entire surface.
Finally, it is necessary to draw conclusions about the accuracy of determining the bending stresses of above-ground pipelines using the developed method, the degree of influence on the accuracy of possible irregularities in the insulating coating of the pipeline, as well as the angle of its scanned sector, and to propose recommendations for conducting airborne laser scanning of above-ground pipelines to determine the values of bending stresses with an accuracy of up to 5%.

2.2. Development of a Method for Analyzing Bending Stresses in a Pipeline Wall

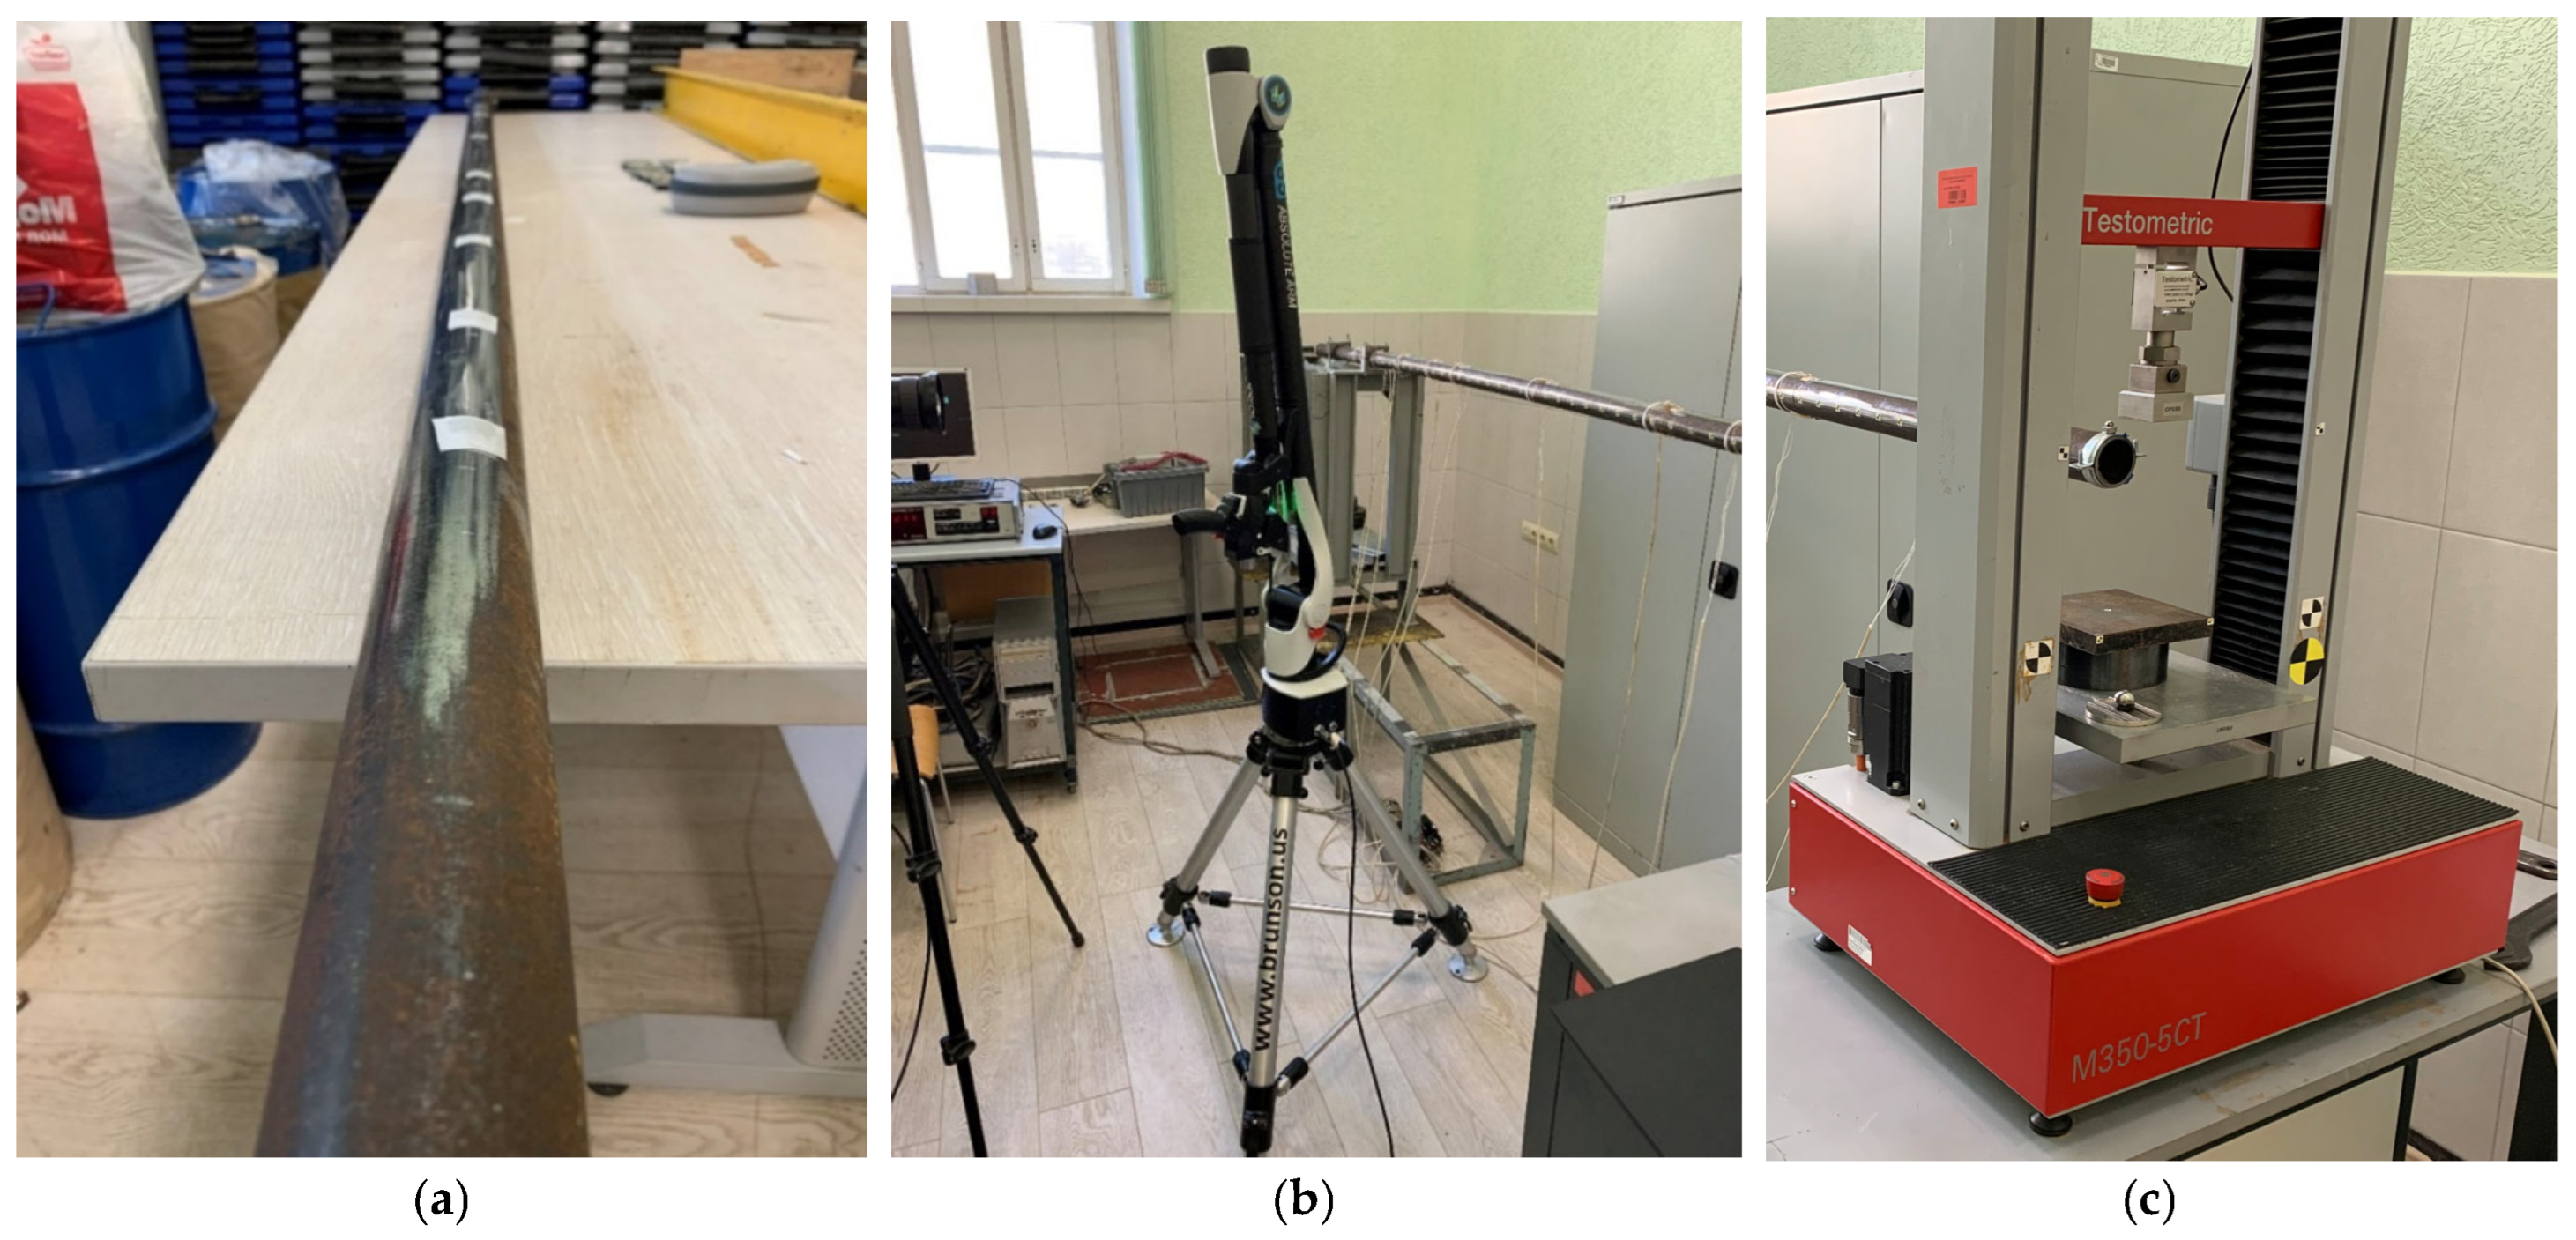
To conduct experiments involving the determination of the polynomial coefficients that describe the spatial position of the central axis of an uninsulated pipe, the following equipment was used (Figure 1):
A pipe 2.4 m long, with an outer diameter of 51 mm and a wall thickness of 3 mm;
Laser Hexagon RS6 Laser Scanner (Hexagon AB, Stockholm, Sweden);
Hasselblad H5D 200 MS camera with 200 MP resolution (Victor Hasselblad AB, Gothenburg, Sweden);
Electromechanical press Testometric M350-5CT (Testometric Company Ltd., Rochdale, UK) for creating a load on the free end of the pipeline.
The equipment used for laboratory testing is shown in Figure 2, Figure 3 and Figure 4.
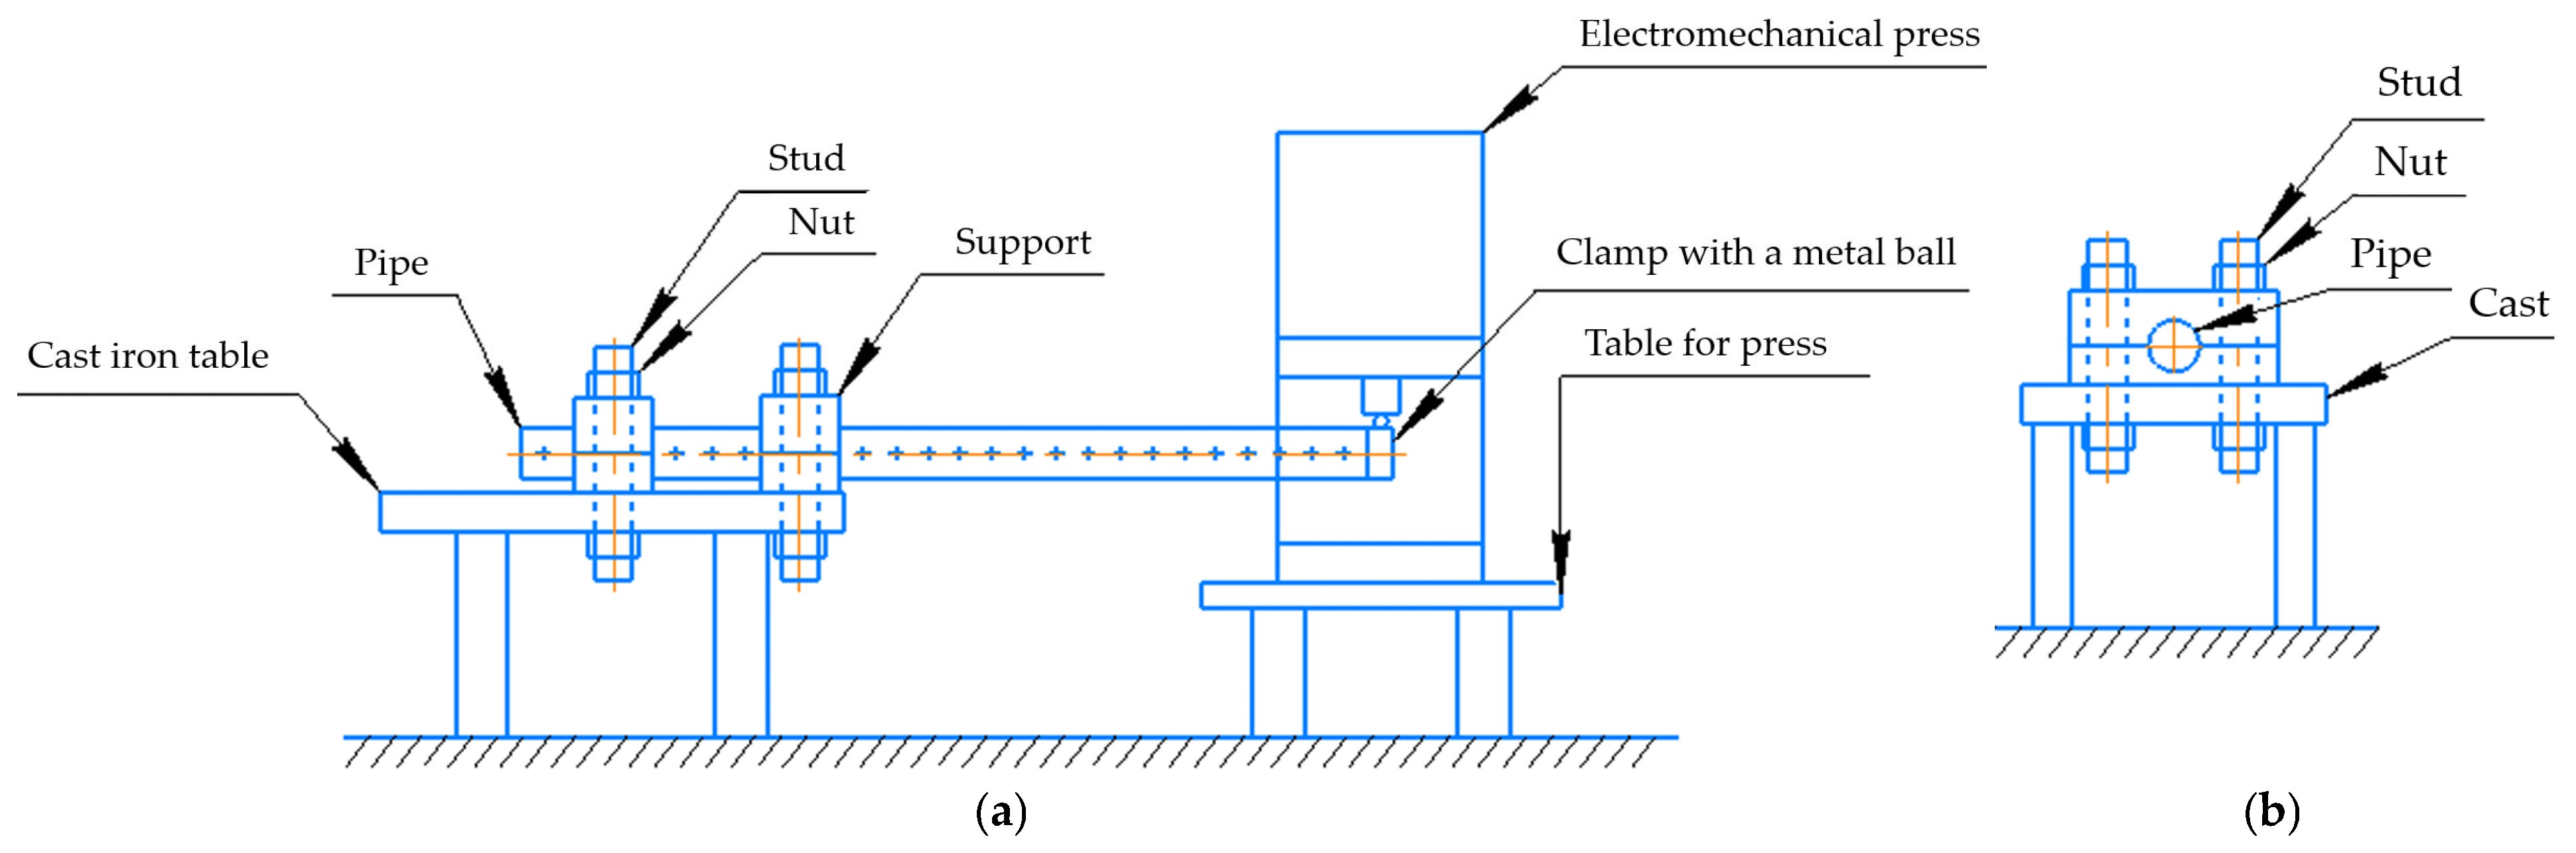
The left end of the experimental pipe is clamped in two places using a fasteners consisting of two halves, secured to each other and to the table with studs and nuts. The free right end of the pipe is positioned under the ram of an electromechanical press. A clamp with a steel ball at the top is placed on the right end of the pipe to ensure contact between the pipe and the press ram.
The Hexagon RS6 Laser Scanner, manufactured by “Hexagon Manufacturing Intelligence” (North Kingstown, RI, USA), is a mobile scanner that enables laser scanning with a point coordinate determination accuracy of up to 26 microns. The minimum distance between points is up to 27 microns. The maximum data collection rate is 1.2 million points per second.
The Testometric M350-5CT testing machine is manufactured by the British company “The Testometric Company Limited” (Rochdale, UK). It can generate a maximum force of 5 kN. The force measurement accuracy is 0.5% of the applied force.
During the experiment, a Hasselblad H5D 200 MS camera was used to take photographs of cross markers located every 5 cm along the side of the pipe.
The Hasselblad H5D 200 MS camera is manufactured by the Swedish company “Victor Hasselblad AB” (Gothenburg, Sweden) and allows to take photographs of images with a resolution of up to 200 megapixels, which provides the necessary quality of images of the experimental pipe with cross markers for further analysis.
To ensure better adhesion, before testing, the pipeline in the areas where the markers are attached is subjected to the action of a grinding machine.
The first stage of the study included the following steps:
  • The left end of the pipe is securely fixed by clamping it in a special fixture, ensuring a rigid seal;
  • At the opposite end of the pipe, the rod of the electric press is placed;
  • The video camera is positioned in such a way as to record markers applied to the surface of the pipe;
  • The free end of the pipe is loaded with a force of 150 N by lowering the press rod, which causes deformation of the pipe in the form of elastic bending;
  • The deformed state of the pipe is photographed using a camera;
  • The geometry of the curved pipe is determined by laser scanning with a minimum density of 9 points/cm2;
  • The loading force is removed by returning the electric press rod to its original position, releasing the free end of the pipe.
During the experiment, the results of stress assessment using laser scanning are compared with those obtained by photographing cross markers. Measuring stress in the pipeline wall is also possible using strain gauges. However, despite the previously described limitations of this method, in-line inspection is most often used during the operation of above-ground pipelines. This method involves obtaining data on the pipeline’s spatial position and calculating bending stress values based on this data. Thus, when assessing stress by photographing cross markers located on the side of the pipe and by laser scanning, stress assessment is also based on data on the spatial position of the pipeline, as is the case with stress calculations based on in-line inspection results. Therefore, the two described methods were used in the experiments.
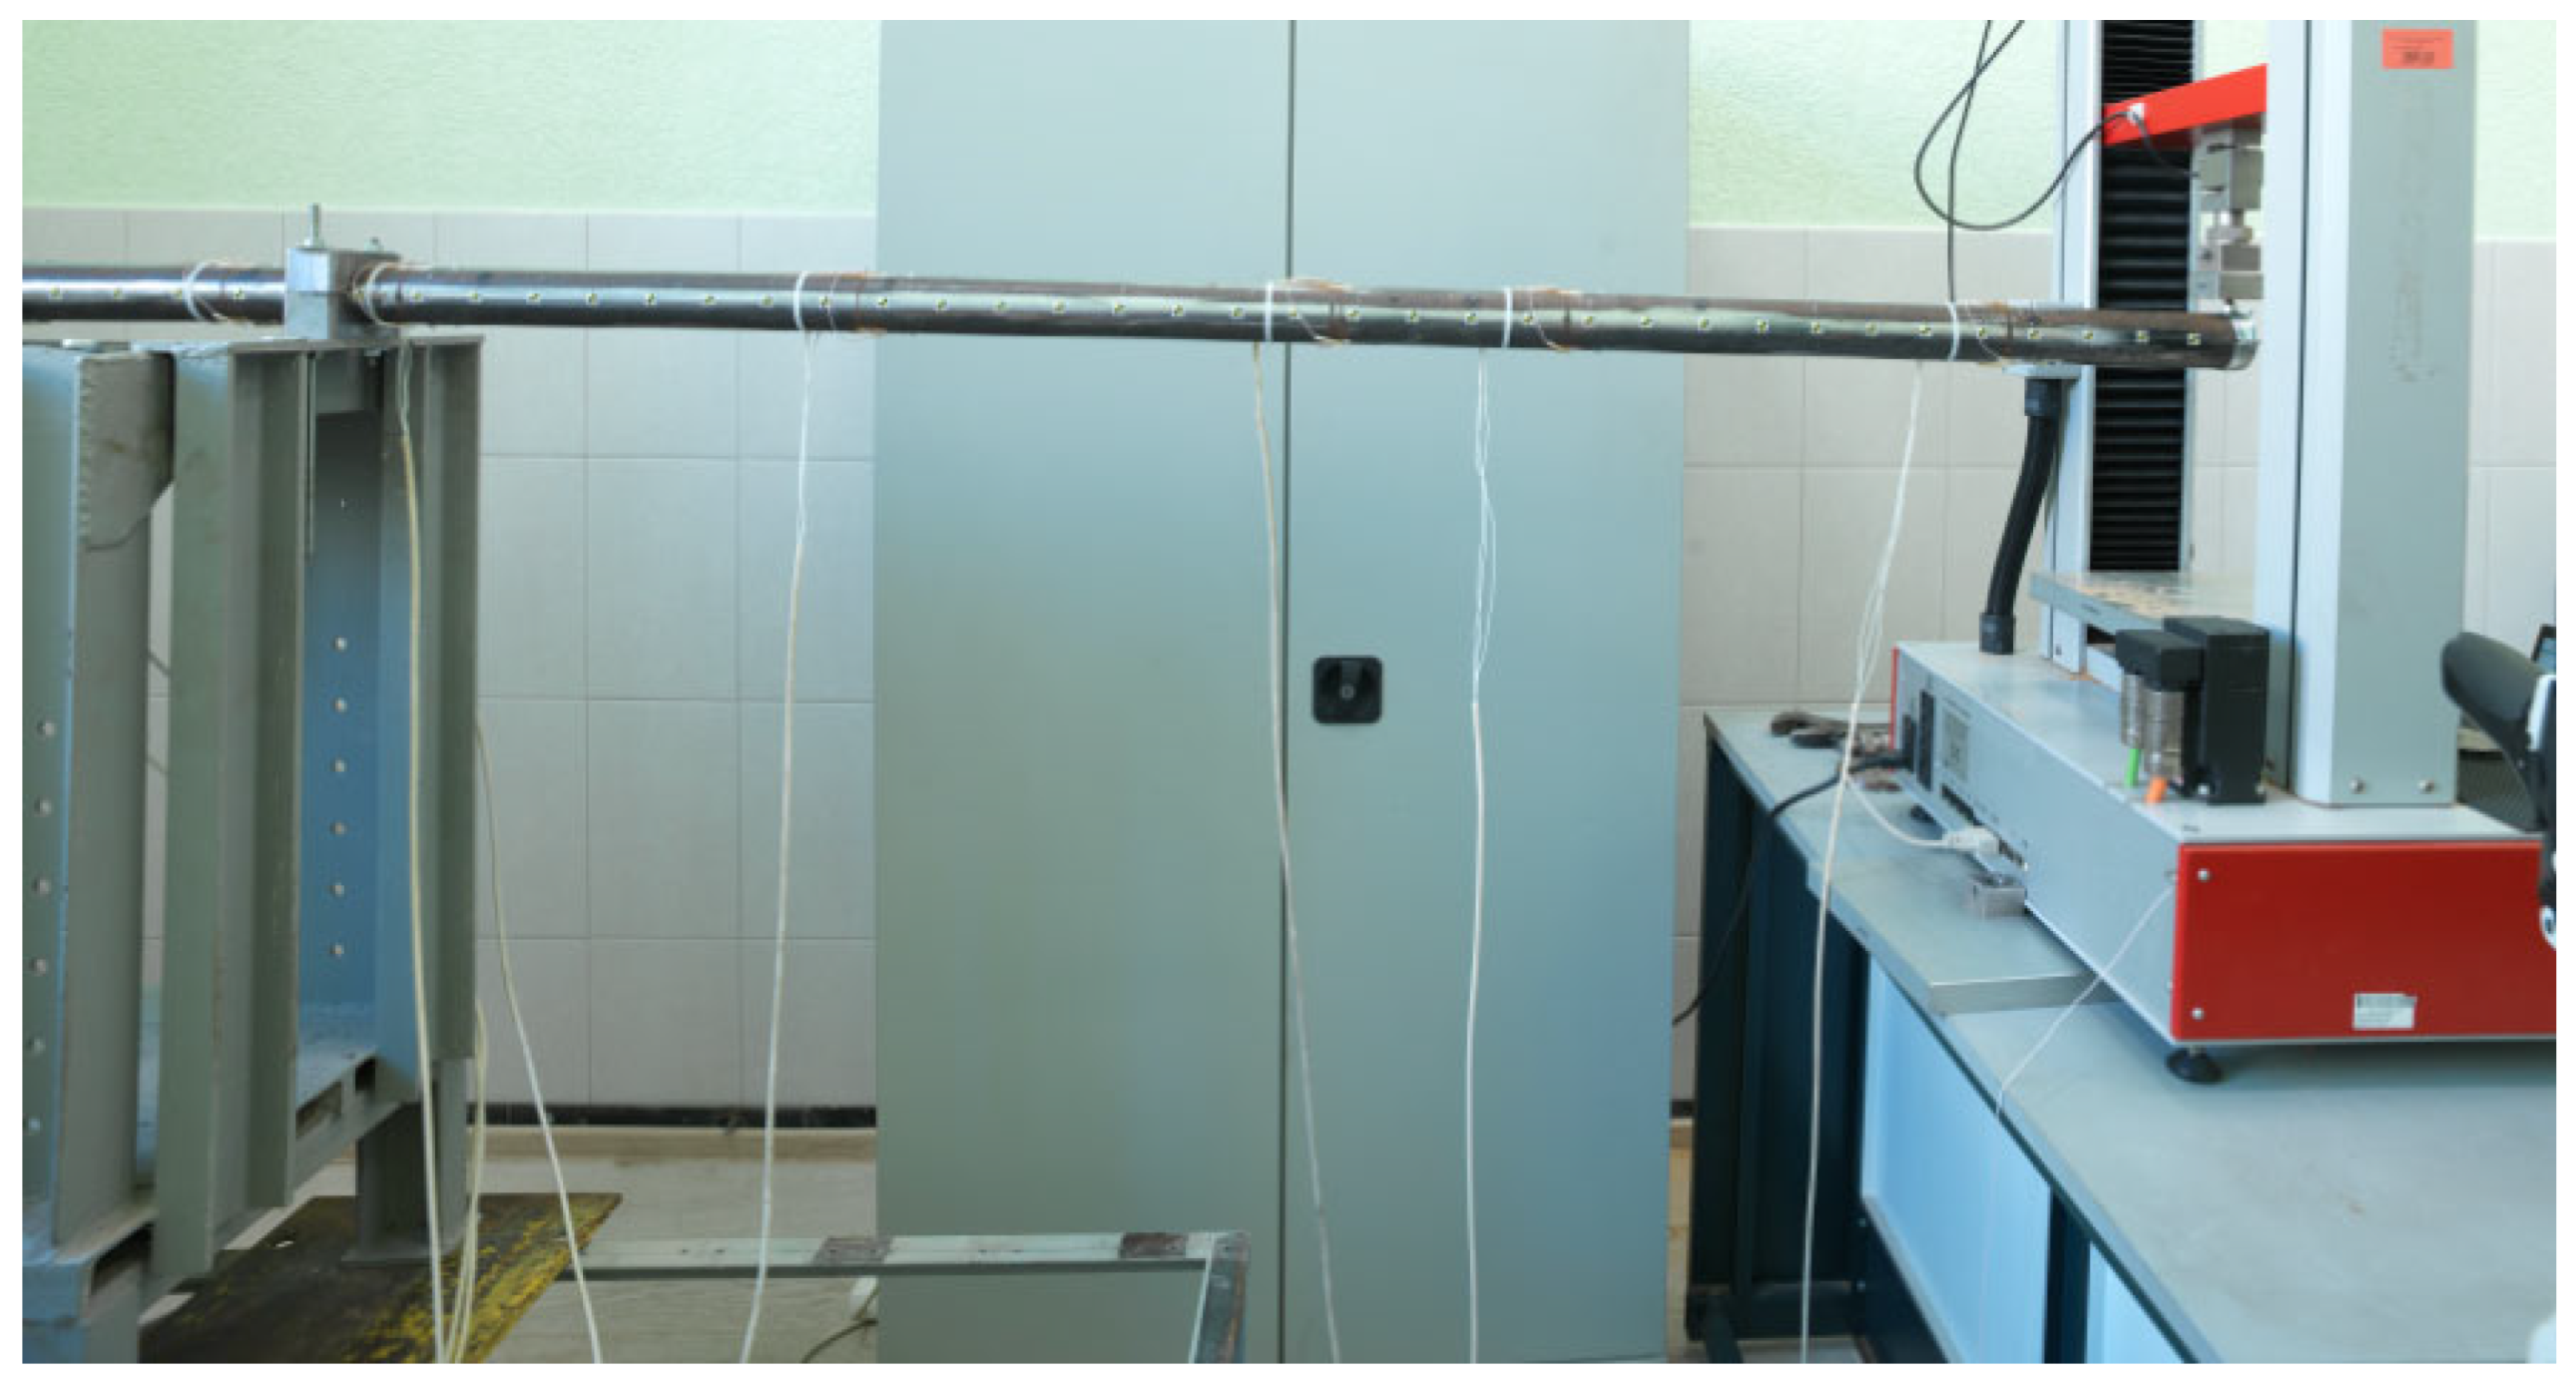
The pipe under study in a bent state is shown in Figure 3.
An example of the resulting point cloud of the pipe is shown in Figure 4.
As a result of laser scanning, clouds of points of the pipe were obtained for pipe’s various studied lengths for further transition from point clouds to the equation of the curved axis of the pipe.
In the second stage, the central axis of the pipe in a state of elastic bending was constructed using laser scanning data. The method described below for analyzing the coordinates of the surface points of the pipe under study is presented in an earlier work by the authors [54,55]. Nevertheless, the method described in the previous work was used to assess the possible movements of the excavated section of the underground pipeline during its repair with the cutting of the defective section. In this paper, it is advisable to evaluate the applicability of this method in relation to estimating the bending stresses of above-ground pipelines.
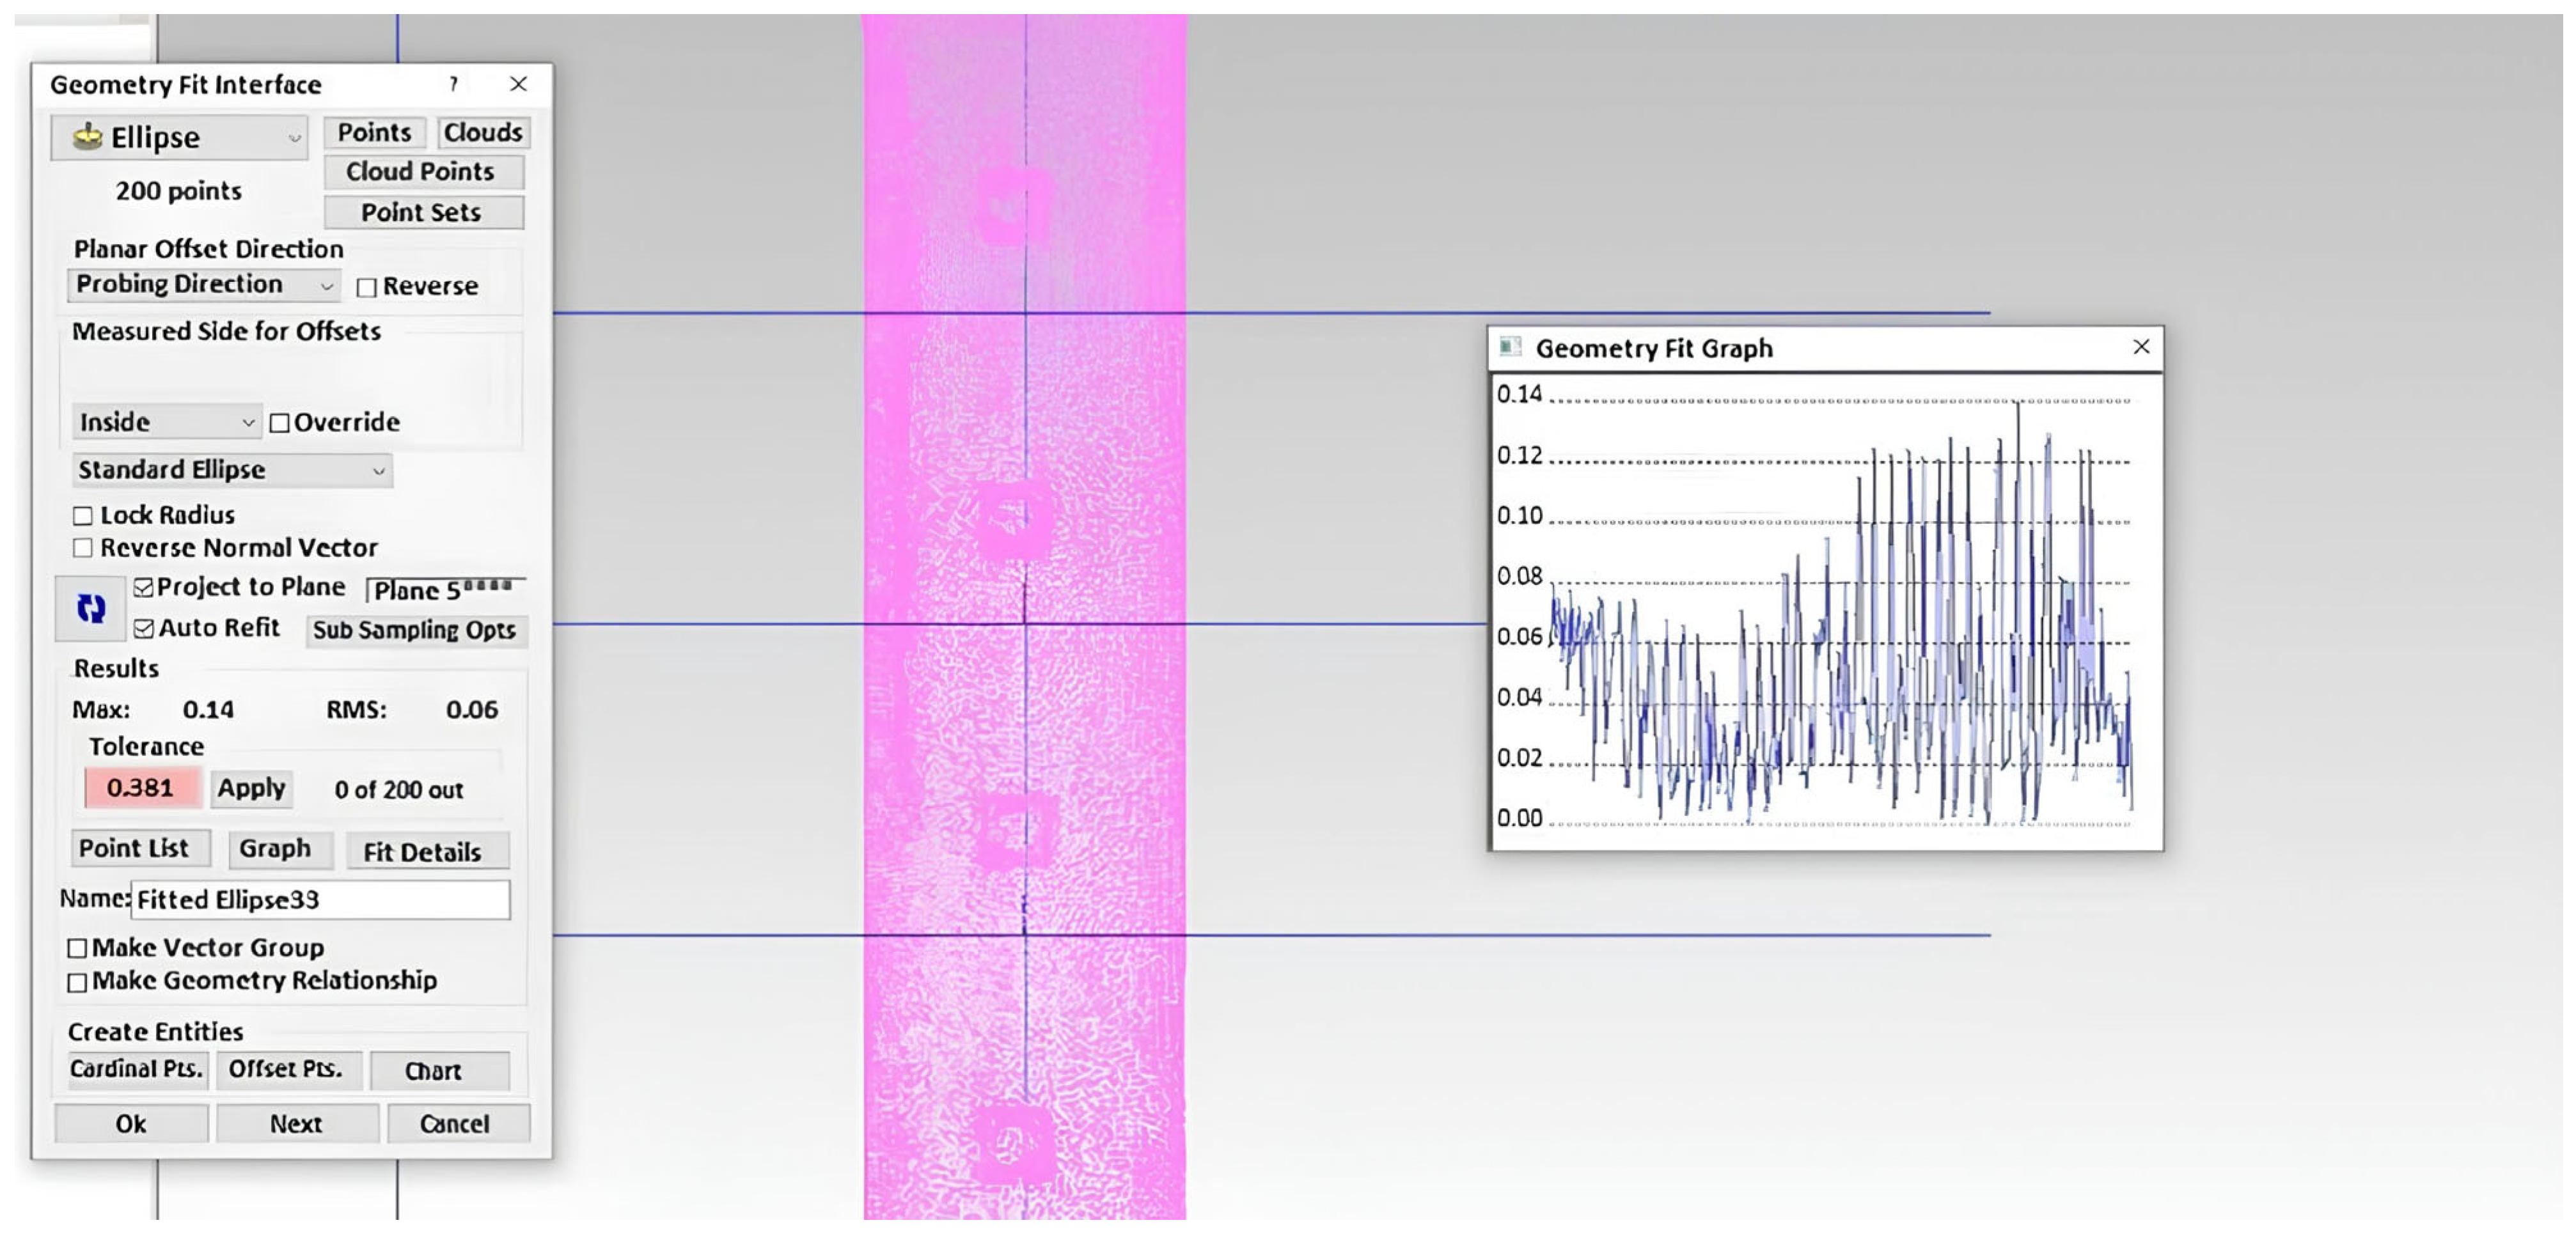
Cloud of points processing began with a filtering procedure that excluded points with a standard deviation greater than 0.1 mm. Filtering was performed on cylindrical surfaces (5 mm high) with central axes parallel to the horizontal axis of the scanning coordinate system and spaced between cross markers at 5 cm intervals. Final removal of points that did not meet the specified deviation requirements was achieved by selecting a range of up to 0.1 mm on the Geometry Fit Graph deviation chart in SpatialAnalyzer software (version 2025.1).
SpatialAnalyzer software, developed by the American company New River Kinematics, specializes in metrology solutions, integrating data from over 120 measuring devices to analyze their measurement results. For laser scanning, the software enables point cloud analysis, visualization, noise filtering (deviations in the measured points on an object’s surface), and conversion of point clouds into 3D polygonal models.
The SpatialAnalyzer program when processing a point cloud is shown in Figure 5.
The center of Figure 5 shows a pink cloud of laser scan points. The initial maximum deviation of the points from the elliptical surface was 0.381 mm (shown in Figure 5 as Tolerance). The points are then filtered by removing them using Geometry Fit Graph, leaving only those with a maximum deviation of up to 0.1 mm.
Then, the filtered points in each created cylinder were approximated with an ellipse using SpatialAnalyzer. The choice of an ellipse as an approximating figure was explained by the fact that, despite the initially circular cross-section of the pipe, it becomes ovalized during deformation. For each resulting ellipse, the coordinates of the center were determined, which ultimately represent the points of the curved axis of the pipeline.
The third stage of the study involves recording the position of the cross markers attached to the side of the pipe, based on photographs taken earlier.
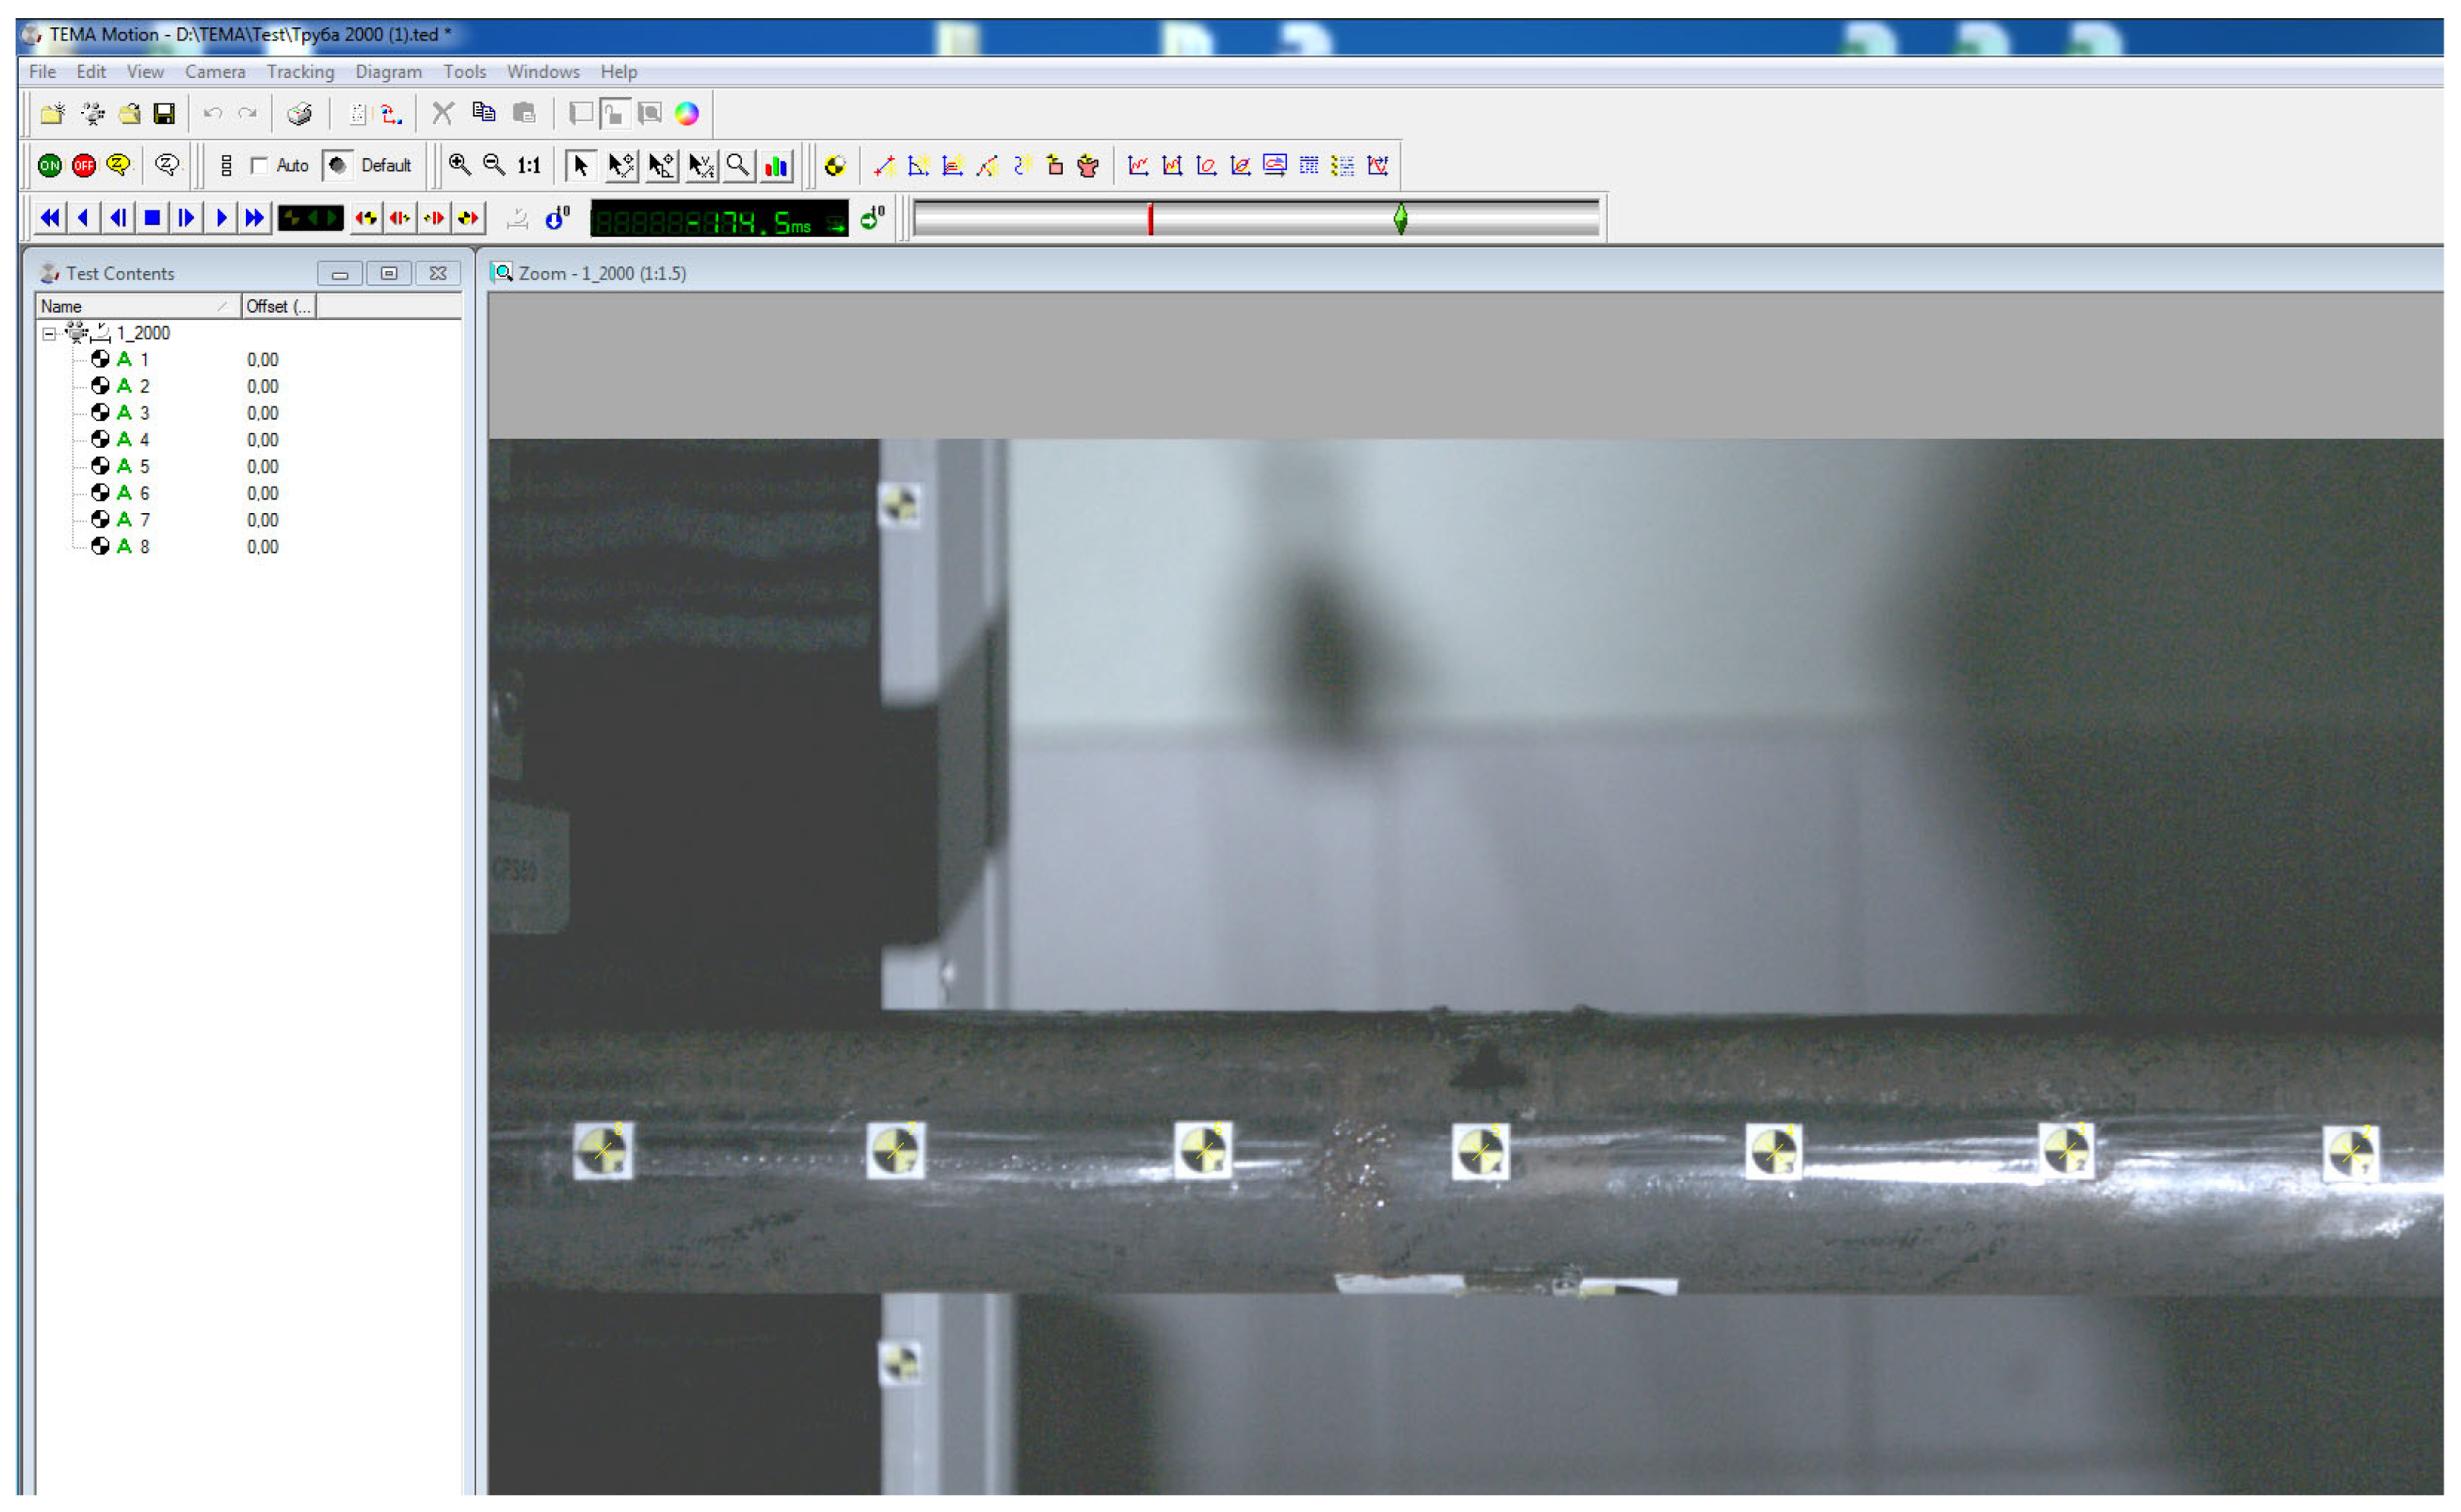
The third stage included localizing the cross markers located along the lateral generatrix of the pipe by analyzing previously taken photographs. The original images were imported into TEMA Motion software (classic version), where the operator determined the coordinates of the marker centers and specified the known distance between two of them. Based on this distance, the software calibrated the image, calculating the number of pixels per millimeter along the pipe axis.
The program interface is shown in Figure 6.
TEMA Motion software was developed by the Swedish company Image Systems AB (Linköping, Sweden) and specializes in motion analysis of high-speed industrial processes. The program allows for motion capture of cross markers and analysis of their relative coordinates.
A photograph of the pipe with the marker centers marked on it is shown in Figure 7.
The obtained marker centers are the points of the curved axis of the pipeline.
The points obtained using the two described methods were approximated by a fourth-degree polynomial in the MS Excel spreadsheet processor, with the derivation of the corresponding polynomial equation, which is the equation of the curved axis of the pipe when it is bent, and is written as follows:
y = a x 4 + b x 3 + c x 2 + d x + e ,
where a, b, c, d, e are the coefficients of the polynomial; x is the coordinate of the pipeline cross-section along its length, m.
According to Hooke’s law, when a tubular beam bends, the bending moment in the beam is related to the elastic bending radius in accordance with the formula [56]:
M ( x ) = E I ρ ( x ) ,
where E is the Young’s modulus of the pipeline material, MPa; I is the axial moment of inertia of the pipe section, m4; ρ ( x ) is the elastic bending radius of the pipeline, m.
At the same time, the formula for calculating the bending stresses in the beam is as follows:
σ b ( x ) = M ( x ) D 2 I ,
where D is the outer diameter of the pipeline, m.
Thus, based on the polynomial coefficients found using two methods, the values of bending stresses in the pipe wall are calculated using the following formula:
σ b ( x ) = E D 2 ρ ( x )
The radius of elastic bending of a pipeline is calculated based on the curvature of the function describing the spatial position of its central part using the formula:
ρ ( x ) = 1 k ( x ) ,
where k(x) is the curvature of the deflection function of the pipeline axis, calculated using the formula:
k ( x ) = k y 2 ( x ) + k x 2 ( x ) ,
where ky(x), kz(x) are the values of the curvature of the pipeline axis in the vertical and horizontal directions, respectively, calculated using the formulas:
k y ( x ) = v ( x ) [ 1 + ( y ( x ) ) 2 ] 3
k z ( x ) = z ( x ) [ 1 + ( z ( x ) ) 2 ] 3
where y(x) is the vertical coordinate of the pipeline cross-section, m; z(x) is the pipeline cross-section applicate, m.
After this, the relative deviations of the calculated stress values are determined based on the data obtained by photographing the cross markers and laser scanning the pipe.

2.3. Determination of the Influence of Unevenness of the Pipeline Insulation Coating and the Value of the Angle of the Scanned Sector on the Results of Determining Stresses in the Pipeline Wall

The aim of this study is to assess the influence of the unevenness of the insulation coating, as well as the angle of the scanned sector of the pipeline, on the accuracy of determining the stresses calculated on the basis of the coefficients of the polynomial describing the spatial position of the central axis of the pipeline according to its laser scanning data.
The achievement of the stated research objective is carried out in several stages:
  • Conducting laser scanning of the pipe under examination without an insulating coating layer;
  • Insulation of the pipe under study with a coating layer with the irregularities and defects created by it;
  • Carrying out laser scanning of an insulated pipe;
  • Processing the point cloud of the pipeline under study without an insulating coating layer and after insulation, with further transition from the point cloud of the pipe to the coordinates of its central axis;
  • Reducing the angle of the scanned pipe sector from 180° in 30° increments and determining the coordinates of the central axis of the pipe based on the obtained point clouds;
  • Calculation of absolute deviations of the coordinates of the points of the central axis of an insulated pipe at each angle of the scanned sector relative to an uninsulated pipe;
  • Summation of the coordinates of the points of the central axis of an elastically bent uninsulated pipe, obtained from the results of photographing cross markers, with their calculated absolute deviations as a result of insulating the pipe at each of the angles of the scanned sector, followed by approximation of the obtained points by a fourth-degree polynomial;
  • Calculation of the values of bending stresses in the pipeline wall based on the coefficients of each of the obtained polynomials;
  • Evaluation of the magnitude of the relative deviation of the calculated stresses based on the coefficients of each of the obtained polynomials for the insulated pipe from the stress values for the uninsulated pipe.
The following equipment was used in the study:
A pipe 2.4 m long, with an outer diameter of 51 mm and a wall thickness of 3 mm;
Leica MS 60 (Leica Geosystems, Balgach, Switzerland) electronic total station with laser scanning function;
Spherical reflectors for referencing the position of the laser scanner to the existing coordinate system during its movement.
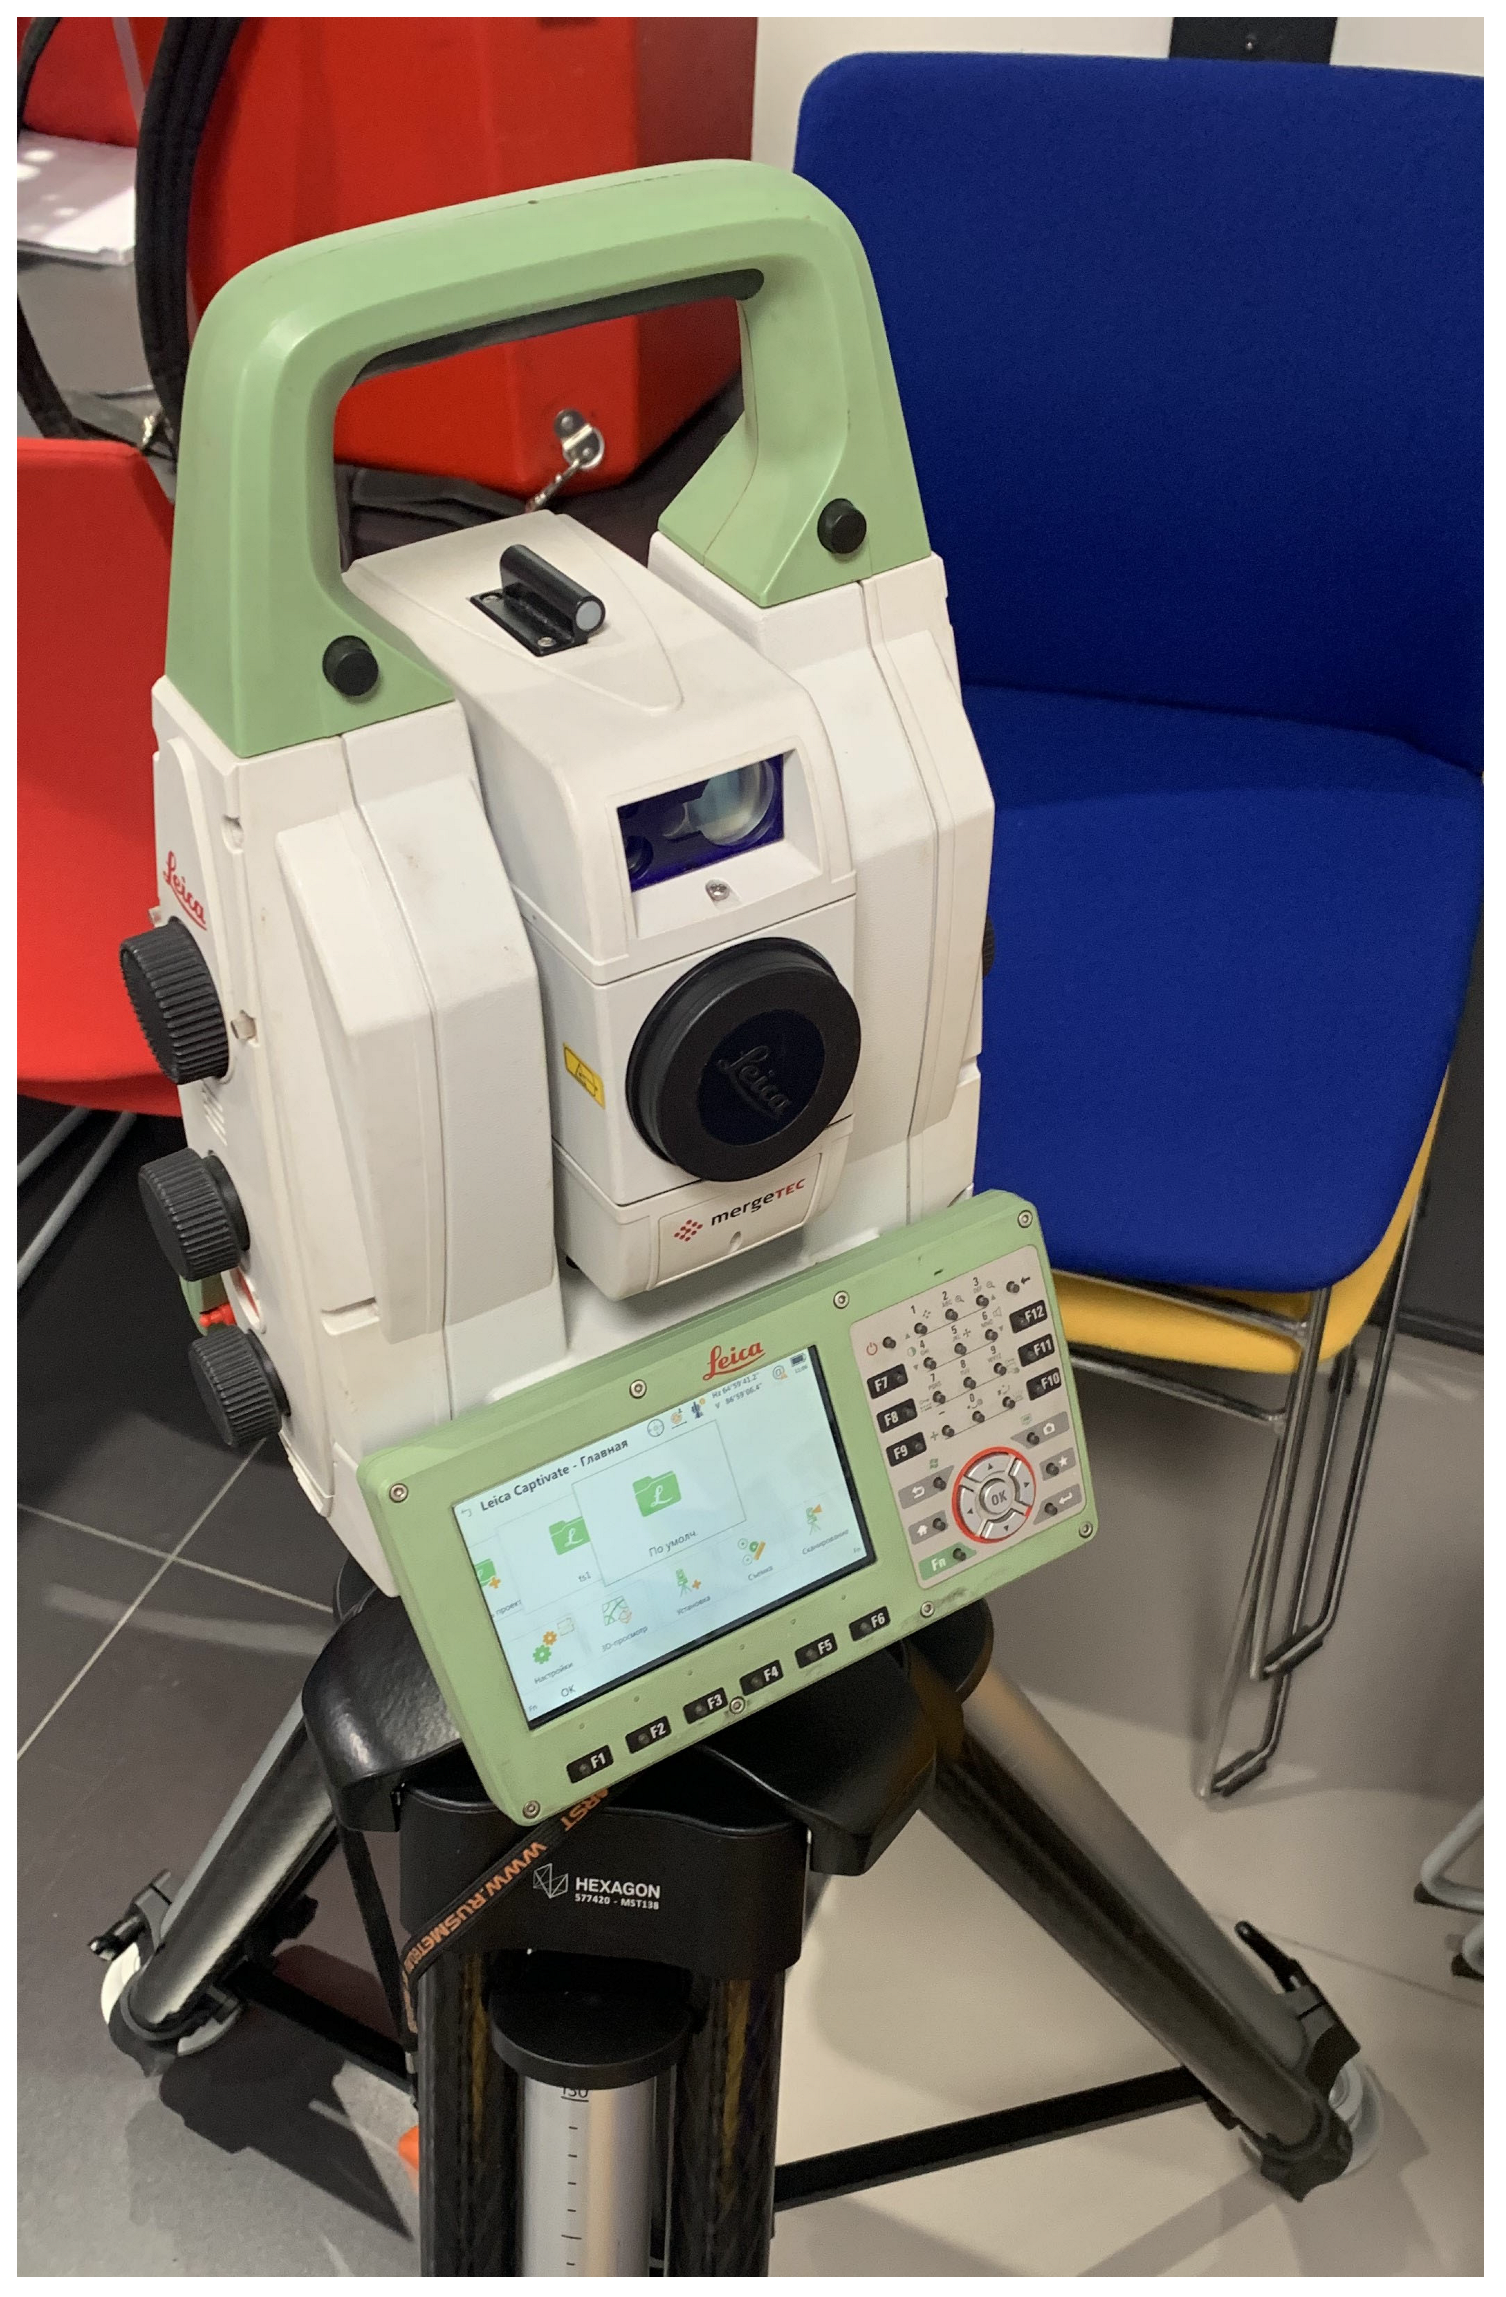
The Leica MS60 laser scanner, manufactured by “Leica Geosystems” (Balgach, Switzerland), is a high-precision total station with laser scanning capabilities. Maximum scanning accuracy is 1 mm for every 50 m of distance to the object. The minimum distance between points is 0.5 mm. The maximum scanning speed is 30,000 points per second.
The laser scanner used is shown in Figure 8.
Laser scanning of the pipeline under study was carried out in the following order:
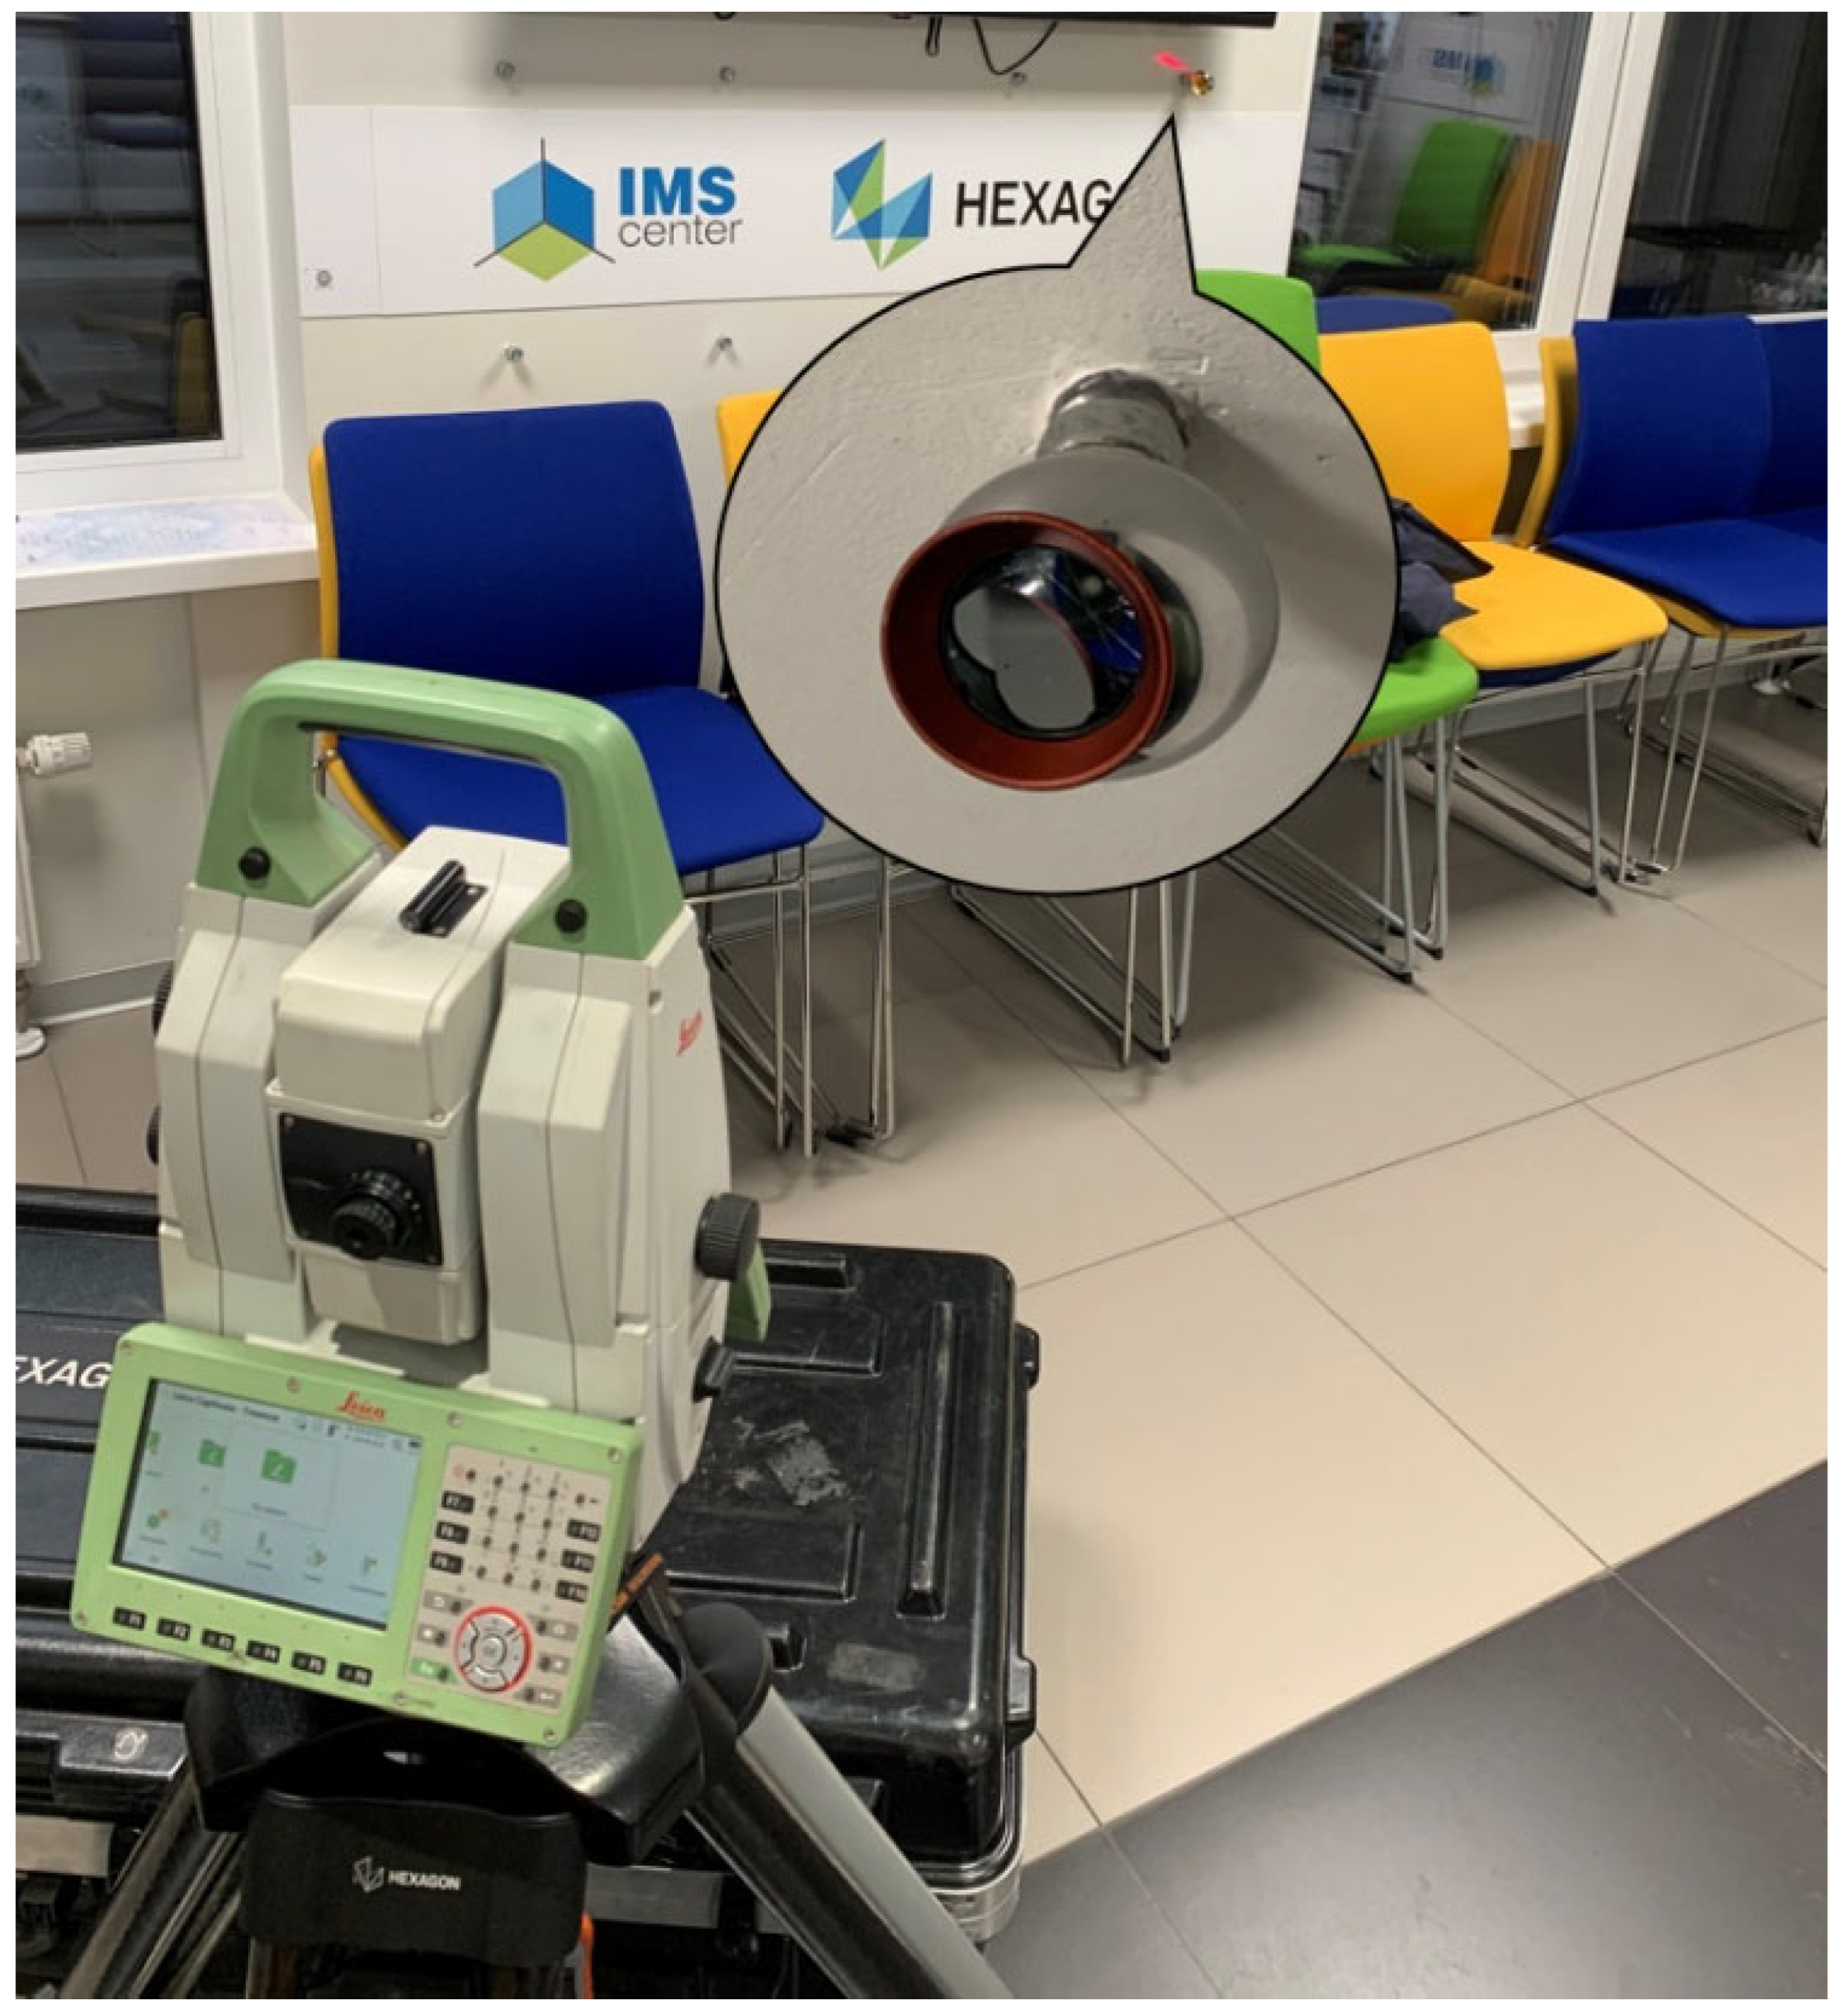
  • Before conducting laser scanning, it is necessary to create a coordinate system by tying the laser scanner to the position of four spherical reflectors installed in its field of view.
The creation of a coordinate system by positioning a laser scanner on spherical reflectors is shown in Figure 9.
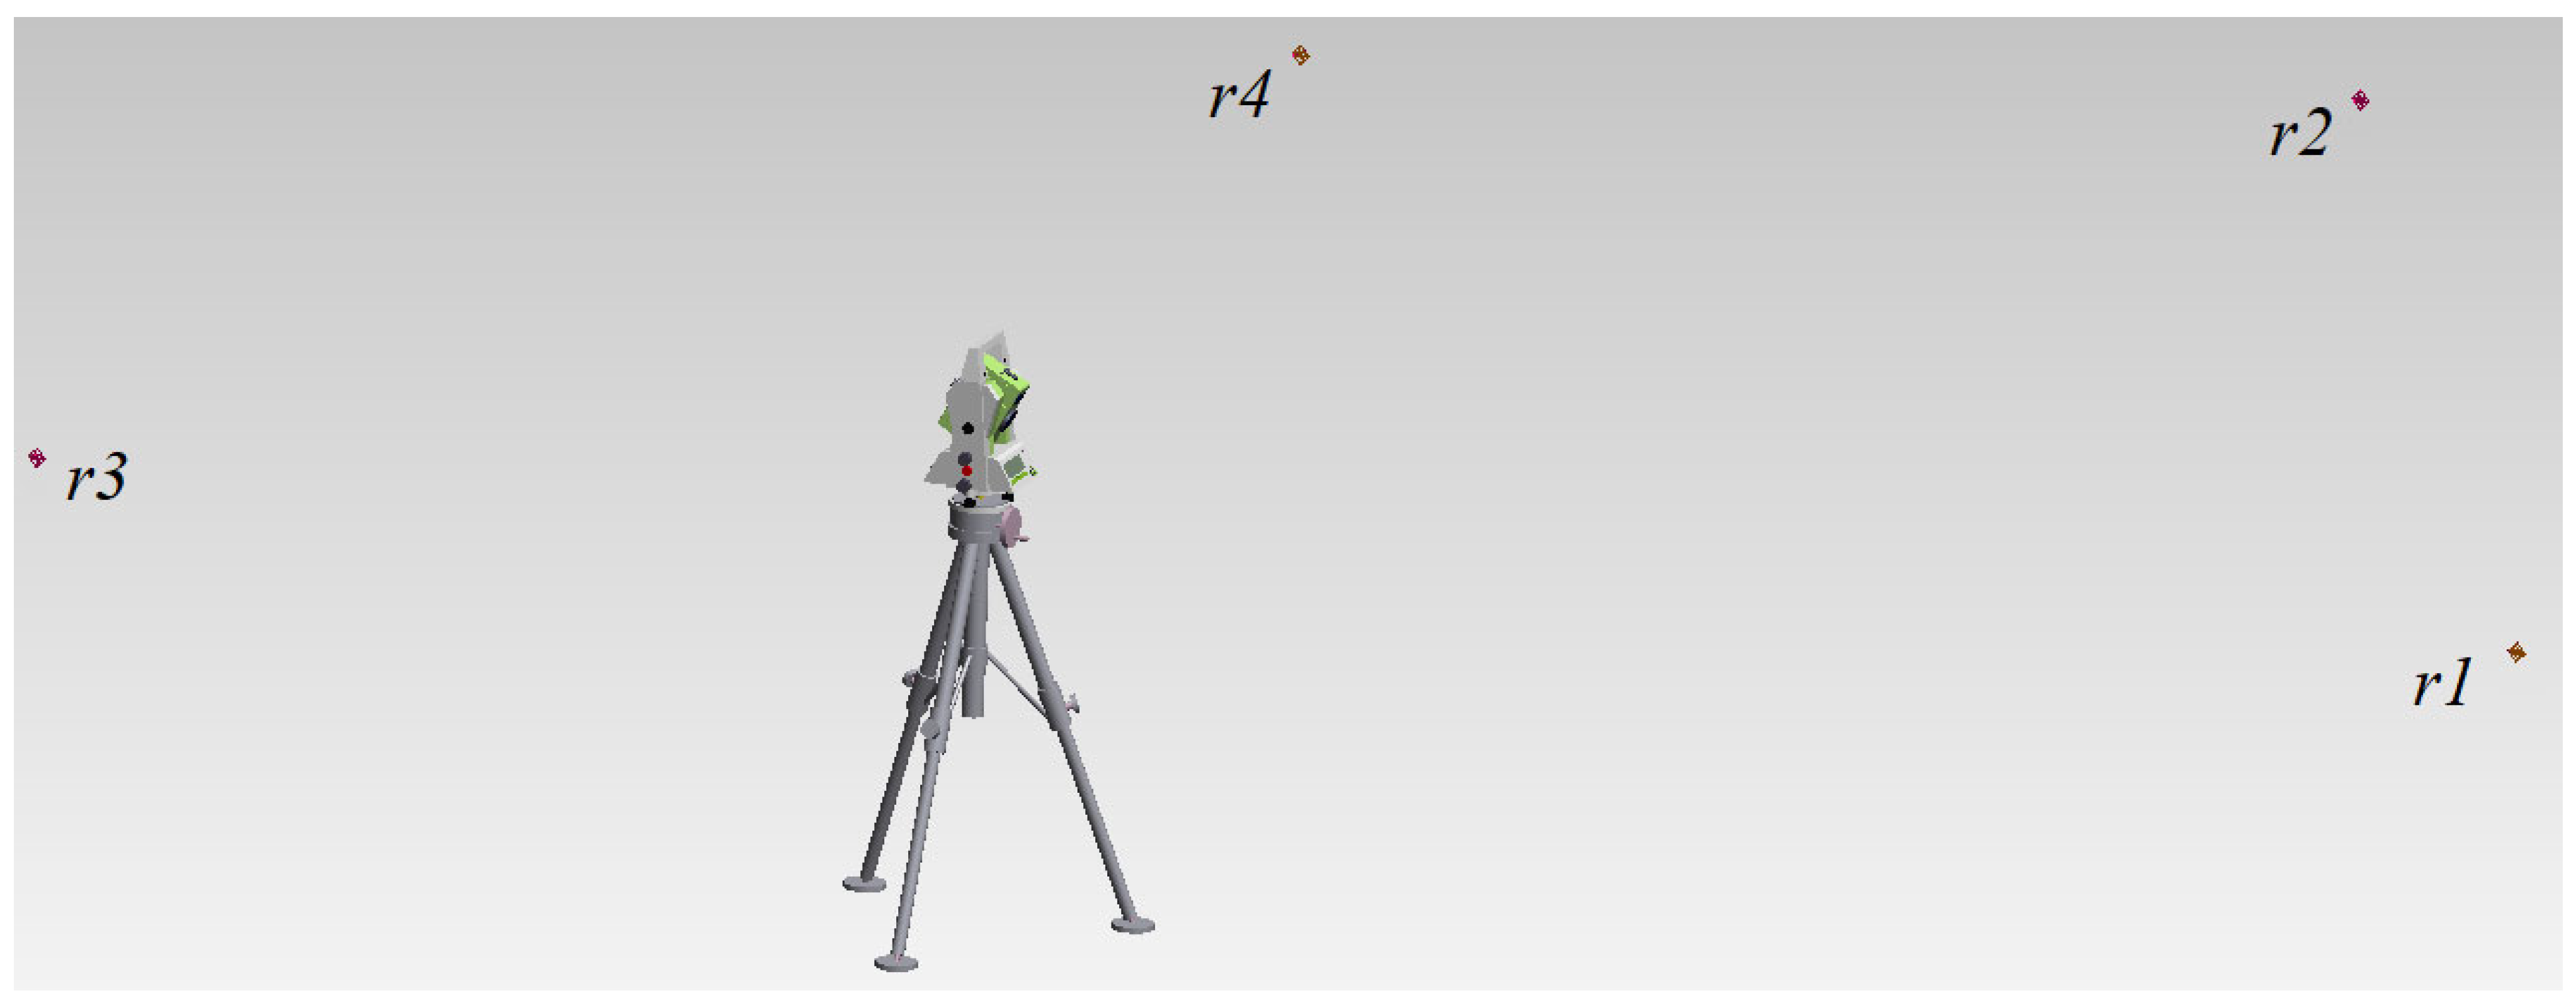
The result of creating a coordinate system within which scanning is carried out and the position of the laser scanner relative to the spherical reflectors is displayed in the Spatial software (version 2025.1) used. Analyzer and is shown in Figure 10.
2.
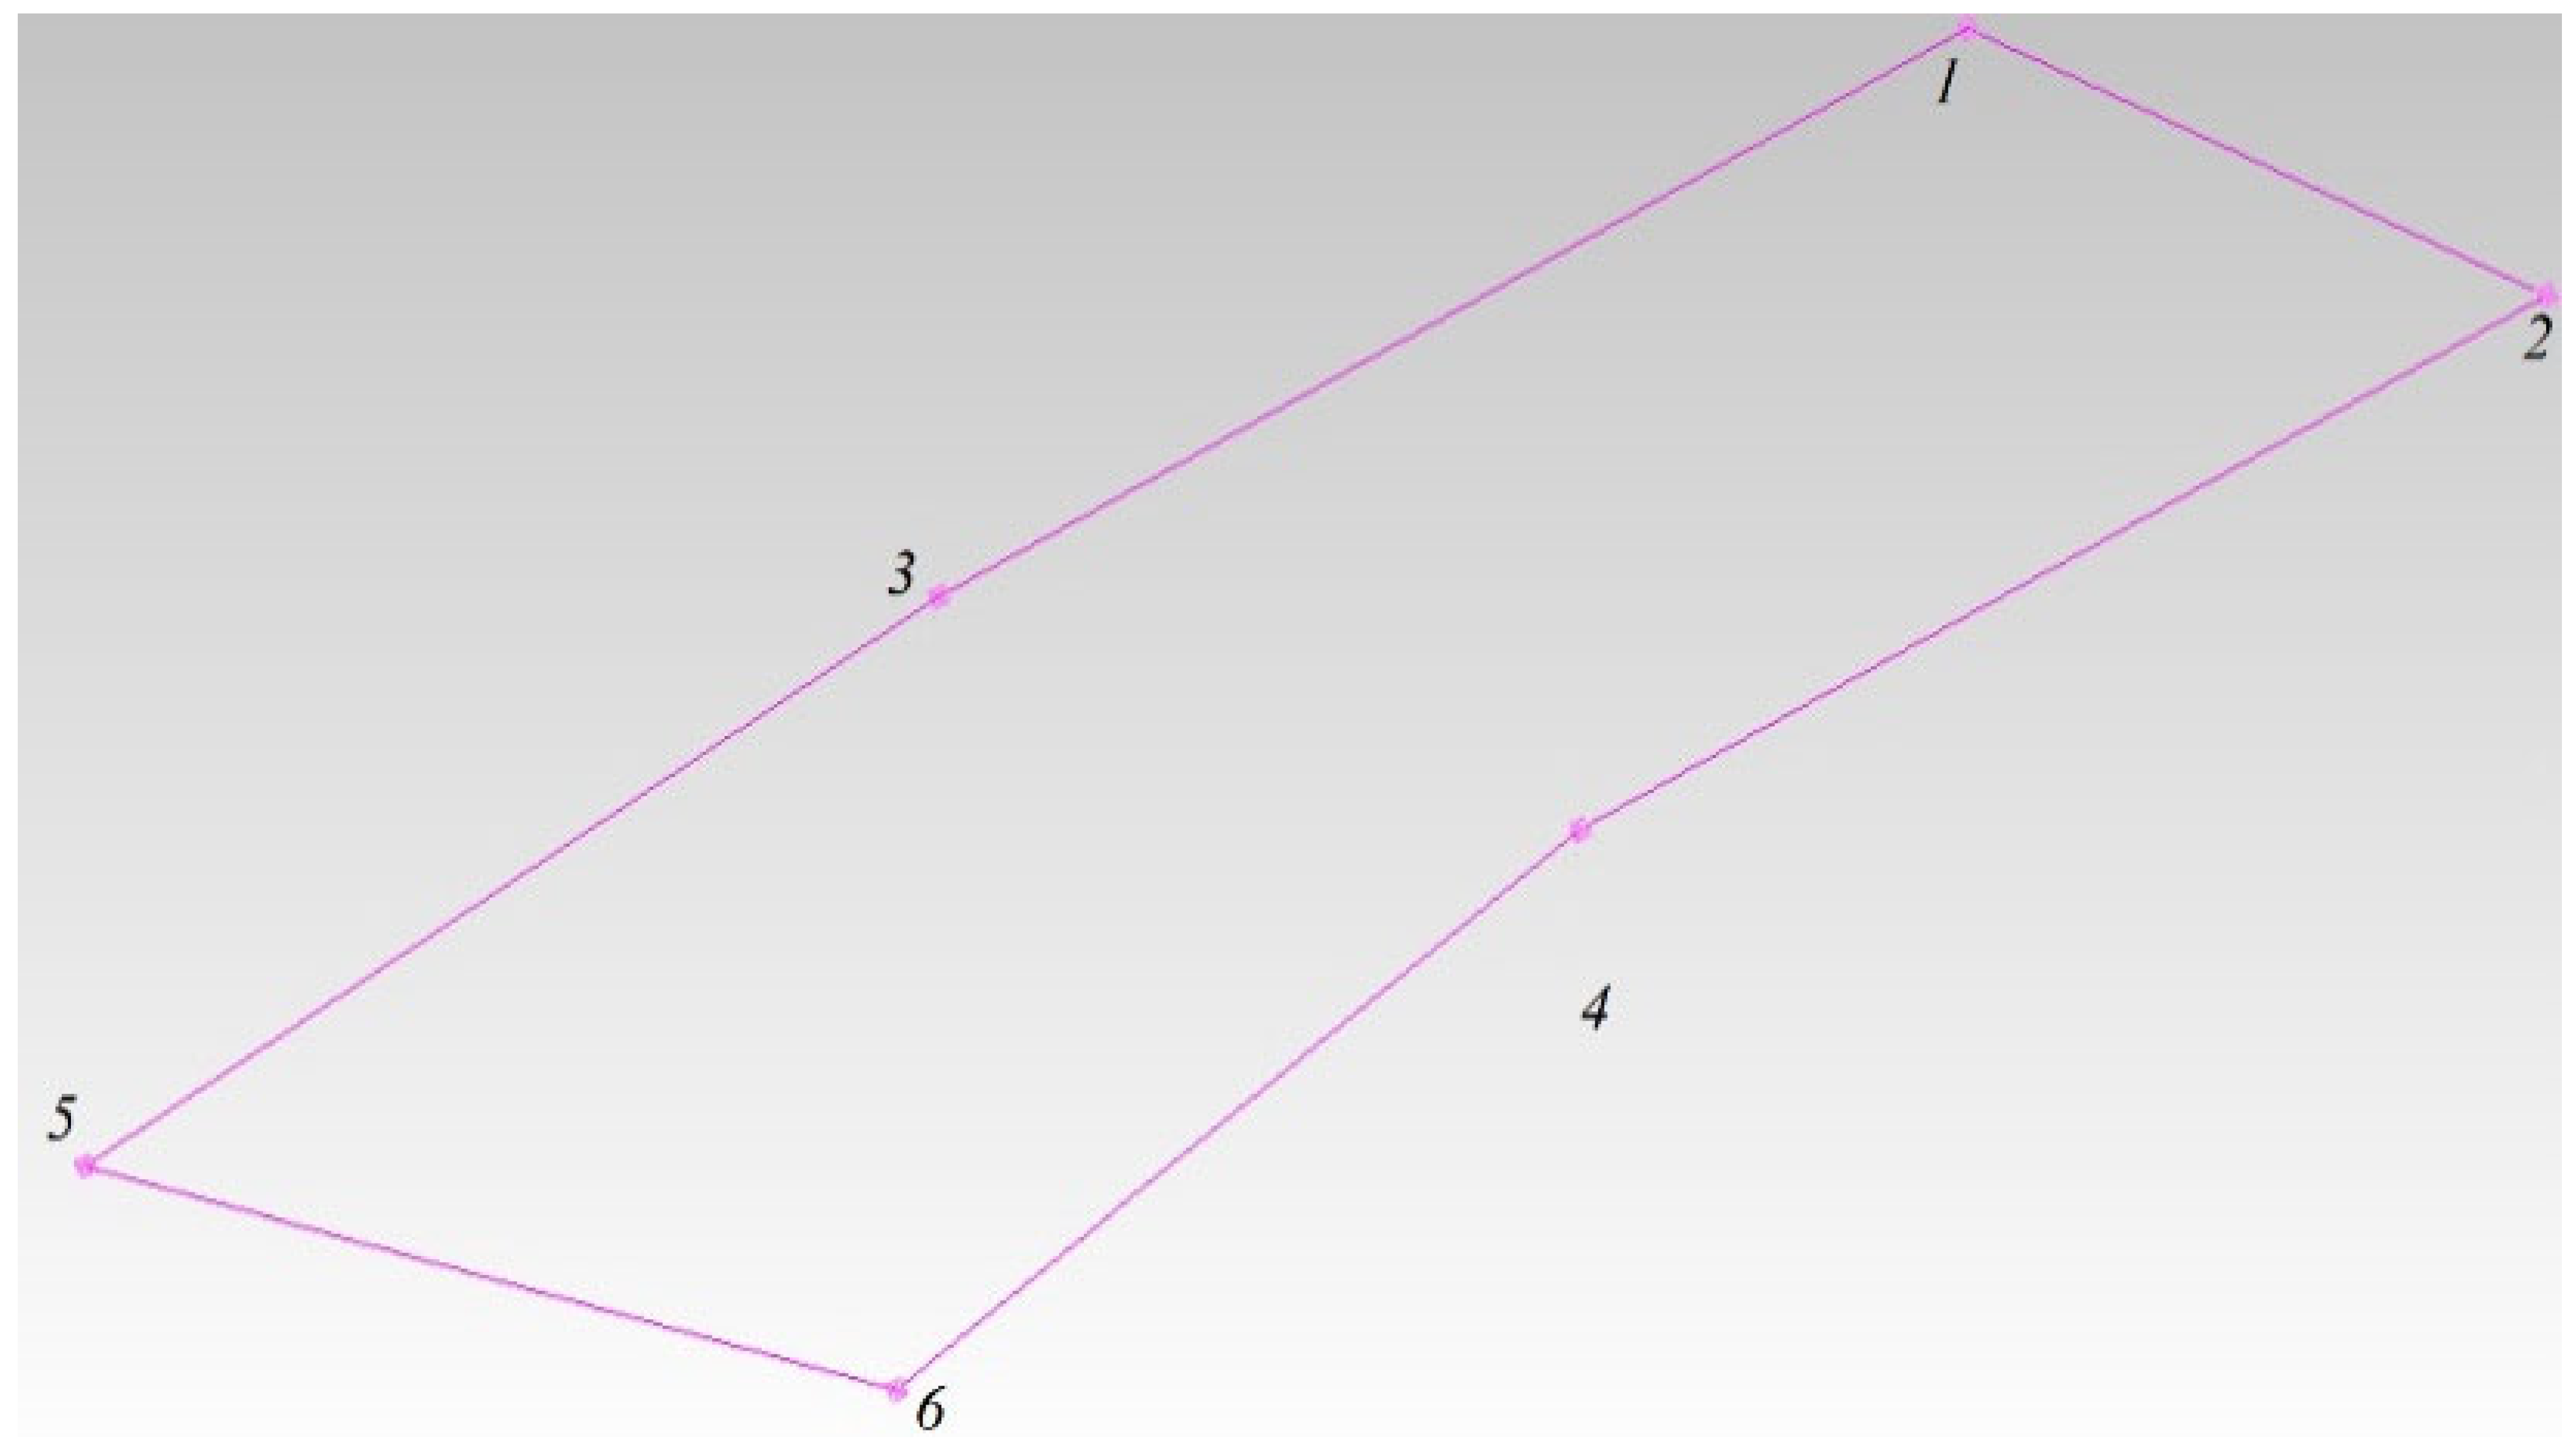
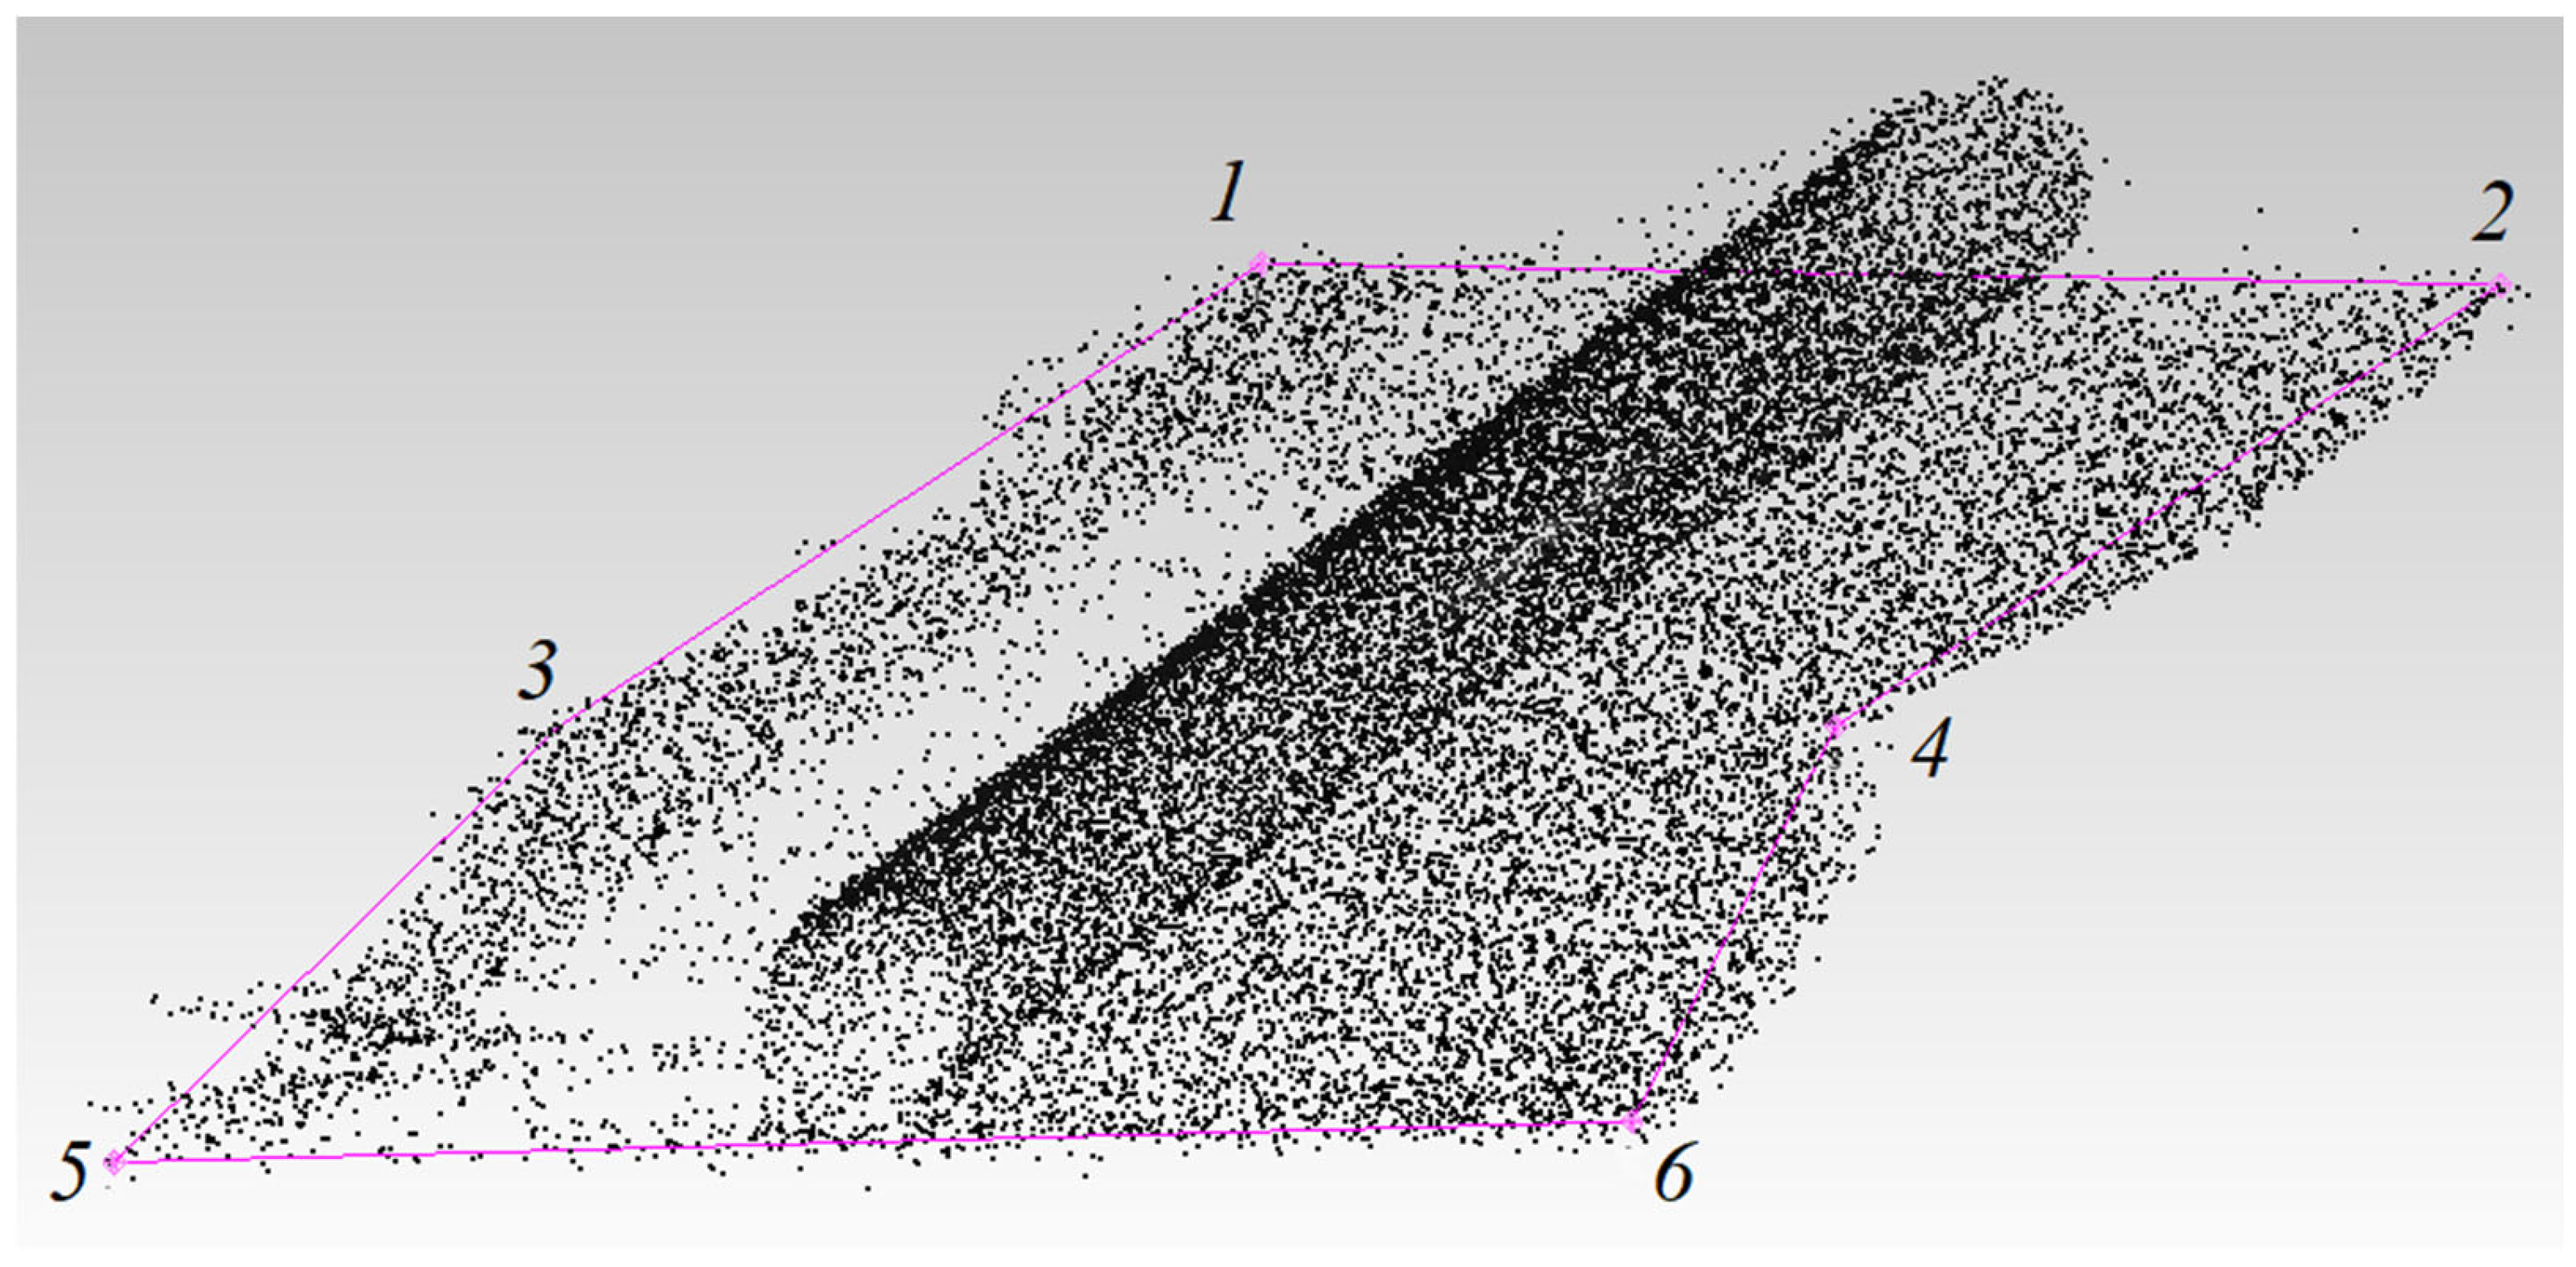
The scanner’s laser beam marks points along the perimeter of the pipeline contour. To do this, the scanner beam is directed sequentially at the perimeter points, after which each coordinate is recorded in the specialized Spatial Analyzer software. Six points were selected to plot the perimeter. The resulting perimeter plot is shown in Figure 11.
3.
The process of laser scanning of the pipe being examined is started within the obtained perimeter with a point density of at least 9 points/cm2.
4.
The laser scanner is moved to a position from which the second side of the pipe is scanned. After moving the laser scanner, it is referenced to the previously created coordinate system by aiming it at the same four spherical reflectors r1, r2, r3, and r4 used previously.
After laser scanning the pipe from both sides, its point cloud was obtained, shown in Figure 12.
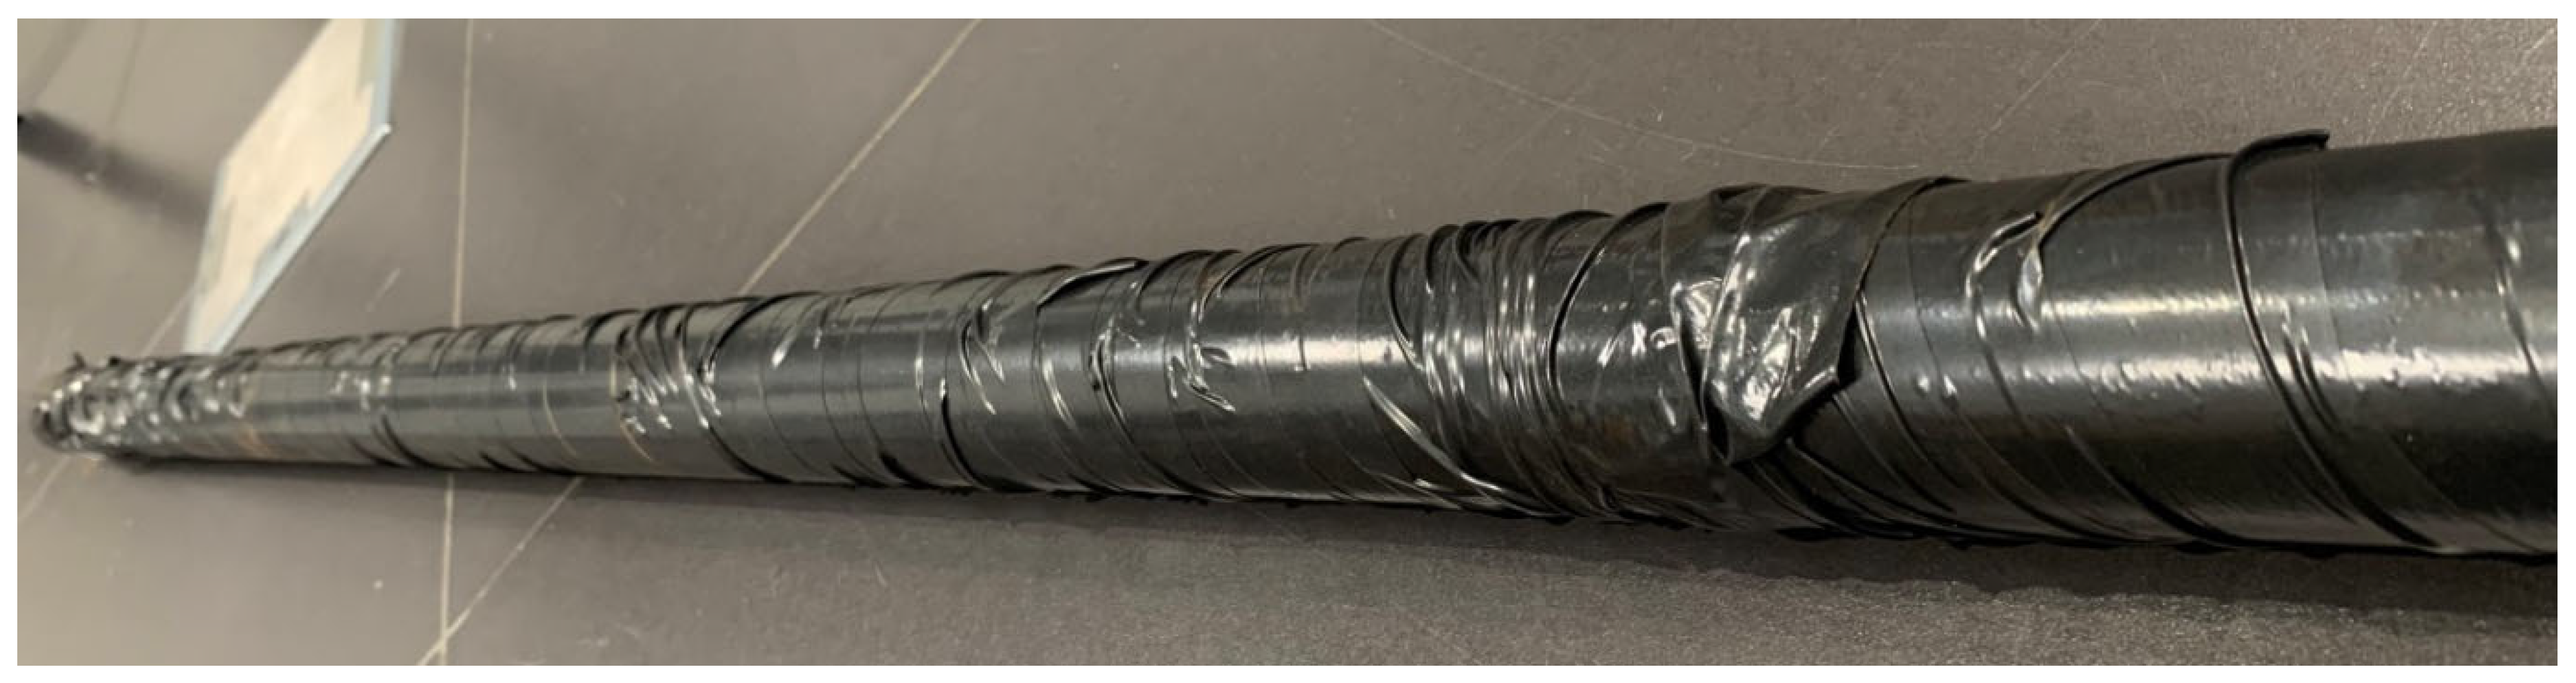
Next, the pipe under test is insulated. Black electrical tape was chosen as the insulating coating, allowing for the desired unevenness and delamination of the main pipeline’s insulation coating to be simulated.
The insulated pipe is shown in Figure 13.
The magnitude of the created irregularities in the pipe’s insulation coating ranges from 0.02 to 0.14 times its outside diameter (roughness values range from 1 to 7 mm). Taking into account the obtained roughness value relative to the outside diameter of the pipe, for a main pipeline with an outside diameter of 1420 mm, the roughness value would range from 28.4 mm to 142 mm, which is significantly greater than the insulation roughness that occurs during the operation of main pipelines, since the magnitude of absolute deviations of the unevenness of the insulating coating of the main pipelines ranges from 5 to 15 mm. Based on this, it can be concluded that the influence of insulation coating roughness on the determination of bending stresses in the pipeline wall will be somewhat overestimated, and the conclusions reached regarding the degree of influence of insulation roughness on scanning results are fully applicable to main pipelines.
Obtaining the coordinates of the points of the central axis of the pipeline under study based on the point cloud of its laser scanning was carried out as follows:
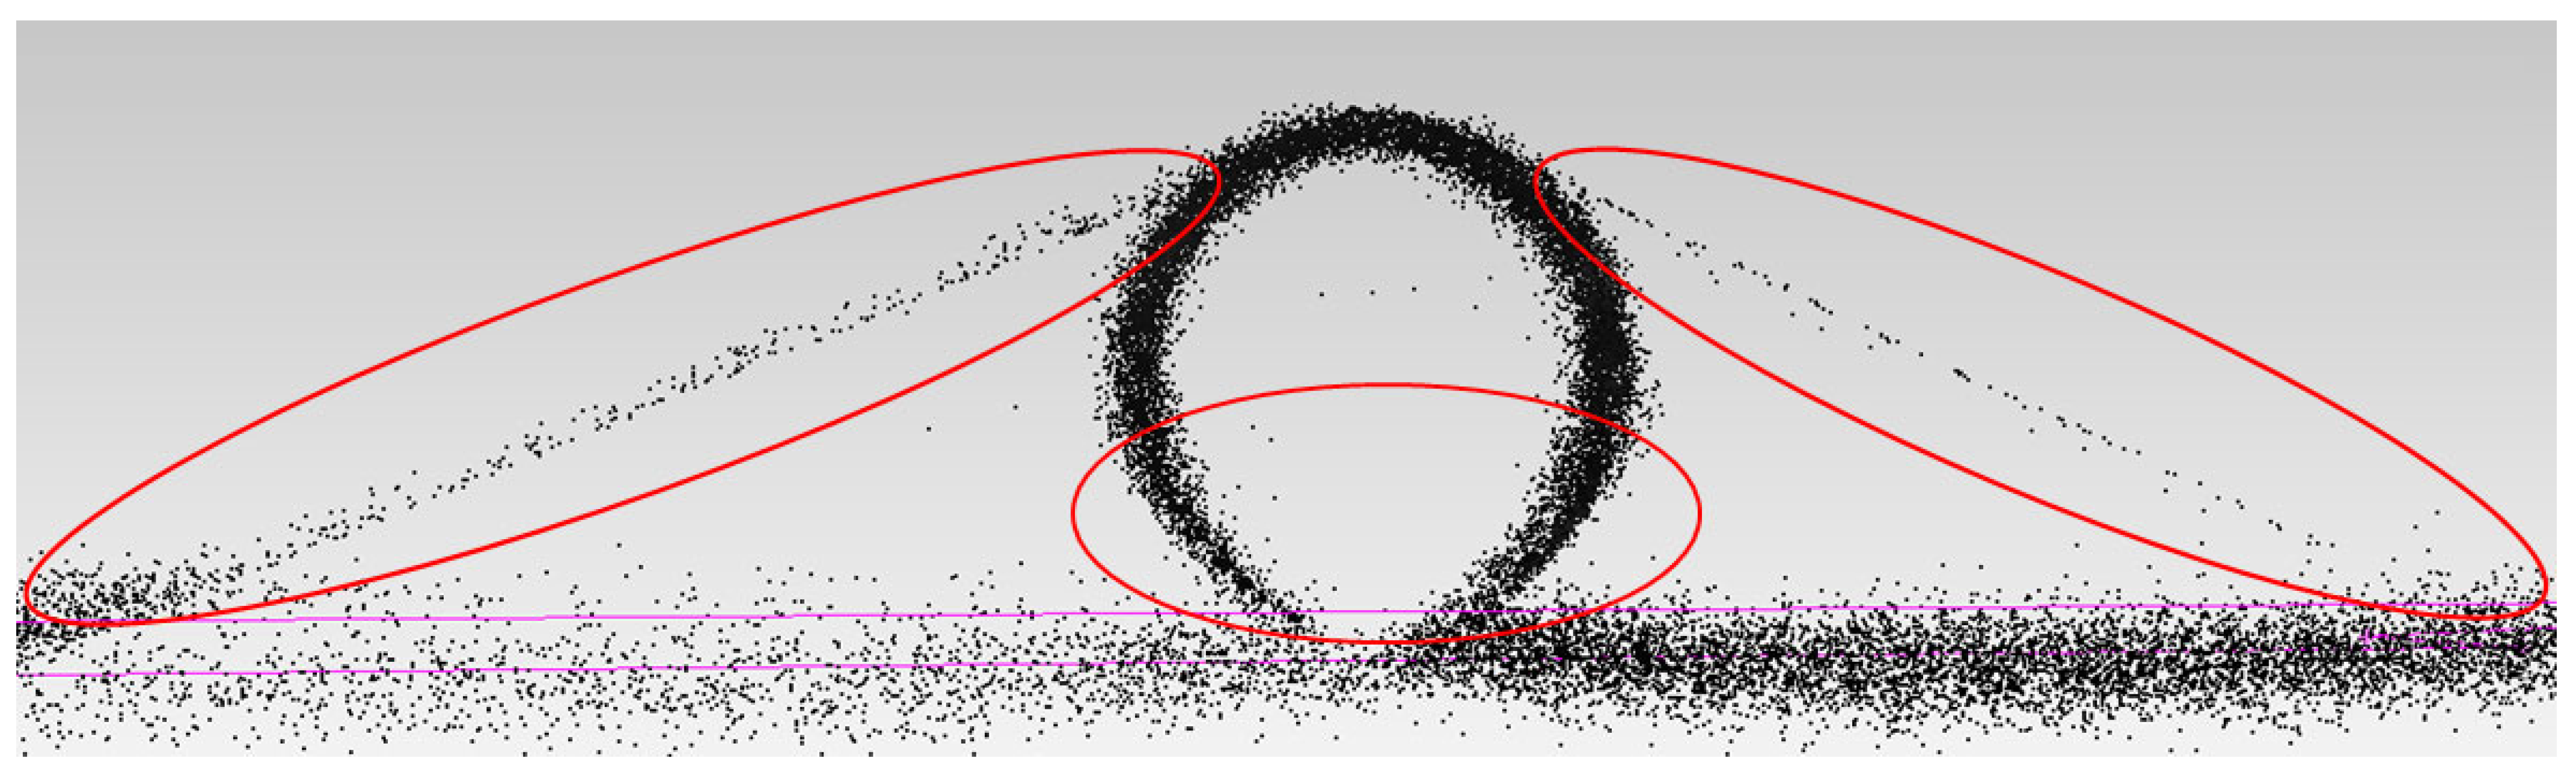
1. First, we removed points from the cloud caused by the edge effect, which occurs at the boundary between the visible and invisible zones of the laser scanner [57]. These points do not belong to the surface of the pipeline being examined and are shown in Figure 14.
Points included in the edge effect zones are removed by selecting them using the tools of the Spatial software package Analyzer. It is worth noting that while the boundaries of the edge effect zones located at the edges of the scanned pipeline are quite clearly visible, the location of the beginning of the zone located at the bottom of the pipeline is less clear.
During laser scanning of above-ground main pipelines, the maximum angle of the scanned sector of the pipeline is 180°, since aerial laser scanning is carried out from a position above the pipeline and as the scanner approaches the upper generatrix of the pipeline, the angle of the scanned sector decreases.
2. Next, the point cloud of the pipe under study was processed using the Spatial software package. Analyzer in the manner described earlier for non-insulated elastically bent pipe.
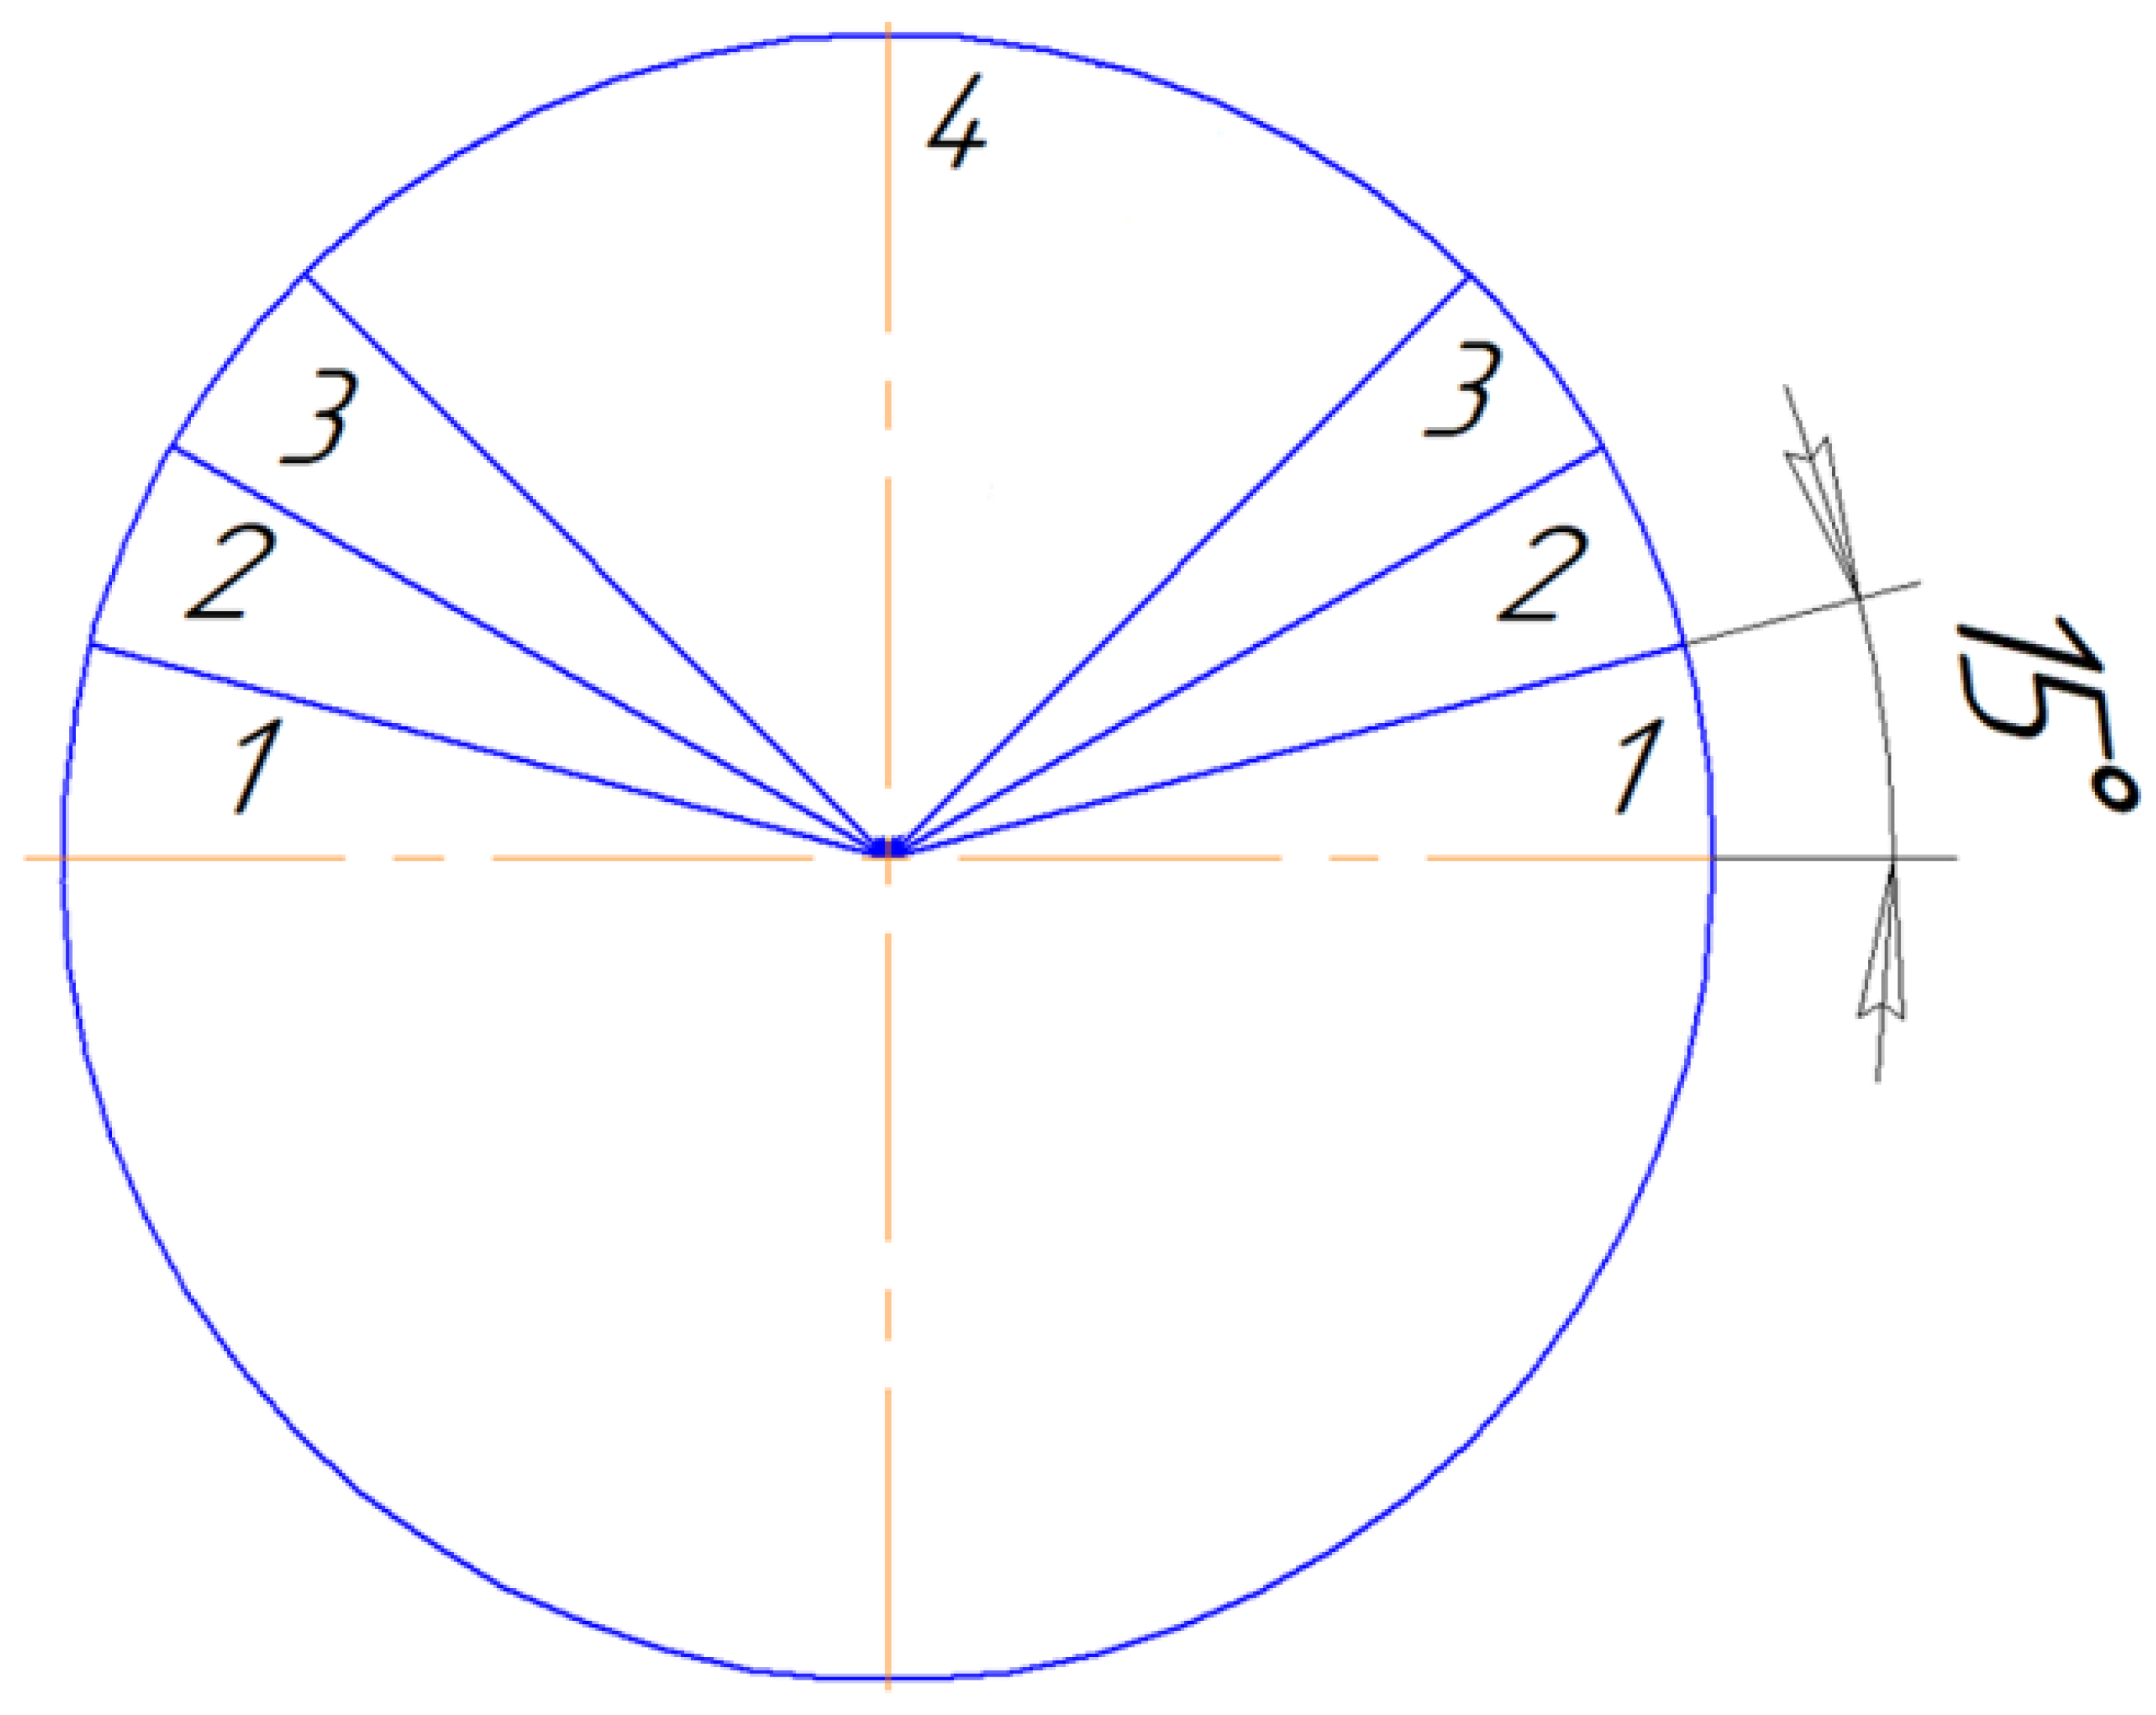
Next, we determine the minimum laser scanning sector size for the pipeline. We select four angles from 180° to 90° for the laser scanning sector, with the angle decreasing in 30° increments.
The location of the laser scanning sectors under study is shown in Figure 15.
Thus, the resulting point cloud of the isolated pipe is successively reduced in accordance with the selected values of the angles of the scanned sector.

3. Results

3.1. Results of the Analysis of Stress Values in the Pipeline Wall Based on the Developed Method of Processing Laser Scanning Data

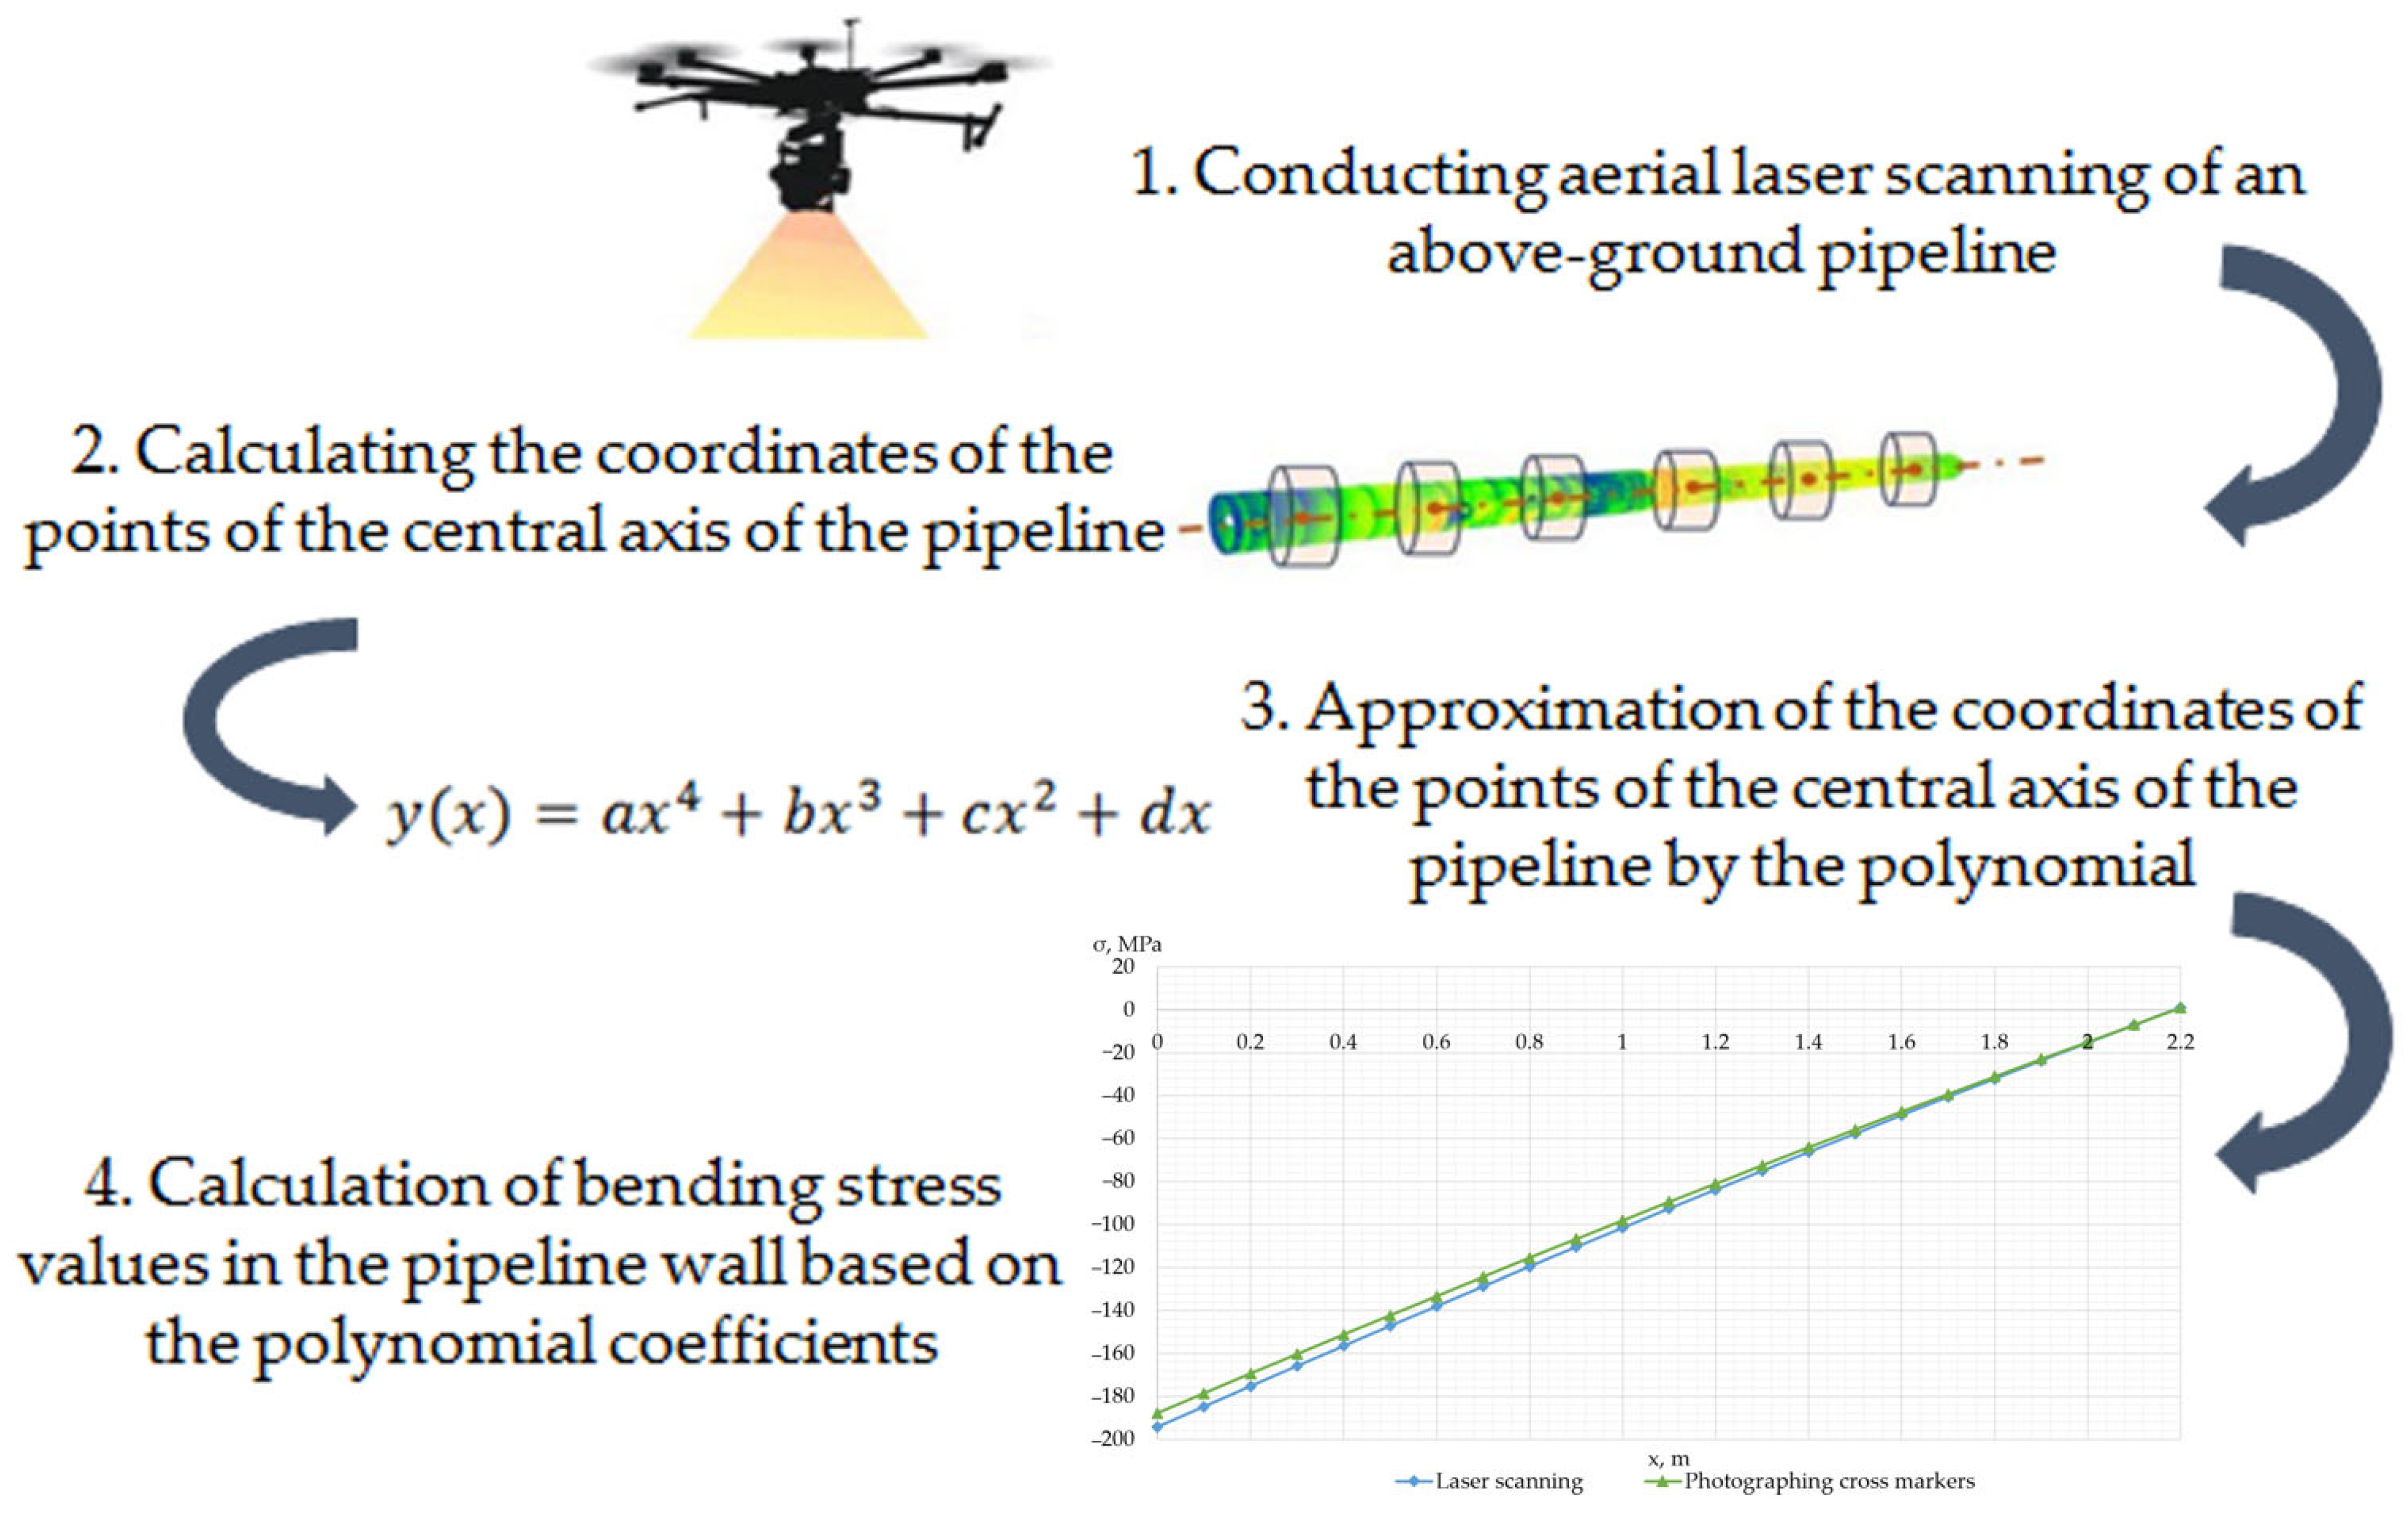
A graphical representation of the sequence of stages in assessing the magnitude of bending stresses in the wall of an above-ground main pipeline based on data from its aerial laser scanning using the developed method is shown in Figure 16.
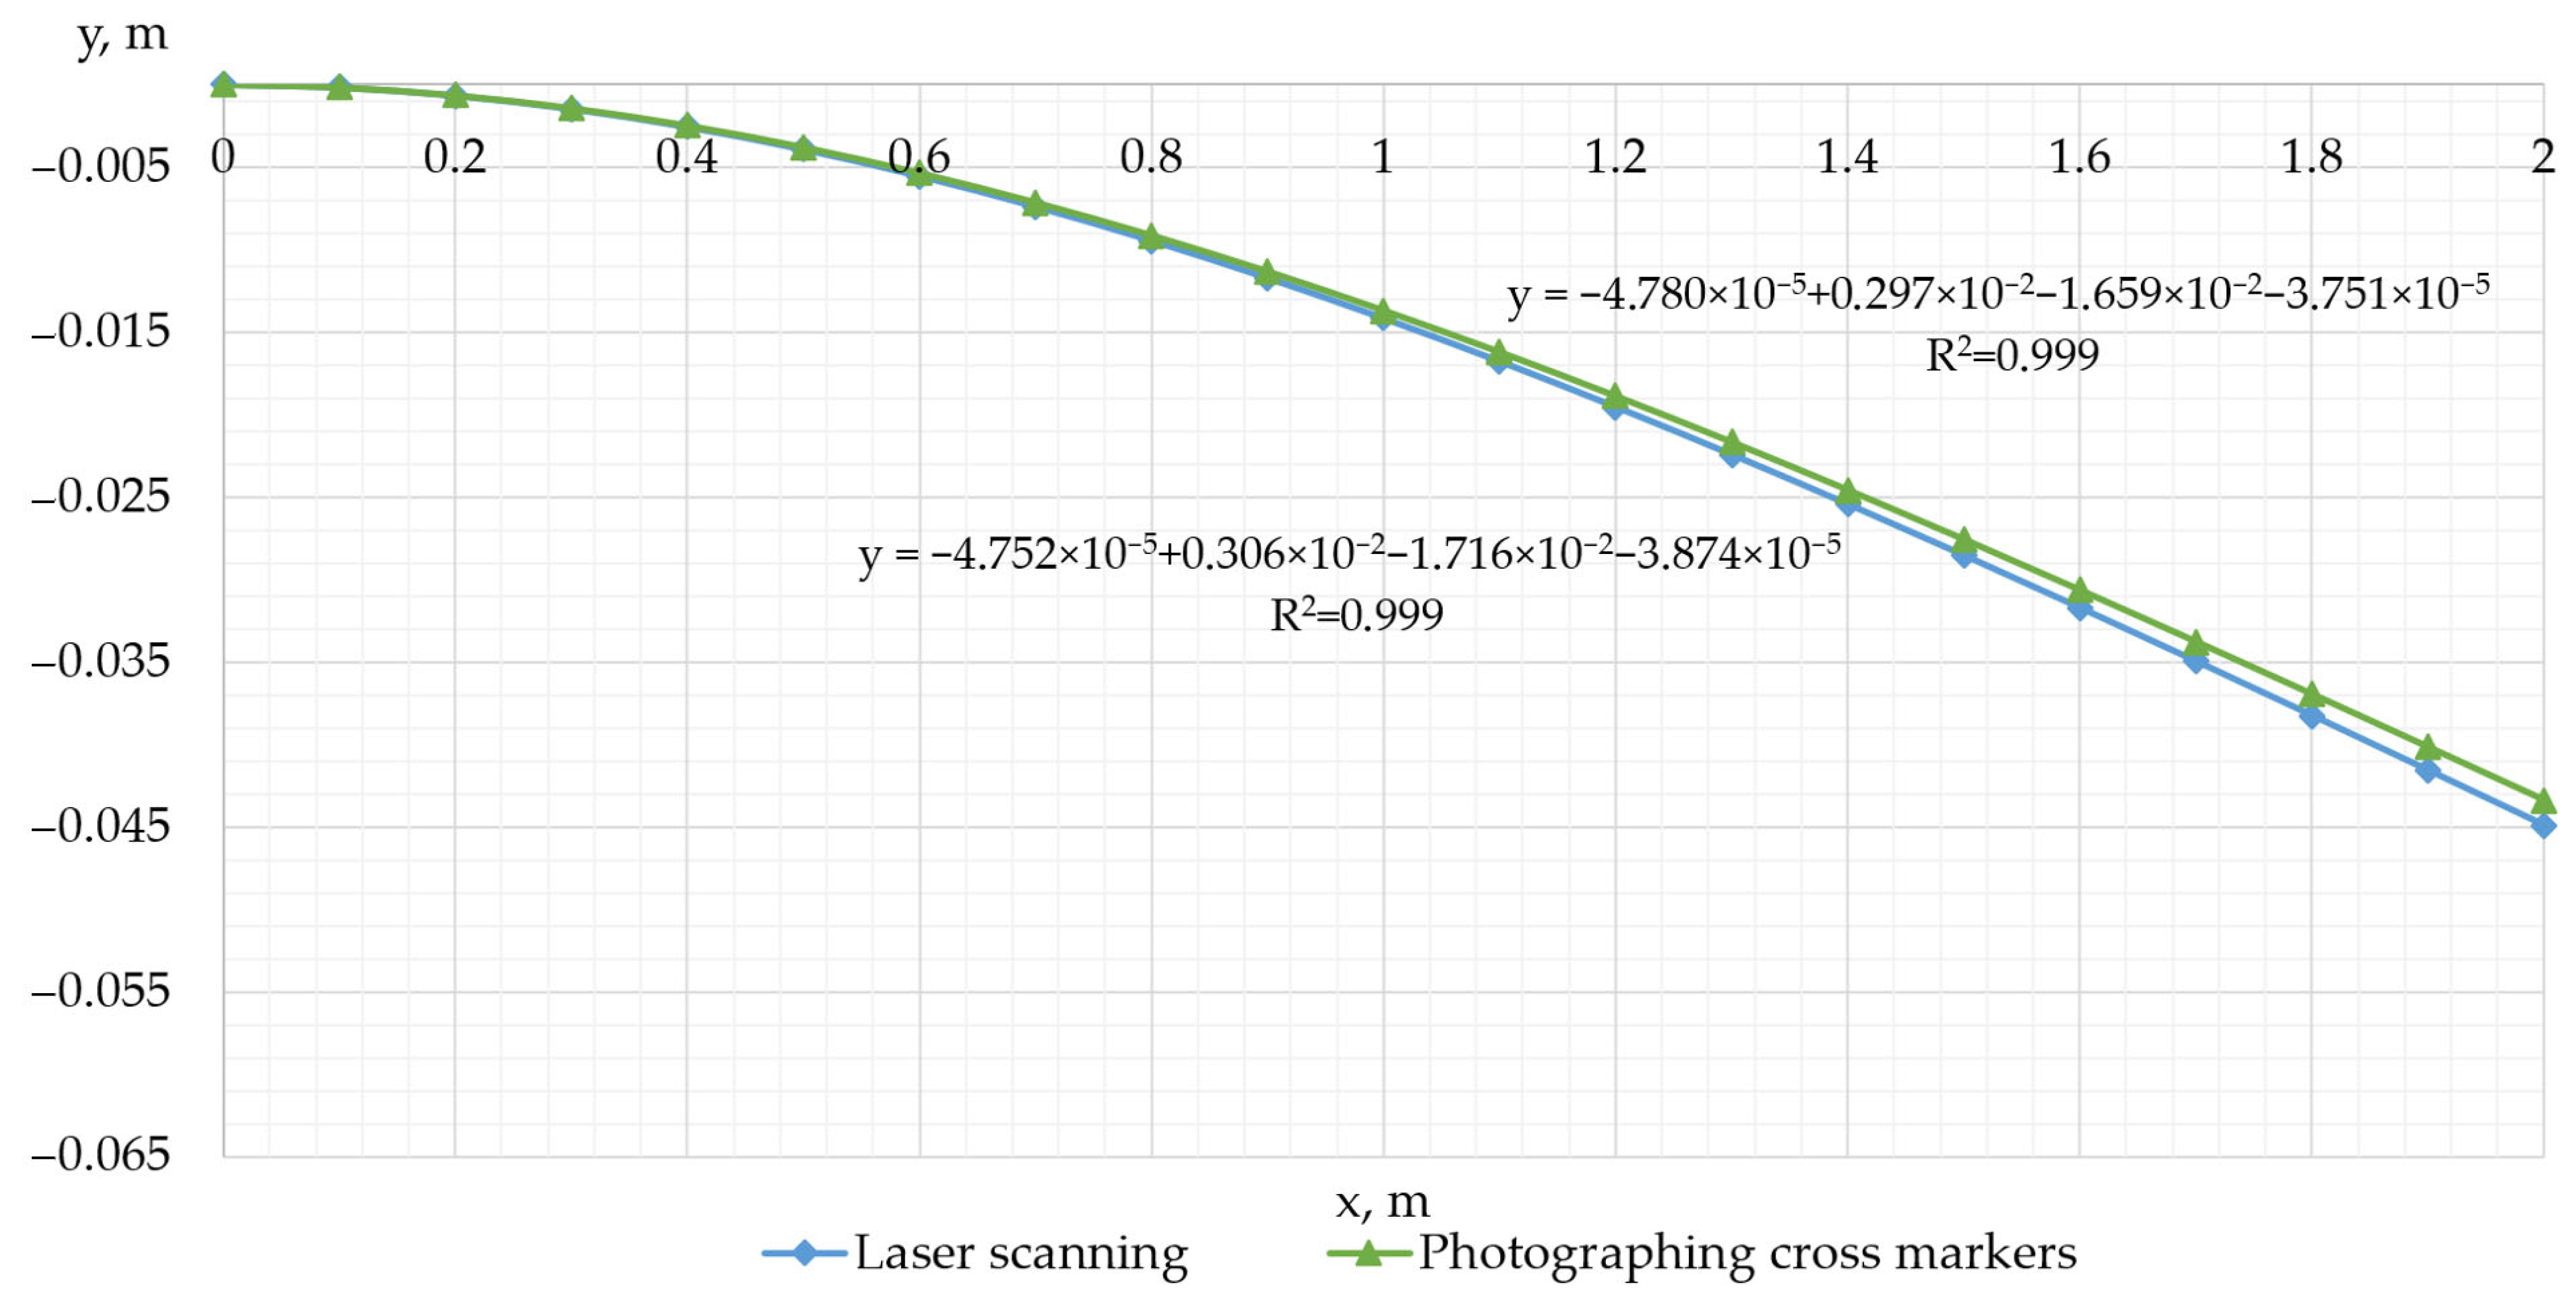
As a result of determining the coefficients of the polynomial describing the spatial position of the central axis of an elastically bent pipe based on a cloud of points from its laser scanning and photographs of cross markers, the coefficients presented in Table 2 were obtained.
Examples of graphs of deflection of a 2 m long pipe, obtained by laser scanning and photographing markers, are shown in Figure 17.
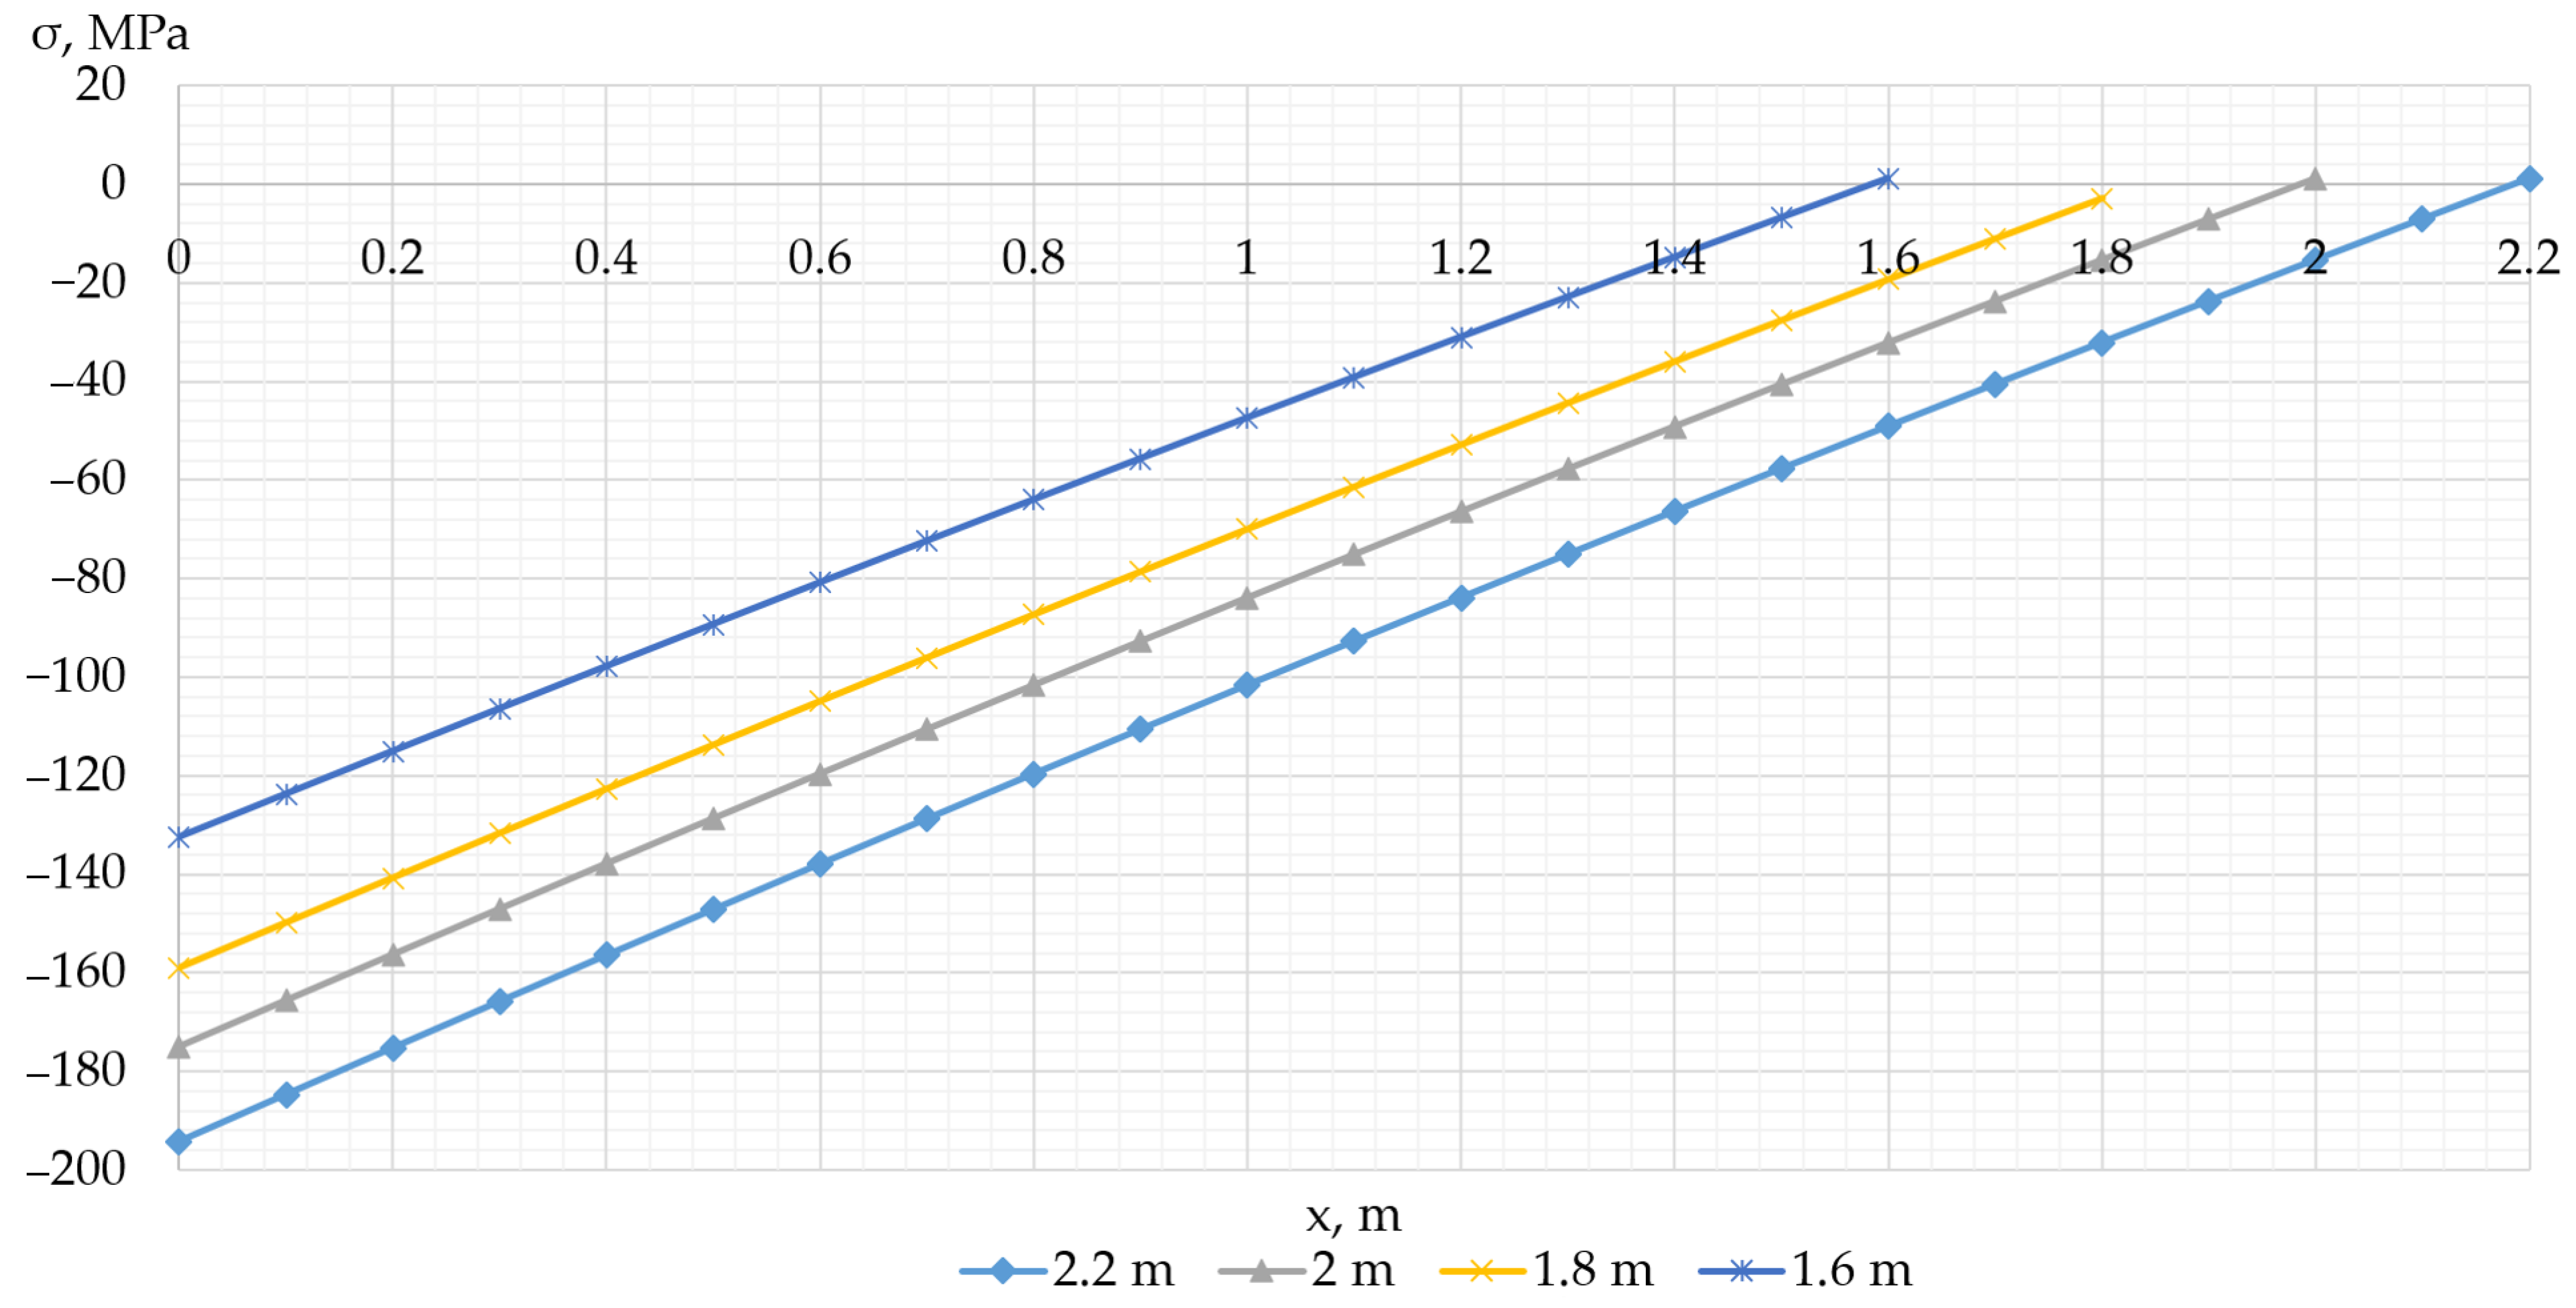
The graphs of the distribution of bending stress values based on the obtained equations describing the spatial position of the central axis of the pipe, based on Formulas (2), (6) and (8), are presented in Figure 18.
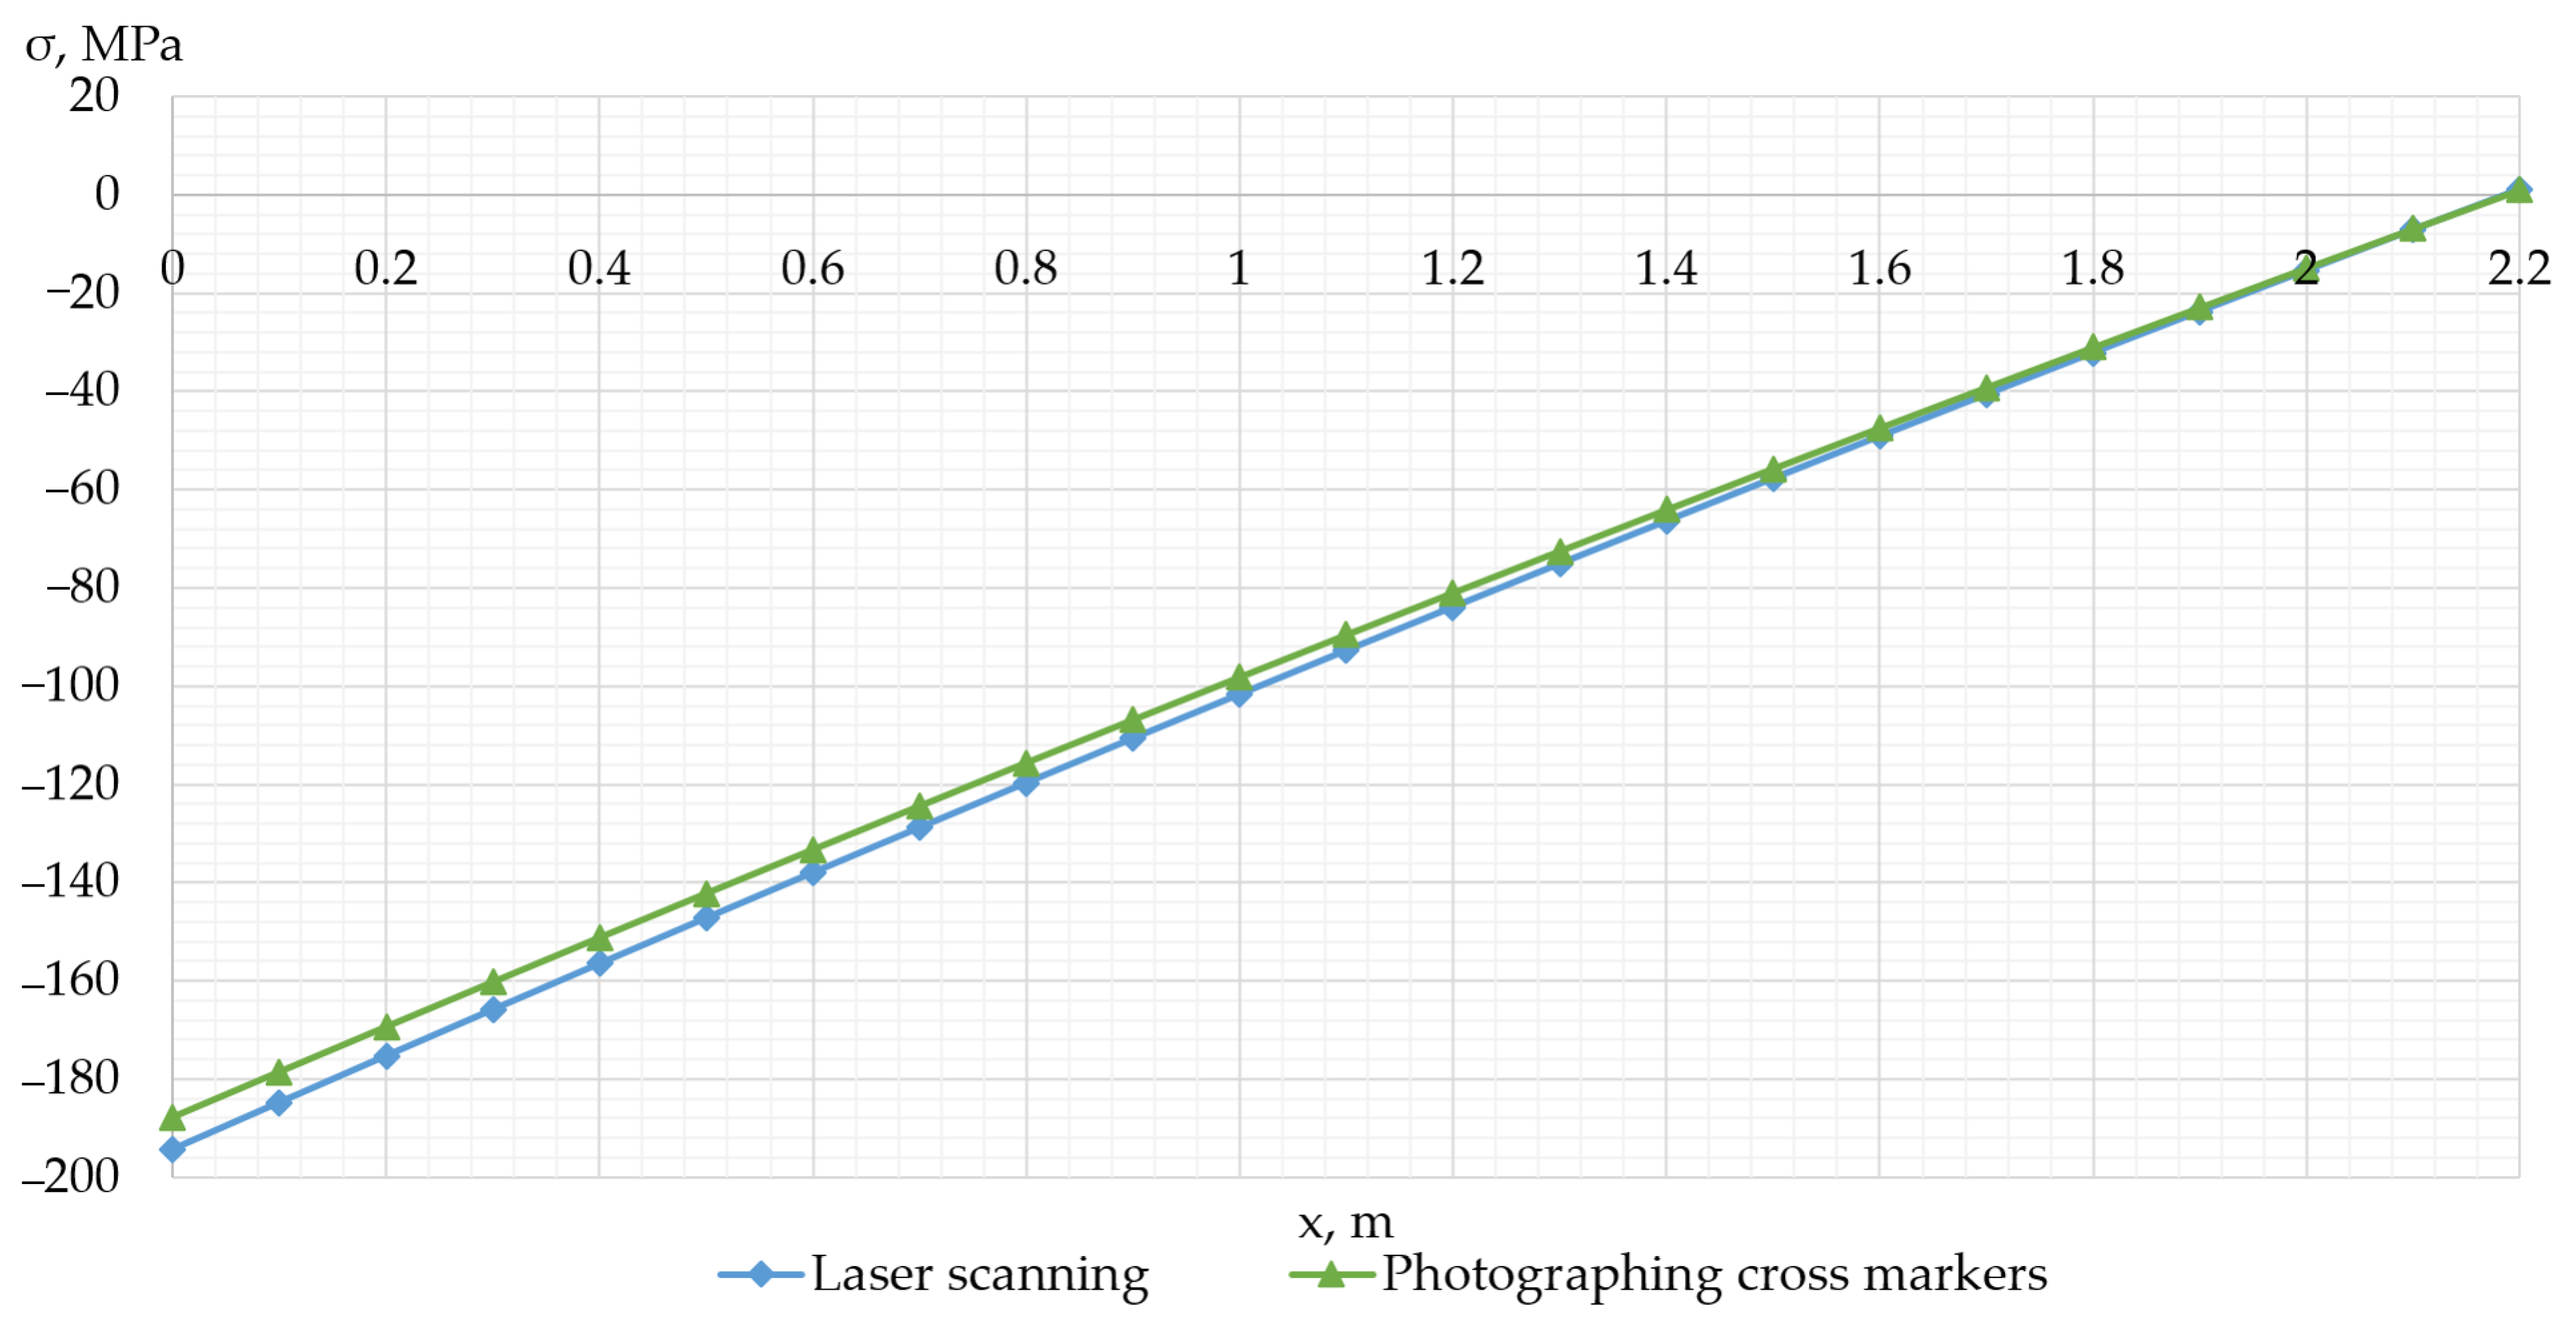
An example of graphs of the distribution of bending stress values based on laser scanning data and photographing cross markers for a 2.2 m long pipe is shown in Figure 19.
Based on the data in Table 3 and the results of the experimental study, it can be concluded that the developed method allows one to estimate the magnitude of bending stresses in the pipeline wall with an accuracy of up to 5% based on laser scanning data.

3.2. Results of the Study of the Degree of Influence of the Unevenness of the Pipeline Insulation Coating and the Angle of Its Scanned Sector on the Accuracy of Estimating the Values of Bending Stresses in Its Wall Using the Developed Method

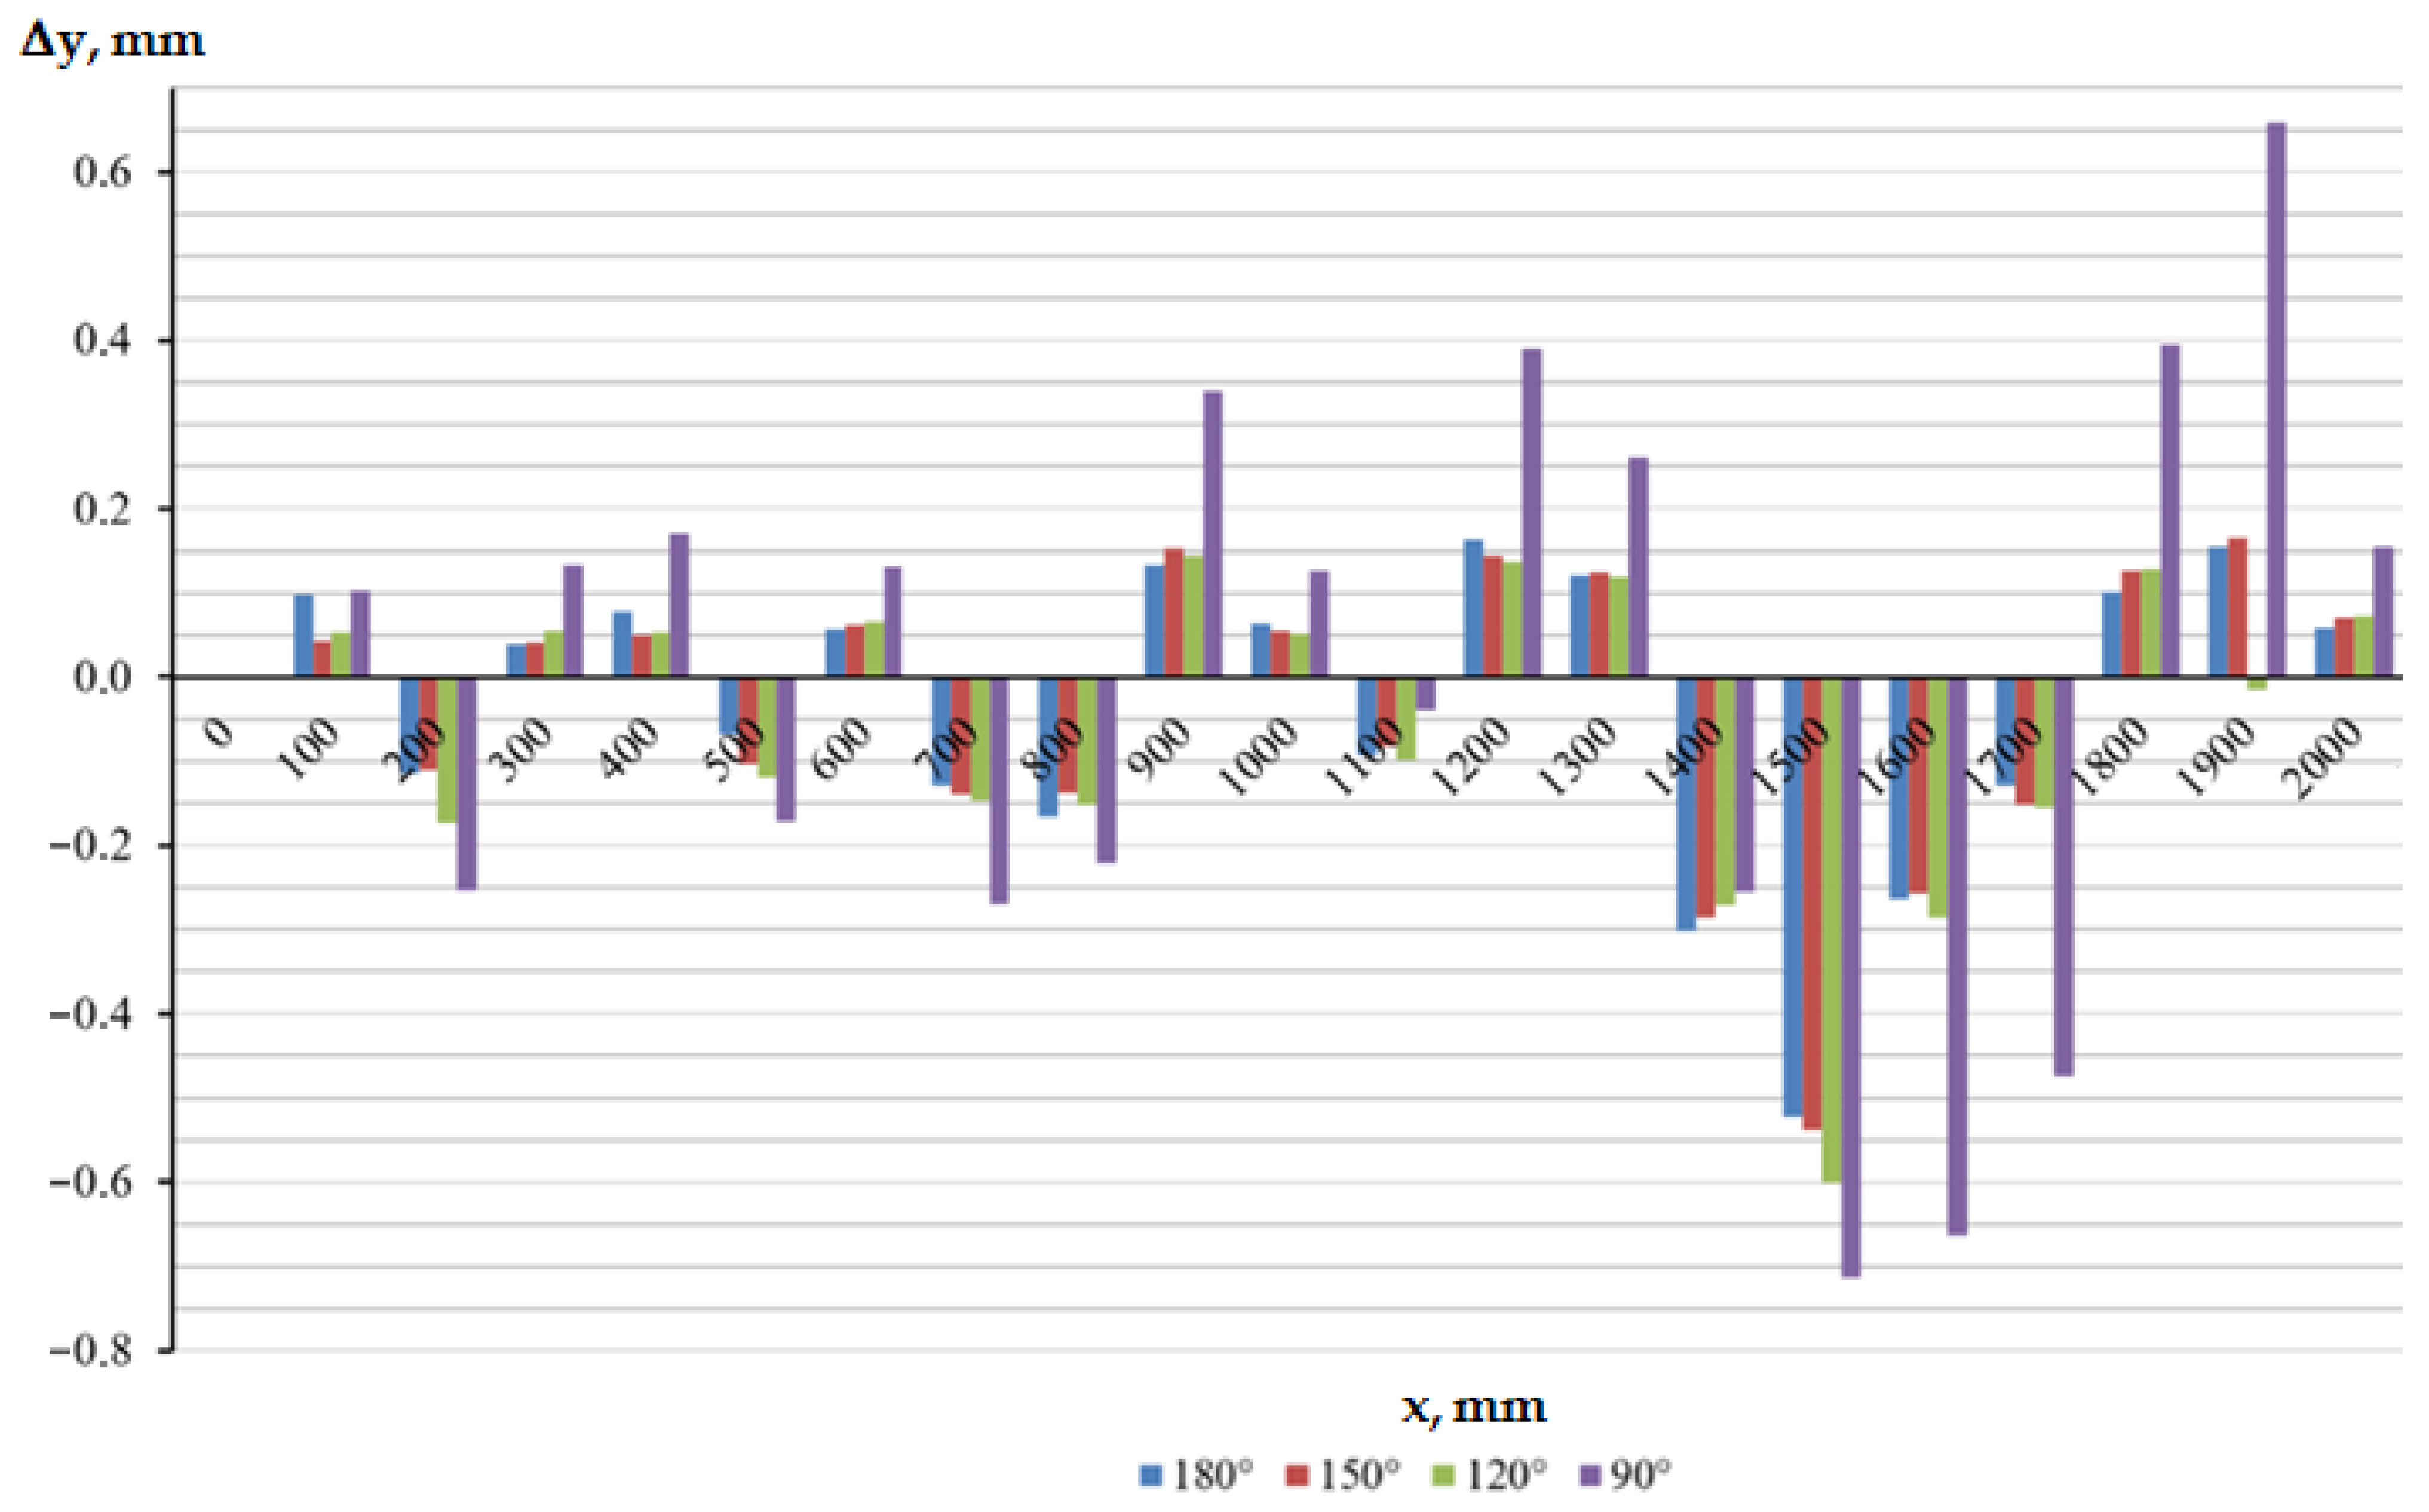
As a result of laser scanning of the experimental pipe with created unevenness of the insulating coating at the selected angles of the scanned sector of the pipe, absolute deviations of the coordinates of the points of its central axis relative to the coordinates of the points of the axis of the uninsulated pipe were obtained, presented in Figure 20.
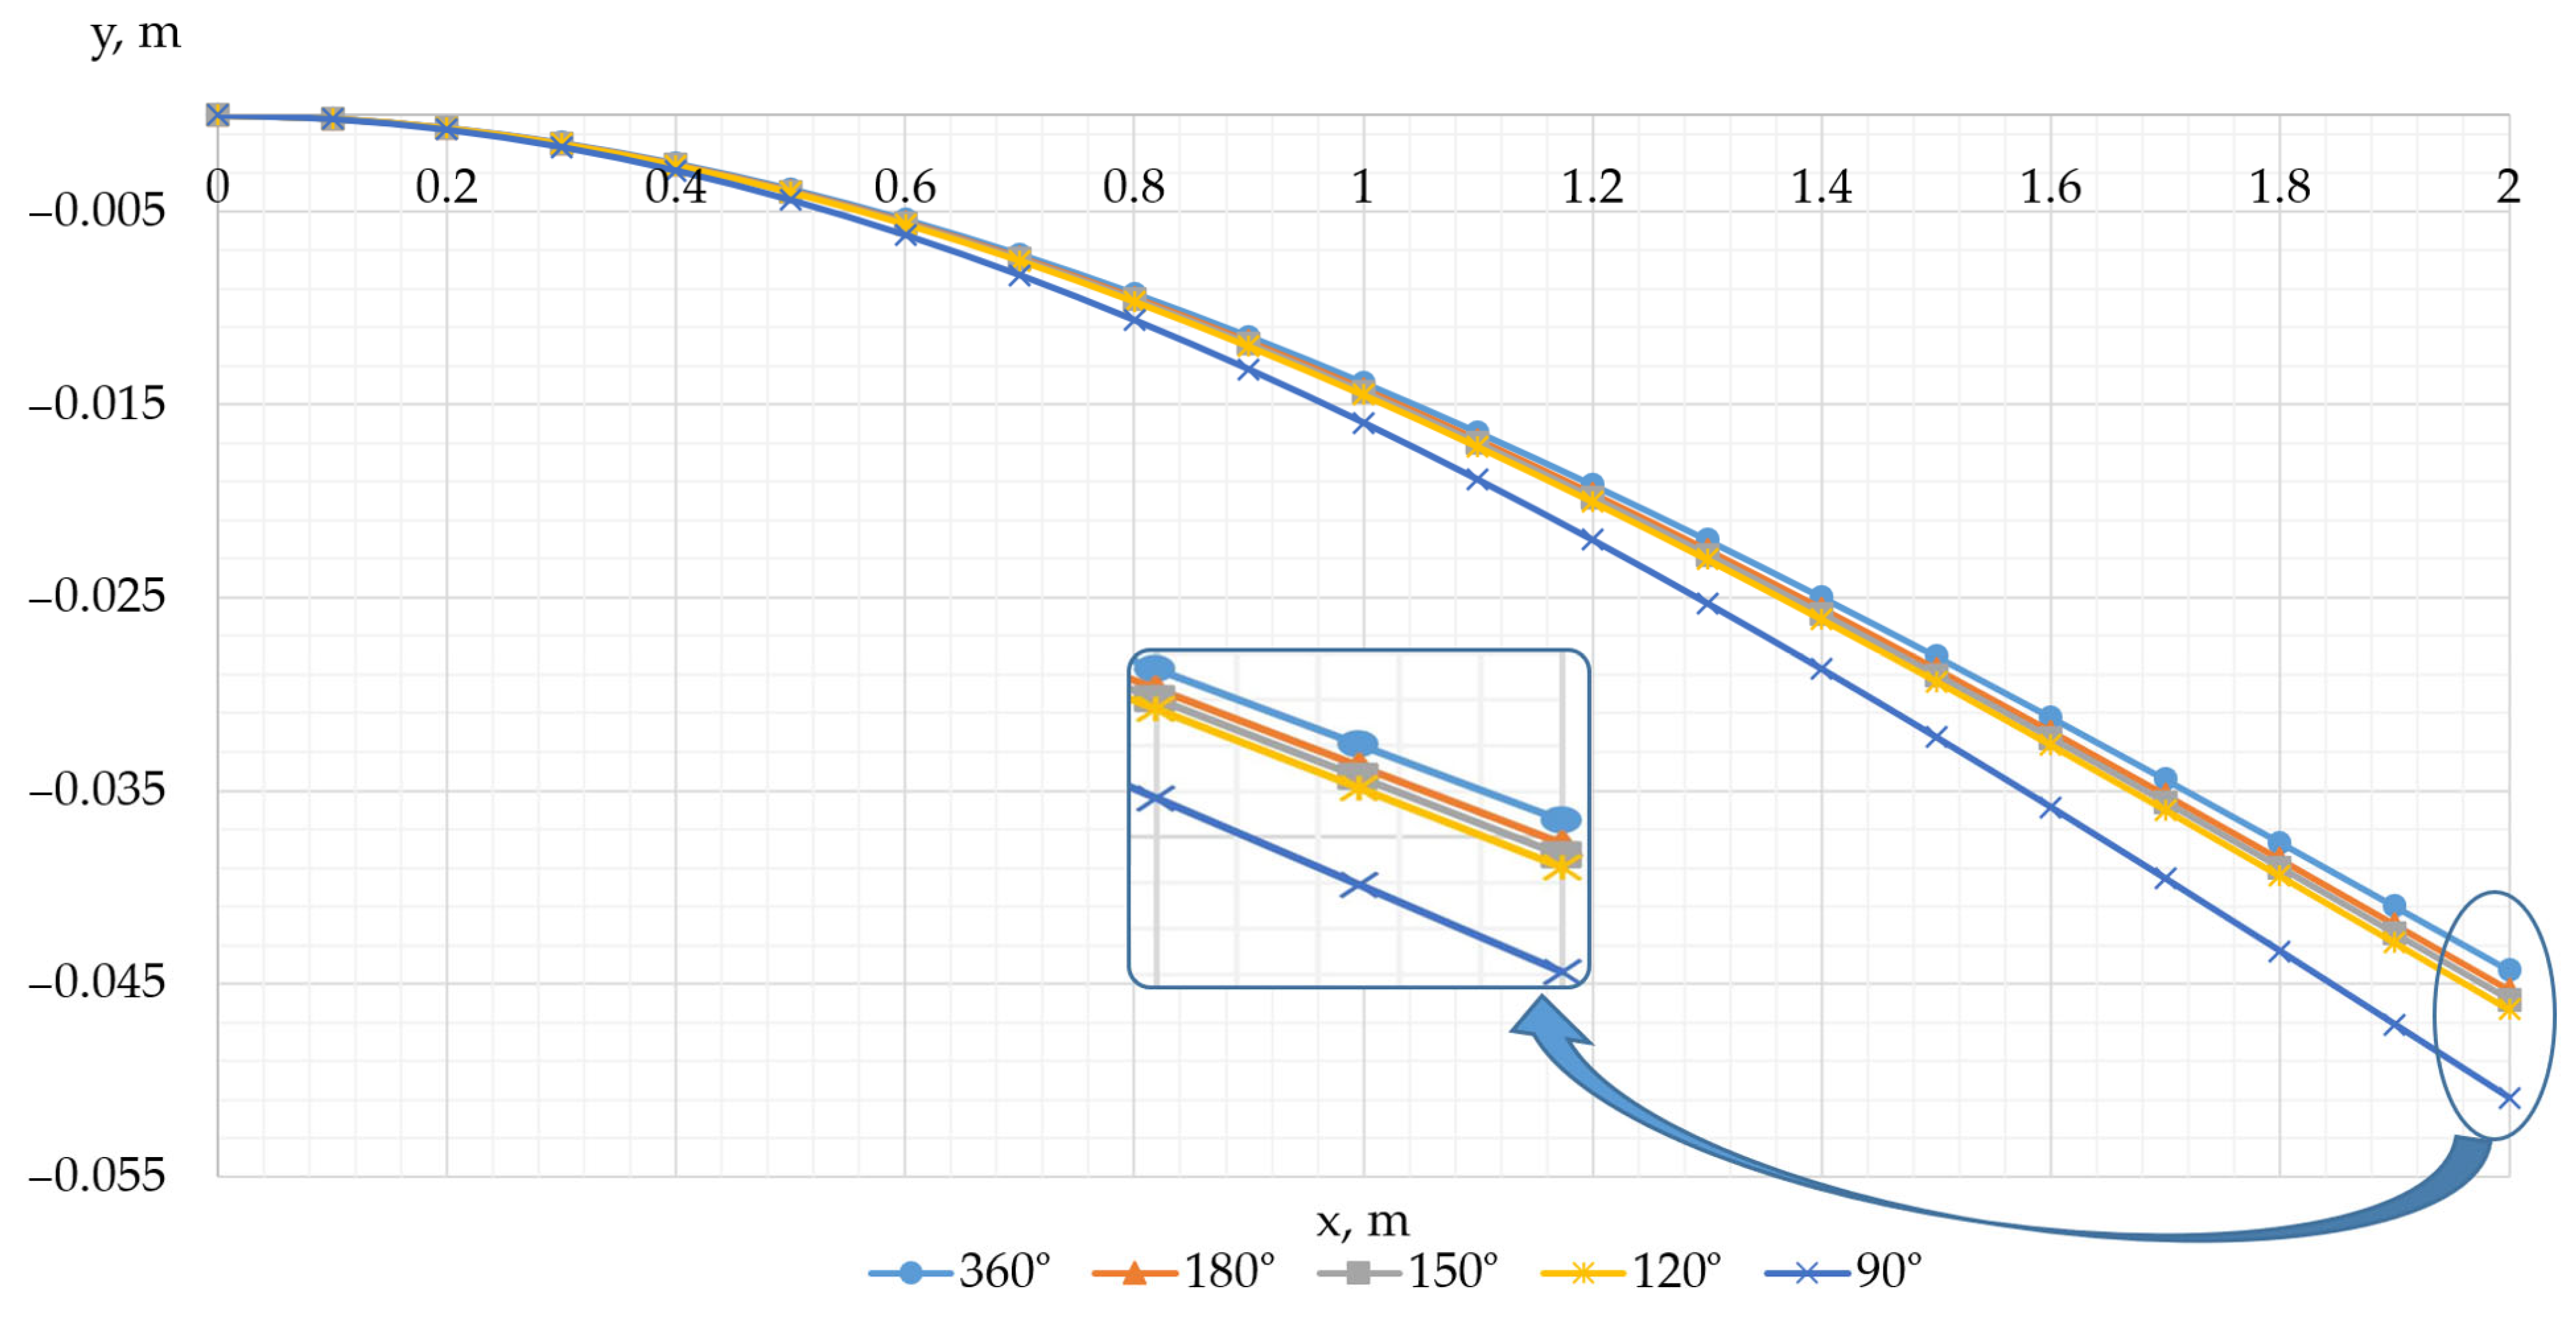
Based on the obtained values of absolute deviations of the coordinates of the points of the central axis of the pipe before and after its insulation, the graphs of the pipe deflection for the selected values of the laser scanning sector angles are presented in Figure 21.
The coefficients of the polynomials of the central axis of the pipe, obtained from the results of its laser scanning at different values of the angle of the pipe scanning sector, are presented in Table 4.
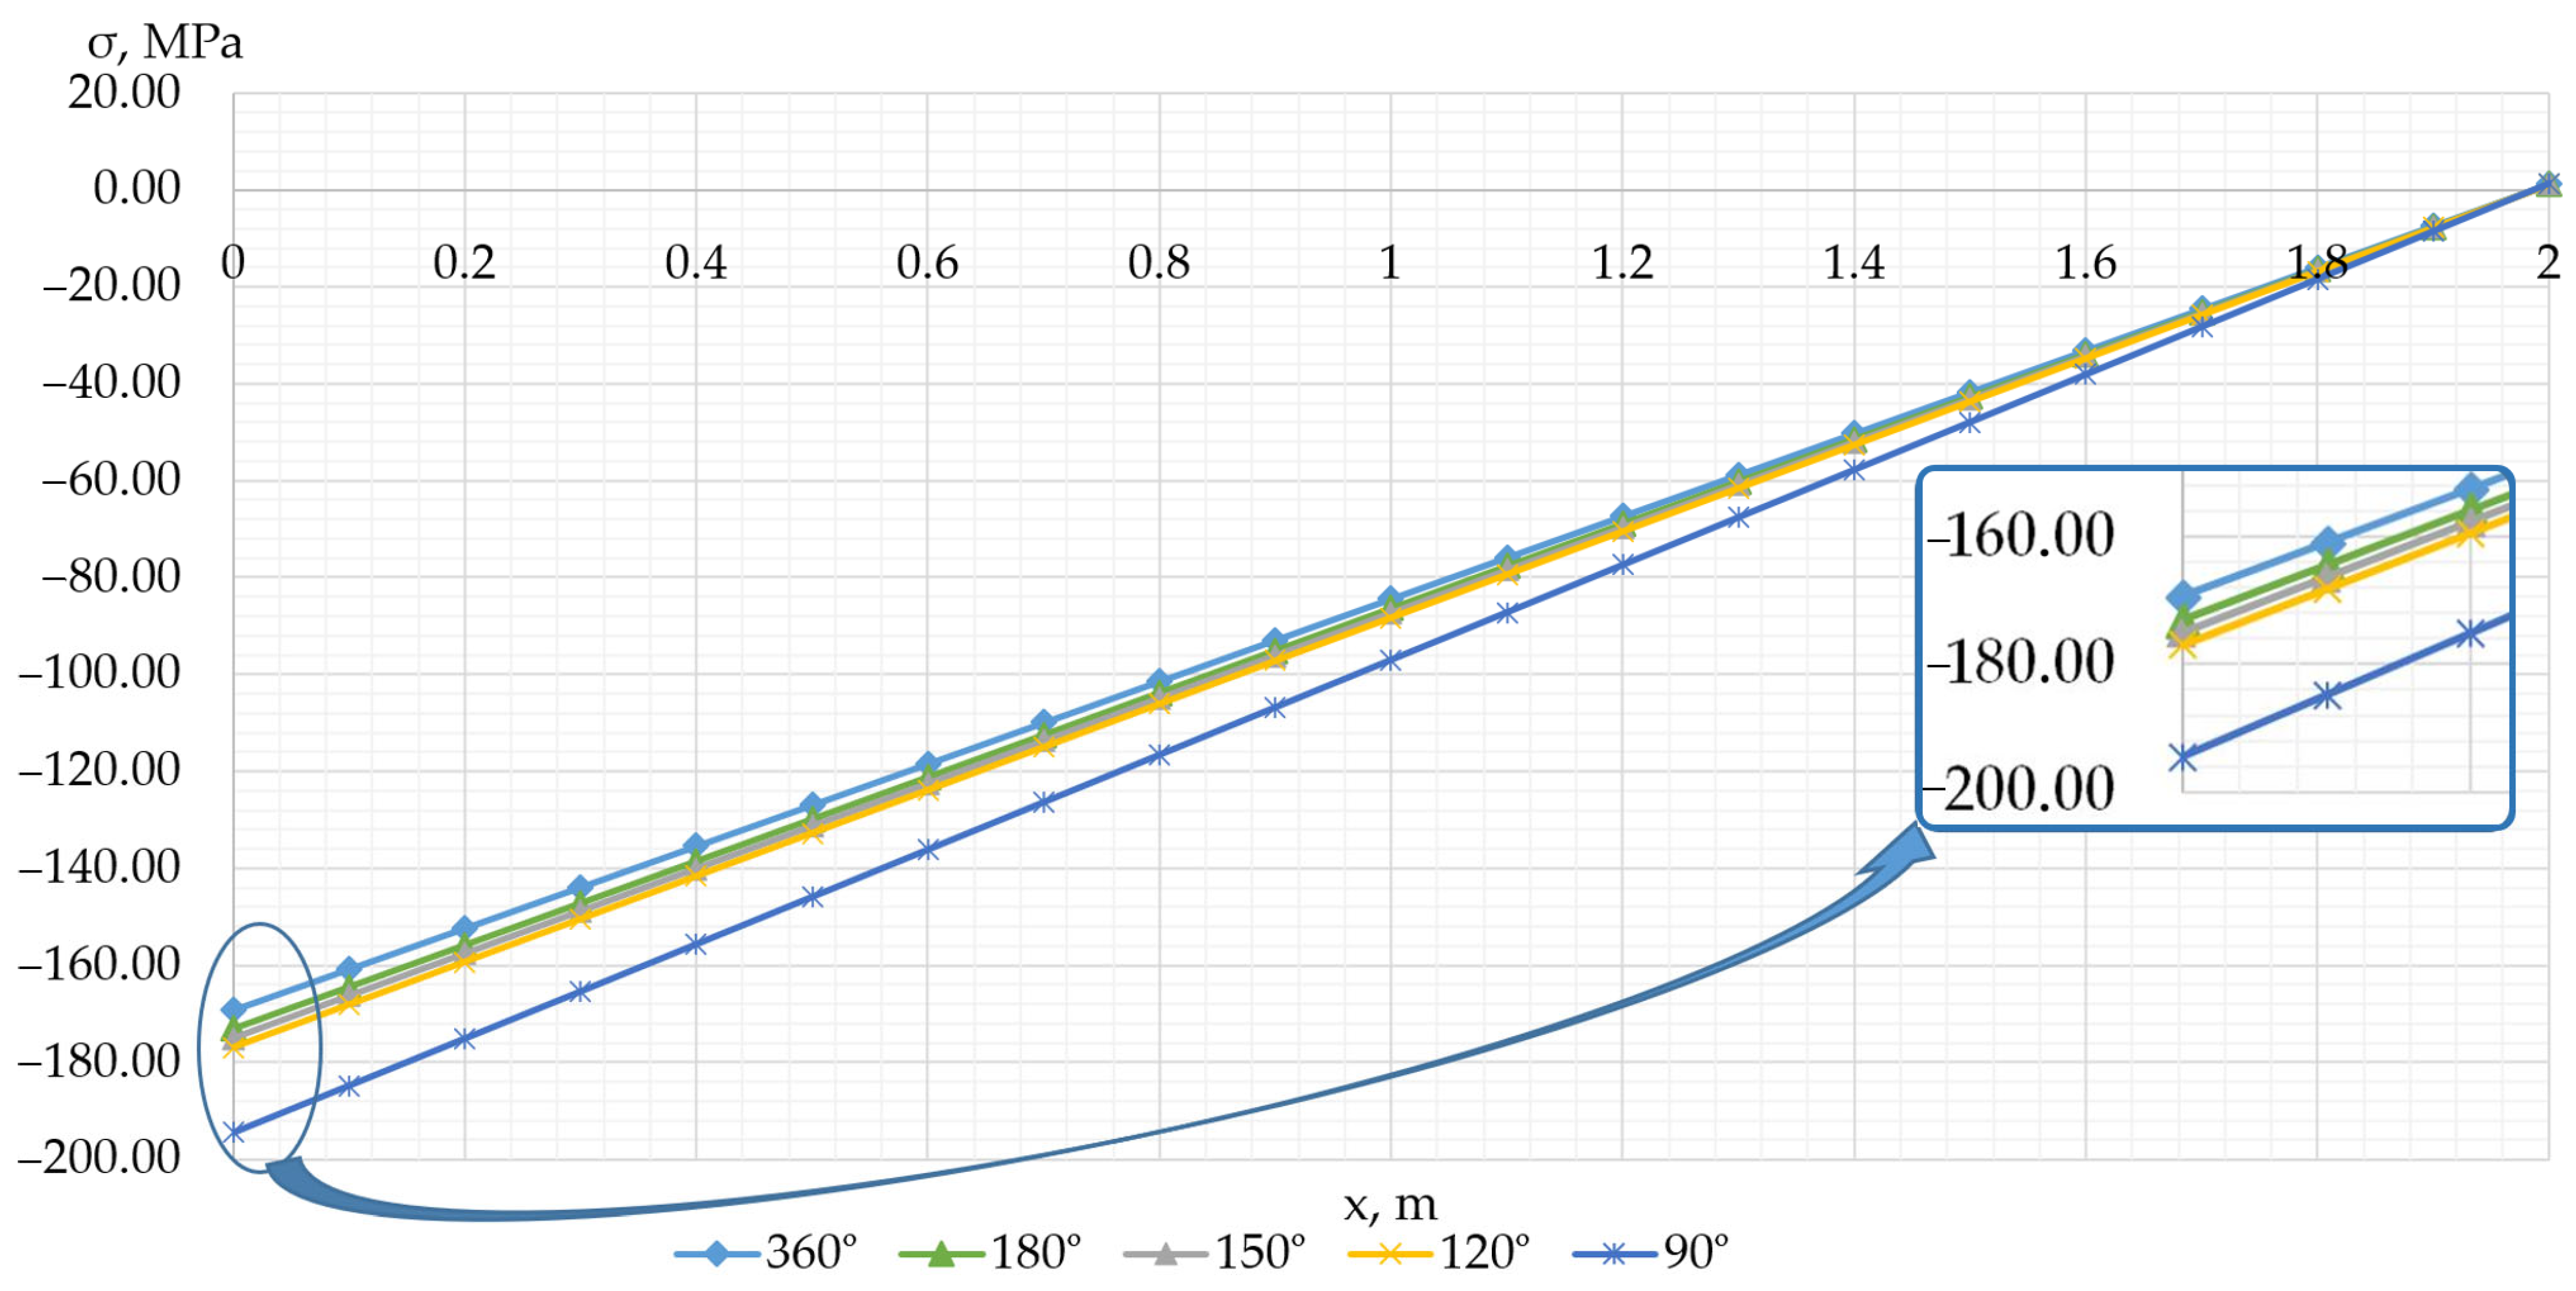
Based on the obtained equations of pipe deflection, for each value of the angle of its scanned sector, the values of bending stresses along the length of the pipe were calculated and are presented in Figure 22.
In this case, the maximum relative deviations of the calculated stress values for an insulated pipe from the stress values calculated for a pipe without insulation are presented in Table 5.
Based on the table data, it can be concluded that an accuracy of up to 5% in determining bending stress values is achieved with a laser scanning sector angle of above-ground pipelines greater than 120°. The scanning sector angle depends on the height of the airborne laser scanner above the upper generatrix of the pipeline and is achieved when scanning for the purpose of monitoring the spatial position of the above-ground pipeline.

4. Discussion

The task of assessing the stress–strain state of above-ground main pipelines is particularly relevant, since existing methods do not always allow estimating the stresses on each section of the pipeline due to the disadvantages characteristic of the methods used. To solve this problem, aerial laser scanning is often used to determine the stress–strain state of above-ground pipelines in operation, based on obtaining the coordinates of a cloud of points on the surface of the main pipeline and further analyzing the spatial position of its central axis.
However, to date, the influence of a number of factors that reduce the accuracy of determining bending stresses in the walls of the above-ground pipelines in field conditions has not been studied.
In this article, a method has been developed for estimating bending stresses in the wall of a main pipeline. The method used includes filtering a cloud of points on the pipeline surface, obtaining the coefficients of a polynomial describing the spatial position of the central axis of the pipeline, and calculating the bending stresses in its wall based on the resulting polynomial. Based on the results of experimental studies, the developed method made it possible to estimate the values of bending stresses in the pipe with an accuracy of up to 5% in comparison with the stress assessment method based on the results of photographing cross markers located on the side of the pipe.
It is important to note that the result of the stress assessment based on laser scanning data may be influenced by the unevenness of the surface of the thermal insulation of the above-ground pipeline, as well as the angle of the scanned pipeline sector, since in the case of aerial scanning it is impossible to scan the pipeline from all sides.
In connection with the above, an experiment was also conducted to study the degree of influence of these factors on the accuracy of determining stress values using the developed method. According to the results of the experiment, it was revealed that the unevenness of the pipeline insulation coating does not significantly affect the accuracy of the stress assessment.
At the same time, taking into account the existing irregularities in the insulation coating of the pipeline, the minimum angle of its scanned sector, which ensures the accuracy of estimating stress values up to 5%, is 120°.
The advantages of the proposed laser scanning data processing method include minimizing the influence of pipeline insulation coating irregularities by using point approximations on the pipeline surface. This also ensures the required accuracy in determining bending stresses at a 120° pipeline scanning angle, which is more than adequately achieved during scanning, as scanning is often performed from a height that provides a scanning angle of up to 180°.
As for the limitations of the developed method, its results in field conditions may be distorted by factors inherent to the field. In this regard, as part of further research, it is necessary to conduct experimental studies of the degree to which parameters such as the density of the cloud of scanning points, the distance from the laser scanner to the pipeline, the accuracy of the scanning equipment itself, and the speed of the air scanner influence the accuracy of estimating the stresses in the above-ground pipeline wall.
The proposed method for processing laser scanning data from above-ground pipelines to estimate bending stresses in their walls is suitable for monitoring pipeline deformations in areas most susceptible to deformation. These pipeline sections must be carefully monitored periodically to predict when stresses approach critical values.
In addition, airborne laser scanning is most effective when combined with in-line inspection data. This will allow for a comprehensive assessment of the severity of defects in the pipeline wall identified by in-line inspection, in conjunction with bending stresses. This will also enable the detection of dangerous defects such as stress-corrosion cracking.
It is also important to note that airborne laser scanning is not an expensive method. Laser scanners are currently a fairly affordable technology, becoming cheaper and more compact every year. For one-time or periodic scanning, purchasing scanning services from a third-party company may be advisable.

5. Conclusions

As a result of the conducted research, the following conclusions can be drawn:
  • Aerial laser scanning allows for the rapid and accurate determination of bending stress values in the walls of above-ground pipelines but requires taking into account limitations on the scanning angle and the state of the insulation.
  • The developed method for assessing bending stresses based on airborne laser scanning data allows for determining the magnitude of bending stresses in the wall of an above-ground main pipeline with an accuracy of up to 5%.
  • The scanning data processing method includes filtering the point cloud, approximating sections with ellipses to account for ovalization during bending, constructing the central axis of the pipeline using a 4th-degree polynomial, and calculating the values of bending stresses in the pipeline wall.
  • Unevenness of the insulating coating does not have a significant impact on the accuracy of determining bending stresses based on the developed method.
  • The minimum angle of the scanned pipeline sector is 120°, which ensures an accuracy of bending stress assessment of up to 5%. This is achieved by conducting aerial laser scanning from a height that ensures sufficient coverage of the upper generatrix of the pipeline.
  • The developed method can be used for operational monitoring and forecasting of the formation of emergency sections of pipelines, which increases the safety of their operation, and can be used in combination with other diagnostic methods, for example, in-line inspection for a comprehensive assessment of the condition of above-ground pipelines.

6. Patents

The results of this study are contained in the patent “Method of repair of defective sections of main pipelines”, No. 2791795, at the Federal Institute of Intellectual Property of the Russian Federation (registration date 13 March 2023).

Author Contributions

Conceptualization, I.S. and E.D.; methodology, I.S. and E.D.; software, E.D., A.K. and M.M.; validation, I.S.; formal analysis, E.D.; investigation, E.D.; resources, E.D., A.K. and M.M.; data curation, I.S.; writing—original draft preparation, E.D., A.K. and M.M.; writing—review and editing, E.D. and I.S.; visualization, A.K. and M.M.; supervision, I.S.; project administration, E.D. All authors have read and agreed to the published version of the manuscript.

Funding

This research received no external funding.

Institutional Review Board Statement

Not applicable.

Informed Consent Statement

Not applicable.

Data Availability Statement

The original contributions presented in this study are included in the article. Further inquiries can be directed to the corresponding author.

Conflicts of Interest

The authors declare no conflicts of interest.

Abbreviations

y(x)pipeline deflection in a vertical or horizontal plane with the coordinate z, m;
a, b, c, d, epolynomial coefficients;
Douter diameter of the pipeline, m;
M(x)bending moment in the pipeline, N·m;
Iaxial moment of inertia of the pipe section, m4
σ b ( x ) bending stresses in the wall of the pipeline, Pa;
ρ ( x ) elastic bending radius of the pipeline, m;
k(x)curvature of the deflection function of the pipeline axis, 1/m;
k y ( x ) , k z ( x ) curvature of the pipeline axis in the vertical and horizontal directions, respectively, 1/m;
EYoung’s modulus of elasticity of pipeline steel, Pa;

References

  1. Tutko, R.; Lozynskyi, V. Oscillations of the Oil Pipeline Axis with Consideration of the Inertia Component When Pumping Diesel Fuel. Energies 2025, 18, 2472. [Google Scholar] [CrossRef]
  2. Prokhorova, E.A.; Gendler, S.G.; Fazylov, I.R. Influence of ecological conditions on risk of injuries and occupational illness in Russia’s Arctic Zone. Min. Informa. Anal. Bull. 2024, 6, 105–122. [Google Scholar]
  3. Doroshenko, Y.; Kogut, G.; Doroshenko, Y.; Tarayevs’kyy, O.; Pyrig, T. Numerical study on erosion wear and strength of main gas pipelines bends. Stroj. Časopis J. Mech. Eng. 2021, 71, 27–40. [Google Scholar]
  4. Galevskiy, S.; Ponomarenko, T.; Tsiglianu, P. The Impact of Self-Sufficiency in Basic Raw Materials of Metallurgical Companies on Required Return and Capitalization: The Case of Russia. J. Risk Financ. Manag. 2025, 18, 318. [Google Scholar] [CrossRef]
  5. Liu, J.; Zhang, W.; Gu, T.; Liu, J.; Peng, J.; Dou, Y. Mechanical Analysis of Lined Pipe System Under Temperature–Pressure Coupling in Elastic Laying. Processes 2025, 13, 691. [Google Scholar] [CrossRef]
  6. El-Mageed, A.I.A.A.; Desouky, M.M.; El-Sayed, M.; Salem, T.; Radwan, A.B.; Hassan, M.K.; Al-Oufy, A.K.; El-Dessouky, H.M. Carbon Fiber-Reinforced Thermoplastic Composite Coatings for Steel Pipelines. Polymers 2024, 16, 3417. [Google Scholar] [CrossRef] [PubMed]
  7. Al-Suhaibani, Z.; Danish, S.N.; Al-Khalaf, Z.S.; Salim, B. Improved Prediction Model and Utilization of Pump as Turbine for Excess Power Saving from Large Pumping System in Saudi Arabia. Sustainability 2023, 15, 1014. [Google Scholar] [CrossRef]
  8. Aleksandrova, T.N.; Kuznetsov, V.V.; Prokhorova, E.O. Investigation of Interfacial Characteristics as a Key Aspect of the Justification of the Reagent Regime for Coal Flotation. Minerals 2025, 15, 76. [Google Scholar] [CrossRef]
  9. Litvinenko, V.S.; Petrov, E.I.; Vasilevskaya, D.V.; Yakovenko, A.V.; Naumov, I.A.; Ratnikov, M.A. Assessment of the role of the state in the management of mineral resources. J. Min. Inst. 2023, 259, 95–111. [Google Scholar] [CrossRef]
  10. Dutkiewicz, M.; Dalyak, T.; Shatskyi, I.; Venhrynyuk, T.; Velychkovych, A. Stress Analysis in Damaged Pipeline with Composite Coating. Appl. Sci. 2021, 11, 10676. [Google Scholar] [CrossRef]
  11. Litvinenko, V.S.; Tsvetkov, P.S.; Dvoynikov, M.V.; Buslaev, G.V.; Eichlseder, W. Barriers to implementation of hydrogen initiatives in the context of global energy sustainable development. J. Min. Inst. 2020, 244, 428–438. [Google Scholar] [CrossRef]
  12. Aleksandrov, A.N.; Rogachev, M.K.; Nguyen, T.N.; Kishchenko, M.A.; Kibirev, E.A. Simulation of organic solids formation process in high-wax formation oil. Top. Issues Ration. Use Nat. Resour. 2019, 2, 779–790. [Google Scholar]
  13. Aleksandrova, T.N.; Kuznetsov, V.V.; Nikolaeva, N.V. Potential trace element markers of naphthogenesis processes: Modeling and experimentation. J. Min. Inst. 2024, 269, 687–699. [Google Scholar]
  14. Peng, L.; Zhang, J.; Li, Y.; Du, G. A novel percussion-based approach for pipeline leakage detection with improved MobileNetV2. Eng. Appl. Artif. Intell. 2024, 133, 108537. [Google Scholar] [CrossRef]
  15. Zakirova, G.S.; Pshenin, V.V.; Gustov, A.A. Compensation of temperature deformations of gas pipelines. Int. J. Eng. 2025, 38, 1699–1707. [Google Scholar] [CrossRef]
  16. Pengchao, C. Advancements and future outlook of safety monitoring, inspection and assessment technologies for oil and gas pipeline networks. J. Pipeline Sci. Eng. 2025, 5, 100267. [Google Scholar] [CrossRef]
  17. Nikolaev, A.; Zhukov, A.; Goluntsov, A.; Shirmaher, E. Evaluation of the Effectiveness of Anti-Turbulence Additives in the Transportation of High-Viscosity Oil at Low Ambient Temperatures. Processes 2025, 13, 1434. [Google Scholar] [CrossRef]
  18. Zhang, Y.; Zhong, Z.; Guo, D.; Xu, C.; Du, X.; Wang, H. Experimental investigation of ductile iron pipeline joints rehabilitated with corrosion-protection linings under combined bending and internal pressure. Eng. Struct. 2025, 343, 121234. [Google Scholar] [CrossRef]
  19. Smirnov, Y.; Suchkov, D.V.; Goryunova, T.V. Justification of the line of action for reclamation of lands disturbed by opencast mining. E3S Web Conf. 2021, 266, 08005. [Google Scholar] [CrossRef]
  20. Protosenya, A.G.; Kumov, V.V. Effect of soil body structure of mixed-type tunnel face on shape and size of subsidence trough on ground surface. MIAB. Min. Inf. Anal. Bull. 2024, 4, 5–21. [Google Scholar]
  21. Weng, G.; Xing, X.; Han, Z.; Wang, B.; Zhu, X.; Zheng, J. Stress prediction model of oil and gas pipeline based on magnetic-force coupling and machine learning. Measurement 2025, 240, 117818. [Google Scholar] [CrossRef]
  22. Kec, J.; Cerny, I. Stress-strain assessment of dents in wall of high pressure gas pipeline. Procedia Struct. Integr. 2017, 5, 340–346. [Google Scholar] [CrossRef]
  23. Diao, X.; Jiang, J.; Mebarki, A.; Ni, L.; Duo, Y.; Chen, S.; Zhang, S. Risk analysis of domino effect of leakage accident of petrochemical pipeline based on analytic hierarchy process and fuzzy fault tree analysis. Saf. Sci. 2025, 187, 106852. [Google Scholar] [CrossRef]
  24. Kang, J.; Meng, X.; Su, T.; Chang, W.; Wang, Z.; Wang, H.; Zhang, J. Research on leakage control of river oil and gas pipelines based on accident situation evolution model. J. Loss Prev. Process Ind. 2025, 96, 105615. [Google Scholar] [CrossRef]
  25. Grigorev, E.; Nosov, V. Improving quality control methods to test strengthening technologies: A multilevel model of acoustic pulse flow. Appl. Sci. 2022, 12, 4549. [Google Scholar] [CrossRef]
  26. Ma, Q.; Liang, W.; Zhou, P. A review on pipeline in-line inspection technologies. Sensors 2025, 25, 4873. [Google Scholar] [CrossRef] [PubMed]
  27. Ma, Q.; Tian, G.; Zeng, Y.; Li, R.; Song, H.; Wang, Z.; Zeng, K. Pipeline in-line inspection method, instrumentation and data management. Sensors 2021, 21, 3862. [Google Scholar] [CrossRef]
  28. Korobov, G.Y.; Vorontsov, A.A.; Buslaev, G.V.; Nguyen, V.T. Analysis of Nucleation Time of Gas Hydrates in Presence of Paraffin During Mechanized Oil Production. Int. J. Eng. Trans. A Basics 2024, 37, 1343–1356. [Google Scholar] [CrossRef]
  29. Parlak, B.O.; Yavasoglu, H.A. A Comprehensive Analysis of In-Line Inspection Tools and Technologies for Steel Oil and Gas Pipelines. Sustainability 2023, 15, 2783. [Google Scholar] [CrossRef]
  30. Palaev, A.G.; Dzhemilev, E.R. Research of efficiency of influence of ultrasonic treatment on asphalt and paraffin oil deposits. IOP Conf. Ser. Mater. Sci. Eng. 2020, 862, 032081. [Google Scholar] [CrossRef]
  31. Zakirova, G.S.; Krapivsky, E.I. Application of Ansys/Fluent software package for analysis of thermohydraulic processes in the low-temperature main pipeline for liquified hydrocarbon. J. Phys. Conf. Ser. 2019, 1384, 012070. [Google Scholar] [CrossRef]
  32. Gendler, S.; Fazylov, I.R. Methods of regulation air temperature in the Russian oil mains. Top. Issues Ration. Use Nat. Resour. 2020, 1, 16–21. [Google Scholar]
  33. Freddi, F.; Mingazzi, L.; Pozzi, E.; Aresi, N. Laboratory assessment of an in-place inclinometer chain for structural and geotechnical monitoring. Sensors 2023, 23, 8379. [Google Scholar] [CrossRef]
  34. Mohamad, H.; Beddelee, A.A.A.; Ghazali, M.F.; Lee, H.E.; Chaiyasarn, K.; Nasir, M.Y.M. Distributed fibre optic inclinometer with cloud-based monitoring system. Eng. Sci. Technol. Int. J. 2023, 41, 101406. [Google Scholar] [CrossRef]
  35. Tan, X.; Poorghasem, S.; Huang, Y.; Feng, X.; Bao, Y. Monitoring of pipelines subjected to interactive bending and dent using distributed fiber optic sensors. Autom. Constr. 2024, 160, 105306. [Google Scholar] [CrossRef]
  36. Dvoynikov, M.V.; Kutuzov, P.A. Analysis of Efficiency of Communication Channels for Monitoring and Operational Control of Oil and Gas Wells Drilling Process. Int. J. Eng. 2025, 38, 120–131. [Google Scholar] [CrossRef]
  37. Gloukhov, D.V.; Suchkov, D.V.; Altukhova, A.P.; Smirnov, D.R. Modeling of Dust Content Control System for Industrial Enterprises in the Mineral Resource Sector. Int. J. Eng. Trans. B Appl. 2026, 39, 1802–1811. [Google Scholar] [CrossRef]
  38. Chmelko, V.; Garan, M.; Šulko, M. Strain measurement on pipelines for long-term monitoring of structural integrity. Measurement 2020, 163, 107863. [Google Scholar] [CrossRef]
  39. Chen, P.; Li, R.; Jia, G.; Lan, H.; Fu, K.; Liu, X. A decade review of the art of inspection and monitoring technologies for long-distance oil and gas pipelines in permafrost areas. Energies 2023, 16, 1751. [Google Scholar] [CrossRef]
  40. Arya, A.K. A critical review on optimization parameters and techniques for gas pipeline operation profitability. J. Pet. Explor. Prod. Technol. 2022, 12, 3033–3057. [Google Scholar] [CrossRef]
  41. Belikov, A.A.; Belyakov, N.A. Method for ensuring geomechanical safety during undermining of water-protective strata. Sustain. Dev. Mt. Territ. 2025, 17, 115–125. [Google Scholar] [CrossRef]
  42. Sepulveda-Valdez, C.; Sergiyenko, O.; Tyrsa, V.; Mercorelli, P.; Rodríguez-Quiñonez, J.C.; Flores-Fuentes, W.; Murrieta-Rico, F.N. Mathematical modeling for robot 3d laser scanning in complete darkness environments to advance pipeline inspection. Mathematics 2024, 12, 1940. [Google Scholar] [CrossRef]
  43. Gumilar, I.; Farohi, F.; Munarda, M.; Bramanto, B.; Kartini, G.A.J. The Combined Use of Terrestrial Laser Scanner and Handheld 3D Scanner for 3D Modeling of Piping Instrumentation at Oil and Gas Company. J. Eng. Technol. Sci. 2022, 54, 220603. [Google Scholar] [CrossRef]
  44. Fraser, J.S.; Allard, P.H. Impact of 3D Laser Data Resolution and Accuracy on Pipeline Dents Strain Analysis. Mater. Eval. 2023. Available online: https://source.asnt.org/impact-of-3d-laser-data-resolution-and-accuracy-on-pipeline-dents-strain-analysis (accessed on 10 December 2025).
  45. Holzhüter, H.; Bödewadt, J.; Bayesteh, S.; Aschinger, A.; Blume, H. Technical concepts of automotive LiDAR sensors: A review. Opt. Eng. 2023, 62, 031213. [Google Scholar] [CrossRef]
  46. Baborykin, M.Y. Device for Determining the Planned-Altitude Position of a Pipeline. Patent of the Russian Federation 2017108820, 21 August 2017. [Google Scholar]
  47. Skorobogatov, A.A.; Pshenin, V.V.; Duchnevich, L.D. Review of Multiphase Oil-Water Flow Characteristics in Horizontal and Inclined Pipelines. SOCAR Proc. 2025, 81–98. Available online: https://proceedings.socar.az/en/journal/115 (accessed on 10 December 2025).
  48. Meng, X.; Pullen, A.; Guo, X.; Yun, X.; Gardner, L. 3D laser scanning and DIC in structural testing: State-of-the-art, best practice and effective use. Eng. Struct. 2025, 345, 121055. [Google Scholar] [CrossRef]
  49. Lin, W.; Li, P.; Xie, X. A Novel Detection and Assessment Method for Operational Defects of Pipe Jacking Tunnel Based on 3D Longitudinal Deformation Curve: A Case Study. Sensors 2022, 22, 7648. [Google Scholar] [CrossRef]
  50. Lopes, M.A.; Soeiro, F.J.C.P.; Silva, J.G.S. Nonlinear buckling behavior and stress and strain analyses of atmospheric storage tank aided by laser scan dimensional inspection technique. J. Braz. Soc. Mech. Sci. Eng. 2022, 44, 443. [Google Scholar] [CrossRef]
  51. Li, M.; Feng, X.; Hu, Q. 3D laser point cloud-based geometric digital twin for condition assessment of large diameter pipelines. Tunn. Undergr. Space Technol. 2023, 142, 105430. [Google Scholar] [CrossRef]
  52. Li, P.; Zhang, Q.; Wang, X.; Zhao, T.; Wang, Y. Method for detecting pipeline spatial attitude using point cloud alignment. Measurement 2023, 219, 113279. [Google Scholar] [CrossRef]
  53. Pshenin, V.; Sleptsov, A.; Dukhnevich, L. Prospects of Improving the Vibroacoustic Method for Locating Buried Non-Metallic Pipelines. Eng 2025, 6, 121. [Google Scholar] [CrossRef]
  54. Shammazov, I.; Dzhemilev, E.; Sidorkin, D. Improving the Method of Replacing the Defective Sections of Main Oil and Gas Pipelines Using Laser Scanning Data. Appl. Sci. 2023, 13, 48. [Google Scholar] [CrossRef]
  55. Sidorkin, D.I.; Shammazov, I.A.; Dzhemilev, E.R.; Pshenin, V.V. Method of Repair of Defective Sections of Main Pipelines. Patent of the Russian Federation 2791795, 13 March 2023. [Google Scholar]
  56. Timoshenko, S. Strength of Materials: Part I, 3rd ed.; D. Van Nostrand Company: New York, NY, USA, 1950; pp. 93–96. [Google Scholar]
  57. Bi, S.; Yuan, C.; Liu, C.; Cheng, J.; Wang, W.; Cai, Y. A Survey of Low-Cost 3D Laser Scanning Technology. Appl. Sci. 2021, 11, 3938. [Google Scholar] [CrossRef]
Figure 1. Laser scanner and electromechanical press used during the experiment [54]: (a) Pipeline with a length of 2.4 m, an outer diameter of 51 mm and a wall thickness of 3 mm; (b) Laser scanner Hexagon RS6 Laser Scanner; (c) Electromechanical press Testometric M350-5CT.
Applsci 16 01330 g001
Figure 2. Schematic diagram of the experimental setup for scanning an elastically curved pipe: (a) Side view of the experimental setup; (b) Front view of the fixed pipe.
Applsci 16 01330 g002
Figure 3. The pipe under study in a bent state [54].
Applsci 16 01330 g003
Figure 4. Point cloud of a 2.2 m long pipe when it is bent [54].
Applsci 16 01330 g004
Figure 5. SpatialAnalyzer program interface when processing a point cloud [54].
Applsci 16 01330 g005
Figure 6. TEMA Motion program interface.
Applsci 16 01330 g006
Figure 7. Photograph of a pipe with marker centers marked on it [54].
Applsci 16 01330 g007
Figure 8. Leica MS 60 laser scanner.
Applsci 16 01330 g008
Figure 9. Creating a coordinate system by positioning a laser scanner using spherical reflectors.
Applsci 16 01330 g009
Figure 10. Coordinate system created by tying the laser scanner to spherical reflectors r1, r2, r3 and r4.
Applsci 16 01330 g010
Figure 11. Scanning perimeter created by specifying perimeter points with the scanner beam:1, 2, 3, 4, 5, 6—points limiting the scanning area.
Applsci 16 01330 g011
Figure 12. Cloud of laser scanning points of a pipeline within the established scanning perimeter; 1, 2, 3, 4, 5, 6—points limiting the scanning area.
Applsci 16 01330 g012
Figure 13. Insulated pipe.
Applsci 16 01330 g013
Figure 14. Edge effect zones (highlighted with red ellipses) of the pipeline under study.
Applsci 16 01330 g014
Figure 15. Location of the laser scanning sectors under study: 1–4—numbers of variants of scanned pipe sectors.
Applsci 16 01330 g015
Figure 16. Graphical representation of the sequence of stages for assessing bending stress values based on airborne laser scanning data using the developed method.
Applsci 16 01330 g016
Figure 17. Graphs of deflection of a 2 m long pipe obtained by laser scanning and photographing cross markers.
Applsci 16 01330 g017
Figure 18. Graphs of the distribution of bending stress values based on the obtained equations describing the spatial position of the central axis of the pipe of the studied lengths, obtained from laser scanning data.
Applsci 16 01330 g018
Figure 19. Graphs of the distribution of bending stress values based on laser scanning data and photographing cross markers for a 2.2 m long pipe.
Applsci 16 01330 g019
Figure 20. Values of absolute deviations Δy of the coordinates of the points of the central axis of the pipe along the Oy axis before and after its insulation at the selected angles of the scanned sector of the pipe.
Applsci 16 01330 g020
Figure 21. Graphs of the deflection of an insulated pipe for selected values of the laser scanning sector angles.
Applsci 16 01330 g021
Figure 22. Graphs of the distribution of bending stresses in the wall of an insulated pipe for selected values of the angles of its laser scanning sector.
Applsci 16 01330 g022
Table 1. Characteristics of laser scanners for airborne scanning.
ModelScanning SpeedDistanceAccuracyNavigationField of View (Vert./Horiz.)
GreenValley LiAir 50
(GreenValley International, Berkeley, CA, USA)
up to 300,000 points/s≤100 m300 mm/150 m heightGPS, GLONASS, GALILEO30°/360°
Phoenix miniRANGER-3 LITE
(Phoenix LiDAR Systems, Huntsville, AL, USA)
up to 300,000 points/s2–290 m15 mm/150 m heightGPS, GLONASS, GALILEO30°/360°
AlphaAir 15
(CHC Navigation, Shanghai, China)
up to 2 mln points/s≤250 m15 mm/150 m heightGPS, GLONASS, GALILEO75°/360°
Table 2. Coefficients of the polynomials of the central axis of the pipe, obtained by laser scanning and photographing markers.
Evaluation MethodCoefficients of a Polynomial
abcd
Pipe length l = 2.2 m
Scanning−4.950 × 10−53.119 × 10−3−1.904 × 10⁻²−3.746 × 10⁻⁵
Photo−4.970 × 10−53.024 × 10−3−1.841 × 10⁻²−3.628 × 10⁻⁵
Pipe length l = 2.0 m
Scanning−4.752 × 10−53.069 × 10−3−1.716 × 10⁻²−3.874 × 10⁻⁵
Photo−4.780 × 10−52.974 × 10−3−1.659 × 10⁻²−3.751 × 10⁻⁵
Pipe length l = 1.8 m
Scanning−4.557 × 10−52.998 × 10−3−1.559 × 10⁻²−3.926 × 10⁻⁵
Photo−4.580 × 10−52.935 × 10−3−1.524 × 10⁻²−3.841 × 10⁻⁵
Pipe length l = 1.6 m
Scanning−4.112 × 10−52.861 × 10−3−1.299 × 10⁻²−4.130 × 10⁻⁵
Photo−4.064 × 10−52.866 × 10−3−1.302 × 10⁻²−3.985 × 10⁻⁵
Table 3. Maximum relative deviations of bending stress values calculated based on laser scanning data from those calculated based on cross marker photography data.
Pipe Length, l, mMaximum Relative Deviation of Stress Values According to Scanning and Photographic Data, δ, %
2.23.595
2.03.601
1.82.458
1.62.130
Table 4. Coefficients of the polynomials of the central axis of the pipe, obtained from the results of its laser scanning at different values of the angle of the pipe scanning sector.
Angle of the Scanning Sector, °Coefficients of a Polynomial
abcd
360−4.780 × 10−52.974 × 10−3−1.659 × 10⁻²−3.751 × 10⁻⁵
1807.692 × 10−62.817 × 10⁻³−1.697 × 10⁻²−3.592 × 10⁻⁵
1507.776 × 10−62.849 × 10⁻³−1.716 × 10⁻²−3.632 × 10⁻⁵
1207.865 × 10−62.880 × 10⁻³−1.735 × 10⁻²−3.673 × 10⁻⁵
908.645 × 10−63.165 × 10−3−1.907 × 10⁻²−4.036 × 10⁻⁵
Table 5. Maximum relative deviations of the calculated values of bending stresses for an insulated pipe from the values of stresses calculated for a pipe without insulation.
Scanning Sector Angle, °Maximum Relative Deviation of Stress Values According to Scanning and Photographic Data, δ, %
1802.247
1503.332
1204.396
9013.014
Disclaimer/Publisher’s Note: The statements, opinions and data contained in all publications are solely those of the individual author(s) and contributor(s) and not of MDPI and/or the editor(s). MDPI and/or the editor(s) disclaim responsibility for any injury to people or property resulting from any ideas, methods, instructions or products referred to in the content.