Article

Fitness-for-Service Analysis of the Interplay Between a Quarter-Circle Corner Crack and a Parallel Semi-Elliptical Surface Crack in a Semi-Infinite Solid Subjected to In-Plane Bending Part II—The Effect on the Semi-Elliptical Surface Crack

1
Pearlstone Center for Aeronautical Studies, Mechanical Engineering Department, Ben-Gurion University of the Negev, Beer-Sheva 84105, Israel
2
Department of Mechanical and Materials Engineering, Florida International University, Miami, FL 33162, USA
3
The Edward F. Cross School of Engineering, Walla Walla University, Walla Walla, WA 99324, USA
*
Author to whom correspondence should be addressed.
Appl. Sci. 2026, 16(3), 1240; https://doi.org/10.3390/app16031240
Submission received: 16 December 2025 / Revised: 22 January 2026 / Accepted: 22 January 2026 / Published: 26 January 2026
(This article belongs to the Special Issue Fatigue and Fracture Behavior of Engineering Materials)

Abstract

The impact of a quarter-circle corner crack on an adjacent parallel semi-elliptical surface crack (SESC) located in a semi-infinite solid subjected to in-plane bending is studied using a 3-D finite element analysis. The stress intensity factor (SIF) distributions along the front of the SESC are evaluated to determine said impact. The SESC’s semi-major axis ranged from a1 = 10 mm to 30 mm with ellipticities of b1/a1 varying from 0.1 to 1.0 for a constant quarter-circle corner crack length of a2 = 15 mm. Furthermore, several crack configurations are considered where the normalized vertical and horizontal gaps between the two cracks are taken to be H/a2 = 0.4 and 1.2 and S/a2 = −0.5 and 1.0, respectively. The results show that the effect of the quarter-circle corner crack on the SESC can be considerable both in amplifying and in attenuating the SIFs along the semi-elliptical surface crack front. Moreover, these opposite effects can occur simultaneously, but in different sections of the SESC’s crack front. The magnitude and pattern of these effects depend on the length and ellipticity of the SESC. It is further concluded that when considering the fitness-for-service of a critical real mechanical component, a complete 3-D analysis is needed to provide a reliable solution for such crack configurations.

1. Introduction

As this is the second part of the two-part paper, we direct the reader to Part I [1] to get a more in-depth explanation of the problem. Here, we provide a summary of that explanation. In cracked components under load adjacent cracks may affect each other. Each of the cracks may amplify or reduce the stress intensity factors (SIFs) along the other crack’s front. It may create both effects simultaneously along different sections of the front of the affected crack. When evaluating the SIFS of two close cracks in a structure, for the purpose of fitness-for-service [2,3,4,5,6], it is crucial to determine whether these cracks affect each other. That is to say, one must determine if the cracks need to be considered concurrently or whether they can be treated separately. In Part I of the paper [1], the effect of a semi-elliptical surface crack (SESC) on an adjacent quarter-circle corner crack (QCCC) was investigated, analyzing the effects of the geometries of the two cracks, their relative size and their corresponding layout.
The purpose of the present analysis is to evaluate the inverse problem, namely, the SIF behavior of the semi-elliptical surface crack due to the presence of the neighboring quarter-circle corner crack. The analysis will consider the characteristic parameters of this problem, i.e., the absolute and the relative size of the two cracks, the ellipticity of the SESC and the horizontal and vertical gaps between the cracks. Linear elastic fracture mechanics is applied in this analysis via the Finite Element Method (FEM) using the ANSYS (2024 R2) code [7].

2. The Three-Dimensional Analysis

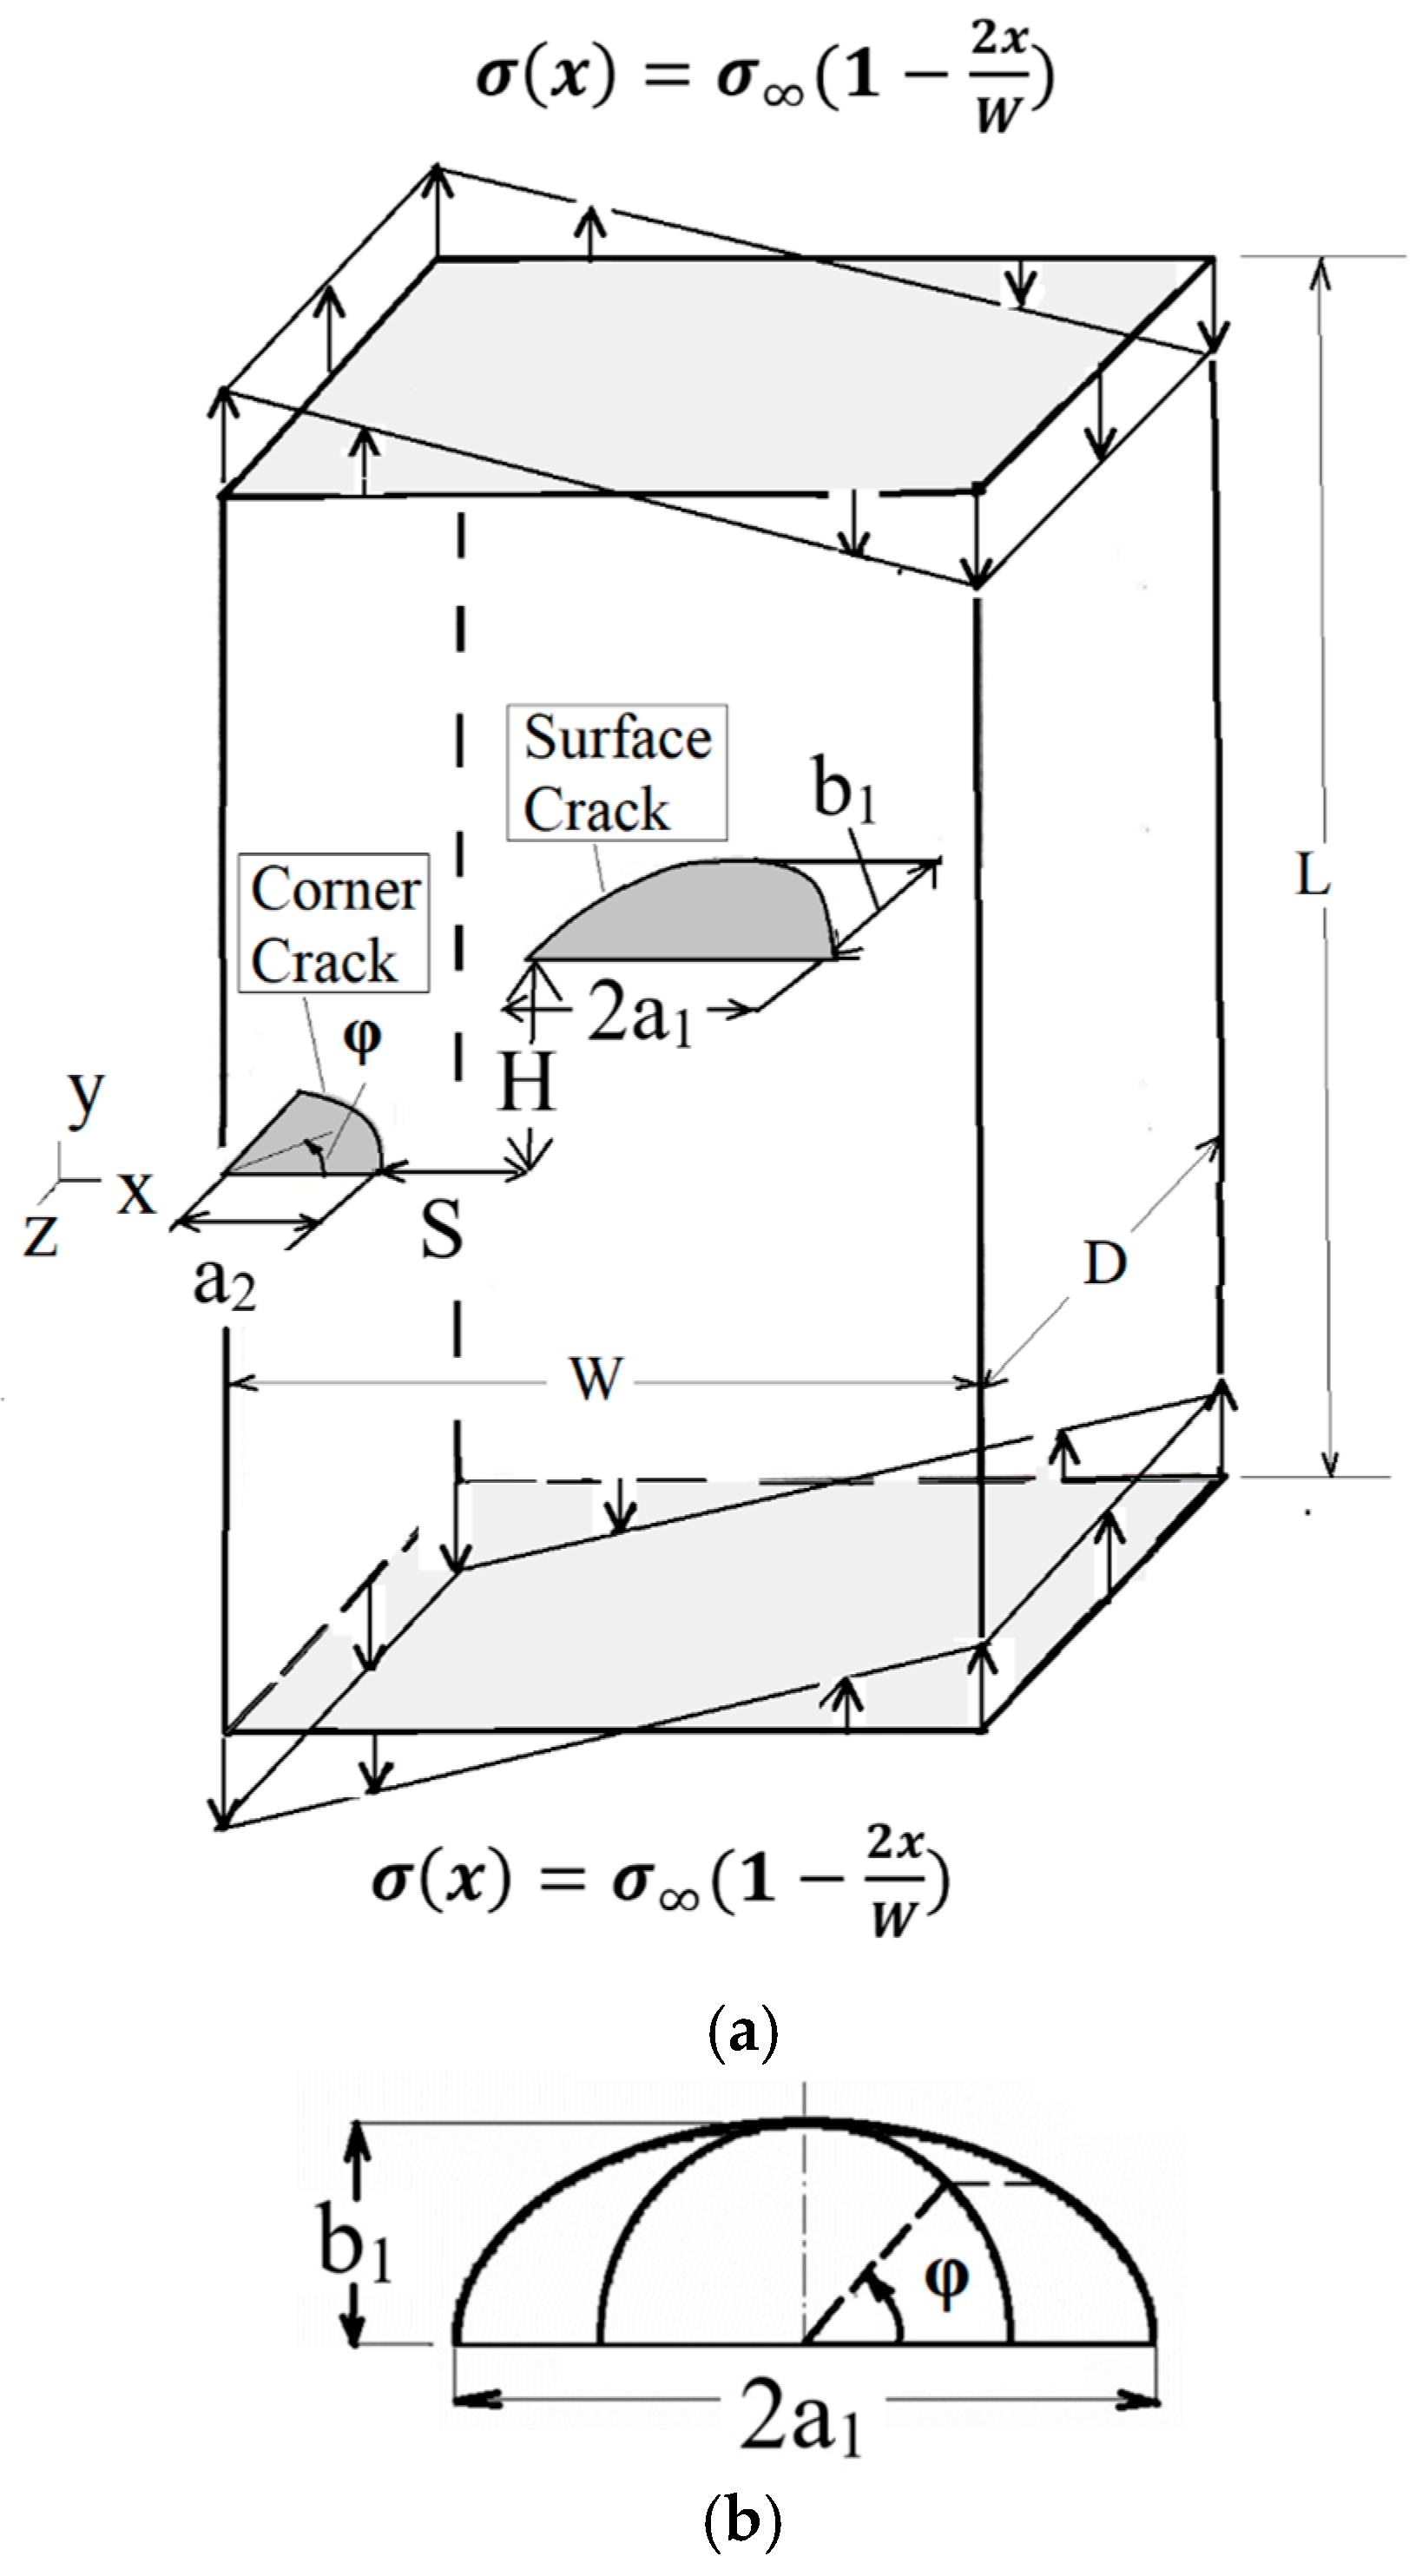
The model of the problem is identical to the one in Part I of the paper [1]. However, for the purpose of completeness, a brief description of the model is included. Figure 1a represents a semi-infinite solid with respect to the crack configuration. The length, height and depth of the solid are considered much larger than the horizontal span between the end points of the cracks, i.e., L, W, D >> a2 + S + 2a1. Furthermore, the solid is subjected to pure in-plane bending. A QCCC of radius a2 and a SESC of half-length a1 and depth b1 are located on parallel planes, both of which are perpendicular to the bending load. The horizontal gap between the cracks is S and the vertical gap is H.
Figure 1b represents the definition of the parametric angle φ used in defining the location of points on each of the crack’s fronts. The elastic solid is assumed to be made of steel with Young’s modulus E = 200 GPa and Poisson’s ratio υ = 0.3. The maximum applied load is taken as σ = 2 KPa. To avert end effects, the width of the solid (W) is defined as W = 50 × (a2 + S + 2a1) [6] and the solid’s depth, D, and height, L, are determined as D = W and L = 2W = 2D.

2.1. The Finite Element Model

In contrast to Part I of this paper [1], the ANSYS Workbench’s Fracture Tool—the built-in crack modeling tool of ANSYS [7]—is employed to facilitate the handling of the more complex semi-elliptical surface crack in the present finite element model. The ANSYS Workbench’s Fracture Tool automatically generates the crack front and enables a direct extraction of the relevant Stress Intensity Factors (SIFs). While trying to apply here the same methods of the FE model of Part I, the walls of the SESC kept collapsing onto each other, making it impossible to create a proper simulated crack. As the SESC was the main focus of Part II, we turned to the Fracture Tool method to solve the problem.
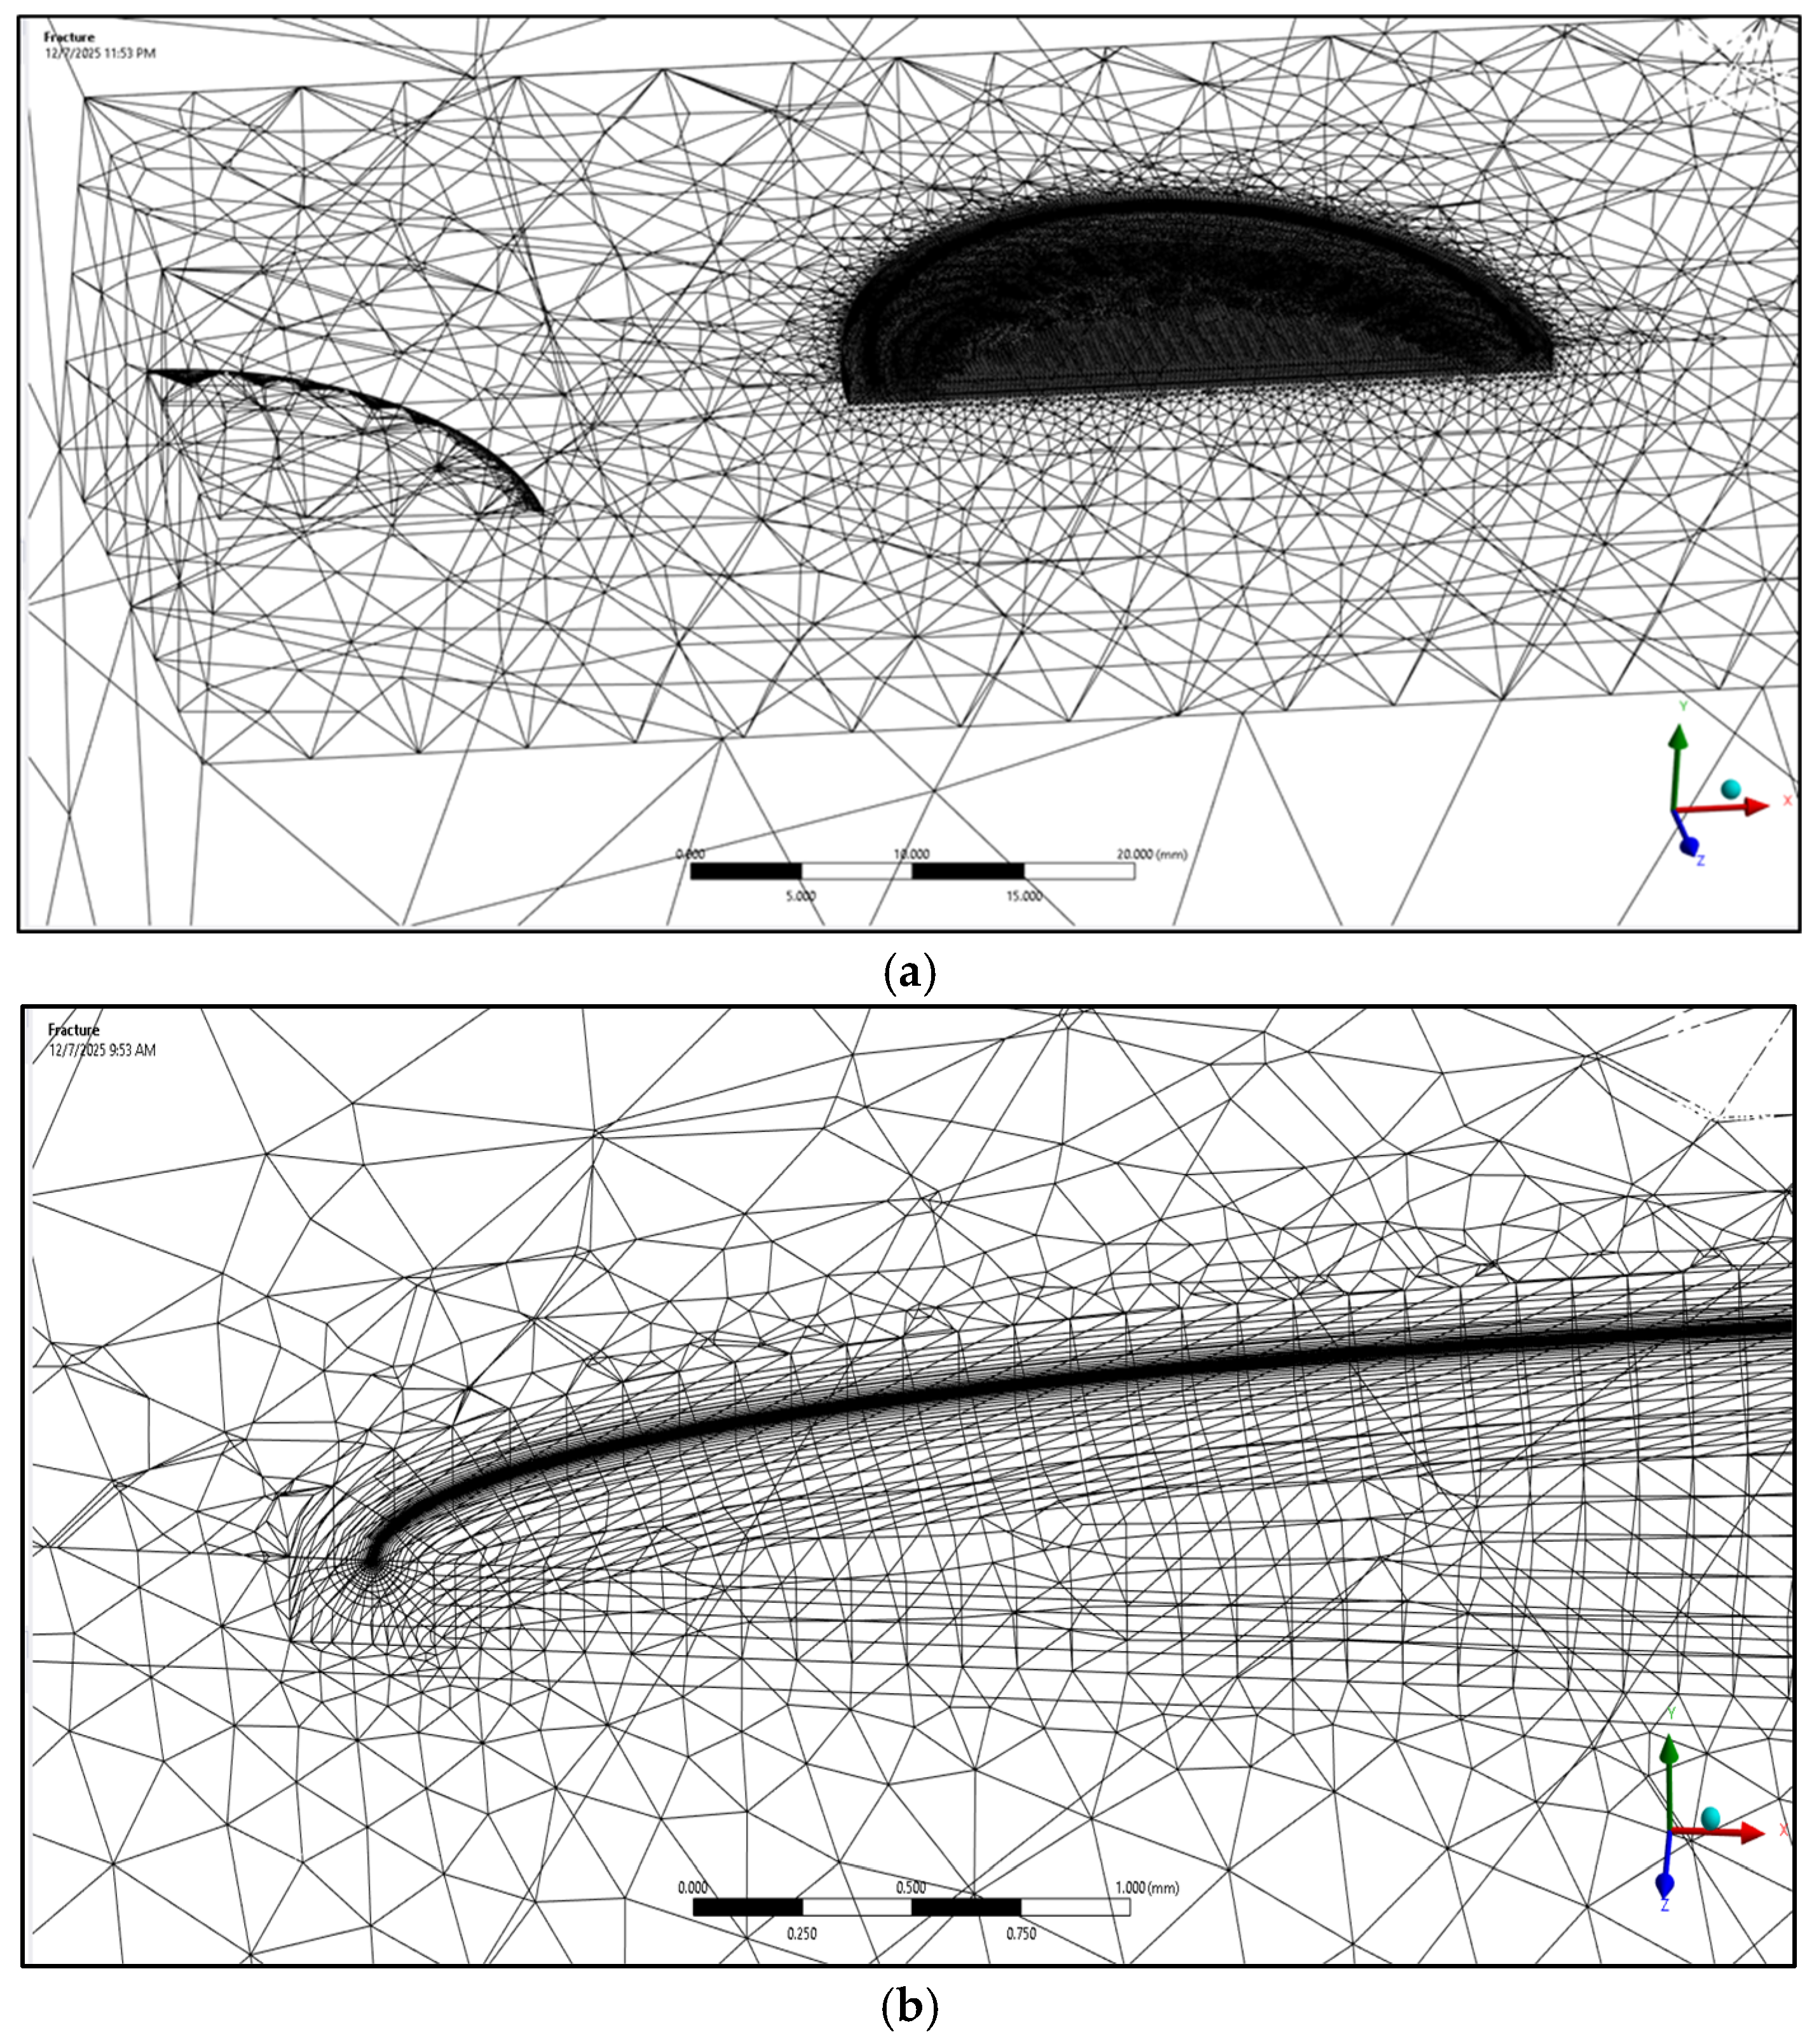
In order to accurately capture the stress singularity, the finite element model was partitioned into two regions (see Figure 2):
  • A small, rectangular block surrounding both the quarter-circle corner crack (QCCC) and the SESC; and
  • The remainder of the semi-infinite solid.
The rectangular block was meshed with a significantly refined tetrahedral mesh, while the outer region was meshed more coarsely to improve computational efficiency. This approach provided sufficient resolution at the crack front without requiring the manually constructed singular-element, collapsed wedges used in Part I [1].
The software offered two possible elements for providing the singularity at the front of the SESC: the quadratic tetrahedron (SOLID187) and the hexahedral element (SOLID186). Both types of elements were investigated in this study and both converged well within the tolerance of convergence. However, it was found that SOLID186 allowed for a better structured mesh along the crack front and provided for better computational efficiency. Away from the crack front, the rest of the semi-infinite solid was meshed with a quadratic tetrahedron (SOLID187) with a much finer mesh within the small rectangular block.
The ANSYS Workbench’s Fracture Tool enabled the evaluation of the relevant SIF values as a function of the crack front arc length, AL, at discrete points along the crack front, measured from φ = 0° at the crack’s right end towards φ = 180° at the crack’s left end. As these values were not reported as a function of the parametric angle φ, a post-processing routine was developed to map the Fracture Tool’s output onto the parametric angle φ.
The arc length was calculated as a function of the angle measured from the right end of the SESC:
A L ( φ ) = o φ [ 1 m   s i n 2 φ ] d φ
where m = 1 − (a1/b1)2. In the preceding definitions, a1 and b1 are the ellipse’s semi-major and semi-minor axes, respectively. Since the SIFs were determined at discrete points of the arc length, an interpolation formula was created to calculate the SIFs at the needed values of φ. Thus, the preceding formula allowed the SIF distribution to be plotted and compared consistently with the authors’ previous work.
To provide accurate and reliable results using the ANSYS Workbench’s Fracture Tool, convergence tests were performed using the SIF as the convergence criterion. It is important to note that the results converge at different rates along the crack front. Convergence was relatively faster in the center of the SESC, φ = 90°, slowing down as one approached the crack tips, φ = 0° and φ = 180°. Meshes having more than 3 million degrees of freedom (DOF), with about half of the total DOFs being assigned to the embedded block, are anticipated to have a level of error within less than 3%, as in [6].

2.2. Parameters Used in This Study

In this study, the size of the QCCC is kept fixed at a2 = 15 mm. Its effect on the SESC depends on the following four parameters: the relative size of the two cracks, a1/a2; the SESC ellipticity, b1/a1; and the normalized horizontal and vertical gaps between the two cracks, S/a2 and H/a2, respectively. Thus, in the following analysis, solutions are obtained for the SESC sizes of a2 = 10, 15 and 30 mm, resulting in a relative crack size range of a1/a2 = 2/3, 1 and 2, respectively. Also assessed were four SESC ellipticities, b1/a1 = 0.1, 0.2, 0.5 and 1.0 as well as two horizontal and two vertical separation distances, i.e., S/a2 = −0.5 and 1.0 and H/a2 = 0.4 and 1.2, respectively.
As in Part I of the paper, all the SIFs are normalized to the 3-D SIF for the QCCC, namely the following:
K 0 = 2 π   σ π a 2
where σ is the maximum applied bending stress. This is the exact SIF for a penny-shaped crack [8].

3. Results and Discussion

3.1. The Solitary Semi-Elliptical Surface Cracks

In order to quantify the QCCC effect on the SESC, the SIF distribution along the SESC with the QCCC present will be compared to its distribution along an identical solitary SESC. It is necessary, therefore, to first evaluate the SIF’s distribution along the crack front of the solitary SESC; this will serve as the reference solution.
The SIF distribution along the front of an SESC in a solid under in-plane bending depends on the crack’s horizontal position with respect to the distributed loading, as well as on its particular size. In the analysis to follow, six representative SESC geometrical configurations are considered, and thus, solutions for six different solitary cases are evaluated: A. a1 = 15 mm and S/a2 = −0.5; B. a1 = 15 mm and S/a2 = 1.0; C. a1 = 30 mm and S/a2 = −0.5; D. a1 = 30 mm and S/a2 = 1.0; E. a1 = 10 mm and S/a2 = −0.5; and F. a1 = 10 mm and S/a2 = 1.0. From previous studies by the authors and other investigators, these values/choices for a1 and S/a2 have produced representative results for close cracks in the horizontal direction as well as representative results for crack size effects, e.g., see [9,10].
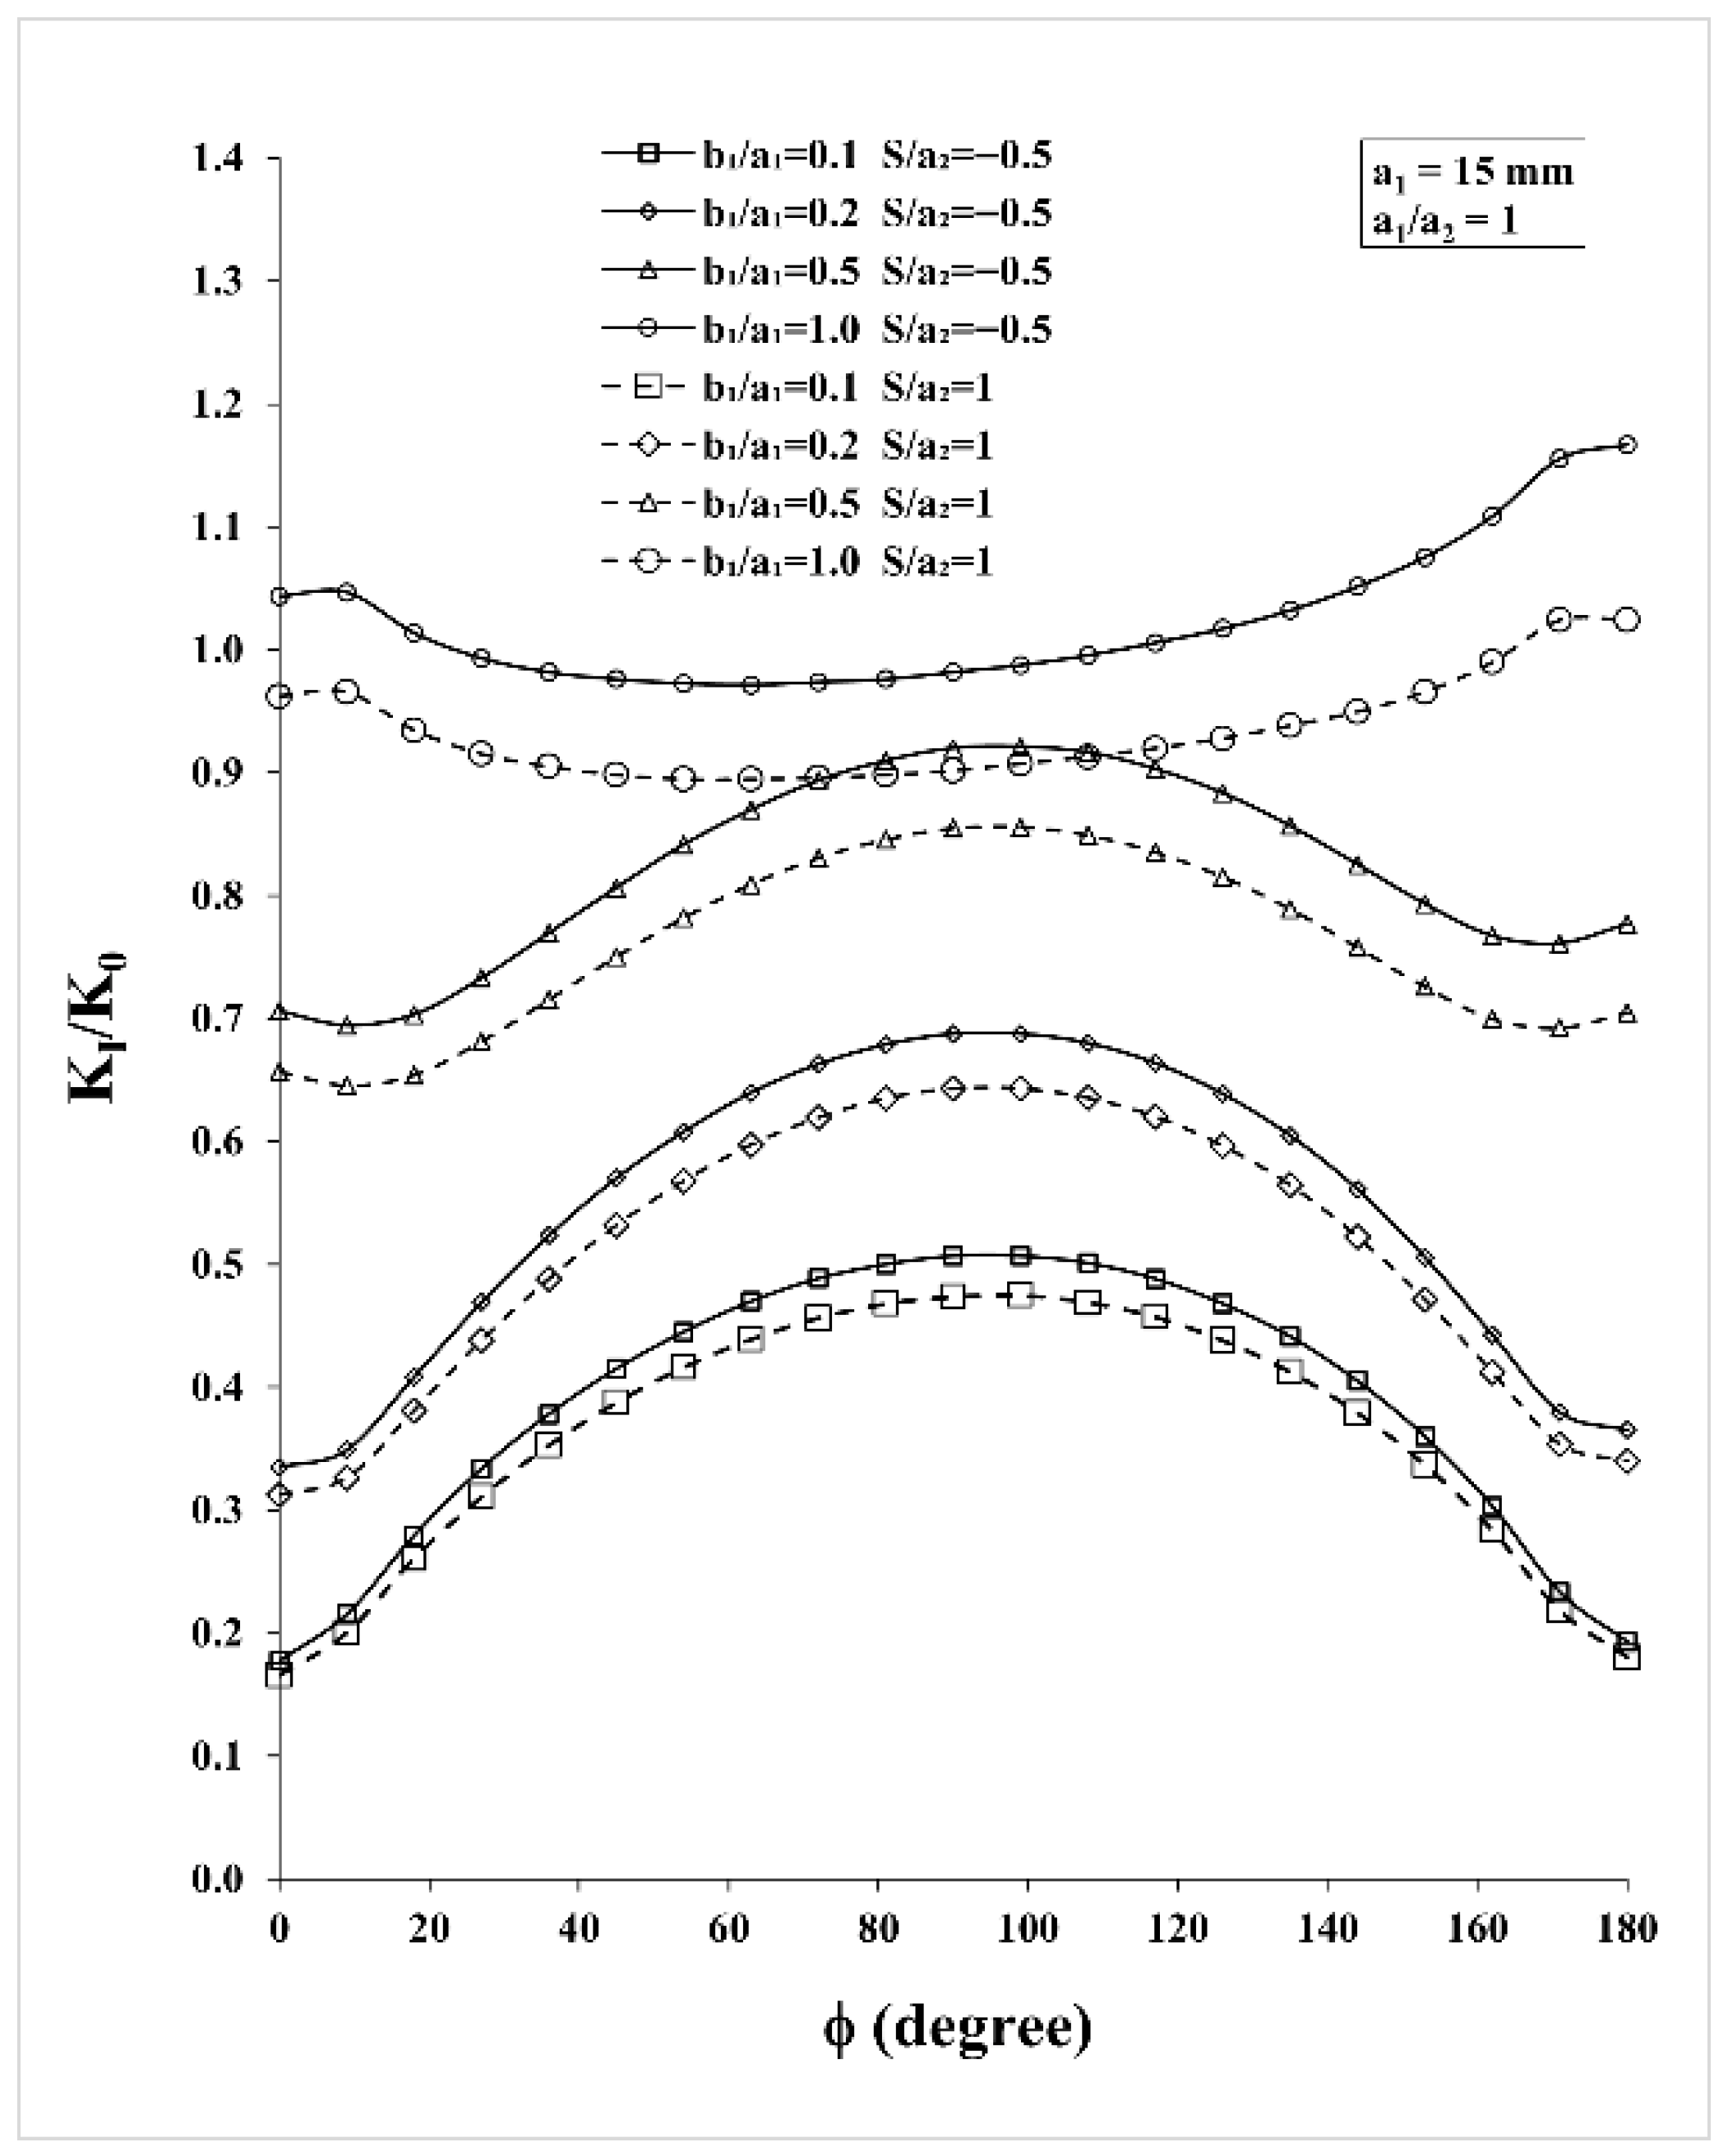
Figure 3 represents the results of cases A and B, i.e., the SIF distribution along the front of a solitary SESC of size a1 = 15 mm in a semi-infinite solid subjected to in-plane bending. The SESC is located at two different horizontal positions, S/a2 = −0.5 (solid lines) and S/a2 = 1.0 (dashed lines).
The following conclusions can be drawn from this figure:
  • All the curves in Figure 3 are non-symmetric with respect to the SESC (φ = 0°) due to the following two effects:
    • The remote bending stress magnitude is higher above the left end of the SESC (φ = 180°) than over its right end (φ = 0°); and
    • The left end of the SESC is closer to the edge of the solid than the right end, and it is more influenced by the free edge effect.
  • As could have been expected, the SIF distribution pattern for the semi-circular crack cases, b1/a1 = 1.0, is concave with its maximum at the ends φ = 0° and 180°. For the shallower crack configurations, b1/a1 = 0.1, 0.2 and 0.5, the curves are convex with a maximum at around φ ≈ 90°. Both patterns are typical of a semi-elliptical surface crack [8].
  • A third trend not related to symmetry can also be seen. As the ellipticity of the SESC increases, the separation between the two curves for cases A and B increases.
  • The SIF distribution depends on the horizontal location of the SESC. The larger S/a2, the more distant the crack is from the left edge of the solid and the lower the SIFs magnitudes. The larger the ellipticity of the SESC, the larger the influence of the horizontal location. For example, for b1/a1 = 1.0, the results are ~8.8% lower for S/a2 = 1.0 than for S/a2 = −0.5. Yet for b1/a1 = 0.1, the difference is only ~6.5%. Furthermore, for any given ellipticity, the SIF curves for S/a2 = 1.0 and S/a2 = −0.5 along the entire crack front are essentially proportional, i.e., the ratio between the corresponding curves for b1/a1 = 0.1, 0.2, 0.5 and 1.0 are 0.935, 0.933, 0.0924 and 0.912, respectively.
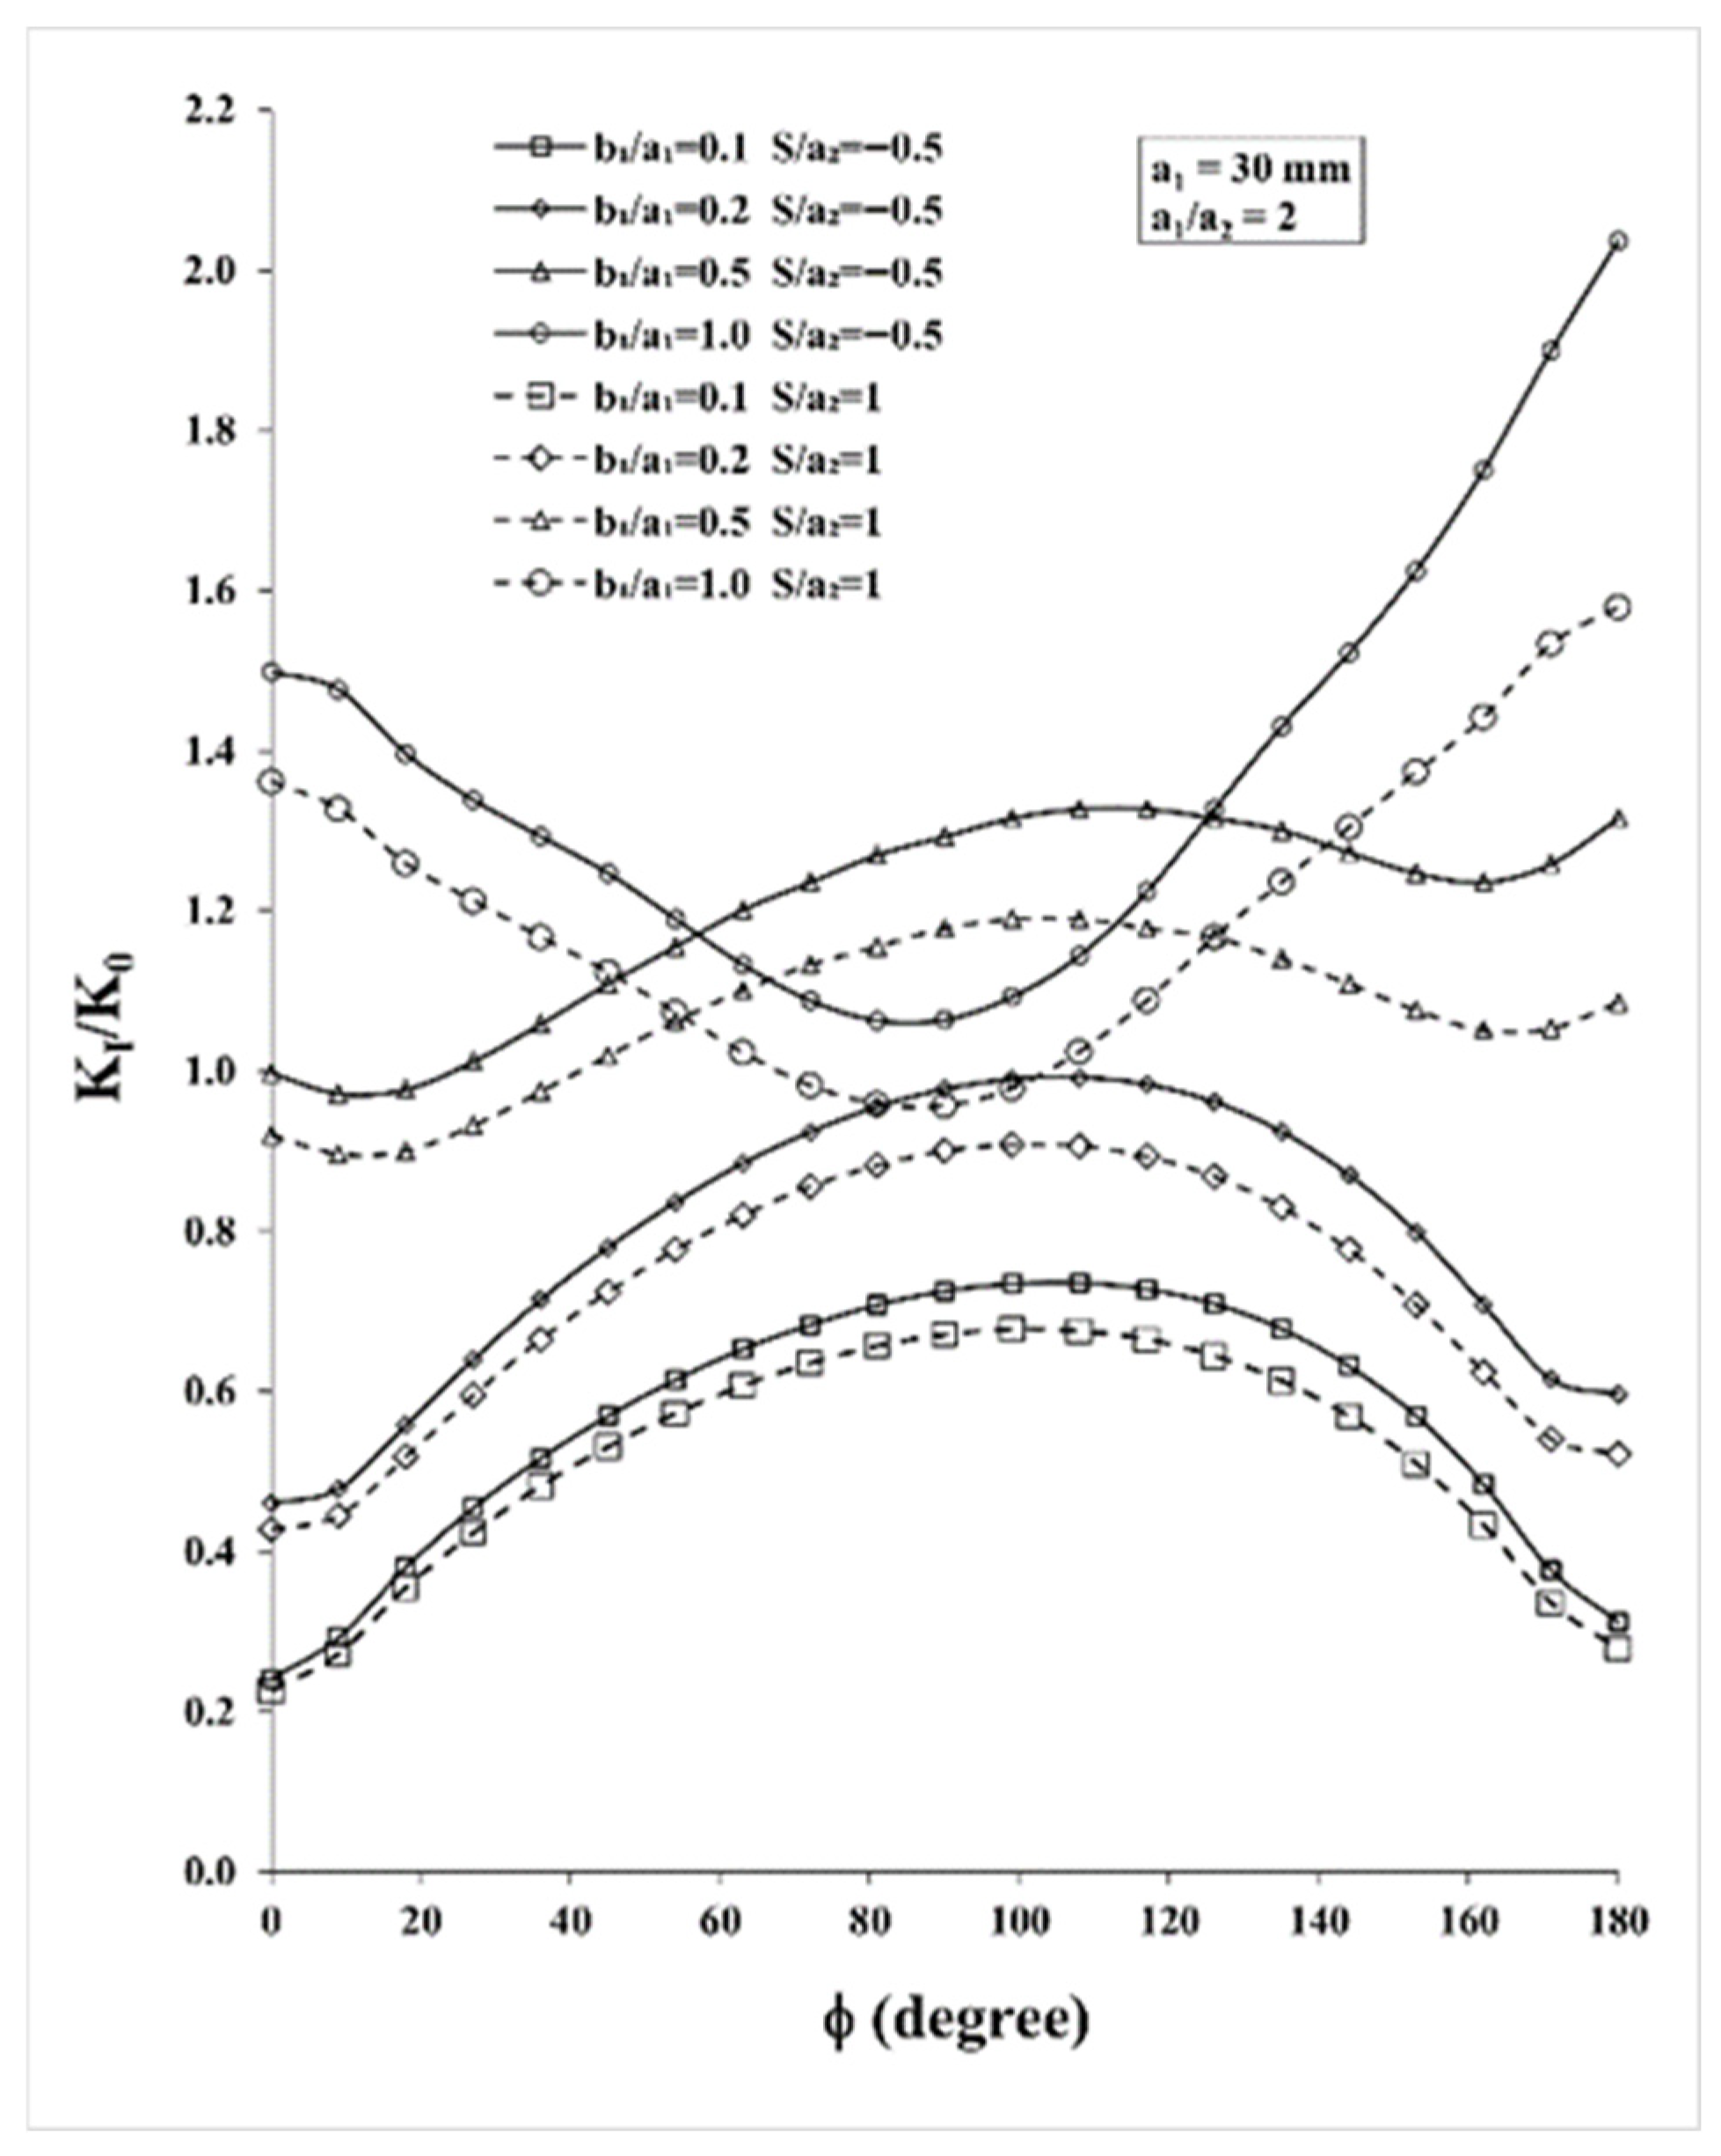
Figure 4 provides the data for cases C and D, i.e., the SIF distribution along the front of a longer solitary semi-elliptical surface crack of half-length, a1 = 30 mm, in a semi-infinite solid subjected to in-plane bending. The SESC here is located at two different horizontal positions, S/a2 = −0.5 (solid lines) and S/a2 = 1.0 (dashed lines).
The results in Figure 4 for the longer SESC are similar in pattern to those in Figure 3 for the SESC of a1 = 15 mm but are considerably different in magnitude and shape. This is an outcome of the larger crack size of the present case and the greater distance from the left free surface. While the SIF maxima for all SESC ellipticities occur at the same locations on the crack front as in Figure 3, their values in the present case are much higher for the two S/a2 values. For example, for S/a2 = −0.5, the maximal SIFs for the four ellipticities, b1/a1 = 0.1, 0.2, 0.5 and 1.0 in Figure 4 are ( K I / K 0 ) m a x ≈ 0.74, 0.99, 1.32 and 2.04, while in Figure 3, the respective maxima are ( K I / K 0 ) m a x ≈ 0.51, 0.69, 0.91 and 1.17. Similarly, for S/a2 = 1.0 in Figure 4, the SIF maxima are ( K I / K 0 ) m a x ≈ 0.68, 0.91, 1.19 and 1.58, while in Figure 3 the respective maxima are ( K I / K 0 ) m a x ≈ 0.47, 0.64, 0.86 and 1.02.
A more in-depth evaluation of Figure 4 indicates that the graphs are skewed to φ = 180°. It is noted that the separation between the S/a2 = 1.0 and the S/a2 = −0.5 is larger beyond φ = 90°, i.e., as one approaches the right tip of the QCCC. The results in the vicinity of φ = 0° are almost the same in almost all the cases because the crack tip of the SESC is the farthest from the QCCC and the free edge. Furthermore, the b1/a1 = 1.0 graphs show a larger dip here compared to the same graphs in Figure 3.
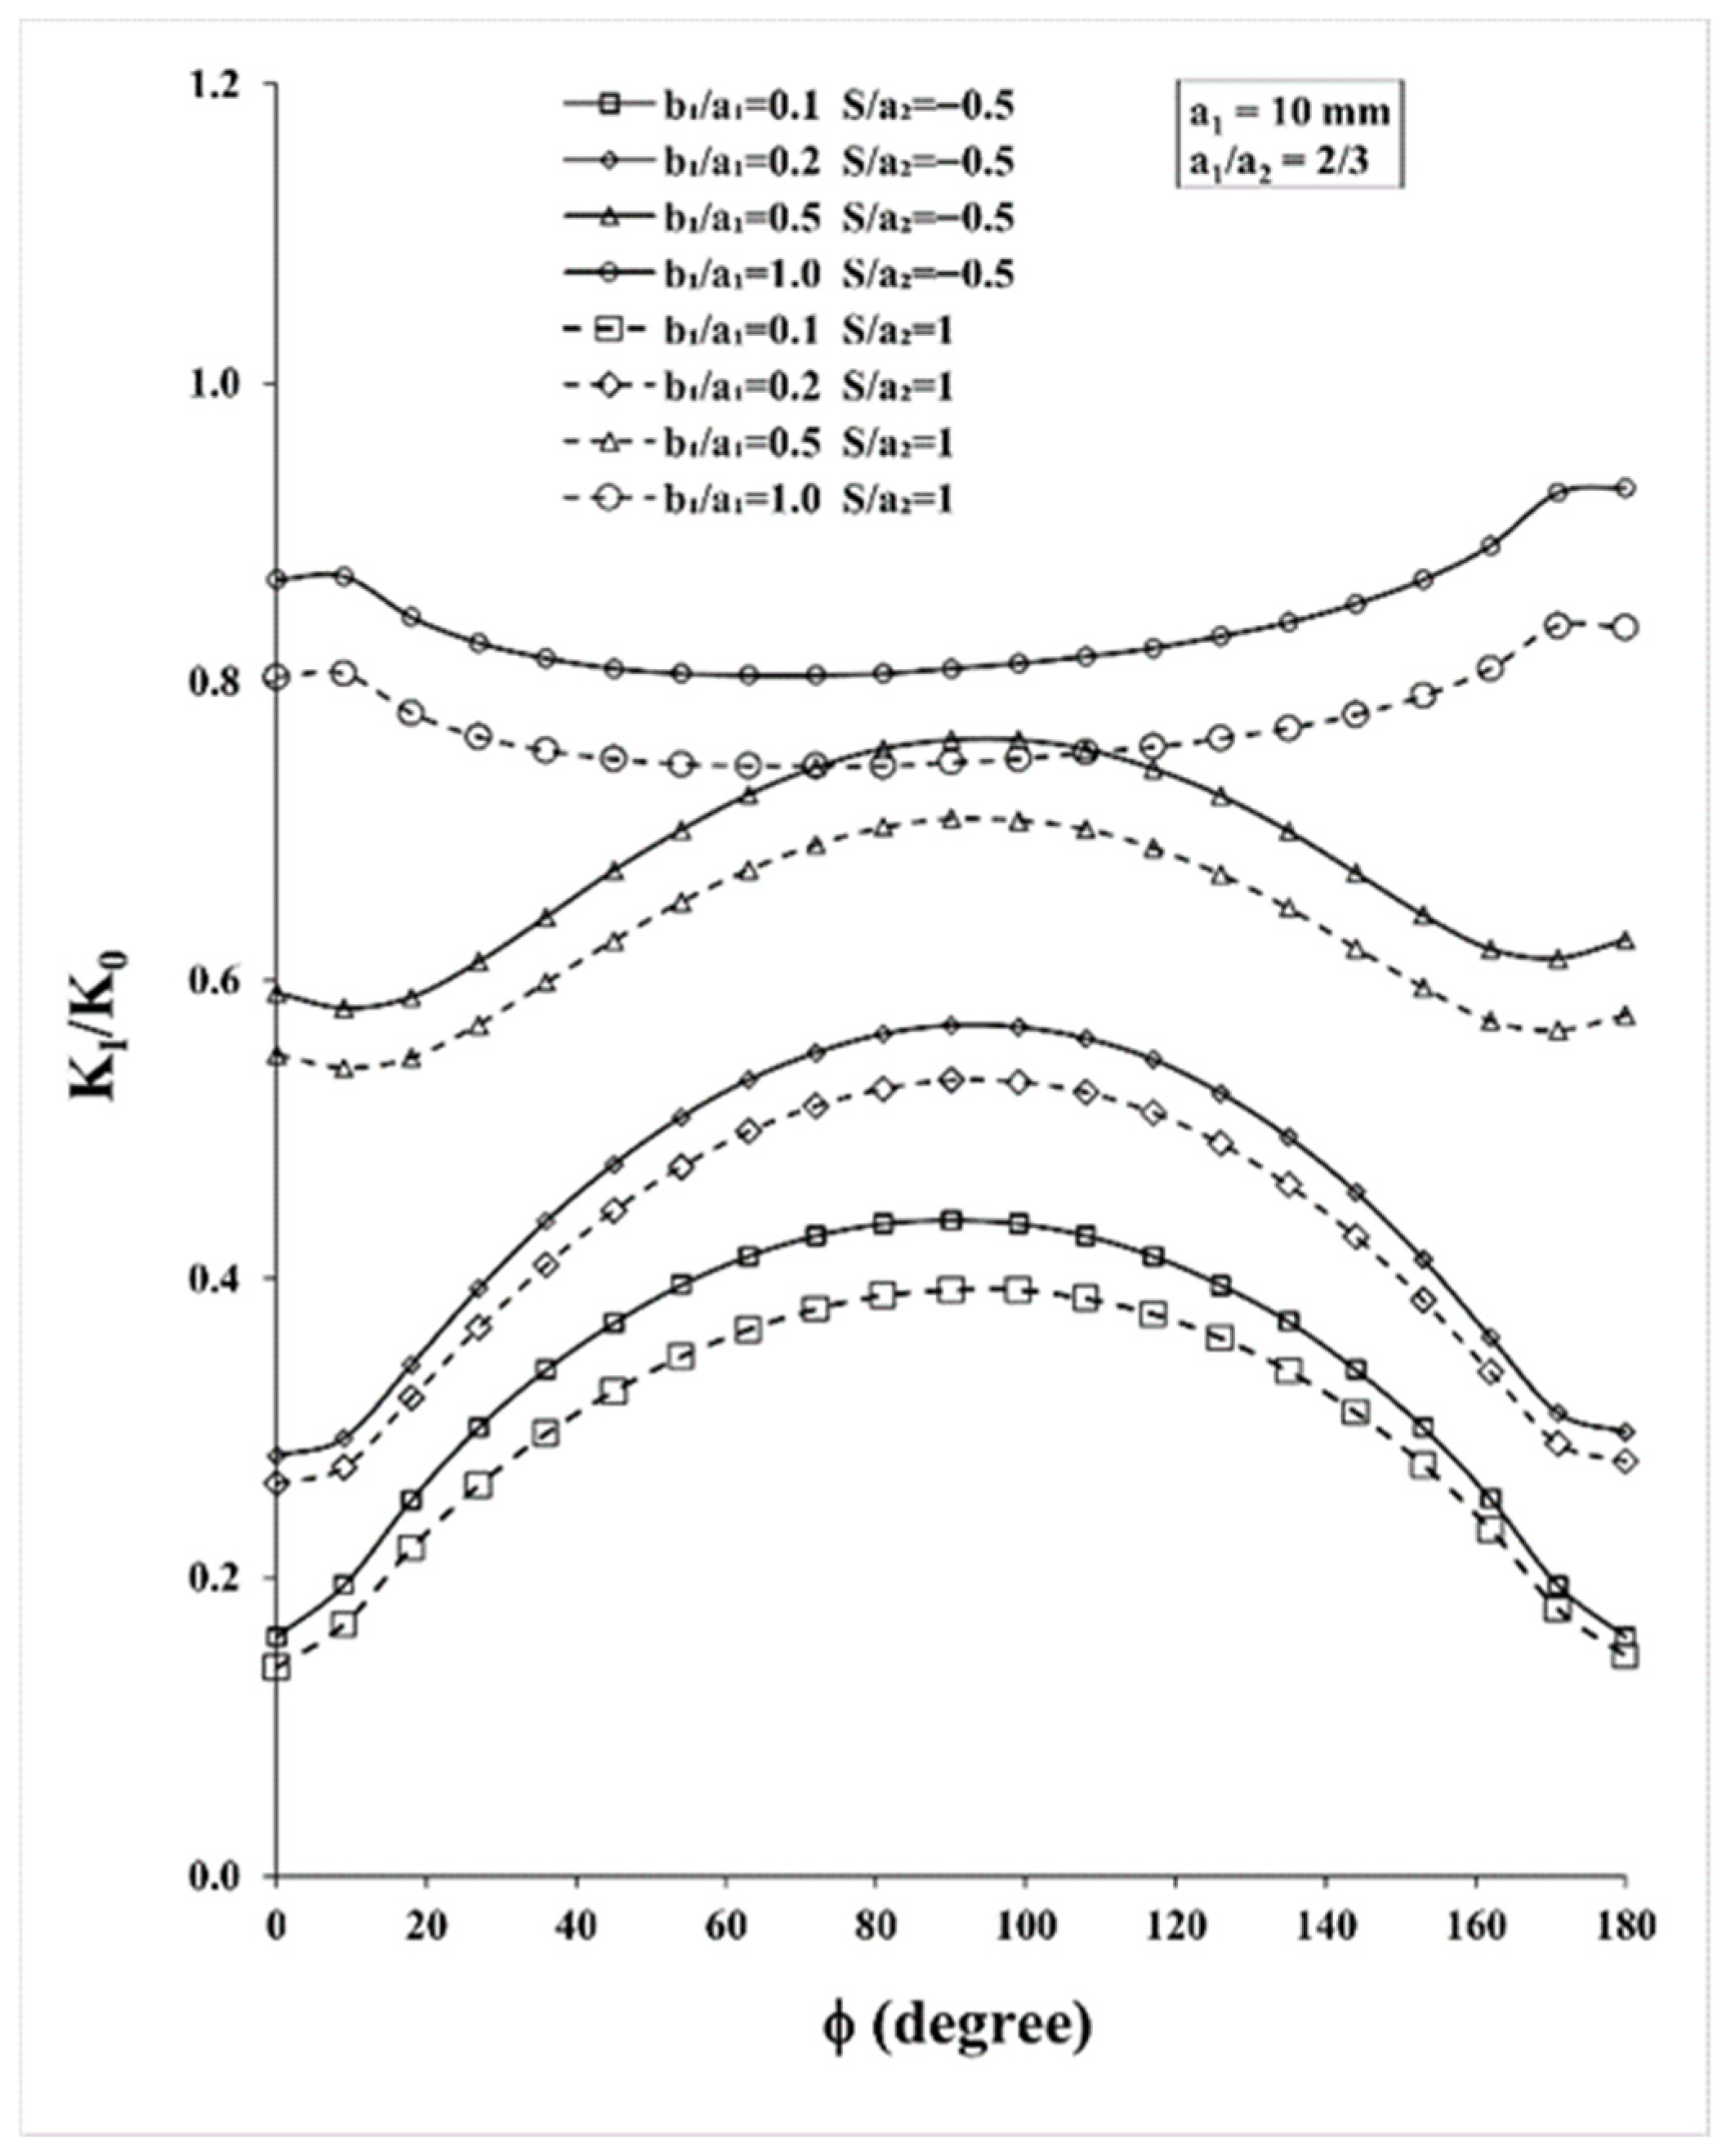
Figure 5 shows the SIF distribution along the crack front for cases E and F, for the shorter solitary semi-elliptical surface crack of half-length a1 = 10 mm in a semi-infinite solid subjected to in-plane bending. Here, the SESC is located at two different horizontal positions, namely, S/a2 = −0.5 (solid lines) and S/a2 = 1.0 (dashed lines).
The results in Figure 5 bear the same pattern as those in Figure 3 for SESC of lengths a1 = 15 mm, but are of a lower magnitude because the present crack is shorter. In this case the maxima for S/a2 = −0.5 for the four ellipticities, b1/a1 = 0.1, 0.2, 0.5 and 1.0 are ( K I / K 0 ) m a x ≈ 0.44, 0.57, 0.76 and 0.93, respectively, which are about 14–20% lower than those in Figure 3. For S/a2 = 1.0, the maxima are ( K I / K 0 ) m a x ≈ 0.39, 0.53, 0.71 and 0.84, respectively, which are about 17–18% lower than those in Figure 3.
Presently, though there may be instances in the literature dealing with multiple cracks, e.g., [11,12,13,14], to the best of the authors’ knowledge, there are no available solutions for a semi-elliptical surface crack under distributed tensile stress resulting from in-plane bending loading. Thus, in order to validate our FE model, we applied the model to the solution of a semi-elliptical surface crack centrally located in an infinite solid subjected to pure tension. For such a problem there are ample solutions [8]. Since the variation in applied stress at the location of the cracks is slow, such a solution is considered to be an acceptable comparison for this problem.
Thus, the SIF distributions along the crack fronts of four SESC configurations with the aforementioned ellipticities were evaluated using our FE model, and the results were compared to [8]. The FE results were found to be in very good agreement with those of [8] for all crack aspect ratios, with a maximum error of less than ~5%, occurring in the vicinity of the crack’s ends, φ = 0° or 180°, and with an average error of about ~1% over the entire crack fronts.

3.2. Effect of Quarter-Circle Corner Crack on Semi-Elliptical Surface Crack for Similar Crack Sizes

In this section, the effect of the QCCC on the SESC is analyzed for several cases of similar crack sizes, a1 = a2 = 15 mm, for four SESC ellipticities previously employed and for several normalized crack gaps, H/a2 and S/a2.

3.2.1. Case I—Horizontally Overlapping and Vertically Close Cracks

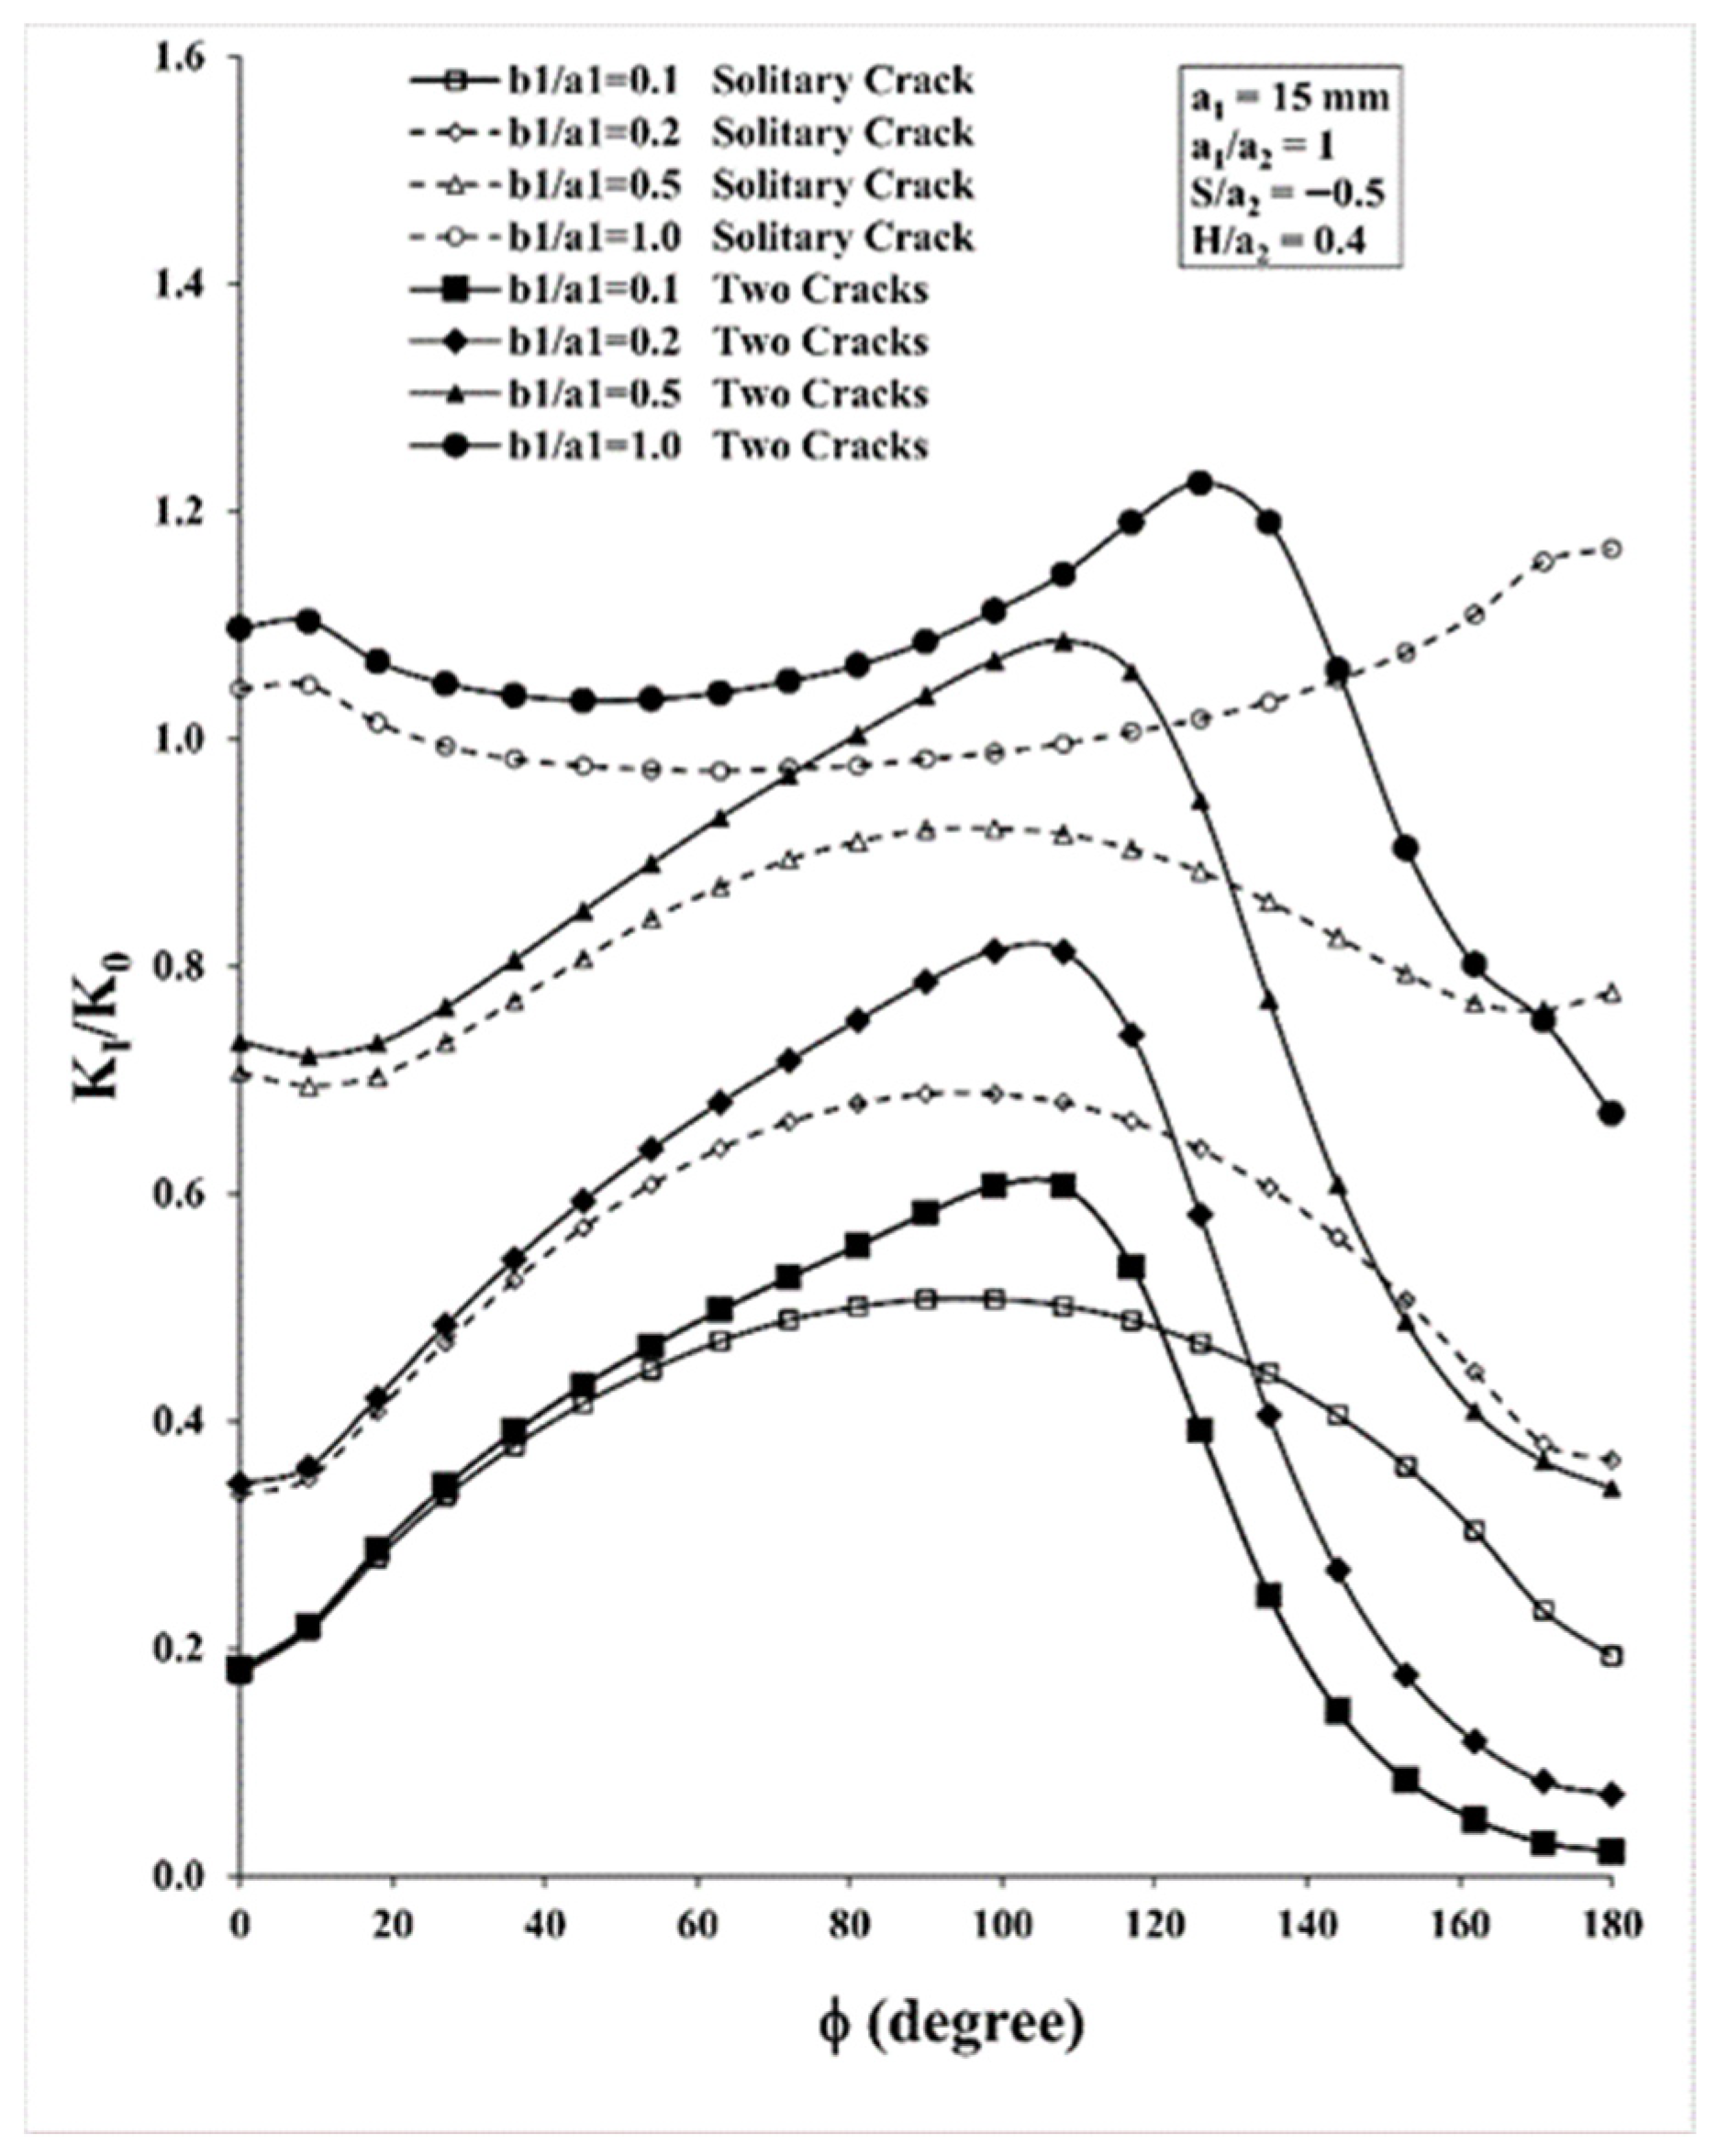
In case I the horizontal gap is taken to be S/a2 = −0.5, thus the SESC and the QCCC are partially overlapping. Cracks are considered overlapped if S/a2 < 0. Figure 6 represents the normalized SIF distribution along the front of the semi-elliptical surface crack in the presence of the quarter-circle corner rack. The results are for the four different ellipticities of the SESC, b1/a1 = 0.1–1.0, and for a small vertical gap of H/a2 = 0.4. Included for comparison are the four solitary configurations of the same SESC.
Figure 6 clearly shows that the presence of the QCCC has a considerable effect on the SESC as it amplifies the SIF along part of the SESC front, while along the rest of the front there is attenuation. The magnitude of the amplification/attenuation and the part of the crack’s front along which it occurs depend on the SESC ellipticity. The curves follow the form of the solitary crack initially before deviating with increasing φ. This occurs since φ = 0° is the SESC tip farthest from the QCCC and least affected by it. As φ increases, the SESC front approaches the QCCC and is most affected by it.
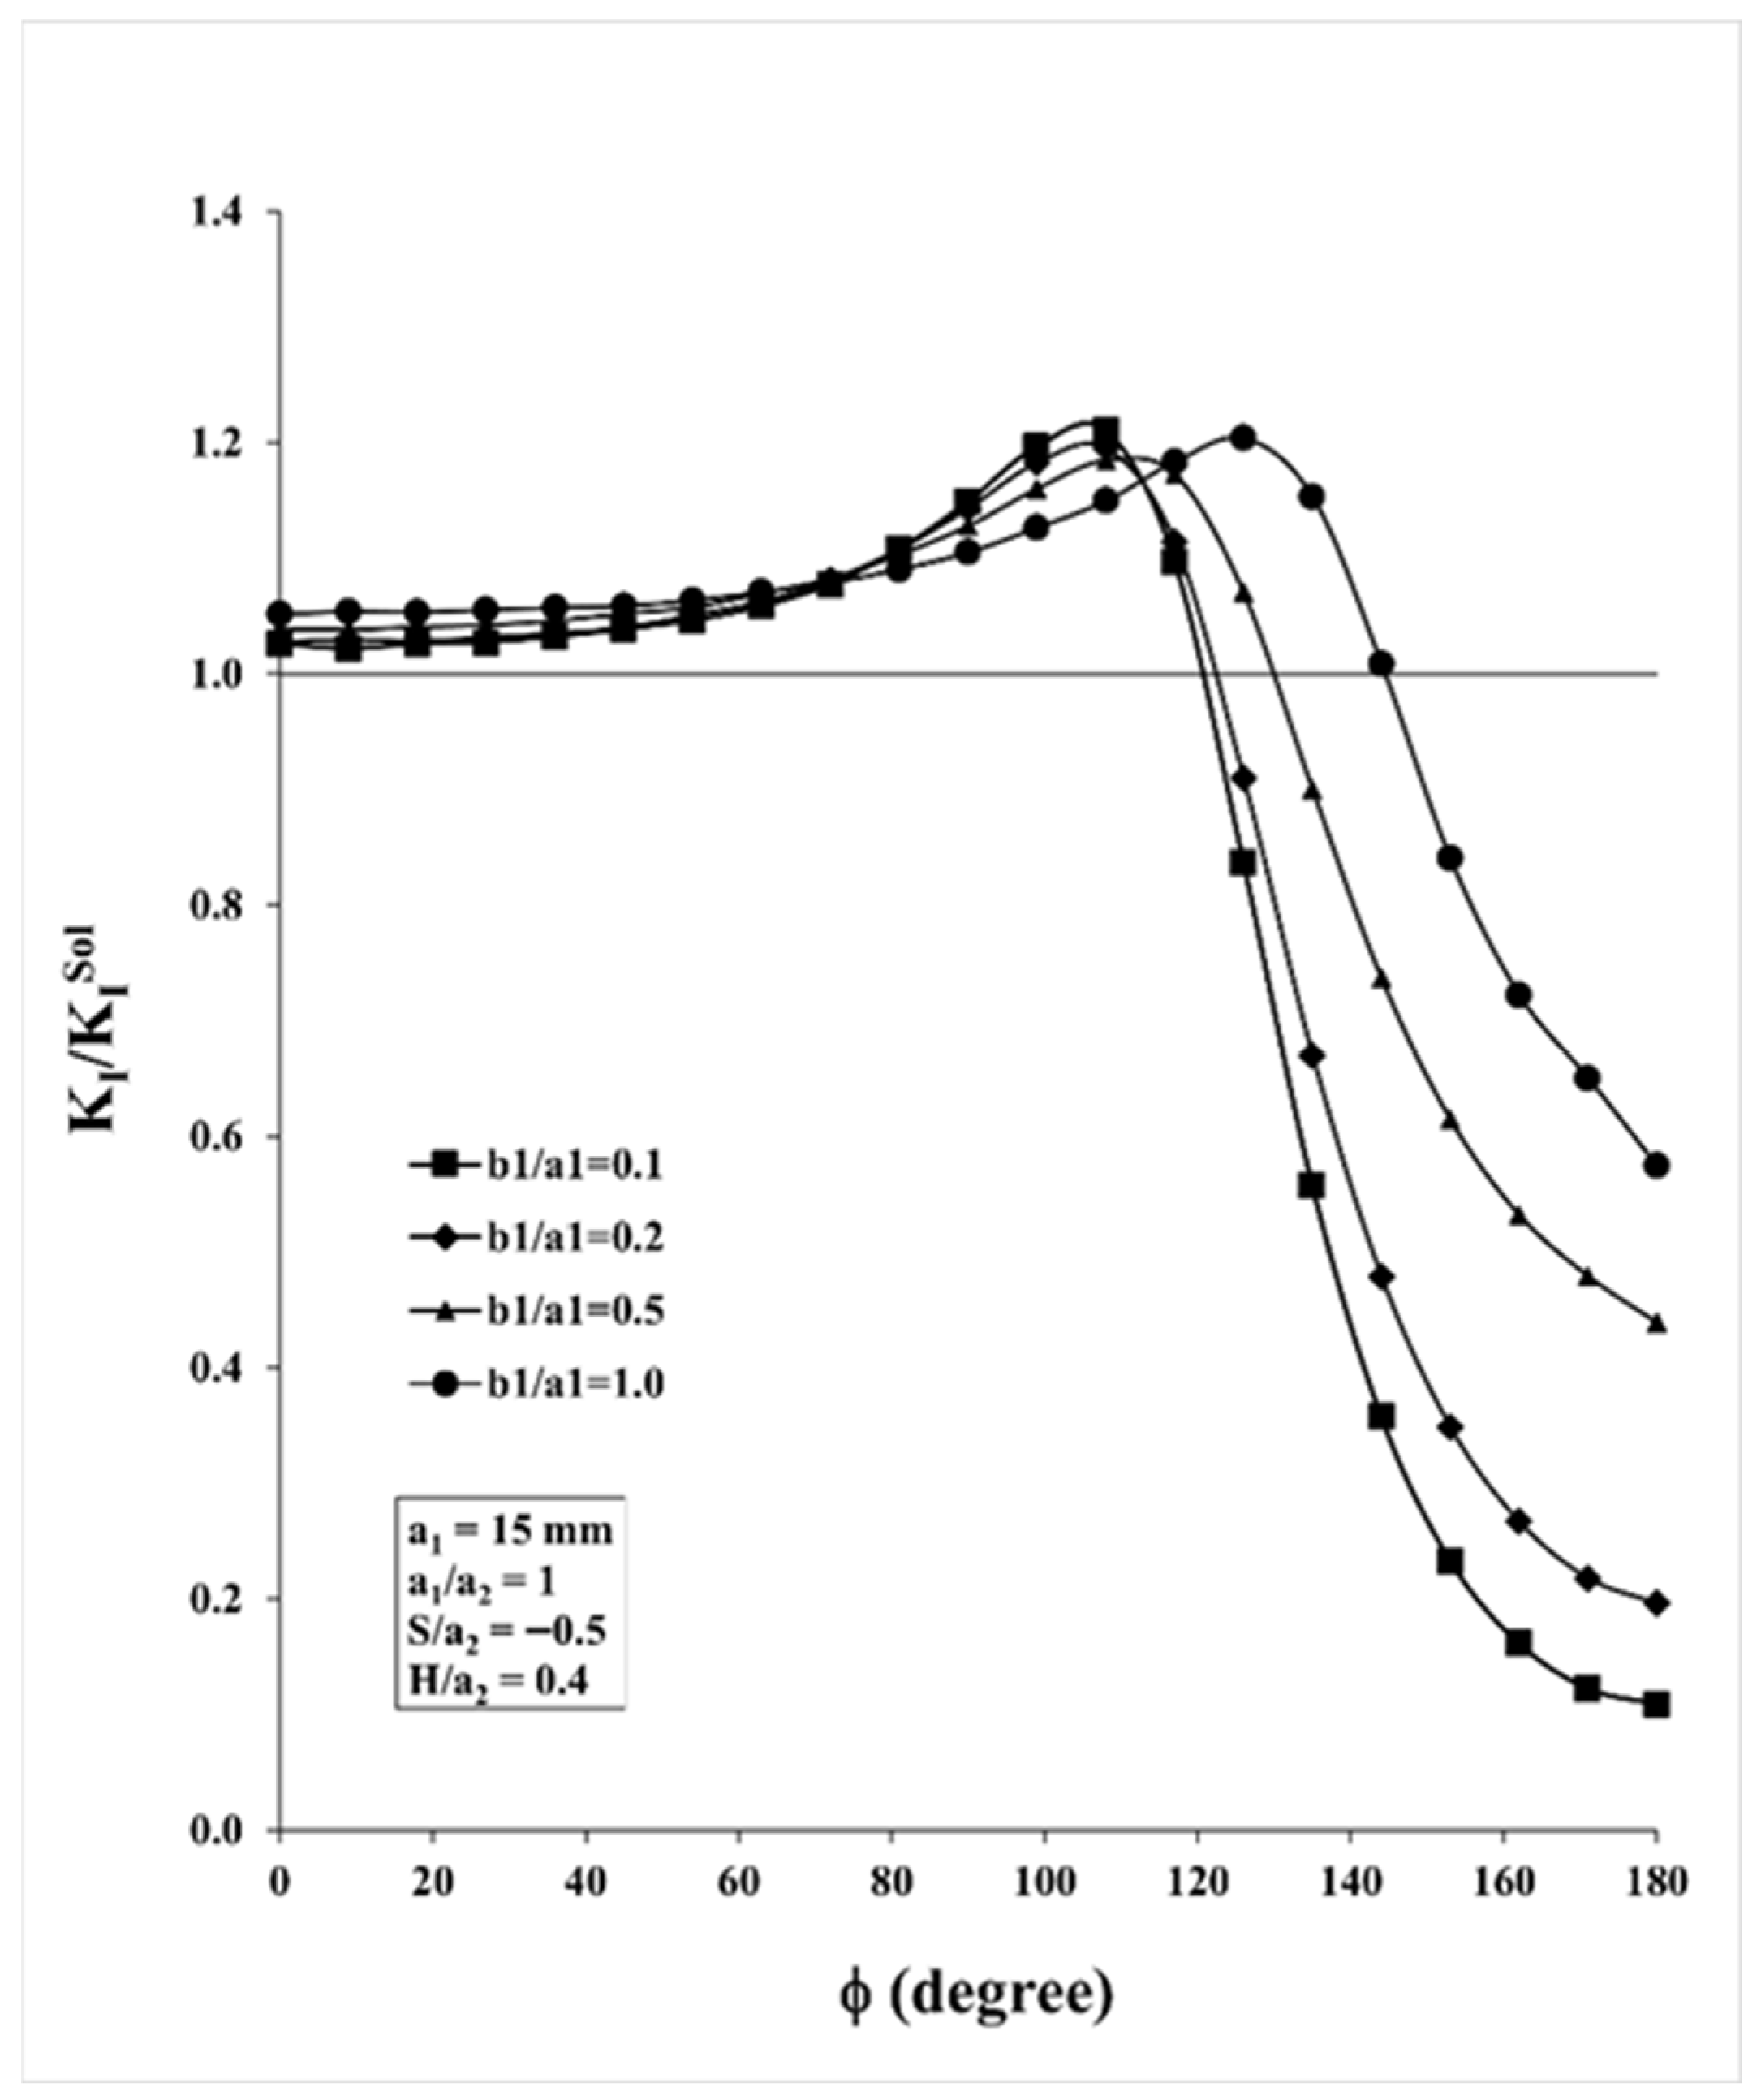
The effect of the QCCC on the SIF distribution along the front of the SESC is similar in nature for all the SESCs’ ellipticities. However, the magnitude and the size of the amplification/attenuation zones depend on the particular ellipticity of the SESC. In order to quantitatively evaluate these effects, the distributions of the SIF along the front of each of the four SESCs are re-normalized to their corresponding solitary SIF distribution configurations. The ratio, K I / K I S o l , for the four SESCs’ ellipticities are presented in Figure 7.
The following conclusions can be drawn from Figure 7:
  • In all four cases, due to the proximity of the two cracks, the SIF is amplified along more than half of the right side of the SESC, φ [0, >90°]. Along the rest of its front, φ [>90°, 180°], the SIF is attenuated due to the shielding effect of the QCCC on the SESC resulting from their overlap [15]. The “shielding effect” occurs when an adjacent crack attenuates the SIF at the tip of the other crack.
  • The pattern of the K I / K I S o l curve in the amplification zone is similar for all cases. At φ = 0°, the most distant point on the SESC front from the QCCC, the amplification is relatively small. The normalized SIF varies between K I / K I S o l = 1.026 for b1/a1 = 0.1 increasing monotonically to K I / K I S o l = 1.051 as ellipticity increases to b1/a1 = 1.0.
  • As φ further increases K I / K I S o l increases until it reaches its maximum of about K I / K I S o l ≈ 1.2 at around φ ≈ 108° for b1/a1 < 1.0 and at φ ≈ 126° for b1/a1 = 1.0. Then the curves decrease until the K I / K I S o l < 1.0 converting to an attenuation effect.
  • As previously noted, the attenuation of the SIF along part of the SESC is a result of the shielding effect induced by the presence of the QCCC. The magnitude of attenuation and the size of the affected zone along the SESC front depend on the SESC ellipticity. The smaller the ellipticity, the higher the attenuation and the larger the zone it affects. In the case of the shallowest SESC, b1/a1 = 0.1, ( K I / K I S o l )min = 0.11 and the size of its attenuation zone is φ = 122° to 180°. For the semi-circular crack case, b1/a1 = 1.0, ( K I / K I S o l )min = 0.57 and the size of its attenuation zone is somewhat smaller φ = 145° to 180°. For the intermediate cases, b1/a1 = 0.2 and 0.5, ( K I K I S o l )min = 0.19 and 0.44, respectively, and their corresponding attenuation zones are, in turn, φ = 122° to 180° and φ = 132° to 180°.

3.2.2. Case II—Horizontally Non-Overlapping and Vertically Close Cracks

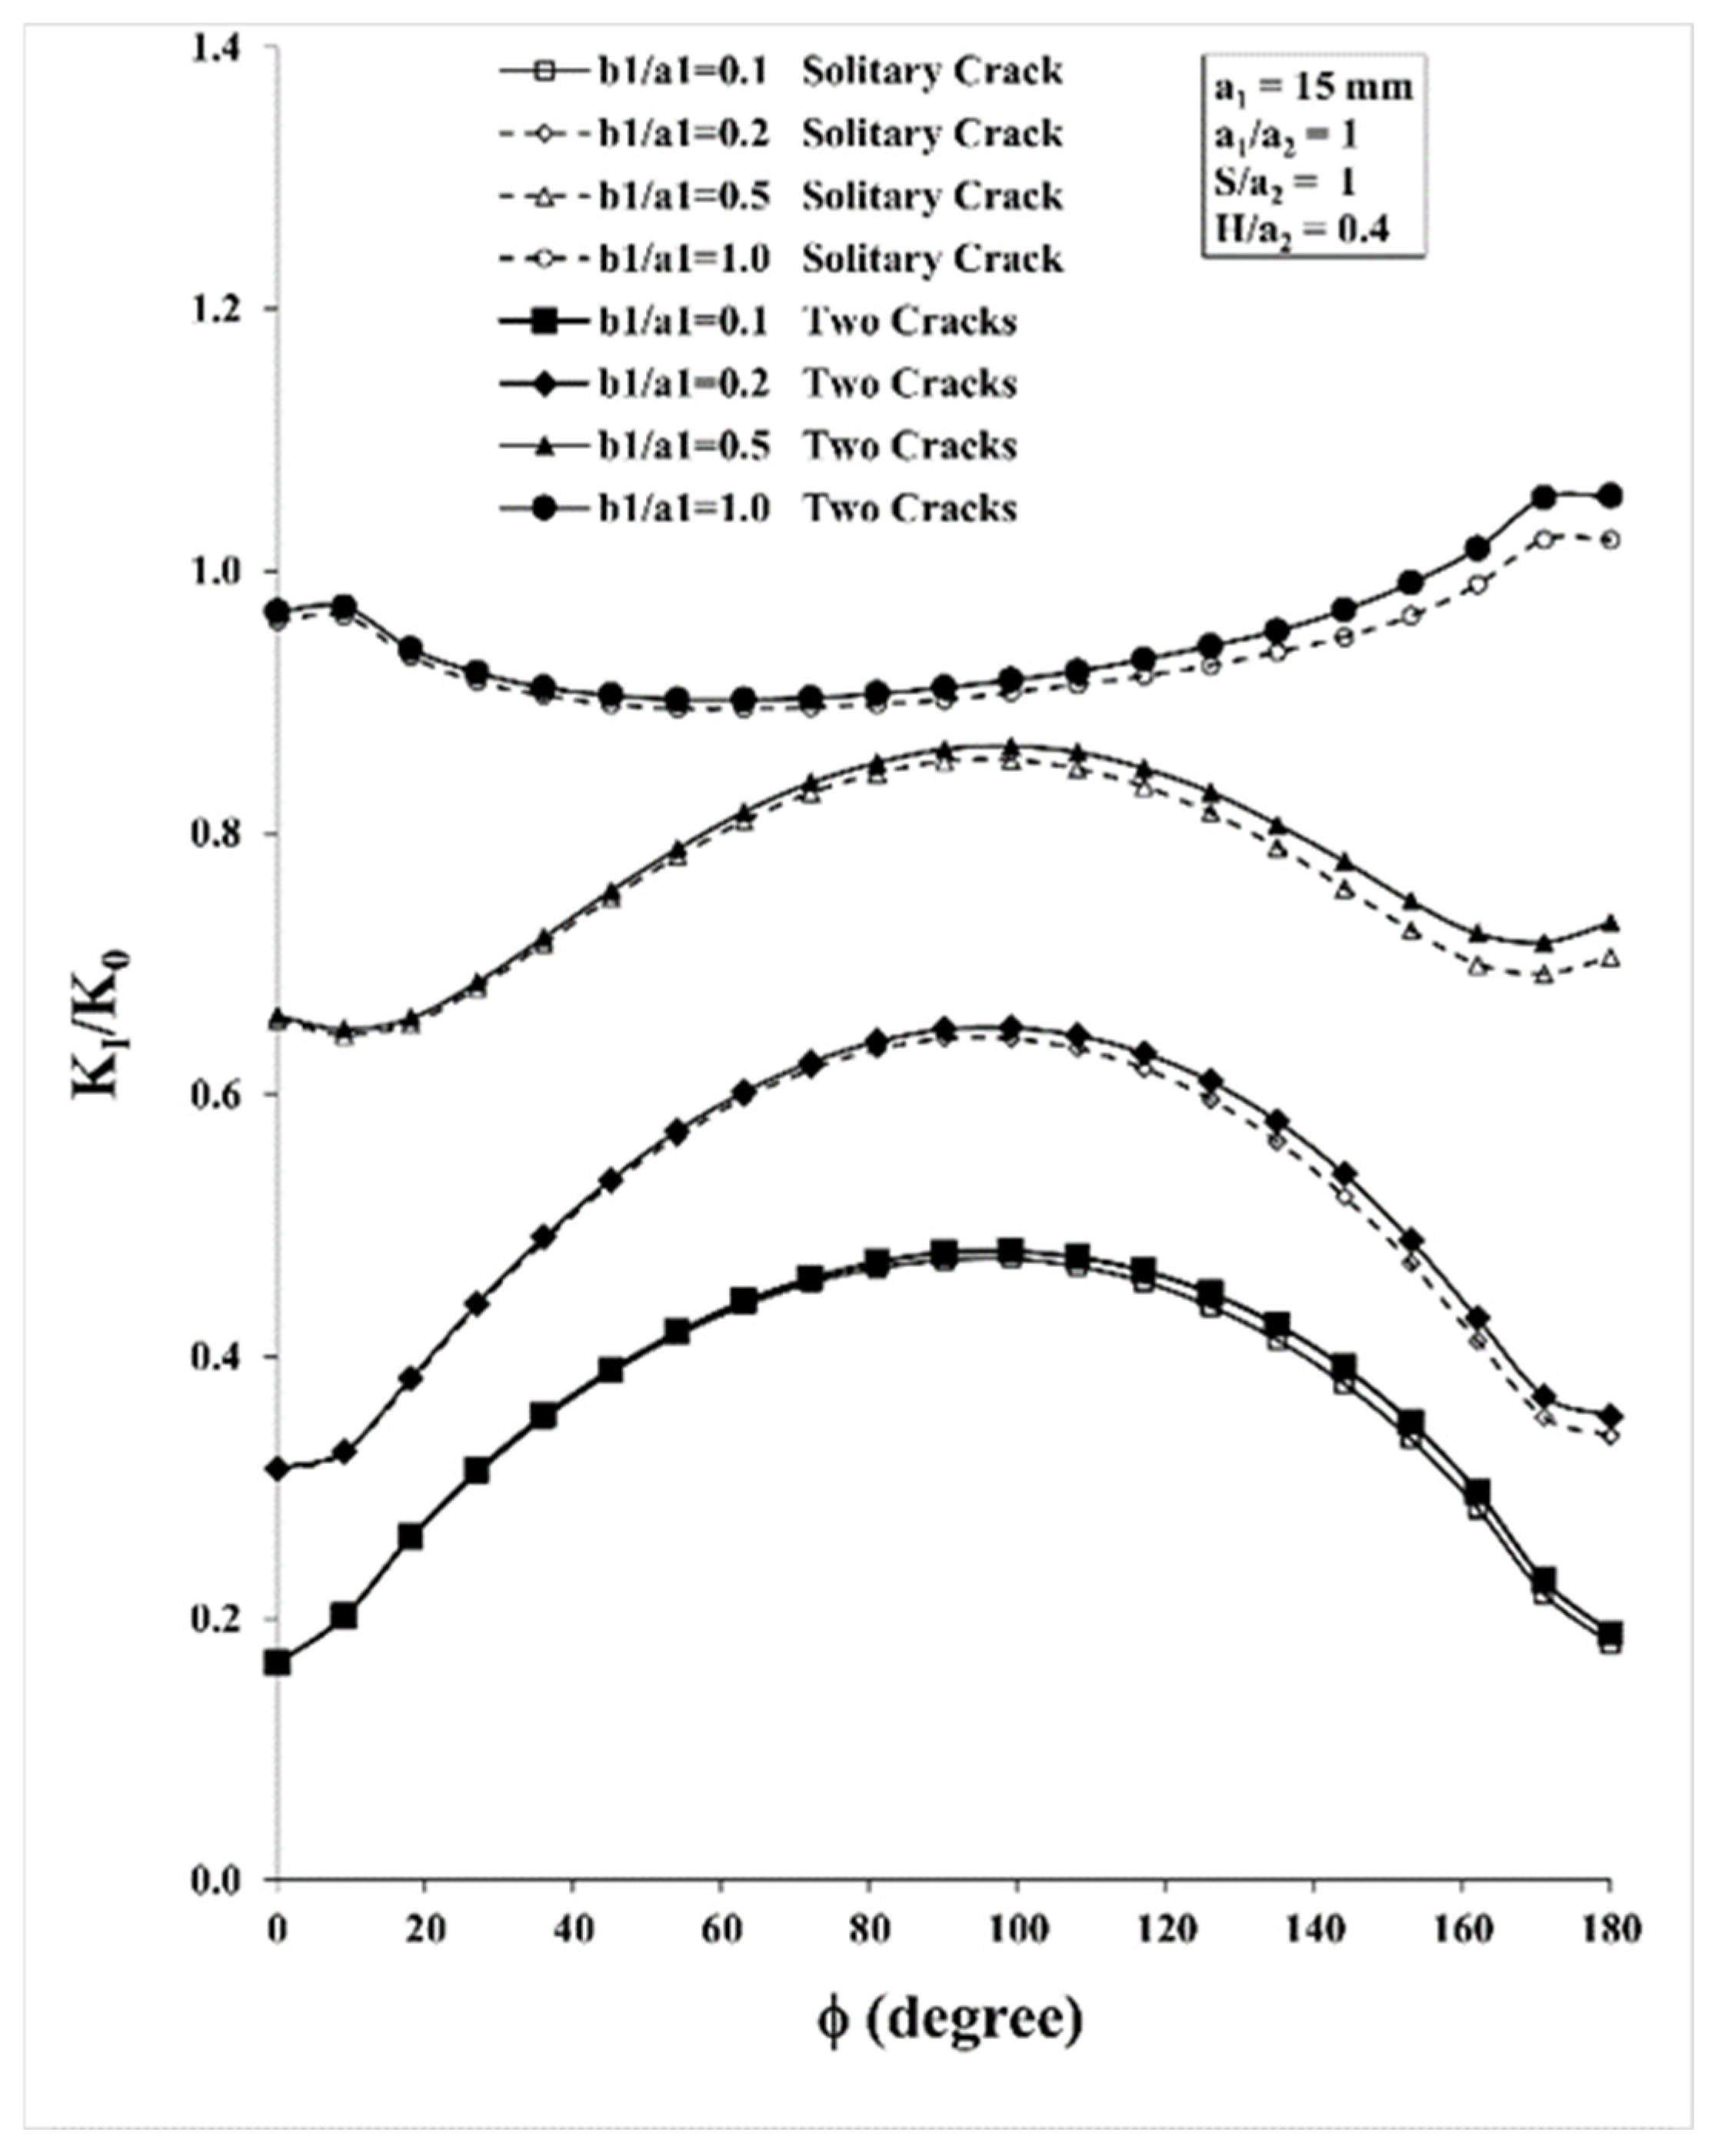
In order to study the effect of the extent of the horizontal separation distance on the influence the QCCC has on the SESC, the crack configuration presented in case I is solved again for S/a2 = 1, while keeping all the rest of the parameters the same. The results for this non-overlapping crack layout are presented in Figure 8. The results are dramatically different from those in Figure 6.
In Figure 8 the SIF distributions for all SESC ellipticities under the influence of the QCCC are practically the same as their corresponding solitary cases. This indicates that when the horizontal separation gap becomes larger, i.e., of the same order as both crack lengths, in this case S/a2 = 1, the QCCC has practically no effect of the SESC. Since no interaction occurs between the cracks, they can be treated as separate cracks.
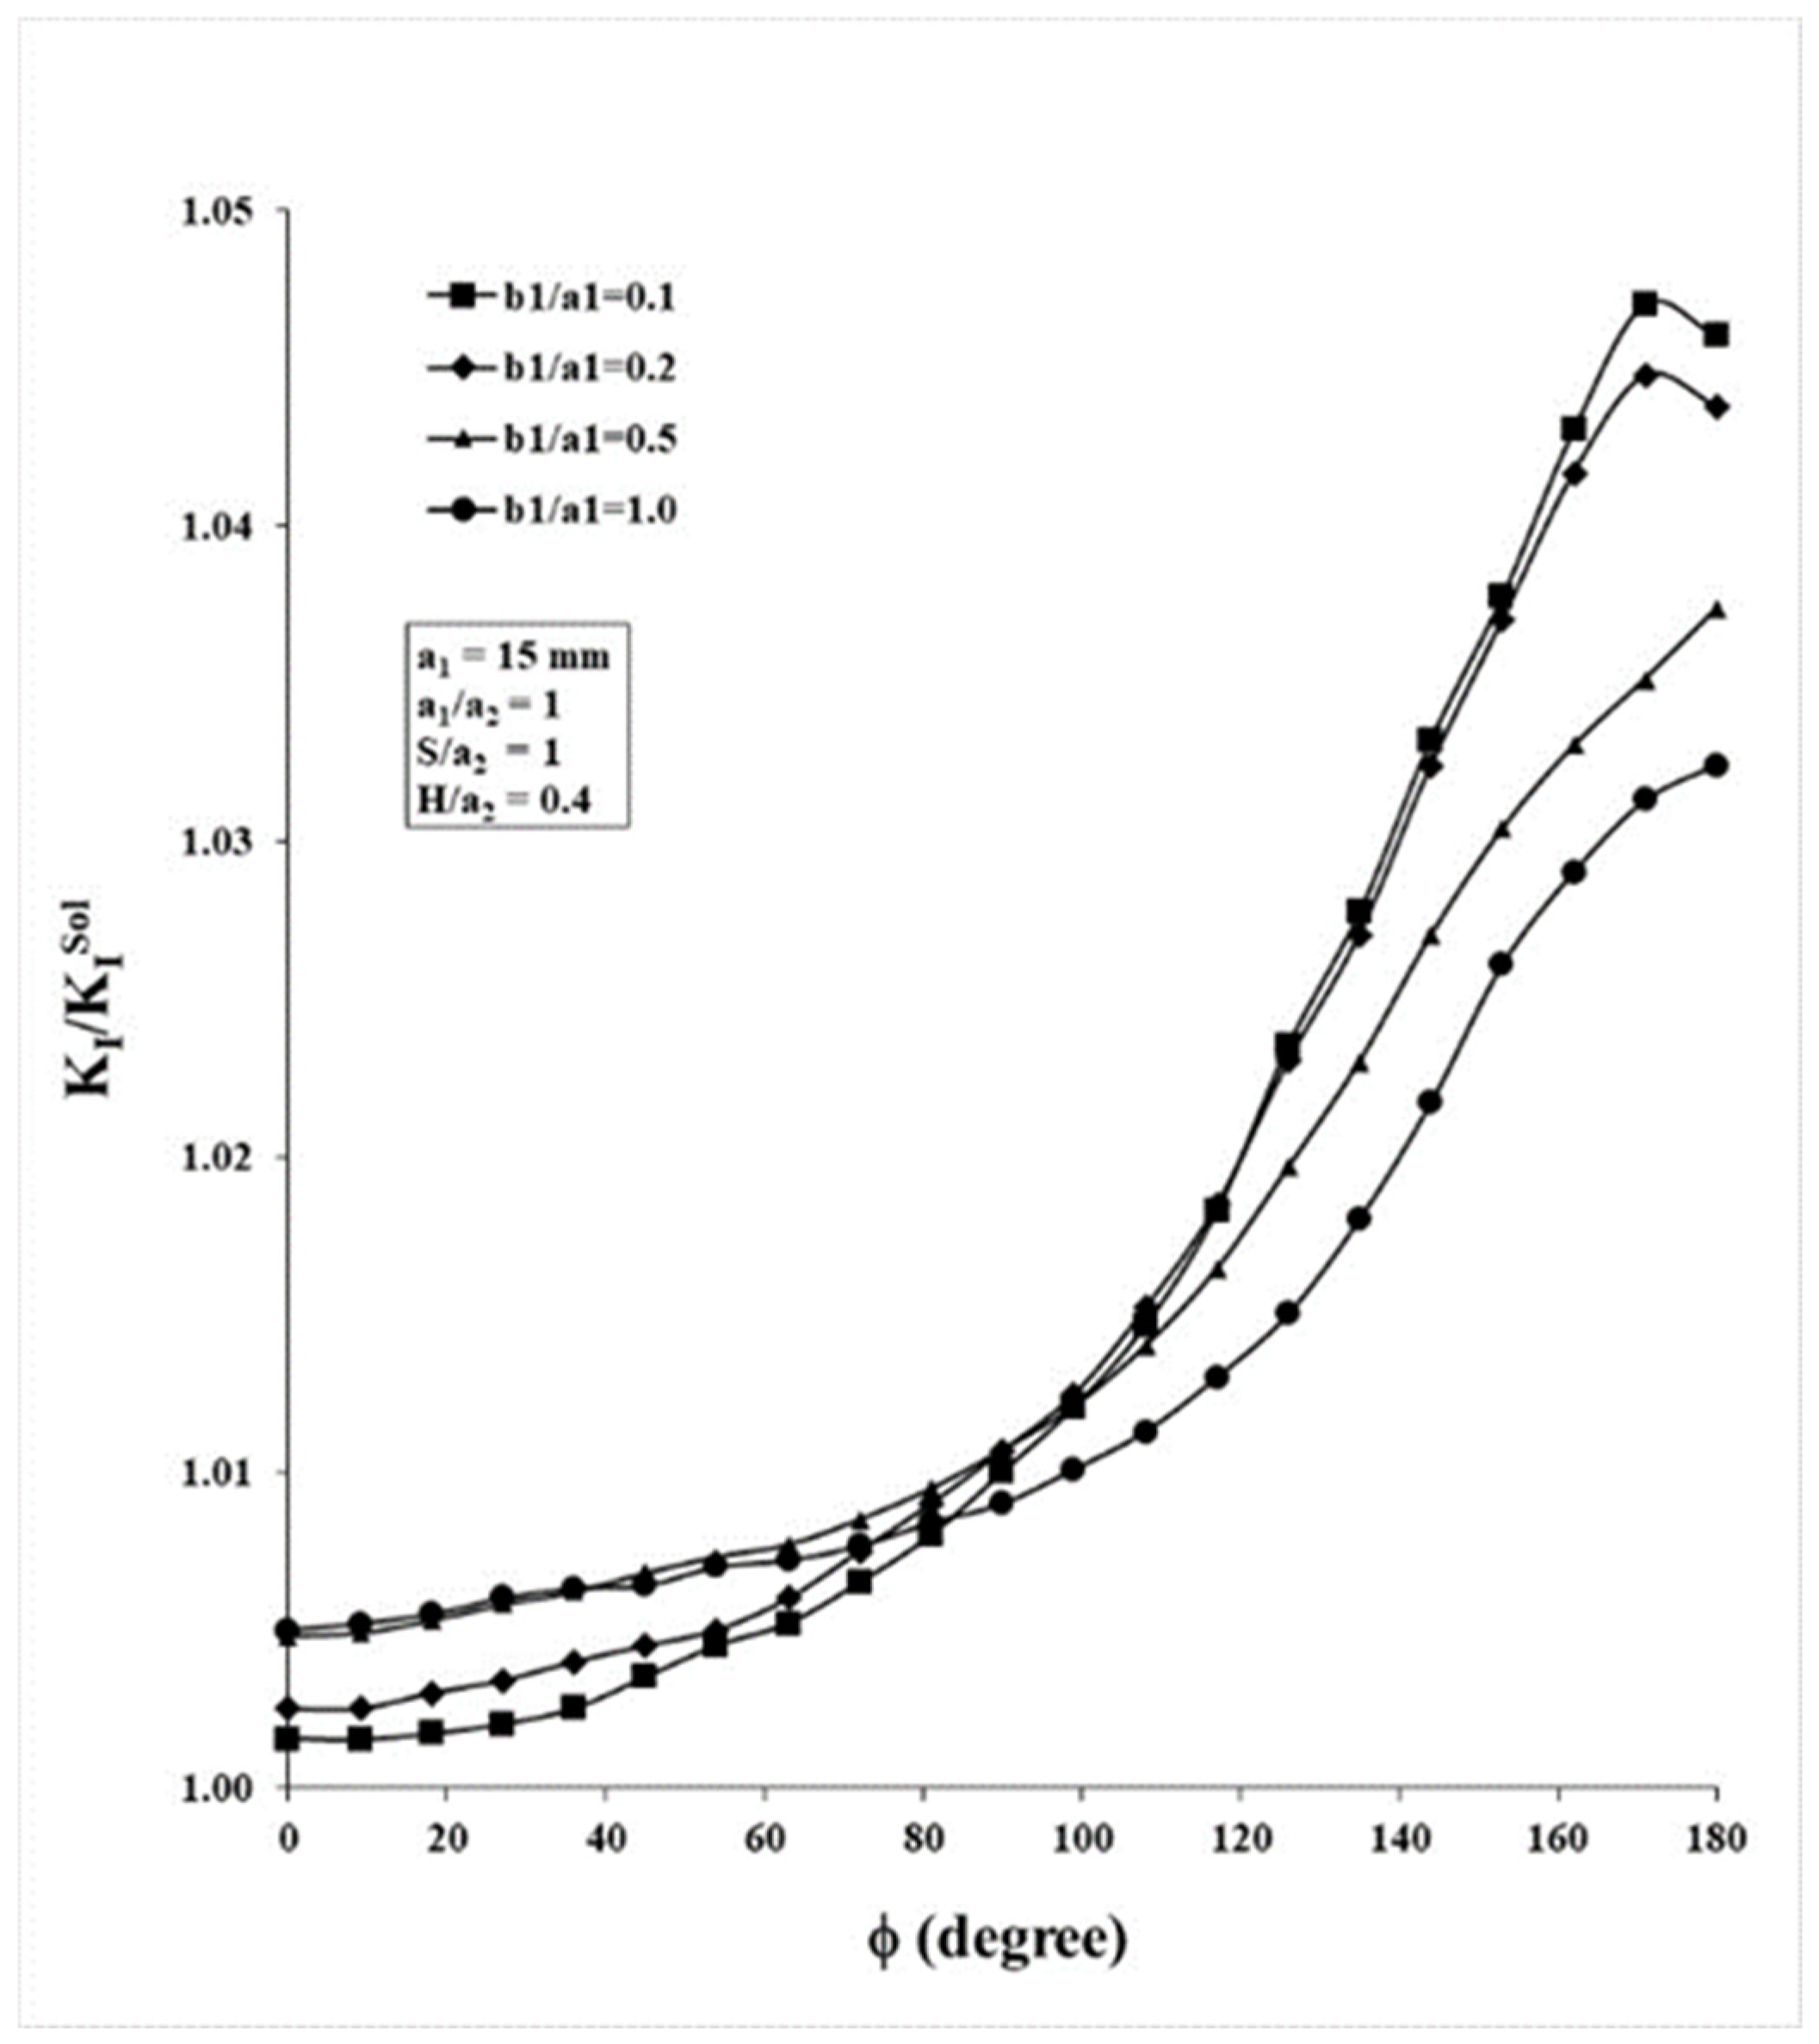
To emphasize this conclusion, the SIF distributions in Figure 8 are renormalized to the values of the solitary crack, K I / K I S o l , and are presented in Figure 9. From Figure 9 it can be seen that at φ = 0°, the farthest point on the SESC from the QCCC, the SESC’s SIF is amplified by the presence of the QCCC by less than 0.5%. However, at φ = 180°, the closest point of the SESC to the QCCC, the QCCC amplifies the SESC’s SIF by less than 5%. The smaller the SESC ellipticity, b1/a1, the larger the SIF amplification is at φ = 180° and the smaller the amplification is at φ = 0°. It is worthwhile noting that in this case, the presence of the QCCC induces no SIF attenuation at any point on the semi-elliptical surface crack front.

3.2.3. Case III—Horizontally Overlapping and Vertically Distant Cracks

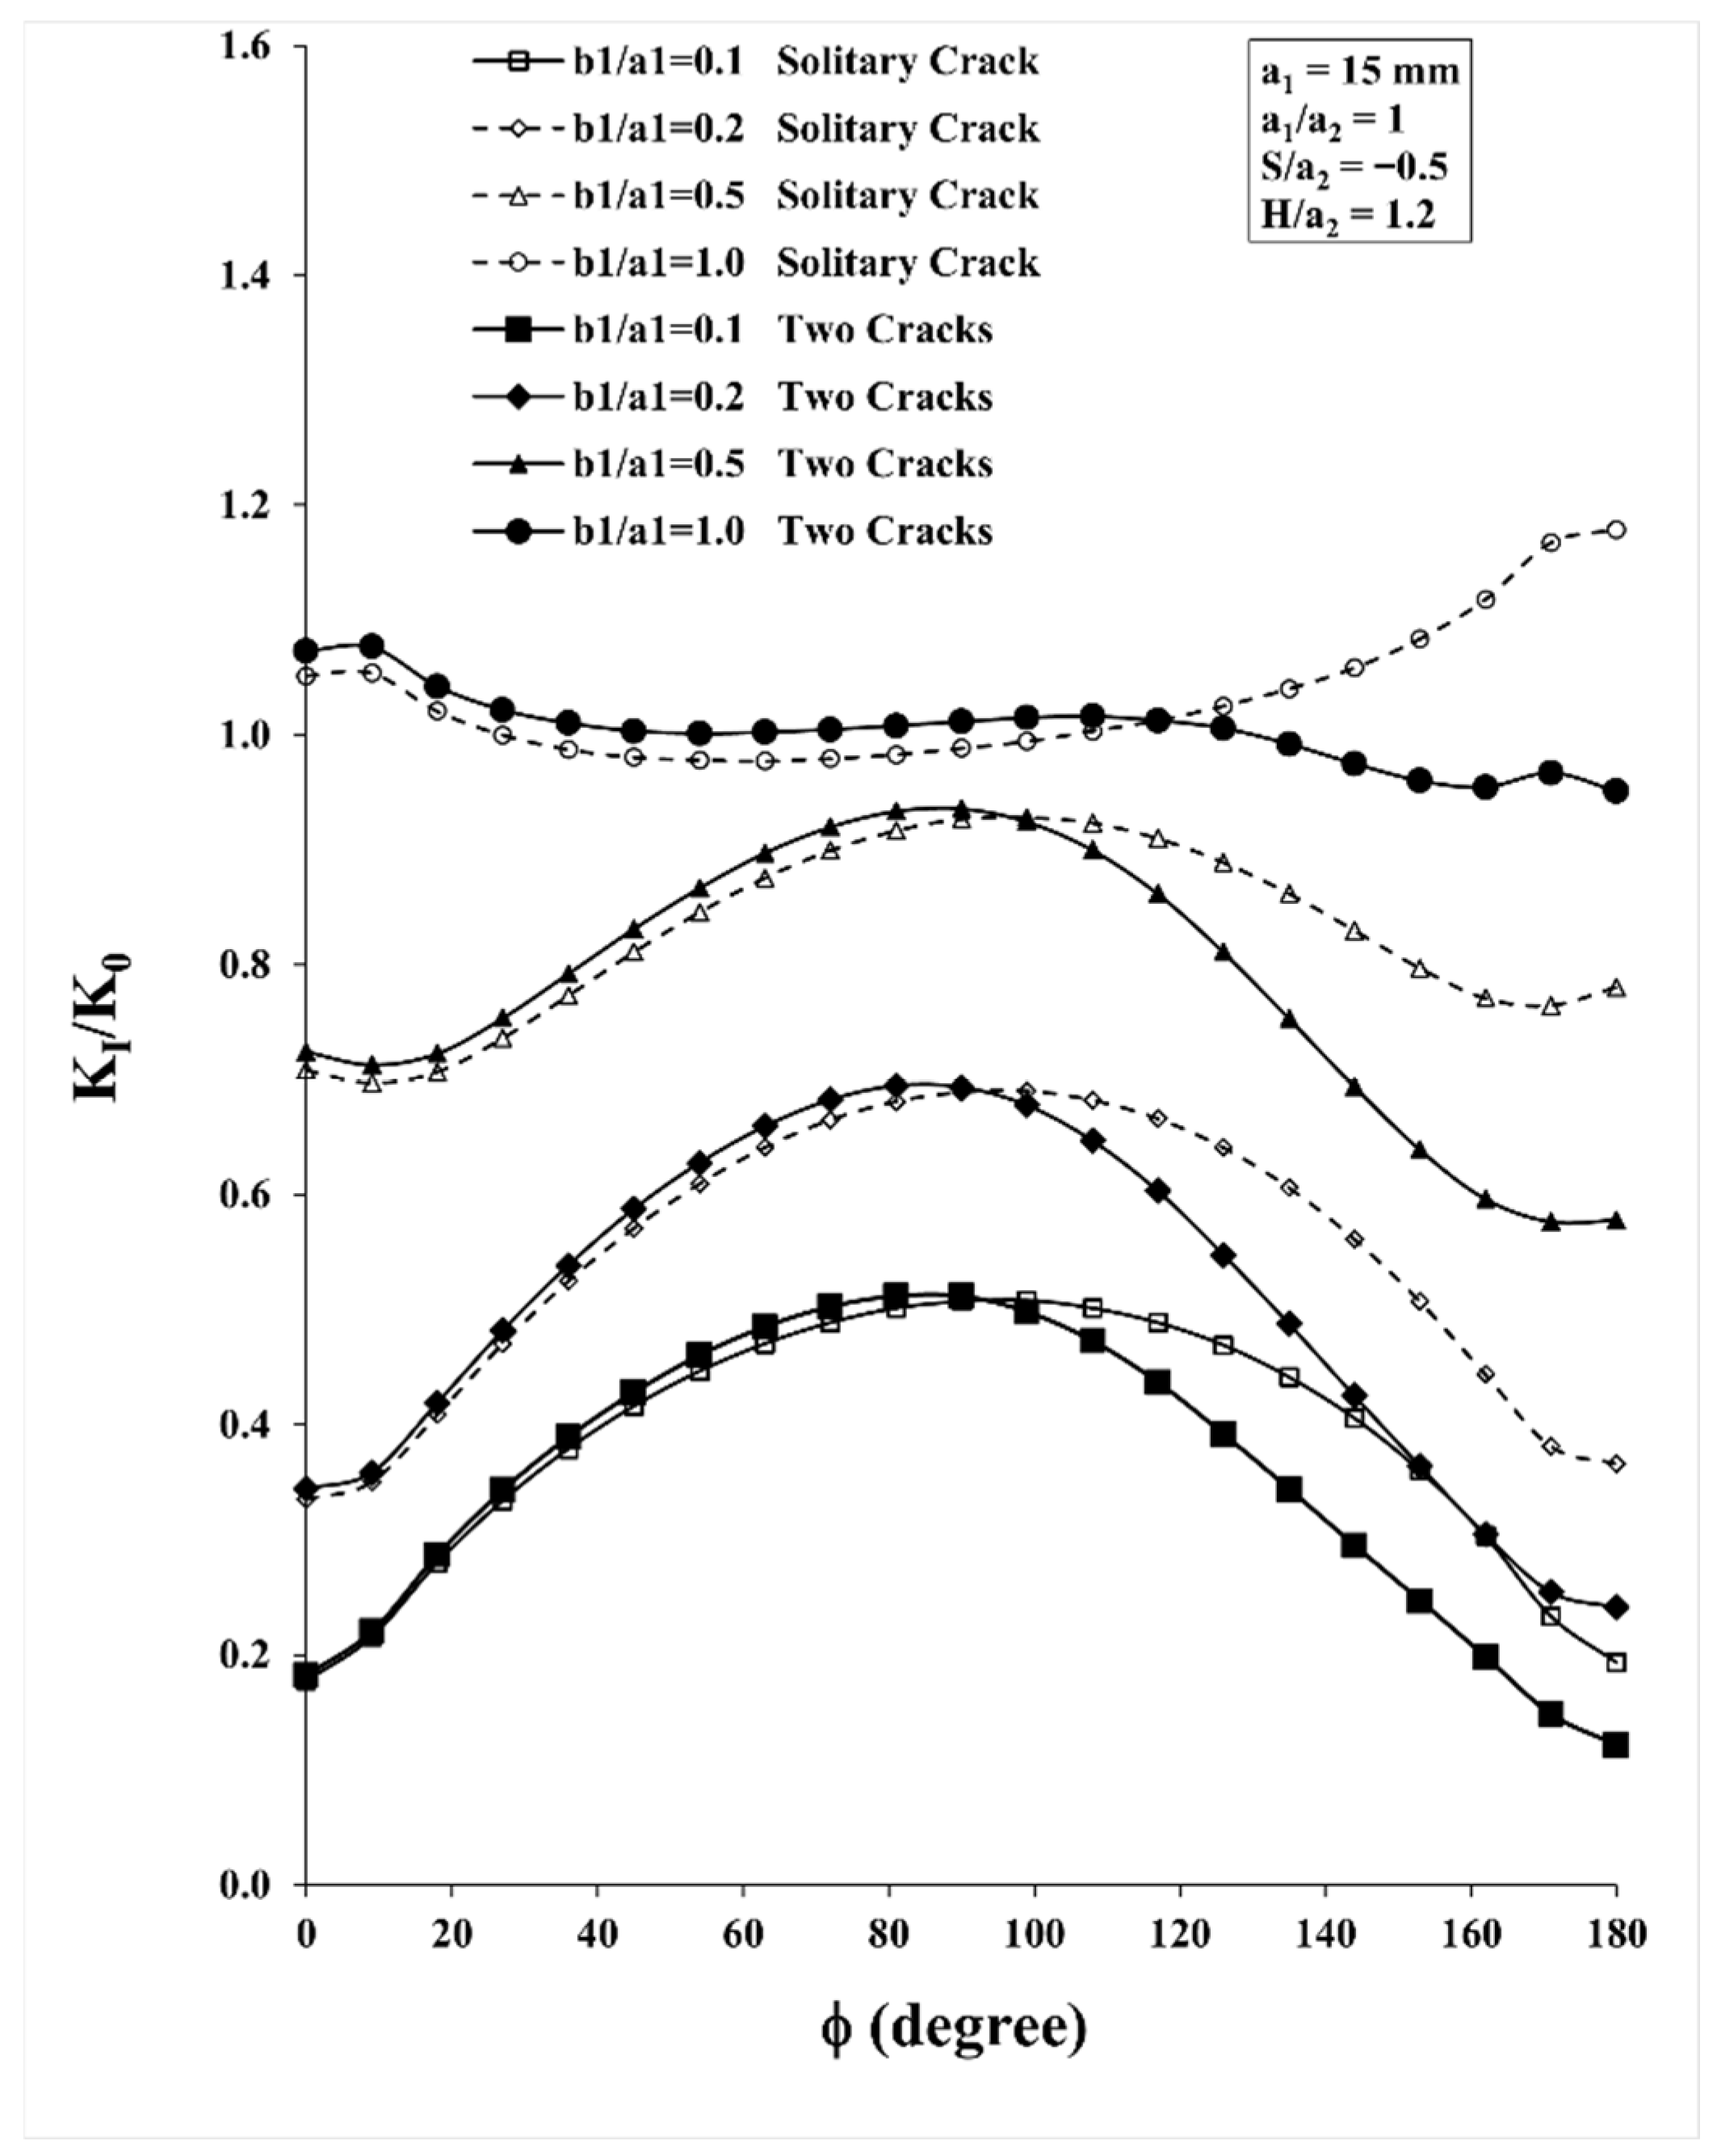
The next set of cases determines the influence that the normalized vertical gap, H/a2, has on the system of cracks that have been previously discussed. To this end, the crack-configuration presented in case I is re-evaluated for a larger vertical gap of H/a2 = 1.2 while keeping the rest of the parameters the same. Thus, in this case, the two cracks overlap horizontally as in case I but are farther apart vertically. The results for this crack configuration are given in Figure 10. The figure depicts the SIF distribution along the SESC front in the presence of (dark symbols) and in the absence of (open symbols) the QCCC for the four different ellipticities of the SESC. The four solitary configurations (open symbols) serve as reference cases. As in case I, Figure 10 accentuates the fact that the presence of the QCCC has a substantial effect on the SESC by amplifying the SIF along a portion of the SESC front, while attenuating it along the rest of it. However, the intensity of the amplification/attenuation effect and the extent to which this occurs along the crack front depend on the SESC ellipticity.
To assess these effects, the distributions of the SIF along the front of each of the four SESC are re-normalized to their corresponding solitary SIF distribution configuration. The ratio K I / K I S o l for the four SESC ellipticities are presented in Figure 11.
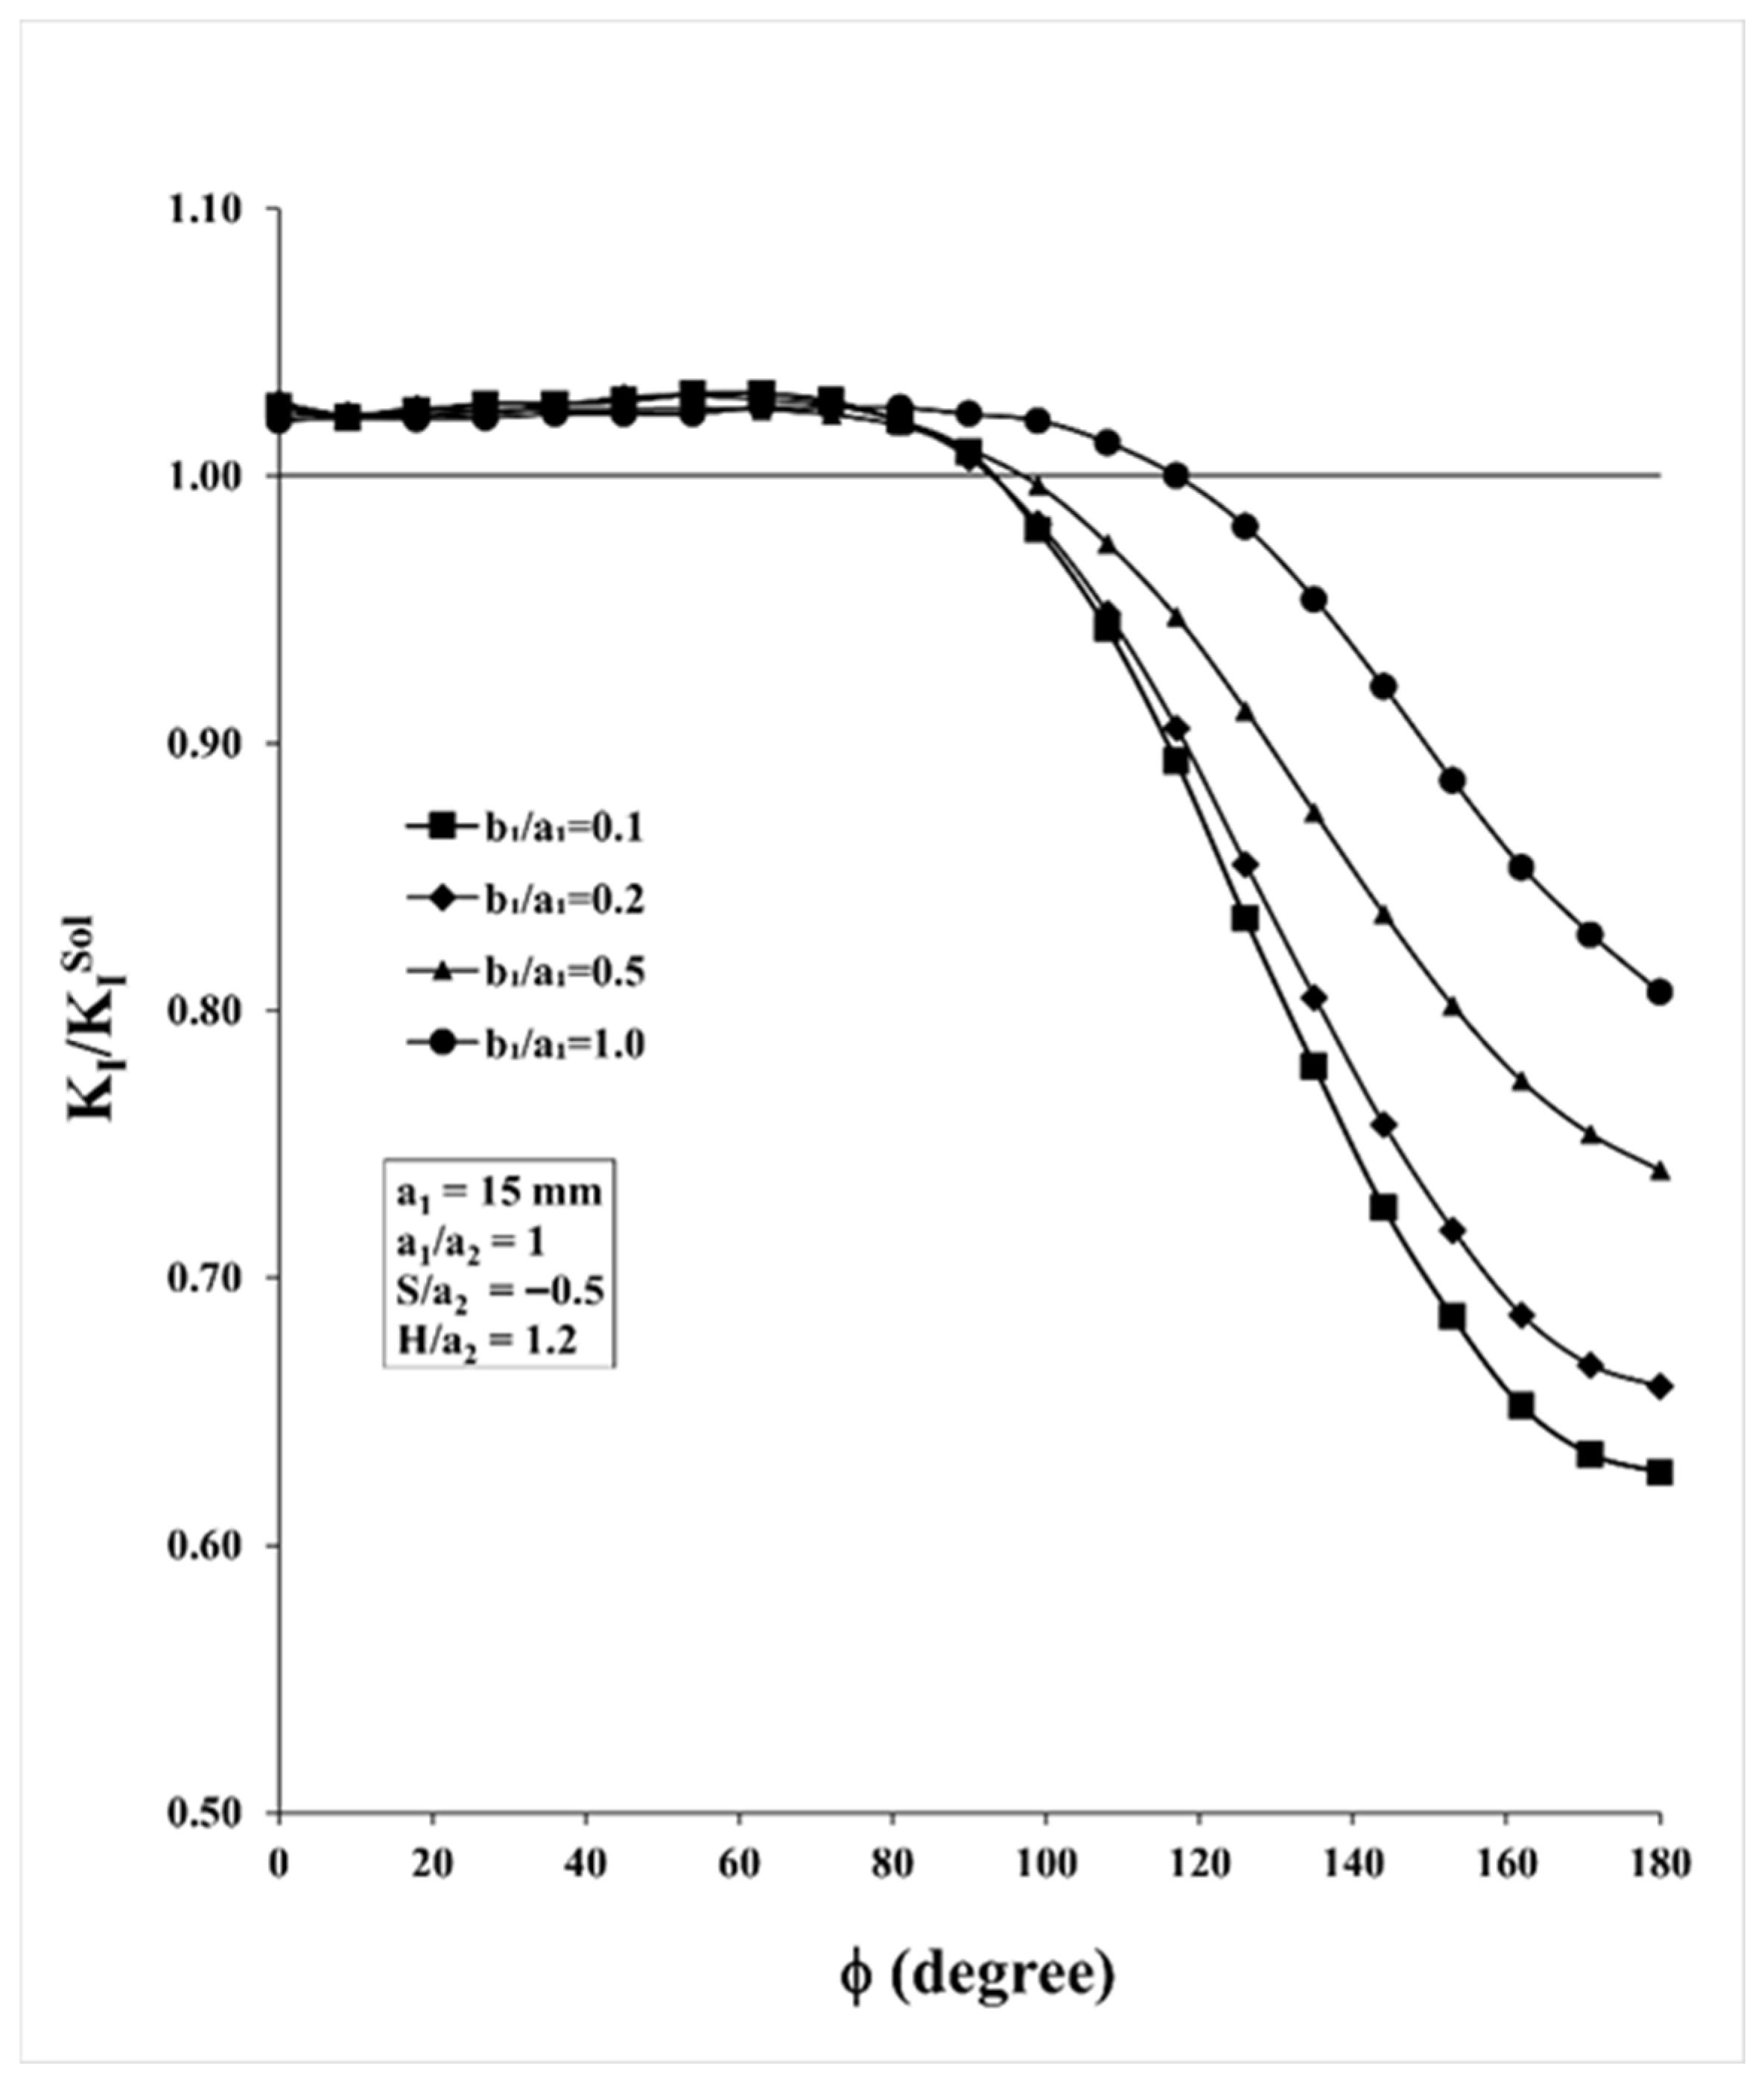
Generally speaking, the pattern of the curves in Figure 11 is somewhat similar to that in Figure 7, as the trends both at the beginning and the end are similar. However, the curves do not peak for φ from 80 to 120° as in Figure 7. Nonetheless, the amplification/attenuation in the present case is much weaker than that in Figure 7 of case I. The results in Figure 11 infer the following:
  • The proximity of the QCCC amplifies the SIF along half of the SESC front, φ from 0° to 90°, for ellipticities of b1/a1 ≤ 0.5, and attenuates the SIF along the rest of it, from φ = 90° to 180°. When the SESC becomes semi-circular, b1/a1 = 1, the amplification zone encompasses almost two-thirds of the crack’s front, from φ = 0° to ~116°, while attenuation occurs only for φ values from ~116° to 180°. In all the cases, attenuation is due to the shielding effect that the QCCC provides on part of the SESC as a result of the cracks’ overlap [15].
  • The pattern of the K I / K I S o l curves in the amplification zone are practically identical for all the crack ellipticities, and K I / K I S o l has an almost constant value of less than 1.03. Unlike case I, where amplification reached up to 20%, in all the present cases, the K I / K I S o l amplification was below 3%.
  • Once in the attenuation zone, K I / K I S o l decreases gradually towards φ = 180° for all crack ellipticities. The larger the ellipticity, the slower the decrease in K I / K I S o l and the weaker the attenuation. For SESC ellipticities of b1/a1 = 0.1, 0.2, 0.5, 1.0, the minimum K I / K I S o l values at φ = 180° are 0.63, 0.66, 0.74 and 0.81, respectively.
By comparing all the similar a1 = a2 = 15 mm crack-size cases, namely cases I, II and III, one can reach several conclusions:
  • A QCCC can have concurrently two opposite effects on an adjacent SESC: amplification of the SIFs along part of the SESC front and attenuation of the SIFs on the rest of its crack front.
  • The vertical gap between the two cracks plays a key role in the nature of their interaction. From our present results, it seems that when the cracks overlap, S/a2 < 0, both amplification and attenuation occur. However, when the cracks are horizontally separated and considered separate cracks, K I / K I S o l ~1, only minimal amplification occurs.
  • Increasing the vertical gap, H/a2, results only in weakening the effect of the QCCC on the SESC, without affecting its nature.
  • It is worthwhile noting that in a 3-D configuration, like the present one, KII and KIII may arise and might be non-negligible with respect to KI. Thus, in order to dismiss this possibility in the present analysis, KII and KIII were evaluated for all the previous and following cases, along with KI. KII and KIII were found to be one to two orders of magnitude smaller than KI, thus fully justifying their non-inclusion in the present analysis.

3.3. The Effect of the Quarter-Circle Corner Crack on a Longer Semi-Elliptical Surface Crack

To assess the effect of the same QCCC (a2 = 15 mm) on a longer SESC of a1 = 30 mm (a1/a2 = 2), cases I and II are solved once again by just changing the SESC length, keeping the rest of the corresponding parameters intact. Thus, the same four ellipticities of the SESC previously employed, as well as the same values of the normalized gaps H/a2 and S/a2, are employed in the following cases.

3.3.1. Case IV—Longer SESC, Horizontally Overlapping and Vertically Close Cracks

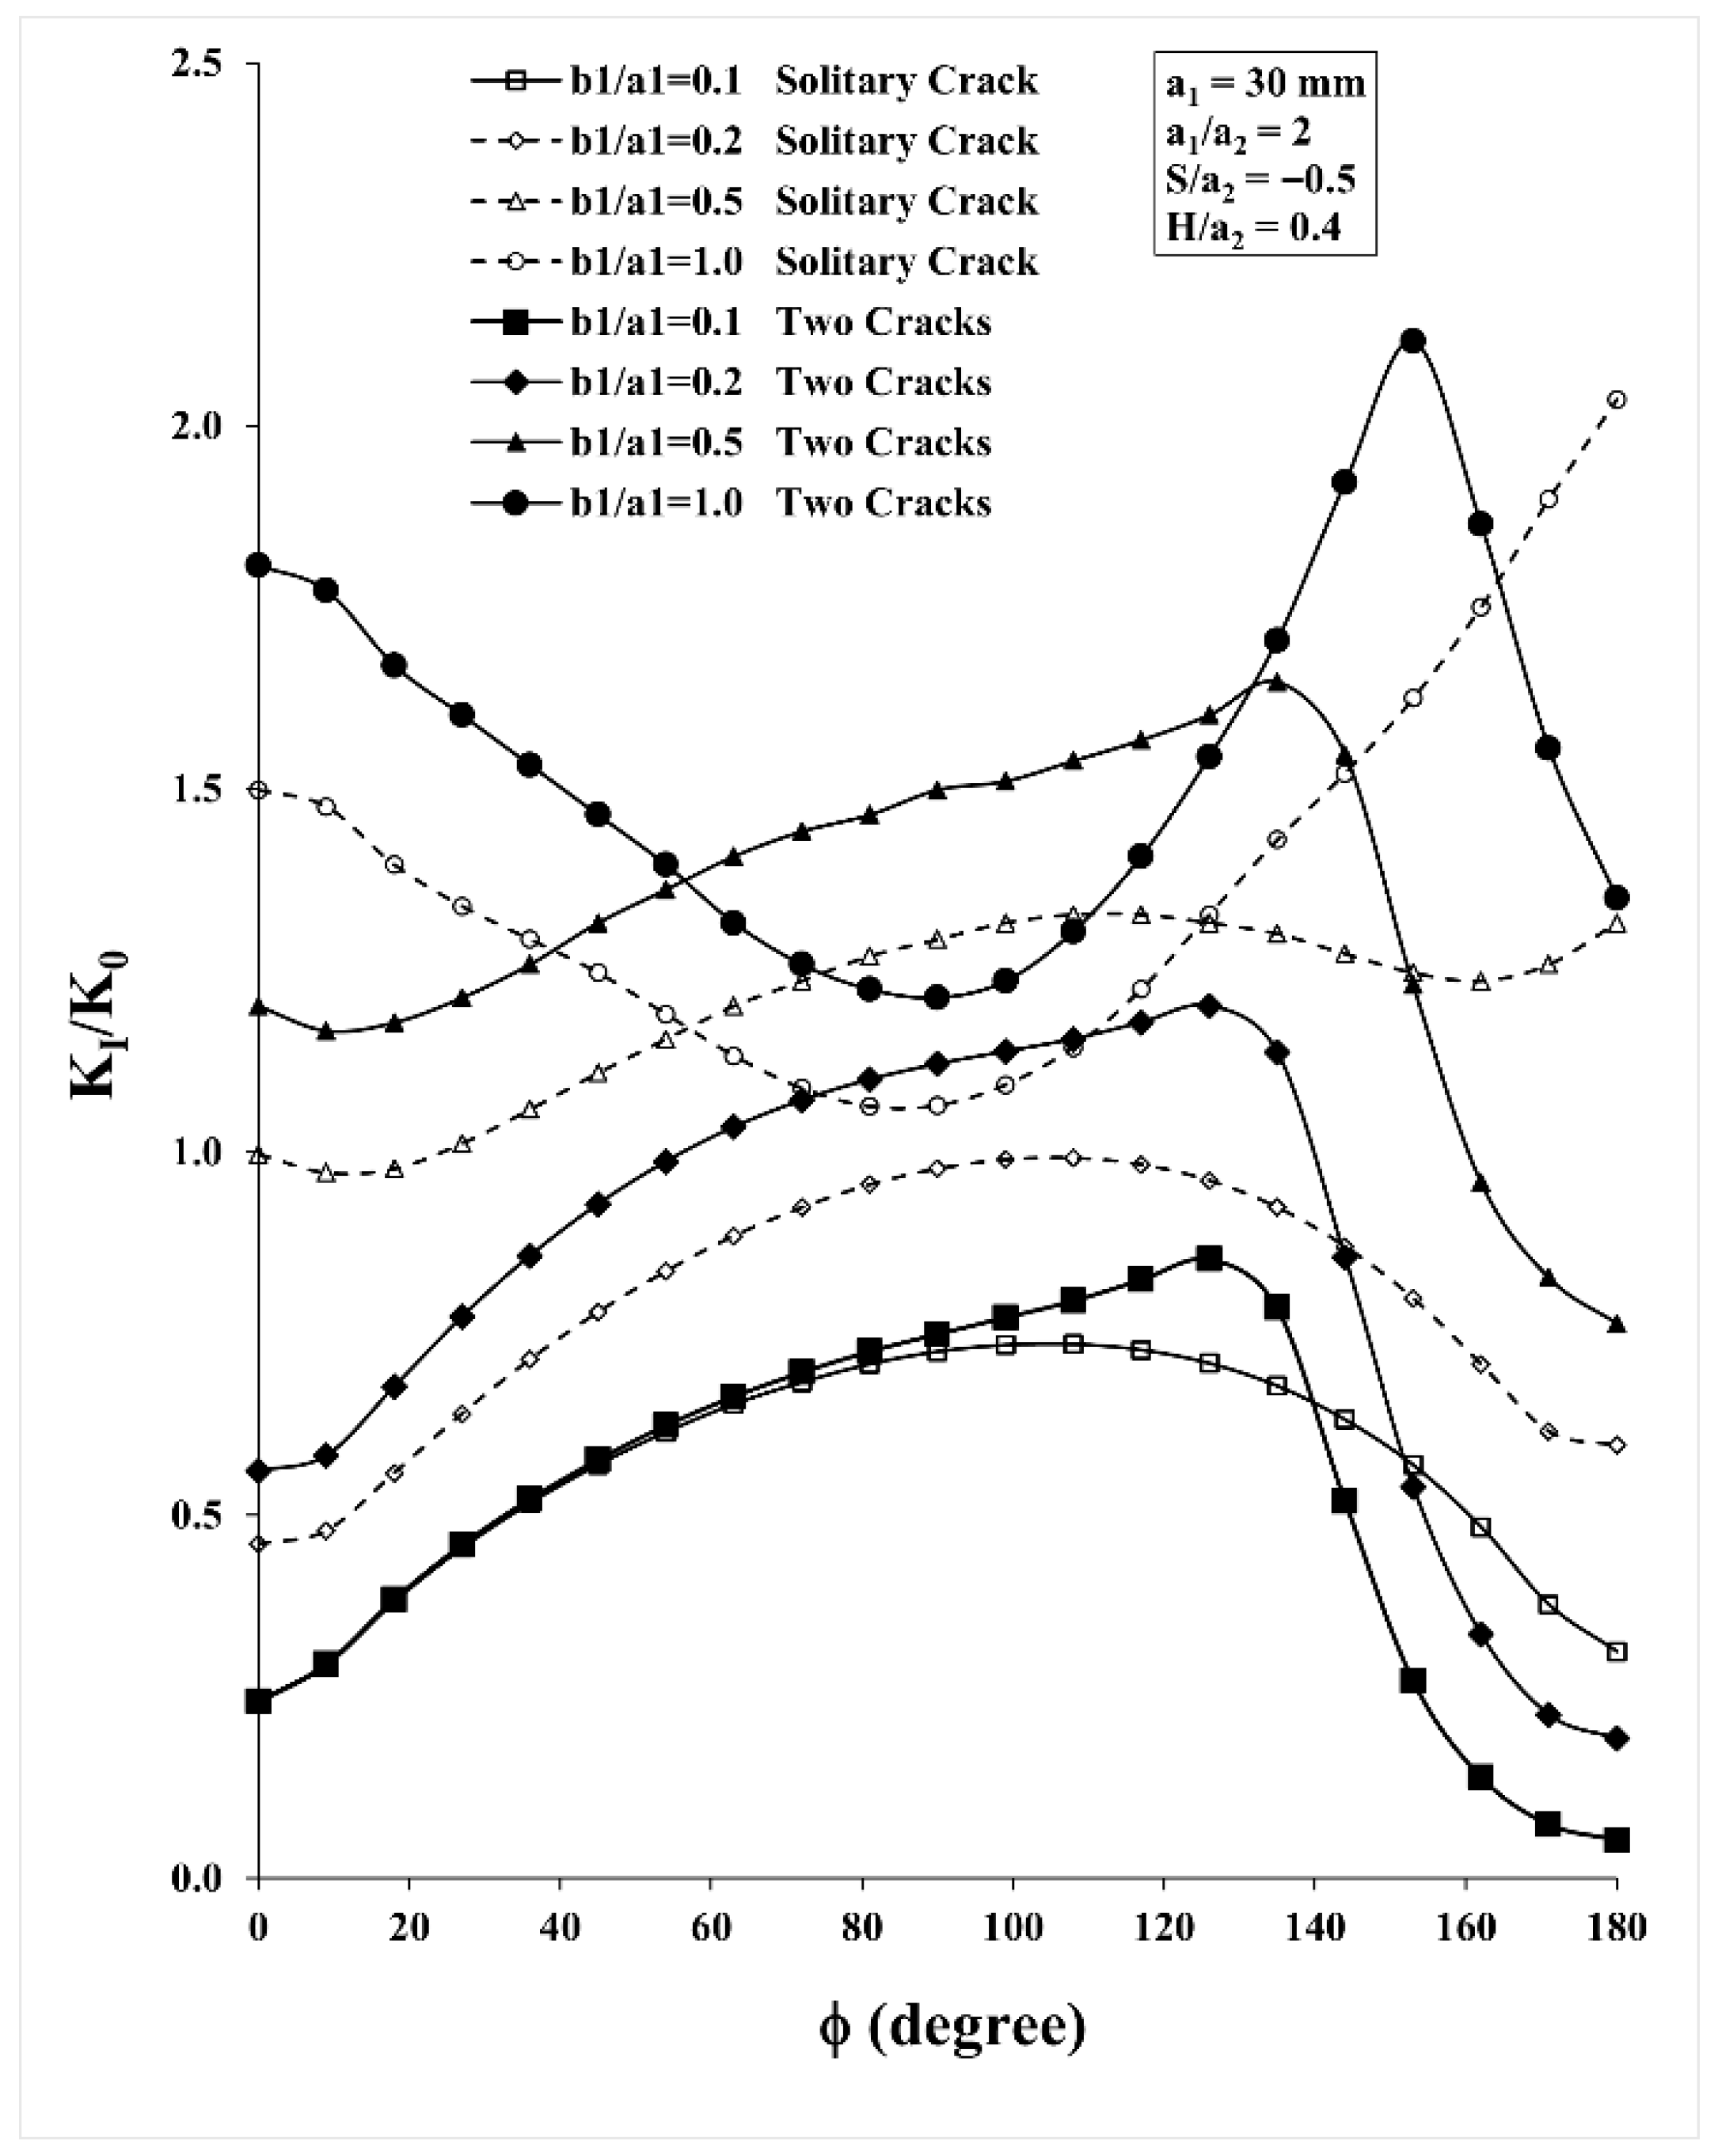
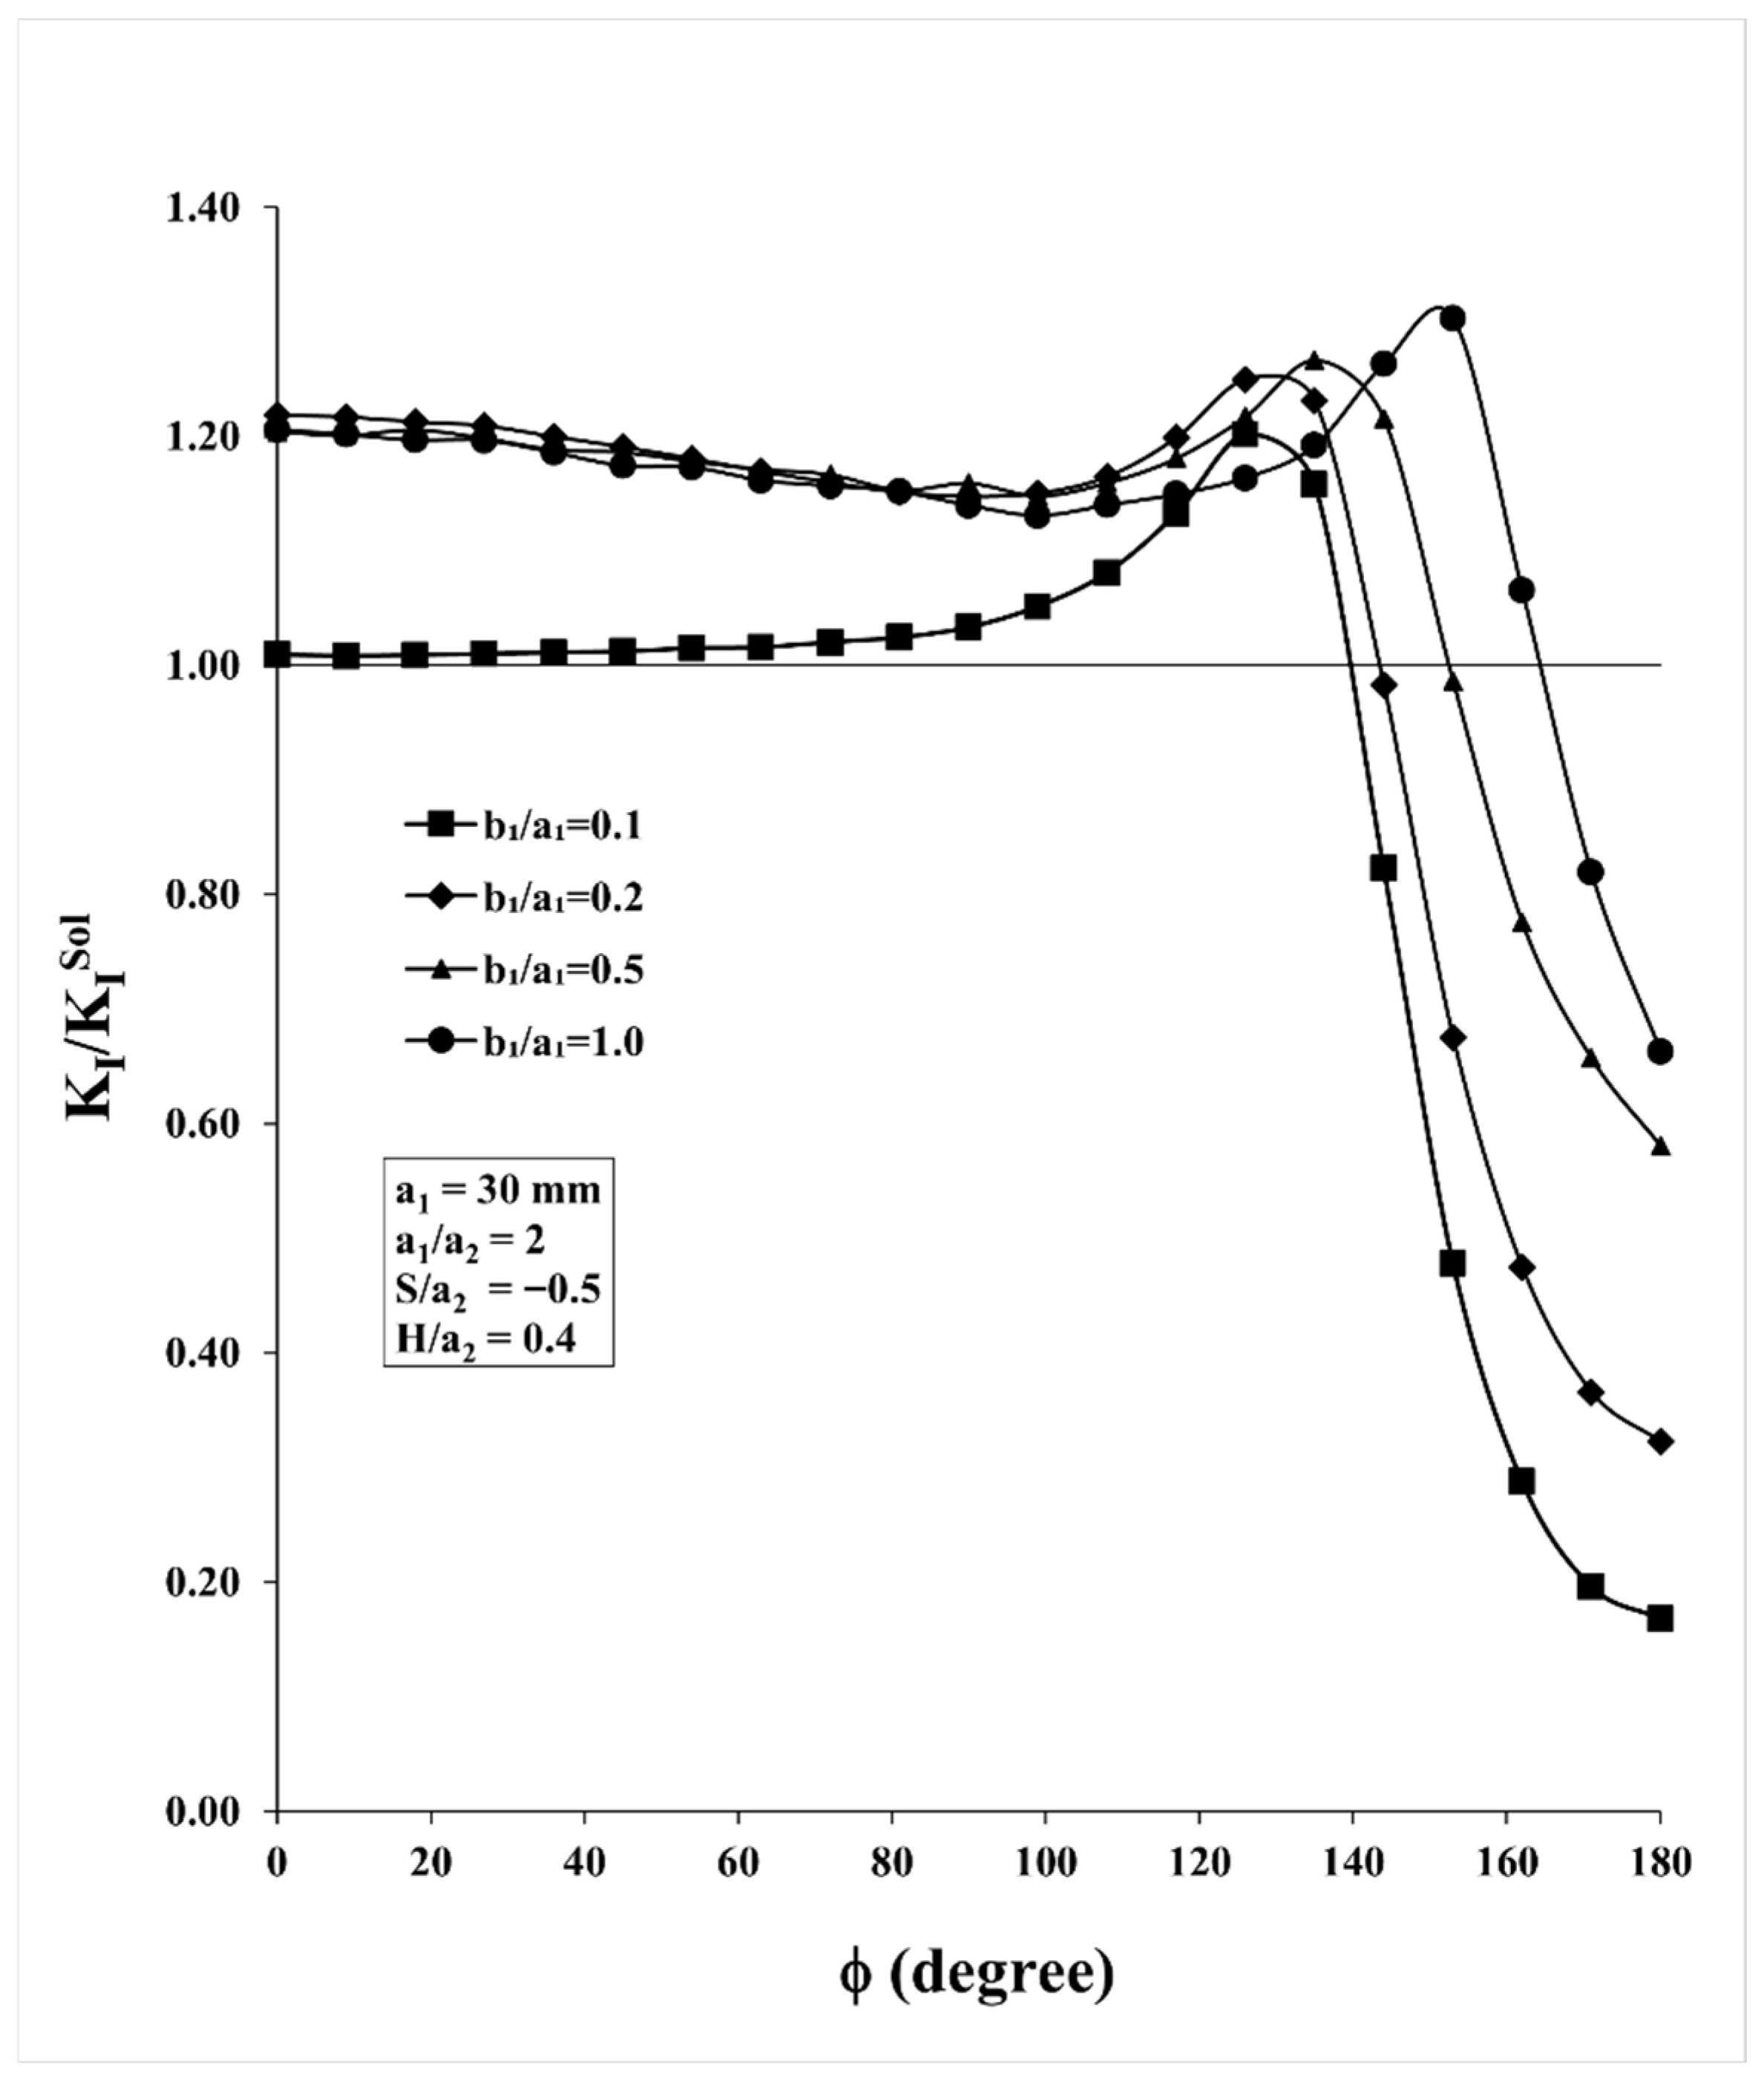
In this case, all the parameters of case I are kept the same except that a1 = 30 mm. Thus, the parameters here are a1/a2 = 2, S/a2 = −0.5, H/a2 = 0.4. The distribution of the SIF along the front of the longer SESC under pure bending as affected by the presence of the QCCC is presented in Figure 12.
Comparing Figure 12 to Figure 6 shows that the SIF distributions bear a similar pattern, but differ considerably in magnitude. As the SESC in the present case is twice as long as in case I, the SIFs along its front are accordingly larger. Furthermore, the effects that the QCCC has on this longer SESC are much more enhanced than those in Figure 6. For example, the difference between a curve for two cracks (dark symbols) and its corresponding solitary crack curve (open symbols) is larger and continues to increase as b1/a1 increases. Moreover, the larger the SESC’s ellipticity, the more intensified is the influence of the QCCC on the SESC. For example, the case b1/a1 = 1 shows a deeper trough than its counterpart in Figure 6.
To quantitatively assess the effect of the presence of the QCCC on the SESC, the results for KI/K0 in Figure 12 are re-normalized to the values of the corresponding solitary crack configuration, yielding K I / K I S o l , and are presented in Figure 13.
The results in Figure 13 resemble those of Figure 7 but show one distinctive difference. As in case I, the QCCC has two opposing effects on the SESC, i.e., the SIF is amplified along most of the crack’s front, while along the rest of it, the SIF is attenuated. Unlike case I, the b1/a1 = 0.1 curve has separated itself from the other ellipticity curves.
In the case of the shallowest crack, b1/a1 = 0.1, the SIF is slightly increased by up to 3% along half of its front, φ = 0° to 90°then it sharply increases to KI/ K I S o l = 1.2 at φ = ~126°. It then decreases gradually until becoming attenuated at φ = ~140°, finally reaching a maximum attenuation of K I / K I S o l =   ~ 0.17 at φ = 180°.
For the rest of the SESC ellipticities, b1/a1 = 0.2, 0.5 and 1.0, the pattern is somewhat different from that of the shallowest crack. Along most of the crack’s front, φ = 0° to 112°, the results for all three ellipticities are practically the same. At φ = 0° K I / K I S o l = ~1.21 decreasing gradually to K I / K I S o l = ~1.16 in the vicinity of φ = 112°. Then, the curves are further amplified to maxima of K I / K I S o l = 1.25, 1.25 and 1.3, respectively, for these three ellipticities. These maxima are located on the SESC’s crack front at φ = 126°, 135°, 153°, respectively. Subsequently, KI/ K I S o l decreases until attenuation is reached at φ = ~ 140° , ~ 150° ,   ~ 165° for b1/a1 = 0.2, 0.5 and 1.0, respectively. Minimum attenuation for these three ellipticities occurs at φ = 180° and its level is ellipticity dependent. The shallower the crack, the higher the attenuation, i.e., ( K I / K I S o l )min = −0.17, −0.32, −0.58 and −0.66, corresponding to the increased SESC ellipticity.

3.3.2. Case V—Larger SESC, Horizontally Non-Overlapping and Vertically Close Cracks

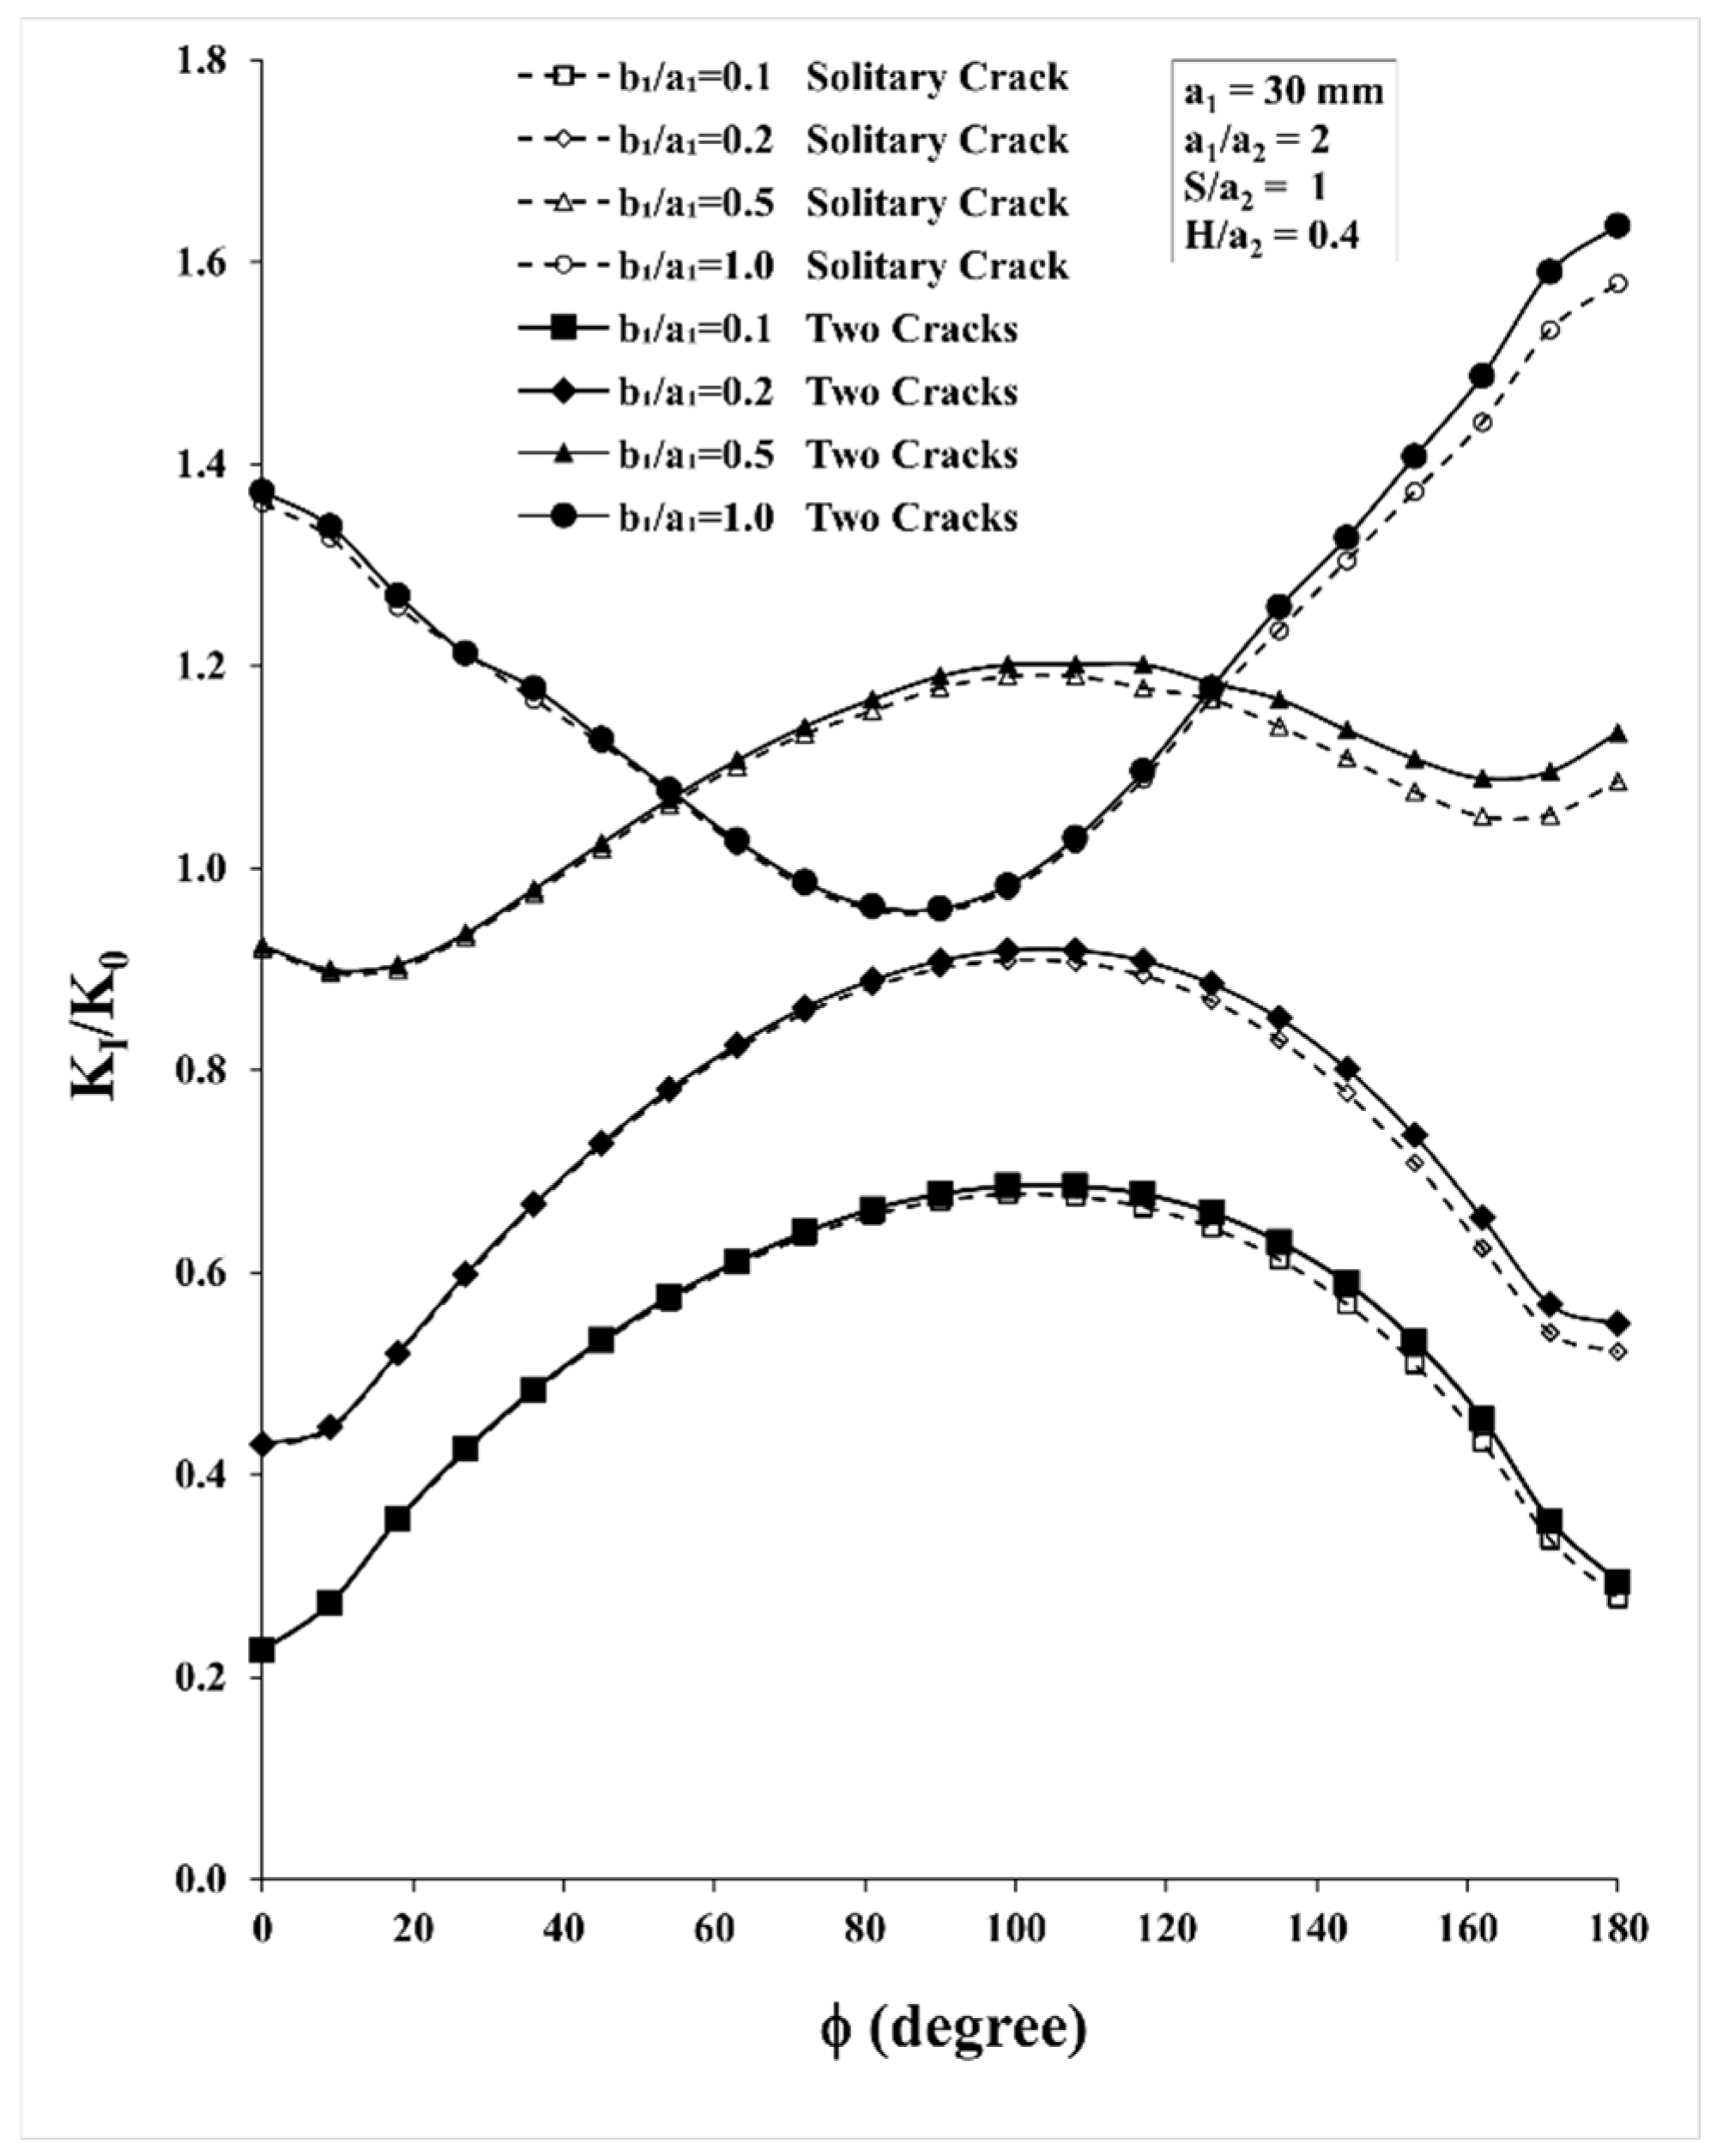
The influence of the horizontal separation distance is further studied when the longer SESC is moved further away from the QCCC. Case V is case IV, solved once more, with the only change being to the horizontal position of the SESC, namely S/a2 = 1. This case is a non-overlapping configuration, and its results are presented in Figure 14. Moving the SESC away from the QCCC has a noticeable effect on the SIF distribution along the SESC’s crack front.
When the SESC is horizontally moved away from the QCCC to S/a2 = 1, the QCCC has almost no influence on the SESC, and vice versa, the SESC on the QCCC (see [1]). Thus, the two cracks can be treated as distinct, solitary cracks. Furthermore, it is noted that the difference between the two-crack graph (dark symbols) and the solitary crack graph (open symbols) becomes very small or non-existent. This is reasonable since the SESC and the solitary crack solutions are almost identical when the cracks become distinct and separate.
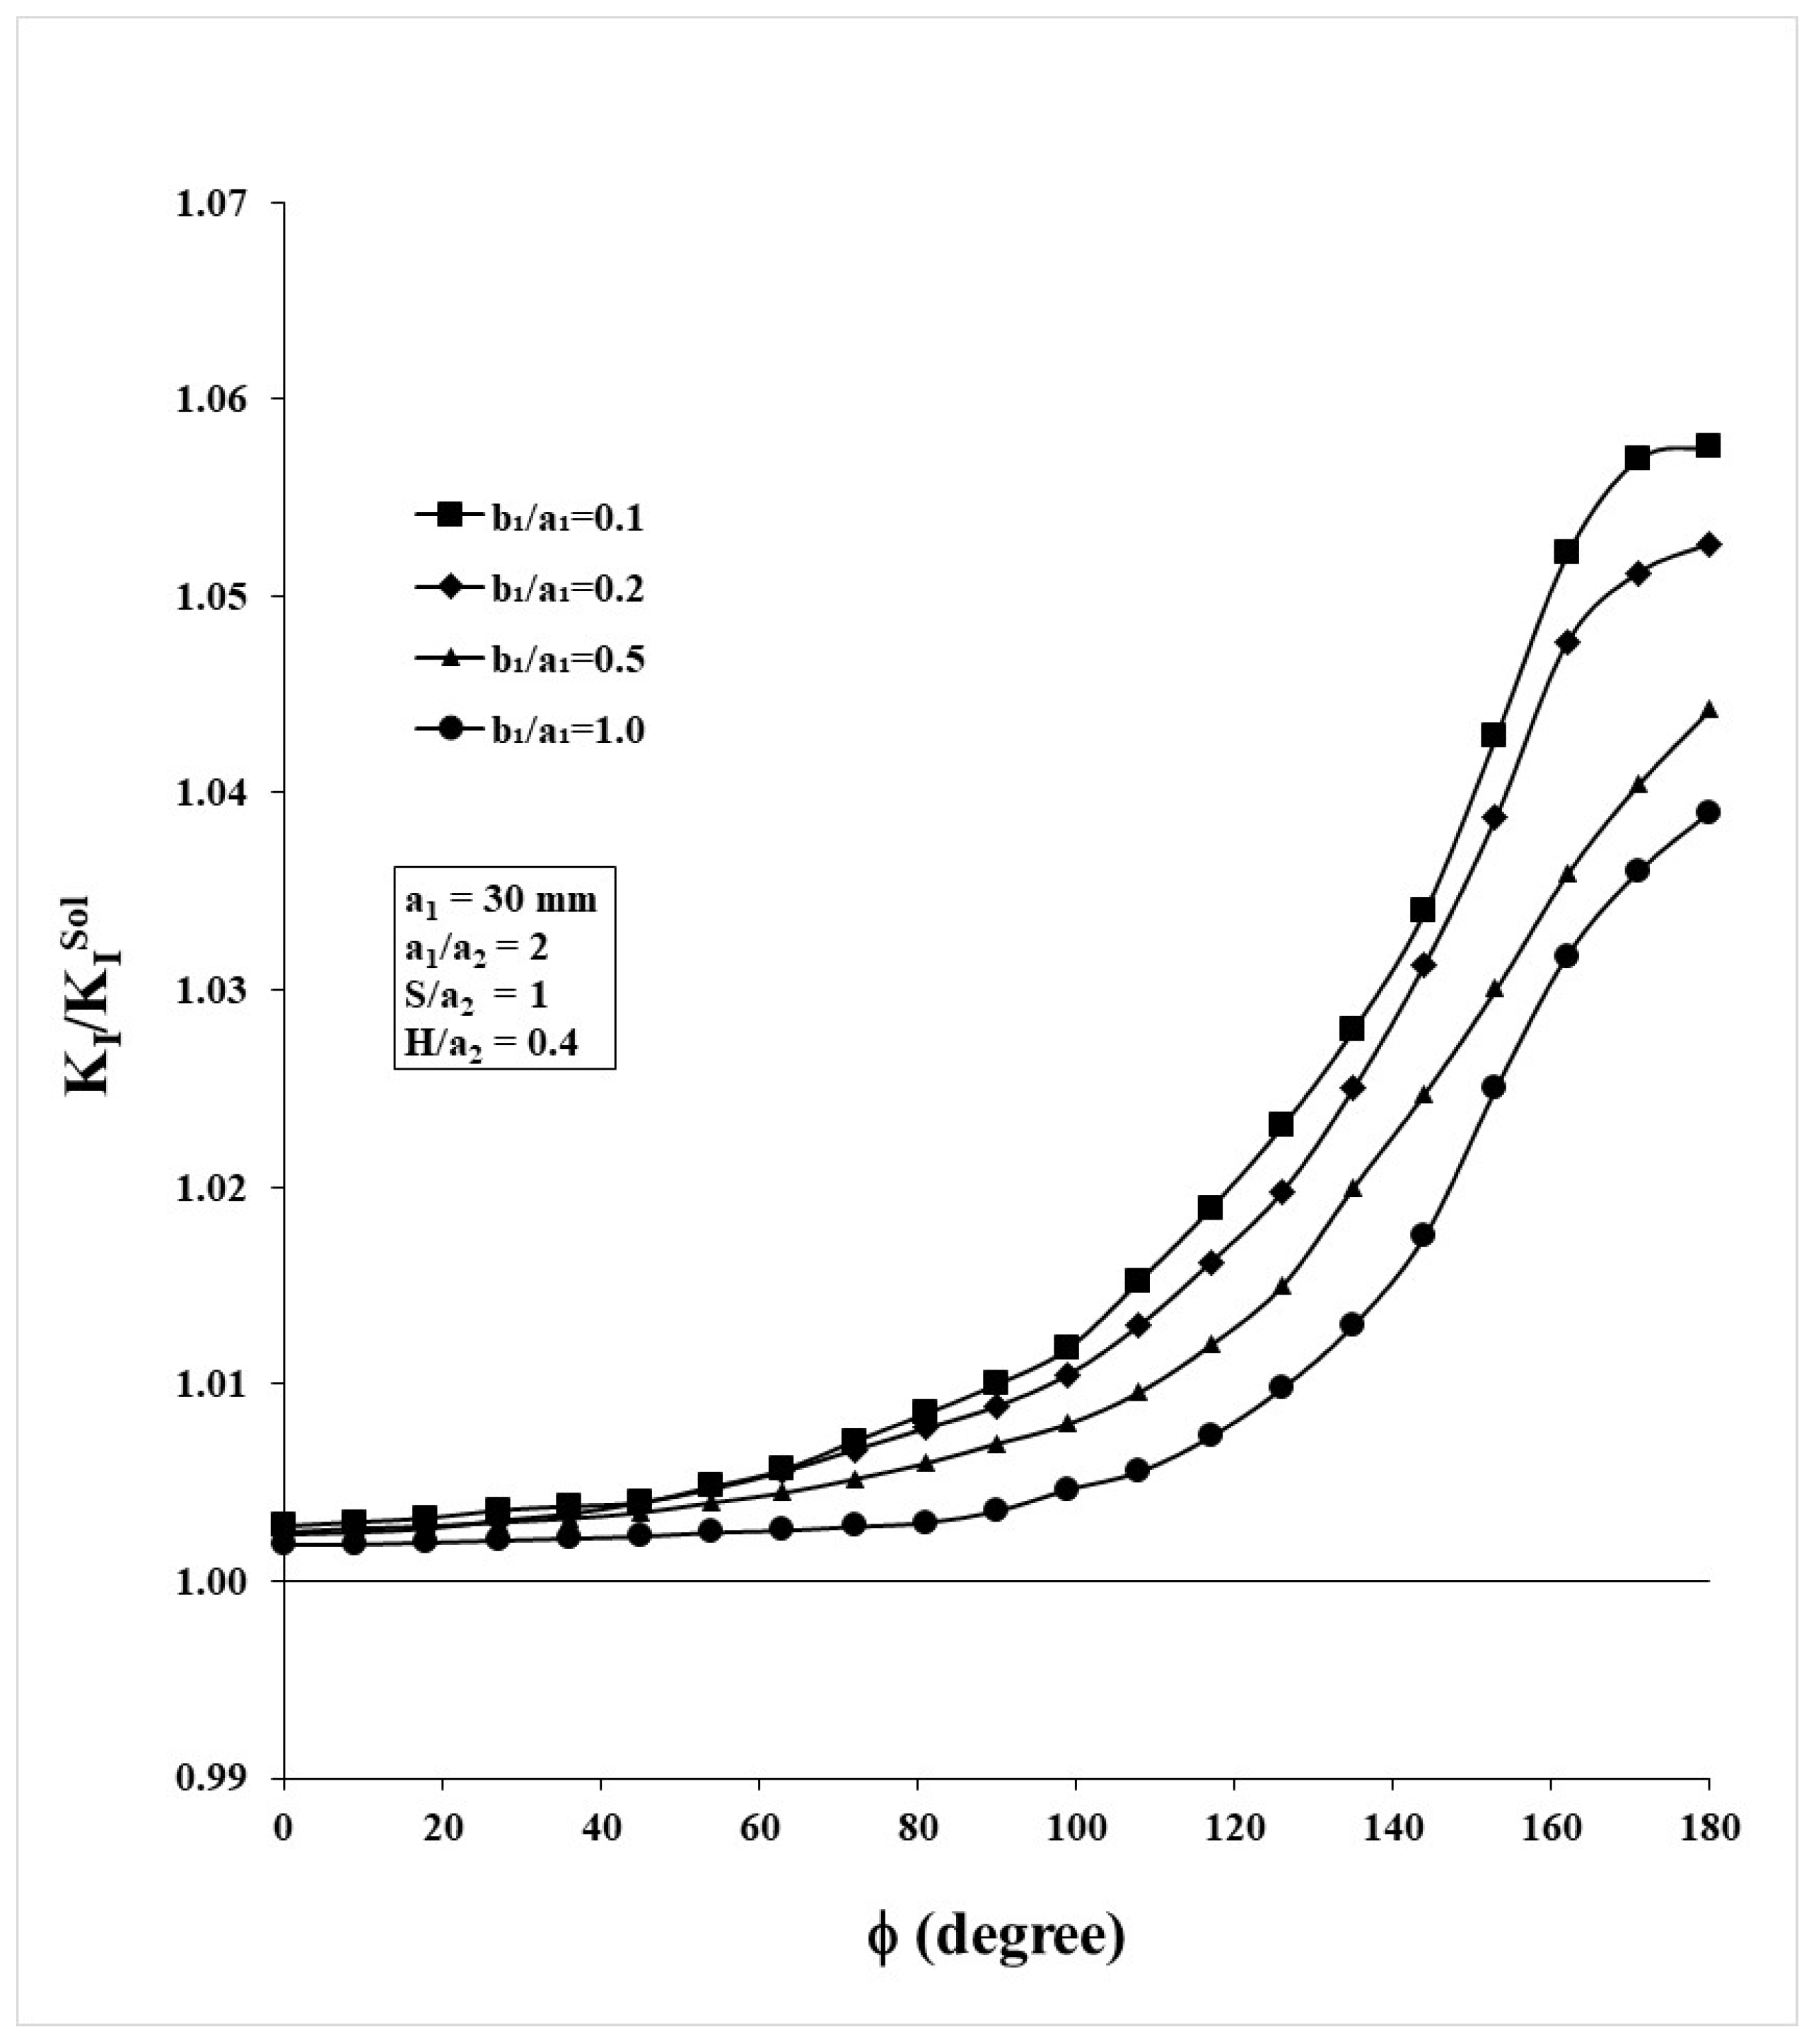
It is noted that the two nearest crack tips of the SESC and QCCC show a higher SIF since the QCCC still has a muted influence due to the vertical closeness of the cracks. To accentuate this result, the SIFs in Figure 14 are re-normalized to their solitary counterparts, KI/ K I S o l , and are presented in Figure 15.
Figure 15 indicates in this case that the QCCC slightly amplifies the entire SIF distribution along the SESC front. For all SESC ellipticities, the minute minimum amplification of about 2‰ to 3‰ occurs at φ = 0°, the farthest point on the SESC front from the QCCC. Then, amplification increases monotonically towards φ = 180°, the closest point on the SESC front to the QCCC. The smaller the crack ellipticity, the higher the amplification. That is, for b1/a1 = 0.1, 0.2, 0.5 and 1.0, the maximum amplifications are 5.7%, 5.2%, 4.5 and 3.9%, respectively. In a manner parallel to case II, it is worthwhile noting that when the cracks are non-overlapping, no shielding effect occurs, i.e., the QCCC induces no SIF attenuation at any point on the SESC front.
For the sake of brevity, the case of a longer SESC (a1 = 30 mm, a2 = 15 mm) for horizontally overlapping but vertically distant cracks (S/a2 = −0.5, H/a2 = 1.2) is not presented herein. This case shows very little crack interaction, and, therefore, the cracks can be treated as separate cracks.

3.4. The Effect of the Quarter-Circle Corner Crack on a Shorter Semi-Elliptical Surface Crack

As the effects of the QCCC on longer SESCs have just been evaluated, attention is turned to the QCCC effects on shorter SESCs. Cases I and II are solved once again by changing the SESC size to a1 = 10 mm (a1/a2 = 2/3). The remaining parameters, the four ellipticities of the SESC, as well as the normalized gaps H/a2 and S/a2, are all kept unchanged.

3.4.1. Case VI—Smaller SESC, Horizontally Overlapping and Vertically Close Cracks

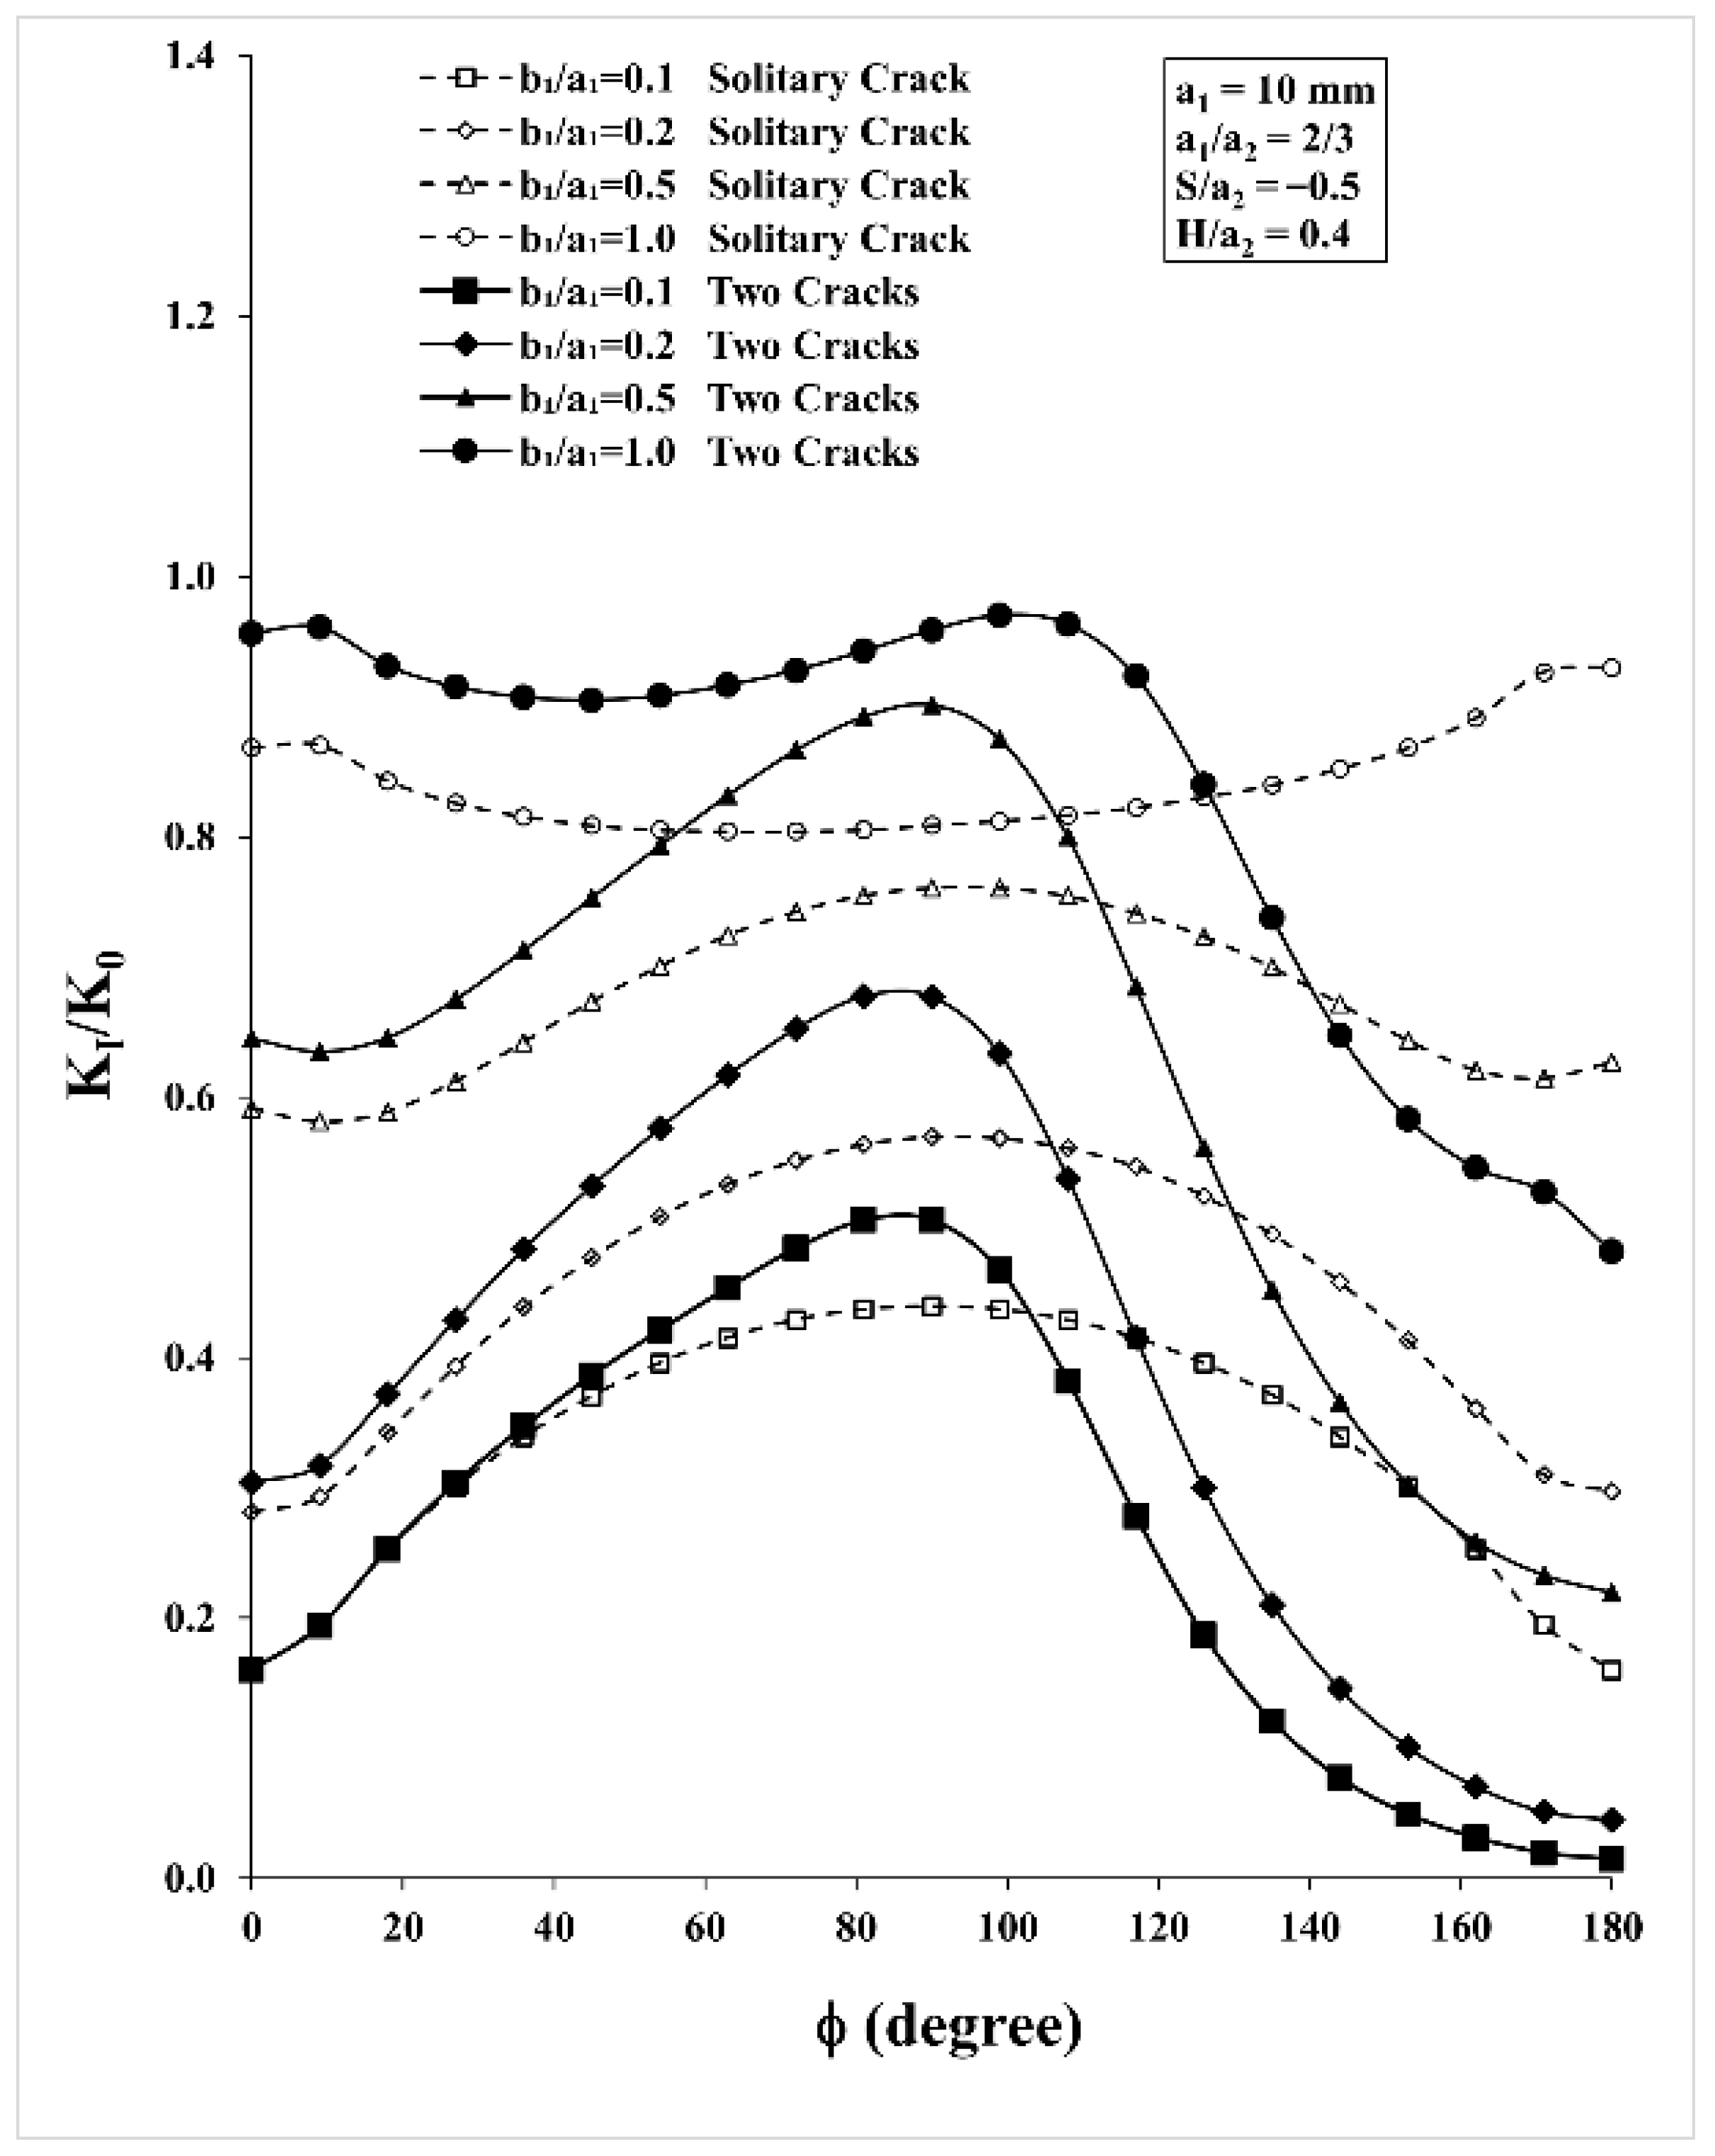
In this section the effect of the QCCC on a shorter SESC is analyzed. All the parameters of case I are kept except for the shorter SESC length, a1 = 10 mm.
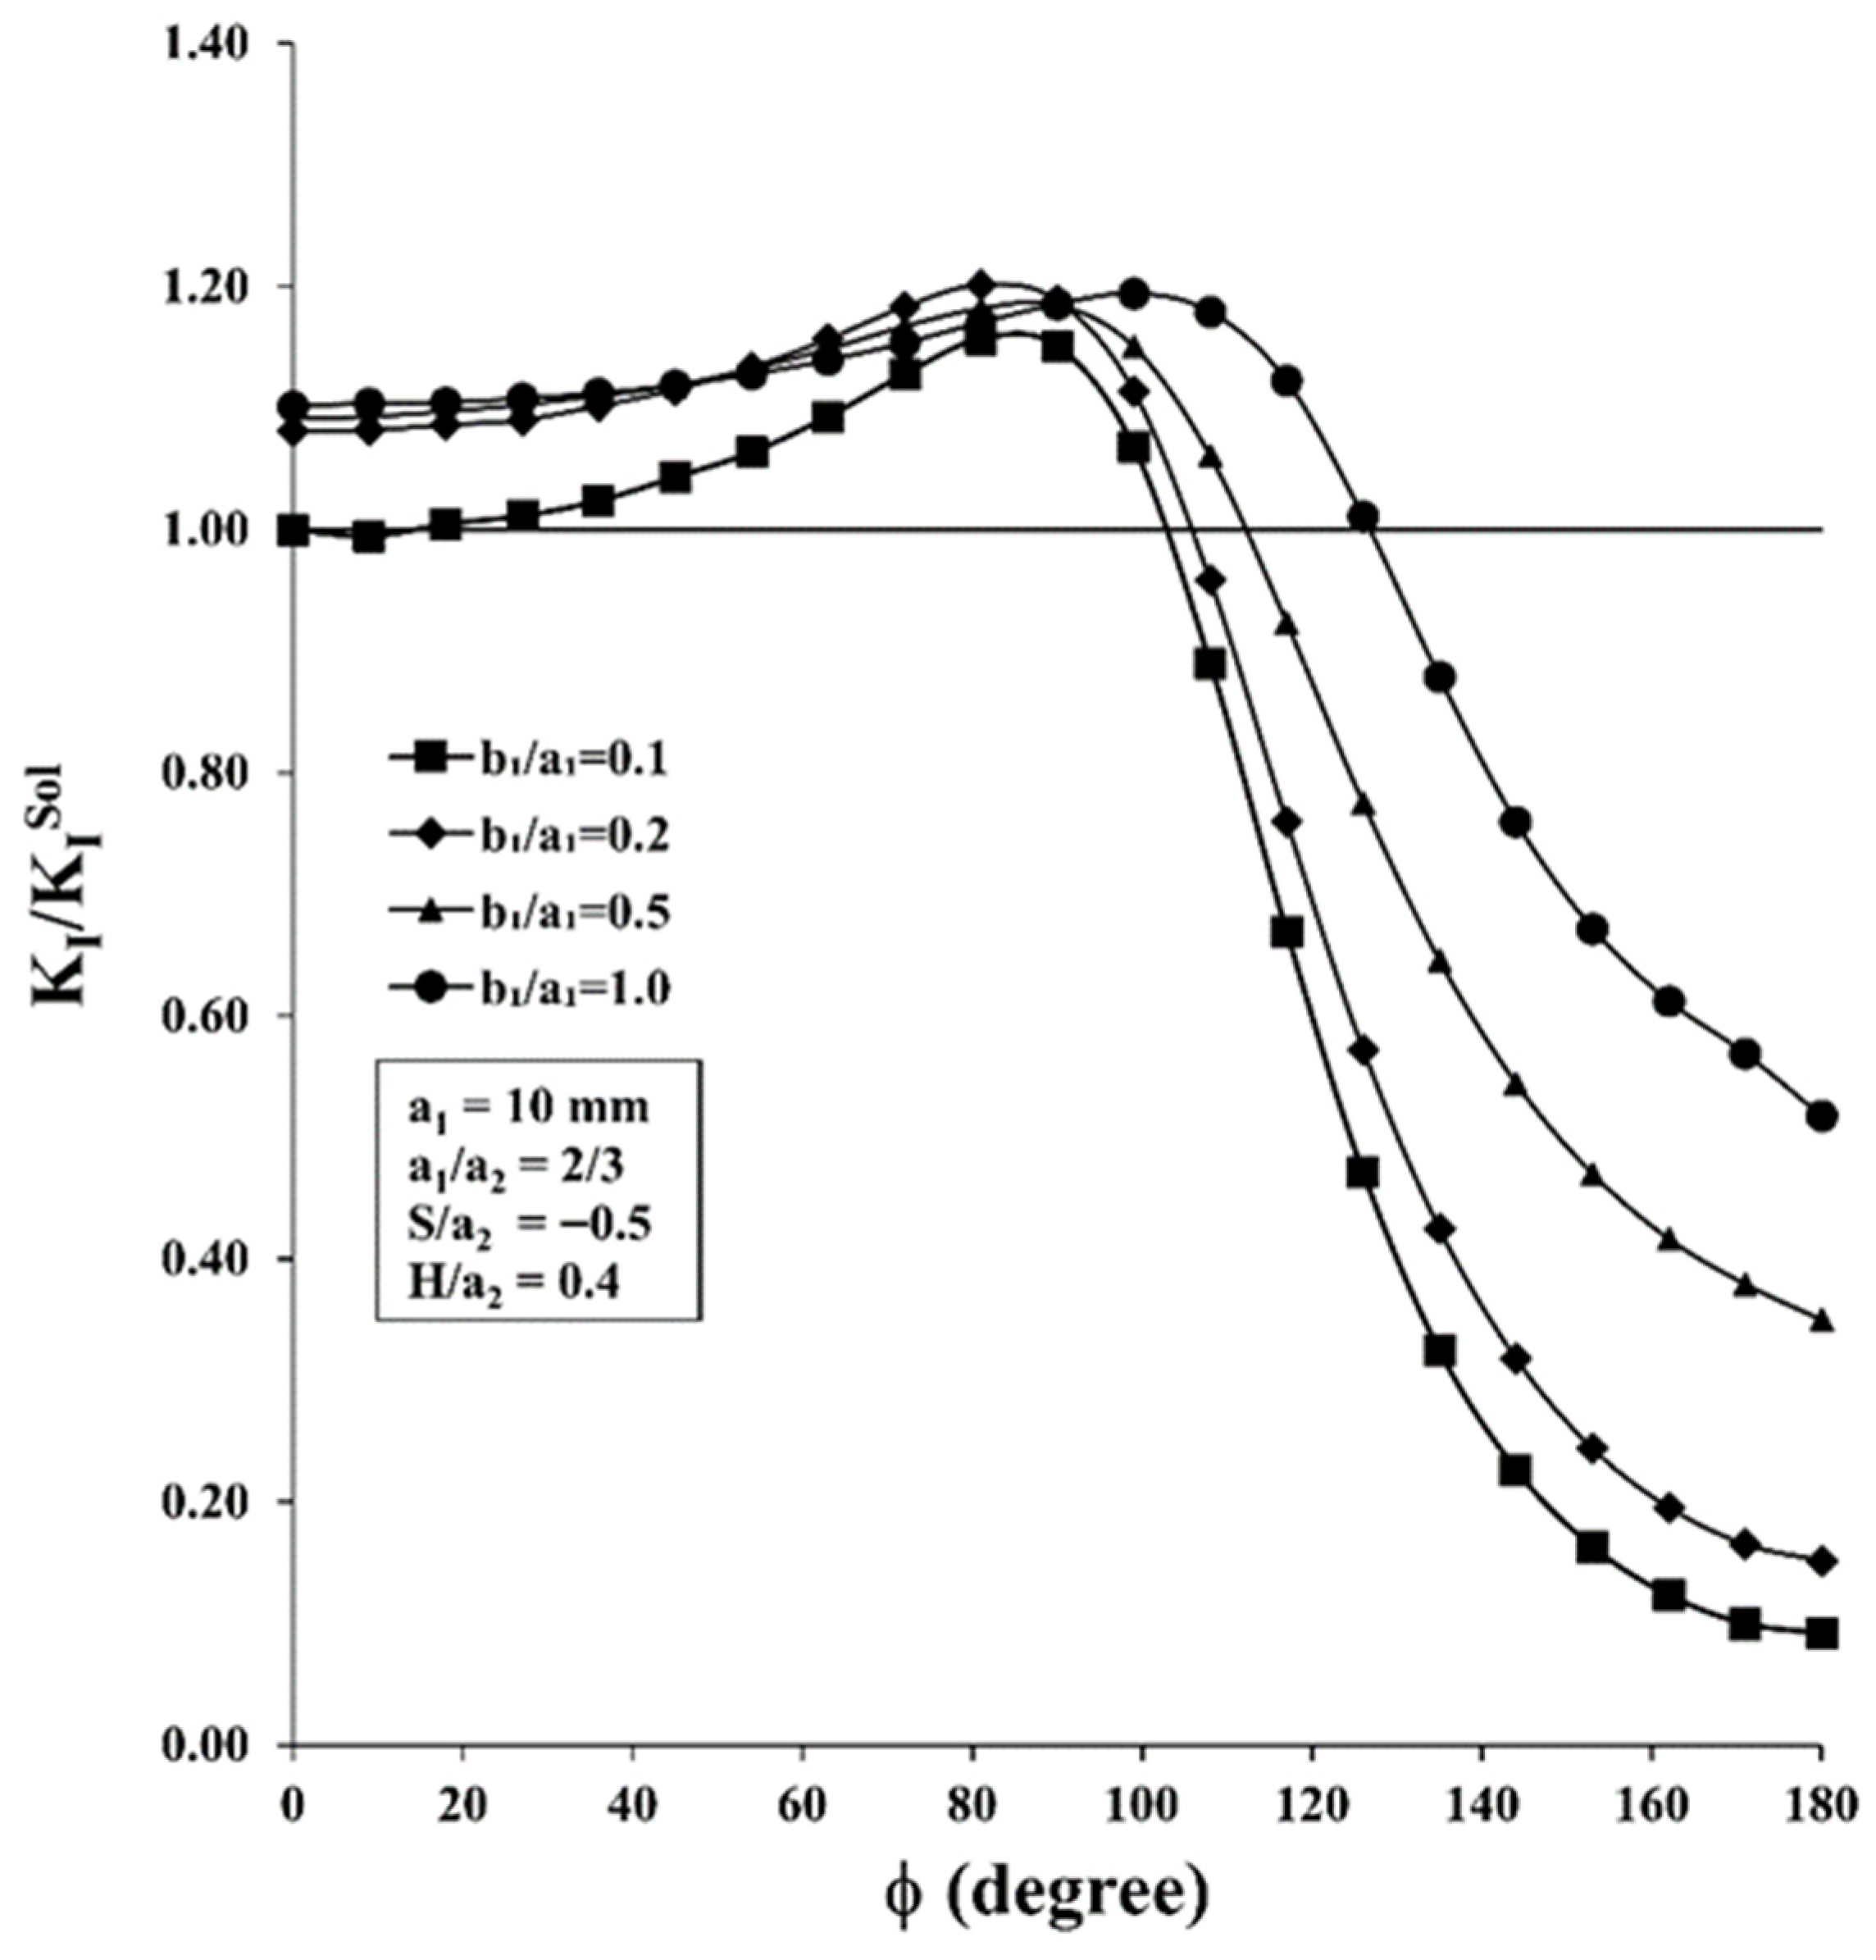
The distribution of the SIF along the front of the shorter SESC under pure in-plane bending, as affected by the presence of a QCCC, is presented in Figure 16. Comparing Figure 16 to Figure 6 (a1 = 10 mm to a1 = 15 mm), one notices that the curves are similar in appearance but that the curves of Figure 16 cross their solitary counterparts at smaller values of φ. Further, the dimensionless SIFs in Figure 16 are lower than those of Figure 6, indicating the effect of the smaller SESC a1. In addition, as the SESC ellipticity increases, the separation between each two-crack curve (dark symbols) and its corresponding solitary curve (open symbols) at φ = 0° increases, and the increases are larger in Figure 16 than in Figure 6. Lastly, the shielding effect increases with increasing ellipticity at φ = 180°.
Comparing Figure 6, Figure 12 and Figure 16, which have the same crack layout but differ in increasing SESC length, enables the evaluation of the QCCC’s impact on SESCs of different lengths. The SIF distributions in Figure 6, Figure 12 and Figure 16 follow similar patterns but differ significantly in the SIF magnitudes. As a rule, the larger the SESC length, the higher the effect of the QCCC. Furthermore, the larger the SESC’s ellipticity, the higher the influence of the QCCC on the SESC.
By following the patterns of the curves in the sequence of Figure 16, Figure 6 and Figure 12, it is noticed that only in the case where a1/a2 > 1 the b1/a1 = 1 curve shows a marked dip before the maximum is reached. Also, for the sequence of the figures given, the point at which attenuation begins moves further to the right. Thus, as the SESC length increases, the QCCC’s influence is to drive the initial attenuation point towards φ = 180° for all the ellipticities evaluated. The largest influence occurs on the b1/a1 = 1 SESC.
The results in Figure 17 represent the re-normalized values of KI/K0 of Figure 16, with their solitary counterparts yielding KI/ K I S o l . To evaluate the effect of the QCCC on an SESC of increasing size, one needs to compare Figure 7, Figure 13 and Figure 17. Although the curves’ patterns in these three figures are similar, the values of KI/ K I S o l differ substantially as a result of the different SESC lengths: 10, 15 and 30 mm, respectively. In these three cases the SESC size, a1, as well as its ellipticity, b1/a1, are analyzed with respect to the following three patterns: (1) how they affect the maximum amplification and its location along the SESC front; (2) the size of the SESC’s segment along which amplification occurs; and, (3) the maximum attenuation and its location.
From these three figures one can conclude that:
  • The maximum amplification slightly increases with both SESC size and its ellipticity; e.g., for a1 = 10 mm and b1/a1 = 0.1, KI/ K I S o l = 1.16, while for a1 = 30 mm and b1/a1 = 1.0, KI/  K I S o l = 1.26.
  • The location of the maximum amplification point φmax increases with both the SESC size and its ellipticity. For example, in the case of a1 = 10 mm and b1/a1 = 0.1, φmax ≈ 103°, while in the case of a1 = 30 mm and b1/a1 = 1.0, it is located at φmax ≈ 168°.
  • From the previous conclusion it is clear that the longer the crack and the higher its ellipticity, the longer is the amplification zone along the SESC front. For example, for a1 = 10 mm and b1/a1 = 0.1 the amplification zone ranges from φ = 0° to ≈103°, while in the case of a1 = 30 mm and b1/a1 = 1.0, it extends from φ = 0° to ≈168°.
  • The shorter and the shallower (smaller ellipticity) the SESC is, the higher its maximum SIF attenuation. For example, for the shortest and shallowest SESC, a1 = 10 mm and b1/a1 = 0.1, KI/ K I S o l = 0.09. That is to say, the SIF is 91% lower than the SIF of the comparable solitary crack. Yet, for the longest, semi-circular surface crack, a1 = 30 mm and b1/a1 = 1.0, KI/  K I S o l = 0.66, indicating that the SIF is only 34% lower than that of its comparable solitary counterpart.
  • The maximum attenuation occurs for all SESC sizes and ellipticities in the same location, φ = 180°.

3.4.2. Case VII—Shorter SESC, Horizontally Non-Overlapping and Vertically Close Cracks

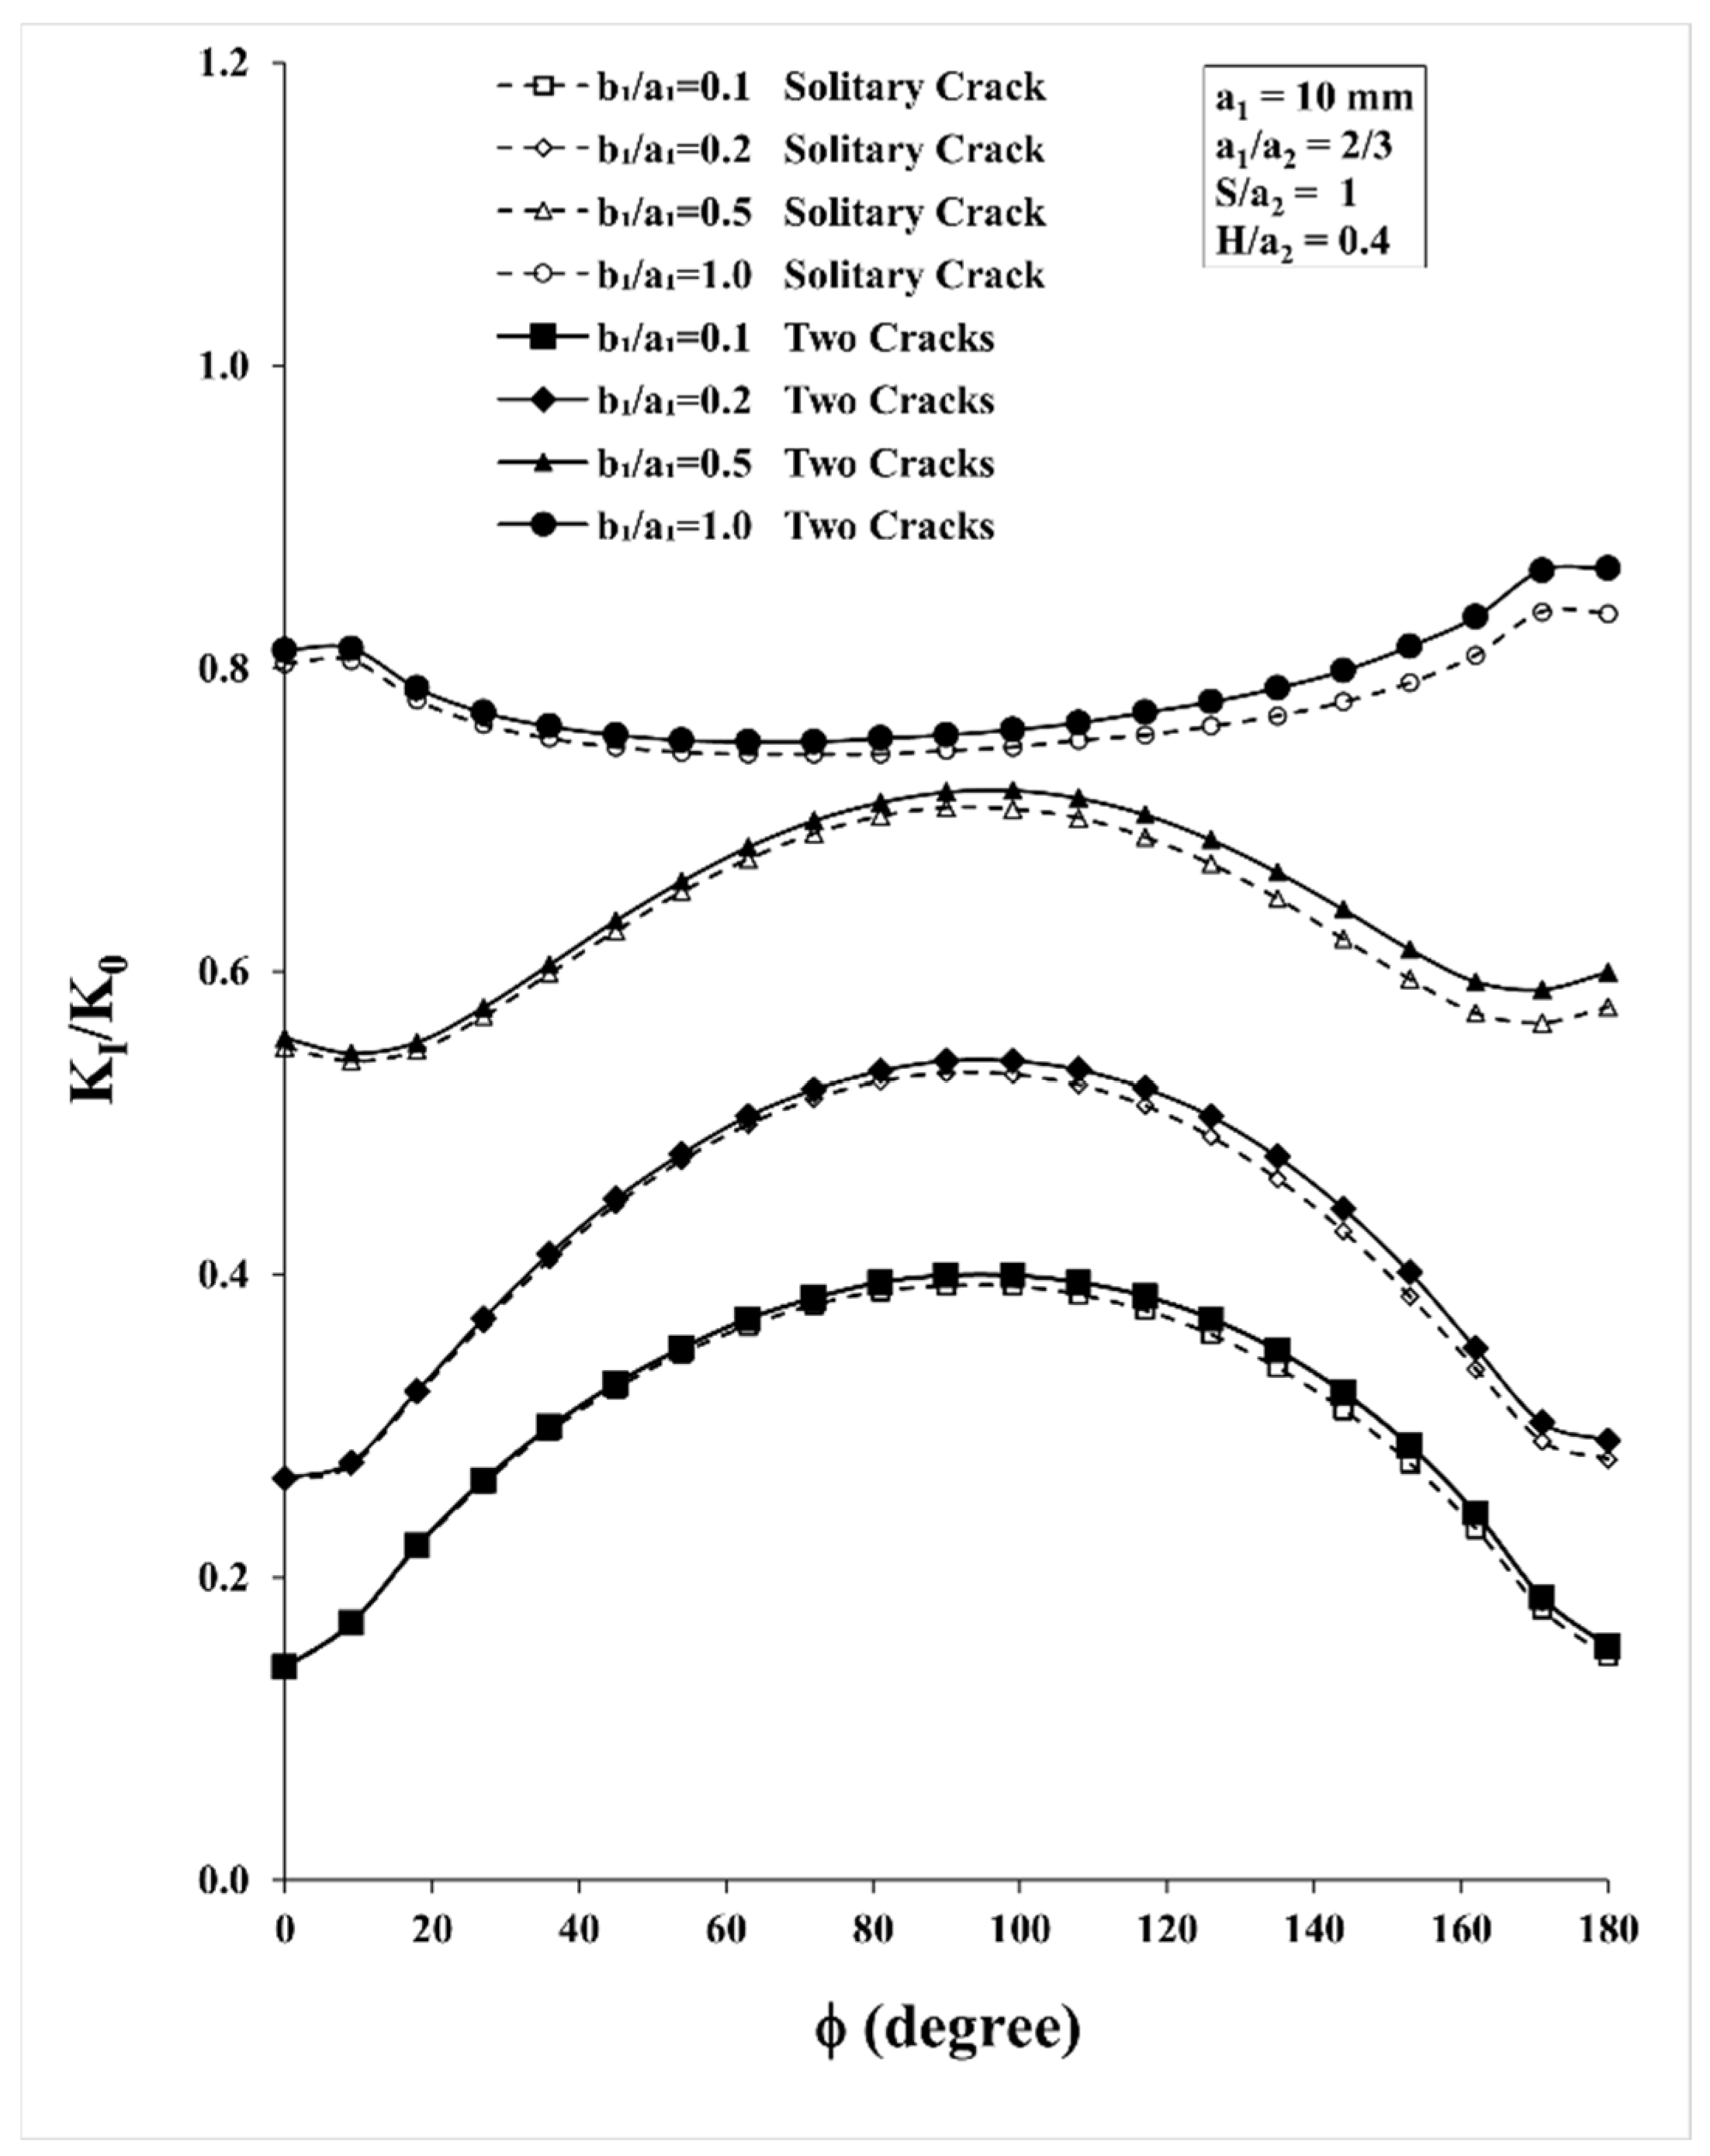
The results in Figure 18 represent the effect the QCCC has on a non-overlapping (S/a2 = 1) shorter SESC, a1 = 10 mm. Case VII is case VI, with the only change being the size of the horizontal gap to S/a2 = 1, creating a non-overlapping configuration.
As in cases II and V, once the SESC is moved horizontally away from the QCCC, S/a2 = 1, the SIF distribution along the SESC front is minimally influenced by the presence of the QCCC. Hence, there is no more reciprocal interaction between the two cracks, and they can be treated as isolated cracks (see also [3]). Furthermore, the difference between the crack curves and their corresponding solitary crack curves is the smallest.
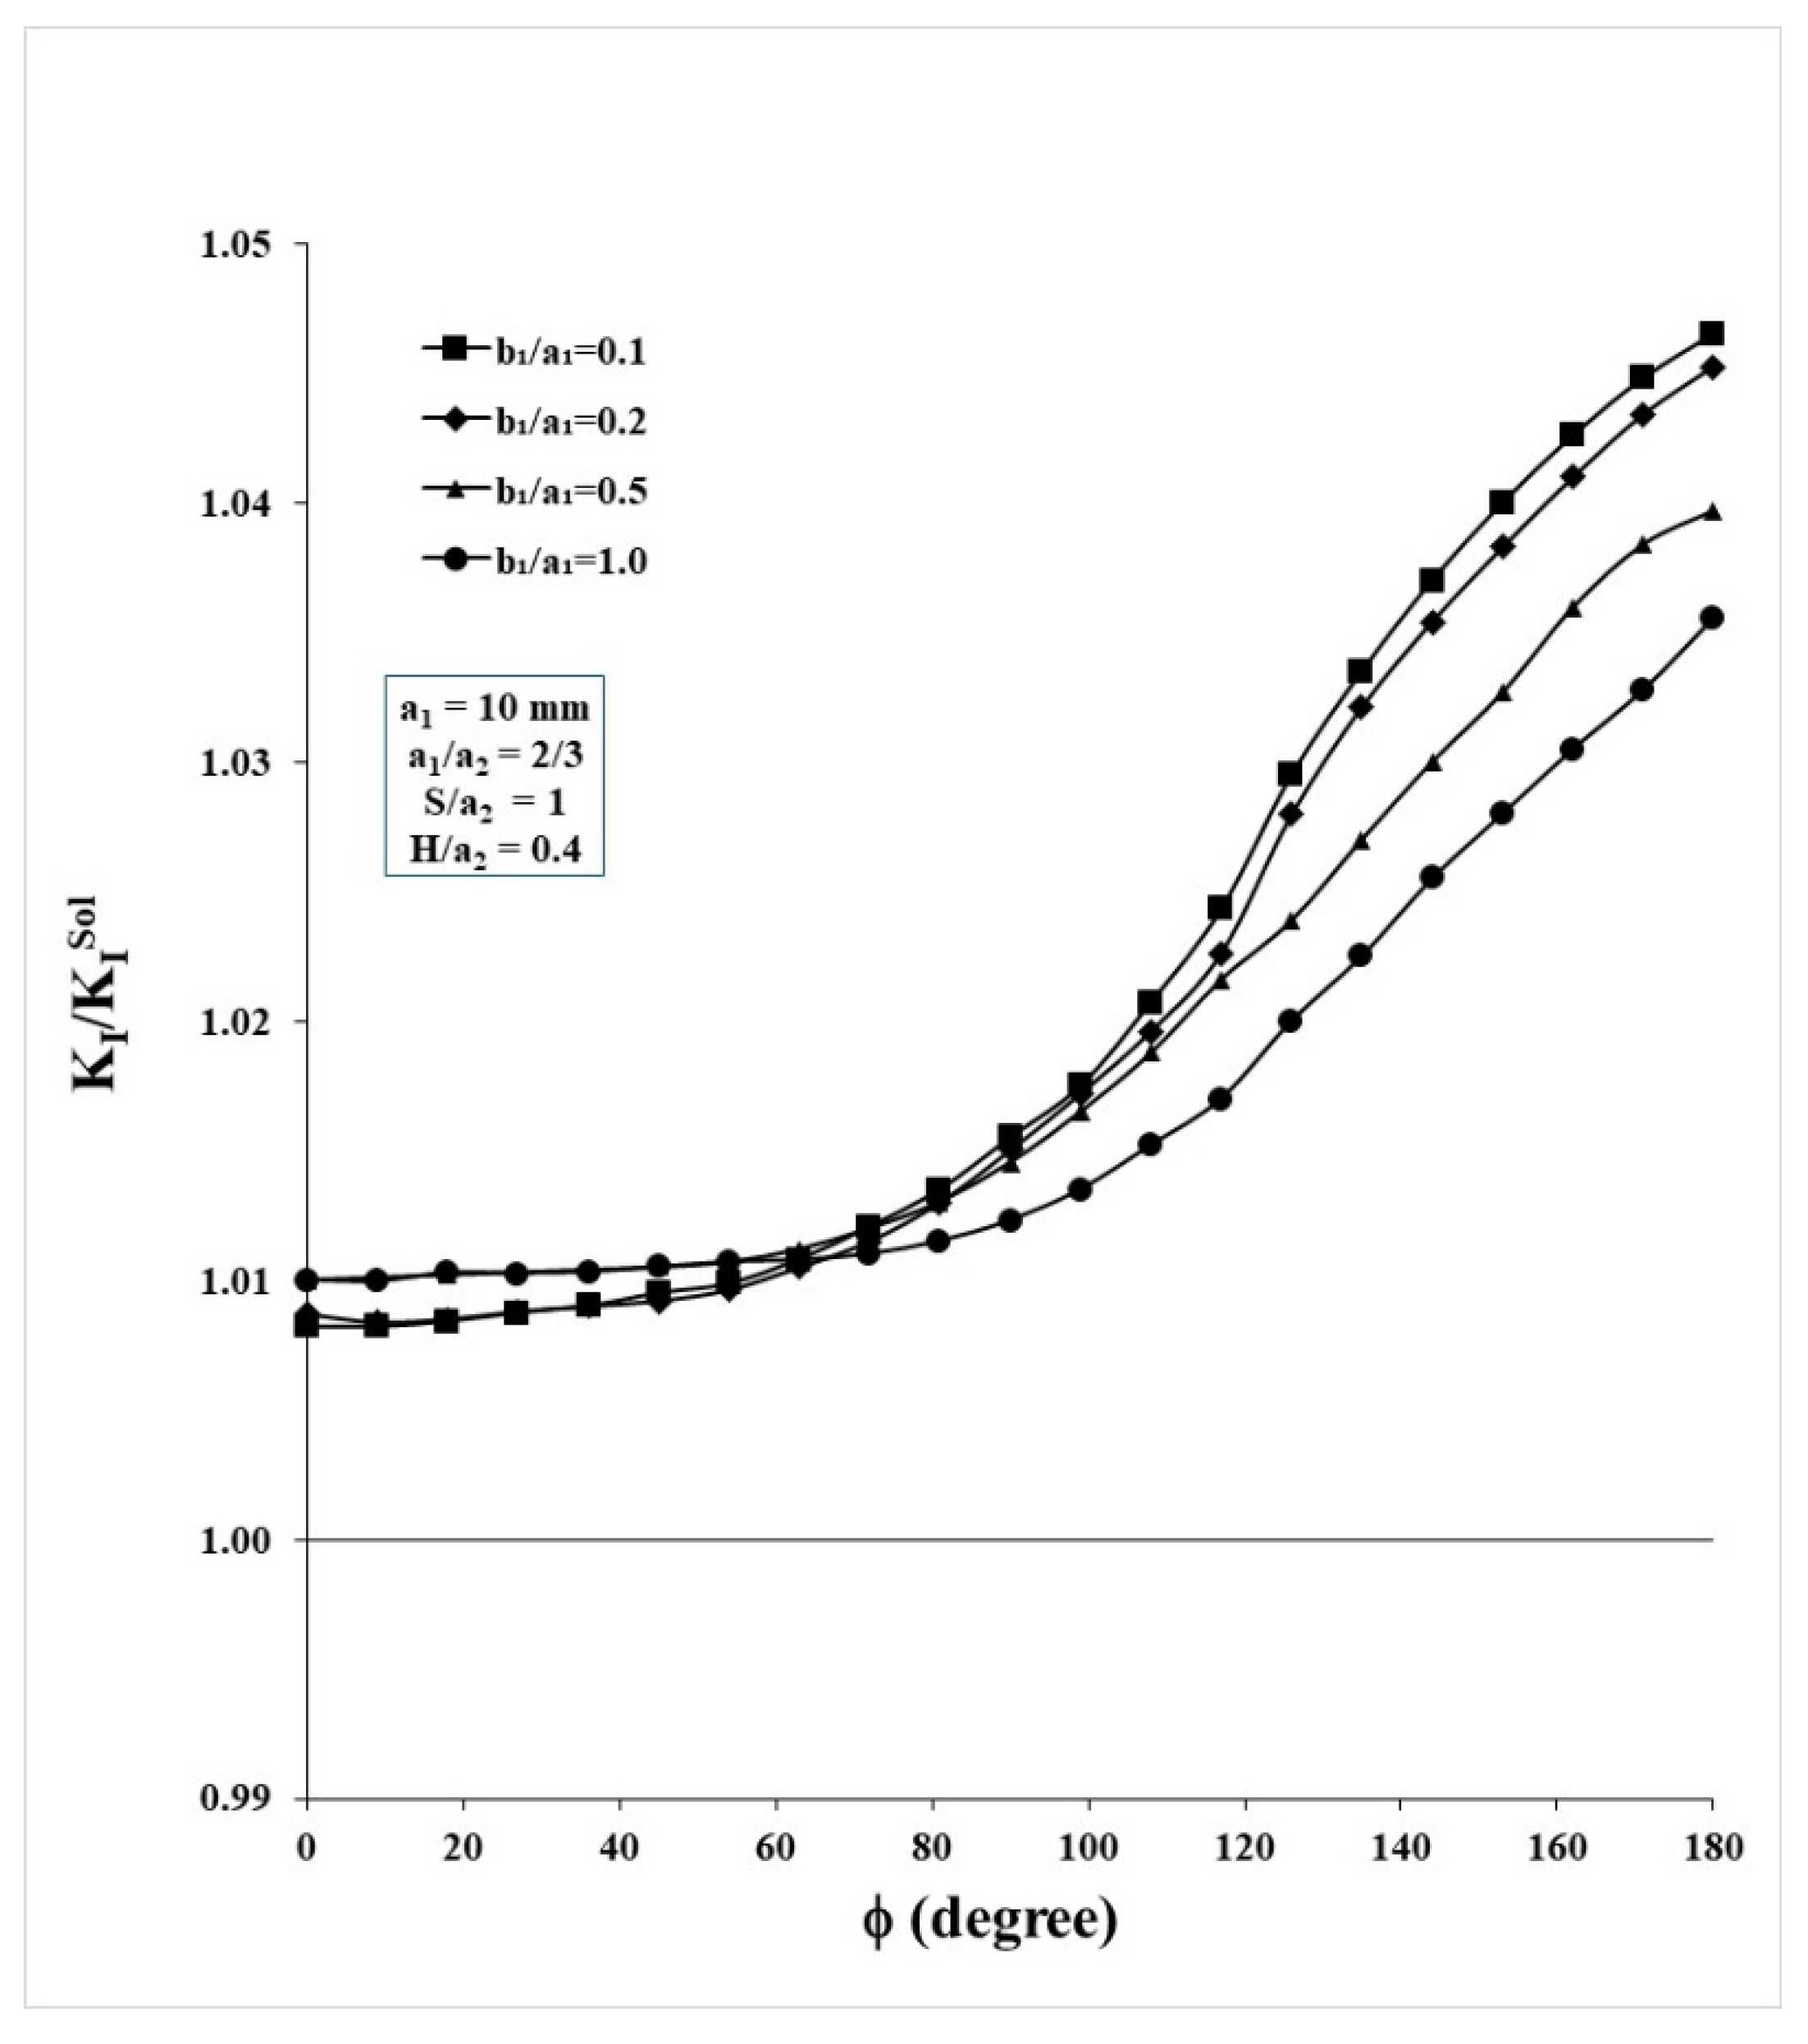
In Figure 19, the SIFs along the crack front of the shorter crack are normalized to their solitary counterparts, yielding KI/ K I S o l . In this case, the SESC does not overlap with the QCCC, resulting in only a very small amplifying effect of the QCCC on the SESC. The amplification is less than 1% at the farthest point of the SESC from the QCCC, φ = 0°, for all crack ellipticities. At the closest point on the SESC’s crack front to the QCCC, φ = 180°, the maximum amplification is between 4.7% for the shallowest SESC, b1/a1 = 0.1, and 3.6% for the semi-circular surface crack, b1/a1 = 1.0.
For the sake of conciseness, the results for horizontally overlapping and vertically distant cracks (S/a2 = −0.5, H/a2 = 1.2) in the case of a shorter SESC, a1 = 10 mm and a2 = 15 mm, are not presented. In those cases, there are practically no interactions between the two cracks, and they can therefore be treated as separate cracks.

4. Concluding Remarks

The effect of a quarter-circle corner crack on the SIF distribution of adjacent semi-elliptic surface cracks of various lengths and ellipticities is studied employing a 3-D finite element analysis. The two-crack system is simulated to exist in a homogeneous, semi-infinite solid subjected to in-plane bending.
The results demonstrate that the SIFs along the crack front of a semi-elliptic surface crack can be significantly affected by the presence of an adjacent quarter-circle corner crack. The QCCC can have simultaneously opposite effects on the SESC, amplifying the SIFs along part of the SESC front, while attenuating the SIFs along the rest of it.
For a given fixed size of the QCCC, the level of this effect on the SESC depends on several parameters: the size, a1, and the ellipticity, b1/a1, of the SESC; the relative size of the SESC with respect to the QCCC, a1/a2; and, the normalized horizontal gap, S/a2, and vertical gap, H/a2, between the two cracks.
When the two cracks overlap horizontally, the QCCC induces a shielding effect on a portion of the SESC front. This effect results in the attenuation of the SIF along that part of the SESC front, whereas along the rest of the SESC front, the SIFs are amplified. In contrast, when the two cracks are horizontally non-overlapping and further apart, the QCCC amplifies the SIFs along the entire crack front of the SESC.
It is worthwhile noting that in a 3-D configuration, like the present one, KII and KIII may arise and be non-negligible with respect to KI. Thus, in order to investigate this possibility in the present analysis, KI, KII and KIII were evaluated for all the cases. KII and KIII were found to be much smaller than KI, with KII and KIII being one to two orders of magnitude smaller, thus fully justifying their non-inclusion in the present analysis.
Based on the results in this paper, as well as the results in Part I [1], it is clear that the simple FFS criteria, provided in [2,3,4,5,6], might not necessarily be suitable for certain 2-D crack layouts and for complex 3-D crack configurations. Thus, when dealing with the FFS of a critical mechanical component, a complete 3-D analysis is needed to provide a reliable solution for such intricate crack layouts.
A limitation of this unsponsored research work is that no experimentation was performed to validate the simulation results. The authors are looking at that aspect and will report on the results elsewhere in the future.

Author Contributions

Conceptualization, M.P.; software, Q.M.; formal analysis, M.P.; investigation, Q.M. and C.L.; writing—original draft, M.P.; writing—review and editing, C.L. All authors have read and agreed to the published version of the manuscript.

Funding

This research received no external funding.

Informed Consent Statement

The engineering simulation information within the paper is provided for general informational and educational purposes only and is not a substitute for professional advice. Also, we do not provide any kind of engineering simulation advice. Accordingly, before taking any actions based upon such information, the authors encourage the reader to consult with appropriate professionals. The use or reliance on any information contained in the paper is solely at the reader’s risk.

Data Availability Statement

The original contributions presented in this study are included in the article. Further inquiries can be directed to the corresponding author.

Acknowledgments

The third author (Q.M.) would like to express his deep gratitude to Walla Walla University for its support of this research work through its Faculty Development Grant.

Conflicts of Interest

The authors declare no conflicts of interest.

Nomenclature

a1half semi-elliptical surface crack length
a2corner crack length
b1semi-elliptical surface crack depth
ALarc length function
EYoung’s modulus
Hvertical gap between the cracks
KImode I SIF
K I S O L mode I SIF for the solitary crack
K0Normalizing SIF
Shorizontal gap between the cracks
Greek Symbols
υPoisson’s ratio
σthe maximum bending stress (see Figure 1a)
φparametric angle (see Figure 1a,b)
Acronyms
ALArc Length
DOFDegrees of Freedom
FEMFinite Element Method
FEFinite Element
FFSFitness-for-Service
QCCCQuarter-Circle Corner Crack
SESCSemi-Elliptical Surface Crack
SIFStress Intensity Factor

References

  1. Perl, M.; Ma, Q.; Levy, C. Fitness-for-Service Analysis of the Interplay between a Quarter-Circle Corner Crack and a Parallel Semi-Elliptical Surface Crack in a Semi-Infinite Solid Subjected to In-Plane Bending: Part I—The Effect on the Quarter-Circle Corner Crack. Appl. Sci. (Fatigue Fract. Eng. Mater.) 2025, 15, 12718. [Google Scholar] [CrossRef]
  2. API 579-1/ASME FFS-1; Fitness-For-Service. 4th ed. The American Petroleum Institute and The American Society of Mechanical Engineers: Washington, DC, USA, 2021.
  3. ASME. Section XI: Rules for Inservice Inspection of Nuclear Power Plant Components. In The ASME Boiler and Pressure Vessel Code, 2025 ed.; ASME International: New York, NY, USA, 2025. [Google Scholar]
  4. BS 7910:2019; Guide to Methods for Assessing the Acceptability of Flaws in Metallic Structures. British Standards Institution: London, UK, 2019.
  5. GTC1-2001-43049; Revision MK8; European Fitness-for-Service Network (FITNET). European Committee for Standardisation: Brussels, Belgium, 2008.
  6. JSME S NA1-2008; Rules on Fitness-for-Service for Nuclear Power Plant. 2008 ed. Japan Society of Mechanical Engineers: Tokyo, Japan, 2008. (In Japanese)
  7. ANSYS Inc. ANSYS Mechanical APDL, Fracture Analysis Guide; Release 2024 R2; ANSYS, Inc.: Canonsburg, PA, USA, 2024. [Google Scholar]
  8. Raju, I.S.; Newman, J.C., Jr. Stress-intensity factors for a wide range of semi-elliptical surface cracks in finite-thickness plates. Eng. Fract. Mech. 1979, 11, 817–829. [Google Scholar] [CrossRef]
  9. Hasegawa, K.; Saito, K.; Miyazaki, K. Alignment Rule for Non-Aligned Flaws for Fitness-for Service Evaluations Based on LEFM. ASME J. Press. Vessel Tech. 2009, 131, 041403. [Google Scholar] [CrossRef]
  10. Ma, Q.; Levy, C.; Perl, M. A LEFM Based Study on the Interaction Between an Edge and a Horizontal Parallel Crack. In Proceedings of the 2013 ASME PVP Conference, Paris, France, 14–18 July 2013. [Google Scholar]
  11. Toribio, J.; González, B.; Matos, J.C.; Mulas, Ó. Stress Intensity Factors for Embedded Surface and Corner Cracks in Finite-Thickness Plates Subjected to Tensile Loading. Materials 2021, 14, 2807. [Google Scholar] [CrossRef] [PubMed]
  12. Cheng, T.; Mei Huang, M.; Li, Y.; Liu, W.; Wang, W.; Meng, X.; Ouyang, X. Influence of Interaction Among Multiple Cracks on Crack Propagation in Nozzle Corner of Reactor Pressure Vessel. Ann. Nucl. Ener. 2023, 194, 110142. [Google Scholar] [CrossRef]
  13. Ferrian, F.; Cornetti, P.; Sapora, A.; Hossein Talebi, A.; Ayatollahi, M.R. Crack Tip Shielding and Size Effect Related to Parallel Edge Cracks Under Uniaxial Tensile Loading. Int. J. Fract. 2024, 245, 223–233. [Google Scholar] [CrossRef]
  14. Wang, Z.W.; Li, D.M.; Zhong, Y.F.; Liu, Y.K.; Shao, Y.N. Review of Experimental, Theoretical and Numerical Advances in Multi-Crack Fracture Mechanics. Mathematics 2024, 12, 3881. [Google Scholar] [CrossRef]
  15. Ritchie, R.O. Mechanisms of fatigue crack propagation in metals, ceramics and composites: Role of crack tip shielding. Mater. Sci. Eng. 1988, 103, 15–28. [Google Scholar] [CrossRef]
Figure 1. A 3-D view of the cracked solid under in-plane bending. (a) The definition of the geometrical and loading parameters of the non-aligned interacting semi-elliptical surface crack and quarter-circle corner crack. (b) The definition of the parametric angle φ.
Applsci 16 01240 g001
Figure 2. Typical Fracture Tool rectangular block containing the SESC and QCCC meshing: (a) the rectangular block containing the SESC and QCCC; (b) section view of the semi-elliptical crack front.
Applsci 16 01240 g002
Figure 3. The normalized stress intensity factor distribution along the front of two solitary semi-elliptical surface cracks of half-length a1 = 15 mm, horizontally located at S/a2 = 1.0 (open symbols).
Applsci 16 01240 g003
Figure 4. The normalized stress intensity factor distribution along the front of two solitary semi-elliptical surface cracks of half-length a1 = 30 mm, horizontally located at S/a2 = 1.0 (open symbols).
Applsci 16 01240 g004
Figure 5. The normalized stress intensity factor distribution along the front of two solitary semi-elliptical surface cracks of half-length a1 = 10 mm, horizontally located at S/a2 = 1.0 (open symbols).
Applsci 16 01240 g005
Figure 6. The SIFs distributions along the front of the SESC in the presence of the QCCC (solid symbols), a1 = a2 = 15 mm, and for a solitary crack (open symbols), for horizontally overlapping, S/a2 = −0.5, and vertically close, H/a2 = 0.4, cracks.
Applsci 16 01240 g006
Figure 7. The amplification/attenuation effect of the QCCC on the SIF distribution along the front of the SESC, a1 = a2 = 15 mm, for horizontally overlapping, S/a2 = −0.5, and vertically close, H/a2 = 0.4, cracks.
Applsci 16 01240 g007
Figure 8. The SIFs distributions along the front of the SESC in the presence of the QCCC (solid symbols) and as a solitary crack (open symbols), a1 = a2 = 15 mm, for horizontally non-overlapping, S/a2 = 1.0, and vertically close, H/a2 = 0.4, cracks.
Applsci 16 01240 g008
Figure 9. The amplification effect of the QCCC on the SIF distribution along the front of the SESC, a1 = a2 = 15 mm, for horizontally non-overlapping, S/a2 = 1.0, and vertically close, H/a2 = 0.4, cracks.
Applsci 16 01240 g009
Figure 10. The SIFs distributions along the front of the SESC in the presence of the QCCC (solid symbols) and as a solitary crack (open symbols), a1 = a2 = 15 mm, for horizontally overlapping, S/a2 = −0.5, and vertically distant, H/a2 = 1.2, cracks.
Applsci 16 01240 g010
Figure 11. The amplification/attenuation effect of the QCCC on the SIF distribution along the front of the SESC, a1 = a2 = 15 mm, for horizontally overlapping, S/a2 = −0.5, and vertically distant, H/a2 = 1.2, cracks.
Applsci 16 01240 g011
Figure 12. The SIFs distributions along the front of a longer SESC in the presence of the QCCC (solid symbols) and as a solitary crack (open symbols), a1 = 30 mm and a2 = 15 mm, for horizontally overlapping, S/a2 = −0.5, and vertically close, H/a2 = 0.4, cracks.
Applsci 16 01240 g012
Figure 13. The amplification/attenuation effect of the QCCC on the SIF distribution along the front of the longer SESC, a1 = 30 mm and a2 = 15 mm, for horizontally overlapping, S/a2 = −0.5, and vertically close, H/a2 = 0.4, cracks.
Applsci 16 01240 g013
Figure 14. The SIFs distributions along the front of the longer SESC in the presence of the QCCC (solid symbols) and for a solitary crack (open symbols), a1 = 30 mm and a2 = 15 mm, for horizontally non-overlapping, S/a2 = 1.0, and vertically close, H/a2 = 0.4, cracks.
Applsci 16 01240 g014
Figure 15. The amplification effect of the QCCC on the SIF distribution along the front of the longer SESC, a1 = 30 mm and a2 = 15 mm, for horizontally non-overlapping, S/a2 = 1.0, and vertically close, H/a2 = 0.4, cracks.
Applsci 16 01240 g015
Figure 16. The SIFs distributions along the front of a shorter SESC in the presence of the QCCC (solid symbols) and as a solitary crack (open symbols), a1 = 10 mm and a2 = 15 mm, for horizontally overlapping, S/a2 = −0.5, and vertically close, H/a2 = 0.4, cracks.
Applsci 16 01240 g016
Figure 17. The amplification/attenuation effect of the QCCC on the SIF distribution along the front of the shorter SESC, a1 = 10 mm and a2 = 15 mm, for horizontally overlapping, S/a2 = −0.5, and vertically close, H/a2 = 0.4, cracks.
Applsci 16 01240 g017
Figure 18. The SIFs distributions along the front of a shorter SESC in the presence of the QCCC (solid symbols) and as a solitary crack (open symbols), a1 = 10 mm and a2 = 15 mm, for horizontally non-overlapping, S/a2 = 1.0, and vertically close, H/a2 = 0.4, cracks.
Applsci 16 01240 g018
Figure 19. The amplification effect of the QCCC on the SIF distribution along the front of the shorter SESC, a1 = 10 mm and a2 = 15 mm, for horizontally non-overlapping, S/a2 = 1.0, and vertically close, H/a2 = 0.4, cracks.
Applsci 16 01240 g019
Disclaimer/Publisher’s Note: The statements, opinions and data contained in all publications are solely those of the individual author(s) and contributor(s) and not of MDPI and/or the editor(s). MDPI and/or the editor(s) disclaim responsibility for any injury to people or property resulting from any ideas, methods, instructions or products referred to in the content.