Article

Fostering Scientific Skill Development Through Interactive Classification of Celestial Bodies

1
Leiden Observatory, Leiden University, 2333 CC Leiden, The Netherlands
2
Science Education Research Group, Faculty of Education, Amsterdam University of Applied Sciences, 1091 GM Amsterdam, The Netherlands
3
Department of Science Communication & Society, Institute of Biology, Leiden University, 2333 BE Leiden, The Netherlands
4
Netherlands Research School for Astronomy (NOVA), 1098 XH Amsterdam, The Netherlands
5
Anton Pannekoek Institute for Astronomy, University of Amsterdam, 1098 XH Amsterdam, The Netherlands
6
Informatics Institute, Faculty of Science, University of Amsterdam, 1098 XH Amsterdam, The Netherlands
*
Author to whom correspondence should be addressed.
Appl. Sci. 2026, 16(20), 9978; https://doi.org/10.3390/app16209978 (registering DOI)
Submission received: 20 July 2026 / Revised: 25 September 2026 / Accepted: 7 October 2026 / Published: 9 October 2026
(This article belongs to the Special Issue Innovative Applications of Artificial Intelligence in Education)

Abstract

Developing scientific literacy in primary education can be challenging. Teachers often lack the time, scientific domain knowledge, and capacity to provide individualised support and guidance during hands-on science activities. As a result, students may struggle to interpret observations and draw accurate conclusions. To address this, we designed a feedback-enhanced lesson and investigated students’ performance and engagement with optional feedback while developing classification skills using the Solar System as context. Developed within the Minds-On application, the lesson combines hands-on activities with a knowledge-based artificial intelligence approach in which encoded domain knowledge enables automated checking of students’ classifications and error-triggered feedback. Students classify celestial bodies by shape, composition, and orbit using a three-level classification tree. A classroom evaluation with 164 students (ages 10–12), using student-performance and interaction-log data, showed that most successfully engaged with the tasks and navigated their increasing complexity. Performance and interaction data indicated that task difficulty peaked at Level 2, while error rates and engagement decreased at Level 3. Although feedback was available to 89 students following an error, only 25 consulted it at least once, and use was fragmented across classification levels. The small and inconsistent feedback-user subgroup therefore does not allow strong conclusions about feedback effectiveness but provides insight into patterns of feedback uptake and interaction.

1. Introduction

Mastering science reasoning skills is a foundational step in developing scientific literacy among primary school students [1]. However, the acquisition of these reasoning skills is often hindered by a range of systemic and pedagogical challenges, including (i) a lack of instructional time for science in some schools, which undermines the effectiveness of hands-on activities [2,3]; (ii) primary teachers lacking sufficient scientific and pedagogical content knowledge, which contributes to low confidence in teaching science and hinders the effective implementation of science education [4,5]; and (iii) the limited effectiveness of discovery-based instructional approaches when implemented without sufficient instructional time or adequate teacher support, which can reduce their potential to support the acquisition of scientific content knowledge, skills, and attitudes [1].
Baumanns et al. [6] and Rizos and Gkrekas [7] demonstrated that students who struggle with pattern recognition tasks are at greater risk of experiencing difficulties in understanding complex scientific concepts and developing mathematical understanding. The challenges students face in practicing pattern recognition skills can, in part, be attributed to a lack of effective pedagogical strategies [7,8]. An example of such approaches are the science lessons that heavily rely on hands-on activities [9,10]. In such cases, teachers may fail to activate the underlying cognitive processes (“minds-on”) necessary for the development of effective pattern recognition skills and conceptual understanding [11]. Providing appropriate guidance in these cases can be critical for students’ knowledge development. For example, Cognitive Load Theory emphasises the need for structured support to prevent cognitive overload during learning [10], and recent empirical studies in science education further demonstrate that guided inquiry approaches more effectively promote conceptual understanding than unguided methods [12]. Integrating real-time individualised corrective guidance into the learning process has been shown to support cognitive development. It helps students address misconceptions, refine their understanding, and integrate complex concepts effectively during challenging learning tasks [13,14,15].
Building on this, the use of interactive computer-based concept diagrams in primary science education has also been shown to enhance student motivation and engagement [16,17]. Stevenson et al. [16] reviewed concept mapping technologies and concluded that they can support learners’ cognitive, metacognitive, and motivational strategies—particularly by helping students externalise and structure their thinking processes. This is further supported by Schroeder et al. [17], whose meta-analysis found that students who actively constructed concept maps demonstrated significantly higher learning gains, particularly in science-related domains. Extending these findings, van Eijck et al. [18] found that combining hands-on experiments with interactive concept diagrams enabled students aged 9–12 to develop scientific reasoning skills more autonomously within standard lesson timeframes.
Together, these results underscore the potential of combining hands-on activities with interactive digital representations—such as concept diagram technologies to help develop students’ reasoning skills and support their cognitive and metacognitive strategies during science learning. While prior studies have not conclusively demonstrated that digital diagrams are more effective than their paper-based counterparts [16], there is growing evidence that such technologies can promote learner autonomy and engagement during science tasks [17,18]. In this context, digital tools that help externalise classification processes and visualise relationships may provide meaningful support during science activities, especially when teacher guidance is limited.
Students aged 10–12 belong to Generation Alpha, a cohort that has grown up immersed in digital technology [19]. Digital learning environments and technology-supported teaching approaches therefore form an increasingly relevant context for the education of this generation. The Minds-On approach reflects this context by combining hands-on materials with interactive concept diagrams and optional digital feedback.
This paper investigates how computer-driven lessons can be deployed to address the challenges in primary science education outlined above. The remainder of the paper is structured as follows: Section 2 presents the theoretical framework and examines the use of concept diagrams, guided instruction, and feedback. Section 3 describes the lesson. Section 4 describes the methodology, including the lesson design and classroom evaluation. Section 5 presents the results, and Section 6 discusses the implications and the limitations of the results.

2. Background

2.1. Challenges in Primary Education

Several factors contribute to the difficulties primary students face in acquiring science skills, with one being the abstract nature of many scientific concepts and phenomena. Without a well-developed knowledge base, students aged 10–12 often struggle to translate concrete observations into abstract understanding [20].
Teaching materials for science lessons often expect students to connect observations with scientific concepts and apply appropriate terminology, however, often without sufficient instructional support [21]. In tasks such as pattern recognition, students are expected to relate hands-on observations to scientific language, such as classification properties, through traditional lesson-designs [22]. This process requires students to select, analyse, and interpret information, thereby engaging in science skills with insufficient guidance [23].
Primary school teachers, on the other hand, require a strong foundation in subject knowledge, strong pedagogical skills, and appropriate teaching methods to teach science effectively [24]. However, teachers may lack sufficient training in science and technology, leading to reduced confidence in teaching scientific concepts [25,26]. These challenges hinder the implementation of science lessons that require extended teacher guidance, causing teachers to rely mainly on stand-alone hands-on activities [18]. This overemphasis on hands-on activities can lead to superficial engagement, where students may physically interact with materials but fail to develop a deeper understanding of the scientific concepts [27]. A study by Teig, Scherer, and Nilsen [28] further shows that time constraints exacerbate these challenges and hinder teachers’ ability to implement cognitively activating strategies that often require individualised student guidance and active student engagement. Consequently, students’ development of science thinking skills is insufficiently stimulated [29,30].

2.2. Crosscutting Concept: Pattern Recognition

Educational frameworks, such as the Next Generation Science Standards (NGSS), advocate for the development of broad science skills, including science practices through cross-cutting concepts [6,7]. One of these cross-cutting concepts is pattern recognition, which helps students connect ideas across various scientific domains. Research has shown that early engagement with pattern recognition enhances problem-solving abilities and lays the groundwork for critical science thinking skills in primary education [6].
Mastering skills such as identifying, observing, and grouping patterns for the purpose of classification is a key component of many primary science curricula [31]. Classification refers to the cognitive task that involves identifying similarities and differences in objects, organisms, or phenomena and grouping them based on shared properties [32]. It is commonly seen as a cognitive skill that can be developed and assessed at varying levels of complexity across primary education grades [33].
According to De Vaan and Marell [33], students’ classification skills in primary education can be assessed through five levels of increasing difficulty: (1) splitting a group of objects into two based on a single property, (2) ordering groups of objects according to one property, (3) using combinations of properties to split a group into multiple groups, (4) describing objects using various properties, and (5) identifying objects based on several distinguishing features without necessarily using a classification chart.

2.3. Concept Diagrams

Concept diagrams are widely used instructional tools in science education to support students’ understanding of scientific concepts and their interrelationships. Diagrams such as classification trees help students organise observable features into hierarchical groupings to facilitate pattern recognition [34,35].
These visual representations serve as cognitive scaffolds by encouraging students to connect new information to prior knowledge, supporting deeper comprehension [16,17]. The visual nature of concept diagrams allows students to externalise their thinking to manage complex ideas more easily, enhancing both retention and conceptual clarity [36,37].

2.4. Instructed Guidance and Feedback Prompts

Effective science learning requires timely individualised feedback to address gaps in their understanding. However, limited content knowledge, time pressure, and large class sizes hinder teachers’ ability to provide individualised feedback [25,26]. These challenges limit the effectiveness of hands-on activities by restricting opportunities for tailored guidance.
Learners also frequently overestimate their understanding and remain unaware of these gaps [2,38]. Addressing such misunderstandings requires cognitive engagement and targeted support [15,39]. Systemic barriers make delivering this level of feedback difficult in typical primary classrooms, highlighting the need for alternative solutions that can provide precise, real-time feedback without overburdening educators.
Automated feedback systems present a promising approach to meet this need by offering real-time, individualised, context-specific guidance that helps students recognise and correct errors without increasing cognitive load [13,14,40]. Within Minds-On, this guidance is supported by a knowledge-based artificial intelligence approach rather than machine learning or generative AI. Concepts and relationships are formally encoded in interactive knowledge representations, enabling automated reasoning and comparison with expert knowledge [41,42]. This provides the basis for automated checking and context-specific support during students’ interaction with the diagrams. In fact, system-generated feedback was found to be more impactful than teacher-led feedback in helping students immediately address their misunderstandings [13]. For example, Gerard et al. [15] compared three types of feedback prompts—generic tips, direct corrections, and knowledge integration guidance—and found that integration prompts, which encouraged students to connect ideas and revise thinking, had the greatest impact. Krieglstein et al. [43] investigated how the design and complexity of concept maps influence cognitive learning processes, highlighting that well-structured visual representations not only support learner comprehension but also reduce cognitive load, thereby enhancing the effectiveness of feedback during learning. Similarly, Kroeze et al. [44] demonstrated that formative feedback in concept mapping tools could provide meaningful input beyond binary correctness, thereby enhancing conceptual understanding. Despite these advantages, student engagement with feedback remains a critical challenge, emphasizing the importance of designing feedback systems that actively involve learners in the process [45].

2.5. Research Questions

This study investigates students’ engagement and interaction with the application and lesson materials, as well as their comprehension of astronomical concepts. The goal is to identify the potential benefits and drawbacks of implementing software-integrated guided instructions and optional feedback prompts. Two research questions will be investigated:
  • Engagement—How do students engage with the classification exercises during the lesson?
  • Performance—How do students interact with the application’s functions and what role does feedback usage play in this interaction and overall performance?

3. The Minds-On Solar System Lesson

This chapter describes the lesson structure and design. It outlines the lesson design (Section 3.1), the instructional materials (Section 3.2), and the integrated feedback intervention (Section 3.3).

3.1. The Lesson Design

Minds-On is a browser-based educational application developed within the Minds-On project. The application is built around encoded knowledge representations, a symbolic artificial intelligence approach in which concepts and relationships are formally represented to support automated reasoning and interaction with learners [41,42]. These encoded representations allow the software to compare students’ actions with expert knowledge and provide automated checking and context-specific support. In the Solar System lesson, this functionality was used to evaluate students’ classifications and make reflective feedback available following classification errors. This enables the application to respond to students’ interactions rather than only present digital instructional content. The application is accessible through the Minds-On project website https://mindson.nl (accessed on 19 June 2024) The lesson, The Solar System, was delivered during regular class time and designed to support both classification skills and understanding of key properties of celestial bodies. It combined physical materials (a Solar System map and card set) with digital tasks and instructions.
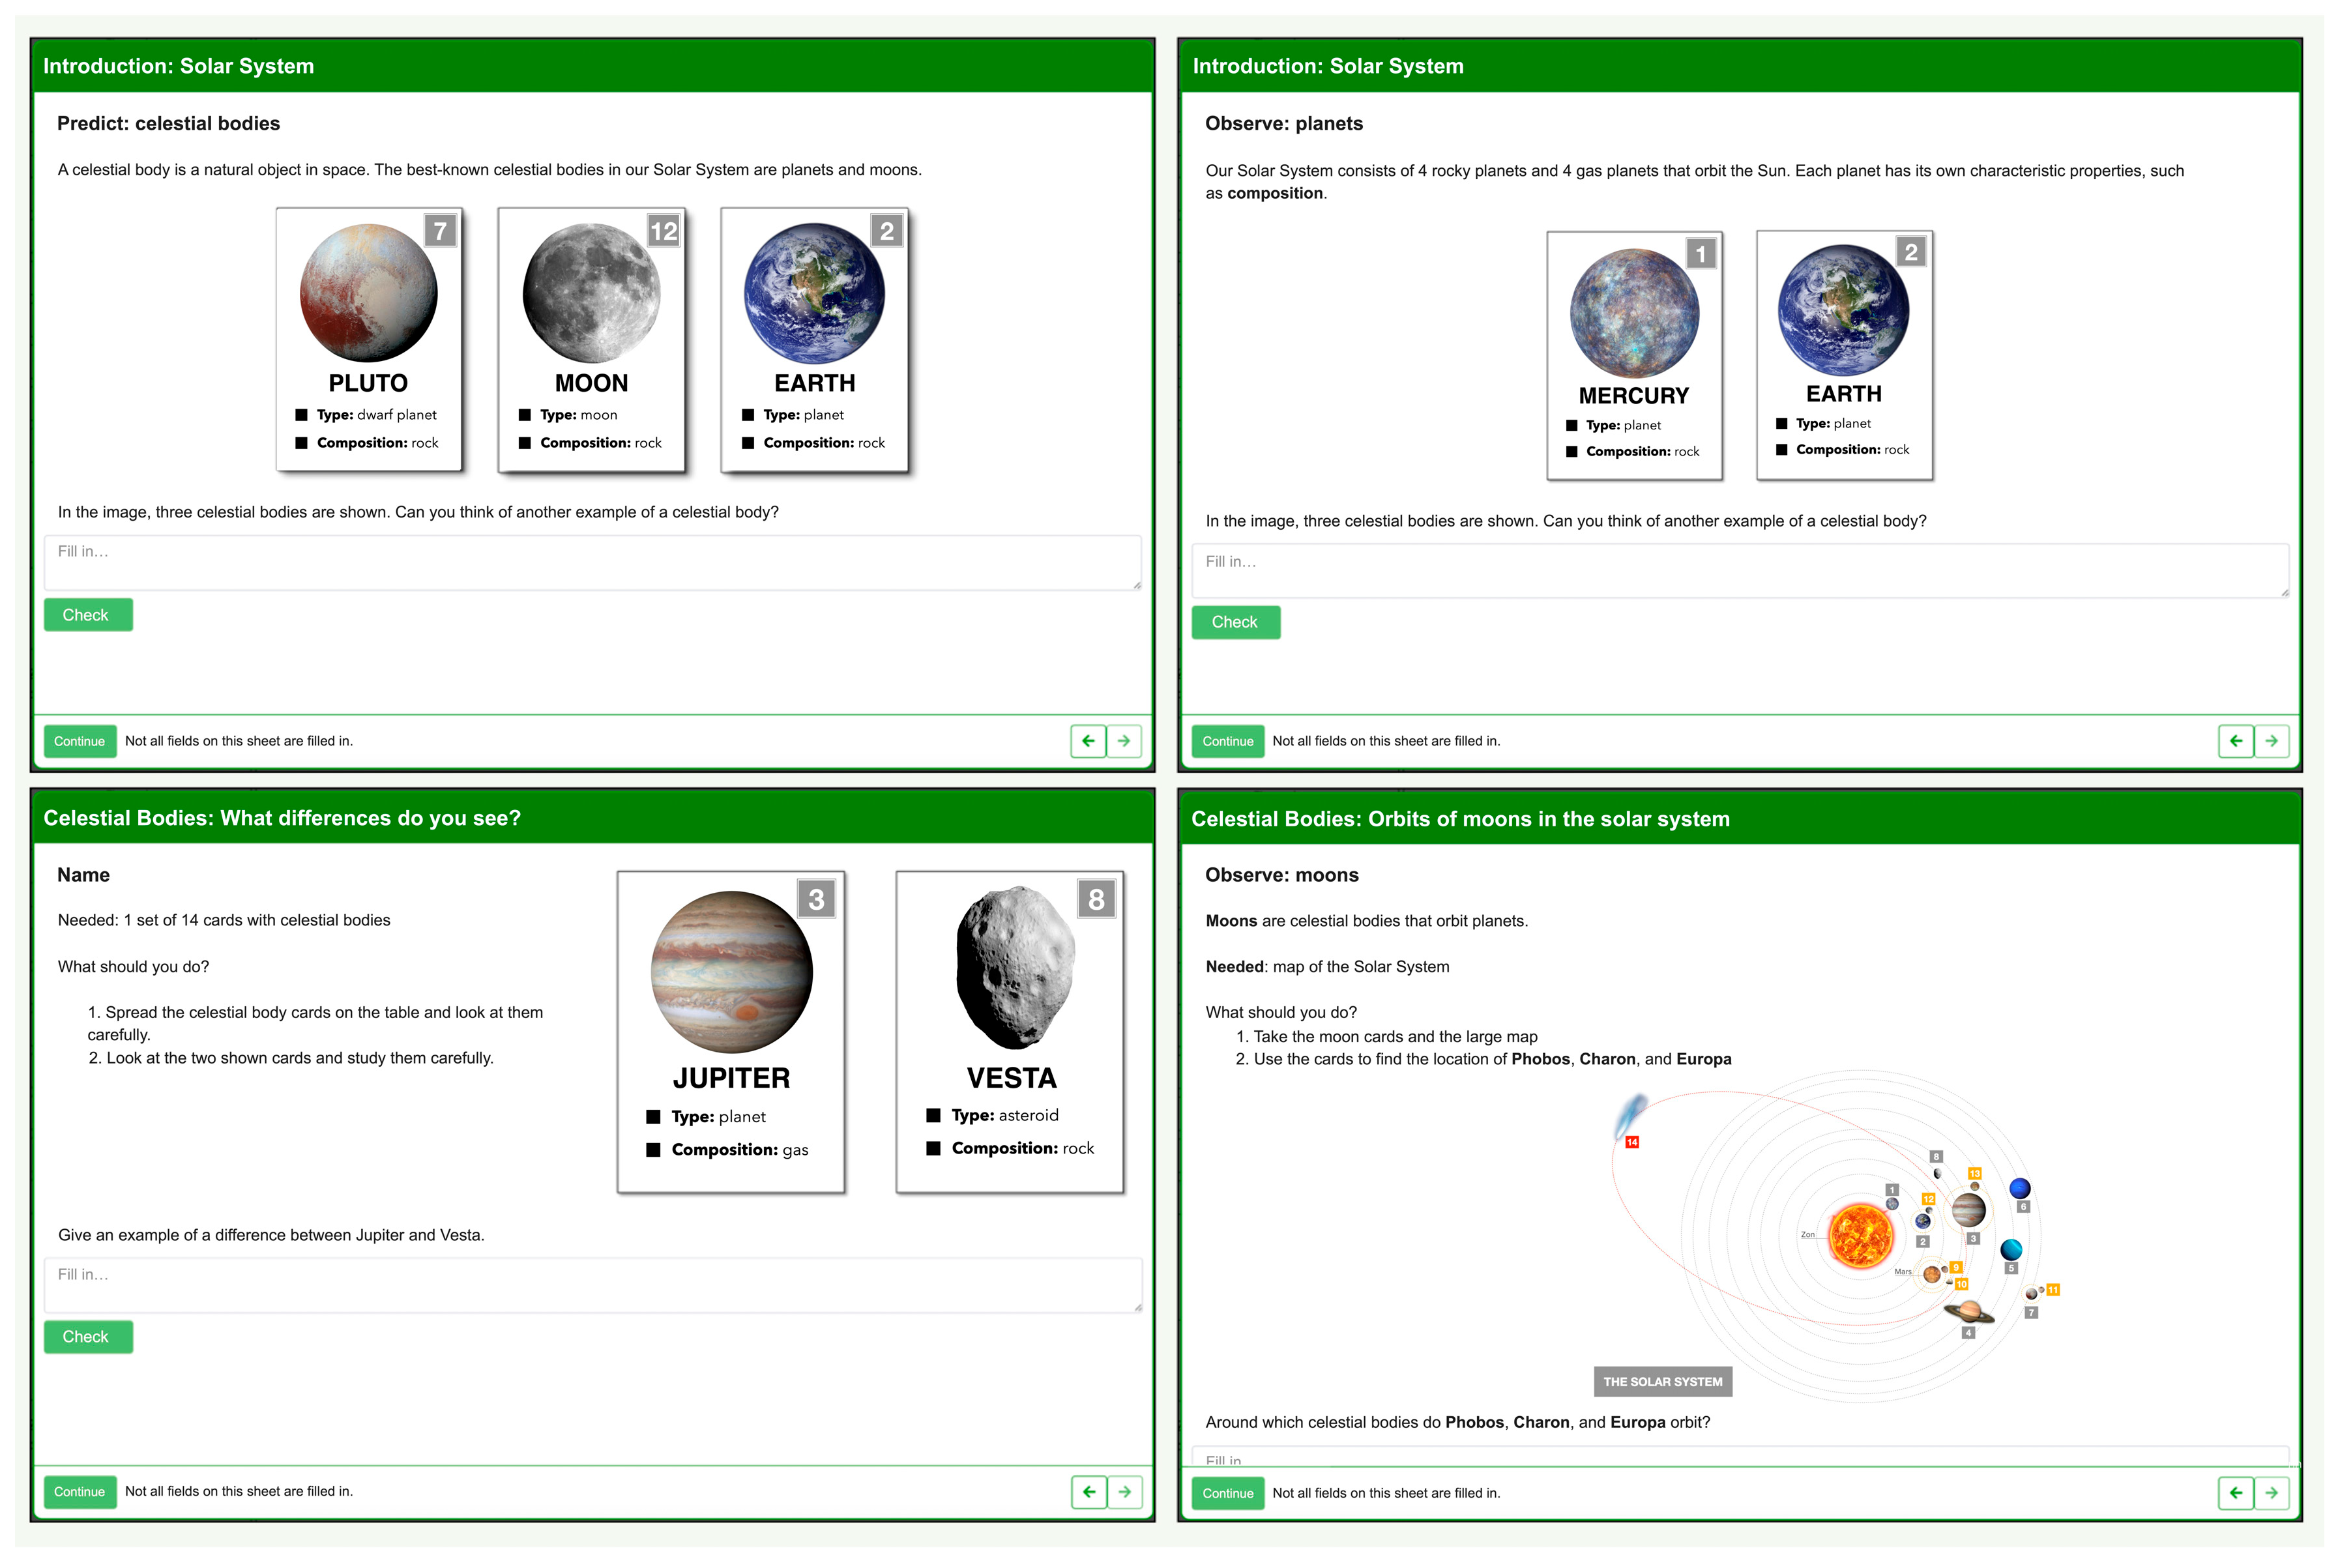
Students began by logging into the Minds-On application using individual access codes. They first completed a sequence of structured warm-up questions, which were designed to activate prior knowledge and introduce key features of celestial bodies (see Figure 1).
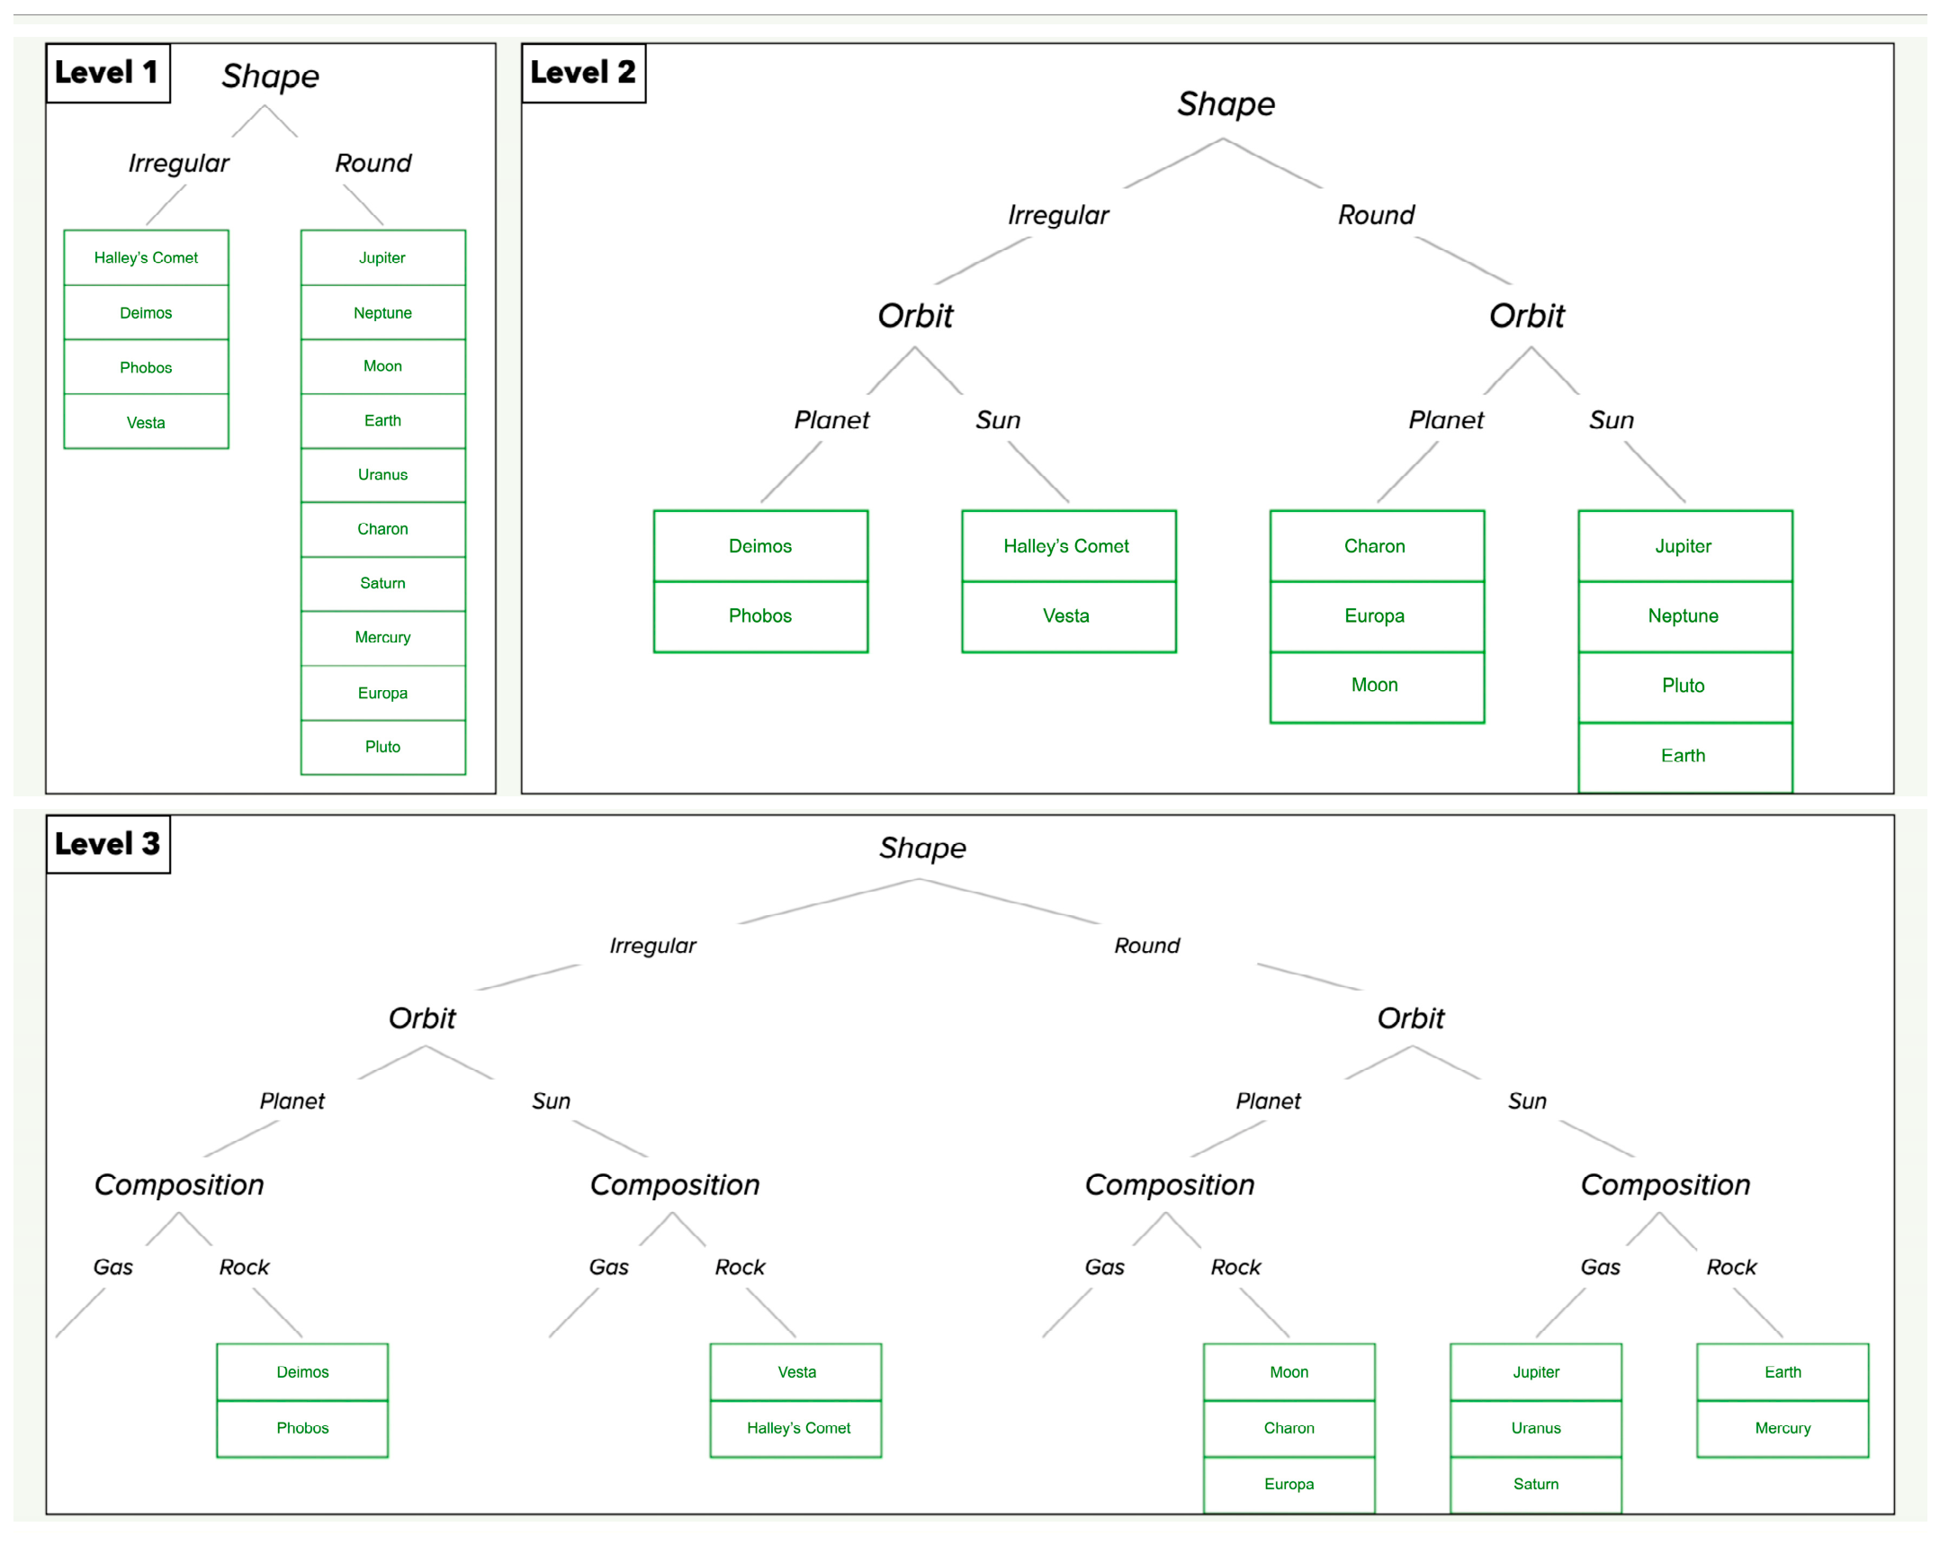
The core activity was an interactive classification exercise in which students sorted 14 celestial bodies across three ascending levels of complexity (see Figure 2). At each level, students selected one property (e.g., shape: round vs. irregular), grouped the cards accordingly on their desk, and then mirrored these groupings in the software’s branching diagram interface. In subsequent levels, the classified celestial bodies were hidden, but their previously selected property remained visible, requiring students to recall their earlier classifications and reassign the same celestial bodies based on an additional new property. Throughout the task, students could check their answers and revise their choices.
In addition, a randomly assigned subgroup of students had access to voluntary feedback prompts following classification errors. These prompts compared the misclassified object with a contrasting example and posed a reflective question, without initially revealing the correct answer.

3.2. Lesson Materials

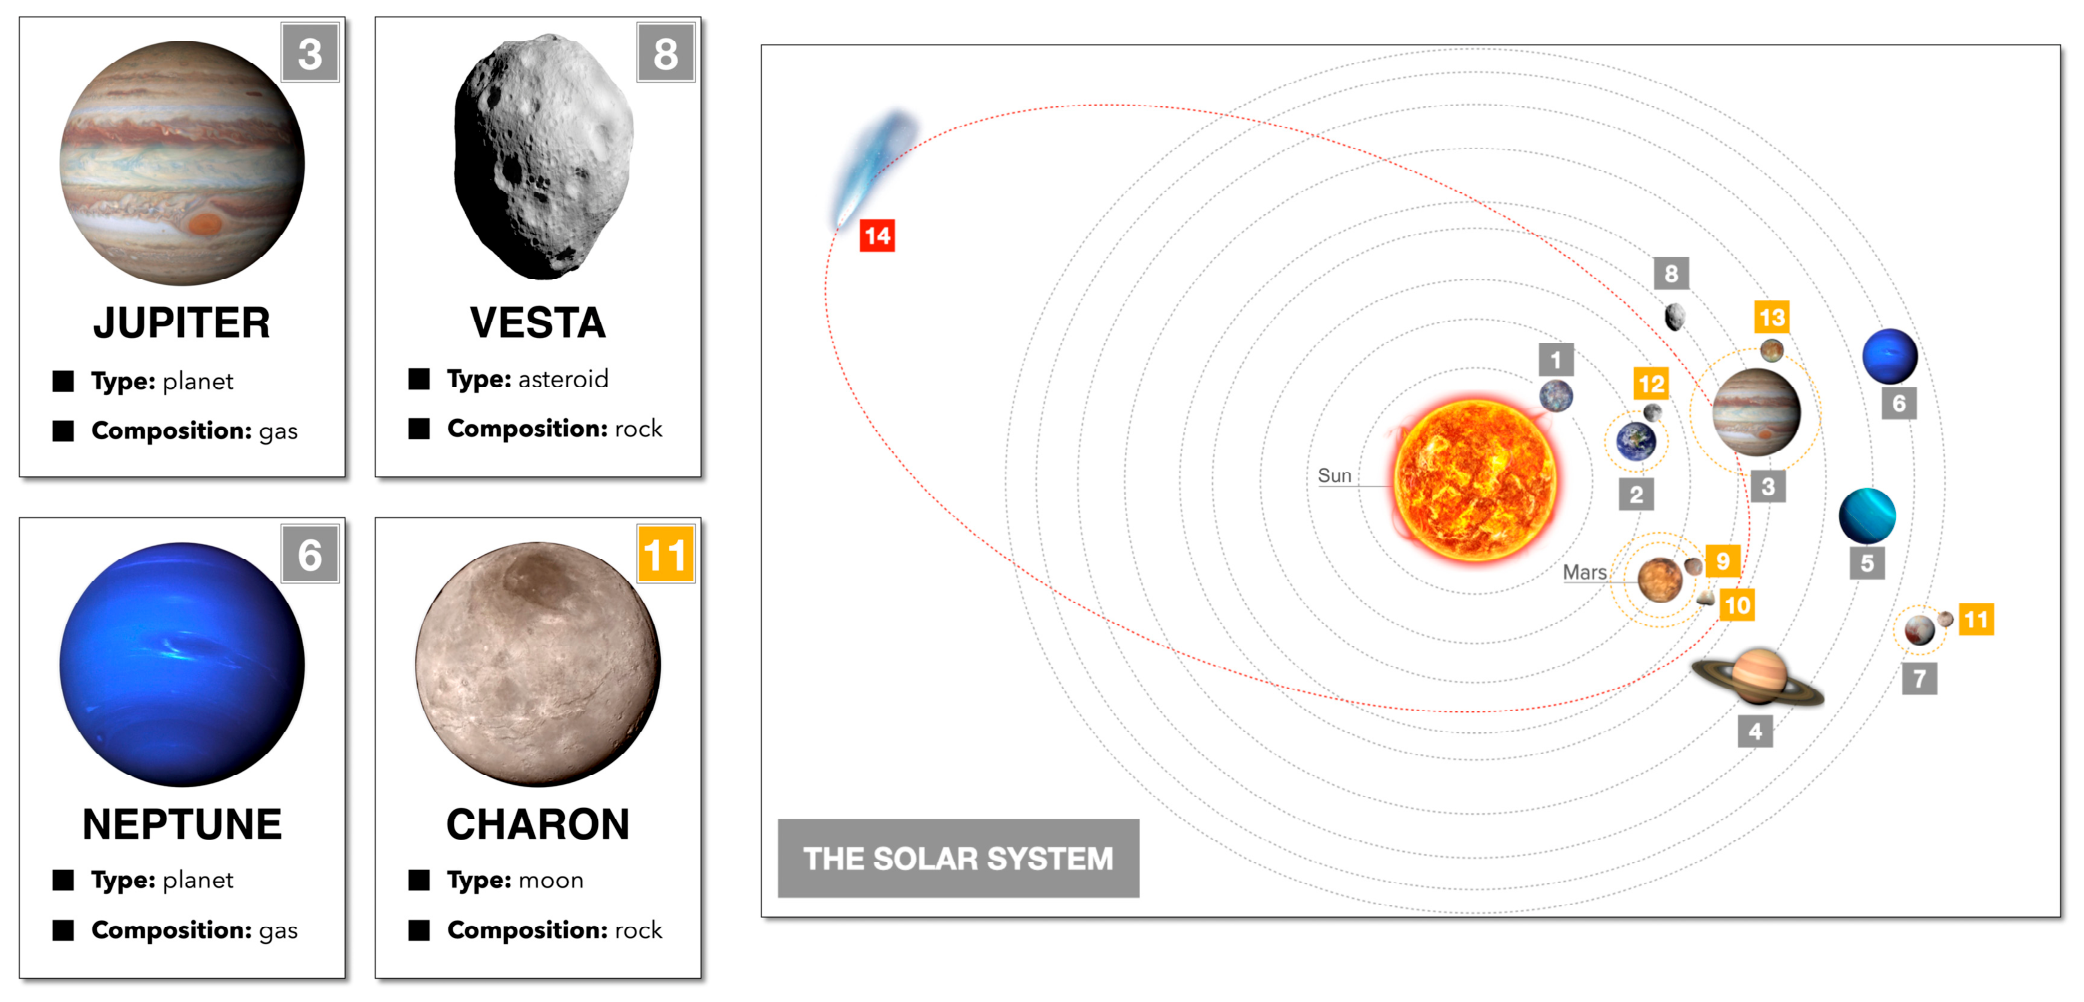
The lesson materials consisted of a Solar System map and a card set (see Figure 3); both used during the classification task. Identical visual representations of celestial bodies were used on the printed cards, map and in the digital interface.
  • Card set: Fourteen paper-based cards (see Figure 3, left section) provided information about five planets, one dwarf planet, one asteroid, five moons, and one comet. Each card included the following information:
(i)
an image (for shape inference: round or irregular),
(ii)
a description of composition (rock or gas),
(iii)
a classification label (e.g., planet, moon, comet).
(iv)
a unique number and colour code—orange for moons, red for the comet, and grey for (dwarf) planets and asteroid—corresponding to their location on the map.
  • Map: The Solar System map (see Figure 3, right section) displays the orbits—around the Sun or around a planet—of all 14 celestial bodies.

3.3. Feedback Prompts

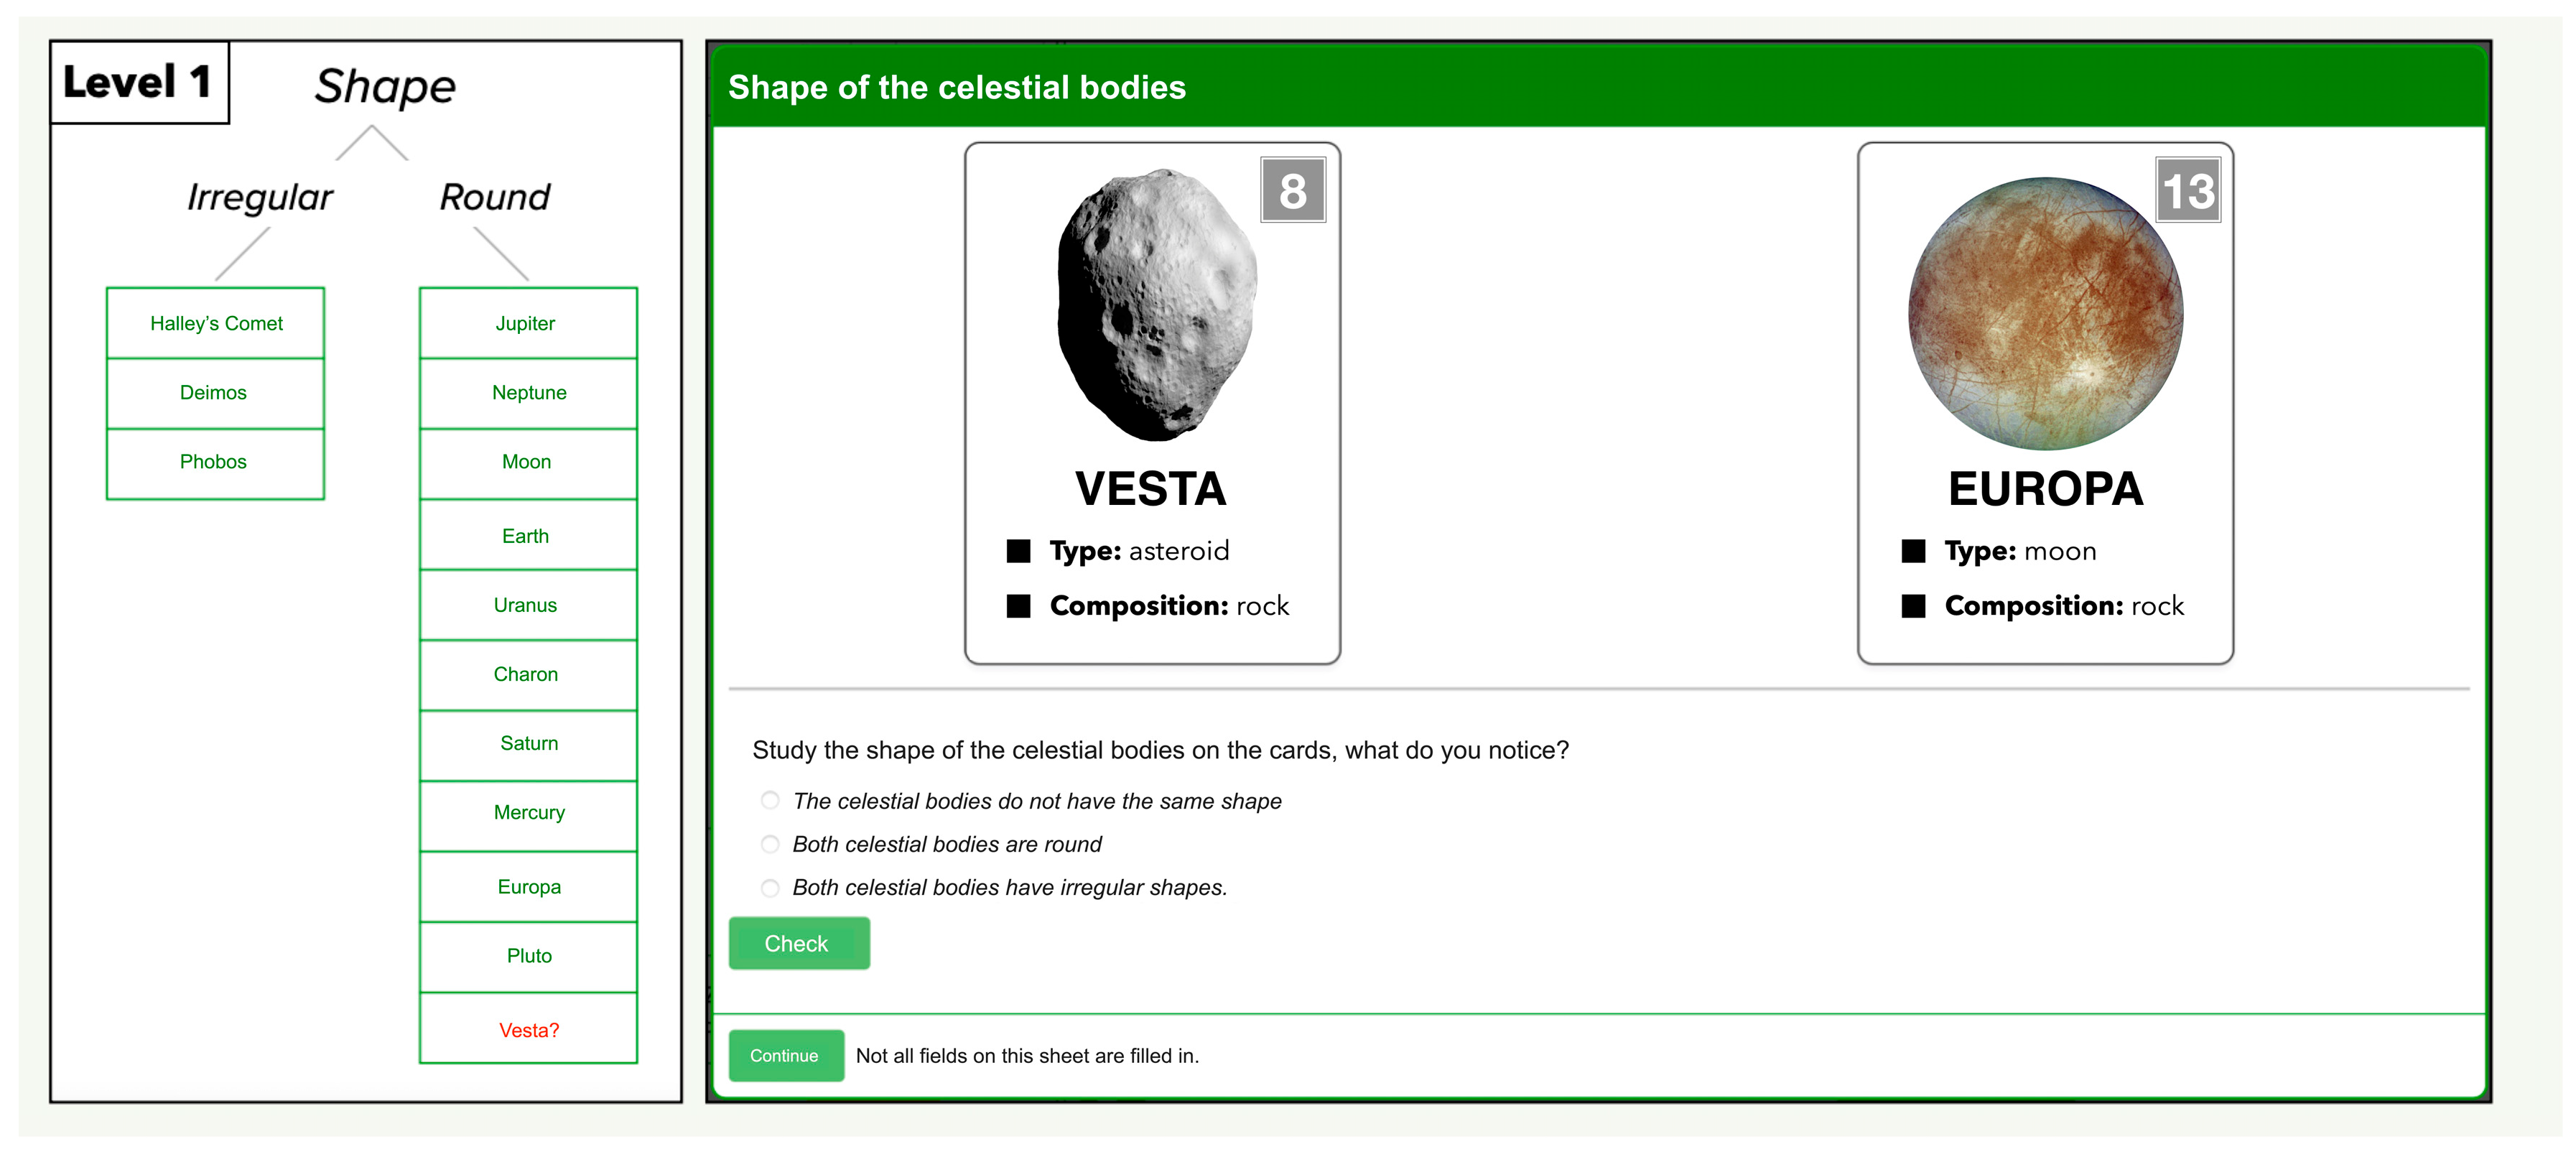
To support students during the interactive classification exercise (see Figure 2), a voluntary feedback prompt system was designed and implemented to encourage self-reflection and correct mistakes without directly providing the correct answers. In this lesson, the knowledge-based functionality of Minds-On enabled students’ classifications to be checked automatically. When a student misclassifies a celestial body—for example, marking Vesta as round instead of irregular (Figure 4)—the application flags the error with a red question mark. Students may then choose to engage with a feedback prompt that compares the misclassified body to one with the opposite property (e.g., Europa), accompanied by a question that encourages reflection. The AI-supported role in this implementation therefore concerned automated evaluation of the classification and the provision of error-triggered, context-specific guidance.
This approach encourages critical thinking by guiding students to independently arrive at the correct classification. Students maintain control over when and how to use feedback throughout the lesson, enabling a personalised learning experience. Full access to the physical materials (card set and Solar System map) alongside the software ensures a coherent learning environment.

4. Method

This chapter outlines the methodological framework used to evaluate the Minds-On lesson. It describes the lesson protocol, procedure, and the employed instruments to assess student behaviour and engagement (Section 4.2.1), learning gains (Section 4.2.2) and experience (Section 4.2.3).

4.1. Lesson Protocol

A total of 176 students (ages 10–12) from eight classes across five public primary schools in Amsterdam participated in the study. Recruitment was based primarily on schools’ willingness to participate, while also aiming for geographical spread across different parts of the city. Twelve students were excluded due to incomplete participation (missing pre/post-tests or lesson data), resulting in a final sample of 164 students.
To protect student confidentiality, each participant was assigned a unique code. Student access codes were generated prior to the lesson and used to randomly allocate students to either the feedback-enabled or non-feedback condition. Within each class, students were allocated as evenly as possible between the two conditions. Because of uneven class sizes and subsequent absences, withdrawals, or incomplete participation, the final distribution was not exactly equal. For students in the feedback-enabled condition, voluntary feedback prompts became available following classification errors. Teachers administered the pre-test prior to the lesson and the post-test afterward. The Minds-On lesson itself lasted approximately 50–60 min, of which 20–30 min were spent on the interactive diagram activity. The pre- and post-tests were administered on a different occasion from this lesson period. Teachers were instructed not to provide instructional or content-related support during the session.

4.2. Instruments

4.2.1. Data-Logger

Student behaviour, performance and decision-making were logged through in-app analytics. The following indicators were tracked and analysed:
-
Property selection frequencies across the three classification levels
-
Completion times and celestial body selection and dragging order
-
Error types per level related to the properties and celestial bodies
-
Feedback use (number of consultations before/after errors)
-
Additional metrics: total drag actions, check actions, and overall error counts
These metrics were used to identify decision-making patterns and to evaluate the influence of feedback on performance.

4.2.2. Knowledge Assessment

To assess learning gains, all students completed identical pre- and post-tests consisting of 30 items aligned with the lesson’s instructional goals. The assessments targeted classification skills, visual interpretation, schematic understanding, and knowledge transfer related to celestial bodies’ properties:
-
Composition (gas vs. rock)
-
Shape (round vs. irregular)
-
Orbit (around the Sun vs. a planet)
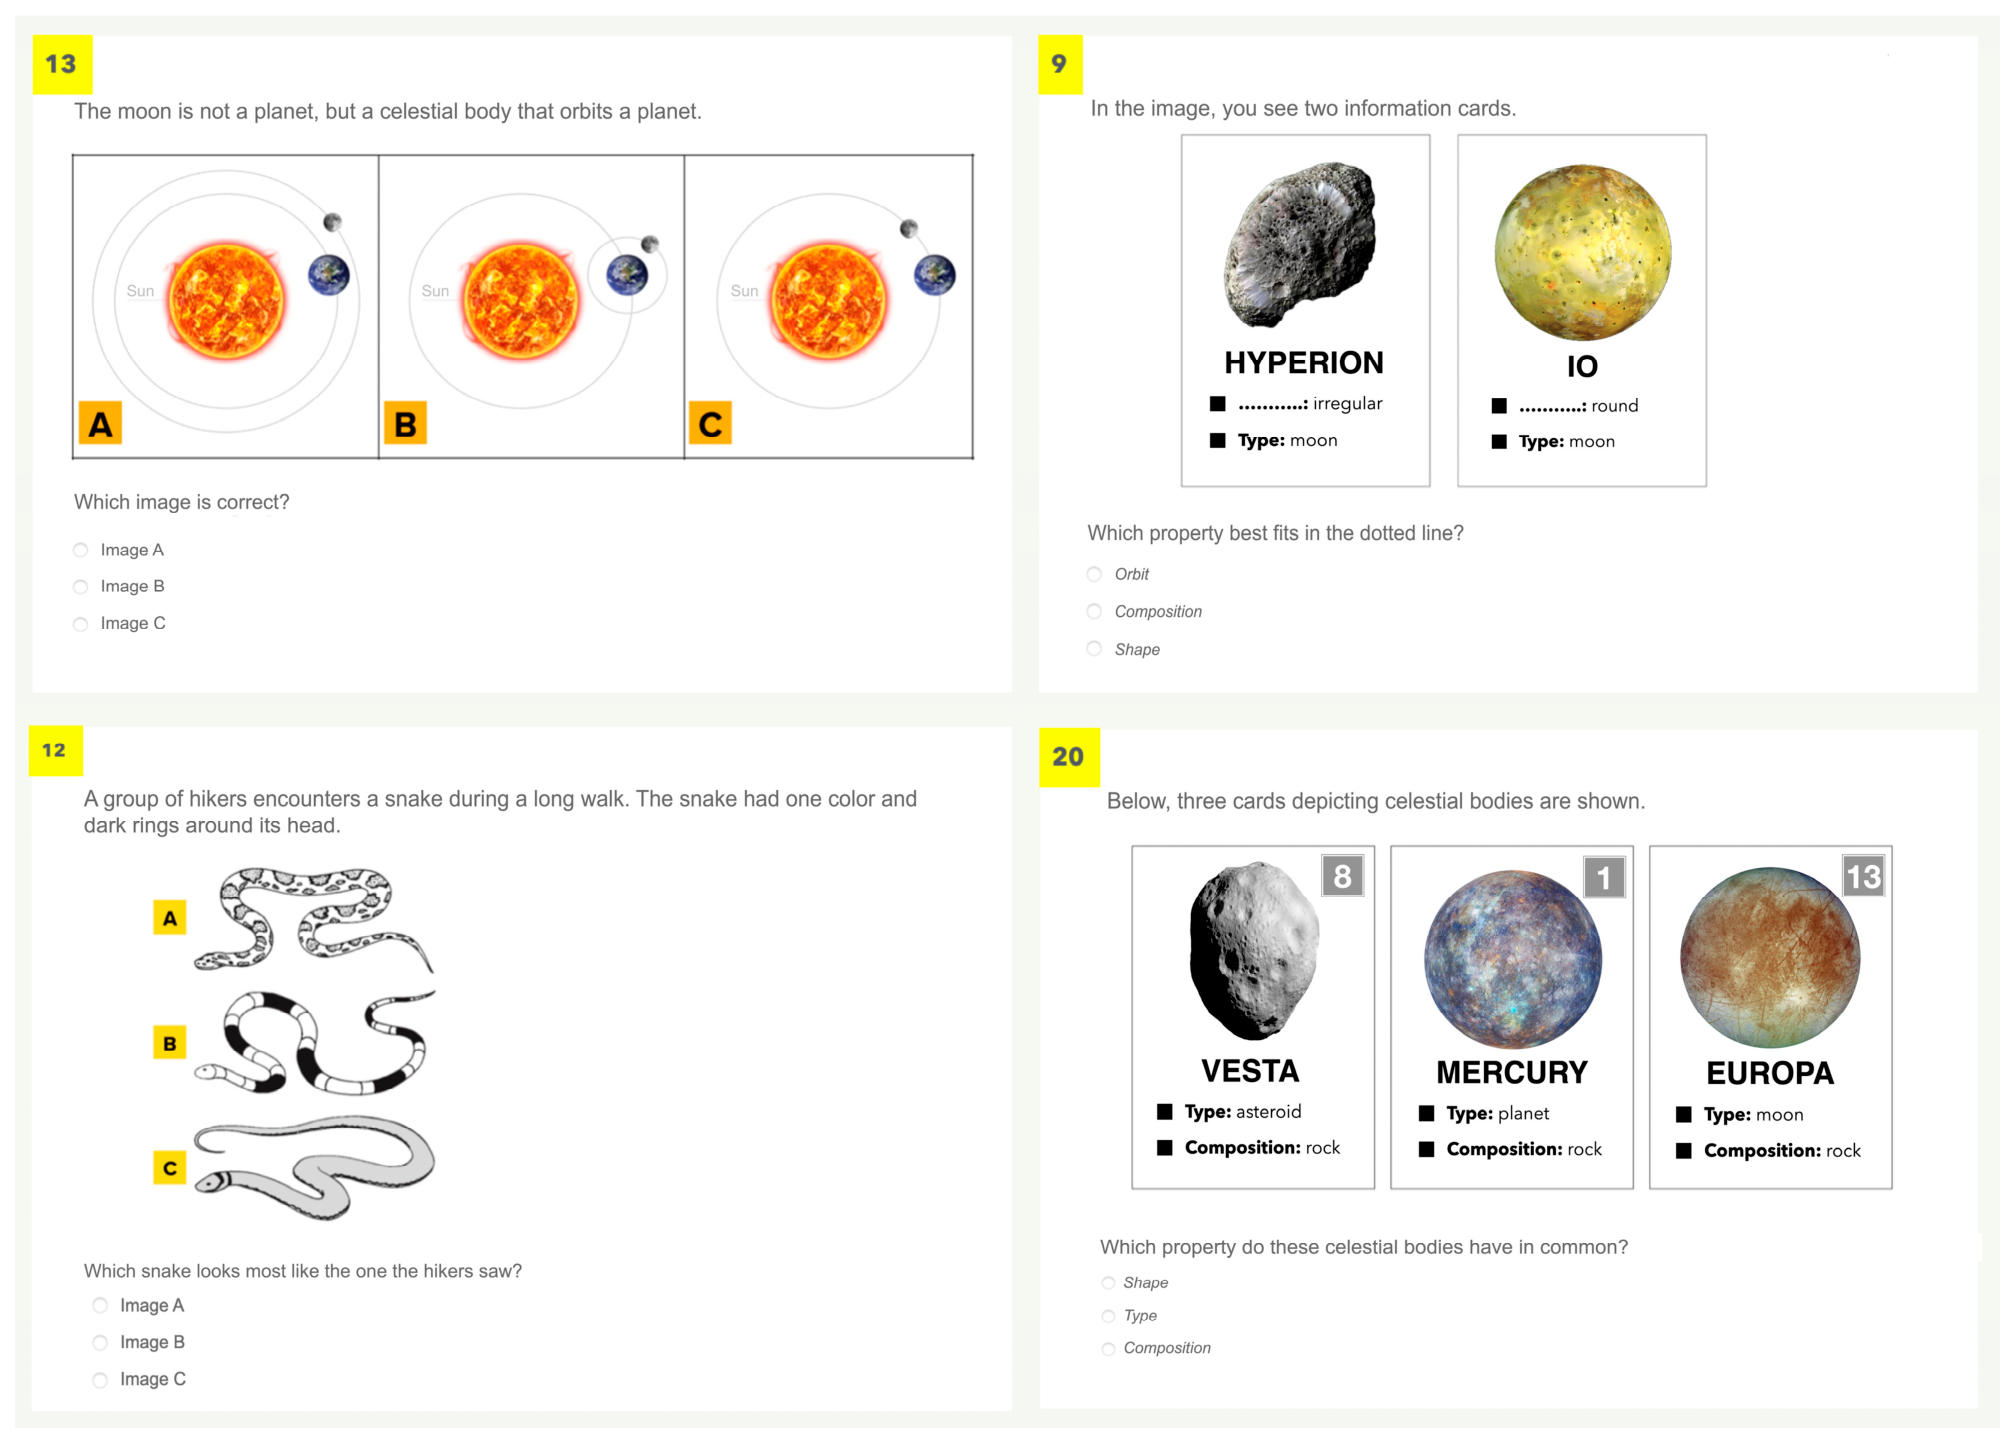
Pattern recognition—specifically classification—can be assessed across five ascending levels of complexity (see Section 2.2). This lesson primarily addressed Level 3 classification skills: the ability to use combinations of properties to divide a group of celestial bodies into a multi-layered classification tree. Test items reflected this level of complexity, including multiple choice, matching, and fill-in-the-blank question formats. The items assessed both conceptual knowledge and transferable reasoning skills, often addressing multiple learning goals simultaneously. Sample questions are provided in Figure 5.

4.2.3. Post-Lesson Experience Survey

Immediately after completing the final diagram step, all students completed a short eight question post-lesson experience questionnaire integrated in the application, all rated on a 4-point Likert scale (1 = Strongly disagree, 2 = Disagree, 3 = Agree, 4 = Strongly agree). Questions focused on clarity, ease of use, transfer between physical and digital tasks, perceived understanding, enjoyment, as well as the integration between physical and digital components. All statistical analyses were performed using Python 3.12. The analysis scripts were developed in PyCharm 2024.1.4 (Professional Edition; JetBrains).

5. Results

This section presents the results of the classroom evaluation, organised by the research questions defined in Section 2.5, using data from the application’s built-in data-logger, knowledge questionnaires and a post-lesson experience survey.

5.1. Knowledge Questionnaire

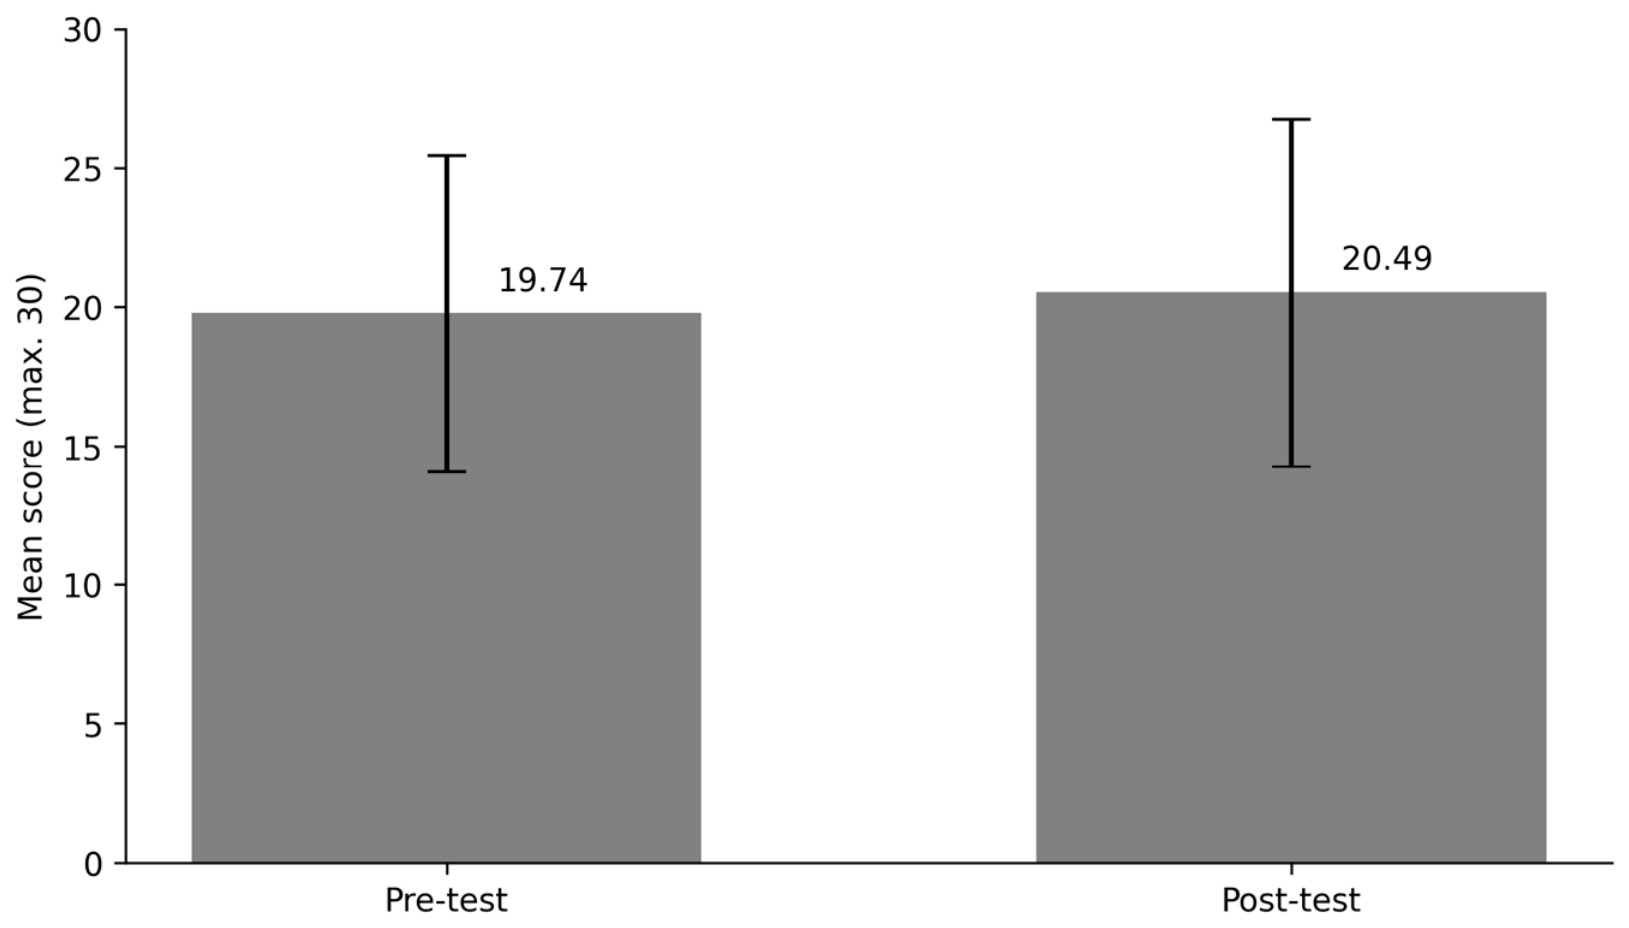
As shown in Table 1, knowledge scores increased from pre-test (M = 19.74, SD = 5.70) to post-test (M = 20.49, SD = 6.25), a mean difference of 0.75 points on the 30-item assessment. This difference was statistically significant but small in magnitude, t(162) = −2.63, p = 0.009, d = 0.21. The linear mixed-effects model likewise showed a significant pre–post difference (p = 0.007). Given the uncontrolled pre–post design, these results indicate a small within-sample increase in test performance. The mean pre- and post-test scores are visualised in Figure 6.

5.2. Property Preferences

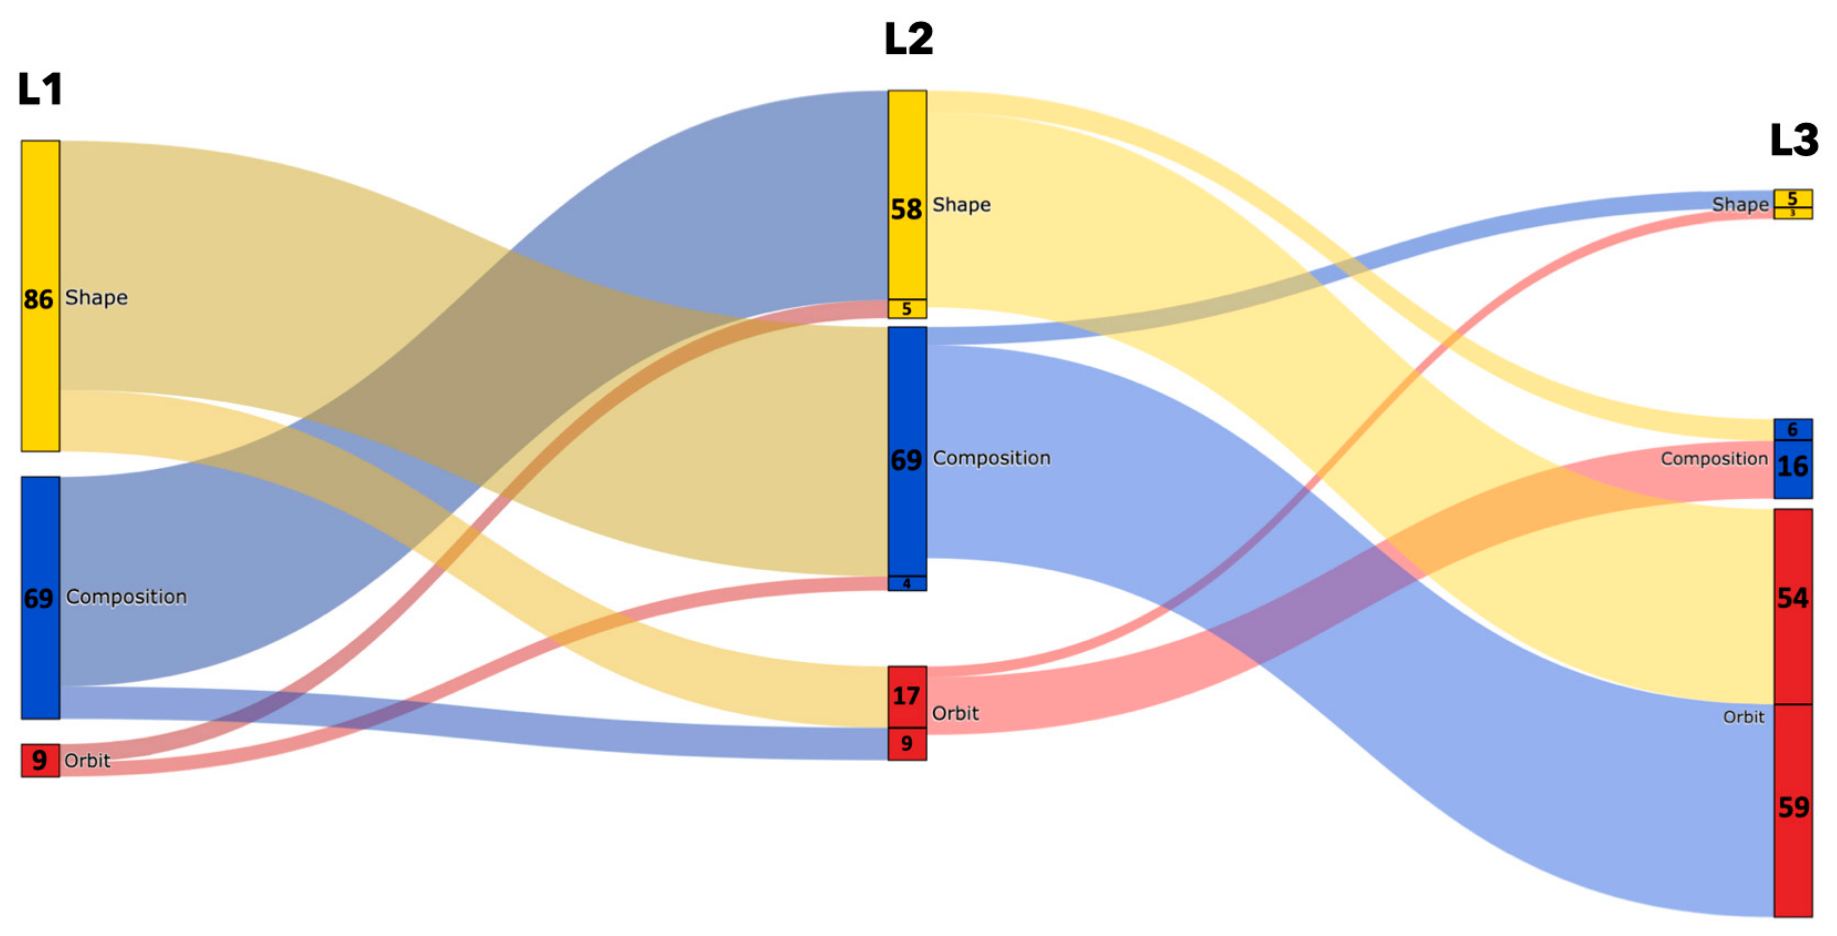
A frequency analysis examined students’ use of the properties Shape, Composition, and Orbit across the three classification levels. The pattern is visualised in an alluvial diagram (see Figure 7) that traces students’ choices across levels. At Level 1, shape (46.7%) and composition (37.5%) were most frequently chosen, with limited use of orbit (4.9%). This pattern continued at Level 2. By Level 3, orbit was selected by 71.7% of students. Because previously selected properties were no longer available, orbit was the only remaining untested property for most students. Its predominance at Level 3 therefore largely reflects the structure of the classification task rather than a spontaneous preference for orbit.
A chi-square test was used to determine whether the distribution of property choices varied significantly across levels. The results confirmed that the distribution of property choices was not a random variation, χ2(4) = 227.36, p < 0.001.

5.3. Task Completion Time Across Levels

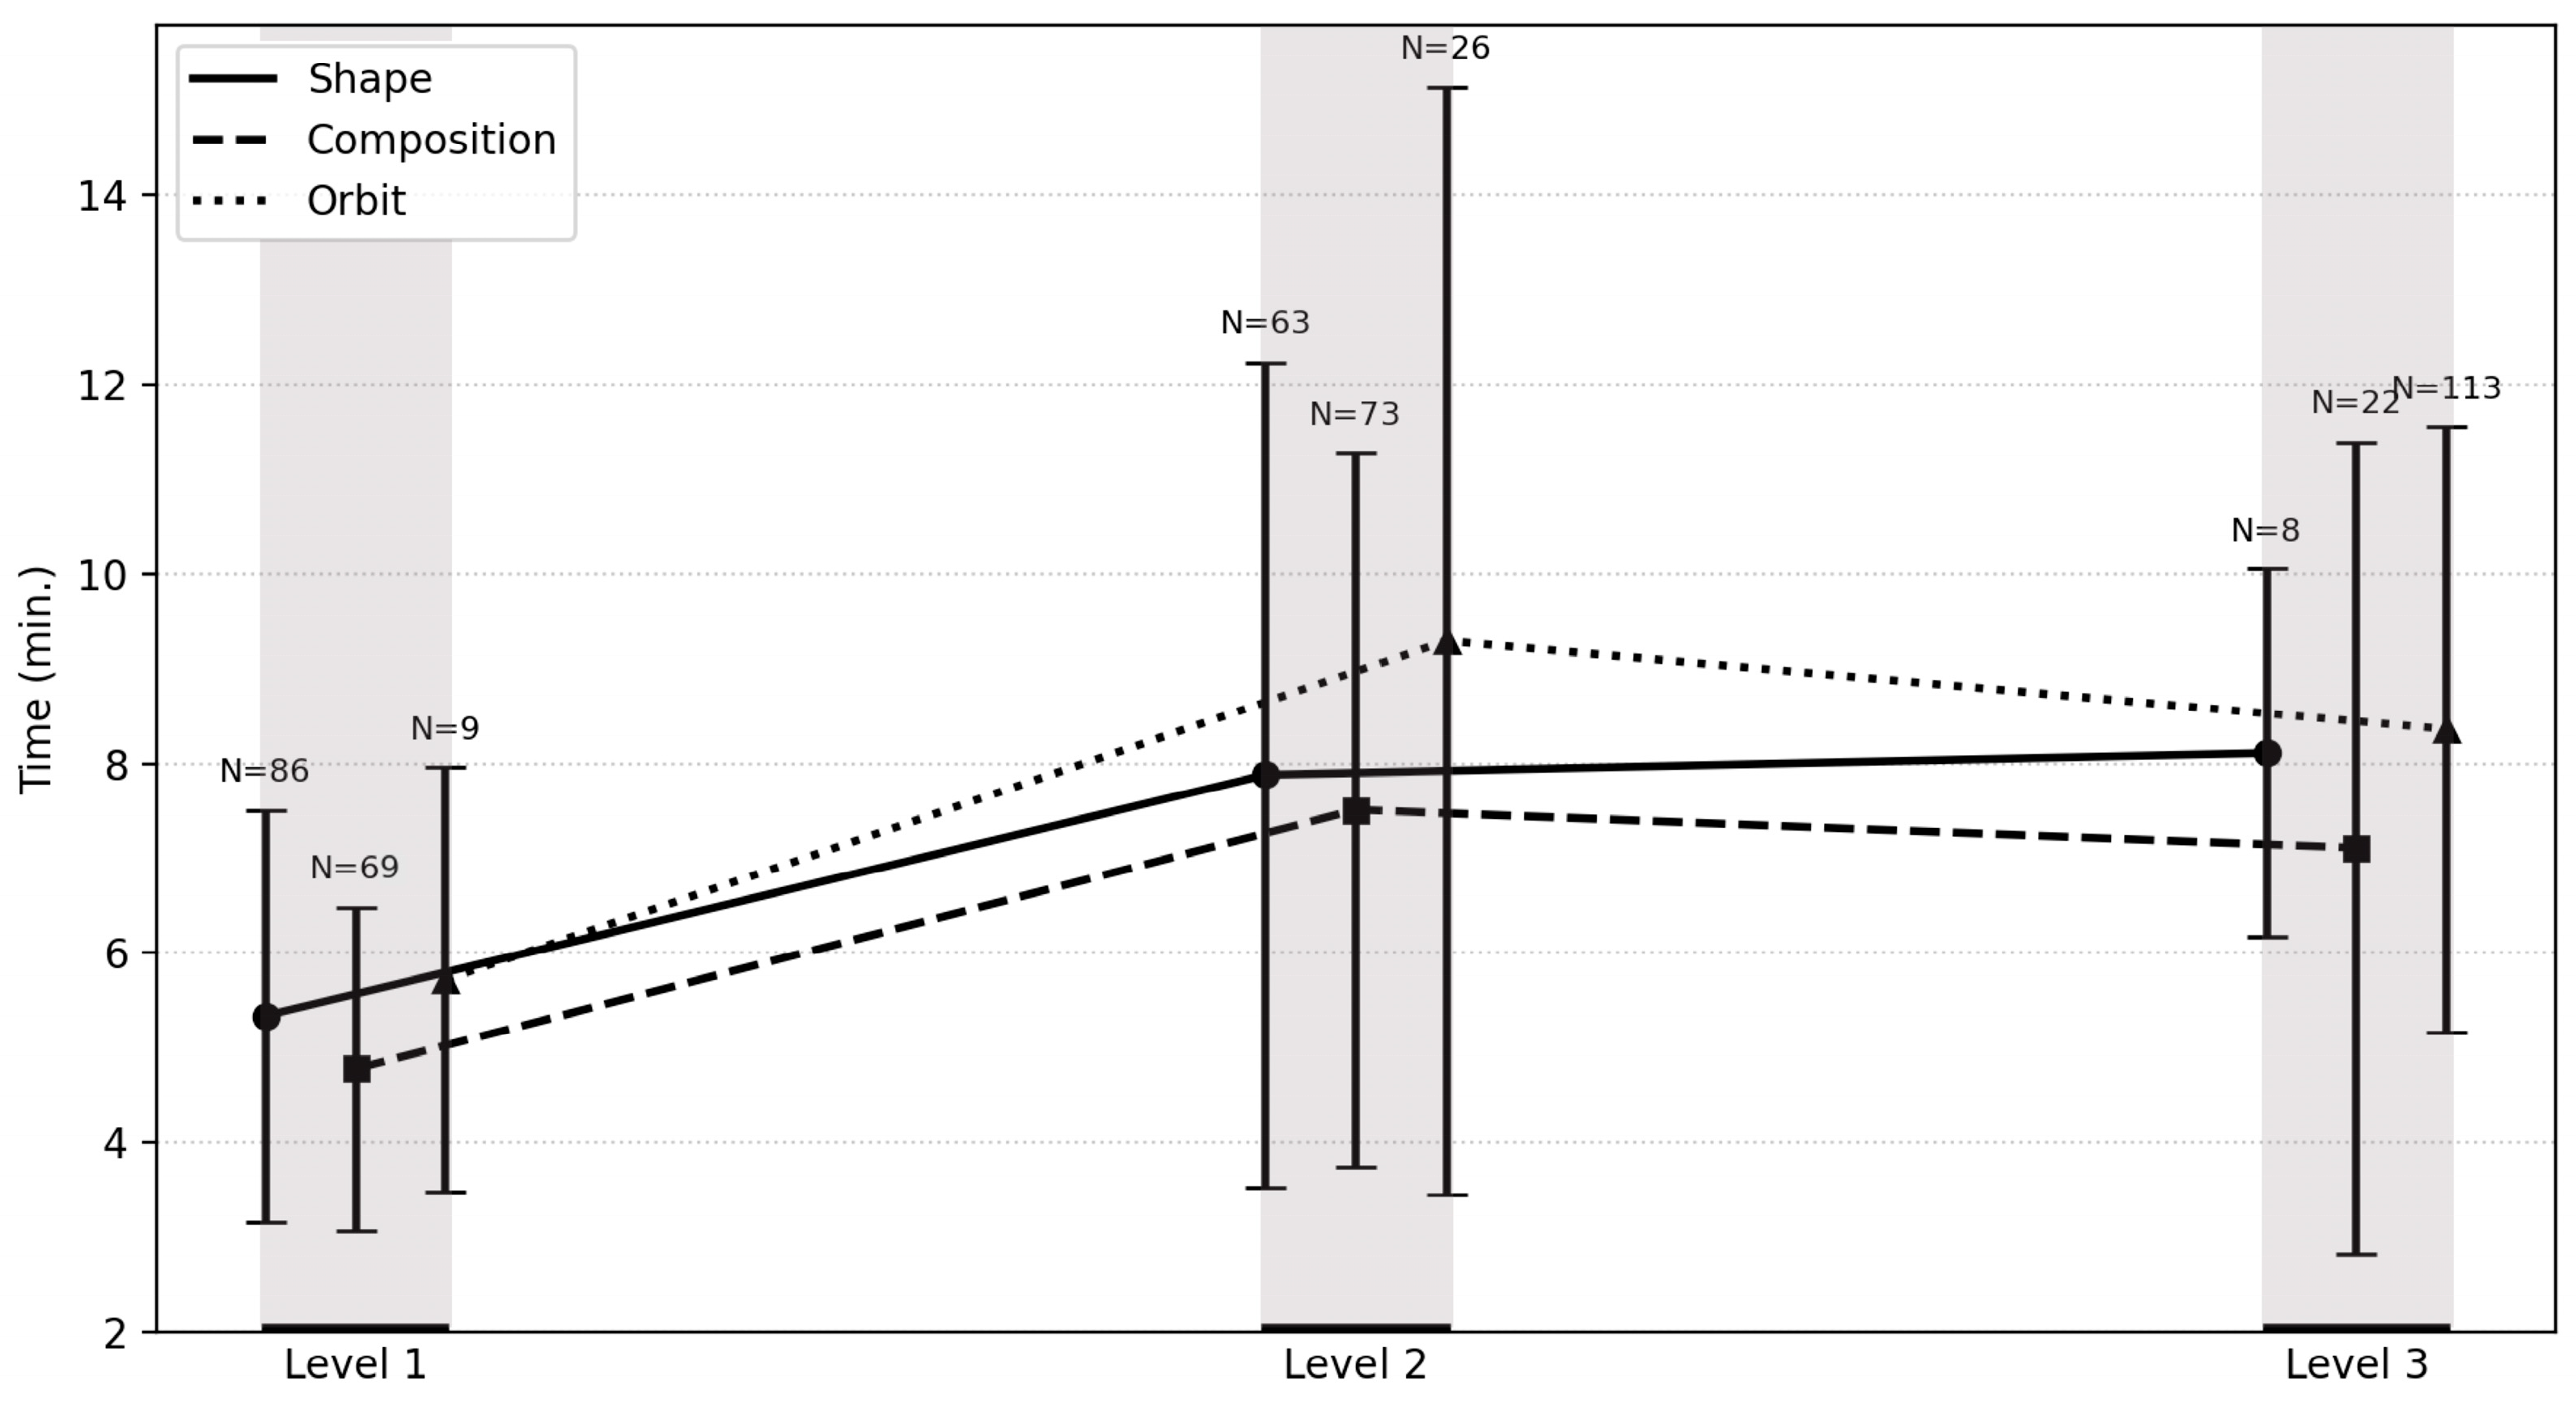
Completion times and error patterns were tracked to examine trends across classification levels. A one-way analysis of variance (ANOVA) showed that average task completion time (see Figure 8) differed significantly across levels, F(2, 455) = 40.51, p < 0.001, η2 = 0.15. The average completion times for the total group were 5.5 min at Level 1, 8.2 min at Level 2, and 8.0 min at Level 3. Post hoc tests revealed significant increases from Level 1 to Level 2 and from Level 1 to Level 3 (p < 0.001), but no significant difference between Levels 2 and 3 (p = 0.79).

5.4. Celestial Body Selection

To examine which celestial bodies were most and least favoured, an order-of-selection analysis was conducted across classification levels (see Table 2). In Level 1, familiar bodies such as Earth and Halley’s Comet were most frequently selected first. By Levels 2 and 3, several bodies previously chosen last—such as Saturn, Vesta, and Mercury—appeared among the top three first-dragged selections.
Redrag patterns supported this shift. A redrag was counted when students revisited and changed an earlier choice after checking their answers. Pluto (8.7% redrag rate), Jupiter (11.9%), and Earth (10.1%) showed the highest drag frequencies and the lowest redrag rates. In contrast, Saturn (15.7%) and Vesta (16.1%) had lower relative drag rates and moderately higher redrag frequencies.

5.5. Student Interaction with the Application Functions

Of the total sample (N = 164), 89 students were offered the option to consult feedback after making an error. Among these, 28% (n = 25) chose to use the feedback function at least once. Feedback access and feedback use were treated as distinct measures. Students in the non-feedback condition had no access to feedback prompts, whereas students in the feedback-enabled condition could choose whether to consult a prompt following an error. Subsequent analyses of actual feedback use are therefore descriptive and should not be interpreted as comparisons between experimentally equivalent user groups.
Three key observations emerged:
(1)
Check use. Across the full sample (N = 155), check use gradually increased across classification levels, F(2, 154) = 9.58, p < 0.001. The full sample included both students who were not given access to feedback and those who chose not to use it. Feedback users showed higher levels of check activity at Level 1 (M = 2.33 vs. 1.26) and Level 2 (M = 4.38 vs. 1.70). Given the small and self-selected feedback-user subgroup, these differences are reported descriptively and are not interpreted as evidence of an effect of feedback.
(2)
Overall activity. Feedback users were also more actively dragging the celestial bodies. They more than doubled the number of drag actions at Level 2. Drag actions did not differ significantly across levels for the total group, F(2, 154) = 1.14, p = 0.32, but feedback users performed more at Level 2 (M = 50.88 vs. M = 25.73; +98%). Dragging activity after checking peaked at Level 2 for the full sample, nearly 9 times higher than at Level 1, F(2, 154) = 11.19, p < 0.001. The same pattern was observed among the feedback users.
(3)
Feedback engagement. Feedback use was uneven across levels. Both the number of consultations and consultations per student rose at Level 3, yet students who consulted feedback at Level 1 did not continue to use it in later levels. Only two feedback users consulted feedback at both Levels 2 and 3. It is important to note that this represents a very small sample, which limits generalising these findings.
Feedback users mirrored the full-sample pattern in that Level 2 took longer than Level 1; however, they consistently required about 1 to 2.5 min more per level than the non-feedback users (e.g., +1.1 min at Level 1, +2.4 min at Level 2, and +2.0 min at Level 3). The Level 2 difference corresponds to a small-to-moderate effect, d = 0.39. Nonetheless, due to the small sample size of feedback users, this difference could not be tested for statistical significance.

5.6. Student Performance

This analysis compared the number of student errors (referred to as “False Occurrences” in Table 3) across classification levels for both feedback users and the comparison group (non-feedback users), as summarised in Table 3. As students progressed from Level 1 to Level 2, errors increased significantly for the properties of orbit and composition, while errors related to shape rose more gradually. Among feedback users, error counts increased nearly fivefold from Level 1 to Level 2. Given the small feedback-user subgroup, this pattern is reported descriptively. Error counts were higher for feedback users across all levels and properties. A detailed analysis of feedback users’ error patterns (see Table 4) revealed consistent misclassifications:
  • Level 1: Saturn and Charon were most often misclassified by shape.
  • Level 2: Deimos and the Moon were frequently misclassified by composition.
  • Level 3: Deimos accounted for most orbit-related errors.
A repeated-measures ANOVA, using the full sample of students, confirmed a significant difference in student errors across the three levels, F(2, 328) = 3.52, p = 0.031, and a linear mixed-effects model further indicated a significant fixed effect of session on errors, b = 2.4, SE = 0.7, p = 0.0006 (see Table 5). Based on individual error trajectories from the mixed model, students were classified into progression categories: 27% struggling, 23% improved, 33% showed no change, and 16% had incomplete data, with dropouts predominantly occurring at Level 3 (67%) compared to Level 2 (33%).

5.7. Post Lesson Experience Survey

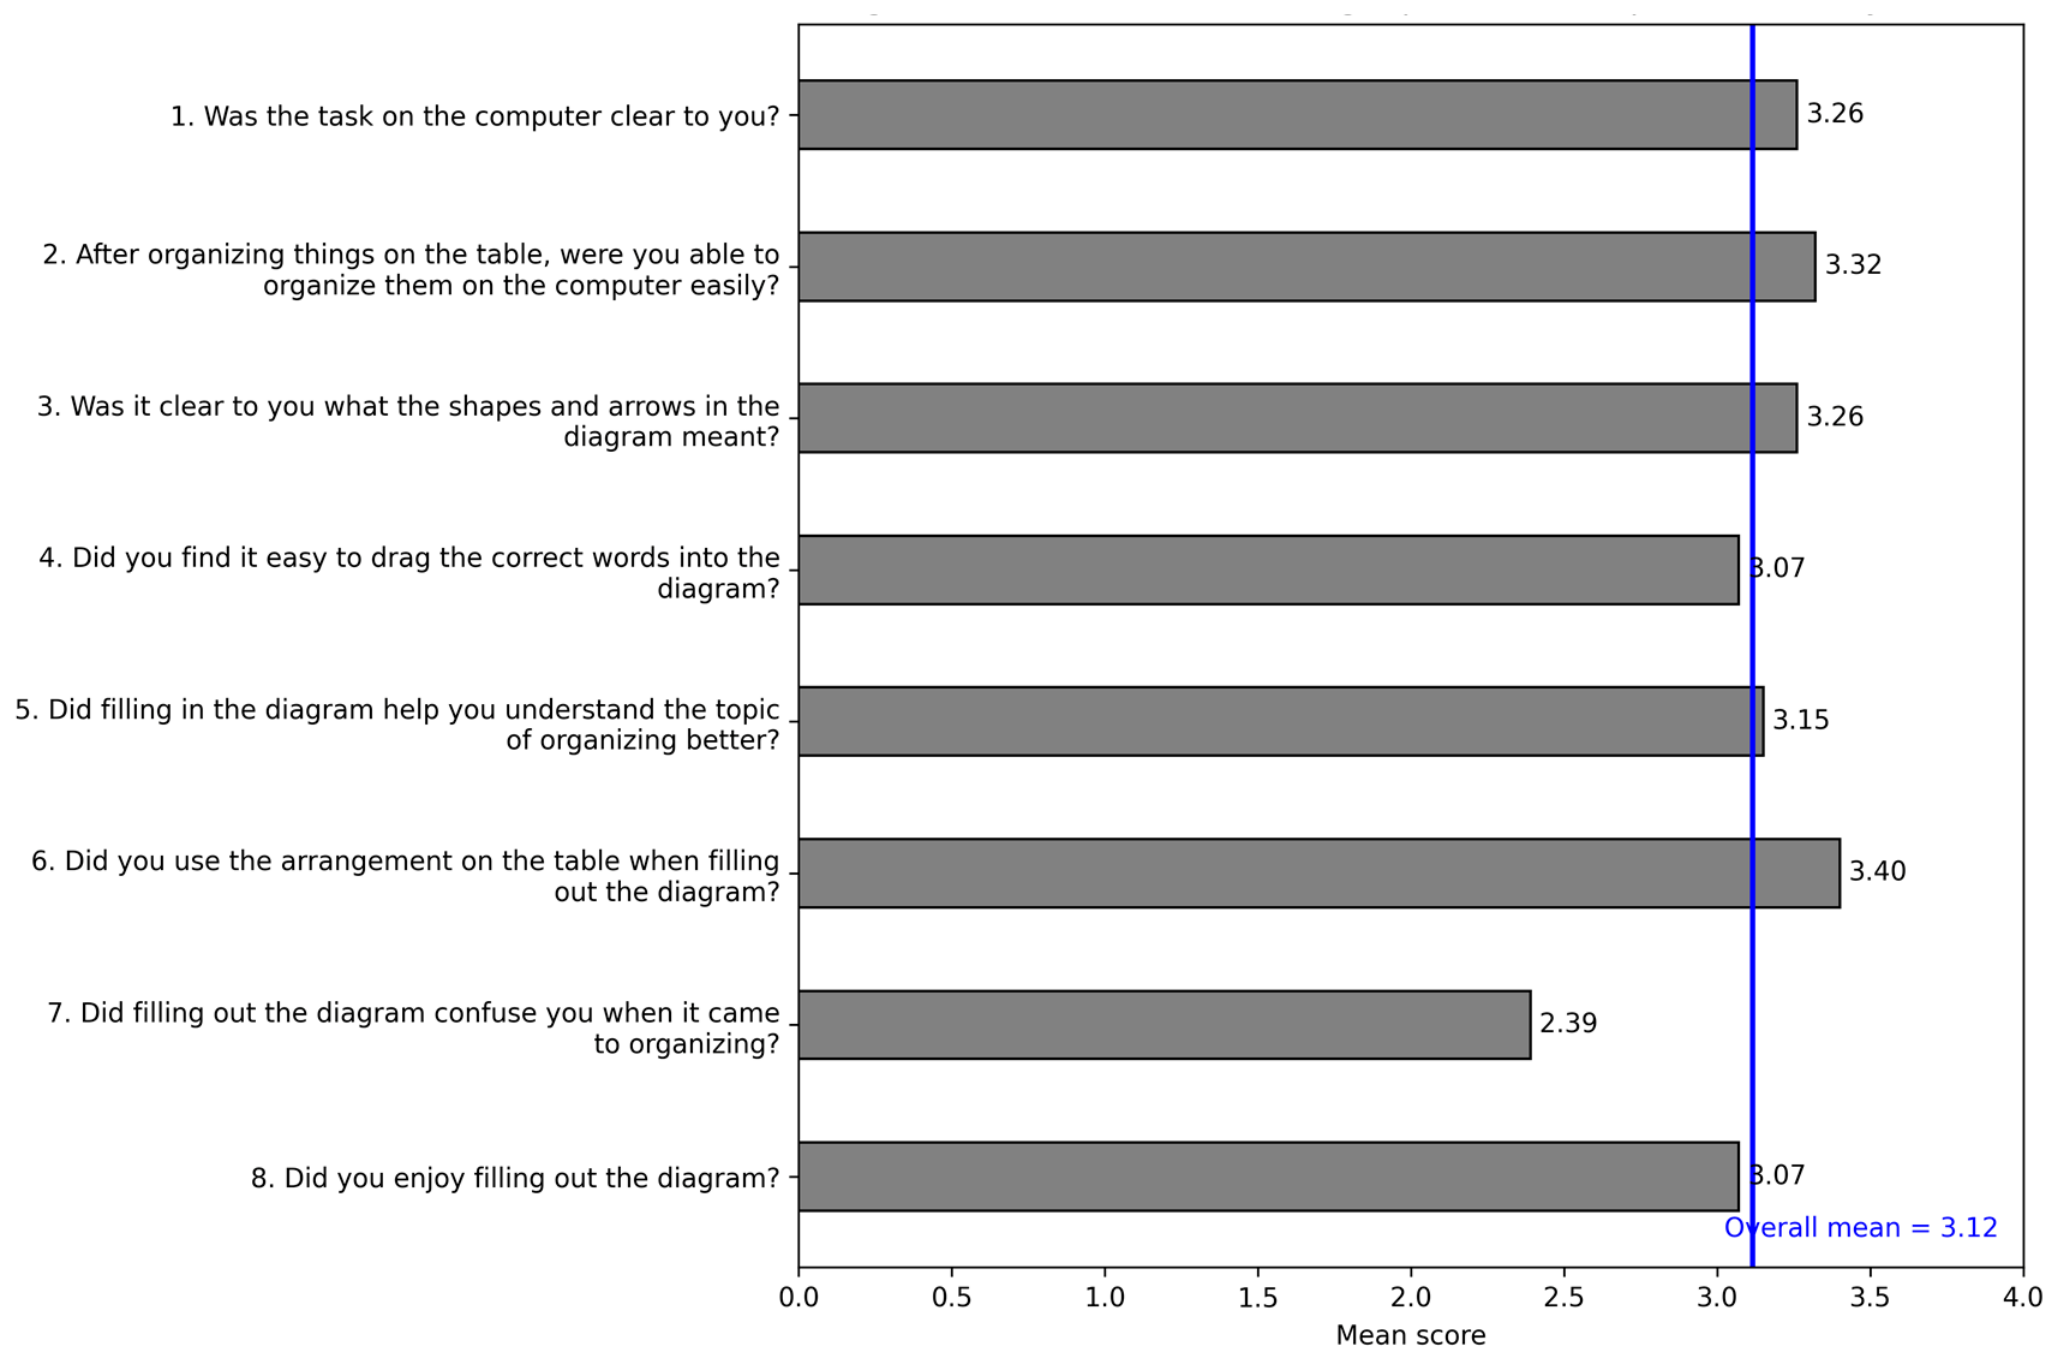
Post-lesson experience survey responses (see Figure 9) indicated that most students (87.5%) agreed that completing the diagram supported their understanding of the topic, while 12.5% disagreed or strongly disagreed. The mean scores across the eight post-lesson experience items are visualised in Figure 9.
The questionnaire was integrated directly into the application, allowing students to provide immediate feedback after completing the lesson. When asked whether any part of the diagram was difficult to complete, most students answered “no.” Among those who did report difficulties, common themes included issues with the dragging interface (“dragging the celestial bodies”), challenges at the final level of the diagram (‘the last level”), and confusion about orbital movement (“orbit”). A few students also identified specific celestial bodies they found difficult to classify, such as Neptune.

6. Discussion

This section is organised into three parts. The first examines student engagement with the classification exercises, the second explores their performance across levels, and the third discusses study limitations.

6.1. Engagement

Student engagement during the classification task was assessed based on task completion time and the strategies students used when selecting classification properties. In the earlier levels, students predominantly selected shape (46.7%) or composition (37.5%), these properties were easily inferred from visual features or short textual descriptions in the lesson materials. Aligned visual elements across the cards, map, and interface may have supported early shape and composition-based classifications [35]. The predominance of orbit at Level 3 should not be interpreted as evidence of a developing preference or learning effect, as orbit was the only remaining untested property for most students. More informative is its limited selection at Levels 1 and 2, when students could still choose between multiple properties.
In addition to property selection, students’ object placement patterns also reveal shifts in strategy over time. At Level 1, Earth and Halley’s Comet were most often placed first, while less familiar bodies (e.g., Deimos, Saturn, Charon) tended to be placed last. By Level 2 and 3, this pattern reverses, with previously last-placed bodies like Saturn and Mercury appearing among the top three first-placed items. This shift may reflect a move from reliance on familiar reference points to more complex or uncertain items, consistent with progressive-complexity principles [20]. Drag and redrag data support this pattern. Celestial bodies such as Earth and Pluto showed high drag rates (above 90%) and low redrag rates (around 10%), indicating confidence during placement. In contrast, celestial bodies like Saturn, Uranus, Phobos and Vesta were dragged less often but showed higher redrag rates (15–16%), suggesting that students may have been less certain about these objects and were more likely to revise their initial decisions.
Timing data also aligned with these engagement trends. Mean completion time rose from 5.5 min at Level 1 to 8.2 min at Level 2 (an increase of about 2.7 min) and then stabilised at 8.0 min at Level 3, suggesting that the challenges at Level 2 fostered the skills needed for the final level. Concurrently, the use of the Check function and the dragging behaviour thereafter peaked at level 2 and then declined, implying improved decision making, an effect predicted by cognitive-load theory, which posits that repeated engagement reduces processing demands [10].

6.2. Performance

The pre–post assessment showed a statistically significant but small increase in knowledge scores (d = 0.21). However, because no control group completed the assessments without the lesson, alternative explanations such as test–retest effects cannot be excluded. This learning gain is consistent with observable trends in how students interacted with the application across classification levels.
Task performance varied with complexity. At Level 1, students made few errors when classifying the celestial bodies by composition, reflecting the task’s simplicity at this stage, which involved sorting familiar objects into just two clearly defined categories. By contrast, orbit-related errors persisted at Level 3. These errors should not be interpreted solely as evidence of students’ conceptual difficulty. The instructional materials themselves may have contributed, particularly through the simplified 2D representation of orbital relations and ambiguous labelling of objects such as Pluto and Charon.
These performance trends are supported by the statistical analyses (see Section 5.6) showing significant differences in errors across levels. Individual student progressions varied widely, with some improving, others struggling, and a portion disengaging before completing the tasks. This variability highlights the need to investigate how different forms of feedback integration influence engagement as task difficulty increases.
Students’ self-reported experiences further support these observations. According to the post-lesson experience survey (Section 5.7), 87.5% of students agreed that completing the diagram helped them understand the topic. This perception aligns with observed learning gains and may explain sustained task engagement across levels. When asked whether any part of the diagram was difficult, students most cited the dragging interface, the final level of the diagram, and orbital classification—all of which correspond to observed performance challenges and support the interpretation that these areas introduced higher cognitive load.
Feedback usage was limited but revealing. Of the 89 students offered feedback following an error, 25 (28%) consulted it at least once. This low uptake aligns with research showing that students often avoid optional automated feedback [2,42], particularly in science tasks that lack structured support [21]. Similar patterns of limited engagement have been widely reported in higher education contexts (e.g., [46,47]), yet such findings remain relatively unexplored in primary education. Students who actively sought out the feedback function showed more active overall engagement, performing more checks and drag actions, particularly at Level 2—but also made more errors. However, this engagement was not reflected in the number of feedback consultations across levels. While several students consulted feedback in Level 1, none of these students used it again in Levels 2 or 3. Each level saw almost entirely new feedback users, with only two students using feedback in both Level 2 and Level 3. The students who engaged with feedback revised their strategies, particularly at Level 2, where 78% of post-feedback actions involved dragging—a strong indicator of feedback prompting high engagement.
Students’ drag behaviour further highlights the role of task complexity. Drag actions before and after checks peaked at Level 2, where a second layer of classification was introduced, and previous placements disappeared—forcing re-evaluation and re-classification. By Level 3, drag counts declined, reflecting students’ growing task familiarity and understanding.
Error analysis reveals property-specific challenges. While mistakes related to “shape” were minimal, mistakes in “composition” and especially “orbit” rose sharply at Level 2, particularly among feedback users, whose error count increased nearly fivefold from Level 1 to level 2 (p < 0.001). These mistakes then declined at Level 3, while non-feedback users’ errors continued to rise, peaking in the final level. For example, Deimos and the Moon were frequently misclassified by composition in Level 2 but also emerged as the most common source of orbit-related errors in Level 3. These patterns indicate that some concepts were not fully supported by the instructional design—particularly the idea that moons orbit planets.
These performance differences are mirrored in the overall learning trajectories. Across levels, 27% of students were classified as struggling, 23% as improved, 33% showed no change, and 16% had incomplete data (see Table 5). Notably, most drop-offs occurred after a strong start, suggesting that attrition was more likely driven by increased task difficulty than initial skill level. Together, these trends underscore the need for better structured support for conceptual transitions, particularly those related to orbit.

6.3. Study Limitations

This study presents several limitations. Despite instructions to work individually or in pairs, peer discussions were frequent. Such interaction may represent an additional way in which the application supports learning, although the extent to which the application stimulates peer interaction requires further investigation. Consequently, the present design cannot isolate changes associated with the application from those arising through peer support, and the observed outcomes cannot be attributed to the software alone. Additionally, feedback use was voluntary, and few students chose to utilise this option. The small number of consistent feedback users also limits the strength of conclusions drawn about its effectiveness.
Conceptual challenges, particularly concerning orbit, were likely exacerbated by the lesson materials. Misconceptions may have been reinforced by oversimplifications in the 2D solar system map or unclear labels (e.g., Charon shown orbiting Pluto without clarifying its classification as a dwarf planet rather than a planet). Future versions should consider the use of more immersive visualisations or 3D representations to address these conceptual difficulties [48].
Time constraints also likely affected outcomes. The 60 min lesson may have been too short for students to engage deeply with the feedback or to consolidate understanding of multi-level classification and orbital dynamics.

7. Summary of Findings

This study offers three key insights.
(1)
Student Adaptation: Students showed a clear preference for the visually distinct properties “shape” and “composition” in earlier levels, ultimately postponing the property “orbit”. Task completion time peaked at Level 2 but either stabilised or decreased by Level 3, suggesting that the challenges encountered in Level 2 helped students develop basic essential classification skills. Additionally, students’ selection patterns evolved, with more unfamiliar and distant celestial bodies being placed earlier in higher levels, indicating growing confidence and exploratory behaviour.
(2)
Limited Feedback Engagement: Of the 89 students offered feedback following an error, 25 consulted it at least once, while repeated use across classification levels was limited. Feedback users showed more checking and dragging activity but also made more errors. Given the small group of feedback users, these findings do not allow conclusions about feedback effectiveness. Instead, they indicate that optional feedback produced limited and fragmented uptake and requires further integration into the lesson design. Future studies should directly compare voluntary feedback with more structured or mandatory feedback conditions to determine whether increased exposure changes feedback uptake, error correction, or learning outcomes.
(3)
Challenges with Abstract Concepts: Students struggled most with the abstract concepts of “orbit,” which remained the most challenging property across all levels.
Overall, the classroom evaluation identifies both workable and problematic elements of the current lesson design. Students engaged with the classification activity, but optional feedback was used by relatively few students, and orbit-related classifications remained challenging. The findings therefore primarily provide evidence about how the lesson functions in an authentic classroom setting and identify directions for further development.

Author Contributions

I.B. conceived and designed the study, coordinated data collection and managed ethical approval, performed the analysis, and drafted the manuscript. J.H., B.B. and P.R. supervised the research project and provided guidance on all aspects of the study. P.K. and Ionica Smeets provided guidance on study set-up and data analysis. T.V.E. recruited schools for participation. All authors critically revised the manuscript for important intellectual content and approved the final version. All authors have read and agreed to the published version of the manuscript.

Funding

This research was supported by The Dutch Black Hole Consortium (grant dossier number: NWA.1292.19.202).

Institutional Review Board Statement

The study was conducted in accordance with the Declaration of Helsinki, and approved by the Ethics Review Board of the Faculty of Education of the Amsterdam University of Applied Sciences (Ref: HVA-259; approval date: 30 November 2023). All methods were performed in accordance with the relevant guidelines and regulations of the Ethics Review Board of the Faculty of Education of the Amsterdam University of Applied Sciences.

Informed Consent Statement

Written informed consent was obtained from parents/guardians of all participating primary school students using a standardized consent form. Parents/guardians were informed in writing about the study and could withdraw their child at any time without giving a reason.

Data Availability Statement

The datasets generated and analyzed during the current study are available from the corresponding author on reasonable request.

Acknowledgments

The authors would like to thank Ionica Smeets for her thoughtful suggestions on the paper and insights into the data analysis, Anders Bouwer for his input on the lesson design, and Catherine van Beuningen and Martine Gijsel for sharing their expertise and for the valuable discussions. We also thank the primary schools in Amsterdam and Alphen aan den Rijn that participated in the study, and the teachers who welcomed us into their classrooms and supported our research. Finally, we are especially grateful to all the students who participated for their enthusiasm, curiosity, and willingness to share their ideas and experiences.

Conflicts of Interest

The authors declare no conflicts of interest.

References

  1. Deehan, J.; MacDonald, A.; Morris, C. A scoping review of interventions in primary science education. Stud. Sci. Educ. 2024, 60, 1–43. [Google Scholar] [CrossRef] [Scilit]
  2. Bennett, J.; Dunlop, L.; Atkinson, L.; Compton, S.; Glasspoole-Bird, H.; Lubben, F.; Reiss, M.J.; Turkenburg-van Diepen, M. A Systematic Review of Approaches to Primary Science Teaching; Education Endowment Foundation: London, UK, 2023; Available online: https://educationendowmentfoundation.org.uk/education-evidence/evidence-reviews/primary-science (accessed on 30 July 2025).
  3. Kolbe, T.; Steele, C.; White, B. Time to teach: Instructional time and science teachers’ use of inquiry-oriented instructional practices. Teach. Coll. Rec. 2020, 122, 1–54. [Google Scholar] [CrossRef] [Scilit]
  4. van Uum, M.S.J.; Peeters, M.; Verhoeff, R.P. Professionalising primary school teachers in guiding inquiry-based learning. Res. Sci. Educ. 2019, 51, 81–108. [Google Scholar] [CrossRef] [Scilit]
  5. Deehan, J.; MacDonald, A. Examining the Metropolitan and Non-metropolitan Educational Divide: Science Teaching Efficacy Beliefs and Teaching Practices of Australian Primary Science Educators. Res. Sci. Educ. 2023, 53, 889–917. [Google Scholar] [CrossRef] [Scilit]
  6. Baumanns, L.; Pitta-Pantazi, D.; Demosthenous, E.; Lilienthal, A.J.; Christou, C.; Schindler, M. Pattern-recognition processes of first-grade students: An explorative eye-tracking study. Int. J. Sci. Math. Educ. 2024, 22, 1663–1682. [Google Scholar] [CrossRef] [Scilit]
  7. Rizos, I.; Gkrekas, N. Pattern recognition among primary school students: The relationship with mathematical problem-solving. Contemp. Math. Sci. Educ. 2024, 5, ep24010. [Google Scholar] [CrossRef] [Scilit]
  8. Lüken, M.M.; Sauzet, O. Patterning strategies in early childhood: A mixed methods study examining 3- to 5-year-old children’s patterning competencies. Math. Think. Learn. 2021, 23, 28–48. [Google Scholar] [CrossRef] [Scilit]
  9. Kirschner, P.A.; Sweller, J.; Clark, R.E. Why minimal guidance during instruction does not work: An analysis of the failure of constructivist, discovery, problem-based, experiential, and inquiry-based teaching. Educ. Psychol. 2010, 41, 75–86. [Google Scholar] [CrossRef] [Scilit]
  10. Sweller, J.; Ayres, P.; Kalyuga, S. Cognitive Load Theory; Springer: New York, NY, USA, 2011. [Google Scholar] [CrossRef] [Scilit]
  11. Wammes, D.; Kester, L.; Slof, B. Adapting the difficulty of hands-on tasks to pupils’ prior knowledge: Effects on challenge and skill development. Int. J. Technol. Des. Educ. 2025; advance online publication. [CrossRef] [Scilit]
  12. Kapici, H.O.; Akcay, H.; Cakir, H. Investigating the effects of different levels of guidance in inquiry-based hands-on and virtual science laboratories. Int. J. Sci. Educ. 2022, 44, 324–345. [Google Scholar] [CrossRef] [Scilit]
  13. Lukasenko, R.; Anohina-Naumeca, A.; Vilkelis, M.; Grundspenkis, J. Feedback in the concept map based intelligent knowledge assessment system. Sci. J. Riga. Tech. Univ. Comput. Sci. Appl. Comput. Syst. 2010, 43, 1–10. [Google Scholar]
  14. Hattie, J.; Timperley, H. The power of feedback. Rev. Educ. Res. 2007, 77, 81–112. [Google Scholar] [CrossRef] [Scilit]
  15. Gerard, L.F.; Ryoo, K.; McElhaney, K.W.; Liu, O.L.; Rafferty, A.N.; Linn, M.C. Automated guidance for student inquiry. J. Educ. Psychol. 2016, 108, 60–81. [Google Scholar] [CrossRef] [Scilit]
  16. Stevenson, M.P.; Hartmeyer, R.; Bentsen, P. Systematically reviewing the potential of concept mapping technologies to promote self-regulated learning in primary and secondary science education. Educ. Res. Rev. 2017, 21, 1–16. [Google Scholar] [CrossRef] [Scilit]
  17. Schroeder, N.L.; Nesbit, J.C.; Anguiano, C.J.; Adesope, O.O. Studying and constructing concept maps: A meta-analysis. Educ. Psychol. Rev. 2018, 30, 431–455. [Google Scholar] [CrossRef] [Scilit]
  18. van Eijck, T.; Bredeweg, B.; Holt, J.; Pijls, M.; Bouwer, A.; Hotze, A.; Louman, E.; Ouchchahd, A.; Sprinkhuizen, M. Combining hands-on and minds-on learning with interactive diagrams in primary science education. Int. J. Sci. Educ. 2024; advance online publication. [CrossRef] [Scilit]
  19. Höfrová, A.; Balidemaj, V.; Small, M.A. A systematic literature review of education for Generation Alpha. Discov. Educ. 2024, 3, 125. [Google Scholar] [CrossRef] [Scilit]
  20. Bransford, J.D.; Brown, A.L.; Cocking, R.R. (Eds.) How People Learn: Brain, Mind, Experience, and School: Expanded Edition; National Academy Press: Washington, DC, USA, 2000. [Google Scholar] [CrossRef] [Scilit]
  21. Boer, I.; Hornstra, L.; van de Pol, J.; Bakx, A. Teacher expectations: Associations with need supportive teaching and students’ need satisfaction. Eur. J. Psychol. Educ. 2025, 40, 77. [Google Scholar] [CrossRef] [Scilit]
  22. Kotsis, K.T. The significance of experiments in inquiry-based science teaching. Eur. J. Educ. Pedagog. 2024, 5, 815. [Google Scholar] [CrossRef] [Scilit]
  23. Gillies, R.M. Using cooperative learning to enhance students’ learning and engagement during inquiry-based science. Educ. Sci. 2023, 13, 1242. [Google Scholar] [CrossRef] [Scilit]
  24. Hollenstein, L.; Brühwiler, C. The importance of teachers’ pedagogical-psychological teaching knowledge for successful teaching and learning. J. Curric. Stud. 2024, 56, 480–495. [Google Scholar] [CrossRef] [Scilit]
  25. Pappa, C.I.; Georgiou, D.; Pittich, D. Technology education in primary schools: Addressing teachers’ perceptions, perceived barriers, and needs. Int. J. Technol. Des. Educ. 2024, 34, 485–503. [Google Scholar] [CrossRef] [Scilit]
  26. Markwick, A.; Reiss, M.J. Professional learning in primary science: Developing teacher confidence to improve the leadership of teaching and learning. Int. J. Sci. Educ. 2024, 46, 1339–1359. [Google Scholar] [CrossRef] [Scilit]
  27. Osborne, J. Teaching scientific practices: Meeting the challenge of change. J. Sci. Teach. Educ. 2014, 25, 177–196. [Google Scholar] [CrossRef] [Scilit]
  28. Teig, N.; Scherer, R.; Nilsen, T. I know I can, but do I have the time? The role of teachers’ self-efficacy and perceived time constraints in implementing cognitive-activation strategies in science. Front. Psychol. 2019, 10, 1697. [Google Scholar] [CrossRef] [Scilit]
  29. Pedersen, J.E.; McCurdy, D.W. The effects of hands-on, minds-on teaching experiences on attitudes of preservice elementary teachers. Sci. Educ. 1992, 76, 141–146. [Google Scholar] [CrossRef] [Scilit]
  30. Palac, N.C.J.C.; Baldo, K.J.C.; Socorro, N.M.G.; Berame, J.S. Determining the intermediate grade pupils’ perceived learning difficulties in science class experiences. Am. J. Educ. Technol. 2024, 4, 1–11. [Google Scholar] [CrossRef] [Scilit]
  31. SLO. Primary Science Curriculum Guidelines; SLO: Enschede, The Netherlands, 2023. [Google Scholar]
  32. Tzuriel, D. Dynamic assessment of learning potential: More than learning ability. Educ. Child Psychol. 2017, 34, 74–87. [Google Scholar] [CrossRef] [Scilit]
  33. De Vaan, A.; Marell, M. Assessing Classification Skills in Primary Education; Utrecht University Press: Utrecht, The Netherlands, 2012. [Google Scholar]
  34. Sutopo, S.; Waldrip, B. Impact of a representational approach on students’ reasoning and conceptual understanding in learning mechanics. Int. J. Sci. Math. Educ. 2014, 12, 891–909. [Google Scholar] [CrossRef] [Scilit]
  35. Eshuis, E.H. Powering up Collaboration and Knowledge Monitoring: Reflection-Based Support for 21st-Century Skills in Secondary Vocational Technical Education. Doctoral Dissertation, University of Twente, Enschede, The Netherlands, 2021. [Google Scholar]
  36. Tytler, R.; Prain, V. Representation construction to support conceptual change. In International Handbook of Research on Conceptual Change, 2nd ed.; Vosniadou, S., Ed.; Routledge: New York, NY, USA, 2013; Volume 29, pp. 560–579. [Google Scholar]
  37. Larkin, J.H.; Simon, H.A. Why a diagram is (sometimes) worth ten thousand words. Cogn. Sci. 1987, 11, 65–99. [Google Scholar] [CrossRef]
  38. Golke, S.; Steininger, T.; Wittwer, J. What makes learners overestimate their text comprehension? The impact of learner characteristics on judgment bias. Educ. Psychol. Rev. 2022, 34, 2405–2450. [Google Scholar] [CrossRef] [Scilit]
  39. Eshuis, E.H.; Ter Vrugte, J.; Anjewierden, A.; de Jong, T. Expert examples and prompted reflection in learning with self-generated concept maps. J. Comput. Assist. Learn. 2022, 38, 350–365. [Google Scholar] [CrossRef] [Scilit]
  40. Siantuba, J.; Nkhata, L.; de Jong, T. The impact of an online inquiry-based learning environment addressing misconceptions on students’ performance. Smart Learn. Environ. 2023, 10, 22. [Google Scholar] [CrossRef] [Scilit]
  41. Bredeweg, B.; Kragten, M.; Holt, J.; Kruit, P.; van Eijck, T. Learning with interactive knowledge representations. Appl. Sci. 2023, 13, 5256. [Google Scholar] [CrossRef] [Scilit]
  42. Holt, J.; Bredeweg, B.; Pijls, M.H.J.; van Eijck, T.J.W.; Hotze, A.; Louman, E.; Ouchchahd, A.; Bouwer, A.J. Minds–On: A Framework for Supporting the Teaching and Learning of Scientific Concepts and Reasoning in Primary Education Using Interactive Diagrams. In Scientific and Educational Methodologies for Teaching Science; Cano Carmona, E., Cano Ortiz, A., Eds.; IntechOpen: London, UK, 2026. [Google Scholar] [CrossRef] [Scilit]
  43. Krieglstein, F.; Schneider, S.; Beege, M.; Rey, G.D. How the design and complexity of concept maps influence cognitive learning processes. Educ. Technol. Res. Dev. 2022, 70, 99–118. [Google Scholar] [CrossRef] [Scilit]
  44. Kroeze, K.A.; van den Berg, S.M.; Veldkamp, B.P.; de Jong, T. Automated assessment of and feedback on concept maps during inquiry learning. IEEE Trans. Learn. Technol. 2021, 14, 460–473. [Google Scholar] [CrossRef] [Scilit]
  45. de Jong, T.; Lazonder, A.W.; Chinn, C.A.; Fischer, F.; Gobert, J.; Hmelo-Silver, C.E.; Koedinger, K.R.; Krajcik, J.S.; Kyza, E.A.; Linn, M.C.; et al. Let’s talk evidence—The case for combining inquiry-based and direct instruction. Educ. Res. Rev. 2023, 39, 100536. [Google Scholar] [CrossRef] [Scilit]
  46. Winstone, N.E.; Nash, R.A.; Rowntree, J.; Parker, M. “It’d be useful, but I wouldn’t use it”: Barriers to university students’ feedback seeking and recipience. Stud. High. Educ. 2017, 42, 2026–2041. [Google Scholar] [CrossRef] [Scilit]
  47. Carless, D.; Boud, D. The development of student feedback literacy: Enabling uptake of feedback. Assess. Eval. High. Educ. 2018, 43, 1315–1325. [Google Scholar] [CrossRef] [Scilit]
  48. Bekaert, H.; De Cock, M.; Van Dooren, W.; Van Winckel, H. Investigating students’ insight after attending a planetarium presentation about the apparent motion of the Sun and stars. Phys. Rev. Phys. Educ. Res. 2024, 20, 010141. [Google Scholar] [CrossRef] [Scilit]
Figure 1. Introductory questions used to assess students’ baseline knowledge.
Applsci 16 09978 g001
Figure 2. Minds-On ‘Solar System’ exercise and the cross-cutting concept of classification across three levels.
Applsci 16 09978 g002
Figure 3. Solar System map and celestial body cards used in the hands-on learning activity.
Applsci 16 09978 g003
Figure 4. Feedback screen from the “Minds-On” software during the classification exercise. Vesta was incorrectly classified as “round”, as indicated by the red font color.
Applsci 16 09978 g004
Figure 5. Four sample questions from each category of the pre- and post-test, representing a range of skills assessed, such as classification, pattern recognition, and content knowledge about celestial bodies.
Applsci 16 09978 g005
Figure 6. Mean pre-test and post-test knowledge scores on the 30-item assessment.
Applsci 16 09978 g006
Figure 7. Distribution of students’ property (composition, shape, and orbit) selection across the different levels (L1, L2, L3).
Applsci 16 09978 g007
Figure 8. Mean time spent (in minutes) on each property across Levels 1–3, with error bars representing standard deviations. Sample sizes (N) are shown above each point. The x-axis represents the diagram levels.
Applsci 16 09978 g008
Figure 9. Mean scores for the eight post-lesson experience survey items. Responses were provided on a four-point Likert scale ranging from 1 (Strongly disagree) to 4 (Strongly agree). Note, scores reflect students’ responses using a 4-point Likert-scale: 1 = Strongly disagree, 2 = Disagree, 3 = Agree, 4 = Strongly agree.
Applsci 16 09978 g009
Table 1. Pre-test and post-test, including means, standard deviations, paired t-test and a multilevel analysis result to assess changes in performance.
NPre-Test (Max = 30)Post-Test (Max = 30)Paired t-test ResultsMultilevel Analysis (Mixed Effects Model)
Group Mean SD Mean SD tp p
Total16419.745.7020.496.25−2.630.009−0.0230.007
Table 2. This table presents the most frequently selected first and last dragged celestial bodies across three classification levels (Level 1–3). Frequencies (in parentheses) represent student counts.
Level 1Level 2Level 3
First DraggedHalley’s Comet (25)Earth (27)Earth (23)
Earth (24)Saturn (20)Vesta (20)
Pluto (17)Pluto (14)Mercury (13)
Last DraggedSaturn (20)Charon (21)Deimos (15)
Charon (19)Phobos (16)Phobos (13)
Vesta (19)Mercury (16)Jupiter (13)
Table 3. Descriptive application-interaction metrics across classification levels for the full sample and students who consulted feedback. Reported F- and p-values concern changes across classification levels within the reported groups and should not be interpreted as tests of differences between feedback users and non-users.
FunctionTotal GroupFeedback Users
LevelNMSDSkewF(2,N)pNMSDF(2,N)p
Check11551.260.491.749.58p < 0.00192.330.501.680.21
21541.701.192.87 84.382.45
31351.852.243.69 84.253.58
Drag115523.5312.403.431.140.32932.8917.151.990.16
215425.7317.253.26 850.8830.43
313523.8118.273.89 831.2516.04
Drag After Check11550.943.775.9311.19p < 0.00193.445.551.350.28
21548.3022.883.54 812.2515.27
31354.8312.934.59 88.1210.80
False Occurrence11550.991.873.716.67p < 0.00191.440.732.610.10
21543.065.593.01 89.3810.45
31354.317.073.19 88.008.77
Feedback Consults1——————91.110.331.320.29
2——————81.620.92
3——————81.881.46
Table 4. This table presents the celestial bodies with the highest error counts made by feedback users, categorized by property (Shape, Composition, Orbit) and level (Levels 1–3). The final column indicates the percentage of students responsible for each error.
LevelN (Total)PropertyCB with Highest Error CountError CountN (Error)
Level 19ShapeSaturn880%
Charon220%
Level 28CompositionDeimos2678.8%
Moon721.2%
Level 38OrbitDeimos2080%
Moon520%
Table 5. Summary of statistical tests and distribution of students across progression categories, Note. b = regression coefficient; SE = standard error.
Analysis/GroupStatistic/PercentageN (Students)Level Breakdown
Repeated-measures ANOVAF(2, 328) = 3.52, p = 0.031164
Linear mixed-effects modelb = 2.4, SE = 0.7, p = 0.0006164
Progression categories (mixed model)
Struggling27%45
Improved23%38
No Change33%54
Incomplete16%27Level 2 dropout: 9 (33%)
Level 3 dropout: 18 (67%)
Disclaimer/Publisher’s Note: The statements, opinions and data contained in all publications are solely those of the individual author(s) and contributor(s) and not of MDPI and/or the editor(s). MDPI and/or the editor(s) disclaim responsibility for any injury to people or property resulting from any ideas, methods, instructions or products referred to in the content.