1. Introduction
With the continuous growth in vehicle ownership, some expressways can no longer meet the increasing demand for transportation. Expanding existing expressways has thus become a significant trend in highway infrastructure development. As a crucial component of highway systems, the most commonly adopted capacity expansion solution for highway tunnels is to construct new tunnels on both sides of the existing ones. Blasting, favored for its high excavation efficiency and relatively low cost, is a widely used method for tunnel excavation. However, when the distance between the blast source and the existing tunnel is small, the vibrations generated by blasting excavation can jeopardize the safety of the existing tunnel [
1,
2,
3,
4]. Therefore, clarifying the dynamic response characteristics of adjacent tunnels under blast vibrations and proposing safety control criteria for blasting operations are essential issues for ensuring the safety of neighboring tunnels.
In the study of tunnel safety control standards, peak particle velocity (PPV) serves as a crucial reference control parameter [
5], It is widely used to assess the impact of blast vibrations from tunnel construction on adjacent structures. Predictions are typically based on empirical or semi-empirical formulas. A classic empirical formula for predicting PPV is as follows [
6,
7,
8]:
where
k and
α are parameters related to the rock mass,
R is the distance from the blast source in meters,
Q is the maximum charge weight per delay in kilograms, and
m is a scaling coefficient.
Research on the dynamic response of adjacent structures under blast disturbance often focuses on the relationship between particle vibration velocity and structural effective stress. Singh [
9] conducted field experiments in multiple coal mines in India to study the impact of blasting on adjacent underground coal mine working faces. Through on-site tests, Singh found that blasting-induced vibrations can cause severe damage to the roof and pillars of underground tunnels. Based on the damage zones and the Rock Mass Rating (RMR) of the roof rock, he derived safe peak particle velocity (PPV) thresholds for underground working faces. Nateghi [
10] investigated the dynamic response of existing service tunnels under blasting loads through field blasting tests and in situ monitoring. Slimane [
11] deployed advanced instrumentation on-site to study the characteristics of blast-induced vibrations at an open-pit mine in Algeria and their potential impact on nearby infrastructure, particularly the downstream dam. Mohamed [
12] investigating the impact of quarry blasting on two nearby oil pipelines by measuring peak particle velocity (PPV), and deriving the safety distance accordingly following the deduced PPV, and provided the maximum allowable charge weight per delay. Duan et al. [
13] based on a highway tunnel construction project in Chongqing, China, used field monitoring and numerical simulation to analyze the patterns of PPV, stress distribution, and vault settlement during tunnel excavation. Yu et al. [
14] focusing on a two-lane large-span highway tunnel, indicated through field monitoring tests that factors influencing the vibration on an existing tunnel from the blasting excavation of a new tunnel include distance, free surface location, charge weight, and borehole layout. They noted that the blast vibration is greatest in the cut section and relatively smaller in the perimeter hole section. Kan et al. [
15] found through analysis of field and simulation data that both the total charge weight and the maximum charge weight per hole have a considerable impact on PPV. Jiang [
16] analyzed the dynamic response of a tunnel beneath a surface blast source via numerical simulation and, based on the maximum tensile strength theory, confirmed a safety vibration velocity threshold of 11 cm/s for the tunnel. Wang [
17] conducted similar research, concluding that the peak particle velocity and tensile stress are higher on the side of the existing lining facing the blast (blast-facing side) and at the arch waist, making these areas more susceptible to damage. By comparing numerical simulation and field test results, a PPV safety standard of 10.73 cm/s and a maximum charge weight of 41.05 kg were determined. Zhang [
18] based on a subway tunnel blasting excavation project adjacent to a civil air defense tunnel, established a statistical relationship model between the effective stress, vibration velocity, and charge weight in the air defense tunnel.
The aforementioned studies have investigated the response and safety criteria for single-arch tunnels under various conditions subjected to adjacent blast loads. However, research on the response of existing double-arch tunnels to nearby blast loads is relatively scarce. A Double-arch tunnel is a special structural form of twin tunnel, in which there is no unexcavated rock or soil between the two caverns, and both the leading and trailing tunnels share a common middle wall. Since the linings of the leading and trailing tunnels intersect at the top of the middle partition wall, they are subjected to significantly asymmetric loads during construction, and the stress conditions during operation are more complex compared to separated tunnels. In China, double-arch tunnels are widely used in expressway tunnel construction due to their smooth alignment, minimal land occupation, high space utilization [
19], and ease of operation and management. Existing research indicates that the mechanical properties of double-arch tunnels differ from those of conventional single-arch tunnels [
20], and the dynamic response of adjacent tunnels to blasting is related to their spatial configuration [
21]. Therefore, it is necessary to investigate the structural response characteristics of double-arch tunnels under blast loads.
This paper studies a double-arch highway tunnel expansion project in Guangzhou City, Guangdong Province. The new expansion tunnel is adjacent to an existing double-arch tunnel, which remains in normal operation during construction. The vibrations induced by the blasting excavation of the expansion tunnel may affect the normal operation of the existing tunnel. To ensure the safety of the existing tunnel under the disturbance from adjacent blasting, it is imperative to study its stability under blast disturbance and establish corresponding safety criteria. Through numerical simulation, the dynamic response of the existing tunnel is investigated. Based on the maximum stress principle, safety control standards for blast vibration are proposed, and the maximum charge weight for cut holes is specified. These measures aim to ensure the safety of the existing tunnel during the construction of the expansion tunnel and provide a reference for similar engineering problems.
2. Project Overview
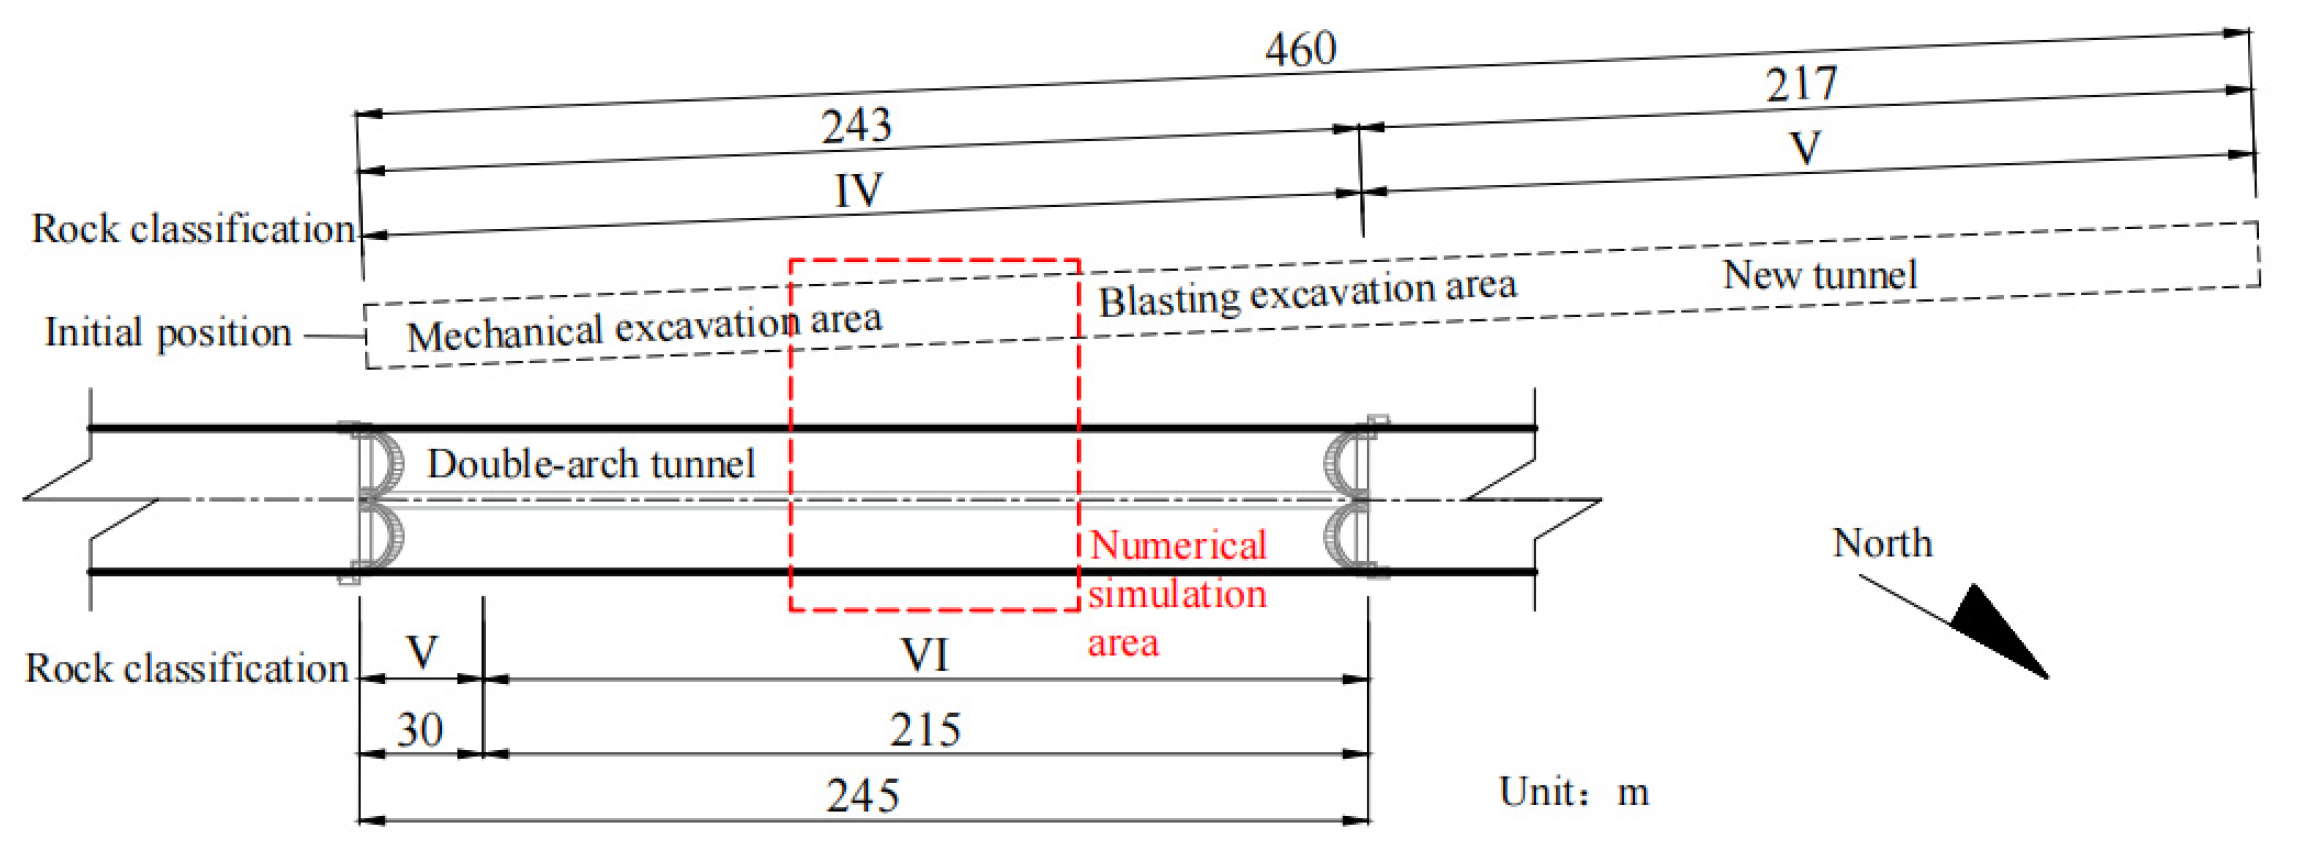
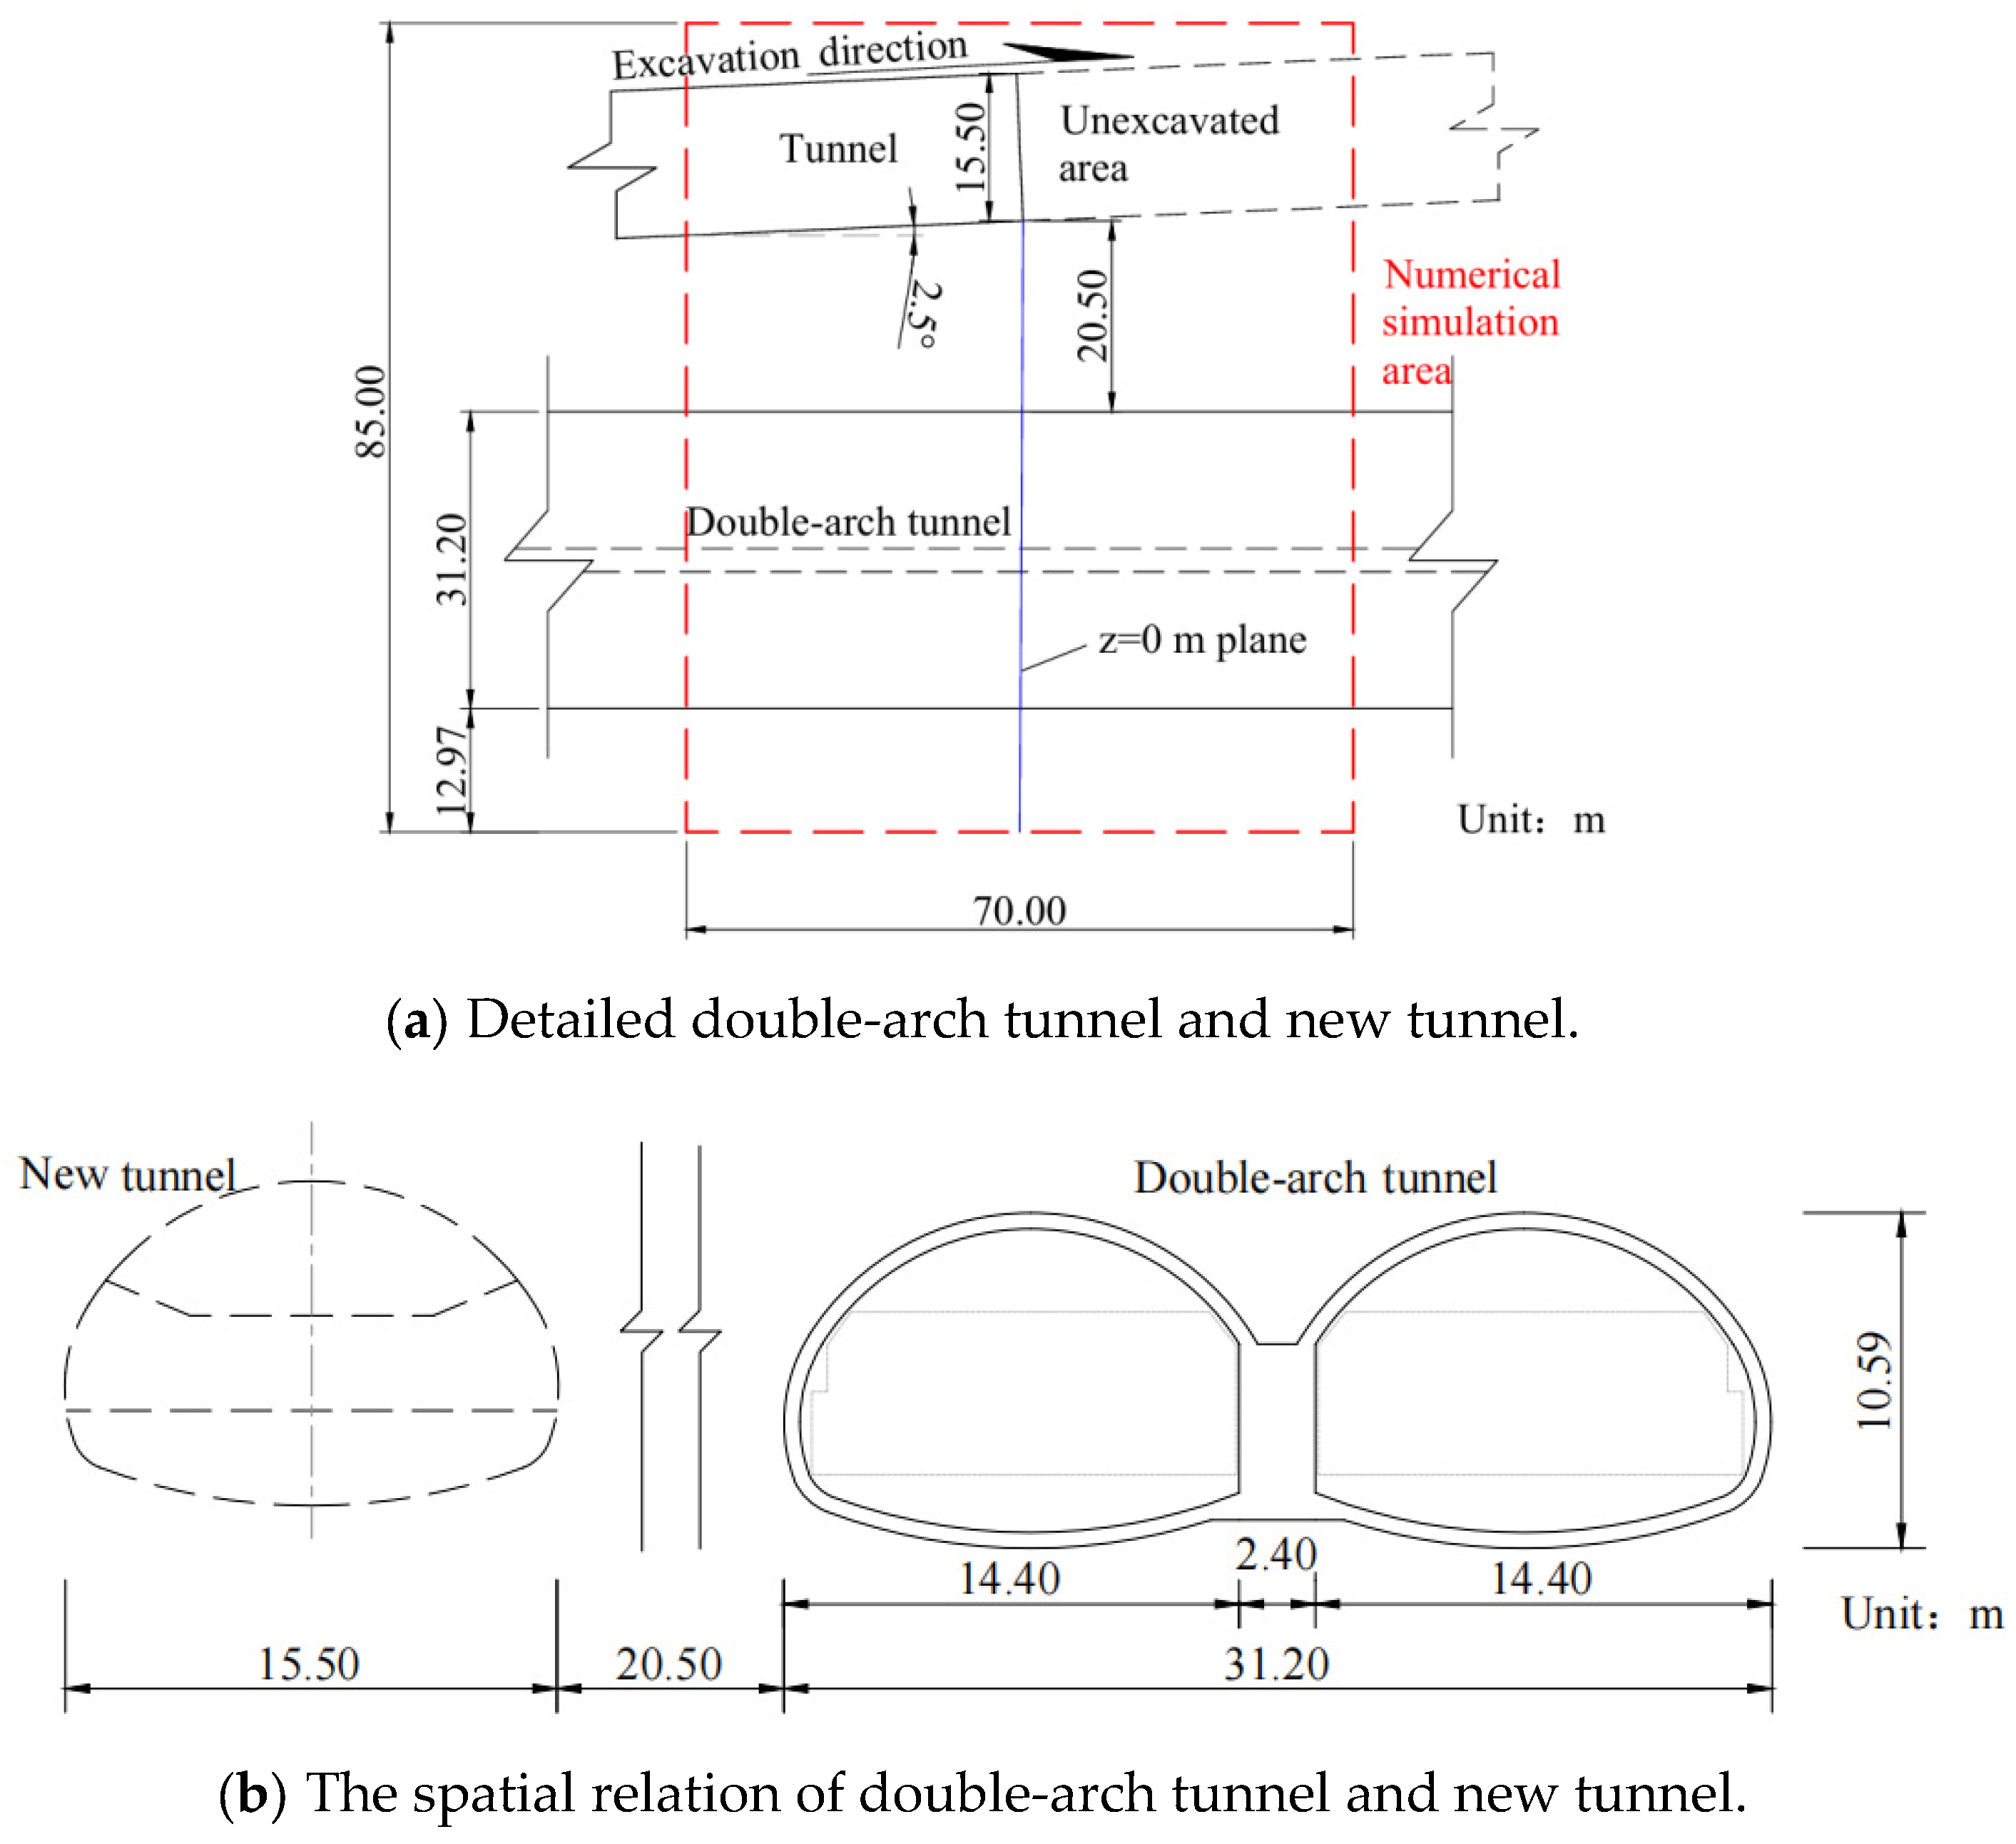
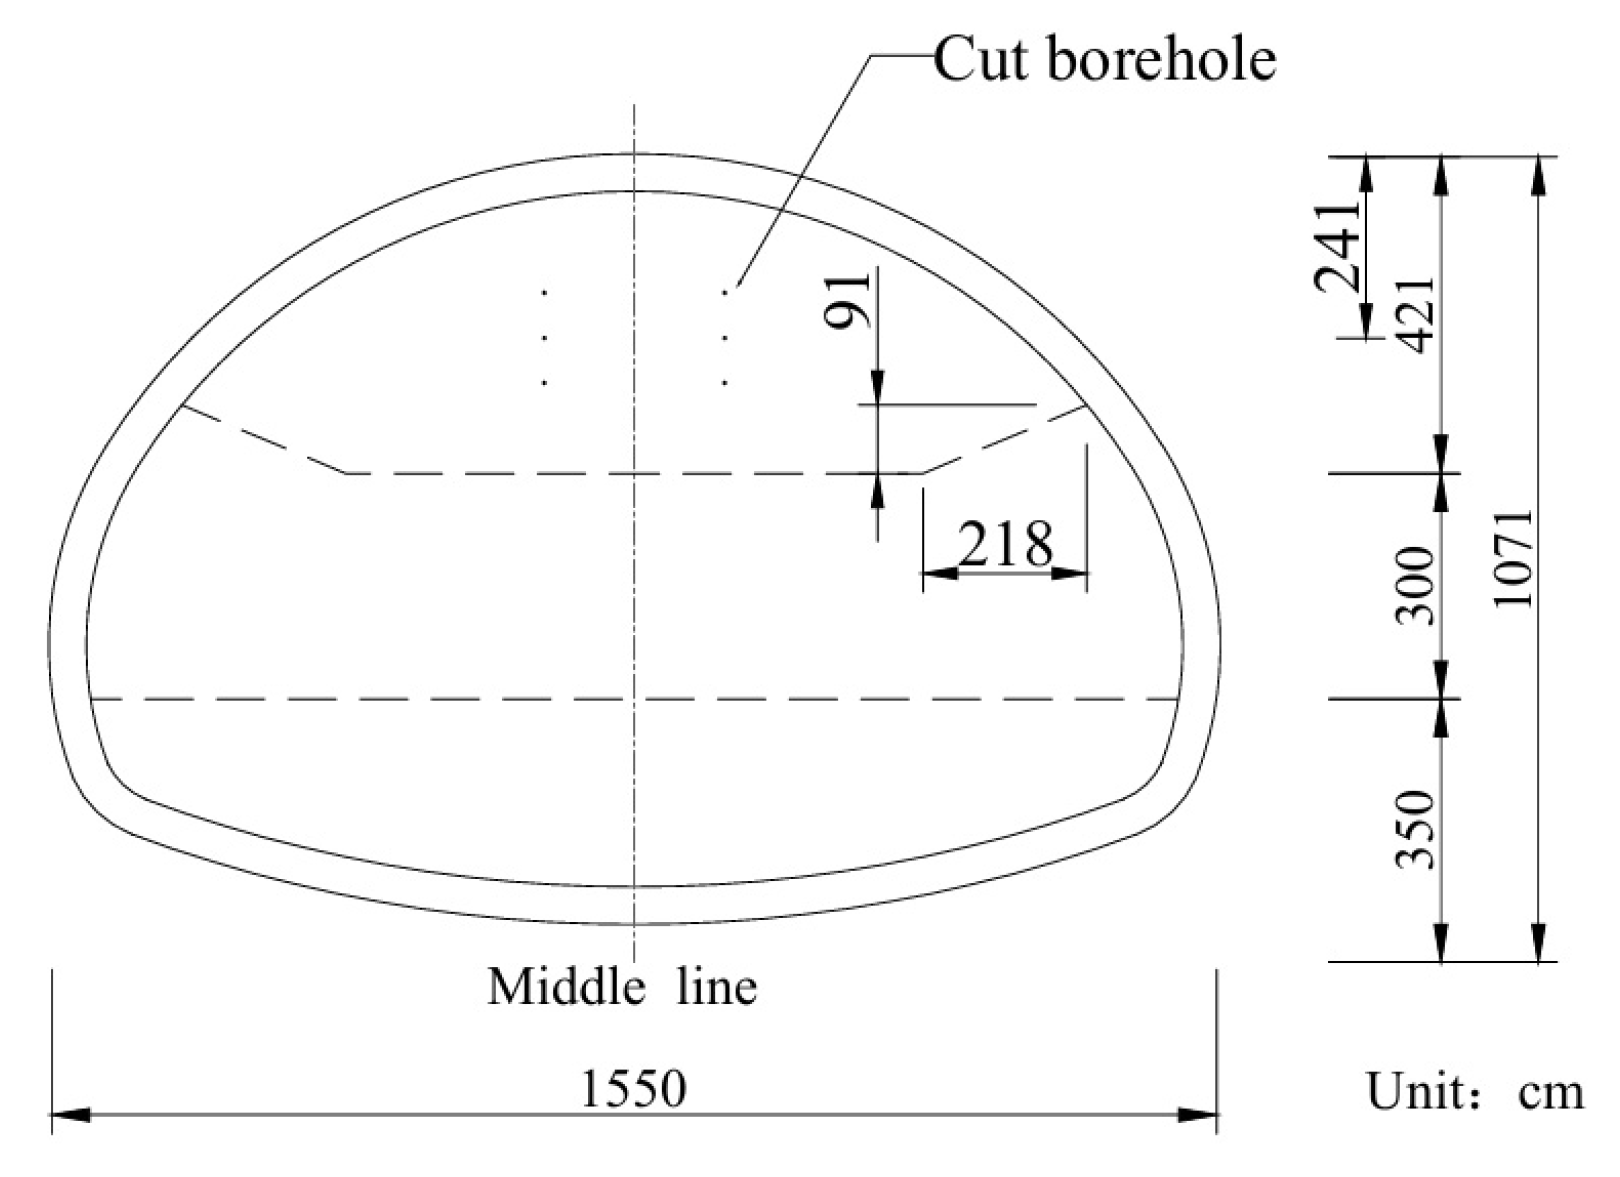
The project involves the expansion of a highway tunnel, adopting the scheme of constructing new separated tunnels on both sides of the existing tunnel. The new tunnels, together with the existing one, will form a bidirectional 12-lane traffic passage. The existing tunnel is a double-arch structure with dimensions of 10.59 m in height and a total span of (14.40 m × 2 + 2.4 m). The new left-line tunnel is 460 m long, with dimensions of 10.71 m (height) × 15.50 m (span). It intersects with the existing tunnel at an angle of approximately 2.5°, and the clear distance between the two tunnels ranges from about 12.8 m to 24.8 m. The spatial layout and positions of the tunnels are shown in
Figure 1.
The rock strata traversed by both the new and existing tunnels primarily consist of weathered granite. At the portal section of the new tunnel, the earthwork was removed using mechanical excavation methods, while the remaining sections were constructed using the drilling and blasting method.
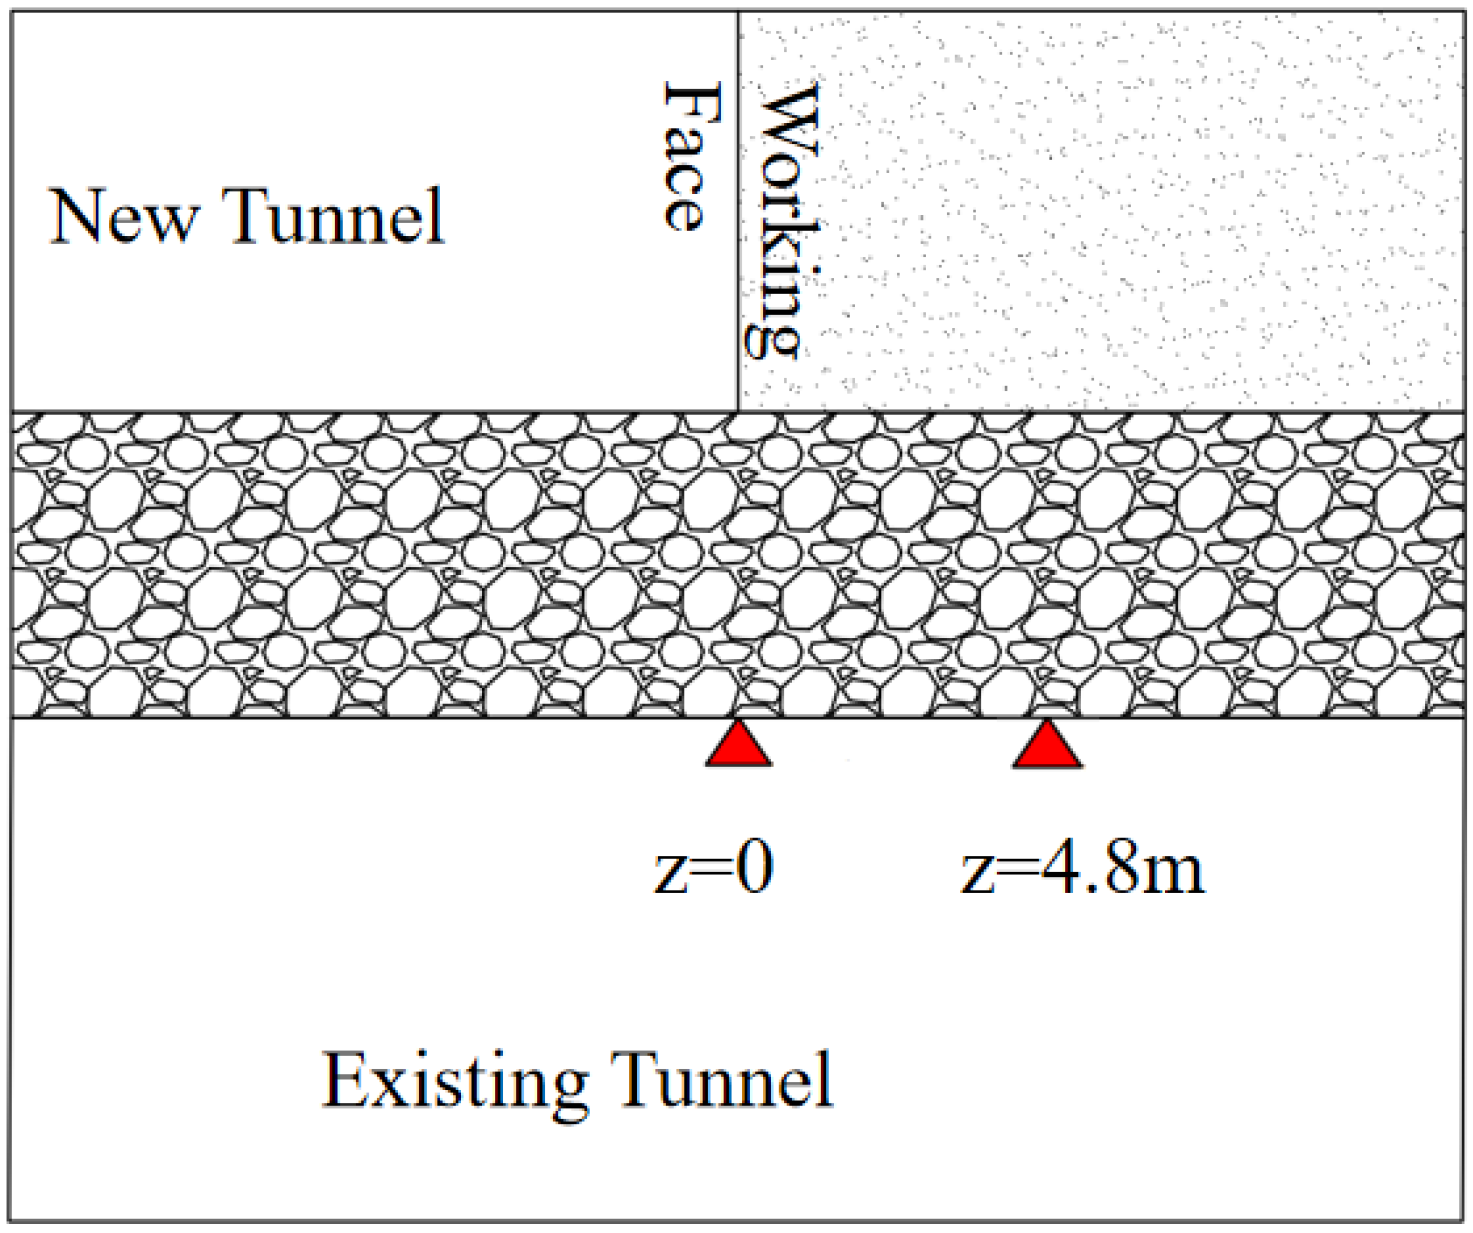
Figure 2a,b illustrates the relative positional relationship between the working face of the new left-line tunnel and the existing tunnel when the excavation of the new tunnel reaches a depth of 140 m. The cross-section at this working face is defined as the z = 0 m section, where the clear distance between the two tunnels is 20.50 m.
Controlled blasting is employed for excavating the new tunnel due to its large cross-section. For the Class IV surrounding rock, the smooth blasting method with a three-bench excavation sequence is applied.
Based on engineering experience and previous research (Wang et al. [
22]), the blast vibration effect is most significant from cut hole blasting during tunnel excavation. In this project, the blast from the upper-bench cut holes generates the strongest stress waves due to the limited free surfaces available for rock breakage. Therefore, only the blasting impact from the upper-bench cut holes was evaluated. The location of these cut holes is shown in
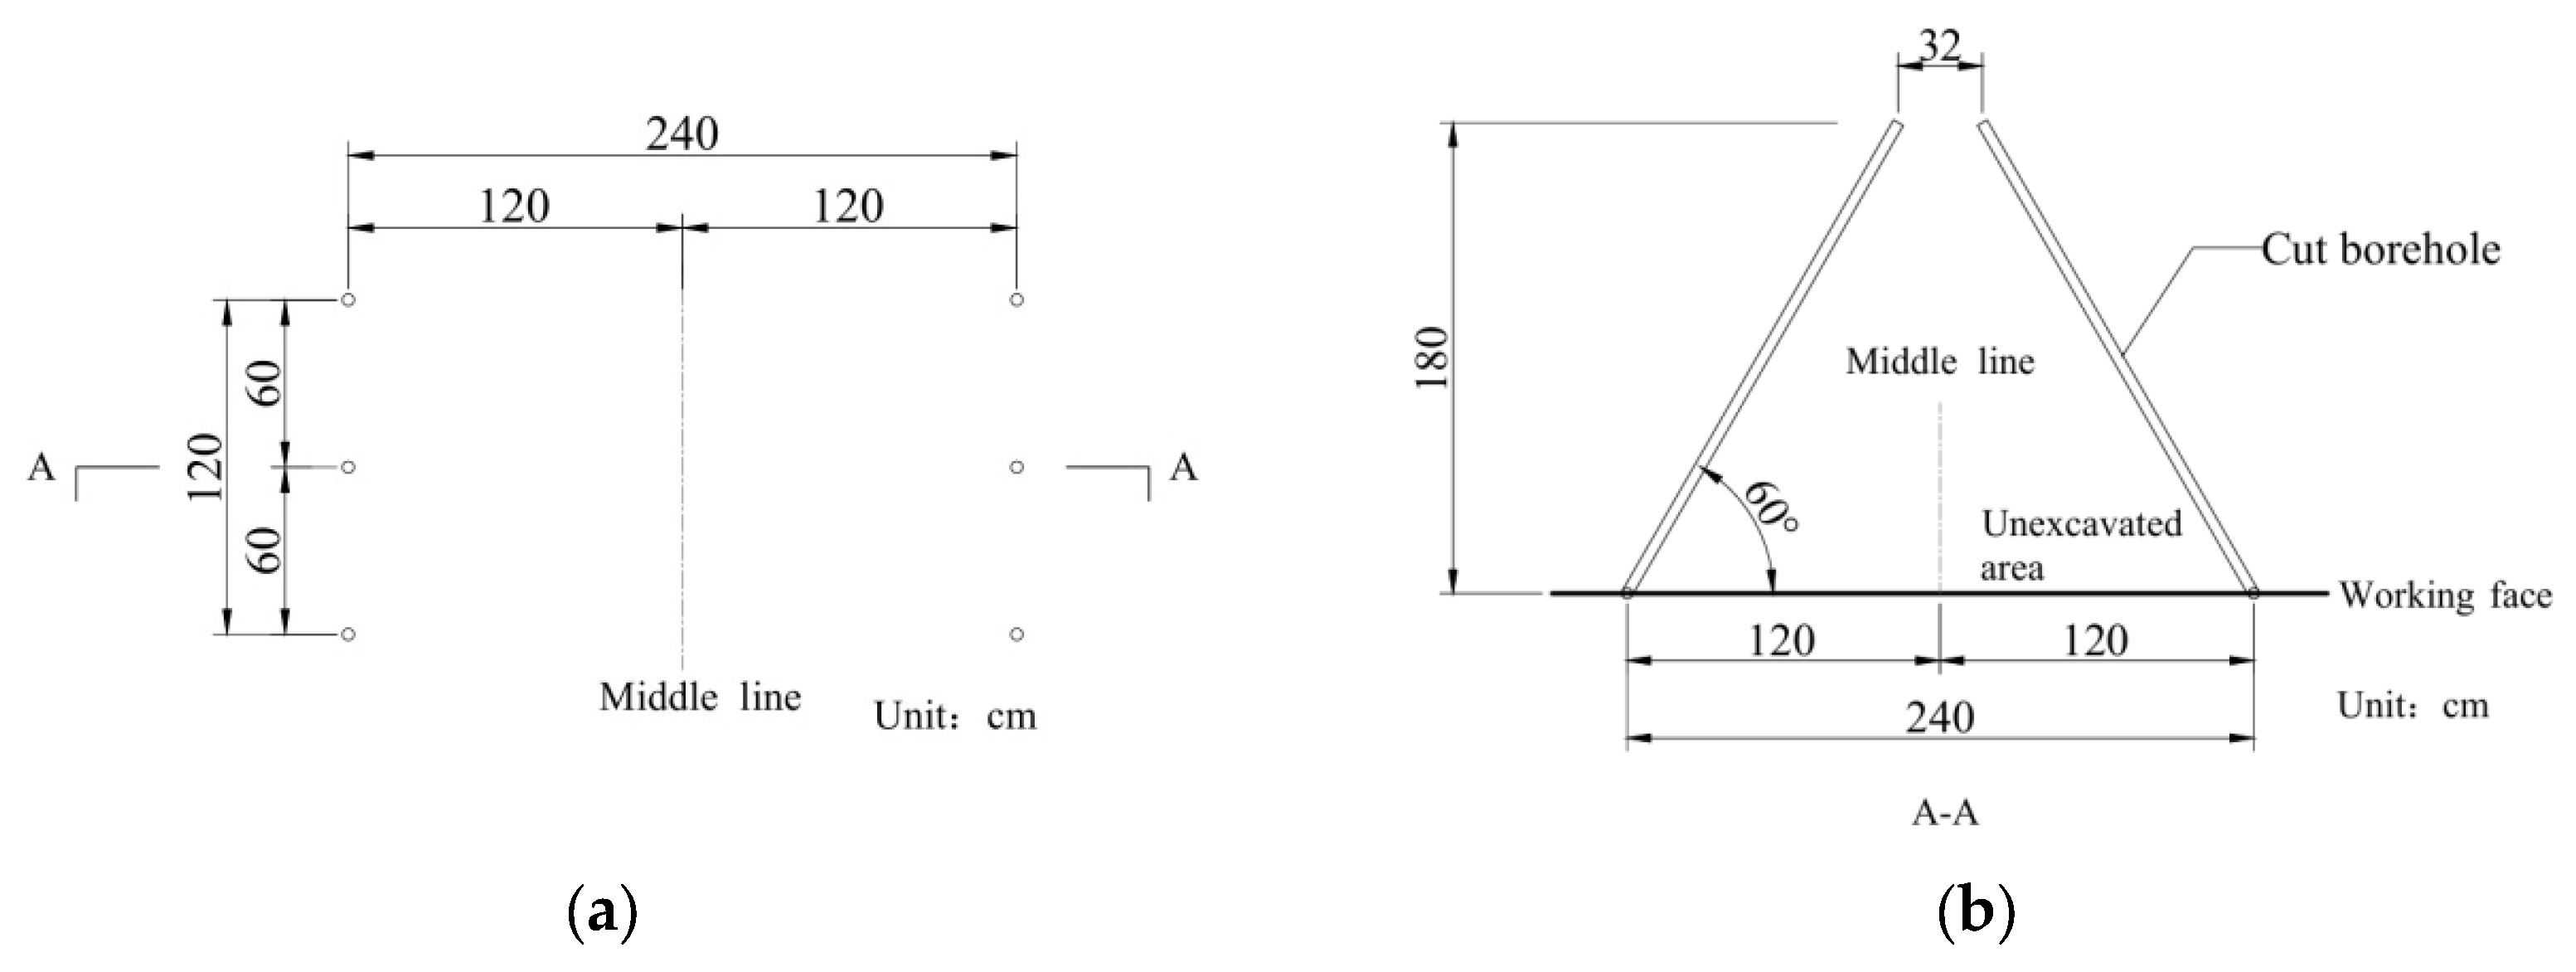
Figure 3, and their detailed layout is presented in
Figure 4: there are six cut holes in the upper bench, each with a depth of 180 cm. Each hole is charged with 3 cartridges of explosives, resulting in a charge weight of 0.9 kg per hole and a total charge weight of 5.4 kg per delay.
3. Numerical Simulations
During the blasting excavation of the new tunnel, the existing highway tunnel remained in operation, making it difficult to conduct on-site monitoring without disrupting traffic flow. To investigate the response of the adjacent tunnel under blast excavation, this study employs ANSYS/LS-DYNA (software version R16.1.1) for modeling and numerical simulation.
3.1. Model Setup and Boundary Conditions
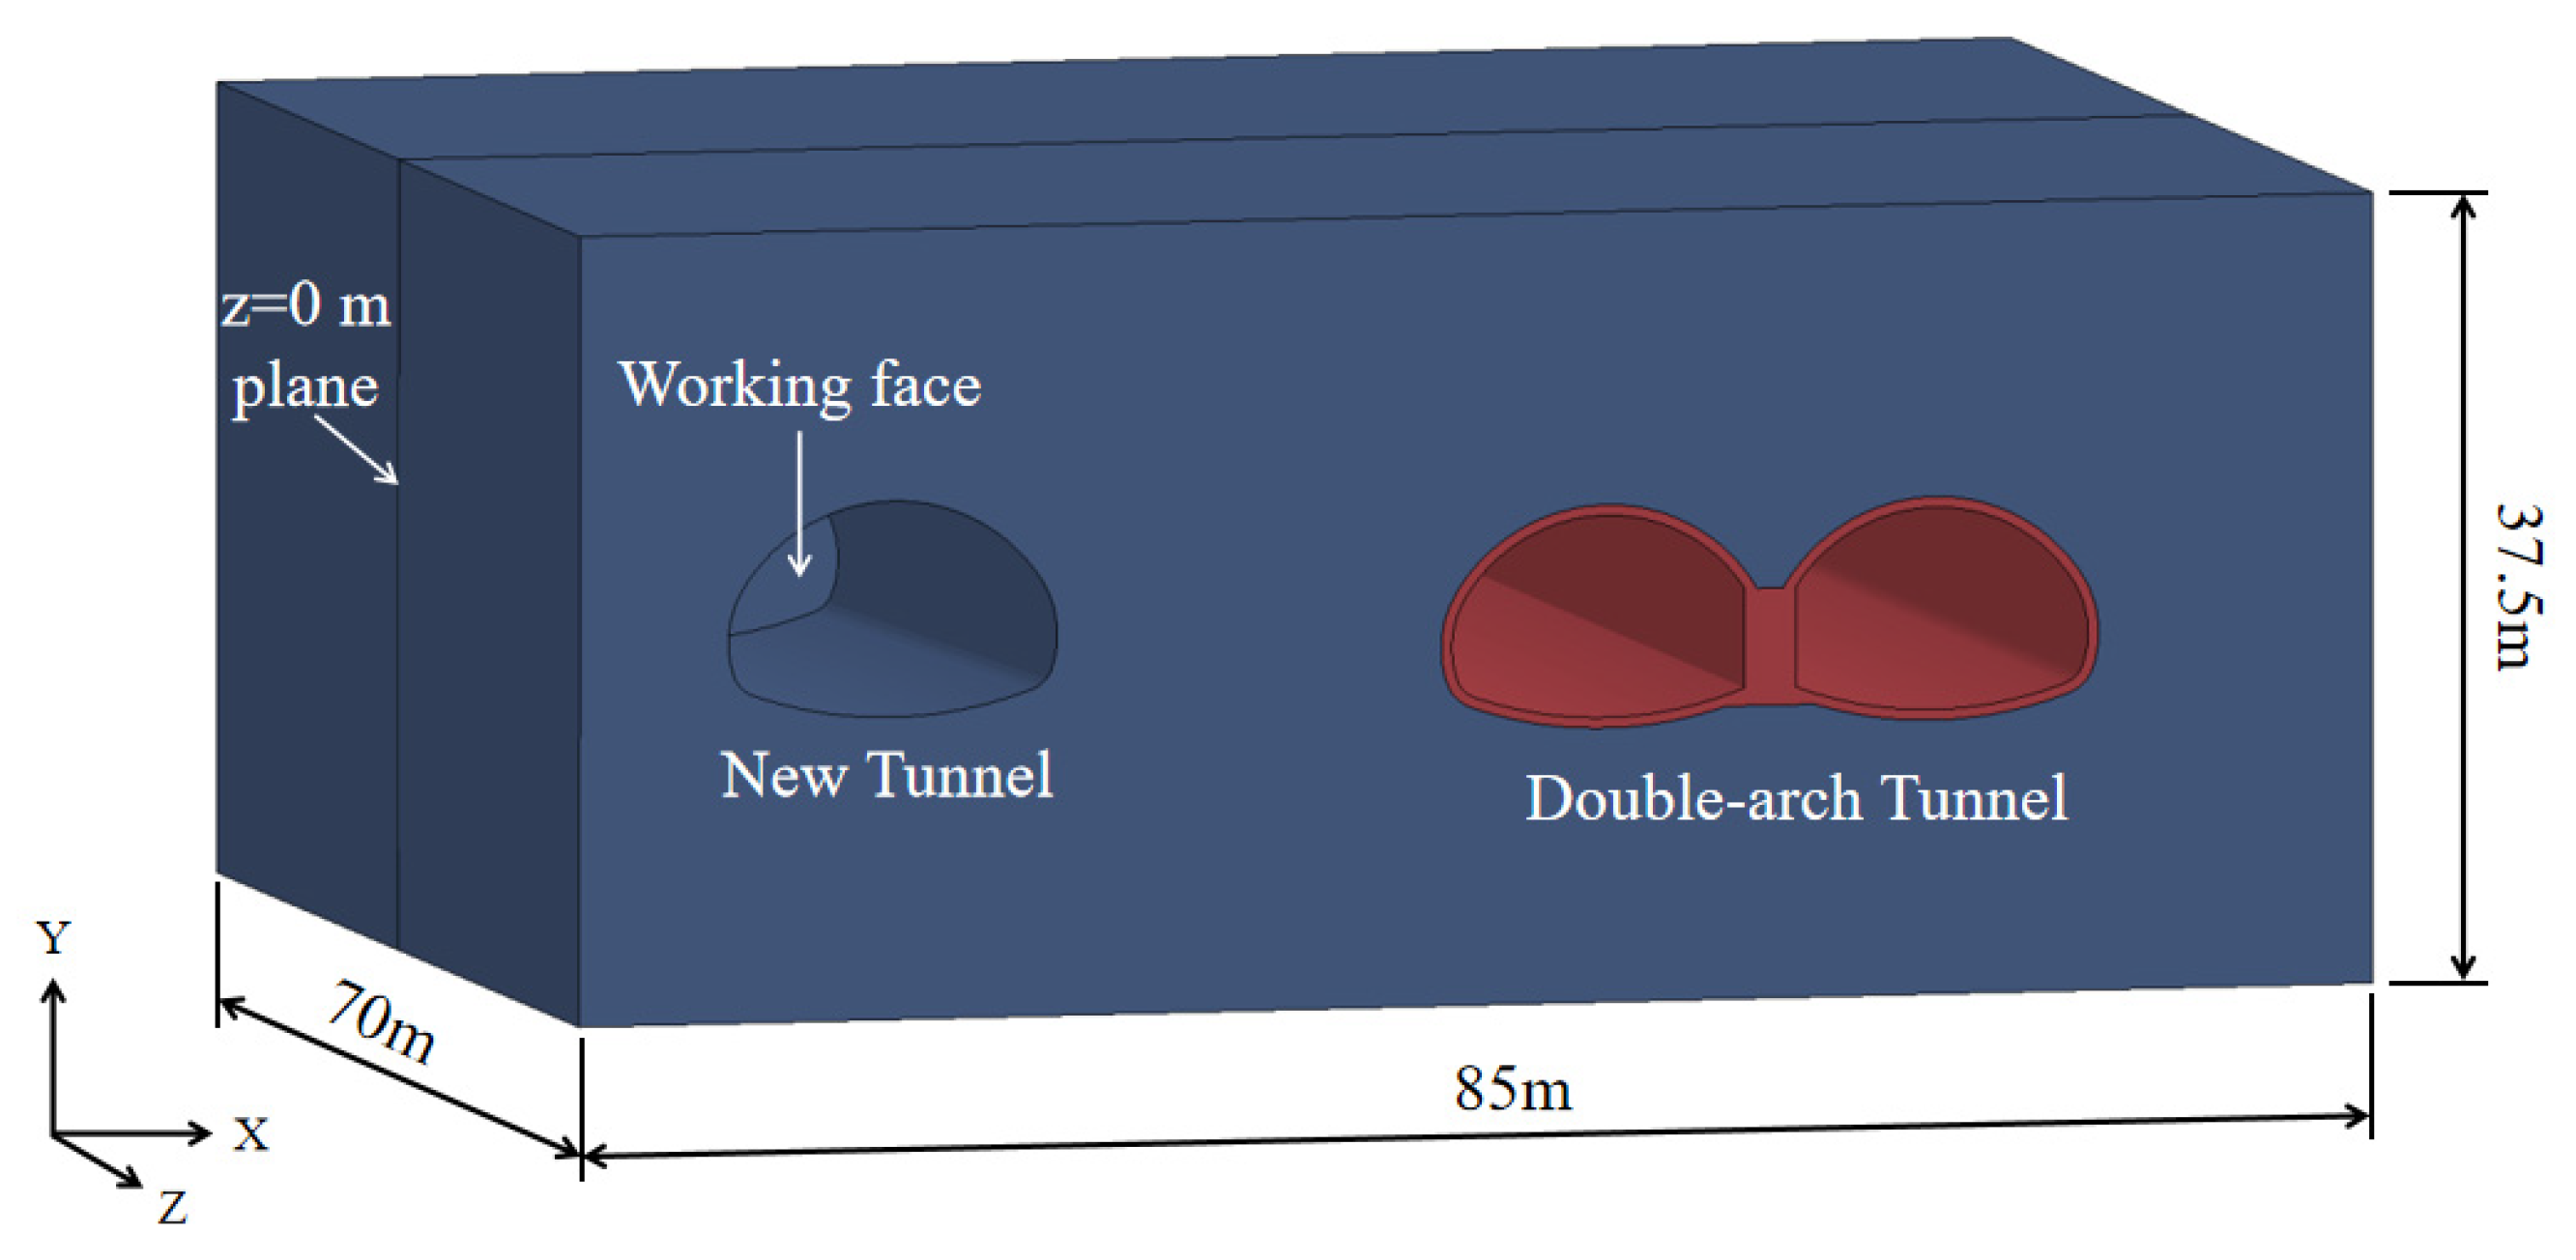
A numerical model was established in ANSYS/LS-DYNA based on the actual site layout and blasting parameters, corresponding to the scenario where the working face of the new left-line tunnel was excavated to a depth of 140 m. The geometric parameters of the model are as follows: the model dimensions are 85 m × 37.5 m × 70 m and the SOLID164 element type was employed. The double-arch tunnel has a height of 10.59 m and a width of 31.16 m. The distance between the z = 0 m cross-section and the boundary of the numerical model is 35 m, and the clear distance from the center of the cut hole blast source to the existing double-arch tunnel is 27.79 m. To simulate an infinite rock mass, non-reflective boundaries were applied to all external surfaces of the model, except for the inner surfaces of the existing tunnel, the excavated section of the new tunnel, and the working face. The simulation aims to capture the entire process of blast vibration propagation, from the detonation in the near field to its transmission into the far field.
Figure 5 illustrates the established 3D finite element model.
3.2. Physical and Mechanical Parameters
- 1.
Explosive
The material model *MAT_HIGH_EXPLOSIVE_BURN was selected to simulate the explosive, allowing control over the total blast energy by adjusting the detonation velocity and internal energy of the explosive products. The load was defined using the Jones–Wilkins–Lee (JWL) equation of state *EOS_JWL to simulate the pressure–volume–energy relationship of the detonation products under real conditions. Its general form is given as
where
P is the detonation pressure of the explosive;
A,
B,
R1,
R2 and
ω are constants related to the explosive properties;
V is the relative specific volume of the detonation products.
V = v/v0, it is a dimensionless quantity.
v = 1
/ρ is the specific volume of the detonation products.
v0 is defined as the initial specific volume of the explosive prior to detonation;
E0 is the internal energy per initial volume of the detonation products.
The explosive material used in the simulation was 2# rock emulsion explosive. Its material parameters and the corresponding equation of state (EOS) coefficients are listed in
Table 1.
- 2.
Concrete
To accurately simulate the dynamic response of the concrete lining under blast-induced stress wave disturbance, the *MAT_ELASTIC constitutive model was adopted. Its corresponding parameters listed in
Table 2.
- 3.
Rock
Rocks are discontinuous and heterogeneous; thus, there is no mathematical equation that can directly describe these rock masses [
23]. In numerical simulations, surrounding rock is typically assumed to be a continuous, isotropic elasto-plastic material. The *MAT_PLASTIC_KINEMATIC material model in LS-DYNA can describe isotropic hardening and kinematic hardening plastic models, and it also accounts for the influence of strain rate. It can be used to simulate the stress and strain of rock materials [
24,
25].
The rock mass in the entire numerical simulation domain corresponds to Grade IV. Laboratory tests provided key parameters for the rock samples, including unit weight, Poisson’s ratio, yield stress, and tangent modulus.
According to the wave equation in elastic wave theory, the P-wave propagation velocity is related to the density, Young’s modulus, and Poisson’s ratio of the medium. The relevant calculation formula is
where
is the longitudinal wave velocity in the medium,
is the density of the medium,
is the Young’s modulus of the medium, and
is the Poisson’s ratio of the medium.
Based on borehole acoustic wave test results, the average P-wave velocity of the moderately weathered granite at the tunnel site generally ranges from 3091 to 5165 m/s. Taking the rock longitudinal wave velocity Cp = 4000 m/s, the Young’s modulus of the surrounding rock can be calculated as 28.5 GPa using the above formula.
The specific parameters for the rock are summarized in
Table 3.
3.3. Data Comparison
Blast tests were conducted in blasting excavation project, with vibration sensors (Blasting Vibration Monitor model L20-S made by Chengdu Jiaobo Technology Co., Ltd., Chengdu, China) installed at the springline at sections z = 0 m and z = 4.8 m of existing tunnel.
Figure 6 shows a schematic of the sensor arrangement (not to scale).
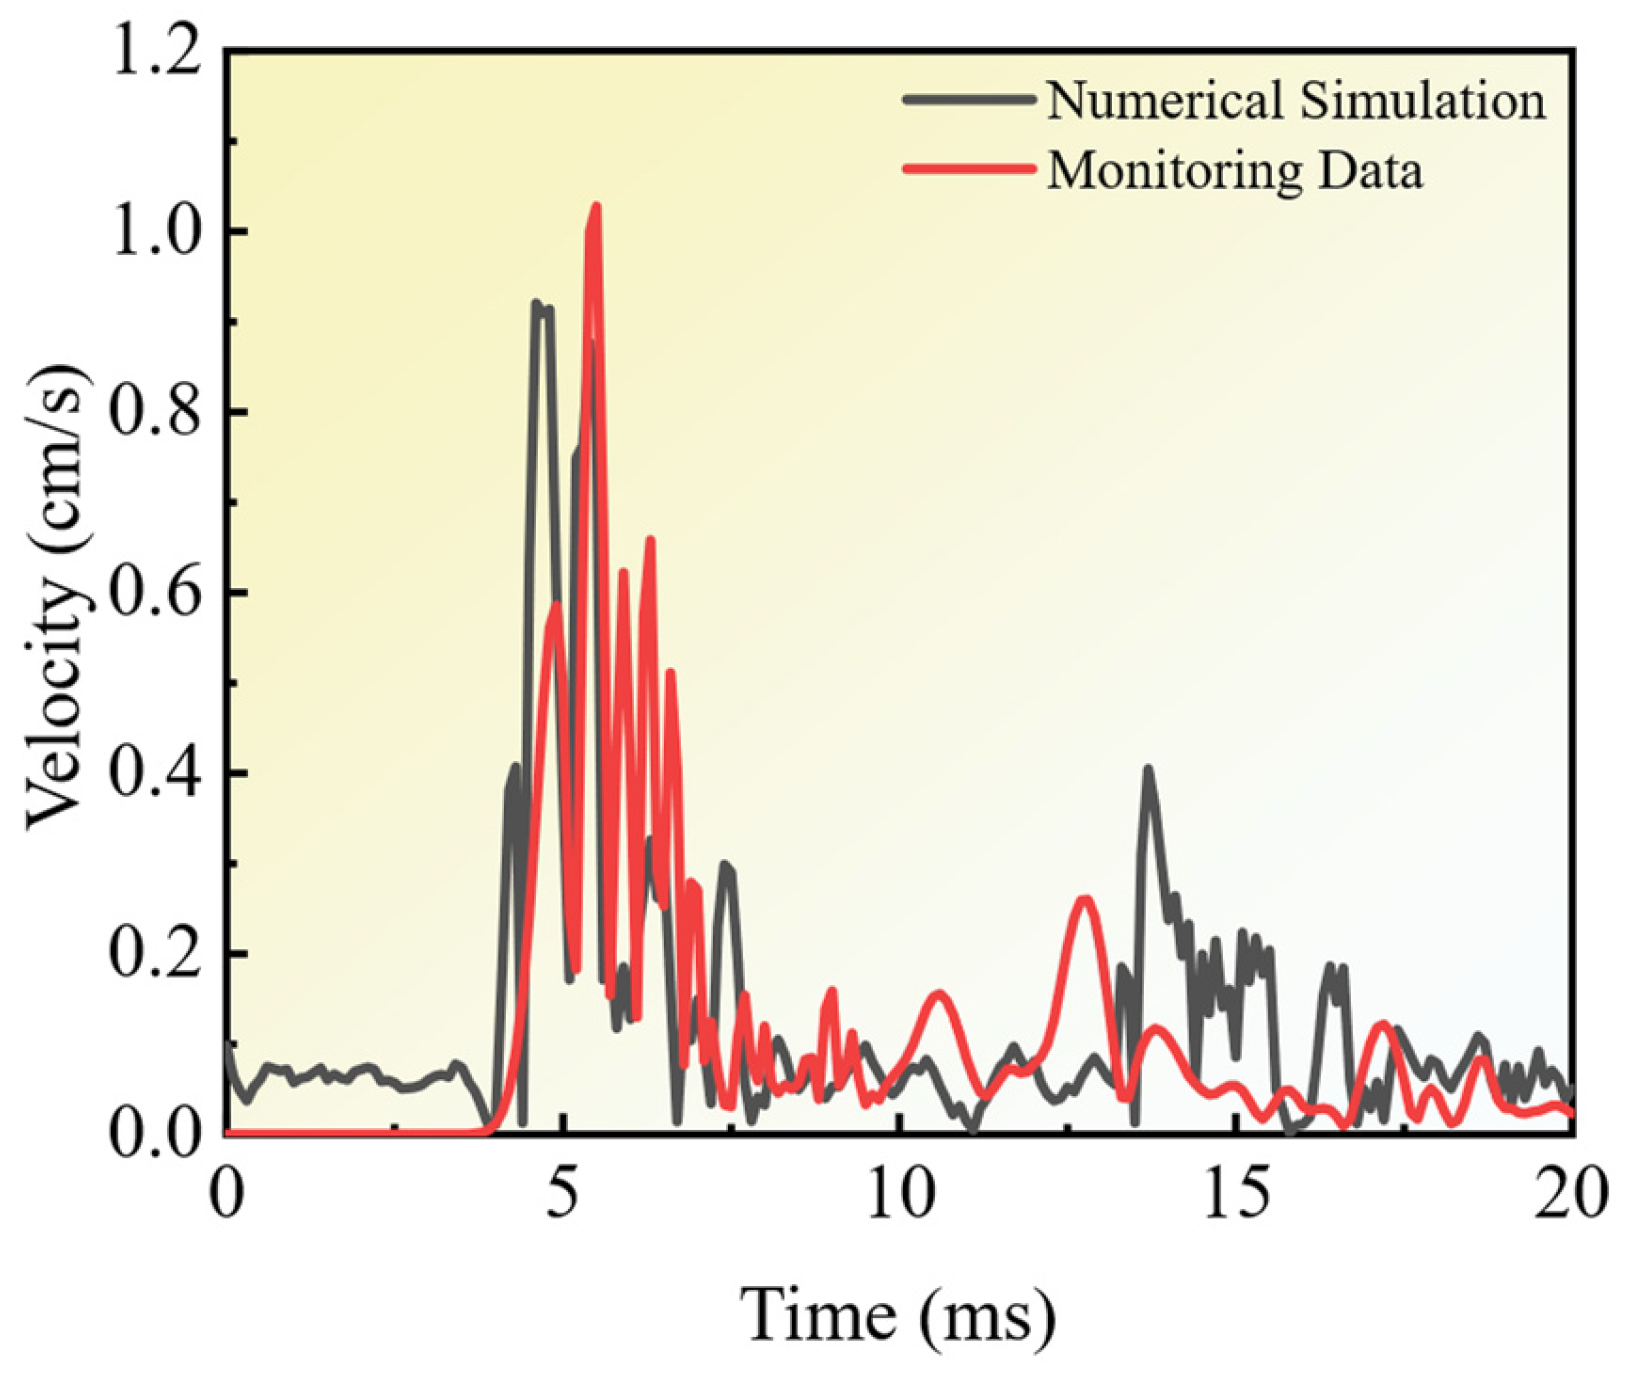
Due to vibrations induced by vehicles traveling inside the tunnel, the sensor at z = 4.8 m was triggered prematurely, resulting in a failure to successfully obtain vibration data from this location. The data from the monitoring point at z = 0 and the numerical simulation data are plotted together in
Figure 7.
As can be seen from the figure, the two curves exhibit little difference in their peak values, and their vibration frequencies as well as attenuation patterns are highly consistent. This demonstrates that the numerical model can effectively simulate the vibration response of adjacent tunnels under blasting loads.
4. Blast Response Characteristics
This section investigates the blast response characteristics of the existing tunnel by analyzing the distribution patterns of vibration velocity and effective stress at different points on the tunnel structure, from both the axial direction and cross-sectional perspectives.
4.1. Vibration Velocity Characteristics
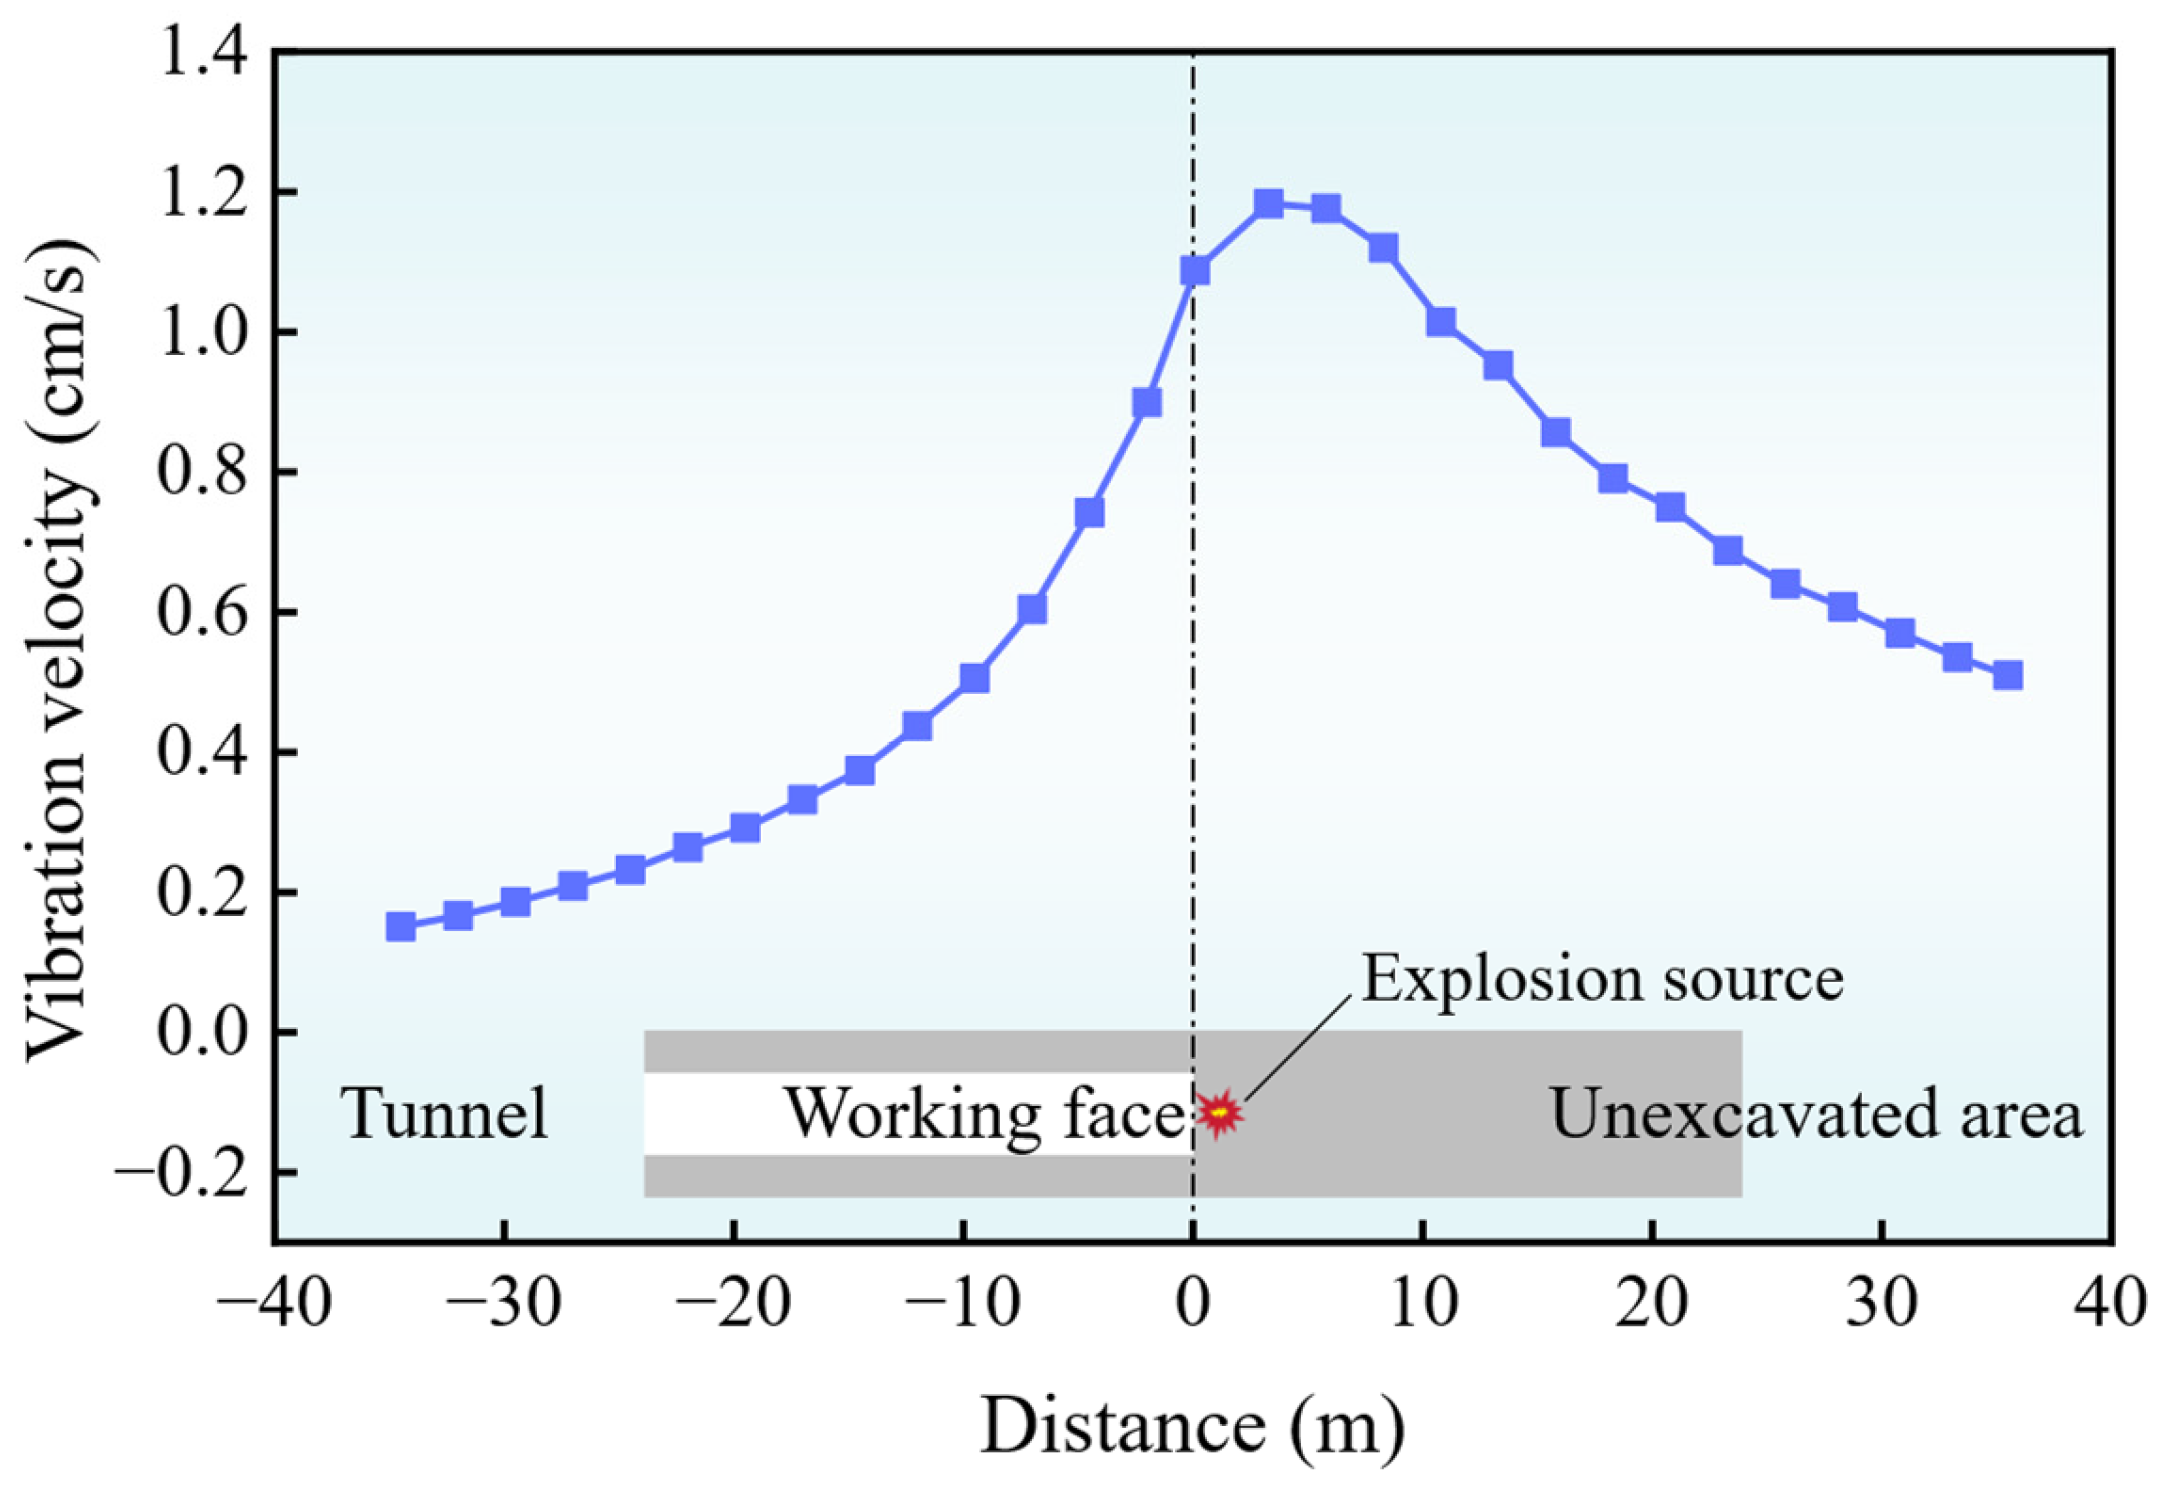
Figure 8 shows the distribution of the maximum vibration velocity along the axial direction at the blast-facing sidewall of the double-arch tunnel. The peak vibration velocity occurs at the z = 4.5 m cross-section. From this point forward along the excavation direction (increasing z), the vibration velocity continuously decreases, and the rate of decrease gradually slows. In the opposite direction (decreasing z), the vibration velocity also shows a continuous decrease. The curves for the regions z = 0 m to z = 4.8 m and z = 4.8 m to z = 9.8 m are nearly symmetric about z = 4.8 m, indicating that the vibration velocity follows a consistent variation pattern in these two zones. An inflection point is observed at z = 0 m, suggesting a change in the attenuation rate of the velocity. Comparing the regions z < 0 m and z > 9.8 m, the velocity attenuates more rapidly in the z < 0 m region. The z = 0 m cross-section corresponds to the working face of the new tunnel. Due to the excavation, the rock mass at this section has a free surface, resulting in different boundary conditions compared to other sections. The removal of rock mass prevents the propagation of blast seismic waves or increases wave reflections, thereby reducing the impact on the distant existing tunnel. Consequently, the vibration velocity at the corresponding location on the existing tunnel is smaller than at other locations, leading to an unsmooth velocity decrease at z = 0 m. This observation is consistent with the findings of Xue [
26].
Based on the aforementioned analysis of the axial vibration velocity distribution, three representative cross-sections were selected for a detailed analysis of the global dynamic response: the section with the maximum velocity (z = 4.8 m), the working face section (z = 0 m), and its symmetric counterpart about z = 4.8 m (z = 9.8 m).
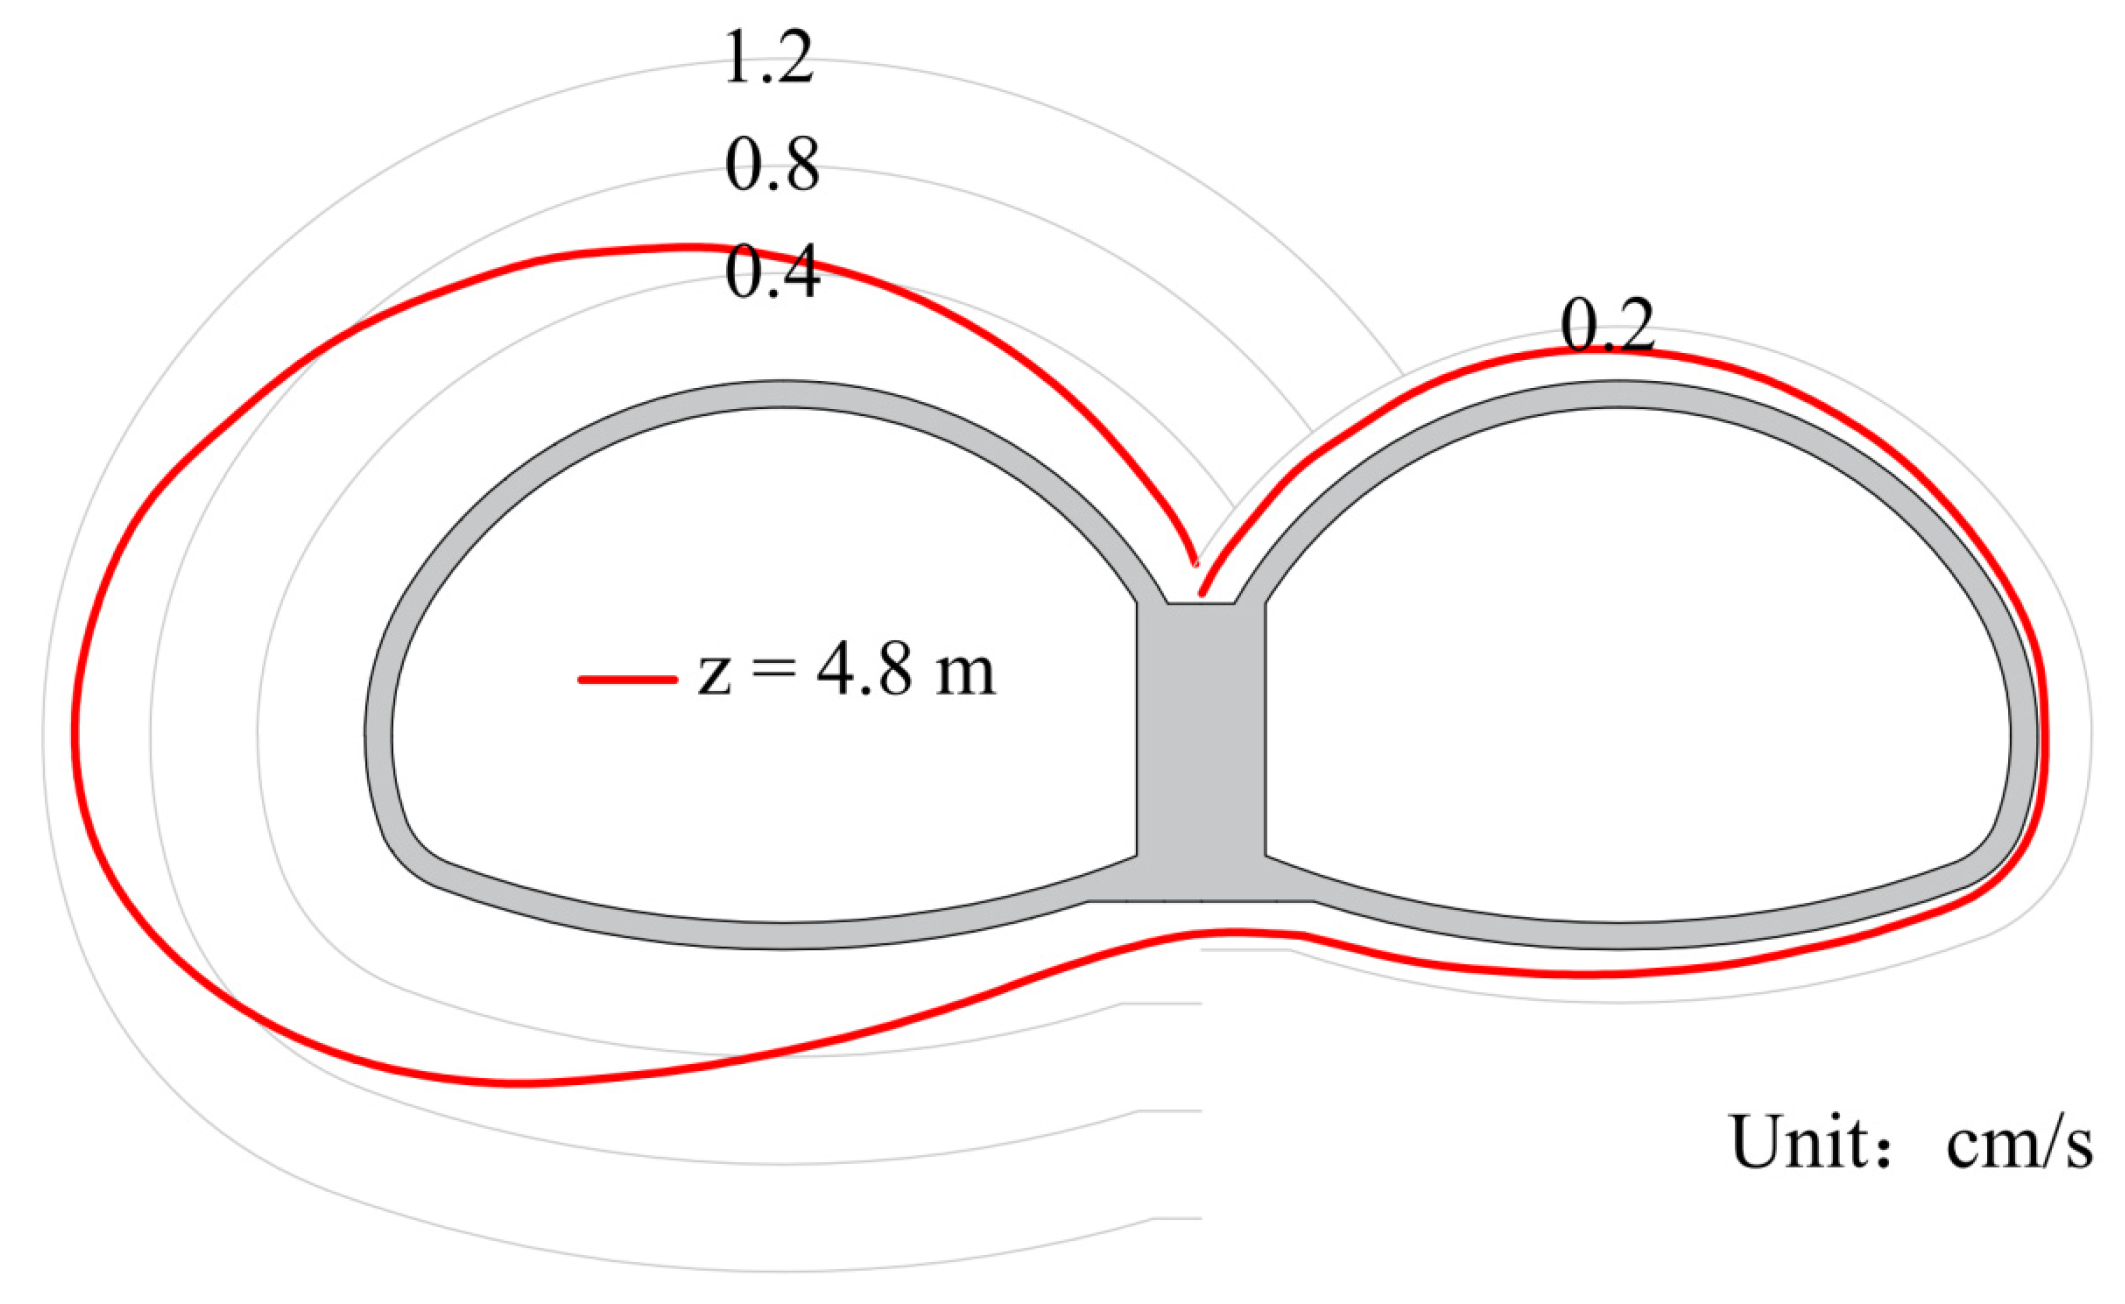
Figure 9 displays the vibration velocity distribution on the z = 4.8 m cross-section. It is evident that the vibration velocity in the blast-facing cavern (left cavern) is significantly greater than that in the blast-away cavern (right cavern), the spatial relationship between the existing tunnel and the blast source can be referenced in
Figure 2 and
Figure 5. The maximum velocity in the right cavern is only 0.13 cm/s, indicating a negligible influence from the blasting. Therefore, the subsequent analysis focuses on the left cavern.
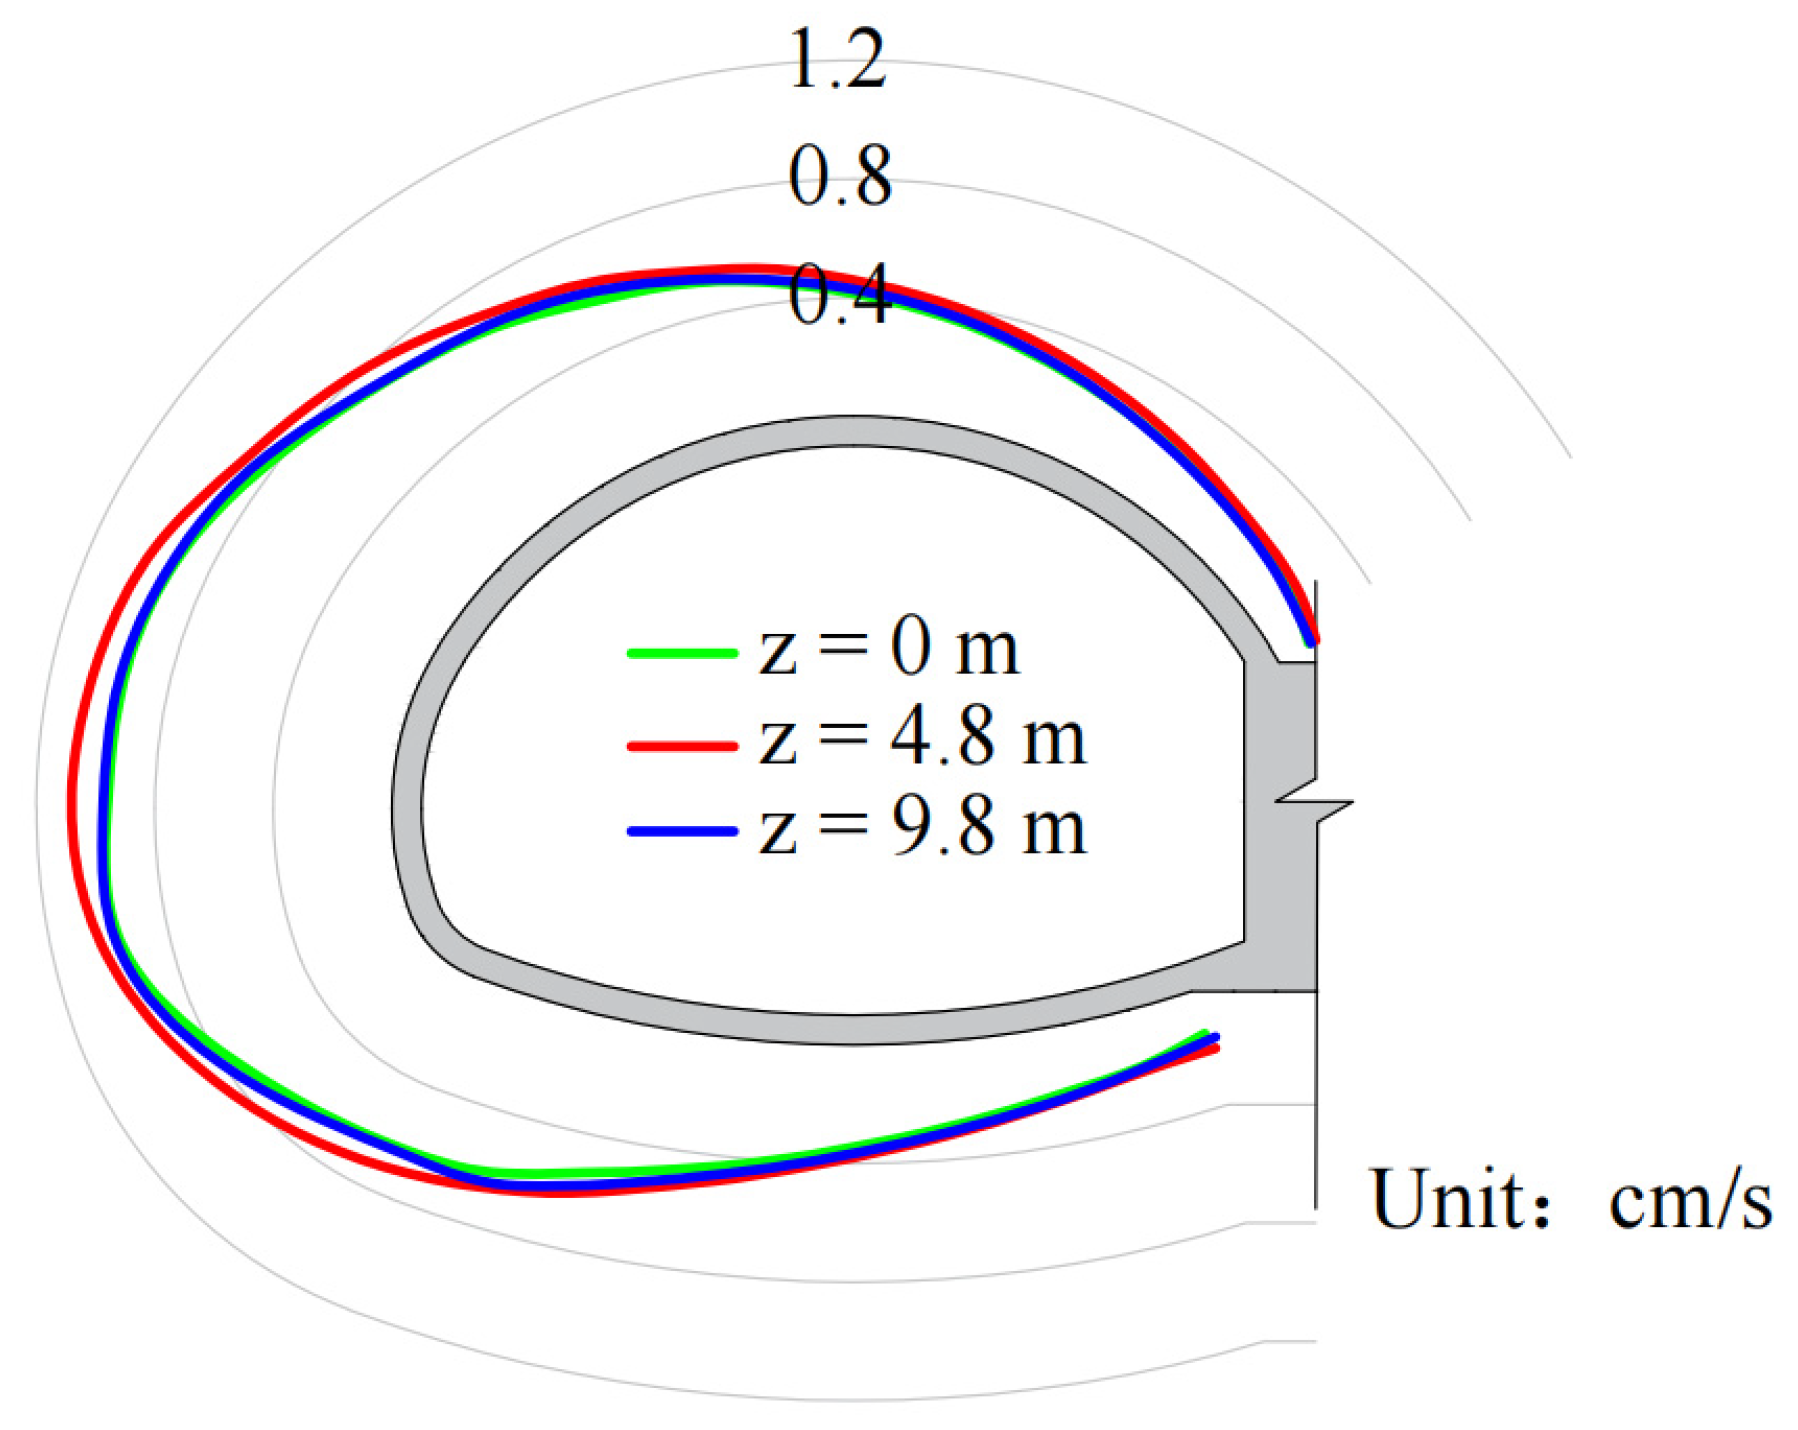
Figure 10 illustrates the vibration velocity distribution on the three cross-sections: z = 0 m, z = 4.8 m, and z = 9.8 m.
For different cross-sections of the existing tunnel, the distribution pattern of vibration velocity is consistent, differing only in magnitude. The velocities at various points on the z = 4.8 m cross-section are generally the highest, while the velocities on the z = 0 m and z = 9.8 m cross-sections are relatively similar and lower. Overall, since the vibration velocity of the left sidewall is much greater than that of the right sidewall, the velocity decreases with increasing distance from the blast-facing sidewall towards the blast-away side within the left cavern. On all three cross-sections, the maximum vibration velocity occurs at the sidewall, with values of 0.969 cm/s, 1.218 cm/s, and 0.983 cm/s for z = 0 m, 4.8 m, and 9.8 m, respectively.
4.2. Effective Stress Characteristics
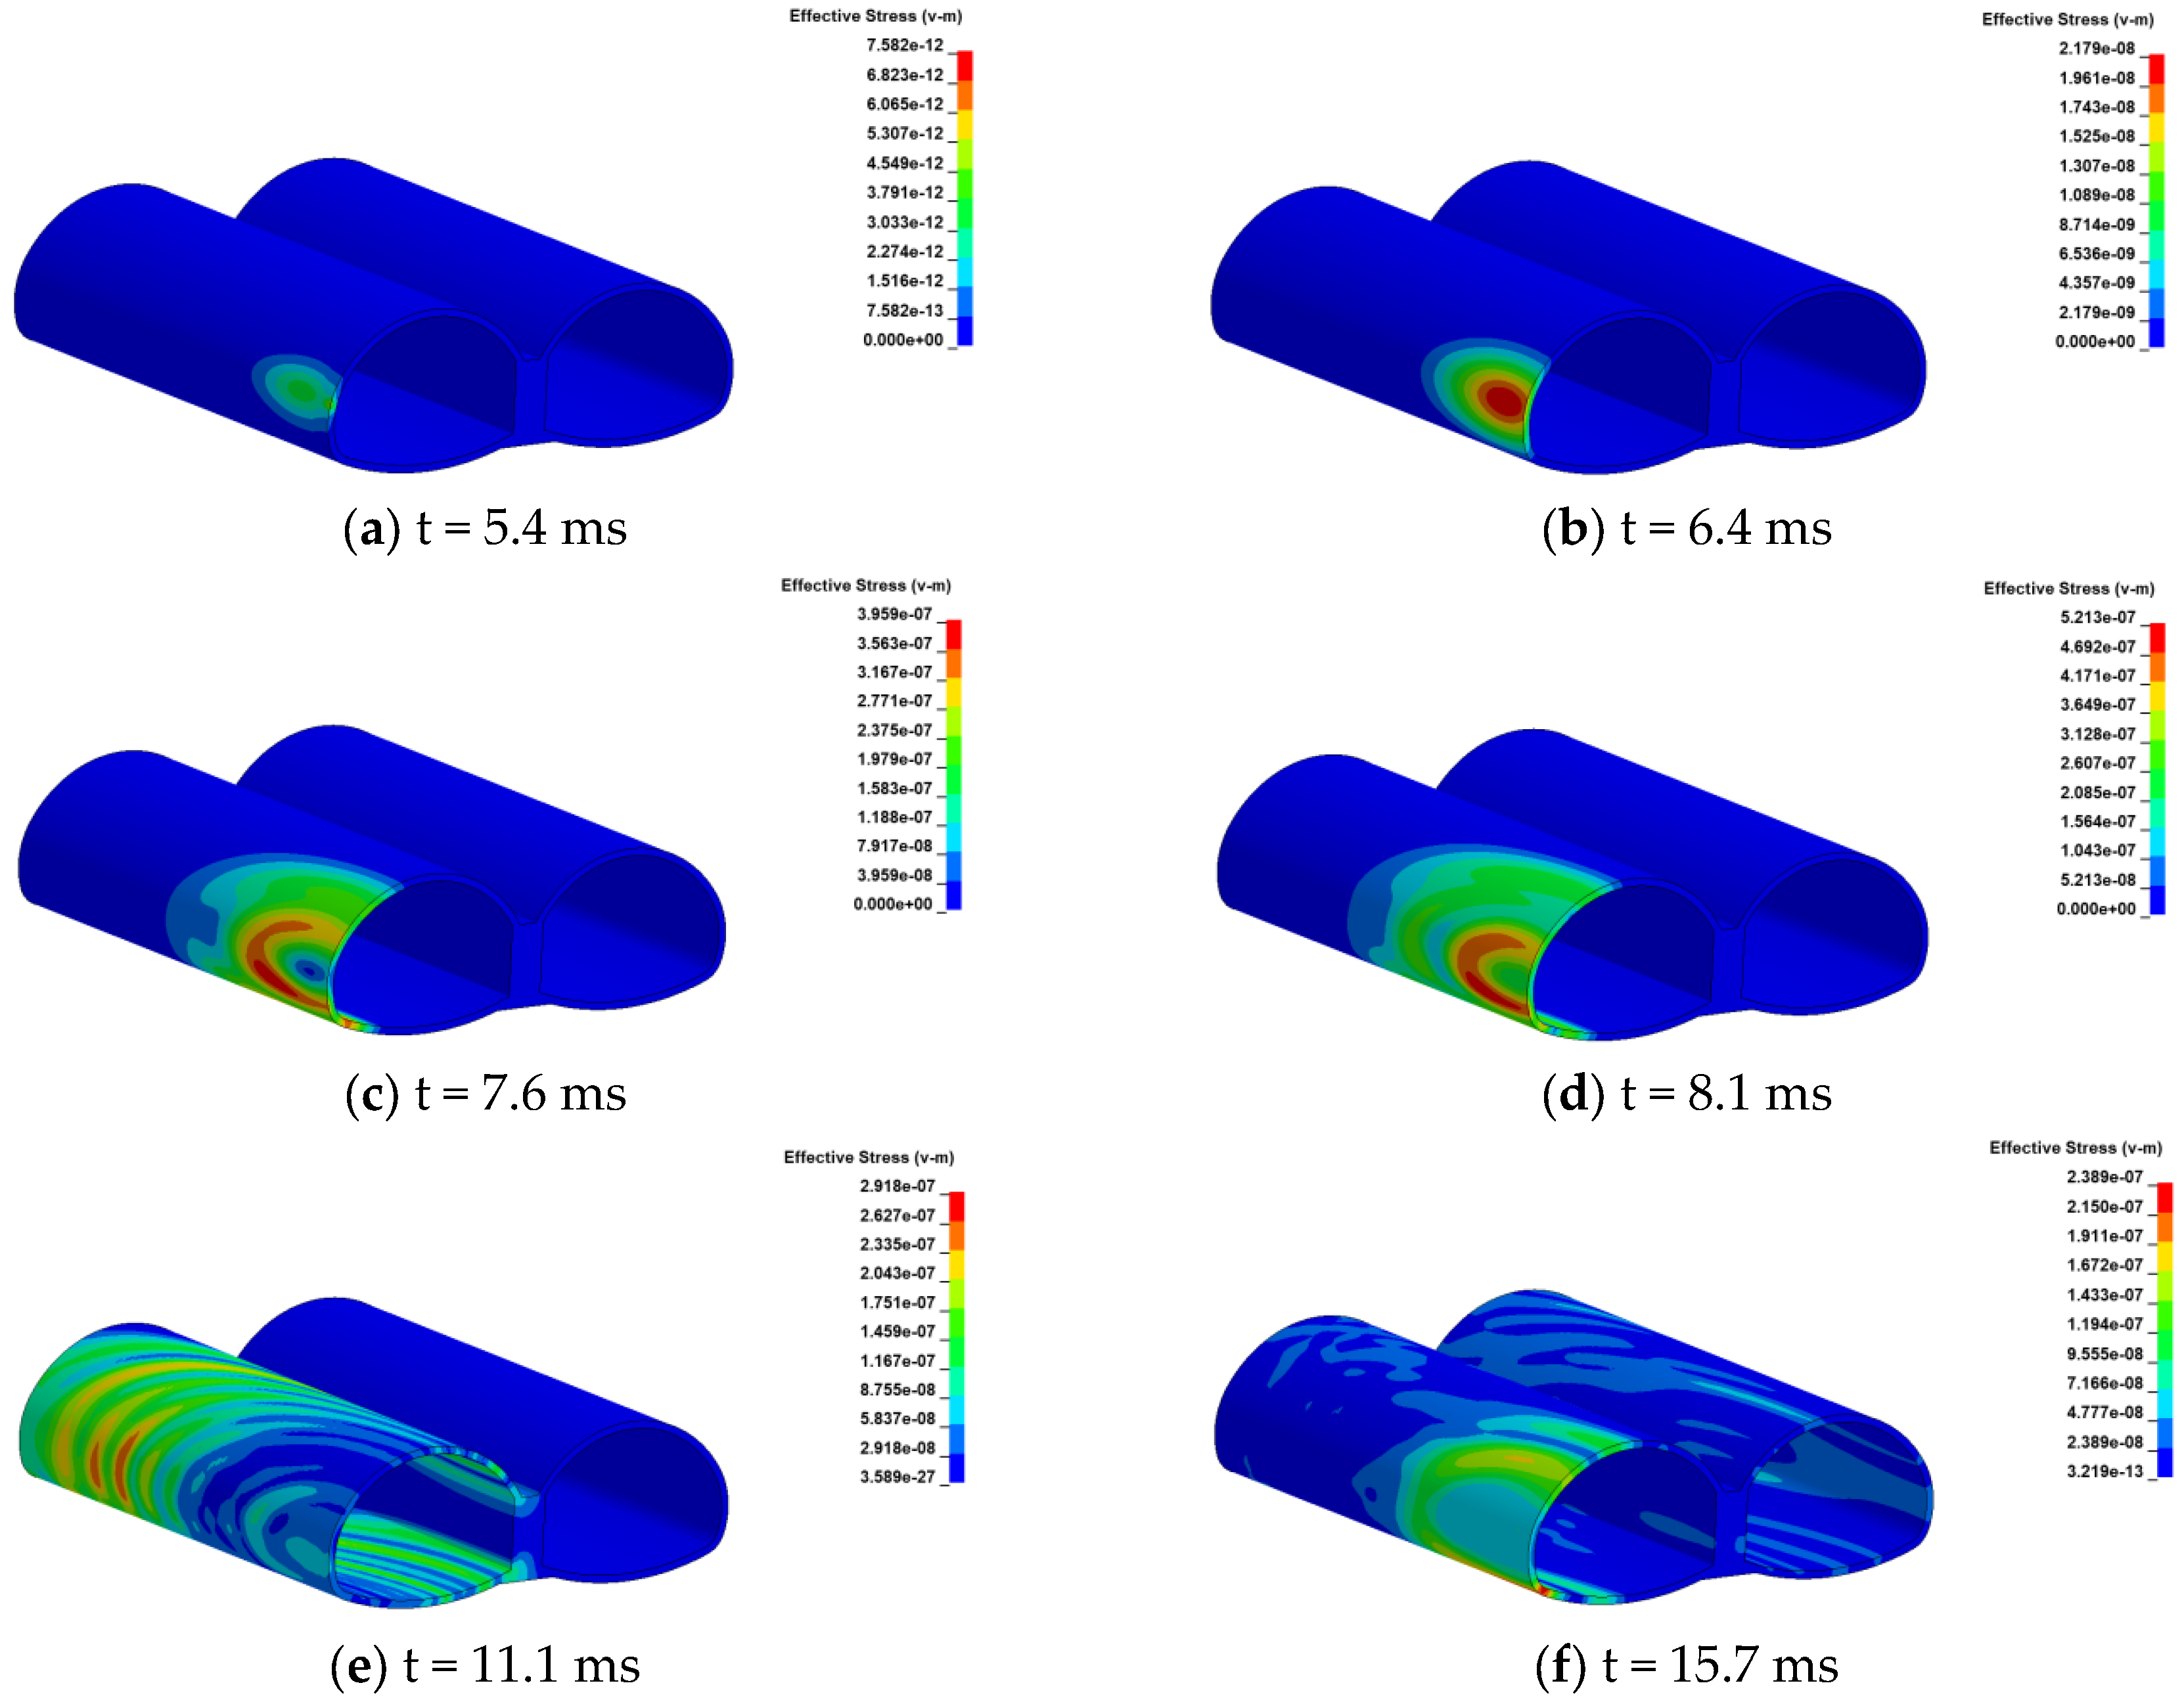
Figure 11 presents the contour plot of effective stress in the lining of the existing tunnel structure, with the foremost end at z = 0 m and the rearmost end at z = 35.5 m. At t = 5.4 ms, the seismic wave induced by the blasting excavation of the new tunnel propagates to the sidewall of the existing tunnel. As time progresses, the blasting effect intensifies, forming a stress concentration zone centered at the left sidewall of the z = 4.8 m cross-section, which then propagates outward in a wavelike manner. The stress at material points undergoes periodic variations. At t = 8.1 ms, the maximum effective stress appears at the sidewall, and the affected zone has expanded to the vault and the invert. After t = 8.1 ms, the influence continues to extend to the middle wall and even the right cavern, but the magnitude of the effective stress decreases significantly.
Based on existing research, a correlation exists between the dynamic stress in tunnel structures and the peak particle vibration velocity [
27]. Therefore, for analyzing the distribution characteristics of effective stress in the tunnel lining, the same three cross-sections (z = 0 m, 4.8 m, and 9.8 m) were selected.
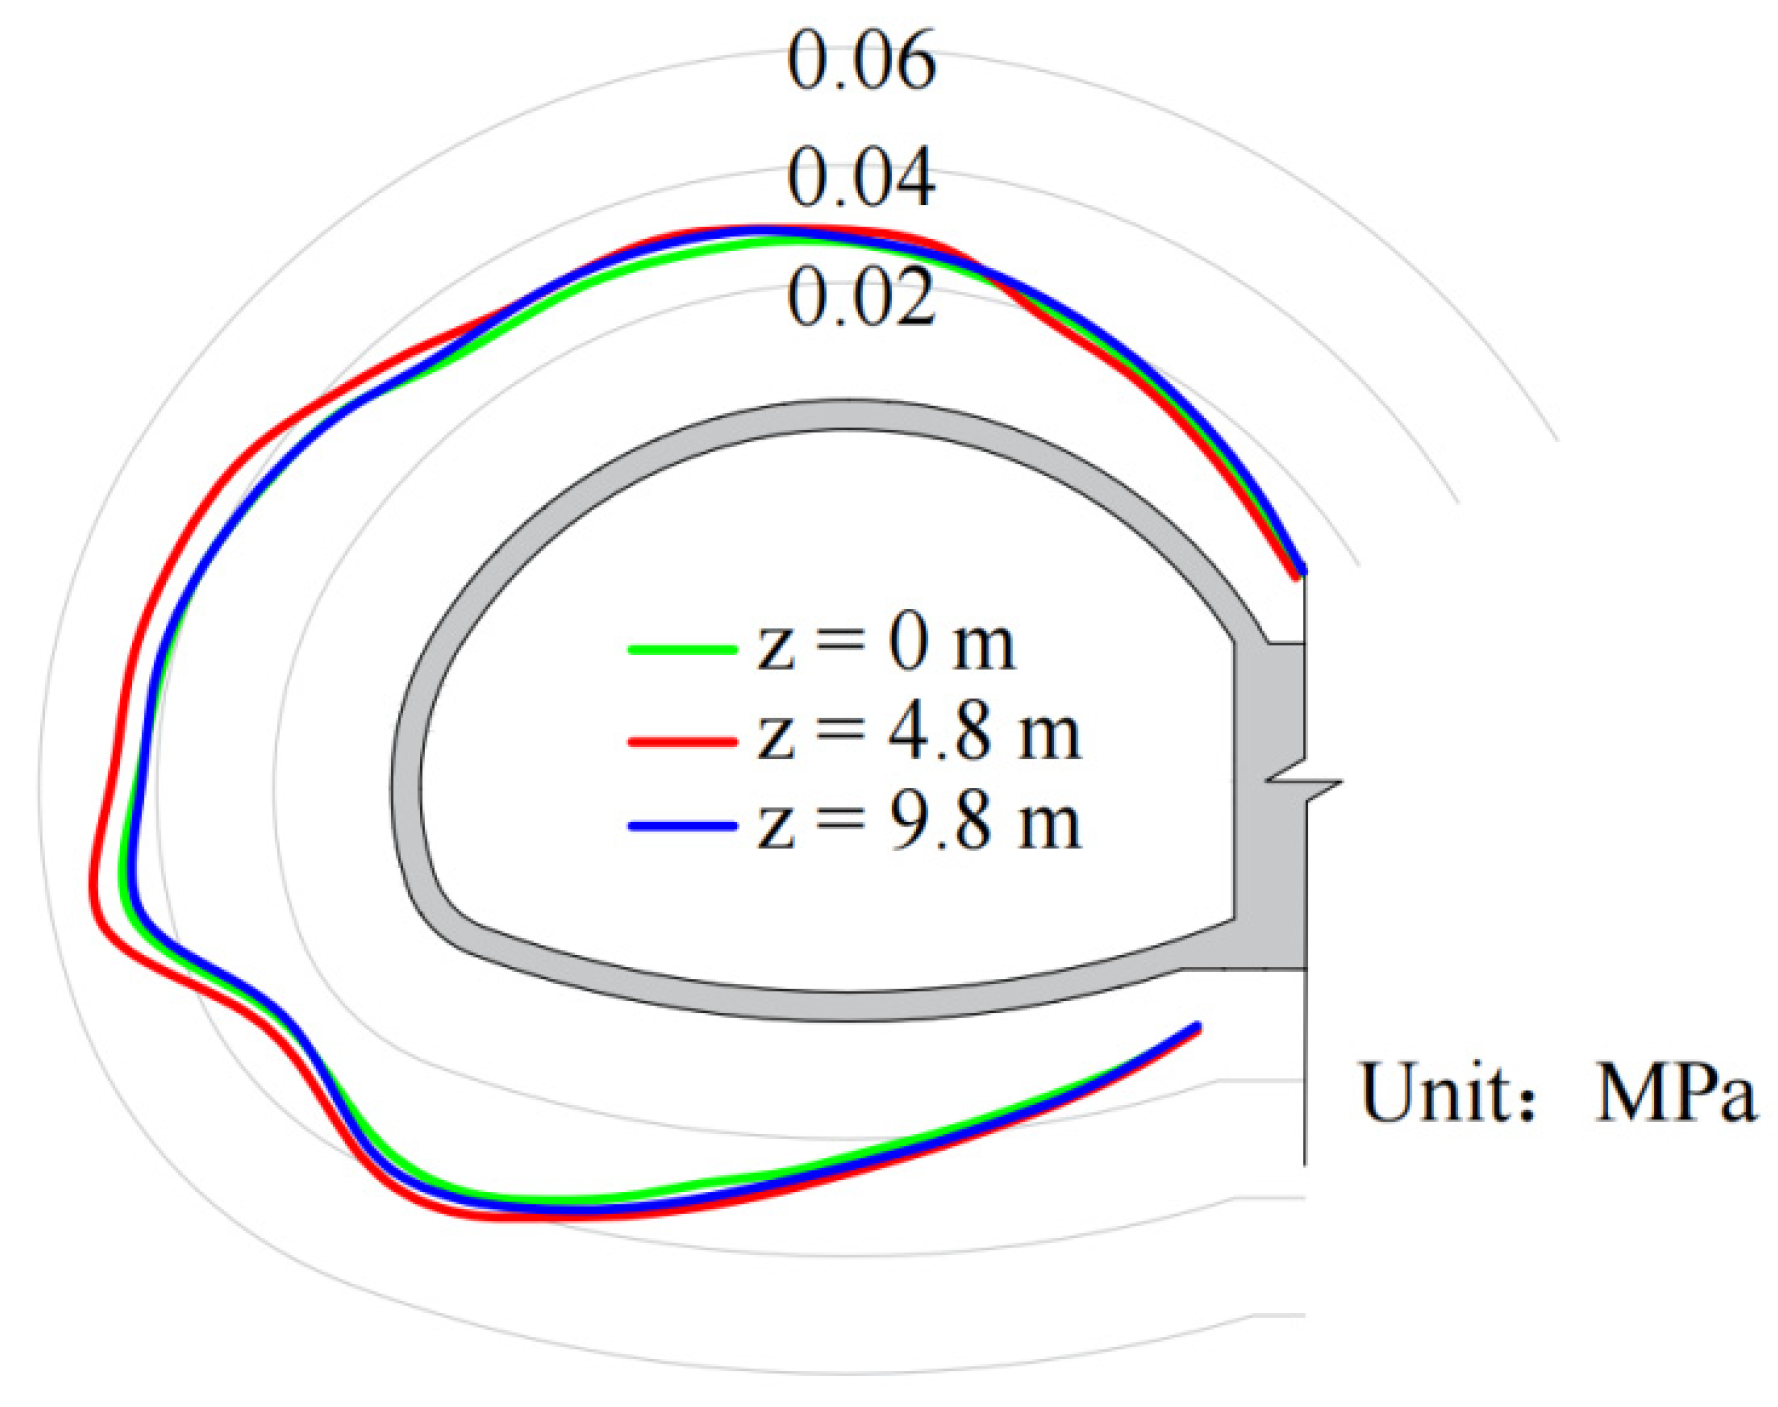
Figure 12 shows the effective stress distribution on these three cross-sections. The maximum effective stresses are 0.047 MPa, 0.052 MPa, and 0.045 MPa, respectively. It can be observed that among the three sections, the effective stress on the z = 4.8 m cross-section is the highest. On each individual cross-section, the effective stress is greatest at the sidewall, indicating that the blast-facing sidewall is more susceptible to damage compared to other locations. The effective stress in the structure decreases significantly with increasing distance from the blast source. Notably, the effective stress at the arch foot is considerably lower than in the surrounding areas.
5. Safety Control Based on Vibration Velocity
Damage to the lining of adjacent tunnels can be assessed based on the maximum tensile stress criterion. When the tensile stress on the lining exceeds the tensile strength of the concrete material, the lining structure can be considered damaged. As discussed in
Section 3 and
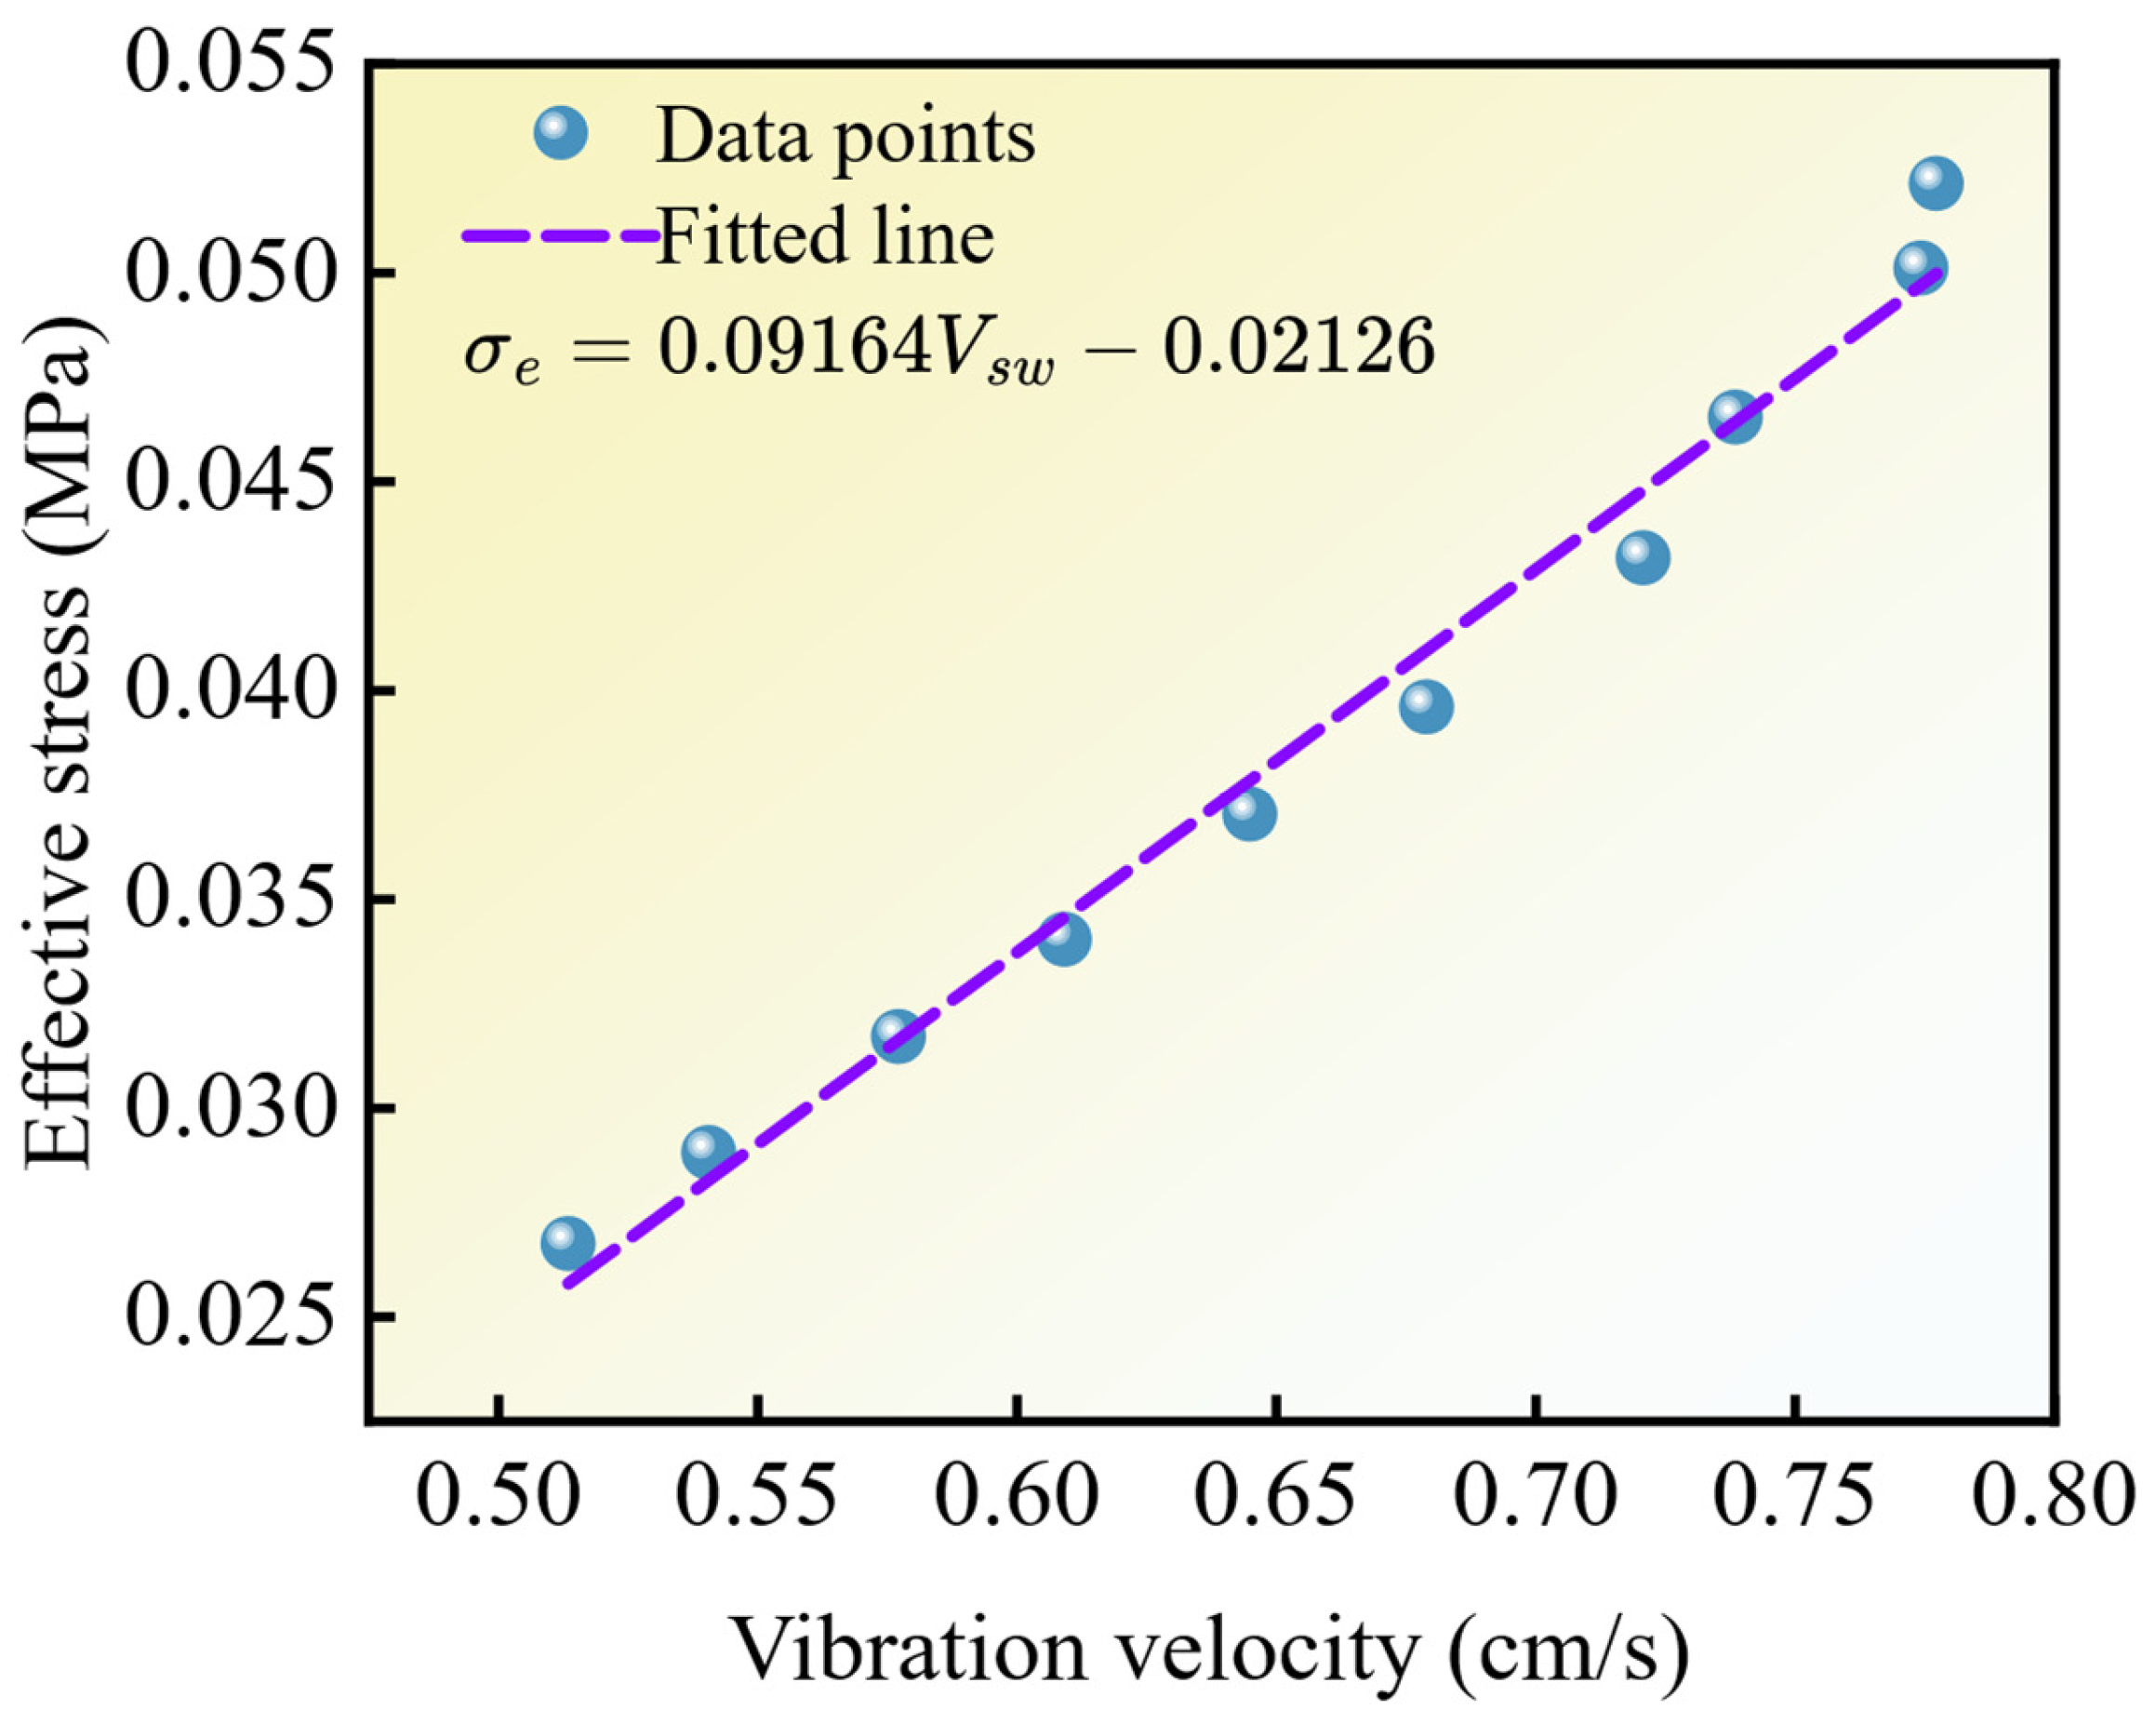
Section 4, the variation trends of vibration velocity and effective stress at the sidewall location are similar. By establishing a relationship between vibration velocity and effective stress, it is possible to determine the corresponding vibration velocity threshold associated with the maximum tensile stress. A statistical relationship model between the two is established, as shown in
Figure 13. The equation of the relationship model is
where
σe is the effective stress in MPa and
Vsw is the vibration velocity at the sidewall in cm/s. This equation indicates a strong linear relationship between vibration velocity and effective stress.
The existing double-arch tunnel lining uses C25 grade concrete. According to the time-dependent model of concrete strength under general atmospheric conditions proposed by Niu:
In the equation,
t is the service duration of the concrete in the general atmospheric environment, measured in years;
η(t) is the time-dependent strength proportionality parameter of concrete. According to Code for Design of Concrete Structures (China) (GB/T50010-2010) [
28], taking the maximum tensile strength during the service life as 1.27 MPa and the service time as 45 years, the calculated tensile strength is 1.105 MPa, which is approximately equal to the tensile strength of C20 concrete (1.10 MPa). Ultimately, the tensile strength is taken as 1.10 MPa, from which the safety threshold for blasting vibration velocity of the existing tunnel lining is determined to be 12.23 cm/s.
In the highway double-arch tunnel studied in this paper, it is more practical to install vibration sensors at the arch foot location. If a corresponding relationship exists between the vibration velocity at the arch foot and that at the sidewall, the arch foot vibration velocity can be used to determine whether the sidewall vibration velocity exceeds the safe threshold.
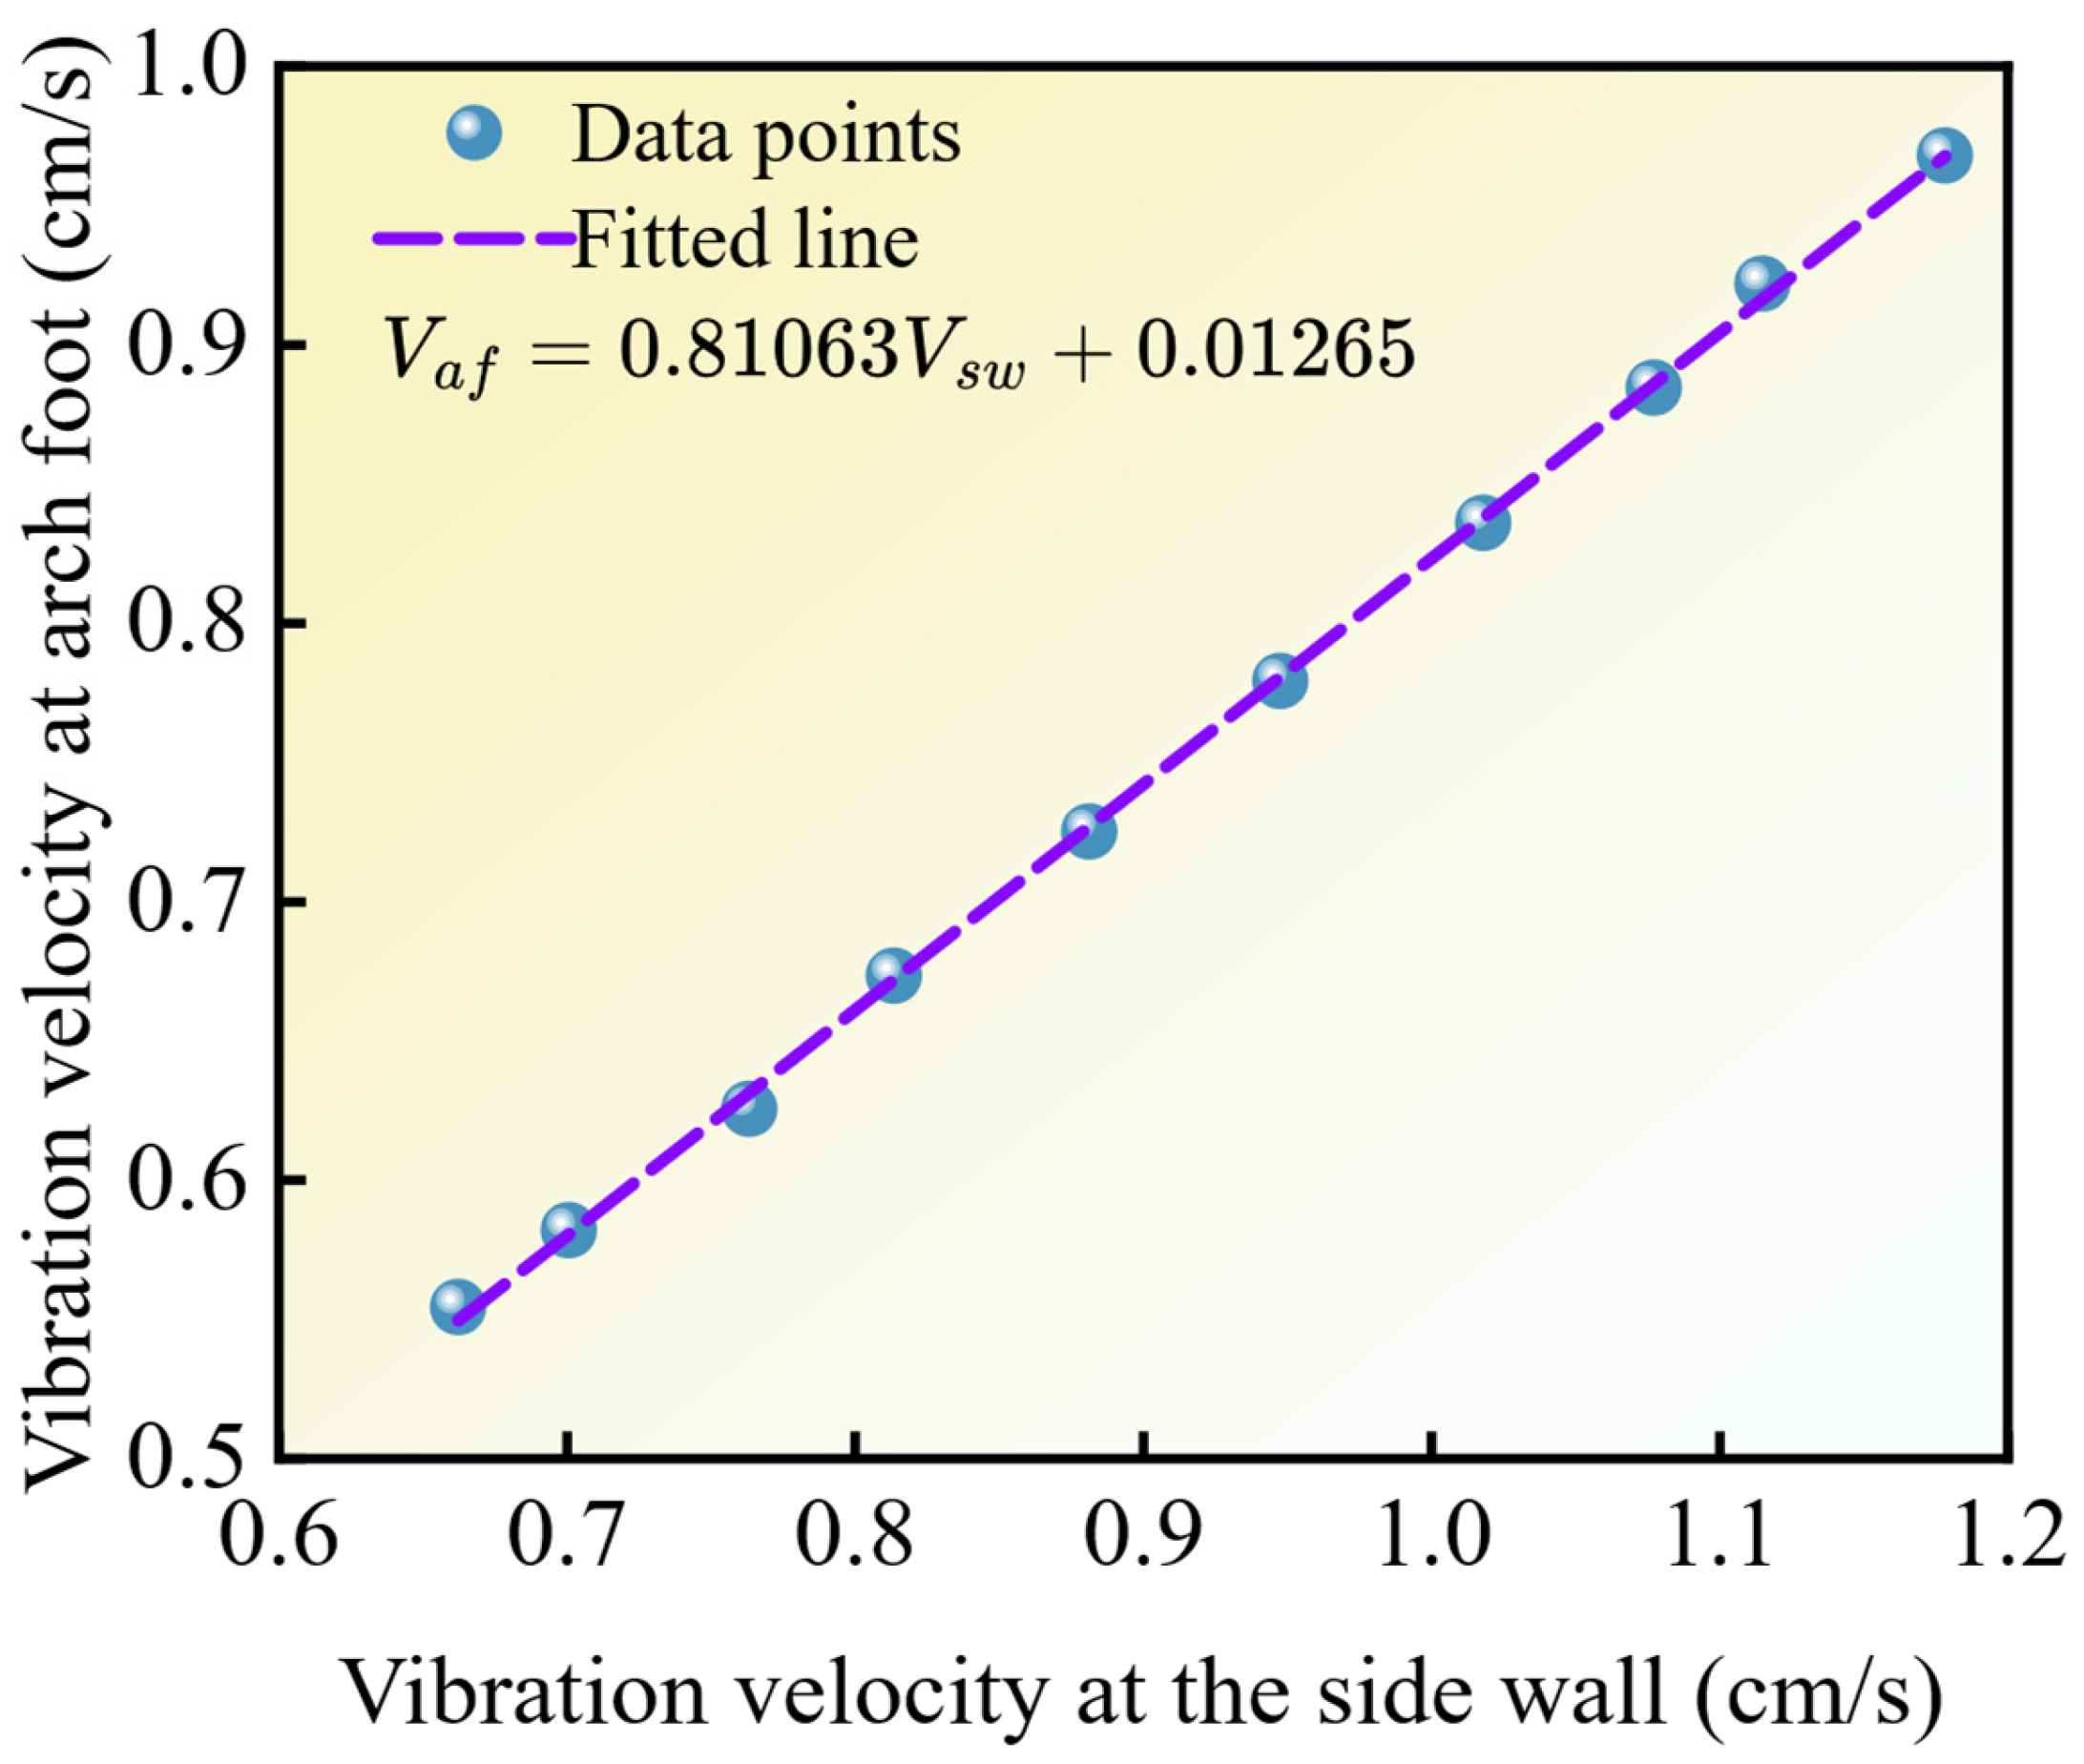
Figure 14 shows the statistically derived relationship model between arch foot vibration velocity and sidewall vibration velocity, with its equation given as
where
Vaf is the vibration velocity at the arch foot in cm/s.
It can be observed that a strong linear relationship exists between the arch foot velocity and the sidewall velocity. When the vibration velocity at the blast-facing sidewall reaches the safety threshold of 12.23 cm/s, the corresponding vibration velocity at the arch foot is 9.91 cm/s. This arch foot velocity value is therefore adopted as the safety control standard for the existing tunnel during the construction of the new tunnel.
6. Maximum Charge
In actual tunnel construction, the advance per round is related to the length of the cut holes. Longer cut holes allow for a greater charge weight to be loaded. However, an excessive charge weight can generate overly intense blast effects, potentially causing adverse impacts on the lining structure of the existing tunnel. To ensure the safe operation of the adjacent existing tunnel during the construction of the new tunnel, it is essential to clarify the relationship between the charge weight and the dynamic response of the existing tunnel structure.
In this section, five different charge weights were set to investigate the relationship between charge weight and vibration velocity through corresponding numerical simulations. The specific working conditions are listed in
Table 4.
With the increase in charge weight in the cut holes, the disturbance from blasting excavation on the adjacent tunnel intensifies, leading to a corresponding increase in the vibration velocity of points on the tunnel lining.
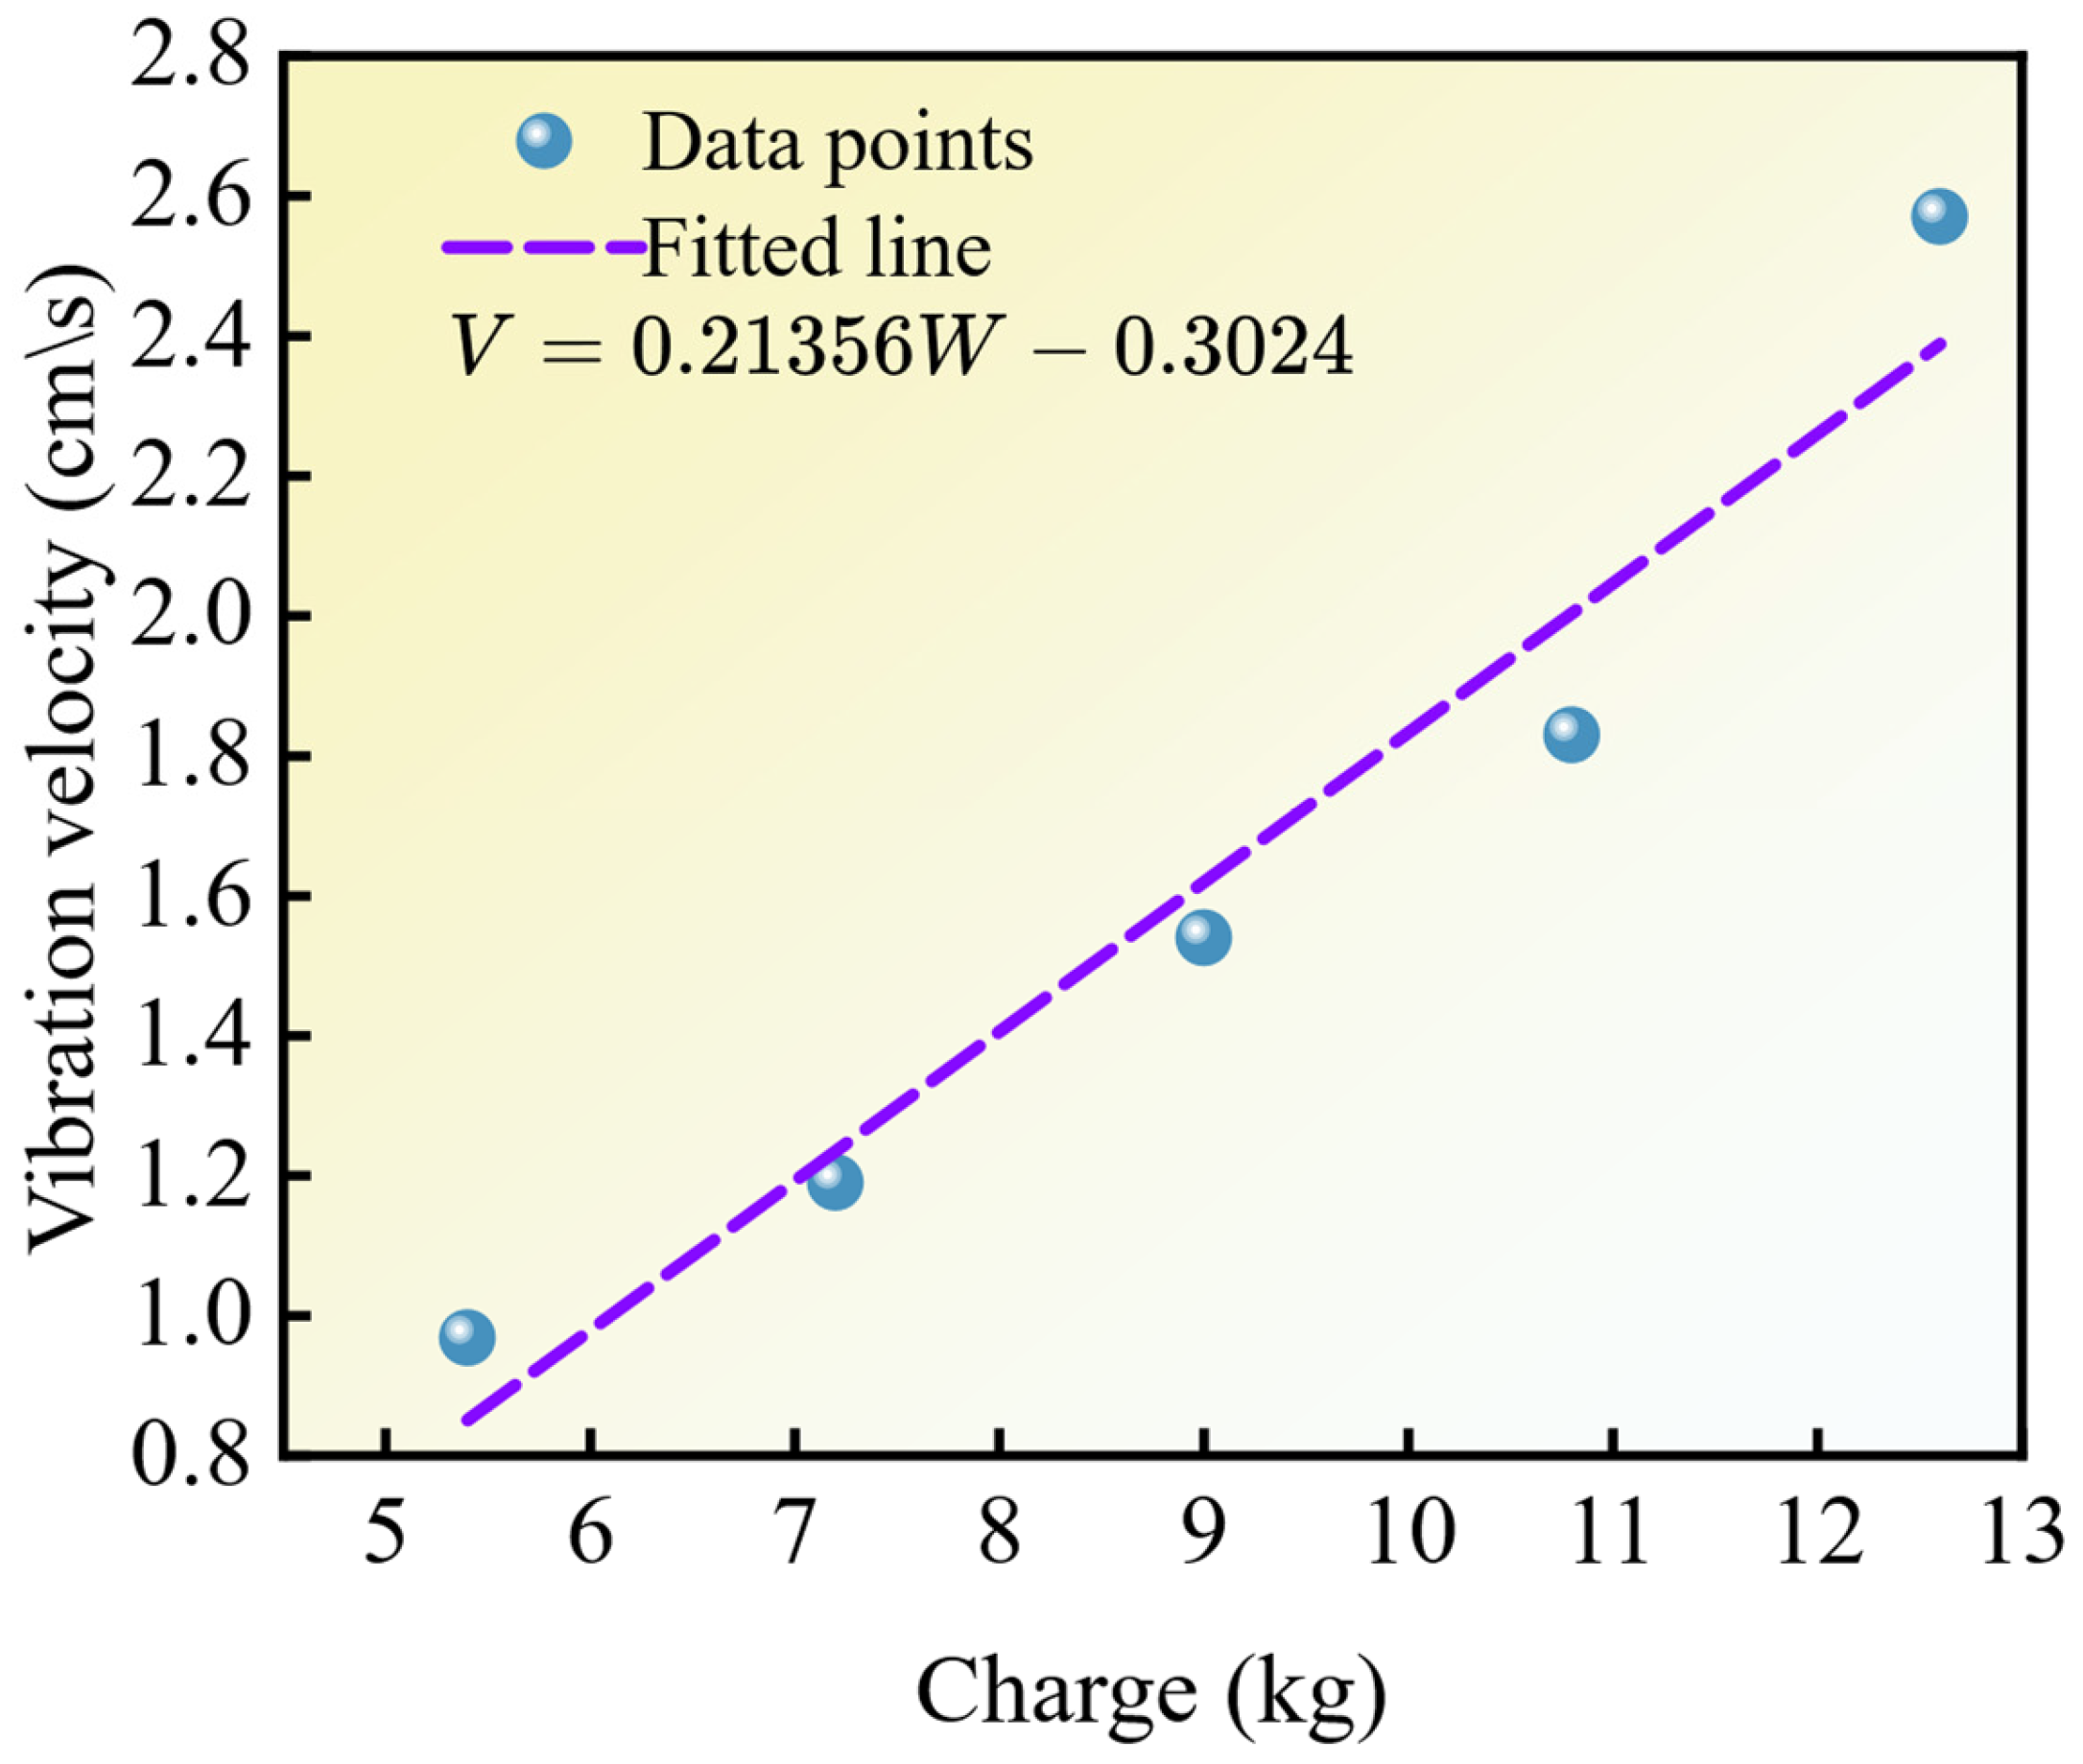
Figure 15 presents the statistical relationship between the vibration velocity at the blast-facing arch foot of the existing tunnel and the charge weight in the cut holes under different working conditions.
The relationship equation is
where
V is the vibration velocity at the arch foot in
cm/s and
W is dosage of explosive in kilograms.
Based on this equation, the safe charge weight threshold can be determined from the safe arch foot vibration velocity threshold. To ensure that the vibration velocity at the blast-facing arch foot does not exceed 9.91 cm/s, the maximum charge weight per delay must not exceed 47.82 kg.
7. Conclusions
In this study, the dynamic response of a highway tunnel subjected to adjacent blasting excavation loads was investigated using numerical simulation. To ensure the safe operation of the existing tunnel during the construction of the new tunnel, a safety control standard for blast-induced vibrations was proposed, and a recommended maximum charge weight per delay for cut holes was provided, aiming to offer a safety reference for similar engineering projects.
The aforementioned statistical relationship is dependent on factors such as rock properties, tunnel geometry, and blast source location, and is thus specific to the current project. In other words, for dynamic response problems of tunnels subjected to blasting disturbances under different conditions, the above relationship equation and safety criterion may not be applicable. For instance, Zhang [
14] and Zhao [
29] employed a similar methodology to analyze different blasting projects, and the resulting relationship models were not identical. Nevertheless, the general approach of establishing relationships among effective stress, vibration velocity, and charge weight remains valuable and can be applied to guide safe tunnel construction.
The main conclusions drawn from this research are as follows:
Through numerical simulation, the velocity distribution across different sections of the existing tunnel was analyzed. It was found that the particle vibration velocity on the side facing the blast is relatively higher. In the scenario studied in this paper, the maximum vibration velocity occurs at the sidewall on the blast-facing side.
The distribution of effective stress in the tunnel lining follows a pattern similar to that of the particle vibration velocity: the effective stress is highest on the blast-facing side. In this study, the maximum effective stress is located at the sidewall, indicating that this area is prone to damage when blast vibration intensity increases.
A statistical relationship was established between particle vibration velocity and effective stress. By using effective stress magnitude as a criterion for assessing tunnel structural safety, a corresponding safe threshold for particle vibration velocity can be derived based on this statistical relationship.
Simulations of the tunnel’s dynamic response under various blast charge masses were conducted, establishing a relationship between the cutting charge mass and the vibration velocity at the arch foot. Based on the previously defined “safe vibration velocity,” a corresponding “safe charge mass” can be determined.
It should be noted that the applicability of the method does not imply the practical applicability of the numerical values. Project-specific investigation and analysis should be conducted for individual cases.



 ,
,