Article

Risk Visualization in Mining Processes Based on 3Dmine-3DEC Data Interoperability

1
Key Laboratory of Ministry of Education for Efficient Mining and Safety of Metal Mines, University of Science and Technology Beijing, Beijing 100083, China
2
School of Resources and Safety Engineering, University of Science and Technology Beijing, Beijing 100083, China
*
Authors to whom correspondence should be addressed.
Appl. Sci. 2026, 16(2), 816; https://doi.org/10.3390/app16020816
Submission received: 28 November 2025 / Revised: 8 January 2026 / Accepted: 9 January 2026 / Published: 13 January 2026

Abstract

The use of geological models for mine production scheduling, planning, and design is a common aspect of current digital mine construction. Establishing a mapping relationship from digital geological resources to mining process simulation and then to risk early warning, enabling real-time interaction between digital models and physical mines, is an essential component of mining digital twins and an important direction for future development. This study is based on a non-ferrous metal mine and involves the development of data interaction functionality between 3Dmine (enterprise edition) and 3DEC7.0 software. This enables data mapping between geological models and numerical models, as well as real-time 3D visualization of risk points in the geological model. The main research findings are as follows: (1) Based on UAV photogrammetry and geological exploration data, a refined 3D geological model incorporating the surface, subsidence zones, goaf groups, and roadway systems was constructed using 3Dmine. The mine numerical model was then generated through 3Dmine-3DEC coupling technology. (2) A 3DEC-3Dmine data interaction interface based on Python was developed. Intelligent extraction and format conversion of mechanical parameters, such as stress and displacement, were achieved through secondary development, and a multi-software collaboration platform was built using an SQL database. A three-dimensional visual characterization script for risk points was developed. (3) Based on the strength–stress ratio and the nearest distance attribute assignment method, the three-dimensional visualization of blocks with different risk levels in 3Dmine is realized. (4) When the adjacent mine rooms are excavated in turn, the range of grade II risk area will be obviously expanded and a more serious grade III risk area will appear. The research findings offer a direction for the future development of mining digital twin technology, as well as technical support and theoretical guidance for analyzing and predicting safety risks during the mining process.

1. Introduction

Mineral resources form the foundation of modern industrial development. As resource depletion progresses, mining operations are increasingly conducted at greater depths and under more complex geological conditions. These practices have led to significant safety challenges, including goaf instability, stope roof collapses, and open-pit slope failures [1,2,3,4,5]. To ensure the safe and efficient exploitation of resources, analyzing safety and risk factors in the mining process through theoretical calculation, physical simulation, and numerical simulation is a widely used approach [6,7,8,9,10,11,12]. Among these, numerical simulation software has become the most effective tool for assessing mining process safety due to its low cost and high repeatability [13,14,15]. For instance, Azarfar et al. [16] employed FLAC3D for sensitivity and comparative analyses, studying the stability of large- and small-scale rock slopes (including both overall open-pit and steep slopes) and fault zones. Gao et al. [17] employed 3DEC to simulate roof plate failure due to horizontal stress inclined relative to the roadway’s forward direction. They found that, for roadways subjected to high stress, reinforcing the roof corner at an oblique angle in real time after excavation is essential to prevent roof failure. Chen et al. [18] employed 3DEC to investigate the stability of circular tunnel portals in layered rock masses. They found that the layering influences the rock mass damage process and the distribution of secondary cracks, leading to larger damaged areas. Additionally, digital software is extensively used to build geological models during mine production. Mining design, production planning, and resource management are then based on these models, enhancing the efficiency, accuracy, and numerical precision of the mining process. Lv et al. [19] developed the underlying database, surface model, physical model, and block model using 3Dmine, demonstrating the application of 3D mine digitization in mining operations. This laid the foundation for mine design, measurement, production, and management. Using the 3Dmine platform, Wang et al. [20] applied three-dimensional geological modeling and the distance power inverse ratio method to create ore body and grade distribution models for the study area.
Numerical simulation software can model the fracture process of rock masses and assess mining process safety. However, this approach depends on simplified geometric models, making it difficult to accurately represent the actual geological features. Although digital modeling software excels in representing three-dimensional geological structures, it lacks high-precision mechanical calculation capabilities. Therefore, achieving complementarity between numerical and digital software through their coupling is crucial [21]. Fan et al. [22] constructed a three-dimensional spatial model of a complex goaf group through the coupling of Minesight4.0 and 3Dmine software. FLAC software (https://www.itasca.fr/en/software/flac3d (accessed on 15 September 2025)) was then used for simulation analysis. Wang et al. [23] employed the 3DMINE-Rhino-FLAC coupling modeling method to separate and extract special ore bodies and surface topographic features of the Hongling ore body and analyzed the stability characteristics of the stope around the subsidence area. Deng et al. [24] proposed a multi-software coupling numerical modeling method (3DMine-Midas GTS NX-FLAC3D), leveraging the 3Dmine software’s ability to construct three-dimensional geological models. This method addressed the challenge of creating unified geological and numerical models for high, steep slopes in open-pit mines. Using filling mining as the research context, Zhang et al. [25] employed 3DMine-Rhinoceros-FLAC3D coupling to construct a detailed three-dimensional model of the mining area and conducted optimization simulations and stability analysis of safety pillars. To accurately analyze the movement and stress variations in surrounding rock in underground mining, particularly the stability of complex goafs formed by different mining methods and the changes in pillar stress, Gao et al. [26] proposed a multi-software joint modeling method 3Dmine-Surfer-Rhino-ANSYS-FLAC3D, addressing the challenges of constructing three-dimensional numerical models of complex goaf groups and generating meshes for numerous small mine pillars.
Currently, relying solely on numerical modeling inevitably leads to the loss of details from the original digital model, resulting in discrepancies between the simulation results and the actual engineering outcomes. The current 3DMine-FLAC3D multi-software coupling method provides fundamental support for numerical simulation and modeling in mining engineering. However, it has several limitations: 3DMine functions solely as a modeling tool, enabling only one-way data transfer to numerical software; processes such as data format conversion and result extraction rely heavily on manual operations, leading to low efficiency and susceptibility to errors; and it fails to effectively support risk visualization during the early stages of mining design. To address these limitations, this paper proposes a 3DMine-3DEC coupling method, establishing a comprehensive mapping relationship among the digital representation of geological resources, dynamic simulation of the mining process, and a risk early-warning system. This method enables real-time feedback of the 3DEC calculation results to the 3DMine platform, facilitating bidirectional data exchange and improving workflow efficiency. Leveraging the 3DMine platform, potential risk zones can be identified and located during the early stages of mine design. This achieves risk visualization between the digital twin model and the physical mine, thereby enhancing both the safety and scientific rigor of the mining design process.

2. Construction of a 3Dmine-3DEC Coupled Mine Model

This study establishes a three-dimensional geological model of the mining area using 3Dmine software (https://www.3dmine-cn.com/ (accessed on 15 September 2025)) to process field aerial data, borehole data, middle section plans, and other geological datasets [27]. The geological model is subsequently imported into 3DEC software for numerical analysis. Using 3DEC’s built-in commands, we perform rapid segmentation of the geological area’s numerical grid model and optimize the block model quality. This approach enables the rapid establishment of a comprehensive three-dimensional mine model that accurately represents the mine site and allows for quantitative calculation of stress and displacement distributions throughout the mining system, thereby providing improved guidance for subsequent operations.

2.1. Mine Overview

The metal mining area is situated in Suxian District, Chenzhou City, Hunan Province, on the northern side of the Nanling tectonic belt. The ore body is layered, measuring 1200 m in length, 500–800 m in width, 150–380 m in thickness, and 300–890 m in height. The deposit is located in the contact zone between granite and limestone, forming a greisen-skarn composite tungsten polymetallic deposit, which is classified as a super-large deposit. The mining area utilizes underground mining methods. The mining area is divided into five sections: east, west, north, central, and south. The primary methods used are sublevel drilling-stage open stoping and large-diameter deep hole-stage open stoping, supplemented by sublevel caving mining. Currently, there are approximately 2 million cubic meters of goafs underground, with a subsidence area of 80,000 square meters in the central region.

2.2. Construction of a Mine Geological Model Using 3Dmine

2.2.1. Construction of Surface Model

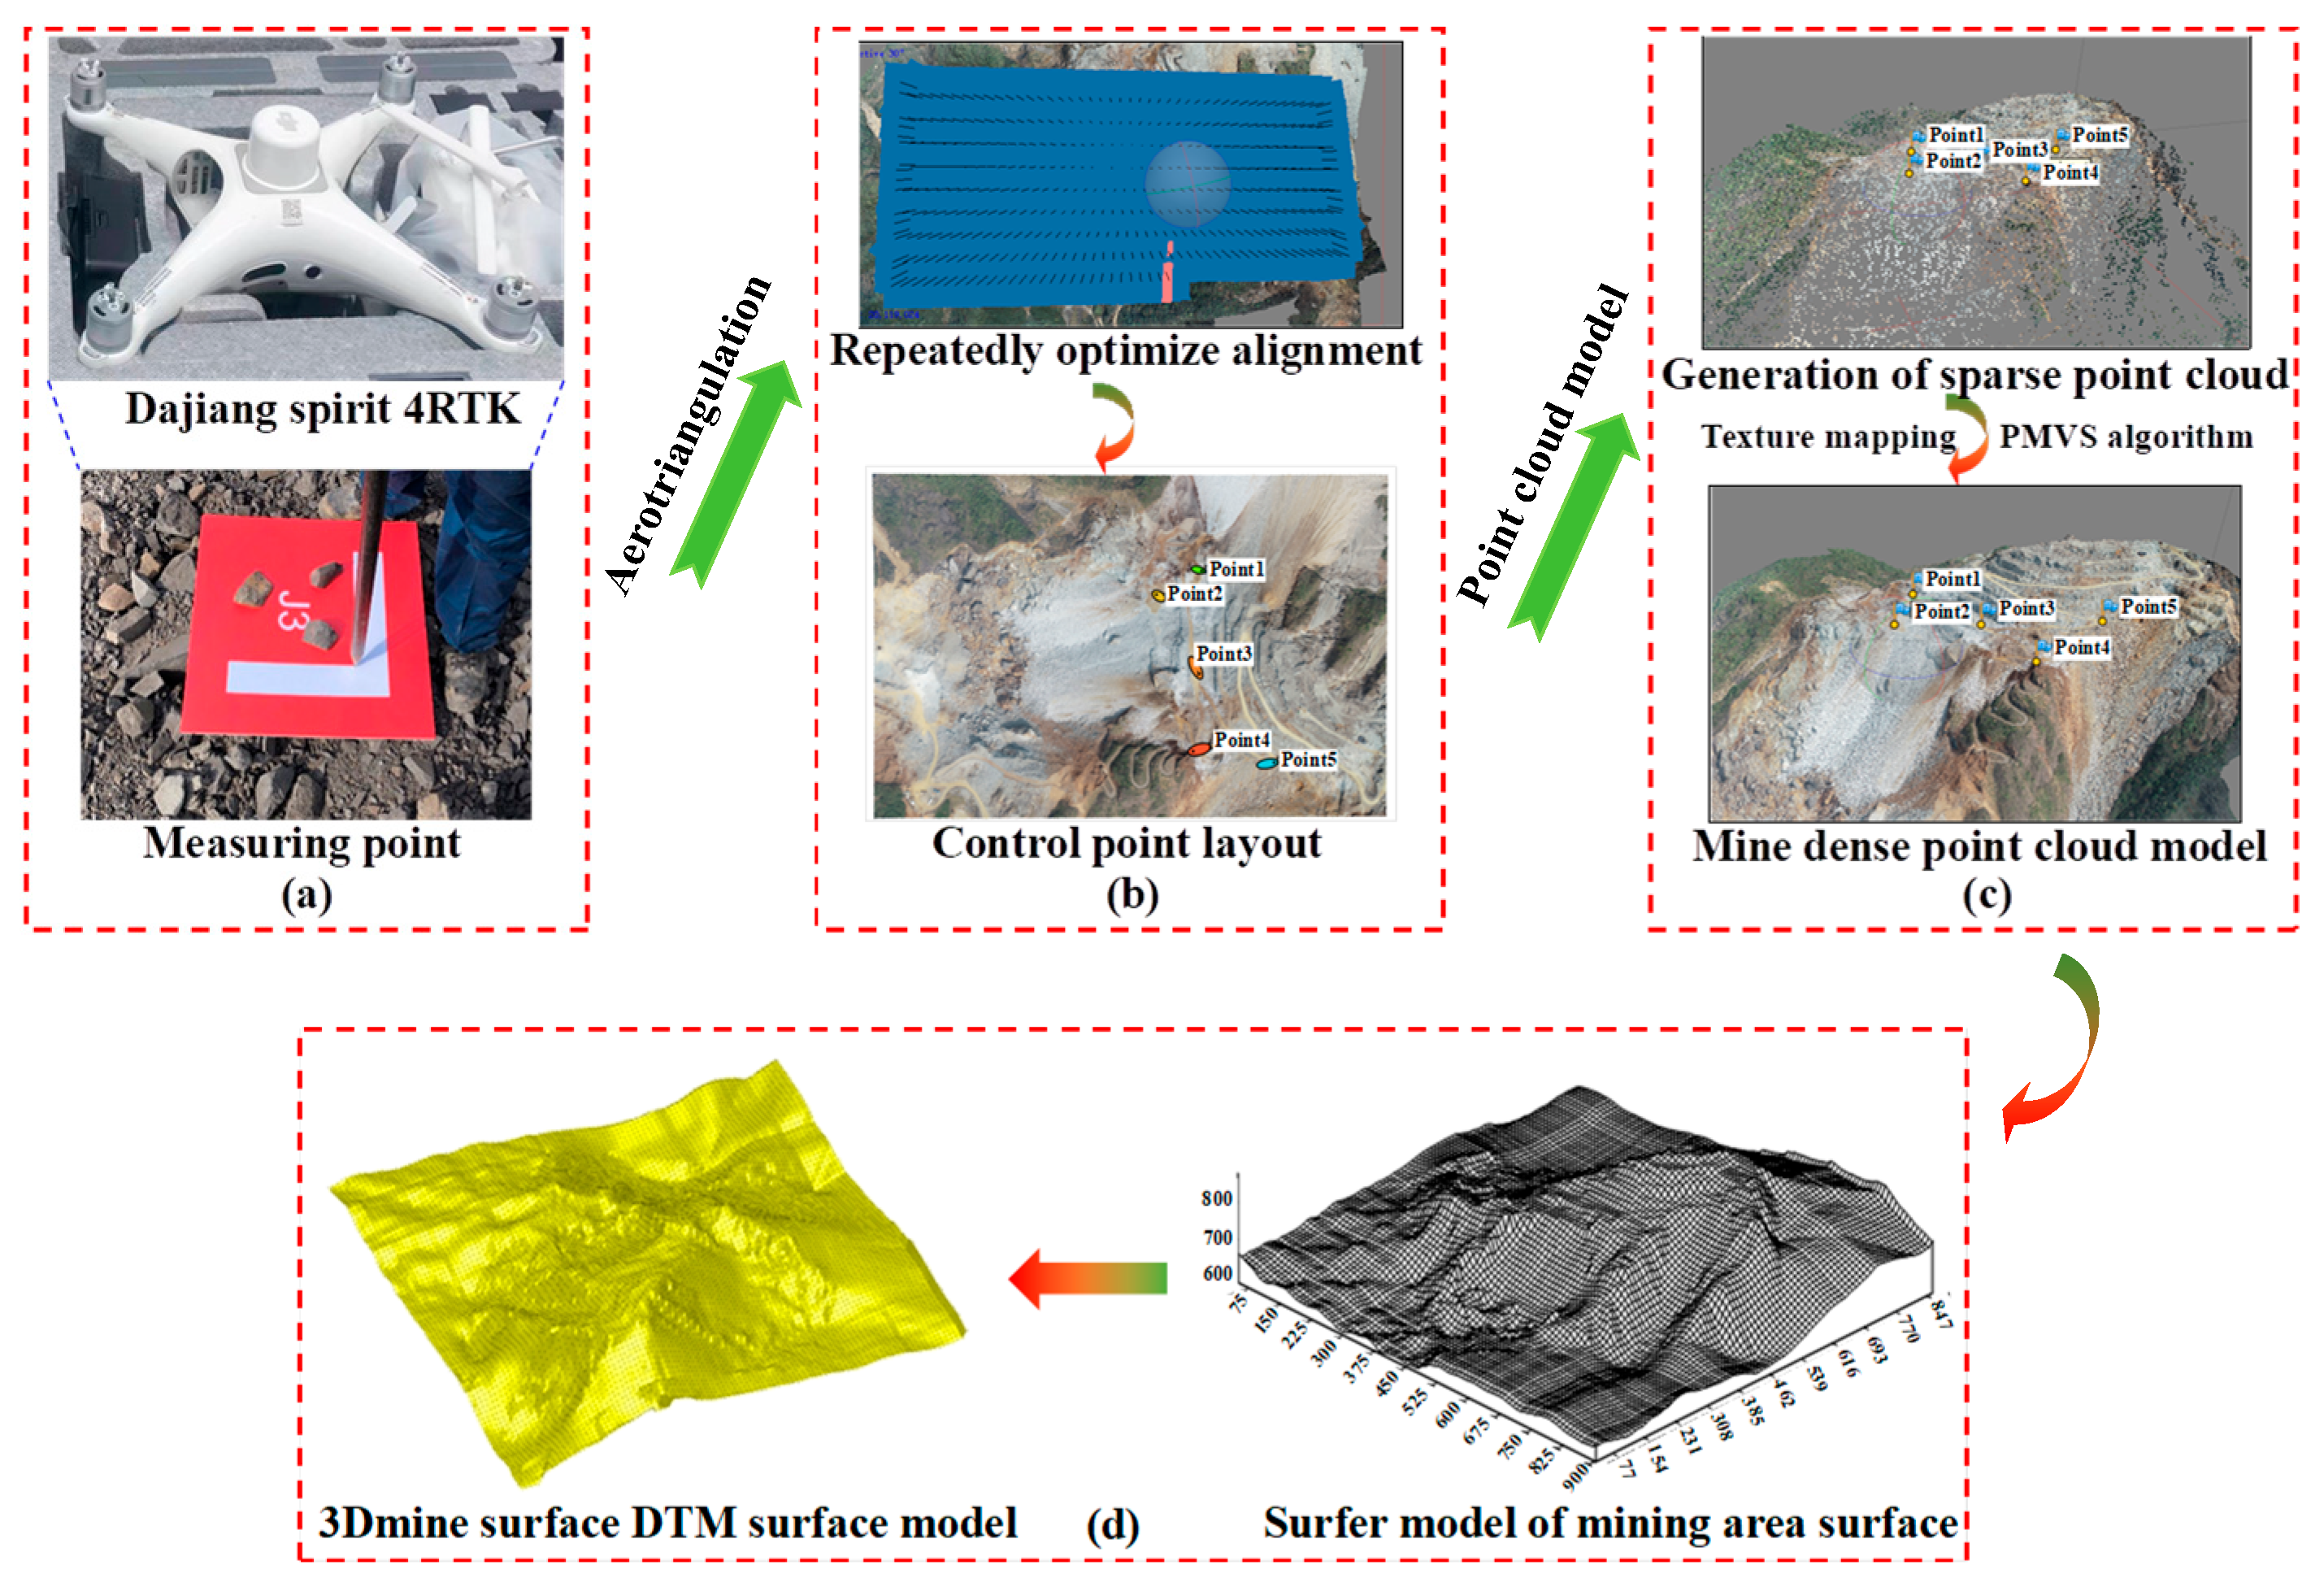
Aerial photography of the open-air surface (with arranged measuring points) was conducted using the DJI Spirit 4RTK (DJI Technology Co., Ltd., Shenzhen, China), as shown in Figure 1a. The horizontal positioning error is 1 cm, the vertical error is 1.5 cm, and the horizontal absolute accuracy of the plane model can reach 5 cm. A total of 723 oblique images were captured using UAV oblique photography technology. Aerial triangulation without image control points was then conducted on the oblique images. The use of GPS-RTK measurement method to collect image control point data can obtain high-precision image position information [28], as shown in Figure 1b. The coordinates of the image control points are presented in Table 1. After photo alignment, the control point positions are located in the sparse point cloud model using the control point coordinates, and the control points are then inserted into the corresponding aerial images. The No. 3 image control point is selected as the reference point, and the No. 1, 2, 4, and 5 image control points are used in the recalculation. Subsequently, the dense point cloud, grid, and texture of the model are generated, as shown in Figure 1c. The accuracy of the No. 3 reference point is approximately 1.2 cm, while the accuracy of the other image control points is approximately 0.93 cm. Surfer software interpolates the dense point cloud DEM file to restore the real topography, then outputs it as a .dat file, which is imported into 3Dmine to create a surface DTM model, as shown in Figure 1d.

2.2.2. Construction of Underground Model

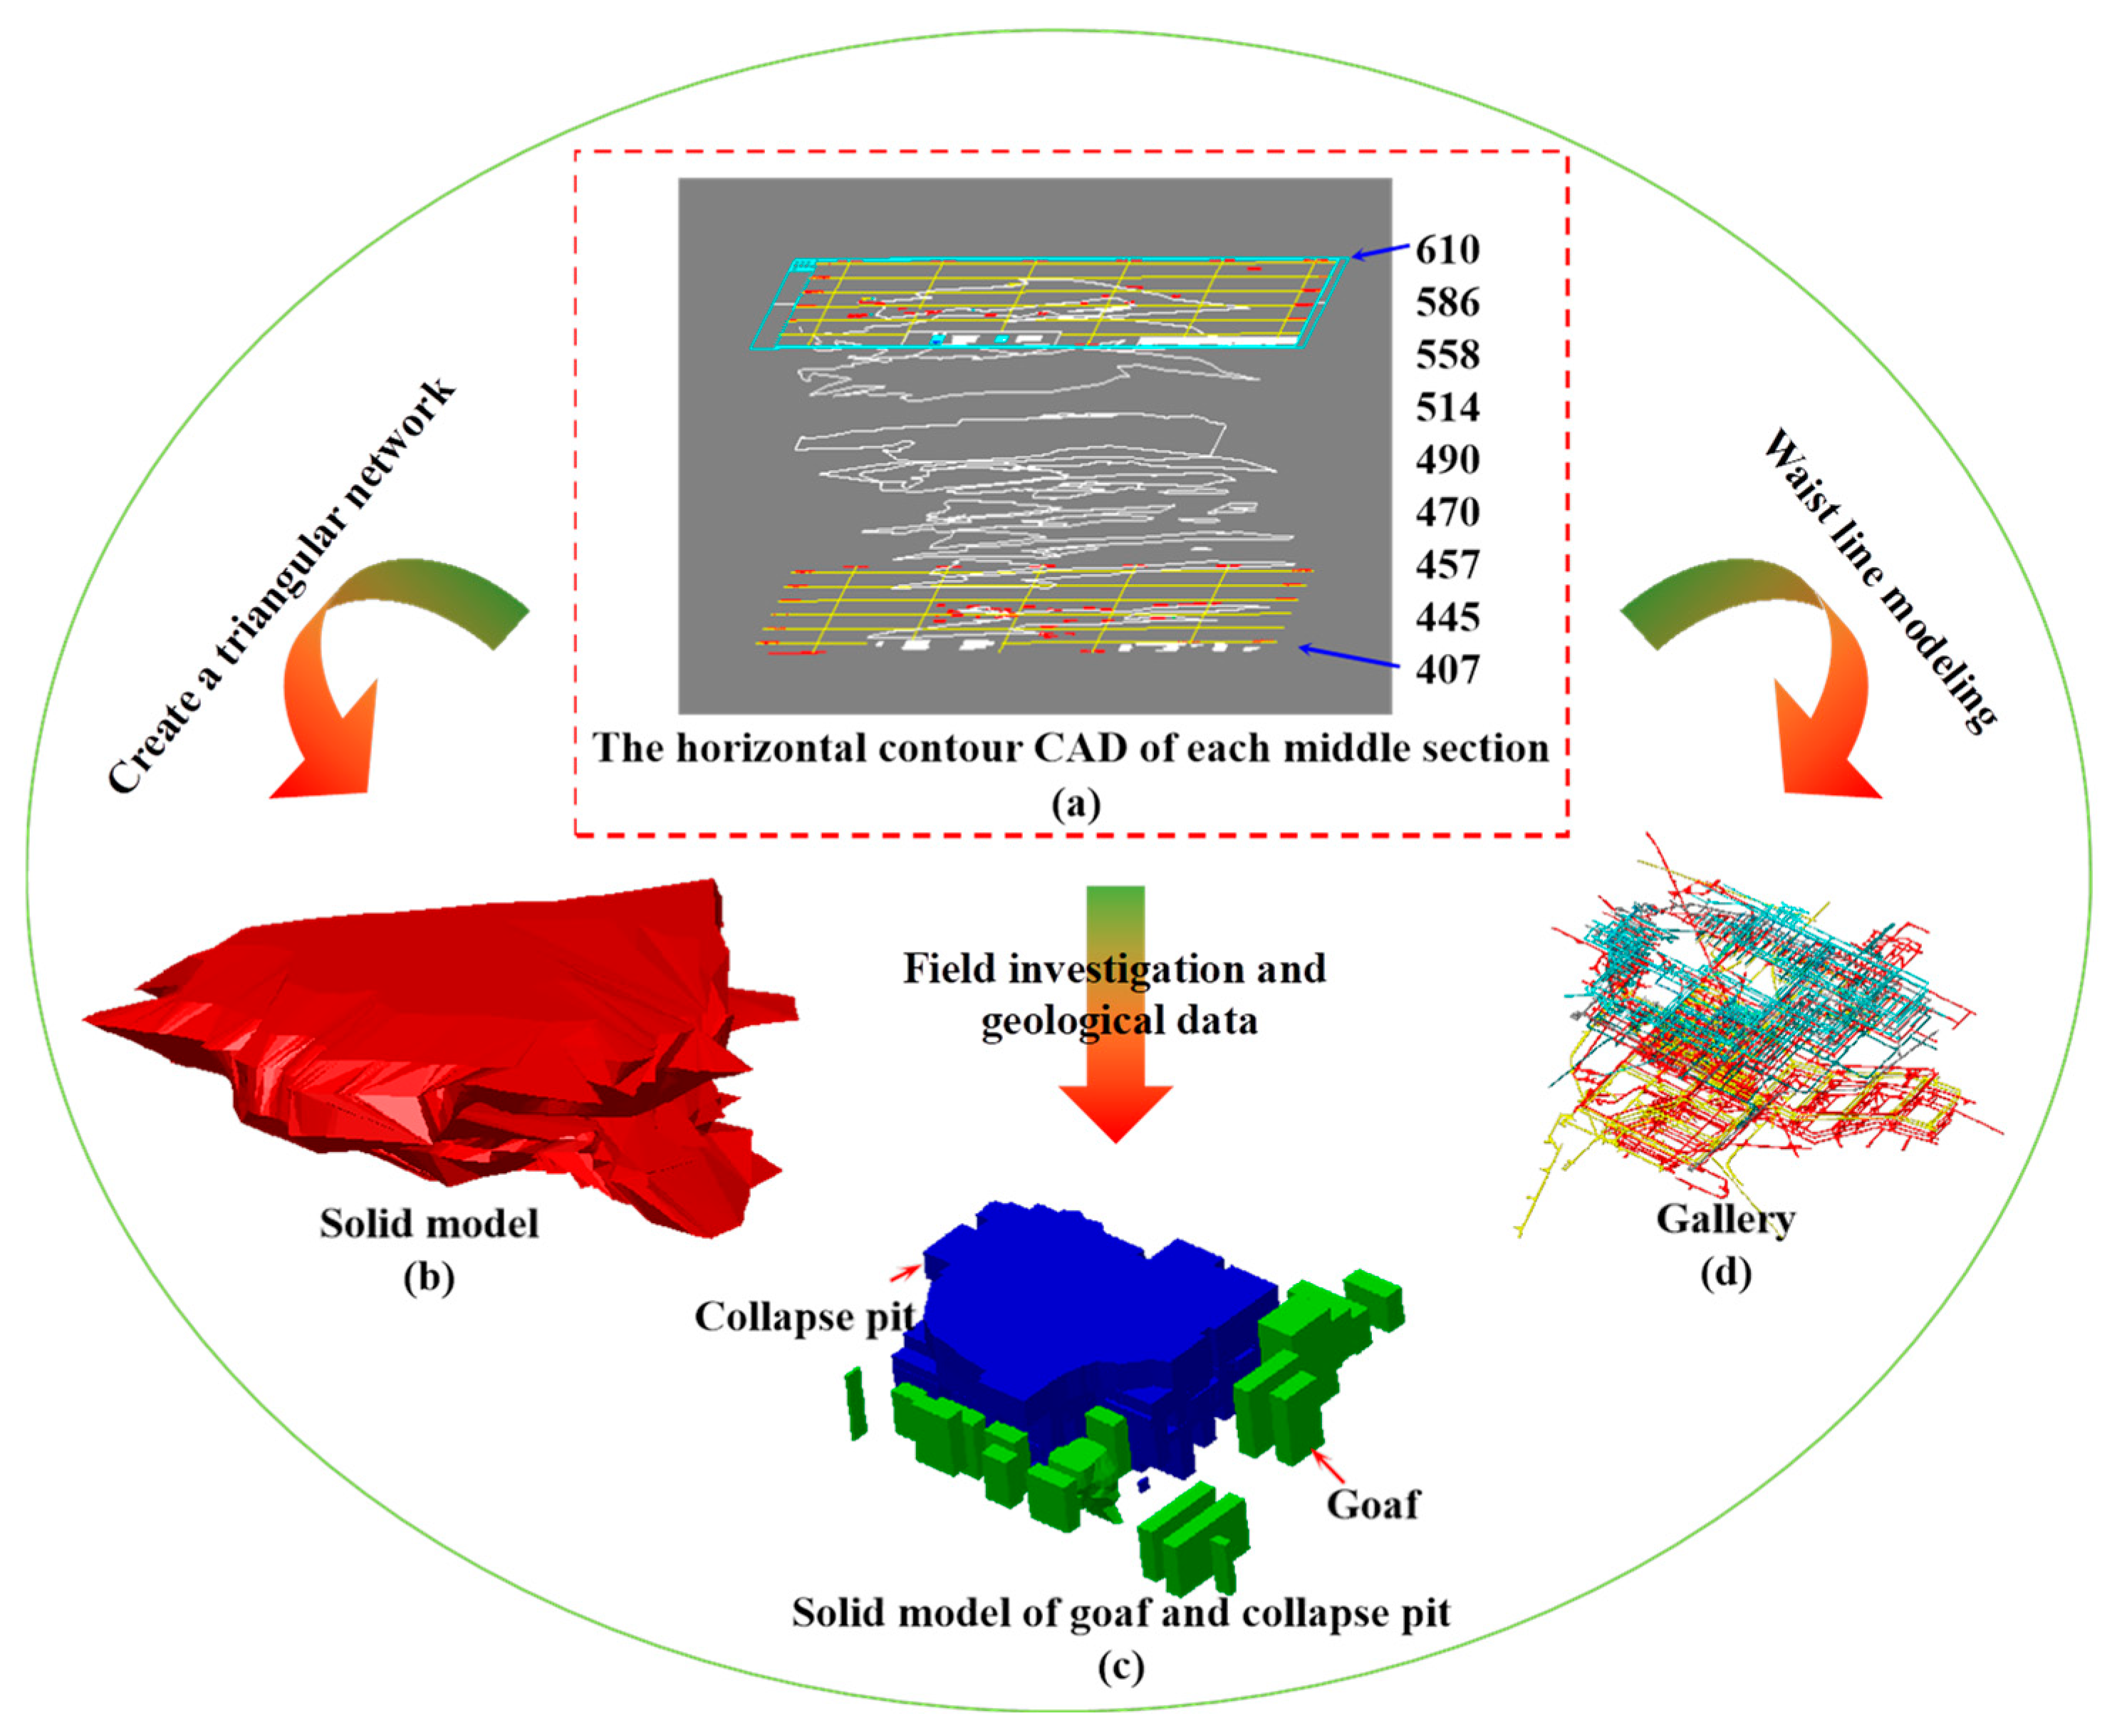
Based on the geological characteristics of the mine and the middle section plan data, a three-dimensional model of the ore body, goaf, and collapse pit is constructed using the section line, merging, and connecting section methods. The specific process is as follows: (1) First, the boundary line of the ore body is extracted from the mid-level plan and imported into 3Dmine software, where it is checked and corrected for closure, repeated points, and crossover issues in the line segments. (2) The mid-section plan of the independent coordinate system is aligned with the UAV aerial surface model coordinate system through coordinate correction and offset. The processed horizontal mid-section plan is shown in Figure 2a. (3) Using the processed horizontal mid-level plan, the preliminary ore body model is generated and appropriately extrapolated using the “connect triangulation between closed lines” function. Combined with the geological profile data, a dense triangular mesh is generated using the “create triangulation” function to integrate the three-dimensional solid model. (4) The closure and grid validity of the model are verified using the “Verification Entity/Triangulation” function until the model passes verification, after which the final solid model is constructed, as shown in Figure 2b,c.
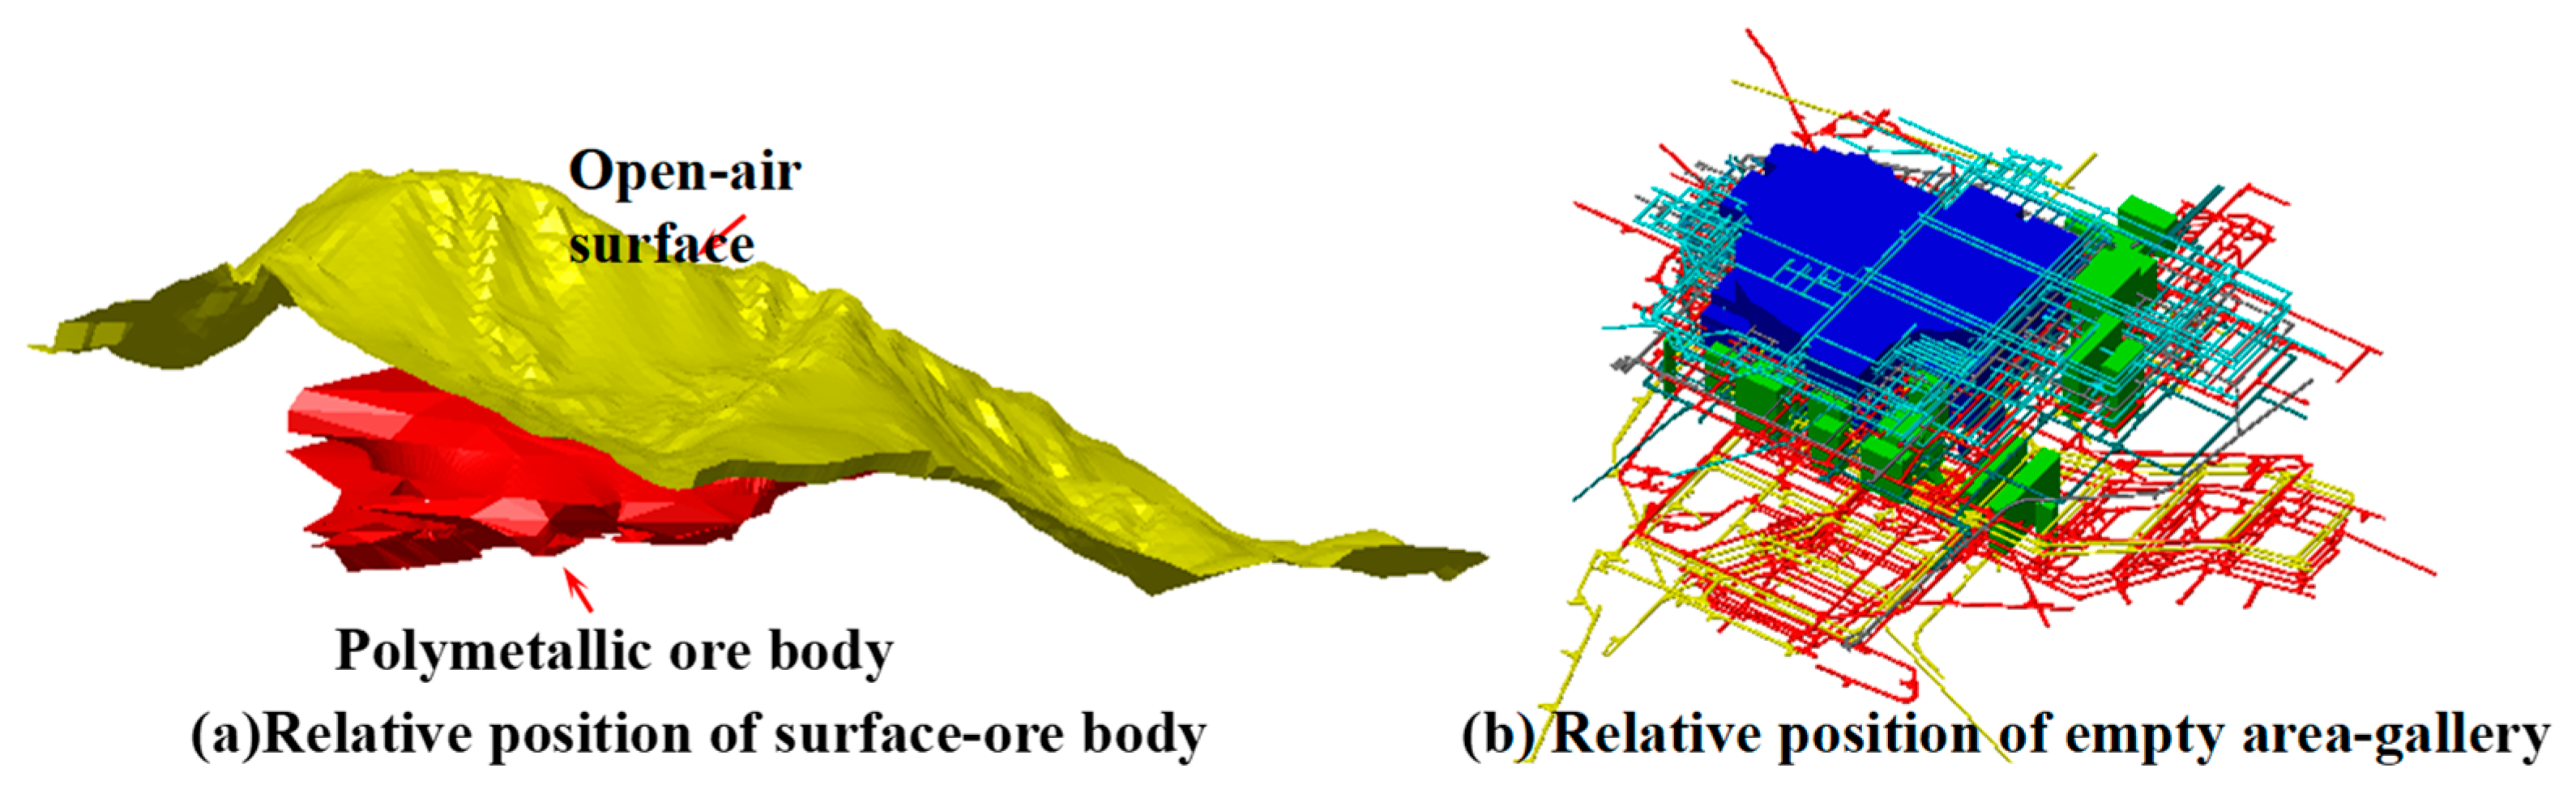
Three-dimensional roadway modeling is crucial for mine safety and mining planning. In this study, the waist line modeling method is employed to construct the roadway solid model in 3Dmine software. The specific process is as follows: (1) Extract and clean the roadway contour lines from the middle section plan. (2) Assign the corresponding elevation value to each horizontal roadway using the “line elevation” function. (3) Use the “cleaning/error checking” function to optimize the data quality and close the roadway lines to form the floor contour. Finally, an accurate three-dimensional roadway solid model is generated, as shown in Figure 2d. This method offers reliable technical support for the spatial relationship analysis and production planning of the mine roadway system. Figure 3 illustrates the three-dimensional spatial relationship between the surface, ore body, goaf, subsidence area, and roadway. The visualization of this relationship provides a crucial basis for mine safety operations, goaf management, and roadway optimization design.

2.3. Construction of Numerical Model Based on 3DEC

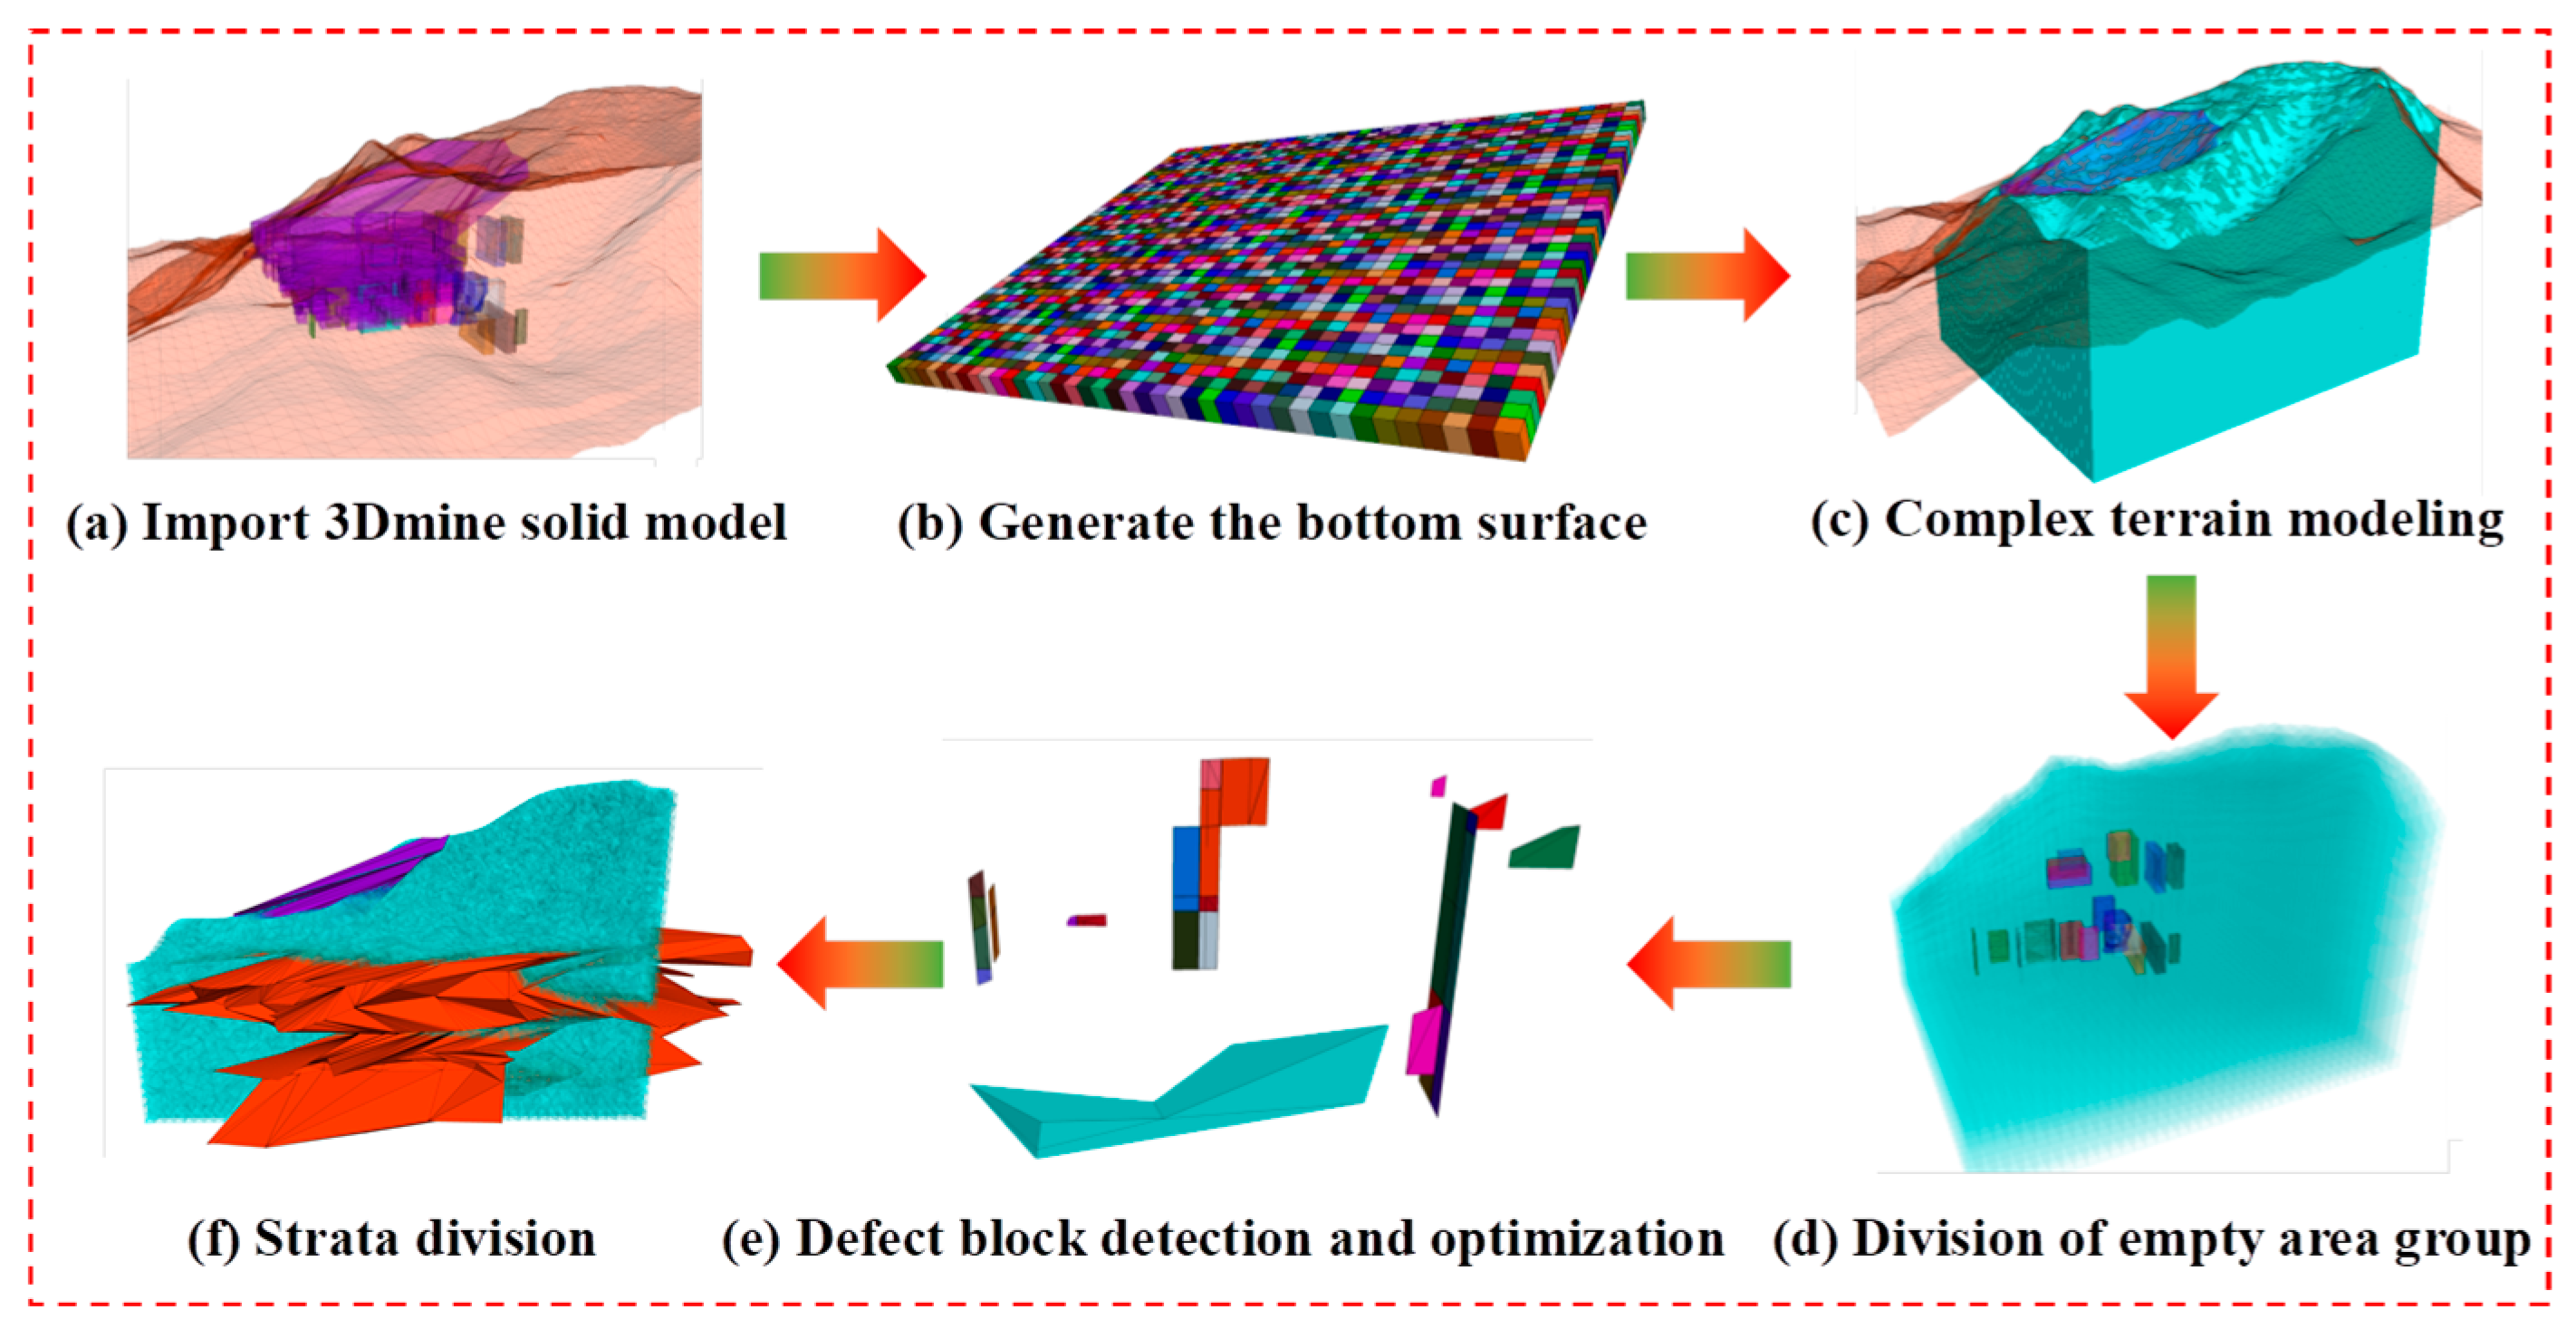
Based on the “block generate from-topography” command in 3DEC, this study achieves three-dimensional modeling of complex terrain. First, import the 3Dmine solid model into 3DEC, as shown in Figure 4a. Secondly, the initial working area (X: 5500–7500 m, Y: 7800–9800 m, Z: 0–900 m) is defined, and the mine bottom model, composed of 1600 basic units, is generated through a 40 × 40 × 1 division, as shown in Figure 4b. The DEM terrain data is then imported, and 10 layers of block units with a decreasing ratio (scale factor 0.9) are generated along the Z-axis. Finally, a high-precision three-dimensional model comprising 17,600 blocks (with an average size of 22.5 × 18.75 × 57 m) is established, as shown in Figure 4c. The goaf solid model constructed using 3Dmine software achieves accurate coupling between the goaf boundary and the surrounding rock blocks by importing the geometric entities and performing the Block CUT operation, as shown in Figure 4d. To address the issue of defective blocks (tiny volume, concave body) potentially caused by goaf cutting, the “block hide” command is combined with centroid range screening (with a threshold set to half of the average block size, 60 m) for optimization. This effectively reduces the large error in the goaf range after cutting generation, as shown in Figure 4e. Finally, the zone unit is established, and the model is divided according to lithology, as shown in Figure 4f.

3. Data Extraction and Interactive Interface Development of Risk Points

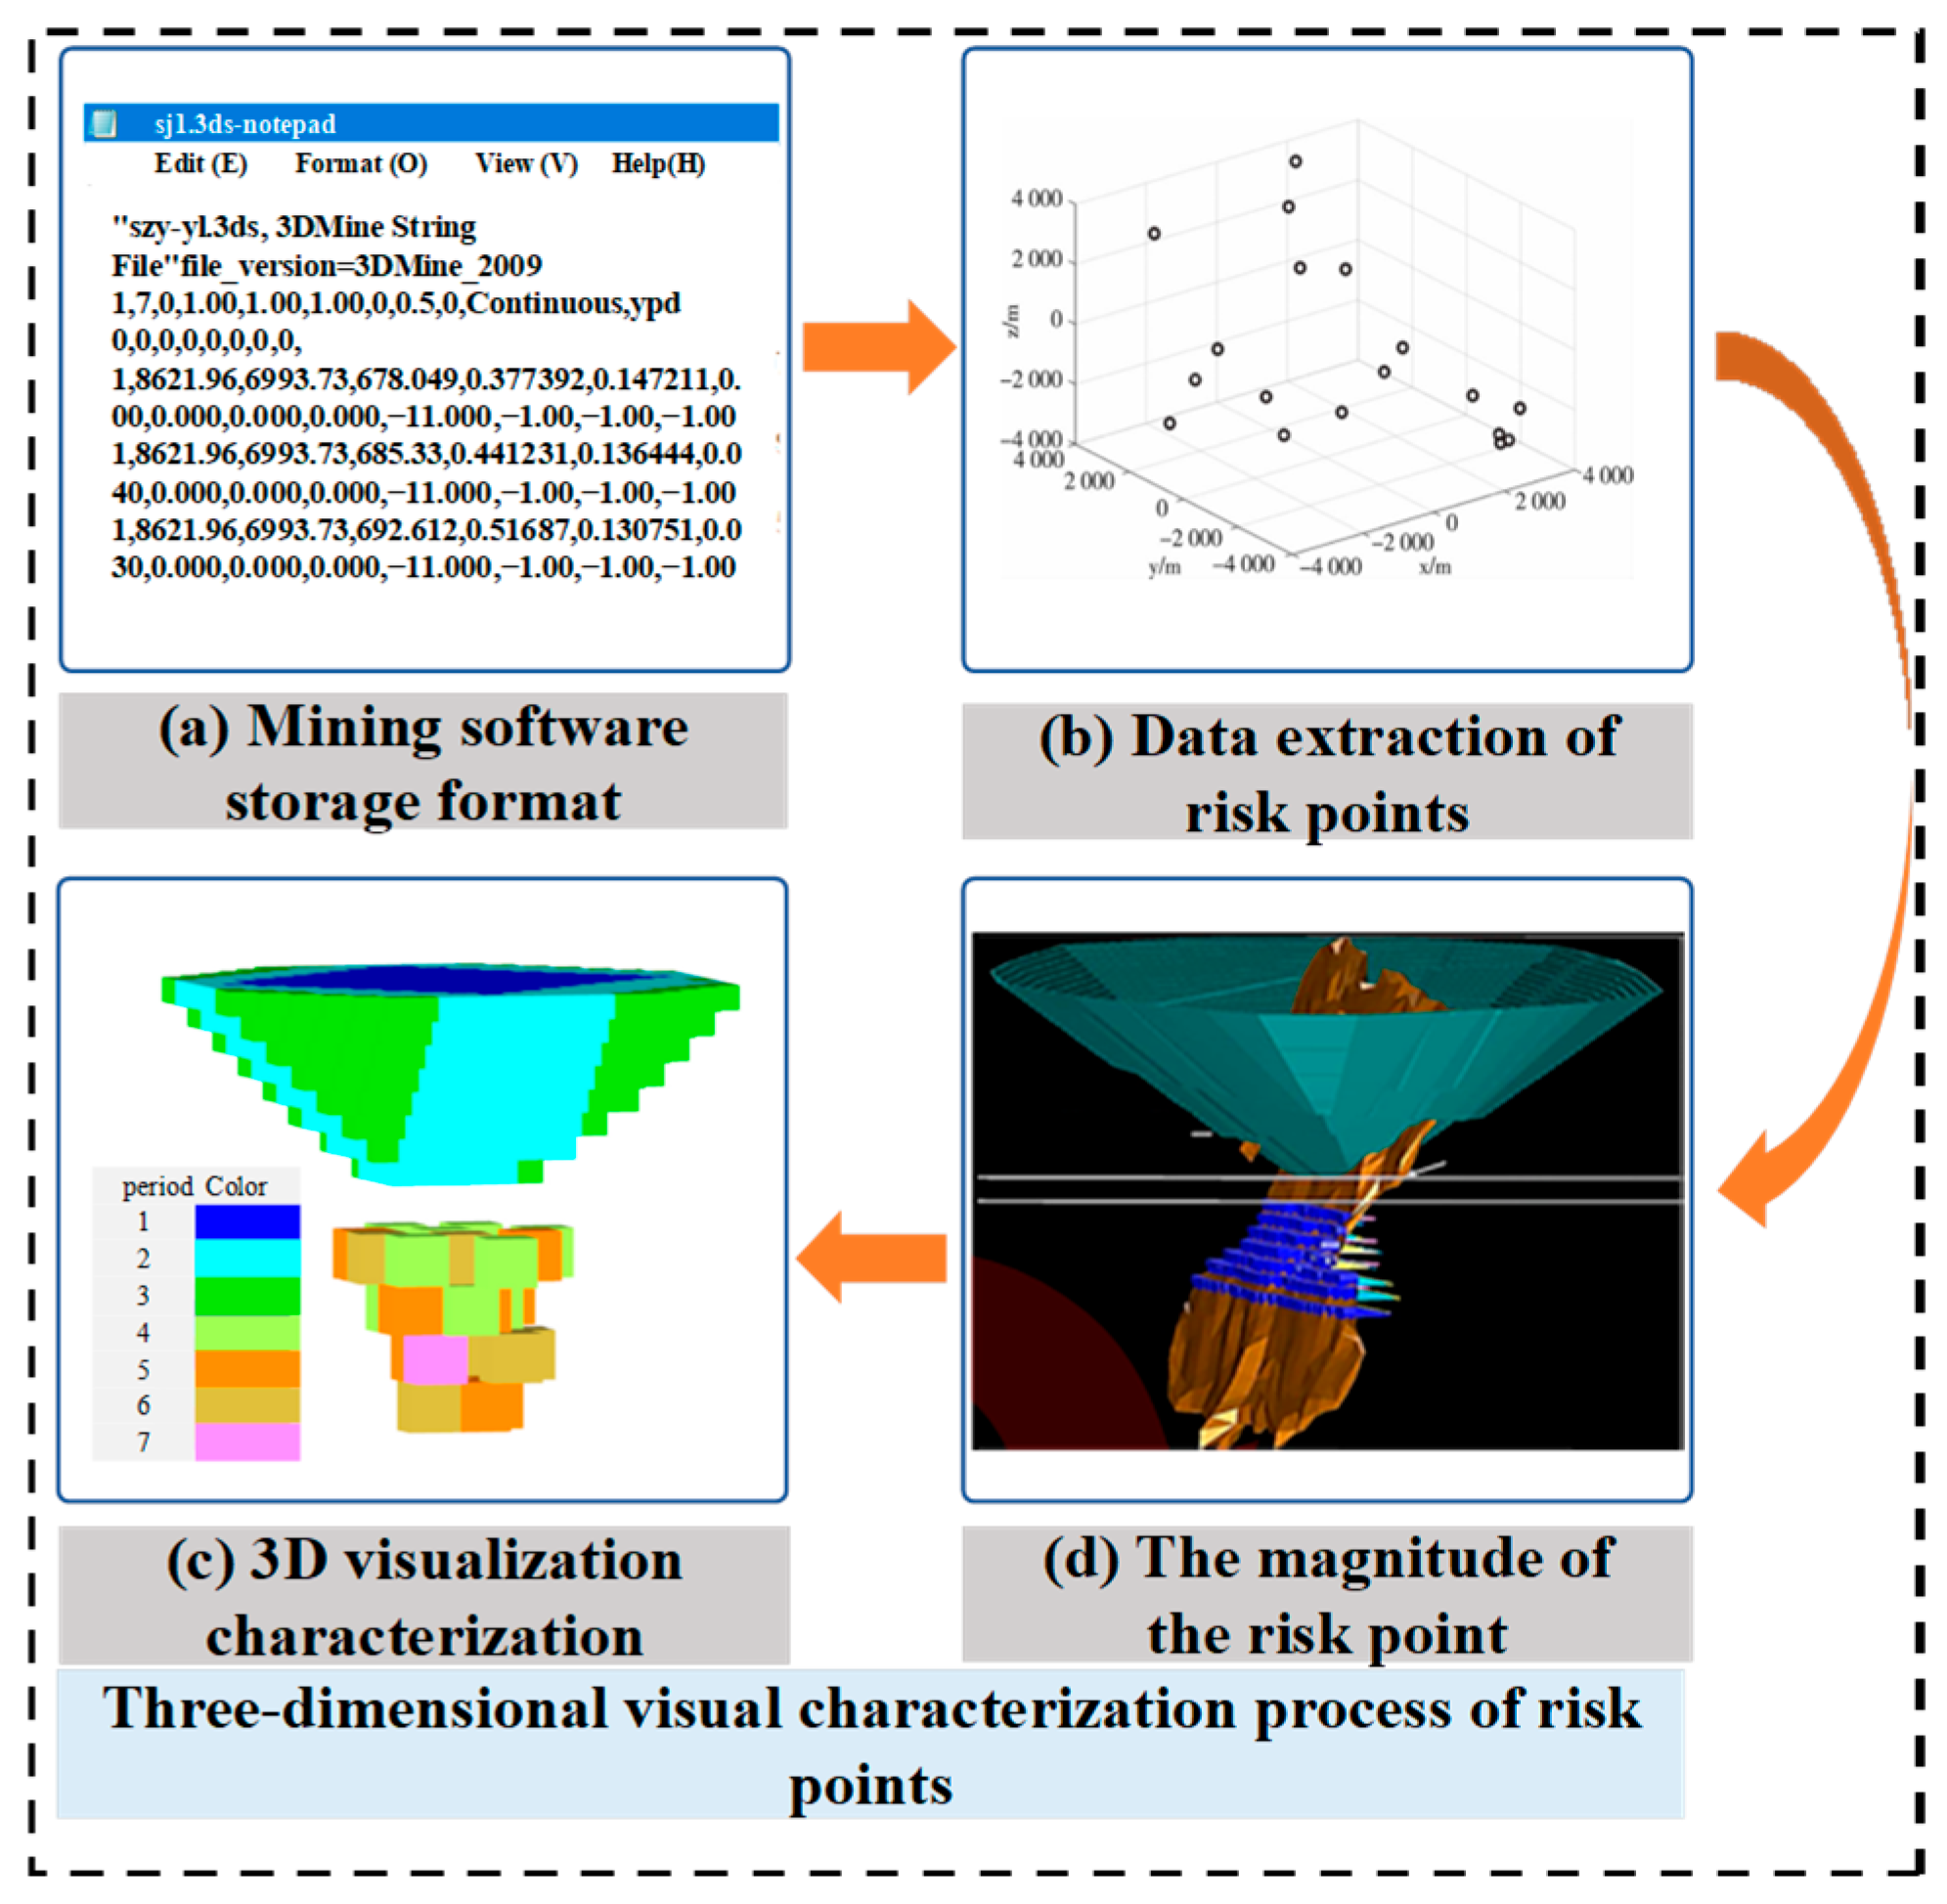
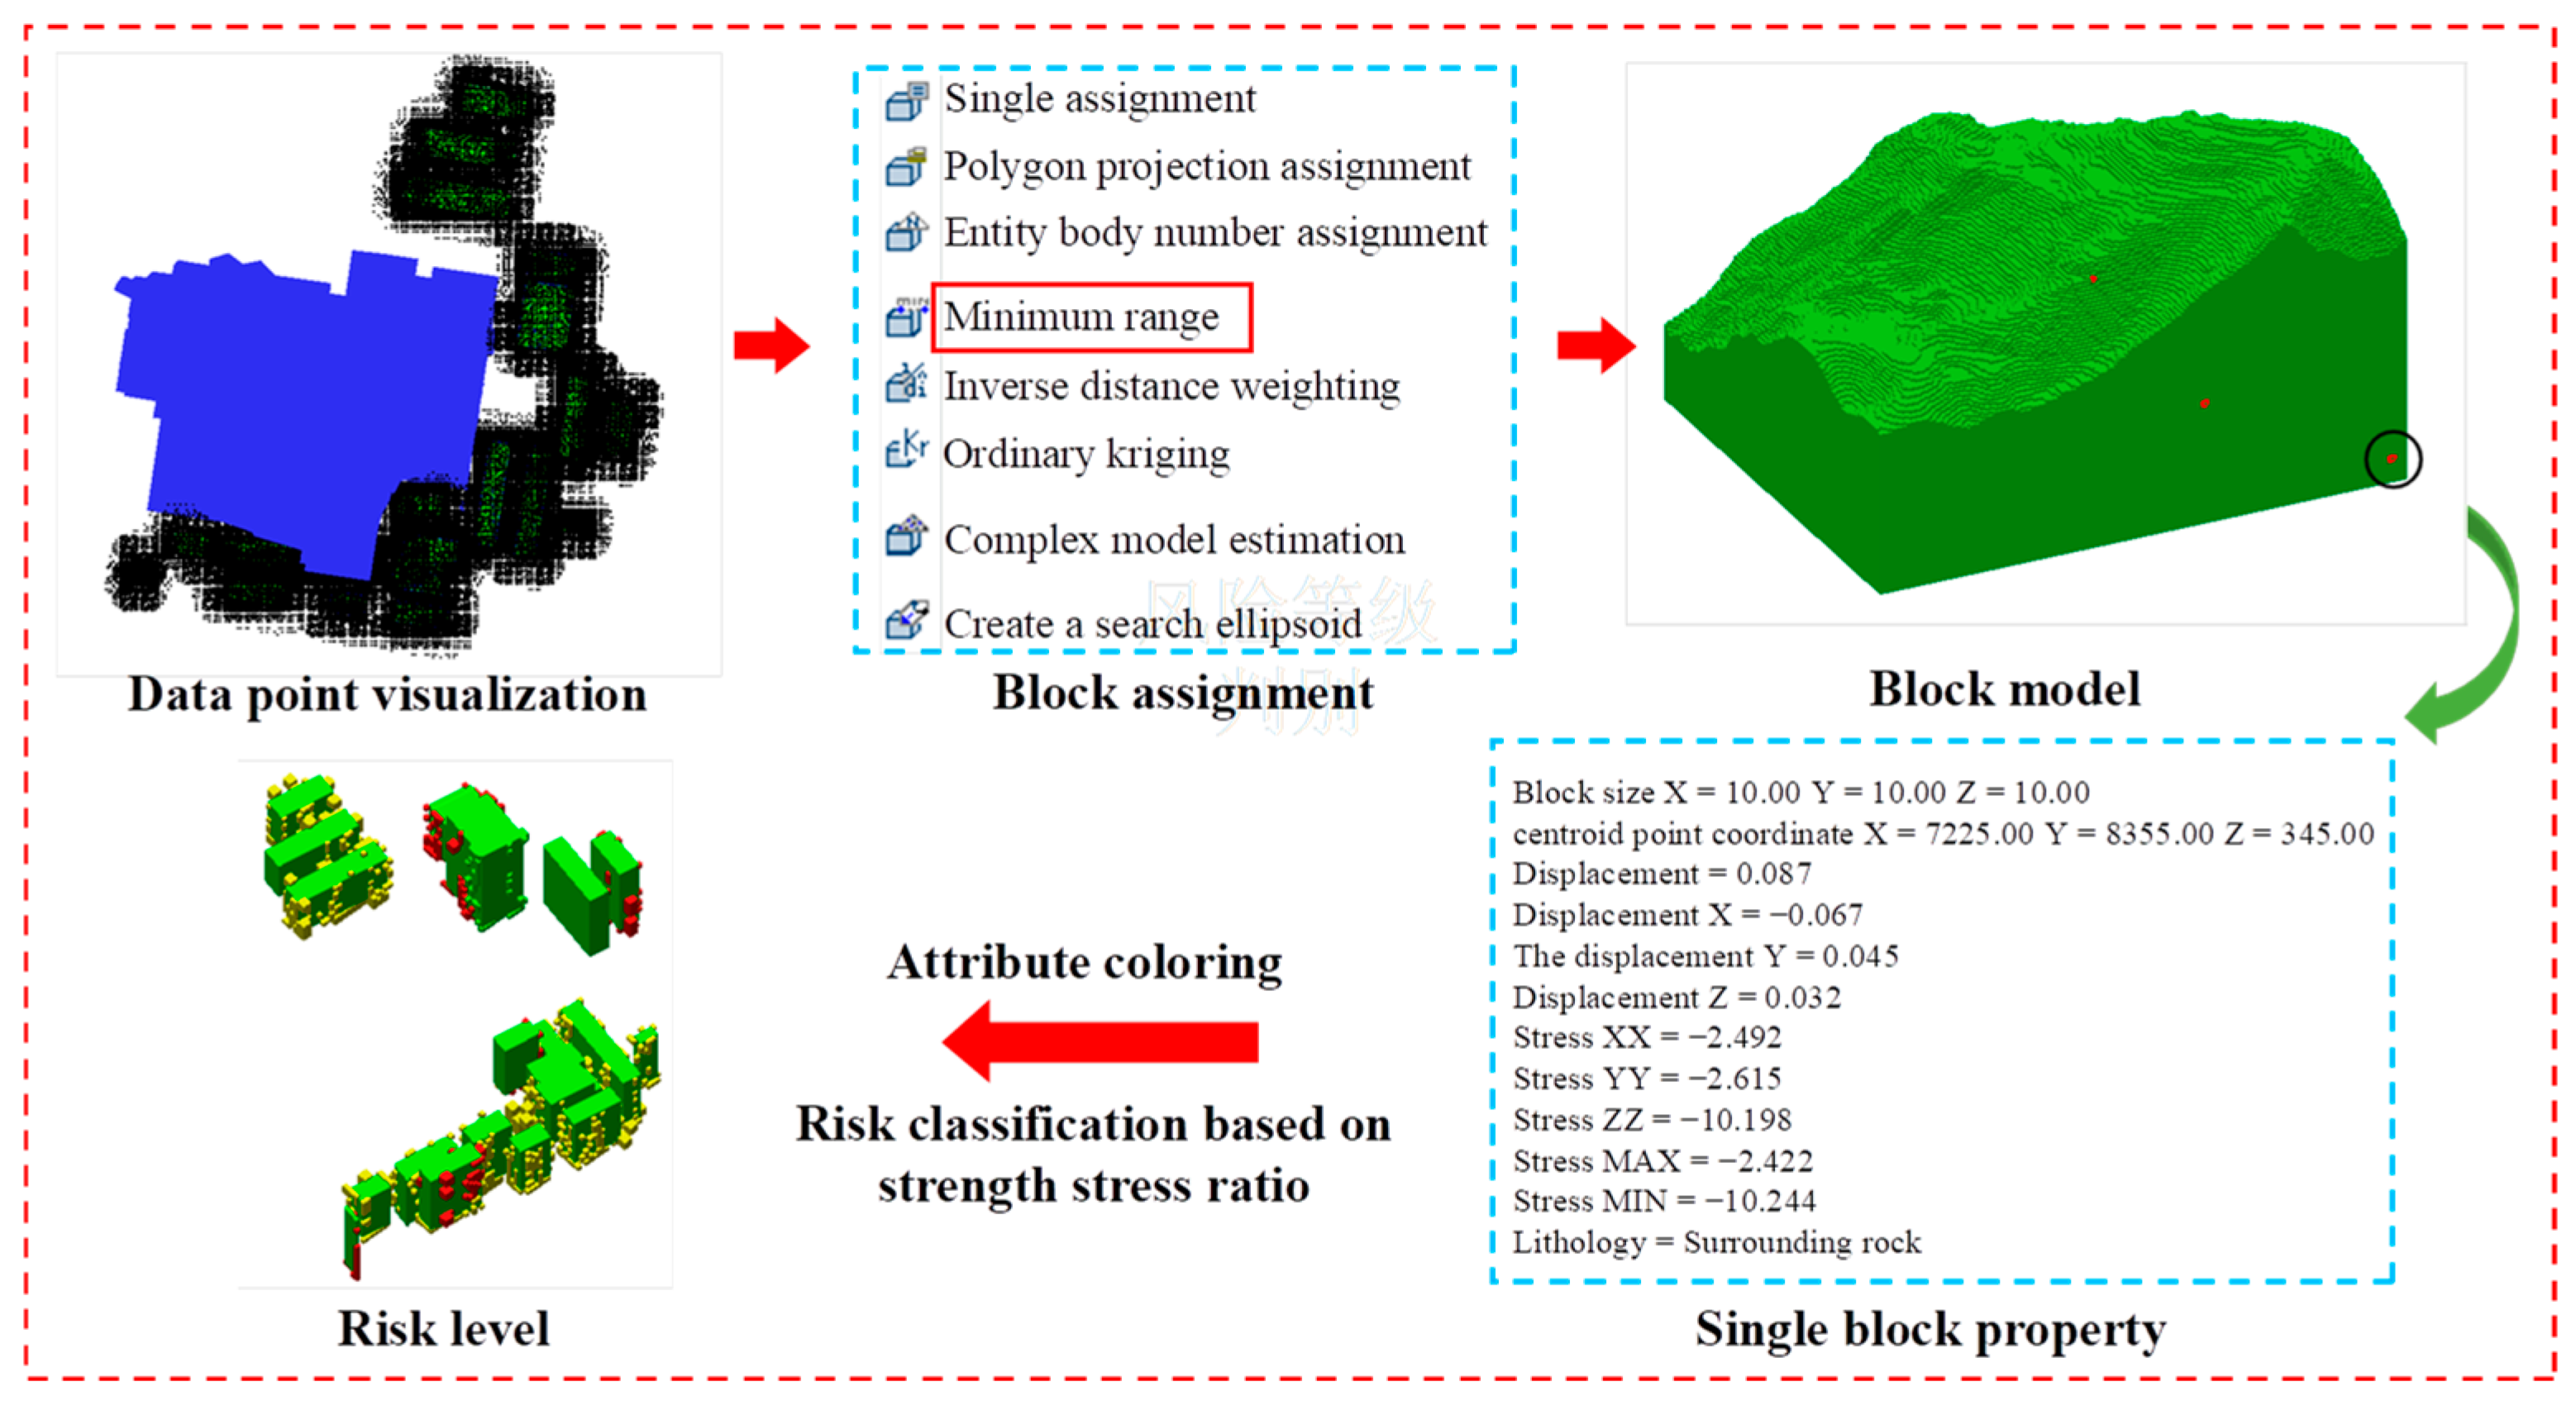
During mining, factors such as stress and displacement disturbances can lead to goaf collapse or slope instability. Therefore, risk classification and visual characterization provide a more intuitive way to identify and evaluate potential rock mass risk points. This section describes how, based on the results of numerical simulation risk analysis (Figure 5a), the three-dimensional coordinates of risk points are extracted (Figure 5b), and these risk points are marked in the three-dimensional digital model to create a visual representation of instability risk (Figure 5c,d). By integrating mining process data, the three-dimensional digital model is updated, followed by another round of numerical simulation to obtain the new risk point coordinates. These updated coordinates are then reintroduced into the digital model, enabling dynamic updates to the visual representation of risk points. This approach provides decision support for mine managers and technicians, as shown in Figure 5.

3.1. Data Extract

To achieve the three-dimensional visual representation of risk points, mechanical characteristic data such as displacement and stress are extracted from 3DEC software and assigned to the block model in 3Dmine. This enables the creation of a visual representation of the risk points. By understanding the data storage format of 3Dmine, the 3DEC numerical simulation data is imported into the block model.

3.1.1. 3Dmine File Data Format

The foundation of 3Dmine grade data characterization is the block model, which consists of a series of small cuboid units that can have attributes assigned. Within the block model, the properties of each rock mass can be queried and displayed. Depending on the specific requirements of the project, rock mass properties in the target area are visualized by applying constraints, solid constraints, cross-sections, elevations, or profiles. To study the attributes and their variations within the geological body, it is essential to assign the appropriate attribute values to the block model. Using lithology and sample data from the borehole database, a geostatistical method is applied to estimate and compute the attributes of the block model.
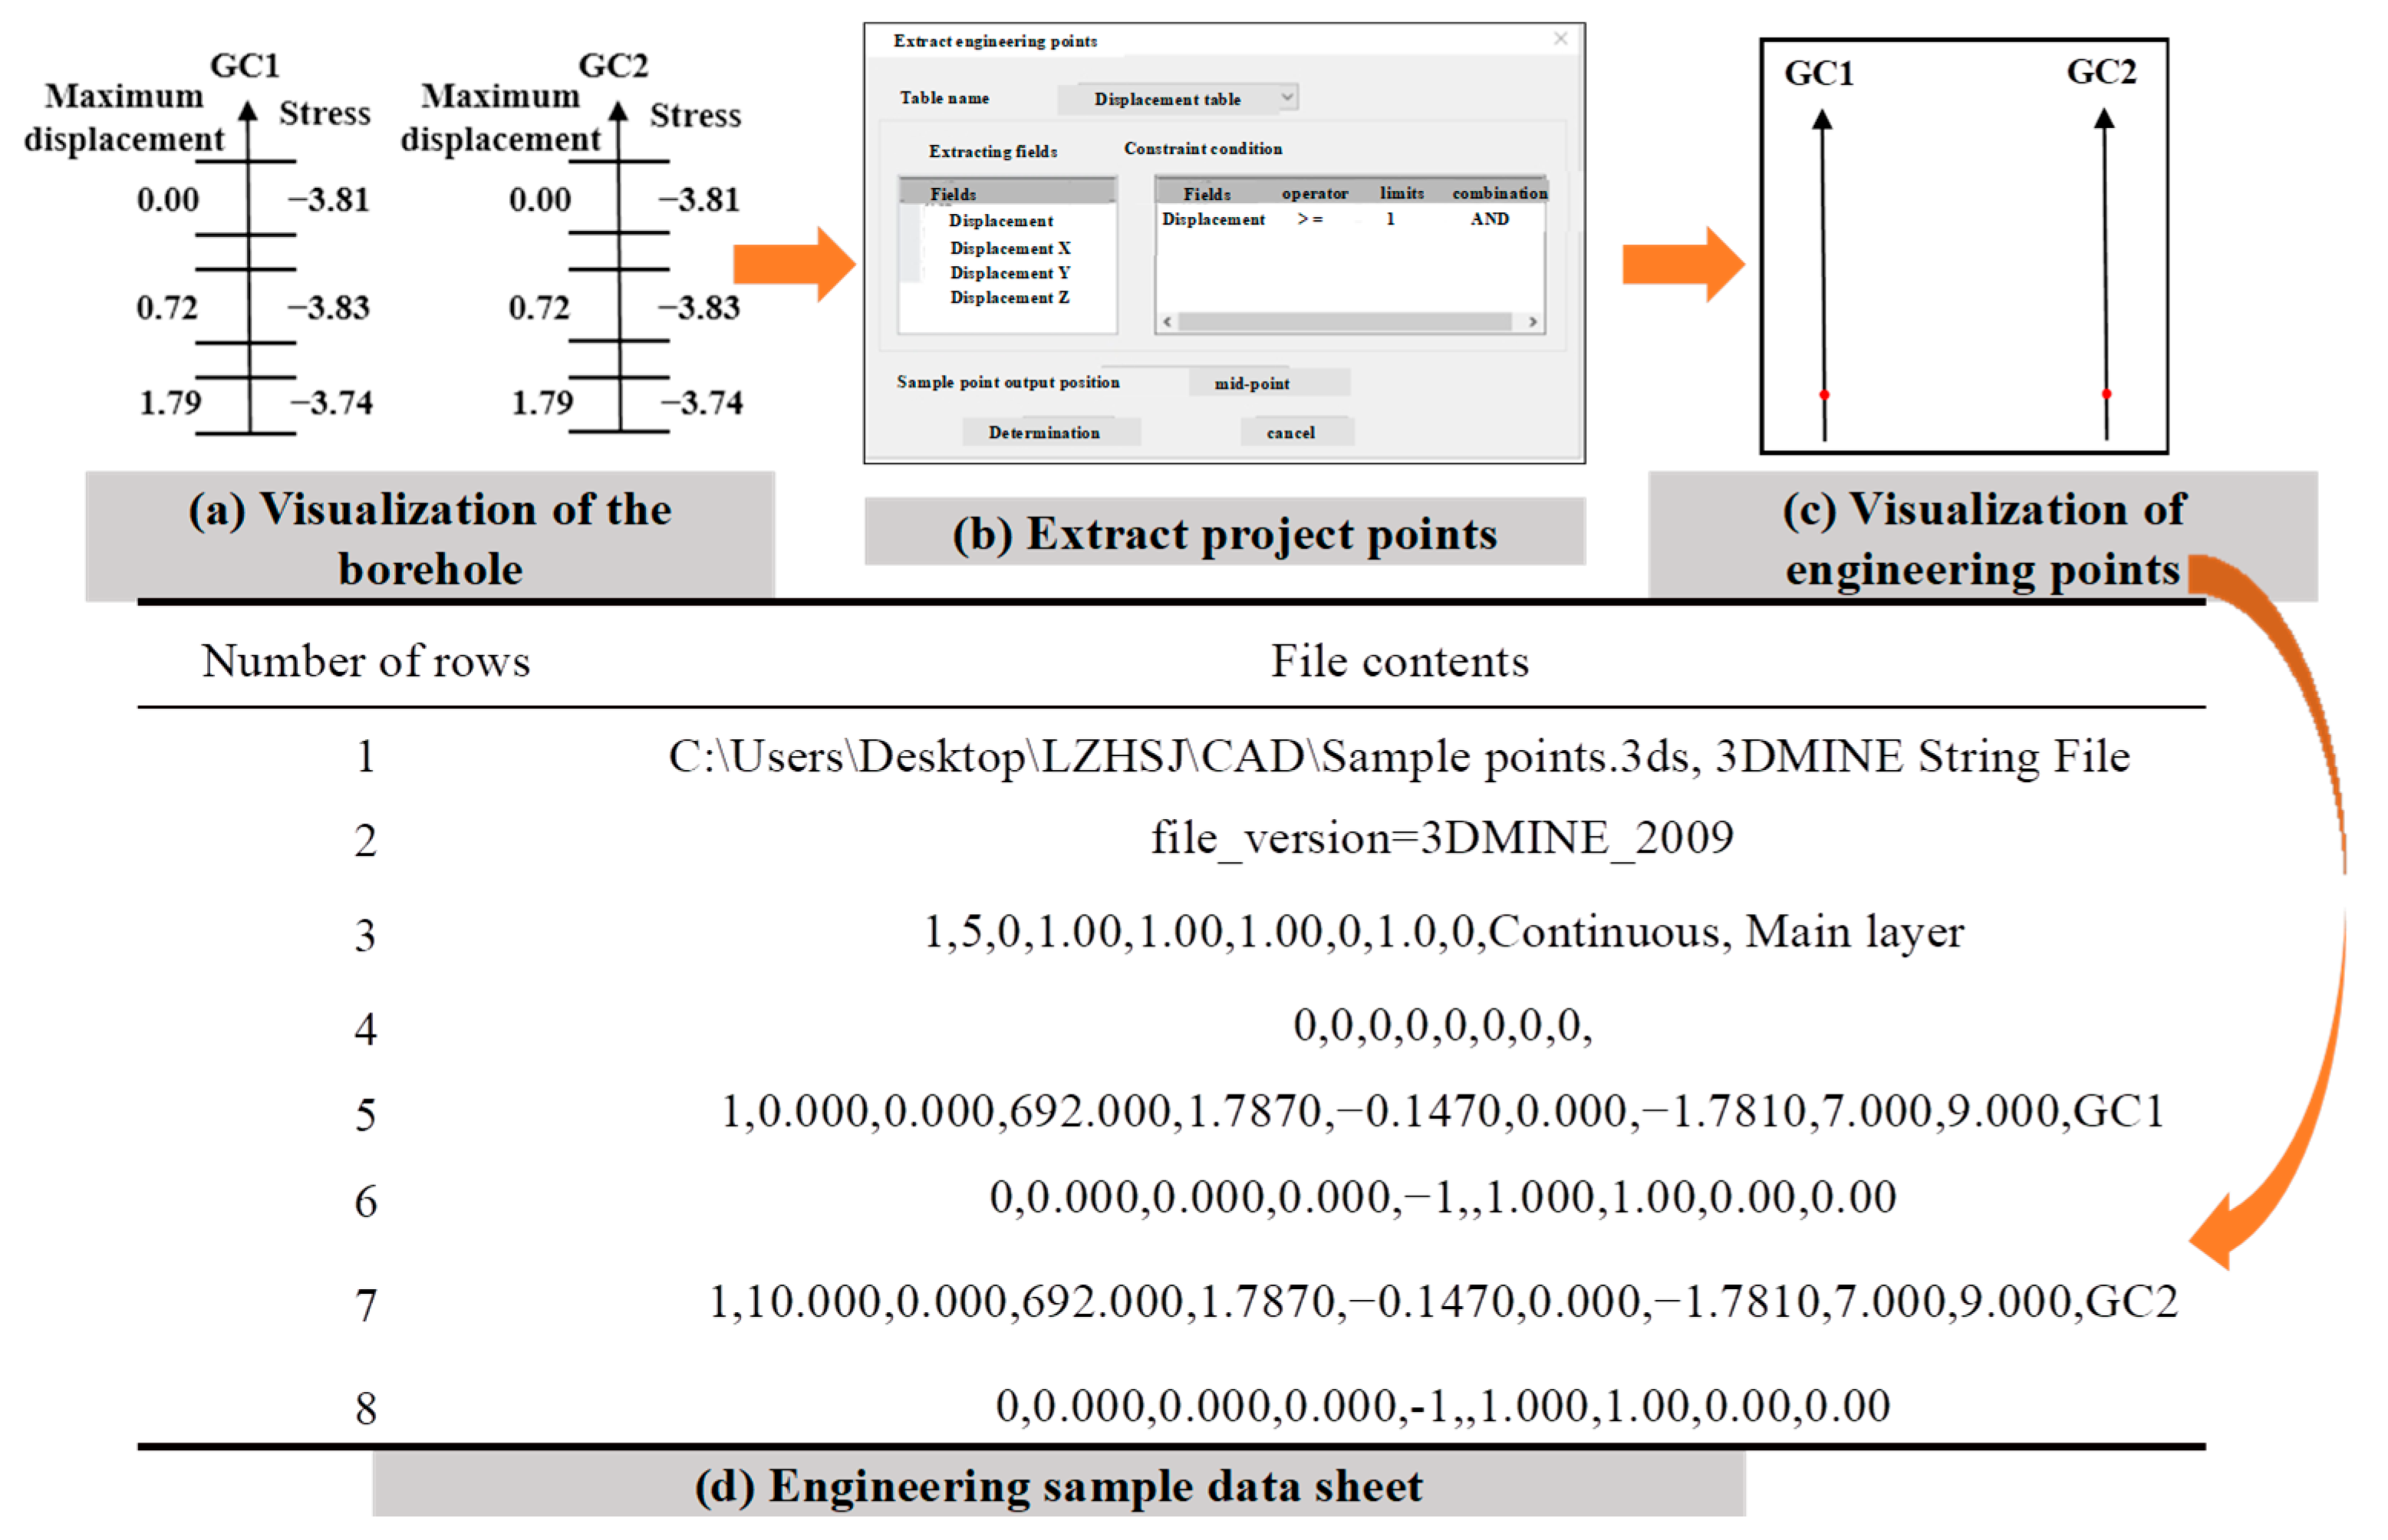
Using data from numerical simulation software, a virtual borehole representing the mechanical characteristics of the rock mass is constructed, and a data file in the form of a borehole database is generated. This file accurately describes the stress distribution and mechanical properties within the mining area. The data storage format for risk point visualization in 3Dmine software is outlined as follows: (1) Borehole database analysis: Two boreholes, GC1 and GC2, are created in 3Dmine. Virtual mechanical parameters are assigned to these boreholes, generating the borehole database format, which includes tables for stress, orifice, inclinometer, displacement, and other data. (2) Engineering sample point file analysis: Using the 3Dmine block model assignment process, the “Extract Engineering Sample Points” function in the “Data Extraction” command of the “Drilling” feature is employed to generate the necessary sample point data. This generates both the drilling and engineering sample points, along with their respective data tables, as shown in Figure 6. (3) Display settings for engineering sample points: Through the “Engineering Sample Point Display Settings,” relevant attributes, such as layer information, color, point marker size, and other display options, can be modified.

3.1.2. Data Extraction Using 3DEC

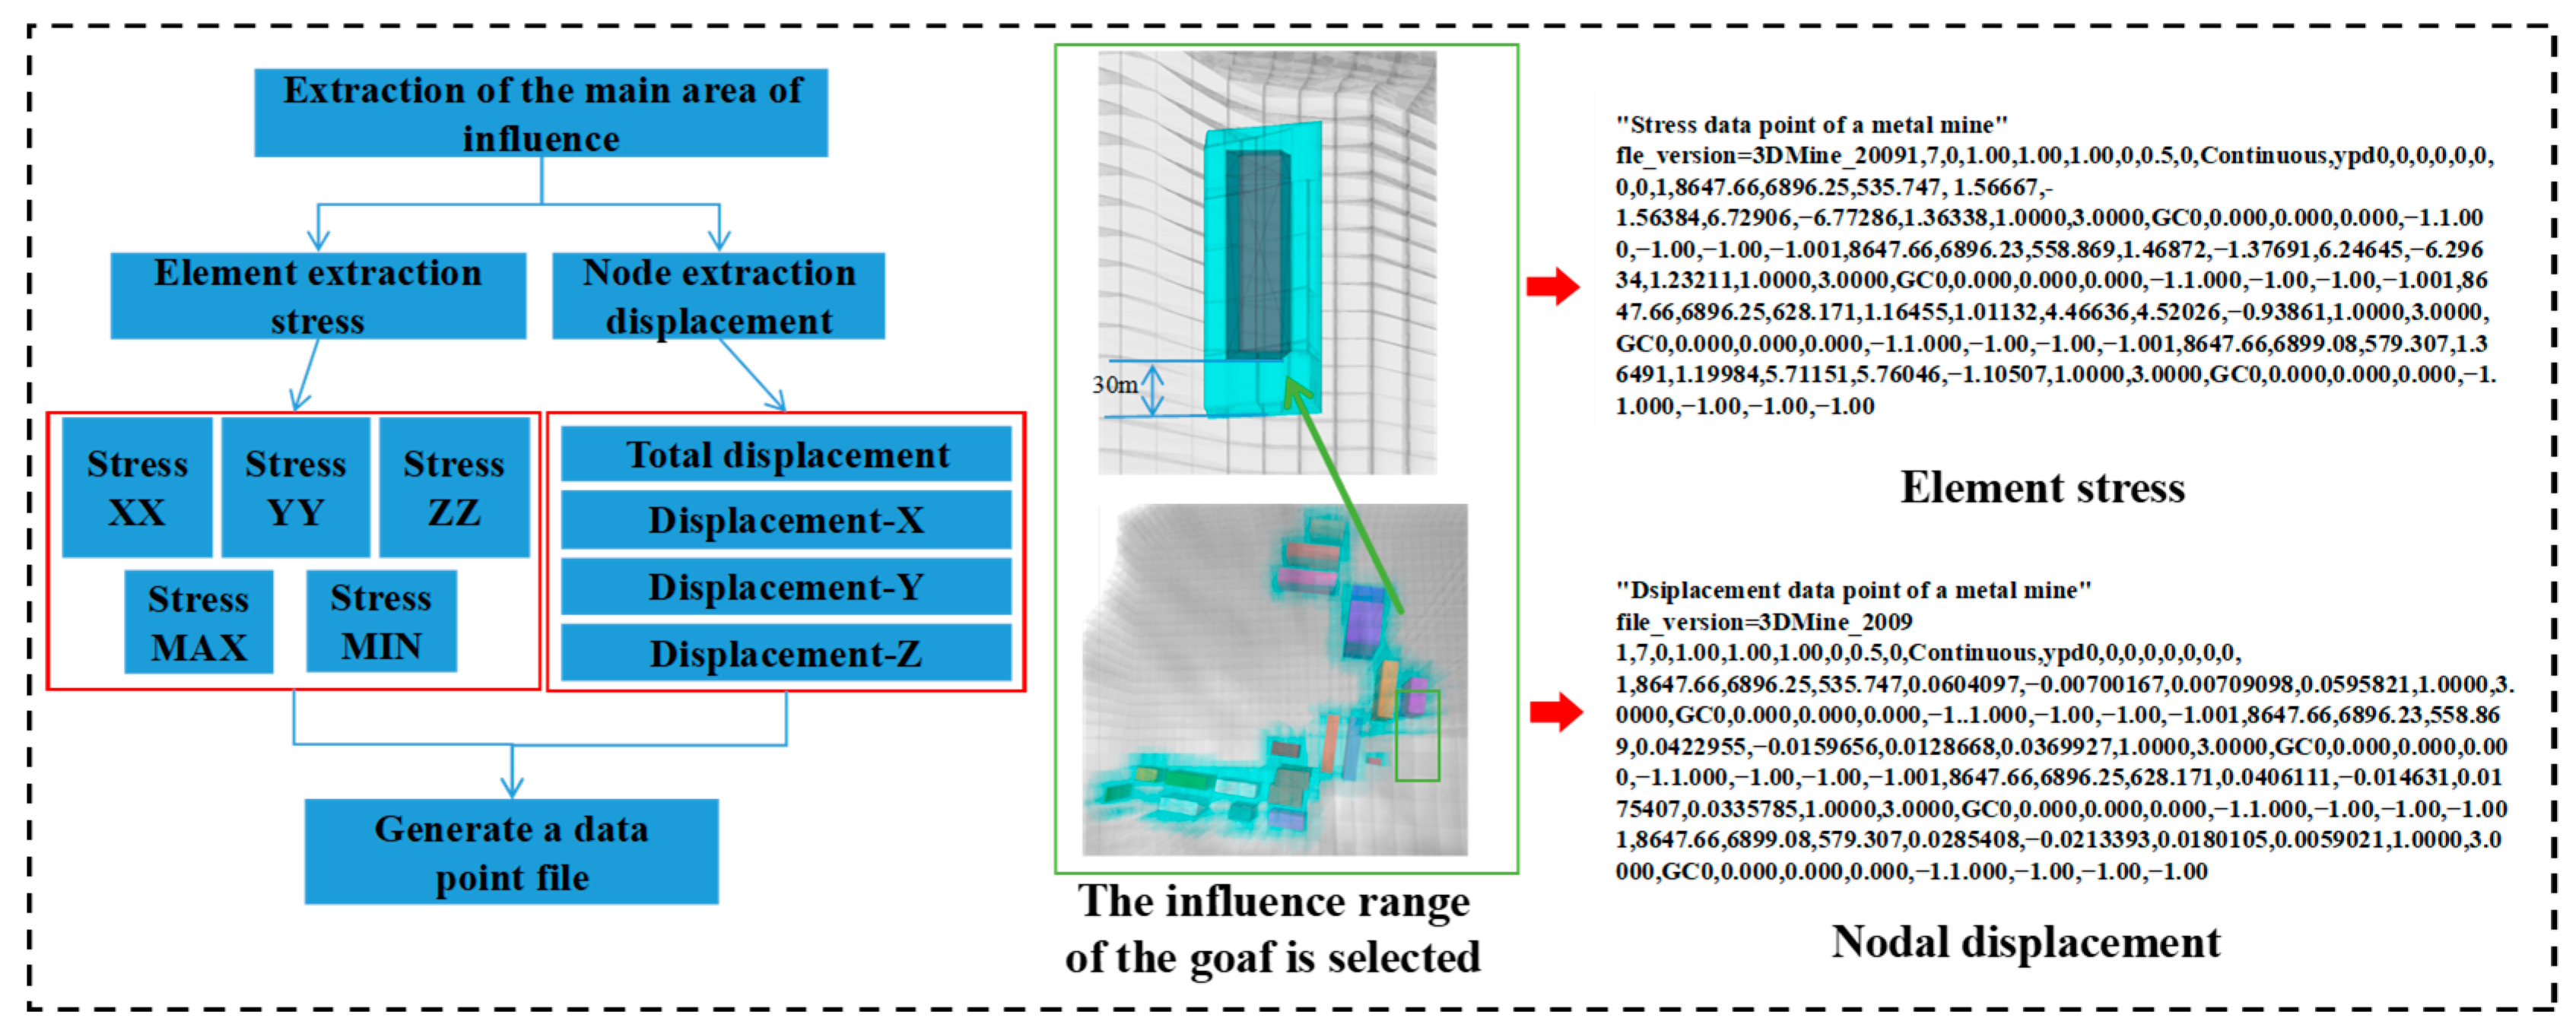
Based on the 3DEC numerical simulation results, virtual boreholes are generated, and sample point files are created in the required format to enable the reading function of 3Dmine entity files. Using the 3DEC numerical simulation results, this study selects the relevant working area with the built-in FISH language, reads the mechanical characteristic data, and generates the engineering sample point file according to the specified data format. The extraction process is illustrated in Figure 7.
(1) Work Area Selection: The numerical simulation results are analyzed to determine the appropriate distance, which defines the main influence range of engineering activities. The data extraction range is then set based on the geometry-distance parameters in 3DEC software. (2) Data Reading Development: In the built-in FISH language of 3DEC numerical analysis software, stress and displacement data stored in corresponding units and nodes can be accessed through correlation functions. Using the “loop foreach” function, the unit list (block.zone.list) within the work area is iterated over. The “pos” function retrieves the (X, Y, Z) coordinates of each unit, while the block.zone.stress commands are used to read the stress data for each unit. The “loop foreach” function is then used to iterate over the node list (block.gp.list) within the work area. The “pos” function retrieves the (X, Y, Z) coordinates of each node, and the block.gp.disp commands are used to access the stress data for each node, thus completing the data reading development, as shown in Figure 7. (3) Sample point data file generation. Using 3DEC’s file function, the reading and writing of text files are enabled through the file.write command, and the file is given a name. Once all data is extracted, the resulting (.3ds) file can be opened in 3DMINE for subsequent 3D visualization.

3.1.3. Mechanical Feature Point Extraction

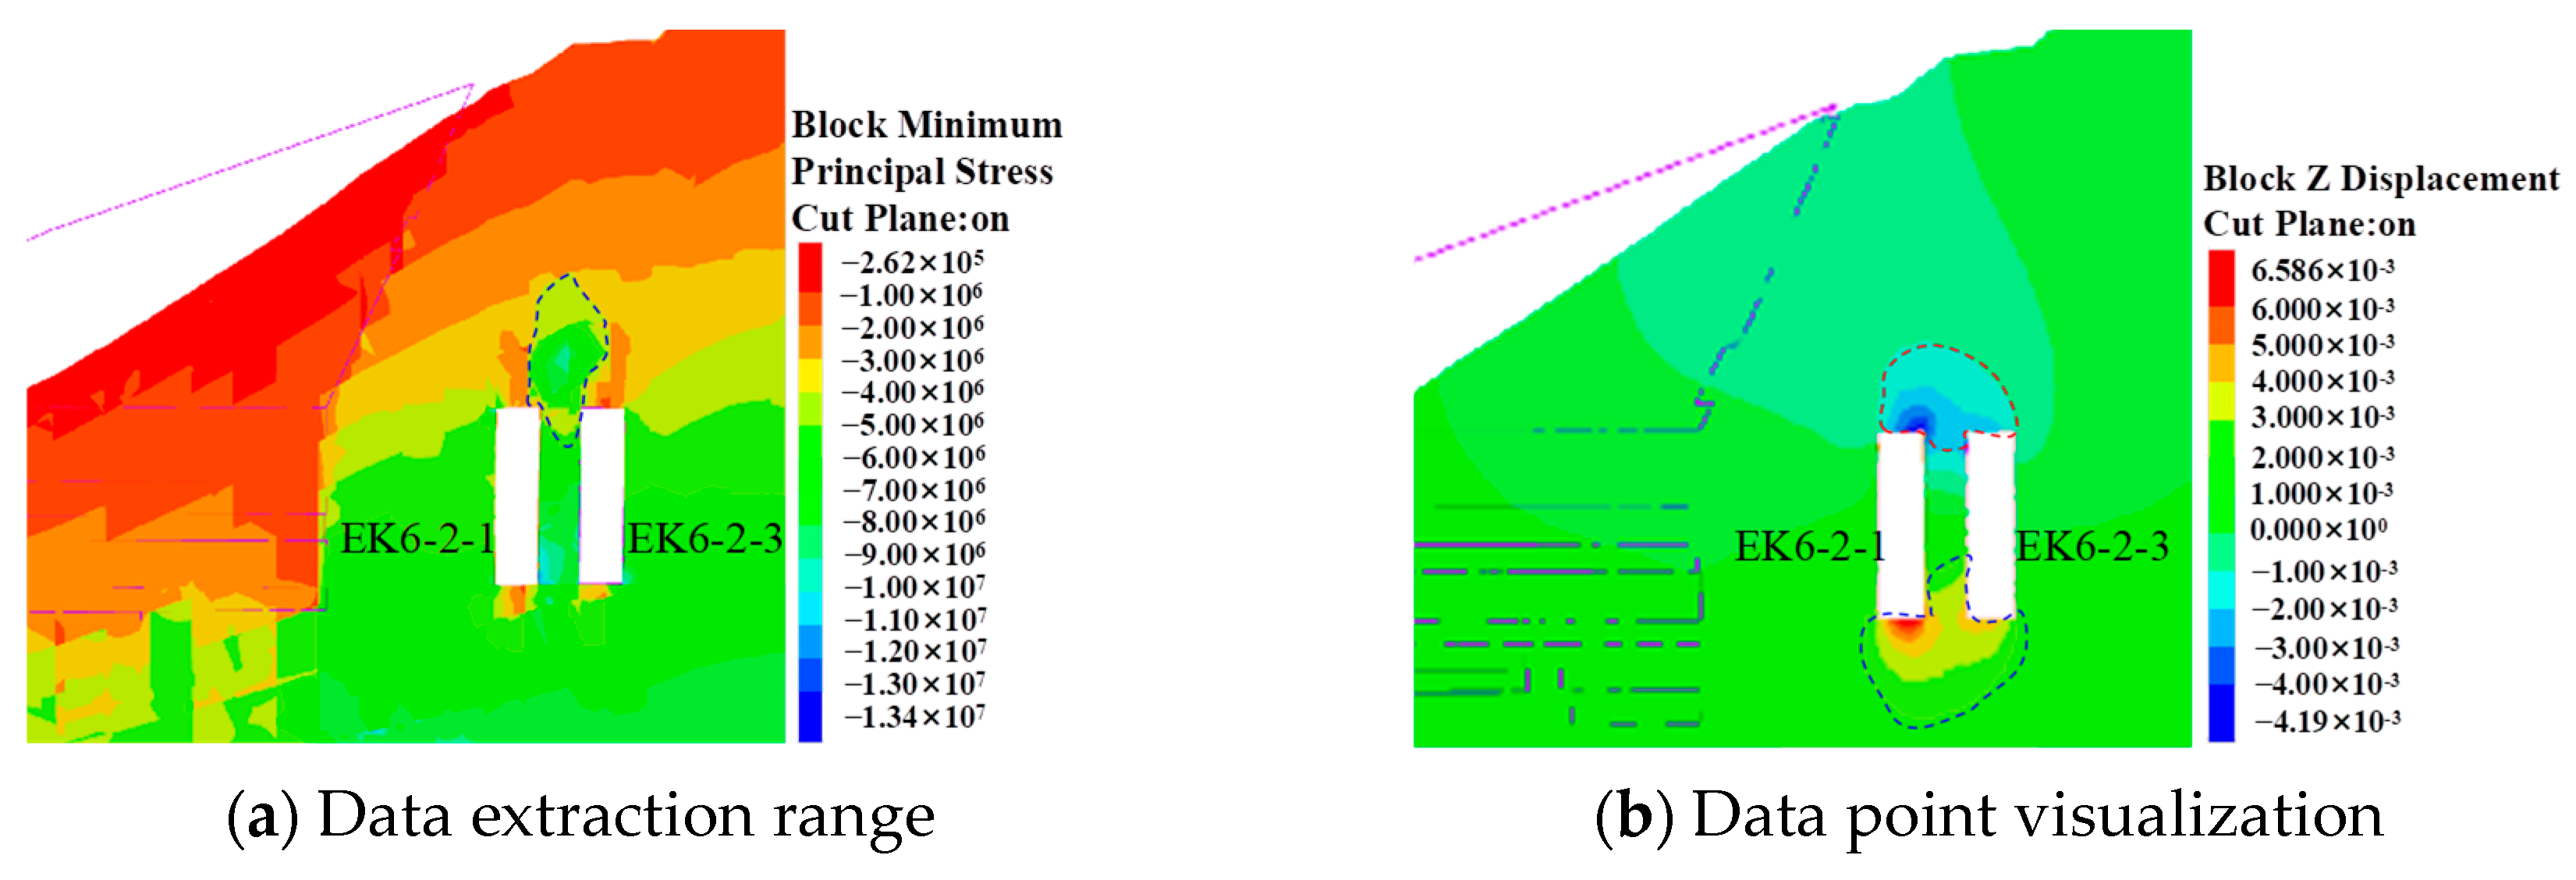
Based on the numerical model established in Section 2, this subsection simulates the goaf excavation process and analyzes the resultant stress and displacement characteristics in the surrounding rock mass. Figure 8 illustrates the distribution of stress and displacement in the rock mass surrounding the mined-out goaf. In Figure 8a, a distinct zone of stress concentration and redistribution is evident within 30 m above the goaf roof, with stress values ranging from 4 to 6 MPa. Figure 8b indicates that the maximum displacements, approximately 0.42 cm and 0.66 cm, occur at the roof and floor of boreholes EK6-2-1 and EK6-2-3, respectively. Displacement attenuates rapidly with distance from the roof and floor. Beyond this 30 m distance, displacement stabilizes, indicating that the region is minimally affected by mining-induced disturbances. Therefore, the area within a 30 m radius of the goaf is identified as the core disturbance zone.
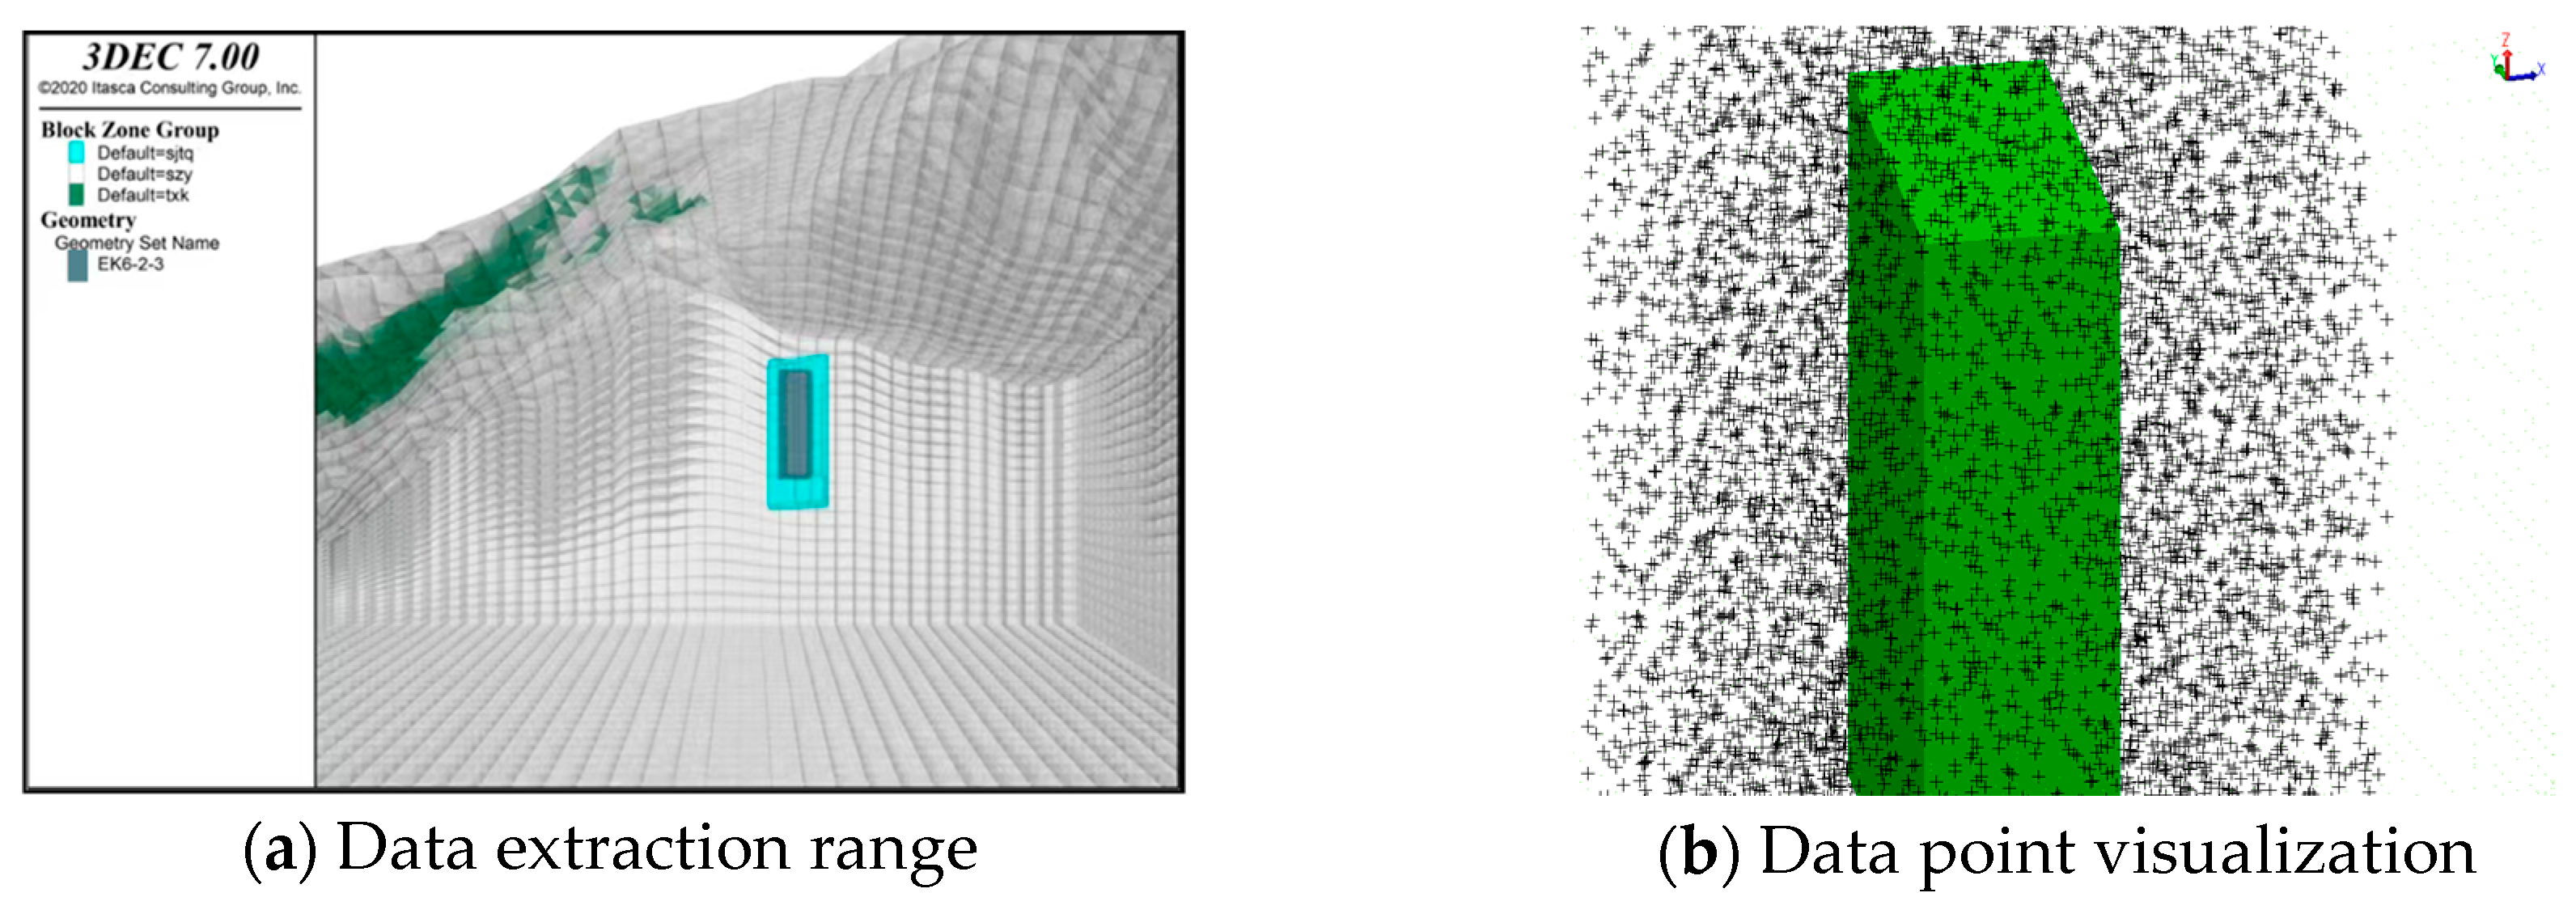
Based on the analysis of the numerical simulation results, a 30 m radius is determined as the main influence range of goaf excavation. As shown in Figure 9a, the data extraction range is defined by dividing the model. As shown in Figure 9b, the minimum and maximum principal stresses, stresses in the XX, YY, and ZZ directions, and displacements (including total displacement and displacements in the X, Y, and Z directions) are extracted for each unit, resulting in a total of 57,680 data points. Stress and displacement data control point files are generated in 3Dmine format, and the boreholes are visualized within 3Dmine.

3.2. Interactive Interface Development

This study uses a mine as the engineering background and, based on Python, redevelops the 3Dmine software to construct a data interaction interface with the 3DEC discrete element analysis software. By integrating the technical advantages of various software, this study implements the embedded application of numerical simulation in the mining planning process, providing reliable data support for mine engineering decision-making. This study’s secondary development leverages the application programming interface (API) of 3Dmine software. While maintaining the core architecture of the system, the software’s functions are optimized and expanded. This development approach ensures system stability and significantly enhances the software’s professional applicability.

3.2.1. Secondary Development of 3Dmine

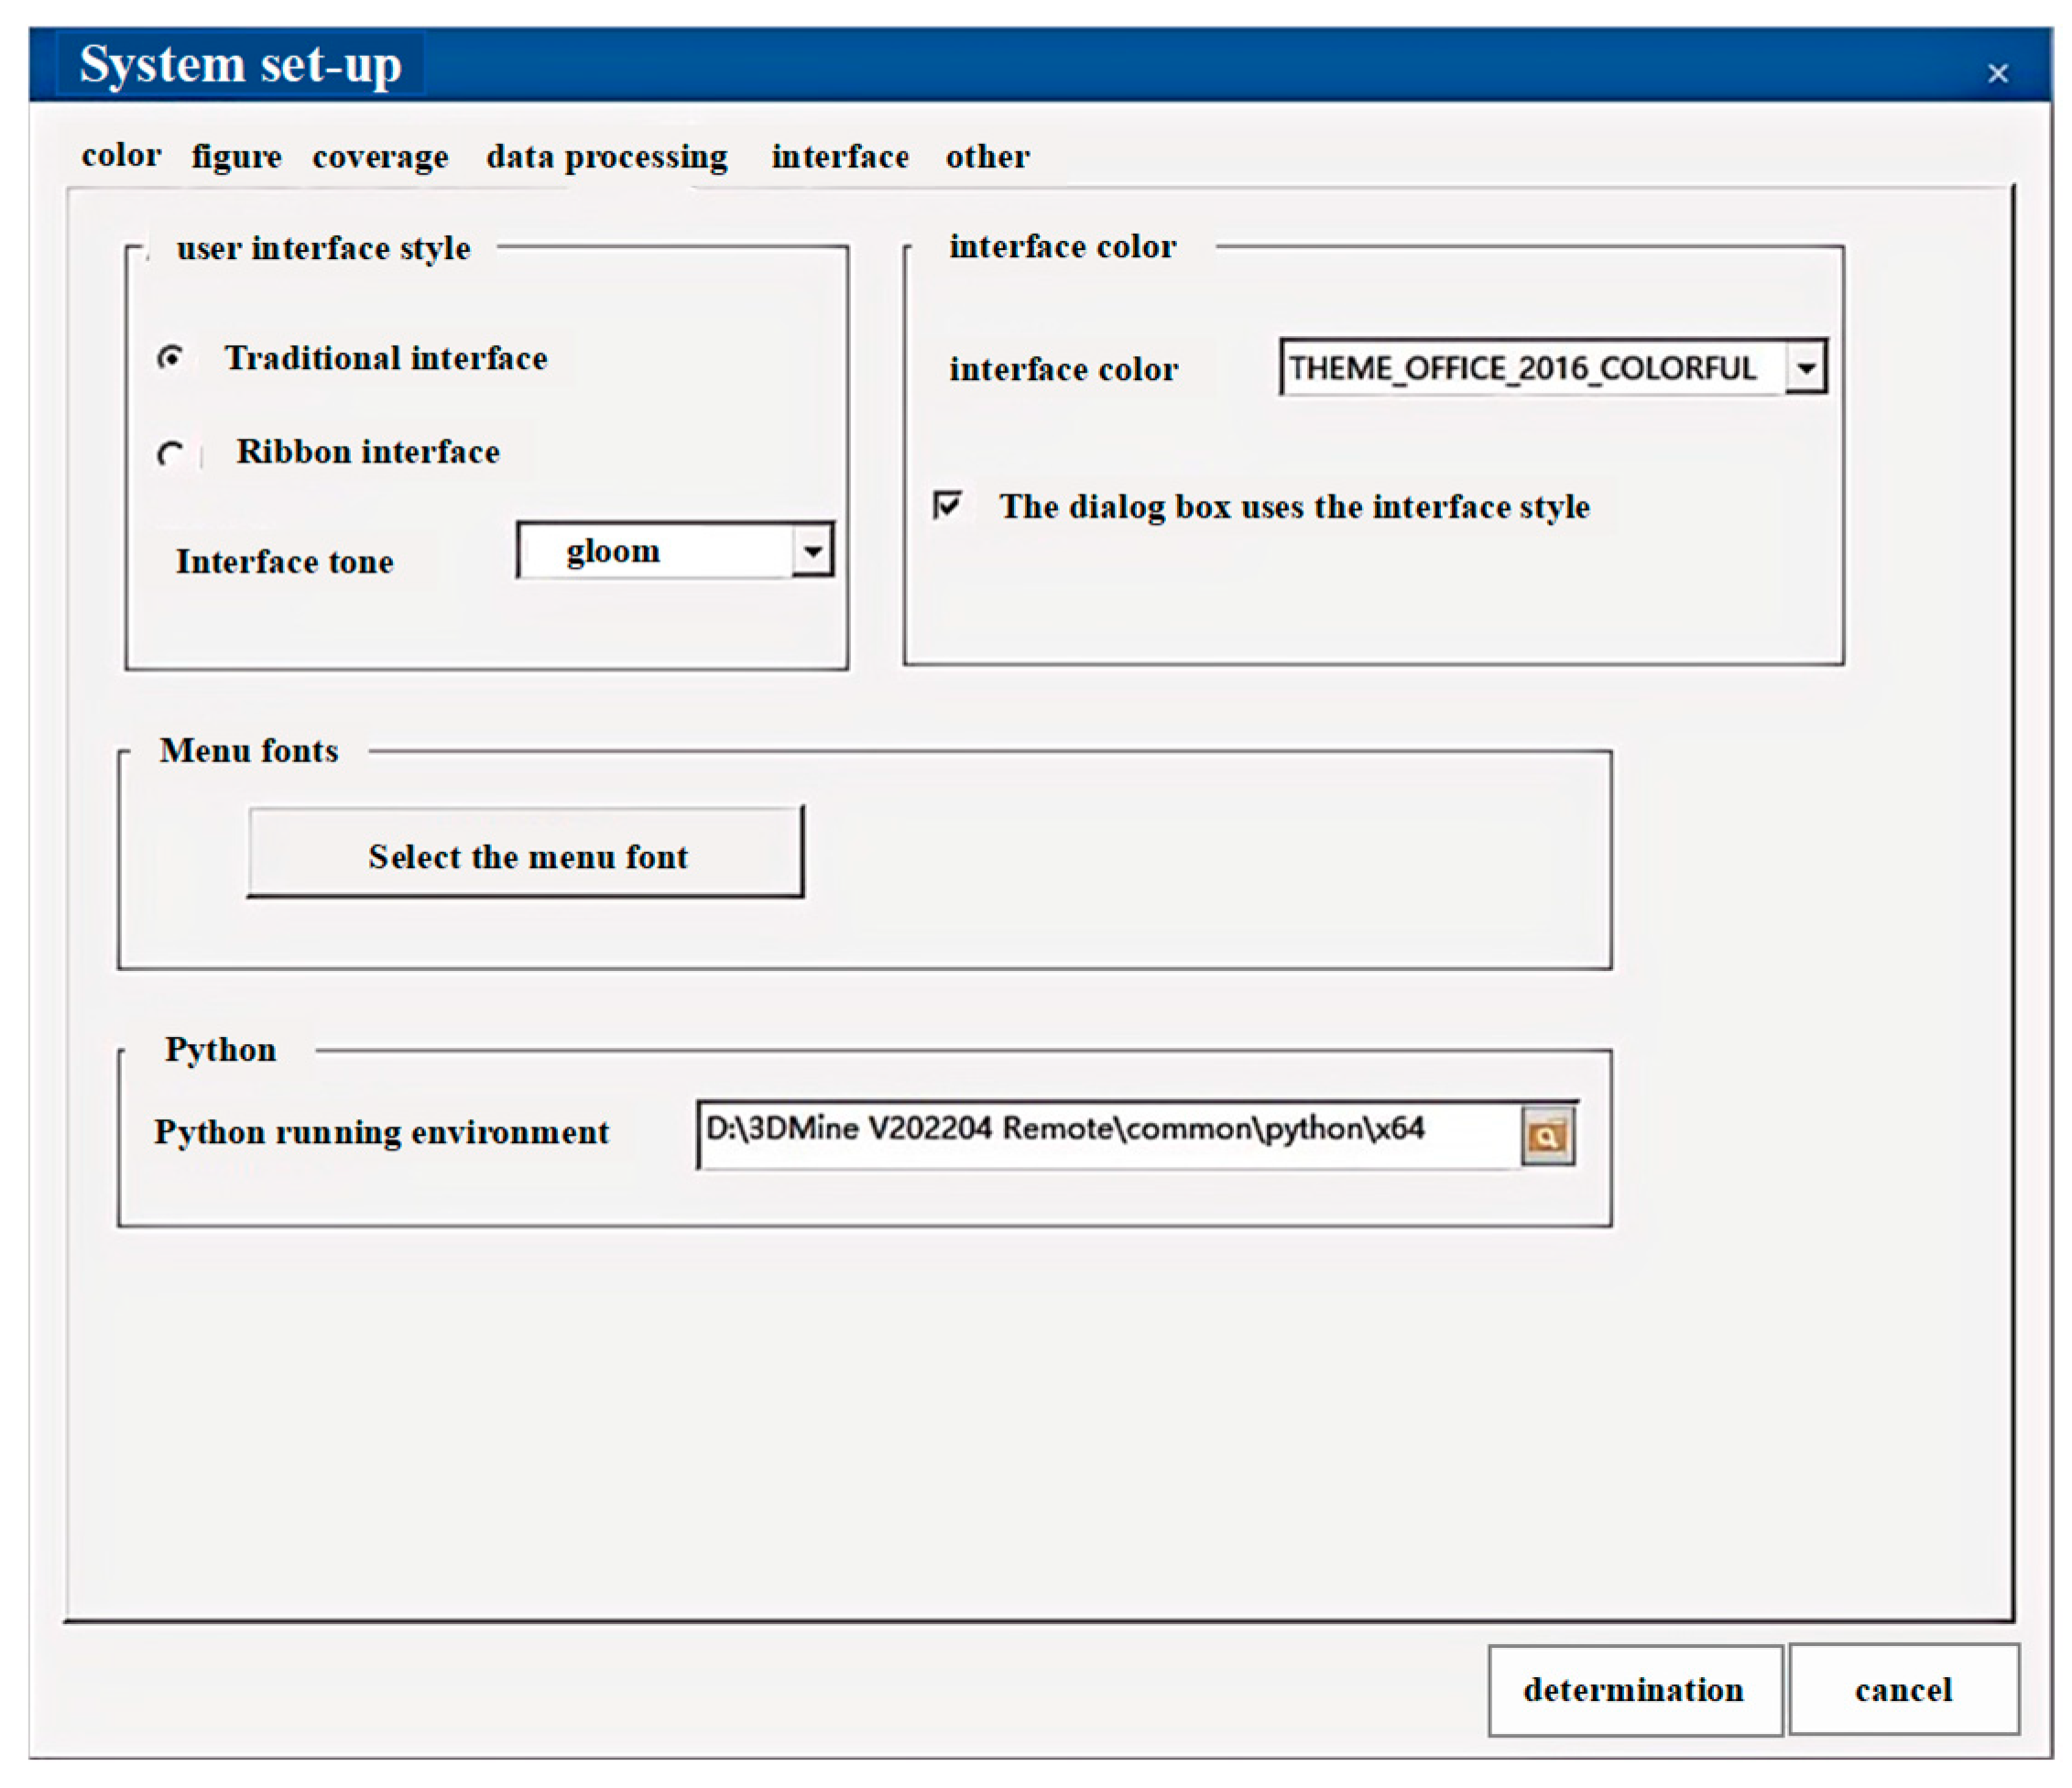
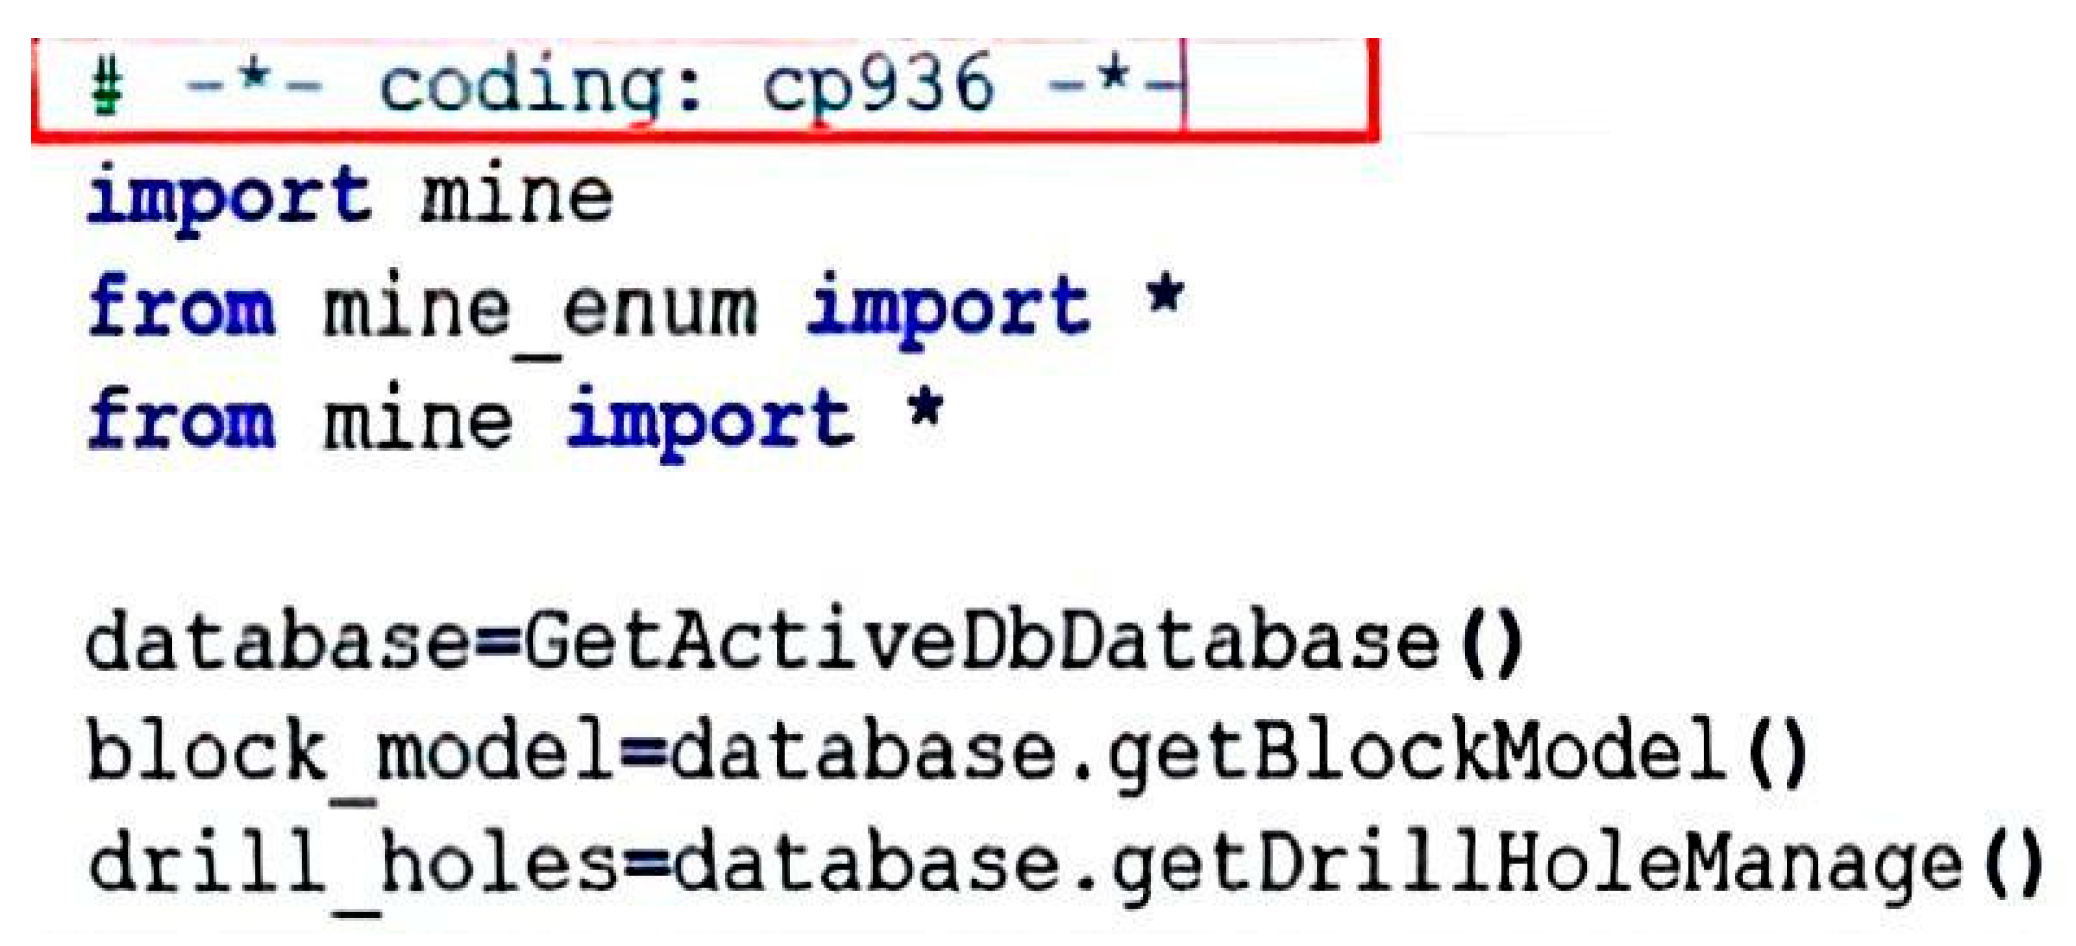
The 3Dmine software supports Python-based secondary development. By default, it integrates the Python 3.x interpreter and allows users to customize the interpreter path in the system settings. If the path is invalid, the script will not execute. Alternatively, the user can run the Python program by dragging the .py file onto the graphical interface or by double-clicking the script file, as shown in Figure 10. To simplify the secondary development process, the software offers a macro recording function that automatically converts user actions into Python code. Beginners can quickly learn programming conventions by analyzing the generated scripts. It is important to note that scripts generated by the macro recorder are in ANSI format and are encoded in GBK by default, as shown in Figure 11. Therefore, when editing, the encoding format must be preserved, and the corresponding declaration should be added to the first line of the file to ensure proper parsing and execution of the script.

3.2.2. Secondary Development of 3DEC

The 3DEC software is integrated into the Python programming environment, leveraging Python’s strengths in scientific computing and numerical simulation. Through Python extension development, users can directly control the numerical model, while maintaining compatibility with the traditional FISH language. Compared to FISH, Python offers improved execution efficiency (approximately a 10% performance boost), a more user-friendly development experience, and greater functional scalability. The key difference between the two is that the Python runtime state is independent of the model state. It does not reset with the “model new” command or during file saves, and only alters its behavior when a specific command is executed. Additionally, users can enhance computational efficiency by utilizing third-party Python modules like NumPy. For instance, converting FISH loop operations into array-based operations can greatly boost performance.

3.2.3. 3SQL Database Development

As specialized mining software, 3DEC and 3Dmine offer considerable value in their respective fields. While both support a Python programming environment, they cannot be directly integrated due to the embedded Python interpreter architecture. This design, though, ensures software stability but limits the systems’ ability to interact with each other. The specific implementation methods are as follows: (1) Establish a standardized database structure to store the key parameters of 3DEC numerical simulations and 3Dmine mining designs; (2) Develop a custom Python interface to enable two-way data transmission between the database and the two software programs; (3) Use SQL query optimization techniques to support data retrieval and analysis under complex conditions. Experiments show that this approach not only preserves the stability of the original system but also improves work efficiency by approximately 25% through automated data flow, particularly in large-scale collaborative design for mine engineering. All tests in this study were conducted on a unified hardware platform (specifications: AMD EPYC 7532 32-core processor (AMD, Santa Clara, CA, USA), 128 GB DDR4 RAM, NVIDIA GeForce RTX 3060 Ti GPU (Samsung Electronics, Suwon, Republic of Korea), 2TB SSD storage). The entire workflow was completed in 2.4 h, with data processing fully automated and requiring no manual intervention. In contrast, the computational cost of the conventional approach is incurred predominantly during data processing, which involves manual operations such as format conversion, repeated data import/export, and verification and cross-checking. Consequently, the conventional workflow required 3.2 h. It should be noted that this time comparison is specific to the hardware configuration employed; computational times may vary on systems with different performance. This innovative method offers a new technical approach for mining software integration and holds significant engineering application value.
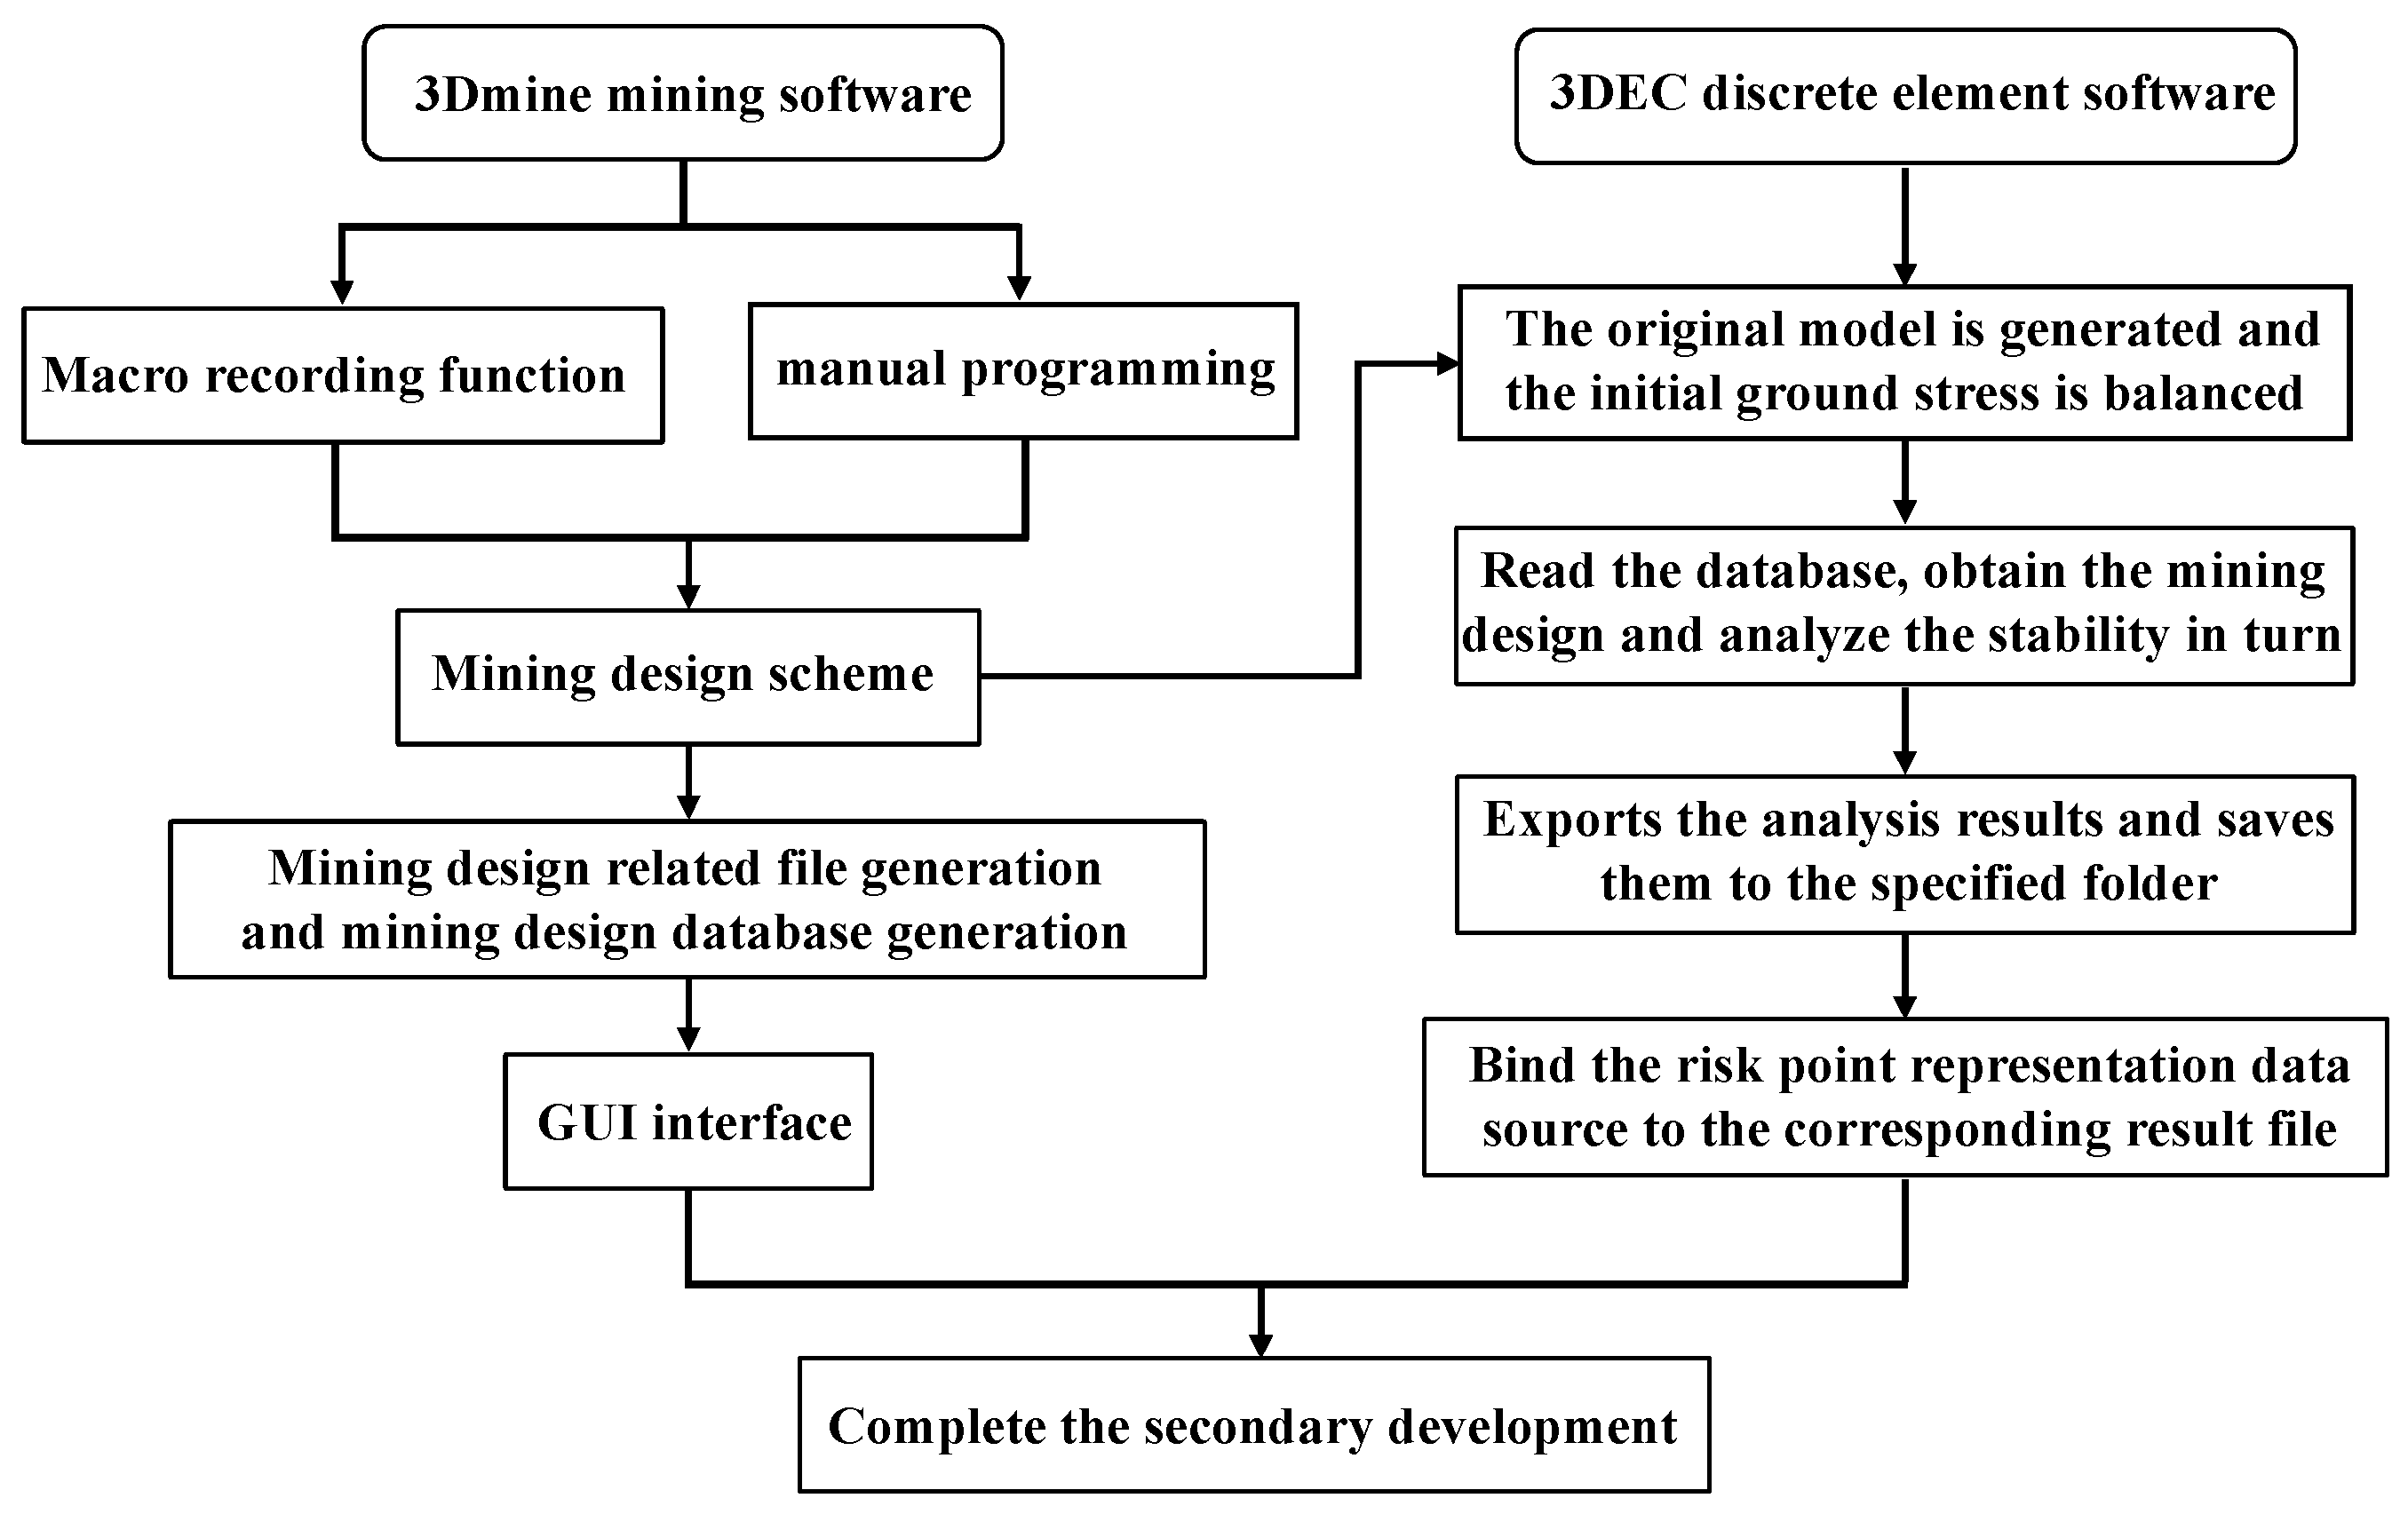
In summary, this paper presents a data interaction system between 3Dmine and 3DEC software, developed using Python, consisting of three key components: (1) A data conversion module that transforms the 3Dmine mining model into 3DEC’s standard input format; (2) An SQL database intermediate layer for parameter storage and transmission; and (3) A result feedback mechanism that returns simulation data to 3Dmine for 3D visualization. The system is built with PySimpleGUI to create an integrated user interface, allowing users to perform the entire process—from data conversion and numerical simulation to result in visualization—by simply double-clicking the script. The development of risk point 3D visualization representation script is realized. The software development process is illustrated in Figure 12.

4. Three-Dimensional Visualization of Risk Points

4.1. Initial Stress Equilibrium

The boundary conditions for the calculation model are as follows: horizontal movement is restricted on the sides, the bottom is fixed, and the upper surface is a free boundary. It is assumed that the failure of the rock and soil materials follows the Mohr-Coulomb strength criterion. Based on the relevant geological data of the mine, the physical and mechanical parameters of the three rock types are determined and then adjusted according to the Hoek-Brown strength criterion. The mechanical properties of each layer’s rock mass are provided in Table 2.
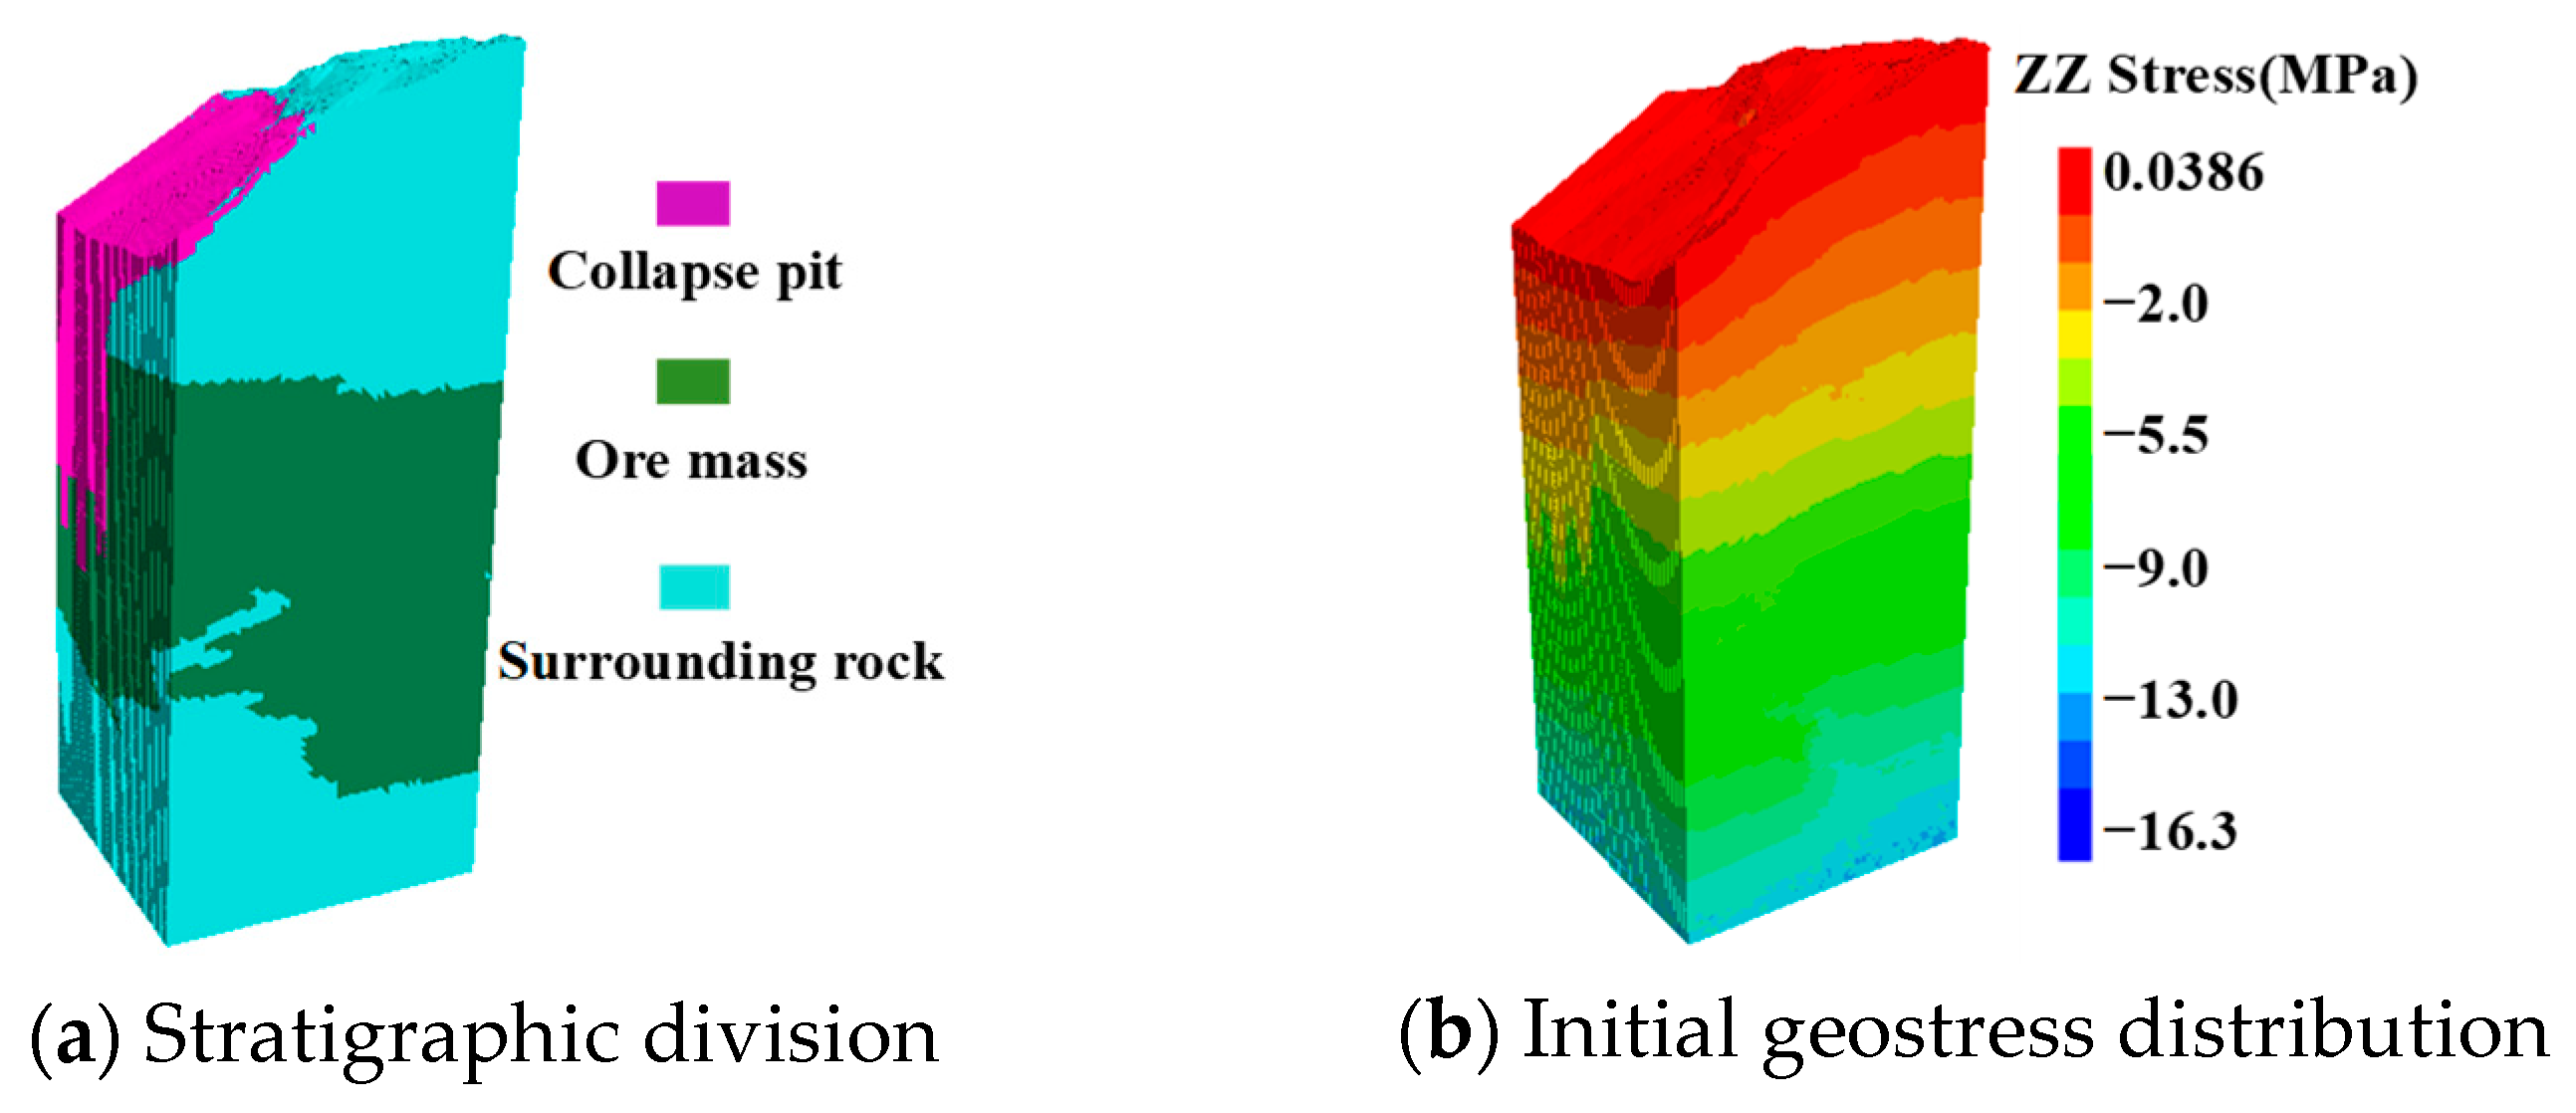
The numerical model of the stope, as generated, is shown in Figure 13a. The purple, green, and blue areas represent the collapse pit, ore body, and surrounding rock, respectively. The maximum model dimensions are 900 m × 850 m, with a minimum block element size of 10 m. This configuration yields approximately 350,000 block elements and 1 million zone elements. The model’s spatial extent and resolution are scalable to accommodate specific project requirements. Before performing the mining simulation, the initial stress field must be balanced, and the displacement and velocity should be initialized. The bottom surface of the model is set at 300 m, considering the original topography, to accommodate the elevation change. The vertical stress (ZZ) distribution, based on the 3DEC simulation, indicates that the initial stress field, formed by the self-weight of the rock mass, is layered. The maximum stress in the Z-direction is 16.3 MPa, which aligns with the theoretical value, as shown in Figure 13.

4.2. Risk Grade Index

The Strength–stress ratio theory refers to the ratio of the rock mass strength to the stress acting on the rock mass [29,30]. While similar to the concept of safety factor, which primarily evaluates overall stability, the strength–stress ratio focuses on assessing local stability. For continuous units or blocks, the ratio of uniaxial compressive strength to applied stress is commonly used. One advantage of the strength–stress ratio theory is that it allows for quick identification of potential problem areas through simple constitutive models, even before more complex calculations are conducted.
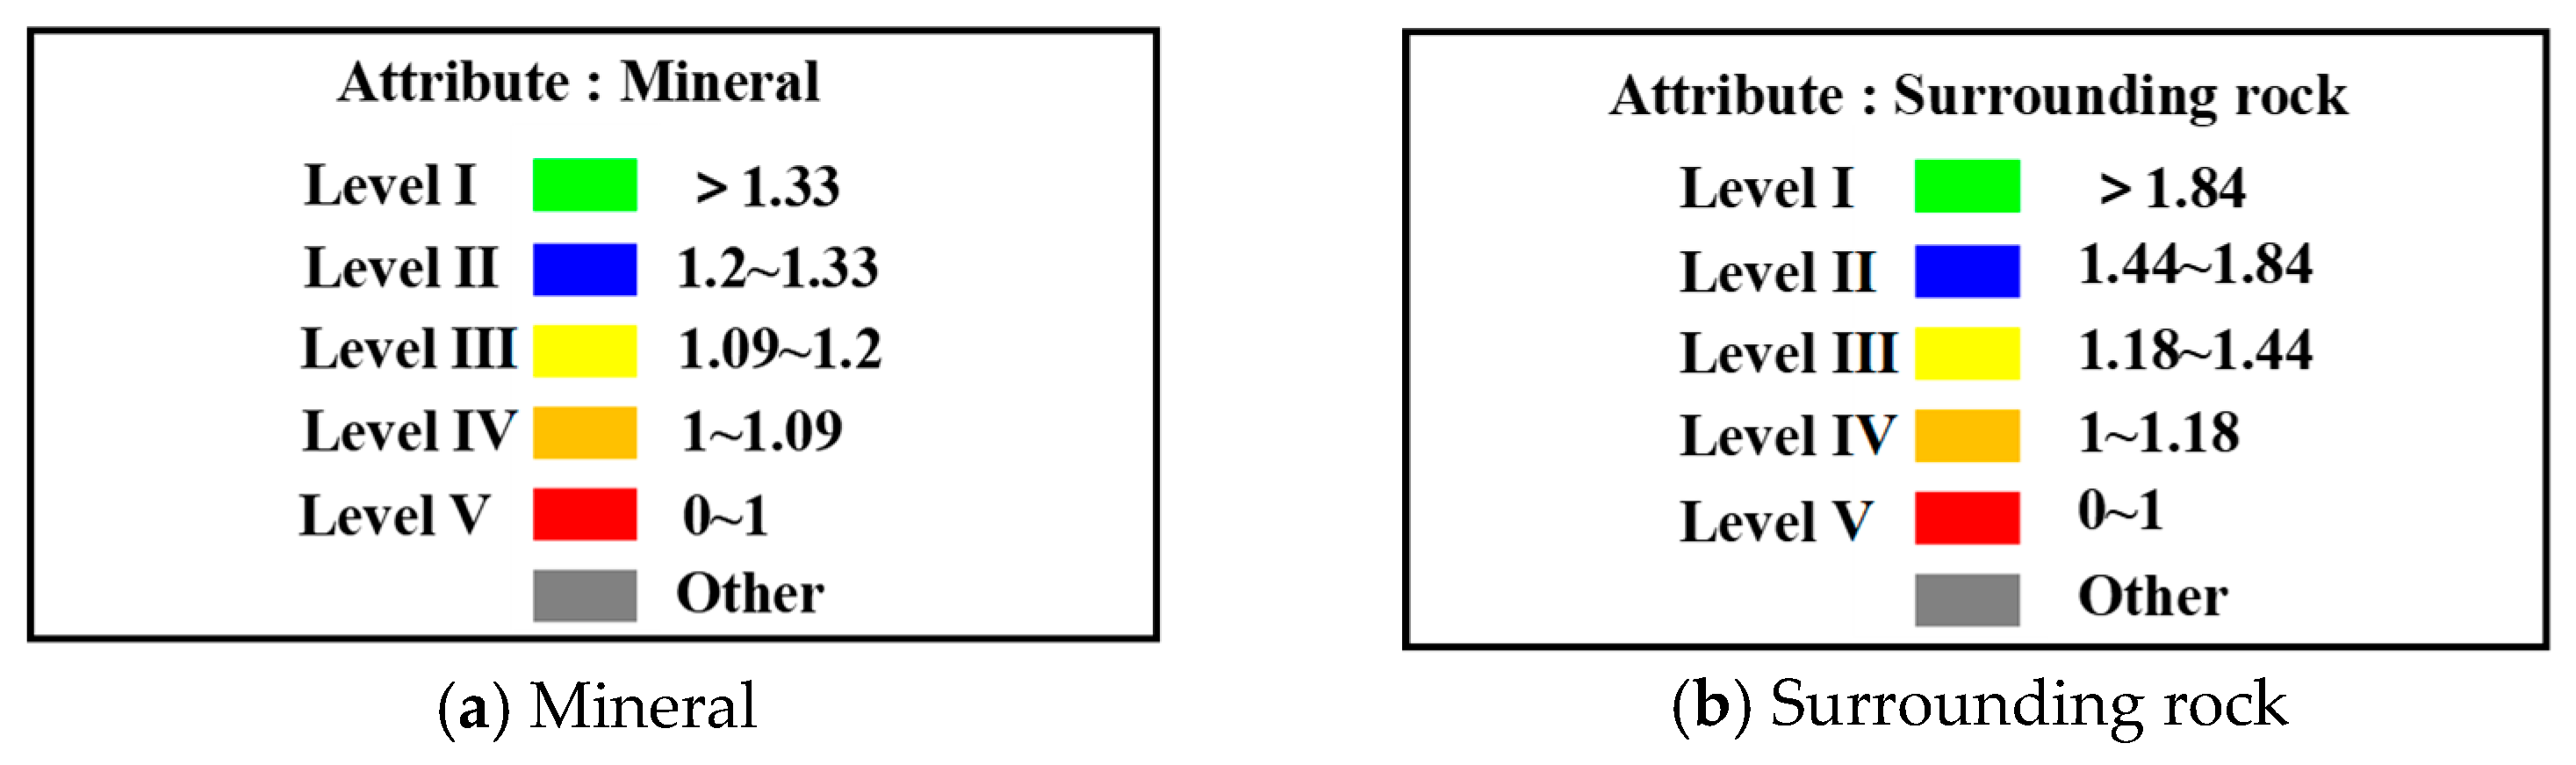
Based on the strength–stress ratio theory and using the Hoek-Brown conversion formula, the rock mass strength values from Table 2 are used as the maximum strength for calculations. The ore is classified into five categories: Level I-Green (1.33, +∞), Level II-Blue (1.2, 1.33], Level III-Yellow (1.09, 1.2], Level IV-Orange (1, 1.09], and Level V-Red (0, 1]. Similarly, the surrounding rock is also divided into five categories: Level I-Green (1.84, +∞), Level II-Blue (1.44, 1.84], Level III-Yellow (1.18, 1.44], Level IV-Orange (1, 1.18], and Level V-Red (0, 1]. By traversing each block in the model and calculating its strength–stress ratio, risk areas are visualized using different colors based on the ratio, which helps determine the rock’s risk level. The classification of risk levels is shown in Figure 14.

4.3. Risk Point Attribute Assignment

The study of the spatial distribution of geological body attributes requires the quantitative characterization of multi-source geological data using a three-dimensional block model. This is based on the lithology identification results and sampling test data from the geological database. The simulation benefits from a large number of borehole extractions, providing broad coverage with relatively even distribution, which allows for capturing the main variations in the stress field within the study area. Therefore, the nearest distance method is used to assign values to the stress and displacement attributes [31].
The range and parameters of the empty block model determined in this study include the model’s coordinate range (X: +6400 m to +7300 m; Y: +8350 m to +9100 m; Z: +400 m to +900 m). The model size is 900 m × 850 m × 500 m, with a block unit size of 10 m × 10 m, and a boundary unit size of 1.25 m × 1.25 m. The solid model serves as the foundation for constraining the block model. Using the extracted mechanical characteristic data, stress engineering sample points are obtained from the stress table, and an engineering sample 3ds file with stress attributes is generated in 3Dmine. Next, displacement engineering sample points are extracted from the displacement table, and an engineering sample 3ds file with displacement attributes is created, with each attribute then added to the block. The risk level classification based on the strength–stress ratio and the coloring of block attributes is implemented in 3Dmine, enabling 3D visualization of the mine numerical simulation results and risk levels, as shown in Figure 15.

4.4. Three-Dimensional Visual Characterization of Risk Points

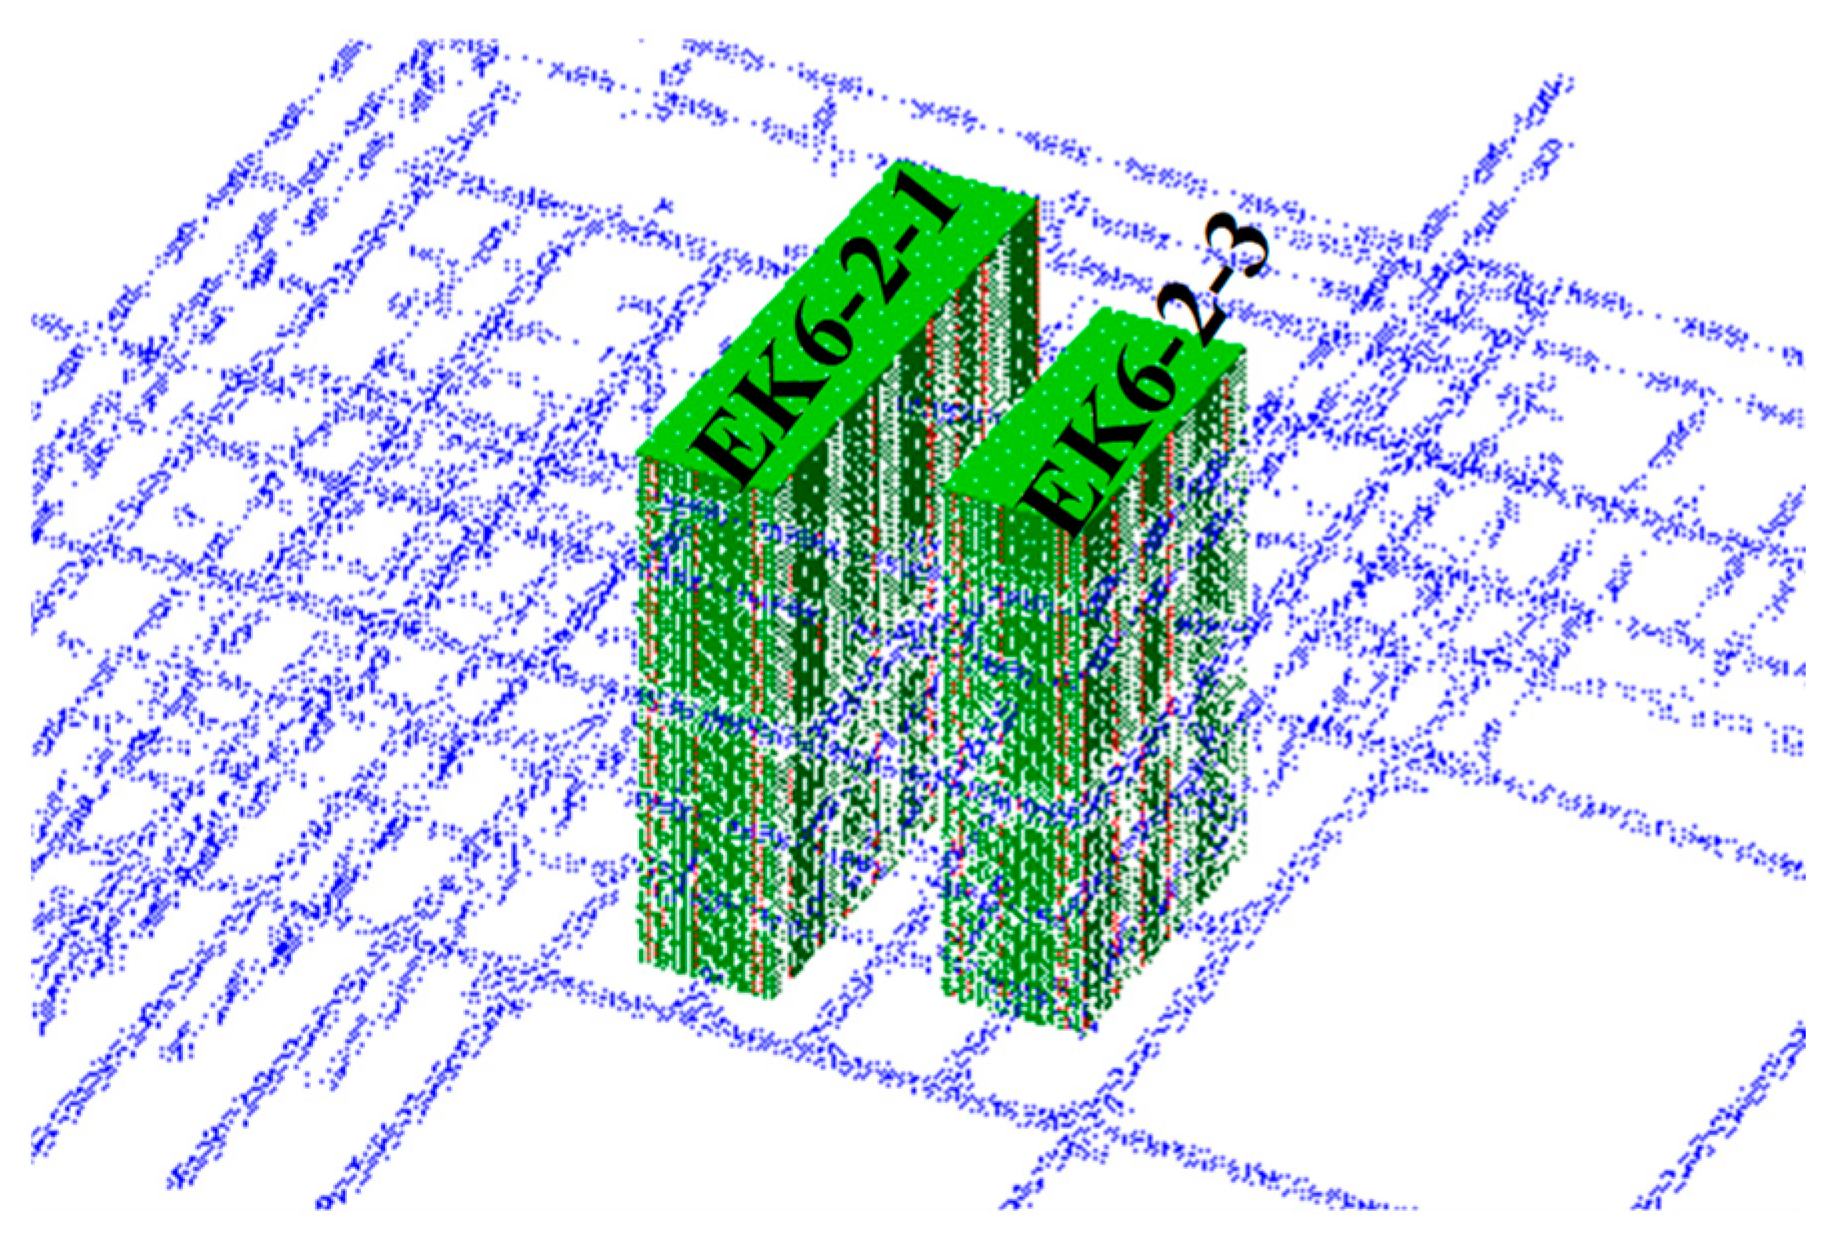
The block model encompasses the entire mining area and serves as the foundation for subsequent operations. The physical model serves as the basis for the block model constraints. It is defined using the polymetallic mine’s physical model, including the EK6-2-1 and EK6-2-3 mining areas and various horizontal tunnels, resulting in the block model of the mining area shown in Figure 16.
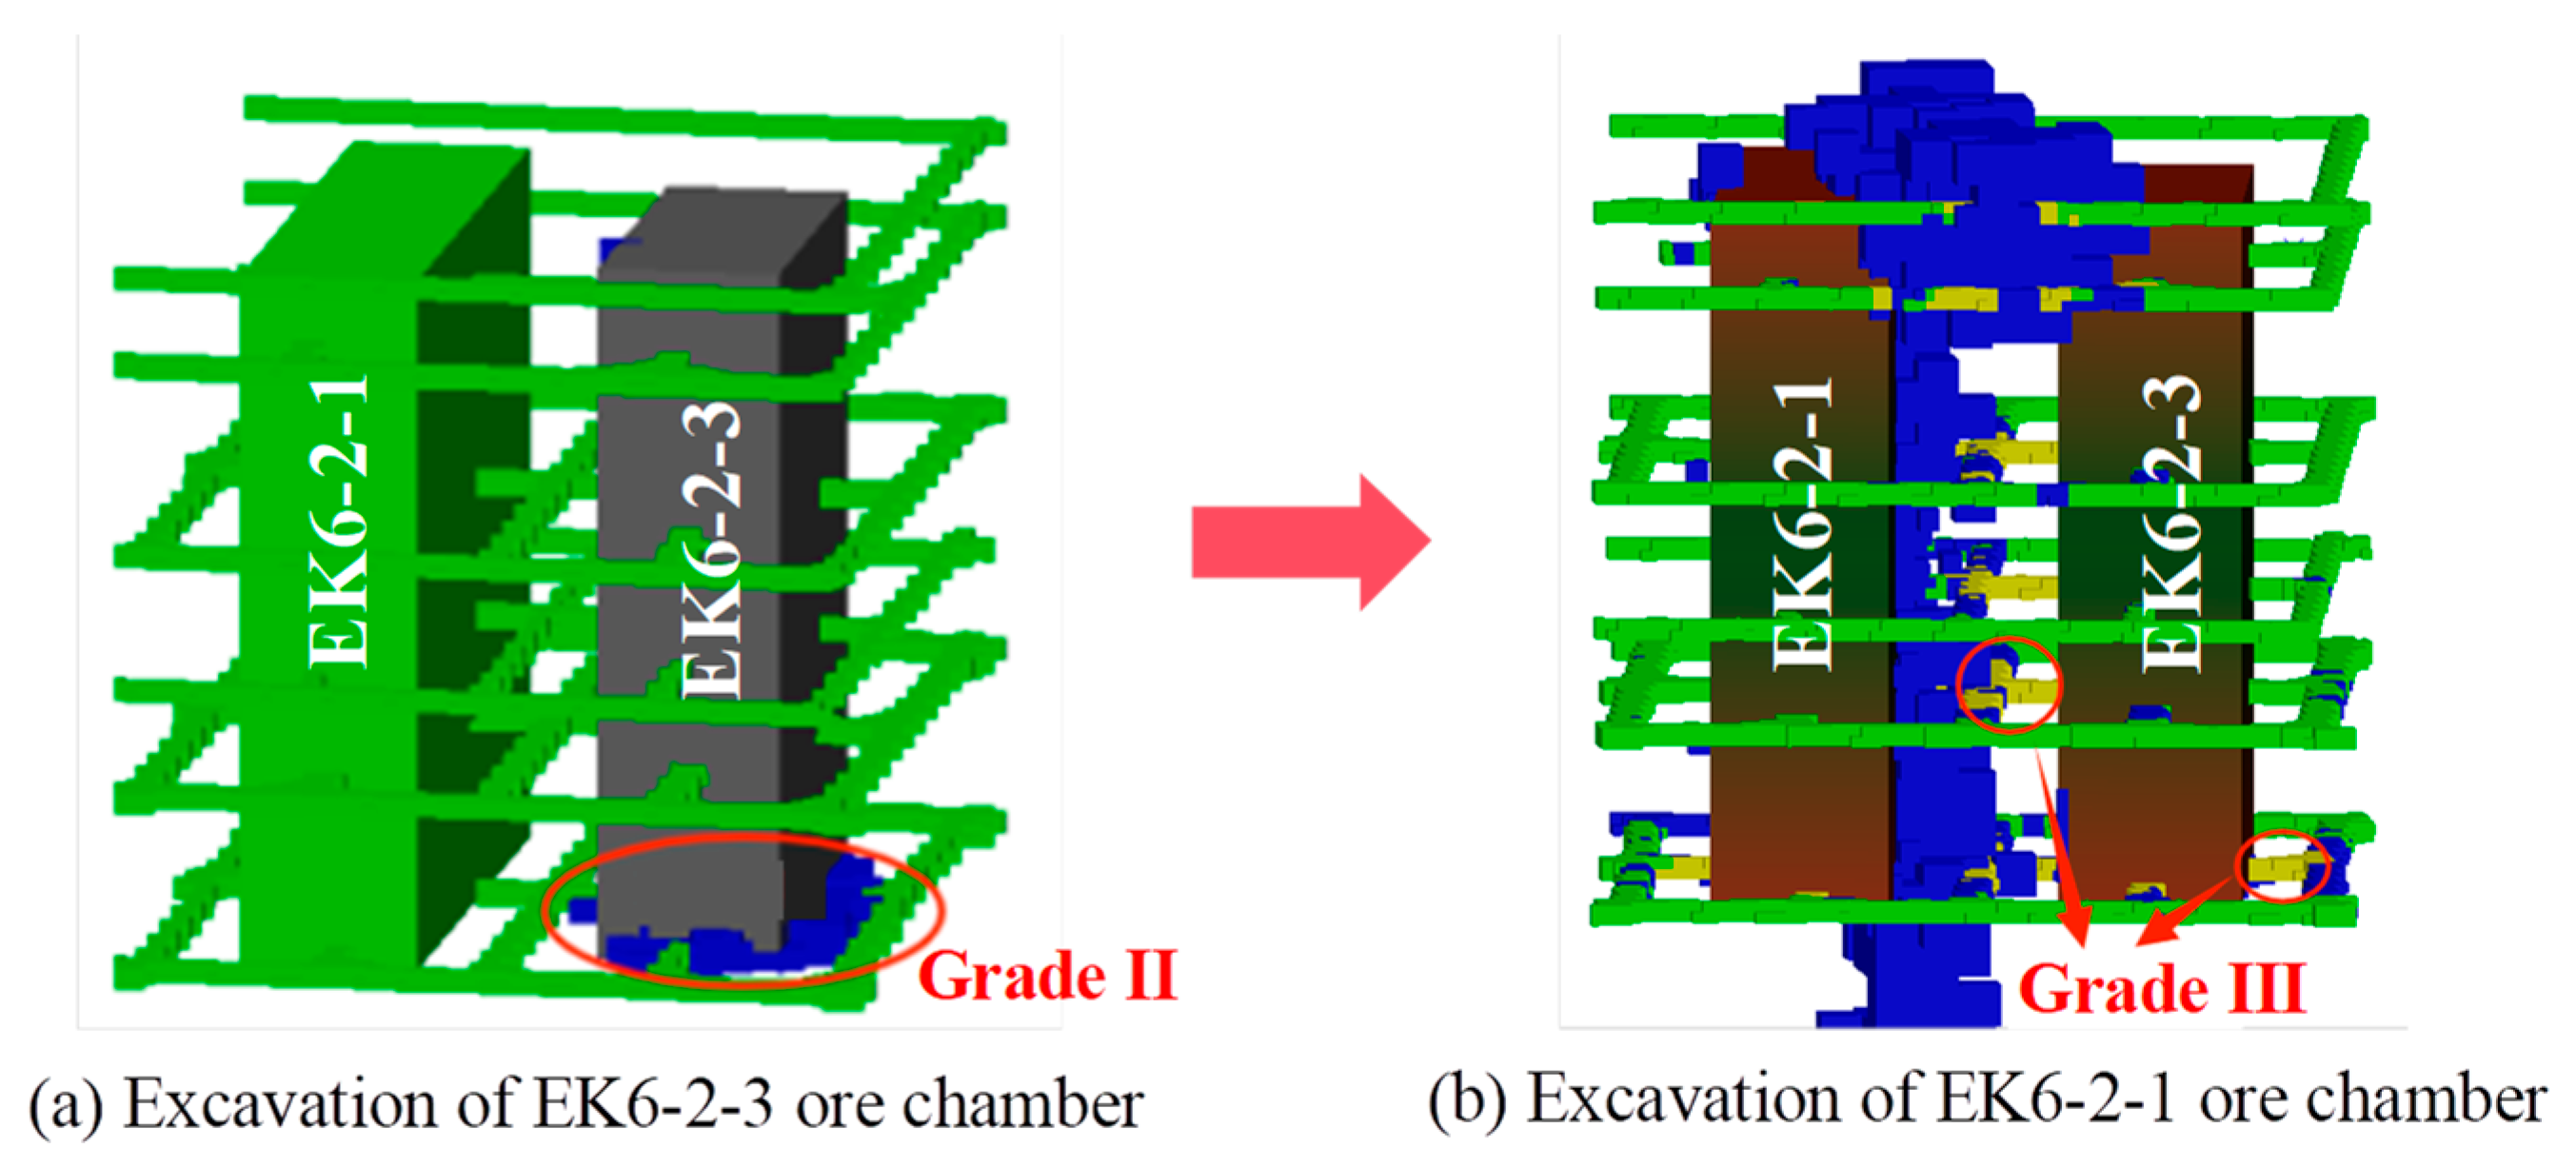
To assess the effectiveness of the 3D visualization of risk points, this study is based on the EK6-2 mining area, sequentially excavating ore chamber No. 3 and ore chamber No. 1, to conduct a visual analysis of the risk points.
Figure 17a shows that during the excavation of ore chamber EK6-2-3, the original rock stress field is disrupted for the first time. The stress redistribution is mainly concentrated around the bottom of the excavation, creating a localized Level II risk zone at the bottom due to the disturbance from a single excavation in a relatively isolated area. However, during the excavation of ore chamber EK6-2-1, as shown in Figure 17b, the Level II risk zone expands significantly, primarily between the two ore chambers, with the emergence of a Level III risk zone. This is due to the synergistic disturbance effect of multiple excavations. The initial stress disturbance from the excavation of EK6-2-3 overlaps with the new disturbance from the excavation of EK6-2-1, amplifying the concentration of stress. At the same time, the latent damage (e.g., microfracture development) caused by the first excavation around EK6-2-3 accumulates and deteriorates during the second excavation, further weakening the stability of the surrounding rock. Furthermore, as the two ore chambers are adjacent, the overlapping excavation disturbance in the shared boundary area causes stress concentration far exceeding that of a single excavation, ultimately leading to a noticeable expansion of the Level II risk zone and the formation of a more severe Level III risk zone. This highlights the synergistic amplification effect of underground excavation risks.

5. Discussions

5.1. Model Accuracy Verification

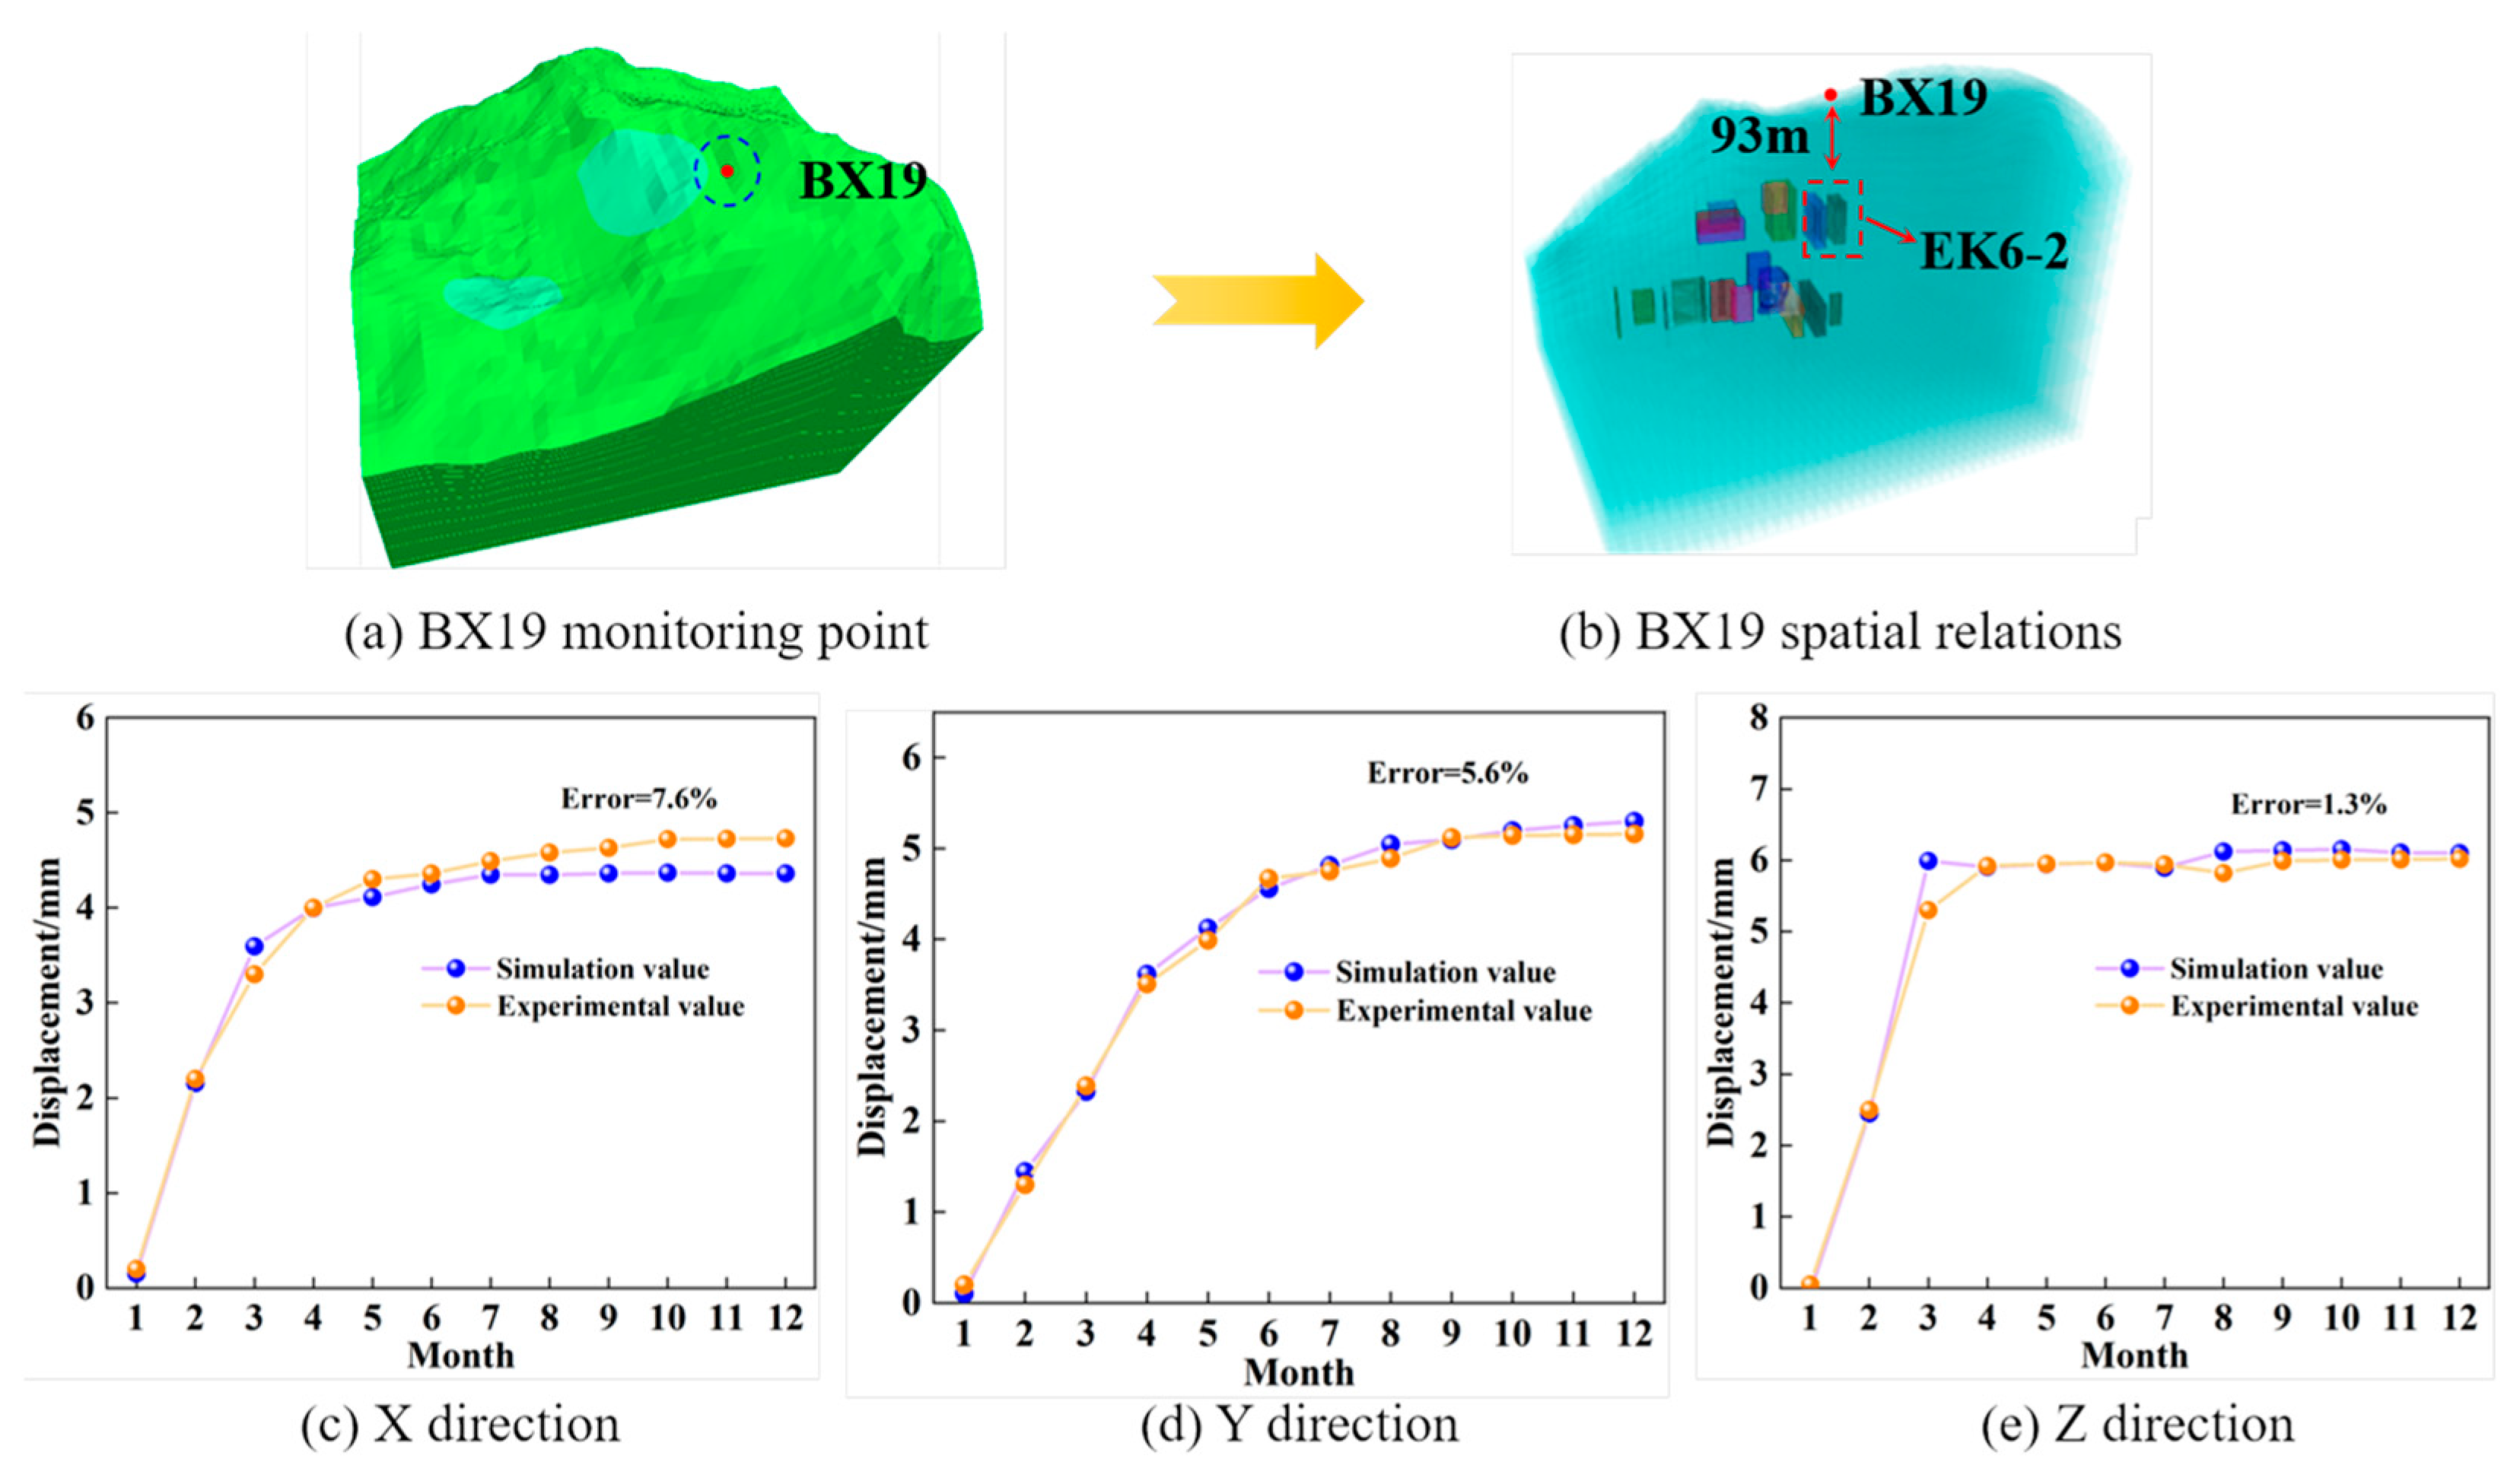
Utilizing the developed 3D visualization program, an efficient equivalent numerical model for the underground mining area was constructed. Its key advantage lies in its ability to accurately reconstruct the complex terrain contours and spatial distribution of underground voids. Additionally, the built-in algorithms facilitate the automatic extraction and interactive analysis of key physical parameters such as stress and displacement, providing standardized data support for subsequent stability assessments. To verify the computational accuracy of the model, a comparison was made between the measured displacement data at monitoring point BX19, located 93 m above ore chamber EK6-2, and the calculated data from this study. The location of the monitoring point is shown in Figure 18a,b. The measured and simulated displacement values in the X, Y, and Z directions for monitoring point BX19 are 4.73 mm, 5.16 mm, and 6.02 mm, and 4.37 mm, 5.45 mm, and 6.10 mm, respectively, as shown in Figure 18c–e. The computed errors are 7.6%, 5.6%, and 1.3%, respectively, confirming the reliability of the proposed computational method.

5.2. Limitations

The mechanical and geological environmental parameters of the rock mass in this study were derived from monitoring data at discrete time points and are assumed to be static. In practice, however, mining operations induce continuous changes (e.g., increasing depth and scope), which persistently alter the groundwater distribution and in situ stress field. Concurrently, environmental factors such as temperature and humidity also directly affect the physico-mechanical properties of the rock mass. These dynamic processes cannot be adequately captured by static parameters, potentially leading to model errors such as misjudgment or failure to detect hazardous states. Therefore, future research will focus on integrating time-varying parameters to improve the model’s practicality and applicability in real-world engineering scenarios.
The risk level classification in this study is primarily based on the strength–stress ratio, a key indicator that, while providing an intuitive quantitative relationship between rock strength and stress state, serves as a foundation for initial risk assessment. However, this method has notable limitations in practical engineering applications. It fails to account for the time-dependent accumulation of rock deformation during mining, cannot adequately represent the dynamic process of rock mass deterioration from damage evolution to progressive failure under sustained stress, and omits the post-peak softening behavior of rock. Consequently, its sensitivity to risks in the later stages of hazard evolution is insufficient. Furthermore, the strength–stress ratio does not sufficiently incorporate parameters such as strain and the extent of the plastic zone, which are essential indicators of the internal damage state of the rock mass. From the perspective of rock mass failure mechanisms, strain parameters can quantify the degree of deformation accumulation in the surrounding rock, directly linking to the dynamic process of risk evolution. The distribution and depth of the plastic zone, on the other hand, reveal the damage degradation boundary within the rock mass and serve as an important indicator for identifying potential instability zones. The absence of these parameters may result in misjudgment of complex risk conditions. Therefore, future research will incorporate dynamic correction coefficients and develop a “Strength-Stress Ratio-Strain-Plastic Zone” multi-dimensional indicator system, which will integrate weighted coefficients and discrimination thresholds of different parameters to achieve a more refined classification of risk levels, further enhancing the engineering guidance value of the assessment results.

6. Conclusions

This study uses a mine as the research background and, through secondary development and other methods, establishes data interaction scripts for 3Dmine software and 3DEC discrete element analysis software, fully leveraging the technical advantages of both. The numerical simulation results are visualized in the digital software, enabling real-time interaction between the numerical and digital data. The main conclusions are as follows:
(1)
Utilizing field geological data and UAV photogrammetry, this study constructed high-precision 3D digital and numerical models. The 3D digital model, created with 3DMine, integrates surface topography, subsidence zones, goaf clusters, ore bodies, and roadways. This model was then seamlessly converted into a 3DEC numerical simulation model, effectively bridging the gap between digital and numerical models inherent in traditional methods and thereby enhancing the efficiency and accuracy of model development.
(2)
A collaborative platform was developed by integrating a Python-based data interaction interface with an SQL database. This system facilitates efficient data transfer and format conversion, enabling the feedback of the mechanical calculation results to the 3DMine software for three-dimensional visualization. Additionally, a risk assessment script was developed to rapidly identify and quantitatively characterize potential hazard zones, thereby enhancing the intelligence of mine safety management.
(3)
A risk classification system based on the strength–stress ratio, integrated with block attribute coloring, enables the three-dimensional visualization of risk zones within the mine. The attribute assignment and constrained viewing functions, which utilize the nearest distance method, enable the rapid identification and locking of high-risk blocks. This approach provides a clear visual representation of risk distribution and offers practical guidance for optimizing mining plans.
(4)
The research findings were validated against field monitoring data, showing displacement errors of 7.6% in the X-direction, 5.6% in the Y-direction, and 1.3% in the Z-direction, which demonstrates high computational accuracy and engineering reliability. This technical approach applies to both metallic and non-metallic mines for a range of geotechnical assessments, including mining risk assessment, goaf stability management, and roadway stability analysis.

Author Contributions

Conceptualization, A.-B.J. and C.M.; methodology, A.-B.J.; software, Y.-Q.Z.; validation, H.-K.W.; formal analysis, Y.-Q.Z.; investigation, Z.-H.L.; writing—original draft preparation, A.-B.J. and C.M.; writing—review and editing, Y.-Q.Z. All authors have read and agreed to the published version of the manuscript.

Funding

This research was funded by [the National Natural Science Foundation of China] grant number [52174106]; [the National Key Research and Development Program Project of China] grant number [2022YFC2905102].

Data Availability Statement

The raw data supporting the conclusions of this article will be made available by the authors on request.

Acknowledgments

The research project team of Aibing Jin at University of Science and Technology Beijing. The authors would like to acknowledge the help from Hunan Shizhuyuan Nonferrous Metals Co., Ltd.

Conflicts of Interest

The authors declare no conflicts of interest.

References

  1. Gu, Z.Y.; Xiong, X.; Yang, C.Y.; Cao, M.C. A method for analyzing discontinuities characterization using the integration of underground drift point cloud with 3DEC software. Ain Shams Eng. J. 2024, 15, 102744. [Google Scholar] [CrossRef]
  2. Zheng, Z.; Li, S.X.; Qin, Z.Y.; Zhang, Q. Dual-scale 3DEC-GBM discrete element simulation on mechanical behavior and anisotropic fracture evolution mechanism of rock induced by true three-dimensional stress. Rock Mech. Rock Eng. 2024, 57, 3885–3915. [Google Scholar]
  3. Zhang, P.; Nordlund, E. A 3DEC numerical analysis of the interaction between an uneven rock surface and shotcrete lining. Rock Mech. Rock Eng. 2021, 54, 2267–2289. [Google Scholar] [CrossRef]
  4. Liu, B.; He, K.; Han, M.; Hu, X.W.; Wu, T.W.; Wu, M.Y.; Ma, G.T. Dynamic process simulation of the Xiaogangjian rockslide occurred in shattered mountain based on 3DEC and DFN. Comput. Geotech. 2021, 134, 104122. [Google Scholar] [CrossRef]
  5. Liu, J.P.; Xu, S.D.; Li, Y.H.; Lei, G. Analysis of rock mass stability based on mining-induced seismicity: A case study at the Hongtoushan copper mine in China. Rock Mech. Rock Eng. 2019, 52, 265. [Google Scholar]
  6. Jiang, J.Y.; Lu, Y.; Wang, D.; Han, X.P. Slope stability calculation method for highwall mining with open-cut mines. Sci. Rep. 2022, 12, 209. [Google Scholar] [CrossRef]
  7. Huang, W.S.; Cai, S.J.; Wu, D.; Huang, G.; Liu, Y.C. Stability assessment of underground mined-out areas in a gold mine based on complex system theory. Geotech. Geol. Eng. 2015, 33, 1295–1305. [Google Scholar] [CrossRef]
  8. Tao, Z.G.; Shu, Y.; Yang, X.J.; Peng, Y.Y.; Chen, Q.H.; Zhang, H.J. Physical model test study on shear strength characteristics of slope sliding surface in Nanfen open-pit mine. Int. J. Min. Sci. Technol. 2020, 30, 421–429. [Google Scholar] [CrossRef]
  9. Liu, J.; Feng, X.T.; Zhang, J.; Yue, D.M. Stability assessment of the Three-Gorges Dam foundation, China, using physical and numerical modeling-Part I: Physical model tests. Int. J. Rock Mech. Min. 2003, 40, 609–631. [Google Scholar] [CrossRef]
  10. Ma, Q.C.; Liu, X.L.; Wang, E.Z.; Liu, C.; Jia, W. Optimizing 3D granular modeling with integrated 3DEC and neper techniques for granite mechanics simulation. Comput. Geotech. 2024, 173, 106578. [Google Scholar] [CrossRef]
  11. Zhang, C.; Zhao, Y.X.; Han, P.H.; Bai, Q.S. Coal pillar failure analysis and instability evaluation methods: A short review and prospect. Eng. Fail. Anal. 2022, 138, 106344. [Google Scholar] [CrossRef]
  12. Shabanimashcool, M.; Li, C.C. Numerical modelling of longwall mining and stability analysis of the gates in a coal mine. Int. J. Rock Mech. Min. 2012, 51, 24–34. [Google Scholar]
  13. Rezaei, M.; Mousavi, S.Z.S. Slope stability analysis of an open pit mine with considering the weathering agent: Field, laboratory and numerical studies. Eng. Geol. 2024, 333, 107503. [Google Scholar] [CrossRef]
  14. Yang, Z.Q.; Zhai, S.H.; Gao, Q.; Li, M.H. Stability analysis of large-scale stope using stage subsequent filling mining method in Sijiaying iron mine. J. Rock Mech. Geotech. 2015, 7, 87–94. [Google Scholar]
  15. Wu, J.H.; Hsieh, P.H. Simulating the postfailure behavior of the seismically-triggered Chiu-fen-erh-shan landslide using 3DEC. Eng. Geol. 2021, 287, 106113. [Google Scholar] [CrossRef]
  16. Azarfar, B.; Ahmadvand, S.; Sattarvand, J.; Abbasi, B. Stability analysis of rock structure in large slopes and open-pit mine: Numerical and experimental fault modeling. Rock Mech. Rock Eng. 2019, 52, 4889–4905. [Google Scholar] [CrossRef]
  17. Gao, F.Q.; Stead, D. Discrete element modelling of cutter roof failure in coal mine roadways. Int. J. Coal Geol. 2013, 116, 158. [Google Scholar] [CrossRef]
  18. Chen, Y.L.; Teng, J.Y. 3DEC Numerical Analysis of Failure Characteristics for Tunnel in Stratified Rock Masses. KSCE J. Civ. Eng. 2024, 28, 2420–2426. [Google Scholar] [CrossRef]
  19. Lv, W.L.; Li, J.; Yan, Y.F.; Gao, S. The Application of 3Dmine in Lan Jian Orefield of Panzhihua Vanadic Titanomagnetite. Adv. Mater. Res. 2014, 868, 3–6. [Google Scholar] [CrossRef]
  20. Wang, H.Z.; Wang, E.D.; Sun, Y.X.; Wang, Y. 3D geological modeling and deep prospecting of Donganshan iron deposit, Liaoning. J. Guilin Univ. Technol. 2023, 43, 588. [Google Scholar]
  21. Huang, J.H.; Fang, Y.W.; Wang, C.; Zhang, Z.H. Research on 3D Geological and Numerical Unified Model of in Mining Slope Based on Multi-Source Data. Water 2024, 16, 2421. [Google Scholar] [CrossRef]
  22. Fan, Z.H.; Xu, Z.H.; Wang, J. Precision Detection in Complex Goaf Group and Couple Modeling with Multiple Softwares. Metal Mine 2014, 138–141. [Google Scholar]
  23. Wang, L.M.; Zhang, X.Q.; Yin, S.H.; Zhang, X.L.; Jia, Y.F.; Kong, H.L. Evaluation of stope stability and displacement in a subsidence area using 3Dmine-Rhino3D-FLAC3D coupling. Minerals 2022, 12, 1202. [Google Scholar] [CrossRef]
  24. Deng, H.W.; Wang, Y.; Xu, Y.H. Study on Space Structure Evolution of Large and Complicated Underground Goaf. J. Disaster Prev. Mitig. Eng. 2018, 38, 401. [Google Scholar]
  25. Zhang, C.; Song, W.D.; Fu, J.X.; Li, Y.; Kang, M.C. Shaft safety pillar delineation and optimization simulation of filling miniing method. J. Min. Saf. Eng. 2022, 39, 136. [Google Scholar]
  26. Gao, Y.; Chen, Q.F.; Jiang, T.L. Research on Three-Dimensional Numerical Model Construction Method and Cemented Filling Treatment of Complex Cavities in Daxin Manganese Mine. Gold Sci. Technol. 2019, 27, 851. [Google Scholar]
  27. 3DMine Mining Engineering Software, Enterprise Edition 2021.5; Beijing San Diman Mining Software Technology Co., Ltd. (Developer): Beijing, China, 2021. Available online: https://www.3dmine-cn.com/ (accessed on 15 September 2025).
  28. Vemulapalli, S.C.; Mesapam, S. Slope stability analysis for mine hazard assessment using UAV. J. Indian Soc. Remote Sens. 2021, 49, 1483–1491. [Google Scholar] [CrossRef]
  29. Bhasin, R.; Grimstad, E. The use of stress-strength relationships in the assessment of tunnel stability. Tunn. Undergr. Space Technol. 1996, 11, 93–98. [Google Scholar] [CrossRef]
  30. Gong, F.Q.; Dai, J.H.; Xu, L. A strength-stress coupling criterion for rockburst: Inspirations from 1114 rockburst cases in 197 underground rock projects. Tunn. Undergr. Space Technol. 2023, 142, 105396. [Google Scholar] [CrossRef]
  31. Zhou, K.; Zheng, L.M. Application of the Nearest Neighbor Method in Delineation of Noble Metal Ore: Taking a Layered Platinum Ore in South Africa as an Example. Gold Sci. Technol. 2013, 21, 55. [Google Scholar]
Figure 1. Surface model construction process.
Applsci 16 00816 g001
Figure 2. Underground model construction process.
Applsci 16 00816 g002
Figure 3. Relative position distribution.
Applsci 16 00816 g003
Figure 4. 3DEC numerical model construction.
Applsci 16 00816 g004
Figure 5. Three-dimensional visualization characterization process of risk points.
Applsci 16 00816 g005
Figure 6. 3Dmine Data Storage Format.
Applsci 16 00816 g006
Figure 7. Data point extraction process.
Applsci 16 00816 g007
Figure 8. Influence range of goaf.
Applsci 16 00816 g008
Figure 9. Mechanical feature point extraction.
Applsci 16 00816 g009
Figure 10. 3Dmine software Python interpreter settings.
Applsci 16 00816 g010
Figure 11. Python script file format in 3Dmine.
Applsci 16 00816 g011
Figure 12. Development schematic flow chart.
Applsci 16 00816 g012
Figure 13. Stratigraphic division and initial stress distribution.
Applsci 16 00816 g013
Figure 14. Risk classification based on strength–stress ratio.
Applsci 16 00816 g014
Figure 15. Risk point assignment.
Applsci 16 00816 g015
Figure 16. EK6-2 stope solid model.
Applsci 16 00816 g016
Figure 17. Three-dimensional visualization of risk points after excavation of EK6-2 ore chamber.
Applsci 16 00816 g017
Figure 18. Monitoring point layout and displacement.
Applsci 16 00816 g018
Table 1. Coordinates of surface image control point measurement.
Image Control Point NumberX (m)Y (m)Elevation (m)
1416,924.7632,848,873.495780.631
2416,856.5362,848,839.906765.290
3416,920.8492,848,726.955790.694
4416,911.7712,848,618.141786.317
5417,033.7362,848,602.244811.019
Table 2. Mine rock physical and mechanical parameters table.
Name of Ore RockDensity/
(kg/m3)
Tensile Strength/MPaPeak Strength/MPaPoisson RatioElastic Modulus/GPaCohesion/MPaInternal Friction Angle/°
Skarn ore body30009.61149.820.2016.885.5227.45
Marble surrounding rock29008.0695.480.2213.2411.0632.54
Granular collapse pit26000.11.060.260.8730.4520
Disclaimer/Publisher’s Note: The statements, opinions and data contained in all publications are solely those of the individual author(s) and contributor(s) and not of MDPI and/or the editor(s). MDPI and/or the editor(s) disclaim responsibility for any injury to people or property resulting from any ideas, methods, instructions or products referred to in the content.