1. Introduction
The study of unsaturated soil mechanics holds significant importance in geotechnical engineering due to the prevalence of unsaturated conditions in the vadose zone [
1], particularly in arid, semi-arid, and seasonally dry regions. Unlike saturated soils, unsaturated soils exhibit complex hydro-mechanical behaviour governed by matric suction [
2]. This suction critically influences key engineering properties, including shear strength, volume change, and compressibility [
3]. Accurate characterization of such behaviour is essential for the reliable analysis and design of near-surface geotechnical systems such as shallow foundations, retaining structures, embankments, and natural slopes [
4]. Moreover, moisture variations due to climatic effects or vegetation can induce substantial changes in suction, leading to swelling, shrinkage, or collapse of sensitive soils [
5]. As such, advancing the understanding of unsaturated soil behaviour remains a vital component of modern geotechnical research and application [
6].
The Barcelona Basic Model (BBM), established by Alonso et al. [
7], was one of the first elastoplastic constitutive models capable of modelling unsaturated soil behaviour based on the concept of the critical state theory [
8]. This model is a continuation of the Modified Cam Clay model [
9] by introducing the effect of net stress and suction on soil strength and stiffness. The modifications to the model allow it to describe the mechanical properties of unsaturated soils, as well as predict the characteristics of collapse-induced deformation [
10,
11].
Determination of the BBM parameters entails selection of seven parameters that govern the isotropic response; the rate of increase in soil stiffness with suction,
; compression index for the fully saturated state,
; soil stiffness with suction,
; reference effective pressure,
; the specific volume at the reference effective pressure for zero suction,
elastic coefficient associated with changes in net stress,
; elastic coefficient associated with changes in suction,
; and three parameters that control the deviatoric behaviour: the elastic shear modulus,
; parameter controlling the increase in cohesion with suction,
; and the critical state ratio,
. The parameters that describe the elastic and shear response can be obtained typically by employing the same methodology for saturated soils [
8,
12]. The difficulty of the BBM lies in determining
, since each parameter regulates more than one aspect of soil behaviour. Moreover, different aspects of soil behaviour are influenced by more than one of these parameters.
Due to the complexity of the BBM formulation and the challenges associated with parameter determination, its application in applied engineering remains limited. However, some attempts have been made to utilize the BBM in the analysis of shallow foundations, bearing capacity determination, and slope stability problems [
13,
14,
15,
16]. The dependency of the parameters upon one another in parameter selection leads to no single correct set of parameters for a certain soil sample to match the physical behaviour of experimental tests. This is evident from a benchmark exercise [
17] conducted by seven teams from prestigious universities to determine the most suitable BBM parameters to simulate laboratory tests reported in the literature [
18]. Despite being provided with the same initial laboratory test results, each team employed different methods to determine the BBM parameters, thus resulting in a different set of parameters for each team. The methodologies were mainly based on iteration or compromise and used varying degrees of emphasis on particular behavioural aspects or tests. The exercise concluded that a particular combination of parameter values may produce a good match to one aspect of experimental behaviour (e.g., isotropic compression, collapse, shear response, etc.), whereas another combination results in better matching of another aspect of behaviour. It is also possible that different combinations of parameter values can give very similar predictions for some stress paths and yet widely different predictions when applied to other stress paths [
17].
Parameter determination in the original BBM [
7] was based on a sequential method employing excessive iteration and fitting multiple soil aspects simultaneously without isolating specific features. To eliminate the need for tedious iterative calibration, a sequential method especially designed to determine the five main parameters that govern isotropic behaviour
was established by Gallipoli [
19,
20]. Generally, a sequential method can refer to two distinct concepts: defining a neural network architecture by adding layers one by one, or a method for estimating a model’s numerical parameters iteratively. In geotechnical engineering, interpretability of parameters is vital; thus, the present study uses the latter concept, as the former requires large data sets and often acts as a black box adjusting parameters with weights and biases without a clear explanation why the specific values were chosen [
21,
22]. Other methods for calibrating parameters of constitutive models include global optimization [
23,
24] and data assimilation schemes [
25].
In the sequential method, the determination of each parameter is directly linked to the removal of a specific degree of freedom governing isotropic virgin behaviour in the BBM. This method minimizes subjectivity in model calibration and lowers the likelihood of deriving significantly different parameter values from the same dataset. The parameters are determined individually in a prescribed order, independent of assumptions concerning the remaining parameters. An advantage of the sequential method is that prescribed limits of certain parameters can be included to ensure that parameters can overcome the logical physical values of these parameters.
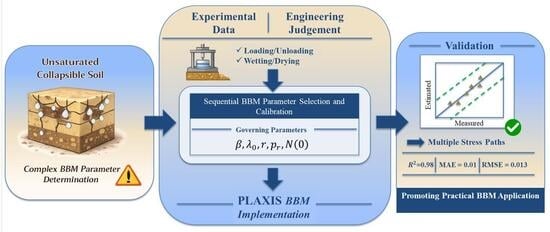
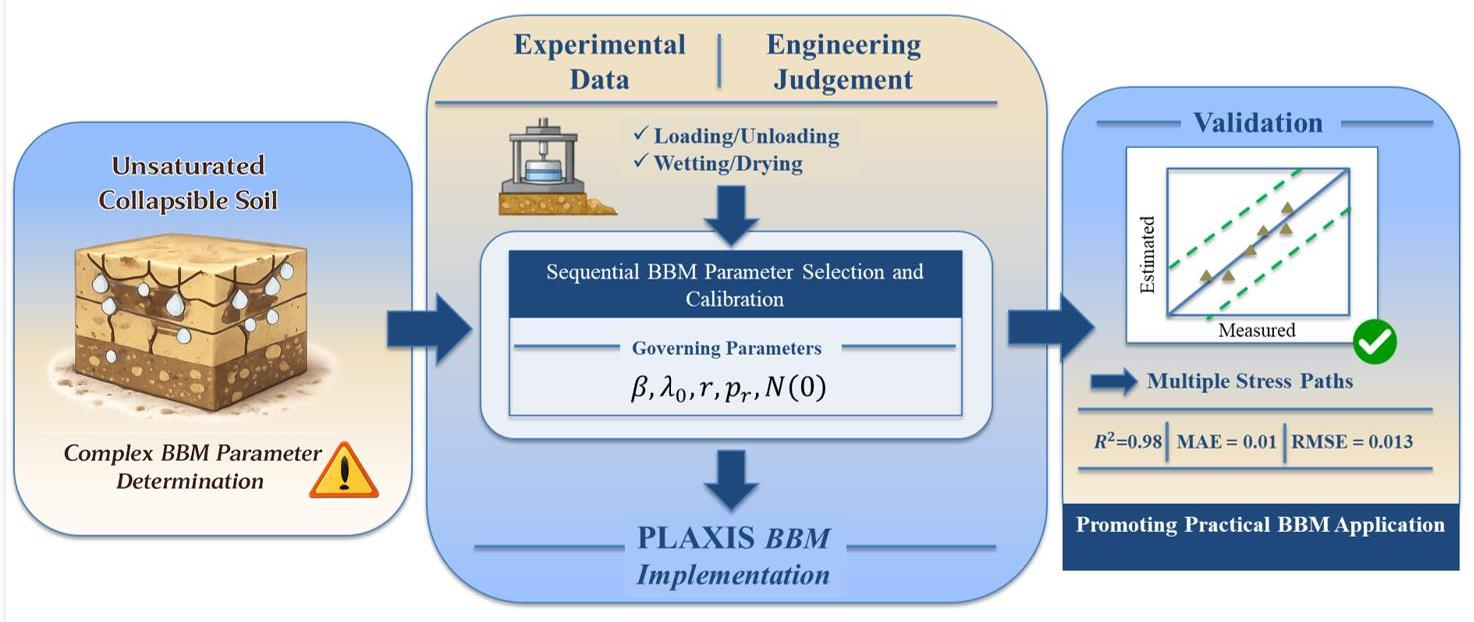
To address the research gap, the present paper illustrates a practical framework and detailed, step-by-step procedure for the selection and calibration of Barcelona Basic Model (BBM) parameters using the sequential method [
19], highlighting the importance of engineering judgement and a clear understanding of the original model formulation. The calibrated parameters are then implemented in Plaxis 2024.1 software [
26] to simulate laboratory tests reported in the literature [
18], enabling evaluation of whether the estimated values adequately capture soil behaviour or require minor adjustment to produce realistic stress–strain responses for engineering practice. The novelty of this study lies in documenting the exact workflow that integrates laboratory testing, parameter selection, and PLAXIS implementation into a simplified protocol, discussing the procedural operability and limitations, as well as identifying key stages where engineering judgement is most critical. Implementing the detailed framework produces a single, reliable set of BBM parameters, ensuring high reproducibility with minimum parameter variation when applied to an identical data set. This study contributes to the understanding of the mechanical behaviour of unsaturated soils through constitutive modelling and numerical simulation.
2. Overview of the Plaxis Barcelona Basic Model (PBBM)
The modified Plaxis Barcelona Basic Model, PBBM [
26], implemented as a user-defined soil model, builds upon the original Barcelona Basic Model (BBM) proposed by Alonso et al. [
7], incorporating several enhancements with minor modifications. A key advancement is the adoption of Bishop’s effective stress,
, given by Equation (1), in the model formulation, replacing the net mean stress used in the original BBM.
where
is the total stress tensor, m is the second-order identity tensor, χ is the matric suction coefficient,
is the pore water pressure, and
is the pore air pressure.
is defined as follows:
where
is the effective degree of saturation,
is the degree of saturation,
is the residual degree of saturation, and
is the degree of saturation at the fully saturated state.
This approach establishes a relationship between
,
and
. However, Bishop’s effective stress alone is insufficient to capture certain unsaturated soil behaviours, such as collapse upon wetting, necessitating the inclusion of suction to properly define the stress state in unsaturated conditions. Another improvement involves incorporating Lode’s angle into the yield (Mohr–Columb failure mechanism) and plastic potential surfaces, as a circular yield surface in the deviatoric plane cannot adequately represent failure criteria for both fully and partially saturated soils. A major benefit of the Plaxis BBM formulation is its capability to simulate a smooth transition between partially and fully saturated states, and vice versa [
27].
Under isotropic compression loading at a constant suction value, the BBM adopts a linear logarithmic relation between the specific volume,
, and the mean effective pressure,
, as shown in Equation (3), where
is the reference pressure for the PBBM formulation which controls virgin loading under isotropic stress states and controls the shape and size of the loading collapse (LC) curve.
Both the slope,
, and the intercept,
, of the normal compression line (NCL) at specified suction values, defined in Equation (3), are suction dependent according to Equations (4) and (5).
where
is the slope of the compression line of the fully saturated sample in (
-
) plane,
is a parameter controlling the soil stiffness with suction,
is a parameter controlling the rate of increase in soil stiffness with suction, and
is the suction value.
where
is the specific volume at reference pressure
at the fully saturated state,
is the slope of the swelling line in
-
plane and
is the atmospheric pressure.
Thus, this indicates that the main parameters that control virgin loading under isotropic states are and .
The loading collapse curve (LC) equation yields the following:
where
is the slope of the swelling line in
-
plane,
and
are the preconsolidation pressures for the unsaturated and fully saturated state, respectively, for the PBBM formulation.
3. Determination of the PBBM Parameters Using the Sequential Method
To utilize the sequential method [
19] for determination of the main parameters of the PBBM [
and
], a minimum of four NCLs with different suction values are required. The following main laboratory tests on partially saturated collapsible Jossigny silt (44.5% silt, 39.4% sand, 16.1% clay, plastic limit of 16%, liquid limit of 32%, dry density of 16.6 kN/m
3, and specific gravity of 2.67) [
18] were used:
SAT-1: A saturated isotropic test with loading from = 10 kPa to = 1300 kPa followed by unloading to = 50 kPa
TISO-1: An unsaturated isotropic test with loading/unloading phases and wetting/drying phases. The first loading phase was at s = 800 kPa with loading from = 50 kPa to 600 kPa, followed by wetting to = 10 kPa and then drying to = 150 kPa. In the second loading/unloading phase, the sample was loaded from = 600 kPa to 1400 kPa and unloaded to = 600 kPa. Afterwards, wetting to = 20 kPa, at which the final loading/unloading phase was performed by loading from = 600 kPa to 2000 kPa and unloading to 50 kPa.
IS-NC-12: An unsaturated triaxial test at = 800 kPa consisting of isotropic loading from = 25 kPa to 1200 kPa followed by shearing.
A full description of specimen preparation is detailed in [
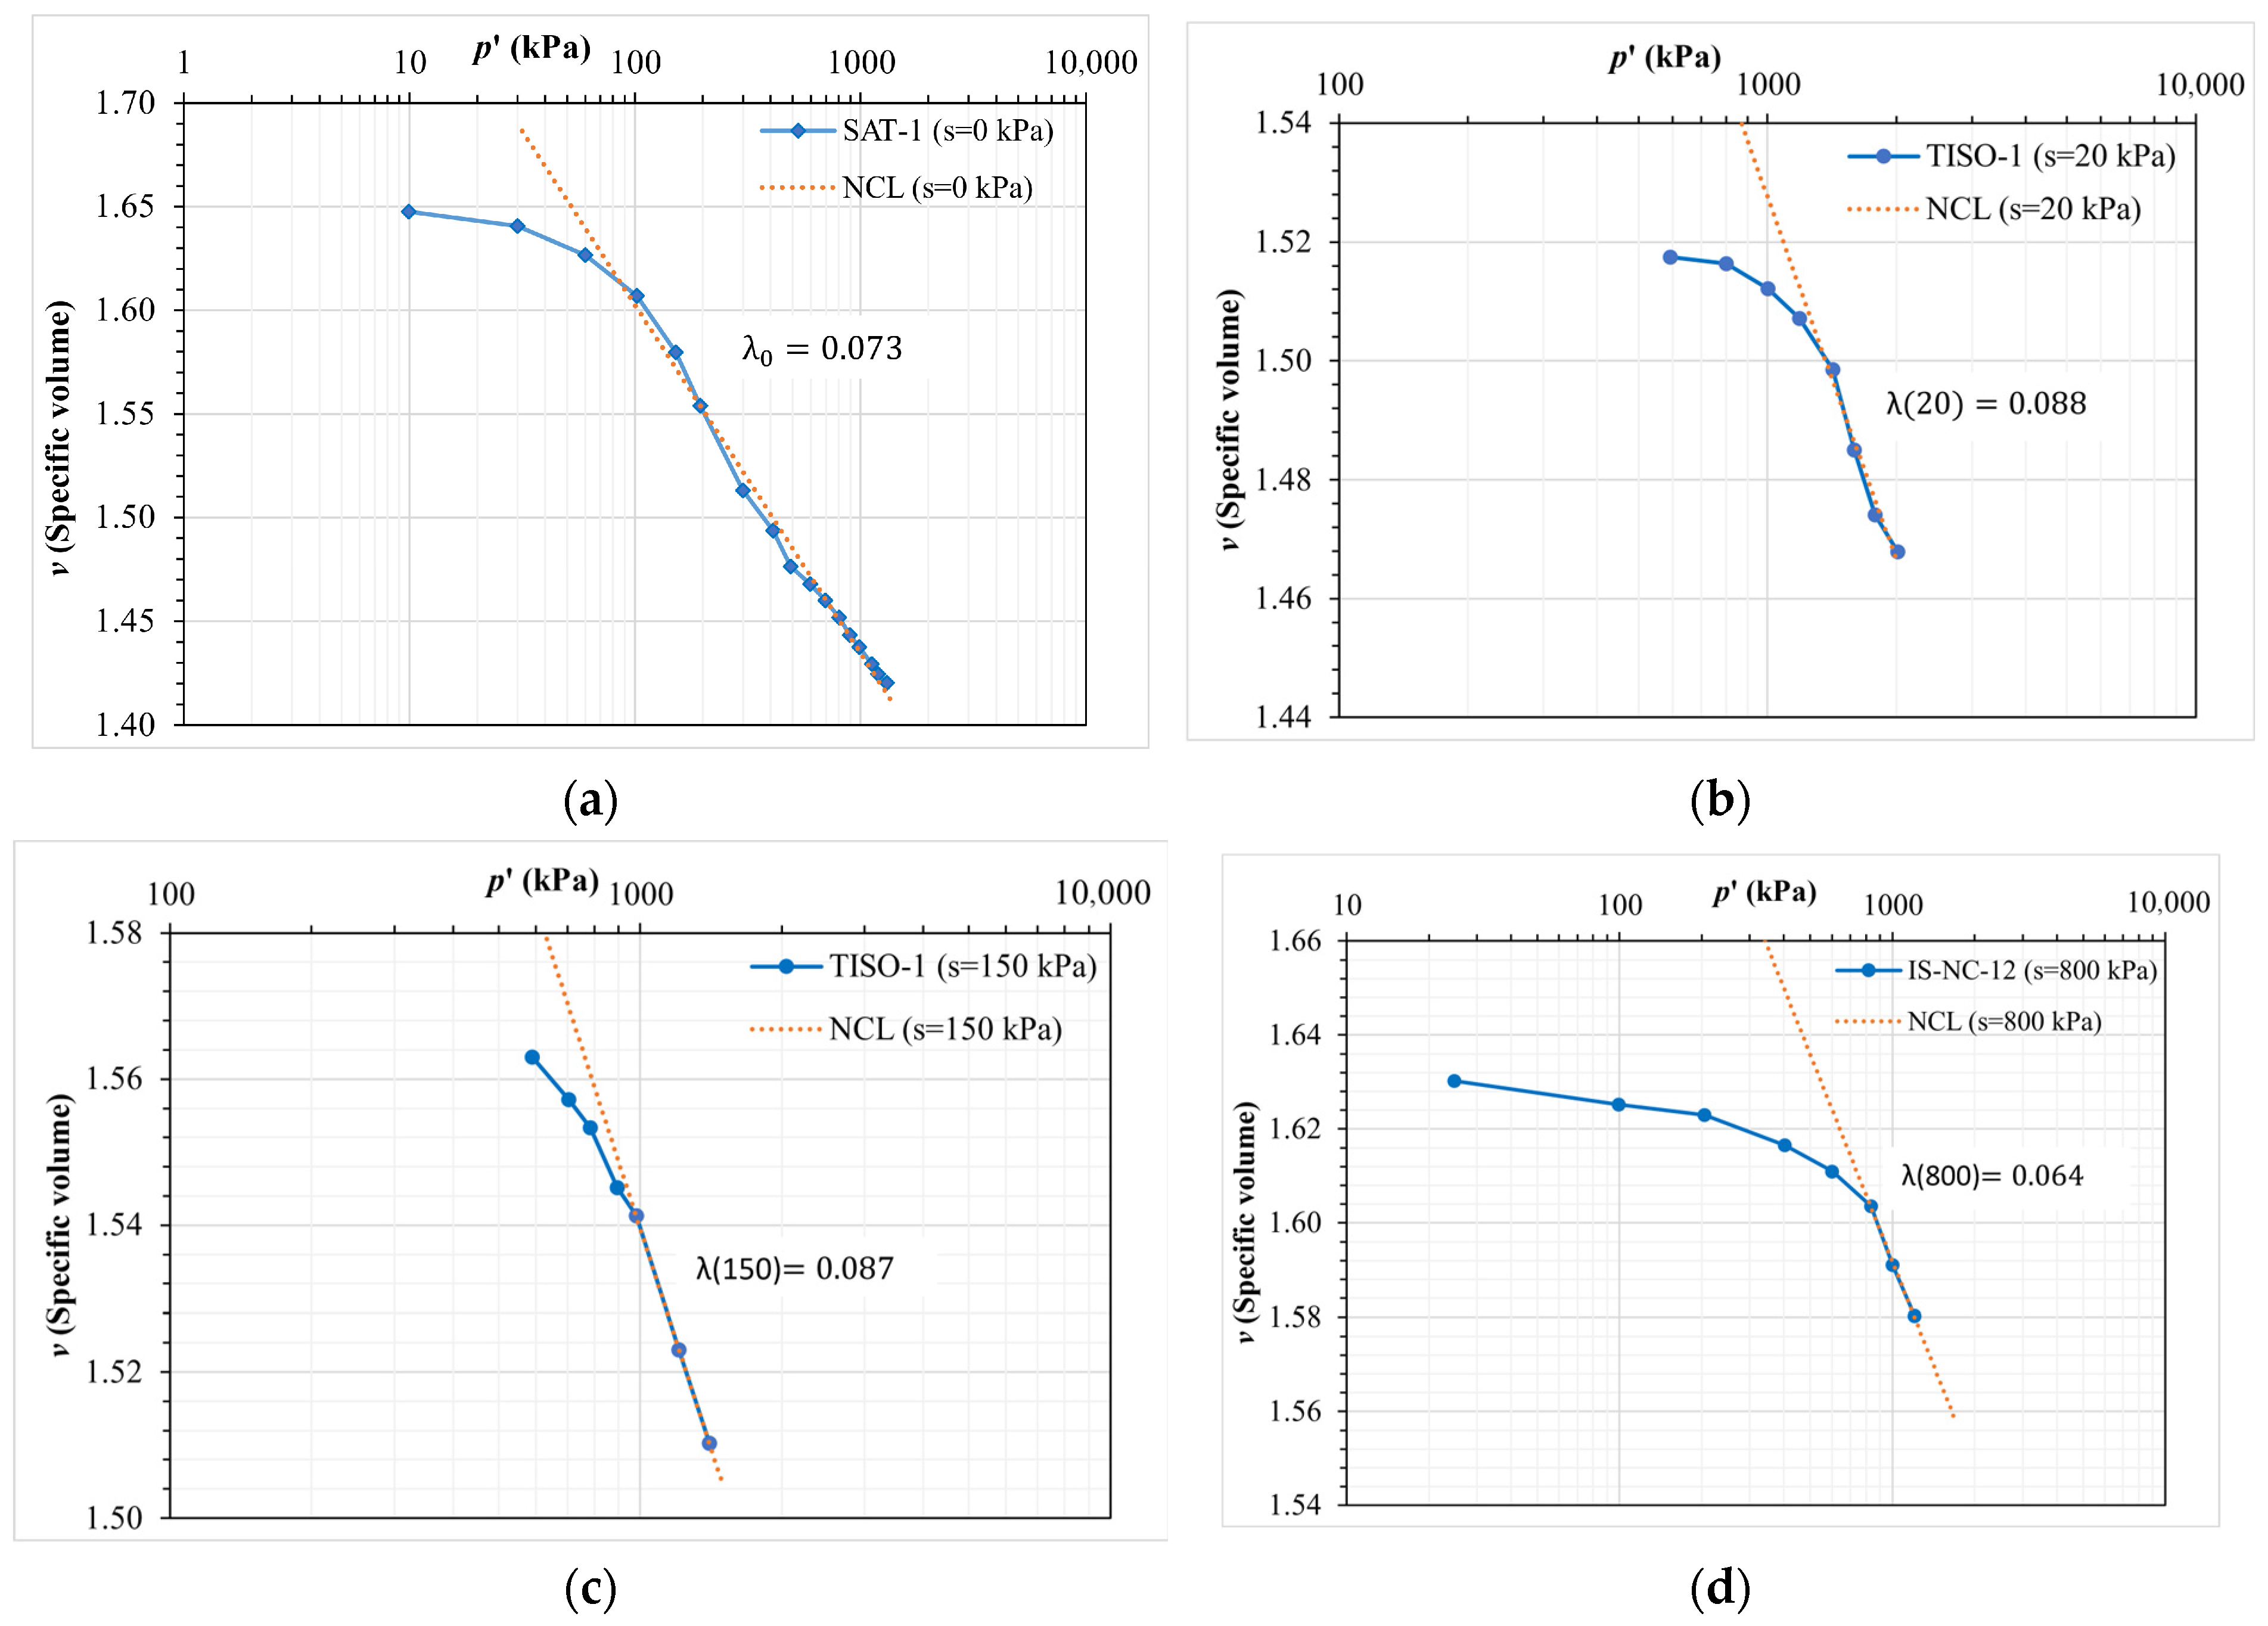
18]. Based on experimental tests, the NCLs and their slopes,
, for suction values
= 0, 20, 150, and 800 kPa were obtained, as shown in
Figure 1.
The above NCLs were normalized, with respect to
, specific volume at a reference stress of
(taken as 100 kPa), to be expressed in the form:
Normalization of the NCLs using
(normalized specific volume) is an important step in the sequential method to obtain the mapped specific volume
[
20], which in turn is used to determine the value for
.
A summary for
,
, and
for different suction values is shown in
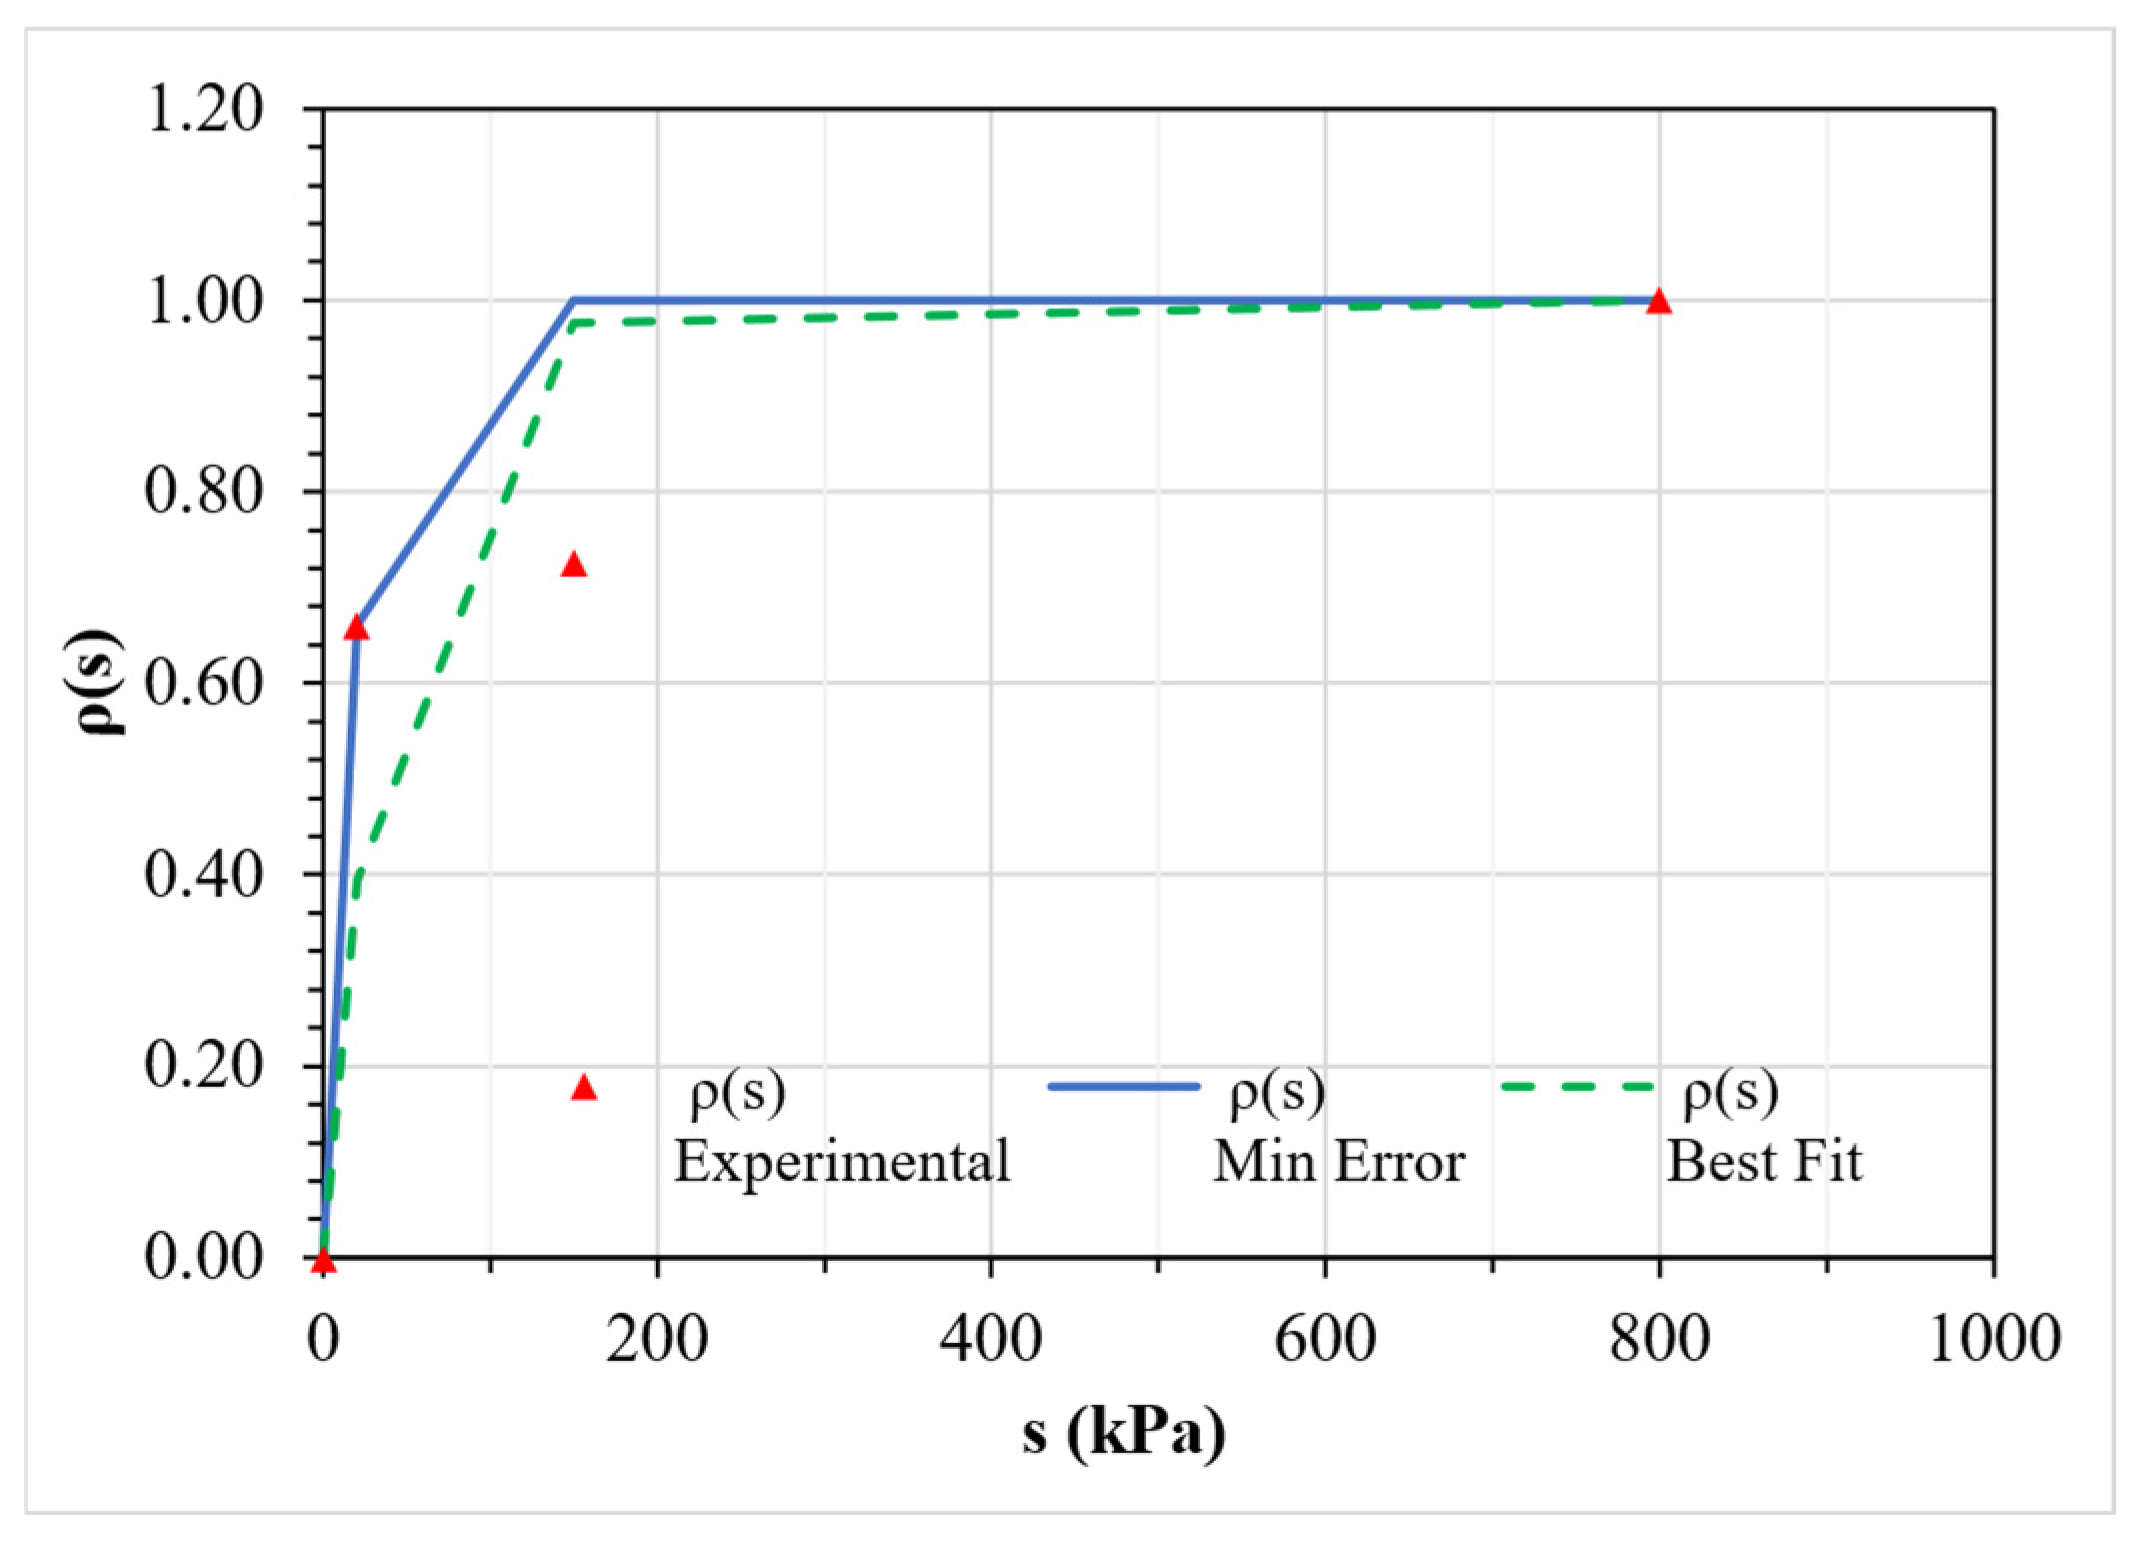
Table 1. The values for
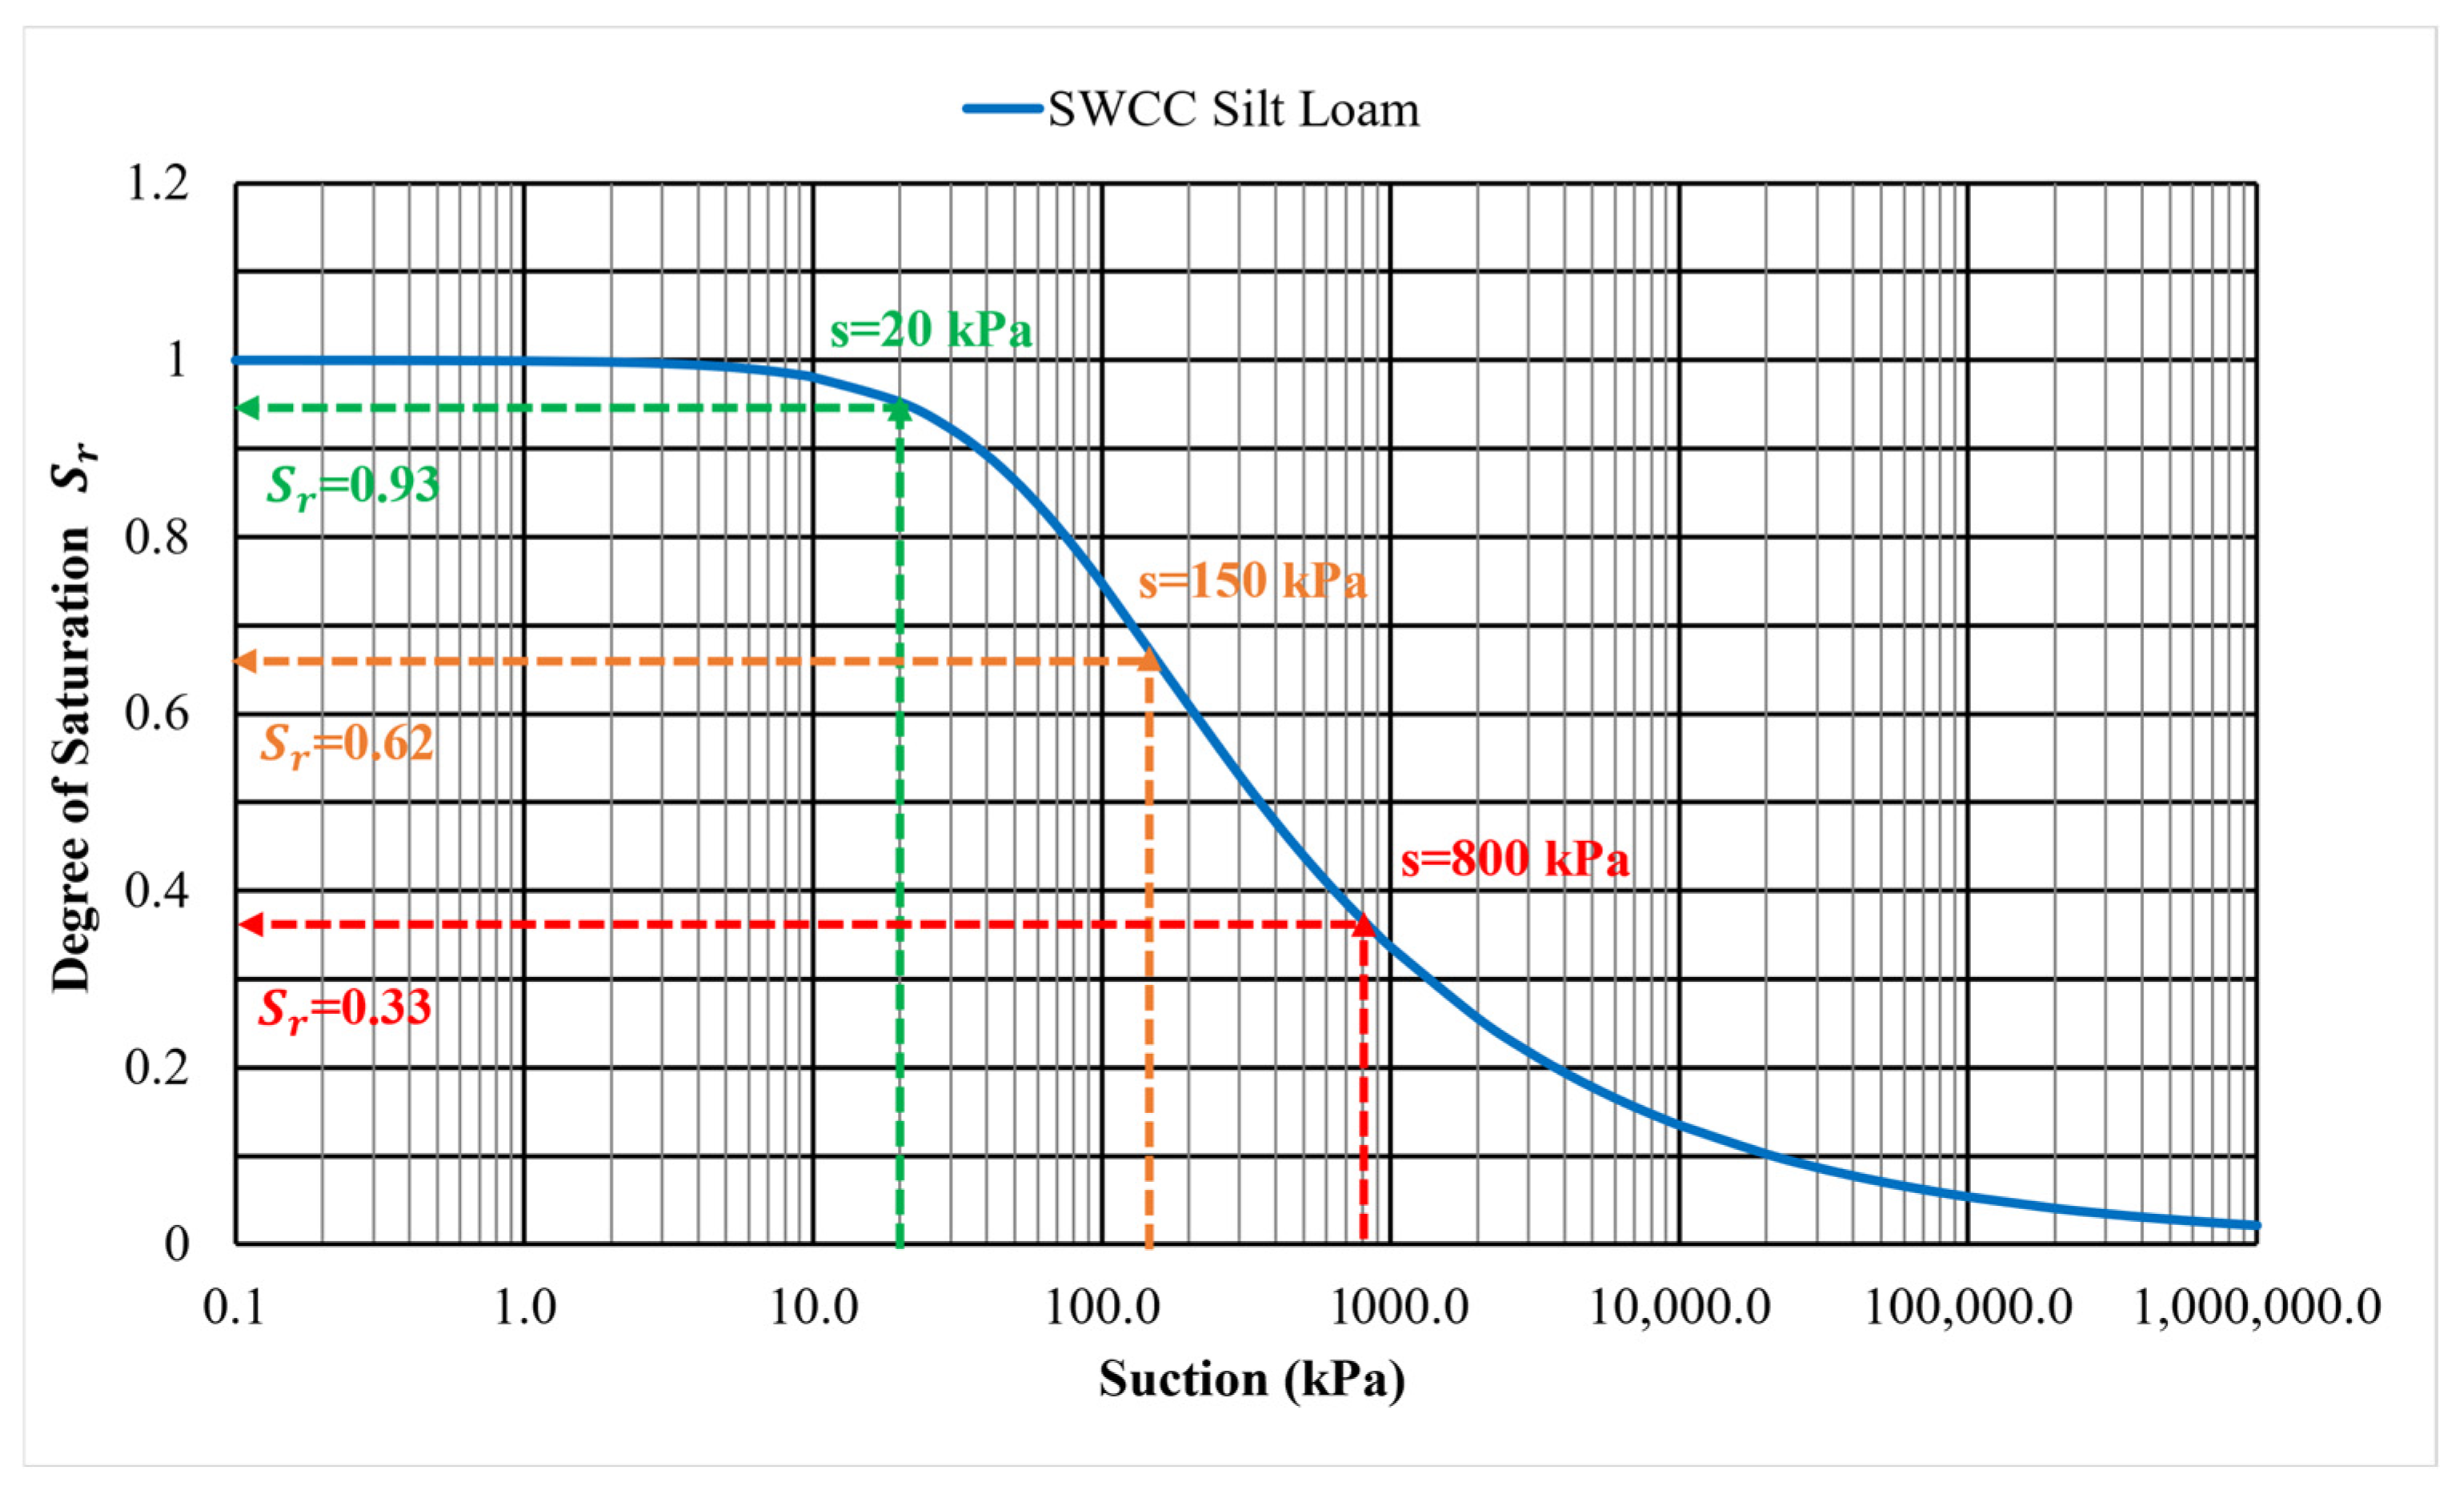
corresponding to each suction value were obtained from the soil water characteristic curve (SWCC) for typical silty loam [
28], shown in
Figure 2.
Prior to its use in the BBM calibration, the SWCC for typical silty loam reported in the literature [
28] was compared against available suction measurements using psychrometers on isotropically compacted specimens performed on the tested soil [
18]. These measurements covered a suction range of (0–4400) kPa, corresponding to
values from (100–20)%, respectively. The average void ratio for both SWCCs was about 0.6, whereas the average dry density was about 16.6 kN/m
3. The SWCC for silty loam provided an adequate fit to these experimental data points, confirming its applicability in this study under the tested conditions.
Once adjusting
according to Equation (7) and obtaining the values of
for different suction values, the mapped specific volume
[
29] in terms of the slope of the swelling line in
-
plane
, can be defined as follows:
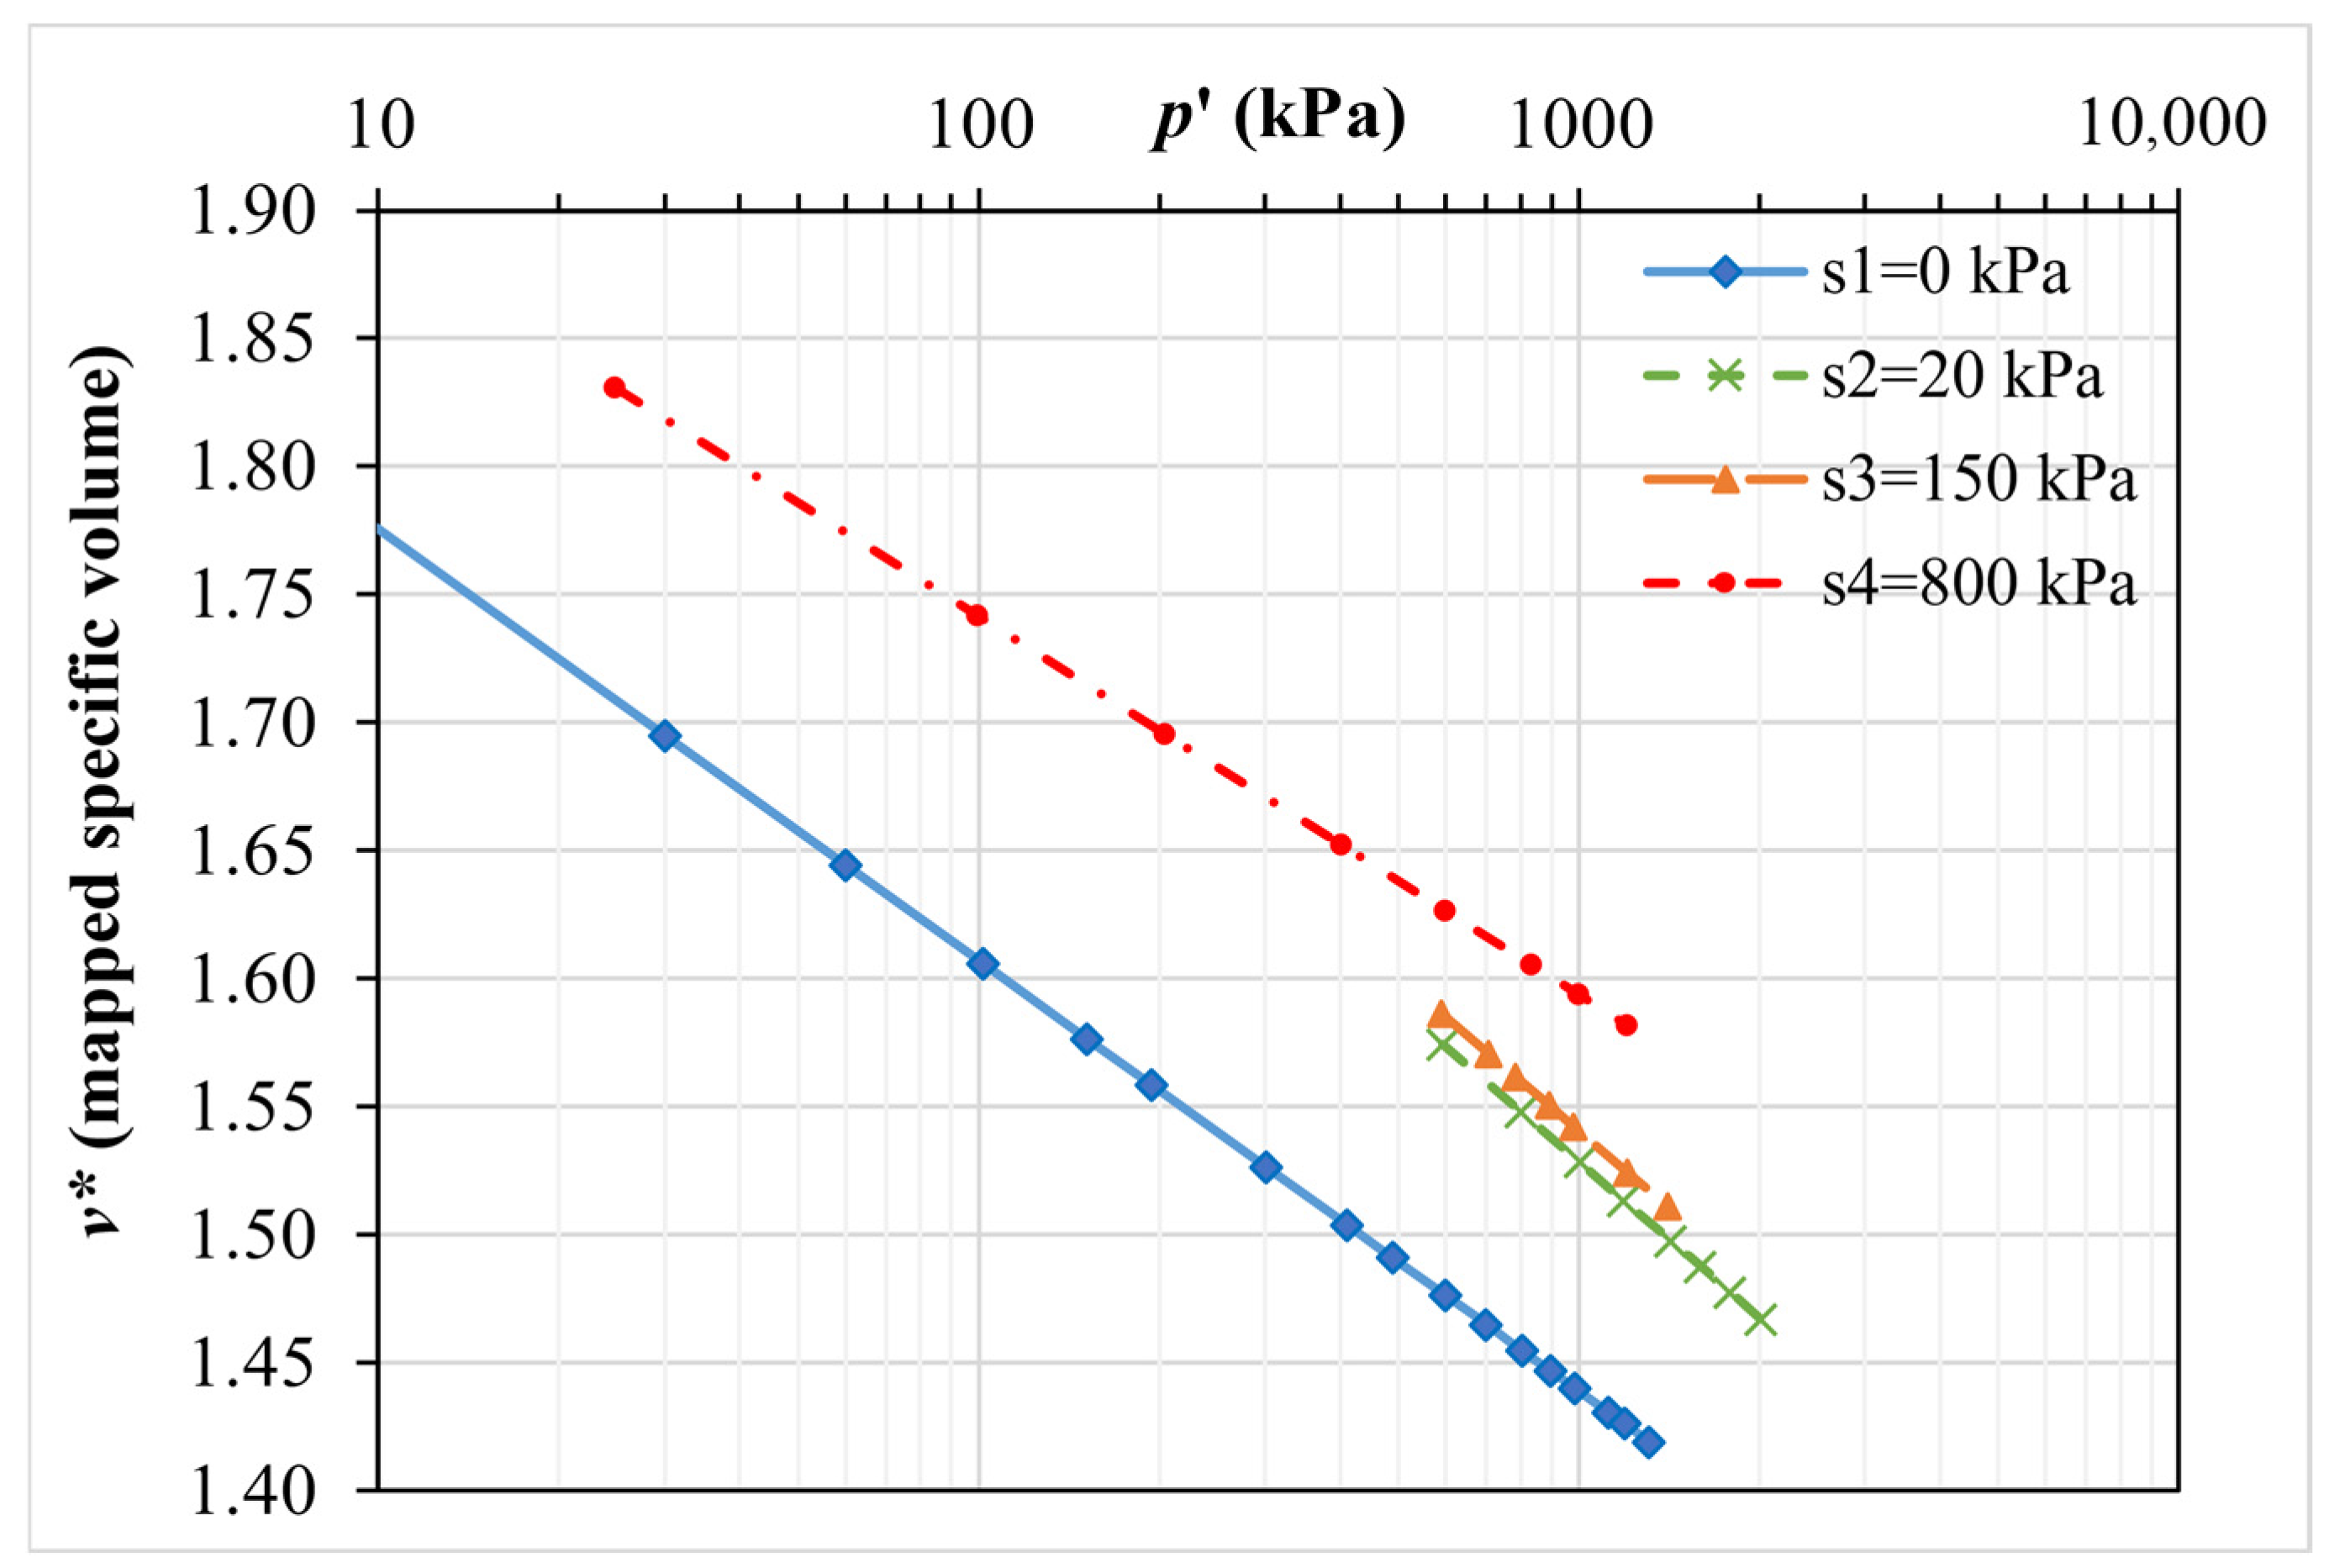
Hence, the relationship between
and
for different suction values
= 0, 20, 150, and 800 kPa obtained from lab test results is presented in
Figure 3.
3.1. Determination of β
The relative spacing between constant suction NCLs in - plane is solely governed by . Consequently, can be determined from experimental observations of this spacing without reference to other parameters, making it the initial parameter chosen in the sequential method.
The graphical equation for
is denoted as follows:
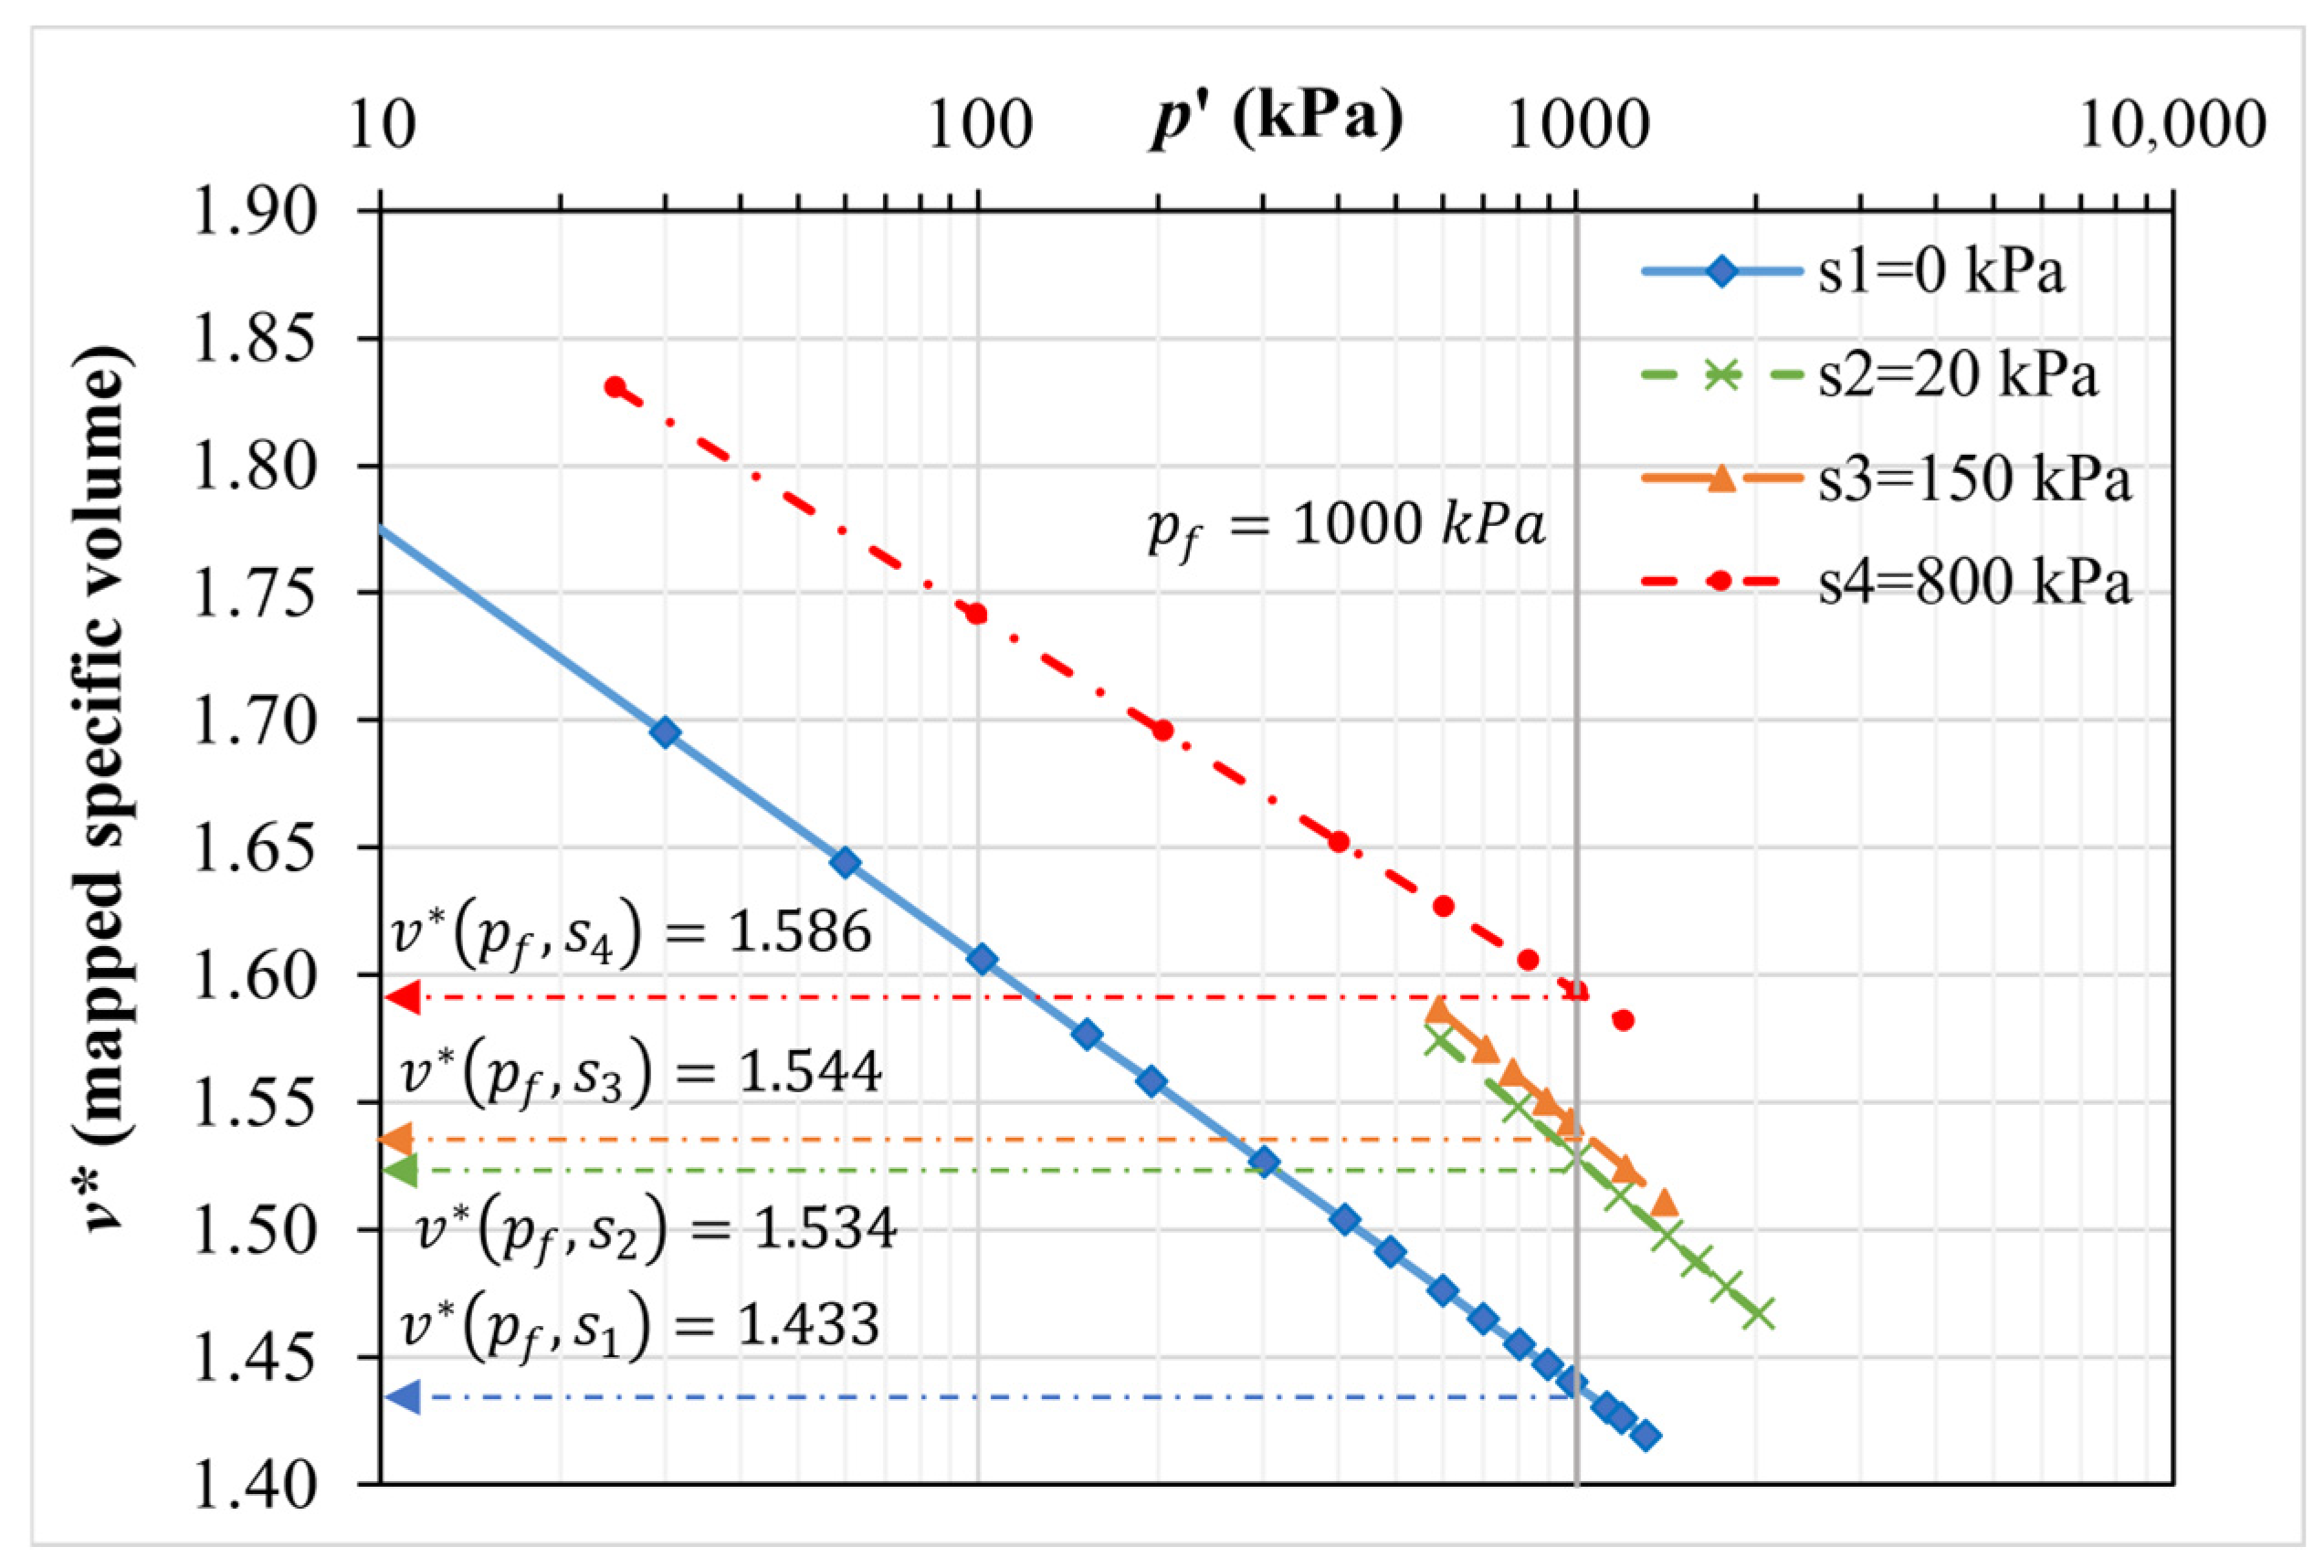
Figure 4 provides a graphical explanation of how to obtain
based on a reference pressure exclusive to the sequential method
of 1000 kPa. The value for
is not fixed, yet it is chosen according to experimental stress ranges within the four calibrated tests to improve the accuracy [
20]. The fully saturated state at
= 0 is taken as the minimum reference suction value
, whereas the maximum reference suction value
is taken as
= 800 kPa.
The theoretical value of
[
16] is expressed as follows:
Equation (10) is fitted to experimental values obtained from Equation (9), which leads to
= 0.054 kPa
−1 and
= 0.025 kPa
−1. The value of
is obtained by selecting a value for β which results in the least possible mathematical error between
values of Equations (9) and (10), whereas the value for
is obtained by selecting a value for
which results in a best fit graphical representation for the
values plotted in
Figure 5. The mean squared error (MSE) for
and
are 0.018 and 0.033, respectively.
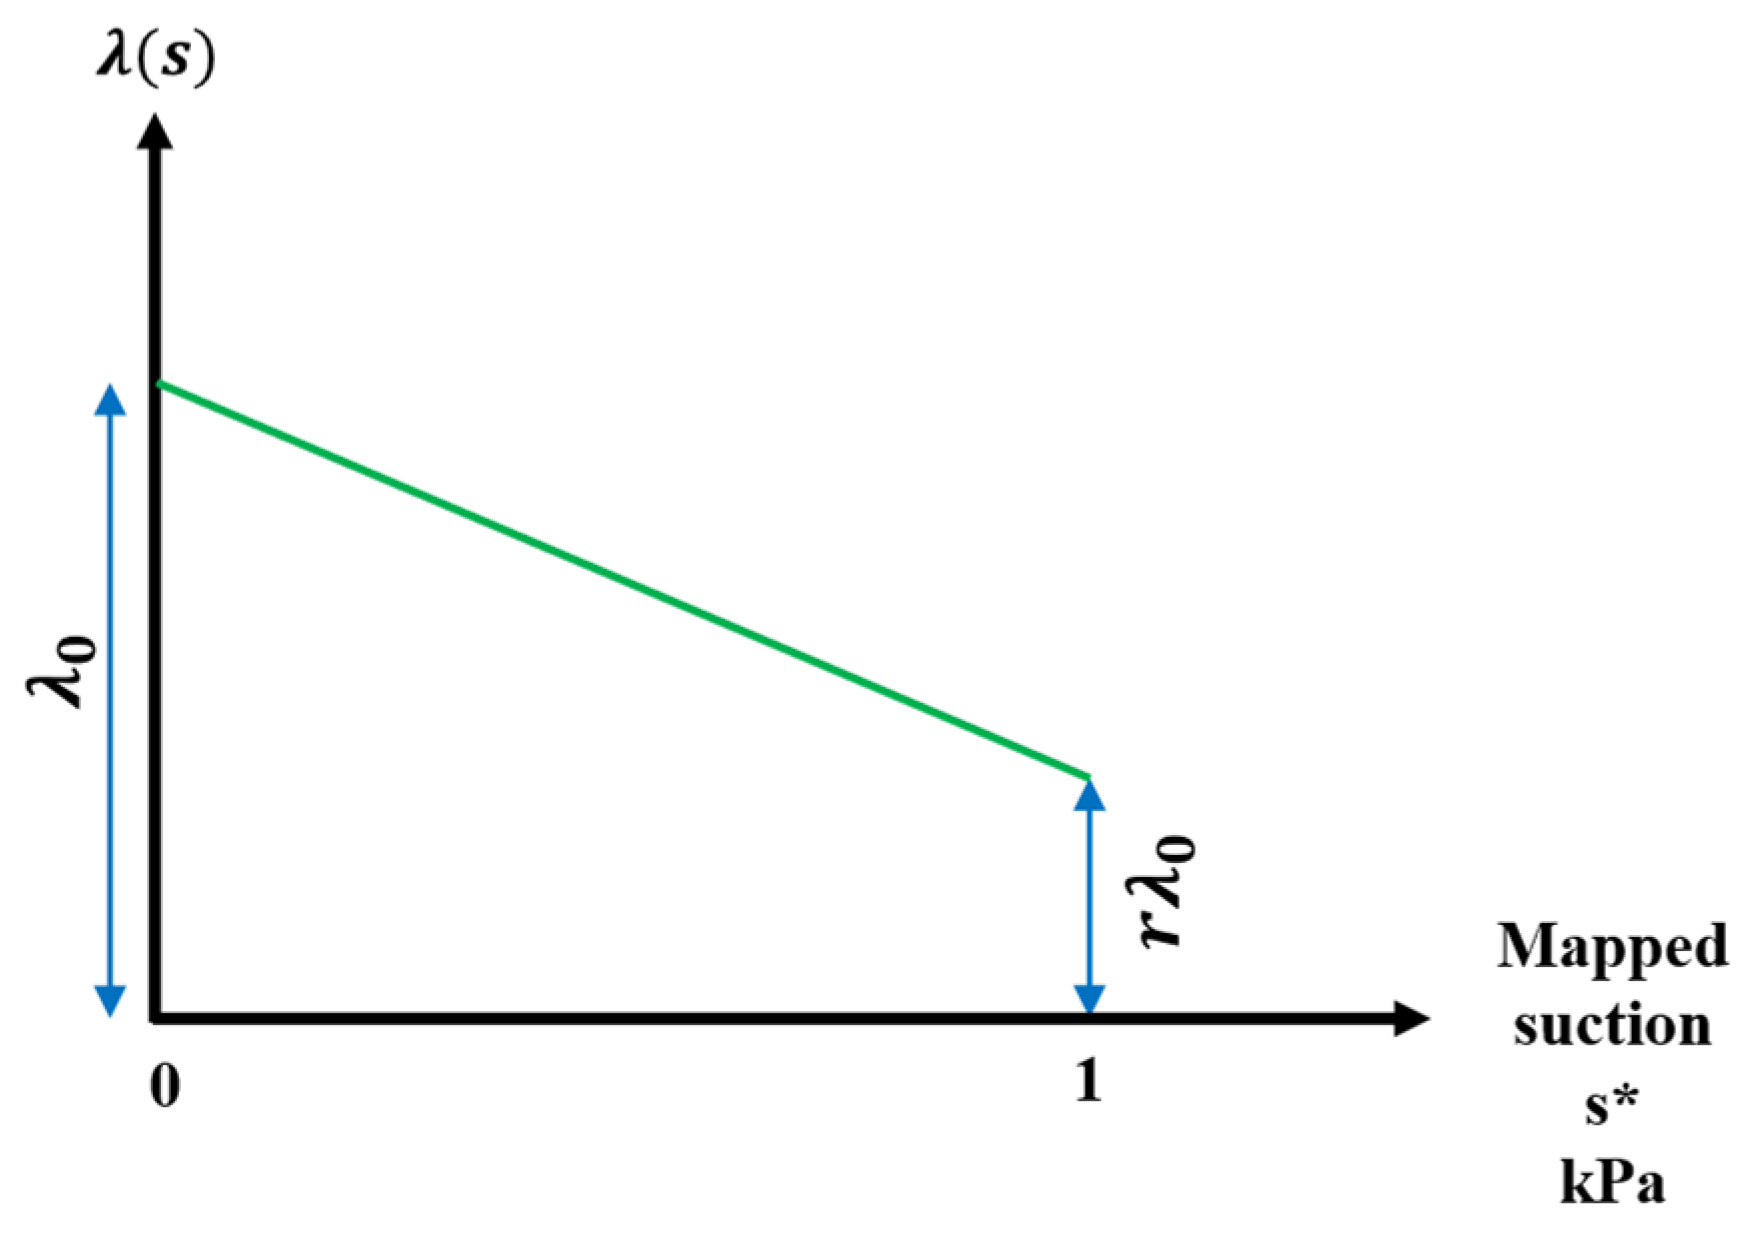
3.2. Determination of and r
The parameter “
” is determined indirectly from the terms
(slope of NCL at infinite suction) and
(slope of NCL at zero suction) by fitting the linear relation expressed as Equation (11) to the experimental slopes of the NCL at certain suction values.
where
is an auxiliary variable defined as mapped suction
The intercept of Equation (11) at
= 0 determines the value of
, whereas the intercept at
= 1 determines the value of
, as shown in
Figure 6, which leads to
= 0.8 and
= 0.073.
3.3. Determination of and
The relative position of the NCLs, at a specified suction value, is fixed once the three parameters
,
and
are established. Furthermore, all NCLs must intersect in
-
plane at a single point with abscissa
and ordinate
. Any variation in the value of
, while maintaining the other parameters as constant, leads to a rigid horizontal translation of the NCLs. This implies that the vertical spacing between NCLs at a given reference stress increases or decreases as
is varied. Based on this behaviour, the value of
can be determined by matching the experimental vertical spacing between two NCLs at a specified reference stress to satisfy the following equation:
After determining the value of the abscissa
, the ordinate
of the intersection point of the NCLs in
-
plane is calculated by imposing a zero average error between the predicted and experimental values of
at the reference stress
for the
experimental suction levels by substituting in the following equation:
Yielding = 0.028 kPa and = 2.264.
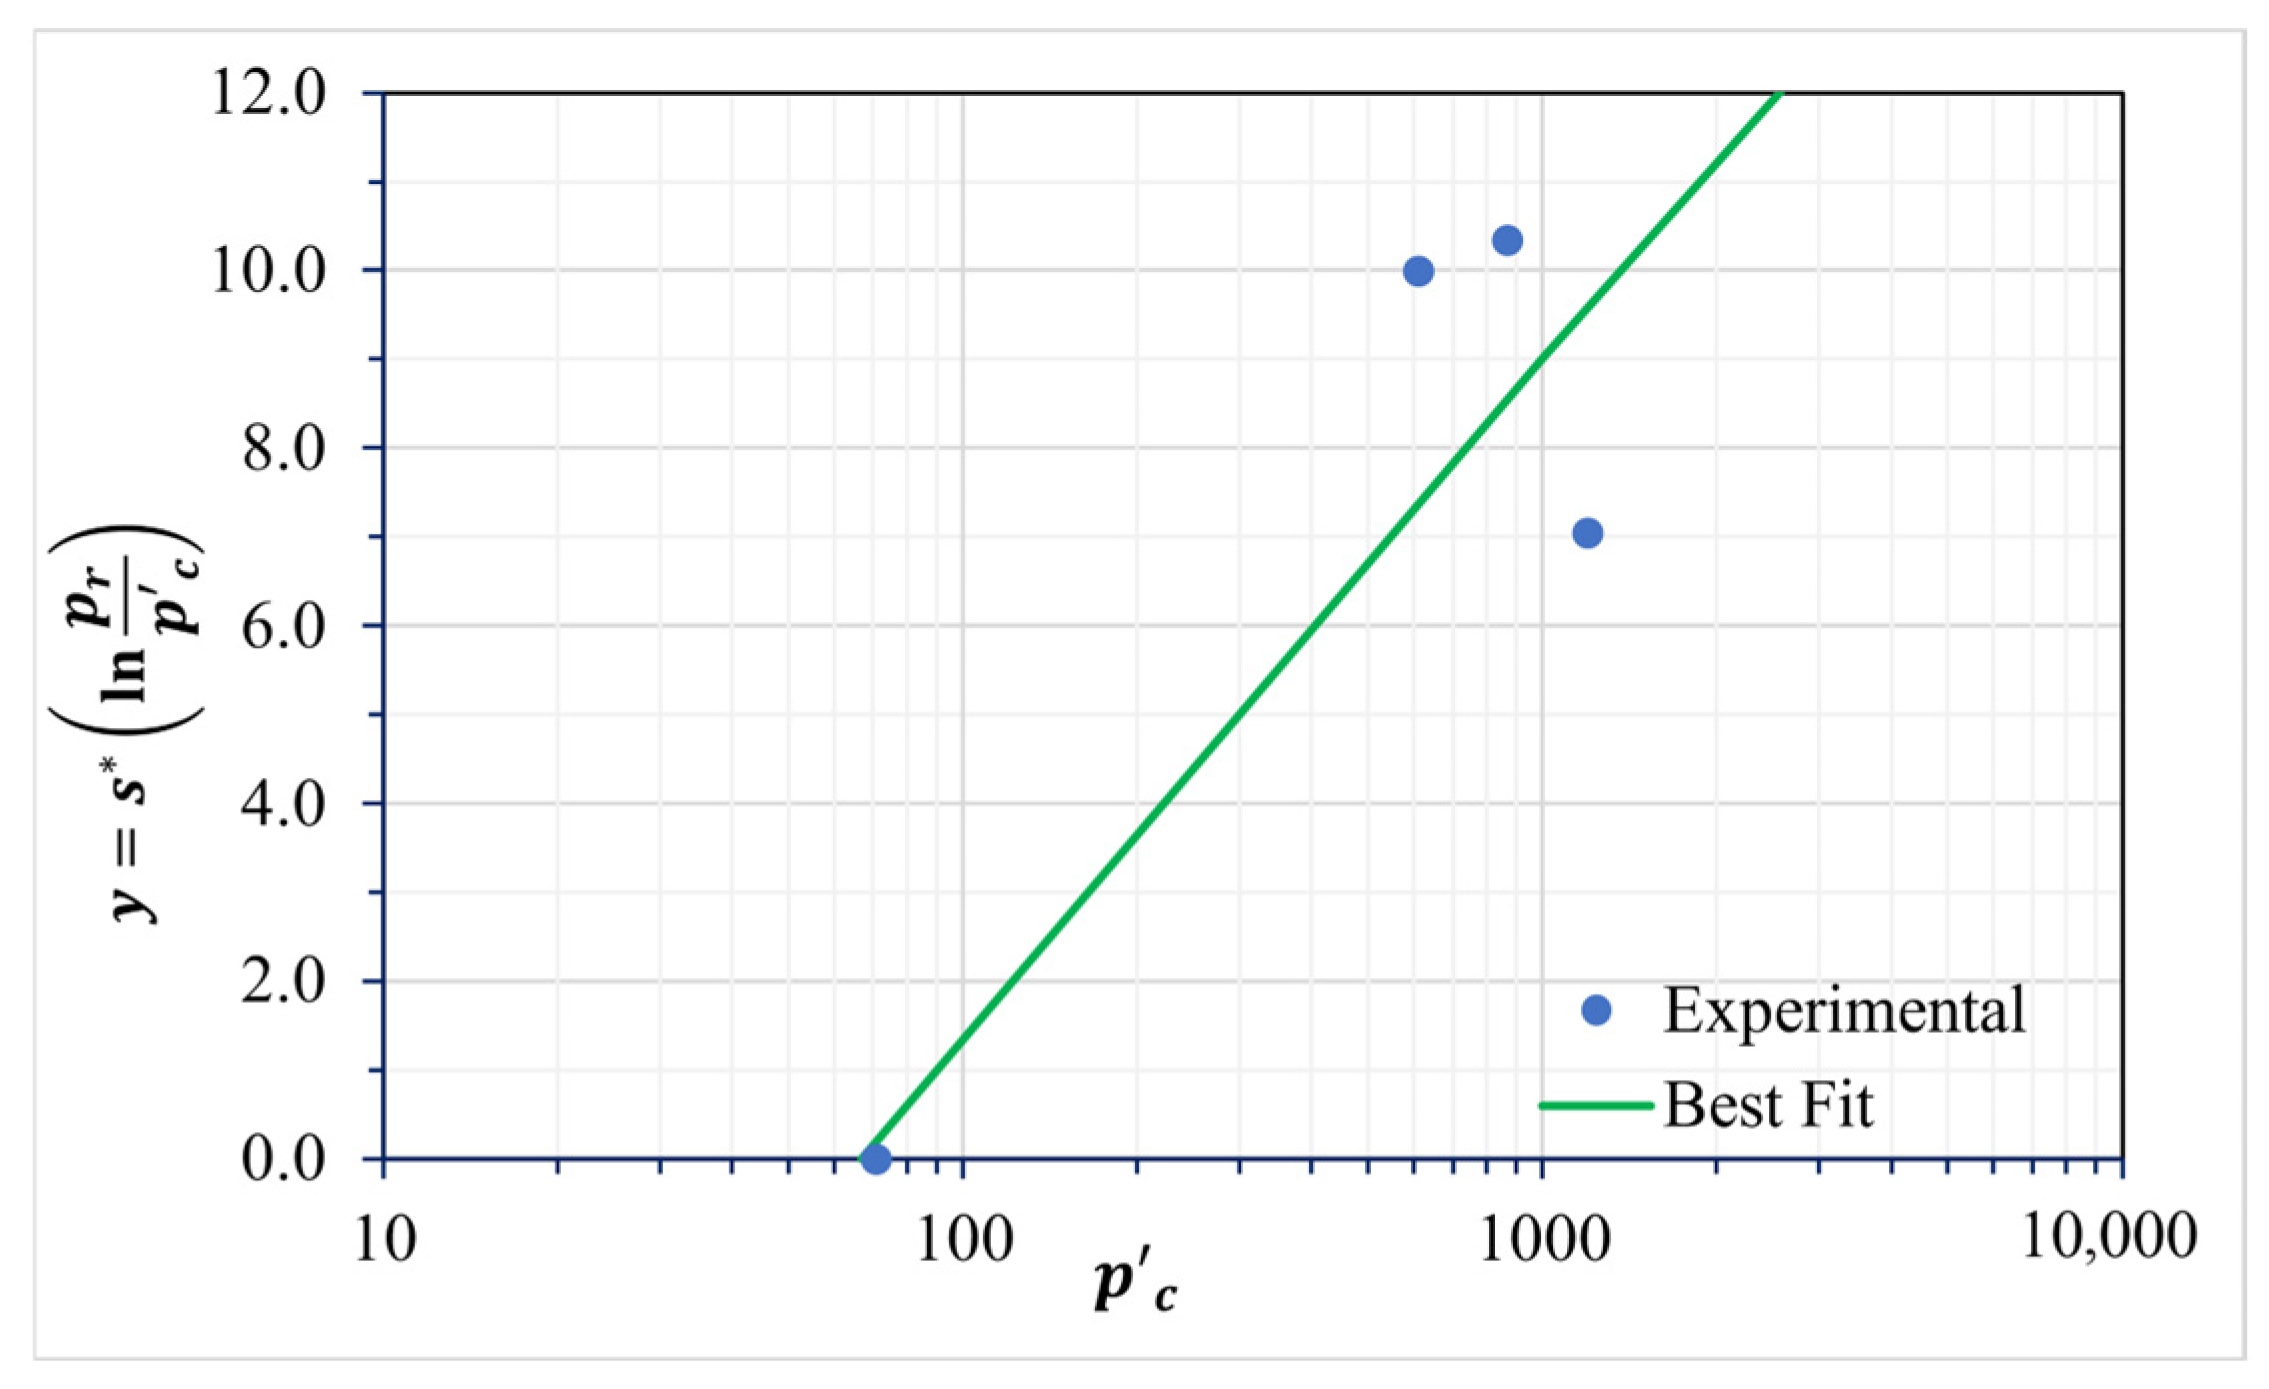
3.4. Hardening Parameter Determination by Fitting Experimental Data
The value of the initial hardening parameter
can either be taken as the preconsolidation stress determined from isotropic loading at zero suction (full saturation) or determined by fitting the load collapse equation to isotropic yield stresses measured at different suction values from samples that have not been tested along plastic stress paths [
20]. In this study, the fitting process is utilized to check the validity of the other previously determined parameters.
The load collapse yield curve equation is rearranged as follows:
where “
y” is an auxiliary variable equal to
Therefore, a straight line with slope
can be fitted to the experimental data points of coordinates y and
so that the value of
is estimated as the intersection of the line with the
X-axis at
= 0, yielding
= 68 kPa as shown in
Figure 7.
3.5. Summary of Estimated Parameters
The current study parameters, estimated using the sequential method [
19], are presented in
Table 2, alongside the estimated parameters by the seven teams in the benchmark exercise [
17], as well as an estimation conducted by D’onza et al. [
20] for comparison. The value for
in
Table 2 for the current study parameters is
. This value will be used for all Plaxis soil test facility simulations.
Despite being provided with the same laboratory test data [
18], there is a great variation in the estimated BBM parameters, indicating that the complexity of the BBM not only stems from the need to conduct suction-controlled tests on unsaturated soil, but also from the interpretation and analysis of the test data and estimation of parameters. It is to be noted that the estimation of most of the parameters requires adequate knowledge of the background of formulating the BBM. For example, when determining the value “
”, it is important to establish the value of
from isotropic compression tests on a fully saturated sample to compare with the value of
obtained from the best fit method and calibrate accordingly. Also, the value of
should ideally be less than unity to result in a reasonable value for
. When
is set to greater than 1, Equation (13) returns an unrealistically high value of
which contradicts the definition of the reference effective pressure in the BBM formulation, where
should be less than
.
3.6. Sensitivity of on Determining the BBM Parameters
A sensitivity analysis was performed to study the effect of the initial selection of
on the main BBM parameters [
and
]. The selected values of
correspond to the upper and lower bounds of the common applied net stress domain shared by the 4 NCLs.
Table 3 shows that the effect of
on the variation in the BBM parameters is minimum. Back-analysis is performed using parameters derived from
= 1000 kPa.
3.7. Considerations and Limitations of the Sequential Method
The sequential method [
19] offers a systematic and relatively straightforward framework for determining the parameters of the Barcelona Basic Model (BBM). Nonetheless, some considerations must be acknowledged. The accuracy of the procedure is inherently dependent on high-quality experimental data derived from suction-controlled isotropic and triaxial tests. Consequently, meticulous execution of these tests and rigorous validation of the resulting data are imperative. Furthermore, the interpretation of test outcomes, particularly during curve-fitting, may introduce minor variability depending on the optimization criteria employed. For robust calibration, it is essential to perform a minimum of four individual tests conducted across a spectrum of suction values, ideally spanning a wide range to capture the nonlinear hydro-mechanical behaviour of unsaturated soils. Calibration based on a narrow suction range may yield parameters that are not representative of the soil behaviour outside the tested interval, thereby compromising the model’s predictive capability when extrapolated to conditions beyond the calibration domain.
4. Numerical Simulation for Laboratory Tests Using Finite Element Analysis
The soil test facility feature in Plaxis software (Bentley Systems, Delft, The Netherlands,), using the current study parameters, was employed to simulate SAT-1, TISO-1, and IS-NC-12 tests [
18] for back analysis and verification of the estimated parameters. The results of the simulations are graphically represented in
-
space and compared with the experimental data [
18] and benchmark study data [
17]. This study focuses mainly on how the current study parameters adequately represent the experimental results. The benchmark study data is represented for relative purposes only.
4.1. Simulation of SAT-1 Test
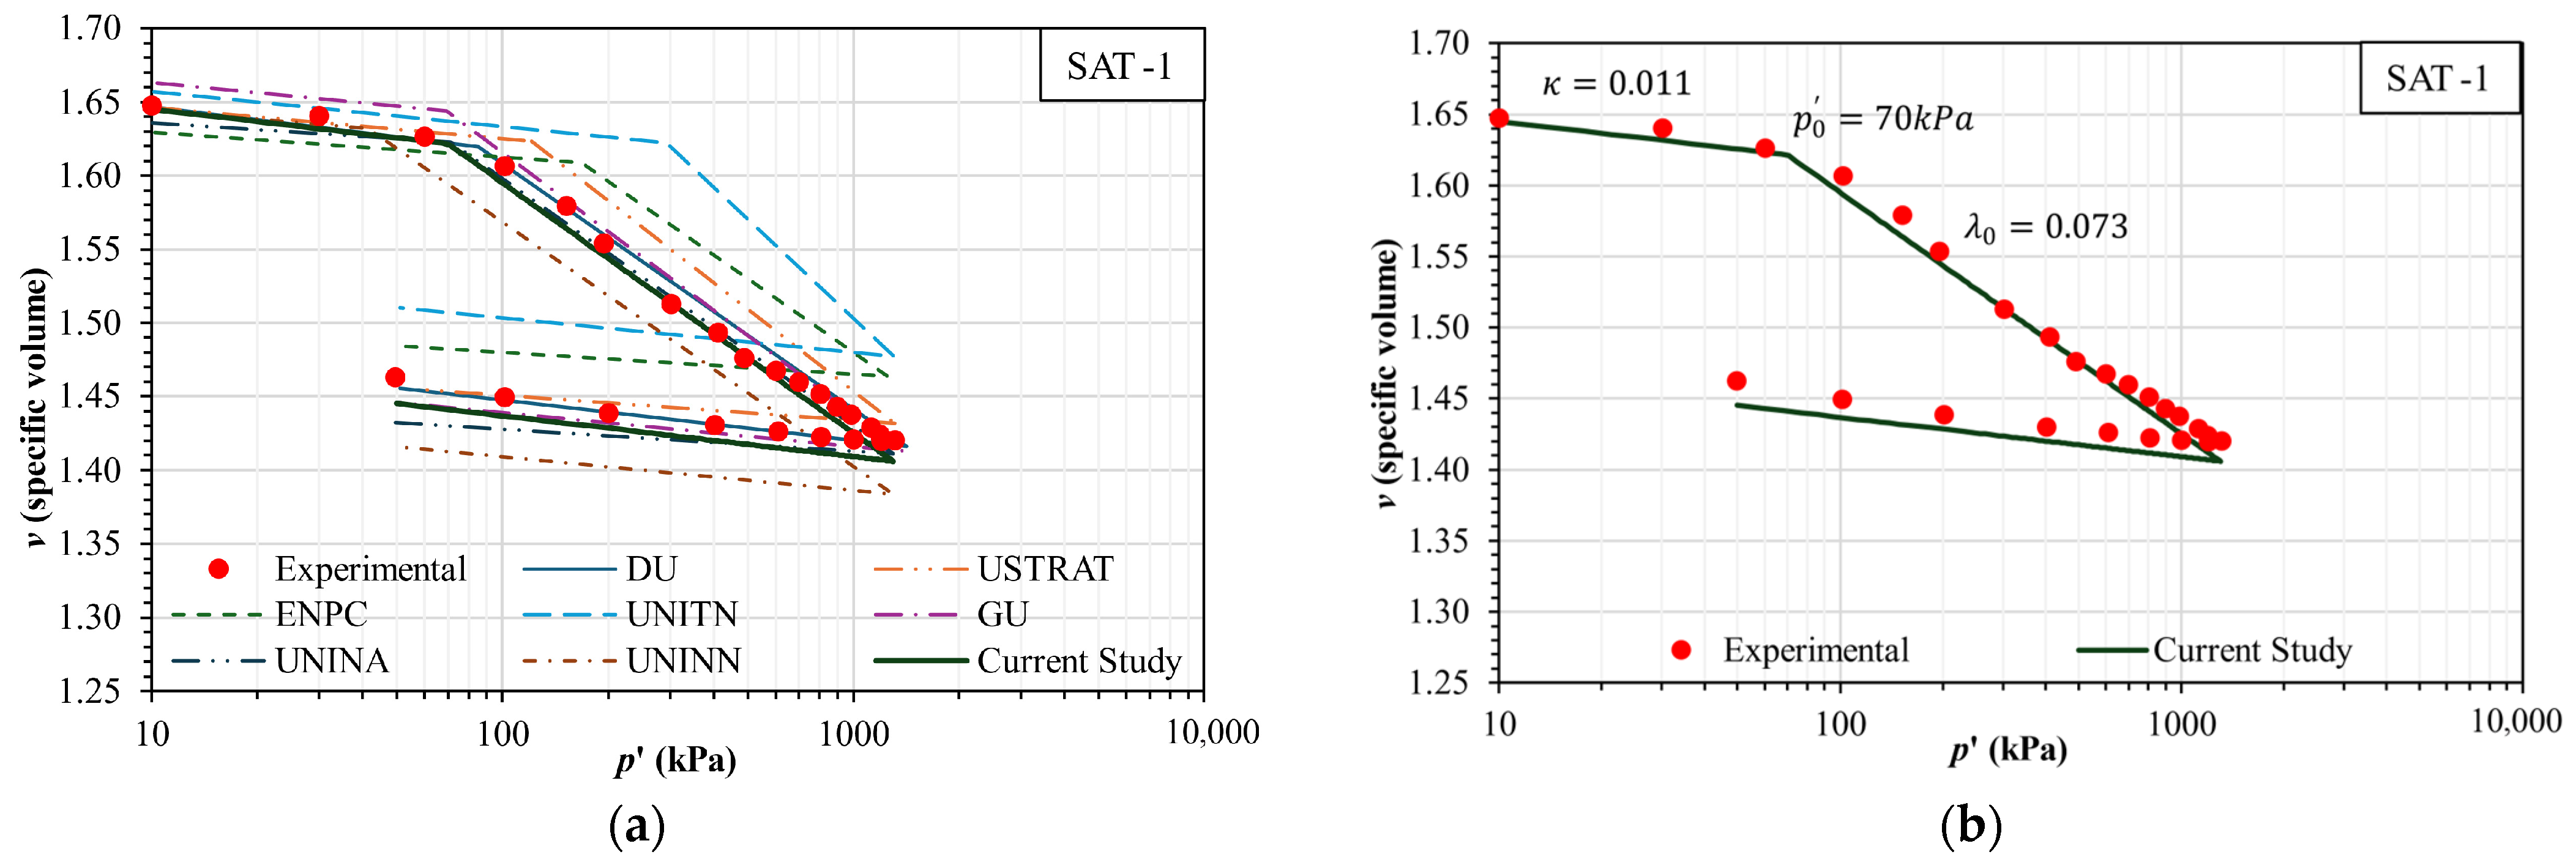
The first experimental test to be verified was SAT-1, which consisted of isotropic compression loading of a fully saturated sample (s = 0) from
= 10 kPa to 1300 kPa and then unloading to 50 kPa, at an initial void ratio,
, of 0.65. The soil test facility option in Plaxis [
26] was utilized. For isotropic loading, the initial effective stress in x, y, and z directions is the same and equal to 10 kPa. Throughout each phase, stress increments are increased with equal value in all three directions until the maximum load of 1300 kPa is reached. Then, stress increments are entered with a positive value in all three directions to indicate removal of the load till 50 kPa.
For the fully saturated isotropic test SAT-1,
Figure 8 shows good agreement between the experimental results and the Plaxis isotropic test simulation using the current study parameters. However, the agreement of the data from the SAT-1 test alone is not capable of analyzing the suitability of the parameters to simulate the behaviour of unsaturated soil. As previously stated, at the fully saturated case, the BBM and the MCC model give almost the same results, i.e., at the fully saturated state, the simulation does not depend on the additional BBM parameters and depends mainly on the same parameters that define the MCC, which are
and
.
4.2. Simulation of IS-NC-12 Test
The IS-NC-12 test was an unsaturated triaxial test at = 800 kPa, consisting of isotropic loading from = 25 kPa to 1200 kPa, followed by shearing at = 0.63. The simulation of this test procedure was performed in two steps: isotropic loading and then shearing.
Since the test was conducted in a partially saturated state, the suction value was defined in the simulations, as well as all the required associated parameters. The PBBM uses Bishop’s effective stress in its definition, which requires setting the values for the groundwater parameters and SWCC for the unsaturated state. By implementing the Van Genuchten SWCC fitting method [
30] and using the percentage of soil components within the tested Jossigny soil sample after [
18], the required parameters to determine Bishop’s effective stress are obtained.
Then, the isotropic test is simulated in a similar method to SAT-1. The total stress is back-calculated to achieve the required effective stress, which is in a non-editable box. The triaxial shearing test was simulated using the conventional triaxial tab in the soil test facility feature.
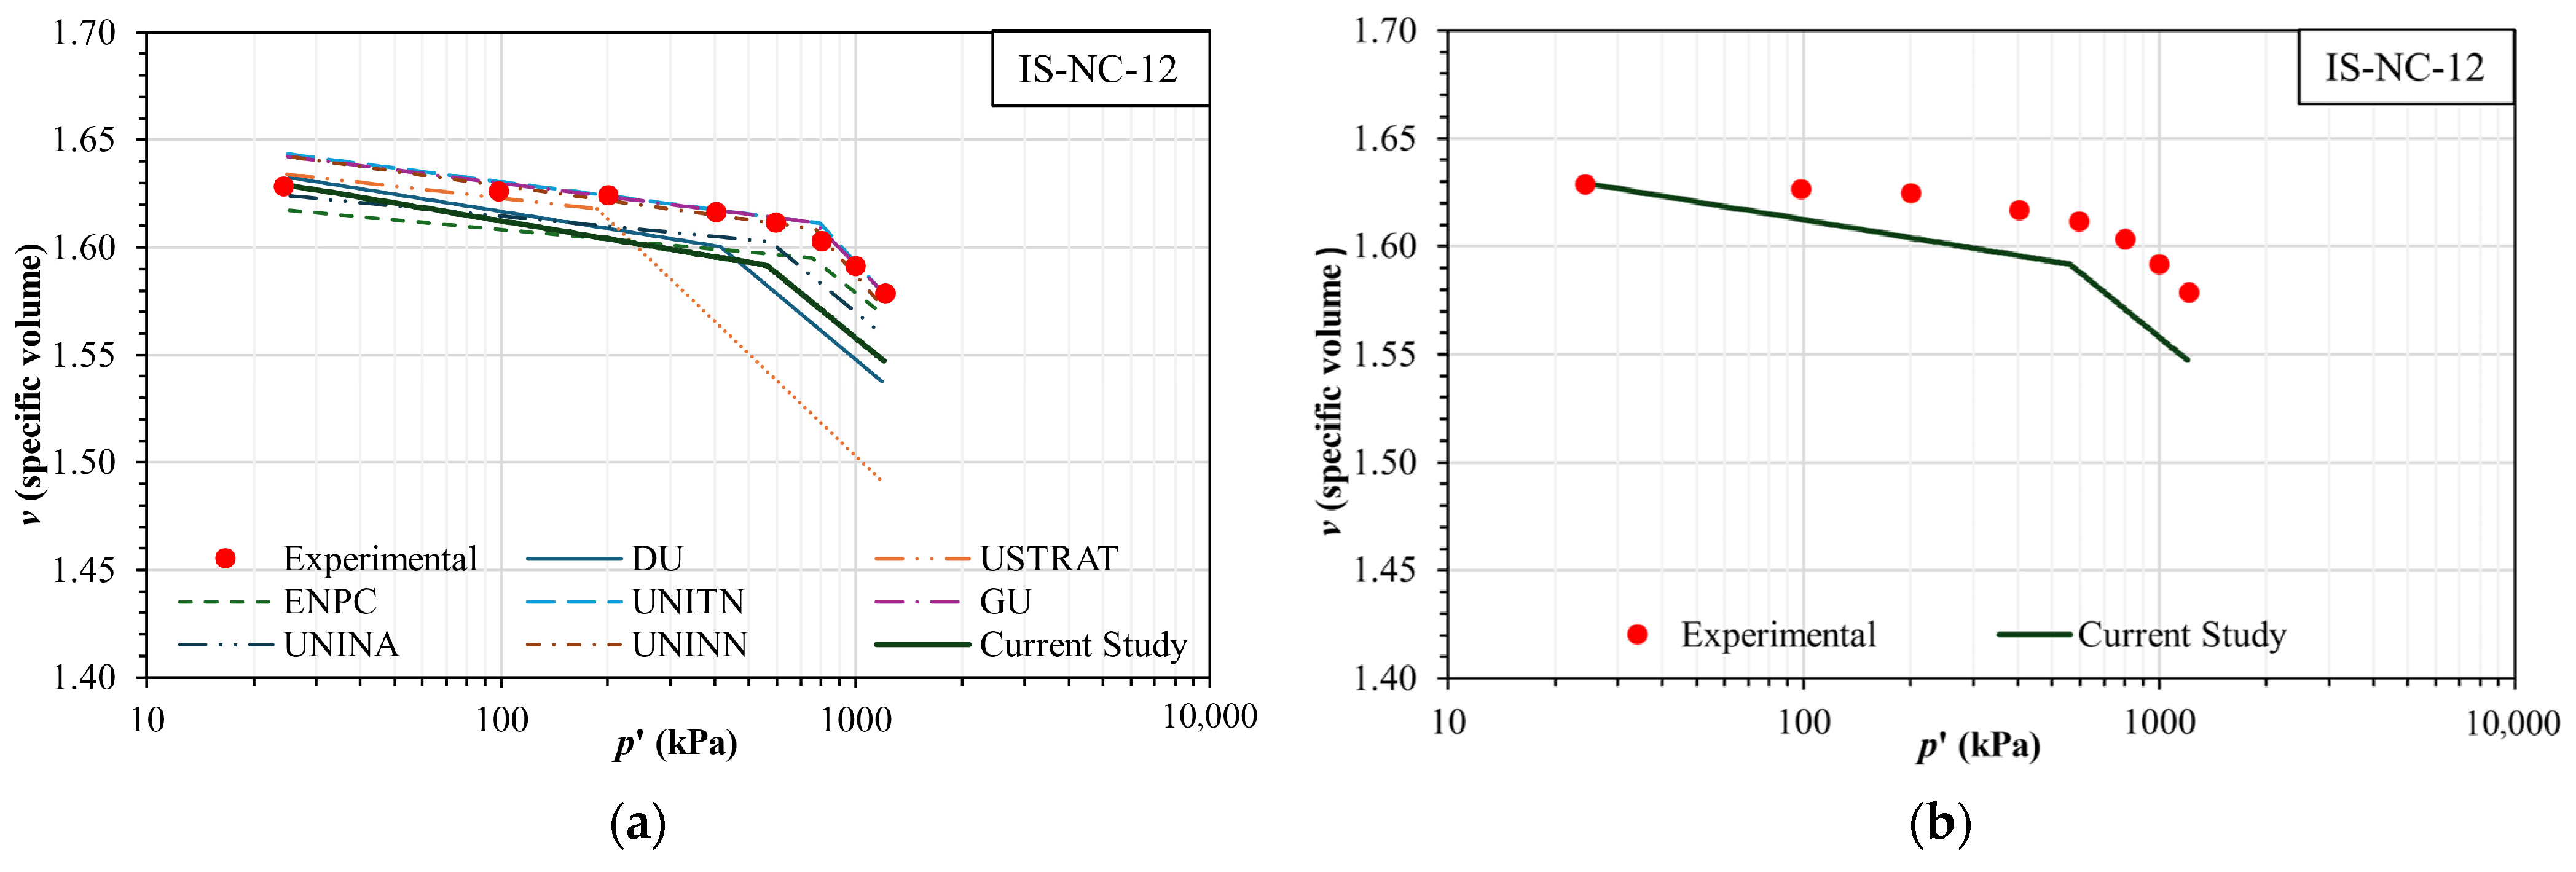
For the isotropic compression loading stage of IS-NC-12, shown in
Figure 9, the current study simulations show good agreement with the experimental values. The value of
at a suction value of 800 kPa from the current study simulation is 682 kPa, which almost coincides with the experimental data, which has a value of 675 kPa. For pre-yielding, values of
are less than
, and the slope
from the current parameters simulation is slightly steeper than the experimental results. For the NCL segment of the graph,
values greater than
, and the values for
at
= 800 kPa for the current study simulation and experimental data are 0.063 and 0.064, respectively.
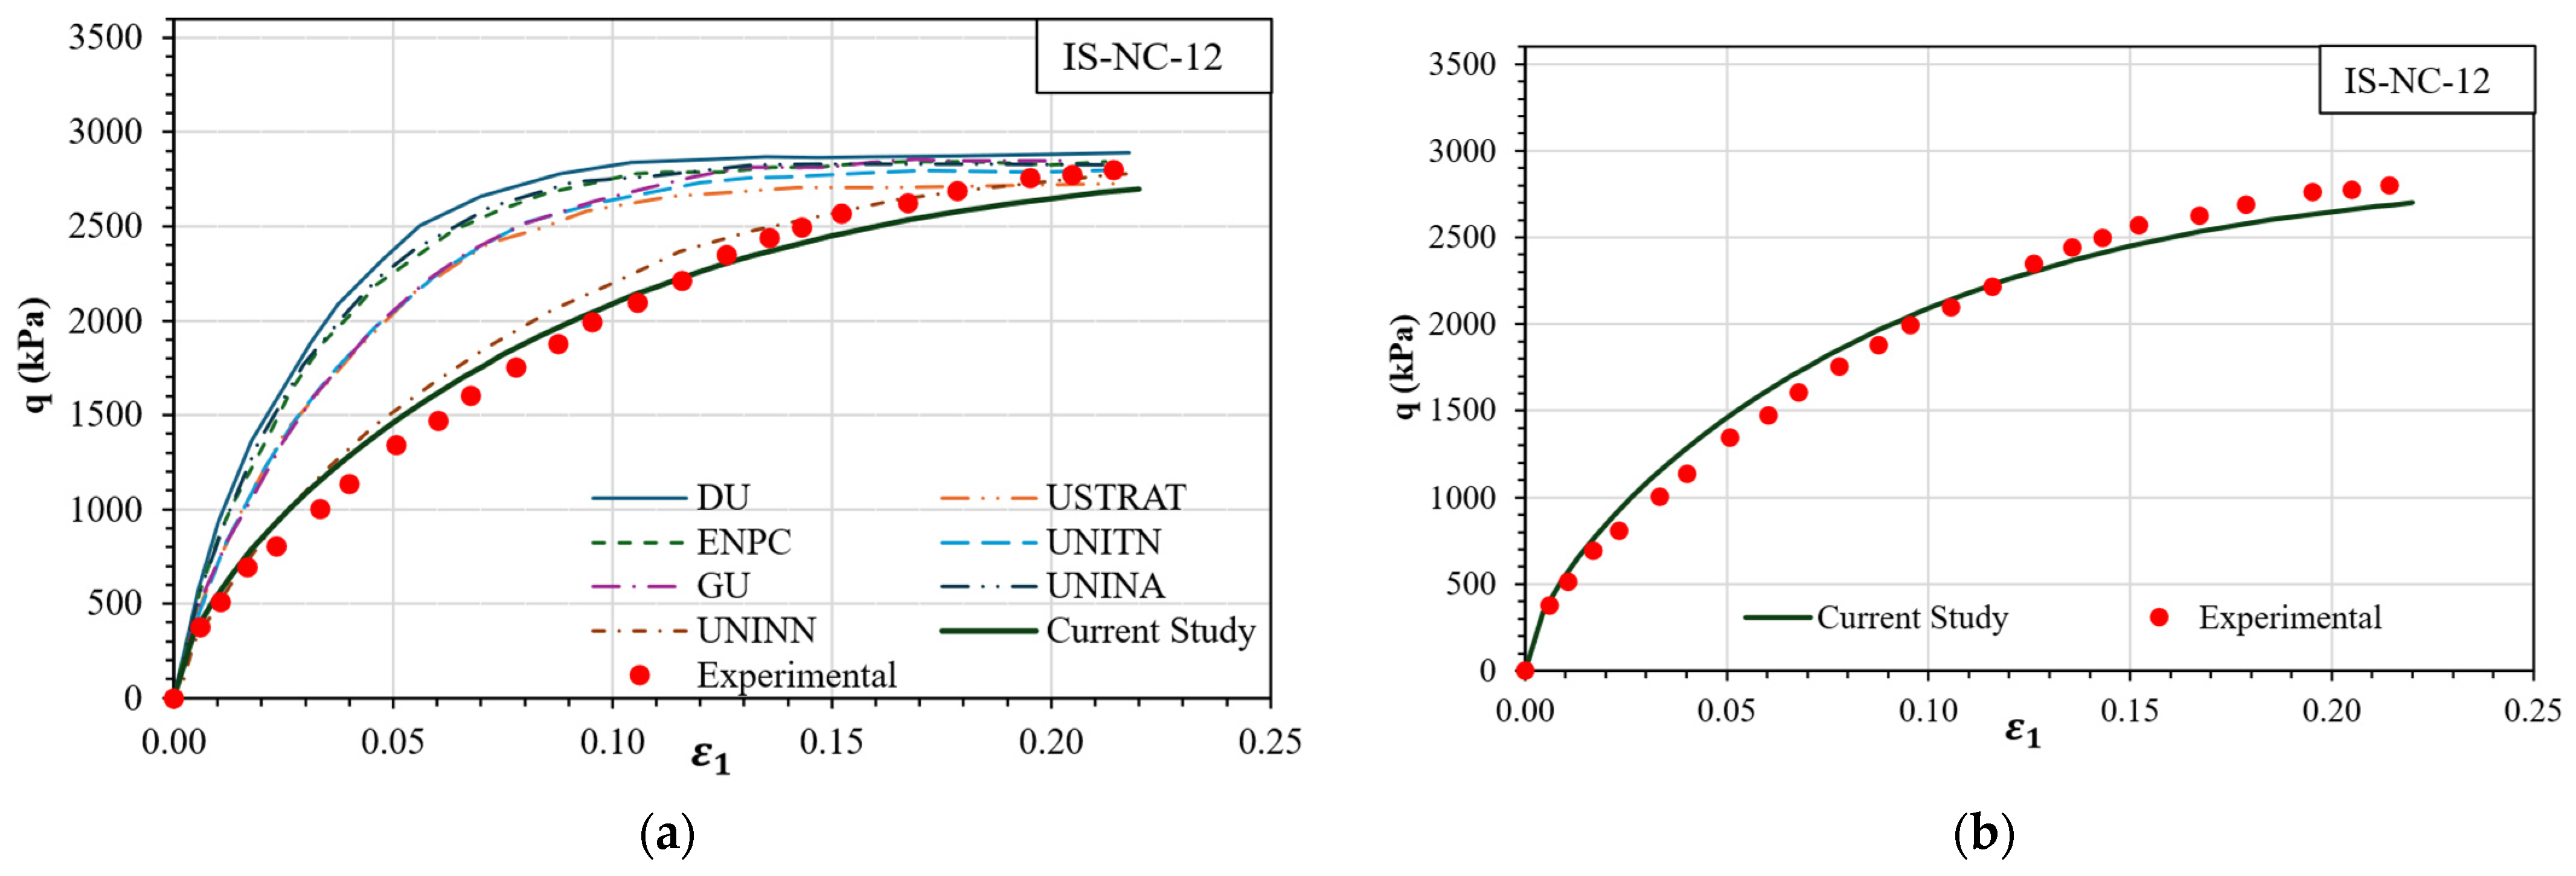
For the triaxial shear test part of IS-NC-12, shown in
Figure 10, the current study simulations show very good agreement with the experimental data. The deviatoric stress,
, at failure from the Plaxis BBM simulation using the current study parameters is 2700 kPa, whereas it is 2800 kPa from the experimental test data; thus, the simulations underestimate
at failure by about 3.5%. When investigating the data, it was very important to ensure that the simulation did not overestimate the expected axial strain (
) at a specified
value to prevent geotechnical problems for use in practical engineering. Across the range of
, the average variation in the current study simulation of
at a certain deviator stress compared with the experimental data was ±0.01.
When analyzing the graphs, it is important to note the statement that a particular combination of parameter values may produce a good match to one aspect of experimental behaviour, whereas for another aspect of behaviour, they may produce poor or unsatisfactory results. For the parameter data set to be considered valid, it should produce satisfactory matching for different experimental behaviours. This is evident in
Figure 9 and
Figure 10, considering the results of the current study.
4.3. Simulation of TISO-1 Test
The experimental test TISO-1 consisted of loading/unloading cycles and wetting/drying cycles on a partially saturated soil sample. Each condition was simulated separately to ensure adequate boundary conditions. The first stage (AB) of the TISO-1 test consisted of isotropic loading at a suction value of 800 kPa from = 50 kPa to 600 kPa. The value of at the start of the experimental test was 0.625. The second stage (BCD) consisted of wetting from = 800 kPa to = 10 kPa, and then drying to = 150 kPa at constant value equal to 600 kPa. According to experimental test data, at the start of the BCD stage was about 0.61. The third stage (DEF) consisted of isotropic loading at = 150 kPa from = 600 to 1400 kPa, and then unloading to = 600 kPa. At the start of stage DEF, was recorded as 0.565. The final wetting stage (FG) of the TISO-1 test consisted of wetting from = 150 kPa to 20 kPa at a constant value of 600 kPa. At the beginning of the FG stage, was reported as 0.52. The final loading stage (GHI) consisted of isotropic loading from = 600 kPa to 2000 kPa, then unloading to = 200 kPa at = 20 kPa.
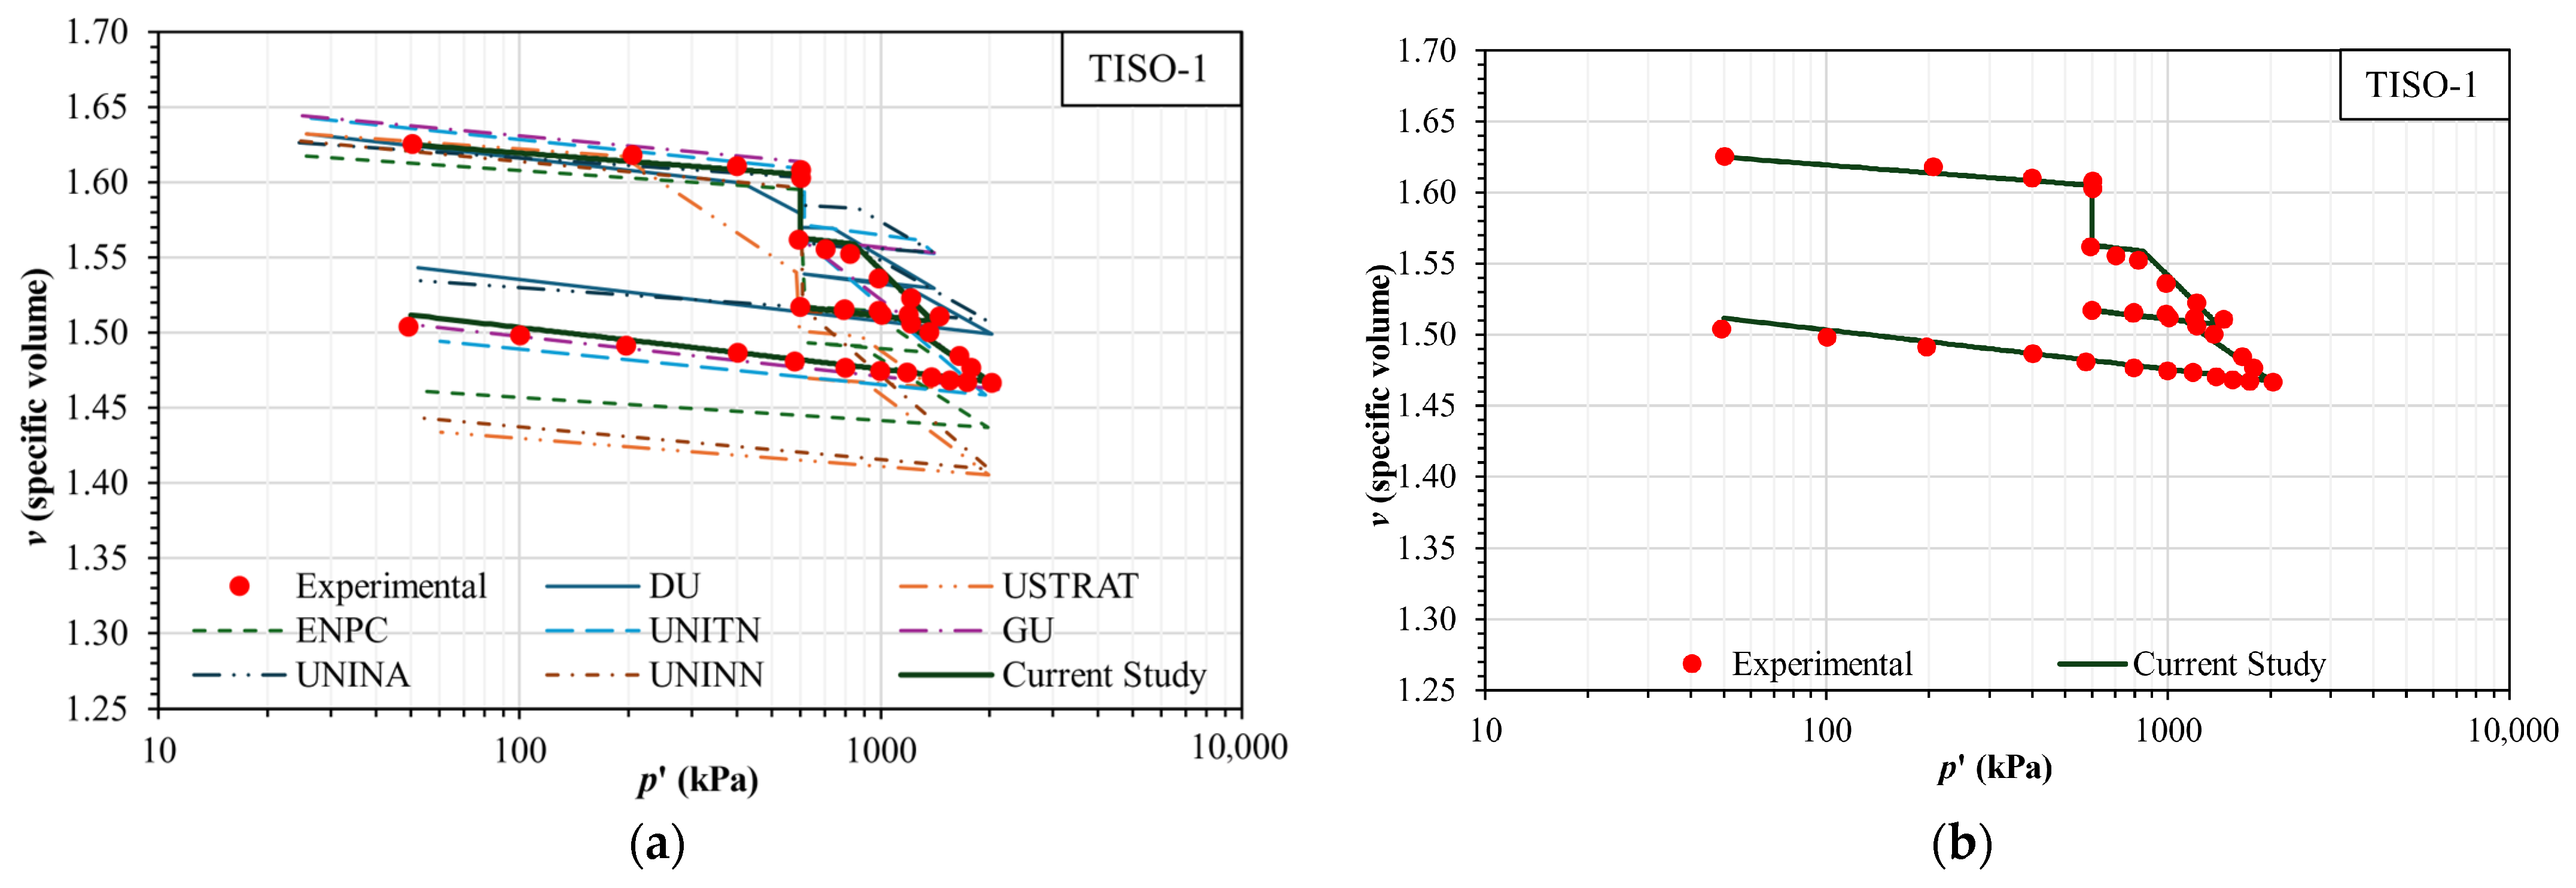
The simulation for the unsaturated isotropic compression test TISO-1 at various suction levels compared with the experimental and benchmark data is shown in
Figure 11. The Plaxis soil test facility simulation using the current study parameters shows very good agreement with the experimental results, evident in
Figure 11b. This is achieved by critically analyzing the behaviour for each loading stage and setting the suitable parameters that influence
for each stage, namely OCR (over-consolidation ratio) and POP (pre-overburden pressure).
4.4. Validation Against Independent Test Conditions
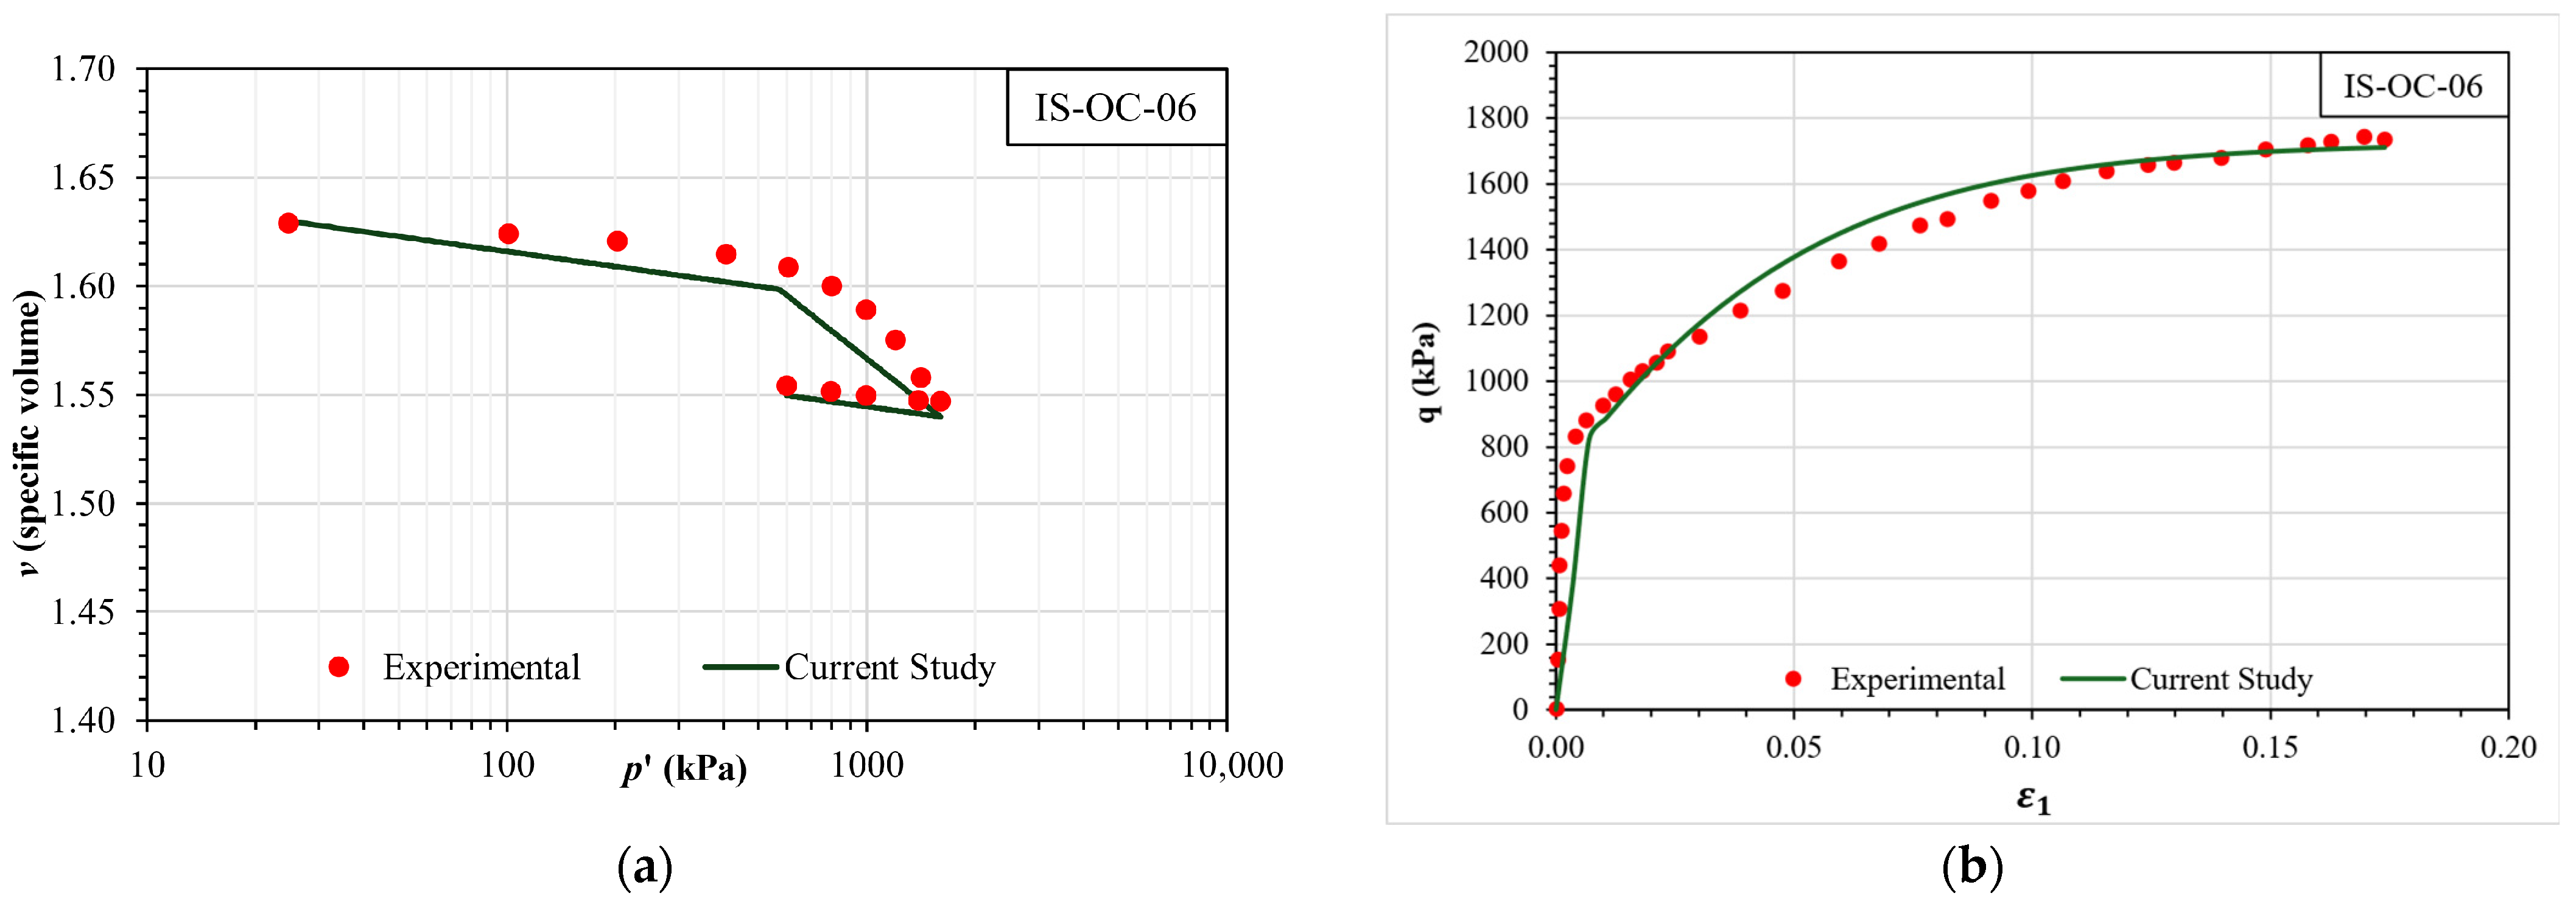
To ensure the capability of the estimated parameters to adequately simulate stress conditions not included in the parameter estimation process, an independent test condition was simulated and compared with the experimental results. The experimental test was an unsaturated triaxial test at a constant suction value of 800 kPa, IS-OC-06, consisting of isotropic loading from
= 25 kPa to
= 1600 kPa, and then unloading to
= 600 kPa, followed by shearing [
18]. The initial void ratio at the beginning of the test was 0.63. The same simulation procedure for IS-NC-12 was employed.
Figure 12 illustrates both the isotropic and shear response. The numerical simulations exhibit very good agreement with the experimental measurements, confirming the validity of the calibrated parameter set and the robustness of the proposed framework in reproducing realistic stress paths beyond the specific calibration cases.
5. Results and Discussion
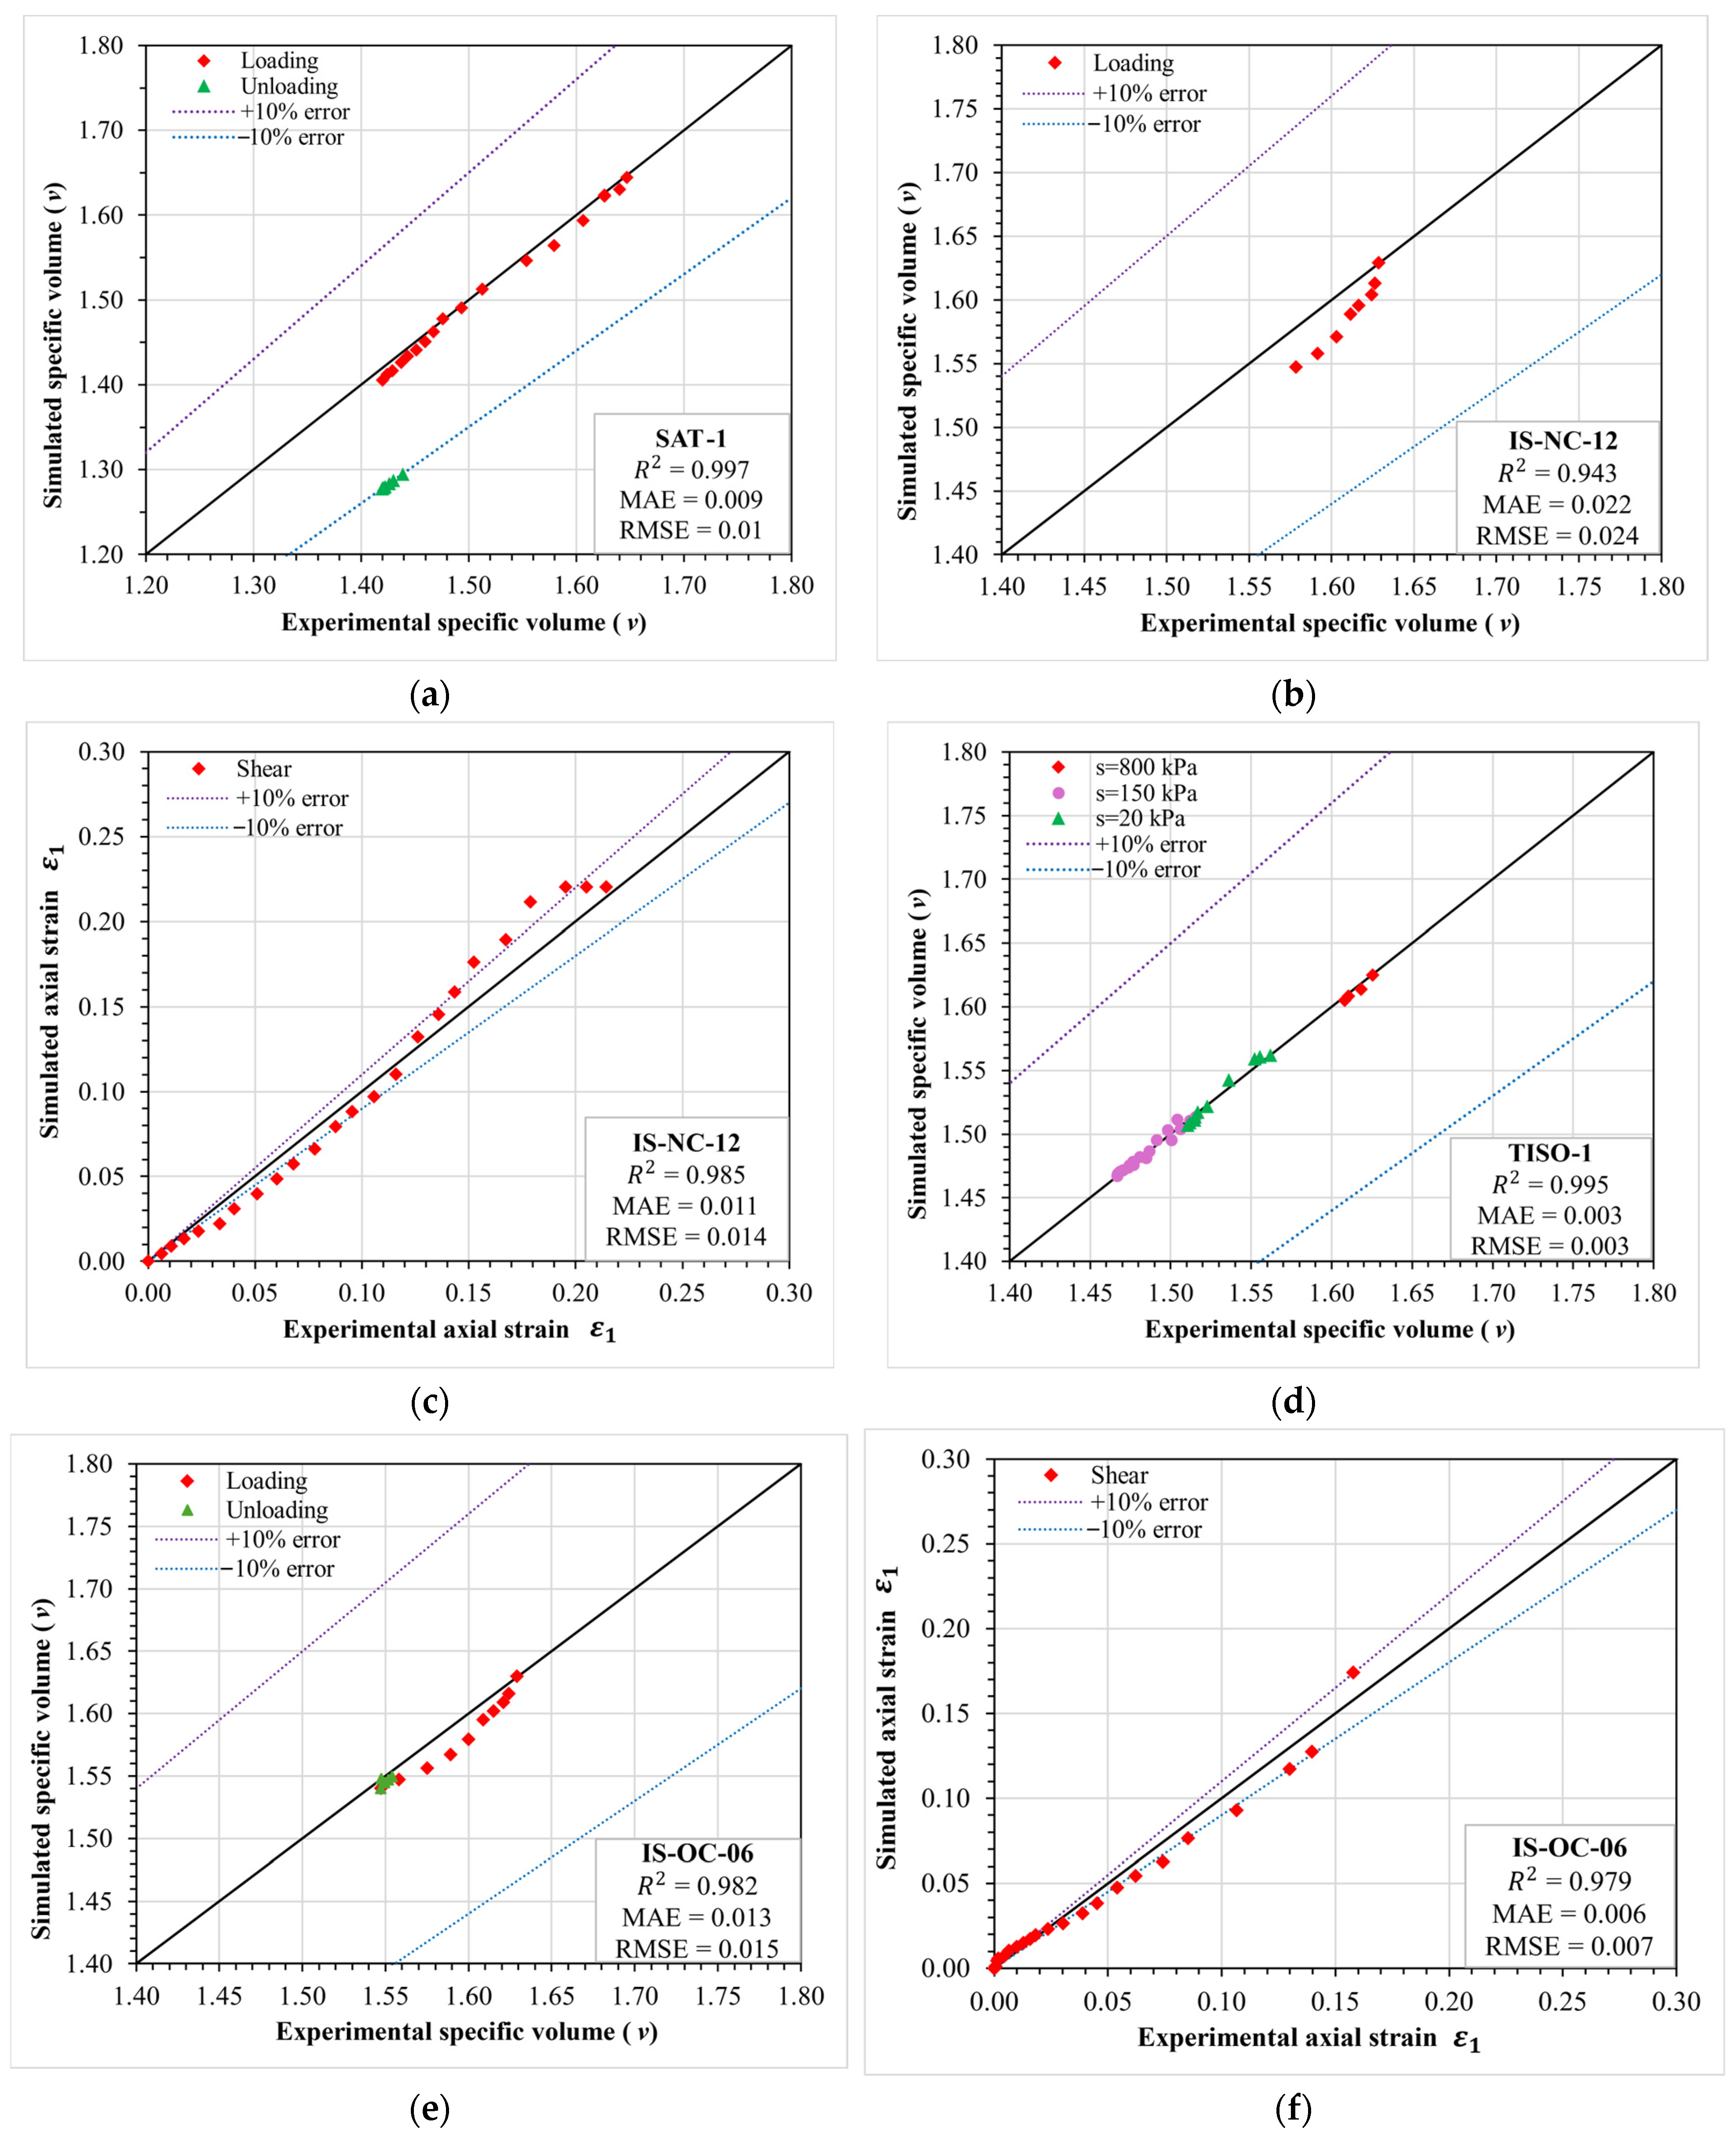
Statistical analysis of the Plaxis simulations was performed using the results obtained from the current study’s estimated parameters. A parity plot (1:1 reference line) was plotted for comparison with an error bandwidth of ±10%, as shown in
Figure 13. For the Sat-1 test, the estimated parameters reproduce almost identical specific volumes for the loading stage, lying directly on the 1:1 line, as shown in
Figure 13a. The specific volumes for the unloading simulation lie on the -10% line, indicating a slight error; however, the unloading soil behaviour is captured effectively, which is evident in
Figure 8b. The coefficient of determination (R
2) = 0.997, the mean absolute error (MAE) = 0.009, and the root mean square error (RMSE) = 0.01, thereby demonstrating that the current study’s simulation parameters capture the saturated isotropic compression behaviour adequately.
For the IS-NC-12 isotropic test, as shown in
Figure 13b, relatively little scatter is observed with R
2 = 0.943, while the simulated results are scattered very near to the 1:1 line with MAE = 0.022 and RMSE = 0.024. With respect to the specific volume, these values are insignificant. For the shear behaviour of IS-NC-12, as shown in
Figure 13c, simulated values for ε
1 are confined within the ±10% error bandwidth. For small strains (up to 0.12), the model slightly underestimates the axial strain at a specified deviator stress. However, for greater strains, the simulated results are slightly overestimated. The values for R
2, MAE, and RMSE for triaxial shearing of IS-NC-12 are 0.985, 0.011, and 0.014, respectively. Results from
Figure 13b,c indicate that the current study simulation parameters effectively capture the unsaturated isotropic behaviour and shear performance of collapsible soil.
Furthermore, to validate the current study parameters, the results for drying/wetting paths, as well as loading/unloading paths for TISO-1, were compared with the experimental data, as shown in
Figure 13d. For the different suction values (s = 20, 150, and 800) kPa, the simulated results show excellent agreement with the experimental data, with R
2 = 0.995, MAE = 0.003, and RMSE = 0.003, highlighting the main feature of the BBM: the ability to capture wetting/drying paths and loading/unloading paths.
To ensure the capability of the current study parameters and the framework to reproduce stress paths not included in the calibration process, statistical analysis was performed on IS-OC-06. The isotropic response, shown in
Figure 13e, is effectively captured with R
2, MAE, and RMSE of 0.982, 0.013, and 0.015, respectively. For pre-yield and unloading, the simulations are closely aligned with the 1:1 line. For values of
greater than
in the loading stage, the predicted values are consistently distributed below the 1:1 line with tight dispersion, yielding an average error of 1.4%. The shear response simulation, shown in
Figure 13f, exhibits very good agreement with the experimental values (R
2 = 0.979, MAE = 0.006, RMSE = 0.007), confined within the ±10% error margin.
The overall evaluation of
Figure 13 shows that the current study simulations adequately capture various stress conditions with a single set of parameters, for stress paths covered by and external to the calibration process, confirming the robustness and consistency of the proposed calibration framework across different loading scenarios. For all test simulations, MAE ≈ RMSE indicate stable, reliable predictions. These results demonstrate that the calibrated parameter set can be confidently used in practical finite element analyses involving unsaturated collapsible soils under varying stress paths.
6. Conclusions
This study introduces a practical step-by-step procedure for selecting and calibrating the parameters of the Plaxis Barcelona Basic Model (PBBM) through the sequential method, eliminating the need for an excessive iteration procedure. Implementing this method immensely reduces the probability of obtaining varying values for a single parameter from the same set of laboratory test results. However, it is vital to emphasize the role of engineering judgement and a sound understanding of the original model formulation, not to depend solely on analytical and statistical results. The parameter data set is considered valid if it is capable of matching different stress paths with minimum error. This is crucial for its application in practical engineering, as unsaturated collapsible soils are not explicitly subjected to isotropic loading at a certain suction value, yet they are subjected to various combined loading–unloading, wetting–drying, and shearing scenarios. In this study, verification of the parameter selection method and BBM constitutive model implemented in Plaxis software was performed by back analysis of reported laboratory tests on unsaturated soils in the literature [
18]. Analysis of the results shows that the parameters implemented in the BBM reliably reproduce soil behaviour for different stress paths with an average of R
2 = 0.98, MAE = 0.01, and RMSE = 0.013 for the four simulated laboratory tests.
The proposed calibration framework facilitates the reliable use of BBM in commercial finite element platforms, enhancing its applicability in engineering design involving unsaturated collapsible soils, such as the analysis of slope stability, bearing capacity, and settlement of shallow and deep foundations. A key methodological insight of our study is that for practical engineering applications of the BBM, extensive, project-specific suction laboratory tests are not an absolute prerequisite. A carefully selected SWCC from the literature, based on matching fundamental soil properties and validated against limited site data where possible, can be reasonably used. Further work utilizing the proposed framework to study the performance of piles in unsaturated collapsible soil is ongoing and will be published soon.



 ,
,