Article

Vibrational Spectroscopy of Serpentinite Phase Transformations and Significance of OH Bands

by
Ayşe Didem Kılıç
1,*,
Ebubekir Sıddık Inanlı
2 and
Ismail Yıldırım
1
1
Department of Geological Engineering, Faculty of Engineering, Fırat University, Elazığ 23119, Türkiye
2
Institute of Science, Fırat University, Elazığ 23119, Türkiye
*
Author to whom correspondence should be addressed.
Appl. Sci. 2026, 16(19), 9940; https://doi.org/10.3390/app16199940 (registering DOI)
Submission received: 10 September 2026 / Revised: 26 September 2026 / Accepted: 1 October 2026 / Published: 8 October 2026

Abstract

Serpentine group minerals—comprising antigorite, chrysotile, and lizardite—are key indicators of the hydration of ultramafic rocks and the serpentinization process. In this study, the mineralogical, chemical, and structural characteristics of serpentinites located north of Divriği, as well as serpentinization processes, were investigated using XRD, SEM, FTIR, and ICP-MS analyses, and an attempt was made to determine OH stretching characteristics associated with the serpentinization process. While low ∑REE contents (11.07–15.13 ppm) indicate that serpentinites originated from an REE-depleted ultramafic protolith, SEM and FTIR findings—consistent with microscopic observations—reveal the presence of antigorite, chrysotile, and lizardite varieties of serpentine in varying proportions across the selected samples. Antigorite is more prominent in samples ESp-1 and ESp-2, whereas chrysotile is more distinct in ESp-3. In FTIR spectra, OH stretching bands in the 3600–3750 cm−1 range and Si–O vibrations in the 400–1200 cm−1 range confirm the presence of serpentine-group minerals. The multi-band structure in the OH region and strong Si–O band around ~994 cm−1 indicate the coexistence of antigorite and chrysotile. The combined evaluation of FTIR, SEM, XRD, and geochemical data highlights the necessity of a multi-analytical approach to distinguish between serpentine polymorphs and demonstrates that serpentinization involves a multi-stage mineral transformation process. Consequently, the formation of serpentine minerals and serpentinization are the result of a multi-stage process controlled by protolith composition, fluid–rock interaction, and varying physicochemical conditions.

1. Introduction

The Serpentinite is a common rock type that can form in various geological settings through metamorphism and hydration of upper mantle rocks [1,2,3]. Within this rock group—subdivided into chrysotile, lizardite, and antigorite—Antigorite is generally stable under high-pressure and low-to-moderate temperature conditions in subduction-related environments. Depending on pressure-temperature (P-T) conditions, antigorite can also occur at various depths [1,2]. Antigorite is common in ultramafic rocks of eclogite and blueschist facies [4,5]; chrysotile and lizardite form through near-surface metasomatic processes under greenschist-facies or lower-grade metamorphic conditions [1,6]. Compared to other serpentine varieties, antigorite possesses a high water content; this characteristic triggers element mobility and results in lower trace element concentrations within the antigorite structure [7].
The crystal structure of serpentines is a 1:1 type phyllosilicate structure consisting of octahedral layers. In serpentines—which are composed of SiO4 tetrahedral layers and brucite-like octahedral layers—lattice mismatch between octahedral (O) and tetrahedral (T) layers leads to the formation of distinct structures [8]. Serpentine varieties—namely lizardite (with a flat crystal structure), antigorite (with wavy layers), and fibrous chrysotile (with a cylindrical, spiral shape)—may occur individually or coexist within a single rock [1,8]. Structural variations among serpentine minerals have also influenced their crystal chemistry, resulting in specific differences. For instance, chrysotile, which possesses an optimal structural curvature, exhibits the ideal Mg3Si2O5(OH)4 composition. Conversely, cationic impurities such as Fe, Ni, and Al stabilize the flat structure of lizardite [9] and influence the relationship between its crystal structure and crystal chemistry [10]; the synthesis of pure Mg–lizardite in the form of platy particles serves as evidence of this [10].
Although analytical techniques such as ICP-MS, quantitative XRD, SEM, TGA, and DTA are employed to characterize serpentine minerals—which have the chemical composition (Mg, Fe2+)3 Si2O5 (OH)4—they may prove insufficient due to factors such as the degree of crystallinity and the extremely fine grain size of serpentine varieties. Raman and FT-IR spectroscopies stand out as some of the most accurate, reliable, and cost-effective methods for identifying serpentine minerals. Vibrational spectroscopies are among the routine methods most frequently used for characterization of serpentines. Raman spectroscopy has been proven to be a suitable technique for distinguishing between serpentine varieties [1,11,12]. Similarly, Fourier transform infrared spectroscopy [13,14,15,16] and near-infrared spectroscopy [16,17] are considered the most suitable methods for serpentine group minerals. This is because FTIR is a powerful analytical technique for identifying changes in cations within tetrahedral and, particularly, octahedral sites by monitoring OH- stretching vibrations, ν(OH), of phyllosilicates [18]. It is a robust, non-destructive method for determining crystal structures of minerals and the nature of isomorphous substitution [18]. In this study, FTIR spectroscopy was employed alongside XRD and ICP-MS methods to support mineral identification during analysis of serpentine minerals.
In the field of geology, considering mid-infrared (MIR) and near-infrared (NIR) spectroscopies—techniques that have actually existed since the 1920s—mid-infrared spectroscopy covers the wavenumber range of 400–4000 cm−1, whereas near-infrared spectrometers operate in the 4000–12,500 cm−1 infrared region [19]. The primary reason for preferring near-infrared spectroscopy in geology is that it enables the study of water within mineral structures, various combination bands (such as those involving metal ions), overtone bands, and hydroxyl group vibrations [19]. For example, Cheng et al. [20] examined different phyllosilicate minerals such as chrysotile, muscovite, talc, pyrophyllite, and kaolinite by FTIR spectroscopy. A similar study was conducted by Wu et al. [21]. Zhang et al. [22] used near-infrared spectroscopy in a study in which they examined long hydrogen bonds in TO and TOT type layered silicates. In another study, OH stretching bands (NOH) in the range of 3650–3700 cm−1 and OH vibration bands (δOH) at values of approximately 618 and 646 cm−1, originating from the internal and surface hydroxyls of serpentines, show the success of these methods [23]. Farmer [23] and Bishop et al. [24] identified the presence of 3650–3700 cm−1 OH stretching bands for chrysotile and antigorite and 618 and 646 cm−1 OH bands originating from internal/surface hydroxyls. Clarke et al. [25] reported measurement values for serpentine group minerals, determining 3650–3700 cm−1 (νOH stretching vibrations), 609 cm−1, 630 cm−1, and 649 cm−1 (OH vibrations), ~3700 cm−1 (inner OH), and ~3650–3690 cm−1 (outer/surface OH). Fritsch et al. [26] investigated OH stretching vibration characteristics of eight serpentine samples from the New Caledonia ophiolite in mid- and near-infrared regions using Fourier transform infrared (FTIR) spectroscopy. The researchers distinguished between OH stretching bands associated with characteristic structural vibration properties of lizardite, antigorite, and chrysotile varieties and those linked to chemical substitutions in octahedral sites (specifically the substitution of Mg by Fe and Ni). Lizardite, possessing a symmetric structure, exhibits an FTIR response characteristic of OH stretching bands, consistent with previous studies. In the case of antigorite—which has a relatively less symmetric and more distorted structure—the study is significant for demonstrating that the distribution of OH bond lengths plays a key role in the broadening of vibrational signals.
This study aims to identify serpentine group minerals by evaluating FTIR spectra of serpentinites from the Divriği (Sivas) region in conjunction with XRD and chemical analysis data. Furthermore, vibration spectrum peaks associated with the OH group of serpentines were experimentally investigated, and differences in the OH stretching spectrum resulting from variations in crystal structure and chemical composition were addressed.

2. Materials and Methods

For optical mineralogical examination, thin sections of selected serpentinite rock samples exhibiting various textures and colors were prepared thin sections. Thin sections were produced at the Thin Section Laboratory of the Department of Geological Engineering at Fırat University. The sections were examined and photographed using a Leica transmitted-light polarizing microscope under both plane-polarized (single nicol) and cross-polarized (crossed nicols) light.
In selected serpentinites, FT-IR analyses were performed at the METU Central Laboratory. FTIR spectra were acquired using a Shimadzu IRTracer-100 spectrometer (Shimadzu Corporation, Kyoto, Japan) and ATR accessory (4 cm−1 resolution). Samples (25 mg) were loaded onto the diamond ATR crystal and analyzed at room temperature. The empty accessory was used to obtain the background spectrum. All spectra were recorded within a range of 4000–400 cm−1 with a 4 cm−1 resolution and Happ–Genzel apodization. Each spectrum was calculated as the average of 32 scans and subjected to background subtraction. Raw spectra were subjected to smoothing and baseline correction. Although FTIR spectra were obtained with a spectral resolution of 4 cm−1, closely spaced absorption bands cannot serve as the sole criterion for polymorph identification. Instead, the overall FTIR spectral patterns—including characteristic OH stretching and Si–O-related bands—were evaluated in conjunction with results from XRD, microscopic examinations, and geochemical analyses to support the identification of antigorite, chrysotile, and lizardite.
SEM and XRD analyses of the serpentinites were conducted at the Physics Laboratory of Erzincan Binali Yıldırım University (Turkey). High-temperature X-ray diffraction (HT-XRD) analyses were performed using a PANalytical Empyrean high-temperature X-ray diffractometer (Malvern Panalytical, Malvern, UK), with measurements taken at temperatures ranging from 25 °C to 1200 °C. In this study, to monitor the temperature-dependent phase transformations of the serpentine minerals, the samples were heated to 900 °C at a heating rate of 20 °C/min, and XRD measurements were carried out. Phase identification of the samples was performed based on the obtained diffraction patterns. The HT-XRD procedure should not be confused with TG/DTA analysis; no TG/DTA measurements were conducted in this study. The JCPDS (Joint Committee on Powder Diffraction Standards) database was utilized [27]. Upon comparison with the standard database, the samples were identified as chrysotile (JCPDS card no. 14-116), lizardite (14-177), and antigorite (19-131) [28]. Chemical analysis of each pulverized sample was performed at ACME Laboratory (Bureau Veritas Mineral Laboratories—Vancouver, BC, Canada) using ICP/MS according to LF200 and LF300 methods. Major, rare, and trace elements in samples were determined through these analyses.

3. Results

3.1. Geology

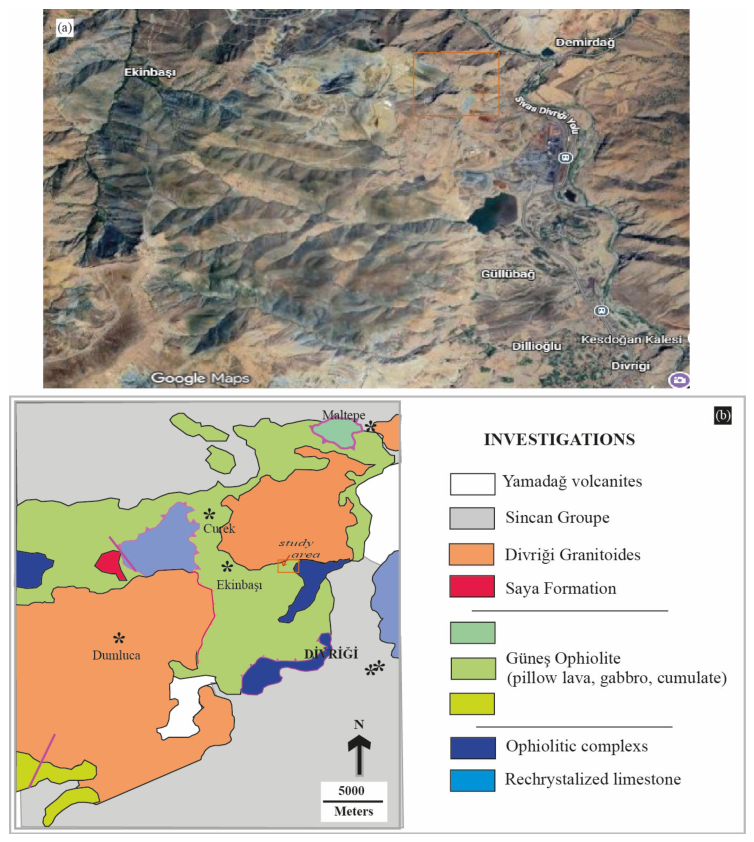
The serpentinites located to the north of Divriği (Sivas)—situated at the junction of Sivas, Erzincan, and Malatya provinces in northeastern Türkiye—are proximal to ore occurrences known in the literature as the Divriği Iron Deposits; geographically, they extend between two areas referred to in the literature as the Bizmişen and Divriği ore deposits (Figure 1). Although mineralization in the region has been investigated by numerous researchers [29,30,31,32], no study focusing specifically on the serpentinites themselves in the study area has been encountered. Consequently, this study fills a significant gap in the literature.
An examination of the study area’s geology reveals that the Munzur recrystallized limestone (Early Carboniferous–Campanian) represents the oldest unit. Overlying this is the Ophiolitic mélange (Örükyayla Mélange)—a complex comprising Campanian-aged serpentinite, gabbro, diabase, dark red micritic limestone, and radiolarite. Additionally, a significant silica zone known as Şenkaya chrysoprase (a chalcedony-type silica mineral) is located within the mélange [29,32]. The ophiolitic mélange and recrystallized limestone constitute the basement units and are overlain by the Jurassic-aged Güneş ophiolite, which consists of harzburgite, dunite, gabbro, and pyroxenite. The uppermost units consist of the Maastrichtian-aged volcano-sedimentary Saya Formation; the Paleocene-aged Divriği granitoid; the Eocene–Miocene Sincan Group (comprising an alternation of variegated conglomerate and sandstone in shades of dark red, green, and gray) and the Plio-Quaternary Yamadağ volcanics (Figure 1) [32]. Serpentinites are widely distributed within the ophiolitic mélange unit and can be easily distinguished—even from a distance—by their greasy luster and greenish color.

3.2. Mineralogy and Petrography

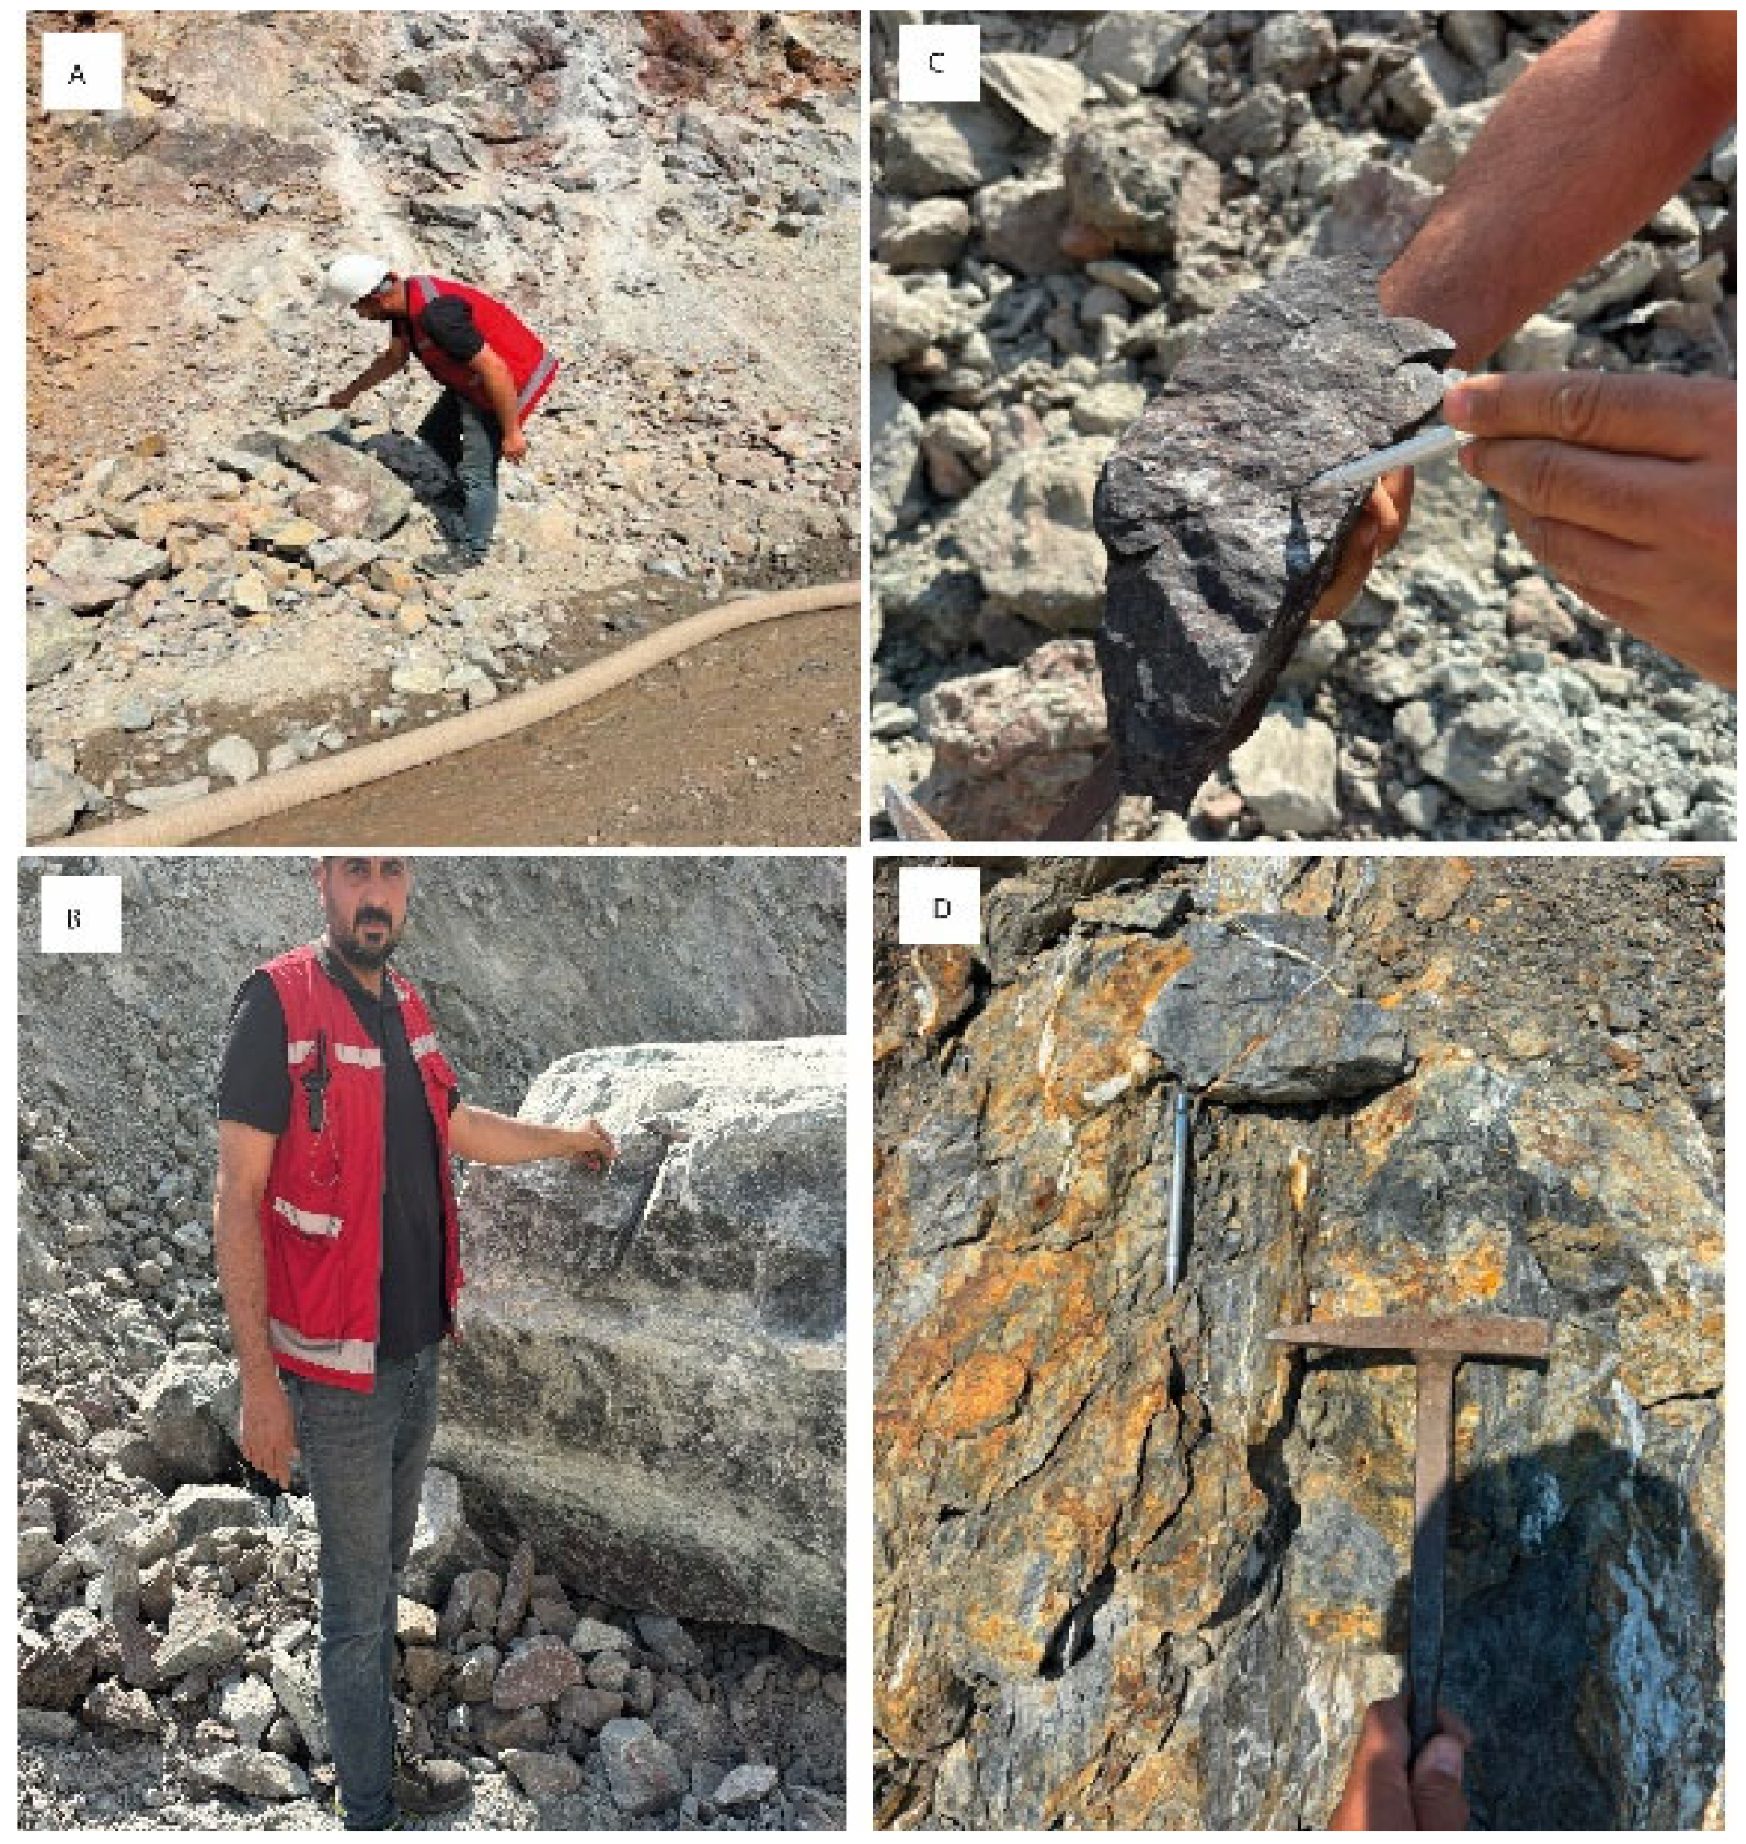
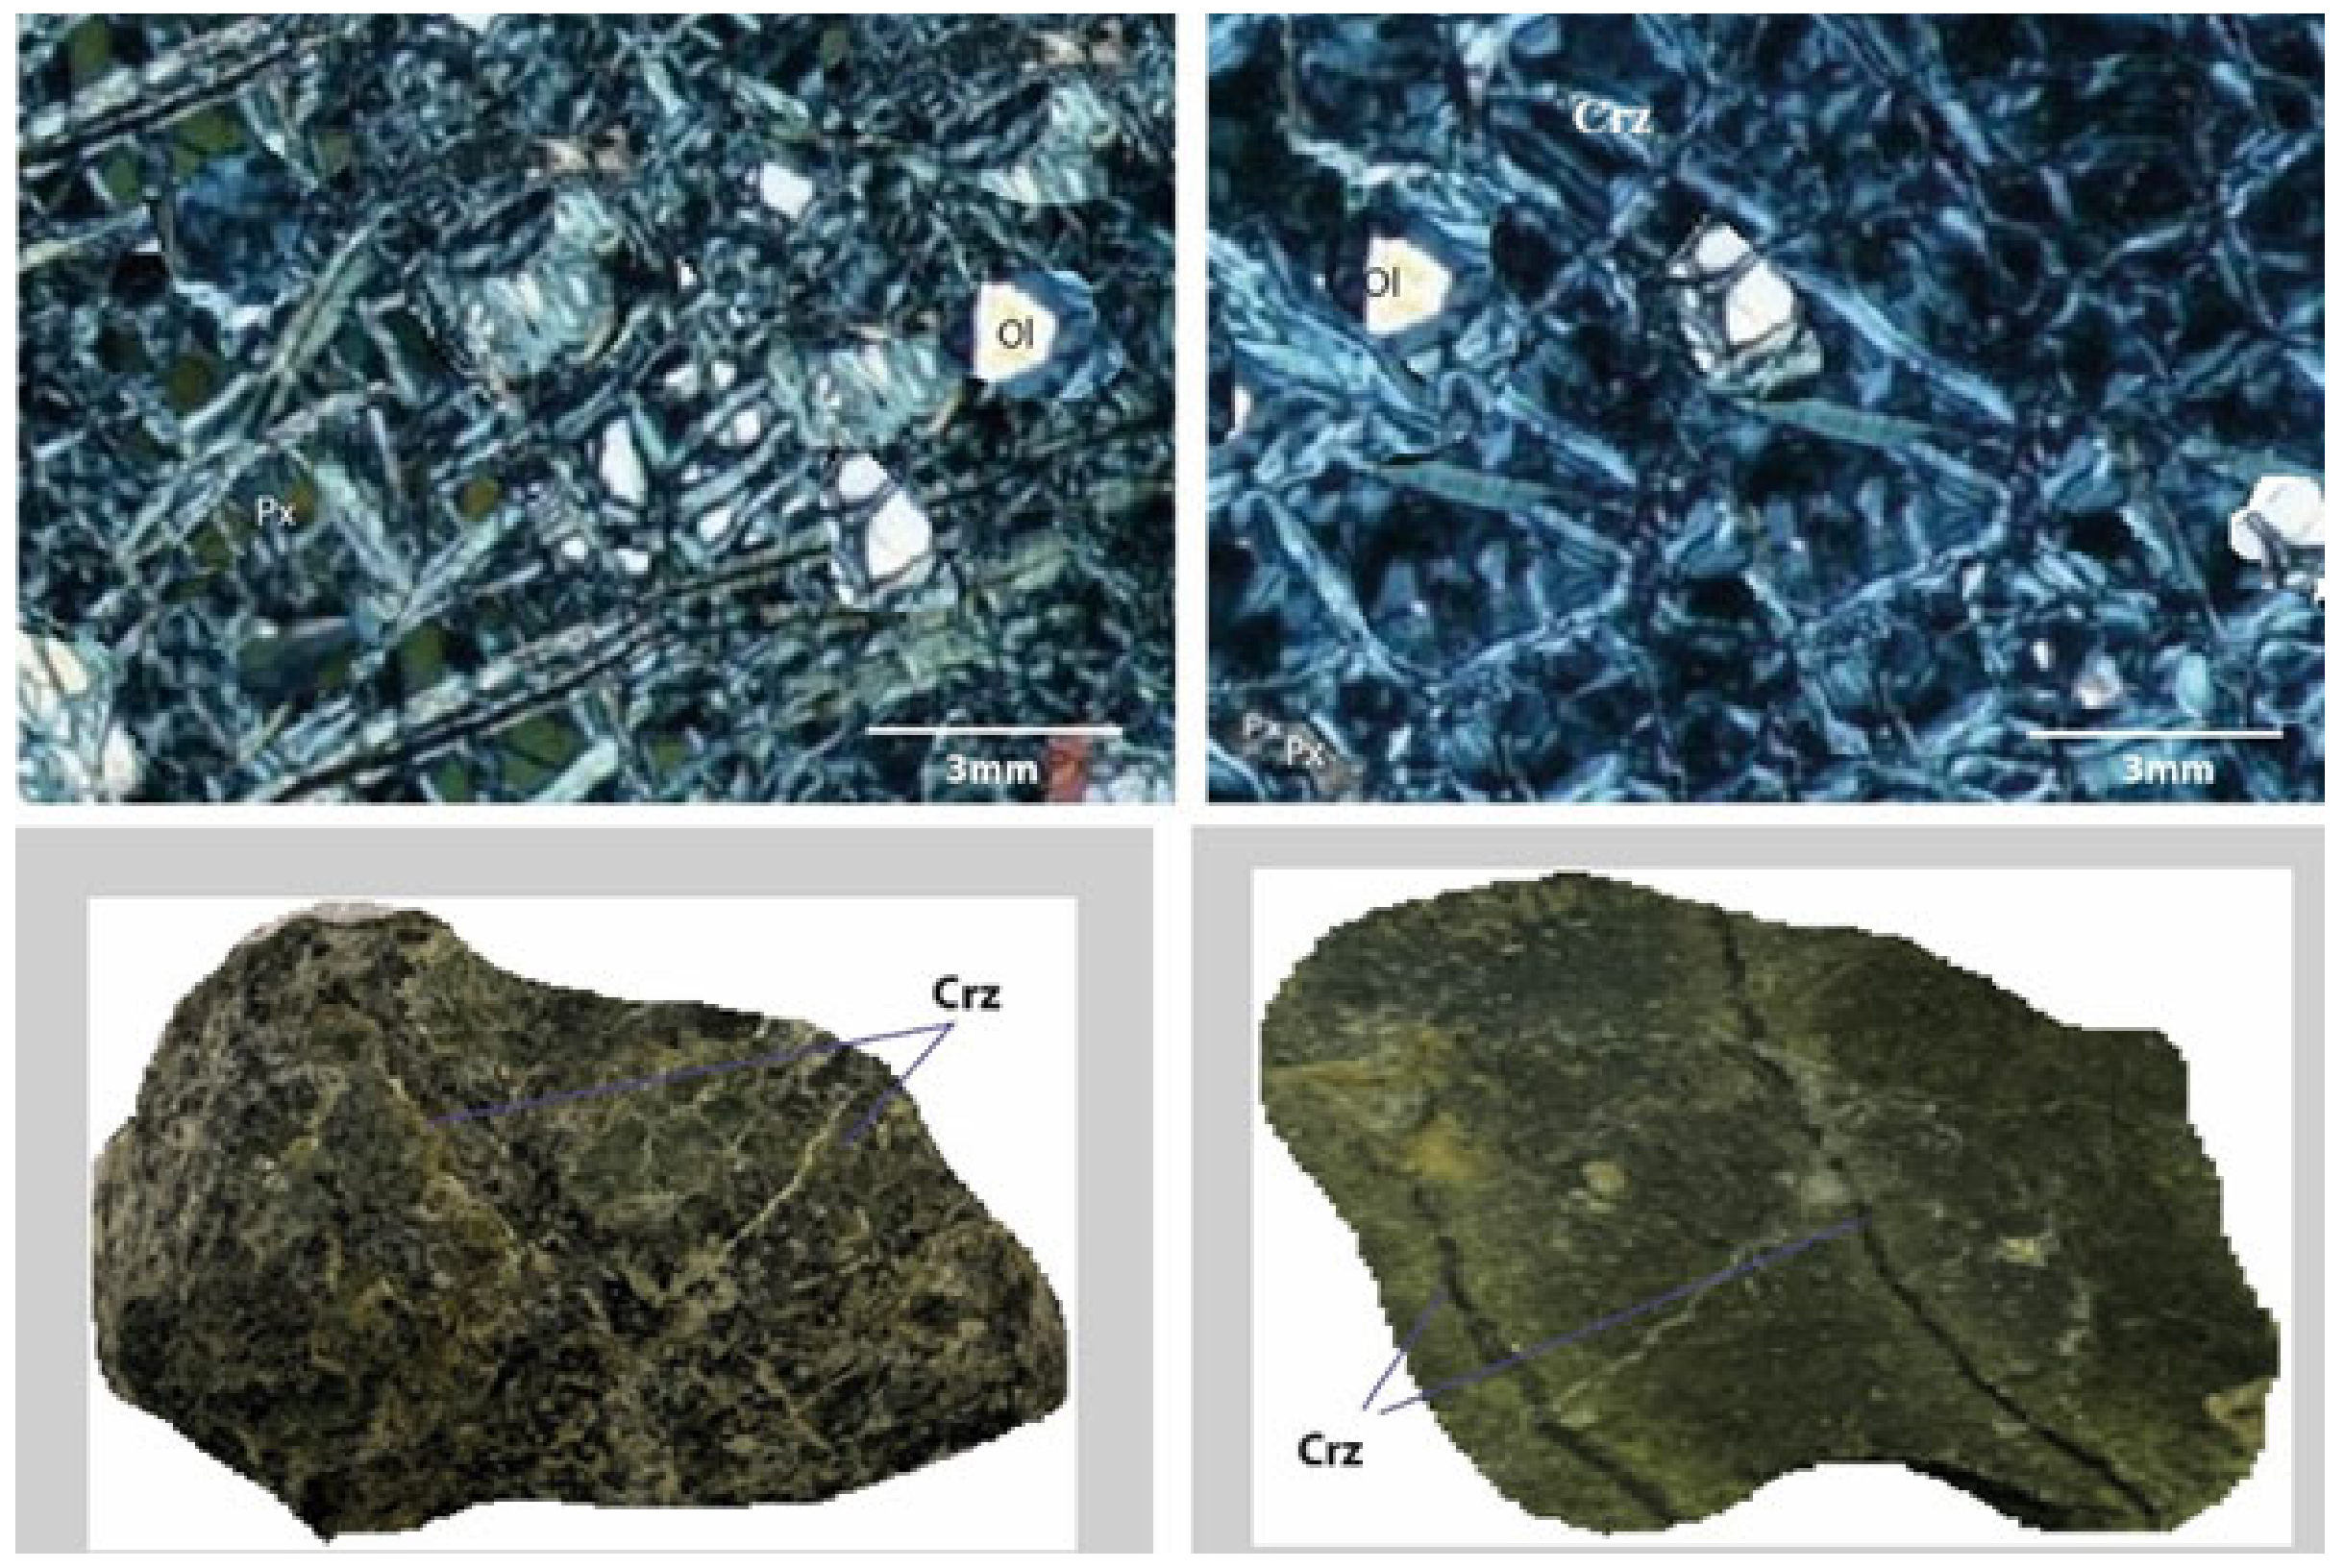
The serpentinites under investigation are in contact with iron mineralization within a skarn zone that developed between the Munzur limestones and the Divriği granitoid. It has been reported that these formed through contact metamorphism or felsic alteration at the interface between serpentinites (or serpentinized ultramafics) and granitoid [33,34]. Studies conducted in the area reveal the presence of garnet, epidote, pyroxene, and magnetite minerals, which are characteristic of a skarn zone (Figure 2). Felsic alteration is widespread in the region (Figure 2A). The serpentines in the study area exhibit a distinctive appearance characterized by a mesh texture and a dark gray–green color (Figure 2). Mineralogically composed of olivine, pyroxene, and magnetite, the serpentines are observed to enclose micro-olivine grains (Figure 3). In some samples, pyroxene is transected by fibrous chrysotile veinlets that form a mesh-like network (Figure 2B,C). The serpentinites exhibit holocrystalline, glomeroporphyritic, and mesh textures, with primary minerals appearing to float within the groundmass (Figure 3).
The orthopyroxenes are partially or completely serpentinized. Chrysotile within the mesh-like veins surrounding the residual minerals has pseudomorphically replaced the orthopyroxenes, and hydration has proceeded pseudomorphically [1,35]. Olivine minerals are readily distinguished by their vivid interference colors. Acicular, elongated chrysotile is observed within the fractures. The recognizability of olivine and orthopyroxene minerals, along with the presence of the original mesh texture, indicates that temperatures were not high and points to an abundance of mafic minerals. Orthopyroxene transforms into serpentine, chlorite, tremolite, and magnetite, forming a mesh-like structure (Figure 3). Opaque minerals consist of magnetite and red and green spinels (Figure 3). Red spinels occur as euhedral, crack-free grains, while Cr-spinel cores are surrounded by magnetite.
The identification of chrysotile and antigorite during macroscopic and microscopic examinations indicates that the chrysotile phase originated from dunite, while the antigorite phase points to the presence of both dunite and harzburgite protoliths (Figure 3). The abundance of antigorite compared to chrysotile in the examined serpentinites reflects prograde metamorphic conditions [36].
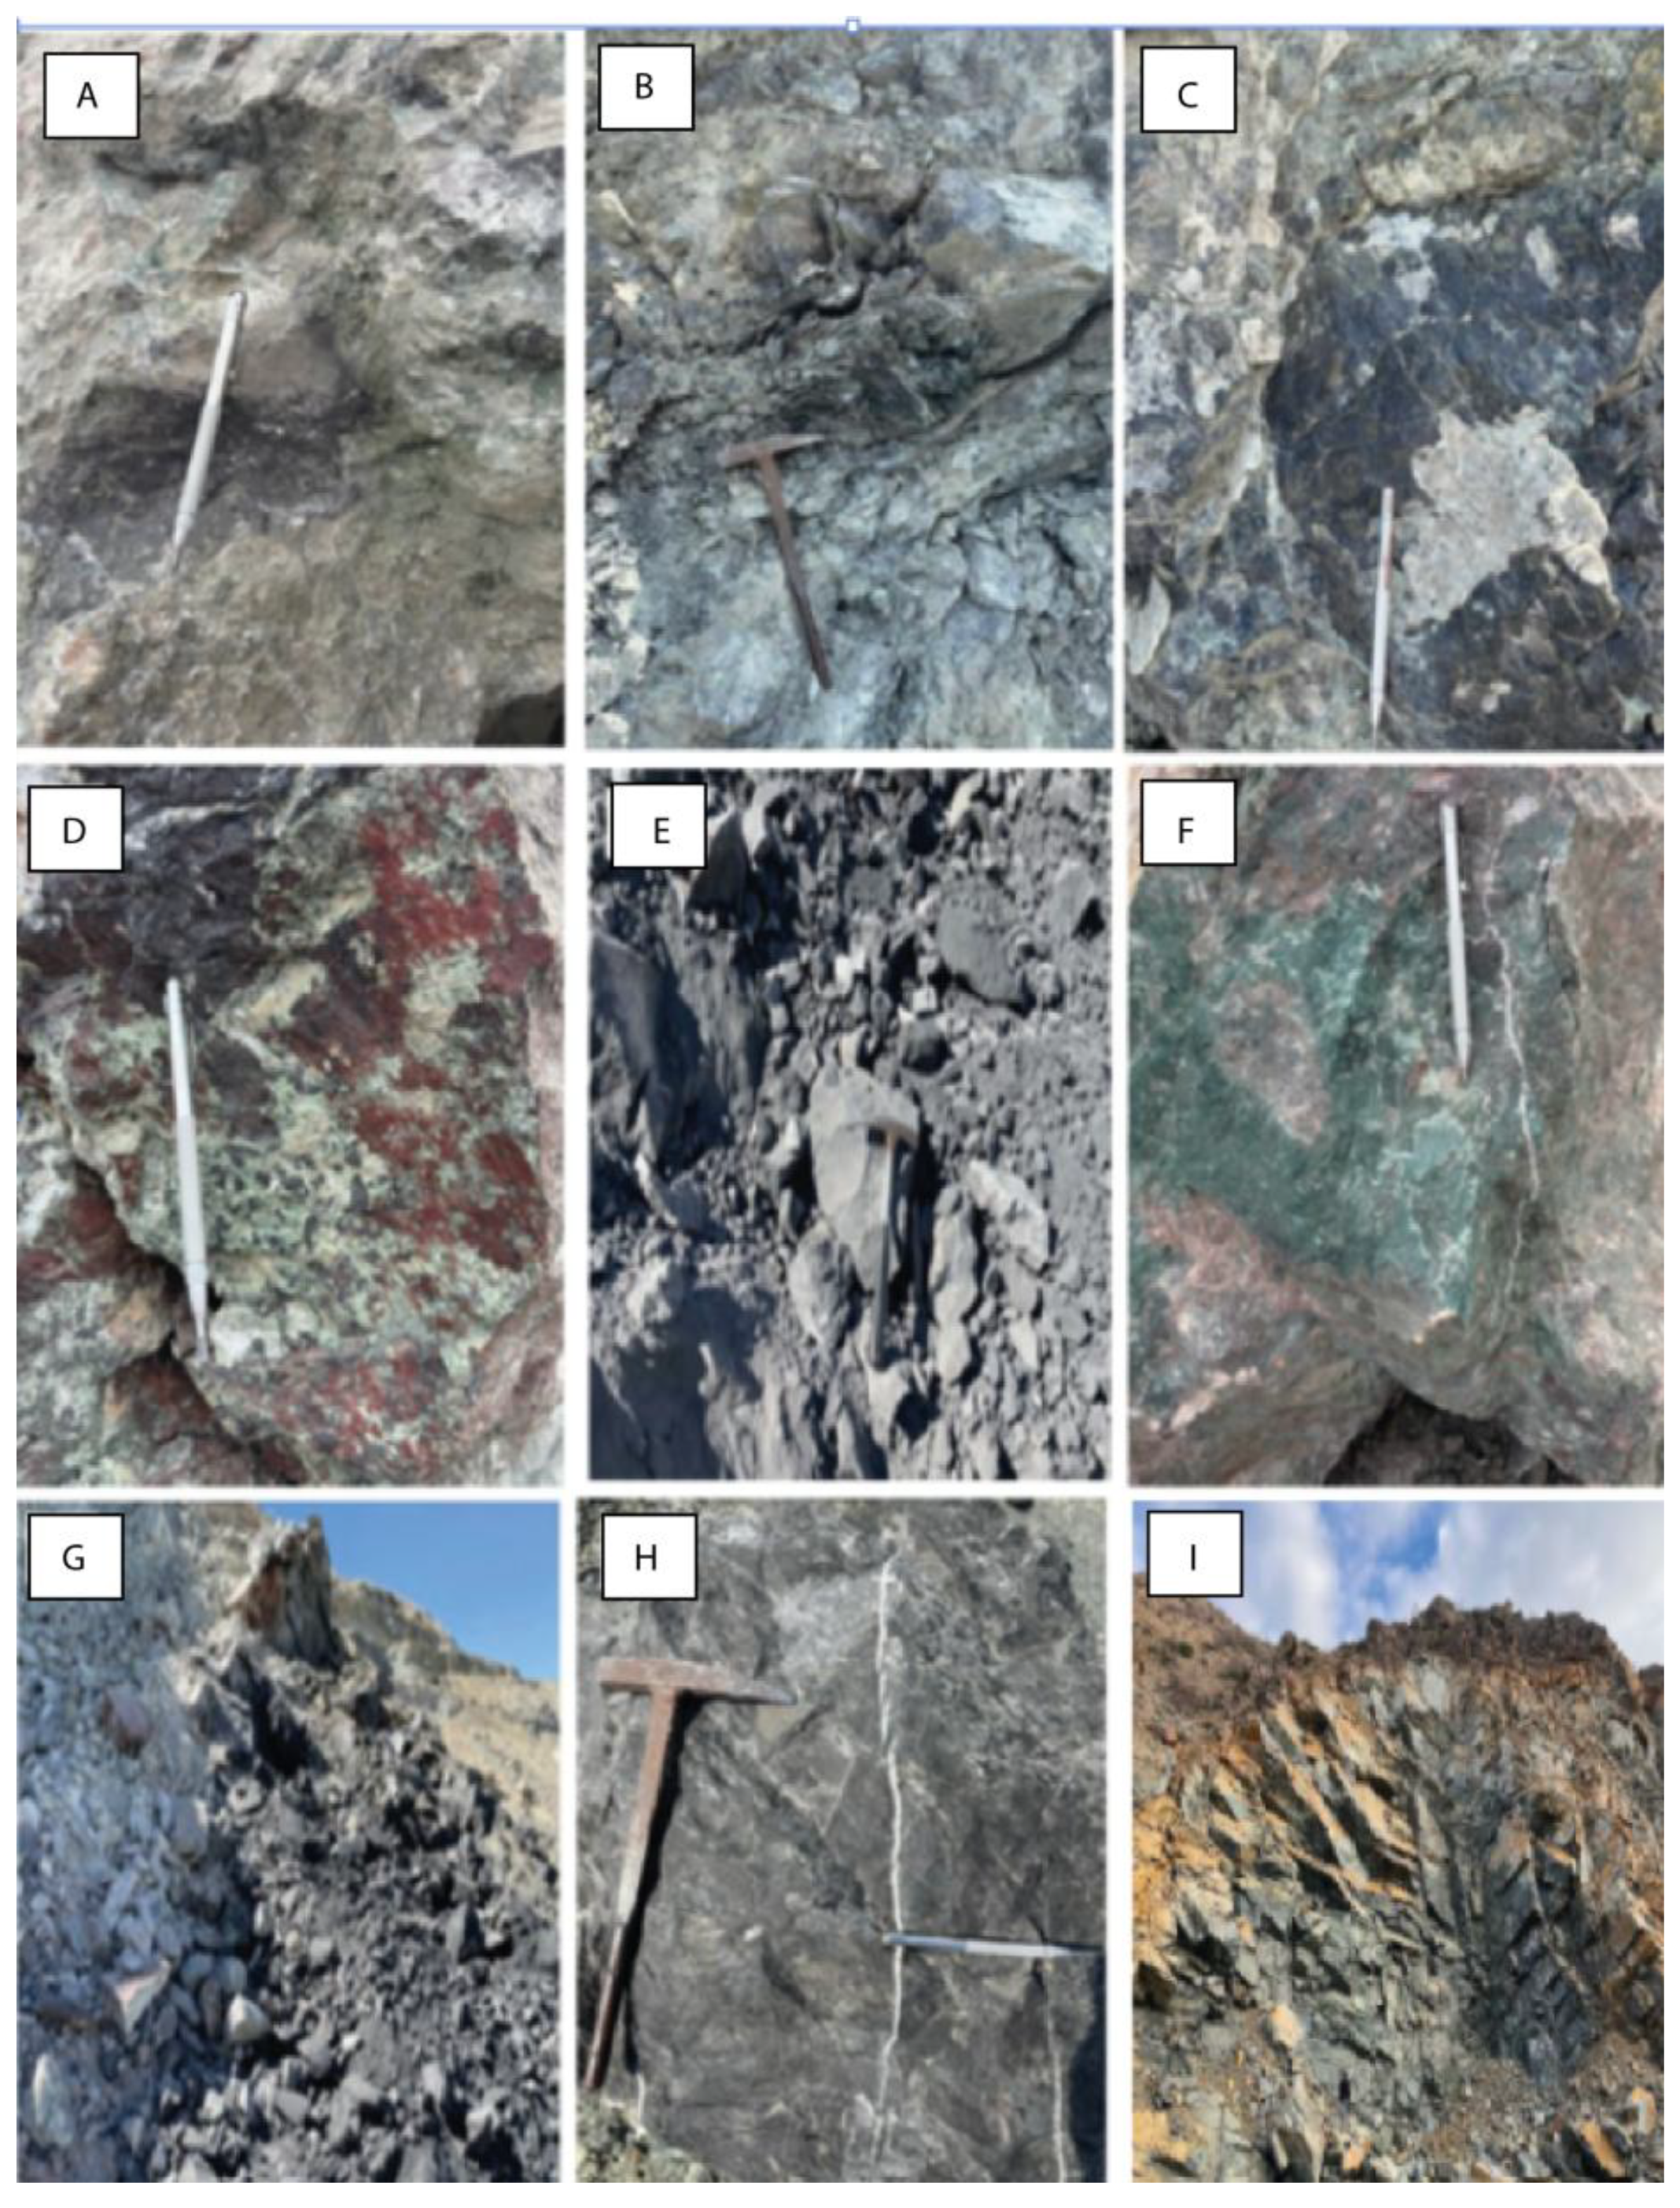
The serpentine group minerals—lizardite [Mg3(Si3O5(OH)4)], antigorite [(Mg, Fe)3(Si3O5(OH)4)], and chrysotile [Mg3(Si3O5(OH)4)]—possess specific compositions. Capable of forming in abyssal, mantle wedge, and subduction zone environments, these minerals frequently lead to ore formation through reactions involving fluids that induce metasomatism (Figure 4) [37]. Serpentine minerals can form under conditions starting from temperatures of 200–300 °C and pressures of 500 bar [38]. Akgül [39] states that during serpentinization, serpentine minerals follow a reaction sequence: olivine + water → serpentine + brucite; enstatite + water → serpentine + talc; and olivine + enstatite + water → serpentine. Figure 4 presents field views of serpentinites and iron mineralization in the study area. The serpentinites undergo alteration as a result of water-rock interaction at low temperatures (<20 °C). During the reactions resulting from this interaction, silicon—within the element cycle—is notably leached from mafic or ultramafic rocks and partially re-precipitated as authigenic clay minerals. Conversely, the subsequent serpentinization process requires a net input of silicon into water. Figure 4D–G shows blocks and clasts that are completely serpentinized yet retain their structural integrity. Fibrous chrysotile veins, exhibiting orthogonal and oblique orientations, were observed within the durable serpentine clasts at numerous locations in the field (Figure 2, Figure 3 and Figure 4). Pyroaurite formations were encountered—typically within fractures where hyperalkaline waters seeped and ascended—associated with clasts resembling serpentinite breccia (Figure 4F). All primary minerals, with the exception of chromian spinel, have been replaced by secondary minerals (Figure 3 and Figure 4). Although the serpentinite breccia in certain parts of the study area is fully serpentinized, the blocks that have retained their integrity are surrounded by anastomosing structures [40]. Evidence of serpentinization—driven by deformation, alteration, and recrystallization processes—was observed along deep valleys and slopes of the study area (Figure 4).

3.3. Geochemistry

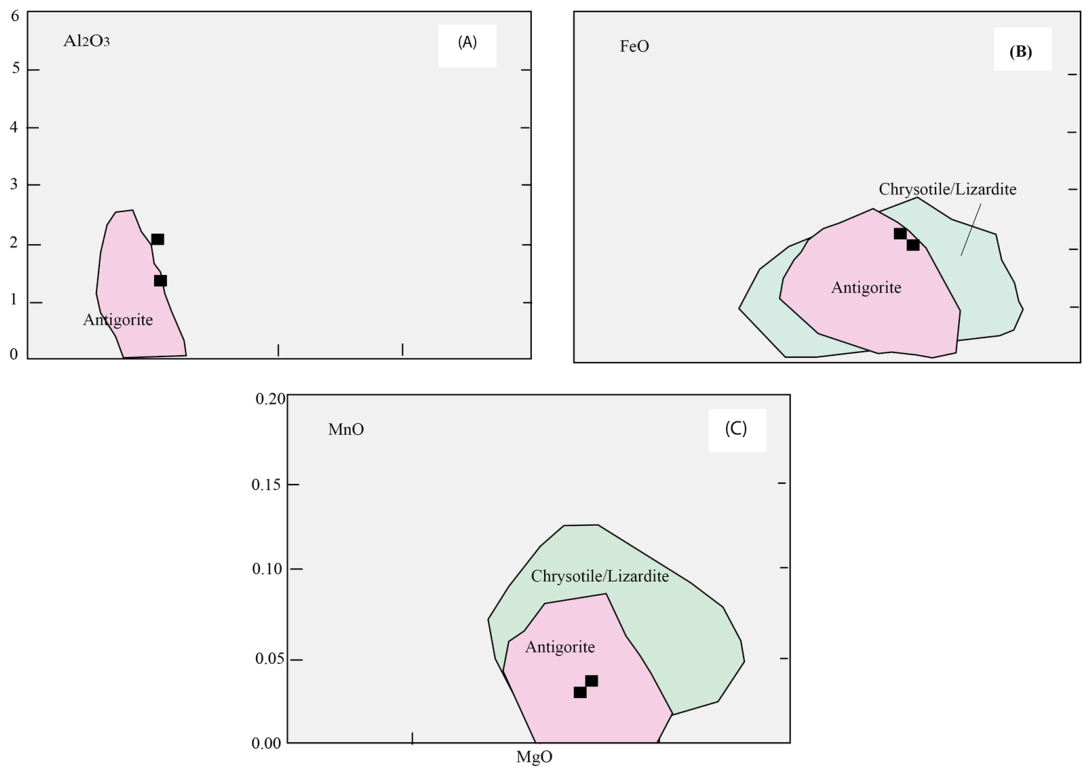
The major element and trace element contents of serpentine samples are presented in Table 1. Serpentines are classified into two groups with distinct chemical compositions: harzburgite serpentines and lherzolite serpentines [39]. The most significant compositional difference between these groups lies in their SiO2 content. Harzburgite serpentines possess high SiO2 content, whereas the SiO2 content of lherzolite serpentines varies over a wide range (36.0–46.0%) [41]. The SiO2 contents of analyzed serpentines—39.12%, 38.53%, and 42.09%, respectively—indicate that these samples may belong to the lherzolite serpentine group (Table 1; Figure 5). Considering data for common serpentines, Al2O3 content ranges from 1.29 to 3.79% [42]. With the exception of two samples, the Al2O3 content is high (1.37%, 2.10%, and 16.74%, respectively). This may indicate a contribution from Al2O3-rich orthopyroxene and/or higher-grade metamorphic–hydrothermal conditions. This situation suggests a higher proportion of antigorite relative to chrysotile and lizardite, as antigorite derived from orthopyroxene contains high levels of Al2O3 [41] (Figure 5). The MgO contents are 36.00%, 36.24%, and 38.85%. High MgO and SiO2 contents, in conjunction with high Al content, facilitate more frequent Al substitution within the crystal structure [41]. Fe2O3 contents of approximately 8.13%, 7.84%, and 13.87% indicate a relatively Fe-rich composition. The high Fe content may reflect Fe–Mg substitution within the crystal structure and redistribution of Fe during serpentinization of olivine and orthopyroxene. The iron in serpentinite can exist in both Fe2+ and Fe3+ oxidation states. It can substitute for Mg2+, particularly in octahedral sites. The relative proportions and distribution of Fe2+ and Fe3+ may vary among chrysotile, lizardite, and antigorite, depending on their crystal–chemical properties and formation conditions. The presence of magnetite alongside serpentine further indicates that Fe was redistributed between serpentine and magnetite during the serpentinization process. A notable observation in Table 1 is that, while ESp-1 and ESp-2 exhibit nearly similar chemical compositions, ESp-3 is in the MgO range (36–38.85%) (Table 1). The low CaO content (0.36 wt.%) suggests limited calcium enrichment, whereas the relatively high MgO content (36–36.2 wt.%) is consistent with an olivine-rich ultramafic protolith. The fact that ESp-3 is significantly more enriched in SiO2–Al2O3–Fe2O3–CaO and possesses markedly higher REE contents stems from a difference in the composition of the source rock. Furthermore, low Al2O3 and relatively high MgO contents, compared with primitive mantle (~4.5 wt.% Al2O3; except ESp-3), indicate a depleted mantle residue resulting from extensive partial melting [43].
It was previously stated that antigorite is the dominant serpentine mineral in the rock, with lesser amounts of lizardite/chrysotile present (Figure 5). Examination of SEM images reveals morphologies consistent with chemical results: platy for antigorite, fibrous for chrysotile, and wavy-surfaced for lizardite The co-occurrence of these minerals in the same rock indicates that serpentinization temperature exceeded 400 °C [40]. While chrysotile and lizardite can remain stable up to ~400 °C [40], antigorite is a serpentine phase that is stable at higher temperatures. Similarly, Bach et al. [45] experimentally demonstrated that lizardite and chrysotile can form within the 350–400 °C temperature range in certain natural systems, with chrysotile forming at ~311 °C and lizardite at ~400 °C.
The analyzed serpentinites show low HFSE (Zr, Hf, Nb, Ta) and LFSE (Rb, Ba, Sr) concentrations (Table 1). Regarding transition elements, the Ni (1963, 1955, 1923 ppm) and Co (79.8, 92.0, 72.3 ppm) contents of the samples depend on the composition of the parent rock. The notably high Ni content indicates that nickel originally present in olivine and pyroxene was affected by the serpentinization process and reflects the nickel-rich nature of the protolith [46]. Furthermore, the fact that Mg2+ levels exceed Ni2+ levels indicates mobility of these elements—which can substitute for one another in crystal structure—during and after serpentinization [46]. This situation is the result of fluid percolation (the flow of hydrothermal fluids through rock) and associated element transport occurring during serpentinization [47].
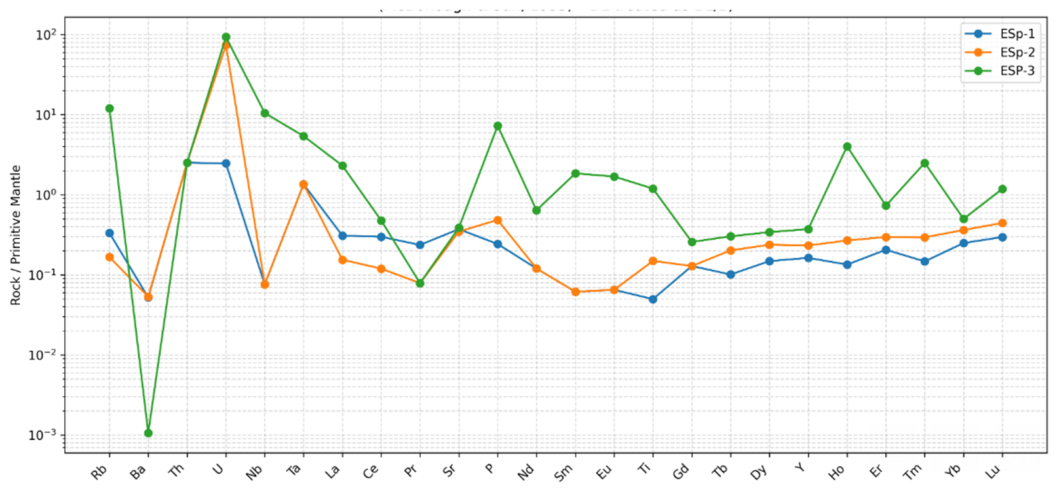
The zigzag pattern shown in Figure 6 is due to variability of rare earth elements even within the same rock units. The studied serpentinites are depleted in REE, with average ∑REE contents of (11.07, 15.13, 12.52 ppm) (Figure 6, Table 1). Light rare earth elements (LREE) range from 0.83 to 4.27 ppm, and heavy rare earth elements (HREE) range from 0.36 to 1.65 ppm. In these rocks, LREEs are slightly less fractionated compared to HREEs, normalized (La/Sm)n = 2.52, 2.10, 1.26 (forearc serpentinites average ((La/Sm)n = 2.3) [48], (Gd/Yb)n = 0.51, 0.81, 0.51. The (Gd/Yb)n ratios being less than one (0.51, 0.81, 0.51) indicate a distinct positive slope for HREEs. This suggests a highly depleted mantle protolith formed by high-degree partial melting before subduction, with geochemical characteristics typical of forearc mantle-wedge serpentinites [48]. The distinct positive Eu anomaly exhibited by Sample 3 (Eu/Eu* = 2.45) indicates the presence of reducing hydrothermal fluids with temperatures >250 °C within the forearc mantle wedge. This anomaly confirms processes associated with deep fluid circulation in subduction zones or plagioclase alteration.

3.4. Characteristics of Mid-Infrared ATR-FTIR Spectra

The FTIR analysis technique is suitable for investigating structural changes in serpentine minerals [50]. Temperature-dependent peak shifts or changes in intensity/absorbance arise from differences in symmetry, bond lengths, and structural arrangements (Figure 7). Variations in absorbance of OH IR bands are utilized for purposes such as estimating OH or H2O content within the crystal structure. Unlike amorphous silicon, where Si–H stretching vibrations are observable around 2000 cm−1, Si–H stretching bands are not characteristic of these minerals; in serpentine group minerals, hydrogen is incorporated into the structure primarily as structural OH. The characteristic infrared absorption features of serpentine minerals are associated with O–H stretching vibrations in the 3600–3750 cm−1 region and lattice vibrations in the 1200–400 cm−1 range. Consequently, no distinct Si–H stretching band was detected around 2000 cm−1 in the obtained FTIR spectra. This finding is consistent with previous spectroscopic studies on chrysotile, lizardite, and antigorite [26]. Existing literature includes FTIR studies on serpentine minerals; notably, the study by Rinaudo et al. [50] distinguishes between serpentine polymorphs and determines the structural behavior of serpentine minerals within their stability ranges under high-temperature and high-pressure conditions. The researchers evaluated the types and structural characteristics of serpentines using a combination of ICP-MS, SEM, and FTIR analyses.
Typical FTIR spectra for serpentines in the 4000–400 cm−1 range are divided into three band groups: The first group consists of strong absorption bands observed in the 3800–3500 cm−1 range, arising from M–O–H (M = Mg2+, Fe2+) stretching vibrations (Figure 7 and Figure 8). Another group comprises strong, complex bands observed in the 1200–600 cm−1 range, corresponding to asymmetric and symmetric Si–O–Si stretching vibrations. The final group includes one or more strong bands observed in the 600–400 cm−1 range, characterizing M–OH stretching vibrations and Si–O–Si deformation vibrations [24]. Compared to the spectra of lizardite and chrysotile, it exhibits wavenumbers that are lower by 4–10 cm−1 [21]. Antigorite displays a characteristic small peak around 3632 cm−1. This feature may stem from the periodic and symmetrical structure, which results in the mutual damping of internal OH vibrations [21].
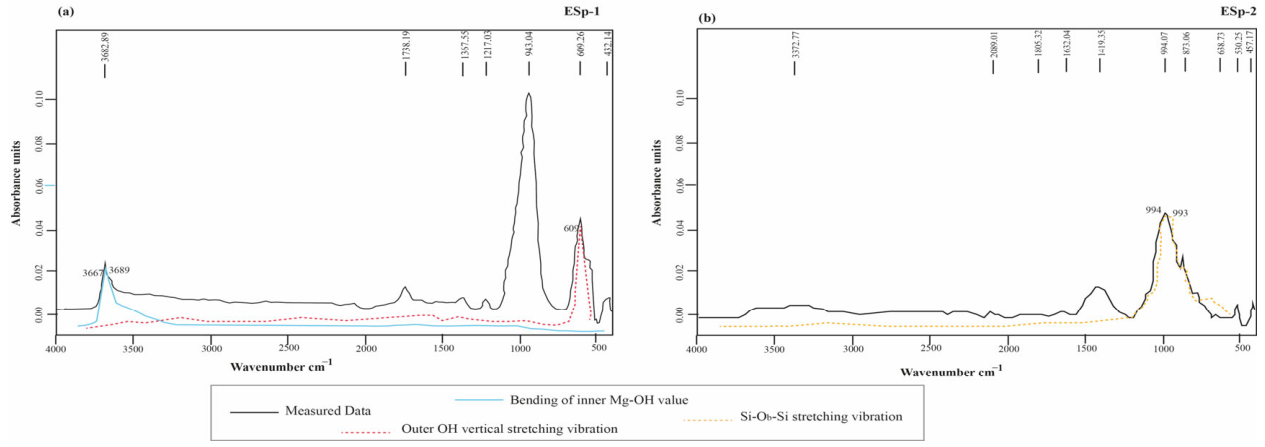
In the FTIR spectra obtained at room temperature, a three-component peak-fitting procedure was applied to resolve the overlapping OH stretching vibrations-νOH (3600–3800 cm−1) (Figure 8a). Furthermore, absorption bands—specifically associated with carbonate types described by [25] and characterized by variable intensities—arising from symmetric stretching and bending vibrations near 1440 and 880 cm−1 were observed in the examined serpentinites (Figure 8a,b, Table 2). In FTIR spectroscopy, the 3800–3500 cm−1 region indicates O–H stretching vibrations associated with Mg2+ and Fe2+. The 1200–600 cm−1 region reflects Si–O–Si stretching vibrations, while the 600–400 cm−1 region reflects M–OH vibrations and Si–O–Si bending/deformation vibrations [21]. The presence of bands at wavenumbers of approximately 1440 and 880 cm−1 (Figure 8b) indicates the presence of carbonate phases. Furthermore, the field photograph of the serpentinites in Figure 4C provides visual evidence supporting the existence of carbonatization-type alteration in the study area. The weak bands observed at 3682.89 cm−1 (OH stretching vibration), 1738.19 cm−1, and ~1368 cm−1 in the first figure may be associated with the vibrations of carbonate groups. However, observation of characteristic bands around ~1440 and ~880 cm−1 is required to conclusively establish the presence of carbonates [52]. In Figure 8a, the bands at 1217.03 cm−1 (Si–O–Si stretching vibrations), 943.04 cm−1 (Si–O stretching vibrations), and 609.26 cm−1 (M–OH and/or Si–O–Si deformation vibrations) are evident, while the band at 432.14 cm−1 represents low-wavenumber lattice/deformation vibrations. A distinct OH stretching band around 3682.9 cm−1 and vibration bands associated with Si–O in the 1200–600 cm−1 range are prominent in the spectrum. According to Wu et al. [21], the specific outer OH vertical stretching vibration occurs in the ranges of 3667–3689 cm−1 for lizardite, 3674–3696 cm−1 for antigorite, and 3668–3699 cm−1 for chrysotile. The band observed at 3682 cm−1 in Figure 8a falls within the characteristic range reported for lizardite and indicates the outer OH vertical stretching vibration of the analyzed sample (ESp-1). According to Wu et al. [21], the band near 609 cm−1 is characteristic of the inner Mg–OH bending vibration and is common to all three serpentine polymorphs (lizardite, antigorite, chrysotile). The bands around 943 and 609 cm−1 can be attributed to deformation vibrations (943.04 cm−1, 609.26 cm−1) (Figure 8a). The characteristic OH stretching vibrations of serpentine minerals are observed in the range of approximately 3650–3700 cm−1, with a distinct band identified in this region, particularly around ~3680 cm−1. In contrast, a low-intensity band observed around 610 cm−1 can be attributed to OH deformation vibrations and/or lattice vibrations within the serpentine structure (Figure 8a). Although the band near 610 cm−1 is relatively weak in intensity and may not be clearly resolved in all spectra, its presence can be recognized in the spectra of serpentine samples. Therefore, this band is considered a supporting spectral feature rather than a diagnostic criterion used independently for polymorph identification. The identification of serpentine polymorphs was based on the overall FTIR spectral characteristics, including OH stretching and Si–O-related bands, together with XRD data. However, due to the low intensity of these bands and their spectral overlap with neighboring vibrations, it was not possible to reliably resolve and fit them in spectra obtained from inside measurements (Figure 8b). In the Es-1 sample, the O–H stretching band appears at 3682.89 cm−1, while Si–O stretching vibrations are primarily observed in the 943–1030 cm−1 range. Additional bands between 432 and 639 cm−1 arise from OH liberation, SiO4 bending, and lattice vibrations. These bands are consistent with characteristic vibration bands reported in the literature for serpentine group minerals (Table 2).
In the FTIR spectrum shown in Figure 8b, the strong band observed at a wavenumber of ~994 cm−1 is attributed to the Si–Ob–Si stretching vibrations reported for antigorite in the 993–994 cm−1 range [21]. The presence of this characteristic antigorite band in the ESp-2 spectrum constitutes strong spectroscopic evidence that the serpentine phase in the sample in question is predominantly antigorite. Furthermore, the bands observed at wavenumbers of 638, 538, and 451 cm−1 correspond to lattice vibrations involving Si–O and Mg–O bonds within the serpentine structure [26]. The bands observed at approximately 1419 and 873 cm−1 indicate the presence of carbonate phases in the sample, corresponding to stretching and bending vibrations of CO32− groups, respectively [53]. The band groups at approximately 3373 and 1623 cm−1 are associated with O–H stretching and H–O–H bending vibrations, respectively, and can be attributed to the presence of adsorbed molecular water [53]. These features were also checked in the spectra of the other two samples but were not clearly resolved, indicating that carbonate phases and/or adsorbed water are less pronounced or below the detection/resolution level in those samples.
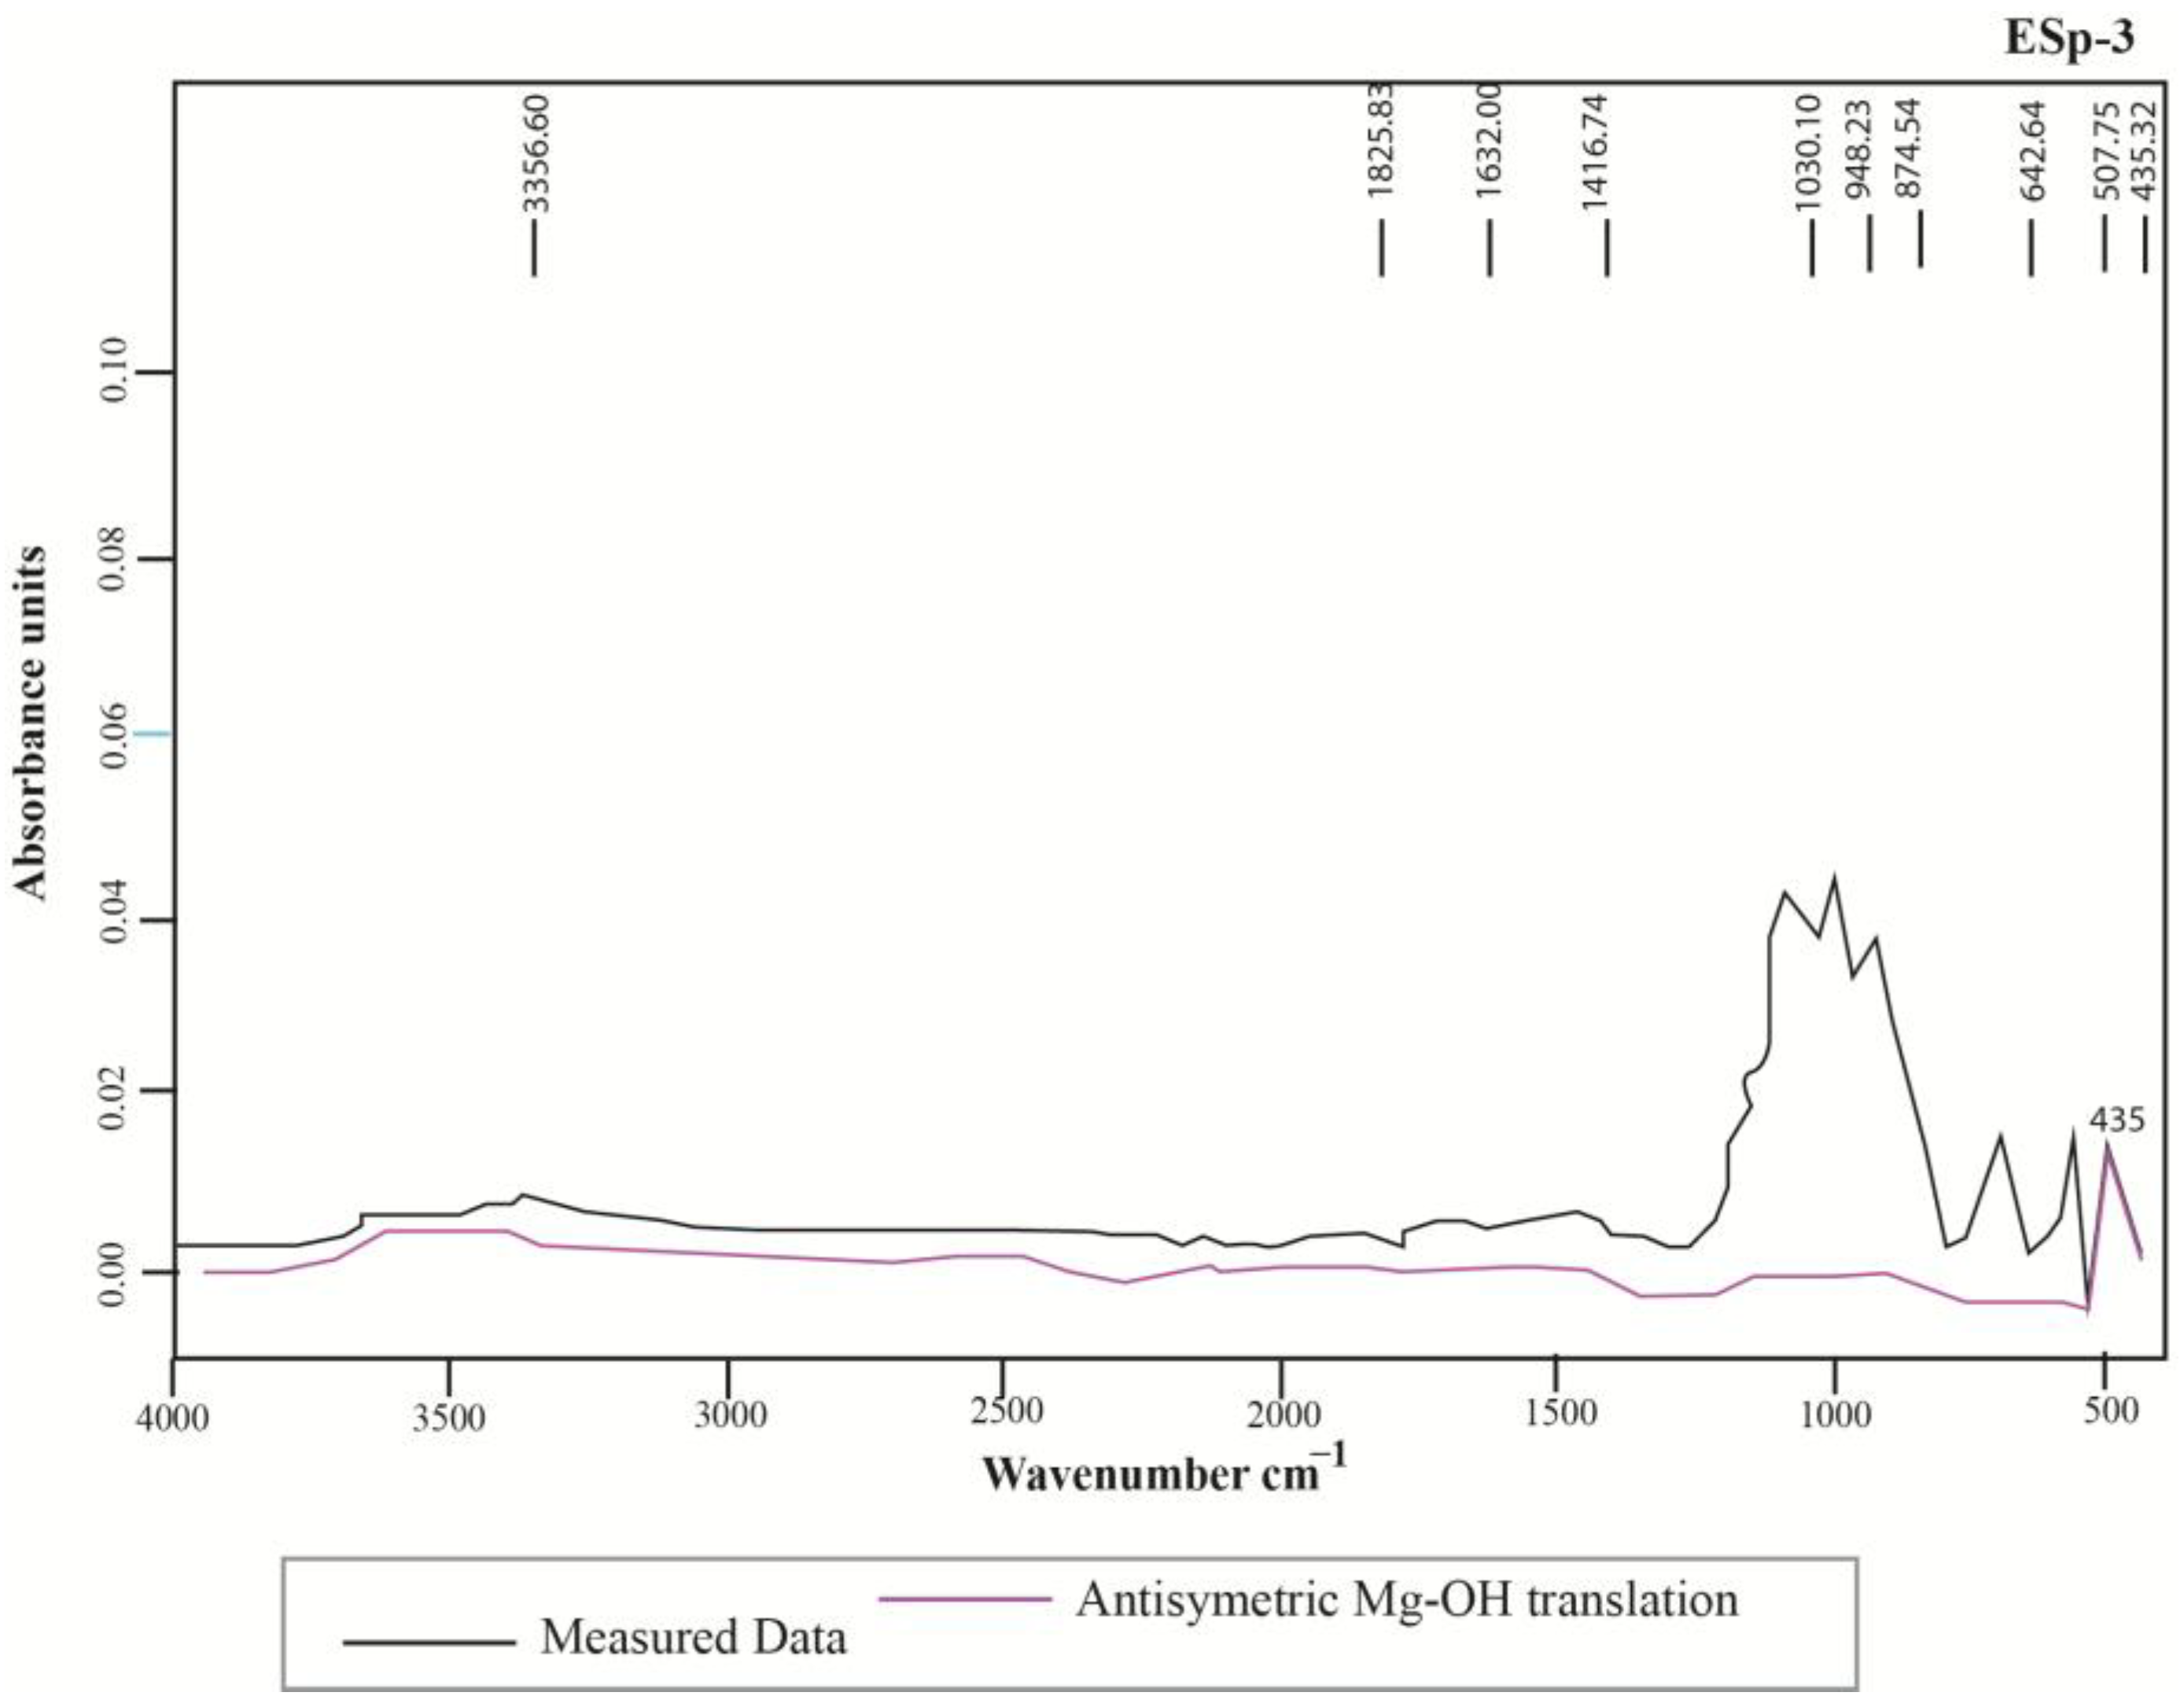
The OH region in IR spectroscopy is significant for distinguishing between serpentine polymorphs. Characteristic spectra for linarite appear at 3652, 3687, and 3702 cm−1; for chrysotile, these values are 3648–3650, 3685–3690, and ~3700 cm−1; and for antigorite, they are ~3670–3675 cm−1 [53]. For weaker components, the absence of the inner OH band near ~3700 cm−1 is typical. The FTIR spectral bands and band groups confirm the presence of serpentine-group minerals (Figure 9). The FTIR spectrum in Figure 9 shows an antisymmetric Mg–OH translation band, which has been identified by Wu et al. [21] as a characteristic vibrational feature of chrysotile. This supports the presence of chrysotile in the analyzed sample (ESp-3). IR spectra corresponding to surface hydroxyl groups (OH) of serpentine samples are presented in Figure 9. However, when the OH region (3600–3750 cm−1) and the 400–1200 cm−1 region of the sample spectra are evaluated separately, the presence of some antigorite alongside chrysotile is observed.
The OH stretching region of the FTIR spectra in Figure 8b is characterized by a broad absorption band featuring a distinct maximum and various shoulder bands of varying relative intensities. The absorption centered around 3680–3690 cm−1, along with shoulder bands near 3704, 3693, and 3670 cm−1, may be attributed to the stretching vibrations of isolated OH groups associated with MgO6 octahedral coordination [26,27,53]. Consequently, the IR spectra corresponding to the OH stretching vibrations identified for the samples under investigation are consistent with spectra previously reported in the literature (~609 cm−1, ~630 cm−1, ~649 cm−1) [26,53].
Antigorite and chrysotile were identified in the examined serpentinites (Figure 8b and Figure 9). Although each serpentine polymorph exhibits characteristic spectral features in FTIR and XRD patterns, the results indicate that these phases can coexist to some extent within the same sample. Consequently, the observed spectral features reflect the presence of lizardite, antigorite, and chrysotile in varying proportions, rather than pointing to a single serpentine polymorph (For example, Figure 8a and Figure 9). The chrysotile shows Si–O bands at 950 and ~1005 cm−1, whereas lizardite exhibits a band at ~975 cm−1. The spectrum shown at ~994 cm−1 consists of a single, dominant, and very strong band. Consequently, it can be inferred that all three samples contain an association of chrysotile with lizardite/antigorite; although the band at approximately 638.73 cm−1 is insufficient on its own to confirm a specific polymorph, it is consistent with the serpentine group.
Distinct spectra may not be observed in non-crystallized serpentinites [51]. The FTIR analysis employed in our study is suitable for distinguishing serpentine minerals solely based on major-element chemistry. The IR spectroscopy data are consistent with the findings of chemical analysis. The high silicon content observed in the analyses is a result of the antigorite-chrysotile replacement process. Antigorite, which forms through prograde and retrograde reactions during subduction and obduction processes [52], is a mineral stable at high temperatures (250 °C to >500 °C) [52]. When spectral findings, geochemistry, and microscopic observations are evaluated together, the spectral variations and broad spectral groups appear to have developed as a result of the incorporation of some SiO2—infiltrating the environment during prograde metamorphism—into antigorite structure [53,54,55].

3.5. Scanning Electron Micrographs (SEM)

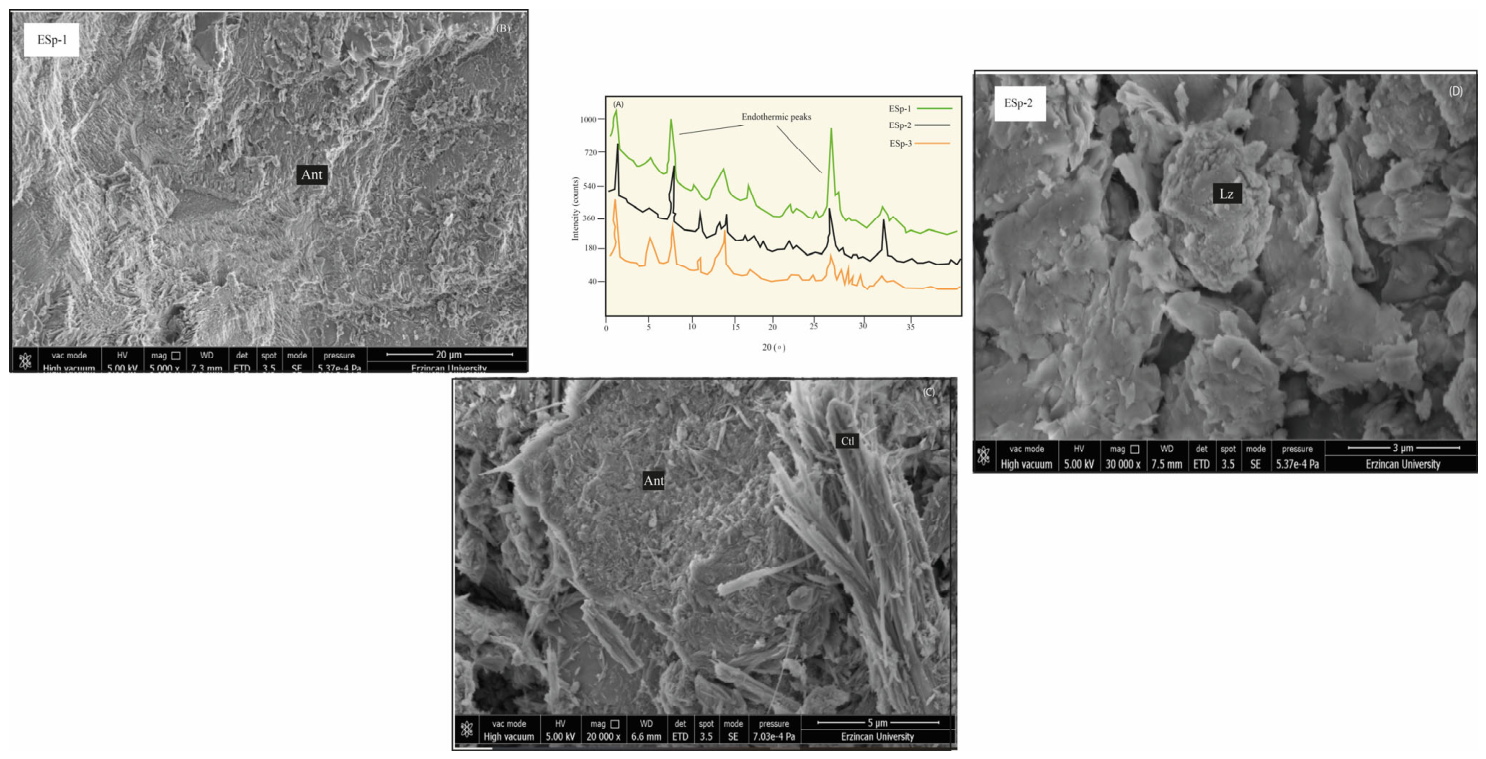
XRD and SEM images of serpentine samples are presented in Figure 10. X-ray diffraction (XRD) analyses were performed using a PANalytical Empyrean diffractometer operated at 45 kV and 40 mA with Cu Kα radiation (λ = 1.540598 Å); diffraction patterns were collected over a 2θ range of 10.03–89.97° with a step size of 0.055°. The XRD patterns exhibit characteristics typical of serpentine minerals, featuring a prominent basal reflection at approximately 12° 2θ (d ≈ 7.1 Å), along with reflections at 24° 2θ (d ≈ 3.7 Å), 35–37° 2θ (d ≈ 2.4–2.5 Å), 42° 2θ (d ≈ 2.15 Å), 51° 2θ (d ≈ 1.79 Å), and 60–62° 2θ (d ≈ 1.5 Å). Comparison of these diagnostic reflections with reference JCPDS patterns is consistent with the identification of chrysotile, lizardite, and antigorite. The relative intensities of the characteristic reflections were taken into account during phase identification. As neither Rietveld refinement nor any other quantitative phase analysis method was employed, quantitative phase proportions were not calculated. Consequently, the XRD data provide qualitative mineralogical evidence that complements FTIR-based identification of serpentine polymorphs and their characteristic OH stretching bands.
The images of samples ESp-1 and ESp-2 are consistent with literature data (Figure 10); the lamellar morphology is associated with antigorite mineral, and ESp-2 exhibits a platy (plate-like) morphology characteristic of lizardite, whereas sample ESp-3 is identified as the chrysotile phase, displaying the classic curved, cylindrical fibrous morphology [1,53]. Fibrous chrysotile cuts across other serpentine phases within the rock (Figure 10). The platy morphology observed in SEM images characterizes high-grade metamorphic transformation [54]. Chrysotile occurs in the form of curved, hollow cylinders and is predominantly found in bundles parallel to one another (Figure 10).

4. Discussion

Geological, microscopic, major and trace element, FTIR, and SEM analyses of serpentinites observed between the Divriği district of Sivas province and the Kemaliye district of Erzincan province reveal the multi-stage mineral transformations and serpentinization processes that occurred during hydration of ultramafic rocks. Microscopic examinations indicate that the serpentinites contain olivine and orthopyroxene relics, and that the mesh textures and fractures of these minerals are locally rimmed by fibrous chrysotile and lizardite. It is evident that serpentinization proceeded via pseudomorphic and vein-type reactions within the protolith texture.
Serpentinites formed in diverse environments—such as mantle wedges, abyssal settings, and subduction zones—comprise three minerals with distinct crystal structures: antigorite, lizardite, and chrysotile. These minerals, which exhibit varying morphologies and differ in terms of cation exchange and crystal structure, either envelop primary minerals (olivine and pyroxene) or alter them starting from their margins. The co-occurrence of chrysotile, lizardite, and antigorite within rock suggests that serpentinization and/or subsequent metamorphic recrystallization processes may have taken place under varying pressure-temperature (P-T) conditions. Particularly in samples dominated by antigorite, mineralogical characteristics are consistent with the presence of serpentine phases that form or recrystallize at higher temperatures. A study on high-pressure serpentinites [56] indicates that antigorite begins to replace lizardite within the 320–390 °C range and becomes the dominant serpentine phase above 390 °C. An examination of the chemical compositions of ESp-1, ESp-2, and ESp-3 samples reveals that the ESp-3 sample exhibits a composition distinct from that of the other two. The low Al2O3 and high MgO contents, along with similar transition element concentrations, observed in ESp-1 and ESp-2 suggest that these samples may have originated from a similar ultramafic protolith and undergone varying degrees of serpentinization or alteration [36]. In contrast, the distinct chemical composition observed in ESp-3 may be attributed to the mineralogical composition of the protolith, alteration conditions, or the redistribution of elements during serpentinization.
The variation in SiO2 contents between 38.53% and 42.09% and MgO contents between 36.00% and 38.85% in the examined samples is consistent with serpentinized ultramafic rocks. While low Al2O3 contents in ESp-1 and ESp-2 may indicate the presence of an Al-poor ultramafic protolith, high Al2O3 content in ESp-3 could be attributed to orthopyroxene contribution, a different protolith composition, or the influence of Al-bearing phases during alteration. When Al2O3 contents are evaluated alongside FTIR and SEM findings, a mineralogical composition consistent with the presence of antigorite emerges. The variation in Fe2O3 contents between 7.84% and 13.87% indicates that samples are Fe-rich and that Fe is distributed among serpentine minerals, magnetite, and relict mafic minerals during serpentinization. The generally low HFSE and LFSE contents support the conclusion that the serpentinites were derived from an ultramafic protolith. However, the higher contents of Hf, Nb, Rb, and certain rare earth elements (REE) in sample ESp-3 compared to other samples suggest that this sample may have undergone a different alteration history. The low total REE contents of the examined serpentinites reflect the REE-depleted nature of the ultramafic protolith. The fact that ∑REE contents range from 11.07 to 15.13 ppm and HREE contents are lower than LREE contents indicates that serpentinites originated from an REE-depleted source rock. Normalized (La/Sm)n ratios ranging from 1.26 to 2.52 reveal a relative enrichment of LREEs compared to HREEs. In contrast, (Gd/Yb)n ratios between 0.51 and 0.81 suggest the absence of significant fractionation among HREEs and indicate a slight HREE slope. These characteristics are consistent with the REE behavior commonly observed in fore-arc serpentinites. However, fluid–rock interaction during serpentinization, protolith composition, and element transport can also influence REE patterns. The positive Eu anomalies observed in ESp-2 and ESp-3 may be consistent with processes that can develop, particularly in systems where plagioclase undergoes alteration [22,57,58].
FTIR analyses reveal that the serpentinites examined exhibit significant spectral diversity regarding OH- stretching vibrations. The analyzed samples are consistent with results reported for trioctahedral 1:1 layer silicates within the serpentine group [11,26,52,59,60]. Characteristics such as the position, intensity, and width of bands in fundamental and overtone regions of vibrational spectra differ for each serpentine type and also vary depending on the spectroscopic method employed [26]. Regarding vibrational spectroscopic properties of the OH stretching modes for antigorite, lizardite, and chrysotile, lizardite exhibits high symmetry. FTIR spectra obtained in this study are consistent with characteristic vibrational properties of serpentine-group minerals and support the presence of lizardite, chrysotile, and antigorite in serpentinites examined. The Si–O stretching region is particularly diagnostic for distinguishing between serpentine polymorphs [26]. The bands observed at approximately 950 and 1005 cm−1 in the examined serpentinites (Figure 8) can be attributed to Si–O stretching vibrations; the positions of these bands are consistent with characteristic Si–O vibrations previously reported, particularly for chrysotile [26]. The high structural symmetry of lizardite facilitates the assignment of FTIR bands, whereas the more complex structures of chrysotile and antigorite give rise to distinct vibrational characteristics. Researchers Yariv and Heller-Kallai [10], Balan et al. [18], and Prencipe et al. [61] state that the symmetry of vibrational modes is important for interpreting FTIR spectra of serpentine minerals. Therefore, Si–O bands of serpentine minerals under investigation were evaluated based on both their wavenumber positions and structural characteristics.
An examination of the position and structure of antigorite’s OH stretching bands reveals lower symmetry and more pronounced structural distortions compared to lizardite [62]. This lower symmetry and the structural distortions give rise to significant differences in the vibrational spectrum of antigorite compared to that of lizardite [26]. The most significant reason for this is theoretical modeling of the FTIR spectrum of the m = 17 antigorite polysome [18]. The fact that the examined serpentine samples exhibit a broad and dominant OH stretching band serves as evidence of this (Figure 8a and Figure 9). This band is observed at approximately 3682 cm−1 and 3358 cm−1. The width of the band arises from the distribution of OH bond lengths within the low-symmetry structure of antigorite. In particular, the distinct shoulder at 3356 cm−1 is indicative of inner OH vibrations characterized by a relatively narrow frequency distribution [18]. Consequently, the MIR spectra of antigorite—like those of lizardite—are dominated by a broad, asymmetric central band associated with interlayer OH groups.
The broad absorption bands observed in the 3600–3750 cm−1 range reflect distinct OH environments within serpentine minerals. The positions and relative intensities of the bands in this region may be associated with the crystal structure of serpentine polymorphs, the environment of OH bonds, and cation substitutions within the octahedral sheets [22,26]. The peak observed around 3680–3690 cm−1, along with shoulder or splitting features around 3704, 3693, and 3670 cm−1, is consistent with OH stretching vibrations associated with MgO6 octahedral coordination. The observation of plate-like morphology compatible with antigorite and broad OH bands in FTIR in ESp-1 and ESp-2 samples supports the conclusion that antigorite is an important phase in these samples. The fact that the fibrous chrysotile morphology is evident in ESp-3 suggests that chrysotile may be a more important phase in this sample. However, the strong Si–O band observed at approximately 994 cm−1 in the FTIR spectrum of ESp-3 alone is not sufficient to definitively distinguish chrysotile, lizardite, or antigorite. SEM data also show that antigorite and chrysotile are present together in the ESp-3 sample. The bands observed in the spectra around 1419 and 873 cm−1 are consistent with the vibrations of carbonate groups. Conversely, the absence of distinct carbonate bands around 1440 and 880 cm−1 in the samples does not conclusively prove the absence of carbonate phases; rather, it suggests the possibility that these phases are present in low quantities or fall within the detection limits of FTIR. Meanwhile, the bands at approximately 3373 and 1623 cm−1 can be attributed to the presence of adsorbed molecular water. Consistent with observations from fundamental vibration bands, the overtone spectra of antigorite (Figure 8a) show a shift in the inner OH frequency from 3682 cm−1 to 3641 cm−1 (Figure 9). The appearance of a weak shoulder at approximately 3682 cm−1—41 cm−1 below the inner OH band—may be attributed to strain within the Mg2+M* environment [26]. The broad and intense bands observed at approximately 994 cm−1 and 1020 cm−1 may originate from interlayer OH vibrations in the Mg3+ environment (Fritsch et al., 2021) [26]. Regarding the distinct Si–O stretching bands observed at 950 and 1005 cm−1—which are characteristic of chrysotile—antigorite exhibits a larger unit cell, lower symmetry, and more pronounced structural distortions when compared to lizardite and antigorite. The tubular morphology of chrysotile exhibits structural characteristics distinct from those of lizardite and antigorite, resulting in unique vibrational features in the FTIR spectrum. Therefore, when evaluating the bands associated with chrysotile, structural characteristics must be considered in comparison with lizardite and antigorite [18,26,61].
The FTIR spectra provide evidence for the coexistence of different serpentine polymorphs within the analyzed samples. The band at 3682 cm−1 falls within the reported range of the outer OH vertical stretching vibration of lizardite (3667–3689 cm−1), whereas the band near 994 cm−1 corresponds to the Si–Ob–Si stretching vibration reported for antigorite (993–994 cm−1). The band at ~609 cm−1 is associated with the bending vibration of inner Mg–OH groups, which is common to serpentine minerals. In addition, the antisymmetric Mg–OH translation band observed in Figure 9 represents a characteristic vibrational feature of chrysotile.
In conclusion, a combined evaluation of the mineralogical, geochemical, and spectroscopic data regarding serpentinites located north of Divriği reveals that serpentinization is associated with the mineralogical composition of the ultramafic protolith, fluid–rock interaction, and mineral transformations occurring under varying P-T conditions [1,56,61]. It is observed that antigorite is a significant phase in samples ESp-1 and ESp-2, while chrysotile is prominent in sample ESp-3; however, it is evident that no single method is sufficient to definitively distinguish between serpentine polymorphs. In this study, the combined use of FTIR, XRD, SEM, and whole-rock chemistry facilitated the identification of serpentine minerals and interpretation of their structural characteristics, while also demonstrating the value of integrating chemical analysis, SEM, and FT-IR spectroscopy to achieve these results.

5. Conclusions

  • The serpentinites examined are products of metamorphism of an ultramafic complex located in northern Turkey.
  • The FTIR spectra of serpentines were evaluated in conjunction with SEM, XRD, and chemical analysis data; the types of serpentine minerals, the vibration spectra associated with OH groups, and changes in crystal structure and chemical composition were compared against the complete set of analytical data. This band was considered a supporting spectral feature rather than an independent diagnostic criterion.
  • FTIR spectral results indicate that sample ESp-1 is lizardite, sample ESp-2 is antigorite, and sample ESp-3 consists of both chrysotile and antigorite.
  • The SEM findings are consistent with optical examination and FTIR results; it was determined that samples ESp-2 and ESp-3 exhibit a platy morphology consistent with antigorite, while sample ESp-1 displays a fibrous morphology consistent with lizardite/chrysotile. Furthermore, considering the overlap of FTIR bands, it was concluded that the serpentine species present are antigorite, chrysotile, and lizardite. Although each serpentine polymorph exhibits characteristic spectral features, FTIR and XRD results indicate that lizardite, antigorite, and chrysotile can coexist within the same sample in varying proportions.
  • The broad, distinct bands observed in the 3600–3750 cm−1 range of the OH stretching region characterize different OH environments of serpentine minerals, while fluids and alteration of the source rock may give rise to variations in chemical environment. This is supported by the fact that positive Eu anomalies may be associated with alteration and/or fluid–rock interaction. Furthermore, the REE patterns are consistent with a depleted ultramafic protolith.
  • These results suggest that the studied serpentinites may have formed from a highly depleted mantle source under conditions consistent with a forearc mantle-wedge setting. However, this interpretation should be considered a hypothesis and requires confirmation through studies involving a larger number of serpentinites.
  • While the FTIR method is an effective complementary technique for identifying serpentine polymorphs and their structural characteristics, it is concluded that mineral identification should be evaluated in conjunction with XRD, SEM, and chemical data.

Author Contributions

Methodology, A.D.K. and I.Y.; formal analysis, A.D.K. and E.S.I.; investigation, A.D.K.; resources, A.D.K.; writing—original draft preparation, A.D.K.; writing—review and editing, A.D.K., E.S.I. and I.Y.; project administration, funding acquisition, A.D.K. and E.S.I. All authors have read and agreed to the published version of the manuscript.

Funding

This study was supported by the Fırat University with FUBAP-MF.25.117 and MF.26.20.

Data Availability Statement

The original contributions presented in the study are included in the article; further inquiries can be directed to the corresponding author.

Conflicts of Interest

The authors declare no conflicts of interest.

References

  1. Şaşmaz, A.; Kılıç, A.D.; Konakçı, N. Chemical and Thermal Changes in Mg3Si2O5 (OH)4 Polymorph Minerals and Importance as an Industrial Material. Appl. Sci. 2024, 14, 10298. [Google Scholar] [CrossRef] [Scilit]
  2. Canales, J.P.; Dunn, R.A.; Arai, R.; Sohn, R.A. Seismic imaging of magma sills beneath an ultramafic-hosted hydrothermal system. Geology 2017, 45, 451–454. [Google Scholar] [CrossRef] [Scilit]
  3. Ulrich, M.; Munoz, M.; Boulvais, P.; Cathelineau, M.; Cluzel, D. Serpentinization of New Caledonia peridotites: From depth to (sub-)surface. Contrib. Mineral. Petrol. 2020, 75, 91. [Google Scholar] [CrossRef] [Scilit]
  4. Hattori, K.H.; Guillot, S. Geochemical character of serpentinites associated with high- to ultrahigh-pressure metamorphic rocks in the Alps, Cuba, and the Himalayas: Recycling of elements in subduction zones. Geochem. Geophys. Geosyst. 2007, 8, Q09010. [Google Scholar] [CrossRef] [Scilit]
  5. Zhang, L.; Sun, W.-D.; Chen, R.-X. Evolution of serpentinite from seafloor hydration to subduction zone metamorphism: Petrology and geochemistry of serpentinite from the ultrahigh pressure North Qaidam orogen in northern Tibet. Lithos 2019, 346, 105158. [Google Scholar] [CrossRef] [Scilit]
  6. Boskabadi, A.; Pitcairn, I.K.; Leybourne, M.I.; Teagle, D.A.H.; Cooper, M.J.; Hadizadeh, H.; Nasiri Bezenjani, R.; Monazzami Bagherzadeh, R. Carbonation of ophiolitic ultramafic rocks: Listvenite formation in the Late Cretaceous ophiolites of eastern Iran. Lithos 2020, 352, 105307. [Google Scholar] [CrossRef] [Scilit]
  7. Plissart, G.; González-Jiménez, J.M.; Garrido, L.N.F.; Colás, V.; Berger, J.; Monnier, C.; Diot, H.; Padrón-Navarta, J.A. Tectono-metamorphic evolution of subduction channel serpentinites from South-Central Chile. Lithos 2019, 336, 221–241. [Google Scholar] [CrossRef] [Scilit]
  8. Wicks, F.J.; Whittaker, E.J.W. Serpentine textures and serpentinization. Can. Mineral. 1977, 15, 459–488. [Google Scholar]
  9. Militello, G.M.; Bloise, A.; Gaggero, L.; Lanzafame, G.; Punturo, R. Multi-Analytical Approach for Asbestos Minerals and Their Non-Asbestiform Analogues: Inferences from Host Rock Textural Constraints. Fibers 2019, 7, 42. [Google Scholar] [CrossRef] [Scilit]
  10. Yariv, S.; Heller-Kallai, L. The Relationship between the I.R. Spectra of Serpentines and Their Structures. Clays Clay Miner. 1975, 23, 145–152. [Google Scholar] [CrossRef] [Scilit]
  11. Petriglieri, J.R.; Salvioli-Mariani, E.; Mantovani, L.; Tribaudino, M.; Lottici, P.P.; Laporte-Magoni, C.; Bersani, D. Micro-Raman mapping of the polymorphs of serpentine. J. Raman Spectrosc. 2015, 46, 953–958. [Google Scholar] [CrossRef] [Scilit]
  12. Rinaudo, C.; Gastaldi, D.; Belluso, E. Characterization of chrysotile, antigorite and lizardite by FT-Raman spectroscopy. Can. Mineral. 2003, 41, 883–890. [Google Scholar] [CrossRef] [Scilit]
  13. Luce, R.W. Identification of serpentine varieties by infrared absorption. USGS Prof. Pap. 1971, 750-B, 199–201. [Google Scholar]
  14. Falini, G.; Foresti, E.; Lesci, G.; Roveri, N. Structural and morphological characterization of synthetic chrysotile single crystals. Chem. Commun. 2002, 38, 1512–1513. [Google Scholar] [CrossRef] [Scilit]
  15. Basile, A.; Hughes, J.; McFarlane, A.J.; Bhargava, K. Development of a model for serpentine quantification in nickel laterite minerals by infrared spectroscopy. Miner. Eng. 2010, 23, 407–412. [Google Scholar] [CrossRef] [Scilit]
  16. Baron, F.; Petit, S. Interpretation of the infrared spectra of the lizardite-nepouite series in the near and middle infrared range. Am. Mineral. 2016, 101, 423–430. [Google Scholar] [CrossRef] [Scilit]
  17. Post, J.L.; Borer, L. High-resolution infrared spectra, physical properties, and micromorphology of serpentines. Appl. Clay Sci. 2000, 16, 73–85. [Google Scholar] [CrossRef] [Scilit]
  18. Balan, E.; Paulatto, L.; Deng, Q.; Béneut, K.; Guillaumet, M.; Baptiste, B. Molecular overtones and two-phonon combination bands in the near-infrared spectra of talc, brucite and lizardite. Eur. J. Mineral. 2022, 34, 627–643. [Google Scholar] [CrossRef] [Scilit]
  19. Sakaguchi, I.; Kouketsu, Y.; Michibayashi, K.; Walls, S.R. Attenuated total reflection infrared (ATR-IR) spectroscopy of antigorite, crysotile, and lizardite. J. Mineral. Petrol. Sci. 2020, 115, 303–312. [Google Scholar] [CrossRef] [Scilit]
  20. Cheng, H.F.; Hao, R.W.; Zhou, Y.; Frost, R.L. Visible and near-infrared spectroscopic comparison of five phyllosilicate mineral samples. Spectrochim. Acta Part A Mol. Biomol. Spectrosc. 2017, 180, 19–22. [Google Scholar] [CrossRef] [Scilit]
  21. Wu, S.; He, M.; Yang, M.; Zhang, B.; Wang, F.; Li, Q. Near-Infrared Spectroscopy Study of Serpentine Minerals and Assignment of the OH Group. Crystals 2021, 11, 1130. [Google Scholar] [CrossRef] [Scilit]
  22. Zhang, S.J.; Deji, Z.; Qin, H.; Liu, H.; Luosang, D.; Cheng, H.F. The Structure of Layered Silicate Mineral and Their Vibrational Spectra Characteristics. China Non-Met. Miner. Ind. 2018, 2, 1–7. [Google Scholar]
  23. Farmer, V.C. The Infrared Spectra of Minerals. In Mineralogical Society Monograph No. 4; Mineralogical Society: London, UK, 1974; p. 539. [Google Scholar]
  24. Bishop, J.L.; Lane, M.D.; Dyar, M.D.; Brown, A.J. Reflectance and emission spectroscopy study of four groups of phyllosilicates: Smectites, kaolinite-serpentines, chlorites and micas. Clay Miner. 2008, 43, 35–54. [Google Scholar] [CrossRef] [Scilit]
  25. Clark, R.N.; King, T.V.; Klejwa, M.; Swayze, G.A.; Vergo, N. High spectral resolution reflectance spectroscopy of minerals. J. Geophys. Res. Solid Earth 1990, 95, 12653–12680. [Google Scholar] [CrossRef] [Scilit]
  26. Fritsch, E.; Balan, E.; Petit, S.; Juillot, F. Structural, textural, and chemical controls on the OH stretching vibrations in serpentine-group minerals. Eur. J. Mineral. 2021, 33, 447–462. [Google Scholar] [CrossRef] [Scilit]
  27. Bloise, A.; Miriello, D. Multi-analytical approach for identifying asbestos minerals in situ. Geosciences 2018, 8, 133. [Google Scholar] [CrossRef] [Scilit]
  28. Barnes, L.; Le Marche, V.C., Jr.; Himmelberg, G.R. Geochemical evidence of present day serpentinization. Science 1967, 156, 830–832. [Google Scholar] [CrossRef] [Scilit]
  29. Uçurum, A.; Larson, L.T.; Boztuğ, D. Geology, geochemistry, and petrology of the alkaline subvolcanic trachyte-hosted iron deposit in the Karakuz area, northwestern Hekimhan-Malatya, Turkey. Int. Geol. Rev. 1996, 38, 995–1005. [Google Scholar] [CrossRef] [Scilit]
  30. Isik, M.A. Complex metasomatic process between serpentinized ultrabasic rocks and alkaline intrusive bodies in Divriği. In Proceedings of the European Union of Geosciences Conference XI (OS6), Strasbourg, France, 8–12 April 2001. [Google Scholar]
  31. Stendal, H.; Ünlü, T. Rock geochemistry of an iron ore field in the Divriği region, Central Anatolia, Turkey: A new exploration model for iron ores in Turkey. J. Geochem. Explor. 1991, 40, 281–289. [Google Scholar]
  32. Öztürk, C.; Kılıç, Ö.C.; Ünlü, T. Cevher ve skarn minerallerinde yapılan bir konfokal Raman spektroskopisi çalışması: Dumluca demir yatağı (Divriği, Sivas, Türkiye). Geosound 2017, 37, 203–216. [Google Scholar]
  33. Ünlü, T.; Stendal, H. Divriği Bölgesi Demir Yataklarının Element Korelasyonu ve Jeokimyası. Orta Anadolu, Türkiye. Jeol. Mühendisleri Odası Derg. 1986, 28, 5–19. (In Turkish) [Google Scholar]
  34. Yıldızeli, R. Sivas-Yıldızeli ve Civarı Demir Yatakları ve Belirtileri Jeoloji Raporu; Rapor No: 6154; Maden Tetkik Ve Arama Genel Müdürlüğü (MTA): Ankara, Turkey, 1977.
  35. Smith, D. Antigorite Peridotite, Metaserpentinite, and other Inclusions within Diatremes on the Colorado Plateau, SW USA: Implications for the Mantle Wedge during Low-angle Subduction. J. Petrol. 2010, 51, 1355–1379. [Google Scholar] [CrossRef] [Scilit]
  36. Kılıç, A.D.; İnceöz, M. Mineralogical, geochemical and isotopic effect of silica in ultramaphic systems, eastern Anatolian Turkey. Geochem. Int. 2015, 53, 369–382. [Google Scholar] [CrossRef] [Scilit]
  37. Mével, C. Serpentinization of abyssal peridotites at mid-ocean ridges. Comptes Rendus Geosci. 2003, 335, 825–852. [Google Scholar] [CrossRef] [Scilit]
  38. Janecky, D.R.; Seyfried, W.E. Hydrothermal serpentinization of peridotite within the oceanic crust: Experimental investigations of mineralogy and major element chemistry. Geochim. Cosmochim. Acta 1986, 50, 1357–1378. [Google Scholar] [CrossRef] [Scilit]
  39. Akgül, M. Islamköy (Kulp-Diyarbakir) Yöresindeki Bazik Ve Ultrabazik Kayaçlar Ile Ilişkili Cevherleşmeler/The Mineralizations, Associated with Basic and Ultrabasic Rocks of Islamköy (Diyarbakir). Ph.D. Thesis, Fırat University, Elazığ, Turkey, 1993. [Google Scholar]
  40. Evans, B.W. The serpentinite multisystem revisited: Chrysotile is metastable. Int. Geol. Rev. 2004, 46, 479–506. [Google Scholar] [CrossRef] [Scilit]
  41. Moody, J.B. Serpentinization. A review. Lithos 1976, 9, 125–138. [Google Scholar] [CrossRef] [Scilit]
  42. Lasheen, E.S.R.; Saleh, G.M.; Khaleal, F.M.; Alwetaishi, M. Petrogenesis of Neoproterozoic Ultramafic Rocks, Wadi Ibib–Wadi Shani, South Eastern Desert, Egypt: Constraints from Whole Rock and Mineral Chemistry. Appl. Sci. 2021, 11, 10524. [Google Scholar] [CrossRef] [Scilit]
  43. Palme, H.; O’Neill, H. Cosmochemical estimates of Mantle Composition. In Treatise on Geochemistry; Holland, H.D., Turrekian, K.K., Eds.; Elsevier: Amsterdam, The Netherlands, 2004; Volume 2, pp. 1–38. [Google Scholar]
  44. Kodolanyi, J.; Pettke, T.; Spandler, C.; Kamber, B.S.; Gmeling, K. Geochemistry of Ocean Floor and Fore-arc Serpentinites: Constraints on the Ultramafic Input to Subduction Zones. J. Pertol. 2012, 53, 235–270. [Google Scholar] [CrossRef] [Scilit]
  45. Bach, W.; Garrido, C.J.; Paulick, H.; Harvey, J.; Rosner, M. Seawater-peridotite interactions: First insights from ODP Leg 209, MAR 15°N. Geochem. Geophys. Geosyst. 2004, 5, Q08J09. [Google Scholar] [CrossRef] [Scilit]
  46. Rucklidge, J.C.; Patterson, G.C. The role of Chlorine in serpentinization. Contr. Min. Petrol. 1977, 65, 39–44. [Google Scholar] [CrossRef] [Scilit]
  47. GamalElDien, H.M.; Hamdy, M.M.; AbuEl Ela, A.; Abu Alam, T.; Hassan, A.; Kil, Y.; Mizukami, T.; Soda, Y. Neoproterozoic serpentinites from the Eastern Desert of Egypt: Insights into Neoproterozoic mantle geodynamics and processes beneath the Arabian-Nubian Shield. Precambrian Res. 2016, 286, 213–233. [Google Scholar] [CrossRef] [Scilit]
  48. Deschamps, F.; Guillot, S.; Godard, M.; Chauvel, C.; Andreani, M.; Hattori, K. In situ characterization of serpentinites from forearc mantle wedges: Timing of serpentinization and behavior of fluid-mobile elements in subduction zones. Chem. Geol. 2010, 269, 262–277. [Google Scholar] [CrossRef] [Scilit]
  49. Sun, S.S.; McDonough, W.F. Chemical and Isotopic Systematics of Oceanic Basalts: Implications for Mantle Composition and Processes. Geol. Soc. Lond. Spec. Publ. 1989, 42, 313–345. [Google Scholar] [CrossRef] [Scilit]
  50. Rivero Crespo, M.A.; Pereira Gómez, D.; Villa García, M.V.; Gallardo Amores, J.M.; Sánchez Escribano, V. Characterization of Serpentines from Different Regions by Transmission Electron Microscopy, X-ray Diffraction, BET Specific Surface Area and Vibrational and Electronic Spectroscopy. Fibers 2019, 7, 47. [Google Scholar] [CrossRef] [Scilit]
  51. Mellini, M.; Fuchs, Y.; Viti, C.; Lemaire, C.; Linares, J. Insights into the antigorite structure from Mössbauer and FTIR spectroscopies. Eur. J. Mineral. 2002, 14, 97–104. [Google Scholar] [CrossRef] [Scilit]
  52. Auzende, A.L.; Devouard, B.S.; Danile, I.; Baronnet, A.; Lardeaux, J.M. Serpentines from Central Cuba: Petrology and HRSEM study. Eur. J. Mineral. 2002, 14, 905–914. [Google Scholar]
  53. Wicks, F.J.; O’Hanley, D.S. Serpentine Mineral: Structure and petrology. Reviews in Mineralogy. In Hydrous Phylosilicates; Baley, S.W., Ed.; Mineralogical Society of America: Chantilly, VA, USA, 1988; pp. 91–167. [Google Scholar]
  54. Cressey, B.A.; Whittaker, E.J.W. Five-fold symmetry in chrysotile asbestos revealed by transmission electron microscopy. Mineral. Magasine 1993, 5, 729–732. [Google Scholar] [CrossRef] [Scilit][Green Version]
  55. Punturo, R.; Bloise, A.; Critelli, T.; Catalano, M.; Fazio, E.; Apollaro, C. Environmental implications related to natural asbestos occurrences in the ophiolites of the Gimigliano-Mount Reventino Unit (Calabria, Southern Italy). Int. J. Environ. Res. 2015, 9, 405–418. [Google Scholar]
  56. Schwartz, S.; Guillot, S.; Reynard, B.; Lafay, R.; Debret, B.; Nicollet, C.; Lanari, P.; Auzende, A.L. Pressure–temperature estimates of the lizardite/antigorite transition in high pressure serpentinites. Lithos 2013, 178, 197–210. [Google Scholar] [CrossRef] [Scilit]
  57. Raia, N.H.; Whitney, D.L.; Teyssier, C.; Lesimple, S. Serpentinites ofdifferent tectonic origin in an exhumedsubduction complex (New Caledonia, SW Pacific). Geochem. Geophys. Geosyst. 2022, 23, e2022GC0103. [Google Scholar]
  58. Niu, Y. Bulk-rock major and trace element compositions of abyssal peridotites: Implications for mantle melting, melt extraction andpost-melting processes beneath mid-ocean ridges. J. Petrol. 2004, 45, 2423–2458. [Google Scholar] [CrossRef] [Scilit]
  59. Farmer, V.C.; Russell, J.D. The infra-red spectra of layer silicates. Spectrochim. Acta 1964, 20, 1149–1173. [Google Scholar] [CrossRef] [Scilit]
  60. Trittschack, R.; Grobéty, B.; Koch-Müller, M. In situ high-temperature Raman and FTIR spectroscopy of the phase transformation of lizardite. Am. Mineral. 2012, 97, 1965–1976. [Google Scholar] [CrossRef] [Scilit]
  61. Prencipe, M.; Noel, Y.; Bruno, M.; Dovesi, R. The vibrational spectrum of lizardite-1T [Mg3Si2O5(OH)4] at the Γ point: A contribution from an ab initio B3LYP calculation. Am. Mineral. 2009, 94, 986–994. [Google Scholar] [CrossRef] [Scilit]
  62. Capitani, G.C.; Stixrude, L.; Mellini, M. First-principles energetics and structural relaxation of antigorite. Am. Mineral. 2009, 94, 1271–1278. [Google Scholar] [CrossRef] [Scilit]
Figure 1. (a) Location map of the study area obtained from Google Earth, (b) Geological map of the study area [32].
Applsci 16 09940 g001
Figure 2. Field photographs of the serpentinites. (A) Alteration zone, (B) mesh-textured serpentinite and chrysotile vein, (C) massive serpentinite and pyroaurite occurrences, and (D) greenish serpentinites containing relict olivine and pyroxene.
Applsci 16 09940 g002
Figure 3. Hand specimens of serpentinites containing chrysotile bands and photomicrographs of mesh-textured serpentinites containing relict olivine. Chrysotile (Crz), olivine (Ol), pyroxene (Px).
Applsci 16 09940 g003
Figure 4. Field photographs from different locations showing serpentinite, host rocks, and iron ores. (A–C) Dark-colored serpentinite blocks within the serpentinite mass; (D,F) foliated and massive serpentinites and epidote–zoisite zones; (E) massive serpentinite mass containing a serpentine vein; and (E,G,H) ore-bearing zones and host rocks in the iron ore study area; (I) Multiple fracture surfaces developed in serpentinites.
Applsci 16 09940 g004
Figure 5. Serpentine binary variations: (A) MgO vs. Al2O3, (B) MgO vs. FeO, (C) MgO vs. MnO. Fields of antigorite and chrysotile are from [44].
Applsci 16 09940 g005
Figure 6. Primitive mantle-normalized spider diagrams of the serpentinites [normalised values after [49]].
Applsci 16 09940 g006
Figure 7. Chemical classification of serpentinites [51].
Applsci 16 09940 g007
Figure 8. FTIR spectra of (a) lizardite serpentine and (b) antigorite serpentine.
Applsci 16 09940 g008
Figure 9. FT-IR spectra of chrysotile serpentinite.
Applsci 16 09940 g009
Figure 10. (A) X-ray diffraction (XRD) spectra. Scanning electron microscopy micrographs of samples ESp-1 (B), ESp-3 (C) and ESp-2 (D).
Applsci 16 09940 g010
Table 1. Major oxide, trace element, and REE data for serpentinite samples.
SamplesESp-1ESp-2ESP-3
SiO239.1238.5342.09
Al2O31.372.1016.74
Fe2O38.137.8413.87
MgO36.0036.2438.85
CaO0.950.190.36
Na2O<0.01<0.01<0.01
K2O<0.01<0.010.11
TiO20.010.030.24
P2O5<0.010.010.15
MnO0.660.570.70
NiO0.330.280.36
Cr2O30.060.070.07
LOI13.113.75.5
Sum99.3999.3799.83
Ba0.3440.3520.007
Ni196319551923
Be<1<1<1
Co79.892.072.3
Cs<0.1<0.14.6
Ga0.61.322.7
Hf<0.1<0.13.3
Nb<0.1<0.16.9
Rb0.20.17.2
Sn<1<12
Sr7.46.97.7
Ta<0.1<0.10.2
Th0.20.20.2
U<0.11.51.9
V535452
W2.3<0.51.3
Zr1.30.91.2
Sc9135
Y0.71.01.6
La0.20.11.5
Ce0.50.20.8
Pr0.060.020.02
Nd<0.3<0.30.8
Sm<0.05<0.050.75
Eu<0.02<0.020.26
Gd0.070.070.14
Tb0.010.020.03
Dy0.100.160.23
Ho0.020.040.6
Er0.090.130.32
Tm0.010.020.17
Yb0.110.160.22
Lu0.020.030.08
∑REE11.0715.1312.52
LREEs0.831.574.27
HREEs0.360.561.65
LREEs/HREEs2.302.802.58
(La/Sm)n2.522.101.26
(Gd/Yb)n0.510.810.51
Eu/Eu*0.731.972.45
Table 2. Typical FTIR bands of studied serpentine samples.
SampleWave
Number (cm−1)
AssignmentLiterature Comparison
ESp-13682.89O–H stretching[21,26]
ESp-1943.04Si–O stretching[26]
ESp-1609.26OH libration/lattice vibration[21]
ESp-1432.14SiO4 bending/lattice vibration[21]
ESp-2994.07Si–O stretching[26]
ESp-2638.73OH libration[21]
ESp-3948.23Si–O stretching[21,26]
ESp-31030.10Si–O stretching[21,26]
Disclaimer/Publisher’s Note: The statements, opinions and data contained in all publications are solely those of the individual author(s) and contributor(s) and not of MDPI and/or the editor(s). MDPI and/or the editor(s) disclaim responsibility for any injury to people or property resulting from any ideas, methods, instructions or products referred to in the content.