Article

Effects of Chemical Digestion on Polyethylene and Polypropylene Microplastics: Implications for Reliable Food Analysis


by
Katarzyna Jażdżewska
1,
Kornelia Kadac-Czapska
1,
Beata Bochentyn
2 and
Małgorzata Grembecka
1,*
1
Department of Bromatology, Faculty of Pharmacy, Medical University of Gdańsk, 80-416 Gdańsk, Poland
2
Advanced Materials Center, Faculty of Applied Physics and Mathematics, Gdańsk University of Technology, 80-233 Gdańsk, Poland
*
Author to whom correspondence should be addressed.
Appl. Sci. 2026, 16(19), 9936; https://doi.org/10.3390/app16199936 (registering DOI)
Submission received: 28 August 2026 / Revised: 2 October 2026 / Accepted: 4 October 2026 / Published: 8 October 2026

Abstract

The presence of microplastics (MPs) in food products has become a concern, underscoring the need for reliable methods of isolation and analysis. There is no specific regulatory framework for monitoring MPs in food. A challenge is the lack of standardized and validated methods for the isolation and determination of MPs in food matrices. This study aimed to evaluate the effects of chemical digestion conditions used to isolate MPs from food matrices on the stability of polyethylene (PE) and polypropylene (PP) particles. The effects were evaluated using nitric acid, hydrochloric acid, hydrogen peroxide, potassium hydroxide, ethanol, and Milli-Q water at selected temperatures and reagent concentrations. Changes in particle surface morphology were assessed by scanning electron microscopy (SEM), while spectroscopic alterations were evaluated by Fourier transform infrared microspectroscopy (µ-FTIR). The SEM and µ-FTIR findings suggested that PE MPs were less affected than PP MPs under the tested treatment conditions. Less intensive treatment combinations were generally associated with fewer morphological and spectroscopic alterations for both polymers. The results showed that heating in Milli-Q water and treatment with acidic, oxidative, and alkaline reagents were associated with changes in selected recovery and spectroscopic parameters of PE and PP MPs under the tested experimental conditions.

1. Introduction

According to the European Food Safety Authority (EFSA), microplastics (MPs) are plastic particles ranging in size from 1 to 5000 μm [1]. These particles are increasingly recognized as environmental contaminants and have been detected in a wide range of food products, including water, milk, salt, sugar, seafood, honey, beer, vegetables, and rice [2,3,4,5,6,7,8,9,10,11,12]. The most frequently detected polymer types include polyethylene (PE), polypropylene (PP), polystyrene (PS), polyamide (PA), and poly(ethylene terephthalate) (PET) [13]. Experimental studies have suggested potential inflammatory, neurotoxic, and reproductive effects of MPs; however, their implications for human health remain uncertain [14]. PE and PP are widely used polymers in food packaging and food-contact applications. They are commonly used to package confectionery, dairy products, meat products, and other processed foods. MPs may be released from food-contact materials during use, particularly under the influence of temperature changes and mechanical stress [15,16].
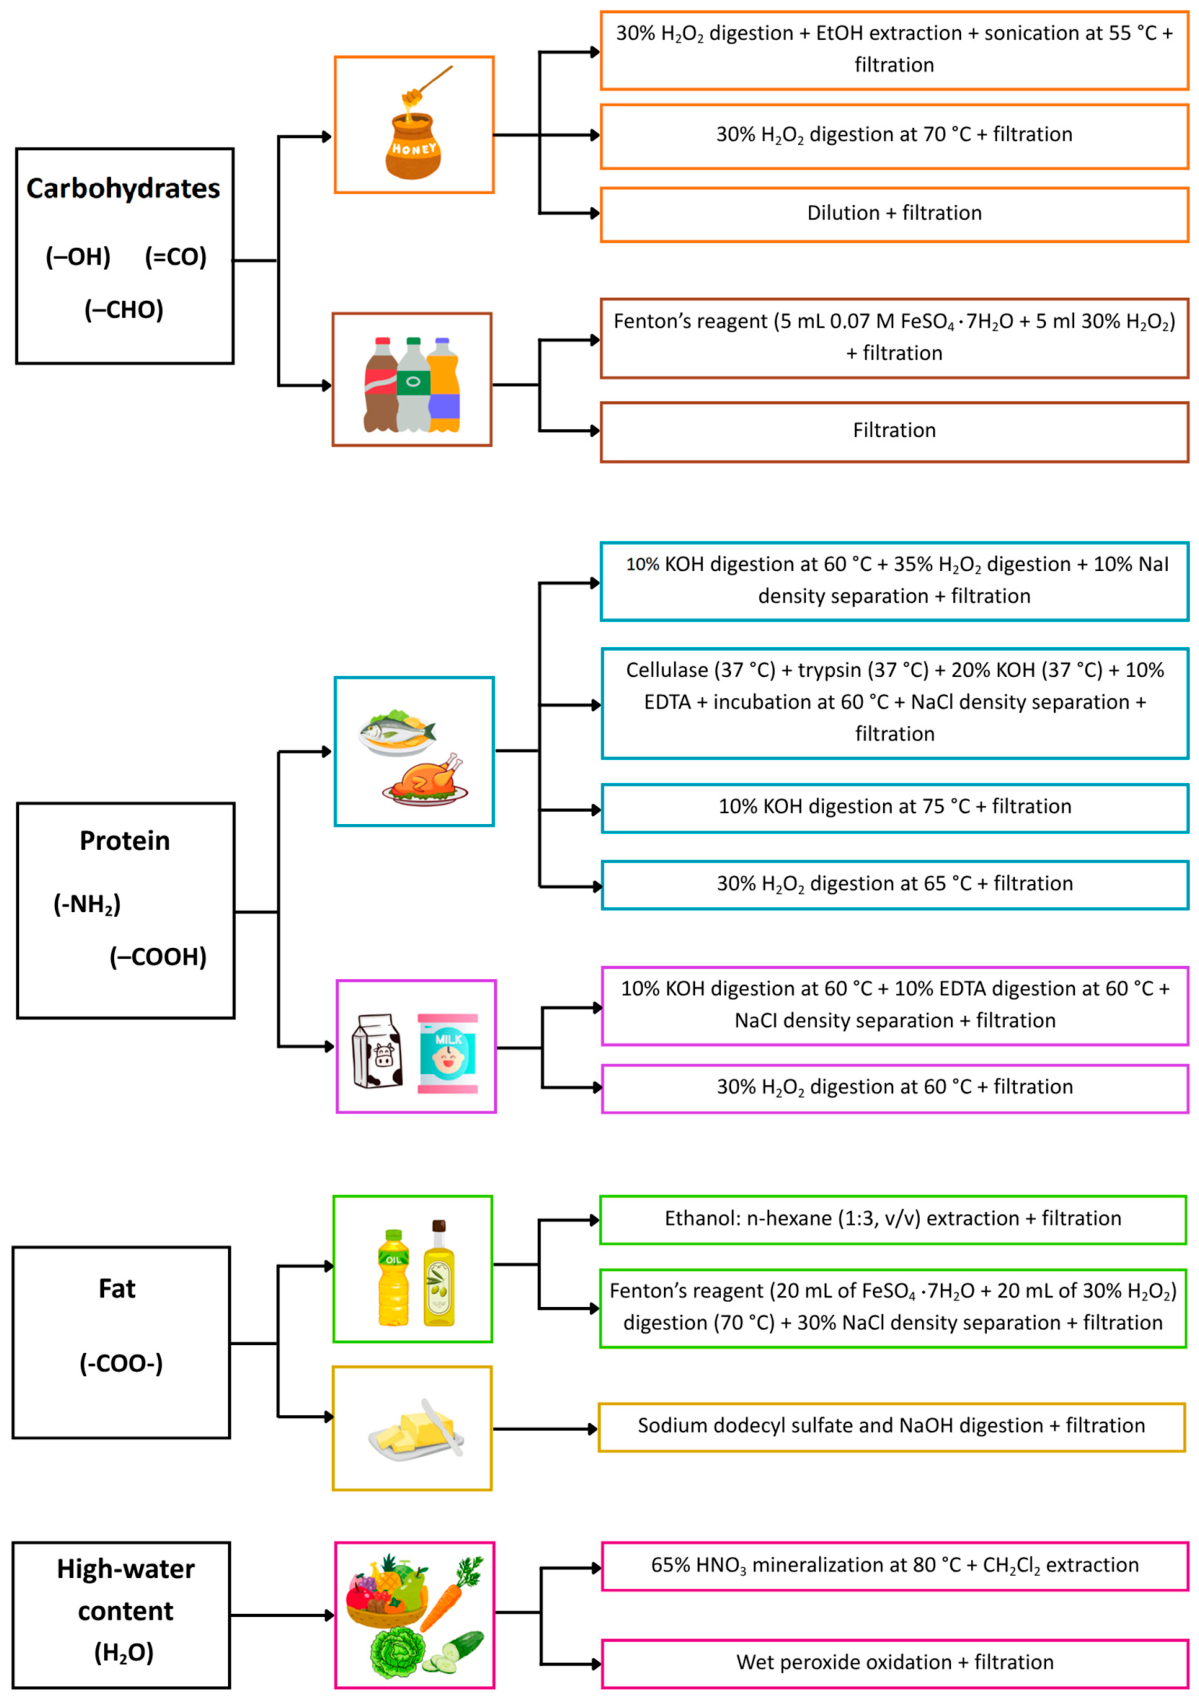
Reliable assessment of human exposure to MPs requires validated methods for their isolation and determination in food [17]. However, many methods currently used to analyze MPs have not been fully validated. Although numerous protocols have been proposed for the isolation of MPs, information on how extraction conditions affect polymer integrity in food analysis remains limited. Inappropriate extraction conditions may therefore lead to inaccurate determination of MPs in food matrices. Moreover, different sample preparation approaches are often used for the same type of food matrix. Figure 1 presents a variety of methods for the isolation of MPs from different food matrices. Such methodological variability makes it difficult to compare results across studies. Currently, there are no specific European Union regulations requiring routine monitoring of MPs in food [18].
The isolation of MPs from food matrices commonly involves digestion, filtration, and density separation. Matrix digestion is a critical step, and its effectiveness depends on the reagent type and concentration, incubation time, and temperature. Previous studies have used enzymatic, oxidative, acidic, and alkaline digestion methods [6,19,20,21,22]. Incubation temperatures reported in previous studies typically range from 30 °C to 80 °C [3,7,23,24]. Reported incubation times have ranged from 1 min to 48 h, depending on matrix complexity [21,24]. Oxidative digestion, including treatment with Fenton’s reagent, has been used for carbohydrate-rich matrices [25]. In contrast, for some liquid matrices, the digestion step is omitted [26,27]. Protein-rich matrices are commonly digested using alkaline reagents or proteolytic enzymes [20,21,28,29]. Sample preparation methods for high-fat foods vary considerably and include alkaline digestion, oxidative digestion, and extraction with organic solvents [30,31,32]. Acidic or alkaline digestion has also been used for fruits and vegetables. In the case of dried samples, some researchers have omitted the digestion step [12,23,33].
Filtration is another commonly used step in the isolation of MPs. This process allows MPs to be separated from the liquid phase and retained on a filter membrane for subsequent analysis. Filter pore size is an important analytical parameter because it influences the lower size limit of MPs retained during filtration [34]. The effectiveness of filtration also depends on the identification technique used [35]. Filtration is compatible with spectroscopic techniques, including Fourier transform infrared microspectroscopy (µ-FTIR) and micro-Raman spectroscopy (µ-Raman). The filter material is also important, as it may interfere with the analysis. It is recommended that the filter pore size be smaller than the smallest particles being analyzed; however, excessively small pores can prolong the filtration process [36]. Cascade filtration has also been employed in the context of complex matrices [37]. Ultrasonic treatment has also been used during sample preparation to facilitate the removal of material adhering to the surface of MPs [38]. Density separation of MPs can be performed using solutions of sodium chloride, sodium iodide, or zinc chloride. High-density solutions, such as sodium iodide and zinc chloride, enable the separation of MPs composed of denser polymers, including PET and poly(vinyl chloride) (PVC) [39]. However, standardized protocols that minimize the loss or alteration of MPs during sample preparation are still lacking.
Many studies have focused on the effects of environmental conditions on the degradation of MPs [40,41,42]. The effects of conditions used to isolate MPs from environmental matrices have also been investigated [43]. However, few studies have examined how conditions used to isolate MPs from food matrices affect polymer stability [44]. This study aimed to compare the effects of selected combinations of temperature and reagent concentration used for the isolation of MPs from food matrices on the stability of PE and PP MPs and to identify the tested conditions associated with the least polymer alteration.
Figure 1. Examples of approaches used to isolate MPs from various food matrices. Prepared by the authors based on data from [6,9,19,20,22,23,25,26,28,29,30,32,33,45,46,47] using graphic elements available in Canva (accessed on 1 August 2026).
Applsci 16 09936 g001

2. Materials and Methods

2.1. Chemicals, Materials, and Instrumentation

The following MPs were used in this study: ultra-high-molecular-weight PE particles (34–50 μm; CAS No. 9002-88-4) were purchased from Sigma-Aldrich (St. Louis, MO, USA). PP particles (50–80 μm; 3D-POWDER SLS PP50-80; CAS No. 9003-07-0) were purchased from 3DRESYNS (Barcelona, Spain). Before the experiments, the chemical identity of these materials was confirmed using a LUMOS II FT-IR microscope (Bruker Optics, Leipzig, Germany). The same technique was used to assess changes in the chemical characteristics of the MPs following treatment [48]. Morphological changes in MPs were examined using scanning electron microscopy (SEM; FEI Quanta FEG 250, FEI, Eindhoven, The Netherlands). Particle shape was also assessed using an Eclipse E400 optical microscope (Nikon Tokyo, Japan) equipped with a 33U Series Color industrial camera (The Imaging Source, Bremen, Germany).
All chemical reagents were of analytical grade. Hydrochloric acid (HCl, 37%; CAS No. 7647-01-0) and potassium hydroxide (KOH; CAS No. 1310-58-3) were purchased from Chempur (Piekary Śląskie, Poland). Nitric acid (HNO3, 65%; CAS No. 7697-37-2) and absolute ethanol (EtOH, 99.8%; CAS No. 64-17-5) were obtained from Avantor Performance Materials Poland S.A. (Gliwice, Poland). Hydrogen peroxide (H2O2, 30%; CAS No. 7722-84-1) was purchased from Pol-Aura (Morąg, Poland). Ultrapure water (18.2 MΩ·cm) was obtained using a Milli-Q Simplicity water purification system (Merck, Molsheim, France).
Cellulose qualitative filter paper with a typical particle retention of 11 μm (Whatman Grade 1, Cat. No. 1001-055; Cytiva, Amersham Place, UK) was used during the experiments. The filtration system consisted of a vacuum filtration apparatus (Chemland, Stargard, Poland) connected to a Rocker 410C vacuum pump (Rocker Scientific Co., Ltd., New Taipei City, Taiwan). Samples were prepared under a K1300 laminar flow hood (Alpina, Konin, Poland). A CENTER 378 four-channel K/J/E/T-type data-logging thermometer (Center Technology Corp., New Taipei City, Taiwan) was used to monitor sample temperature.

2.2. Quality Control

All experiments were performed under strictly controlled conditions to minimize potential contamination of the samples with MPs. Researchers wore cotton lab coats and disposable gloves. Only glassware and metal laboratory equipment were used during the experiments. Before use, all laboratory equipment was washed with detergent and rinsed twice with Milli-Q water. Experiments were conducted in a laminar flow hood. Laboratory equipment kept outside the laminar flow hood, including cylinders, flasks, and bottles, was covered with aluminum foil to minimize airborne contamination. All test solutions used during analysis were filtered through cellulose filters with a typical particle retention of 11 μm. Filters containing the recovered MPs were placed in Petri dishes and dried to constant mass in a glass desiccator. The drying time for PE MPs was 7 ± 2 days, while for PP MPs, it was 5 ± 3 days. Blank samples were included in each analysis to monitor potential contamination. Blank filters were dried to constant mass and weighed before use. After filtration, the blank filters were dried again to constant mass and reweighed. Given the variety of approaches used in the literature for the gravimetric assessment of blank samples [49,50,51], a predefined acceptance criterion of no more than a 1% increase relative to the initial blank-filter mass was applied in this study. If the mass increase exceeded 1%, the blank failed the predefined acceptance criterion, and the corresponding batch of experimental samples was excluded from further analysis. For the purposes of this study, changes in blank filter mass were used as an indicator of potential contamination. The sample preparation procedure was further validated using recovery tests. Gravimetric recovery was determined in three replicates using 10.0 ± 0.1 mg of PE and PP MPs under each tested combination of temperature and treatment solution. The detailed results are presented in Section 3.1.

2.3. Procedure for Assessing the Effects of Treatment Conditions on PE and PP MPs

For each treatment experiment, 10.0 ± 0.1 mg of PE or PP MPs was weighed on a watch glass using an analytical balance. The MPs were quantitatively transferred to a conical flask, and 100 mL of the appropriate filtered test solution (Milli-Q water, HNO3, HCl, KOH, H2O2, or EtOH) at the specified concentration was added. Before addition to the samples, the test solutions and Milli-Q water were pre-heated to the desired temperature, i.e., 40, 60, or 100 °C (Table 1 and Table 2). The flasks were then covered with aluminum foil and placed in a water bath at the target temperature for 45 min. Each sample was prepared in triplicate. A blank sample was also prepared for each treatment condition. To monitor the temperature during the heating process, an additional sample containing the solution was prepared, with a thermocouple immersed in it. After incubation, the samples were vacuum-filtered through the cellulose filters described in Section 2.1. During filtration, the flask was rinsed twice with Milli-Q water to transfer any remaining MPs to the filter. The filters containing the recovered MPs were placed in Petri dishes and dried to constant mass in a desiccator. The experimental conditions used to assess potential changes in the tested polymers are presented in Table 1 and Table 2. The selected reagents represented acidic, alkaline, and oxidative conditions commonly used during sample preparation for the analysis of MPs in food matrices; EtOH was included as an organic solvent. For PE MPs, additional tests were performed using 5% reagent solutions at 60 °C to allow comparison with the conditions reported by Kadac-Czapska et al. [44].
Chemical changes in the MPs after the experimental treatments were assessed using µ-FTIR over the spectral range of 4000 cm−1 to 600 cm−1. The software used was OPUS 9.1.4 (Bruker, Billerica, MA, USA). The attenuated total reflection (ATR) technique with a germanium crystal was used for spectral acquisition. Each spectrum (10 scans) was collected at a resolution of 4 cm−1. A liquid nitrogen-cooled mercury cadmium telluride detector was used. For all investigated conditions and polymers, spectra were recorded for three randomly selected particles.
To assess potential chemical changes that may be associated with polymer degradation, the carbonyl index (CI), hydroxyl index (HI), and carbon–oxygen index (COI) were calculated (Table 3). These indices were derived from absorbance ratios of selected µ-FTIR spectral bands using OPUS 9.1.4 software, following the approach described by Campanale et al. [52]. A spectroscopic crystallinity index for PE and PP MPs was also calculated from the µ-FTIR spectra. Although µ-FTIR does not directly measure the degree of crystallinity, relative changes in crystalline and amorphous contributions can be estimated from characteristic FTIR bands, as described by Kapelewska et al. [53].

2.4. Statistical Analysis

Statistical analyses were performed using STATISTICA 13 (TIBCO Software Inc., Palo Alto, CA, USA). Recovery, degradation-related indices, and crystallinity index for PP MPs were compared between two treatment conditions: 40 °C with 5% reagent solutions and 60 °C with 10% reagent solutions. For PE MPs, these variables were analyzed across three treatment conditions: 40 °C/5%, 60 °C/5%, and 60 °C/10%. In addition, for each polymer separately, recovery, degradation-related indices, and crystallinity index were compared among treatments with Milli-Q water at 40, 60, and 100 °C.
All statistical analyses were performed using individual measurements from three independent replicates per treatment condition (n = 3), while the results are presented as mean values. Normality of the model residuals was assessed using the Shapiro–Wilk test at a significance level of α = 0.05. Homogeneity of variance was assessed using Levene’s test. The effects of treatment condition and chemical reagent, as well as their interaction, on the analyzed variables (recovery, CI, HI, COI, and crystallinity index) were assessed using two-way MANOVA. The effect of temperature (40, 60, and 100 °C) on the analyzed variables was assessed using one-way MANOVA. Tukey’s HSD and Bonferroni-adjusted post-hoc tests were used for pairwise comparisons following the respective multivariate analyses.

3. Results

3.1. Validation

The performance of the procedure was assessed by determining the gravimetric recovery of MPs. The choice of filter is an important factor in the isolation and recovery of MPs. A filter with a typical particle retention of 11 µm was selected based on the lower particle size limit of the µ-FTIR method (10 µm). Furthermore, variations in filter moisture content may affect gravimetric recovery. Therefore, the filters were stored in Petri dishes and dried to constant mass before weighing. Recovery was calculated using the following equation:
R   [ % ] = ( m 2 − m 1 ) − ( m 4 − m 3 ) m MPs ∗ 100
where
m1—mass of the dried filter before filtration [g]
m2—mass of the dried filter with recovered MPs after filtration [g]
m3—mass of the dried blank filter before filtration [g]
m4—mass of the dried blank filter after filtration [g]
mMPs—mass of MPs added before filtration [g]
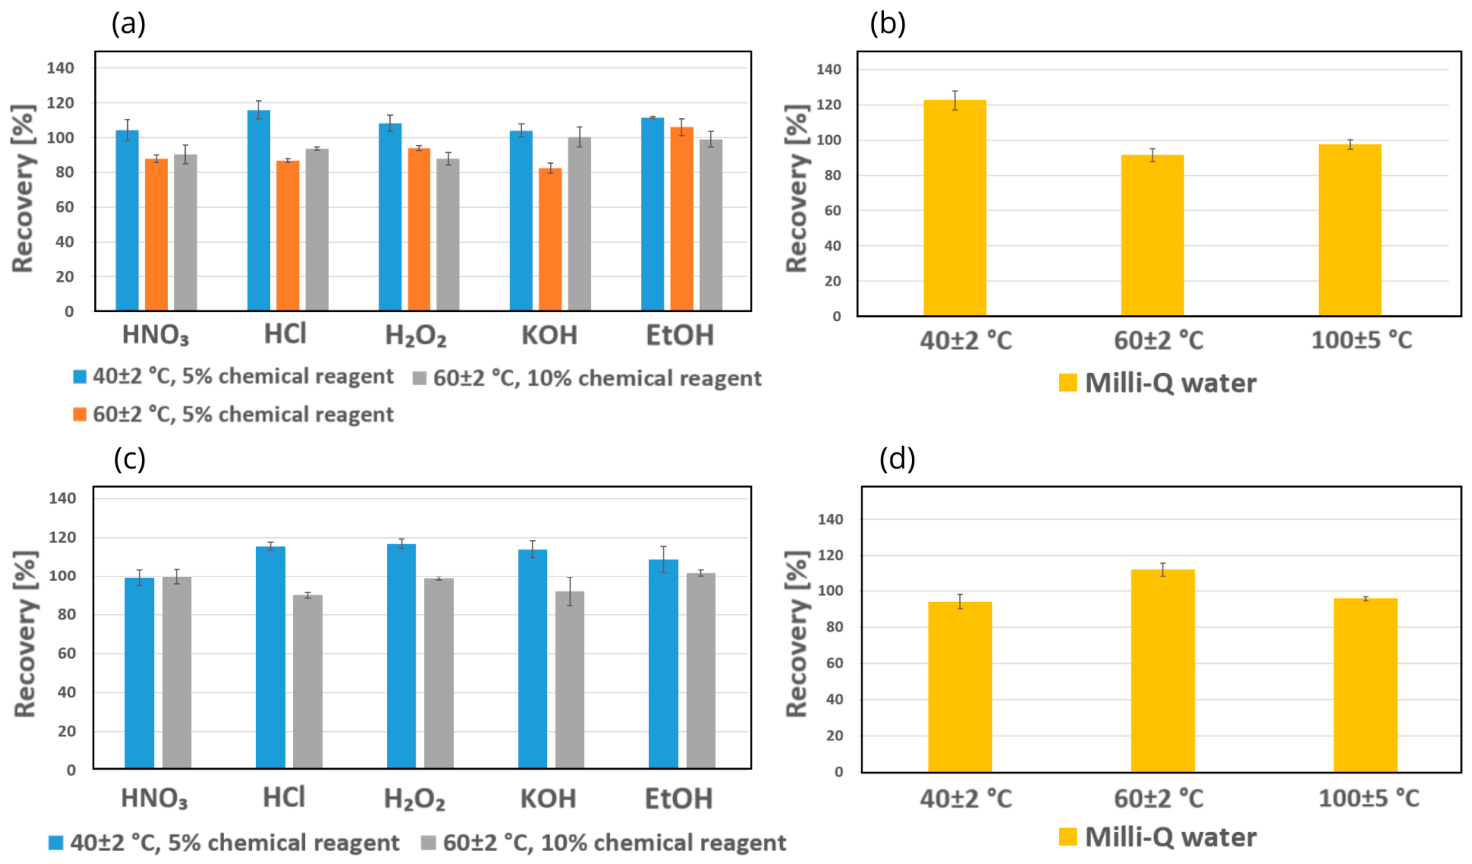
To assess whether the treatment solutions affected filter integrity, the filters were exposed to 100 mL of each tested reagent at a concentration of 10% and 60 °C, or to Milli-Q water at 100 °C. SEM analysis revealed slight visual changes in the morphology of the filter after treatment with 10% HNO3 (Figure S1); however, these changes were not accompanied by reduced recovery of PE or PP MPs (Figure 2). No visible changes in filter morphology were observed under the other treatment conditions. These results indicate that the filters were suitable for the experiments, with no apparent evidence that filter alteration adversely affected the recovery of PE and PP MPs under the tested conditions.
For PE MPs, the highest recovery was obtained after treatment with Milli-Q water (40 °C), reaching 122.3 ± 5.4%. Recovery after treatment with the tested chemical reagents at 40 °C ranged from 104.0% to 115.9% (Figure 2, Table S1). Recovery values above 100% may be associated with residual reagent on the filter or small differences in filter moisture content during weighing. Analytical uncertainty may also be a contributing factor. There is also a risk that the moisture content of the cellulose filter may be affected by room humidity. Moisture uptake can occur after the filter is removed from the desiccator. It is important to note that chemical reagents may remain on both filters and MPs despite washing, which can potentially lead to an overestimation of recovery. These potential sources of positive bias should be considered when interpreting the recovery results, particularly for the PE MPs recovered from Milli-Q water. The lowest recovery, 82.3 ± 2.9%, was obtained after treatment with 5% KOH at 60 °C (Table S1). PE and PP are hydrophobic materials and good electrical insulators. These polymers may adhere to glass surfaces, potentially due to electrostatic interactions, which may hinder the transfer of MPs from the conical flask to the filtration assembly. This can lead to particle losses during the filtration or washing stages and may constitute a source of systematic error. Another potential source of particle loss is the fragmentation of MPs by chemical reagents into particles smaller than the filter retention limit. The PE and PP MPs used in this study covered a defined particle size range. It is conceivable that particles at the lower end of this size range may be more prone to fragmentation than larger particles. For PP MPs, recovery at 40 °C ranged from 94.1% to 116.9% across the tested solutions. At 60 °C, recovery ranged from 90.0% to 112.3%. The lowest recovery was obtained for 10% HCl at 60 °C (Figure 2, Table S1). These recovery values fall within the range of 100% ± 40% specified in Commission Delegated Decision (EU) 2024/1441 for the measurement of MPs in water intended for human consumption [54].

3.2. Analysis of Optical Microscopy and Scanning Electron Microscopy Results

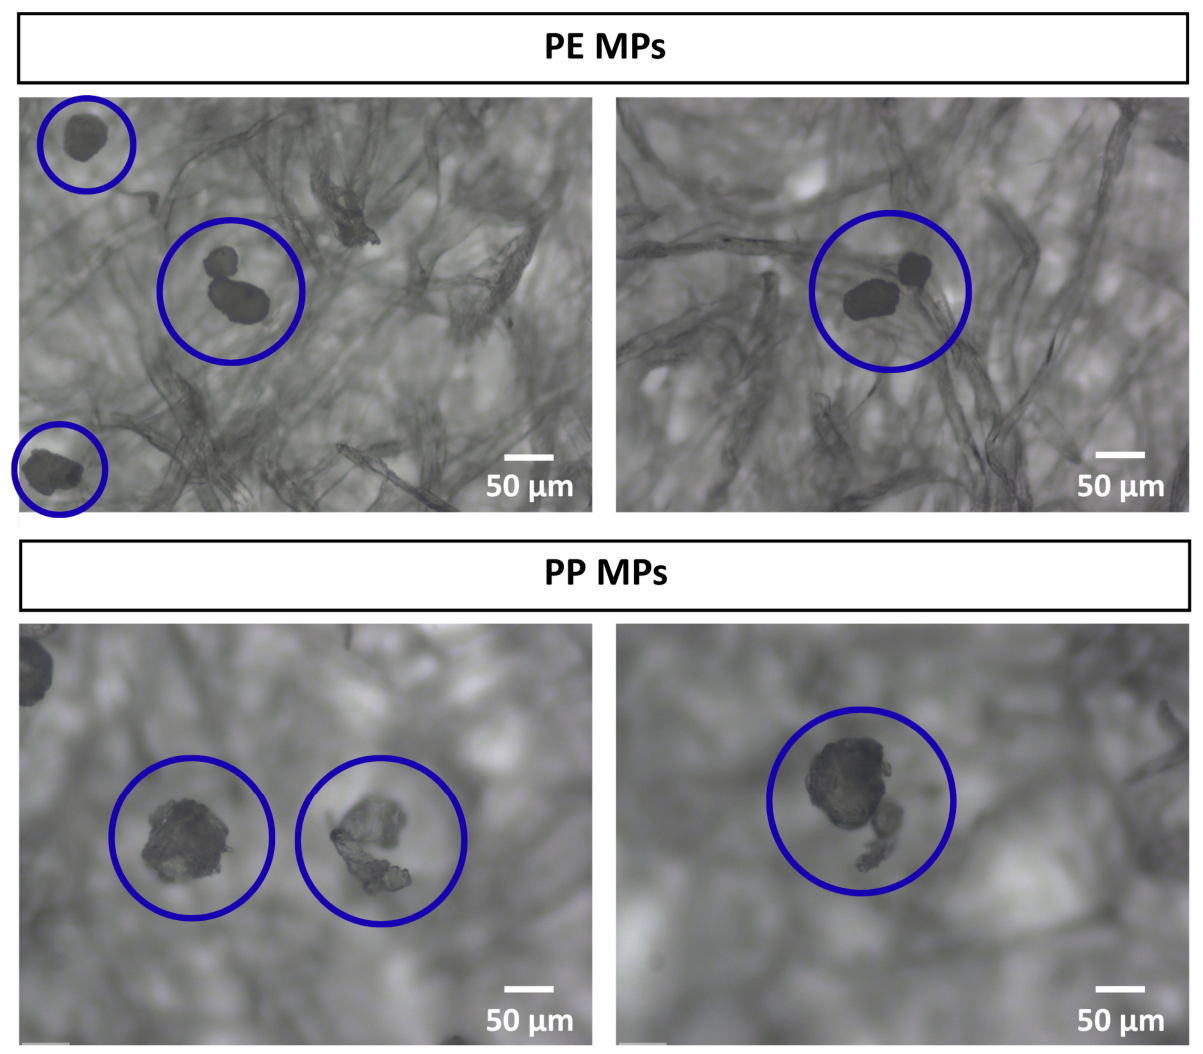
Before the experiments, the morphology of PE and PP MPs was assessed using optical microscopy. Most of the examined particles had an irregular shape (Figure 3).
Following the experimental treatments, the MPs were analyzed by SEM. For this purpose, the MPs on the filters were coated with a 10 nm-thick gold layer and then attached to a holder using carbon tape. SEM imaging was performed in high-vacuum mode using a secondary electron detector. Images were acquired at an accelerating voltage of 10 kV. SEM images of untreated PE and PP MPs were used as references for comparison with the treated samples. A total of three polymer particles were randomly selected for examination under each set of experimental conditions. A visual evaluation of the SEM images was conducted, consistent with the approach employed in other published studies [44,55]. Particular attention was paid to visible morphological features, such as cracks, fragmentation, and potential changes in polymer continuity.
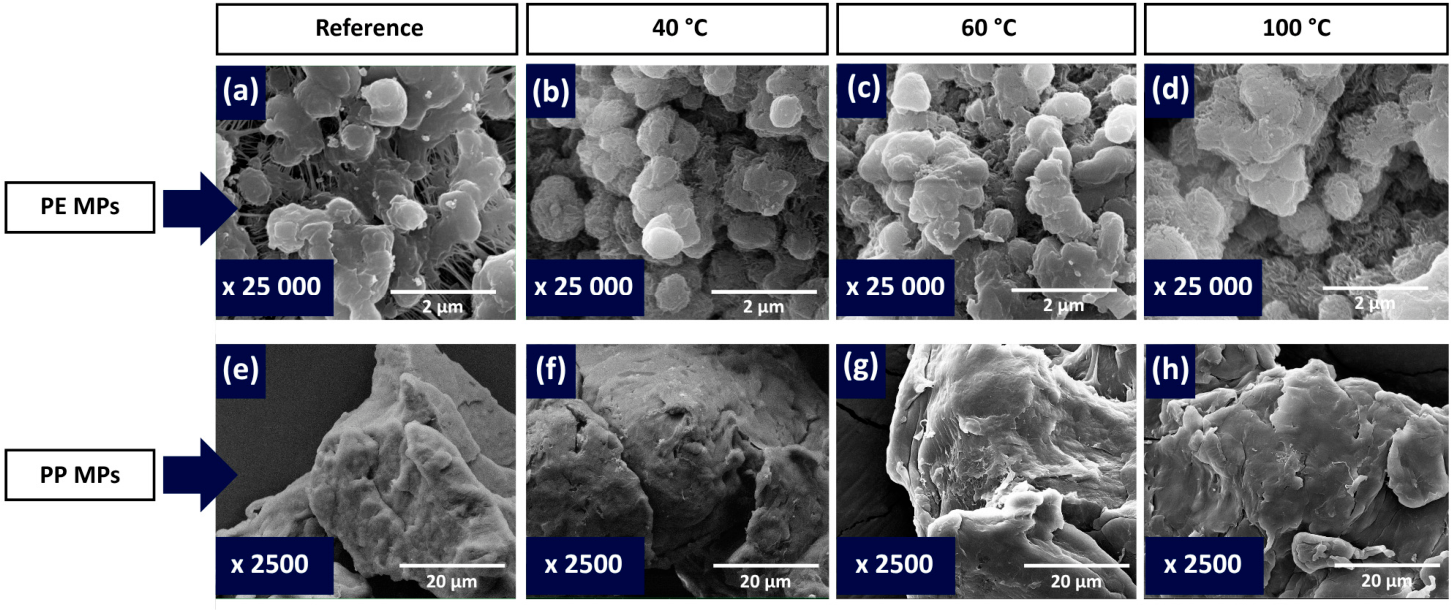
PE MPs heated in Milli-Q water at 40, 60, and 100 °C showed limited visible morphological changes compared with the untreated reference sample (Figure 4b–d). The most noticeable changes were observed in the sample heated at 100 °C (Figure 4d). Small surface cracks were observed, but the overall particle shape appeared unchanged and no fragmentation was visually evident. For PP MPs, no clear visual changes were observed after heating in Milli-Q water at 40, 60, or 100 °C (Figure 4f–h) compared with the untreated reference sample (Figure 4e). These observations suggest limited visible morphological alteration of PP MPs under the tested temperature conditions.
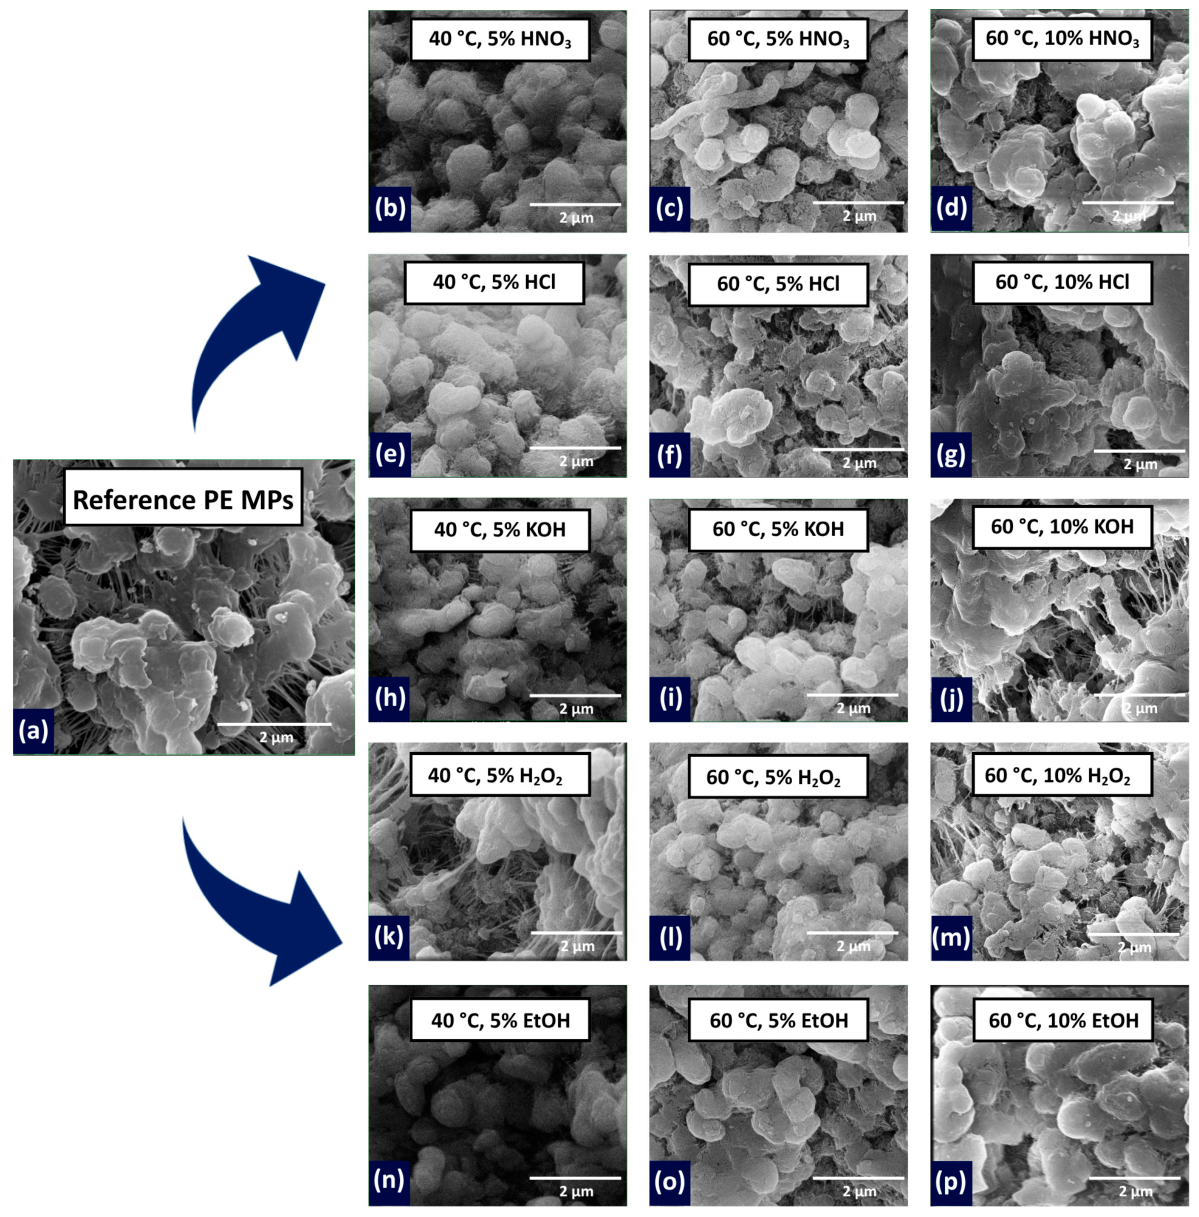
Among the combined chemical and temperature treatments, more pronounced visible morphological changes in PE MPs were observed after treatment with 10% KOH and 10% H2O2 at 60 °C (Figure 5j,m). These conditions were associated with visible surface alterations, with no visually evident particle fragmentation. At the same temperature, PE MPs treated with 5% reagents showed no clear visual changes compared with the reference sample (Figure 5a). Similar results were observed after treatment with acidic, oxidative, and alkaline reagents, as well as EtOH, at 40 °C (Figure 5b,e,h,k,n).
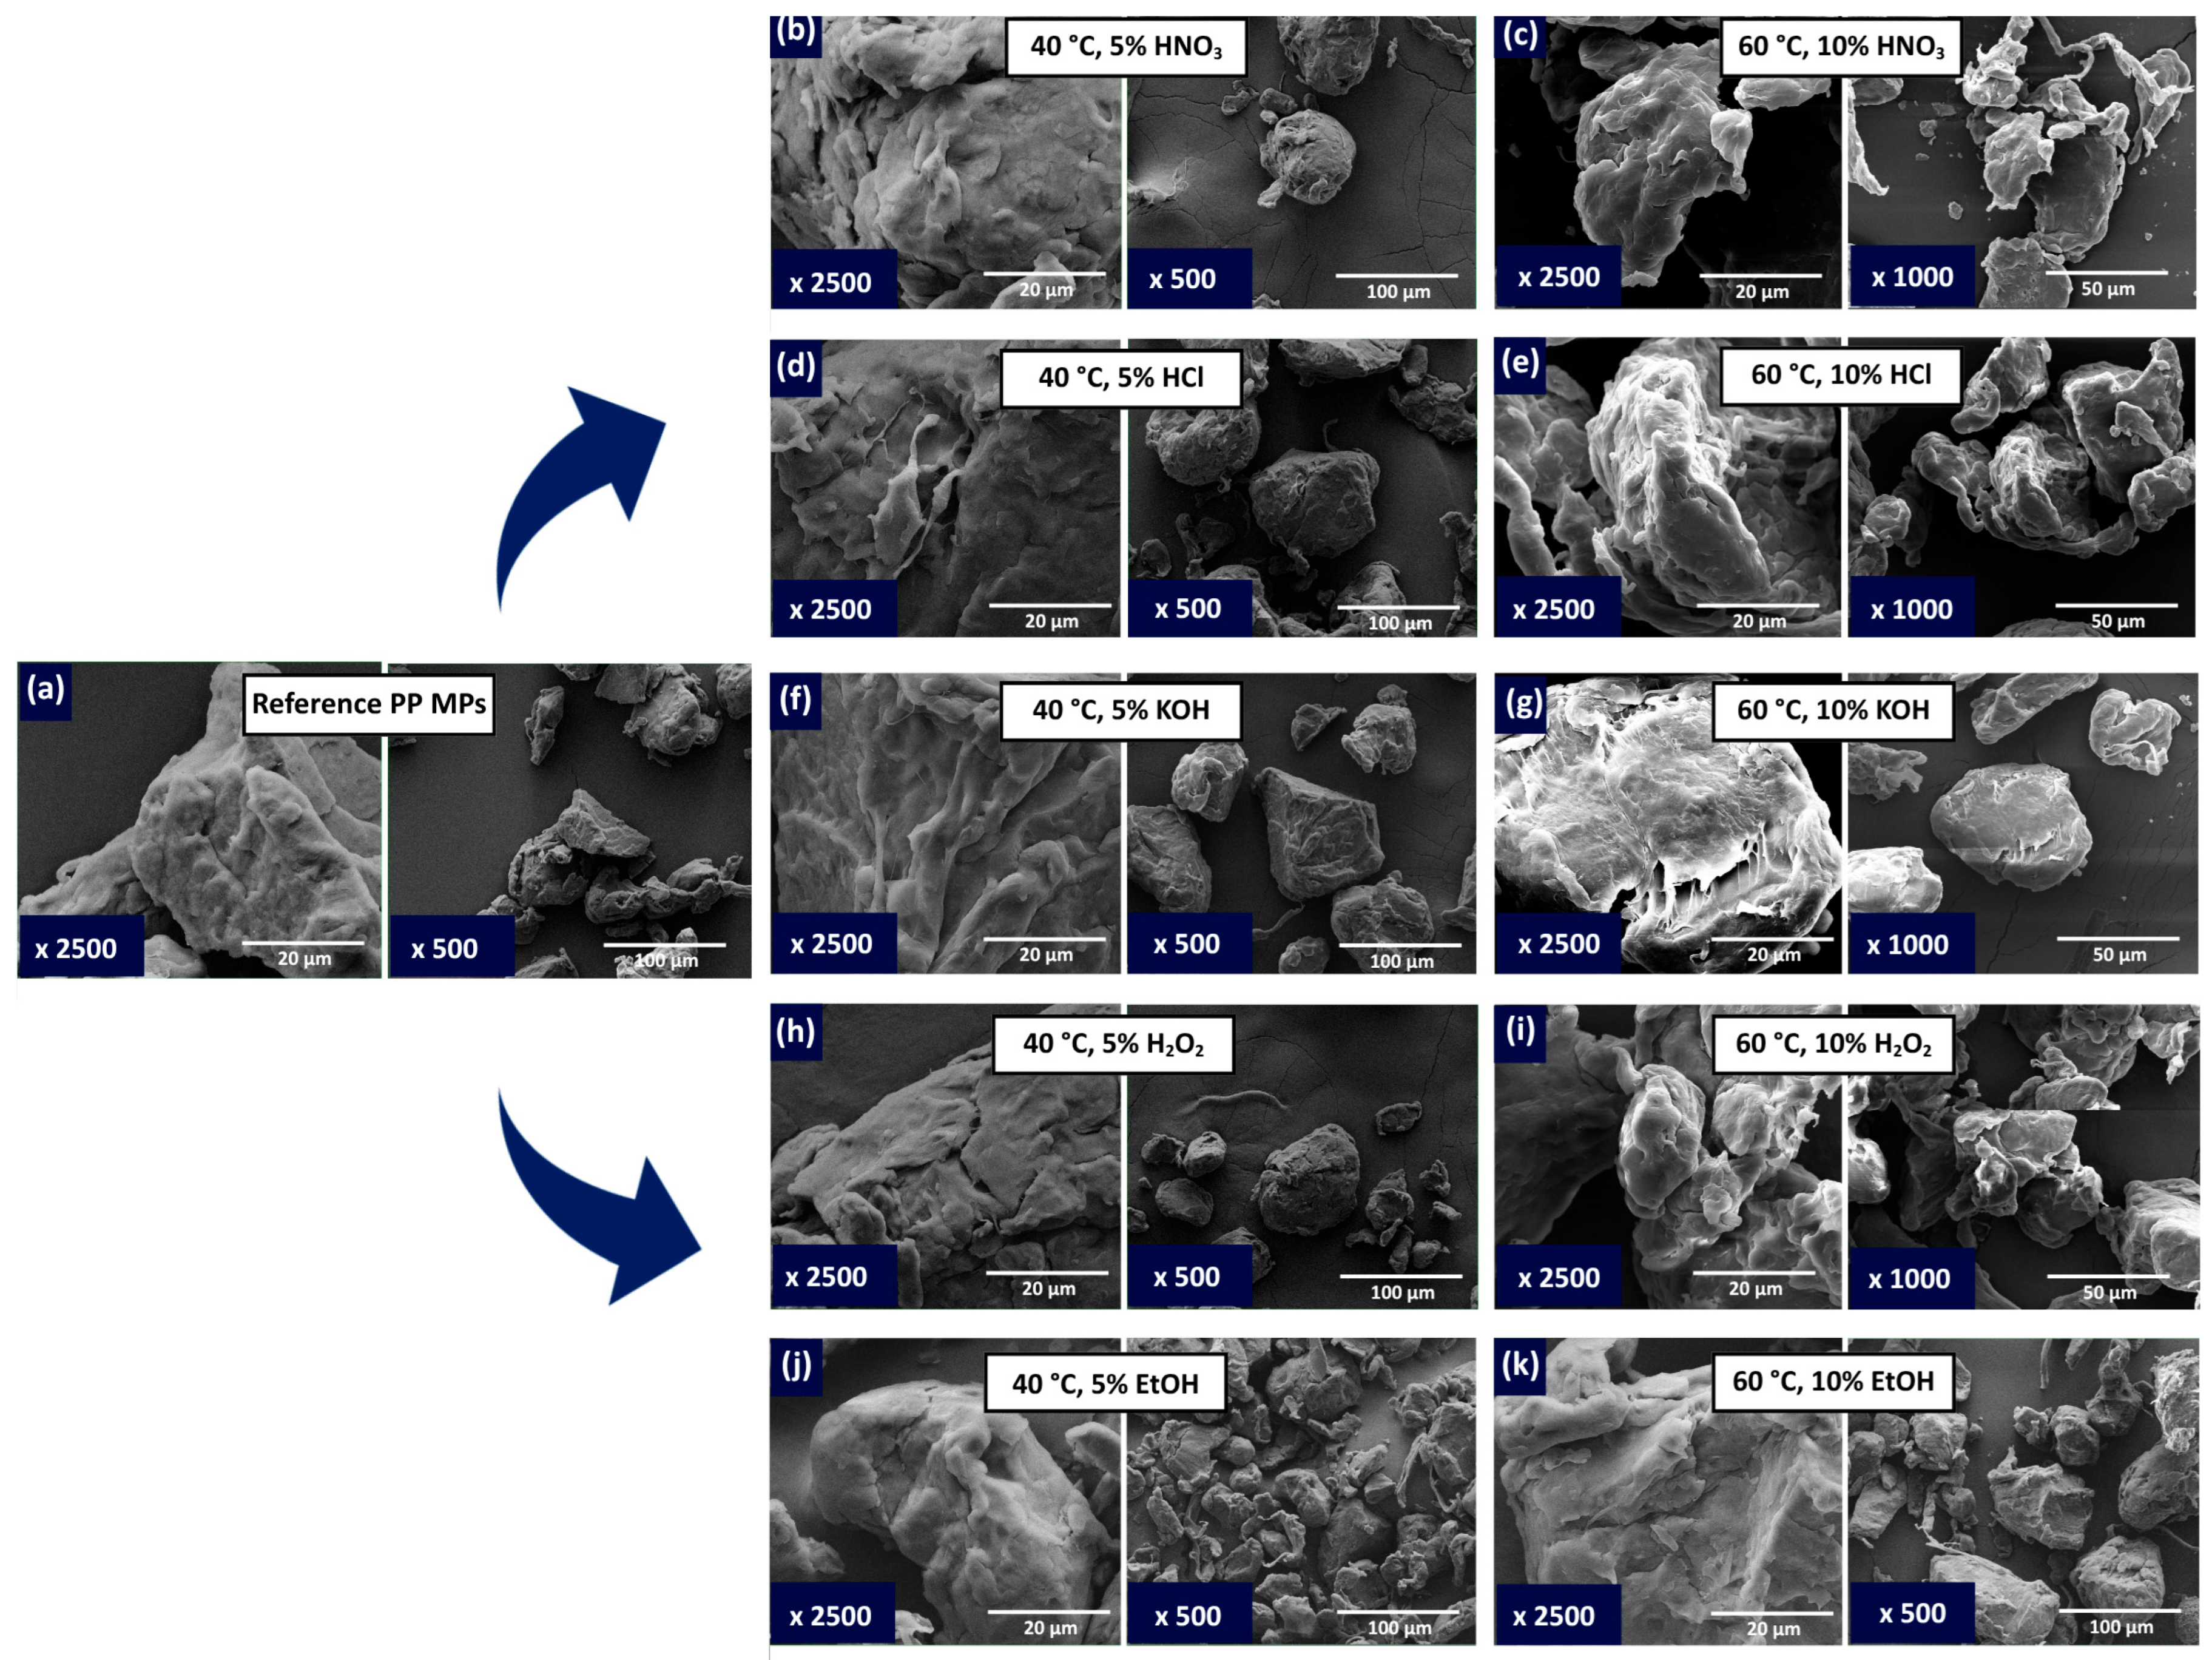
In contrast, PP MPs showed more pronounced visible morphological changes under the tested conditions. Figure 6 presents PP MPs at two magnification levels (× 2500 and either × 1000 or × 500, depending on the sample) to show both the overall particle morphology and visible morphological features. At 40 °C, PP MPs remained visually similar to the untreated reference sample (Figure 6a) after treatment with the tested reagents (Figure 6b,d,f,h,j). At 60 °C, 10% EtOH (Figure 6k) was the only treatment for which no clear visual signs of particle damage were observed. Treatment with the remaining chemical reagents at 60 °C was associated with visible morphological changes, including increased shape irregularity and features suggestive of particle fragmentation. These changes were particularly apparent after treatment with 10% HNO3, 10% HCl, and 10% H2O2 (Figure 6c,e,i).

3.3. Fourier Transform Infrared Microspectroscopy Analysis

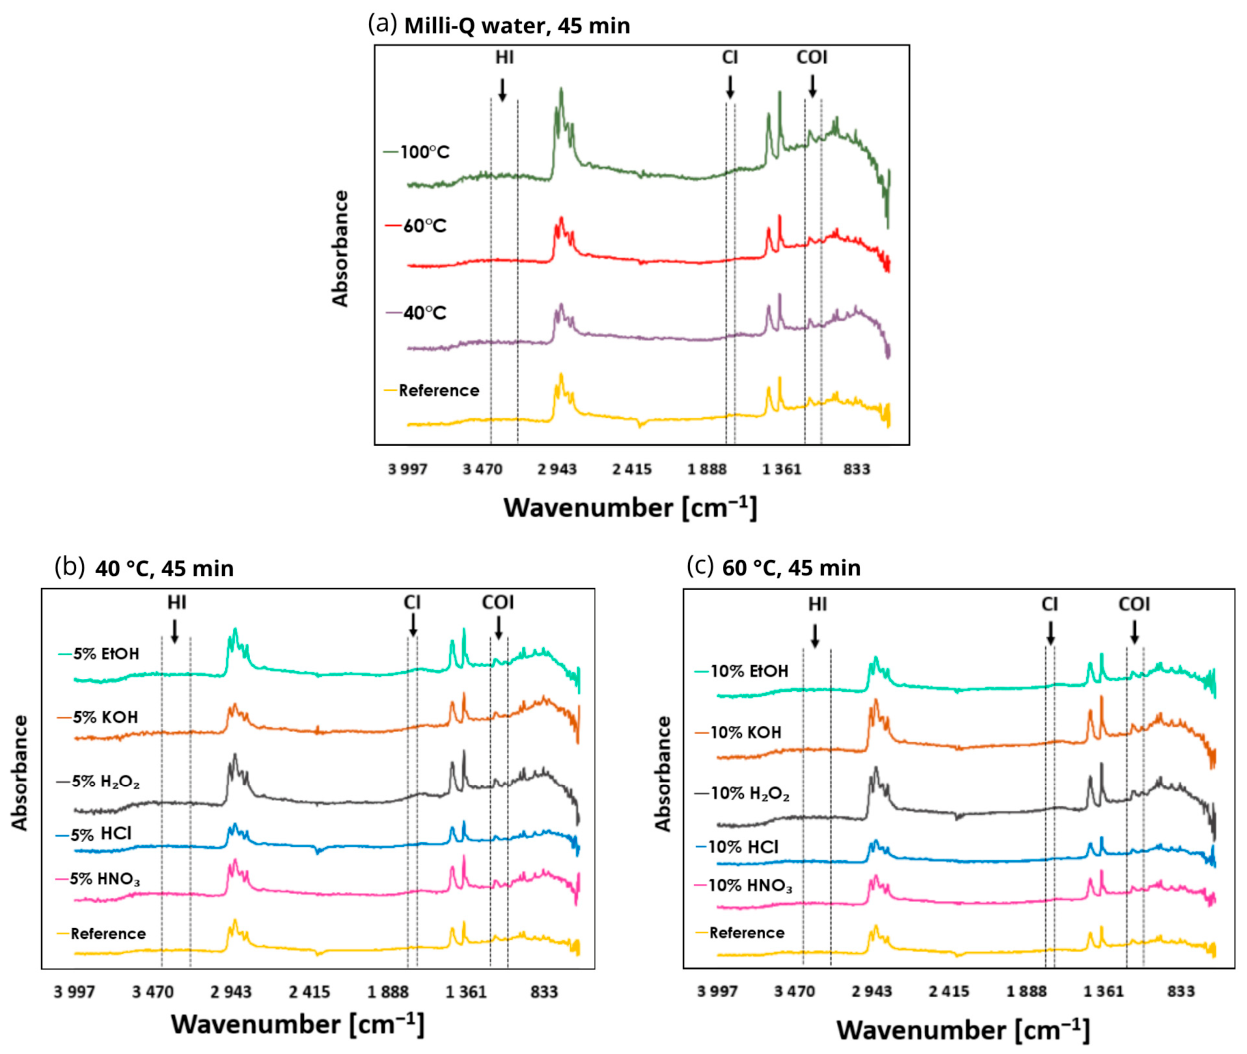
The characteristic PE absorption bands were attributed to CH2 asymmetric stretching at 2919 cm−1, CH2 symmetric stretching at 2851 cm−1, CH2 bending at 1473 and 1463 cm−1, and CH2 rocking at 731–720 cm−1 [56]. No band shifts were observed in the µ-FTIR spectra of PE MPs under any of the tested temperature and chemical conditions compared with the reference spectrum (Figure 7). These results suggest limited detectable chemical alteration of PE MPs under the tested conditions, consistent with previous reports [55].
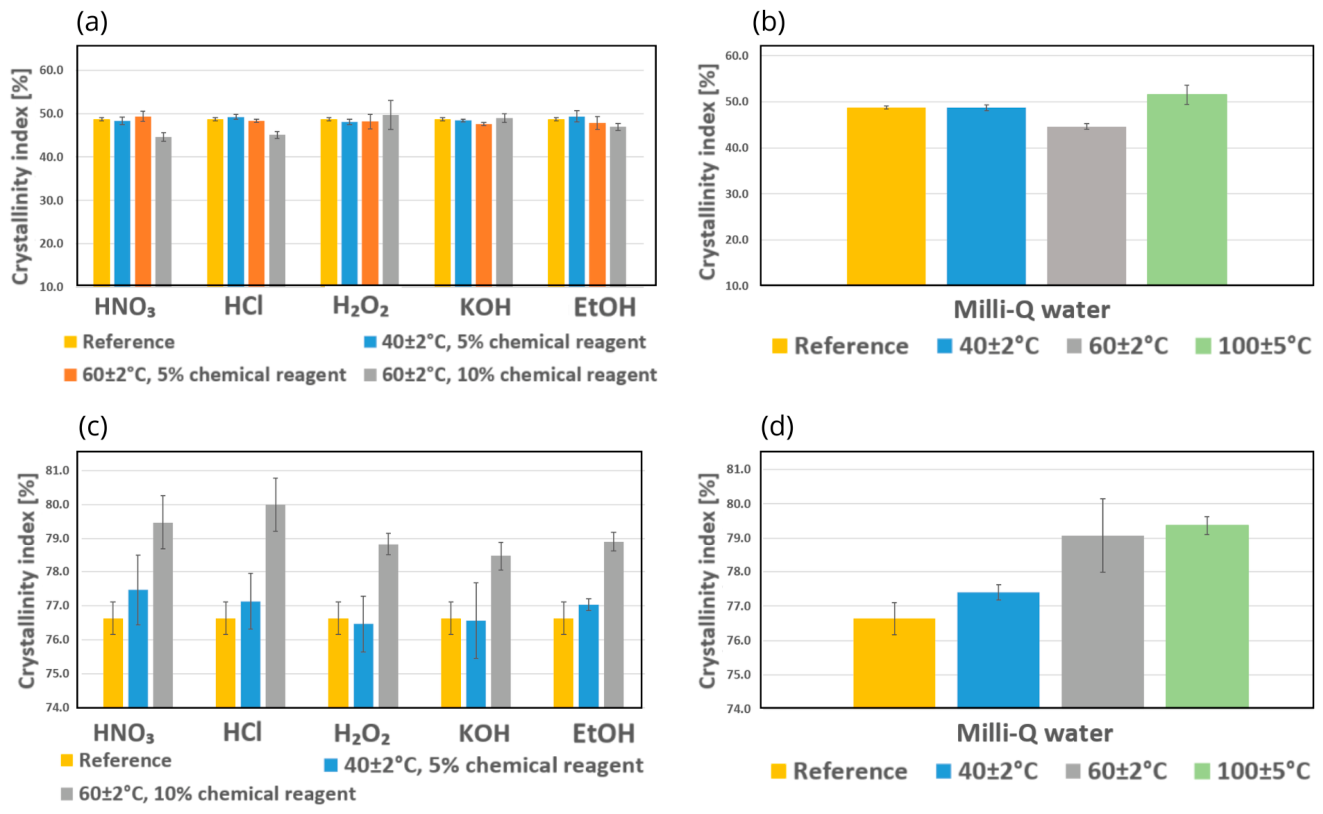
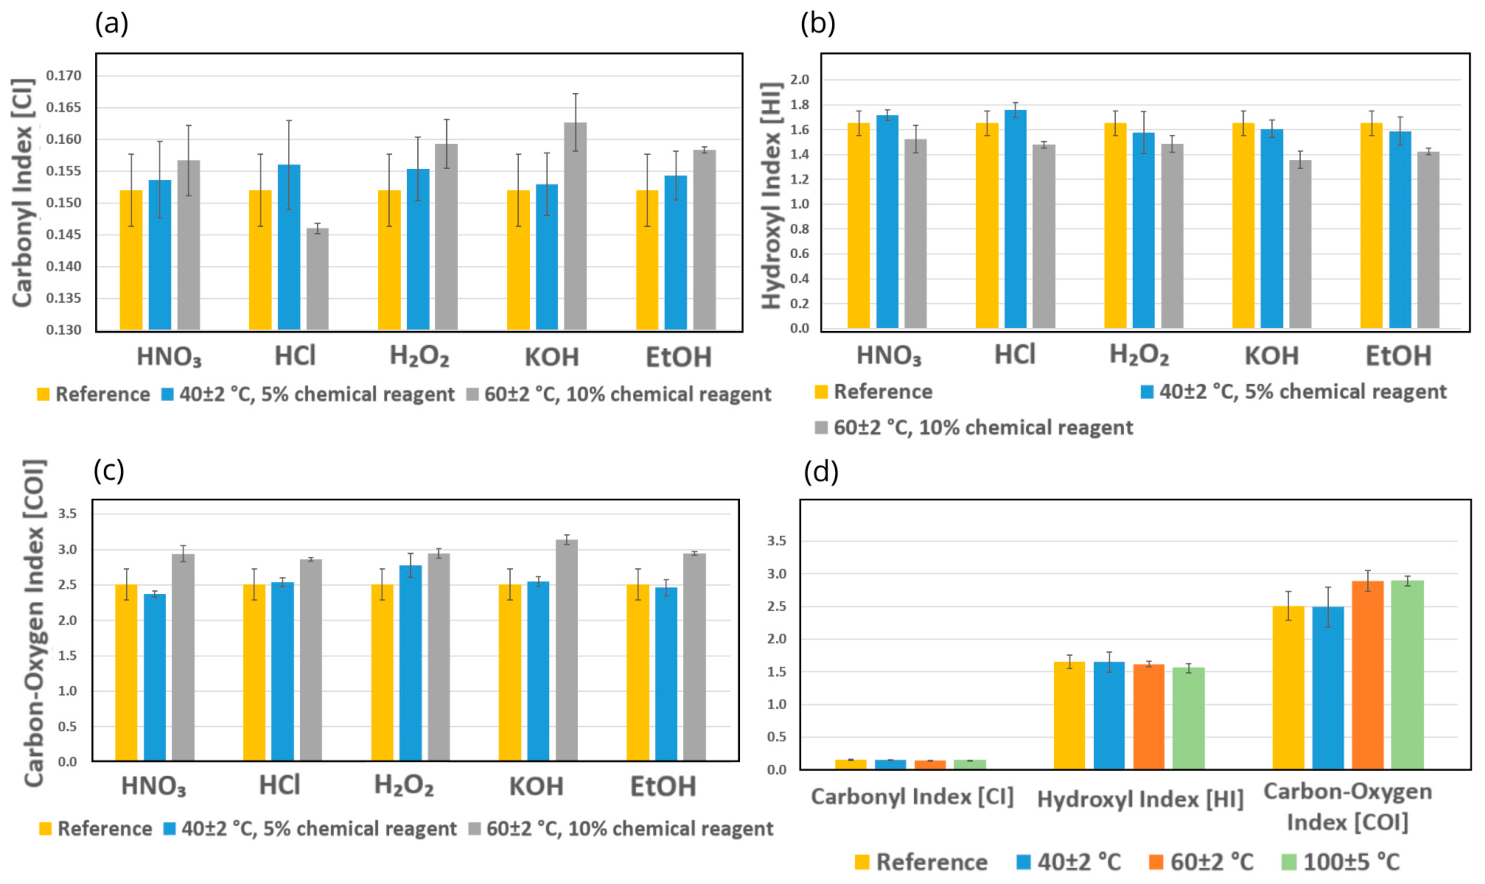
The calculated degradation-related indices and crystallinity index of the treated PE MPs were generally similar to those of the untreated reference samples (Figure 8 and Figure 9a,b). The largest decrease in CI was observed after treatment of PE MPs with 10% HCl at 60 °C. However, SEM analysis did not reveal extensive visible morphological changes under these conditions (Figure 5). Degradation-related indices showed relatively high variability (RSD > 10%) after treatment with 5% H2O2 (at 40 and 60 °C), 5% HNO3 (at 60 °C), 5% KOH (at 60 °C), 10% HCl (at 60 °C), 10% H2O2 (at 60 °C), and after heating in Milli-Q water at 40 and 60 °C (Table S2). This variability may reflect heterogeneity among individual PE particles, including differences in particle size or surface characteristics.
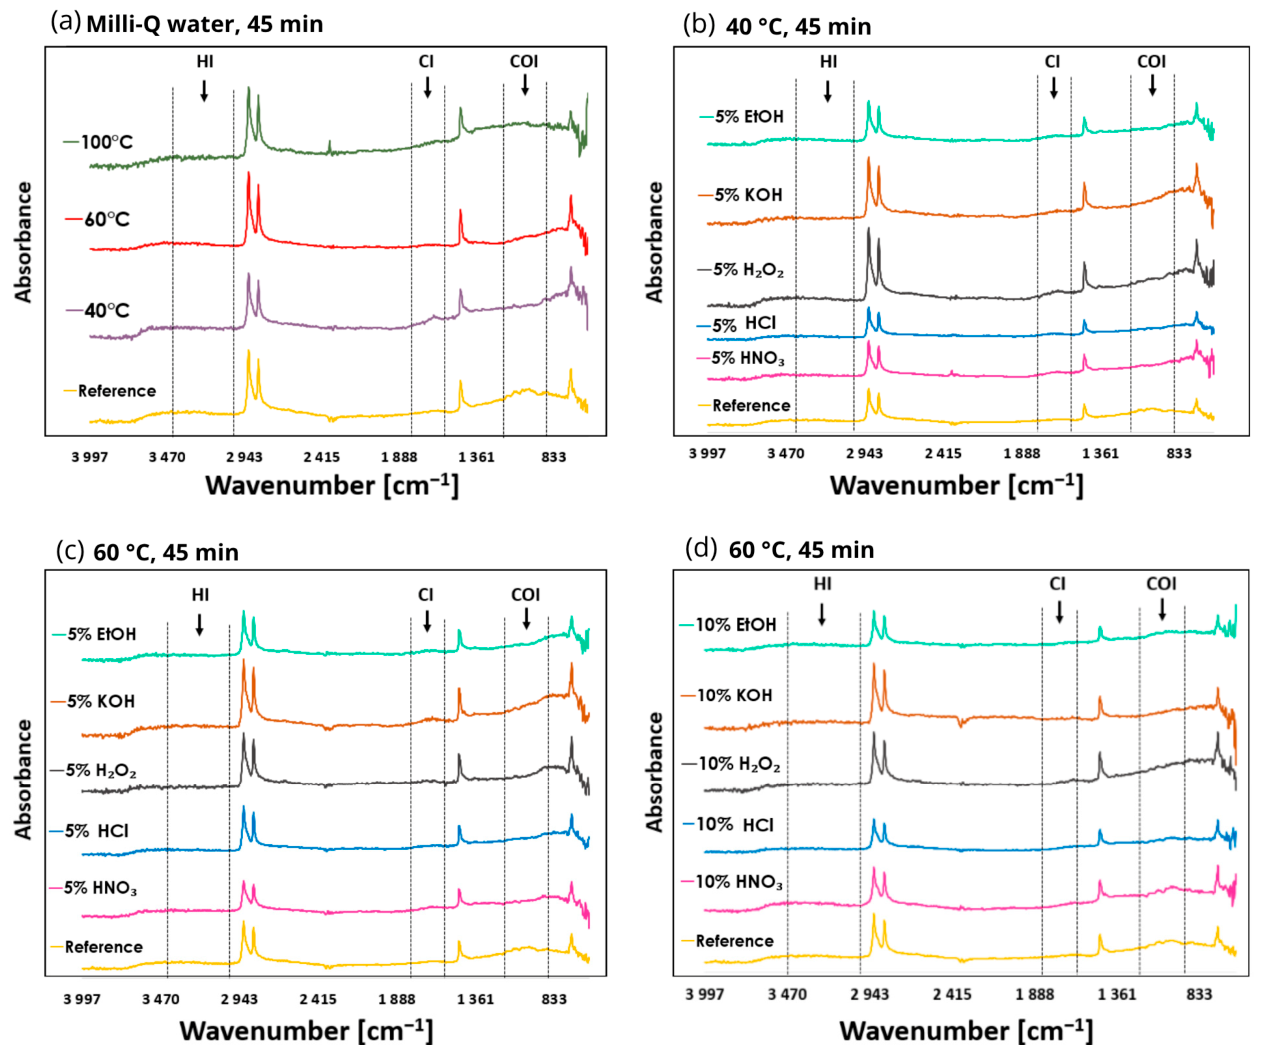
The characteristic PP absorption bands were assigned to CH3 asymmetric stretching at 2955 cm−1, CH2 asymmetric stretching at 2922 cm−1, CH3 symmetric stretching at 2873 cm−1, and CH2 symmetric stretching at 2843 cm−1. The band at 1460 cm−1 was assigned to CH3 asymmetric deformation and/or CH2 scissoring vibrations, whereas the band at 1378 cm−1 was assigned to CH3 symmetric deformation vibrations [57]. Lower-intensity bands were observed at 1167 cm−1, assigned to C–C asymmetric stretching, CH3 asymmetric rocking, and C–H wagging; at 998 cm−1, assigned to CH3 asymmetric rocking; at 974 cm−1, assigned to CH3 asymmetric rocking and C–C asymmetric stretching; at 901 cm−1, assigned to CH3 asymmetric rocking and C–C stretching; and at 844 and 810 cm−1, assigned to CH2 rocking vibrations [57].
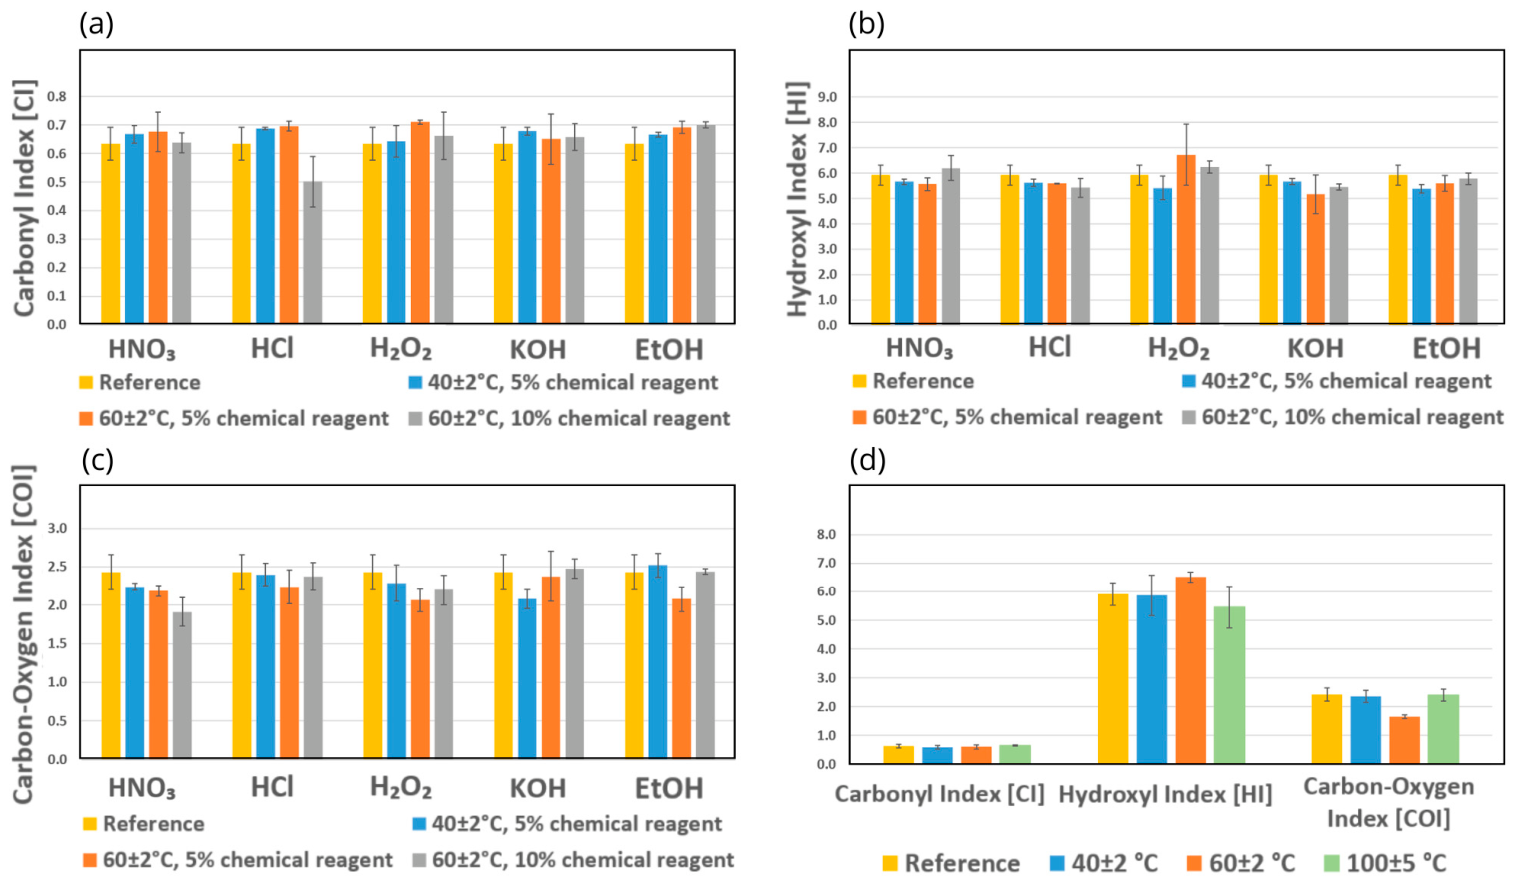
No clear alterations in the characteristic absorption bands of PP MPs were observed in the µ-FTIR-ATR spectra (Figure 10). The CI and COI values were higher under the 60 °C/10% treatment condition than under the 40 °C/5% condition (Figure 11). This trend may reflect changes in absorbance within the C=O and C–O spectral regions (1715–1735 and 1000–1200 cm−1, respectively), which may be associated with early oxidative changes in the polymer. The highest CI and COI values were generally observed under the 60 °C/10% treatment condition, with HCl as an exception. These changes may be associated with early-stage oxidative changes in the polymer; however, they do not provide direct evidence of polymer degradation or chain scission [58]. A similar trend was not observed for HI, which may have been affected by residual moisture in the samples. Heating PP MPs in Milli-Q water at 40 °C did not result in clear changes in the degradation-related indices. However, higher COI values were observed after treatment of PP MPs with Milli-Q water at 60 and 100 °C. These changes were accompanied by increases in the spectroscopic crystallinity index of 2.44 percentage points at 60 °C and 2.74 percentage points at 100 °C relative to the untreated reference sample (Figure 9d, Table S3). This change may be associated with preferential alteration of the amorphous regions, which could result in a relative increase in the crystalline contribution [59]. The crystallinity index also increased in PP MPs treated with each 10% reagent at 60 °C (Figure 9c). Together with the SEM observations and changes in the degradation-related indices, these results suggest early-stage changes in PP MPs under these conditions. The largest increases in the crystallinity index were observed after treatment with HNO3, HCl, KOH, and H2O2. For PP MPs, relatively high variability in the degradation-related indices (RSD > 10%) was observed only after treatment with 5% H2O2 and after heating in Milli-Q water at 40 °C (Table S3).

3.4. Statistical Results

For the Milli-Q water treatments, the normality of model residuals was not significantly violated for any of the analyzed variables for either PE or PP MPs (p > 0.05; Table A1). Levene’s test indicated no significant differences in variance for any of the analyzed variables for either polymer (p > 0.05; Table A2). One-way MANOVA indicated a significant overall effect of temperature on the analyzed variables for both PE and PP MPs (Table A3). For PE MPs, Tukey’s HSD post-hoc test showed statistically significant differences in recovery between 40 and 60 °C (p = 0.001) and between 40 and 100 °C (p = 0.002), and in COI between 40 and 60 °C (p = 0.014) and between 60 and 100 °C (p = 0.011; Table A4). For the crystallinity index, statistically significant differences were observed between 40 and 60 °C (p = 0.012) and between 60 and 100 °C (p = 0.003; Table A4). For PP MPs, Tukey’s HSD post-hoc test showed statistically significant differences in recovery between 40 and 60 °C (p = 0.003) and between 60 and 100 °C (p = 0.005), and in CI between 40 and 60 °C (p = 0.016; Table A4). The difference in crystallinity index between 40 and 100 °C approached, but did not reach, statistical significance (p = 0.054; Table A4). These results indicate that treatment at 100 °C was associated with differences in some of the analyzed properties of PE and PP MPs.
For PE MPs, the normality of model residuals was significantly violated for CI (p = 0.026), HI (p = 0.008), and crystallinity index (p = 0.046; Table A1). In PP MPs, the model residuals showed no significant deviations from normality for any of the analyzed variables (p > 0.05; Table A1). For PE MPs, Levene’s test indicated significant differences in variance for CI (p = 0.003), HI (p < 0.001), and crystallinity index (p = 0.006; Table A2). For PP MPs, Levene’s test indicated significant differences in variance for recovery (p = 0.013) and COI (p = 0.045; Table A2). Two-way MANOVA indicated significant effects of treatment condition, chemical reagent, and their interaction on the analyzed variables for both polymers (Table A5). For PE MPs, Bonferroni-adjusted pairwise comparisons showed significant differences in recovery between 40 °C/5% and 60 °C/5% for HNO3 (p = 0.024), HCl (p < 0.001), and KOH (p = 0.001). Significant differences were also observed between 40 °C/5% and 60 °C/10% for HCl (p < 0.001) and H2O2 (p = 0.001), and between 60 °C/5% and 60 °C/10% for KOH (p = 0.008; Table A6). For PP MPs, Bonferroni-adjusted pairwise comparisons showed significant differences in recovery between 40 °C/5% and 60 °C/10% for HCl (p < 0.001), H2O2 (p = 0.010), and KOH (p = 0.001; Table A6). For PE MPs, a significant difference in CI was observed between 5% and 10% HCl at 60 °C (p = 0.043; Table A7). For PP MPs, a significant difference in crystallinity index was observed between 5% HCl at 40 °C and 10% HCl at 60 °C (p = 0.036; Table A8). No significant pairwise differences were observed for HI or COI in the Bonferroni-adjusted comparisons for either polymer (Table A9 and Table A10).
These results indicate that treatment conditions were associated with differences in recovery for several chemical reagents, particularly HCl, H2O2, and KOH. The statistical results were consistent with the morphological and spectroscopic observations, which suggested limited detectable effects of EtOH on PE and PP MPs under the tested conditions. The differences in recovery observed for KOH and H2O2 were consistent with the visible morphological changes observed by SEM, which may reflect effects of these treatment conditions on the MPs (Figure 5 and Figure 6). The effects of 10% HCl at 60 °C varied across the analyzed parameters and between the two polymers. It is important to note that the experimental combinations for PE MPs (5%/40 °C, 5%/60 °C, and 10%/60 °C) and PP MPs (5%/40 °C and 10%/60 °C) were compared without distinguishing between the effects of temperature and chemical reagent concentration. Consequently, the statistical analysis addresses significant differences between the experimental combinations rather than the effects of the individual parameters.

4. Discussion

Under the tested conditions, treatment with 5% chemical reagents at 40 °C generally resulted in limited detectable alterations in PE and PP MPs. Treatment with Milli-Q water also resulted in limited detectable changes overall, although some statistically significant differences were observed between the tested temperatures. However, these findings are limited to the 45 min incubation period used in this study. In published methods, food matrices are often digested for longer periods and at higher temperatures [6,9,22,28]. For example, Silva et al. [9] used 30% H2O2 to isolate MPs from canned seafood, with prolonged incubation (24–48 h) at elevated temperature (65 °C). The method was not validated for the recovery of MPs, and polyester, PP, and PE were the main polymers identified in the samples. Previous studies have also reported that elevated temperatures may promote fragmentation of PP MPs [60]. Based on the SEM, µ-FTIR, and statistical results, the lower reagent concentrations and lower temperatures tested were generally associated with fewer detectable alterations in PE and PP MPs. Pirsaheb et al. [46] used 10% KOH with incubation at 60 °C for 24 h to isolate MPs from sausages. In the case of incomplete digestion, 35% H2O2 was used as an additional reagent. This method was not validated, which limits the assessment of its analytical reliability. Our results indicate that treatment at 60 °C with 10% alkaline or oxidative reagent solutions may be associated with visible surface alterations in PE MPs and morphological features suggestive of fragmentation in PP MPs. Kadac-Czapska et al. [28] used 30% H2O2 to digest infant formula samples at 60 °C for 8 h. The reported recovery of PE and PP MPs was 102.5 ± 2.0%, indicating efficient recovery under the applied conditions. However, the effectiveness of digestion procedures also depends on the composition of the food matrix. These examples involve protein-rich food matrices. For high-fat matrices, Battaglini et al. [30] used an ethanol:n-hexane mixture (1:3, v/v) to extract MPs from edible vegetable oils. In the present study, treatment with 10% EtOH at 60 °C was associated with limited detectable alterations in PE and PP MPs based on the degradation-related indices, crystallinity index, and SEM observations. Acid digestion is another approach used to isolate MPs from food matrices. Oliveri Conti et al. [23] digested fruit and vegetable samples with 65% HNO3 at 80 °C for 90 min. However, the efficiency of the isolation and recovery of MPs was not evaluated. SEM images of PP MPs treated with 10% HNO3 at 60 °C showed visible morphological features suggestive of particle fragmentation. MPs may also agglomerate during acid digestion, potentially complicating quantitative analysis [61].
The food matrix itself may also influence the susceptibility of MPs to chemical treatment. Insufficient digestion may result in incomplete removal of the food matrix, whereas excessive temperatures or reagent concentrations may alter the MPs themselves. Analytical techniques used for the identification of MPs also have method-dependent lower particle-size limits. The detection limit is 10 µm for µ-FTIR and 1 µm for micro-Raman spectroscopy (µ-Raman) [17]. Fragmented MPs may pass through the filter during sample preparation, potentially leading to their loss and underestimation of their recovery. Chemical modification of the polymer during digestion may also alter its spectral characteristics and complicate subsequent identification. Because µ-FTIR provides only an indirect estimate of polymer crystallinity, complementary techniques such as differential scanning calorimetry (DSC) may be used for a more direct assessment [62]. Future studies could incorporate Raman spectroscopy to provide complementary information on potential changes in the polymer backbone and the formation of degradation-related structural features.
However, the limitations of the study must be considered in light of the differences in the treatment conditions applied to PE and PP MPs. PE was selected as the primary model polymer for the detailed assessment of microplastic stability during sample-preparation procedures. This choice was based on the widespread use of PE in food-contact materials and its recurrent presence among MPs identified in food samples. For PE MPs, three combinations of temperature and chemical reagent concentration were used to further assess the suitability of the 5%/60 °C conditions, which had previously been used for mussel tissue digestion [63] and sucrose-based separation [44]: 5%/40 °C, 5%/60 °C, and 10%/60 °C. In contrast, only two combinations were used for PP MPs (5%/40 °C and 10%/60 °C), which may complicate a direct comparison between the two polymers. The selected experimental conditions also affect statistical interpretation, as the effects of temperature and reagent concentration cannot be fully separated. Consequently, the statistical analysis focused on comparisons between the experimental combinations rather than on the individual effects of temperature and reagent concentration.
Protocols for the determination of MPs in food products should also consider the principles of green chemistry. Green chemistry considers aspects such as reagent quantity and toxicity, waste generation, energy consumption, the number of procedural steps, miniaturization, and automation [64]. Pham et al. [65] suggest that multi-step sample preparation should be avoided, specifically advising against the combined use of chemical oxidation and density separation. Spectroscopic techniques may be more favorable than thermal analysis from a green chemistry perspective, as they are non-destructive to the sample and require minimal or no solvent. Nevertheless, the isolation step may have a substantial influence on the overall “greenness” of the method. Adjama et al. [5] reported that protocols for the determination of MPs in dairy products may be particularly problematic due to the use of multiple oxidative, alkaline, and enzymatic digestion steps. Kumar et al. [66] highlighted the lack of standardized green protocols for the pretreatment, preparation, and analysis of samples for MPs, indicating a current research gap.

5. Conclusions

The results highlight the importance of optimizing conditions for the isolation of MPs from food matrices. Analytical methods should also be validated, with particular attention to the recovery of MPs from the matrix. Based on the tested conditions, less intensive treatment combinations were generally associated with fewer detectable treatment-induced alterations in PE and PP MPs. The combined morphological and spectroscopic findings suggested that PE MPs showed fewer detectable alterations than PP MPs under the tested treatment conditions. The temperature-dependent changes observed during heating in Milli-Q water indicate that elevated temperatures should be applied cautiously during sample preparation. However, the alterations observed at 100 °C were limited and did not consistently indicate substantial degradation of either polymer. Among the tested combinations, treatment with 5% alkaline or oxidizing reagents at 40 °C was generally associated with limited detectable alterations in both PE and PP MPs. For PE MPs, the greatest increases in CI (12.15%) and HI (13.53%) were observed for 5% H2O2 at 60 °C. In contrast, the most notable increase in the crystallinity index (5.72%) was observed for Milli-Q water at 100 °C. For PP MPs, the greatest increases in CI (7.02%) and COI (25.25%) were observed for 10% KOH at 60 °C. In the context of HCl application, the most pronounced increase in HI (6.40%) was observed for the 5%/40 °C combination, while the most notable increase in the crystallinity index (4.40%) was detected for the 10%/60 °C combination. However, it should be emphasized that the observed changes in the degradation-related indices for PE and PP MPs are relatively minor. Therefore, these changes may be associated with polymer degradation, but they do not provide direct evidence of this process.
The results show that both polymer type and treatment conditions should be considered when selecting digestion procedures for the analysis of MPs in food. Nevertheless, the conclusions are limited to the polymers, reagents, and treatment conditions evaluated in this study. The limitations of the method should also be considered in relation to the experimental conditions, particularly the combinations of temperature and reagent concentration, which varied according to the polymer under investigation.
MPs found in food may consist of other polymers with different physicochemical properties. Digestion conditions should therefore be selected based on the polymer types expected to be present and their potential susceptibility to the applied treatment. Further studies should include additional polymer types, such as PET MPs, and evaluate the tested digestion conditions in real food matrices. Future studies should also evaluate a wider range of incubation times, temperatures, and reagent concentrations. This would allow a more comprehensive assessment of the effects of individual treatment parameters and their interactions. These findings may support the development of standardized and reliable protocols for the determination of MPs in food. Greater standardization of MPs analysis in food could improve the quality and comparability of data used to assess human dietary exposure.

Supplementary Materials

The following supporting information can be downloaded at: https://www.mdpi.com/article/10.3390/app16199936/s1, Figure S1. SEM images of cellulose filters under different treatment conditions (×100; ×2500); Table S1. Recovery of PE and PP MPs under the tested treatment conditions; Table S2. Degradation-related indices and crystallinity index of PE MPs; Table S3. Degradation-related indices and crystallinity index of PP MPs.

Author Contributions

Conceptualization, K.J.; K.K.-C. and M.G.; methodology, K.J.; K.K.-C. and M.G.; software, B.B., K.K.-C. and M.G.; validation, K.J.; formal analysis, K.J.; investigation, K.J.; K.K.-C. and B.B.; resources, B.B. and M.G.; data curation, K.J.; writing—original draft preparation, K.J.; writing—review and editing, B.B.; K.K.-C. and M.G.; visualization, K.J.; supervision, M.G.; project administration, M.G.; funding acquisition, K.J. and M.G. All authors have read and agreed to the published version of the manuscript.

Funding

The project received financial support by the Medical University of Gdańsk (“Młody Badacz”; number 01-66025).

Institutional Review Board Statement

Not applicable.

Informed Consent Statement

Not applicable.

Data Availability Statement

The original contributions presented in the study are included in the article; further inquiries can be directed to the corresponding author.

Conflicts of Interest

The authors declare no conflicts of interest.

Abbreviations

The following abbreviations are used in this manuscript:
ATRAttenuated Total Reflection
CICarbonyl Index
COICarbon–Oxygen Index
DSCDifferential Scanning Calorimetry
EFSAEuropean Food Safety Authority
EtOHEthanol
HClHydrochloric acid
HIHydroxyl Index
HNO3Nitric acid (V)
H2O2Hydrogen peroxide
KOHPotassium hydroxide
MPsMicroplastics
PAPolyamide
PEPolyethylene
PETPoly(ethylene terephthalate)
PPPolypropylene
PSPolystyrene
PVCPoly(vinyl chloride)
SEMScanning electron microscopy
v/vVolume/volume
w/vWeight/volume
µ-FTIRFourier transform infrared microspectroscopy
µ-RamanMicro-Raman spectroscopy

Appendix A

Table A1. Results of the normality assessment of model residuals for the analyzed variables in PE and PP MPs (bold values indicate statistical significance at p < 0.05).
Type of PolymerTreatmentRecoveryCarbonyl IndexHydroxyl IndexCarbon–Oxygen IndexCrystallinity Index
PolyethyleneMilli-Q waterp = 0.586p = 0.198p = 0.651p = 0.764p = 0.295
Treatment conditions
(40 °C/5%;
60 °C/5%;
60 °C/10%)
+ reagent
(HNO3, HCl, H2O2, KOH, EtOH)
p = 0.550p = 0.026 *p = 0.008 *p = 0.962p = 0.046 *
PolypropyleneMilli-Q waterp = 0.568p = 0.217p = 0.828p = 0.885p = 0.389
Treatment conditions
(40 °C/5%;
60 °C/10%)
+ reagent
(HNO3, HCl, H2O2, KOH, EtOH)
p = 0.208p = 0.347p = 0.980p = 0.929p = 0.571
Abbreviations: p—p-value; * p < 0.05.
Table A2. Results of Levene’s test for PE and PP MPs (bold values indicate statistical significance at p < 0.05).
Type of PolymerTreatmentVariableFp
Polyethylene
(degrees of freedom for each F: 2.6)
Milli-Q waterRecovery1.1250.385
Carbonyl Index2.9900.126
Hydroxyl Index1.8970.230
Carbon–Oxygen Index1.5950.278
Crystallinity index3.3120.107
Polyethylene
(degrees of freedom for each F: 14.3)
Treatment conditions
(40 °C/5%;
60 °C/5%;
60 °C/10%)
+ reagent
(HNO3, HCl, H2O2, KOH, EtOH)
Recovery1.9300.064
Carbonyl Index3.3390.003 *
Hydroxyl Index6.106<0.001 *
Carbon–Oxygen Index1.3710.227
Crystallinity index2.9950.006 *
Polypropylene
(degrees of freedom for each F: 2.6)
Milli-Q waterRecovery0.8890.459
Carbonyl Index0.1820.838
Hydroxyl Index1.5100.294
Carbon–Oxygen Index2.7940.139
Crystallinity index4.0710.076
Polypropylene
(degrees of freedom for each F: 9.2)
Treatment conditions
(40 °C/5%;
60 °C/10%)
+ reagent
(HNO3, HCl, H2O2, KOH, EtOH)
Recovery3.3000.013 *
Carbonyl Index1.4880.219
Hydroxyl Index2.2180.066
Carbon–Oxygen Index2.4560.045 *
Crystallinity index1.2630.315
Abbreviations: F—value of the test statistic (related to the Fisher-Snedecor distribution); p—p-value; * p < 0.05.
Table A3. Results of the one-way MANOVA test for PE and PP MPs at 40, 60, and 100 °C with Milli-Q water (bold values indicate statistical significance at p < 0.05).
Type of PolymerEffectTestFEffect
df
p
PolyethyleneInterceptWilks204,972.35<0.001 *
TemperatureWilks43.5100.001 *
PolypropyleneInterceptWilks8073.25<0.001 *
TemperatureWilks6.6100.042 *
Abbreviations: F—value of the test statistic (related to the Fisher-Snedecor distribution); p—p-value; * p < 0.05.
Table A4. Results of Tukey’s HSD post-hoc test for PE and PP MPs at 40, 60, and 100 °C with Milli-Q water (bold values indicate statistical significance at p < 0.05).
Type of PolymerVariableTemperature40 ± 2 °C60 ± 2 °C100 ± 5 °C
PolyethyleneRecovery40 ± 2 °C-0.001 *0.002 *
60 ± 2 °C0.001 *-0.375
100 ± 5 °C0.002 *0.375-
Carbonyl Index40 ± 2 °C-0.9740.576
60 ± 2 °C0.974-0.700
100 ± 5 °C0.5760.700-
Hydroxyl Index40 ± 2 °C-0.5650.769
60 ± 2 °C0.565-0.255
100 ± 5 °C0.7690.255-
Carbon–Oxygen Index40 ± 2 °C-0.014 *0.973
60 ± 2 °C0.014 *-0.011 *
100 ± 5 °C0.9730.011 *-
Crystallinity index40 ± 2 °C-0.012 *0.304
60 ± 2 °C0.012 *-0.003 *
100 ± 5 °C0.3040.003 *-
PolypropyleneRecovery40 ± 2 °C-0.003 *0.874
60 ± 2 °C0.003 *-0.005 *
100 ± 5 °C0.8740.005 *-
Carbonyl Index40 ± 2 °C-0.016 *0.078
60 ± 2 °C0.016 *-0.418
100 ± 5 °C0.0780.418-
Hydroxyl Index40 ± 2 °C-0.9500.649
60 ± 2 °C0.950-0.818
100 ± 5 °C0.6490.818-
Carbon–Oxygen Index40 ± 2 °C-0.2080.209
60 ± 2 °C0.208-1.000
100 ± 5 °C0.2091.000-
Crystallinity index40 ± 2 °C-0.0950.054
60 ± 2 °C0.095-0.892
100 ± 5 °C0.0540.892-
Abbreviations: p—p-value; * p < 0.05.
Table A5. Results of interaction of two-way MANOVA test for PE and PP MPs between the tested temperature/reagent concentration combinations (bold values indicate statistical significance at p < 0.05).
Type of PolymerEffectTestFEffect
df
p
PolyethyleneInterceptWilks19,106.805<0.001 *
Temperature
treatment
Wilks9.6310<0.001 *
ReagentWilks2.20200.006 *
Temperature
treatment * reagent
Wilks2.4640<0.001 *
PolypropyleneInterceptWilks61,643.125<0.001 *
Temperature
treatment
Wilks24.825<0.001 *
ReagentWilks2.42200.005 *
Temperature
treatment * reagent
Wilks2.38200.006 *
Abbreviations: F—value of the test statistic (related to the Fisher-Snedecor distribution); p—p-value; * p < 0.05.
Table A6. Results of Bonferroni-adjusted pairwise comparisons for recovery for PE and PP MPs between the tested temperature/reagent concentration combinations (bold values indicate statistical significance at p < 0.05).
Type of PolymerReagentTreatment Condition40 °C/5%60 °C/5%60 °C/10%
PolyethyleneHNO340 °C/5%-0.024 *0.151
60 °C/5%0.024 *-1.000
60 °C/10%0.1511.000-
HCl40 °C/5%-<0.001 *<0.001 *
60 °C/5%<0.001 *-1.000
60 °C/10%<0.001 *1.000-
H2O240 °C/5%-0.1130.001*
60 °C/5%0.113-1.000
60 °C/10%0.001 *1.000-
KOH40 °C/5%-0.001 *1.000
60 °C/5%0.001 *-0.008 *
60 °C/10%1.0000.008 *-
EtOH40 °C/5%-1.0000.345
60 °C/5%1.000-1.000
60 °C/10%0.3451.000-
PolypropyleneHNO340 °C/5%-n.t.1.000
60 °C/10%1.000n.t.-
HCl40 °C/5%-n.t.<0.001 *
60 °C/10%<0.001 *n.t.-
H2O240 °C/5%-n.t.0.010 *
60 °C/10%0.010 *n.t-
KOH40 °C/5%-n.t0.001 *
60 °C/10%0.001 *n.t-
EtOH40 °C/5%-n.t1.000
60 °C/10%1.000n.t-
Abbreviations: p—p-value; * p < 0.05; n.t.—not tested.
Table A7. Results of Bonferroni-adjusted pairwise comparisons for CI for PE and PP MPs between the tested temperature/reagent concentration combinations (bold values indicate statistical significance at p < 0.05).
Type of PolymerReagentTreatment Condition40 °C/5%60 °C/5%60 °C/10%
PolyethyleneHNO340 °C/5%-1.0001.000
60 °C/5%1.000-1.000
60 °C/10%1.0001.000-
HCl40 °C/5%-1.0000.070
60 °C/5%1.000-0.043 *
60 °C/10%0.0700.043 *-
H2O240 °C/5%-1.0001.000
60 °C/5%1.000-1.000
60 °C/10%1.0001.000-
KOH40 °C/5%-1.0001.000
60 °C/5%1.000-1.000
60 °C/10%1.0001.000-
EtOH40 °C/5%-1.0001.000
60 °C/5%1.000-1.000
60 °C/10%1.0001.000-
PolypropyleneHNO340 °C/5%-n.t1.000
60 °C/10%1.000n.t-
HCl40 °C/5%-n.t1.000
60 °C/10%1.000n.t-
H2O240 °C/5%-n.t1.000
60 °C/10%1.000n.t-
KOH40 °C/5%-n.t1.000
60 °C/10%1.000n.t-
EtOH40 °C/5%-n.t1.000
60 °C/10%1.000n.t-
Abbreviations: p—p-value; * p < 0.05; n.t.—not tested.
Table A8. Results of Bonferroni-adjusted pairwise comparisons for the crystallinity index for PE and PP MPs between the tested temperature/reagent concentration combinations (bold values indicate statistical significance at p < 0.05).
Type of PolymerReagentTreatment Condition40 °C/5%60 °C/5%60 °C/10%
PolyethyleneHNO340 °C/5%-1.0000.606
60 °C/5%1.000-0.073
60 °C/10%0.6060.073-
HCl40 °C/5%-1.0000.292
60 °C/5%1.000-1.000
60 °C/10%0.2921.000-
H2O240 °C/5%-1.0001.000
60 °C/5%1.000-1.000
60 °C/10%1.0001.000-
KOH40 °C/5%-1.0001.000
60 °C/5%1.000-1.000
60 °C/10%1.0001.000-
EtOH40 °C/5%-1.0001.000
60 °C/5%1.000-1.000
60 °C/10%1.0001.000-
PolypropyleneHNO340 °C/5%-n.t0.548
60 °C/10%0.548n.t-
HCl40 °C/5%-n.t0.036 *
60 °C/10%0.036 *n.t-
H2O240 °C/5%-n.t0.740
60 °C/10%0.740n.t-
KOH40 °C/5%-n.t0.176
60 °C/10%0.176n.t-
EtOH40 °C/5%-n.t0.817
60 °C/10%0.817n.t-
Abbreviations: p—p-value; * p < 0.05; n.t.—not tested.
Table A9. Results of Bonferroni-adjusted pairwise comparisons for HI for PE and PP MPs between the tested temperature/reagent concentration combinations.
Type of PolymerReagentTreatment Condition40 °C/5%60 °C/5%60 °C/10%
PolyethyleneHNO340 °C/5%-1.0001.000
60 °C/5%1.000-1.000
60 °C/10%1.0001.000-
HCl40 °C/5%-1.0001.000
60 °C/5%1.000-1.000
60 °C/10%1.0001.000-
H2O240 °C/5%-1.0001.000
60 °C/5%1.000-1.000
60 °C/10%1.0001.000-
KOH40 °C/5%-1.0001.000
60 °C/5%1.000-1.000
60 °C/10%1.0001.000-
EtOH40 °C/5%-1.0001.000
60 °C/5%1.000-1.000
60 °C/10%1.0001.000-
PolypropyleneHNO340 °C/5%-n.t1.000
60 °C/10%1.000n.t-
HCl40 °C/5%-n.t0.191
60 °C/10%0.191n.t-
H2O240 °C/5%-n.t0.381
60 °C/10%0.381n.t-
KOH40 °C/5%-n.t0.813
60 °C/10%0.813n.t-
EtOH40 °C/5%-n.t1.000
60 °C/10%1.000n.t-
Abbreviations: p—p-value; n.t.—not tested.
Table A10. Results of Bonferroni-adjusted pairwise comparisons for COI for PE and PP MPs between the tested temperature/reagent concentration combinations.
Type of PolymerReagentTreatment Condition40 °C/5%60 °C/5%60 °C/10%
PolyethyleneHNO340 °C/5%-1.0001.000
60 °C/5%1.000-1.000
60 °C/10%1.0001.000-
HCl40 °C/5%-1.0001.000
60 °C/5%1.000-1.000
60 °C/10%1.0001.000-
H2O240 °C/5%-1.0001.000
60 °C/5%1.000-1.000
60 °C/10%1.0001.000-
KOH40 °C/5%-1.0001.000
60 °C/5%1.000-1.000
60 °C/10%1.0001.000-
EtOH40 °C/5%-1.0001.000
60 °C/5%1.000-1.000
60 °C/10%1.0001.000-
PolypropyleneHNO340 °C/5%-n.t0.234
60 °C/10%0.234n.t-
HCl40 °C/5%-n.t1.000
60 °C/10%1.000n.t-
H2O240 °C/5%-n.t0.192
60 °C/10%0.192n.t-
KOH40 °C/5%-n.t1.000
60 °C/10%1.000n.t-
EtOH40 °C/5%-n.t0.680
60 °C/10%0.680n.t-
Abbreviations: p—p-value; n.t.—not tested.

References

  1. Microplastics and Nanoplastics in Food|EFSA. Available online: https://www.efsa.europa.eu/en/topics/microplastics-and-nanoplastics-food?utm (accessed on 17 August 2026).
  2. Shruti, V.C.; Kutralam-Muniasamy, G. Migration Testing of Microplastics in Plastic Food-Contact Materials: Release, Characterization, Pollution Level, and Influencing Factors. TrAC 2024, 170, 117421. [Google Scholar] [CrossRef] [Scilit]
  3. Al-Mansoori, M.; Stephenson, M.; Harrad, S.; Abdallah, M.A.E. Synthetic Microplastics in UK Tap and Bottled Water; Implications for Human Exposure. Emerg. Contam. 2025, 11, 100417. [Google Scholar] [CrossRef] [Scilit]
  4. Oleksiuk, K.; Krupa-Kotara, K.; Wypych-Ślusarska, A.; Głogowska-Ligus, J.; Spychała, A.; Słowiński, J. Microplastic in Food and Water: Current Knowledge and Awareness of Consumers. Nutrients 2022, 14, 4857. [Google Scholar] [CrossRef] [Scilit] [PubMed]
  5. Adjama, I.; Dave, H.; Balarabe, B.Y.; Masiyambiri, V.; Marycleopha, M. Microplastics in Dairy Products and Human Breast Milk: Contamination Status and Greenness Analysis of Available Analytical Methods. J. Hazard. Mater. Lett. 2024, 5, 100120. [Google Scholar] [CrossRef] [Scilit]
  6. Diaz-Basantes, M.F.; Conesa, J.A.; Fullana, A. Microplastics in Honey, Beer, Milk and Refreshments in Ecuador as Emerging Contaminants. Sustainability 2020, 12, 5514. [Google Scholar] [CrossRef] [Scilit]
  7. Ravikumar, S.; Jeyameenakshi, A.; Syed Ali, M.; Ebenezer, K.S. Assessment of Microplastics in Edible Salts from Solar Saltpans and Commercial Salts. Total Environ. Res. Themes 2023, 6, 100032. [Google Scholar] [CrossRef] [Scilit]
  8. Venkatesh, S.; Naidu, B.C.; Palanisamy, S.; Ngasotter, S.; Shaju, S.S.; Porayil, L.; Balange, A.; Nayak, B.B.; Xavier, K.A.M. Microplastic Accumulation Dynamics and Risk Assessment in Dried Fish Processed with Sea Salt at Different Salting Ratios. J. Hazard. Mater. Adv. 2024, 14, 100415. [Google Scholar] [CrossRef] [Scilit]
  9. Silva, D.M.; Almeida, C.M.R.; Guardiola, F.A.; Pereira, R.; Rodrigues, S.M.; Ramos, S. Uncovering Microplastics Contamination in Canned Seafood. Food Chem. 2024, 448, 139049. [Google Scholar] [CrossRef] [Scilit] [PubMed]
  10. Lazăr, N.N.; Călmuc, M.; Milea, Ș.A.; Georgescu, P.L.; Iticescu, C. Micro and Nano Plastics in Fruits and Vegetables: A Review. Heliyon 2024, 10, e28291. [Google Scholar] [CrossRef] [Scilit] [PubMed]
  11. Yuan, Z.; Nag, R.; Cummins, E. Human Exposure to Micro/Nano-Plastics through Vegetables, Fruits, and Grains—A Predictive Modelling Approach. J. Hazard. Mater. 2024, 480, 135900. [Google Scholar] [CrossRef] [Scilit] [PubMed]
  12. Aydın, R.B.; Yozukmaz, A.; Şener, İ.; Temiz, F.; Giannetto, D. Occurrence of Microplastics in Most Consumed Fruits and Vegetables from Turkey and Public Risk Assessment for Consumers. Life 2023, 13, 1686. [Google Scholar] [CrossRef] [Scilit] [PubMed]
  13. Bhavsar, P.S.; Dongare, P.R.; Shimada, Y.; Gore, A.H. A Critical on Current Challenges in the Analysis of Microplastics in Food Samples. ACS Food Sci. Technol. 2023, 3, 2001–2017. [Google Scholar] [CrossRef] [Scilit]
  14. Kadac-Czapska, K.; Ośko, J.; Nowak, N.; Jażdżewska, K.; Kowalczyk, P.; Grembecka, M. Unseen Hazards—Toxicological Effects and Human Health Impacts of Nanoplastics and Microplastics. Appl. Sci. 2025, 15, 10146. [Google Scholar] [CrossRef] [Scilit]
  15. Hu, J.; Xu, X.; Song, Y.; Liu, W.; Zhu, J.; Jin, H.; Meng, Z. Microplastics in Widely Used Polypropylene-Made Food Containers. Toxics 2022, 10, 762. [Google Scholar] [CrossRef] [Scilit] [PubMed]
  16. Kowalczyk, P.; Kadac-Czapska, K.; Grembecka, M. Polyethylene Packaging as a Source of Microplastics: Current Knowledge and Future Directions on Food Contamination. Foods 2025, 14, 2408. [Google Scholar] [CrossRef] [Scilit] [PubMed]
  17. Kadac-Czapska, K.; Trzebiatowska, P.J.; Knez, E.; Zaleska-Medynska, A.; Grembecka, M. Microplastics in Food—A Critical Approach to Definition, Sample Preparation, and Characterisation. Food Chem. 2023, 418, 135985. [Google Scholar] [CrossRef] [Scilit] [PubMed]
  18. Čapla, J.; Zajác, P.; Čurlej, J.; Fikselová, M.; Hleba, L. Reference Materials for Microplastics: Key to Standardization and Validation of Methods in Food and the Environment. J. Microbiol. Biotechnol. Food Sci. 2026, 15, e13092. [Google Scholar] [CrossRef] [Scilit]
  19. Basaran, B.; Özçifçi, Z.; Kanbur, E.D.; Akçay, H.T.; Gül, S.; Bektaş, Y.; Aytan, Ü. Microplastics in Honey from Türkiye: Occurrence, Characteristic, Human Exposure, and Risk Assessment. J. Food Compos. Anal. 2024, 135, 106646. [Google Scholar] [CrossRef] [Scilit]
  20. Visentin, E.; Manuelian, C.L.; Niero, G.; Benetti, F.; Perini, A.; Zanella, M.; Pozza, M.; De Marchi, M. Characterization of Microplastics in Skim-Milk Powders. J. Dairy Sci. 2024, 107, 5393–5401. [Google Scholar] [CrossRef] [Scilit] [PubMed]
  21. Buyukunal, S.K.; Zipak, S.R.; Muratoglu, K. Microplastics in a Traditional Turkish Dairy Product: Ayran. Pol. J. Food Nutr. Sci. 2023, 73, 139–150. [Google Scholar] [CrossRef] [Scilit]
  22. Habib, R.Z.; Al Kindi, R.; Al Salem, F.; Faris Kittaneh, W.; Poulose, V.; Haris Iftikhar, S.; Mourad, A.-H.I.; Thiemann, T. Microplastic Contamination of Chicken Meat and Fish through Plastic Cutting Boards. Int. J. Environ. Res. Public Health 2022, 19, 13442. [Google Scholar] [CrossRef] [Scilit] [PubMed]
  23. Oliveri Conti, G.; Ferrante, M.; Banni, M.; Favara, C.; Nicolosi, I.; Cristaldi, A.; Fiore, M.; Zuccarello, P. Micro- and Nano-Plastics in Edible Fruit and Vegetables. The First Diet Risks Assessment for the General Population. Environ. Res. 2020, 187, 109677. [Google Scholar] [CrossRef] [Scilit] [PubMed]
  24. Piyawardhana, N.; Weerathunga, V.; Chen, H.S.; Guo, L.; Huang, P.J.; Ranatunga, R.R.M.K.P.; Hung, C.C. Occurrence of Microplastics in Commercial Marine Dried Fish in Asian Countries. J. Hazard. Mater. 2022, 423, 127093. [Google Scholar] [CrossRef] [Scilit] [PubMed]
  25. Ramaremisa, G.; Erasmus, R.M.; Tutu, H.; Saad, D. Occurrence and Characteristics of Microplastics in South African Beverages. Environ. Pollut. 2025, 365, 125388. [Google Scholar] [CrossRef] [Scilit] [PubMed]
  26. Hoseinzadeh, E.; Hossini, H.; Makhdoumi, P.; taha, P.; Parsa, S.; Massahi, T. Microplastics Contamination in Popular Soft Drinks and Non-Alcoholic Beverages Marketed in Iran: Quantity and Characteristics. Results Eng. 2024, 24, 103158. [Google Scholar] [CrossRef] [Scilit]
  27. Wang, Y.; Wang, Y. Assessing Microplastic Contamination in Soda Beverages: A Multi-City, Multi-Container Laser Direct Infrared Spectroscopy Study. Heliyon 2024, 10, 32805. [Google Scholar] [CrossRef] [Scilit] [PubMed]
  28. Kadac-Czapska, K.; Jutrzenka Trzebiatowska, P.; Mazurkiewicz, M.; Kowalczyk, P.; Knez, E.; Behrendt, M.; Mahlik, S.; Zaleska-Medynska, A.; Grembecka, M. Isolation and Identification of Microplastics in Infant Formulas—A Potential Health Risk for Children. Food Chem. 2024, 440, 138246. [Google Scholar] [CrossRef] [Scilit] [PubMed]
  29. Visentin, E.; Niero, G.; Benetti, F.; Perini, A.; Zanella, M.; Pozza, M.; De Marchi, M. Preliminary Characterization of Microplastics in Beef Hamburgers. Meat Sci. 2024, 217, 109626. [Google Scholar] [CrossRef] [Scilit] [PubMed]
  30. Battaglini, E.; Miralles, P.; Lotti, N.; Soccio, M.; Fiorini, M.; Coscollà, C. Analysis of Microplastics in Commercial Vegetable Edible Oils from Italy and Spain. Food Chem. 2024, 443, 138567. [Google Scholar] [CrossRef] [Scilit] [PubMed]
  31. Guo, X.; Dai, H.; Gukowsky, J.; Tan, X.; He, L. Detection and Quantification of Microplastics in Commercially Bottled Edible Oil. Food Packag. Shelf Life 2023, 38, 101122. [Google Scholar] [CrossRef] [Scilit]
  32. Setyobudi, R.H.; Anwar, S.; Garfansa, M.P.; Liwang, T.; Iswahyudi, I.; Damat, D.; Savitri, E.S.; Wahono, S.K.; Latipun, L.; Adinurani, P.G.; et al. Microplastic Debris in Palm Cooking Oil: A Call for Research. BIO Web Conf. 2024, 104, 00037. [Google Scholar] [CrossRef] [Scilit]
  33. Canha, N.; Jafarova, M.; Grifoni, L.; Gamelas, C.A.; Alves, L.C.; Almeida, S.M.; Loppi, S. Microplastic Contamination of Lettuces Grown in Urban Vegetable Gardens in Lisbon (Portugal). Sci. Rep. 2023, 13, 14278. [Google Scholar] [CrossRef] [Scilit] [PubMed]
  34. Tirkey, A.; Upadhyay, L.S.B. Microplastics: An Overview on Separation, Identification and Characterization of Microplastics. Mar. Pollut. Bull. 2021, 170, 112604. [Google Scholar] [CrossRef] [Scilit] [PubMed]
  35. Forgione, E.R.; Ferry, C.; Neumann, B.; Good, K.D. Initiating Environmental Microplastics Analysis: A Review and Planning Guide with Practical Insights from Laboratory Implementation. Sci. Total Environ. 2026, 1014, 181220. [Google Scholar] [CrossRef] [Scilit] [PubMed]
  36. Schymanski, D.; Oßmann, B.E.; Benismail, N.; Boukerma, K.; Dallmann, G.; von der Esch, E.; Fischer, D.; Fischer, F.; Gilliland, D.; Glas, K.; et al. Analysis of Microplastics in Drinking Water and Other Clean Water Samples with Micro-Raman and Micro-Infrared Spectroscopy: Minimum Requirements and Best Practice Guidelines. Anal. Bioanal. Chem. 2021, 413, 5969. [Google Scholar] [CrossRef] [Scilit] [PubMed]
  37. Aloia, R.; Annunziata, L.; Di Giacinto, F.; De Simone, S.; Profico, C.; Fanelli, I.; Di Francesco, G.; Mussi, V.; Scortichini, G. Application of Raman Spectroscopy for the Analysis of Microplastics in Food and Beverages: A Comprehensive Review. Appl. Spectrosc. Rev. 2026, 61, 213–247. [Google Scholar] [CrossRef] [Scilit]
  38. Huang, M.; Si, C.; Qiu, C.; Wang, G. Microplastics Analysis: From Qualitative to Quantitative. Environ. Sci. Adv. 2024, 3, 1652–1668. [Google Scholar] [CrossRef] [Scilit]
  39. Giri, S.; Lamichhane, G.; Khadka, D.; Devkota, H.P. Microplastics Contamination in Food Products: Occurrence, Analytical Techniques and Potential Impacts on Human Health. Curr. Res. Biotechnol. 2024, 7, 100190. [Google Scholar] [CrossRef] [Scilit]
  40. Anshari, R.; Tsuboi, M.; Sato, H.; Tashiro, K.; Ozaki, Y. Raman and ATR-FTIR Unmask Crystallinity Changes and Carboxylate Group and Vinyl Group Accumulation in Natural Weathering Polypropylene Microplastics. Sci. Rep. 2025, 15, 2518. [Google Scholar] [CrossRef] [Scilit] [PubMed]
  41. Asma, A.; Salem Fouad, C.; Nourelhouda, B.; Wassima, Y.; Mohammed, S. Weathering of Greenhouses Plastic Films in Different Exposure Periods. J. Geo. Chem. Soc. 2021, 1, 52–58. [Google Scholar]
  42. Brandão, J.A.O.; Morisso, F.D.P.; Francisquetti, E.L.; Santana, R.M.C. FTIR as a Tool to Evaluate the Photooxidative Degradation of Polyethylene. 16th Brazilian Polymer Conference (CBPOL 2021), Ouro Preto, Brazil, 24–28 October 2021. [Google Scholar]
  43. Entezari, S.; Ganjidoust, H.; Yamini, Y.; Ayati, B. A Peak Comparison Index Approach for Robust Microplastic Analysis across Environmental Matrices: Validation Using Meat Products. Sci. Rep. 2025, 16, 1687. [Google Scholar] [CrossRef] [Scilit] [PubMed]
  44. Kadac-Czapska, K.; Bochentyn, B.; Maślarz, A.; Mahlik, S.; Grembecka, M. Methodology Approach for Microplastics Isolation from Samples Containing Sucrose. Molecules 2024, 29, 3996. [Google Scholar] [CrossRef] [Scilit] [PubMed]
  45. Schiano, M.E.; D’Auria, L.J.; D’Auria, R.; Seccia, S.; Rofrano, G.; Signorelli, D.; Sansone, D.; Caprio, E.; Albrizio, S.; Cocca, M. Microplastic Contamination in the Agri-Food Chain: The Case of Honeybees and Beehive Products. Sci. Total Environ. 2024, 948, 174698. [Google Scholar] [CrossRef] [Scilit] [PubMed]
  46. Pirsaheb, M.; Nouri, M.; Massahi, T.; Makhdoumi, P.; Baban, N.A.; Hossini, H. Microplastics Contamination in the Most Popular Brands of Iranian Sausages and Evaluation of Its Human Exposure. Heliyon 2024, 10, e34363. [Google Scholar] [CrossRef] [Scilit] [PubMed]
  47. Banica, A.L.; Radulescu, C.; Stirbescu, R.M.; Dulama, I.D.; Bucurica, I.A.; Stanescu, S.G.; Stribescu, N.M. Microplastics Contamination of Dairy Products with High-Fat Content-Occurrence and Associated Risks. U.P.B. Sci. Bull. Ser. B 2024, 86, 85–108. [Google Scholar]
  48. Wang, C.; Liang, S.; Bai, L.; Gu, X.; Jin, X.; Ok, Y.S.; Gu, C. Photoaging of Typical as Affected by Air Humidity: Mechanistic Insights into the Important Role of Water. Environ. Sci. Technol. 2023, 57, 5967–5977. [Google Scholar] [CrossRef] [Scilit] [PubMed]
  49. Hamann, L.; Reuß, C.; Herzog, H.; Schreiber, K.; Geitner, C.; Blanke, A. A Self-Cleaning, Bio-Inspired High Retention Filter for a Major Entry Path of Microplastics. npj Emerg. Contam. 2025, 1, 18. [Google Scholar] [CrossRef] [Scilit]
  50. Amirah Mohd Napi, N.N.; Ibrahim, N.; Adli Hanif, M.; Hasan, M.; Dahalan, F.A.; Syafiuddin, A.; Boopathy, R. Column-Based Removal of High Concentration Microplastics in Synthetic Wastewater Using Granular Activated Carbon. Bioengineered 2023, 14, 2276391. [Google Scholar] [CrossRef] [Scilit] [PubMed]
  51. Shafea, L.; Carlos, A.Y.R.; Goebel, M.O.; Woche, S.K.; Felde, V.J.M.N.L.; Sauheitl, L.; Peth, S. Microplastics Recovery from Soil by Density Separation: Application at Pristine and UV-Aged Particles Differing in Surface Properties. Microplast. Nanoplast. 2026, 6, 36. [Google Scholar] [CrossRef] [Scilit]
  52. Campanale, C.; Savino, I.; Massarelli, C.; Uricchio, V.F. Fourier Transform Infrared Spectroscopy to Assess the Degree of Alteration of Artificially Aged and Environmentally Weathered Microplastics. Polymers 2023, 15, 911. [Google Scholar] [CrossRef] [Scilit] [PubMed]
  53. Kapelewska, J.; Klekotka, U.; Żadziłko, E.; Karpińska, J. Simultaneous Sorption Behaviors of UV Filters on the Virgin and Aged Micro-High-Density Polyethylene under Environmental Conditions. Sci. Total Environ. 2021, 789, 147979. [Google Scholar] [CrossRef] [Scilit] [PubMed]
  54. Commission Delegated Decision (EU) 2024/1441 of 11 March 2024 Supplementing Directive (EU) 2020/2184 of the European Parliament and of the Council by Laying down a Methodology to Measure Microplastics in Water Intended for Human Consumption (Notified Under Document C(2024) 1459) (Text with EEA Relevance). Available online: https://eur-lex.europa.eu/eli/dec_del/2024/1441/oj/eng (accessed on 12 August 2026).
  55. Lee, H.B.; Lee, K.S.; Kim, S.J.; Choi, B.I.; Go, B.R.; Rhu, C.J.; Han, T.H. Effect of Chemical Agents on the Morphology and Chemical Structures of Microplastics. Polymers 2022, 14, 4353. [Google Scholar] [CrossRef] [Scilit] [PubMed]
  56. Gulmine, J.V.; Janissek, P.R.; Heise, H.M.; Akcelrud, L. Polyethylene Characterization by FTIR. Polym. Test. 2002, 21, 557–563. [Google Scholar] [CrossRef] [Scilit]
  57. Morent, R.; De Geyter, N.; Leys, C.; Gengembre, L.; Payen, E. Comparison between XPS- and FTIR-Analysis of Plasma-Treated Polypropylene Film Surfaces. Surf. Interface Anal. 2008, 40, 597–600. [Google Scholar] [CrossRef] [Scilit]
  58. Ceretti, D.V.A.; Edeleva, M.; Cardon, L.; D’hooge, D.R. Molecular Pathways for Polymer Degradation during Conventional Processing, Additive Manufacturing, and Mechanical Recycling. Molecules 2023, 28, 2344. [Google Scholar] [CrossRef] [Scilit] [PubMed]
  59. Trofimchuk, E.; Ostrikova, V.; Ivanova, O.; Moskvina, M.; Plutalova, A.; Grokhovskaya, T.; Shchelushkina, A.; Efimov, A.; Chernikova, E.; Zhang, S.; et al. Degradation of Structurally Modified Polylactide under the Controlled Composting of Food Waste. Polymers 2023, 15, 4017. [Google Scholar] [CrossRef] [Scilit] [PubMed]
  60. Soursou, V.; Campo, J.; Picó, Y. A Critical Review of the Novel Analytical Methods for the Determination of Microplastics in Sand and Sediment Samples. TrAC 2023, 166, 117190. [Google Scholar] [CrossRef] [Scilit]
  61. Kumar, R.; Sharma, P.; Verma, A.; Jha, P.K.; Singh, P.; Gupta, P.K.; Chandra, R.; Vara Prasad, P.V. Effect of Physical Characteristics and Hydrodynamic Conditions on Transport and Deposition of Microplastics in Riverine Ecosystem. Water 2021, 13, 2710. [Google Scholar] [CrossRef] [Scilit]
  62. Grison, V.; Romanzini, D.; Dias, R.R.; Pereira, I.M.; Zattera, A.J.; Piazza, D. Combined Effect of Montmorillonite Cloisite 30B and Graphene Nanoplatelets on High-Density Polyethylene Matrix under High Strain Rate Dynamic Compression. J. Appl. Polym. Sci. 2024, 141, e55870. [Google Scholar] [CrossRef] [Scilit]
  63. Rocha, L.A.L.; Portela, H.A.; Calderari, M.R.d.C.M.; de Araújo, F.V. Assessment of Macro-, Meso-and Microplastics in Wild and Cultivated Perna Perna Mussels (Mollusca: Bivalvia). Sci. Mar. 2025, 89, e094. [Google Scholar] [CrossRef] [Scilit]
  64. Pena-Pereira, F.; Wojnowski, W.; Tobiszewski, M. AGREE-Analytical GREEnness Metric Approach and Software. Anal. Chem. 2020, 92, 10076–10082. [Google Scholar] [CrossRef] [Scilit] [PubMed]
  65. Pham, D.T.; Park, H.J.; Mohamed, D.F.M.S.; Kim, P.G.; Tarafdar, A.; Kwon, J.H. Greenness of Analytical Methods for Isolation and Identification of Microplastics in Environmental and Food Samples—A Critical Review. Trends Anal. Chem. 2023, 167, 117263. [Google Scholar] [CrossRef] [Scilit]
  66. Kumar, V.; Sharma, N.; Umesh, M.; Gupta, P.; Sharma, P.; Basheer, T.; Huligowda, L.K.D.; Thomas, J.; Bhagat, S.K.; Pasrija, R. Microplastics in Food: Occurrence, Toxicity, Green Analytical Detection Methods and Future Challenges. Green Anal. Chem. 2024, 11, 100152. [Google Scholar] [CrossRef] [Scilit]
Figure 2. Recovery of (a) PE MPs after treatment with chemical reagents, (b) PE MPs after treatment with Milli-Q water, (c) PP MPs after treatment with chemical reagents, and (d) PP MPs after treatment with Milli-Q water.
Applsci 16 09936 g002
Figure 3. Optical microscopy images showing the morphology of PE and PP MPs (PE and PP MPs are marked with blue circles).
Applsci 16 09936 g003
Figure 4. SEM images of PE and PP MPs treated with Milli-Q water at 40, 60, and 100 °C for 45 min, compared with untreated reference samples (×25,000; ×2500)—(a) PE MPs reference sample; (b) PE MPs at 40 °C; (c) PE MPs at 60 °C; (d) PE MPs at 100 °C; (e) PP MPs reference sample; (f) PP MPs at 40 °C; (g) PP MPs at 60 °C; (h) PP MPs at 100 °C.
Applsci 16 09936 g004
Figure 5. SEM images of PE MPs treated with chemical reagents at 40 and 60 °C for 45 min, compared with the untreated reference sample (×25,000)—(a) PE MPs reference sample; (b) PE MPs at 40 °C, 5% HNO3; (c) PE MPs at 60 °C, 5% HNO3; (d) PE MPs at 60 °C, 10% HNO3; (e) PE MPs at 40 °C, 5% HCl; (f) PE MPs at 60 °C, 5% HCl; (g) PE MPs at 60 °C, 10% HCl; (h) PE MPs at 40 °C, 5% KOH; (i) PE MPs at 60 °C, 5% KOH; (j) PE MPs at 60 °C, 10% KOH; (k) PE MPs at 40 °C, 5% H2O2; (l) PE MPs at 60 °C, 5% H2O2; (m) PE MPs at 60 °C, 10% H2O2; (n) PE MPs at 40 °C, 5% EtOH; (o) PE MPs at 60 °C, 5% EtOH; (p) PE MPs at 60 °C, 10% EtOH.
Applsci 16 09936 g005
Figure 6. SEM images of PP MPs treated with chemical reagents at 40 and 60 °C for 45 min, compared with the untreated reference sample (×2500; ×1000; ×500)—(a) PP MPs reference sample; (b) PP MPs at 40 °C, 5% HNO3; (c) PP MPs at 60 °C, 10% HNO3; (d) PP MPs at 40 °C, 5% HCl; (e) PP MPs at 60 °C, 10% HCl; (f) PP MPs at 40 °C, 5% KOH; (g) PP MPs at 60 °C, 10% KOH; (h) PP MPs at 40 °C, 5% H2O2; (i) PP MPs at 60 °C, 10% H2O2; (j) PP MPs at 40 °C, 5% EtOH; (k) PP MPs at 60 °C, 10% EtOH.
Applsci 16 09936 g006
Figure 7. µ-FTIR spectra of PE MPs after treatment with (a) Milli-Q water at 40, 60, and 100 °C; (b) 5% reagents at 40 °C; (c) 5% reagents at 60 °C; and (d) 10% reagents at 60 °C.
Applsci 16 09936 g007
Figure 8. Degradation-related indices of PE MPs: (a) CI; (b) HI; (c) COI; and (d) CI, HI, and COI of PE MPs treated with Milli-Q water at 40, 60, and 100 °C.
Applsci 16 09936 g008
Figure 9. Crystallinity index of (a) PE MPs treated with chemical reagents at 40 and 60 °C; (b) PE MPs treated with Milli-Q water at 40, 60, and 100 °C; (c) PP MPs treated with chemical reagents at 40 and 60 °C; and (d) PP MPs treated with Milli-Q water at 40, 60, and 100 °C.
Applsci 16 09936 g009
Figure 10. µ-FTIR spectra of PP MPs after treatment with (a) Milli-Q water at 40, 60, and 100 °C; (b) 5% reagents at 40 °C; and (c) 10% reagents at 60 °C.
Applsci 16 09936 g010
Figure 11. Degradation-related indices of PP MPs: (a) CI; (b) HI; (c) COI; and (d) CI, HI, and COI of PP MPs treated with Milli-Q water at 40, 60, and 100 °C.
Applsci 16 09936 g011
Table 1. Experimental conditions used for the treatment of PE MPs.
Type of MPsTemperatureTest SolutionIncubation Time
Polyethylene40 ± 2 °CMilli-Q water45 min
60 ± 2 °C
100 ± 5 °C
40 ± 2 °C5% (v/v) HNO3
5% (v/v) HCl
5% (v/v) H2O2
5% (w/v) KOH
5% (v/v) EtOH
60 ± 2 °C5% (v/v) HNO3
5% (v/v) HCl
5% (v/v) H2O2
5% (w/v) KOH
5% (v/v) EtOH
10% (v/v) HNO3
10% (v/v) HCl
10% (v/v) H2O2
10% (w/v) KOH
10% (v/v) EtOH
Abbreviations: MPs—microplastics; (v/v)—volume/volume; (w/v)—weight/volume; HNO3—nitric acid; HCl—hydrochloric acid; H2O2—hydrogen peroxide; KOH—potassium hydroxide; EtOH—ethanol.
Table 2. Experimental conditions used for the treatment of PP MPs.
Type of MPsTemperatureTest SolutionIncubation Time
Polypropylene40 ± 2 °CMilli-Q water45 min
60 ± 2 °C
100 ± 5 °C
40 ± 2 °C5% (v/v) HNO3
5% (v/v) HCl
5% (v/v) H2O2
5% (w/v) KOH
5% (v/v) EtOH
60 ± 2 °C10% (v/v) HNO3
10% (v/v) HCl
10% (v/v) H2O2
10% (w/v) KOH
10% (v/v) EtOH
Abbreviations: MPs—microplastics; (v/v)—volume/volume; (w/v)—weight/volume; HNO3—nitric acid; HCl—hydrochloric acid; H2O2—hydrogen peroxide; KOH—potassium hydroxide; EtOH—ethanol.
Table 3. Spectroscopic indices associated with potential polymer degradation and crystallinity calculated for PE and PP MPs.
IndicesPE MPsPP MPs
Carbonyl Index (CI)
[-]
Abs (1770–1700)/Abs (1495–1423)Abs (1735–1715)/Abs (1460)
Hydroxyl Index (HI)
[-]
Abs (3353–3021)/Abs (1504–1467)Abs (3400–3300)/Abs (986–952)
Carbon–Oxygen Index (COI)
[-]
Abs (1197–924)/Abs (2987–2866)Abs (1200–1000)/Abs (2940–2885)
Crystallinity Index
[%]
[Abs (730)/Abs (720)] × 100[Abs (998)/Abs (973)] × 100
Abbreviations: Abs—absorbance; PE MPs—polyethylene microplastics; PP MPs—polypropylene microplastics.
Disclaimer/Publisher’s Note: The statements, opinions and data contained in all publications are solely those of the individual author(s) and contributor(s) and not of MDPI and/or the editor(s). MDPI and/or the editor(s) disclaim responsibility for any injury to people or property resulting from any ideas, methods, instructions or products referred to in the content.