Article

Human-Centered Visualization of Multidimensional Electromagnetic Information for Aviation: Effects of Visual Encoding and Spatial Layout

1
National Key Laboratory of Avionics Integration and Aviation System-of-Systems Synthesis, Shanghai 200241, China
2
China Aeronautical Radio Electronics Research Institute, Shanghai 200241, China
3
School of Mechanical Engineering, Southeast University, Nanjing 211189, China
*
Authors to whom correspondence should be addressed.
Appl. Sci. 2026, 16(19), 9427; https://doi.org/10.3390/app16199427 (registering DOI)
Submission received: 30 July 2026 / Revised: 15 September 2026 / Accepted: 21 September 2026 / Published: 22 September 2026
(This article belongs to the Special Issue Human-Centered Design in Wearable Technology)

Abstract

Aviation electromagnetic (EM) interfaces present complex, time-varying information and require designs that minimize unnecessary cognitive demands. However, evidence on how visual encoding and spatial layout affect performance in dynamic EM tasks remains limited. This study compared two dimensions of visual encoding (radar-range and target-threat) and two spatial layouts using a 2 × 2 × 2 repeated-measures design with 32 participants. A Unity 3D simulation incorporated concurrent target recognition and EM situation monitoring tasks. Reaction time, accuracy, NASA Task Load Index (NASA-TLX), interface preferences, and eye-tracking metrics were collected. Target-threat encoding significantly affected target-recognition accuracy, with border-thickness threat encoding outperforming color-background encoding, whereas reaction time did not differ significantly. Radar-range encoding significantly influenced EM monitoring, with the grid encoding producing shorter reaction times than the color-overlay. Target-threat encoding and spatial layout significantly affected subjective workload. The grid-based radar sector combined with border-thickness threat encoding and the center layout was the most frequently preferred interface. Eye-tracking metrics and heatmaps further indicated that the center layout facilitated faster visual attention to the EM indicator, accompanied by fewer total fixations and lower gaze entropy after anomaly onset. These findings support perceptually separable target encoding and task-centered placement of high-priority EM information may inform future helmet-mounted and other wearable displays for dynamic, safety-critical tasks.

1. Introduction

Driven by rapid advancements in information and sensor technologies, modern aviation operations are increasingly reliant on the electromagnetic (EM) spectrum. Consequently, the complexity of aviation EM environment data has grown exponentially, characterized by highly coupled, multivariable, and large-scale spatiotemporal data. This inherent complexity renders the effective visualization of EM fields a formidable technical challenge [1].
To manage this complexity, modern human–machine interfaces are required to simultaneously present fundamental flight parameters alongside real-time EM data that accurately reflects congested and dynamic airspaces [2]. However, the composite display of this multi-source information imposes severe cognitive loads on human operators, placing high demands on their visual attention and rapid information processing capabilities under extreme time constraints [3,4]. Therefore, scientific EM visualization strategies that inherently account for human cognitive capability are critical to enhancing human–machine collaborative decision-making in the aviation industry.
To effectively mitigate operator cognitive load, user-centered visualization is founded upon two primary design pillars: visual coding strategies [5] and structural interface layout [6]. In the context of the aviation EM environment, visual coding requires synthesizing an immense volume of multi-source data into an intuitive format. To prevent cognitive overload, an effective interface design distills this complexity into several fundamental dimensions [7]. The spatial dimension, anchored by radar detection ranges, delineates the geometric boundaries indispensable for tactical path planning. The energy dimension conveys instantaneous operational risks and interference intensity through EM field strength. Concurrently, the frequency dimension monitors spectrum occupancy to track resource allocation and pinpoint potential signal conflicts, while the temporal dimension reflects the continuous dynamic evolution of EM signals.
Furthermore, the attribute dimension provides critical contextual cues by classifying the discrete threat levels of detected targets. Beyond the distinct visual encoding of these parameters, the spatial layout of the interface is also paramount. For instance, Shao et al. [8] demonstrated that the dynamic information layout within spatial interfaces fundamentally dictates users’ visual search performance and reaction times. Building on this, Zhang et al. [9] established that optimizing layout order, specifically the strategic positioning of core visual components, significantly mitigates the adverse cognitive effects of high interface complexity.
However, there is a lack of empirical research providing a comprehensive cognitive evaluation of these multidimensional EM visualization strategies under dynamic operational conditions. Future interface development would benefit from a rigorous, objective perspective on this area. To address this gap, this study proposes a human-centered visualization approach tailored for complex aviation EM environments. The primary objective of this research is to empirically evaluate how multidimensional visual encodings and spatial layouts affect operator information acquisition under dynamic, concurrent task demands. Specifically, we hypothesized that variations in visual encoding strategies and the spatial layout of EM indicators would significantly influence operators’ visual search efficiency, task performance, and subjective mental workload.
To test these hypotheses, we first designed multi-dimensional visual encodings and spatial layouts to translate abstract EM data into intuitive graphical representations. To examine information acquisition under dynamic, concurrent task demands, an aviation task simulation was constructed utilizing the Unity 3D engine. Within this simulated operational environment, we conducted a simulation experiment to investigate how different visual strategies impact operator performance. By analyzing behavioral data (reaction time and accuracy), visual attention patterns, and subjective cognitive load assessments via the NASA Task Load Index (NASA-TLX), we empirically identified the most effective EM visualization design. Ultimately, this research bridges the gap between technical EM data presentation and human cognitive ergonomics, providing experimental evidence for visualization strategies that support efficient recognition and monitoring of aviation EM information while reducing subjective mental workload.
The remainder of this paper is organized as follows. Section 2 reviews related work. Section 3 details the experimental design, including the visual encoding strategies and the Unity 3D task simulation. Section 4 presents the behavioral and eye-tracking results. Section 5 discusses the main findings and design implications. Lastly, Section 6 offers concluding remarks.

2. Related Work

2.1. Technology-Driven EM Visualization

The current literature on EM visualization predominantly concentrates on technical implementation and system architecture, evaluating success strictly through computational performance rather than human usability. For instance, He et al. [10] focused on rendering efficiency, optimizing ray projection algorithms with bounding box techniques to accelerate the three-dimensional display of complex EM vector fields. Similarly, Shen et al. [11] developed a purely algorithmic approach that maps operating frequency bands to discrete color scales and translates EM energy into brightness levels, aiming to mathematically represent the spatial distribution of EM equipment. Furthermore, Jiang et al. [12] concentrated on environmental modeling, integrating radiation source and wave propagation models within a geographic information system framework to simulate three-dimensional EM situations. More recently, Han [13] developed an onboard EM data visualization system based on MySQL and GIS technologies to correlate EM data with flight parameters. Collectively, these methodologies remain exclusively technology-driven, prioritizing data processing capabilities and graphical rendering speed over the cognitive experience of the end-user.

2.2. Human Factors and Eye-Tracking in Interface Design

To the best of our knowledge, few studies in EM visualization have considered human cognitive performance. The most relevant study was conducted by Zhao et al. [14], who developed a visual analytics system intended to alleviate the cognitive load associated with radio monitoring. Yet, their usability evaluation relied exclusively on subjective expert interviews, lacking rigorous, objective ergonomic assessments. Furthermore, their research primarily addressed routine observation, overlooking the severe cognitive bottlenecks that emerge when operators process rapidly evolving, high-density data streams [15]. Although human factors have been widely integrated into interface visualization research, these investigations are predominantly situated outside the EM domain. While traditional metrics such as reaction time and accuracy serve as fundamental indicators of human performance, they alone cannot reveal exactly how accuracy is compromised or precisely where visual attention is allocated [16].
To overcome this limitation and objectively quantify visual search efficiency and cognitive load, researchers frequently utilize eye-tracking technology. This methodology captures precise, real-time data regarding attentional allocation and visual processing, illuminating the underlying cognitive mechanisms that standard behavioral metrics fail to capture [17,18]. Leveraging this technique, Qu et al. [19] utilized eye-tracking metrics to investigate target search performance under varying time and information pressures. Similarly, Zhang et al. [20] employed eye-tracking to evaluate how highlighting styles and luminance contrast influence visual search in multi-window map interfaces. Zhou et al. [21] collected eye-movement data to systematically assess the impact of interface layout, information density, and icon positioning on users’ cognitive load and task performance during mobile application interactions. In the aviation domain specifically, Jin and Xuan [22] utilized eye-tracking and the NASA-TLX scale to evaluate how shape feature encoding and layout methods affect air traffic controller cognitive load on air traffic control (ATC) surveillance interfaces. Despite offering robust analytical techniques, these non-EM and standard ATC studies frequently rely on highly abstract symbolic stimuli or sequential icon search tasks. Moreover, they generally do not impose the strict temporal constraints necessary to simulate high-stress, dynamic operational environments.

2.3. Summary and Comparisons of Previous Studies

As demonstrated, existing research either focuses on the computational architecture of EM systems without cognitive evaluation, or evaluates cognitive load in non-EM or less dynamic environments. To clearly illustrate the research gaps addressed by the present study, Table 1 provides a structured comparison of related previous works against our proposed approach.
Based on the structured comparison in Table 1, the primary contributions of this study are threefold. First, unlike previous technical EM visualizations [10,13] that ignore human cognition, we explicitly bridge the gap between abstract EM data and human-centered ergonomic design. Second, while existing aviation eye-tracking studies often focus on standard navigational interfaces or sequential air-traffic tasks [22], we specifically evaluate multidimensional visual encodings within a highly congested, multi-threat EM environment. Finally, our experimental design moves beyond routine, static observation [14] by imposing strict time constraints and concurrent task demands (simultaneous target recognition and EM status monitoring). These tasks allowed us to evaluate how visual encoding and spatial layout affect operator information recognition, monitoring responses, and subjective workload. Ultimately, this study intends to identify specific visualization strategies that enhance visual search efficiency and reduce mental workload in complex, simulated aviation EM interfaces.

3. Materials and Methods

3.1. Participants

Thirty-two participants (16 males and 16 females, aged 19 to 27 years) were recruited for the experiment. None of the participants had professional piloting or electronic-warfare experience. All participants reported normal or corrected-to-normal vision and no history of color vision deficiency. Prior to the experiment, written informed consent was obtained from each participant. This study was conducted in accordance with the ethical guidelines of the institution. Upon completion, participants received monetary compensation for their time and sustained engagement throughout the study. An a priori power analysis using G*Power 3.1.9.7 (F-test, repeated measures within factors, effect size f = 0.25, α = 0.05, power = 0.80, 8 measurements) indicated a minimum required sample size of 16. Thus, our recruited sample of 32 participants was adequately powered.

3.2. Experimental Design

A 2 × 2 × 2 repeated-measures design was employed for this study. The independent variables were radar-range encoding (2 levels: grid and color-overlay), target-threat encoding (2 levels: color-background and border-thickness), and spatial layout (2 levels: bottom-left and center), all manipulated within participants, resulting in a total of 8 experimental blocks. The dependent variables included objective task performance, subjective evaluations and qualitative eye-tracking patterns.

3.2.1. EM Visual Encoding and Spatial Layout Design

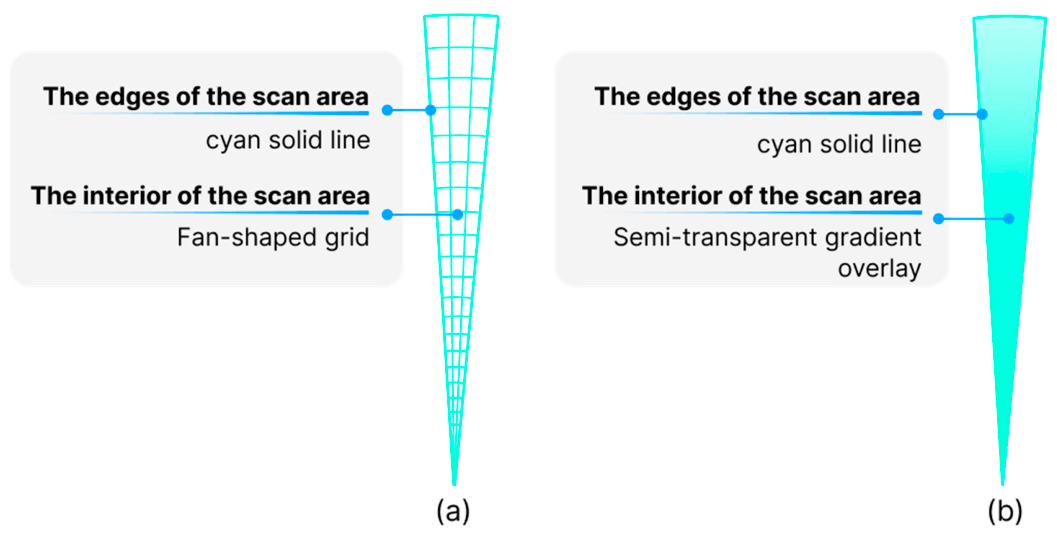
Based on the results of several pilot tests, the spatial and attribute dimensions of the EM environment were encoded as follows. For the spatial dimension, the radar detection ranges were encoded in two alternative formats: (1) a two-dimensional grid sector designed to minimize obstruction of the situational map and reduce visual clutter (Figure 1a), and (2) a color-overlay sector utilizing semi-transparent gradient blocks to intuitively distinguish between scanned and non-scanned areas (Figure 1b).
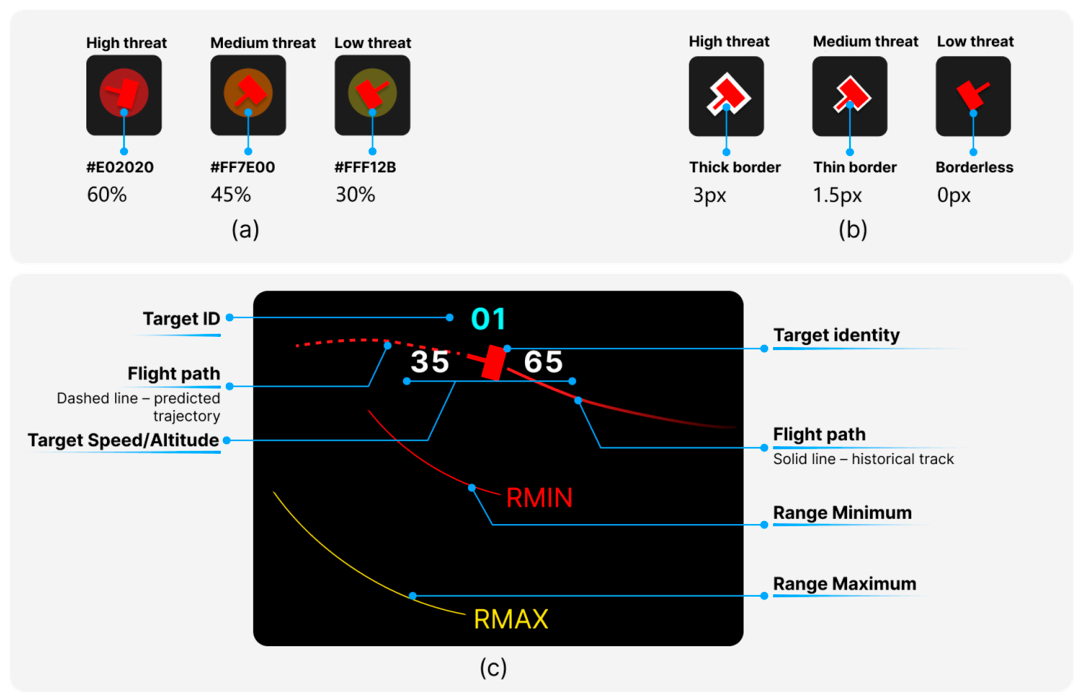
Regarding the attribute dimension, detected targets were represented using one of two design formats. Format 1 employed a semi-transparent background overlaid on the target icon, where red, orange, and yellow denoted high, medium, and low threat levels, respectively (Figure 2a). Format 2 utilized the border thickness of the target icon to indicate the threat level: a thick border for high threat, a thin border for medium threat, and no border for low threat (Figure 2b). Additionally, target identity and status were standardized across conditions: solid red icons represented enemy targets, whereas empty yellow icons denoted unknown targets. Solid lines trailing the target indicated historical flight paths, and dashed lines represented predicted paths based on motion models. Finally, two concentric arcs surrounding the target demarcated the maximum and minimum firing ranges (Figure 2c). The attribute encoding of a target appeared immediately upon its detection by the radar.
Based on these design dimensions, the four specific visual encoding combinations evaluated in this study are defined as follows: Encoding 1 utilizes the grid radar-range with the color-background target-threat; Encoding 2 utilizes the color-overlay radar-range with the color-background target-threat; Encoding 3 utilizes the grid radar-range with the border-thickness target-threat; and Encoding 4 utilizes the color-overlay radar-range with the border-thickness target-threat.
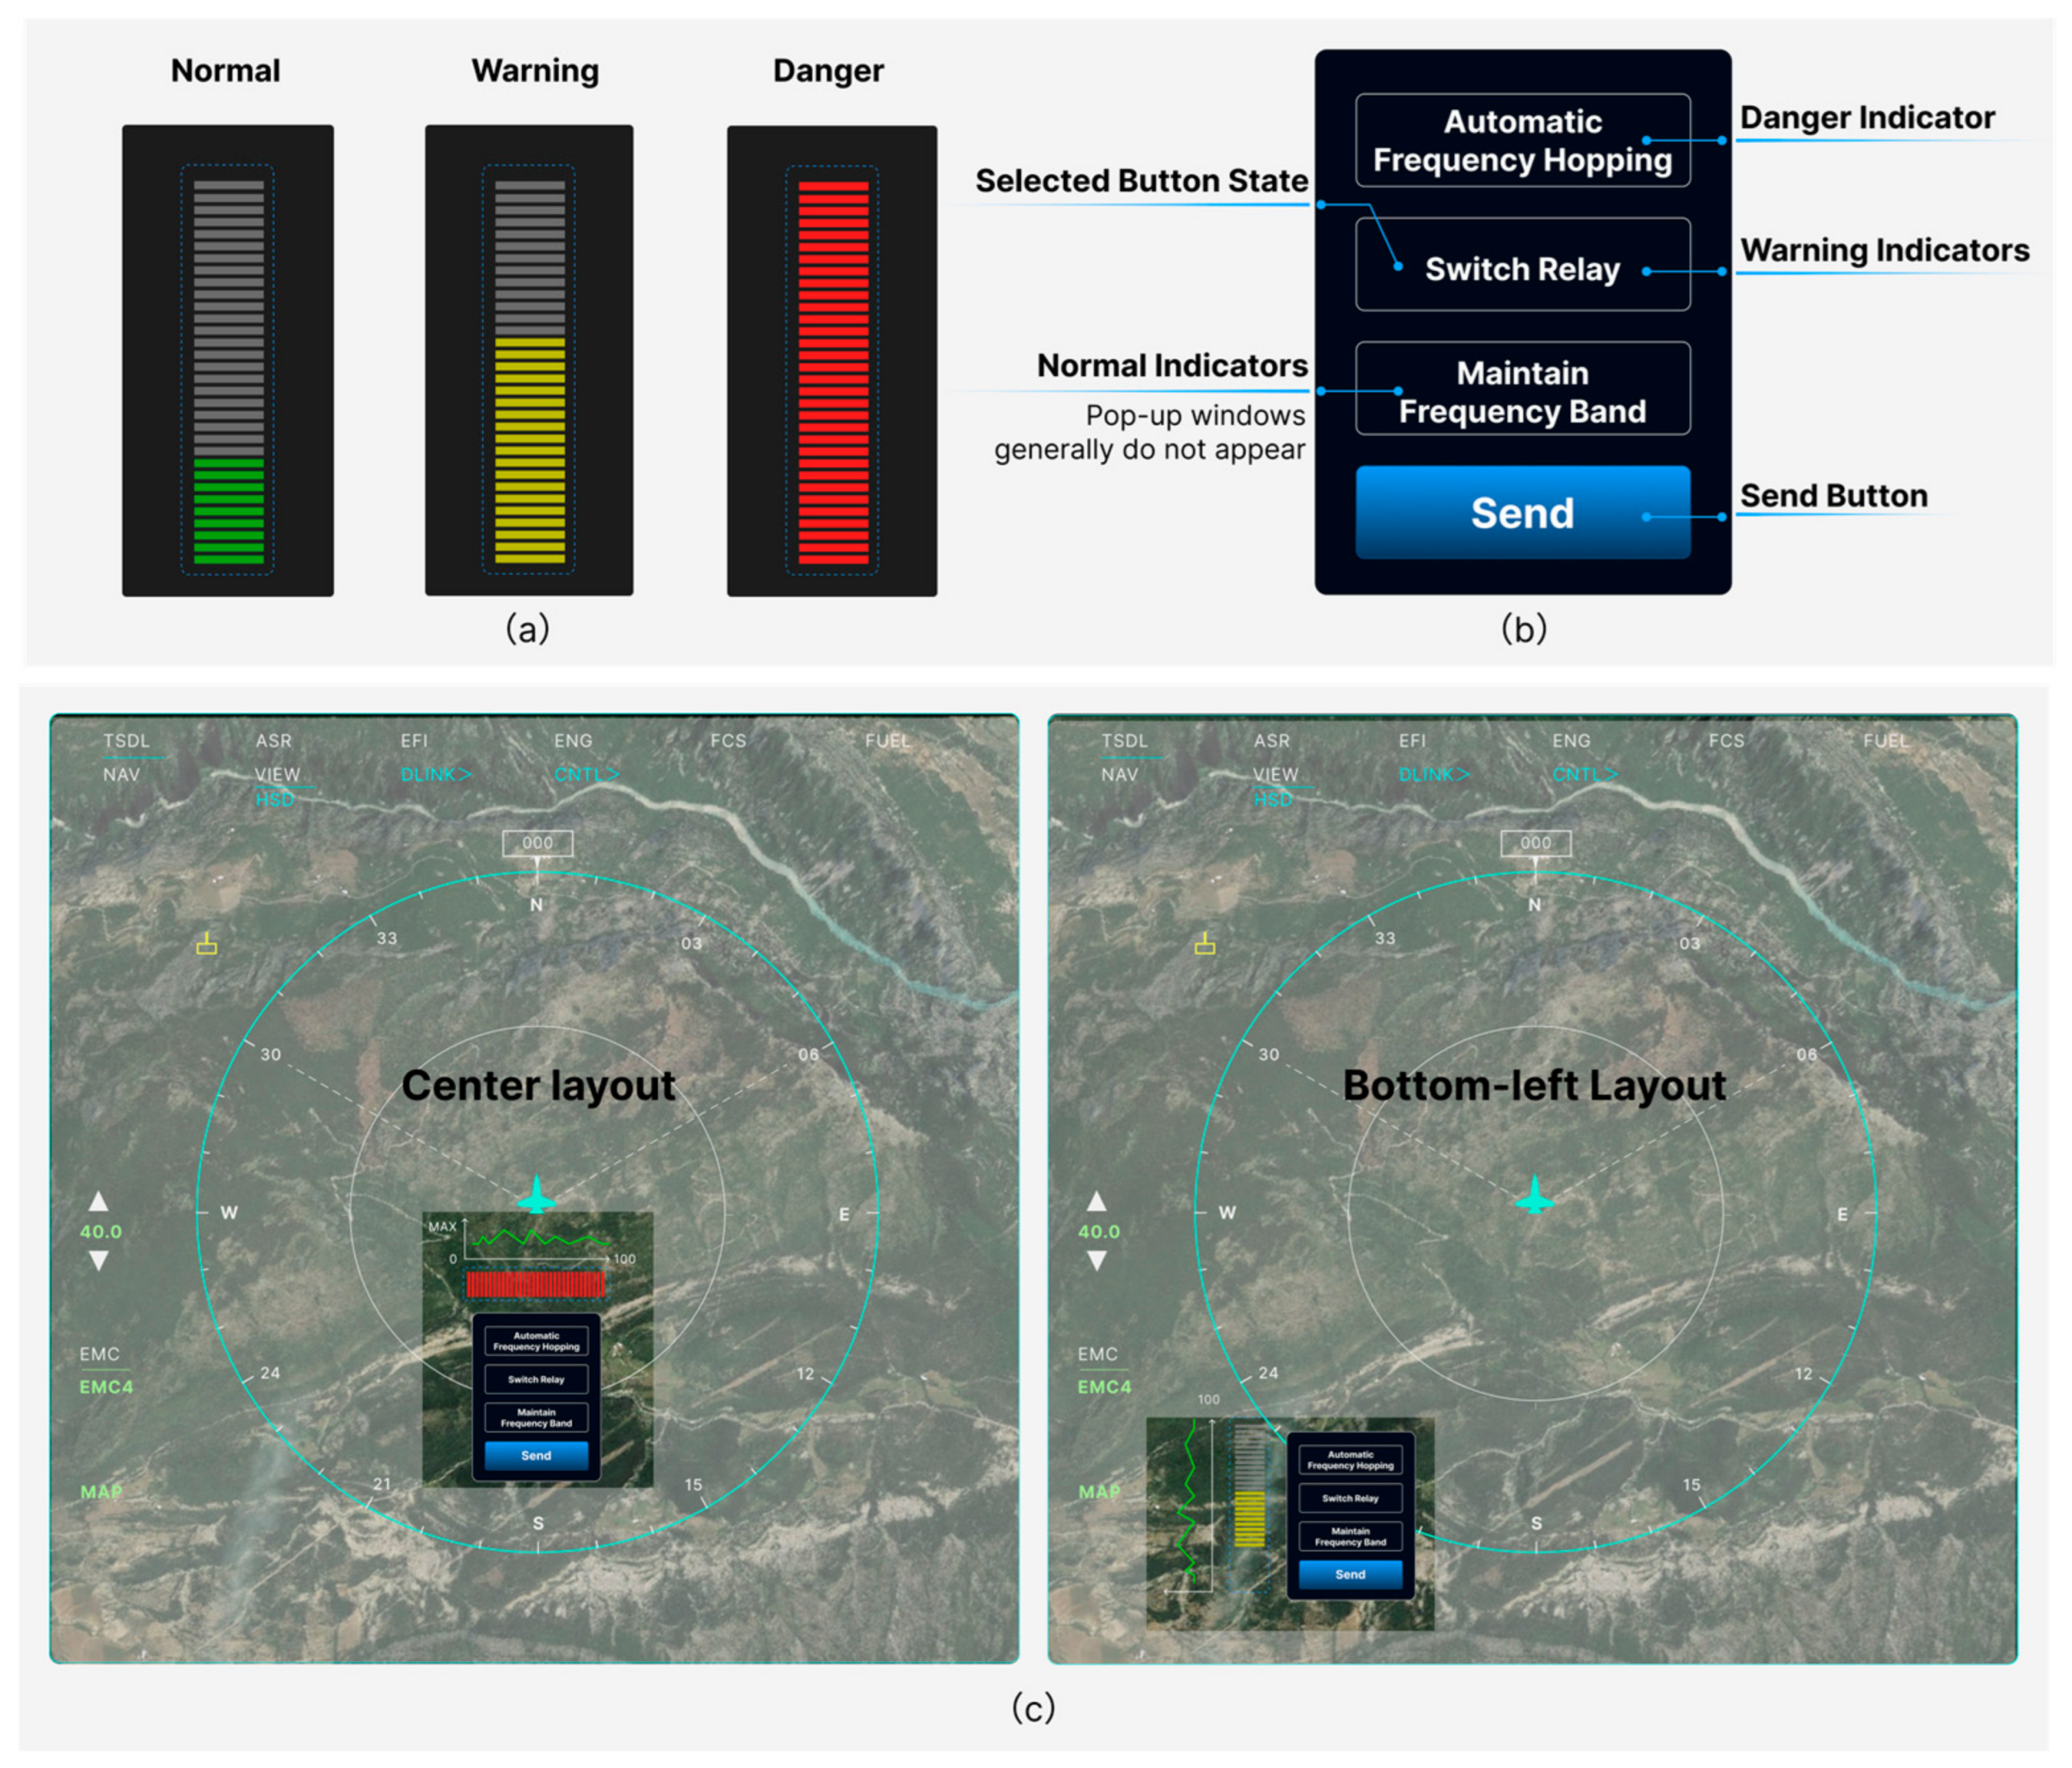
To represent the energy and frequency dimensions, a synthetic EM situational indicator was developed. This indicator was derived through a weighted fusion of parameters, including frequency band occupancy, key frequency band overlap, interference signal power density, and the degree of impact on the ego-aircraft’s operational frequency band. Visually, this indicator utilized color changes to convey the state of the EM environment: green indicated a normal state, while yellow and red indicated varying degrees of anomalies (Figure 3a). Specifically, this indicator was computed as a normalized linear combination of four variables: frequency band occupancy (30%), key frequency band overlap (30%), interference signal power density (20%), and operational impact (20%). The resulting value, ranging from 0 to 1, dictated the indicator’s visual state: values below 0.35 maintained a normal green state, values between 0.35 and 0.75 triggered a yellow warning state, and values exceeding 0.75 triggered a red danger state. Upon detecting an environmental anomaly, an interactive decision window popped up at a fixed location near the indicator (Figure 3b). This window contained three action buttons and a “Send” button. The “Automatic Frequency Hopping” button corresponded to a red anomaly, advising the system or operator to actively evade the interfering frequency bands due to a high-risk EM environment. The “Switch Relay” button corresponded to a yellow anomaly, indicating a moderate interference risk and suggesting a switch to the relay early-warning unit’s perspective for more stable scanning. The “Maintain Frequency Band” button corresponded to the normal green state, indicating a controllable EM environment; this button was primarily included as a baseline option and was rarely required unless the window was triggered unexpectedly. Because this synthetic indicator conveyed high-priority information reflecting the overall EM environment, it was overlaid directly onto the situational map. Two spatial layouts were compared for this indicator: positioned in the bottom-left corner of the interface, or positioned centrally beneath the ego-aircraft (Figure 3c).
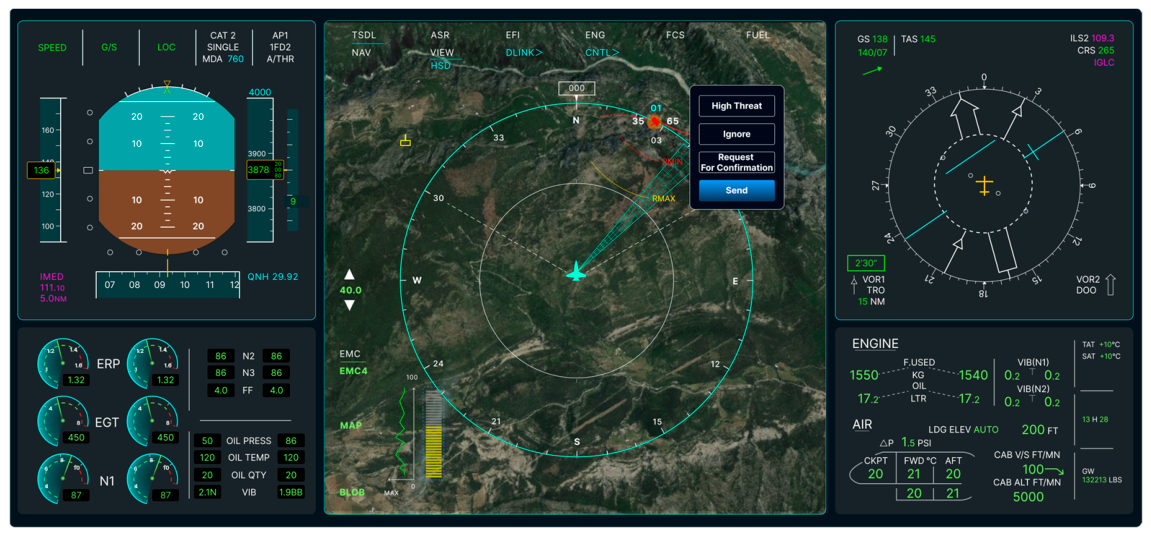
In addition to the aforementioned EM elements, the interface incorporated standard aviation components to ensure ecological validity. These included an aviation situational map, a primary flight display, engine indicating and crew alerting system components, and an electronic centralized aircraft monitor. A complete, representative interface is depicted in Figure 4.

3.2.2. Experimental Task Design

To investigate how visualization strategies support information recognition and monitoring in a dynamic aviation context, the study simulated an aviation detection scenario requiring participants to attend to target information and changing EM conditions concurrently. The experimental task comprised two concurrent sub-tasks.
Sub-task 1 was a target recognition task. During the simulated flight, targets appeared at random locations on the situational map. Once a target entered the ego-aircraft’s radar detection range, its attribute information, including its flight trajectory, firepower envelope, and threat-level visual encodings, became visible. Simultaneously, a task prompt window appeared, requiring participants to identify the target’s threat level from the displayed visual encodings, select the appropriate option, and submit their response.
Sub-task 2 was an EM situation monitoring task. The synthetic indicator, located in a fixed area of the interface (either the bottom-left corner or center), continuously updated to reflect the overall state of the EM environment. Under normal conditions, the indicator remained green, signaling a stable and reliable system state. If the EM environment degraded, the indicator turned yellow or red, signaling a system anomaly. When this occurred, an interactive selection window appeared, prompting the participant to execute and transmit the appropriate command. Crucially, this indicator monitoring task was assigned a higher priority than the target assessment task. Because a compromised spectrum (indicated by a yellow or red state) degraded the system’s detection capabilities and rendered target information potentially unreliable, participants were explicitly instructed to prioritize resolving EM situational anomalies to restore system stability before proceeding with target interpretations.
Each 1 min trial contained exactly 10 predefined airborne targets, with threat levels uniformly distributed. Similarly, EM situational anomalies were introduced at controlled frequencies. Each trial contained 3 yellow warning anomalies and 2 red danger anomalies, with the indicator remaining in a normal green state during the rest periods. To prevent severe learning and anticipation effects, the exact appearance timing of both the targets and the EM anomalies was completely randomized within each trial. Prior to the formal experiment, a pilot test was conducted to verify that all UI elements, visual angles, and color encodings were easily discriminable under these timing constraints.

3.3. Experimental Setup

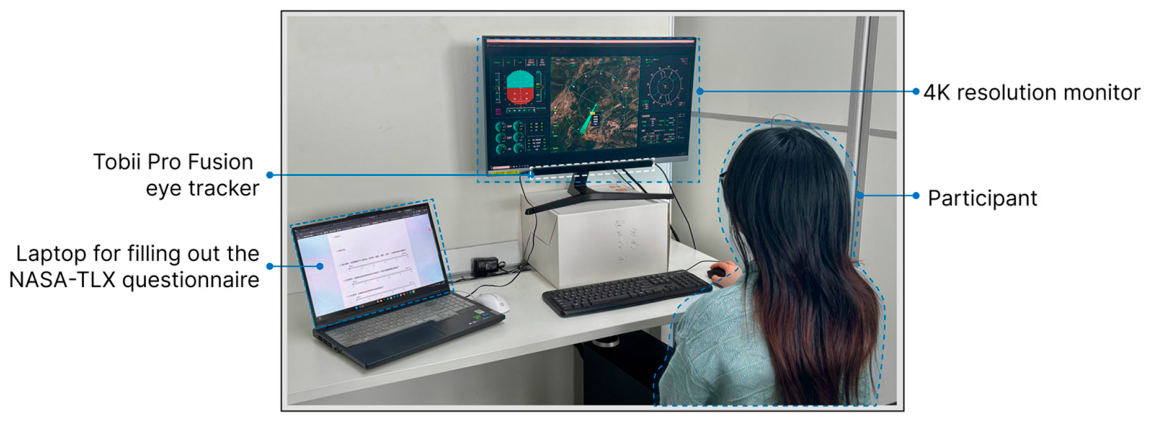
The experimental environment was developed using the Unity 3D engine (version 2022.3.53f1c1) and hosted on a desktop PC equipped with a 4K resolution monitor (U28R550UQC; Tianjin Samsung Electronics Co., Ltd., Tianjin, China). Raw experimental data, including task performance metrics, were encapsulated in real time by the backend code. The system automatically mapped the behavioral data to the corresponding encoding scheme identifiers and exported the results in a structured format (.csv). Eye-tracking data were collected at a sampling rate of 250 Hz using a Tobii Pro Fusion eye tracker (Tobii AB, Stockholm, Sweden) mounted directly beneath the bottom bezel of the monitor. Subjective workload measures (e.g., NASA-TLX) were recorded on a separate laptop. Participants were seated at a standard viewing distance of approximately 60 cm from the monitor. Eye-tracking data were captured using the default Tobii I-VT (Identification by Velocity Threshold) fixation filter parameters provided by the manufacturer. Trials with gaze data loss exceeding 15% due to blinks or track loss were excluded from the analysis to maintain data quality. The overall experimental setup is illustrated in Figure 5.

3.4. Experimental Procedure

Before the formal experiment commenced, the experimenter briefed the participants on the research objectives and standard operating procedures. Once participants understood the task requirements, they completed a series of practice trials to familiarize themselves with the interface layouts and interactive controls. The formal experiment began only after the experimenter confirmed that a participant had fully mastered the procedures.
The formal experiment consisted of 8 conditional blocks. To mitigate potential learning and order effects, the presentation sequence of these blocks was counterbalanced across participants using a Latin square design. Each block comprised 3 trials, with each trial lasting exactly 1 min, simulating a continuous and dynamic flight scenario. Between consecutive trials, participants were required to double-click the spacebar to proceed. This self-paced transition was designed to prevent fatigue accumulation and afford participants a brief period to adjust their cognitive state.
Prior to initiating each experimental block, a standardized calibration was performed using the Tobii Pro Fusion eye tracker (Tobii AB, Stockholm, Sweden) to ensure the accuracy and reliability of the gaze data. During the trials, the system continuously logged participants’ operational behaviors and eye-movement data. After completing each block, participants filled out the NASA-TLX questionnaire on the laptop to evaluate their subjective cognitive workload under that specific condition. Following the standard NASA-TLX procedure, the overall workload score was calculated as a weighted average based on participants’ pairwise comparisons of the six subscales. Upon finishing all 8 blocks, the experimenter conducted a brief interview, asking participants about their most preferred interface and the rationale for their selection.

3.5. Data Analysis

Task performance was evaluated separately for the EM situation monitoring task and the target recognition task. Reaction time was defined as the interval between the onset of a task event and submission of the participant’s response. Prior to analysis, reaction time outliers falling more than three standard deviations from the participant’s mean were excluded. Response accuracy was coded as 1 for a correct response and 0 for an incorrect response. Responses not completed within 5 s were classified as misses and coded as incorrect. To form the dependent variables for both tasks, the trial-level accuracy and reaction time data were aggregated. Specifically, responses across the 30 targets (10 targets per trial × 3 trials) for the recognition task, and the 15 anomalies (5 anomalies per trial × 3 trials) for the monitoring task, were averaged to yield a single continuous accuracy proportion and mean reaction time per participant per experimental condition.
Eye-tracking analysis was conducted to evaluate the effects of interface layout on attentional guidance. The interface was divided into two distinct areas of interest (AOIs): the region displaying the synthetic EM situational indicator, and the remaining area for displaying EM information. The critical event, defined as an EM situation anomaly, served as the temporal reference point. The analysis window was established as the interval from the onset of the anomaly to the completion of the participant’s motor response. Fixation data were subsequently extracted at two critical time points: stimulus onset (the exact moment the anomaly occurred) and 0.25 s post-onset. This 0.25 s threshold was selected because it reflects the standard cognitive baseline for human visual processing time, representing the typical latency required to execute a reactive saccade and establish a fixation following an abrupt visual onset [23,24]. To visualize these patterns, spatial aggregation of the fixation data at these time points was performed to generate eye-tracking heatmaps, mapping the participants’ attention distribution across different interface layout conditions.
To supplement the qualitative heatmaps with quantitative evaluation, three metrics were extracted: time to first fixation (TTFF) on the synthetic indicator, total fixation count, and gaze entropy. Gaze entropy, reflecting the spatial dispersion of visual attention across the two AOIs, was calculated as H = i = 1 2 p i l o g 2 ( p i ) , where p i represents the proportion of fixations falling within each AOI. Due to technical recording errors, eye-tracking data from 3 participants were excluded, resulting in a final sample of 29 participants for this analysis. Paired t-tests were conducted to compare these metrics between the bottom-left and center layouts.
Reaction time, accuracy, and NASA-TLX scores were each analyzed using a 2 × 2 × 2 repeated-measures analysis of variance (ANOVA), with radar-range encoding, target-threat encoding, and spatial layout, each with two levels, as within-participant factors. Because all factors had two levels, the assumption of sphericity was inherently met, and sphericity corrections were not required. Effect sizes were reported as partial eta squared (ηp2). For descriptive interpretation, values of 0.01, 0.06, and 0.14 were considered indicative of small, medium, and large effects, respectively, following conventional benchmarks [25]. Interview responses were summarized as selection frequencies. Statistical significance was set at p < 0.05. Statistical analyses were performed using IBM SPSS Statistics for Windows, Version 27.0 (IBM Corp., Armonk, NY, USA).

4. Results

4.1. Task Performance

4.1.1. Target Recognition Task

For reaction time, the repeated-measures ANOVA revealed that the main effect of radar-range encoding (F(1,31) = 0.884, p = 0.354, ηp2 = 0.028), target-threat encoding (F(1,31) = 1.664, p = 0.207, ηp2 = 0.051) and spatial layout (F(1,31) = 0.931, p = 0.342, ηp2 = 0.029) were not significant. There was also no significant interaction effect among these three factors. The descriptive statistics of the reaction time in the target recognition task are shown in Table 2.
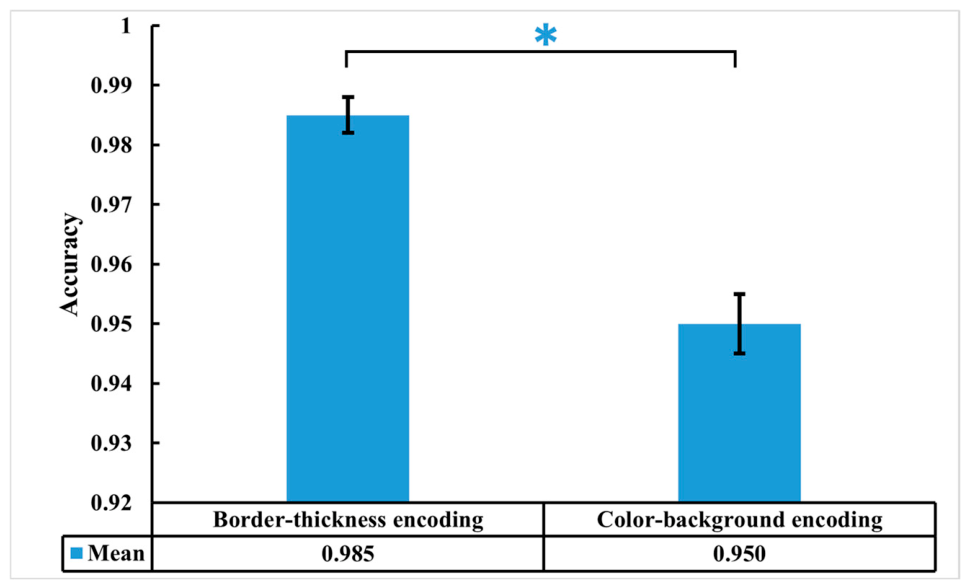
For accuracy, the ANOVA results showed that radar-range encoding (F(1,31) = 0.284, p = 0.598, ηp2 = 0.009) and spatial layout (F(1,31) = 0.306, p = 0.584, ηp2 = 0.010) did not significantly affect the task accuracy, whereas the main effect of target-threat encoding was significant (F(1,31) = 49.314, p < 0.001, ηp2 = 0.614). None of the two-way or three-way interactions was significant (all p > 0.05). As shown in Figure 6, accuracy was higher for border-thickness encoding (M = 0.985, SE = 0.003) than color-background encoding (M = 0.950, SE = 0.005).

4.1.2. EM Situation Monitoring Task

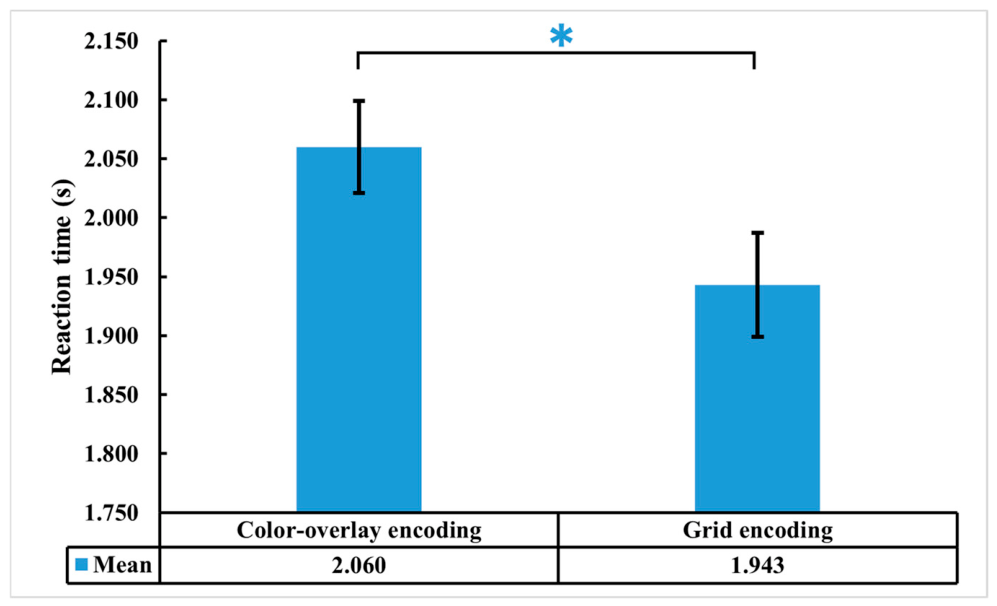
For reaction time, the repeated-measures ANOVA revealed that the main effect of radar-range encoding was significant (F(1,31) = 14.656, p < 0.001, ηp2 = 0.321), whereas the main effects of target-threat encoding (F(1,31) = 0.215, p = 0.646, ηp2 = 0.007) and spatial layout (F(1,31) = 1.334, p = 0.257, ηp2 = 0.041) were not significant. There was no significant interaction effect was found among these three factors. As shown in Figure 7, reaction time was longer for the color-overlay encoding (M = 2.060, SE = 0.039) than for the grid encoding (M = 1.943, SE = 0.044).
For accuracy, due to the clear ceiling effect observed in the monitoring task, where average accuracy scores ranged from 0.996 to 1.0 across all 8 conditions, inferential statistical testing was not performed.

4.2. Overall Mental Workload

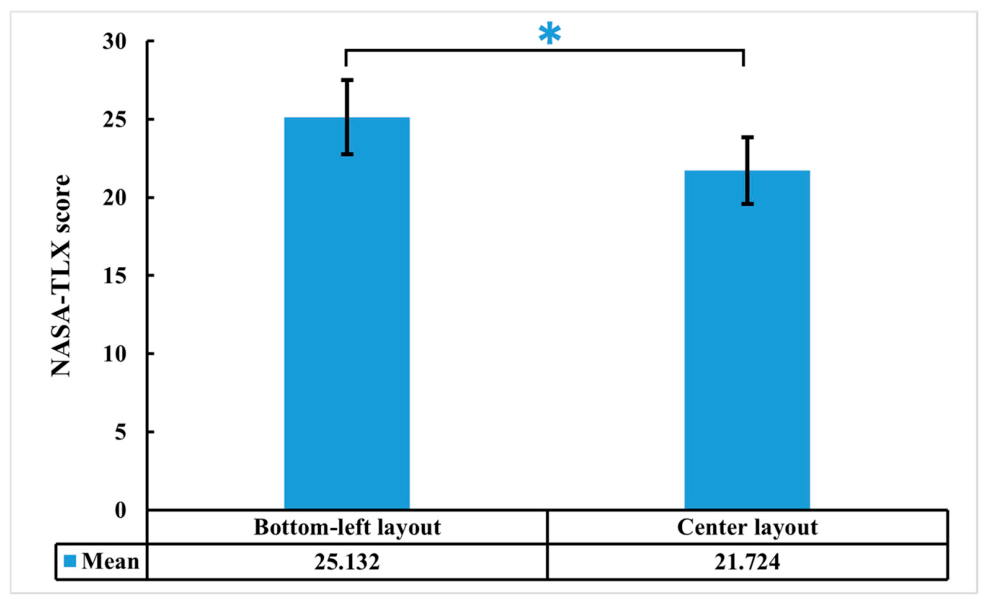
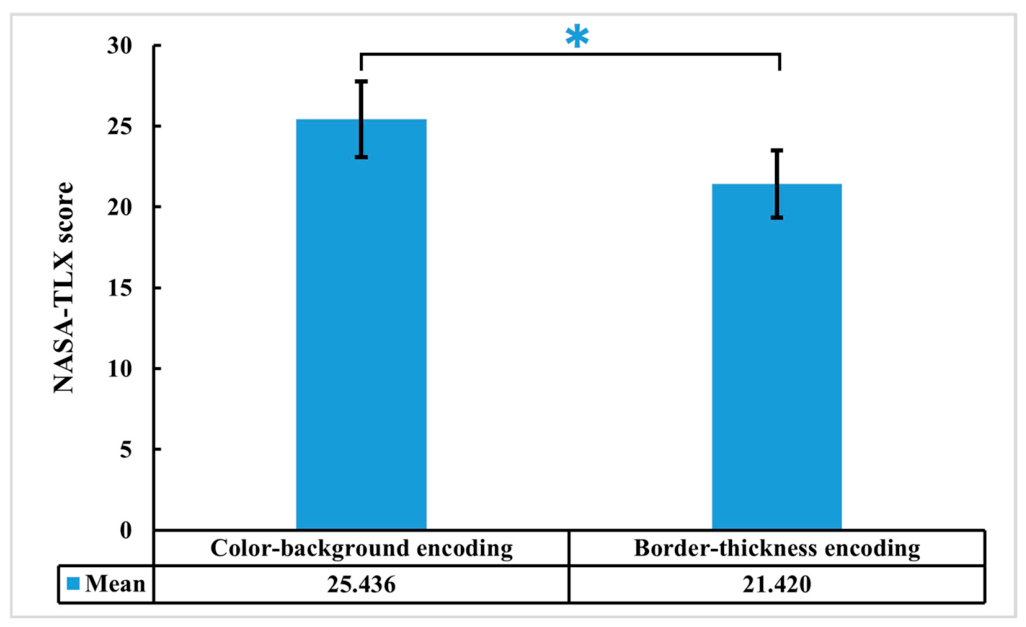
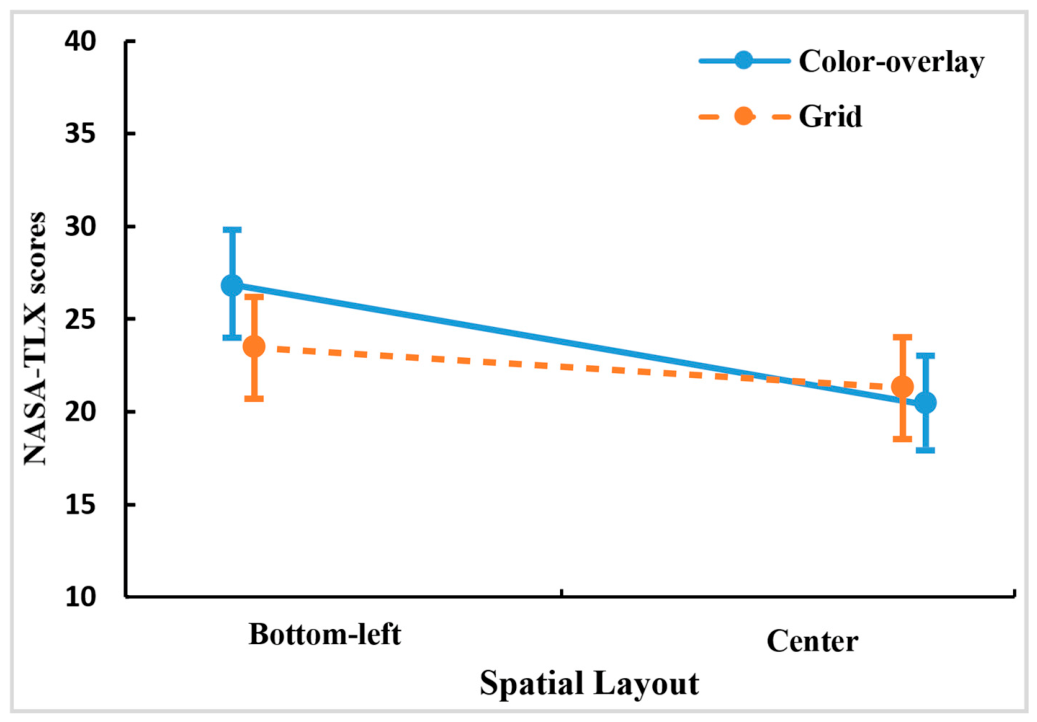
Due to systematic data recording errors, one participant’s data was missing. Thus, data from the remaining 31 participants were used for this analysis. The repeated-measures ANOVA on the NASA-TLX scores showed significant main effects of target-threat encoding (F(1,30) = 11.850, p = 0.002, ηp2 = 0.283) and spatial layout (F(1,30) = 5.667, p = 0.024, ηp2 = 0.159). As illustrated in Figure 8, NASA-TLX score was higher for the bottom-left layout (M = 25.132, SE = 2.361) than for the center layout (M = 21.724, SE = 2.133). Similarly, scores were higher for color-background encoding (M = 25.436, SE = 2.343) than for border-thickness encoding (M = 21.420, SE = 2.071) (Figure 9). A significant interaction was also found between radar-range coding and spatial layout (F(1,30) = 5.047, p = 0.032, ηp2= 0.144). As illustrated in Figure 10, the decrease in NASA-TLX scores from the bottom-left layout to the center layout was greater for color-overlay encoding than for grid encoding. The other two-way interactions and the three-way interaction were not significant (all p > 0.05).

4.3. Overall Interview Results

The interview results, as illustrated in Table 3, showed that the interface utilizing the center layout combined with the Encoding-3 (scheme 7) was the most preferred, selected by 14 out of 32 participants. This was followed by the interface using the center layout and Encoding-4 (scheme 8), which was chosen by 10 participants. The remaining combinations were generally not preferred.
Further analysis incorporating the qualitative interview feedback indicated that the participants’ selection preferences were primarily driven by two factors. First, regarding visual encoding, Encoding-3 was widely considered to convey information more intuitively and clearly, making the target states easier to identify and thereby reducing comprehension costs. In contrast, Encoding-1 and Encoding-2 were associated with insufficient information differentiation and lacked intuitive comprehensibility. Second, regarding interface layout, the majority of participants believed that placing key situational indicators in the central area aligned better with their natural visual attention habits. This arrangement enabled the rapid capture of abnormal information without active visual searching, thereby enhancing operational efficiency. Furthermore, several participants noted that the bottom-left layout was prone to being overlooked during active tasks, which necessitated additional visual searching and consequently increased their cognitive load.

4.4. Eye Tracking

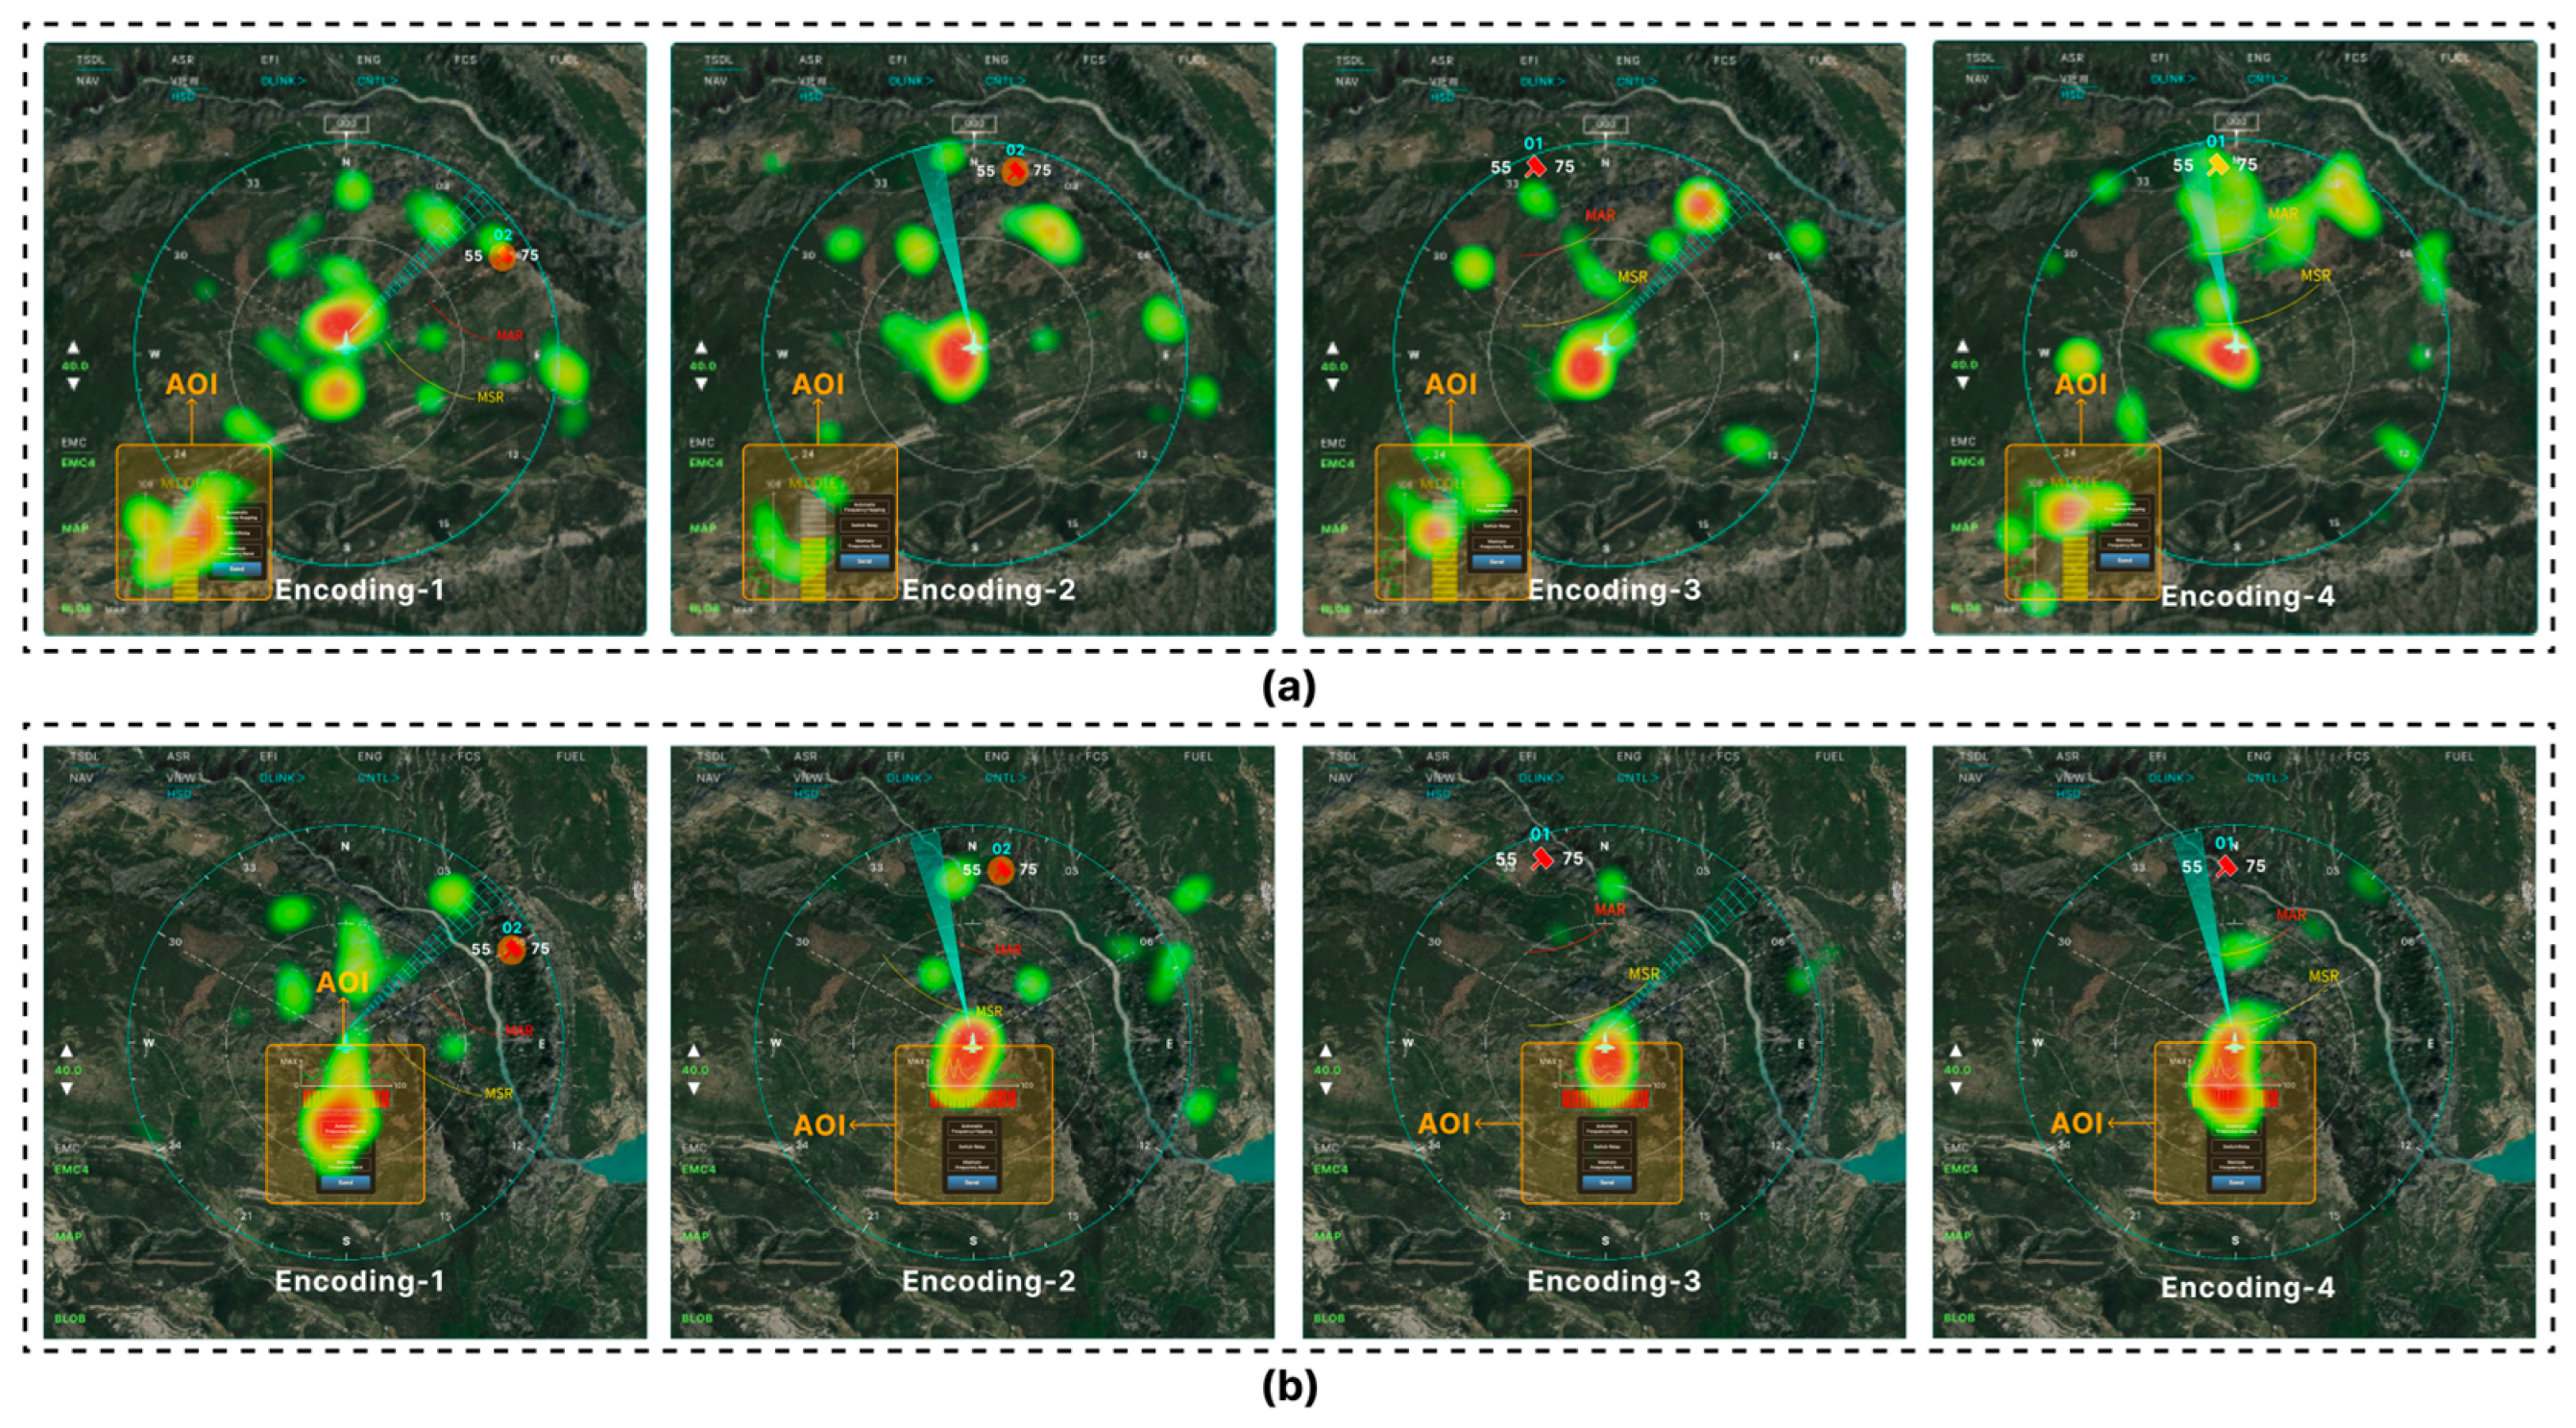
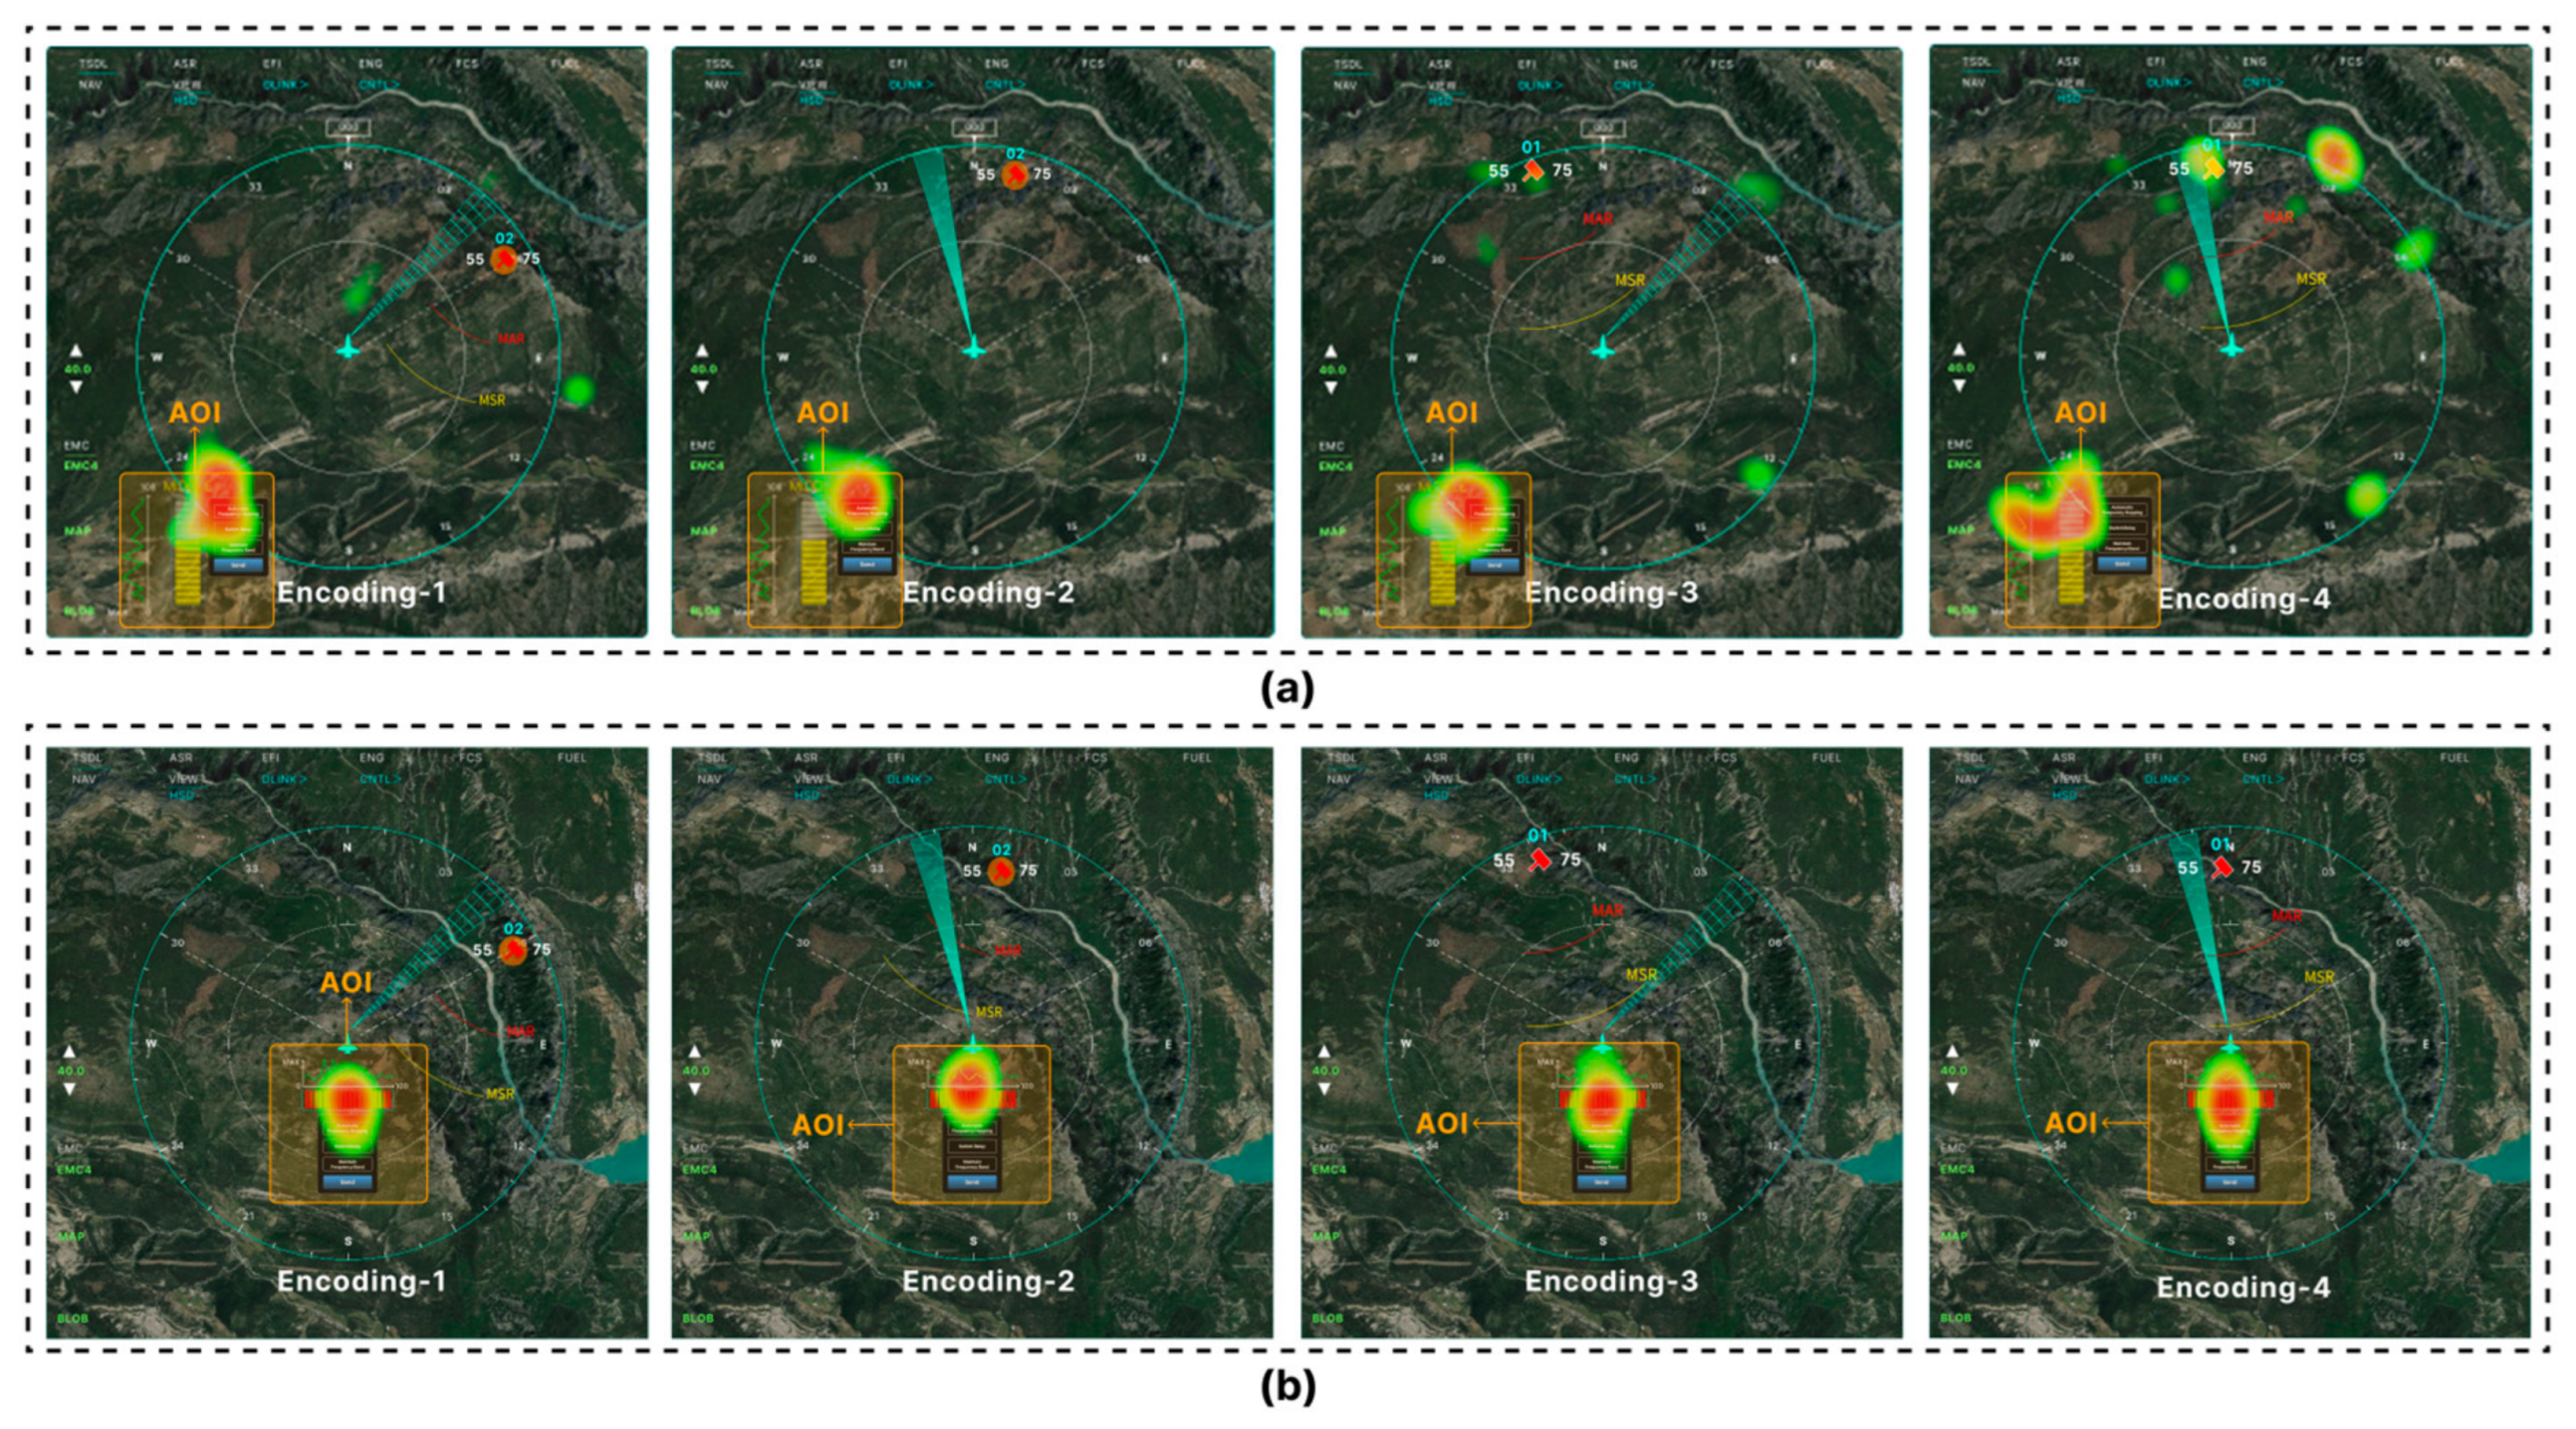
Figure 11 illustrates representative eye-tracking heatmaps at the onset of the EM situational anomaly across the two layout conditions. The layouts exhibited significant differences in the initial distribution of attention. Under the bottom-left layout condition (Figure 11a), participants’ fixations were primarily concentrated within the central region of the interface and adjacent to the radar scan path. Conversely, minimal attention was allocated to the situational indicator region located in the bottom-left corner (Figure 11b), resulting in a distinctly scattered pattern of fixation points. In contrast, the distribution of fixations under the central layout condition was more concentrated. At the onset of the anomaly, the gaze of several participants had already initiated a shift toward the lower-central region of the interface, demonstrating an early deployment of attention toward the situational indicator region.
Further analysis of the fixation heatmaps at 0.25 s post-anomaly onset revealed a more pronounced difference in attentional shift efficiency between the two layout conditions (Figure 12). Under the bottom-left layout condition (Figure 11a), although a subset of fixations began to cluster toward the situational indicator region, the overall pattern still exhibited a trend of diffusion from the central area toward the periphery. This was characterized by longer gaze paths and a noticeable delay in the attentional shift. Conversely, under the central layout condition (Figure 11b), fixation points rapidly concentrated on the situational indicator region within a brief period, with the resulting heatmap demonstrating high-density focal characteristics.
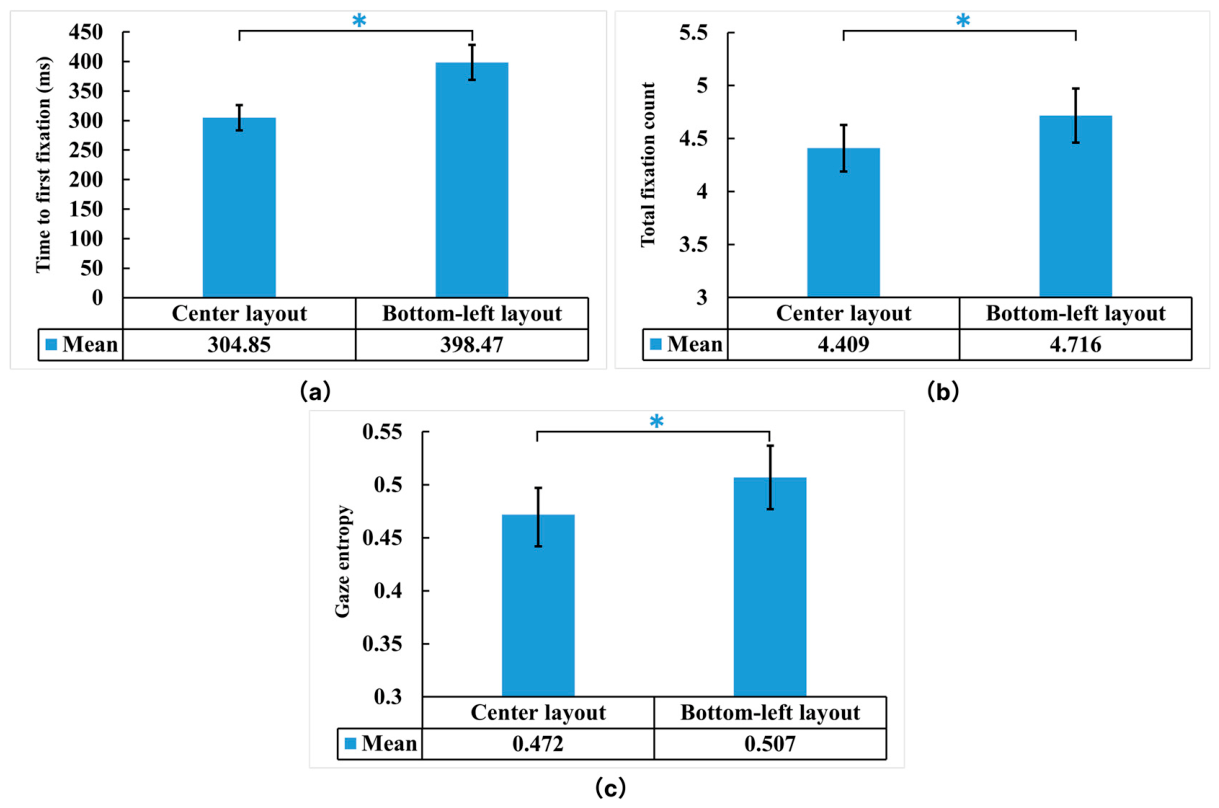
To quantitatively support these heatmap observations, participant-level eye-tracking metrics were analyzed. As illustrated in Figure 13, the results showed that TTFF on the synthetic indicator was significantly shorter under the center layout (M = 304.85 ms, SE = 21.41) compared to the bottom-left layout (M = 398.47 ms, SE = 29.62), t(28) = 3.772, p < 0.001 (Figure 13a). Furthermore, the total fixation count was significantly reduced in the center layout (M = 4.409, SE = 0.219) versus the bottom-left layout (M = 4.716, SE = 0.254), t(28) = 2.413, p = 0.023 (Figure 13b). Finally, gaze entropy between the indicator and the remaining interface area was significantly lower for the center layout (M = 0.472, SE = 0.025) than for the bottom-left layout (M = 0.507, SE = 0.030), t(28) = 2.219, p = 0.035 (Figure 13c).

5. Discussion

This study evaluated two dimensions of visual encoding (radar-range and target-threat) and two spatial layouts for presenting aviation electromagnetic (EM) information within a dynamic task simulation. The results showed that visual encoding and spatial layout influenced task performance, subjective workload, and gaze behavior. Although the experiment used a desktop display, the observed encoding and layout effects may serve as preliminary design implications for helmet-mounted and other wearable displays, where rapid information interpretation and efficient use of visual attention are important.
The visual encoding strategies demonstrated distinct effects across the experimental tasks. Target-threat encoding mainly affected the target recognition task; border-thickness coding yielded higher accuracy than color-background coding, although reaction time did not differ significantly. The reason might be color already encoded target identity, using a different visual channel for threat level likely reduced competition between meanings and improved discrimination [26]. Lazaro et al. [27] likewise found that greater visual complexity in cockpit displays increased search time and target-detection errors. The absence of a reaction-time effect in the present study suggests that the border-thickness encoding primarily reduced classification errors rather than accelerating the complete perception–decision–response sequence. Conversely, radar-range encoding significantly influenced the EM situation monitoring task, with the grid encoding yielding faster reaction times than the color-overlay. The workload and interview results provided complementary evidence: border-thickness coding and the center layout significantly reduced overall NASA-TLX scores, and their combination with the grid-based radar sector was most frequently preferred. The stronger preference for this combination may reflect the lower visual obstruction of its grid-based radar sector, although this interpretation requires direct testing. Furthermore, because subjective preference primarily reflects perceived visual comfort and does not guarantee objective performance advantages, these preference outcomes are interpreted mainly as supplementary indicators of user acceptance.
Spatial layout affected gaze behavior during EM anomaly responses and overall subjective workload across the concurrent tasks. The center layout reduced NASA-TLX scores, but spatial layout did not significantly affect target-recognition accuracy or reaction time in either task. A significant radar-range encoding and spatial layout interaction further showed that the decrease in workload from the bottom-left to the center layout was greater with color-overlay encoding than with grid encoding. Zhou et al. [28] examined recognition responses to HUD information presented at 77 positions within a 50° × 50° field of view. They found that recognition performance and subjective ratings declined as the information moved farther from the visual center, supporting the placement of time-critical information near the operator’s focal region while avoiding obstruction of primary task content. Consistent with this finding, the present quantitative eye-tracking metrics and heatmaps demonstrated that gaze converged more rapidly on the indicator when it was positioned beneath the ego-aircraft. Specifically, the center layout resulted in a significantly shorter time to first fixation (TTFF), fewer total fixations, and lower gaze entropy. This indicates a more efficient, direct focal capture, whereas the bottom-left indicator required a longer, more dispersed peripheral attentional shift. Interview responses similarly indicated that the bottom-left indicator was easier to overlook and demanded deliberate searching. Yuan et al. [29] found that an integrated cockpit AR-HUD reduced gaze shifts toward separate instruments while supporting lower workload and better situation awareness. The absence of a layout effect on target recognition is not contradictory because the manipulation changed only the indicator position; target symbols continued to appear at variable locations within the radar map. Thus, the benefit of central placement was task-specific and should not be interpreted as evidence that all display elements should be centralized.
A further contribution is the evaluation of EM visualization in a continuously changing, time-constrained environment rather than through isolated or static interface stimuli. The simulation required participants to divide attention between randomly appearing targets and changing EM states while following explicit task priorities. Bennett et al. [30] showed that dynamic naturalistic scenes can reveal visual-search behavior with greater behavioral relevance than conventional static tests. Cheng et al. [31] examined experienced pilots during simulated helicopter emergencies and found that changes in task demands substantially altered workload and the allocation of visual attention across critical cockpit areas. The synthetic indicator was introduced for the same task-oriented reason. Pilots are not dedicated EM-spectrum monitors. They should judge system state rapidly while simultaneously managing flight and target information [32,33]. Therefore, frequency occupancy, band overlap, interference power density, and effects on the aircraft operating band were fused into a readily interpretable state cue. Havlíková et al. [34] presented task-relevant virtual information through an augmented-reality interface for industrial quality inspection and found that this approach improved task efficiency and reduced perceived workload compared with conventional paper-based support. Nylin et al. [35] developed a compact glyph for initiating real-time human-automation communication in safety-critical traffic-management domains, emphasizing the need to communicate why attention is required and when action is needed. Similarly, the present indicator converted several technical parameters into an actionable overview. It should nevertheless supplement, rather than replace, access to detailed EM information for diagnosis and non-routine decisions.
The findings suggest several preliminary design implications for aviation EM interfaces. First, target identity and threat level could be represented using perceptually separable visual variables. When color already conveys identity, border thickness is a promising option for indicating threat, based on the observed accuracy advantage. Second, positioning high-priority EM states near the focal task region may support earlier visual orientation and lower overall subjective workload, while avoiding obstruction of targets, trajectories, or flight parameters. Third, a hierarchical organization of EM information could be explored in future studies, in which a compact synthetic overview is supplemented by detailed frequency- and energy-related data available on demand. Friedrich and Vollrath [36] found that matching visual salience to the urgency of unmanned-aircraft system states improved safety-critical visual search, supporting consistent mappings among indicator state, urgency, and recommended action. King et al. [37] applied ecological interface design to an aviation risk-management display, illustrating the value of making operationally meaningful system relationships directly visible. Finally, interface evaluation would benefit from dynamic multitask scenarios and converging measures of accuracy, response time, workload, preference, and visual attention.
Several limitations should be acknowledged. First, the participants were young adults without professional piloting or electronic-warfare experience, limiting generalization to trained pilots with different domain knowledge and scanning strategies [38]. These differences may influence both the magnitude and relative advantages of the observed encoding and layout effects. The findings provide an empirical basis for aviation EM interface design, but further evaluation with professional pilots in representative flight scenarios is needed to establish their operational applicability. Second, the desktop-based experiment and one-minute trials did not reproduce prolonged vigilance, fatigue, aircraft motion, communications, or other operational demands of a full cockpit environment [39]. Third, the tasks assessed recognition of displayed threat information and responses to EM state changes, capturing perceptual and attentional demands relevant to aviation information monitoring. Although these outcomes inform visualization design, they do not directly measure overall pilot situation awareness or the quality of independent tactical decisions. Further studies with trained pilots and operationally representative tasks are needed to establish whether the observed benefits extend to these broader outcomes. Finally, the weights and thresholds of the synthetic EM indicator were simplified for experimental purposes and were not operationally validated; their applicability requires evaluation using operational data and expert input.

6. Conclusions

This study evaluated multidimensional visual encoding conditions (radar-range and target-threat) and two spatial layouts for aviation electromagnetic (EM) information in a dynamic task simulation. A 2 × 2 × 2 repeated-measures experiment with 32 participants examined target recognition and EM situation monitoring using task performance, NASA-TLX scores, interface preferences, and eye-tracking metrics. The results showed that target-threat encoding mainly affected target-recognition accuracy, with border-thickness coding achieving better performance than color-background coding while maintaining comparable reaction times. Conversely, radar-range encoding significantly influenced EM monitoring, where the grid encoding produced faster responses than the color-overlay. In terms of subjective workload, both target-threat encoding and spatial layout demonstrated significant effects. Overall, the combination of a grid-based radar sector, border-thickness threat coding, and a center layout was preferred most frequently. Eye-tracking metrics and heatmaps further demonstrated that the center layout promoted faster visual attention to the EM indicator, requiring fewer total fixations and yielding lower gaze entropy after anomaly onset. Taken together, the findings identify promising encoding and layout choices for supporting information acquisition and reducing workload in the tested desktop simulation. These results provide preliminary design implications for aviation EM interfaces. Their applicability should be tested with professional pilots in cockpit simulators, and proposed extensions to helmet-mounted or other wearable displays require evaluation on the corresponding hardware.


Author Contributions

Conceptualization, X.Z. and X.Y.; methodology, C.L. and F.L.; software, Y.F. and H.W.; validation, H.W. and X.T.; formal analysis, C.L. and F.L.; investigation, Y.F. and H.W.; resources, X.Y.; data curation, C.L. and J.Y.; writing—original draft preparation, C.L.; writing—review and editing, X.Z. and X.Y.; visualization, X.T. and J.Y.; supervision, X.Y.; project administration, X.Z. and X.Y.; funding acquisition, X.Y. All authors have read and agreed to the published version of the manuscript.

Funding

This research was funded by National Key Laboratory of Avionics Integration and Aviation System-of-Systems Synthesis (Grant NO. 2025AIASS0401) and the Fundamental Research Funds for the Central Universities (Grant NO. 2242026RCB0035).

Institutional Review Board Statement

Ethical review and approval were not required for this study under Article 32, Item (2), of China’s Measures for the Ethical Review of Life Science and Medical Research Involving Humans (2023). The study involved non-invasive desktop-based behavioral tasks and used anonymized demographic, task-performance, questionnaire, and eye-tracking data. No biological samples were collected, and the research involved no harm to participants, sensitive personal information, or commercial interests.

Informed Consent Statement

Informed consent was obtained from all subjects involved in the study.

Data Availability Statement

The data presented in this study are available from the corresponding author upon reasonable request.

Acknowledgments

The authors would like to thank all participants for their time and valuable contributions to this study.

Conflicts of Interest

The authors declare no conflicts of interest.

Abbreviations

The following abbreviations are used in this manuscript:
EMElectromagnetic
NASA-TLXNASA Task Load Index
ATCAir traffic control
AOIArea of interest
TTFFTime to first fixation
ANOVAAnalysis of variance
HUDHead-up display

References

  1. Yang, F.; Dong, Z. Research on electromagnetic visualization method. Int. J. Model. Simul. Sci. Comput. 2020, 11, 2050037. [Google Scholar] [CrossRef] [Scilit]
  2. Lim, Y.; Gardi, A.; Sabatini, R.; Ramasamy, S.; Kistan, T.; Ezer, N.; Vince, J.; Bolia, R. Avionics Human-Machine Interfaces and Interactions for Manned and Unmanned Aircraft. Prog. Aerosp. Sci. 2018, 102, 1–46. [Google Scholar] [CrossRef] [Scilit]
  3. Huang, Y.; Cui, H.; Hou, Y.; Hao, C.; Wang, W.; Zhu, Q.; Li, J.; Wu, Q.; Wang, J. Space-based electromagnetic spectrum sensing and situation awareness. Space Sci. Technol. 2024, 4, 0109. [Google Scholar] [CrossRef] [Scilit]
  4. Wang, X.; Pang, L.; Miao, D.; Yan, H.; Cao, X.; Wu, X. Evaluation of Intelligent Auxiliary Information Presentation Mode for Collaborative Flight Formation. Aerospace 2025, 12, 57. [Google Scholar] [CrossRef] [Scilit]
  5. Li, W.; Li, X.; Zhou, Z.; Chen, W. Analysis of Data Visualization Structure Applied to Combat Scenarios. In Proceedings of the International Conference on Man-Machine-Environment System Engineering, Beijing, China, 20–23 October 2023; pp. 401–408. [Google Scholar]
  6. Tang, H.; Lee, B.G.; Towey, D.; Pike, M. The Impact of Various Cockpit Display Interfaces on Novice Pilots’ Mental Workload and Situational Awareness: A Comparative Study. Sensors 2024, 24, 2835. [Google Scholar] [CrossRef] [Scilit] [PubMed]
  7. Hu, H.; Fang, S. Design of electromagnetic situation visualization system. In Proceedings of the 2021 2nd International Conference on Intelligent Design (ICID), Xi’an, China, 19 October 2021; pp. 93–100. [Google Scholar]
  8. Shao, J.; Wu, J.; Tang, W.; Xue, C. How dynamic information layout in GIS interface affects users’ search performance: Integrating visual motion cognition into map information design. Behav. Inf. Technol. 2023, 42, 1686–1703. [Google Scholar] [CrossRef] [Scilit]
  9. Zhang, N.; Zhang, J.; Jiang, S.; Ge, W. The effects of layout order on interface complexity: An eye-tracking study for dashboard design. Sensors 2024, 24, 5966. [Google Scholar] [CrossRef] [Scilit] [PubMed]
  10. He, R.; Xu, Z.; Wang, L.; He, Z. Research on 3D visualization technology of electromagnetic field based on OSG. In Proceedings of the 2017 10th International Symposium on Computational Intelligence and Design (ISCID), Hangzhou, China, 9–10 December 2017; pp. 75–78. [Google Scholar]
  11. Shen, Y.; Lv, Z.; Li, P.; Ye, H. Visualization Approach for Generating Electromagnetic Situation Corresponding to Frequency and Color Method. In Proceedings of the 2023 IEEE 11th International Conference on Information, Communication and Networks (ICICN), Xi’an, China, 17–20 August 2023; pp. 450–454. [Google Scholar]
  12. Jiang, B.; Jiang, Q.; Qi, S.; Guo, J. Visualization of integrated electromagnetic situation in battle. In Proceedings of the 2017 International Conference on Algorithms, Methodology, Models and Applications in Emerging Technologies (ICAMMAET), Chennai, India, 16–18 February 2017; pp. 1–5. [Google Scholar]
  13. Han, C. Design of Electromagnetic Environment Data Visualization System for Civil Aircraft. In Proceedings of the 2025 IEEE 8th International Symposium on Electromagnetic Compatibility (ISEMC), Hefei, China, 10–12 October 2025; pp. 1–3. [Google Scholar]
  14. Zhao, Y.; Luo, X.; Lin, X.; Wang, H.; Kui, X.; Zhou, F.; Wang, J.; Chen, Y.; Chen, W. Visual analytics for electromagnetic situation awareness in radio monitoring and management. IEEE Trans. Vis. Comput. Graph. 2019, 26, 590–600. [Google Scholar] [CrossRef] [Scilit] [PubMed]
  15. Hodgetts, H.M.; Vachon, F.; Chamberland, C.; Tremblay, S. See No Evil: Cognitive Challenges of Security Surveillance and Monitoring. J. Appl. Res. Mem. Cogn. 2017, 6, 230–243. [Google Scholar] [CrossRef] [Scilit]
  16. Prinzmetal, W.; McCool, C.; Park, S. Attention: Reaction time and accuracy reveal different mechanisms. J. Exp. Psychol. Gen. 2005, 134, 73. [Google Scholar] [CrossRef] [Scilit] [PubMed]
  17. Delmas, M.; Caroux, L.; Lemercier, C. Searching in clutter: Visual behavior and performance of expert action video game players. Appl. Ergon. 2022, 99, 103628. [Google Scholar] [CrossRef] [Scilit] [PubMed]
  18. Gomolka, Z.; Kordos, D.; Dudek-Dyduch, E.; Twarog, B. New Perspectives on Eye-Tracking: Theory, Methods, and Applications. Appl. Sci. 2025, 15, 11463. [Google Scholar] [CrossRef] [Scilit]
  19. Qu, J.; Guo, H.; Wang, W.; Dang, S.; Liu, H. A study on the intuitive design of target search tasks under time and information pressure. Brain Sci. 2022, 12, 1464. [Google Scholar] [CrossRef] [Scilit] [PubMed]
  20. Zhang, J.; Hu, L.; Zhu, Y.; Zhang, Y.; Kuang, X.; Li, J.; Gao, W. Designing Effective Multi-Window Map Interfaces: The Role of Highlighting and Luminance Contrast in Visual Search. ISPRS Int. J. Geo-Inf. 2026, 15, 180. [Google Scholar] [CrossRef] [Scilit]
  21. Zhou, C.; Yuan, F.; Huang, T.; Zhang, Y.; Kaner, J. The impact of interface design element features on task performance in older adults: Evidence from eye-tracking and EEG signals. Int. J. Environ. Res. Public Health 2022, 19, 9251. [Google Scholar] [CrossRef] [Scilit] [PubMed]
  22. Jin, H.; Xuan, Z. The Effect of ATC Surveillance System Interface Design and Usability on Air Traffic Controller Cognitive Load. In Proceedings of the 2023 Smart City Challenges & Outcomes for Urban Transformation (SCOUT), Singapore, 29–30 July 2023; pp. 273–278. [Google Scholar]
  23. Rayner, K. Eye movements in reading and information processing: 20 years of research. Psychol. Bull. 1998, 124, 372–422. [Google Scholar] [CrossRef] [Scilit] [PubMed]
  24. Ringer, R.V.; Leonard, C.J. Early visual modulation and selection predict saccadic timing during visual search: An ERP study. Psychophysiology 2025, 62, e14715. [Google Scholar] [CrossRef] [Scilit] [PubMed]
  25. Lakens, D. Calculating and reporting effect sizes to facilitate cumulative science: A practical primer for t-tests and ANOVAs. Front. Psychol. 2013, 4, 863. [Google Scholar] [CrossRef] [Scilit] [PubMed]
  26. Niu, Y.; Zhou, T.; Bai, L. Research on color coding of fighter jet head-up display key information elements in air–sea flight environment based on eye-tracking technology. Proc. Inst. Mech. Eng. Part G J. Aerosp. Eng. 2022, 236, 2010–2030. [Google Scholar] [CrossRef] [Scilit]
  27. Lazaro, M.J.; Kang, Y.; Yun, M.H.; Kim, S. The Effects of Visual Complexity and Decluttering Methods on Visual Search and Target Detection in Cockpit Displays. Int. J. Hum.–Comput. Interact. 2021, 37, 588–600. [Google Scholar] [CrossRef] [Scilit]
  28. Zhou, Y.; Tang, L.; Huang, J.; Xiang, Y.; Ge, Y. How the Position Distribution of HUD Information Influences the Driver’s Recognition Performance in Different Scenes. In International Conference on Human-Computer Interaction; Springer: Cham, Switzerland, 2023; pp. 383–395. [Google Scholar]
  29. Yuan, X.; Ng, K.K.H.; Li, Q.; Yiu, C.Y.; Lau, C.K.; Fung, K.H.; Ng, L.H. Exploring the Human-Centric Interaction Paradigm: Augmented Reality-Assisted Head-Up Display Design for Collaborative Human-Machine Interface in Cockpit. Adv. Eng. Inform. 2024, 62, 102656. [Google Scholar] [CrossRef] [Scilit]
  30. Bennett, C.R.; Bex, P.J.; Merabet, L.B. Assessing visual search performance using a novel dynamic naturalistic scene. J. Vis. 2021, 21, 5. [Google Scholar] [CrossRef] [Scilit] [PubMed]
  31. Cheng, L.; Shen, Y.-C.; He, Q.; Zhang, M.-J. Spying with a pilot’s eye: Using eye tracking to investigate pilots’ attention allocation and workload during helicopter autorotative gliding. Heliyon 2024, 10, 16. [Google Scholar] [CrossRef] [Scilit] [PubMed]
  32. Babu, M.D.; JeevithaShree, D.; Prabhakar, G.; Saluja, K.P.S.; Pashilkar, A.; Biswas, P. Estimating pilots’ cognitive load from ocular parameters through simulation and in-flight studies. J. Eye Mov. Res. 2019, 12, 16. [Google Scholar] [CrossRef] [Scilit] [PubMed]
  33. Alharasees, O.; Kale, U. Cognitive load assessment for cadet pilots in simulated aircraft environment-pilot study. Aircr. Eng. Aerosp. Technol. 2024, 96, 858–872. [Google Scholar] [CrossRef] [Scilit]
  34. Havlíková, K.; Hořejší, P.; Kopeček, P. Effect of Augmented Reality Support on Quality Inspection of Welded Structures. Appl. Sci. 2023, 13, 11655. [Google Scholar] [CrossRef] [Scilit]
  35. Nylin, M.; Lundberg, J.; Bång, M.; Kucher, K. Glyph design for communication initiation in real-time human-automation collaboration. Vis. Inform. 2024, 8, 23–35. [Google Scholar] [CrossRef] [Scilit]
  36. Friedrich, M.; Vollrath, M. Urgency-Based color coding to support visual search in displays for supervisory control of multiple unmanned aircraft systems. Displays 2022, 74, 102185. [Google Scholar] [CrossRef] [Scilit]
  37. King, B.J.; Read, G.J.M.; Salmon, P.M. Clear and present danger? Applying ecological interface design to develop an aviation risk management interface. Appl. Ergon. 2022, 99, 103643. [Google Scholar] [CrossRef] [Scilit] [PubMed]
  38. Lounis, C.; Peysakhovich, V.; Causse, M. Visual scanning strategies in the cockpit are modulated by pilots’ expertise: A flight simulator study. PLoS ONE 2021, 16, e0247061. [Google Scholar] [CrossRef] [Scilit] [PubMed]
  39. Rochon, L.-J.; Karran, A.J.; Rolon-Merette, T.; Courtemanche, F.; Coursaris, C.; Senecal, S.; Léger, P.-M. Cognition in the cockpit: Assessing instructional modalities in pilot training simulations. Front. Psychol. 2025, 16, 1625321. [Google Scholar] [CrossRef] [Scilit] [PubMed]
Figure 1. Visual encodings of radar detection range: (a) grid section; (b) color-overlay section.
Applsci 16 09427 g001
Figure 2. Visual encodings of detected-target attributes: (a) color-background coding; (b) border-thickness coding; (c) target information.
Applsci 16 09427 g002
Figure 3. Synthetic EM situational indicator: (a) indicator states; (b) response interface; (c) bottom-left and central spatial layouts.
Applsci 16 09427 g003
Figure 4. Representative interface for multidimensional aviation EM information.
Applsci 16 09427 g004
Figure 5. Experimental setup for the dynamic aviation EM task simulation.
Applsci 16 09427 g005
Figure 6. Comparisons of target-threat encodings on task accuracy. * p < 0.05.
Applsci 16 09427 g006
Figure 7. Comparisons of radar-range encodings on reaction time. * p < 0.05.
Applsci 16 09427 g007
Figure 8. Comparisons of spatial layout on NASA-TLX scores. * p < 0.05.
Applsci 16 09427 g008
Figure 9. Comparisons of target-threat encodings on NASA-TLX scores. * p < 0.05.
Applsci 16 09427 g009
Figure 10. Interaction effect between radar-range encoding and spatial layout on NASA-TLX scores.
Applsci 16 09427 g010
Figure 11. Gaze heatmaps at the onset of an EM situational anomaly: (a) bottom-left layout; (b) central layout.
Applsci 16 09427 g011
Figure 12. Gaze heatmaps at 0.25 s after EM situational anomaly onset: (a) bottom-left layout; (b) central layout.
Applsci 16 09427 g012
Figure 13. Comparisons of spatial layout on quantitative eye-tracking metrics: (a) time to first fixation (TTFF); (b) total fixation count; (c) gaze entropy. * p < 0.05.
Applsci 16 09427 g013
Table 1. Structured comparison of related literature and the proposed study.
StudyDomain/Interface TypeSample SizeTasksEvaluation MetricsScenario Dynamics
He et al. [10]EM vector fieldsN/ARendering optimizationComputational speedStatic rendering
Han [13]Civil aircraft EMN/AData querying & playbackDatabase efficiencyRetrospective playback
Zhao et al. [14]Radio monitoringExpert groupRoutine observationSubjective interviewsRoutine/Static
Shao et al. [8]GIS Interface18Visual target searchReaction time, eye-trackingDynamic visual motion
Qu et al. [19]Target search60Visual target searchReaction time, accuracy, eye-tracking, EEGDynamic visual motion
Zhang et al. [20]Multi-Window UI35Visual searchEye-trackingStatic
Jin & Xuan [22]ATC surveillance30Sequential icon searchEye-tracking, NASA-TLX, accuracySequential/Static
Our StudyAviation EM32Concurrent target recognition & EM monitoringAccuracy, reaction time, NASA-TLX, Eye-trackingDynamic, time-constrained
Table 2. Descriptive statistics of the reaction time (M ± SE) in the target recognition task.
Reaction Time (s)
Spatial LayoutEncoding-1Encoding-2Encoding-3Encoding-4
Bottom-left1.858 ± 0.0351.889 ± 0.0401.799 ± 0.0341.846 ± 0.045
Center1.856 ± 0.0501.886 ± 0.0471.902 ± 0.0511.834 ± 0.038
Table 3. The overall picking frequencies of the most preferred interface.
Frequencies of Picking (No. Participants)
Spatial LayoutEncoding-1Encoding-2Encoding-3Encoding-4
Bottom-left0 (1)0 (2)2 (3)2 (4)
Center2 (5)2 (6)14 (7)10 (8)
Note: The number in the parenthesis denotes the interface scheme ID.
Disclaimer/Publisher’s Note: The statements, opinions and data contained in all publications are solely those of the individual author(s) and contributor(s) and not of MDPI and/or the editor(s). MDPI and/or the editor(s) disclaim responsibility for any injury to people or property resulting from any ideas, methods, instructions or products referred to in the content.