Article

Receptive-Field-Aware Adaptive Fusion for Multiscale Insulator Defect Detection in Transmission-Line Images

1
Department of Mechanical Engineering, North China Electric Power University, Baoding 071003, China
2
Yanzhao Electric Power Laboratory, North China Electric Power University, Baoding 071003, China
3
The State Key Laboratory of Digital Steel, Northeastern University, Shenyang 110819, China
4
School of Mechanical Engineering, Shenyang Jianzhu University, Shenyang 110168, China
*
Author to whom correspondence should be addressed.
Appl. Sci. 2026, 16(18), 9342; https://doi.org/10.3390/app16189342 (registering DOI)
Submission received: 18 August 2026 / Revised: 9 September 2026 / Accepted: 16 September 2026 / Published: 20 September 2026
(This article belongs to the Section Computing and Artificial Intelligence)

Abstract

Transmission-line inspection requires a single detector to localize complete insulator strings together with much smaller broken-shell and flashover-damaged regions. These targets differ in spatial extent and in their dependence on local detail and surrounding context, which complicates cross-scale feature fusion when accurate bounding boxes are required. This study develops receptive-field-aware path aggregation (PRA) and bidirectional receptive-field-aware aggregation (BRA), combining path aggregation with receptive-field expansion and adaptive scale weighting. Compared with the path aggregation network (PANet), PRA increases mean average precision (mAP) at an intersection-over-union (IoU) threshold of 0.5 (mAP@0.5) by 2.2 percentage points and mAP averaged over IoU thresholds from 0.5 to 0.95 (mAP@0.5: 0.95) by 4.6 points; BRA produces gains of 1.5 and 4.0 points, respectively. The highest mAP@0.5:0.95 of 91.3% is jointly achieved by Swin-T-PRA + Alpha-CIoU and Swin-T-BRA + Alpha-CIoU, with corresponding mAP@0.5 values of 98.6% and 98.5% and model-only inference speeds of 48.5 and 48.3 FPS on an RTX 3080 Ti, respectively. The larger gains across stricter IoU thresholds indicate that PRA/BRA provide greater benefits when more stringent box-overlap criteria are imposed, although the present evaluation does not independently isolate the bounding-box regression mechanism.

1. Introduction

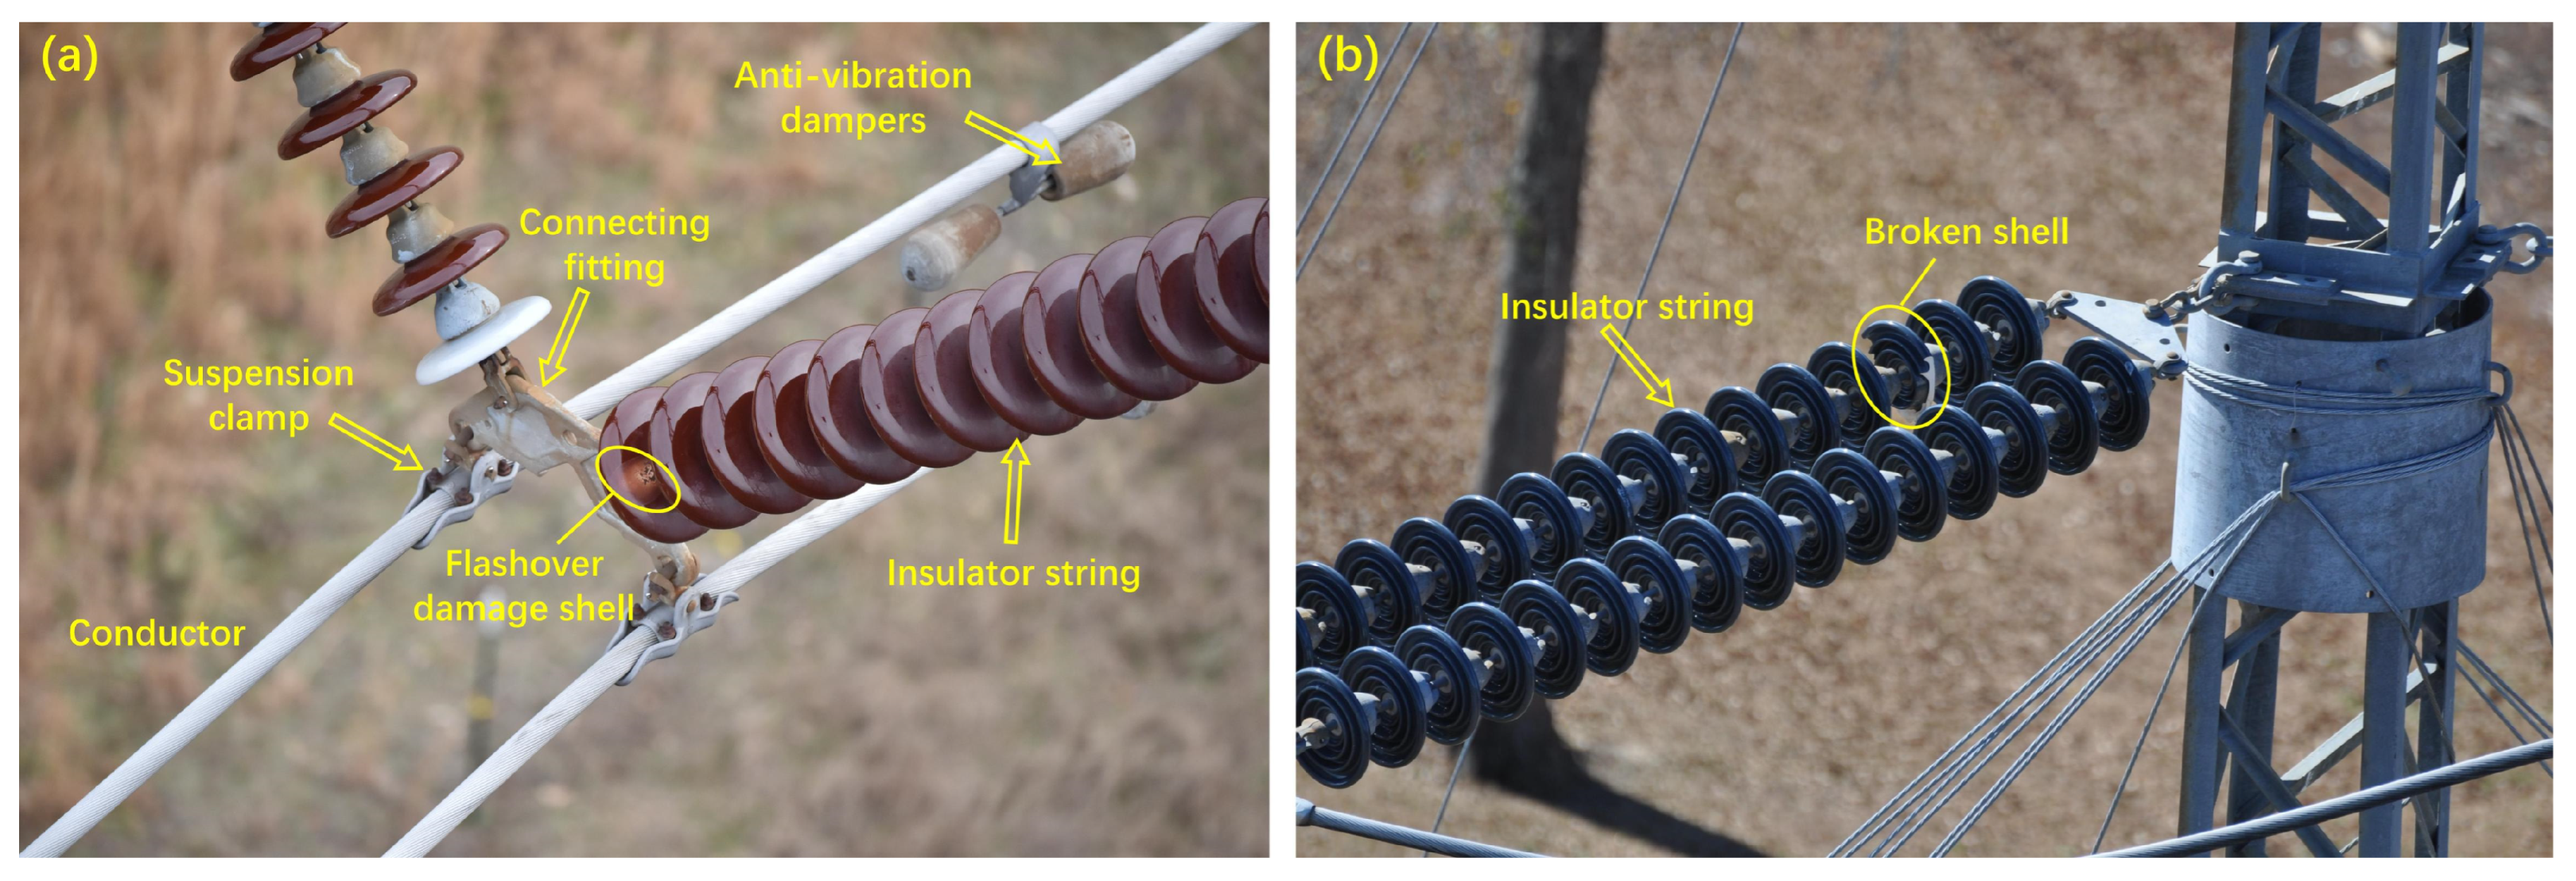
Automatic screening of transmission-line inspection images requires reliable detection of complete insulator strings and localized defects. Insulators provide electrical insulation and mechanical support, while their surface geometry increases the creepage distance and reduces the risk of discharge between conductors at different potentials [1,2]. During long-term service, surface contamination and moisture can form conductive films, reduce the flashover voltage, and promote localized discharge or flashover damage [3,4]. Fractures, cracks, and other visually identifiable broken defects may also appear in transmission-line inspection images and require accurate localization [5]. As illustrated in Figure 1, the resulting inspection task includes three visually distinct classes: insulator strings, broken shells, and flashover-damaged shells. Complete strings are elongated and occupy relatively large image regions, whereas the two defect classes are more localized and rely more heavily on fine appearance cues. A detector must therefore balance broad contextual representation with the preservation of local detail and accurate box localization.
Insulator condition can be assessed using image-based inspection and unmanned aerial vehicle (UAV)-assisted visual analysis [6], together with ultrasonic testing for internal defects [7]. For extensive transmission networks, however, manual inspection is labor-intensive, dependent on operator experience, and difficult to perform consistently in hazardous or inaccessible locations [8,9]. UAVs equipped with imaging sensors are therefore widely used to collect transmission-line images [10]. These inspections can generate large image collections that remain costly to examine manually, particularly when defects occupy only a small image region or have weak visual contrast. Earlier vision-based approaches generally relied on hand-designed image features and rule-based segmentation pipelines. Their dependence on manually specified visual cues limits their ability to accommodate the variation in target scale, viewpoint, illumination, and background found in transmission-line imagery.
Convolutional neural network (CNN)-based detectors have substantially advanced the automatic localization and recognition of insulators and associated defects in aerial inspection images [11], and recent studies continue to explore improved detection architectures, feature representations, and optimization strategies for transmission-line inspection [12]. Ling, et al. [13] combined Faster region-based convolutional neural network (Faster R-CNN) and U-Net to locate self-blast glass insulators in low-signal-to-noise aerial images, while Zhao, et al. [14] incorporated a feature pyramid into Faster R-CNN for insulator recognition under complex backgrounds. Alternative target representations have also been investigated. Wei, et al. [15] represented insulator strings as assembled keypoint chains, and Liu, et al. [16] used parallel branches to locate fault regions and estimate insulator endpoints. Souza, et al. [17] combined a You Only Look Once (YOLO) detector with a ResNet-18 classifier for image-based transmission-line inspection, whereas Wei, et al. [18] examined lightweight edge detection together with cloud-based recognition models. More recent work has extended this line of research toward modern YOLO and real-time transformer architectures. For example, MAP-YOLOv8 integrates targeted architectural modifications for transmission-line insulator defect detection, while improved RT-DETR-based approaches combine attention enhancement, small-object detection layers, and refined boundary-aware feature aggregation [19,20]. Related studies have also examined edge-assisted recognition, cloud–edge collaborative inspection, remote UAV-based component detection, and lightweight power-line defect detection workflows [13,18,21,22,23], although their system-level objectives differ from the image-level detection problem considered here.
Despite this progress, insulator detection in aerial images remains sensitive to heterogeneous backgrounds, viewpoint and illumination changes, target overlap, and limited defect-pixel coverage [17,24,25,26]. Limited annotated data can further constrain data-driven detectors [26,27], and small defect regions tend to lose discriminative detail during feature downsampling [28,29,30]. Outdoor acquisition may additionally introduce noise, blur, fog-like degradation, illumination variation, and contrast changes. Recent UAV-based studies further indicate that sandy and dusty conditions can introduce substantial color bias and visibility degradation, making contextual feature extraction and small-defect localization more difficult [31,32]. Much of the existing work also considers a single defect type, although joint detection of complete strings, broken shells, and flashover-damaged shells requires one model to represent targets with markedly different spatial extents and visual cues. Related studies have adopted multiscale pyramids, receptive-field modules, attention mechanisms, and lightweight detectors, but comparisons often emphasize detection at an intersection-over-union (IoU) threshold of 0.5. This metric alone does not show whether predicted boxes remain accurate at stricter IoU thresholds, and the combined roles of backbone representation, cross-scale fusion, and box-regression loss have not been consistently examined from this perspective. Recent studies [32,33,34] have increasingly adopted modern YOLO variants, transformer-based feature representations, lightweight architectures, and multiscale feature-fusion strategies for insulator defect detection. However, most existing work primarily emphasizes aggregate detection performance, whereas the joint effects of receptive-field expansion, cross-scale feature interaction, and strict IoU localization have received comparatively limited systematic investigation.
This study addresses the problem through receptive-field-aware path aggregation (PRA) and bidirectional receptive-field-aware aggregation (BRA), two fusion necks designed for one-stage insulator detection. Both structures coordinate multi-path feature propagation, multi-branch receptive-field expansion, and adaptive scale weighting so that localized defect cues can be retained while broader context is incorporated for complete insulator strings. Convolutional and vision-transformer backbones provide alternative feature representations, and IoU-based losses are examined as complementary choices for box regression. Cycle-consistent generative adversarial network (CycleGAN)-derived and synthetically fogged images extend the range of appearances used during training; they are not treated as a separate robustness experiment.
The principal contribution lies in the design and evaluation of PRA and BRA for a detection problem in which the target classes have substantially different spatial scales. The two necks integrate established path-aggregation, receptive-field, and adaptive-fusion operations into a task-oriented structure, and their effects are evaluated using mean average precision (mAP) at IoU thresholds of 0.5 and 0.5:0.95. Relative to the corresponding path-aggregation references, the larger improvements at the stricter metric indicate that PRA and BRA provide greater benefits when more stringent box-overlap criteria are imposed. These results characterize high-IoU detection performance rather than independently isolating the bounding-box regression mechanism. Evaluating the necks together with alternative backbones and localization losses further clarifies how feature representation, cross-scale interaction, and boundary regression contribute within the same experimental framework.
Section 2 describes the dataset, training-image preparation, detection framework, PRA/BRA necks, comparative configurations, and evaluation protocol, after which Section 3 presents the experimental results. Section 4 discusses the findings on strict localization, application scope, and limitations, and Section 5 summarizes the main conclusions.

2. Materials and Methods

2.1. Reference Detector and Training Objective

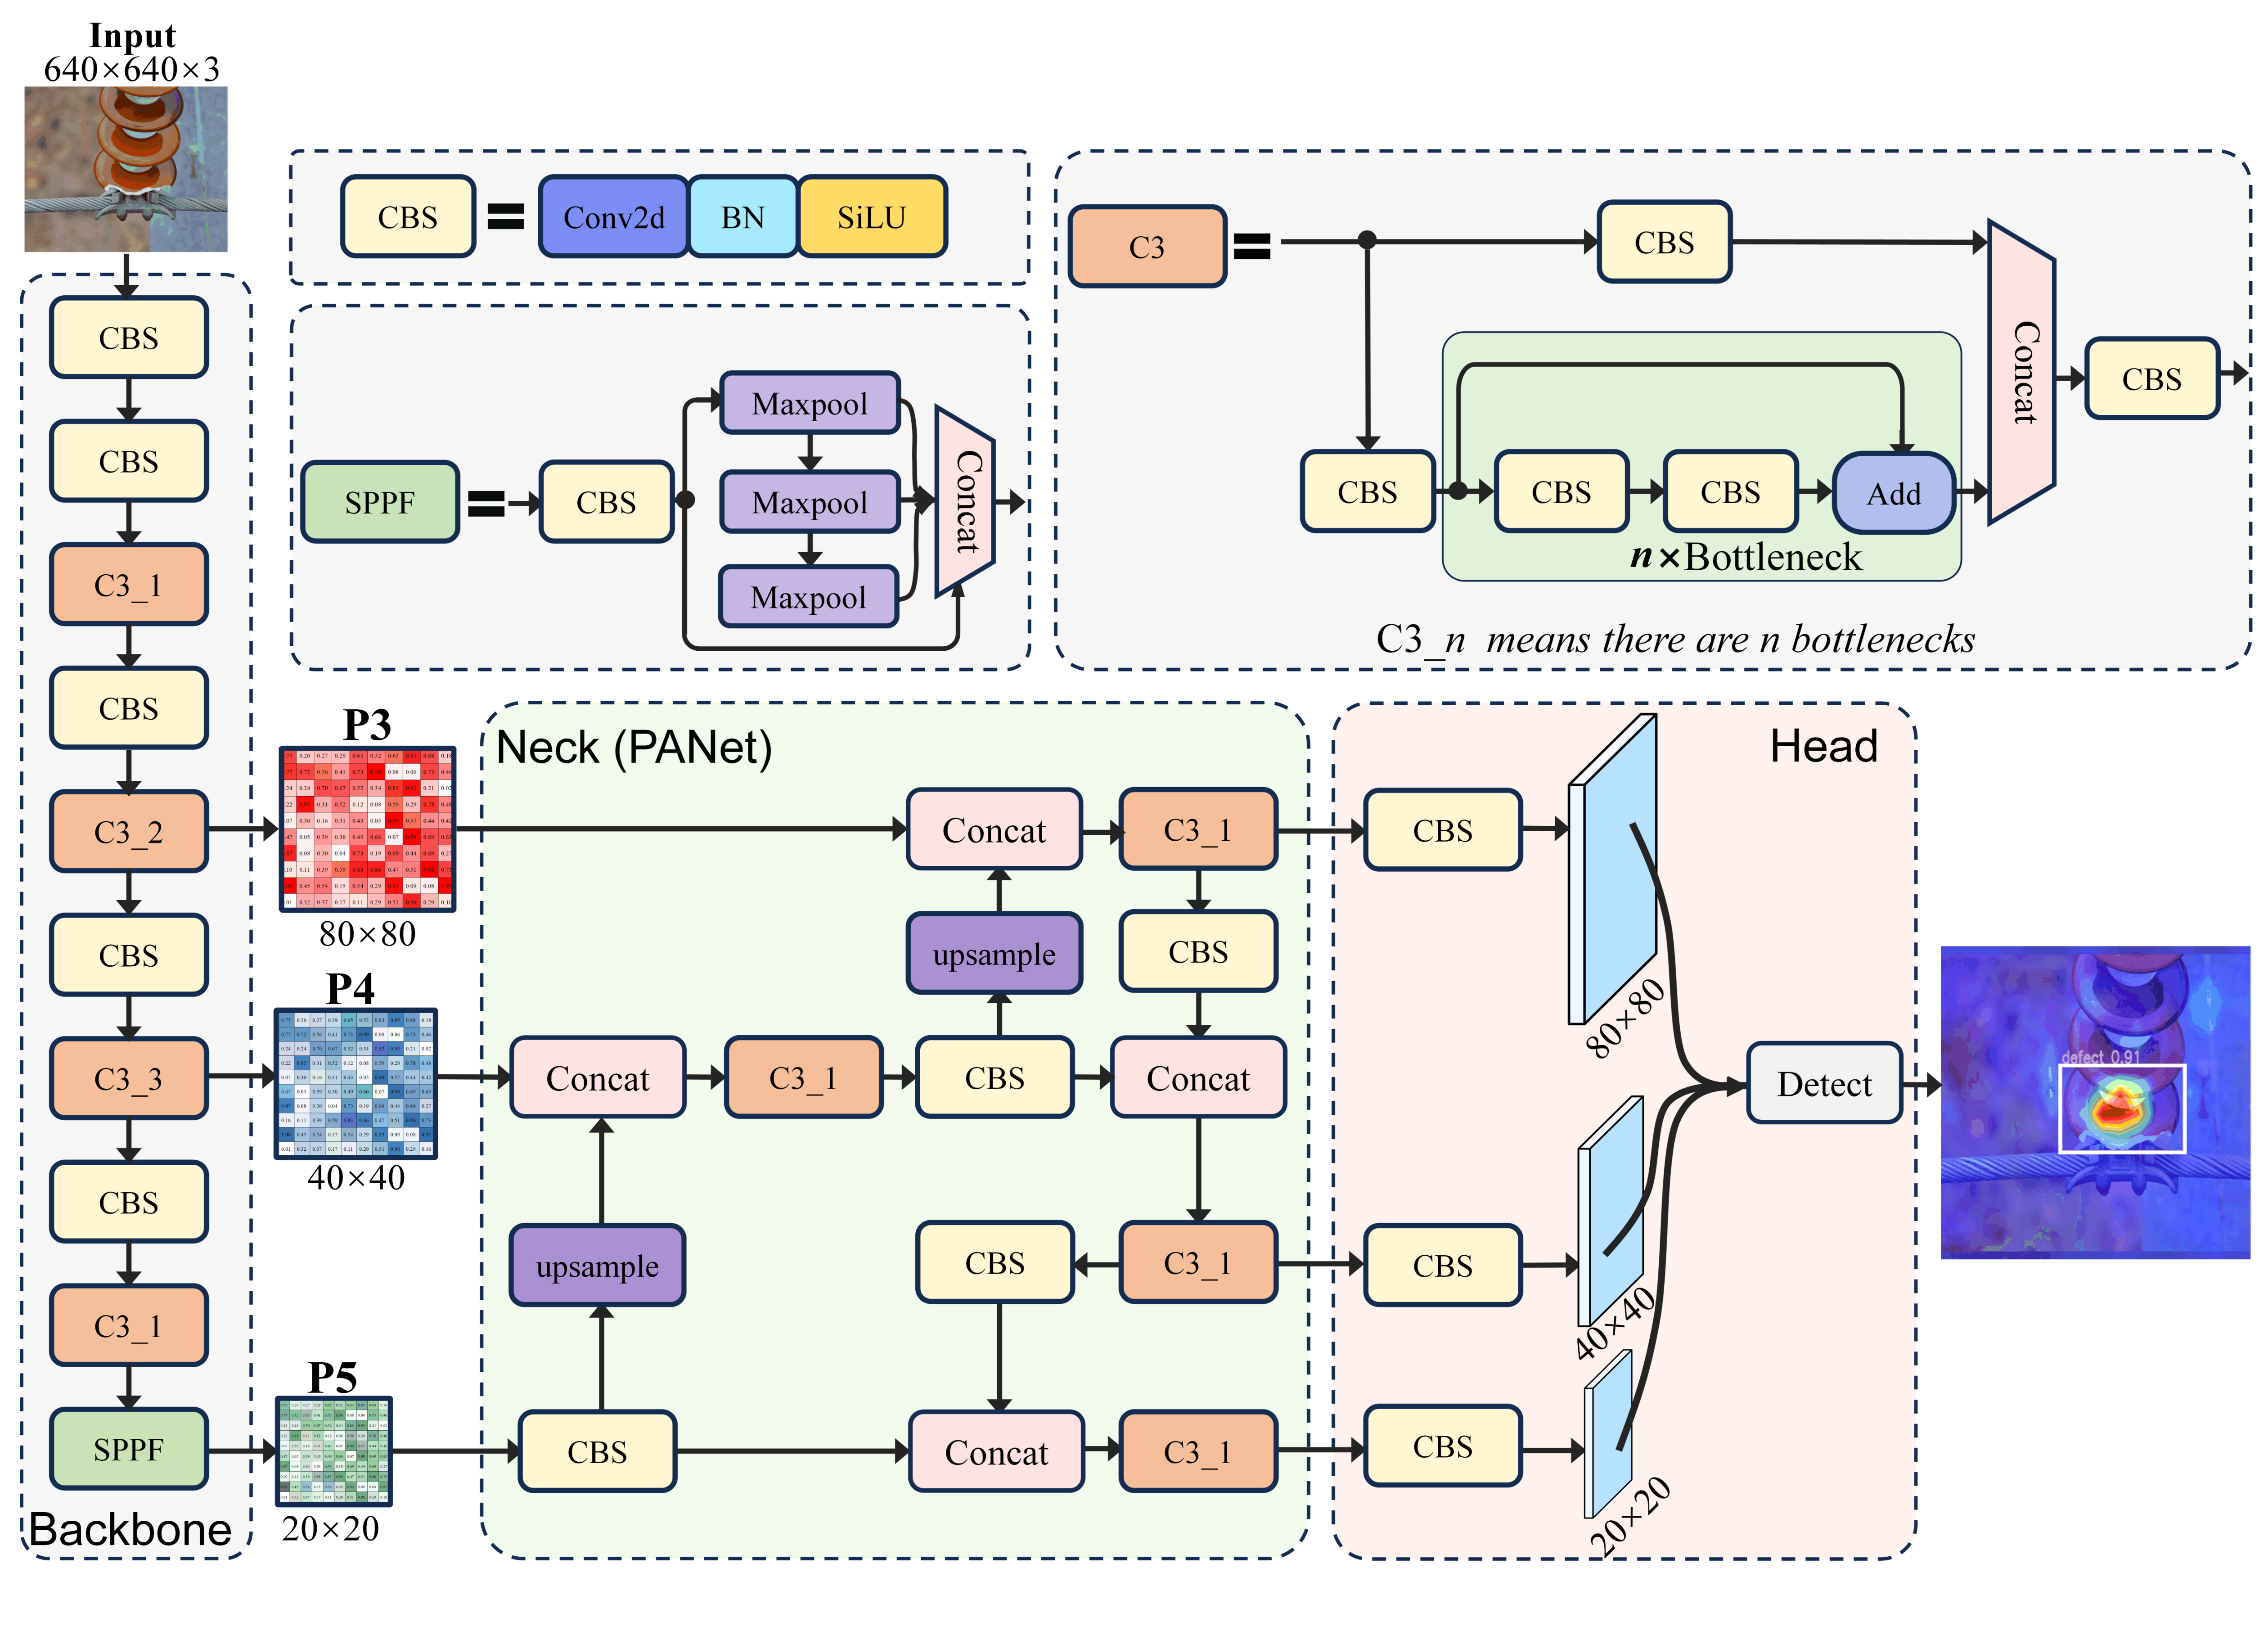
YOLO V5 [35], whose detailed architecture is provided in Figure A1, is used as the reference detector. The cross-stage partial Darknet53 (CSPDarknet53) backbone extracts hierarchical features, and the path aggregation network (PANet) combines them through top-down and bottom-up paths. Prediction heads at P3 (80 × 80), P4 (40 × 40), and P5 (20 × 20) estimate class probabilities, bounding-box coordinates, and object confidence. All subsequent comparisons retain this detection framework while varying the neck, backbone, or localization loss.
The training objective is evaluated at the P3 (80 × 80), P4 (40 × 40), and P5 (20 × 20) prediction scales and contains classification, bounding-box, and confidence terms. For each anchor, binary cross-entropy compares the predicted class probabilities with the ground-truth class labels. The classification loss is defined as follows:
l o s s cls = 1 N obj i = 1 N obj c classes y i , c log y ^ i , c + 1 y i , c log 1 y ^ i , c
where N obj is the number of anchor boxes containing a target, y i , c is the ground-truth class label, and y ^ i , c is the corresponding predicted class probability. The bounding-box term measures the difference between the detected (DT) boxes and ground-truth (GT) boxes.
For anchor boxes containing a target, the detector predicts the box coordinates and applies the IoU loss to measure disagreement between the DT and GT boxes. The bounding-box loss is expressed as follows:
l o s s box = 1 N obj i = 1 N obj j anchors y i , j o b j 1 IoU B i _ dt ,   B i _ gt IoU B dt ,   B gt = B i _ dt B i _ gt B i _ dt B i _ gt
where y i , j o b j indicates whether the ith anchor box contains a target, B i _ gt denotes the GT box, and B i _ dt denotes the predicted DT box. The confidence term compares the predicted probability of target presence with the corresponding ground-truth value using binary cross-entropy:
l o s s conf = 1 N obj i = 1 N obj j anchors y i , j o b j λ conf y i , j o b j log y ^ i , j o b j + 1 y i , j o b j log 1 y ^ i , j o b j
where y ^ i , j o b j denotes the predicted object confidence and λ conf is the weighting coefficient. The classification, bounding-box, and confidence losses from the P3, P4, and P5 prediction heads are weighted and aggregated to obtain L cls , L box , and L conf , respectively:
L cls = α 1 l o s s cls80 + α 2 l o s s cls40 + α 3 l o s s cls20 L box = α 1 l o s s box80 + α 2 l o s s box40 + α 3 l o s s box20 L conf = α 1 l o s s conf80 + α 2 l o s s conf40 + α 3 l o s s conf20
where α 1 ,   α 2 ,   α 3 denotes the weights assigned to the losses from the different prediction scales. The total objective is the weighted sum of the classification, bounding-box, and confidence terms:
L total = a L cls + b L box + c L conf
The confidence term is assigned the largest weight in the reported configuration. The three loss weights are set as follows: a = 0.3 ,   b = 0.3 ,   c = 0.4 .

2.2. Dataset and Training-Image Appearance Diversification

To broaden the range of visual appearances represented during training, this study uses CycleGAN [36] and a synthetic-fog procedure [26] to derive additional seasonal and fog-like training images. These transformations are used only for training-image appearance diversification. The synthetic-fog procedure is based on the dark-channel prior [37]. For a fog-free image I, the dark channel J dark at pixel (x, y) is computed over a local patch as follows:
J dark x ,   y = min c r , g , b min i , j ω x , y I c ( i , j ) ,
where ω x , y denotes the local patch centered at (x, y). Atmospheric light A is estimated from the pixel with the highest dark-channel intensity. A white mask is then applied to increase the minimum values of the three color channels and produce a fog-like appearance. The resulting image is defined by:
I fog x ,   y = I x ,   y × t x ,   y + A × 1 t x ,   y t x ,   y = e D 0.04 ω ω c 2 + h h c 2 + s ,
where I(x, y) is the original fog-free image, A is the atmospheric-light brightness, and t x ,   y is the transmission map. ω c ,   h c denotes the image center, s is the fogging size, and D is the fog-thickness coefficient.
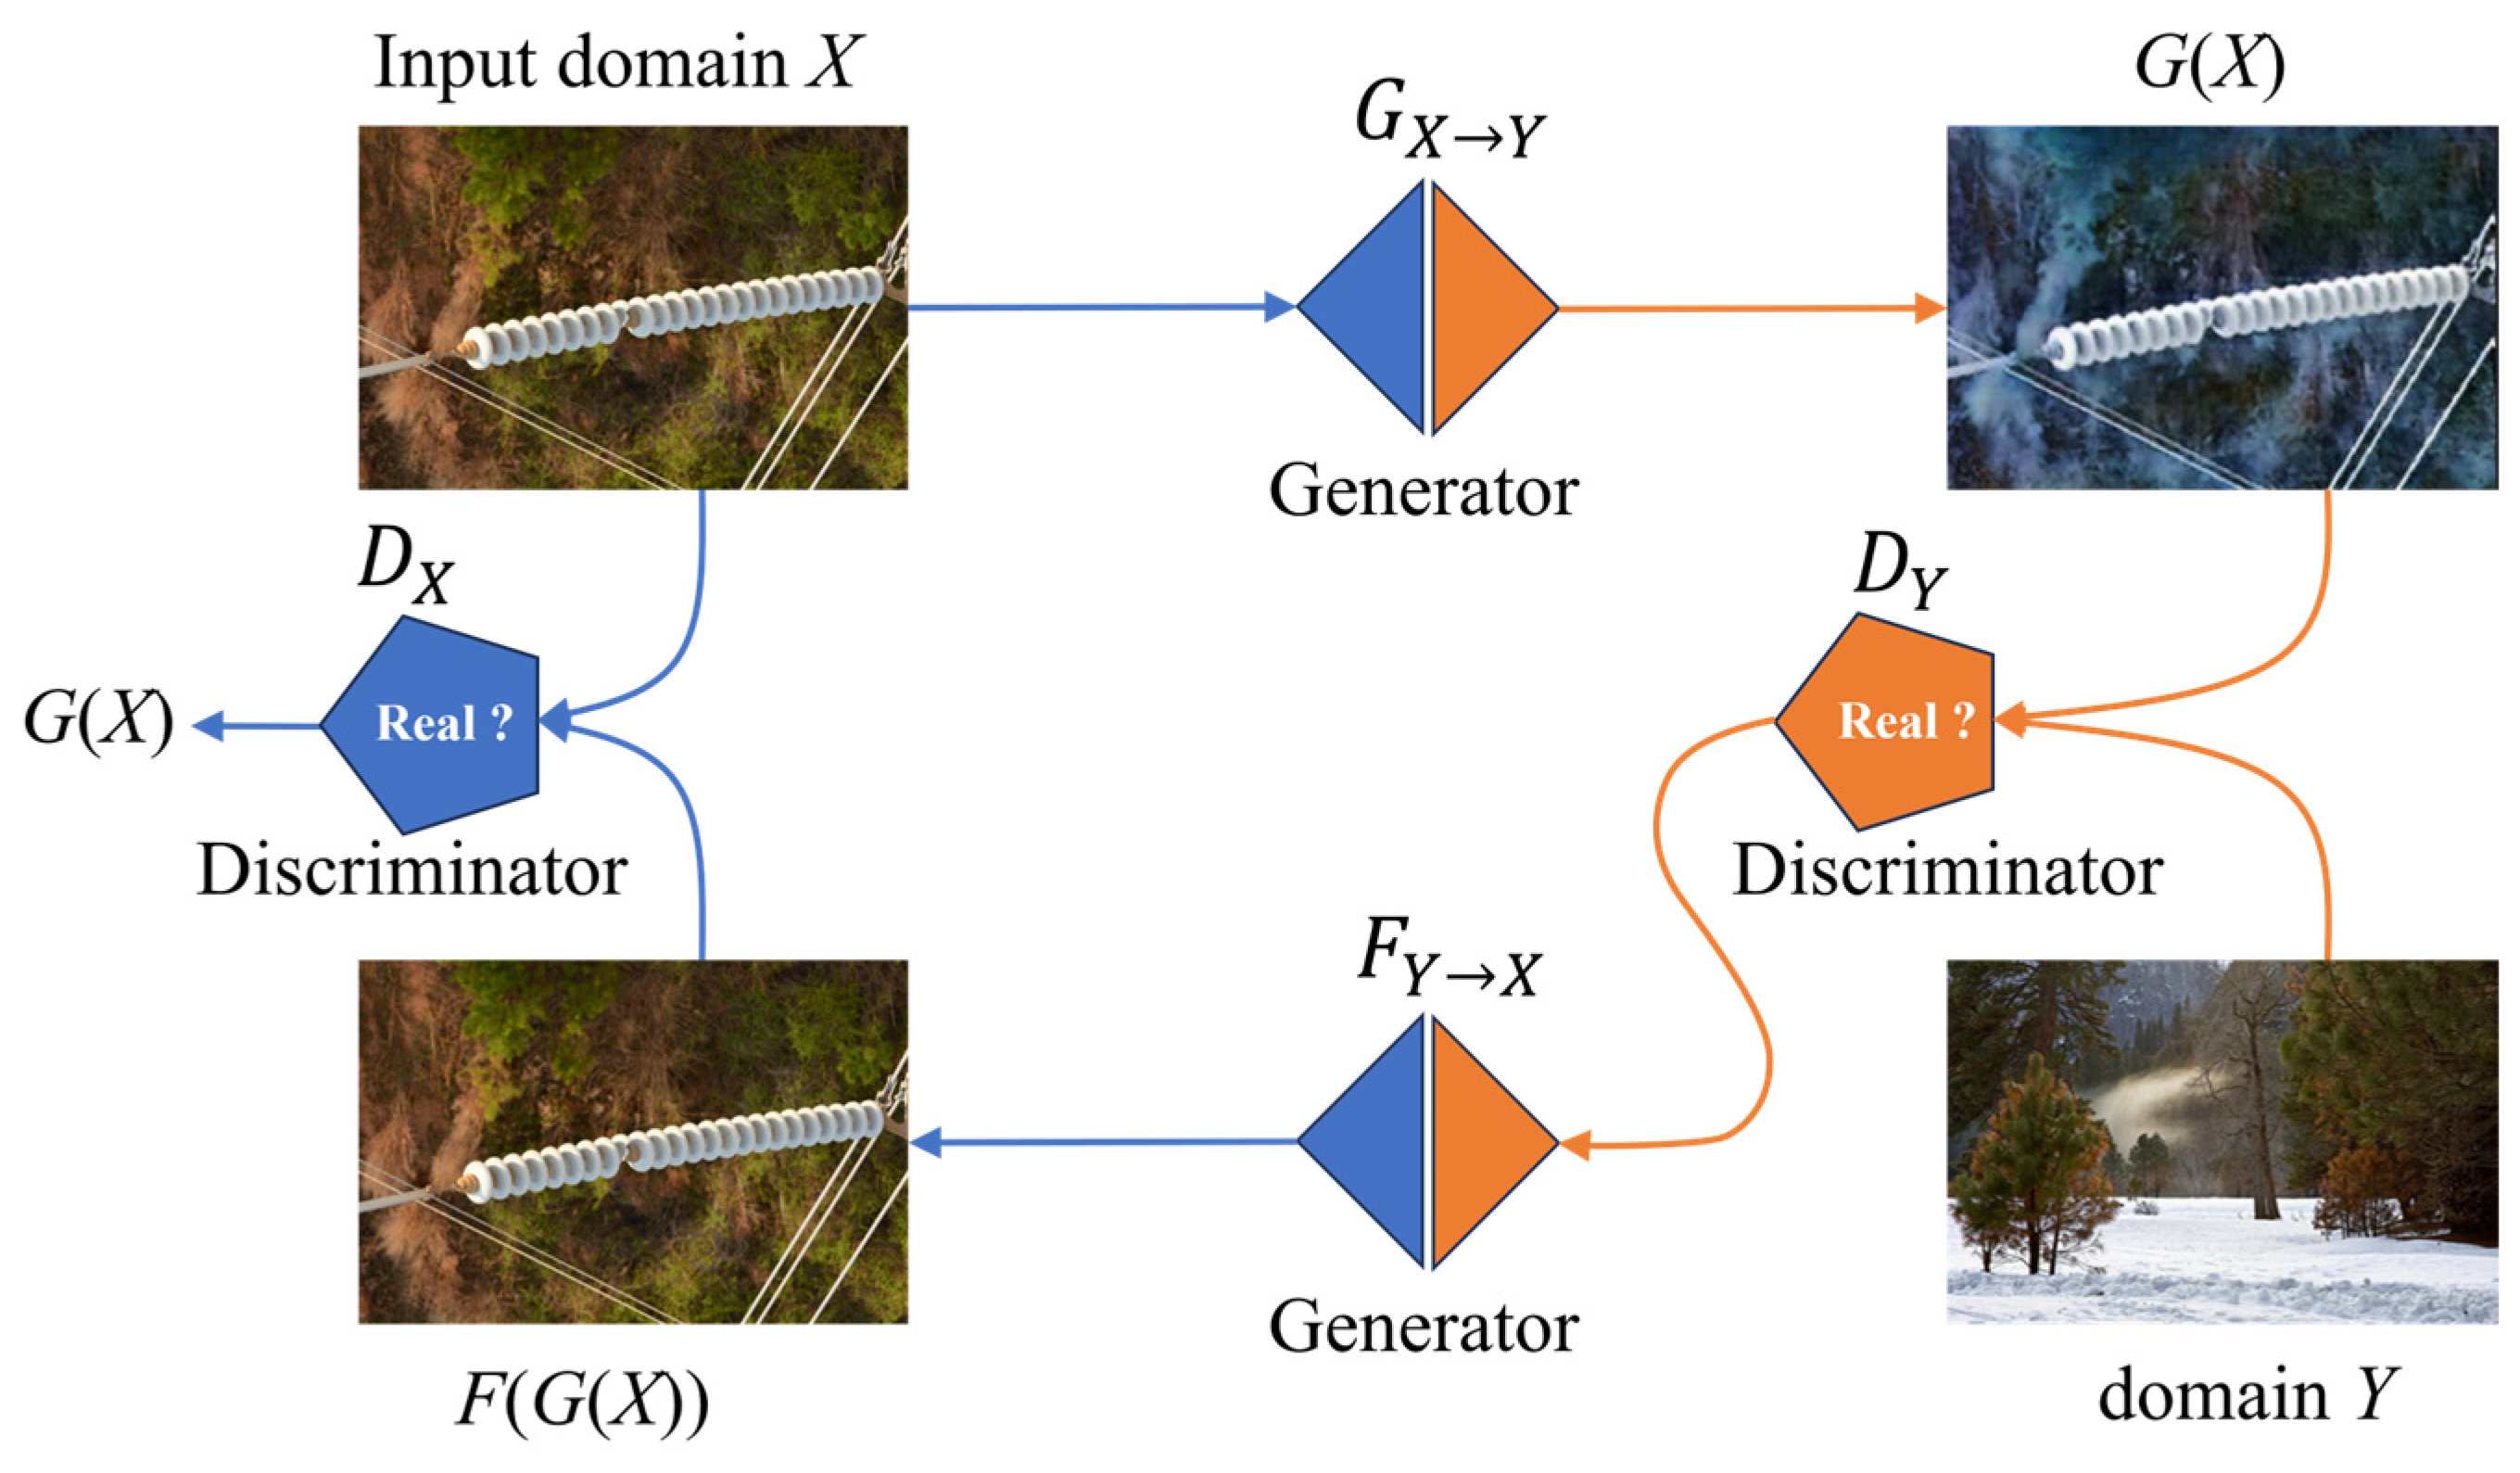
CycleGAN is also used for unpaired seasonal appearance transfer from summer insulator images to winter-like scenes with snow cover, together with reduced image resolution. The model learns mappings between two image domains while enforcing cycle consistency through two generators and their associated discriminators. A detailed schematic of the workflow is provided in Figure A2. The two generators, G : X Y and F : Y X , map images between domains X and Y, while discriminators DX and DY distinguish real domain images from generated images. Cycle consistency requires an image translated from one domain to the other and back again to remain close to its input, represented by F G x x and G F y y . The adversarial terms encourage domain-consistent outputs, and the cycle-consistency term limits content changes during the two mappings. Generators and discriminators are updated alternately during training.
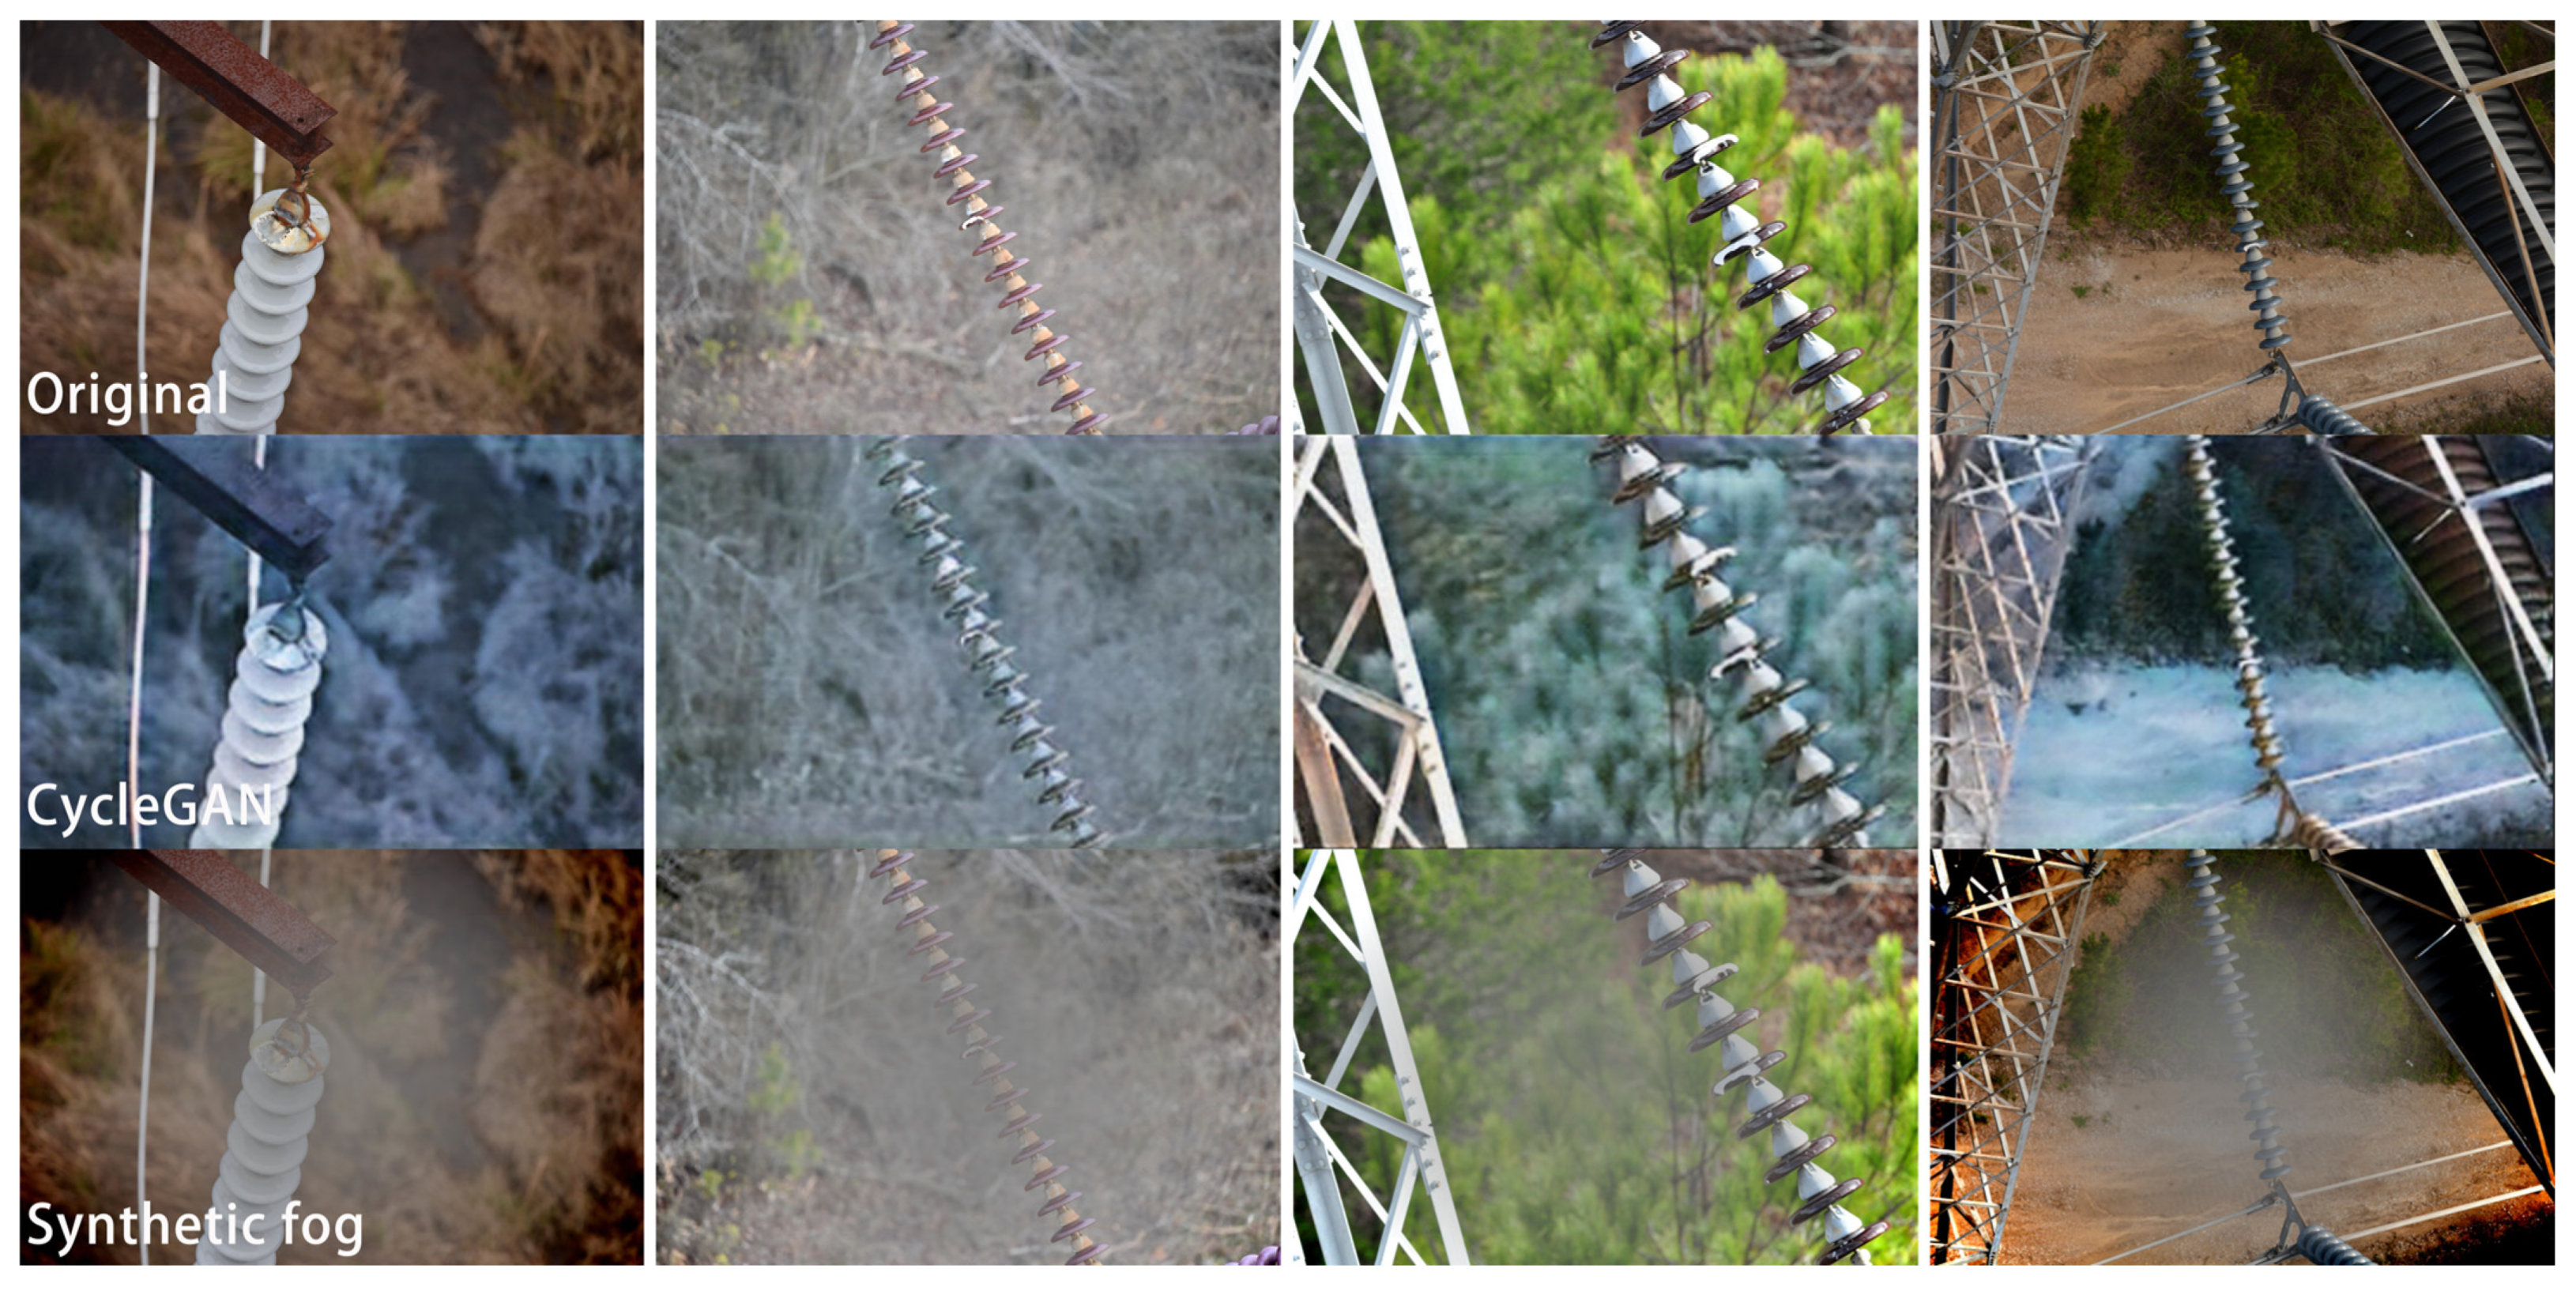
The dataset was compiled from publicly available insulator images [38,39], comprising 2536 source images in total. These images were first partitioned at the source-image level into 1775 training images, 507 validation images, and 254 test images. Appearance transformations were applied only after this partitioning step. For each training image, one CycleGAN-derived image and one synthetically fogged image were generated. The final training set therefore contained 1775 original images, 1775 CycleGAN-derived images, and 1775 synthetic-fog images, corresponding to a 1:1:1 ratio and a total of 5325 training images. The validation and test sets were kept unchanged throughout all experiments, preventing transformed variants derived from training images from entering the evaluation subsets. The cumulative object-instance counts at different stages of training-image diversification are reported in Table 1, with representative examples shown in Figure 2.
Unless otherwise specified, all subsequent comparisons of localization losses, neck architectures, and backbones were conducted using this same appearance-diversified training set. Accordingly, the common PANet baseline corresponds to the appearance-diversified setting in Table 2, which achieves 95.8% mAP@0.5 and 82.2% mAP@0.5:0.95, rather than the general-augmentation setting (95.6% and 79.7%, respectively). The reported PRA and BRA gains are therefore calculated relative to PANet trained on the identical training set.

2.3. Detection Framework and Receptive-Field-Aware Adaptive Fusion

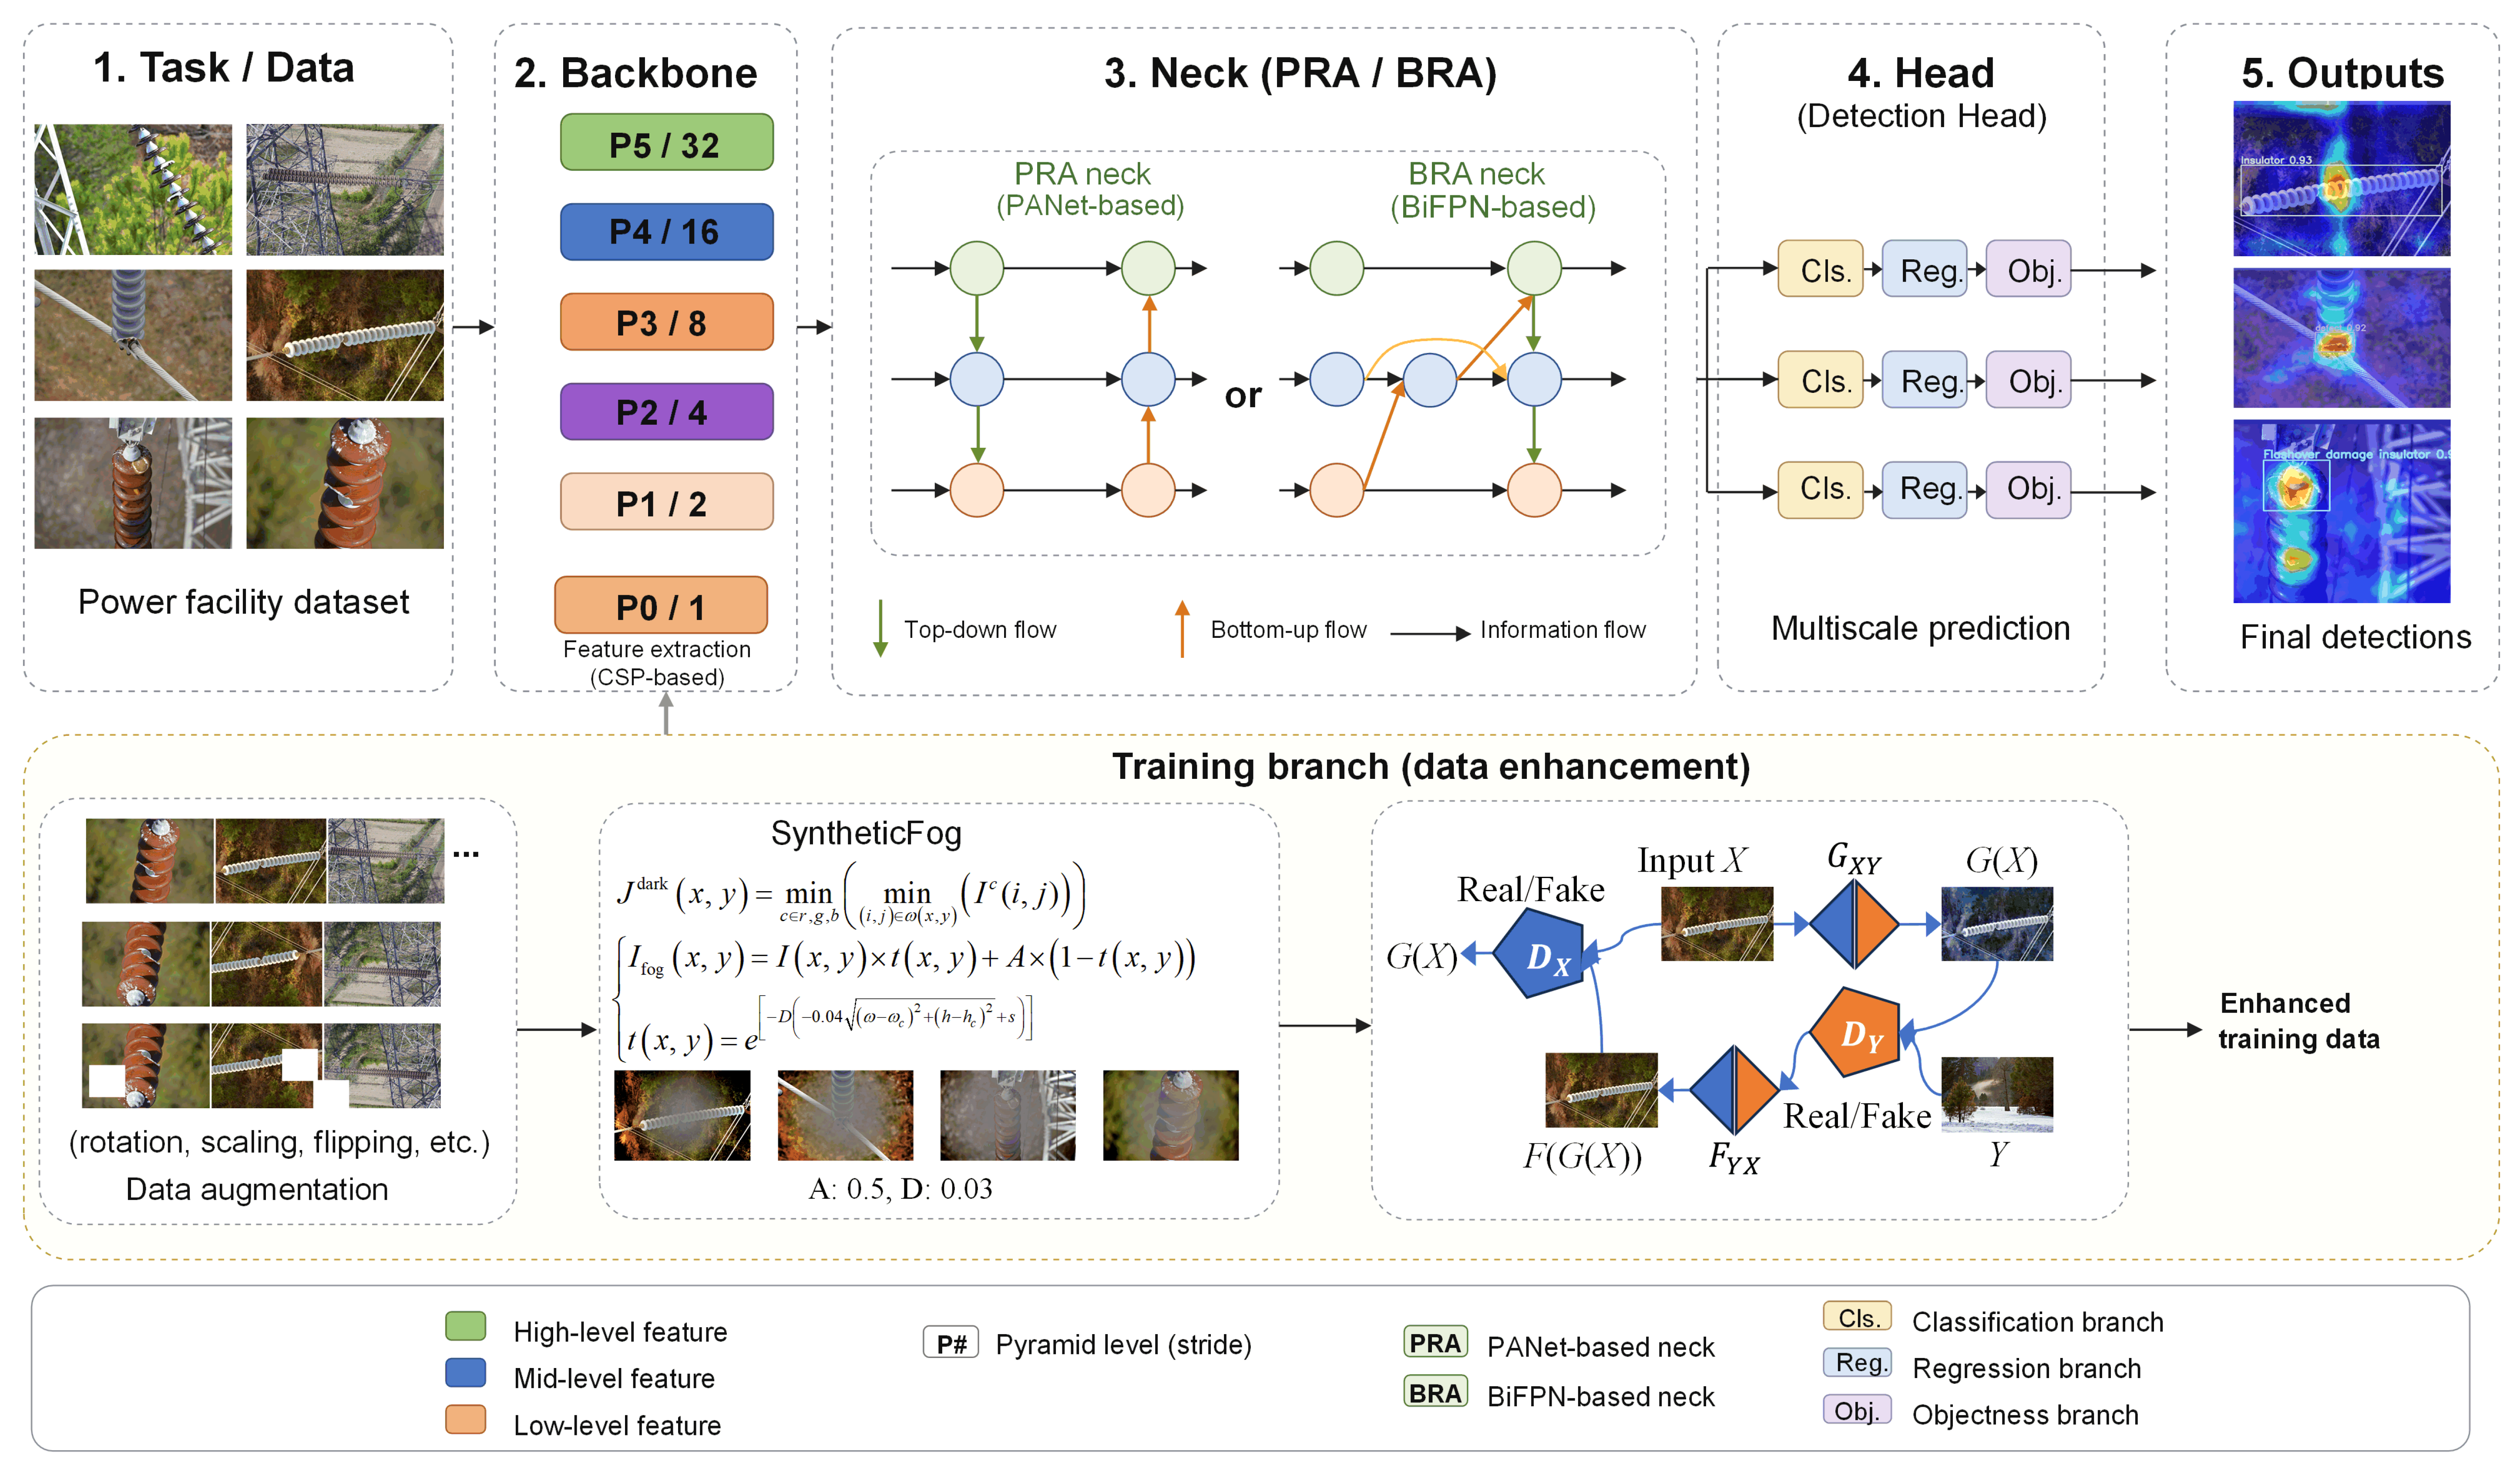
The experimental pipeline in Figure 3 places the proposed necks within a common detection framework. Training-image appearance transformations, backbone representation, cross-scale fusion, and box-regression loss are evaluated as connected design choices rather than independent research threads. PRA and BRA form the main architectural contribution; the candidate convolutional and vision-transformer backbones and the IoU-based losses are used to examine their compatibility within the same one-stage detector. This arrangement allows the experiments to relate each choice to the joint recognition of complete insulator strings and the more localized broken-shell and flashover-damage classes.
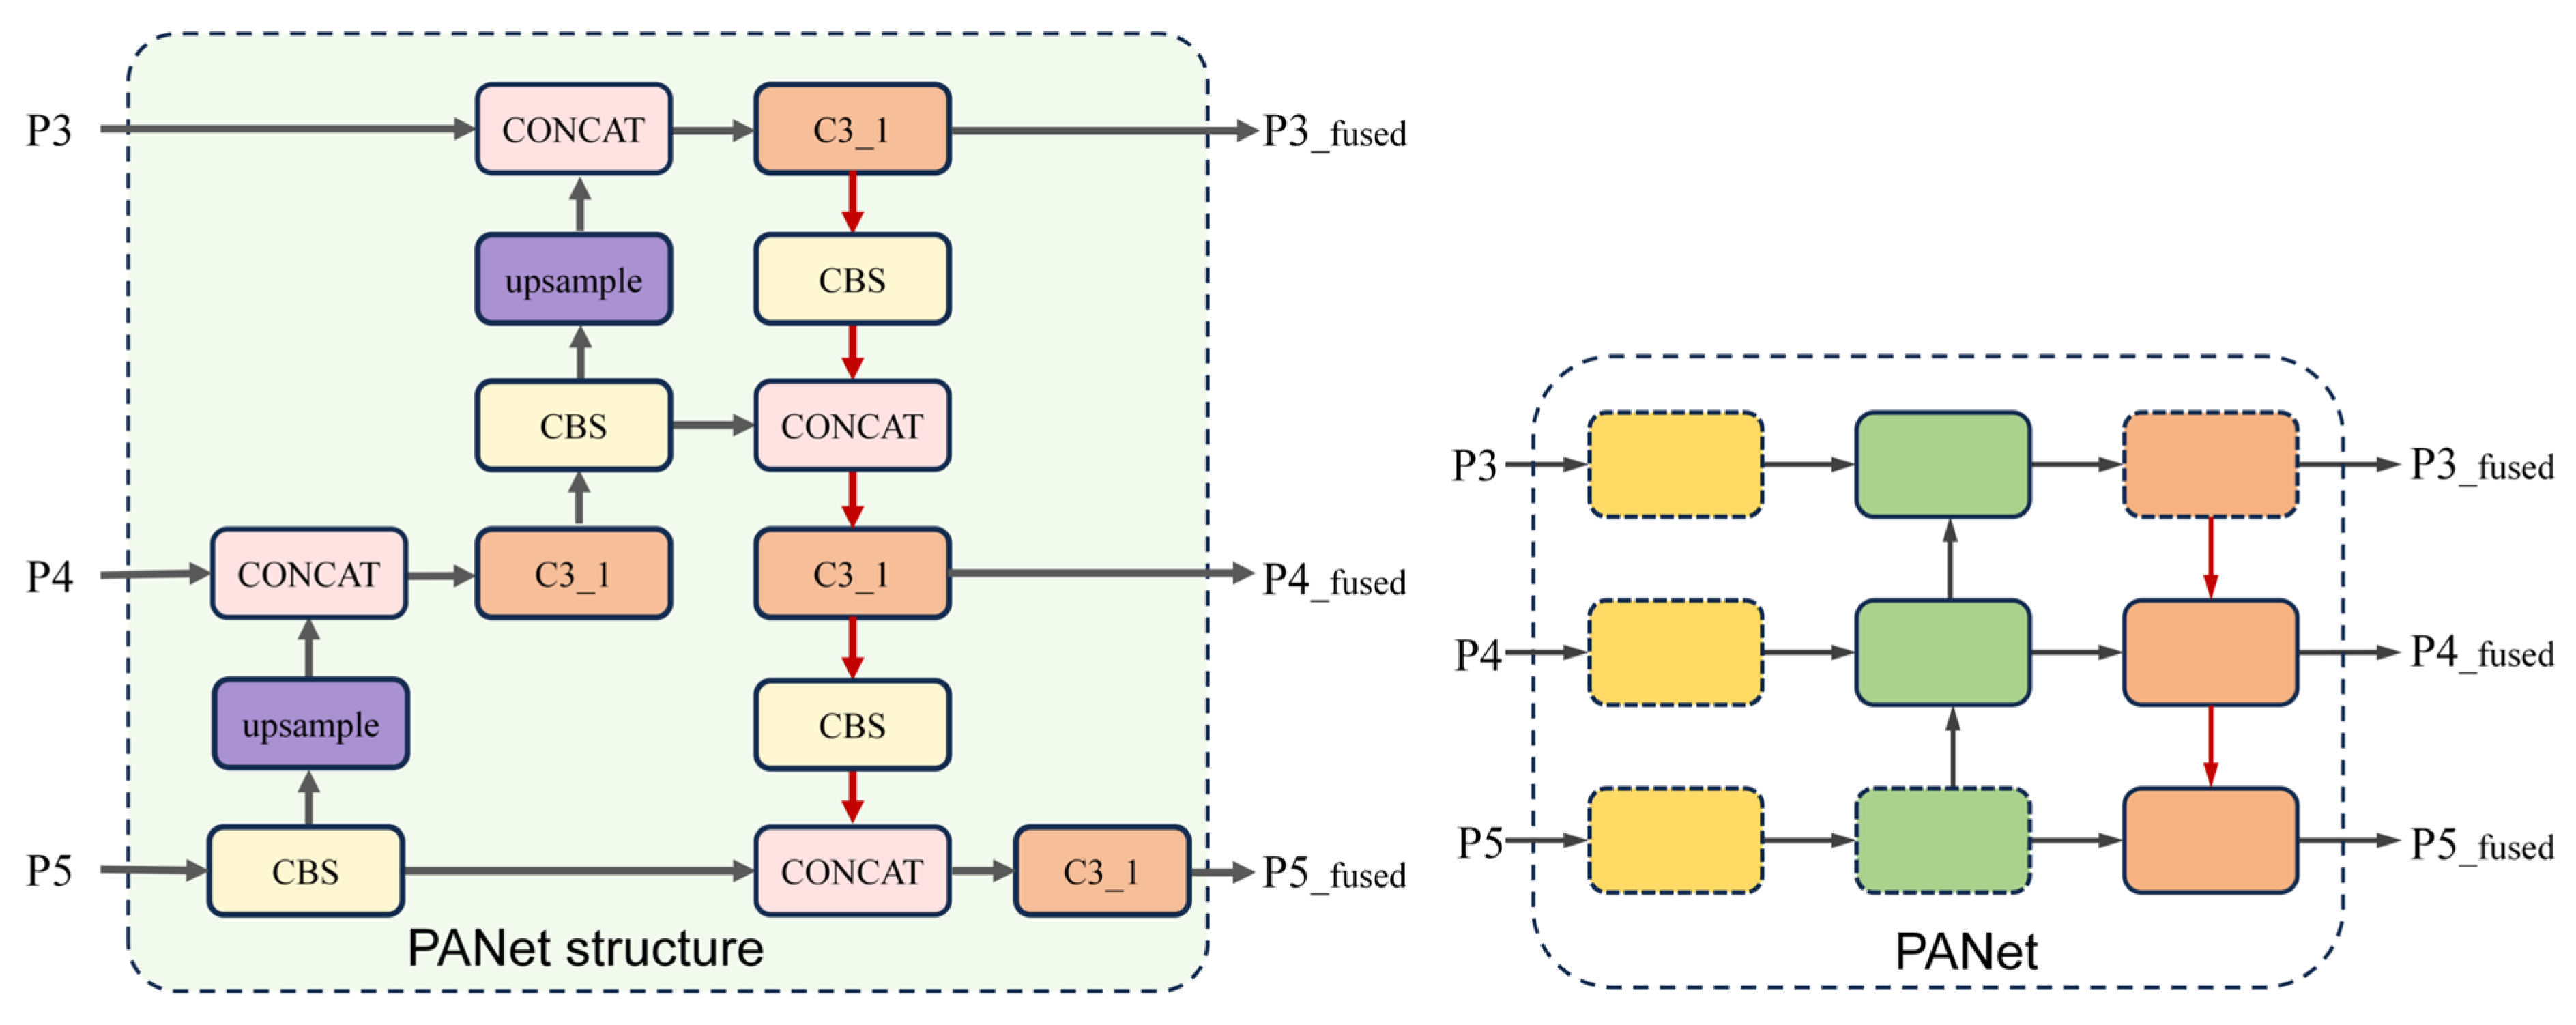
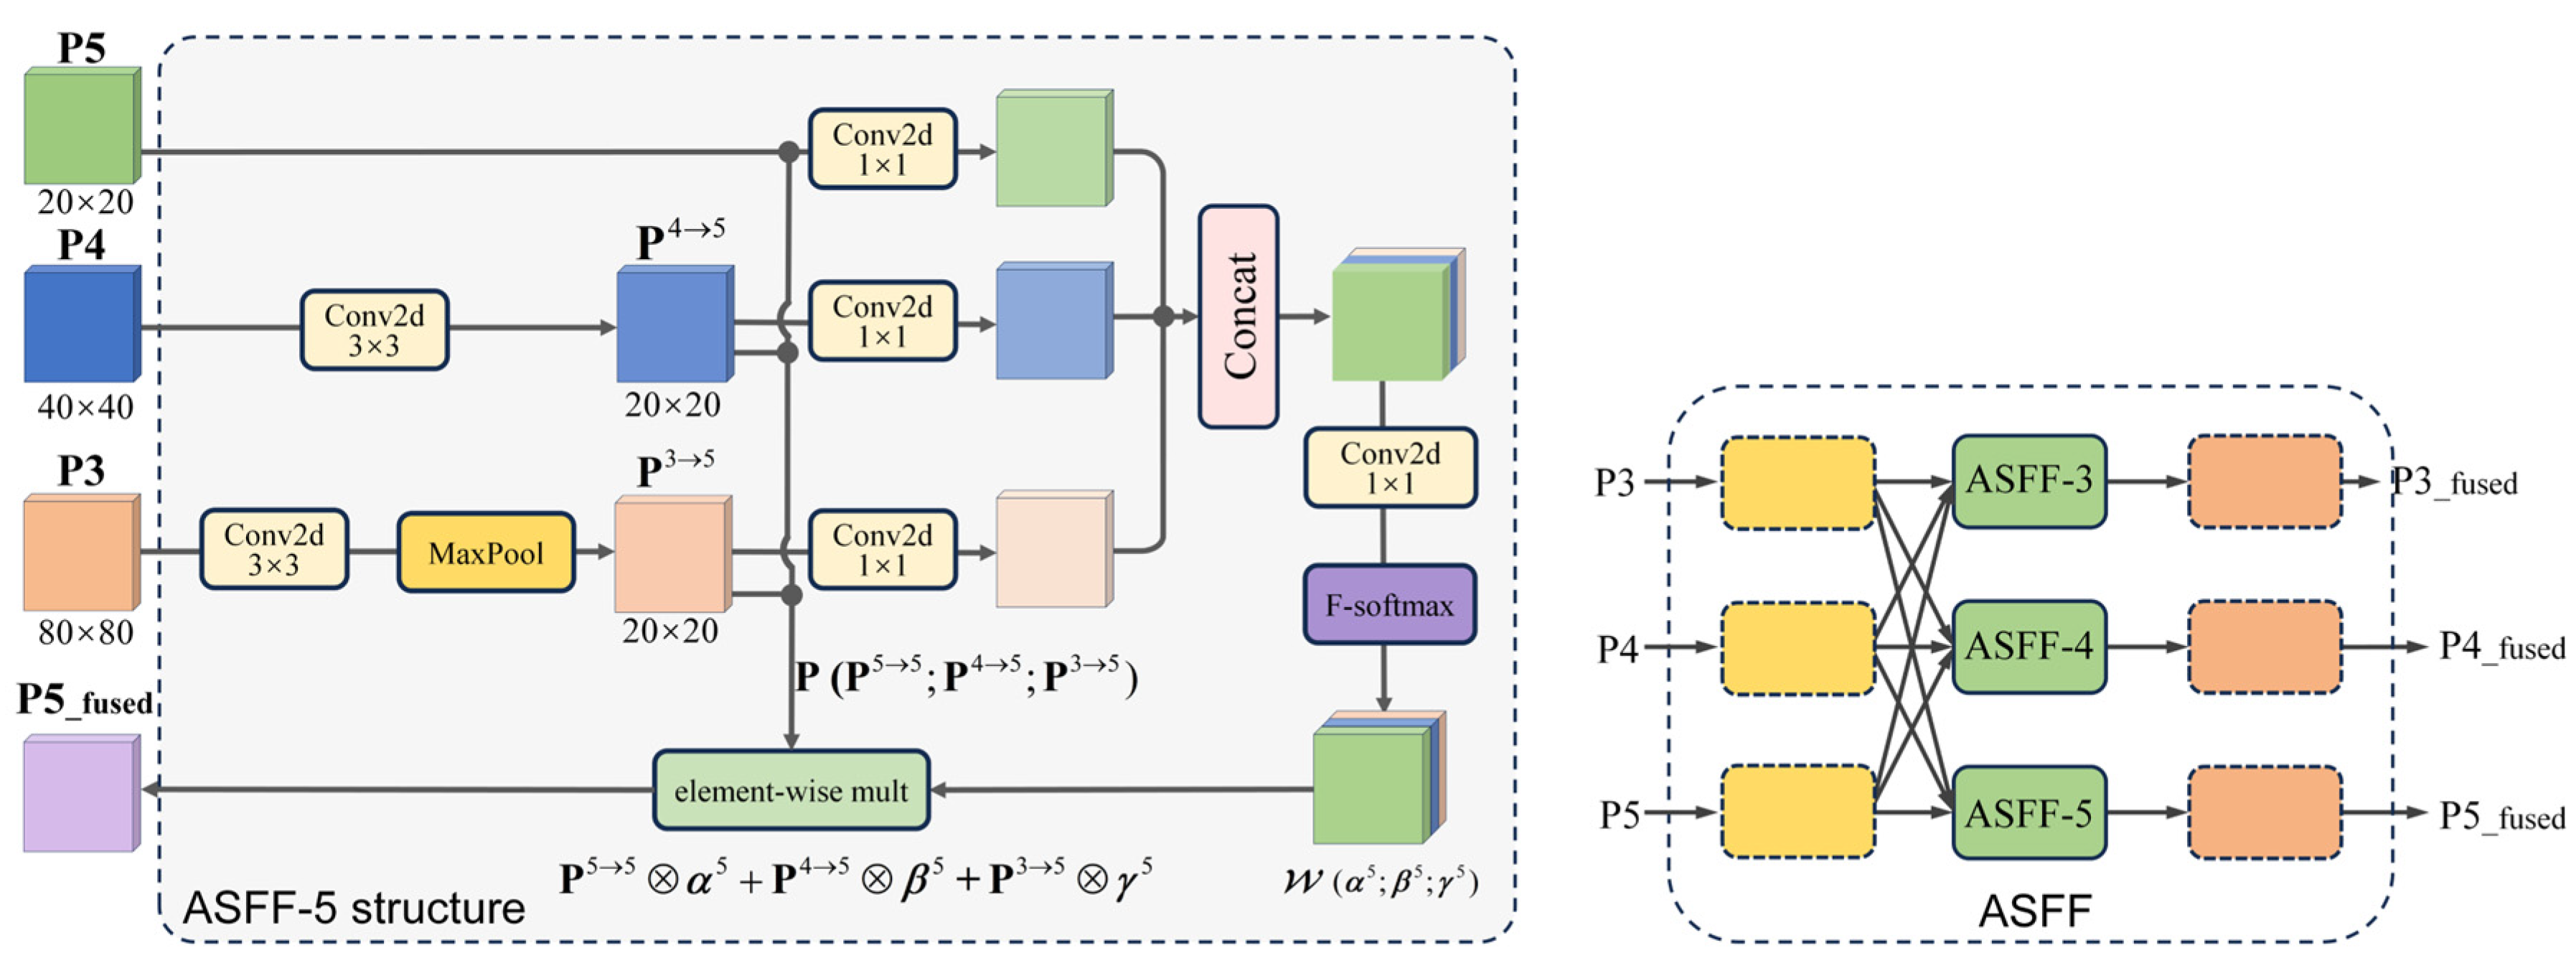
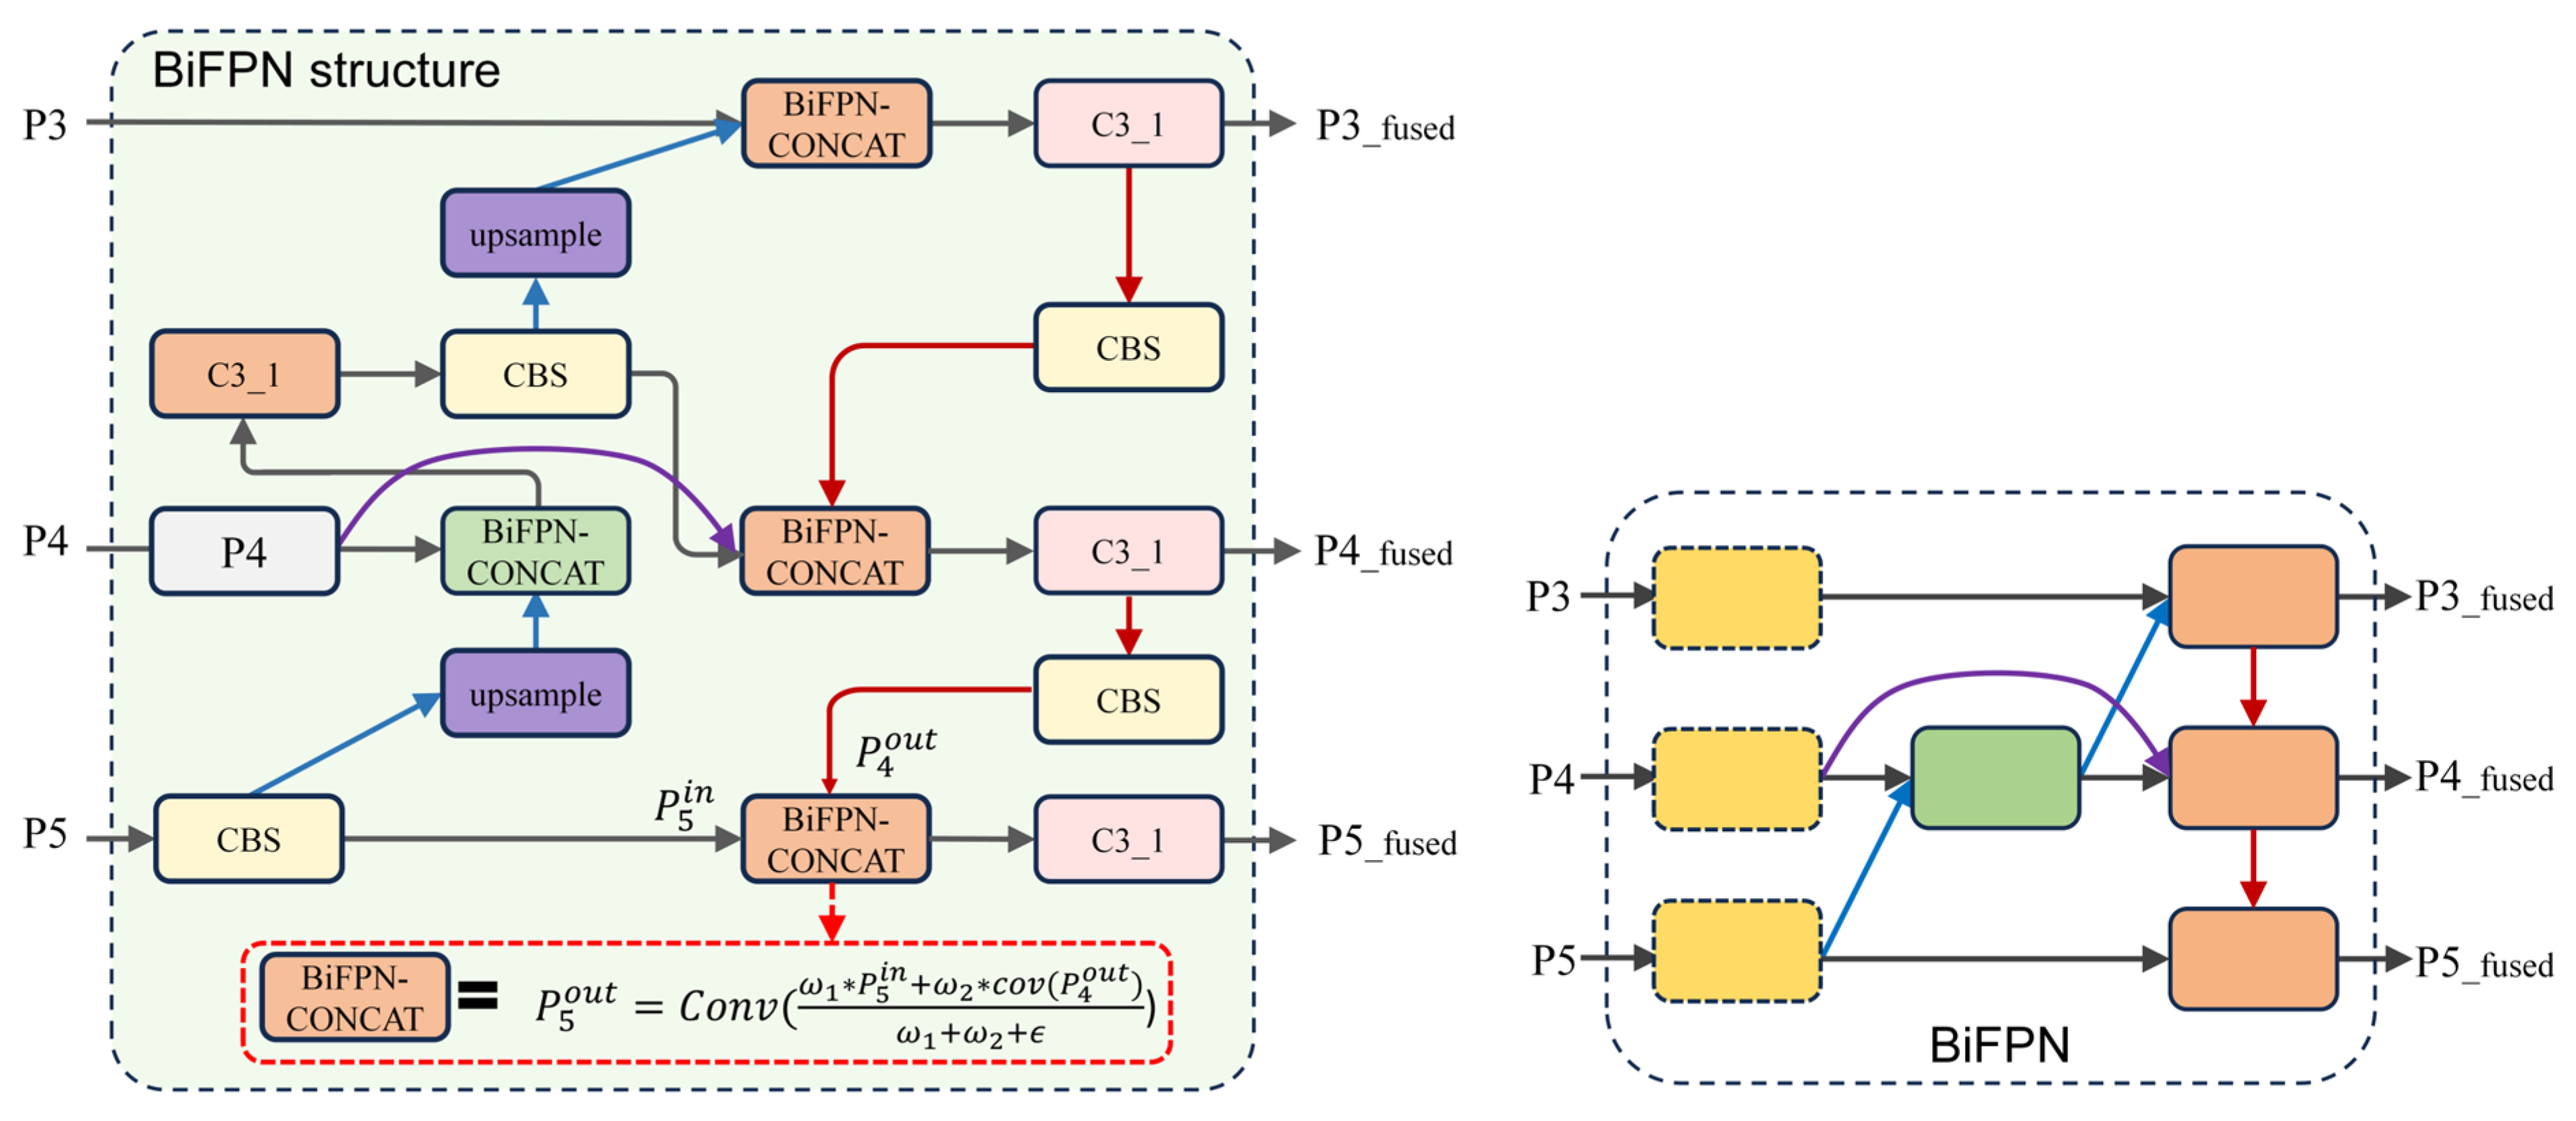
PANet [40], with its detailed topology provided in Figure A3, provides the reference fusion topology. It combines P3 (80 × 80), P4 (40 × 40), and P5 (20 × 20) features through top-down and bottom-up paths. The top-down path upsamples the low-resolution, semantically rich P5 features and merges them with higher-resolution features, after which the bottom-up path propagates spatial detail toward the lower-resolution levels. The resulting P3, P4, and P5 maps are supplied to the three detection heads. Adaptive spatial feature fusion (ASFF) [41] assigns scale-dependent weights to aligned feature maps at each pyramid level, with its detailed P5 weighting schematic provided in Figure A4. The learned weights determine the contribution of each resized feature map during fusion. Bidirectional feature pyramid network (BiFPN) [42], detailed in Figure A5, combines top-down and bottom-up propagation with an additional same-scale connection and normalized learnable weights. Together, these designs provide two complementary mechanisms for controlling information exchange across pyramid levels.
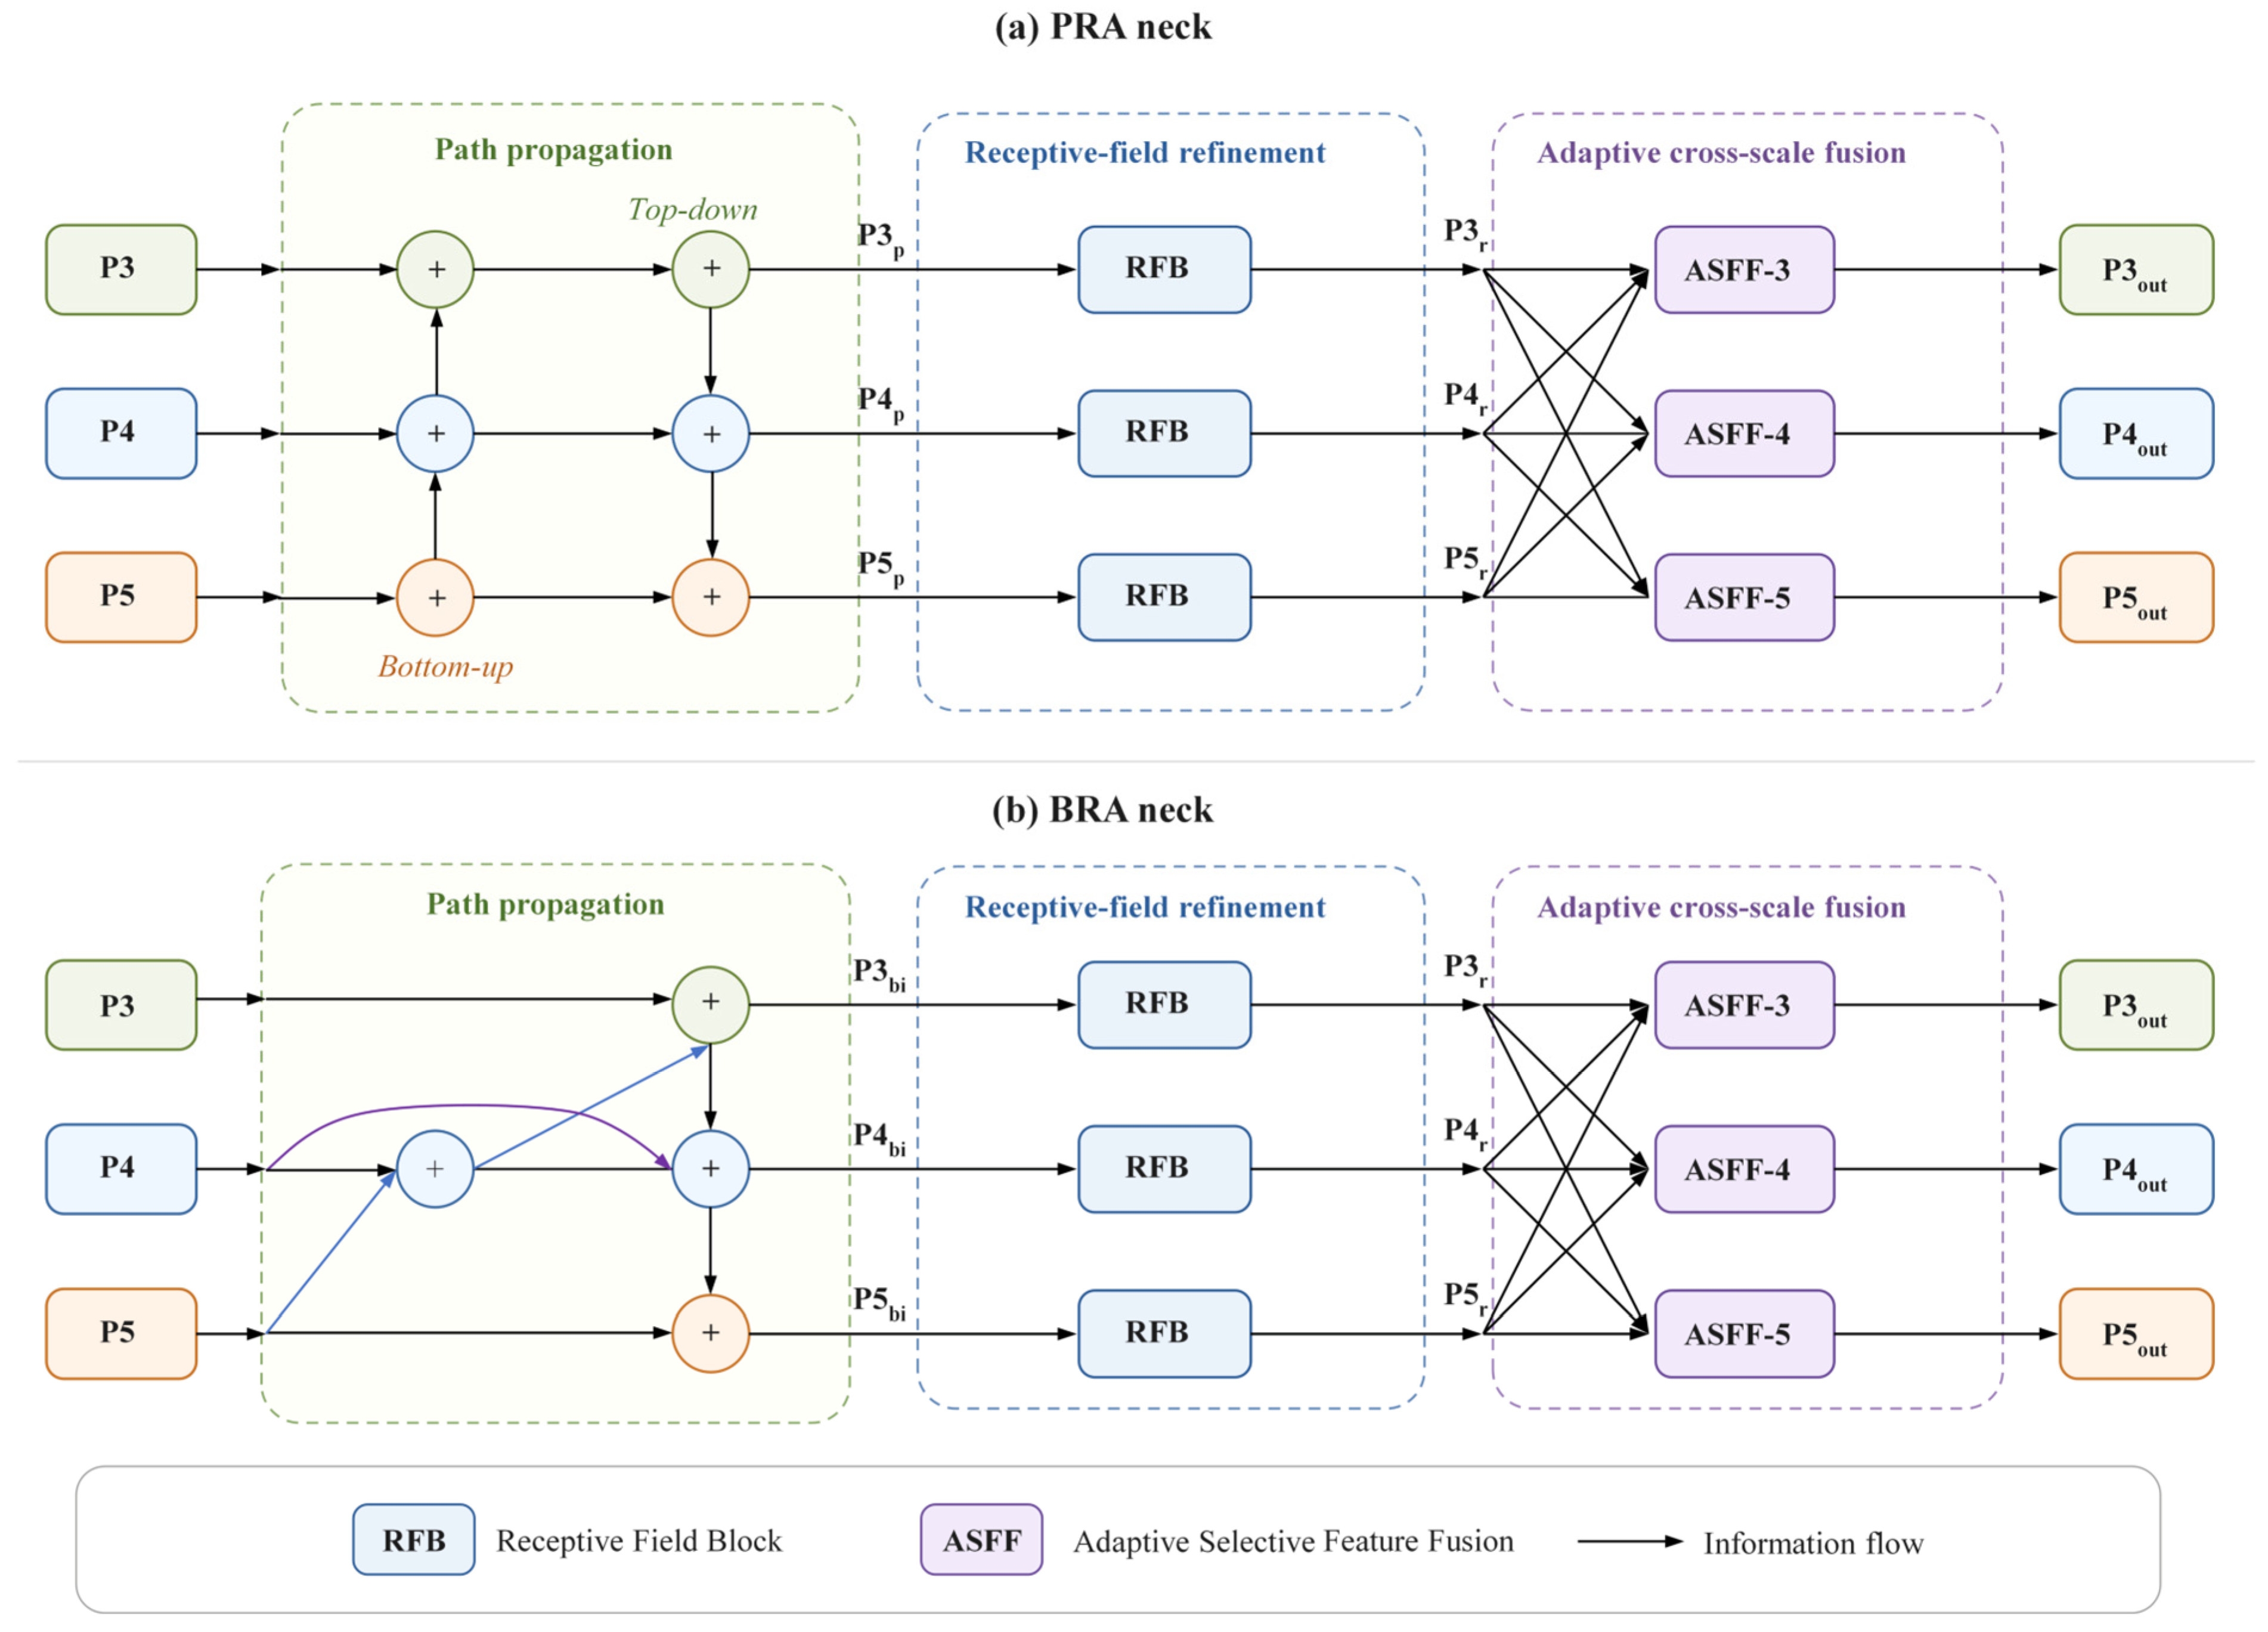
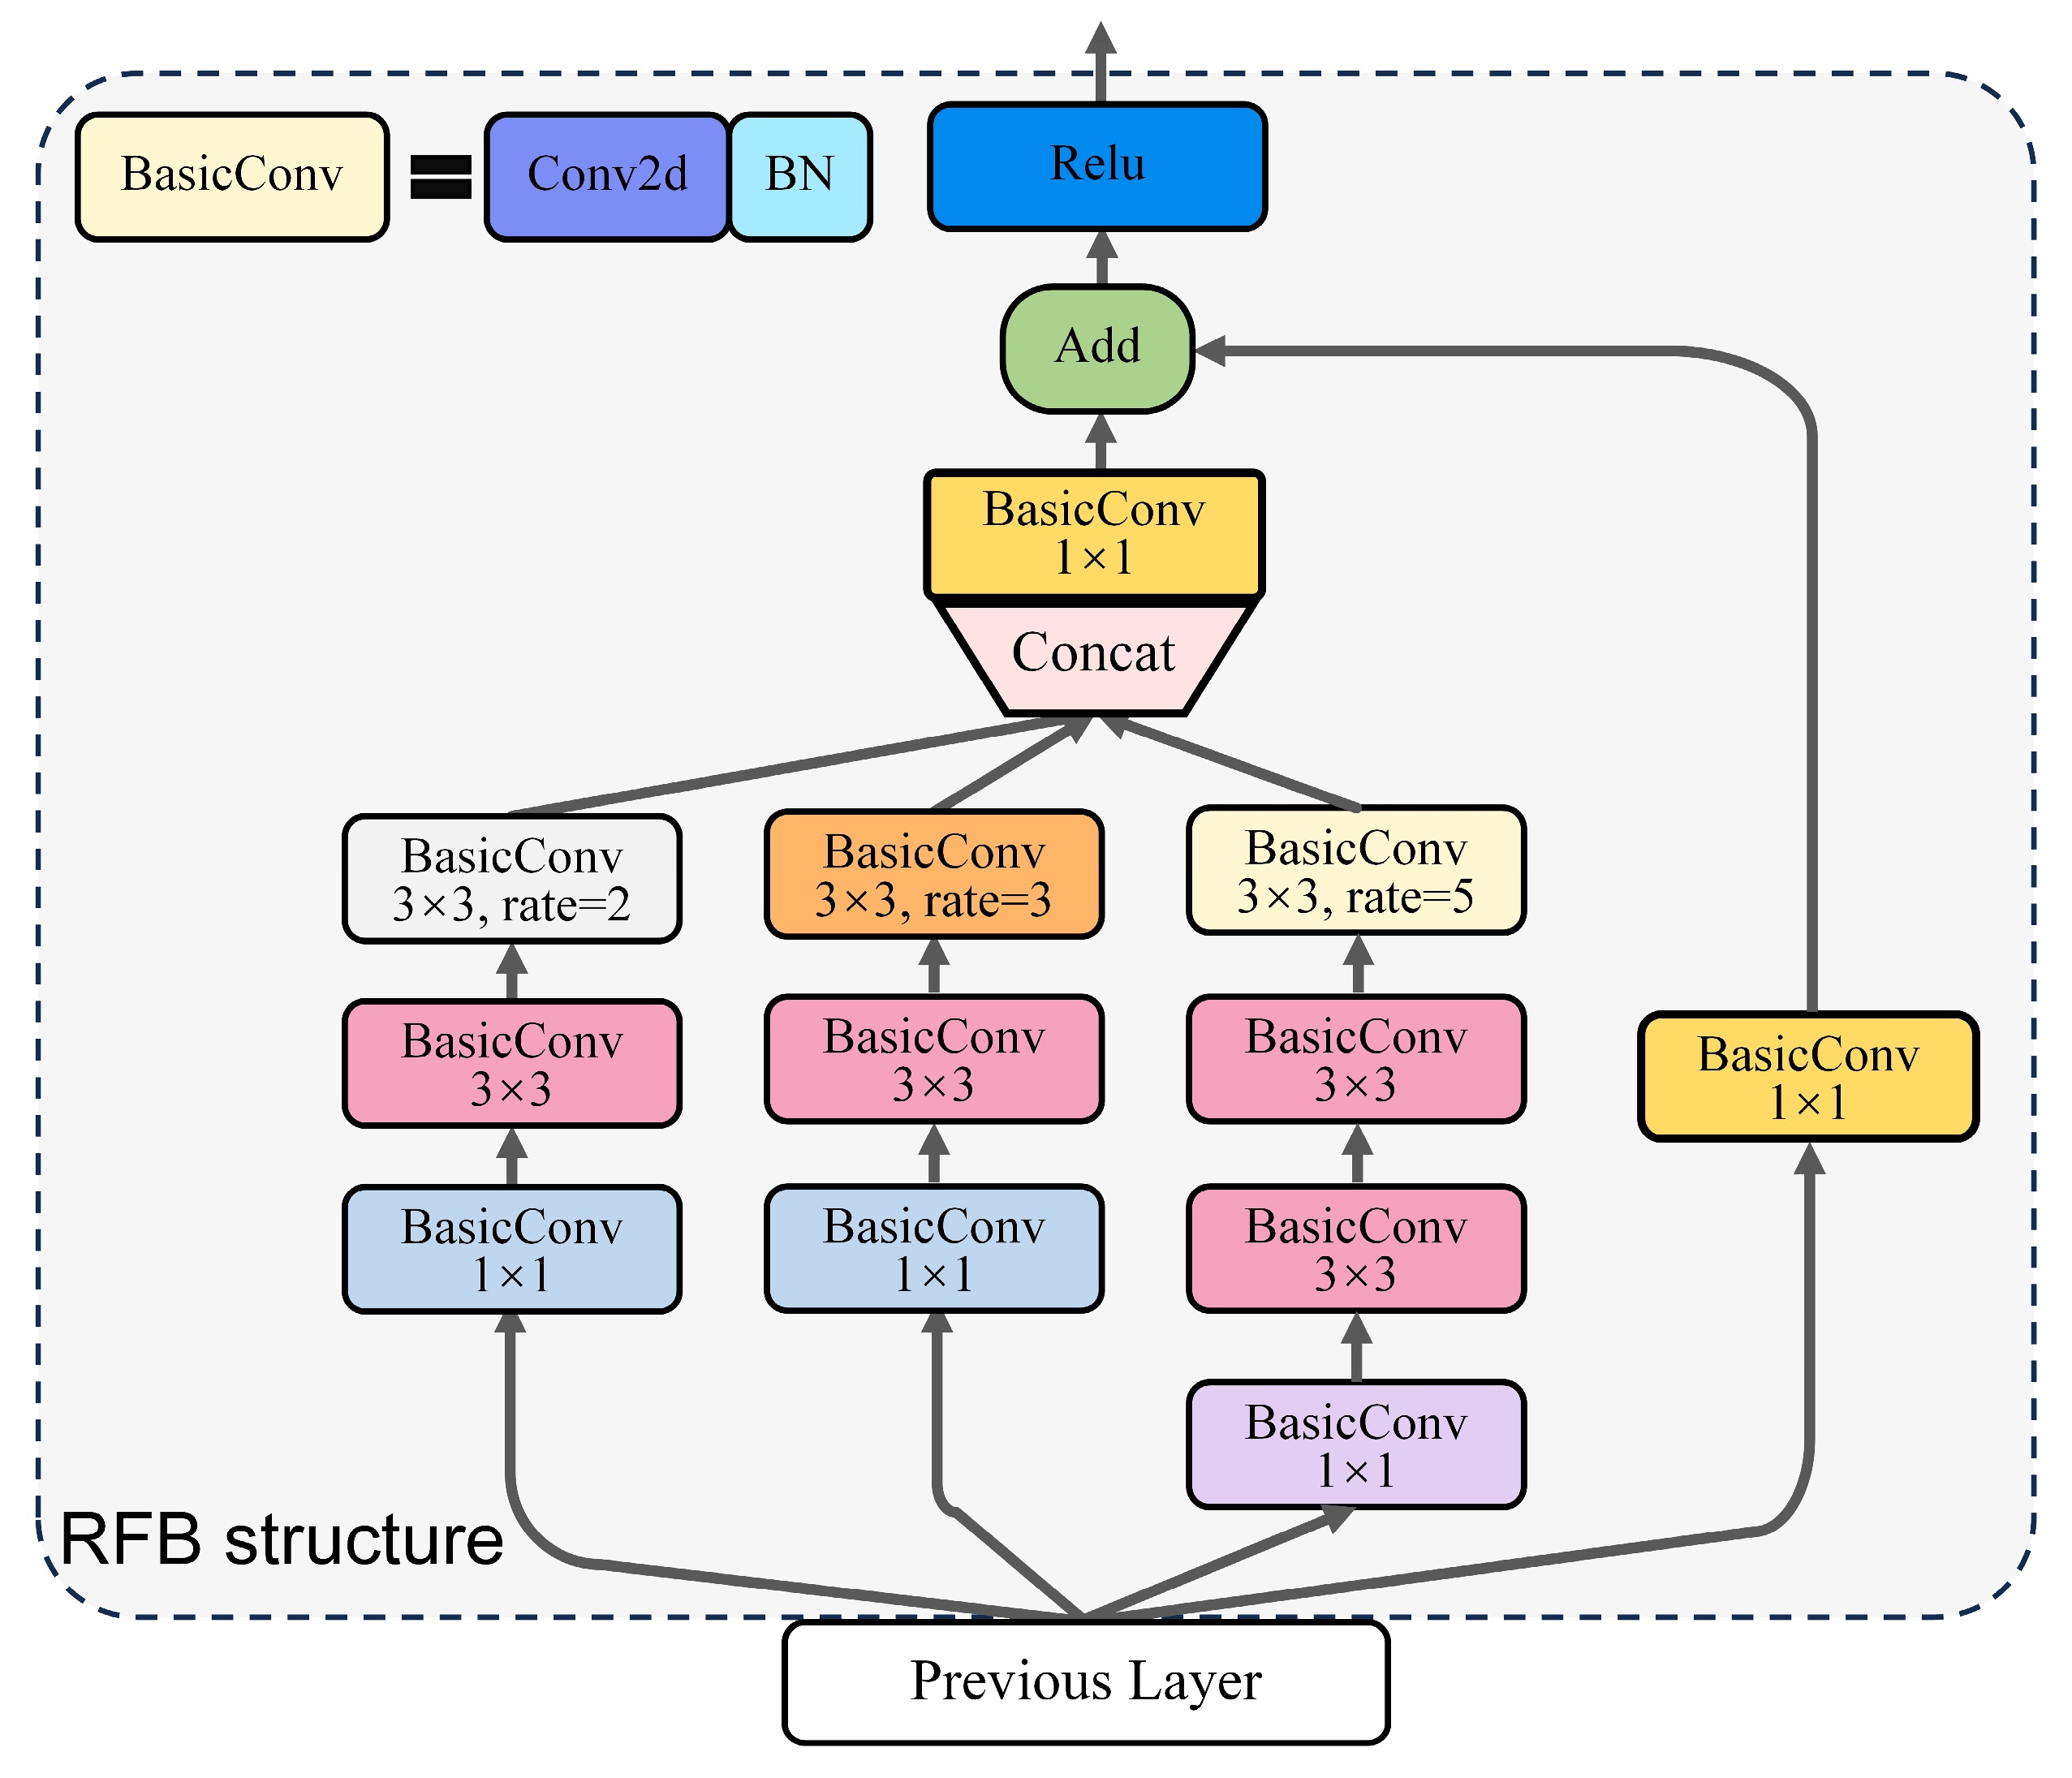
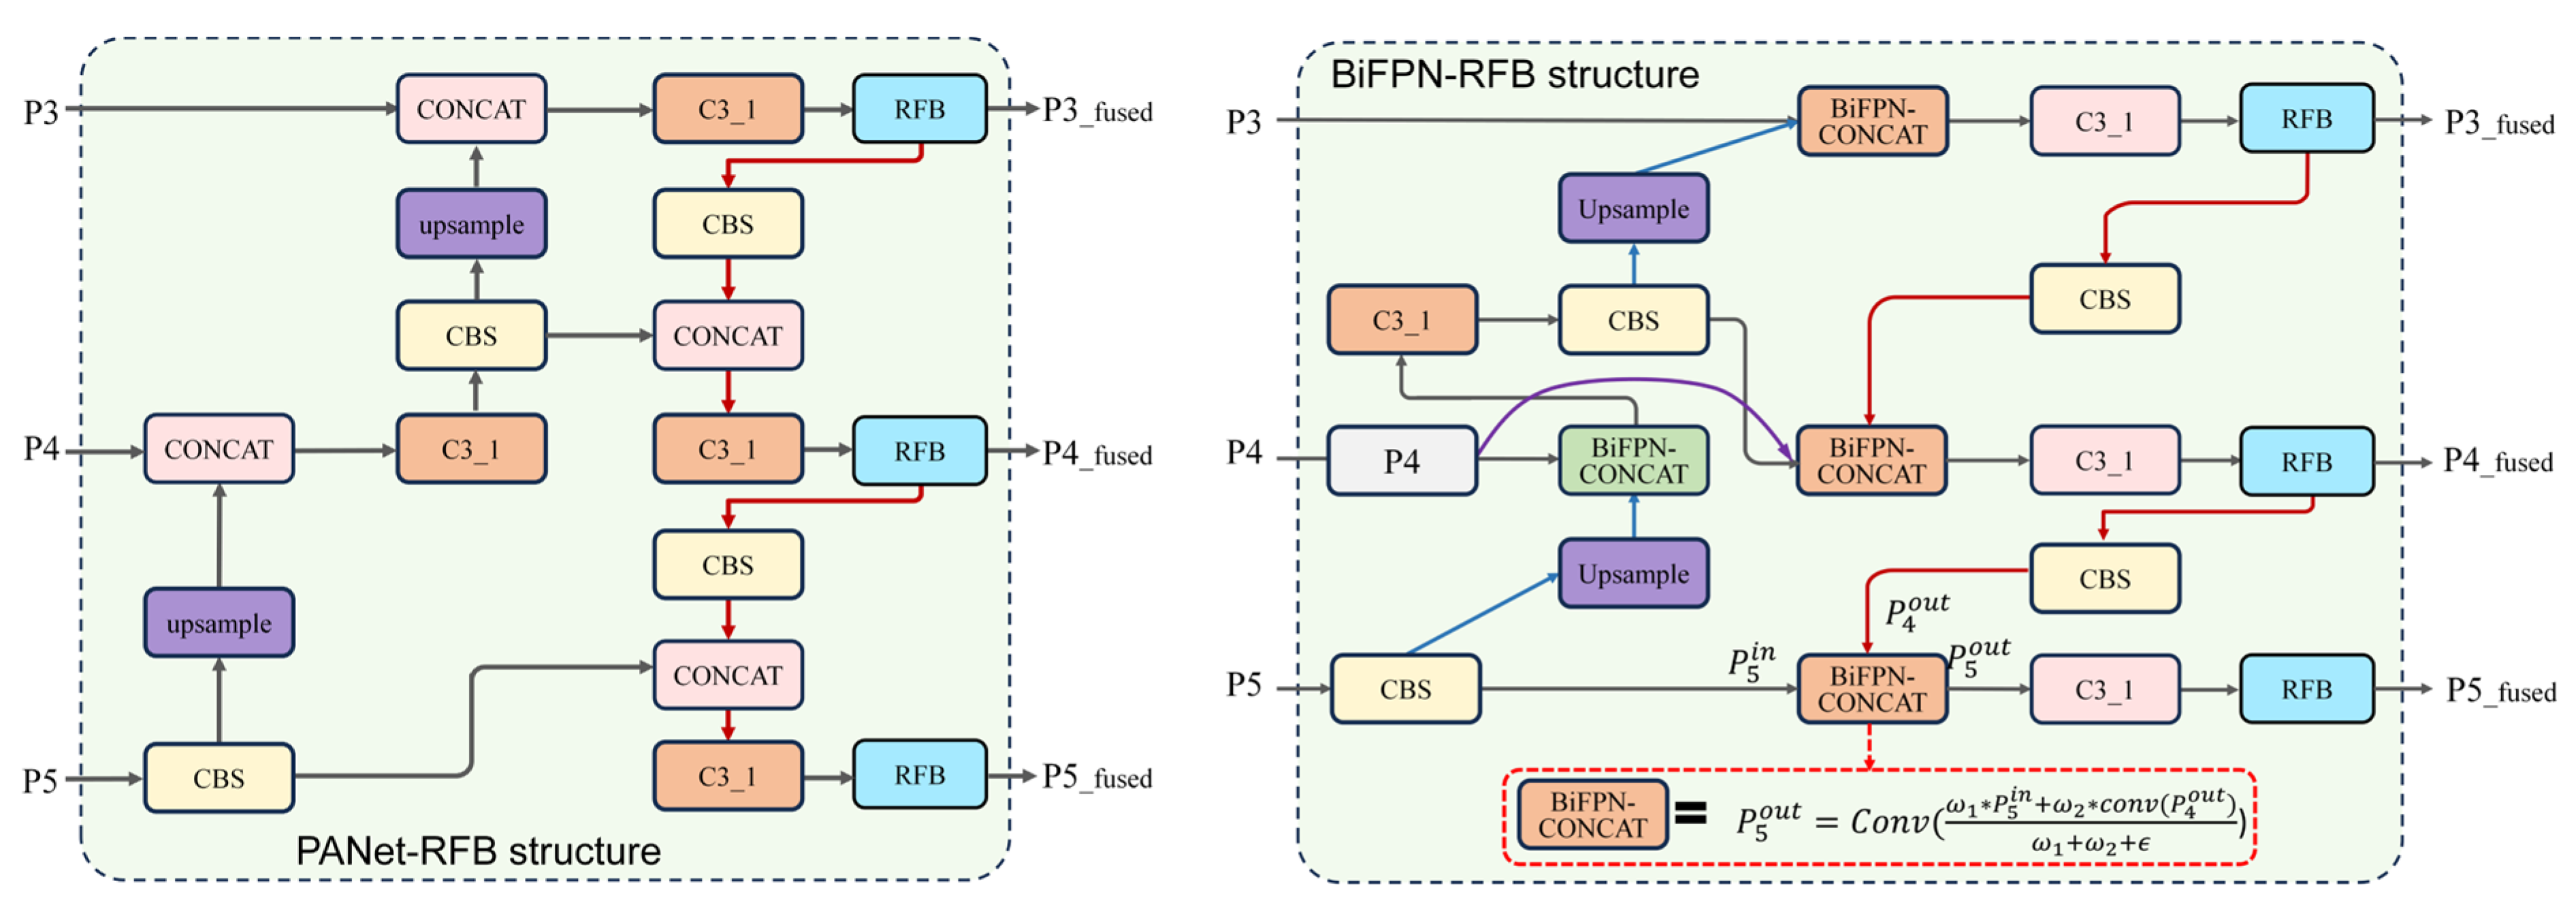
The receptive field block (RFB) [43] expands contextual coverage within the neck. Its parallel branches use different convolutional and dilation settings before their outputs are merged with the input feature map, as detailed in Figure A6. Adding RFB to PANet and BiFPN produces PANet-RFB and BiFPN-RFB (Figure A7). ASFF is then applied at the outer fusion stage to weight the aligned feature maps. The two resulting necks, PRA and BRA, therefore coordinate path aggregation, receptive-field expansion, and adaptive scale weighting within a single fusion structure. Their complete task-oriented architectures are shown in Figure 4.

2.4. Comparative Backbone and Localization-Loss Configurations

The vision transformer (ViT) family uses multi-head self-attention to model long-range interactions [44]. Swin Transformer-Tiny (Swin-T) [45], Next-ViT [46], and EfficientViT [47] are evaluated as alternative backbones to CSPDarknet53. Recent comparative studies on insulator condition monitoring have also reported strong performance from ViT-based representations relative to conventional convolutional architectures, supporting their continued evaluation for power-line visual inspection tasks [48]. The comparison examines whether their pretrained representations provide useful multiscale features for the same insulator-detection framework while the proposed contribution remains in the fusion neck. ConvNeXt V1 [49] and ConvNeXt V2 [50] provide convolutional alternatives. For each candidate, pretrained weights initialize the feature extractor before fine-tuning on the insulator dataset, while the neck and detection head are trained for the target task.
The standard IoU loss provides limited guidance in two relevant cases. If the DT and GT boxes do not overlap, it cannot represent the distance between their centers. If one fixed-size box is contained within the other, IoU remains unchanged as the inner box moves and therefore does not distinguish different internal positions. These limitations motivate the comparison of localization objectives with additional geometric terms. The evaluated alternatives account for box overlap, center distance, or aspect ratio in different ways: generalized intersection over union (GIoU) [51], distance intersection over union (DIoU) and complete intersection over union (CIoU) [52], efficient intersection over union (EIoU) [53], wise intersection over union (WIoU) [54], and the Alpha-IoU variants Alpha-GIoU, Alpha-DIoU, and Alpha-CIoU [55]. Each loss is examined within the same insulator-string and defect-detection task.
To isolate the contribution of each model component, the experiments use controlled comparisons in which only one component is varied at a time. Localization losses are compared with the backbone and neck fixed, neck architectures are compared with the backbone and localization loss fixed, and backbone alternatives are compared with the neck and localization loss fixed. The subsequent backbone-neck-loss combinations are evaluated separately to examine component compatibility and should not be interpreted as the independent contribution of any single component.

3. Results

3.1. Effect of Training-Image Appearance Diversification

The effect of extending training-image appearance is examined with a fixed CSPDarknet53-PANet detector (Table 2). General augmentation gives 95.6% mAP@0.5 and 79.7% mAP@0.5:0.95, whereas the inclusion of CycleGAN-derived and synthetically fogged images gives 95.8% and 82.2%, respectively. The greater change in the stricter metric is consistent with more accurate box localization in this comparison. Insulator strings retain higher precision (P) and recall (R) than the two defect classes in both settings, and broken-shell defects remain the most difficult. For that class, average precision (AP) at IoU thresholds from 0.5 to 0.95 increases from 70.7% to 71.6%, although recall decreases from 85.4% to 81.2%, showing that the appearance transformations do not improve all class-level measures uniformly.

3.2. Localization-Loss Comparison

To examine the influence of box regression independently of the fusion topology, Table 3 compares the IoU-based losses with the backbone and neck held fixed. No alternative improves every class-wise precision and recall value, and broken-shell detection remains the most difficult case throughout the comparison. On the fixed evaluation split, Alpha-CIoU yields 83.1% mAP@0.5:0.95, which is numerically the highest value among the evaluated losses. Relative to CIoU under the same CSPDarknet53-PANet configuration, Alpha-CIoU changes mAP@0.5 from 95.8% to 95.9% (+0.1 percentage points) and mAP@0.5:0.95 from 82.2% to 83.1% (+0.9 points). Because these results are obtained from a single train-validation-test partition without repeated-run variance estimation or statistical significance testing, the small differences among several IoU-loss variants should be interpreted descriptively rather than as statistically significant performance margins. CIoU and Alpha-CIoU are therefore retained as representative localization objectives for the subsequent architecture comparisons.

3.3. Cross-Scale Fusion Neck Comparison

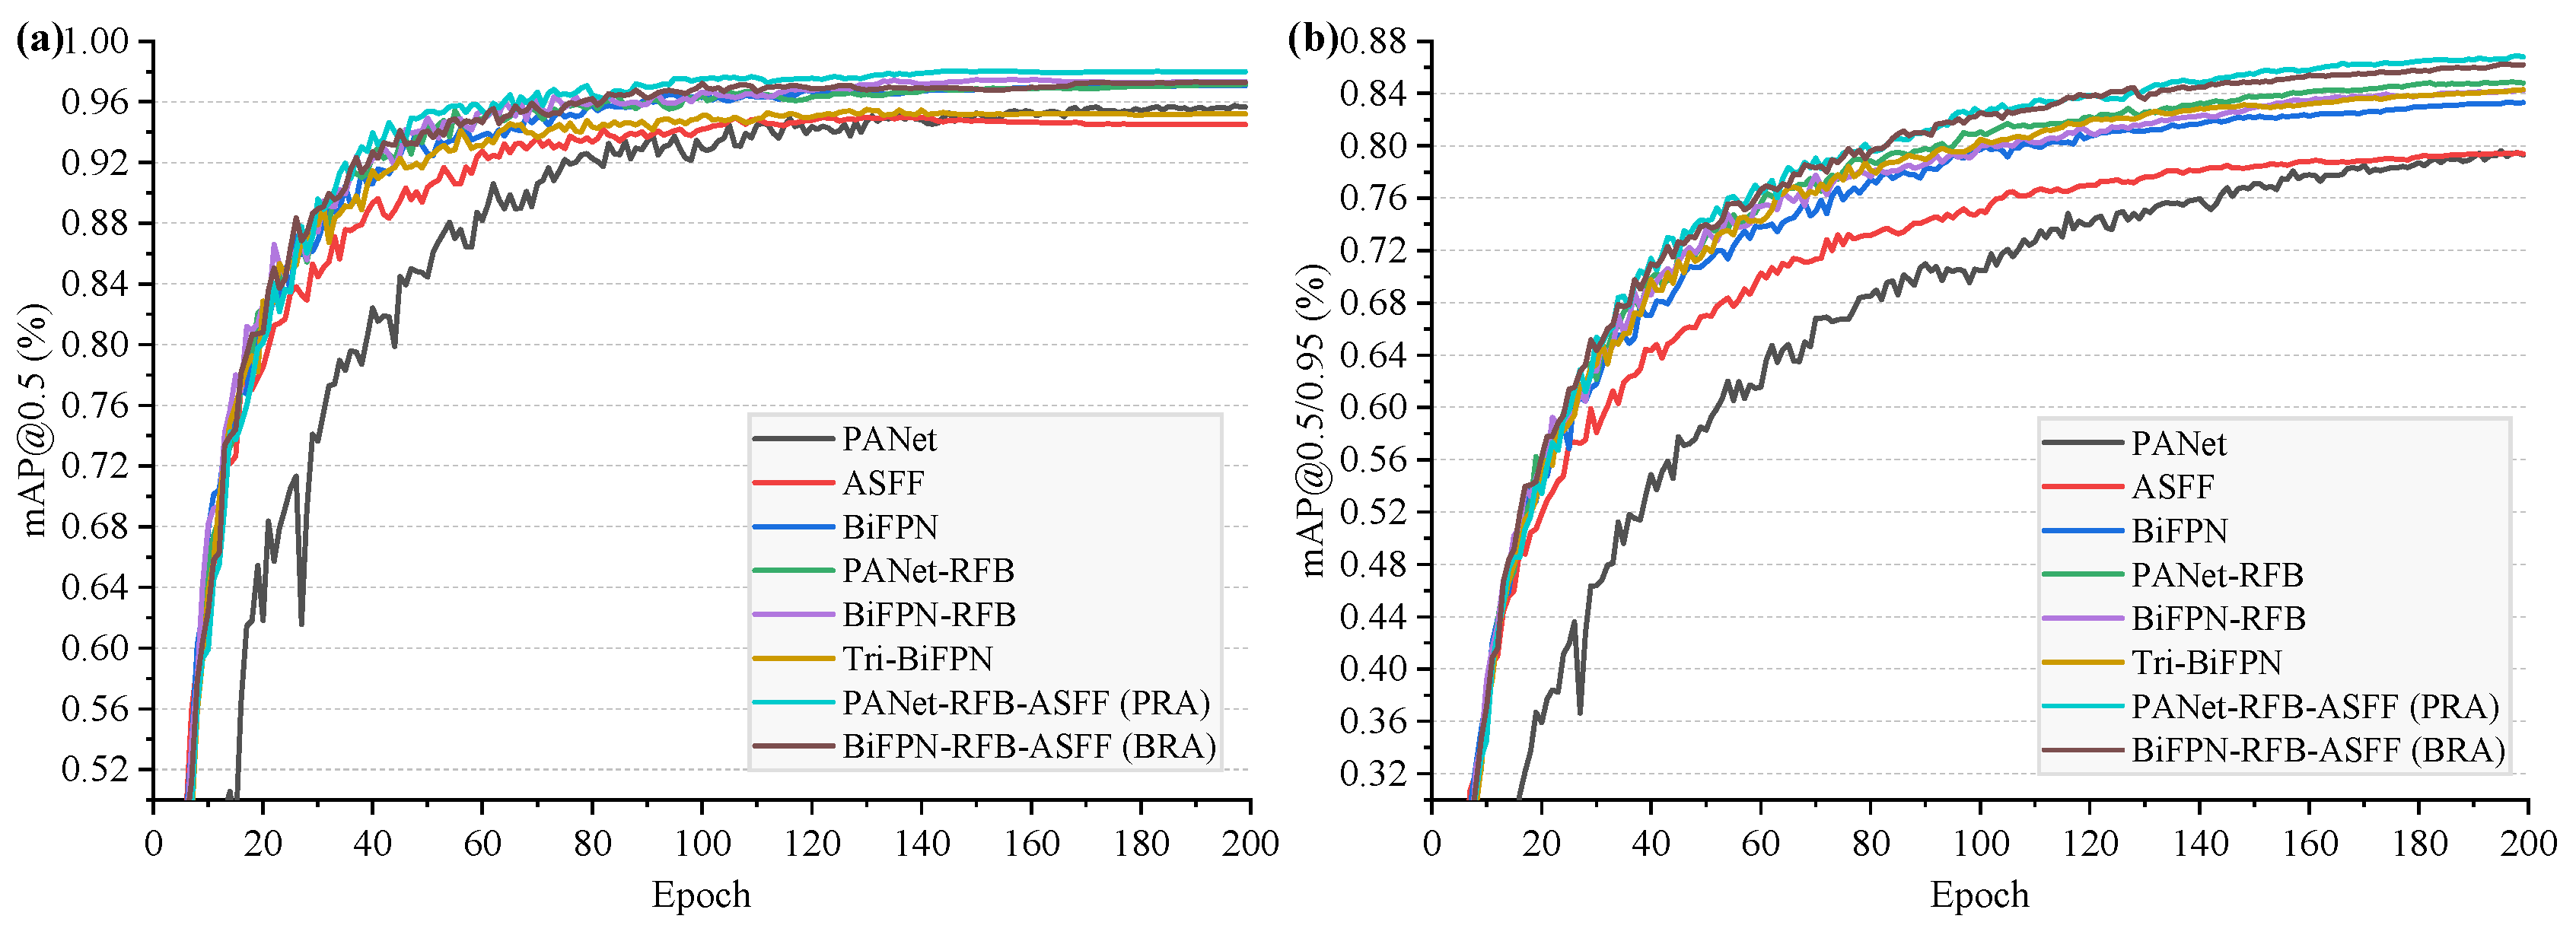
The neck comparison uses the same appearance-diversified training set as the augmented-data setting in Table 2, while CSPDarknet53 and CIoU are held fixed (Table 4). The standard YOLOv5 detection head is also kept unchanged across all neck configurations. The corresponding validation-performance curves are shown in Figure 5. Therefore, the reported PRA/BRA gains are calculated relative to PANet trained on the identical appearance-diversified training set. Relative to this common PANet reference, PRA increases mAP@0.5 by 2.2 percentage points and mAP@0.5:0.95 by 4.6 points, whereas BRA produces gains of 1.5 and 4.0 points, respectively. Tri-BiFPN and ASFF do not match PRA or BRA in this comparison, so adding fusion paths alone does not yield the same pattern. Under these controlled conditions, the larger gains at stricter IoU thresholds are observed for configurations that coordinate path aggregation, receptive-field expansion, and adaptive scale weighting rather than for those that increase path density alone. Model complexity and throughput are reported in giga floating-point operations (GFLOPs) and frames per second (FPS), respectively.
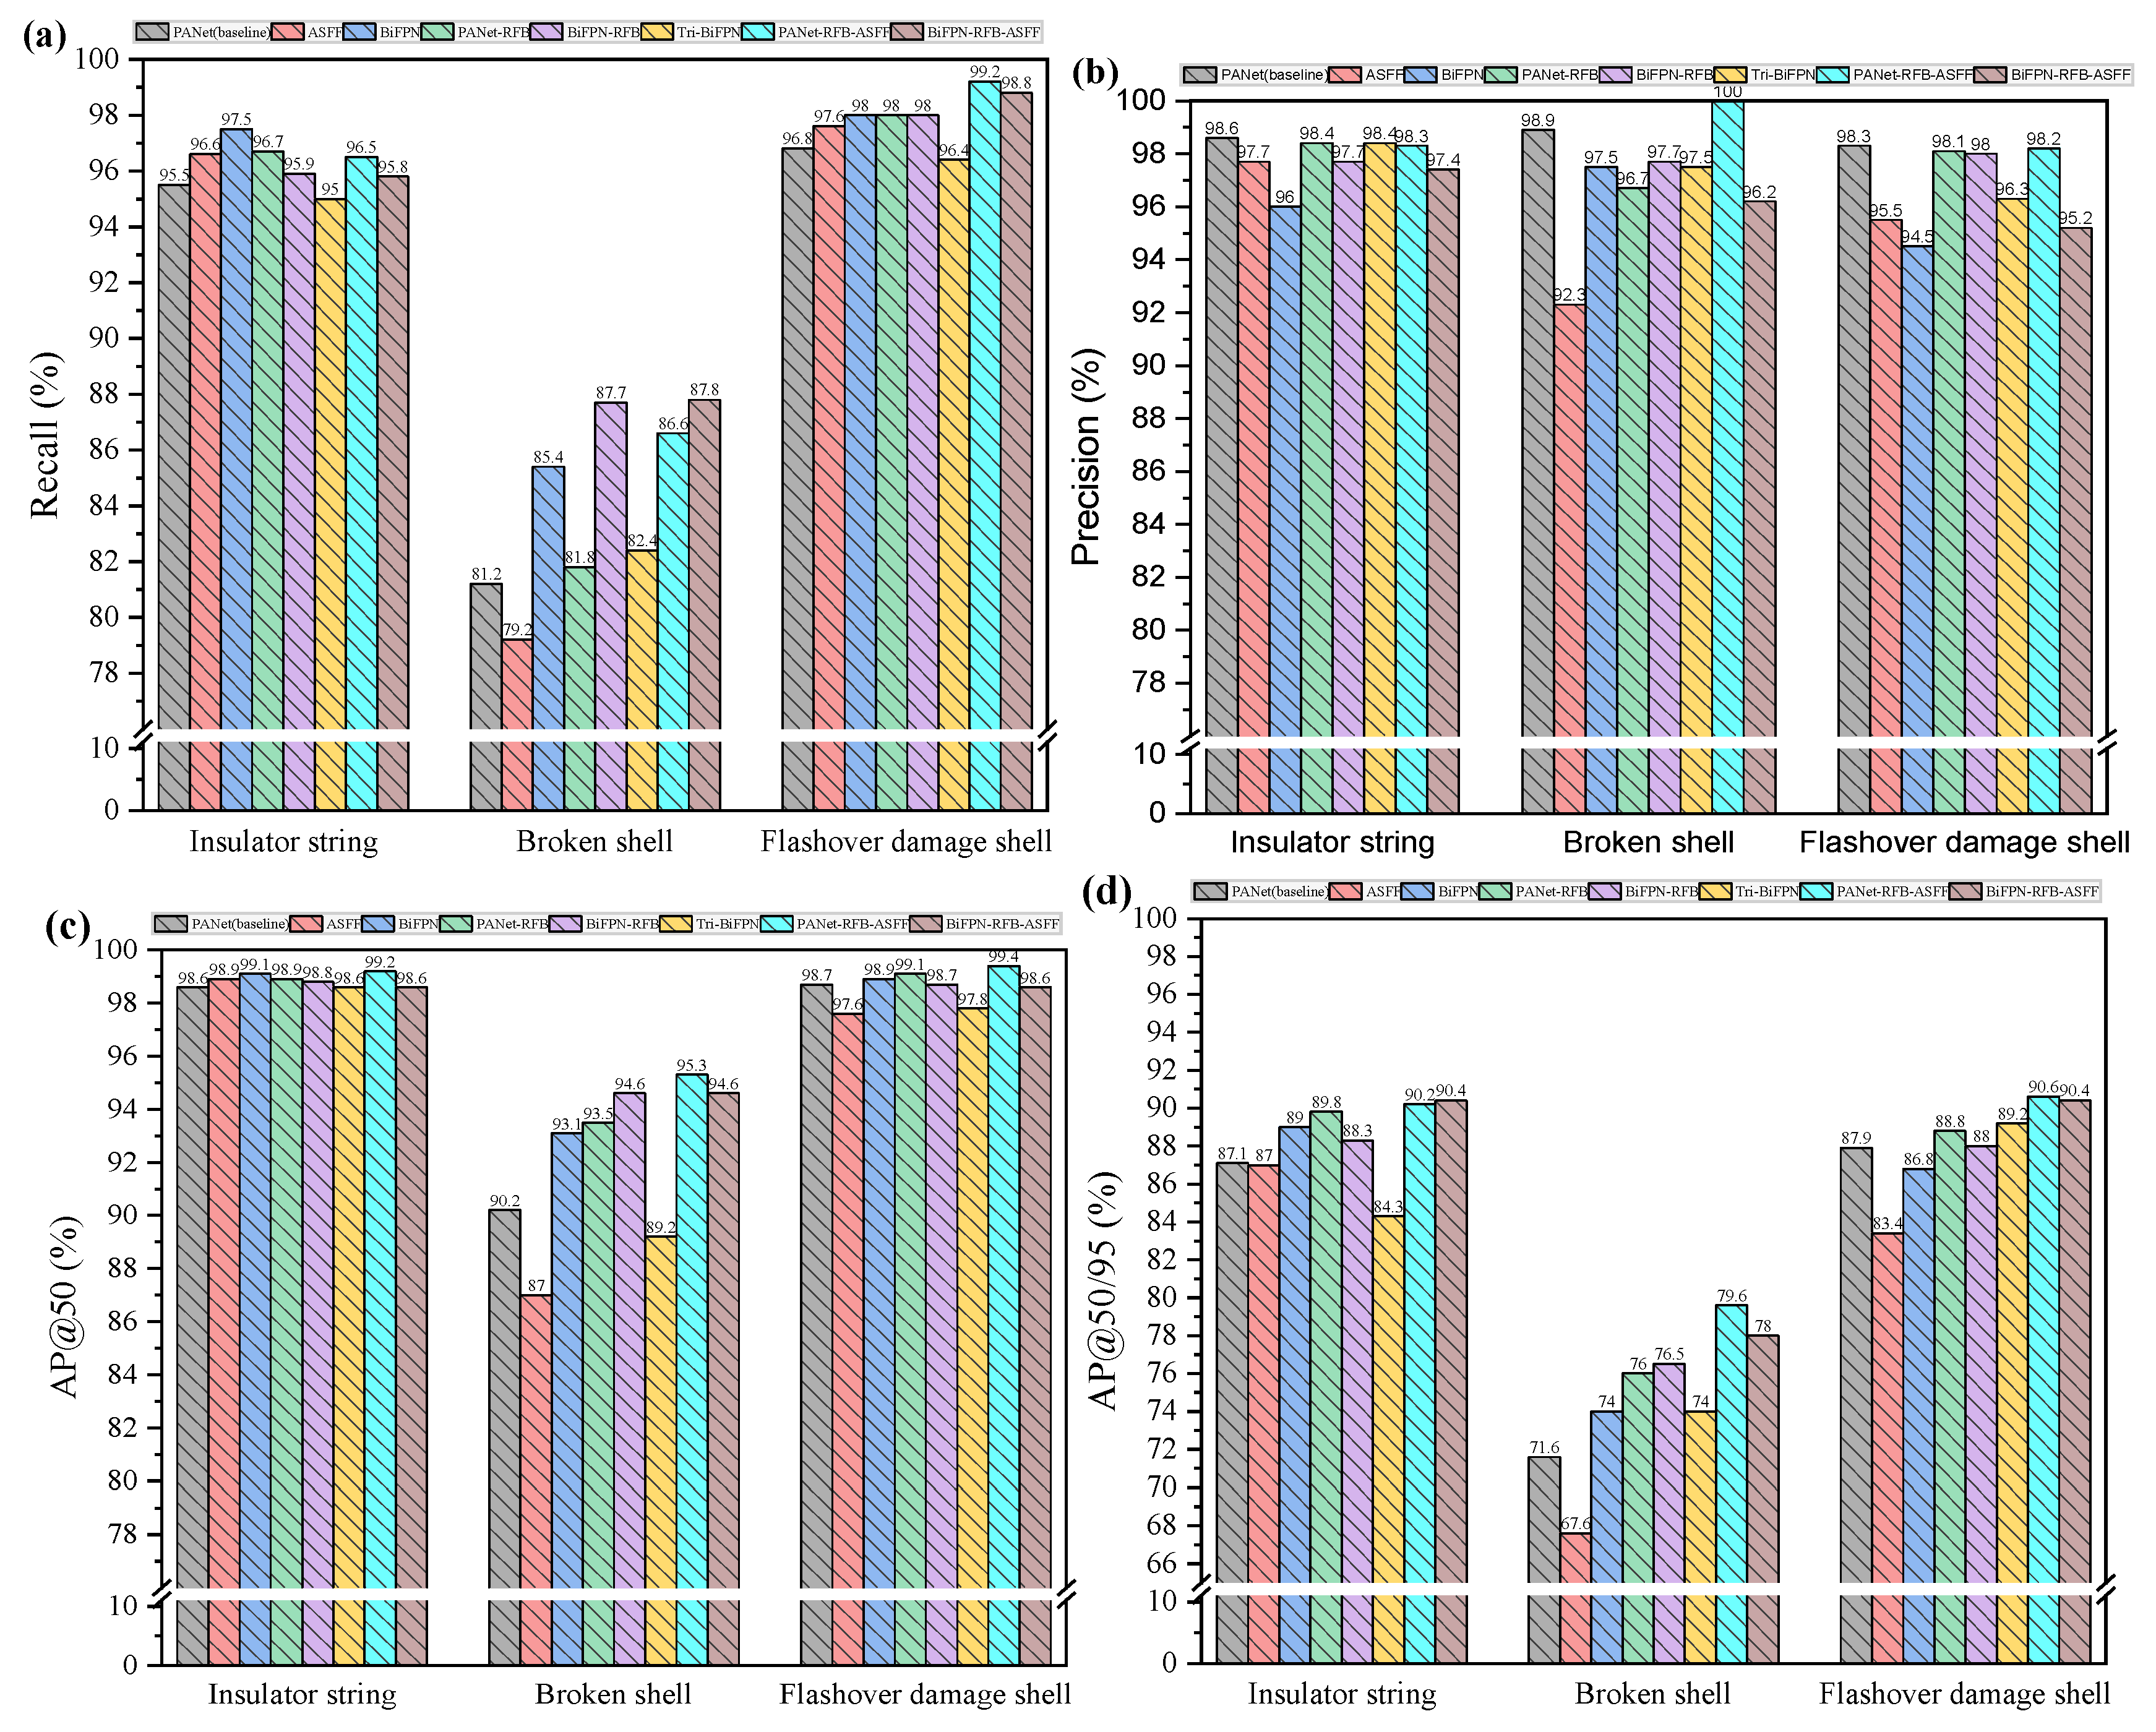
Broken-shell recall and AP remain below the corresponding values for insulator strings and flashover-damaged shells across most neck configurations, as shown in Figure 6. Most hybrid necks, except ASFF and Tri-BiFPN, improve broken-shell detection relative to their reference configurations, but the class-wise gap persists. This pattern makes it necessary to consider aggregate mAP together with class-specific recall and performance at stricter IoU thresholds.

3.4. Backbone-Neck Compatibility and Inference Efficiency

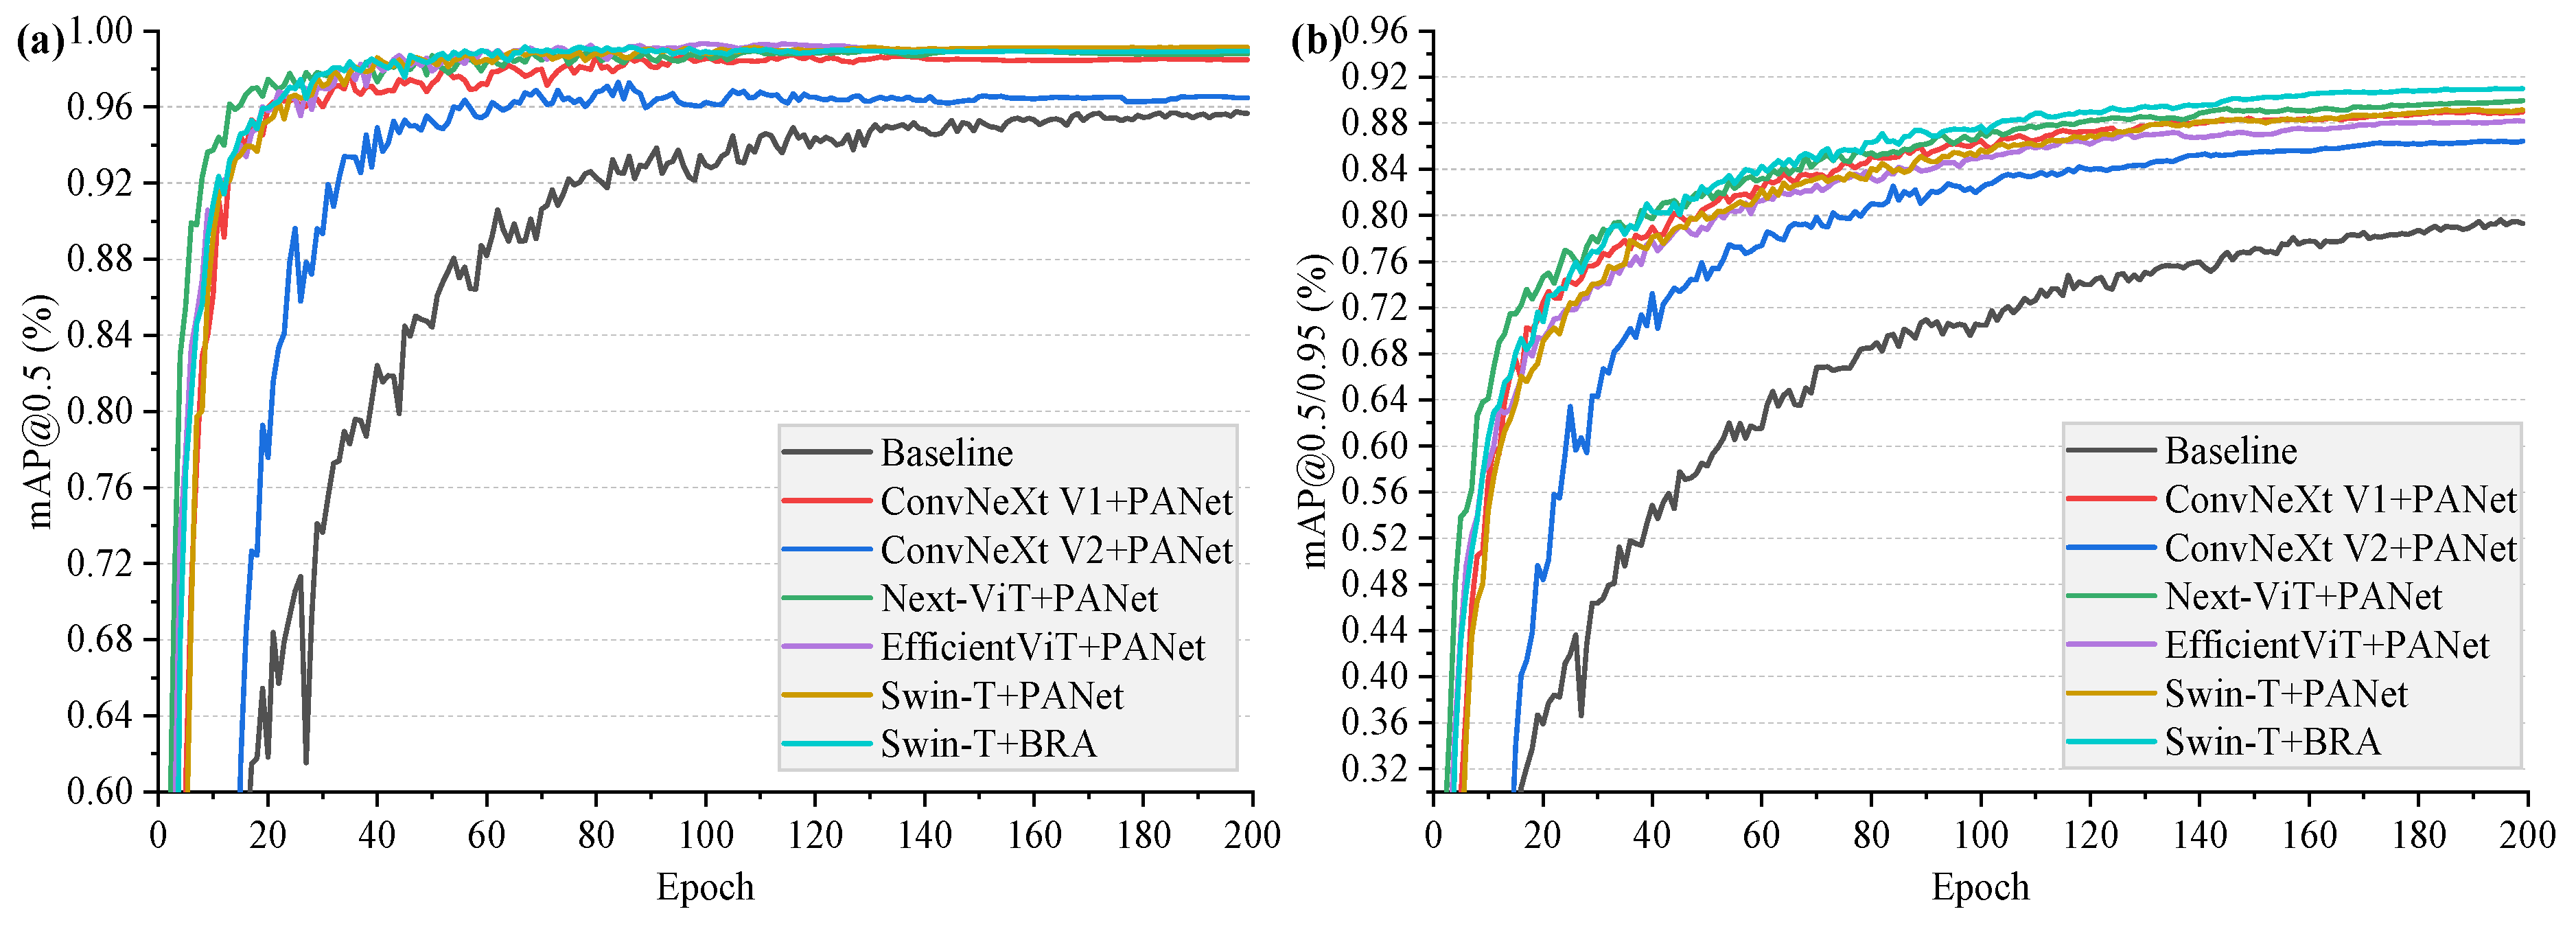
The combined backbone, neck, and localization-loss results are reported in Table 5. With PANet and CIoU fixed, Swin-T achieves the highest mAP@0.5 (99.1%), while Next-ViT achieves the highest mAP@0.5:0.95 (89.9%) among the backbone substitutions. Differences between the necks are smaller at IoU = 0.5 but become clearer under mAP@0.5:0.95, as shown in Table 5 and Figure 6. Swin-T-BRA with CIoU achieves 98.9% mAP@0.5 and 90.9% mAP@0.5:0.95. Swin-T-PRA + Alpha-CIoU and Swin-T-BRA + Alpha-CIoU jointly achieve the highest mAP@0.5:0.95 of 91.3%, with corresponding mAP@0.5 values of 98.6% and 98.5%, respectively. Selecting a stronger backbone therefore does not eliminate the performance differences associated with the neck and localization loss. To make the contribution of each component explicit, the controlled neck, backbone, and localization-loss comparisons are summarized in Table 6. The corresponding validation-performance curves for the evaluated model architectures are shown in Figure 7.
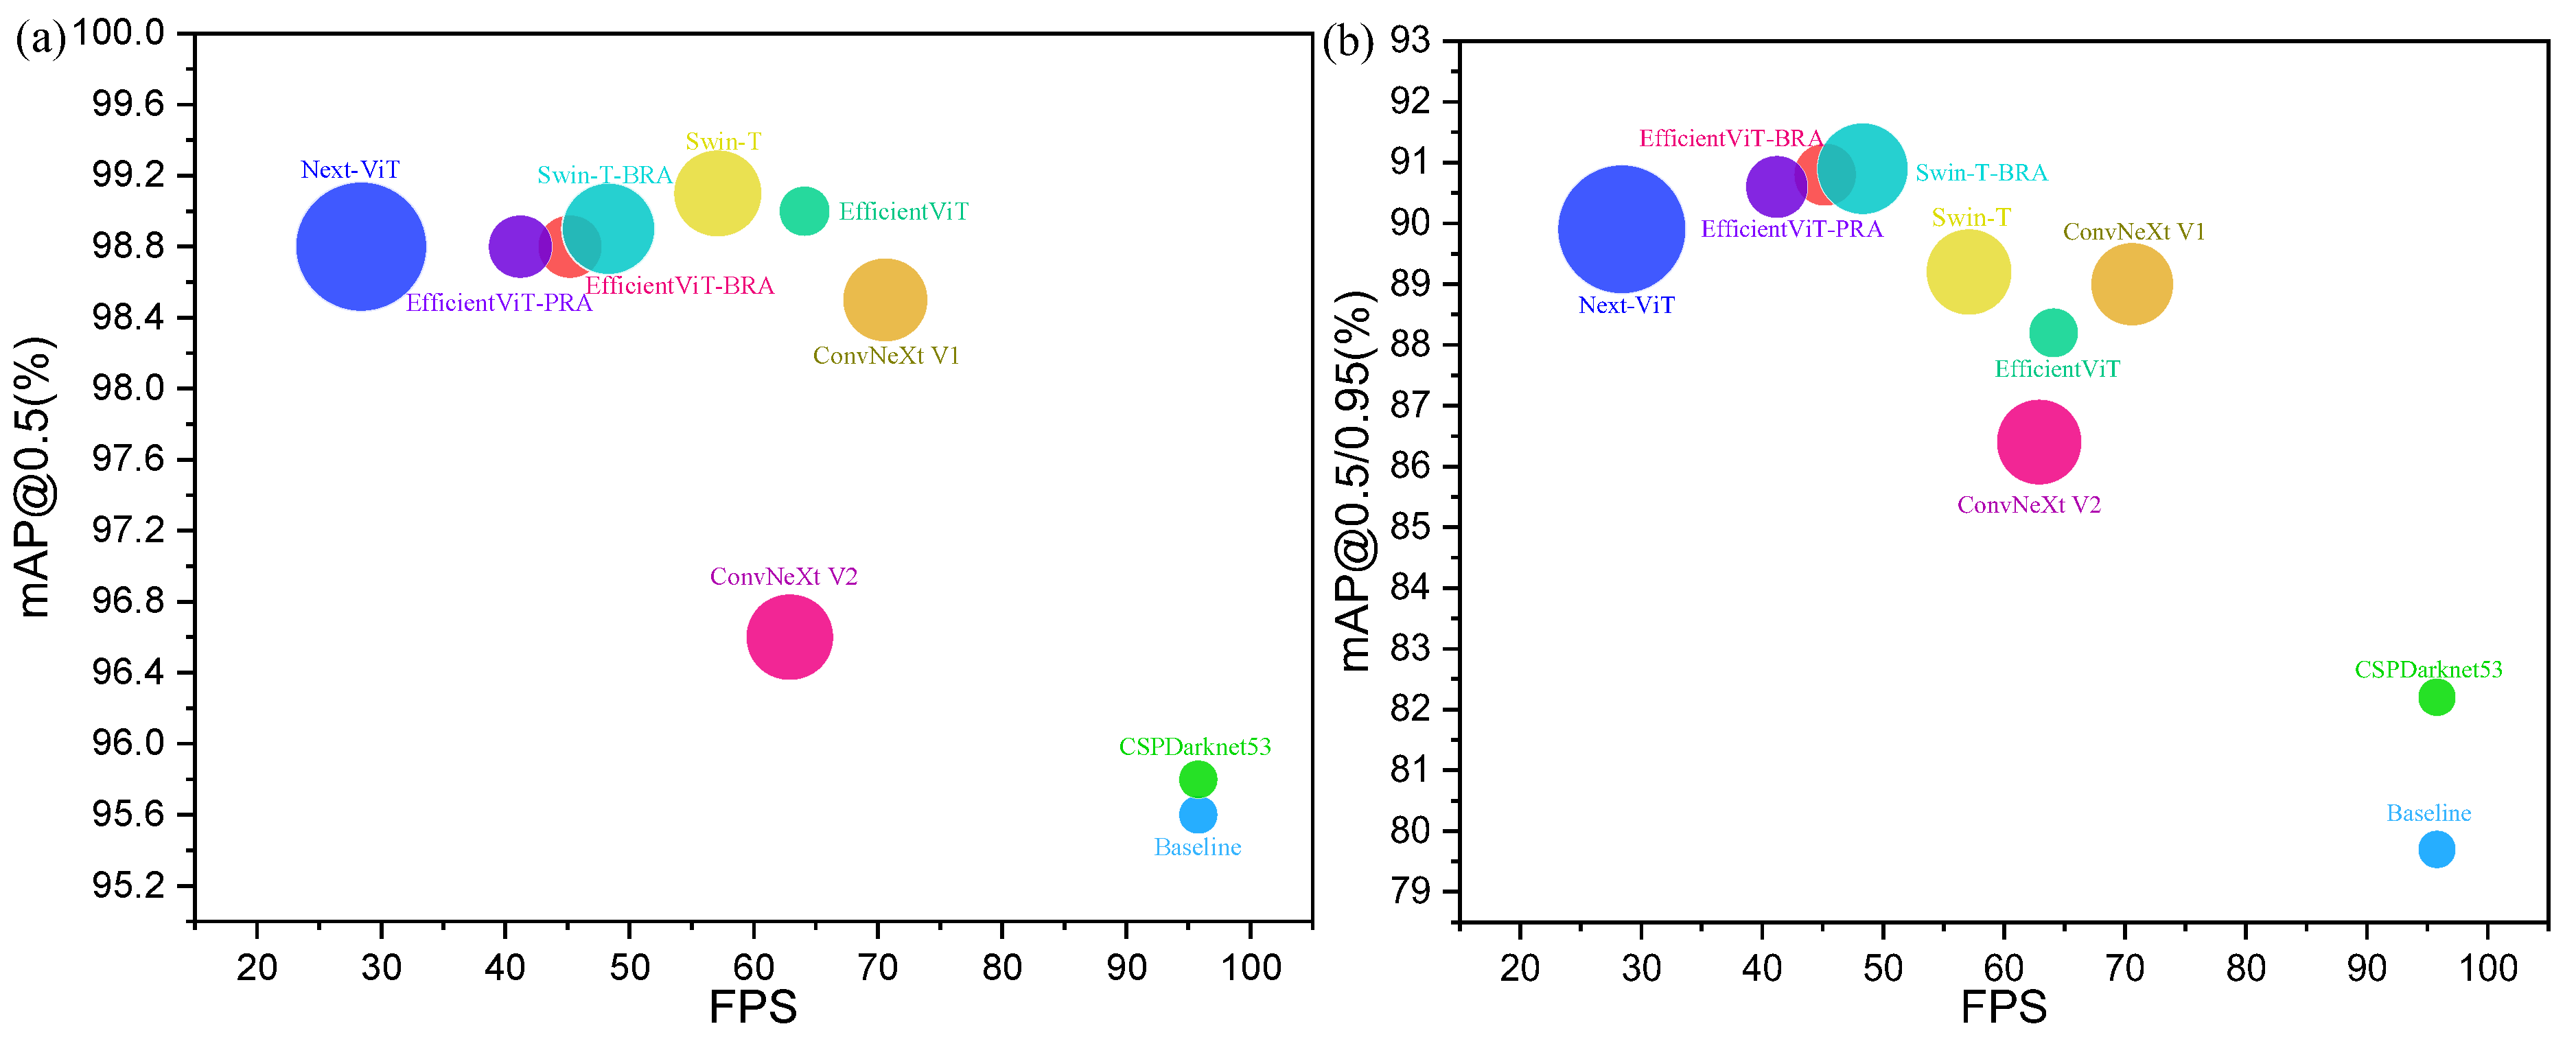
Performance, computational complexity, and model-only inference speed are compared in Figure 8. Models without an explicit neck label use PANet. Next-ViT has the largest GFLOPs count and the lowest FPS among the reported models. Although EfficientViT-PRA and EfficientViT-BRA require fewer GFLOPs than Swin-T-BRA, their measured FPS is lower, showing that fewer operations do not translate into higher throughput on the reported hardware. The Swin-T configurations with PRA or BRA occupy similar performance-efficiency ranges in Figure 8 and Table 5.
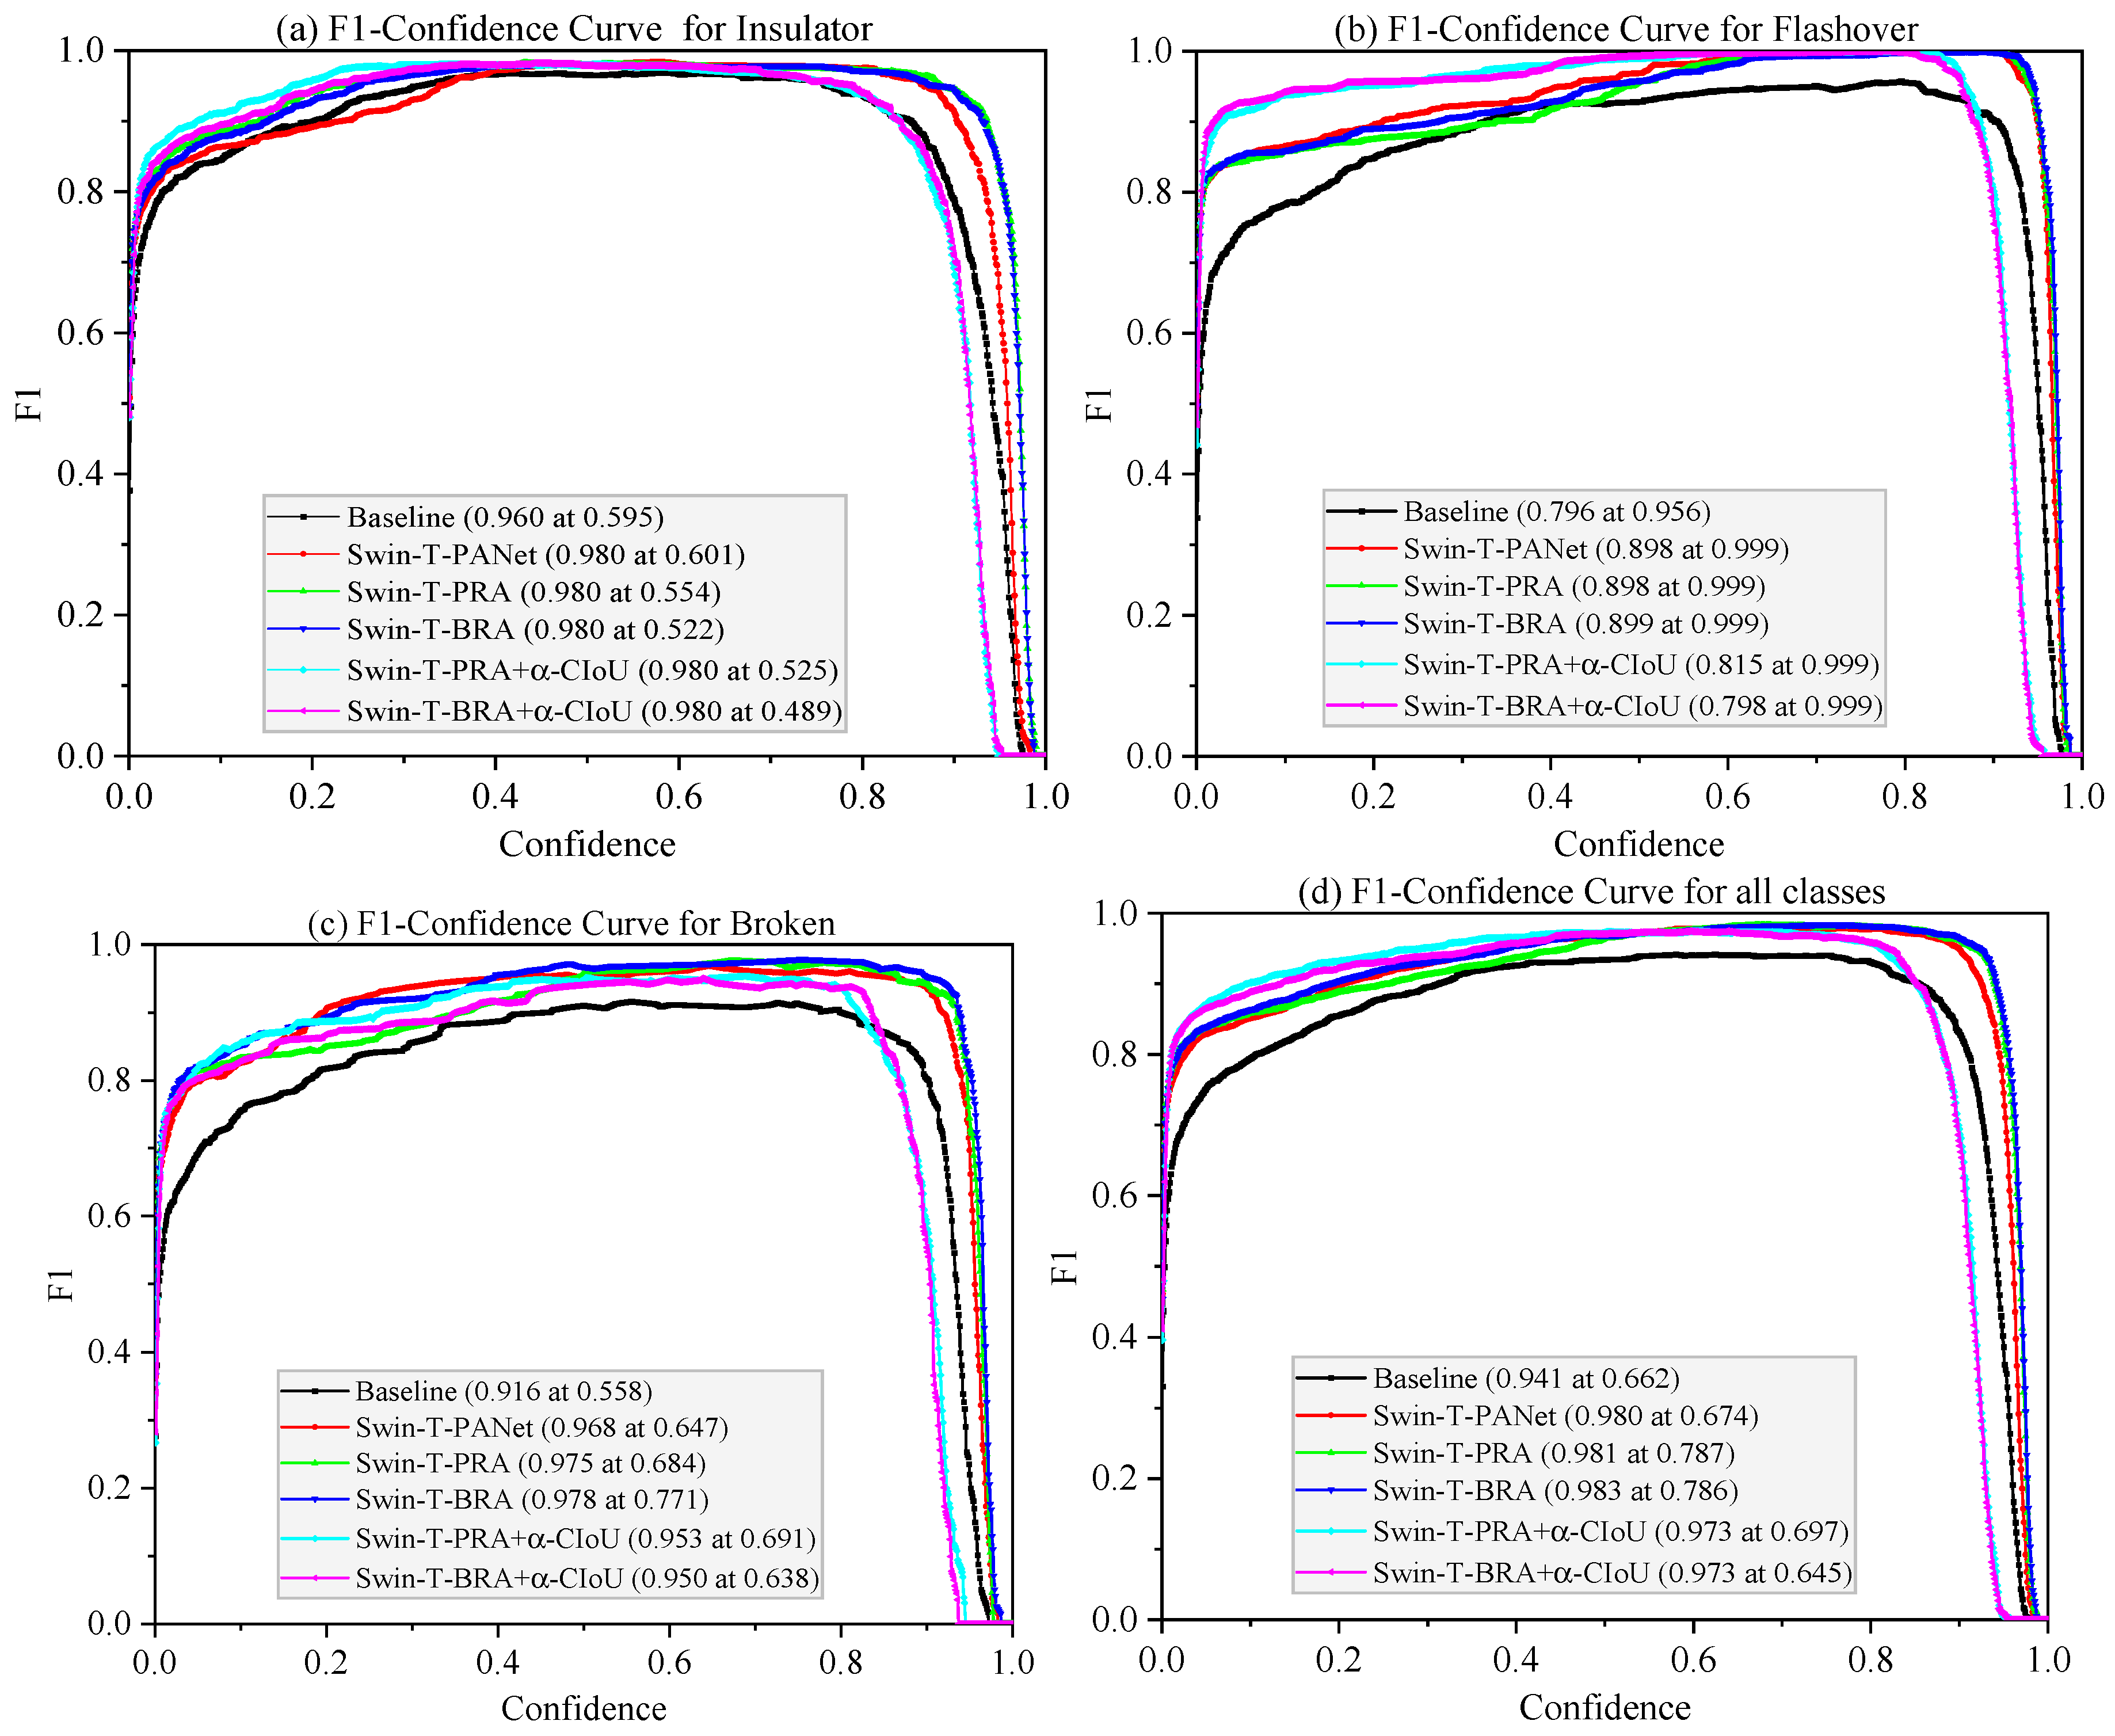
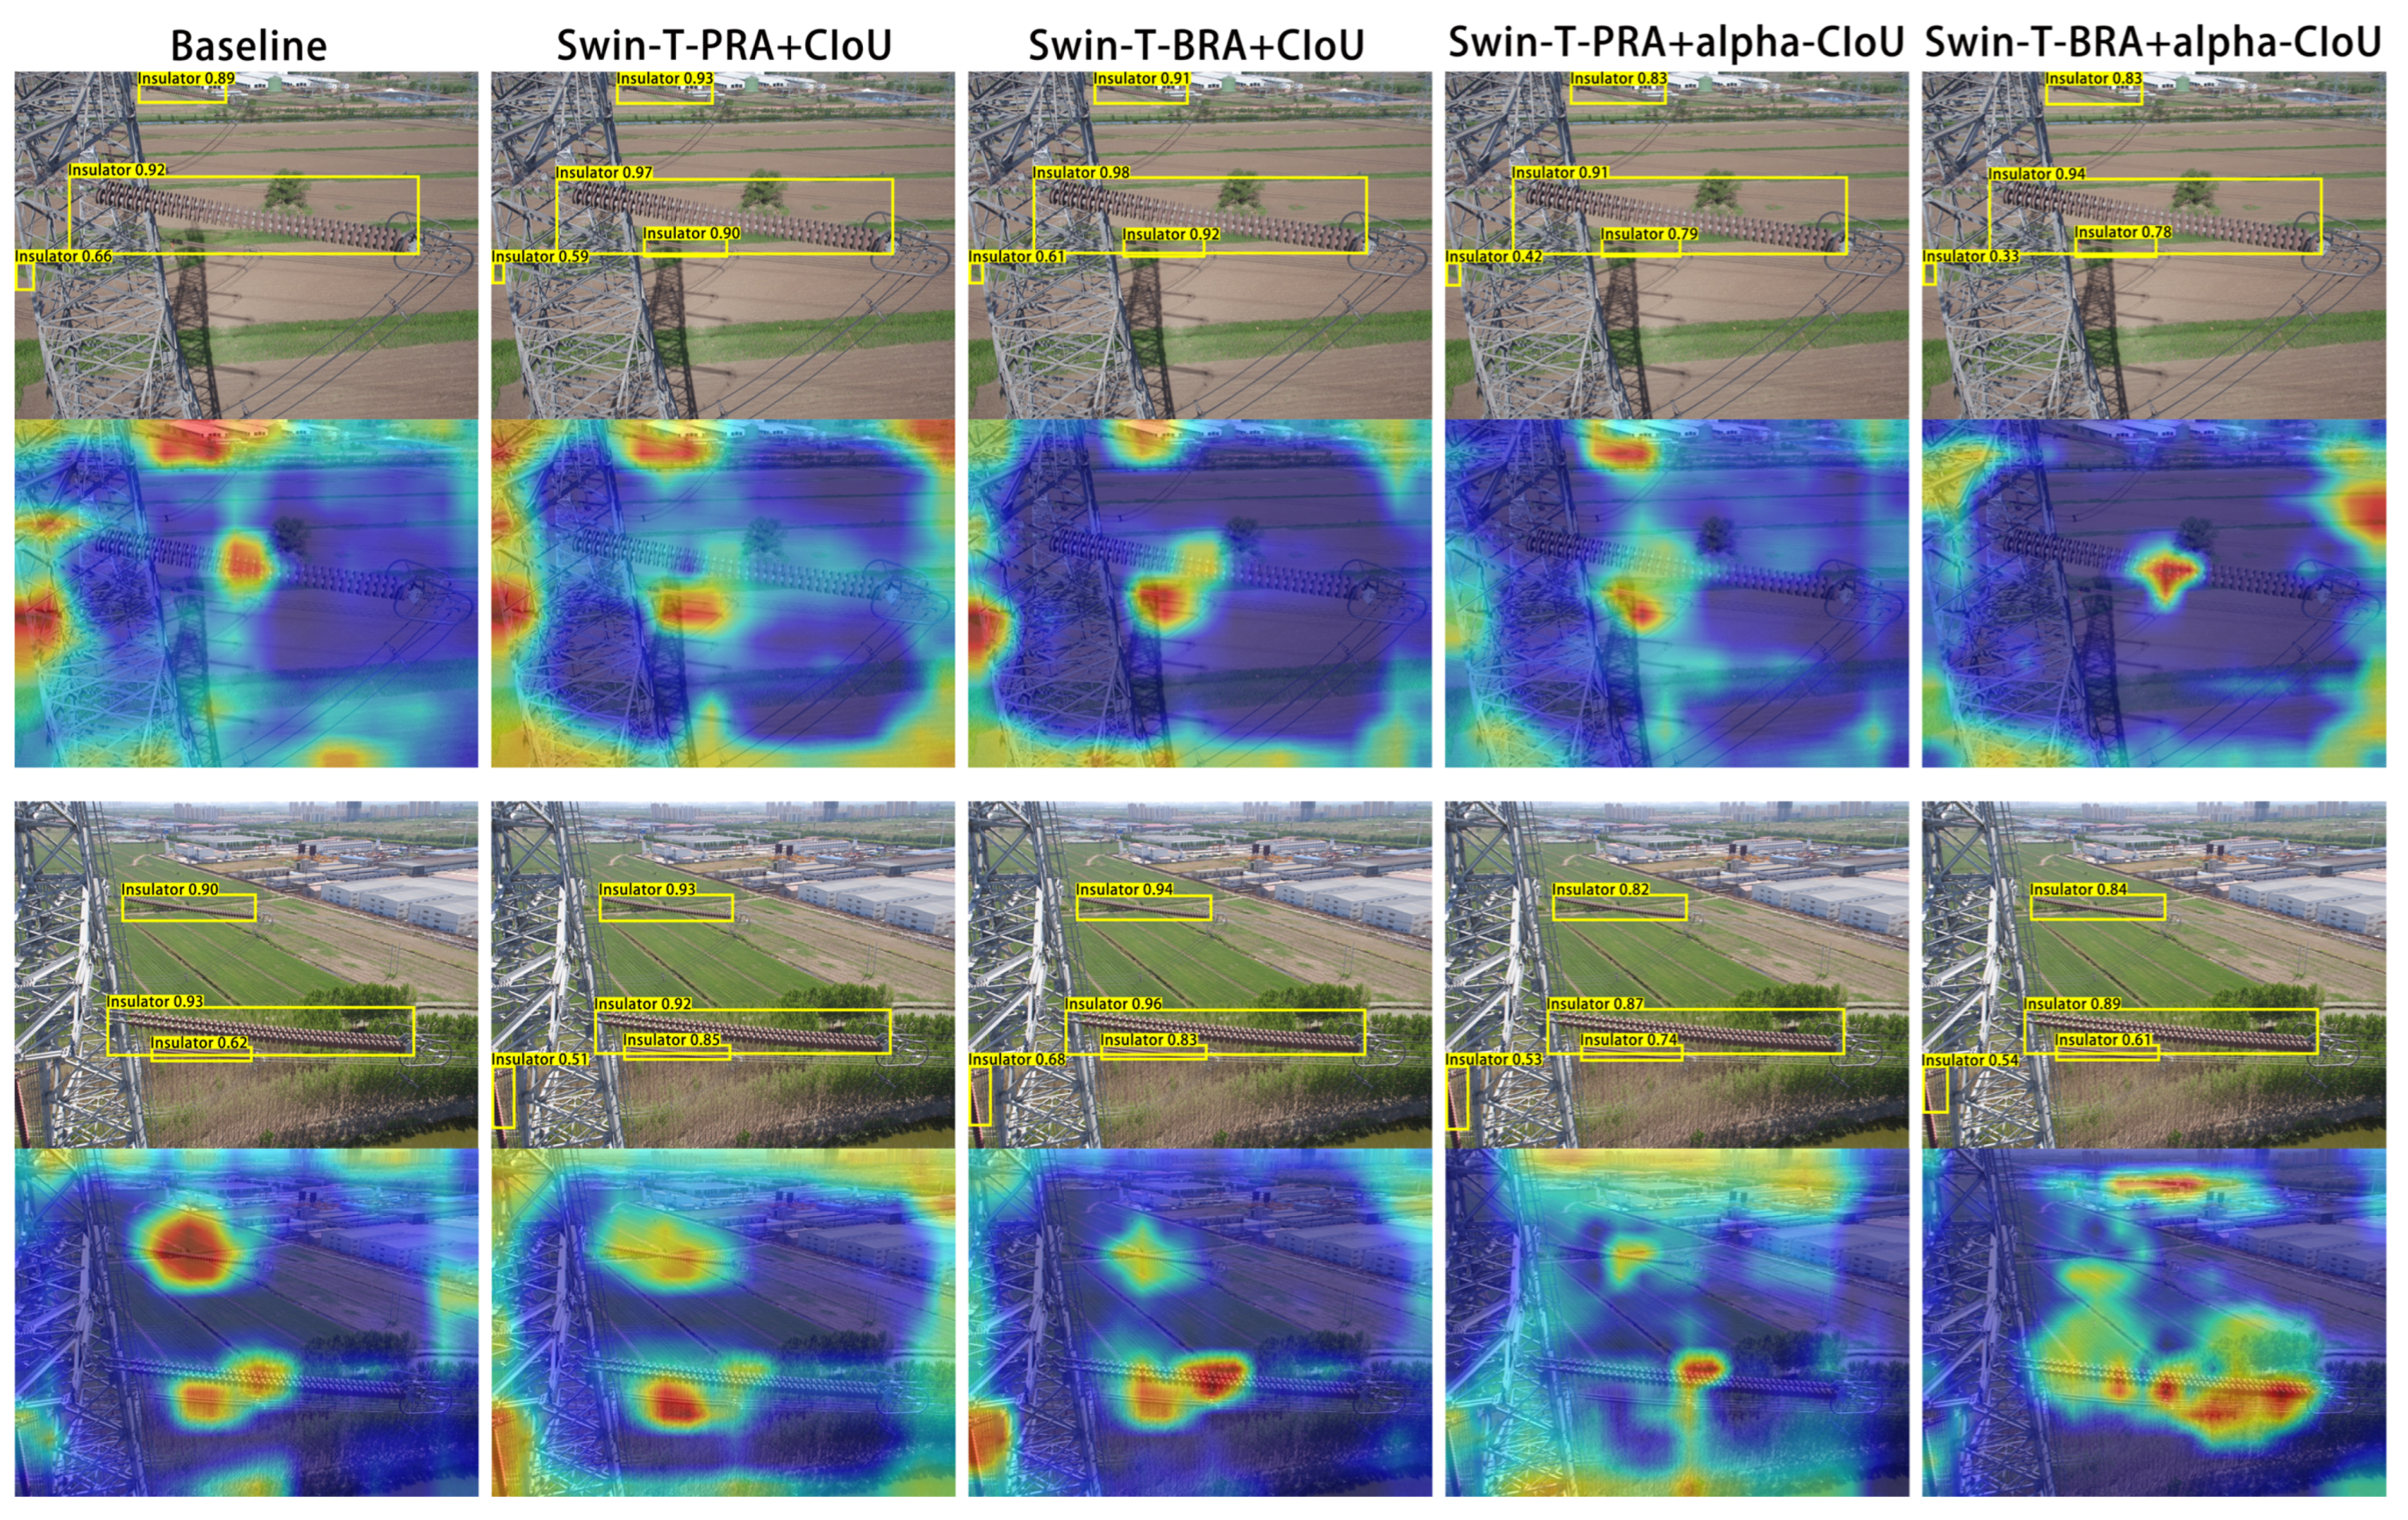
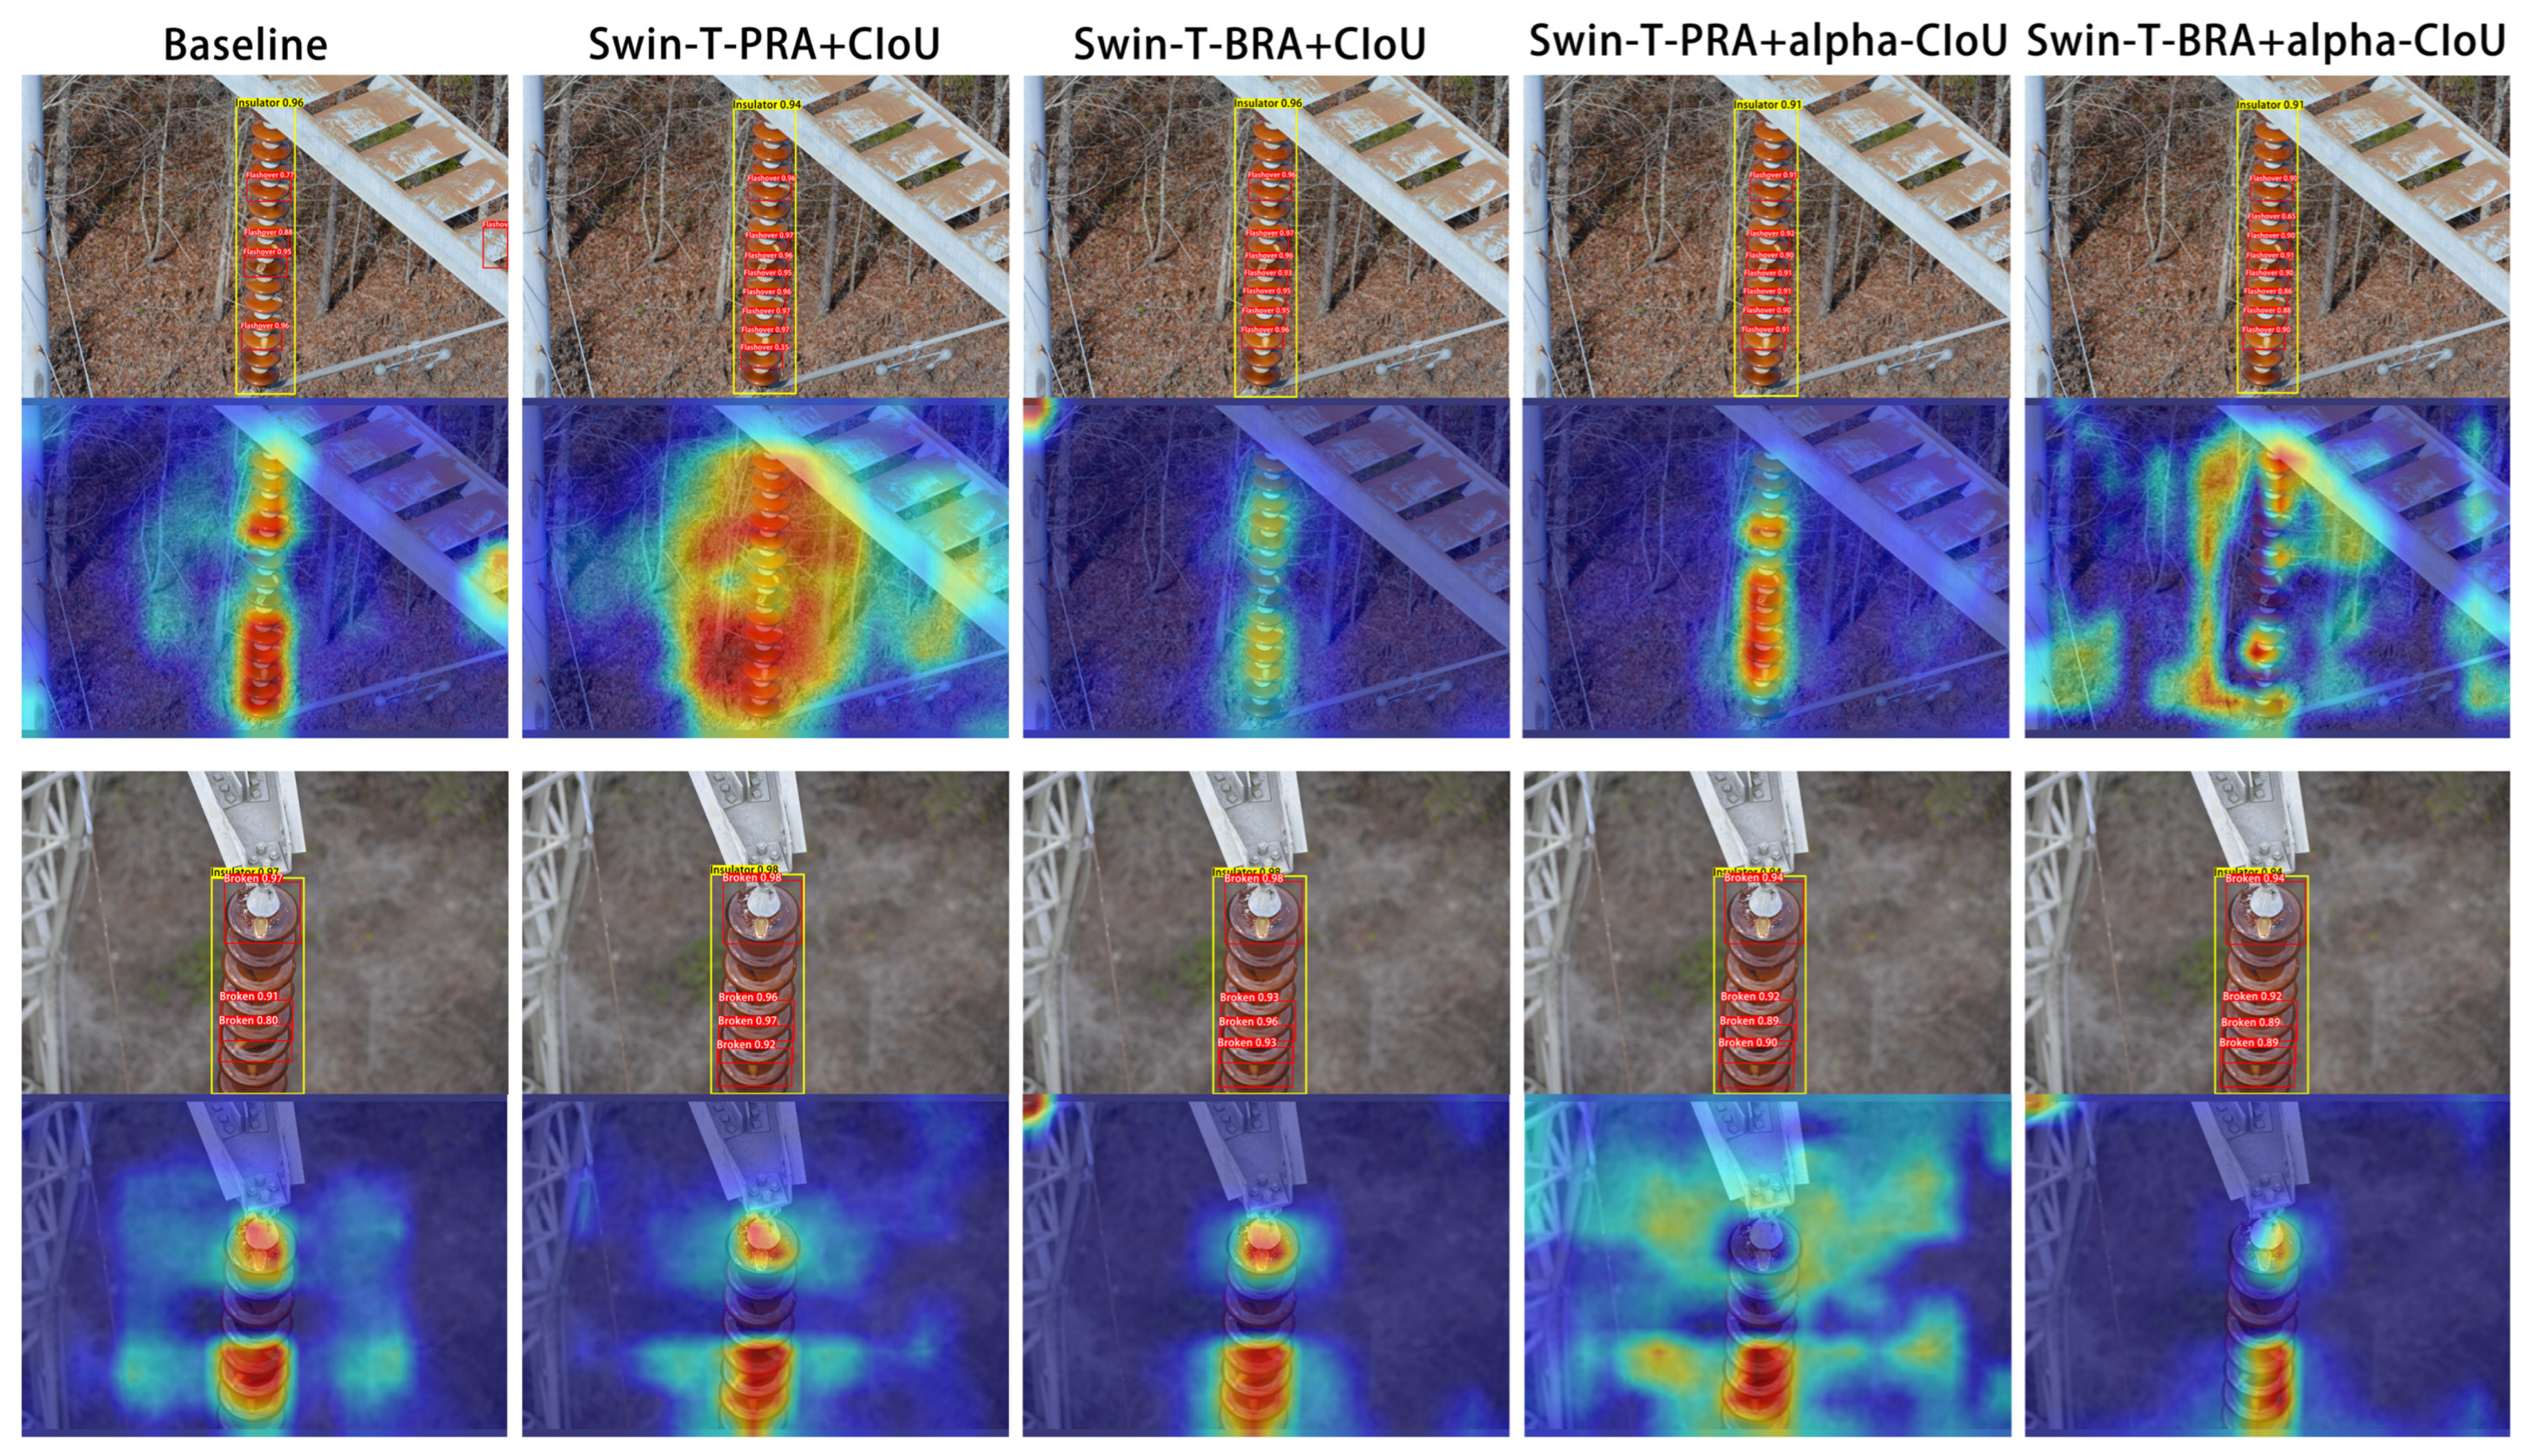
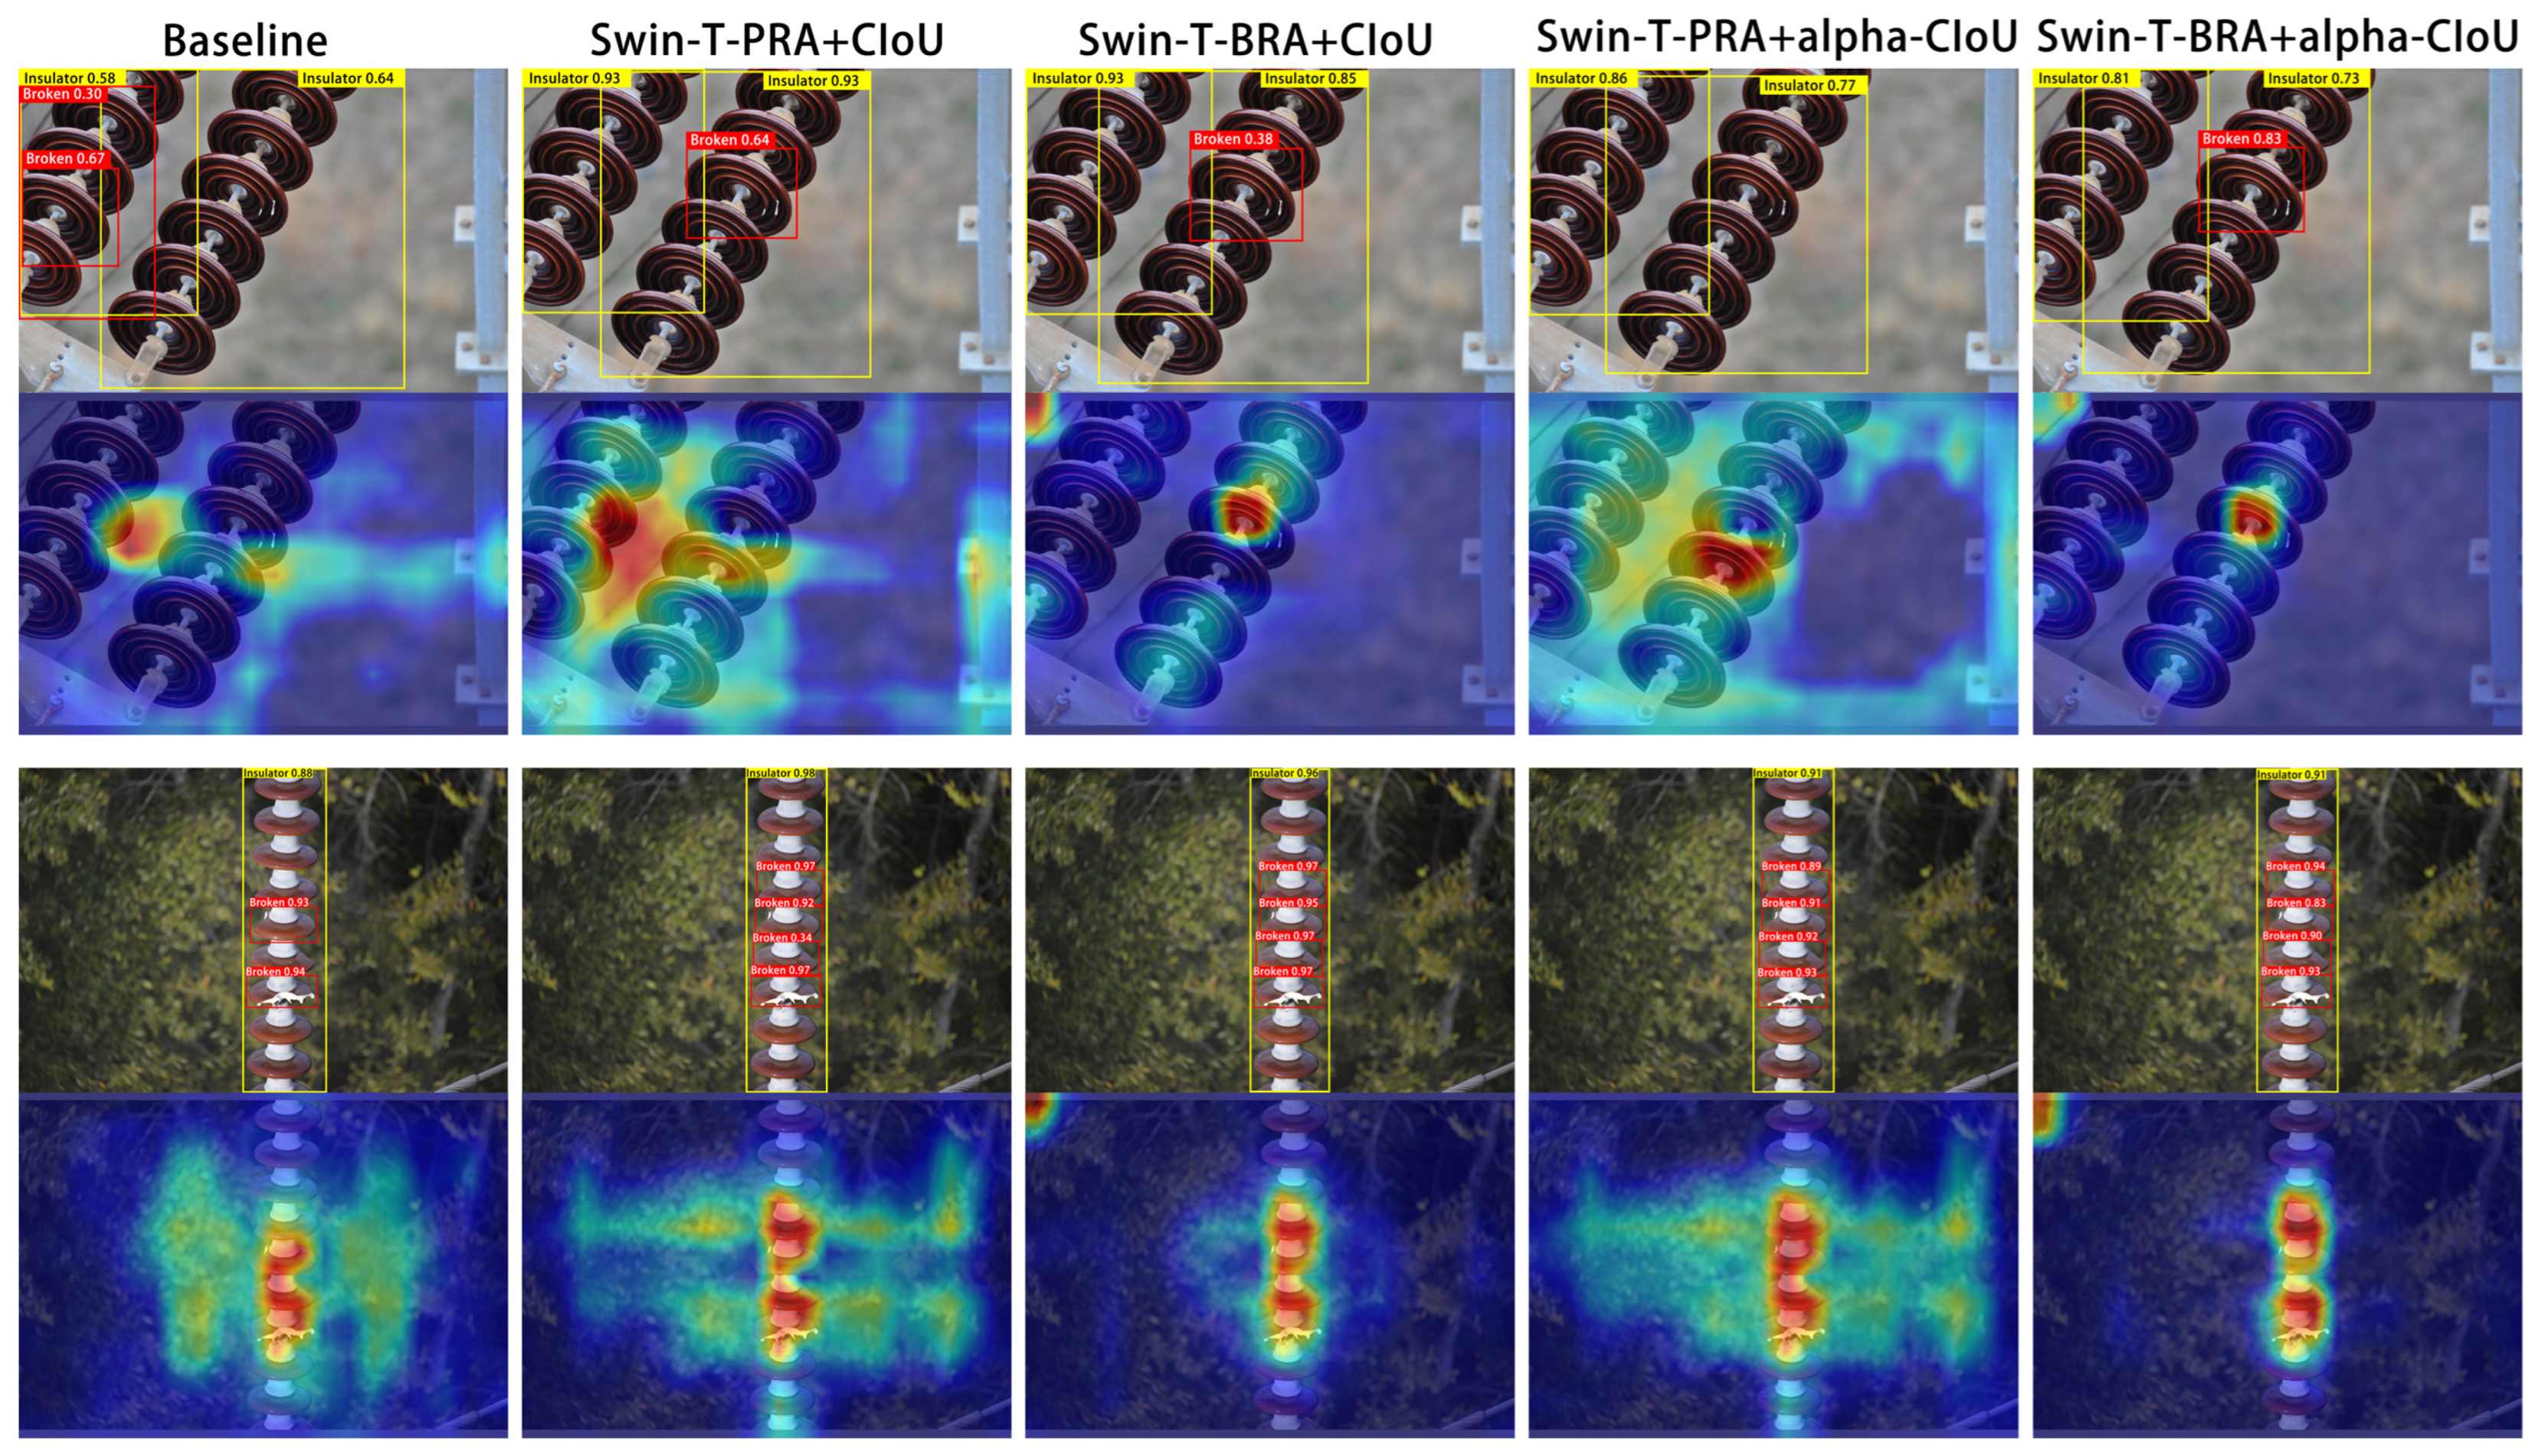
The F1 score (F1)-confidence curves in Figure 9 show how the Swin-T configurations behave as the confidence threshold changes. For broken-shell defects, Swin-T-BRA reaches an F1 score of 0.978 at a threshold of 0.771 and remains competitive across the displayed range (Figure 9c). The curves complement the fixed-threshold metrics by showing the precision-recall trade-off within the evaluated data. Representative qualitative detection results and Score-CAM response maps for insulator strings (Figure A8), broken-shell defects (Figure A9), and flashover-damaged shell defects (Figure A10) are provided in Appendix A.

4. Discussion

The controlled comparisons summarized in Table 6 distinguish the effects of training-image appearance diversification, neck architecture, backbone, and localization loss. With CSPDarknet53 and PANet fixed, appearance diversification increases mAP@0.5 from 95.6% to 95.8% (+0.2 percentage points) and mAP@0.5:0.95 from 79.7% to 82.2% (+2.5 points). Using the same appearance-diversified training set, and with CSPDarknet53 and CIoU fixed, replacing PANet with PRA further improves mAP@0.5 and mAP@0.5:0.95 by 2.2 and 4.6 percentage points, respectively, while BRA provides additional gains of 1.5 and 4.0 points. These gains therefore represent the architectural contribution attributable specifically to PRA/BRA under the controlled setting, independent of the improvement introduced by training-image appearance diversification. In comparison, changing only the backbone from CSPDarknet53 to Next-ViT with PANet and CIoU fixed produces gains of 3.0 and 7.7 points, whereas replacing CIoU with Alpha-CIoU under the fixed CSPDarknet53-PANet configuration produces smaller gains of 0.1 and 0.9 points. Accordingly, the absolute performance of the combined backbone-neck-loss configurations in Table 5 reflects the joint effects of training-image appearance diversification and model-component design, whereas the reported PRA/BRA gains quantify the incremental architectural improvement relative to PANet trained on the identical appearance-diversified training set.
These results show that PRA/BRA improve detection performance under stricter IoU requirements when the backbone, localization loss, and detection head are fixed. However, mAP@0.5:0.95 remains an aggregate detection metric and does not independently quantify bounding-box regression error. Alternative regression-head architectures and direct geometric localization metrics, such as center-distance error, were not separately evaluated in the present study. Therefore, the observed gains are interpreted as improved high-IoU detection performance rather than as direct evidence of an isolated localization mechanism. The relatively small differences among several localization losses in Table 3 should also be interpreted as numerical differences on the present fixed data split, because repeated training runs, cross-validation, and statistical significance tests were not performed.
The configuration with the highest strict-localization performance is distinguished from the final model selected for transmission-line defect inspection. Swin-T-PRA + Alpha-CIoU and Swin-T-BRA + Alpha-CIoU both achieve the highest mAP@0.5:0.95 of 91.3%. However, recall is a critical consideration in transmission-line defect inspection because missed detections may leave defects unidentified during inspection. From this perspective, Swin-T-BRA + CIoU provides a more suitable performance trade-off, achieving 98.9% mAP@0.5 and 90.9% mAP@0.5:0.95, together with a broken-shell recall of 96.5% and a flashover-damage recall of 100%. By comparison, Swin-T-PRA + Alpha-CIoU and Swin-T-BRA + Alpha-CIoU achieve broken-shell recalls of 92.4% and 94.4%, respectively, despite their slightly higher mAP@0.5:0.95 of 91.3%. Swin-T-BRA + CIoU also achieves the highest overall F1 score of 0.983 among the evaluated Swin-T configurations while maintaining an inference speed of 48.3 FPS. Accordingly, considering the importance of reducing missed defect detections together with overall detection accuracy, F1 performance, and inference efficiency, Swin-T-BRA + CIoU is selected as the final model configuration in this study.
Broken-shell defects remain more difficult than complete insulator strings and flashover-damaged shells. This persistent gap is associated with both data imbalance and target-scale disparity. As shown in Table 1, broken-shell instances are less frequent than the other two classes, and their damaged regions generally occupy smaller image areas and depend strongly on viewing direction and local geometry. These factors can make discriminative cues more susceptible to attenuation during feature extraction and cross-scale fusion. Although PRA and BRA improve broken-shell recall and AP@0.5:0.95 relative to the PANet baseline, the class-wise gap remains. For example, PRA increases broken-shell recall from 81.2% to 86.6% and AP@0.5:0.95 from 71.6% to 79.6%, while BRA increases them to 87.8% and 78.0%, respectively. The receptive-field-aware fusion mechanisms therefore mitigate, but do not fully resolve, the difficulty associated with this class. Aggregate mAP should consequently be interpreted together with class-specific recall and AP.
Among the frameworks evaluated on the same task, the Swin-T-BRA + CIoU configuration records the highest mAP@0.5 and mAP@0.5:0.95 values reported in Table 7. This result supports its relative performance within the dataset and evaluation setup used for the table. Because performance depends on data composition, training protocol, and implementation details, the comparison does not provide a universal ranking. Broader comparisons would require controlled evaluation on additional datasets and acquisition conditions.

5. Conclusions

This study investigated whether receptive-field expansion and adaptive cross-scale feature aggregation can improve high-IoU localization when complete insulator strings, localized broken-shell defects, and flashover-damaged regions are detected within a unified transmission-line inspection framework. To address their substantial differences in scale and contextual dependence, PRA and BRA were developed to integrate multi-path feature propagation, receptive-field refinement, and adaptive scale weighting within the detection neck.
Controlled comparisons with CSPDarknet53 and CIoU show that the proposed necks provide larger gains under stricter localization criteria than at IoU = 0.5. Relative to PANet, PRA improves mAP@0.5 and mAP@0.5:0.95 by 2.2 and 4.6 percentage points, respectively, while BRA yields gains of 1.5 and 4.0 points. Further backbone-neck-loss comparisons show that these gains depend on the interaction between feature representation, cross-scale aggregation, and boundary regression. Swin-T-PRA + Alpha-CIoU and Swin-T-BRA + Alpha-CIoU jointly achieve the highest mAP@0.5:0.95 of 91.3%. Considering the importance of recall in transmission-line defect inspection, together with overall detection performance and inference efficiency, Swin-T-BRA + CIoU is selected as the final model configuration in this study.
The results show that receptive-field-aware adaptive cross-scale fusion is particularly effective under stricter IoU-based detection criteria for heterogeneous-scale insulator targets. The present conclusions remain limited to the evaluated dataset and protocol. Future work will examine repeated-run variability and statistical significance, class-balanced and small-defect-oriented training strategies, cross-dataset and cross-line generalization, adverse-weather conditions, and end-to-end deployment on resource-constrained inspection platforms.


Author Contributions

Conceptualization, W.Y., Q.W., Z.H., Y.H. and W.P.; Methodology, W.Y., Q.W., E.L., Z.H., Y.H., W.P. and J.S.; Software, E.L.; Validation, Q.W. and Z.H.; Formal analysis, W.Y.; Investigation, W.Y. and Q.W.; Data curation, E.L.; Writing—original draft, W.Y., Q.W., E.L. and Z.H.; Writing—review & editing, Q.W., Y.H., W.P. and J.S.; Visualization, W.Y., Q.W., E.L. and Y.H.; Supervision, Q.W., W.P. and J.S.; Funding acquisition, Q.W. and J.S. All authors have read and agreed to the published version of the manuscript.
Funding

This research was funded by the Natural Science Foundation of Hebei Province of China (Grant No.: F2026502033), the Scientific Research Innovation Capability Support Project for Young Faculty (Grant No.: SRICSPYF-ZY2025079), and the Fundamental Research Funds for the Central Universities (Grant No.: 2025MS132).

Data Availability Statement

The Chinese Power Line Insulator Dataset (CPLID) is available at the following address: https://github.com/InsulatorData/InsulatorDataSet (accessed on 15 September 2026). The Insulator Defect Image Dataset (IDID) is publicly available upon request from the Electric Power Research Institute. Researchers may obtain the dataset by contacting orders@epri.com, following the access instructions outlined at: https://restservice.epri.com/publicdownload/000000003002017949/0/Product (accessed on 15 September 2026).

Acknowledgments

During the preparation of this work, the authors used ChatGPT-5.6 Sol to improve language clarity and readability. After using these tools, the authors reviewed and edited the content as needed and take full responsibility for the content of the published article.

Conflicts of Interest

The authors declare no conflicts of interest.

Abbreviations

AIartificial intelligence
APaverage precision
ASFFadaptive spatial feature fusion
BiFPNbidirectional feature pyramid network
BRAbidirectional receptive-field-aware aggregation
CIoUcomplete intersection over union
CPLIDChinese Power Line Insulator Dataset
CSPDarknet53cross-stage partial Darknet53
CycleGANcycle-consistent generative adversarial network
DIoUdistance intersection over union
DTdetected box
EIoUefficient intersection over union
EPRIElectric Power Research Institute
F1F1 score
Faster R-CNNFaster region-based convolutional neural network
FPSframes per second
GFLOPsgiga floating-point operations
GIoUgeneralized intersection over union
GTground-truth box
IDIDInsulator Defect Image Dataset
IoUintersection over union
mAPmean average precision
Pprecision
PANetpath aggregation network
PRAreceptive-field-aware path aggregation
Rrecall
RFBreceptive field block
Score-CAMscore-weighted class activation mapping
SPPNetspatial pyramid pooling network
SSDsingle shot multibox detector
Swin-TSwin Transformer-Tiny
UAVunmanned aerial vehicle
ViTvision transformer
WIoUwise intersection over union
YOLOYou Only Look Once

Appendix A. Supplementary Architectures and Case Visualizations

Figure A1. Network architecture and implementation details of the baseline YOLO V5 model.
Applsci 16 09342 g0a1
Figure A2. CycleGAN workflow used to derive winter-like training images. The arrows indicate the image transformation directions between different domains, and the discriminators D x and D y distinguish real and generated images.
Applsci 16 09342 g0a2
Figure A3. PANet neck architecture. (Left): network implementation; (Right): feature-fusion paths.
Applsci 16 09342 g0a3
Figure A4. ASFF neck architecture. (Left): network implementation; (Right): feature-fusion paths.
Applsci 16 09342 g0a4
Figure A5. BiFPN neck architecture. (Left): network implementation; (Right): feature-fusion paths.
Applsci 16 09342 g0a5
Figure A6. Network structure and implementation details of the RFB module.
Applsci 16 09342 g0a6
Figure A7. PANet-RFB and BiFPN-RFB structures. (Left): PANet-RFB; (Right): BiFPN-RFB.
Applsci 16 09342 g0a7
Representative detection results and Score-CAM response maps for insulator strings, broken-shell defects, and flashover-damaged shells are shown in Figure A8, Figure A9 and Figure A10.
Figure A8. Visualization of the detection results of insulator-string cases. (First row): Object detection results. (Second row): Response heatmaps of detection results based on score-weighted class activation mapping (Score-CAM).
Applsci 16 09342 g0a8
Figure A9. Visualization of the detection results of broken shell defect cases. (First row): Object detection results. (Second row): Response heatmaps of detection results based on Score-CAM.
Applsci 16 09342 g0a9
Figure A10. Visualization of the detection results of flashover damage shell defect cases. (First row): Object detection results. (Second row): Response heatmaps of detection results based on Score-CAM.
Applsci 16 09342 g0a10

References

  1. Cheng, Y.; Li, C.; Huang, X. Study of corona discharge pattern on high voltage transmission lines for inspecting faulty porcelain insulators. IEEE Trans. Power Deliv. 2008, 23, 945–952. [Google Scholar] [CrossRef] [Scilit]
  2. Salem, A.A.; Lau, K.Y.; Rahiman, W.; Abdul-Malek, Z.; Al-Gailani, S.A.; Mohammed, N.; Abd Rahman, R.; Al-Ameri, S.M. Pollution flashover voltage of transmission line insulators: Systematic review of experimental works. IEEE Access 2022, 10, 10416–10444. [Google Scholar] [CrossRef] [Scilit]
  3. Abbasi, A.; Shayegani, A.; Niayesh, K. Pollution performance of HVDC SiR insulators at extra heavy pollution conditions. IEEE Trans. Dielectr. Electr. Insul. 2014, 21, 721–728. [Google Scholar] [CrossRef] [Scilit]
  4. Su, H.; Jia, Z.; Guan, Z.; Li, L. Mechanism of contaminant accumulation and flashover of insulator in heavily polluted coastal area. IEEE Trans. Dielectr. Electr. Insul. 2010, 17, 1635–1641. [Google Scholar] [CrossRef] [Scilit]
  5. Fu, Q.; Liu, J.; Zhang, X.; Zhang, Y.; Ou, Y.; Jiao, R.; Li, C.; Mazzanti, G. A small-sized defect detection method for overhead transmission lines based on convolutional neural networks. IEEE Trans. Instrum. Meas. 2023, 72, 3524612. [Google Scholar] [CrossRef] [Scilit]
  6. Luo, Y.; Yu, X.; Yang, D.; Zhou, B. A survey of intelligent transmission line inspection based on unmanned aerial vehicle. Artif. Intell. Rev. 2023, 56, 173–201. [Google Scholar] [CrossRef] [Scilit]
  7. Yuan, C.; Xie, C.; Li, L.; Zhang, F.; Gubanski, S.M. Ultrasonic phased array detection of internal defects in composite insulators. IEEE Trans. Dielectr. Electr. Insul. 2016, 23, 525–531. [Google Scholar] [CrossRef] [Scilit]
  8. Liu, M.; Li, Z.; Li, Y.; Liu, Y. A fast and accurate method of power line intelligent inspection based on edge computing. IEEE Trans. Instrum. Meas. 2022, 71, 3506512. [Google Scholar] [CrossRef] [Scilit]
  9. Li, Z.; Zhang, Y.; Wu, H.; Suzuki, S.; Namiki, A.; Wang, W. Design and Application of a UAV Autonomous Inspection System for High-Voltage Power Transmission Lines. Remote Sens. 2023, 15, 865. [Google Scholar] [CrossRef] [Scilit]
  10. Li, X.; Li, Z.; Wang, H.; Li, W. Unmanned aerial vehicle for transmission line inspection: Status, standardization, and perspectives. Front. Energy Res. 2021, 9, 713634. [Google Scholar] [CrossRef] [Scilit]
  11. Radicioni, L.; Bono, F.M.; Cinquemani, S. Application of synchrosqueezing transform and autoencoders for monitoring of production systems. A case study on plastic chain conveyor systems. In Proceedings of the 2024 20th IEEE/ASME International Conference on Mechatronic and Embedded Systems and Applications (MESA), Genova, Italy, 2–4 September 2024; pp. 1–7. [Google Scholar]
  12. Tao, T.; Li, Z. A review of deep learning application in transmission line defect detection. Electr. Power Syst. Res. 2026, 250, 112193. [Google Scholar] [CrossRef] [Scilit]
  13. Ling, Z.N.; Zhang, D.X.; Qiu, R.C.; Jin, Z.J.; Zhang, Y.H.; He, X.; Liu, H.C. An Accurate and Real-time Method of Self-blast Glass Insulator Location Based on Faster R-CNN and U-net with Aerial Images. CSEE J. Power Energy Syst. 2019, 5, 474–482. [Google Scholar] [CrossRef] [Scilit]
  14. Zhao, W.Q.; Xu, M.F.; Cheng, X.F.; Zhao, Z.B. An Insulator in Transmission Lines Recognition and Fault Detection Model Based on Improved Faster RCNN. IEEE Trans. Instrum. Meas. 2021, 70, 5016408. [Google Scholar] [CrossRef] [Scilit]
  15. Wei, N.; Li, X.Y.; Jin, J.Q.; Chen, P.; Sun, S.F. Detecting Insulator Strings as Linked Chain Structure in Smart Grid Inspection. IEEE Trans. Ind. Inform. 2023, 19, 9019–9027. [Google Scholar] [CrossRef] [Scilit]
  16. Liu, X.Y.; Miao, X.R.; Jiang, H.; Chen, J. Box-point detector: A diagnosis method for insulator faults in power lines using aerial images and convolutional neural networks. IEEE Trans. Power Deliv. 2021, 36, 3765–3773. [Google Scholar] [CrossRef] [Scilit]
  17. Souza, B.J.; Stefenon, S.F.; Singh, G.; Freire, R.Z. Hybrid-YOLO for classification of insulators defects in transmission lines based on UAV. Int. J. Electr. Power Energy Syst. 2023, 148, 108982. [Google Scholar] [CrossRef] [Scilit]
  18. Wei, B.Q.; Xie, Z.X.; Liu, Y.D.; Wen, K.Y.; Deng, F.M.; Zhang, P. Online monitoring method for insulator self-explosion based on edge computing and deep learning. CSEE J. Power Energy Syst. 2022, 8, 1684–1696. [Google Scholar] [CrossRef] [Scilit]
  19. Xu, Z.-y.; Tang, X. Transmission line insulator defect detection algorithm based on MAP-YOLOv8. Sci. Rep. 2025, 15, 10288. [Google Scholar] [CrossRef] [Scilit] [PubMed]
  20. Yao, X.; Li, S. An object detection method based on improved detection transformer for insulator defect detection of electrical transmission lines. Electr. Power Syst. Res. 2026, 256, 112929. [Google Scholar] [CrossRef] [Scilit]
  21. Song, C.; Xu, W.; Han, G.; Zeng, P.; Wang, Z.; Yu, S. A cloud edge collaborative intelligence method of insulator string defect detection for power IIoT. IEEE Internet Things J. 2021, 8, 7510–7520. [Google Scholar] [CrossRef] [Scilit]
  22. Liu, Z.Y.; Wu, G.P.; He, W.S.; Fan, F.; Ye, X.H. Key target and defect detection of high-voltage power transmission lines with deep learning. Int. J. Electr. Power Energy Syst. 2022, 142, 108277. [Google Scholar] [CrossRef] [Scilit]
  23. Deng, F.M.; Xie, Z.X.; Mao, W.; Li, B.; Shan, Y.; Wei, B.Q.; Zeng, H. Research on edge intelligent recognition method oriented to transmission line insulator fault detection. Int. J. Electr. Power Energy Syst. 2022, 139, 108054. [Google Scholar] [CrossRef] [Scilit]
  24. Dian, S.Y.; Zhong, X.K.; Zhong, Y.Z. Faster R-Transformer: An efficient method for insulator detection in complex aerial environments. Measurement 2022, 199, 111238. [Google Scholar] [CrossRef] [Scilit]
  25. Chen, J.L.; Fu, Z.J.; Cheng, X.; Wang, F. An method for power lines insulator defect detection with attention feedback and double spatial pyramid. Electr. Power Syst. Res. 2023, 218, 109175. [Google Scholar] [CrossRef] [Scilit]
  26. Zhang, Z.D.; Zhang, B.; Lan, Z.C.; Liu, H.C.; Li, D.Y.; Pei, L.; Yu, W.X. FINet: An insulator dataset and detection benchmark based on synthetic fog and improved YOLOv5. IEEE Trans. Instrum. Meas. 2022, 71, 6006508. [Google Scholar] [CrossRef] [Scilit]
  27. Cao, Y.; Xu, H.; Su, C.; Yang, Q. Accurate glass insulators defect detection in power transmission grids using aerial image augmentation. IEEE Trans. Power Deliv. 2023, 38, 956–965. [Google Scholar] [CrossRef] [Scilit]
  28. Gao, Z.S.; Yang, G.D.; Li, E.; Liang, Z.Z. Novel feature fusion module-based detector for small insulator defect detection. IEEE Sens. J. 2021, 21, 16807–16814. [Google Scholar] [CrossRef] [Scilit]
  29. Liang, X.; Zhang, J.; Zhuo, L.; Li, Y.Z.; Tian, Q. Small object detection in unmanned aerial vehicle images using feature fusion and scaling-based single shot detector with spatial context analysis. IEEE Trans. Circuits Syst. Video Technol. 2020, 30, 1758–1770. [Google Scholar] [CrossRef] [Scilit]
  30. Cheng, G.; Yuan, X.; Yao, X.; Yan, K.; Zeng, Q.; Xie, X.; Han, J. Towards large-scale small object detection: Survey and benchmarks. IEEE Trans. Pattern Anal. Mach. Intell. 2023, 45, 13467–13488. [Google Scholar] [CrossRef] [Scilit] [PubMed]
  31. Liu, J.J.; Liu, C.A.Y.; Wu, Y.Q.; Xu, H.J.; Sun, Z. An Improved Method Based on Deep Learning for Insulator Fault Detection in Diverse Aerial Images. Energies 2021, 14, 4365. [Google Scholar] [CrossRef] [Scilit]
  32. Li, X.; Sun, Y.; Liu, X.; Wu, X. Insulator defect detection in transmission line in sandy and dusty scenarios based on deep learning. Electr. Power Syst. Res. 2026, 256, 112852. [Google Scholar] [CrossRef] [Scilit]
  33. Xu, J.; Liao, H.; Li, K.; Jiang, C.; Li, D. Multiscale feature fusion transformer with hybrid attention for insulator defect detection. IEEE Trans. Instrum. Meas. 2025, 74, 3539813. [Google Scholar] [CrossRef] [Scilit]
  34. Wang, Q.; Li, E.; Cui, S.; Yang, W.; Zhang, X.; Jiang, W.; Hu, Y.; Peng, W.; Sun, J. Cross-scale recognition of dense insulators and defects in complex power grid environments. Eng. Appl. Artif. Intell. 2026, 164, 113283. [Google Scholar] [CrossRef] [Scilit]
  35. Diwan, T.; Anirudh, G.; Tembhurne, J.V. Object detection using YOLO: Challenges, architectural successors, datasets and applications. Multimed. Tools Appl. 2023, 82, 9243–9275. [Google Scholar] [CrossRef] [Scilit] [PubMed]
  36. Zhu, J.-Y.; Park, T.; Isola, P.; Efros, A.A. Unpaired image-to-image translation using cycle-consistent adversarial networks. In Proceedings of the IEEE International Conference on Computer Vision, Venice, Italy, 22–29 October 2017; pp. 2223–2232. [Google Scholar]
  37. He, K.; Sun, J.; Tang, X. Single image haze removal using dark channel prior. IEEE Trans. Pattern Anal. Mach. Intell. 2011, 33, 2341–2353. [Google Scholar] [CrossRef] [Scilit]
  38. Tao, X.; Zhang, D.; Wang, Z.; Liu, X.; Zhang, H.; Xu, D. Detection of power line insulator defects using aerial images analyzed with convolutional neural networks. IEEE Trans. Syst. Man Cybern. Syst. 2018, 50, 1486–1498. [Google Scholar] [CrossRef] [Scilit]
  39. Kulkarni, P.; Shaw, T.; Lewis, D. Insulator Defect Image Dataset—Version 1.2: Documentation; Electric Power Research Institute (EPRI): Palo Alto, CA, USA, 2020. [Google Scholar] [CrossRef] [Scilit]
  40. Liu, S.; Qi, L.; Qin, H.; Shi, J.; Jia, J. Path aggregation network for instance segmentation. In Proceedings of the IEEE Conference on Computer Vision and Pattern Recognition, Salt Lake City, UT, USA, 18–22 June 2018; pp. 8759–8768. [Google Scholar]
  41. Liu, S.; Huang, D.; Wang, Y. Learning spatial fusion for single-shot object detection. arXiv 2019, arXiv:1911.09516. [Google Scholar] [CrossRef] [Scilit]
  42. Tan, M.; Pang, R.; Le, Q.V. Efficientdet: Scalable and efficient object detection. In Proceedings of the IEEE/CVF Conference on Computer Vision and Pattern Recognition, Seattle, WA, USA, 13–19 June 2020; pp. 10781–10790. [Google Scholar]
  43. Liu, S.; Huang, D. Receptive field block net for accurate and fast object detection. In Proceedings of the European Conference on Computer Vision (ECCV), Munich, Germany, 8–14 September 2018; pp. 385–400. [Google Scholar]
  44. Dosovitskiy, A.; Beyer, L.; Kolesnikov, A.; Weissenborn, D.; Zhai, X.; Unterthiner, T.; Dehghani, M.; Minderer, M.; Heigold, G.; Gelly, S. An image is worth 16x16 words: Transformers for image recognition at scale. arXiv 2020, arXiv:2010.11929. [Google Scholar] [CrossRef] [Scilit]
  45. Liu, Z.; Lin, Y.; Cao, Y.; Hu, H.; Wei, Y.; Zhang, Z.; Lin, S.; Guo, B. Swin transformer: Hierarchical vision transformer using shifted windows. In Proceedings of the IEEE/CVF International Conference on Computer Vision, Montreal, QC, Canada, 10–17 October 2021; pp. 10012–10022. [Google Scholar]
  46. Li, J.; Xia, X.; Li, W.; Li, H.; Wang, X.; Xiao, X.; Wang, R.; Zheng, M.; Pan, X. Next-vit: Next generation vision transformer for efficient deployment in realistic industrial scenarios. arXiv 2022, arXiv:2207.05501. [Google Scholar] [CrossRef] [Scilit]
  47. Liu, X.; Peng, H.; Zheng, N.; Yang, Y.; Hu, H.; Yuan, Y. EfficientViT: Memory efficient vision transformer with cascaded group attention. In Proceedings of the IEEE/CVF Conference on Computer Vision and Pattern Recognition, Vancouver, BC, Canada, 17–24 June 2023; pp. 14420–14430. [Google Scholar]
  48. Yadav, A.; Nirala, A.K.; Swetapadma, A. Comparative deep learning approaches for insulator condition monitoring in power transmission line. Electr. Power Syst. Res. 2026, 257, 113020. [Google Scholar] [CrossRef] [Scilit]
  49. Liu, Z.; Mao, H.; Wu, C.-Y.; Feichtenhofer, C.; Darrell, T.; Xie, S. A convnet for the 2020s. In Proceedings of the IEEE/CVF Conference on Computer Vision and Pattern Recognition, New Orleans, LA, USA, 18–24 June 2022; pp. 11976–11986. [Google Scholar]
  50. Woo, S.; Debnath, S.; Hu, R.; Chen, X.; Liu, Z.; Kweon, I.S.; Xie, S. Convnext v2: Co-designing and scaling convnets with masked autoencoders. In Proceedings of the IEEE/CVF Conference on Computer Vision and Pattern Recognition, Vancouver, BC, Canada, 17–24 June 2023; pp. 16133–16142. [Google Scholar]
  51. Rezatofighi, H.; Tsoi, N.; Gwak, J.; Sadeghian, A.; Reid, I.; Savarese, S. Generalized intersection over union: A metric and a loss for bounding box regression. In Proceedings of the IEEE/CVF Conference on Computer Vision and Pattern Recognition, Long Beach, CA, USA, 15–20 June 2019; pp. 658–666. [Google Scholar]
  52. Zheng, Z.; Wang, P.; Ren, D.; Liu, W.; Ye, R.; Hu, Q.; Zuo, W. Enhancing geometric factors in model learning and inference for object detection and instance segmentation. IEEE Trans. Cybern. 2022, 52, 8574–8586. [Google Scholar] [CrossRef] [Scilit] [PubMed]
  53. Zhang, Y.-F.; Ren, W.; Zhang, Z.; Jia, Z.; Wang, L.; Tan, T. Focal and efficient IOU loss for accurate bounding box regression. Neurocomputing 2022, 506, 146–157. [Google Scholar] [CrossRef] [Scilit]
  54. Tong, Z.; Chen, Y.; Xu, Z.; Yu, R. Wise-IoU: Bounding box regression loss with dynamic focusing mechanism. arXiv 2023, arXiv:2301.10051. [Google Scholar] [CrossRef] [Scilit]
  55. He, J.; Erfani, S.; Ma, X.; Bailey, J.; Chi, Y.; Hua, X.-S. α-IoU: A family of power intersection over union losses for bounding box regression. In Advances in Neural Information Processing Systems 34 (NeurIPS 2021); Curran Associates, Inc.: Red Hook, NY, USA, 2021; pp. 20230–20242. [Google Scholar]
Figure 1. Representative overhead-transmission-line insulator strings and associated fittings, together with flashover-damaged and broken-shell examples. (a) Suspension insulator string with associated fittings and flashover-damaged shell; (b) insulator string with a broken-shell defect.
Applsci 16 09342 g001
Figure 2. Representative original, CycleGAN-derived, and synthetically fogged insulator images.
Applsci 16 09342 g002
Figure 3. Overall pipeline of the proposed insulator-defect detection framework. The inference path proceeds from task/data through the backbone, PRA/BRA neck, and detection head to final detections; appearance diversification is confined to the training branch. PRA, receptive-field-aware path aggregation; BRA, bidirectional receptive-field-aware aggregation.
Applsci 16 09342 g003
Figure 4. Architectures of the proposed receptive-field-aware fusion necks: (a) PRA with PANet-based path propagation and (b) BRA with BiFPN-based path propagation. Both necks apply RFB-based receptive-field refinement before ASFF-based adaptive cross-scale fusion. PANet, path aggregation network; BiFPN, bidirectional feature pyramid network; RFB, receptive field block; ASFF, adaptive spatial feature fusion. The blue and purple arrows indicate additional feature propagation paths in the BRA neck.
Applsci 16 09342 g004
Figure 5. Effect of different neck architectures on aggregate detection performance. (a) Detection framework with PRA/BRA fusion necks; (b) training-image appearance diversification branch.
Applsci 16 09342 g005
Figure 6. Class-wise detection performance across the evaluated neck architectures. (a) Recall comparison; (b) precision comparison; (c) AP@0.5 comparison; (d) AP@0.5:0.95 comparison.
Applsci 16 09342 g006
Figure 7. Validation performance during training for the evaluated model architectures. ViT, vision transformer; Swin-T, Swin Transformer-Tiny. (a) mAP@0.5 variation during training; (b) mAP@0.5:0.95 variation during training.
Applsci 16 09342 g007
Figure 8. Relationship among detection performance, computational complexity, and inference speed for the evaluated model architectures. Circle area represents model GFLOPs. (a) Results based on mAP@0.5; (b) Results based on mAP@0.5:0.95. Circle area represents model GFLOPs.
Applsci 16 09342 g008
Figure 9. F1-confidence curves for the evaluated Swin-T configurations and target classes. F1, F1 score. (a) F1-confidence curves for insulator-string detection; (b) F1-confidence curves for flasho-ver-damage detection; (c) F1-confidence curves for broken-shell detection; (d) F1-confidence curves for all target classes.
Applsci 16 09342 g009
Table 1. Cumulative object-instance counts across training-image diversification stages.
Dataset CompositionOriginalCycleGANSynthetic Fog
Insulator string312556268127
Broken shell142825613694
Flashover damage shell256446086652
Total711712,79518,473
Note: Values denote cumulative annotated object-instance counts rather than numbers of images. Appearance diversification was applied only to the training subset.
Table 2. Effect of training-image appearance diversification on model performance; model: CSPDarknet53 + PANet. CSPDarknet53, cross-stage partial Darknet53; P, precision; R, recall; AP, average precision; mAP, mean average precision.
Augmentation MethodObjectsPRAP@0.5AP@0.5:0.95mAP@0.5mAP@0.5:0.95
General methodInsulator string98.893.698.784.795.679.7
Broken shell97.385.490.570.7
Flashover damage shell93.196.897.783.7
CycleGAN + Synthetic fogInsulator string98.695.598.687.195.882.2
Broken shell98.981.290.271.6
Flashover damage shell98.396.898.787.9
Table 3. Comparison of IoU-Loss variants; model: CSPDarknet53 + PANet. IoU, intersection over union; GIoU, generalized IoU; DIoU, distance IoU; CIoU, complete IoU; EIoU, efficient IoU; WIoU, wise IoU.
IoU LossObjectsPRAP@0.5AP@0.5:0.95mAP@0.5mAP@0.5:0.95
GIoUInsulator string98.495.898.584.495.279.0
Broken shell95.281.989.269.5
Flashover damage shell92.096.497.783.3
DIoUInsulator string97.794.498.586.995.381.8
Broken shell96.277.888.871.6
Flashover damage shell97.49898.586.9
EIoUInsulator string97.796.199.088.695.382.8
Broken shell95.981.189.072.1
Flashover damage shell94.695.698.087.6
WIoUInsulator string97.496.898.887.695.582.1
Broken shell96.883.789.172.5
Flashover damage shell94.498.098.686.2
CIoUInsulator string98.695.598.687.195.882.2
Broken shell98.981.290.271.6
Flashover damage shell98.396.898.787.9
Alpha-GIoUInsulator string97.496.699.086.395.480.1
Broken shell95.981.791.670.7
Flashover damage shell87.790.795.583.3
Alpha-DIoUInsulator string96.896.898.889.195.782.9
Broken shell97.683.189.871.5
Flashover damage shell95.098.398.388.0
Alpha-CIoUInsulator string97.696.898.888.995.983.1
Broken shell95.981.890.472.1
Flashover damage shell95.097.698.688.3
Table 4. Comparative and ablation results for different neck architectures; backbone: CSPDarknet53; loss: CIoU. GFLOPs, giga floating-point operations; FPS, frames per second.
NecksModel Performance Evaluation MetricsModel Training and Inference Metrics
ObjectsPRAP@0.5AP@0.5:0.95mAP@0.5mAP@0.5:0.95ParametersGFLOPsFPS
PANet (baseline)Insulator string98.695.598.687.195.882.27.02M15.895.8
Broken shell98.981.290.271.6
Flashover damage shell98.396.898.787.9
ASFFInsulator string97.796.698.98794.5−1.379.3−2.99.6M18.8133.3
Broken shell92.379.287.067.6
Flashover damage shell95.597.697.683.4
BiFPNInsulator string96.097.599.189.097.1+1.383.3+1.17.17M16.485.5
Broken shell97.585.493.174.0
Flashover damage shell94.598.098.986.8
PANet-RFBInsulator string98.496.798.989.897.2+1.484.9+2.78.75M19.089.3
Broken shell96.781.893.576.0
Flashover damage shell98.198.099.188.8
BiFPN-RFBInsulator string97.795.998.888.397.4+1.684.3+2.18.81M19.284.7
Broken shell97.787.794.676.5
Flashover damage shell989898.788
Tri-BiFPNInsulator string98.49598.684.395.2−0.684.2+2.010.12M22.176.9
Broken shell97.582.489.274.0
Flashover damage shell96.396.497.889.2
PANet-RFB-ASFF (PRA)Insulator string98.396.599.290.298.0+2.286.8+4.614.2M27.373.0
Broken shell10086.695.379.6
Flashover damage shell98.299.299.490.6
BiFPN-RFB-ASFF (BRA)Insulator string97.495.898.690.497.3+1.586.2+4.014.2M27.570.4
Broken shell96.287.894.678.0
Flashover damage shell95.298.898.690.4
Table 5. ViT-based configurations were trained on a Tesla V100 (NVIDIA Corporation, Santa Clara, CA, USA), and FPS was measured on an RTX 3080 Ti (NVIDIA Corporation, Santa Clara, CA, USA).
Model ArchitectureModel Performance Evaluation MetricsModel Training and Inference Metrics
BackboneNeck + LossObjectsPRAP@0.5AP@0.5:0.95mAP@0.5mAP@0.5:0.95ParametersGFLOPsFPS
Baseline modelInsulator string98.695.598.687.195.882.27.02M15.895.8
Broken shell98.981.290.271.6
Flashover damage shell98.396.898.787.9
ConvNeXt V1PANet + CIoUInsulator string97.097.599.190.998.5+2.789.0+6.829.3M74.970.6
Broken shell99.993.197.083.7
Flashover damage shell98.499.499.492.5
ConvNeXt V2PANet + CIoUInsulator string97.795.998.490.696.6+0.886.4+4.232.74M79.362.9
Broken shell99.984.092.377.5
Flashover damage shell98.398.499.091.2
Next-ViTPANet + CIoUInsulator string98.197.999.393.098.8+3.089.9+7.761.49M182.528.4
Broken shell99.994.498.184.6
Flashover damage shell98.899.999.092.2
EfficientViTPANet + CIoUInsulator string98.498.099.391.199.0+3.288.2+6.016.01M26.764.1
Broken shell97.997.998.983.4
Flashover damage shell98.098.099.090.0
Swin-TPANet + CIoUInsulator string97.598.299.291.699.1+3.389.2+7.031.63M80.057.1
Broken shell97.894.898.785.7
Flashover damage shell99.610099.590.2
EfficientViTPRA + CIoUInsulator string98.497.199.092.298.8+3.090.8+8.625.6M42.445.2
Broken shell98.694.998.186.6
Flashover damage shell99.299.699.293.6
EfficientViTBRA + CIoUInsulator string98.595.599.292.198.8+3.090.6+8.425.6M42.541.2
Broken shell97.794.497.885.5
Flashover damage shell98.899.699.594.3
Swin-TPRA + CIoUInsulator string98.197.099.292.899.1+3.390.5+8.338.8M91.548.5
Broken shell97.997.198.785.8
Flashover damage shell99.610099.593.0
Swin-TBRA + CIoUInsulator string98.497.599.192.098.9+3.190.9+8.738.9M91.948.3
Broken shell98.396.598.286.5
Flashover damage shell99.110099.594.1
Swin-T PRA + α - CIoU Insulator string98.496.099.393.398.6+2.891.3+9.138.8M91.548.5
Broken shell97.092.497.086.1
Flashover damage shell99.710099.594.6
Swin-T BRA + α - CIoU Insulator string98.197.399.393.898.5+2.791.3+9.138.9M91.948.3
Broken shell95.194.496.985.1
Flashover damage shell99.410099.594.9
Table 6. Summary of controlled comparisons for training-image diversification and model components.
Component EvaluatedFixed ConfigurationControlled ComparisonmAP@0.5ΔmAP@0.5mAP@0.5:0.95ΔmAP@0.5:0.95
Training-image diversificationCSPDarknet53 + PANetGeneral augmentation
→ CycleGAN + fog
95.6 → 95.8+0.279.7 → 82.2+2.5
NeckCSPDarknet53 + CIoUPANet → PRA95.8 → 98.0+2.282.2 → 86.8+4.6
NeckCSPDarknet53 + CIoUPANet → BRA95.8 → 97.3+1.582.2 → 86.2+4.0
BackbonePANet + CIoUCSPDarknet53 → Next-ViT95.8 → 98.8+3.082.2 → 89.9+7.7
Localization lossCSPDarknet53 + PANetCIoU → α-CIoU95.8 → 95.9+0.182.2 → 83.1+0.9
Note: All neck, backbone, and localization-loss comparisons use the same appearance-diversified training set; therefore, their reported gains do not include the improvement introduced by training-image diversification itself.
Table 7. Comparative results for different detection frameworks. YOLO, You Only Look Once; SSD, single shot multibox detector; Faster R-CNN, Faster region-based convolutional neural network.
ModelsObjectsPrecisionRecallAP@0.5AP@0.5:0.95mAP@0.5mAP@0.5:0.95
YOLO V5Insulator string98.893.698.784.795.679.7
Broken shell97.385.490.570.7
Flashover damage shell93.196.897.783.7
YOLO V3Insulator string95.193.297.481.194.579.6
Broken shell95.382.688.371.2
Flashover damage shell92.396.897.886.6
YOLO V7Insulator string95.798.498.887.496.680.0
Broken shell94.585.496.272.0
Flashover damage shell86.488.494.980.6
YOLO V8Insulator string96.299.099.393.797.986.0
Broken shell94.786.695.476.0
Flashover damage shell96.497.298.988.4
CenterNetInsulator string95.695.696.376.893.869.7
Broken shell93.890.593.062.8
Flashover damage shell78.790.592.069.6
SSDInsulator string95.392.398.180.694.772.4
Broken shell94.976.094.767.2
Flashover damage shell92.177.091.969.2
EfficientDetInsulator string96.474.188.668.291.967.8
Broken shell94.086.594.063.4
Flashover damage shell83.087.093.171.8
Faster R-CNNInsulator string88.099.499.074.997.365.8
Broken shell86.395.295.958.7
Flashover damage shell72.997.697.063.9
Swin-T-BRA(Ours)Insulator string98.497.599.192.098.990.9
Broken shell98.396.598.286.5
Flashover damage shell99.110099.594.1
Disclaimer/Publisher’s Note: The statements, opinions and data contained in all publications are solely those of the individual author(s) and contributor(s) and not of MDPI and/or the editor(s). MDPI and/or the editor(s) disclaim responsibility for any injury to people or property resulting from any ideas, methods, instructions or products referred to in the content.