Article

Freeze–Thaw-Induced Surface Crack and Pore Structure Evolution in Compacted Expansive Soil

1
Faculty of Engineering, China University of Geosciences (Wuhan), 388 Lumo Avenue, Wuhan 430074, China
2
Qinghai Provincial Center for Land Consolidation and Ecological Restoration, Xining 810016, China
*
Author to whom correspondence should be addressed.
Appl. Sci. 2026, 16(18), 9281; https://doi.org/10.3390/app16189281 (registering DOI)
Submission received: 6 August 2026 / Revised: 6 September 2026 / Accepted: 7 September 2026 / Published: 18 September 2026

Abstract

Reliable characterization of freeze–thaw-induced structural change is essential for evaluating compacted soils used in cold-region engineering, where repeated freezing and thawing can alter both surface integrity and internal pore structure. This study combines digital imaging, quantitative crack analysis, and X-ray computed tomography to characterize structural changes in compacted expansive soil subjected to 0, 1, 4, 7, and 10 freeze–thaw cycles. Specimens with initial water contents of 18% and 25% were observed during freezing and after thawing, while the post-thaw three-dimensional pore structure of the 18% specimen was reconstructed from CT images. The 18% surface specimen exhibited no continuous crack network despite evident internal pore restructuring, whereas the 25% specimen showed pronounced crack opening during freezing and partial closure after thawing. With increasing cycles, the crack pattern evolved from a dominant wide crack to a branched network of narrower cracks and then became less continuous. CT-resolvable porosity increased from 23.0% initially to 26.7% after four cycles and then remained nearly stable, whereas connected porosity increased to 25.4% after ten cycles. These complementary observations indicate that post-thaw surface appearance alone may underestimate freeze–thaw-induced structural disturbance and highlight the importance of moisture condition and early-cycle evolution in cold-region engineering.

1. Introduction

Expansive soil is a well-known problematic geomaterial in geotechnical engineering. Its high content of hydrophilic clay minerals, particularly montmorillonite, gives rise to pronounced water sensitivity, swelling–shrinkage deformation, and substantial structural variability [1,2,3,4,5,6,7,8]. Changes in moisture conditions modify matric suction, interparticle interactions, aggregate arrangement, and pore geometry, leading to repeated adjustment of the soil skeleton [9]. When the resulting deformations are constrained, cracking, differential displacement, and progressive deterioration may occur [4,10,11,12]. These problems affect the long-term performance of slopes, embankments, subgrades, foundations, and other earth structures. In seasonally frozen regions, expansive soils are additionally exposed to repeated freezing and thawing caused by seasonal temperature fluctuations. The combined effects of moisture sensitivity and thermal cycling make expansive soils particularly vulnerable to frost heave, thaw settlement, structural degradation, and cracking [13,14,15]. Understanding the multiscale structural evolution of expansive soil under freeze–thaw (FT) action is therefore important for assessing the serviceability and stability of geotechnical structures in cold and seasonally frozen environments.
Scanning electron microscopy, mercury intrusion porosimetry, nuclear magnetic resonance, X-ray computed tomography and digital-imaging techniques have been widely used to characterize freeze–thaw-induced variations in pore characteristics and crack-structure morphology [9,13,16,17,18,19]. FT action induced structural evolution is governed by coupled thermal, hydraulic, and mechanical processes [20,21,22,23,24]. As soil temperature decreases, pore water begins to freeze, and the associated water–ice phase transformation produces volumetric expansion within the pore system. The resulting frost-heave pressure acts on the surrounding pore walls and the soil skeleton, disturbing interparticle contacts and generating local deformation. In fine-grained soils, ice formation and growth within pores and pre-existing structural defects also create hydraulic gradients that drive unfrozen water toward the freezing zone. Continued moisture supply promotes further ice-crystal or ice-lens growth and intensifies the local expansion of the soil skeleton [16,18,25]. When the resulting tensile stress exceeds the local tensile resistance of the soil, existing weak zones may open and develop into cracks [26,27]. Under boundary conditions that permit moisture loss, shrinkage of soil aggregates may also contribute to tensile deformation and crack development [15,28]. During subsequent thawing, the melting of pore ice is accompanied by water redistribution, thaw settlement, and particle rearrangement. Changes in pore and crack structures can substantially alter the hydraulic and mechanical behavior of expansive soils. Pore enlargement and increased connectivity may facilitate internal water migration, whereas macroscopic cracks can provide preferential pathways for infiltration and considerably increase hydraulic conductivity [29,30]. Cracks also weaken the continuity and integrity of the soil skeleton [11,14,15,31,32]. The resulting increase in hydraulic conductivity can accelerate internal water redistribution and compromise the impermeability of compacted soil barriers. Moreover, the connection of individual cracks may create localized weak zones, reduce shear resistance, and increase the susceptibility of earth structures to deformation and instability [4,33]. Pore restructuring and crack development should therefore be regarded as interconnected manifestations of FT action induced structural deterioration rather than as isolated phenomena.
Previous studies have focused primarily on internal pore evolution and microscopic damage. Repeated water–ice phase transitions disturb interparticle contacts and cementation bonds, causing particle rearrangement and changes in pore volume, morphology, and connectivity [16,17,25,34,35,36,37,38,39]. The intensity and form of these responses are influenced by initial water content, dry density, mineral composition, matric suction, freezing temperature, and the availability and mobility of unfrozen water [15,34,38,40]. These studies have substantially advanced the understanding of internal pore restructuring and microscopic damage under FT action. Nevertheless, most of these techniques characterize the internal structure at selected stages, commonly after complete thawing, and provide limited direct information on the transient development of visible cracks during freezing. Compared with the extensive investigation of internal pores and microcracks, the development of macroscopic surface cracks during freezing has received considerably less attention. Visible crack networks in expansive soils have been studied more commonly under evaporation, desiccation, and wetting–drying conditions, where water loss, shrinkage deformation, and tensile stress are regarded as the principal driving processes [11,28,41]. By contrast, FT studies have generally emphasized changes in macroscopic engineering properties or internal microstructure. Although pore-water freezing, moisture migration, ice growth, and frost-heave pressure provide the physical conditions required for crack initiation and propagation, direct quantitative characterization of surface crack development during freezing remains limited. Moreover, in many FT studies, the specimen surface is examined only after complete thawing [14,15,17]. Previous studies have separately investigated freeze–thaw-induced surface crack evolution [14,40] and CT-based internal pore restructuring [29,30]. However, in many FT studies, the specimen surface is examined only after complete thawing, which mainly reflects the residual morphology retained at the end of a cycle and may not represent the maximum crack opening developed during freezing. Direct comparisons of crack morphology between the freezing and post-thaw stages within the same cycle remain limited. In addition, internal pore restructuring may persist after thawing even when a continuous surface crack network is not visible, and the relationship between these stage-dependent surface responses and the retained internal structural changes remains insufficiently characterized.
On this basis, the present study investigates the structural response of expansive soil subjected to repeated FT cycles using surface imaging and X-ray CT. Surface morphology was recorded for specimens with two selected initial water contents during freezing and after complete thawing, and the stage- and cycle-dependent evolution of visible cracks was quantitatively characterized. Separately, X-ray CT was used to examine the internal pore structure retained after selected numbers of complete FT cycles. The study aims to clarify the stage-dependent evolution of surface cracks, quantify the cycle-dependent variation in internal pore structure, and provide a more comprehensive understanding of FT-induced structural evolution in expansive soil.

2. Materials and Methods

2.1. Materials and Specimen Preparation

The soil used in this study was collected from a natural expansive soil site in Anhui Province, China. To obtain a test material with a controlled and relatively high swelling potential, the natural expansive soil was mixed with bentonite at a content of 40% by dry mass [10,32]. The prepared soil exhibited high plasticity and pronounced water sensitivity. Its basic physical properties are summarized in Table 1.
The bulk soil was air-dried, gently disaggregated, and sieved through a 2 mm mesh. Distilled water was incorporated to prepare batches with initial water contents of 18% and 25%. The 18% water content corresponded to the optimum water content of the prepared soil, whereas 25% was selected as a wetter condition to examine the influence of increased initial water availability on the observable surface response during freezing and thawing. The mixtures were then sealed for 24 h to equalize the moisture distribution. Each batch was compacted in layers to a dry density of 1.53 g/cm3, corresponding to a degree of compaction of approximately 91.6%. At this dry density, the calculated initial degrees of saturation were approximately 63% and 87% for the 18% and 25% water-content conditions, respectively. One cylindrical specimen measuring 200 mm in diameter and 100 mm in height was prepared for surface observation at each initial water content, while one additional specimen measuring 39.1 mm in diameter and 80 mm in height with an initial water content of 18% was prepared for repeated CT scanning throughout the FT cycles. All specimens were wrapped immediately after compaction and conditioned for an additional 24 h before FT cycling.

2.2. Cyclic Freeze–Thaw Tests

FT cycling was performed in a KY-225LB temperature and humidity chamber using a directional thermal-boundary configuration intended to promote predominantly axial heat transfer. Each specimen was inserted into a 90 mm-deep opening within a 110 mm-thick sponge insulation block, with a spacing of 20 mm between adjacent openings. The sidewall and base of each specimen were additionally wrapped with 2 mm-thick cotton insulation and aluminum foil. A plastic cover was positioned several millimeters above the exposed soil surface to limit external moisture exchange while leaving a small enclosed air gap above the specimen. One FT cycle comprised 12 h at −20 °C followed by 12 h at +20 °C. Specimens were evaluated after 0, 1, 4, 7, and 10 cycles. The experimental workflow and directional thermal-boundary configuration are shown in Figure 1.

2.3. Surface Image Acquisition and Crack Analysis

Images were collected at two stages of the N F T = 1 , 4 ,   7 , a n d   10 : after 4 h of freezing, used as a fixed intermediate observation point, and after completion of the subsequent thawing stage. The upper surface was recorded using a USB industrial camera. Camera height, illumination, acquisition geometry, and field of view were maintained throughout the experiment. Following camera calibration, image dimensions were converted to physical lengths using a 20 mm reference feature.
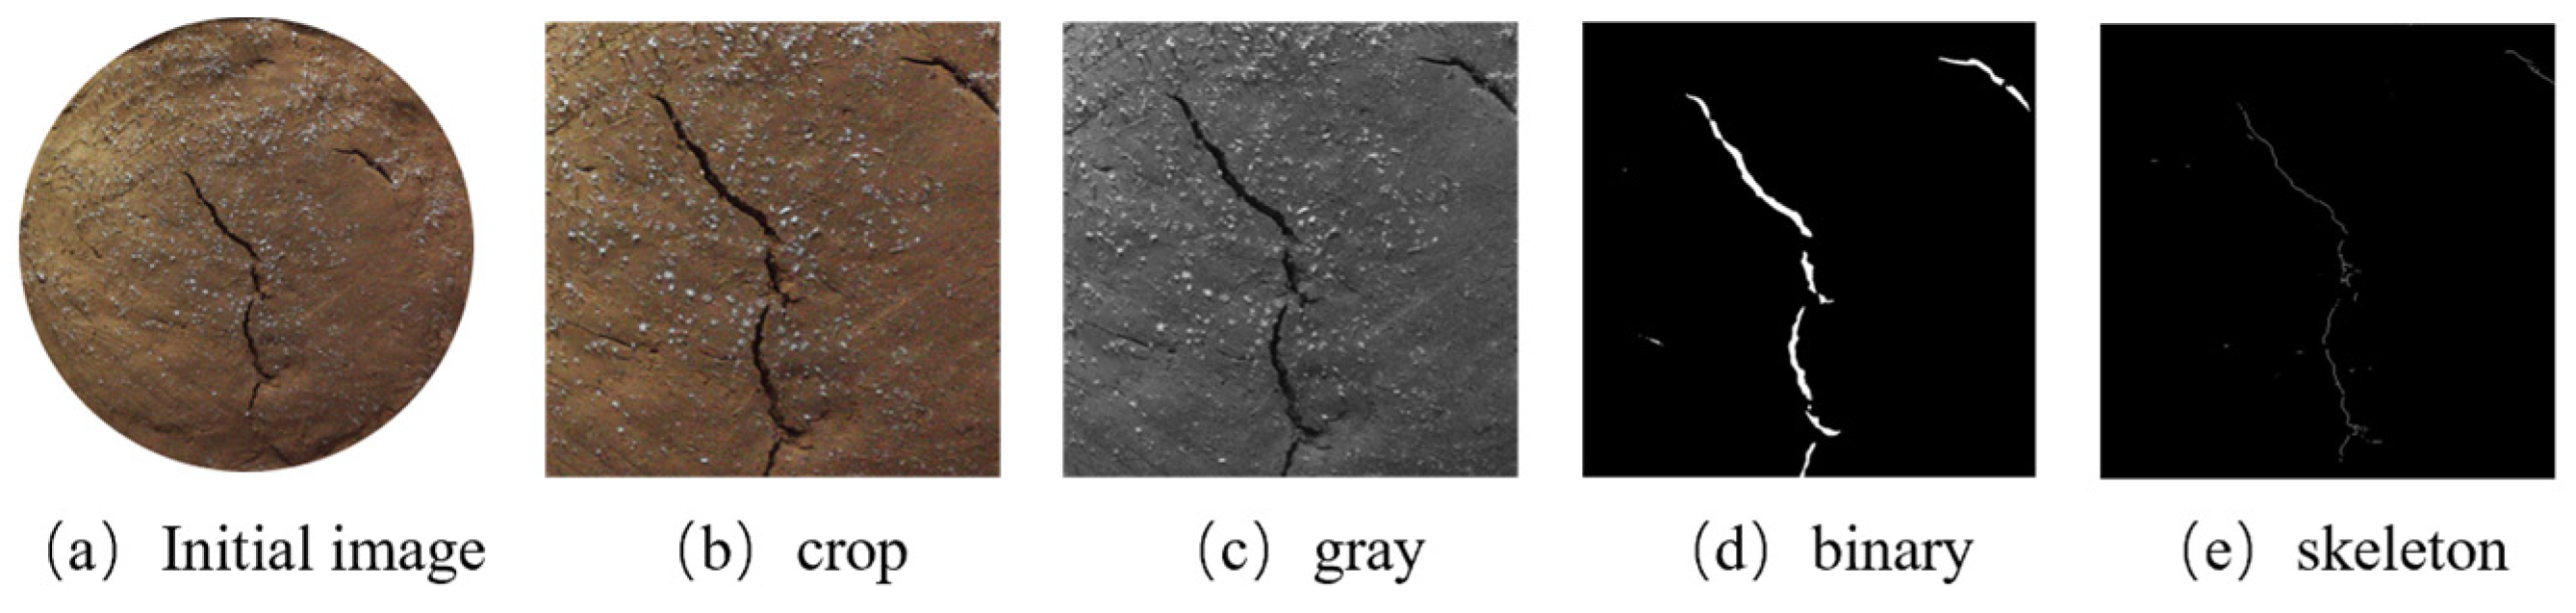
As shown in Figure 2, each photograph was converted to grayscale and classified in ImageJ using the Trainable Weka Segmentation plugin. Representative crack and background pixels were manually labeled to train the classifier, and the resulting probability map was exported as a binary image with white cracks and a black background. The binary images were subsequently processed using custom Python scripts. Small isolated objects were removed, and enclosed black regions within the crack phase were filled without applying dilation or morphological closing. The refined network was then skeletonized. Crack ratio was defined as the fraction of crack pixels within the circular region of interest. Total crack length was measured from the spatially calibrated skeleton, whereas average crack width was derived from distance-transform values sampled along the skeleton.
The relative reduction from the freezing stage to the post-thaw stage was calculated as:
R = X f X t X f × 100 %
where X f and X t denote the corresponding parameter values at the freezing and post-thaw stages, respectively.

2.4. CT Scanning and Pore Structure Characterization

One specimen with an initial water content of 18% was repeatedly examined in the fully thawed condition before cycling and after 1, 4, 7, and 10 FT cycles. CT data were acquired using a Geoscan200 system operated at 160 kV and 120 μA. The reconstructed voxel size was 56 μm.
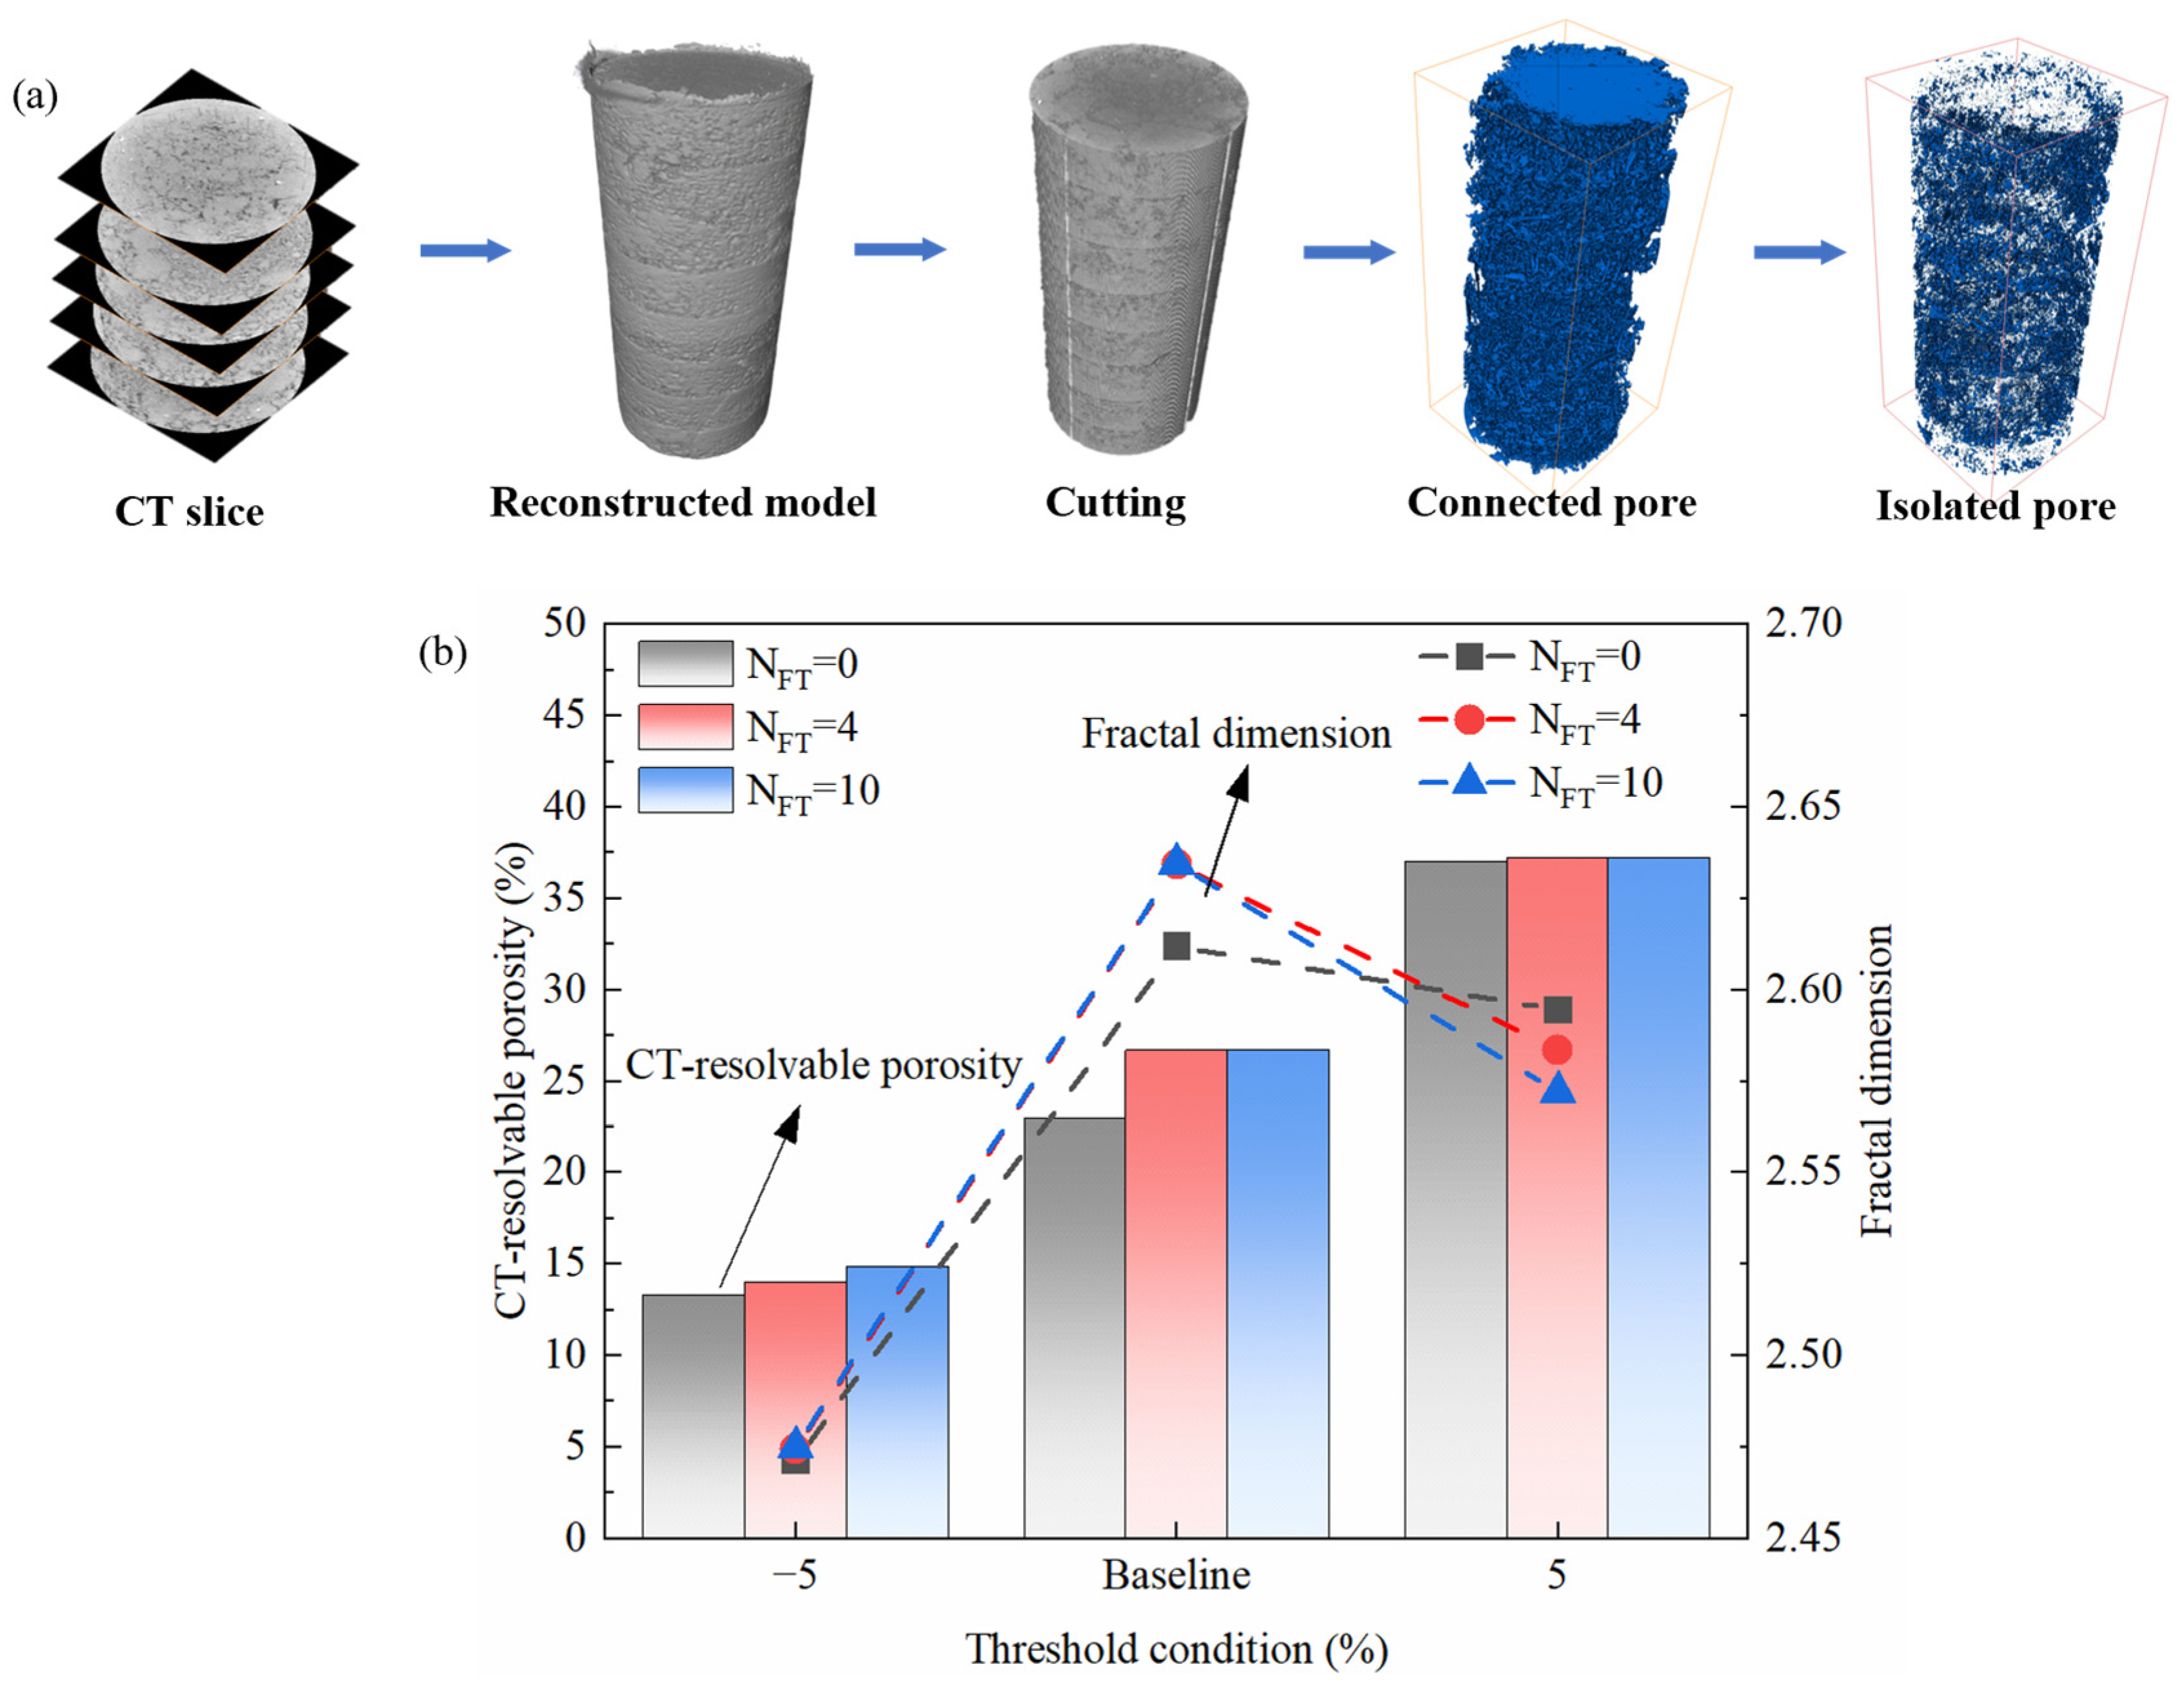
As shown in Figure 3a, the reconstructed volumes were analyzed using Avizo 2021. Before quantitative analysis, the five CT volumes were co-registered to maintain spatial consistency across different FT stages. To reduce boundary effects, a central volume of interest containing approximately 90% of the specimen was retained. Following denoising, the pore and solid phases were separated using grayscale threshold segmentation and reconstructed in three dimensions. A baseline upper threshold was selected through visual comparison between the original grayscale CT slices and the corresponding segmented pore boundaries and was consistently applied to all CT datasets. To evaluate the influence of threshold selection, a threshold-sensitivity analysis was performed by varying the selected upper threshold by ±5%, while all other image-processing parameters were kept unchanged. The sensitivity results for representative datasets at N F T = 0 , 4, and 10 are presented in Figure 3b. The segmented pore-volume fraction was defined as CT-resolvable porosity, while connectivity analysis was used to calculate connected porosity.
Pore size was expressed as the equivalent radius derived from the equivalent diameter of each segmented pore object. Considering the reconstructed voxel size of 56 μm, 56 μm was adopted as the minimum equivalent radius for quantitative pore-size analysis, and the pore-radius distribution was re-binned at 56 μm intervals, beginning with 0.056–0.112 mm. The three-dimensional fractal dimension of the CT-resolvable pore phase was estimated using the box-counting method.

3. Results

3.1. Surface Morphology Under Freeze–Thaw Cycles

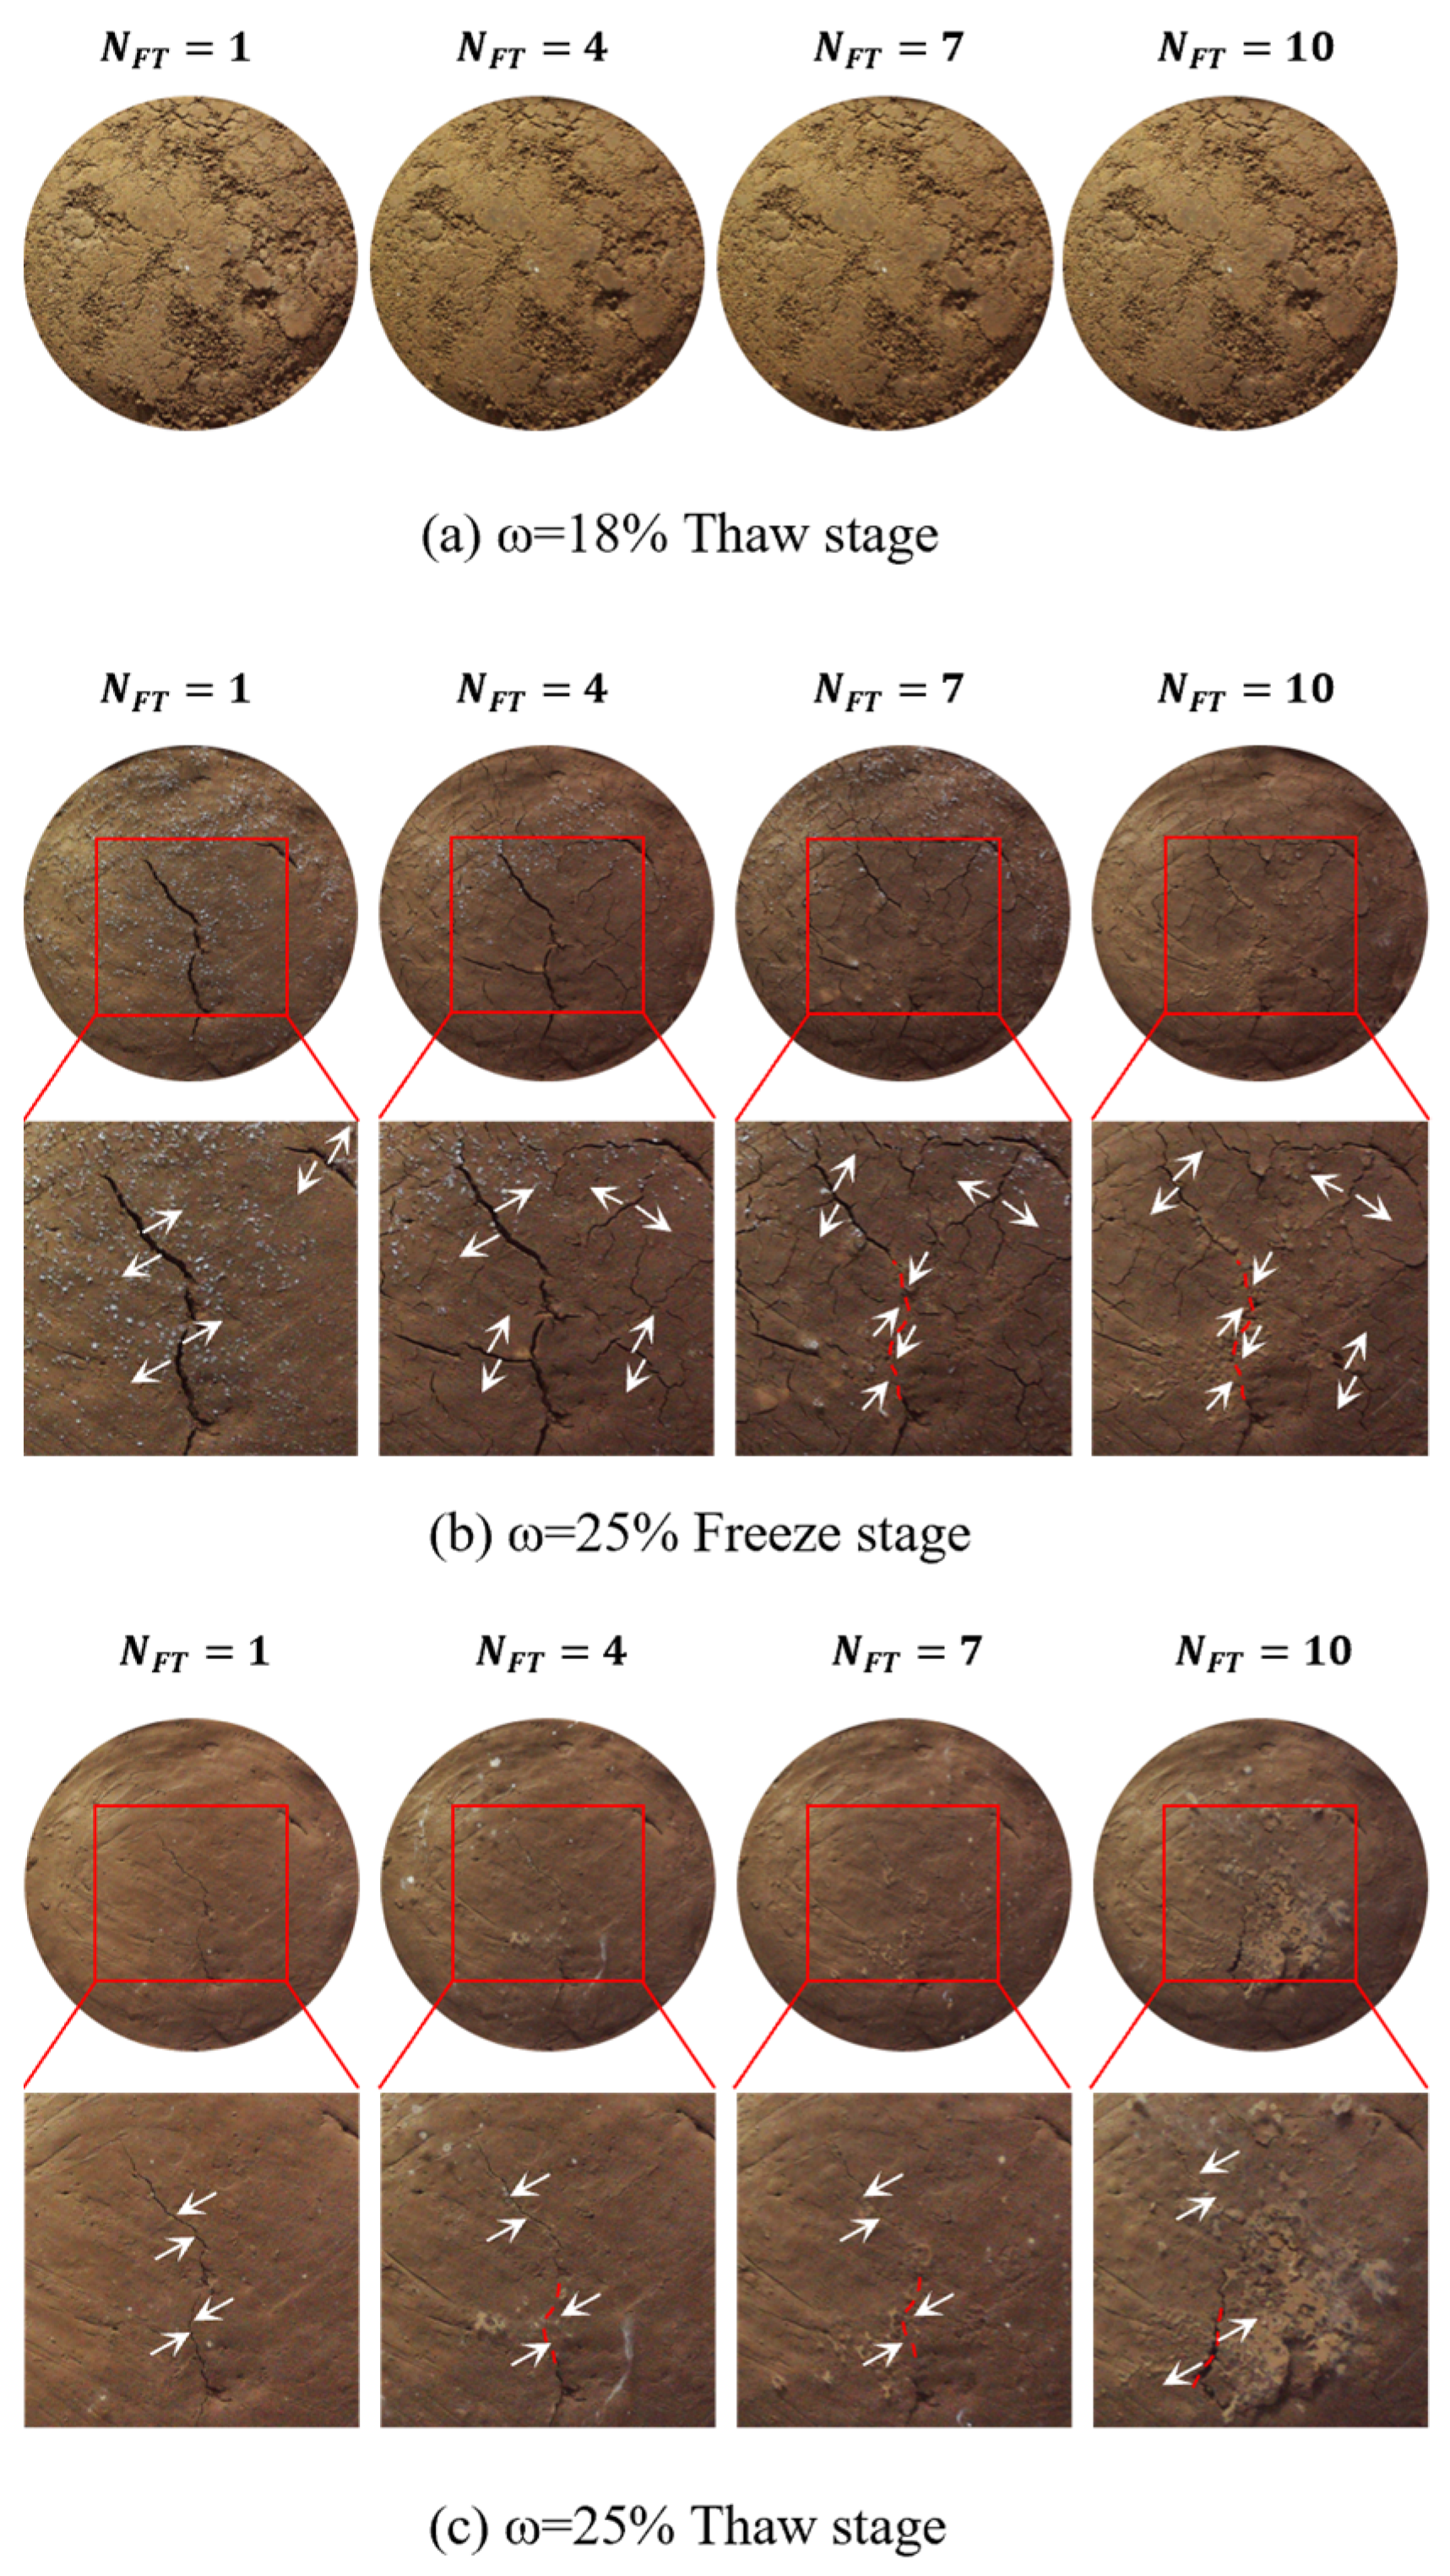
Figure 4 contrasts the post-thaw surfaces of the 18% specimens with the freezing-stage and post-thaw surfaces of the 25% specimens after N F T = 1, 4, 7 and 10. At 18% initial water content, neither a distinct morphological transition nor a continuous crack network was identified at the selected stages. For clarity, Figure 4a therefore presents only the post-thaw images, which show that the initially rough surface morphology persisted throughout cycling.
In contrast, visible surface cracks developed in the 25% specimens after 4 h of freezing. After N F T = 1 , the crack pattern was dominated by a relatively wide primary crack accompanied by only a few short branches. After N F T = 4 , additional secondary branches appeared around the primary crack. The crack network became most widely distributed after   N F T = 7 , with an increased number of branches extending over the specimen surface. After N F T = 10 , visible cracks remained widely distributed, although several branches became shorter, more fragmented, and locally discontinuous.
The surface morphology changed markedly after complete thawing. Most crack openings observed during freezing became narrower or were no longer continuously identifiable. After N F T = 1 and N F T = 4 , several short residual crack traces remained along the freezing-stage crack paths. These traces became sparse and discontinuous after N F T = 7 . After   N F T = 10 , the number of visible residual traces increased slightly compared with that after N F T = 7 , but their continuity remained substantially lower than that observed during freezing. Overall, the freezing-stage morphology of the 25% specimens evolved from a pattern dominated by a relatively wide primary crack to a more distributed network consisting of numerous narrower branches, whereas the post-thaw surfaces were characterized primarily by discontinuous residual crack traces.

3.2. Quantitative Evolution of Surface Cracks in the 25% Specimens

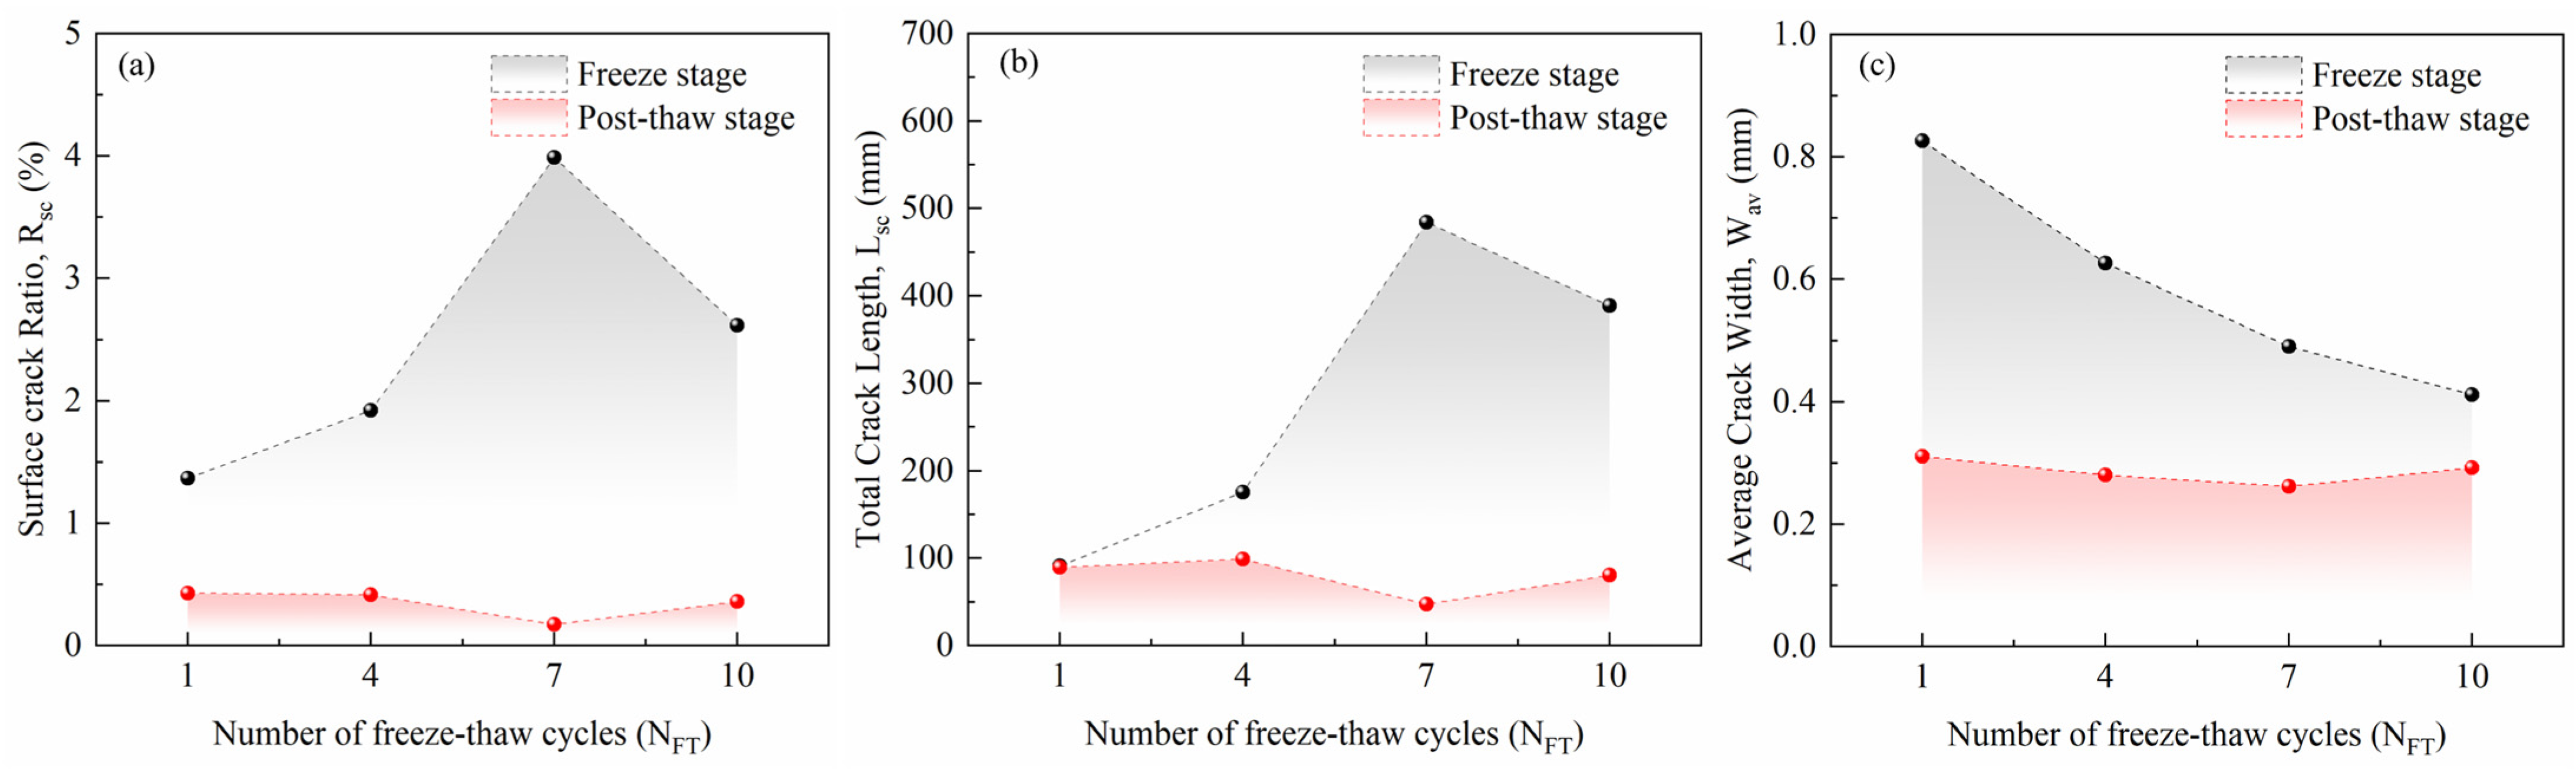
Figure 5 summarizes the stage-specific crack metrics obtained for the 25% specimens. During freezing, the surface crack ratio and total crack length increased from N F T = 1 to N F T = 7 , reached their maximum values after N F T = 7 , and subsequently decreased after N F T = 10 . In contrast, the average crack width decreased continuously with increasing cycle number.
All post-thaw crack parameters were lower than their corresponding freezing-stage values. The post-thaw surface crack ratio remained relatively low from N F T = 1 to N F T = 4 decreased to its minimum after N F T = 7 , and increased again after N F T = 10 . Total crack length increased slightly between N F T = 1 and N F T = 4 , decreased markedly after N F T = 7 , and then increased again after N F T = 10 . Notably, after N F T = 1 , the freezing-stage and post-thaw total crack lengths were nearly identical, despite the pronounced difference in surface crack ratio and average crack width between the two stages. Average crack width changed only slightly across the post-thaw states, showing a gradual decrease up to N F T = 7 followed by a small increase after N F T = 10 .
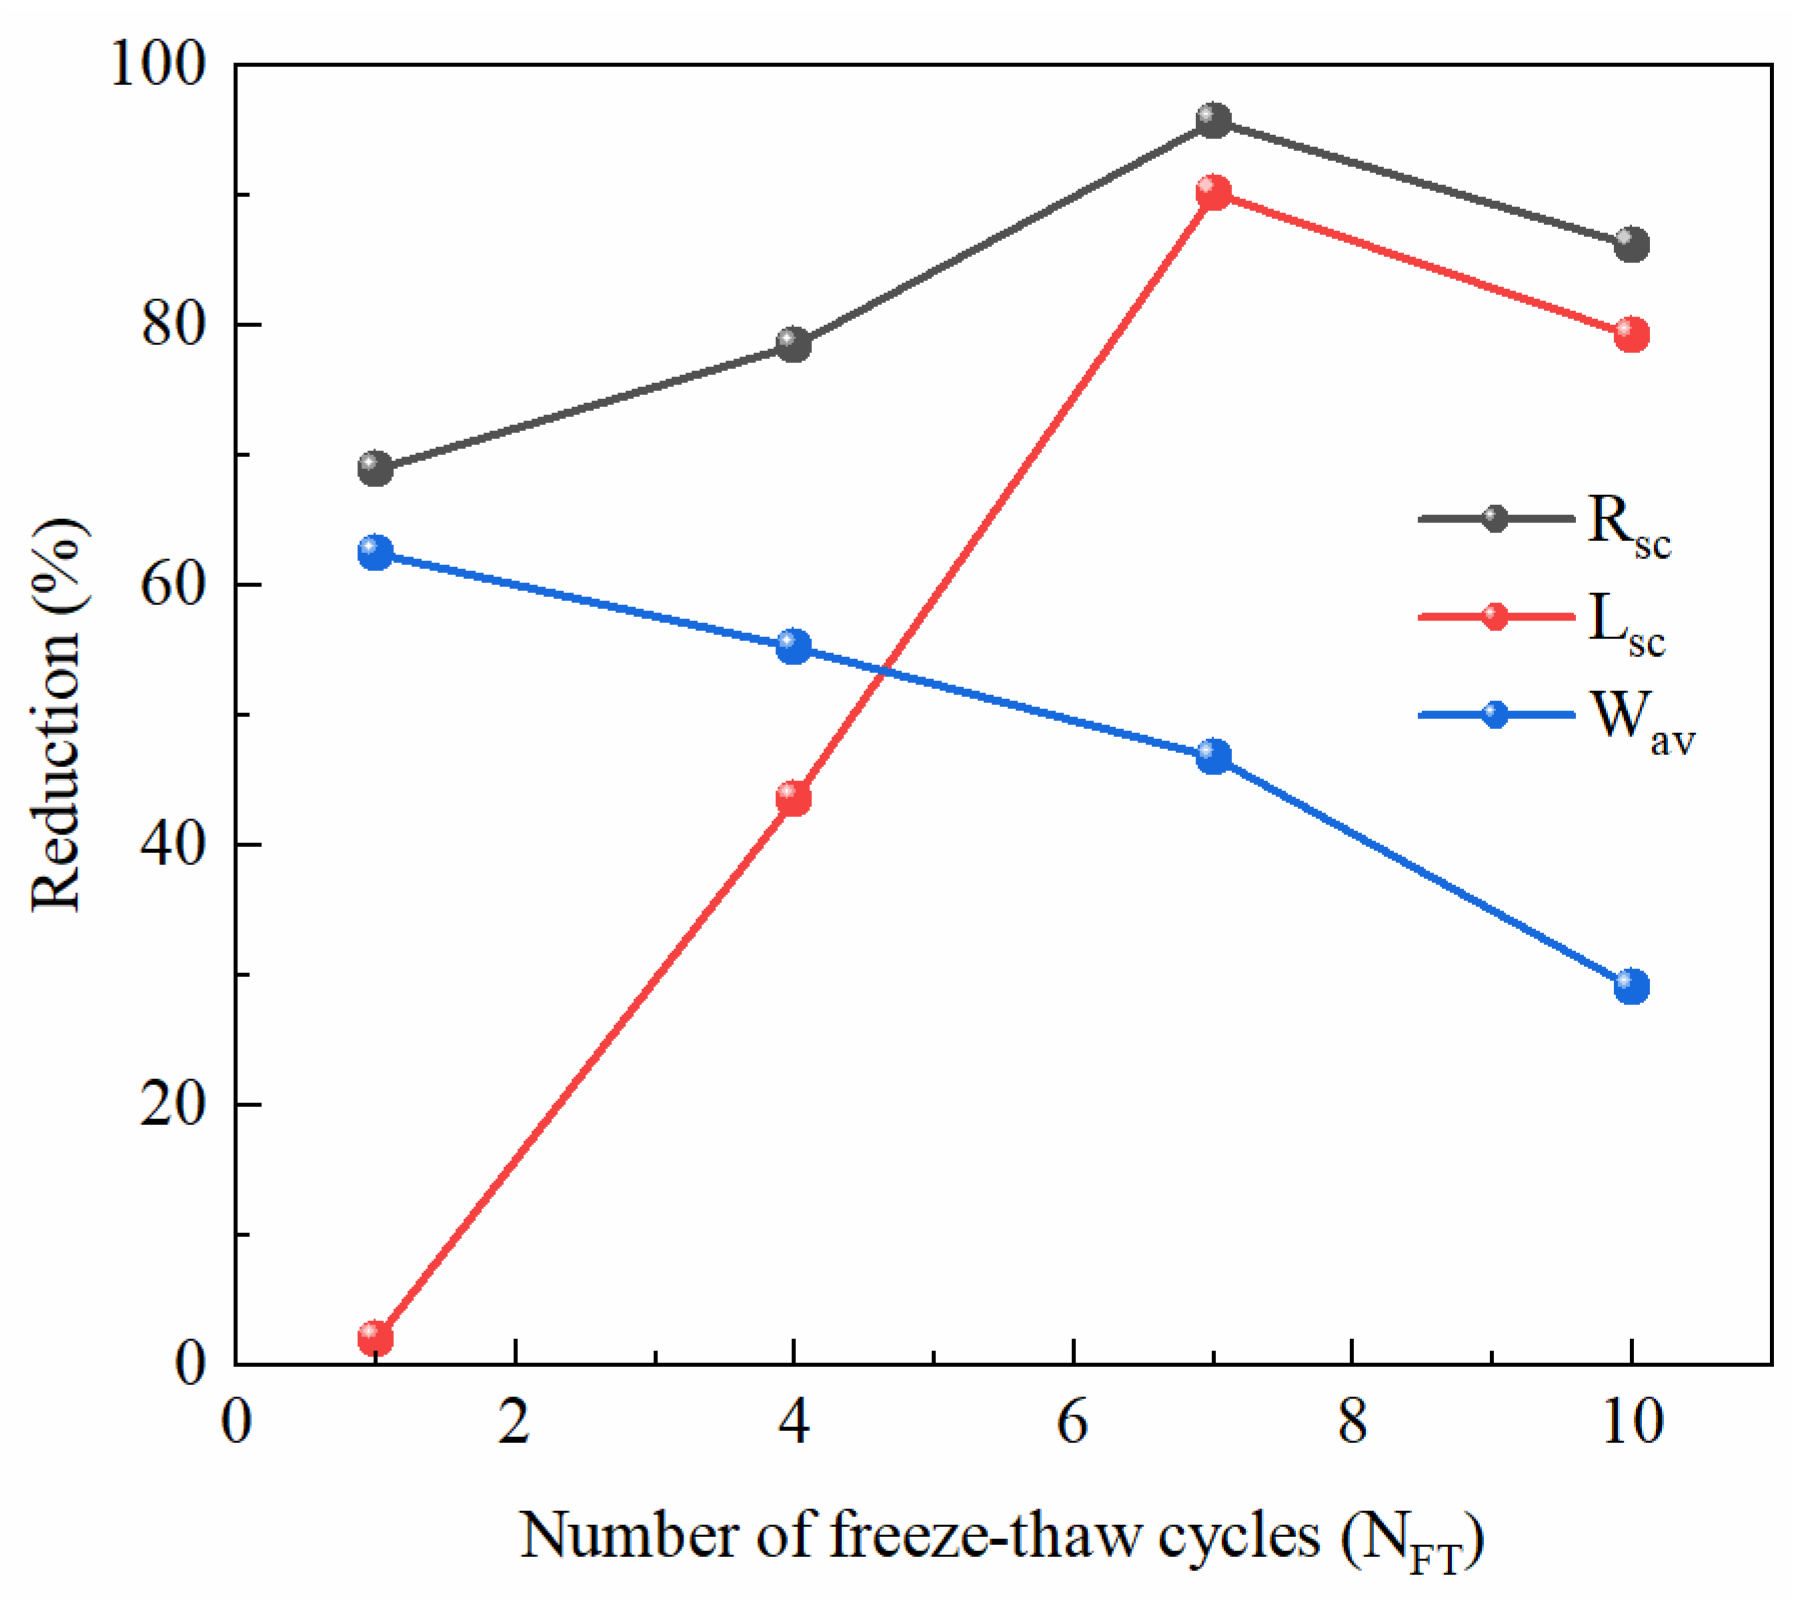
Figure 6 further presents the relative reductions in surface crack ratio, total crack length, and average crack width from the freezing stage to the post-thaw stage. After the N F T = 1 , the detectable crack length was almost fully retained, with a reduction of only 1.99%, whereas crack ratio and average width decreased by 68.88% and 62.40%, respectively. With increasing cycle number, the reduction in total crack length increased sharply, reaching 90.23% after N F T = 7 before decreasing to 79.19% after N F T = 10 . The reduction in surface crack ratio showed a similar trend, increasing to a maximum of 95.69% after N F T = 7 and then decreasing to 86.24% after N F T = 10 . By contrast, the reduction in average crack width decreased progressively from 62.40% after N F T = 1 to 29.03% after N F T = 10 . Thus, the first cycle was characterized by an almost unchanged total crack length accompanied by substantial reductions in crack area and width, whereas the greatest reductions in both surface crack ratio and total crack length occurred after seven cycles.

3.3. Post-Thaw Internal Pore Structure Evolution Based on CT Analysis of the 18% Specimens

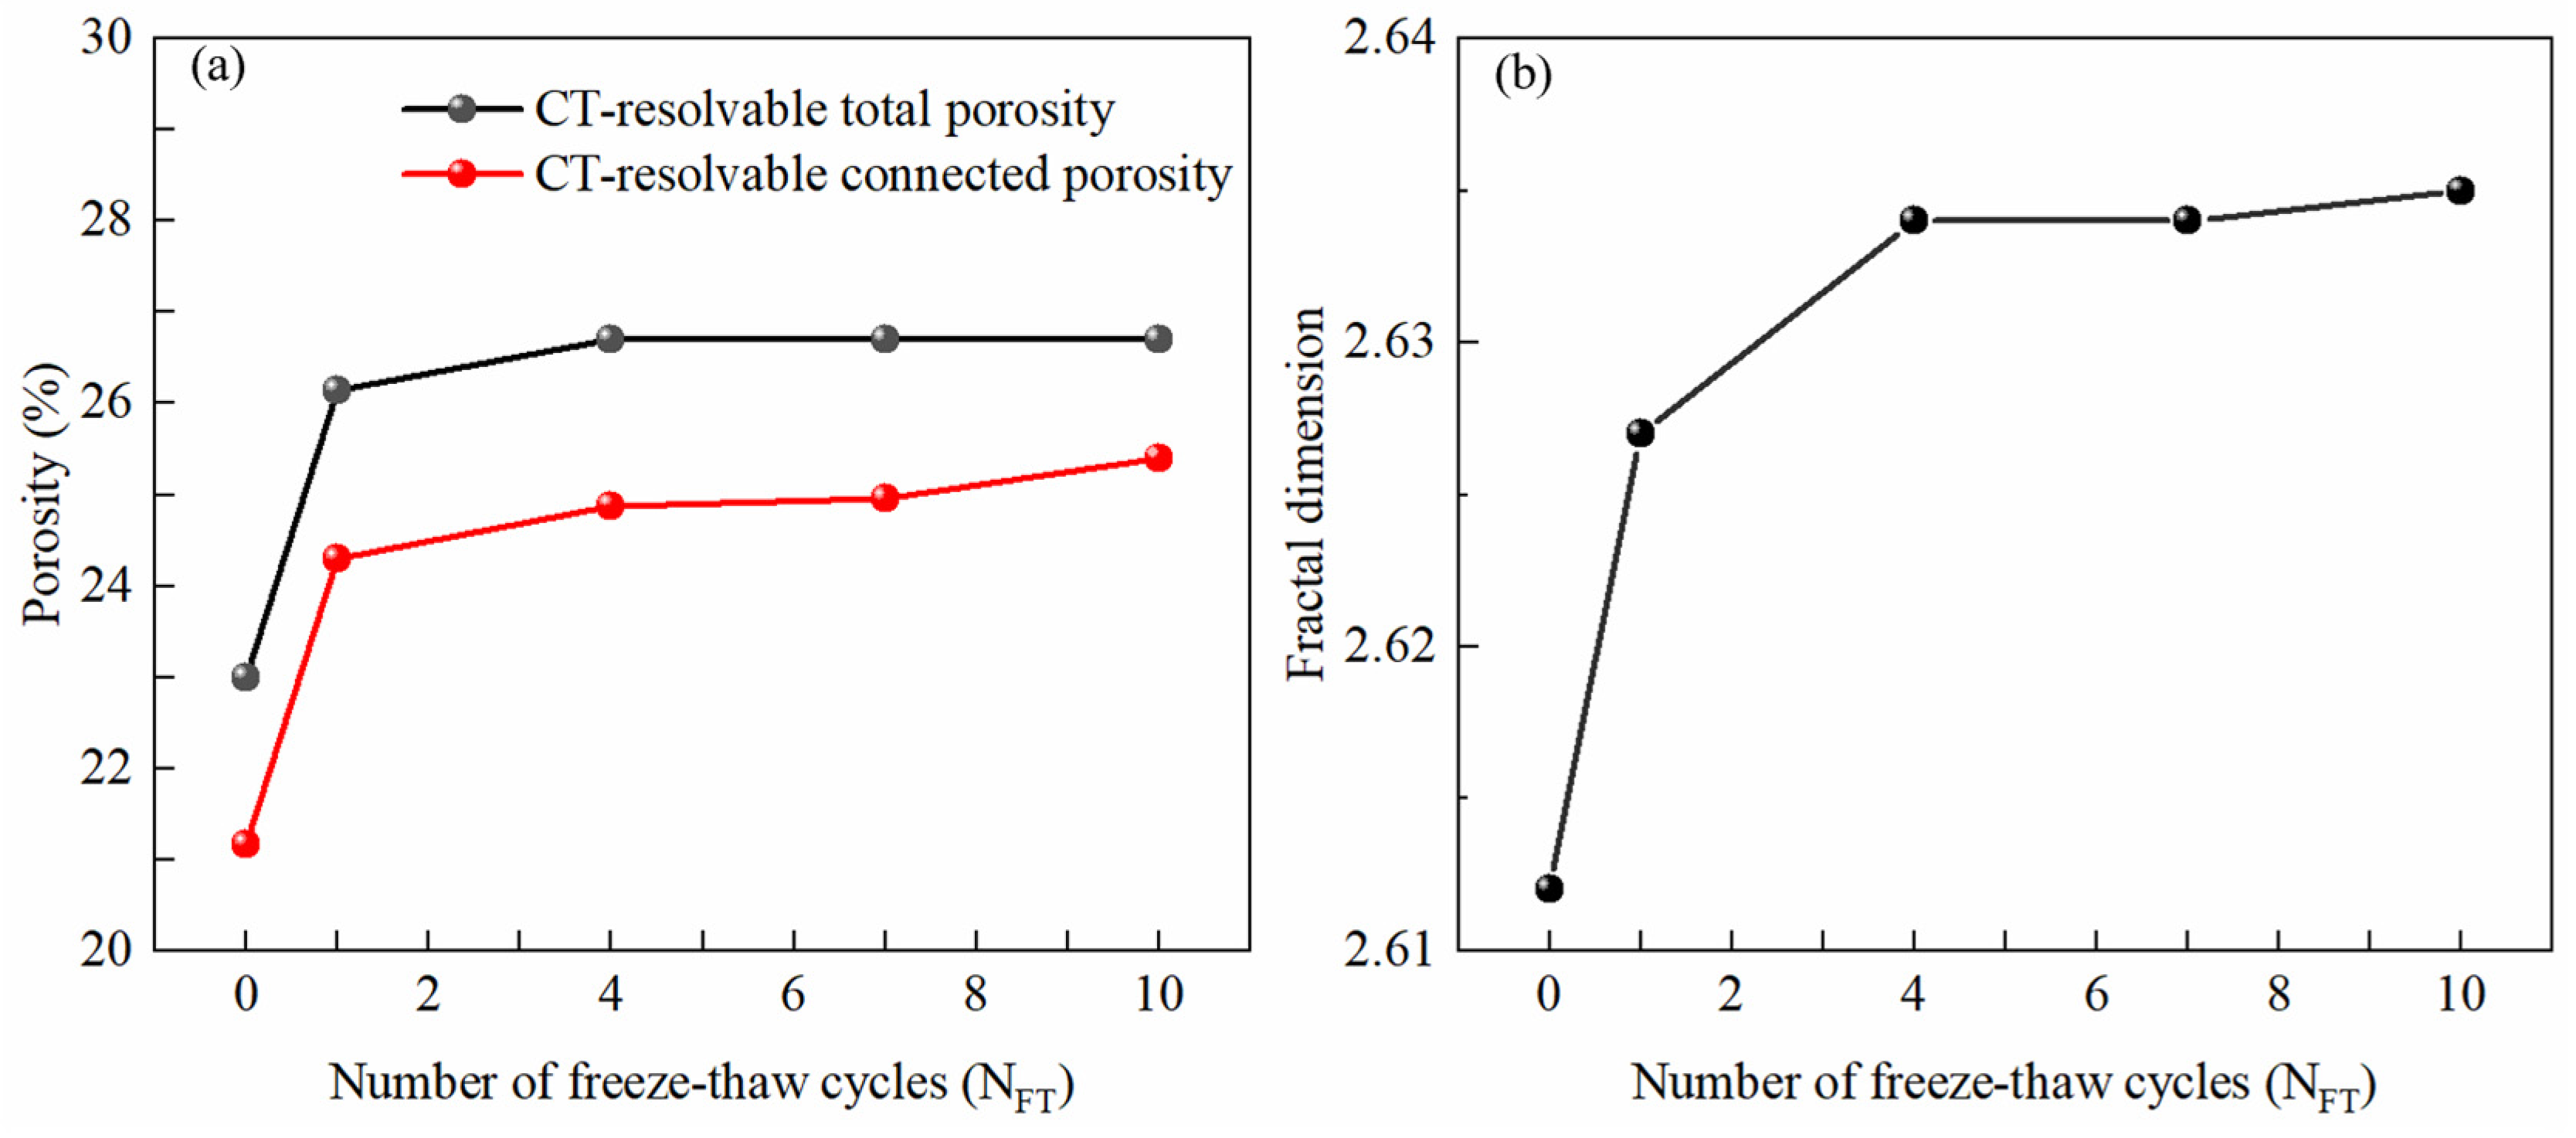
Figure 7 presents the variations in CT-resolvable porosity, connected porosity, and three-dimensional fractal dimension of the 18% specimens after different numbers of FT cycles. As shown in Figure 7a, CT-resolvable porosity increased from approximately 23.0% in the initial state to 26.1% after N F T = 1 and 26.7% after N F T = 4 . Thereafter, only minor changes occurred, and the value remained nearly stable up to N F T = 10 . Connected porosity increased from approximately 21.1% initially to 24.3% after N F T = 1 and 24.9% after N F T = 4 . Unlike CT-resolvable porosity, connected porosity continued to increase slightly during the subsequent cycles, reaching approximately 25.4% after N F T = 10 . Consequently, the difference between CT-resolvable porosity and connected porosity gradually decreased with increasing cycle number. As shown in Figure 7b, the three-dimensional fractal dimension showed a similar early increase followed by a nearly stable trend. It increased from approximately 2.612 in the initial state to 2.627 after N F T = 1 and 2.634 after N F T = 4 . From N F T = 4 to N F T = 10 , only minor variations were observed, with the values remaining close to 2.634. The three-dimensional fractal-dimension results discussed below are based on the adopted baseline segmentation threshold. Thus, the main changes in CT-resolvable porosity and three-dimensional fractal dimension occurred during the first four FT cycles, whereas connected porosity continued to increase slightly during the later cycles.
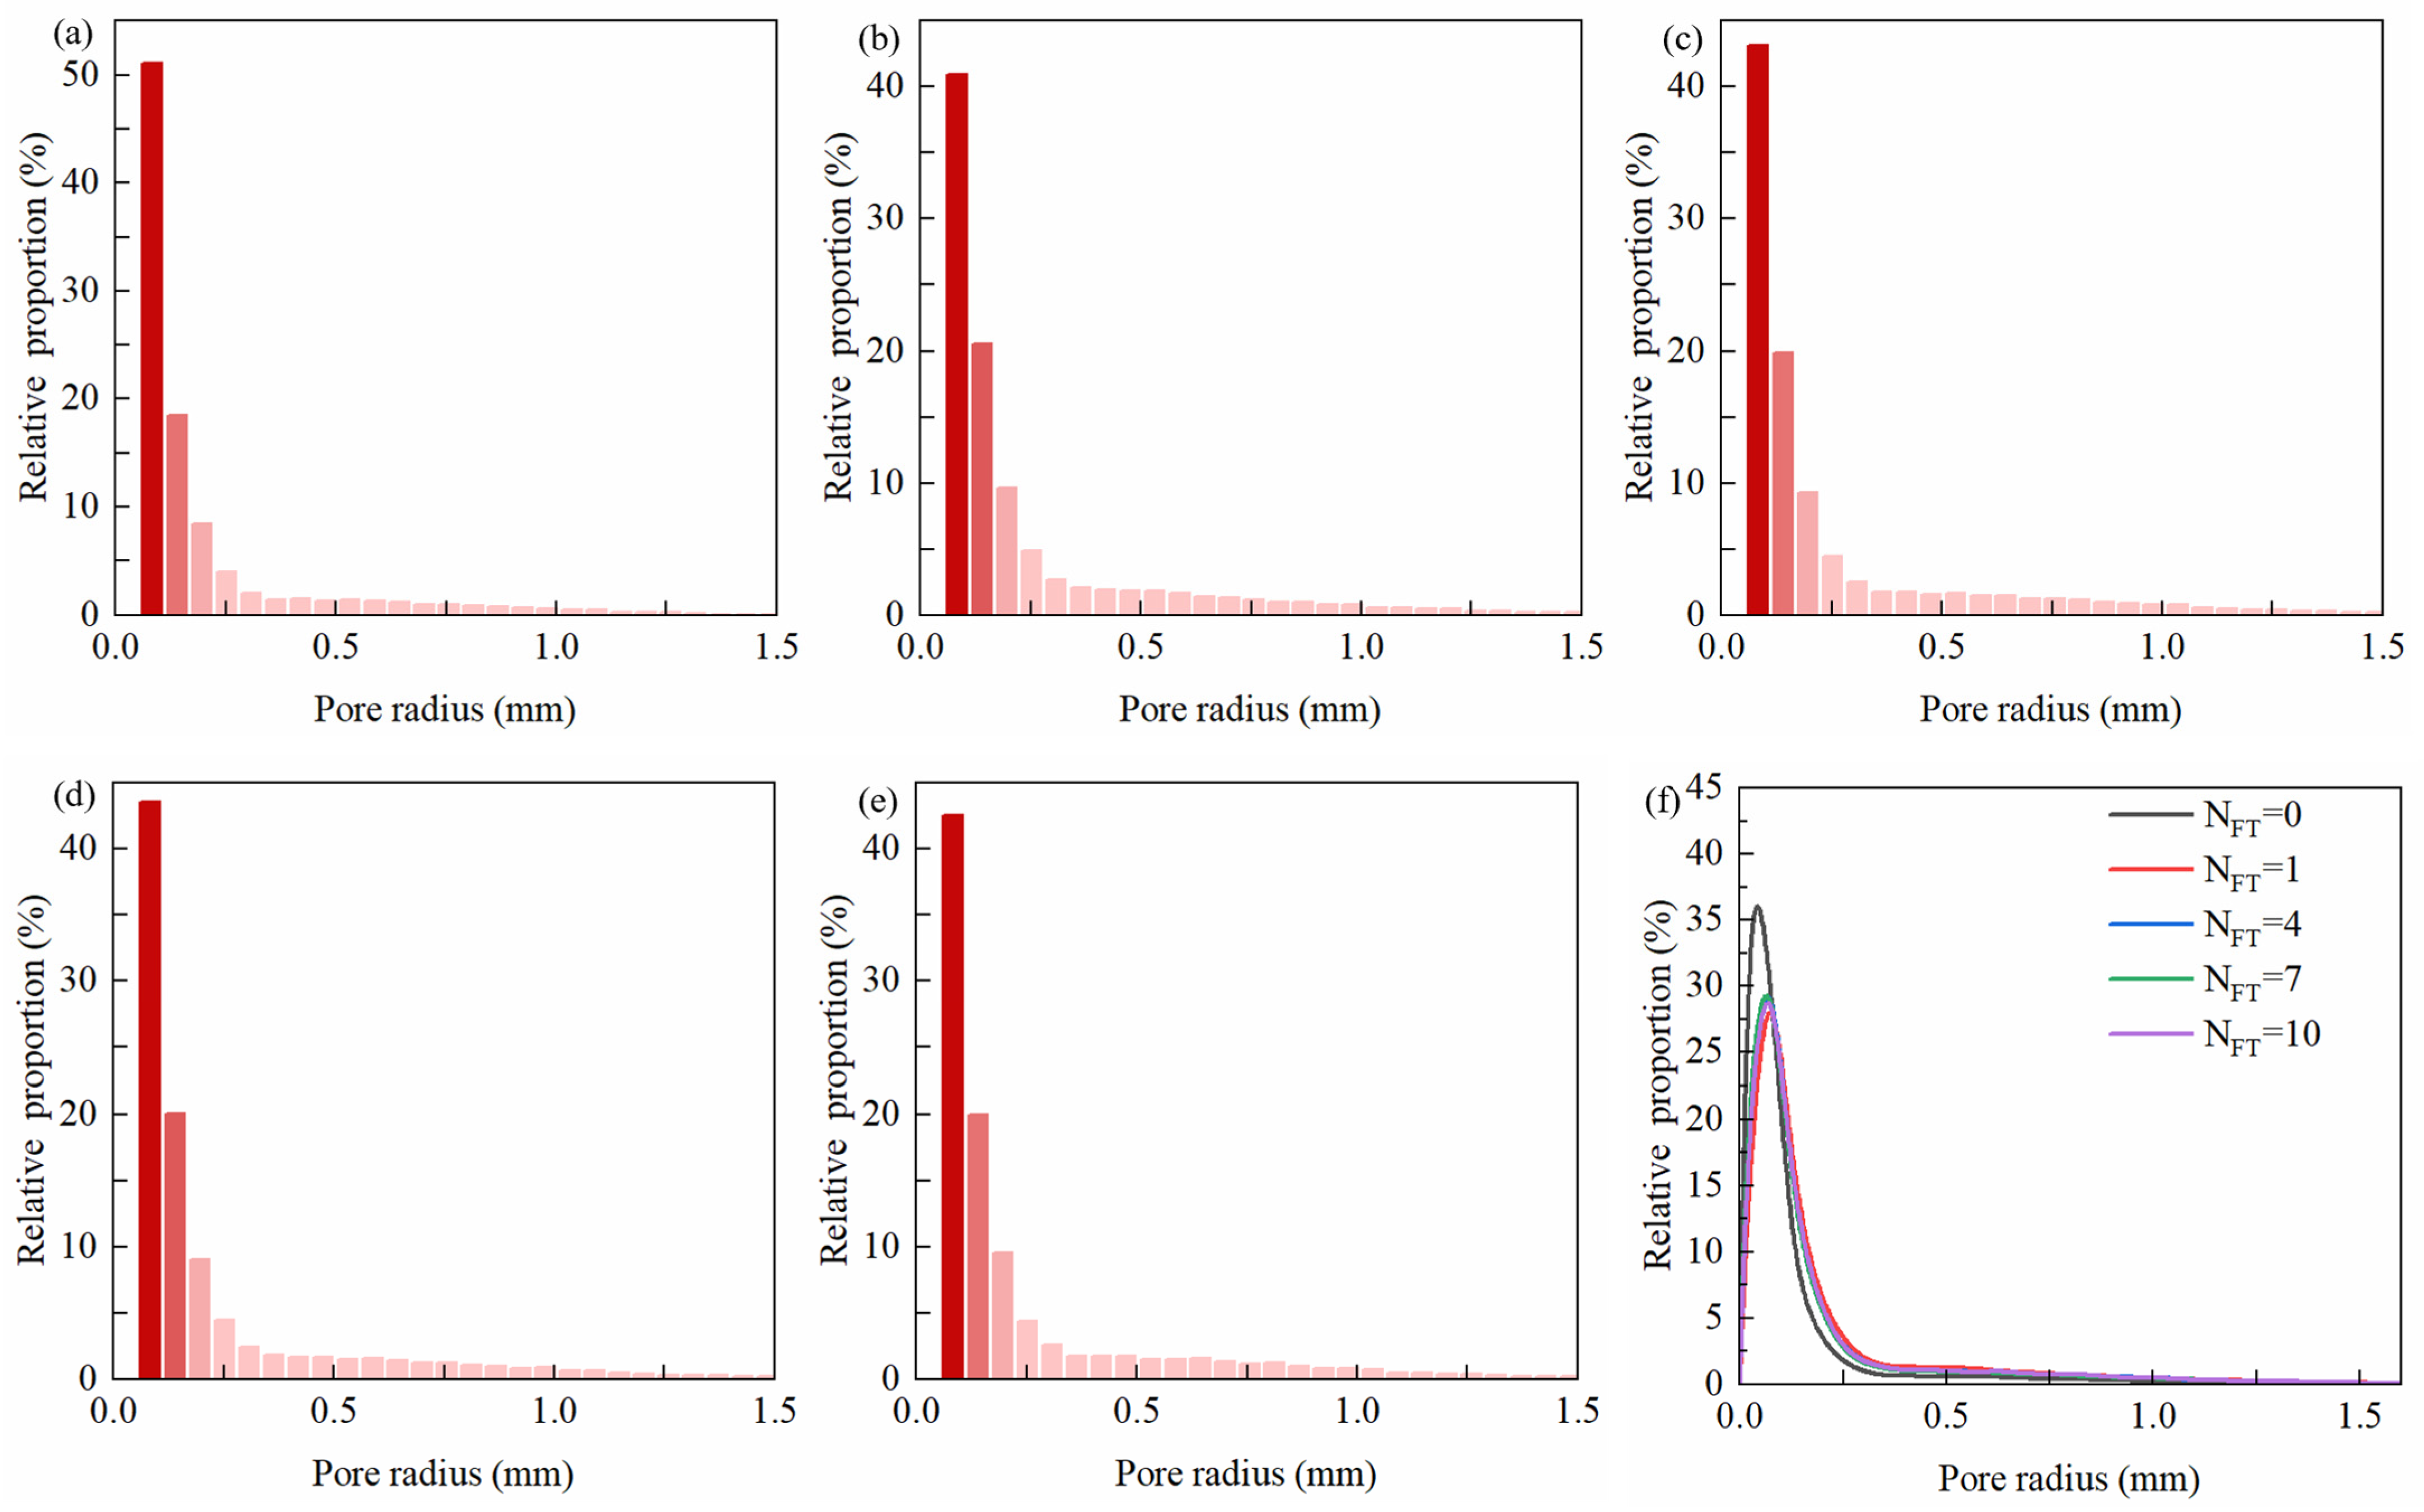
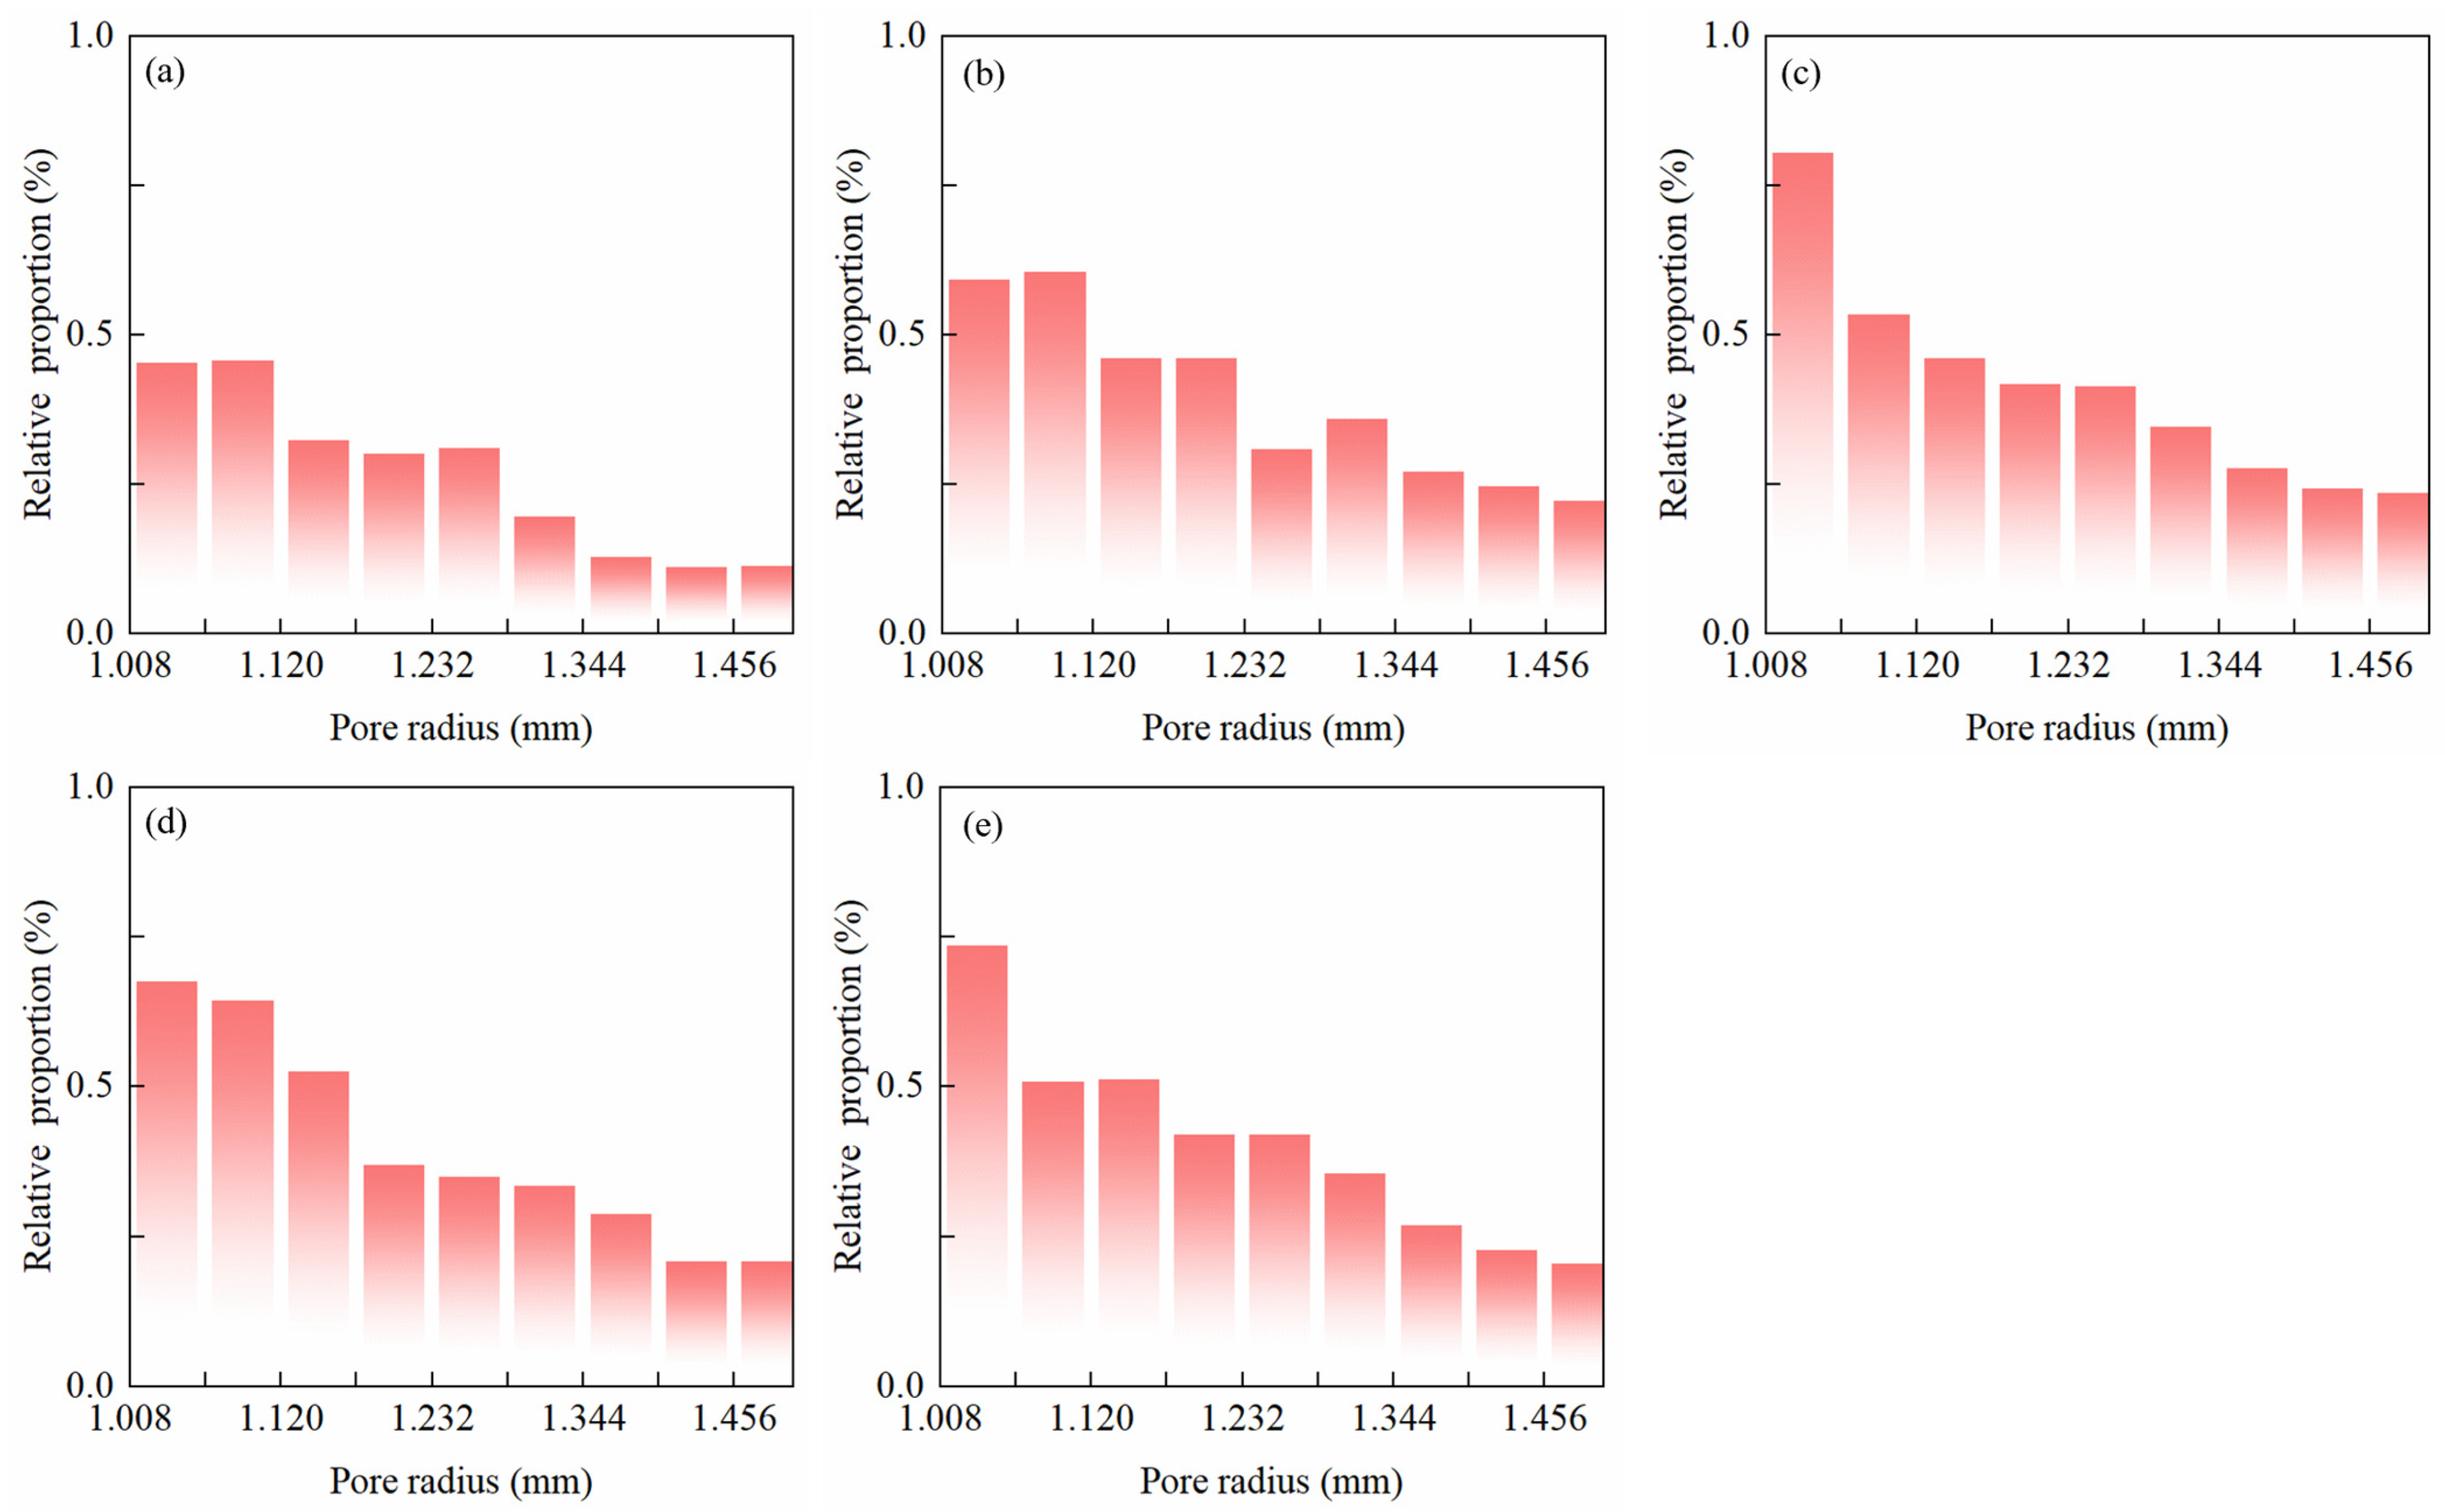
Figure 8 and Figure 9 compare the pore-radius distributions obtained after 0, 1, 4, 7, and 10 FT cycles. In every state, most of the segmented pore volume was associated with small radii, and its relative proportion declined rapidly toward the larger-radius range. Relative to the uncycled specimen, the relative proportion of the smallest quantitatively resolved pore class decreased after FT cycling, whereas the proportions of several larger-radius classes increased. The main redistribution occurred during the early cycles, because the curves corresponding to 4, 7, and 10 cycles were comparatively close. The enlarged 1.0–1.5 mm interval similarly shows higher relative pore-volume proportions after cycling than in the initial condition. These pore-radius distributions are consistent with the observation that CT-resolvable porosity and three-dimensional fractal dimension changed mainly during the first four cycles, whereas connected porosity continued to increase through cycle 10.

4. Discussion

4.1. Contrasting Observable Responses Under the Selected Initial Water-Content Conditions

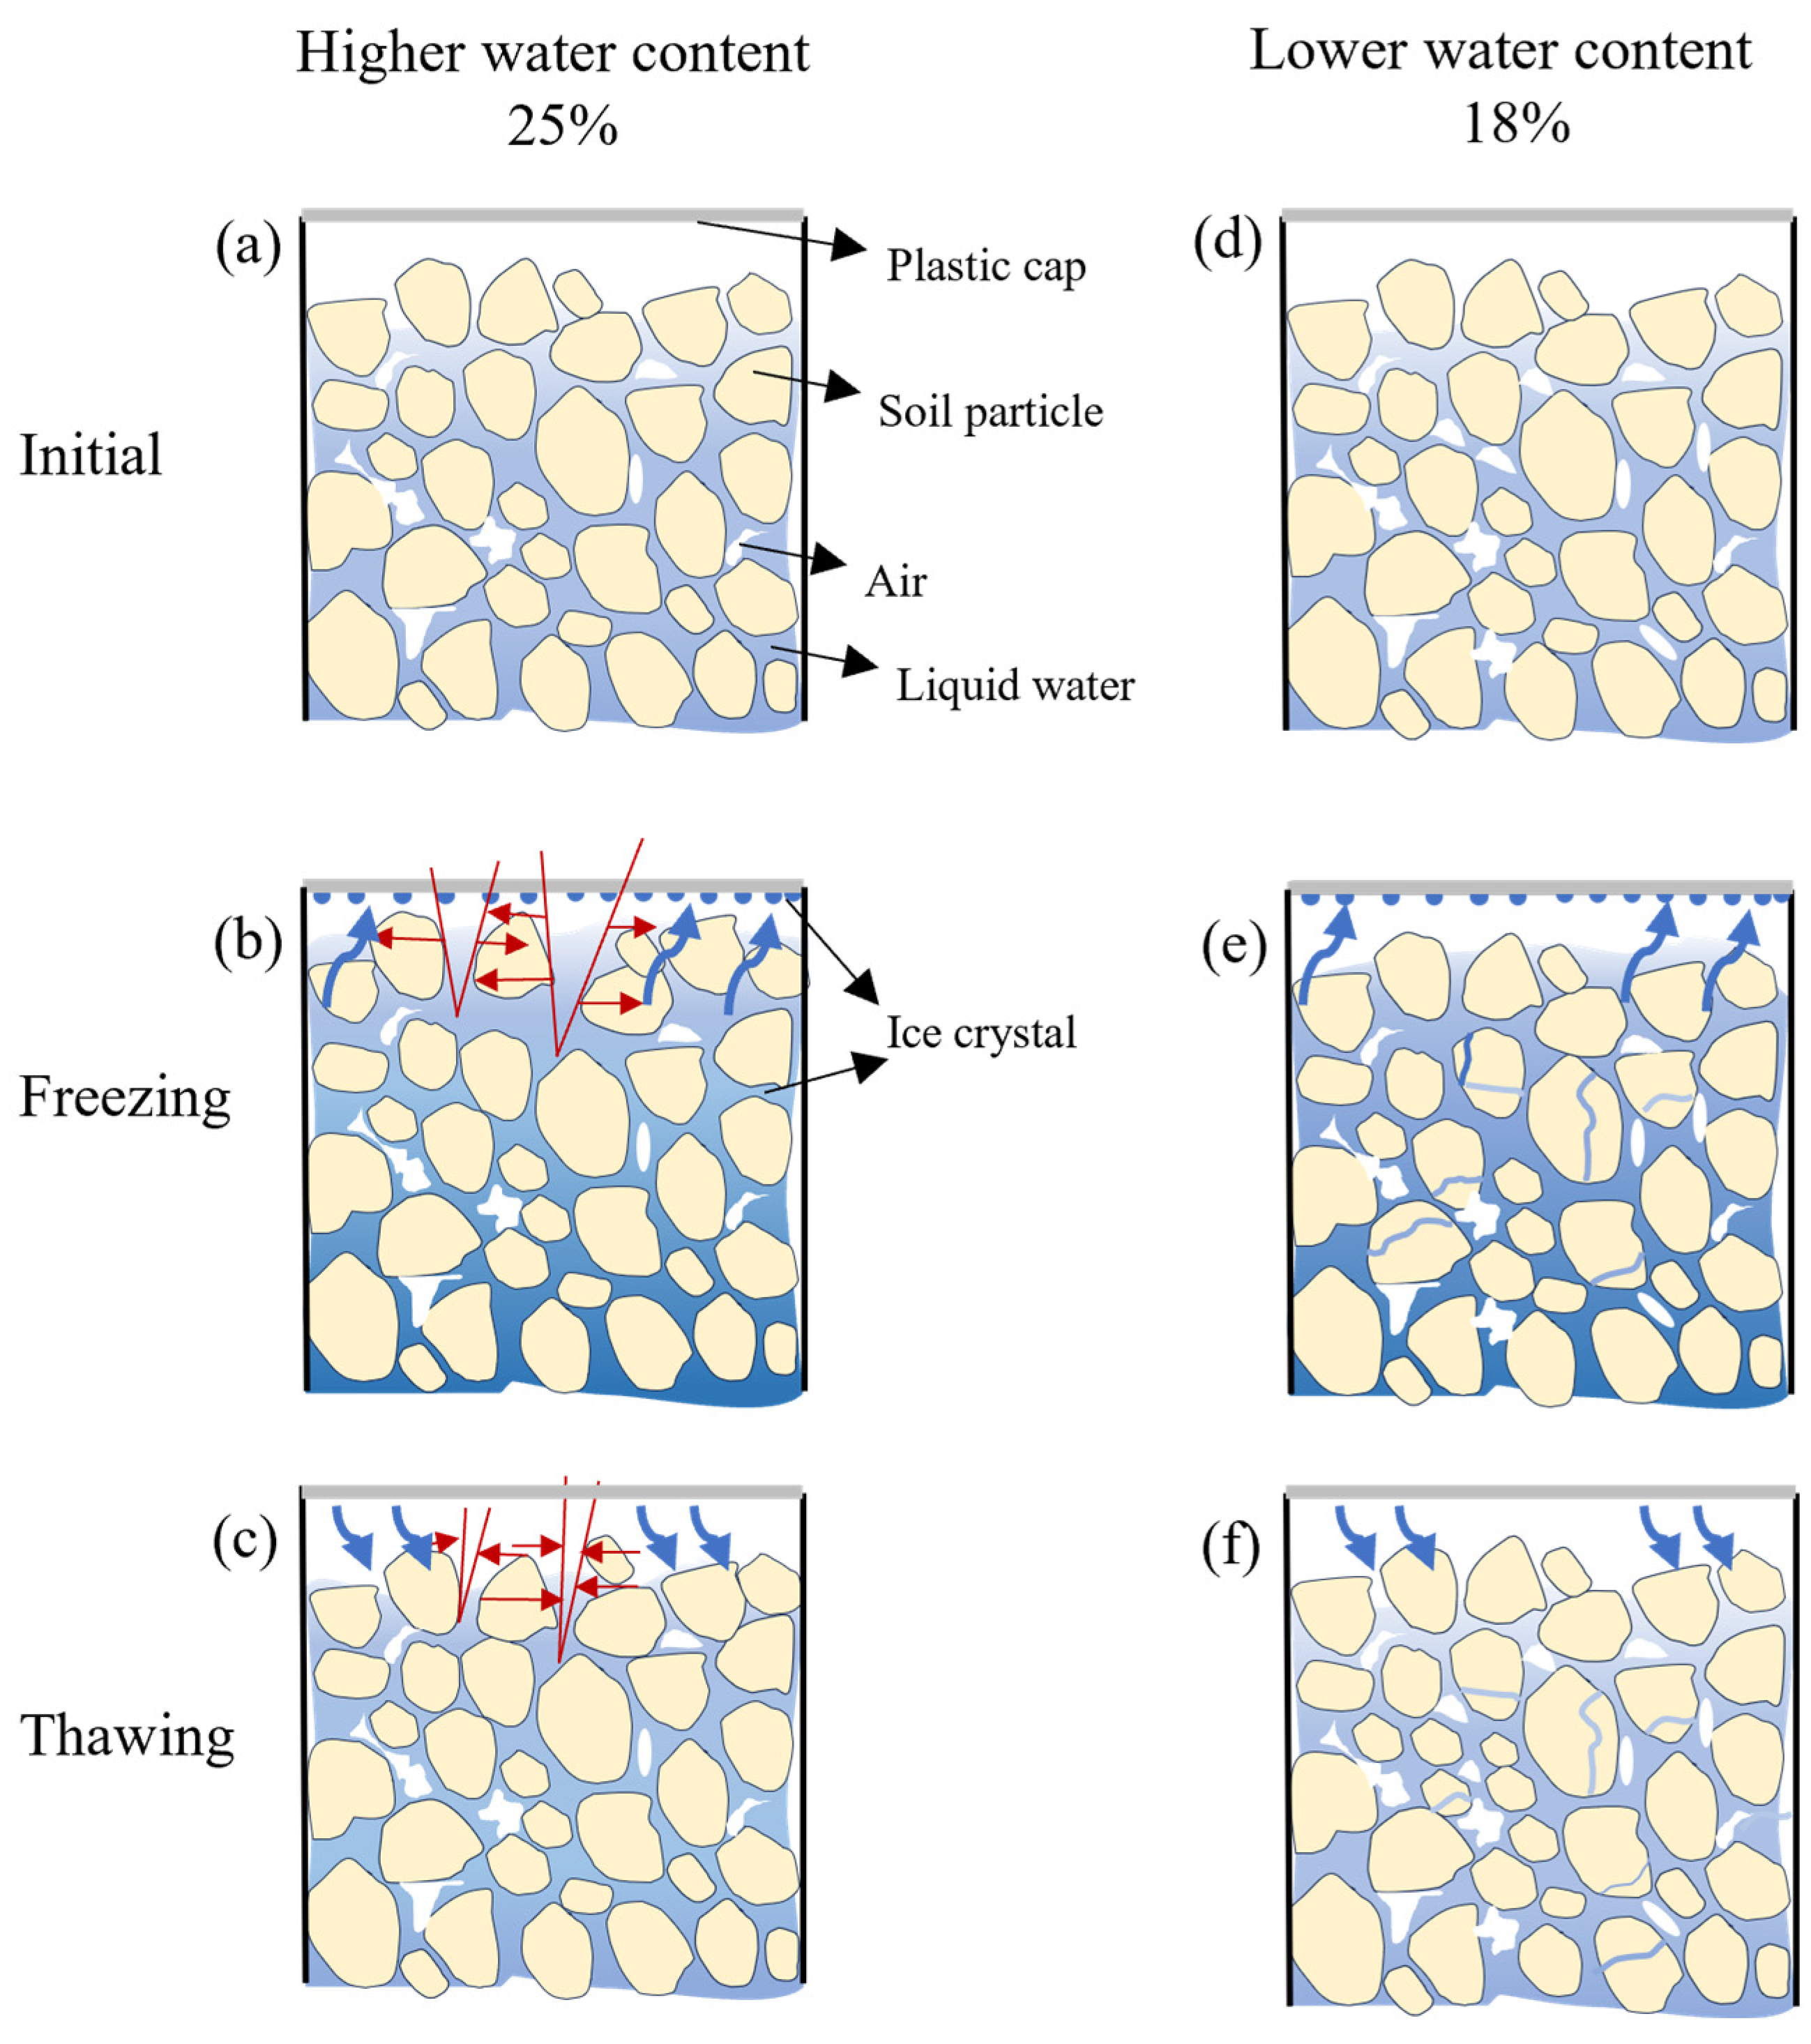
The initial water content determines the amount and spatial distribution of freezable water and therefore influences moisture migration, ice formation, and freezing-induced deformation. As shown in Figure 4, the specimens with initial water contents of 18% and 25% exhibited markedly different surface responses under the same dry density and FT conditions. No identifiable continuous crack network developed on the 18% specimens during either freezing or thawing, whereas distinct cracks appeared on the 25% specimens during freezing and became substantially less visible after thawing. The calculated initial degrees of saturation were approximately 63% and 87% for the 18% and 25% specimens, respectively. Therefore, the contrasting surface responses may reflect not only differences in pore-water availability and initial saturation, but also differences in the initial pore arrangement and compaction-induced soil fabric associated with the two water-content conditions.
As shown in Figure 10a–c, for the specimens with an initial water content of 25%, the greater availability of pore water provided more favorable conditions for water–ice phase transformation and ice-crystal growth. Under the imposed directional thermal boundary, unfrozen water may have migrated toward the colder region and contributed to further ice growth. The associated volumetric expansion may have generated nonuniform frost-heave deformation and localized tensile stresses. When these stresses exceeded the local tensile resistance of the soil, cracks may have initiated and opened preferentially along structurally weak regions, as illustrated in Figure 10b. Because a small air gap remained between the soil surface and the plastic cover, moisture released from the near-surface region through sublimation or vapor transport could migrate into the enclosed headspace and subsequently deposit on the inner surface of the cover during freezing [42]. The decrease in pore-water pressure and the development of frost-induced suction may have promoted water migration toward the freezing region, thereby potentially facilitating continued ice formation and sublimation [14,43,44]. Such moisture transfer may have locally reduced the water content of the near-surface soil and contributed to shrinkage and deformation [45]. Therefore, the clearly opened crack paths observed in the 25% specimens during freezing, as shown in Figure 4b, may be associated with the combined effects of ice-crystal growth, nonuniform frost heave, and internal moisture redistribution.
For the 18% specimens, a smaller amount of water was available for phase transformation and migration, as represented in Figure 10d–f. Previous studies have shown that, in an initially unsaturated soil, part of the volume expansion associated with freezing can be accommodated by the existing air-filled pore space, thereby reducing the macroscopic deformation of the soil skeleton [25]. Local ice growth and crystallization stress may still disturb particle contacts and adjust the pore arrangement, but the resulting deformation may be insufficient to produce a continuous crack network at the exposed surface.
The two water-content conditions also exhibited different observable states after thawing. In the 25% specimens, melting of pore ice released part of the frost-heave deformation and was accompanied by thaw settlement and particle rearrangement. These processes brought the opposing crack surfaces closer together, producing the partial geometric closure illustrated in Figure 10c and the pronounced reduction in visible crack openings shown in Figure 4c. However, the remaining crack traces indicate that the soil did not completely return to the initial state represented in Figure 10a.
For the 18% specimens, the absence of visible cracks after thawing did not indicate a complete recovery of the initial pore arrangement shown in Figure 10d. The increases in CT-resolvable porosity, connected porosity, and three-dimensional fractal dimension in Figure 7, together with the redistribution of pore radii in Figure 8 and Figure 9, indicate that part of the FT-induced pore adjustment was retained after thawing. This residual internal state is represented schematically in Figure 10f. The comparison between Figure 10d,f therefore suggests that repeated water–ice phase transformation disturbed the internal particle–pore arrangement even though the corresponding changes were not expressed as a macroscopically identifiable surface crack network.
Comparison of the two sequences in Figure 10 indicates that the initial water condition affected the observable manifestation of FT-induced structural change under the present test conditions. In the 25% specimens, the response was readily detected through freezing-stage crack opening and post-thaw geometric closure (Figure 10a–c), whereas in the 18% specimens, the retained response was mainly identified through post-thaw pore characterization (Figure 10d–f).

4.2. Stage and Cycle-Dependent Evolution of Surface Cracks

As discussed in Section 3.2, the quantitative crack parameters provide further insight into how the surface crack network developed during freezing and changed after thawing. Rather than varying synchronously, crack ratio, total crack length, and average crack width reflected different aspects of network growth, including crack extension, branch formation, aperture variation, and continuity loss.
During the early FT cycles, surface crack ratio and total crack length increased, whereas average crack width decreased (Figure 5). Because the crack ratio continued to increase despite the narrowing of individual cracks, the development of the surface network was mainly governed by the initiation and extension of additional branches. This explains the transition from a relatively wide primary crack to a more widely distributed network of narrow cracks in Figure 4b. After N F T = 7 , the decrease in crack ratio and total length coincided with the shortening and fragmentation of several branches, indicating reduced network continuity rather than structural recovery. The differences between the freezing and post-thaw parameters reveal a corresponding change in the closure mode (Figure 6). During the first cycle, total crack length was largely retained after thawing, while crack ratio and average width decreased markedly. Thus, the early post-thaw response was dominated by aperture narrowing, with most crack paths remaining identifiable. As the freezing-stage network became increasingly branched, the post-thaw loss of total crack length became more pronounced. This indicates that thawing subsequently caused not only crack narrowing but also local closure and discontinuity of numerous secondary branches, producing the sparse residual traces shown in Figure 4c. The observed evolution of surface cracking is generally consistent with previous studies showing progressive crack-network adjustment under repeated freeze–thaw cycling [14]. However, the present results further demonstrate that crack opening during freezing can be substantially more pronounced than the residual morphology observed after thawing.
Overall, the parameter variations indicate that surface crack development changed from the widening of a dominant weak path to branch-controlled network expansion, followed by increasing fragmentation [14]. Meanwhile, the post-thaw response evolved from aperture reduction to the combined loss of aperture and branch continuity.

4.3. Complementary Surface and Internal Responses to Freeze–Thaw Cycling

As mentioned in Section 3.3, the CT-derived parameters provide complementary information on the evolution of pore volume, connectivity, and geometrical complexity after thawing. Their variations indicate that the internal pore structure underwent rapid adjustment during the early FT cycles, followed by a slower stage in which different pore characteristics evolved at different rates. The threshold-sensitivity analysis showed that the absolute CT-resolvable porosity was affected by threshold selection, although its overall increase from the initial state to the later FT stages was retained under the tested threshold perturbations. In contrast, the cycle-dependent trend of the three-dimensional fractal dimension varied with threshold selection and was therefore interpreted based on the adopted baseline segmentation condition. The pore restructuring observed in the present study is broadly consistent with previous CT-based observations showing that freeze–thaw action can alter soil macroporosity and macropore size [29].
During the early cycles, CT-resolvable porosity, connected porosity, and three-dimensional fractal dimension increased simultaneously (Figure 7). Previous studies have indicated that ice-crystal growth can enlarge existing pores, disturb particle contacts, and rearrange soil aggregates, while incomplete recovery during thawing allows part of these changes to be retained [17,46]. These processes may explain the concurrent increases in detectable pore volume, connectivity, and spatial complexity during the early stage. The initially compacted pore structure was therefore more susceptible to adjustment during the first few FT cycles. After N F T = 4 , CT-resolvable porosity approached relatively stable levels, whereas connected porosity continued to increase gradually (Figure 7). This asynchronous variation suggests that later structural adjustment involved limited additional pore volume but continued modification of the connections among detectable pores. Local pore linking, merging, or rearrangement may increase the connected fraction without substantially changing the total pore volume or overall geometrical complexity. Accordingly, the decreasing difference between CT-resolvable and connected porosity indicates that connectivity became increasingly important within the detectable pore system.
The pore-radius distributions further indicate that pore-structure restructuring was selective rather than uniform (Figure 8 and Figure 9). The smallest quantitatively resolved pore class remained dominant, while its relative proportion decreased after FT cycling and the proportions within several larger-radius intervals increased. This suggests redistribution toward larger equivalent pore sizes rather than a response dominated solely by small pores. FT action may simultaneously cause pore enlargement, compression, merging, and redistribution, depending on local pore geometry and particle arrangement. After N F T = 4 , the relatively small differences among the later distributions were also consistent with the stabilization of CT-resolvable porosity. The early increase in three-dimensional fractal dimension reflects greater irregularity and spatial complexity of the detectable pore structure, whereas its subsequent stabilization indicates that major changes in overall pore geometry had weakened. However, the continued increase in connected porosity shows that a stable fractal dimension did not represent complete cessation of pore restructuring. Overall, the parameter variations identify an early stage dominated by simultaneous changes in pore volume, connectivity, and complexity, followed by a later stage characterized mainly by gradual connectivity adjustment.

4.4. Limitations and Implications

Several limitations should be considered in interpreting the present results. First, the test material was a laboratory-prepared expansive soil obtained by mixing natural expansive soil with 40% bentonite by dry mass; therefore, the observed responses may not be directly generalized to natural expansive soils with different mineral compositions, particle-size distributions, and initial structures. Detailed particle-size distribution was not specifically quantified in the present study, so its possible influence on moisture migration and freeze–thaw response could not be evaluated separately. Second, surface cracks and internal pores were characterized using specimens with different initial water contents and dimensions, and only one independent specimen was used for each surface water-content condition and for CT characterization. Third, CT scanning was performed only after complete thawing and was subject to spatial-resolution and segmentation-threshold limitations. Finally, internal temperature and moisture evolution were not monitored during FT cycling. Future studies should therefore include replicated specimens, more detailed material characterization, and simultaneous monitoring of temperature and moisture during freeze–thaw cycling. In addition, in situ or higher-resolution CT observations during freezing and thawing would help establish a more direct relationship between transient surface cracking, internal pore restructuring, and moisture redistribution.

5. Conclusions

This study investigated the surface crack evolution and post-thaw internal pore restructuring of expansive soil subjected to repeated FT cycles. Surface images and quantitative crack parameters were used to characterize the freezing and post-thaw responses, while X-ray CT was employed to evaluate the retained internal pore structure after different numbers of cycles. Because the surface and CT observations were obtained from specimens with different dimensions and initial water-content conditions, they should be interpreted as complementary observations. The following conclusions can be drawn:
(1)
Under the selected test conditions, the specimens with initial water contents of 18% and 25% exhibited contrasting observable surface responses. No identifiable continuous crack network developed on the 18% specimens, whereas the 25% specimens showed pronounced crack opening during freezing followed by partial geometric closure after thawing. The retained crack traces indicate that the reduction in visible crack geometry did not represent complete structural recovery.
(2)
Repeated FT cycling changed both the geometry and continuity of the surface crack network in the 25% specimens. During the first seven cycles, surface crack ratio and total crack length increased while average crack width decreased, indicating that network development was governed mainly by the initiation and extension of narrow branches rather than continued widening of the primary crack. With further cycling, shortened and fragmented branches became increasingly evident. Meanwhile, the post-thaw response evolved from aperture narrowing of largely retained crack paths to the combined loss of crack aperture and branch continuity.
(3)
The post-thaw pore structure of the 18% specimens underwent its most pronounced adjustment during the first four cycles. CT-resolvable porosity, connected porosity, and three-dimensional fractal dimension increased concurrently during this stage, reflecting changes in detectable pore volume, connectivity, and geometrical complexity. During the later cycles, CT-resolvable porosity and fractal dimension approached stable levels, whereas connected porosity continued to increase gradually. Small pores remained dominant throughout the test, although the increased proportions in selected larger-radius intervals indicated selective pore enlargement, merging, and redistribution rather than uniform coarsening of the pore system.
(4)
From an engineering perspective, these results suggest that post-thaw surface appearance alone may not fully reflect the structural disturbance experienced by compacted expansive soil during freezing. Particular attention should therefore be paid to moisture conditions and early freeze–thaw cycles when evaluating compacted expansive-soil fills and other cold-region earth structures, because substantial crack and pore restructuring may develop during these stages even when the post-thaw surface appears relatively intact.

Author Contributions

Conceptualization, J.Z. and Y.L.; methodology, W.W. and Y.L.; investigation, W.W. and Y.S.; software, Y.S.; data curation, W.W.; writing—original draft preparation, W.W. and Y.S.; writing—review and editing, Y.L. and J.Z.; visualization, W.W. and Y.S.; supervision, J.Z.; project administration, J.Z.; funding acquisition, J.Z. and Y.L. All authors have read and agreed to the published version of the manuscript.

Funding

This work was financially supported by the National Natural Science Foundation of China (Grant No. 42407204 and Grant No. 42377176), Hubei Provincial Natural Science Foundation General Program (Grant No. JCZRYB202500025). It was also supported by the Fundamental Research Funds for the Central Universities, China University of Geosciences (Wuhan).

Institutional Review Board Statement

Not applicable.

Informed Consent Statement

Not applicable.

Data Availability Statement

The original contributions presented in this study are included in the article. Further inquiries can be directed to the corresponding author.

Acknowledgments

The authors would like to thank the editor and anonymous reviewers for their valuable comments and suggestions, which helped improve this manuscript. The authors also appreciate the assistance provided during the experimental work.

Conflicts of Interest

The authors declare that they have no conflict of interest.

References

  1. Shi, B.; Jiang, H.; Liu, Z.; Fang, H.Y. Engineering Geological Characteristics of Expansive Soils in China. Eng. Geol. 2002, 67, 63–71. [Google Scholar] [CrossRef]
  2. Alonso, E.E.; Vaunat, J.; Gens, A. Modelling the Mechanical Behaviour of Expansive Clays. Eng. Geol. 1999, 54, 173–183. [Google Scholar] [CrossRef]
  3. Benchouk, A.; Derfouf, M.; Abou-Bekr, N.; Taibi, S. Behavior of Some Clays on Drying and Wetting Paths. Arab. J. Geosci. 2013, 6, 4565–4573. [Google Scholar] [CrossRef]
  4. Zhu, X.; Chen, Z.; Ni, P.; Cai, Z.-Y.; Huang, Y.-H.; Zhang, C. Cracking in Compacted Expansive Soils under Unidirectional Wet-Dry Cycles: Insights from X-Ray Computed Tomography. Acta Geotech. 2024, 19, 7851–7864. [Google Scholar] [CrossRef]
  5. Basma, A.A.; Al-Homoud, A.S.; Husein Malkawi, A.I.; Al-Bashabsheh, M.A. Swelling-Shrinkage Behavior of Natural Expansive Clays. Appl. Clay Sci. 1996, 11, 211–227. [Google Scholar] [CrossRef]
  6. Sun, X.; Song, S.; Niu, C.; Zhang, X.; Dou, C.; Xia, W.; Li, X.; Wang, Q. Investigation of the Structural Strength of Expansive Soil in a Seasonally Frozen Region. Buildings 2024, 14, 789. [Google Scholar] [CrossRef]
  7. Nowamooz, H.; Masrouri, F. Mechanical Behaviour of Expansive Soils after Several Drying and Wetting Cycles. Geomech. Geoeng. 2010, 5, 213–221. [Google Scholar] [CrossRef]
  8. Lin, Y.; Yuan, J.; Ding, C. Specimen Size Effect on Expansive Soil Permeability: Laboratory and In-Situ Investigation. Appl. Sci. 2025, 15, 12205. [Google Scholar] [CrossRef]
  9. Qin, Y.; He, J.; Bai, Y.; Teng, H. Study on the Mechanism of Freeze–Thaw Cycling Effects on Soil Aggregate Stability and Pore Structure Evolution. Appl. Sci. 2026, 16, 2589. [Google Scholar] [CrossRef]
  10. Luo, Y.; Hou, X.; Zhang, J.; Wang, Y.; Hu, M.; Jiang, G.; Tang, C.-S. Exploring the Effects of Weather-Driven Dynamics of Desiccation Cracks on Hydrological Process of Expansive Clay Slope: Insights from Physical Model Test. J. Hydrol. 2025, 656, 133011. [Google Scholar] [CrossRef]
  11. Tang, C.-S.; Cheng, Q.; Gong, X.; Shi, B.; Inyang, H.I. Investigation on Microstructure Evolution of Clayey Soils: A Review Focusing on Wetting/Drying Process. J. Rock Mech. Geotech. Eng. 2023, 15, 269–284. [Google Scholar] [CrossRef]
  12. Lu, X.; Xu, G.; Gan, L.; Lou, L.; Shi, Y.; Hu, P.; Zhuo, S.; Chen, X. Microscopic Damage Mechanism of Asphalt Mixtures under Freeze-Thaw Cycles: The Role of Initial Void Content. Constr. Build. Mater. 2026, 521, 146165. [Google Scholar] [CrossRef]
  13. Cong, S.; Tang, L.; Ling, X.; Vanapalli, S.K. Insights into the Shallow Landslide Mechanism of Expansive Soil Slope Induced by Freeze–Thaw Cycles and Snowmelt Infiltration. Can. Geotech. J. 2025, 62, 1–17. [Google Scholar] [CrossRef]
  14. Lu, Y.; Liu, S.; Weng, L.; Wang, L.; Li, Z.; Xu, L. Fractal Analysis of Cracking in a Clayey Soil under Freeze–Thaw Cycles. Eng. Geol. 2016, 208, 93–99. [Google Scholar] [CrossRef]
  15. Wei, Y.; Tang, C.-S.; Lu, Y.; Zhang, M.; Cheng, Q.; Li, L.; Shi, B. Evaporation and Desiccation Cracking of Soils: Experiment Evidence and Insight on the Freeze-Thaw Cycle Dependence. Eng. Geol. 2024, 329, 107399. [Google Scholar] [CrossRef]
  16. Huang, Y.; Chen, Y.; Wang, S.; Wu, M.; Wang, W. Effects of Freeze–Thaw Cycles on Volume Change Behavior and Mechanical Properties of Expansive Clay with Different Degrees of Compaction. Int. J. Geomech. 2022, 22, 04022050. [Google Scholar] [CrossRef]
  17. Zhao, G.; Zou, W.; Han, Z.; Wang, D.; Wang, X. Evolution of Soil-Water and Shrinkage Characteristics of an Expansive Clay during Freeze-Thaw and Drying-Wetting Cycles. Cold Reg. Sci. Technol. 2021, 186, 103275. [Google Scholar] [CrossRef]
  18. Tang, L.; Cong, S.; Geng, L.; Ling, X.; Gan, F. The Effect of Freeze-Thaw Cycling on the Mechanical Properties of Expansive Soils. Cold Reg. Sci. Technol. 2018, 145, 197–207. [Google Scholar] [CrossRef]
  19. Wang, Y.; Yang, W.; Ge, Y.; Liu, P.; Zhang, A. Analysis of Freeze-Thaw Damage and Pore Structure Deterioration of Mortar by Low-Field NMR. Constr. Build. Mater. 2022, 319, 126097. [Google Scholar] [CrossRef]
  20. Zheng, J.; Wang, J.; Lu, Y.; Gu, X.; Pastor, M.; Tayyebi, S.M.; Mu, Y.; Wang, T. Modelling the Frost Cracking Behavior in Clayey Soils: A Peridynamic Approach. Comput. Geotech. 2024, 176, 106765. [Google Scholar] [CrossRef]
  21. Jin, J.; Li, S.; Song, C.; Zhang, X.; Lv, X. Ageing Deformation of Tailings Dams in Seasonally Frozen Soil Areas under Freeze-Thaw Cycles. Sci. Rep. 2019, 9, 15033. [Google Scholar] [CrossRef] [PubMed]
  22. Thomas, H.R.; Cleall, P.; Li, Y.-C.; Harris, C.; Kern-Luetschg, M. Modelling of Cryogenic Processes in Permafrost and Seasonally Frozen Soils. Géotechnique 2009, 59, 173–184. [Google Scholar] [CrossRef]
  23. Ye, D.; Liu, G.; Ma, T.; Cheng, G.; Fan, S.; Yang, T. The Mechanics of Frost Heave with Stratigraphic Microstructure Evolution. Eng. Geol. 2023, 319, 107119. [Google Scholar] [CrossRef]
  24. Li, K.-Q.; Yin, Z.-Y. State of the Art of Coupled Thermo–Hydro-Mechanical–Chemical Modelling for Frozen Soils. Arch. Comput. Methods Eng. 2025, 32, 1039–1096. [Google Scholar] [CrossRef]
  25. Chen, H.; Du, H.; Guo, H.; Kong, F.; Zhang, Z. Freezing Strain Characteristics and Mechanisms of Unsaturated Frozen Soil: Analysis of Matric Suction and Water–Ice Phase Change. Acta Geotech. 2024, 19, 7243–7260. [Google Scholar] [CrossRef]
  26. Akagawa, S.; Nishisato, K. Tensile Strength of Frozen Soil in the Temperature Range of the Frozen Fringe. Cold Reg. Sci. Technol. 2009, 57, 13–22. [Google Scholar] [CrossRef]
  27. Azmatch, T.F.; Sego, D.C.; Arenson, L.U.; Biggar, K.W. Tensile Strength and Stress–Strain Behaviour of Devon Silt under Frozen Fringe Conditions. Cold Reg. Sci. Technol. 2011, 68, 85–90. [Google Scholar] [CrossRef]
  28. Xi, Y.; Sun, M.; Li, G.; Zhang, J. Crack Development in Compacted Loess Subjected to Wet–Dry Cycles: Experimental Observations and Numerical Modeling. Buildings 2025, 15, 2625. [Google Scholar] [CrossRef]
  29. Fan, W.; Yang, P.; Yang, Z.J. Freeze-Thaw Impact on Macropore Structure of Clay by 3D X-Ray Computed Tomography. Eng. Geol. 2021, 280, 105921. [Google Scholar] [CrossRef]
  30. Kong, B.; He, S.-H.; Tao, Y.; Xia, J. Pore Structure and Fractal Characteristics of Frozen–Thawed Soft Soil. Fractal Fract. 2022, 6, 183. [Google Scholar] [CrossRef]
  31. Cheng, Q.; Tang, C.-S.; Zhu, C.; Li, K.; Shi, B. Drying-Induced Soil Shrinkage and Desiccation Cracking Monitoring with Distributed Optical Fiber Sensing Technique. Bull. Eng. Geol. Environ. 2020, 79, 3959–3970. [Google Scholar] [CrossRef]
  32. Luo, Y.; Zhang, J.; Tang, C.-S.; Jiang, G.; Bogaard, T. Impact of Dynamic Desiccation Cracks on Hydrological Processes and Stability in Expansive Clay Slopes: A Coupled Dual-Permeability Modeling Approach. Eng. Geol. 2025, 357, 108377. [Google Scholar] [CrossRef]
  33. Du, H.; Chen, H.; Li, J.; Wang, Q.; Kong, F.; Wang, B.; Wang, W. Dispersivity-Induced Crack Patterns in Soils Subjected to Combined Wet-Dry and Freeze-Thaw Cycles: Insights from Monitoring, Testing, and CT Scanning. Soil Tillage Res. 2026, 256, 106856. [Google Scholar] [CrossRef]
  34. Cai, G.; Liu, Q.; Li, K.; Zhang, J.; Liu, Y.; Zhou, A. Volume Change Behavior of Compacted Loess under Drying/Wetting and Freezing/Thawing Cycles. Eng. Geol. 2023, 326, 107329. [Google Scholar] [CrossRef]
  35. Lu, Y.; Liu, S.; Alonso, E.; Wang, L.; Xu, L.; Li, Z. Volume Changes and Mechanical Degradation of a Compacted Expansive Soil under Freeze-Thaw Cycles. Cold Reg. Sci. Technol. 2019, 157, 206–214. [Google Scholar] [CrossRef]
  36. Chen, Z.; Rao, J.; Wan, Y. The Effect of Temperature Pathways on Unfrozen Water and Thermal Parameters of Frozen Soils. Soil Mech. Found. Eng. 2024, 61, 257–263. [Google Scholar] [CrossRef]
  37. Hotineanu, A.; Bouasker, M.; Aldaood, A.; Al-Mukhtar, M. Effect of Freeze–Thaw Cycling on the Mechanical Properties of Lime-Stabilized Expansive Clays. Cold Reg. Sci. Technol. 2015, 119, 151–157. [Google Scholar] [CrossRef]
  38. Zhao, R.; Liu, X.; Li, Q.; Jin, D.; Gao, W. Experimental Study on the Effect of Freeze–Thaw Cycles to the Cohesion and Moisture Content of Geogrid Reinforced Silty Clay. Sci. Rep. 2024, 14, 19478. [Google Scholar] [CrossRef] [PubMed]
  39. Zhao, L.; Ma, P.; Mu, Q.; Jia, Z.; Zhao, J.; He, Z.; Huo, B.; Li, Z.; Peng, J. Influences of Freeze-Thaw Cycles on Desiccation Cracking of an Intact Loess. Eng. Geol. 2025, 344, 107864. [Google Scholar] [CrossRef]
  40. Li, J.; Chen, H.; Gao, X.; Ding, Q.; Shan, W.; Guo, H.; Zhuo, J. Cracks Evolution and Micro Mechanism of Compacted Clay under Wet-Dry Cycles and Wet-Dry-Freeze-Thaw Cycles. Cold Reg. Sci. Technol. 2023, 214, 103944. [Google Scholar] [CrossRef]
  41. Tang, C.; Shi, B.; Liu, C.; Zhao, L.; Wang, B. Influencing Factors of Geometrical Structure of Surface Shrinkage Cracks in Clayey Soils. Eng. Geol. 2008, 101, 204–217. [Google Scholar] [CrossRef]
  42. de Jong, E.; Kachanoski, R.G. Drying of Frozen Soils. Can. J. Soil Sci. 1988, 68, 807–811. [Google Scholar] [CrossRef]
  43. Zhang, L.; Wei, M.; Yang, C. Pore Water Pressure Changes of Supercooling and Ice Nucleation Stages during Freezing Point Testing. Géotech. Lett. 2015, 5, 39–42. [Google Scholar] [CrossRef]
  44. Williams, P.J. Pore Pressures at a Penetrating Frost Line and Their Prediction. Géotechnique 1966, 16, 187–208. [Google Scholar] [CrossRef]
  45. Aubert, J.E.; Gasc-Barbier, M. Hardening of Clayey Soil Blocks during Freezing and Thawing Cycles. Appl. Clay Sci. 2012, 65–66, 1–5. [Google Scholar] [CrossRef]
  46. Chen, Q.; Ghimire, B.; Su, L.; Liu, Y. Micro-Scale Investigations on the Mechanical Properties of Expansive Soil Subjected to Freeze-Thaw Cycles. Cold Reg. Sci. Technol. 2024, 219, 104128. [Google Scholar] [CrossRef]
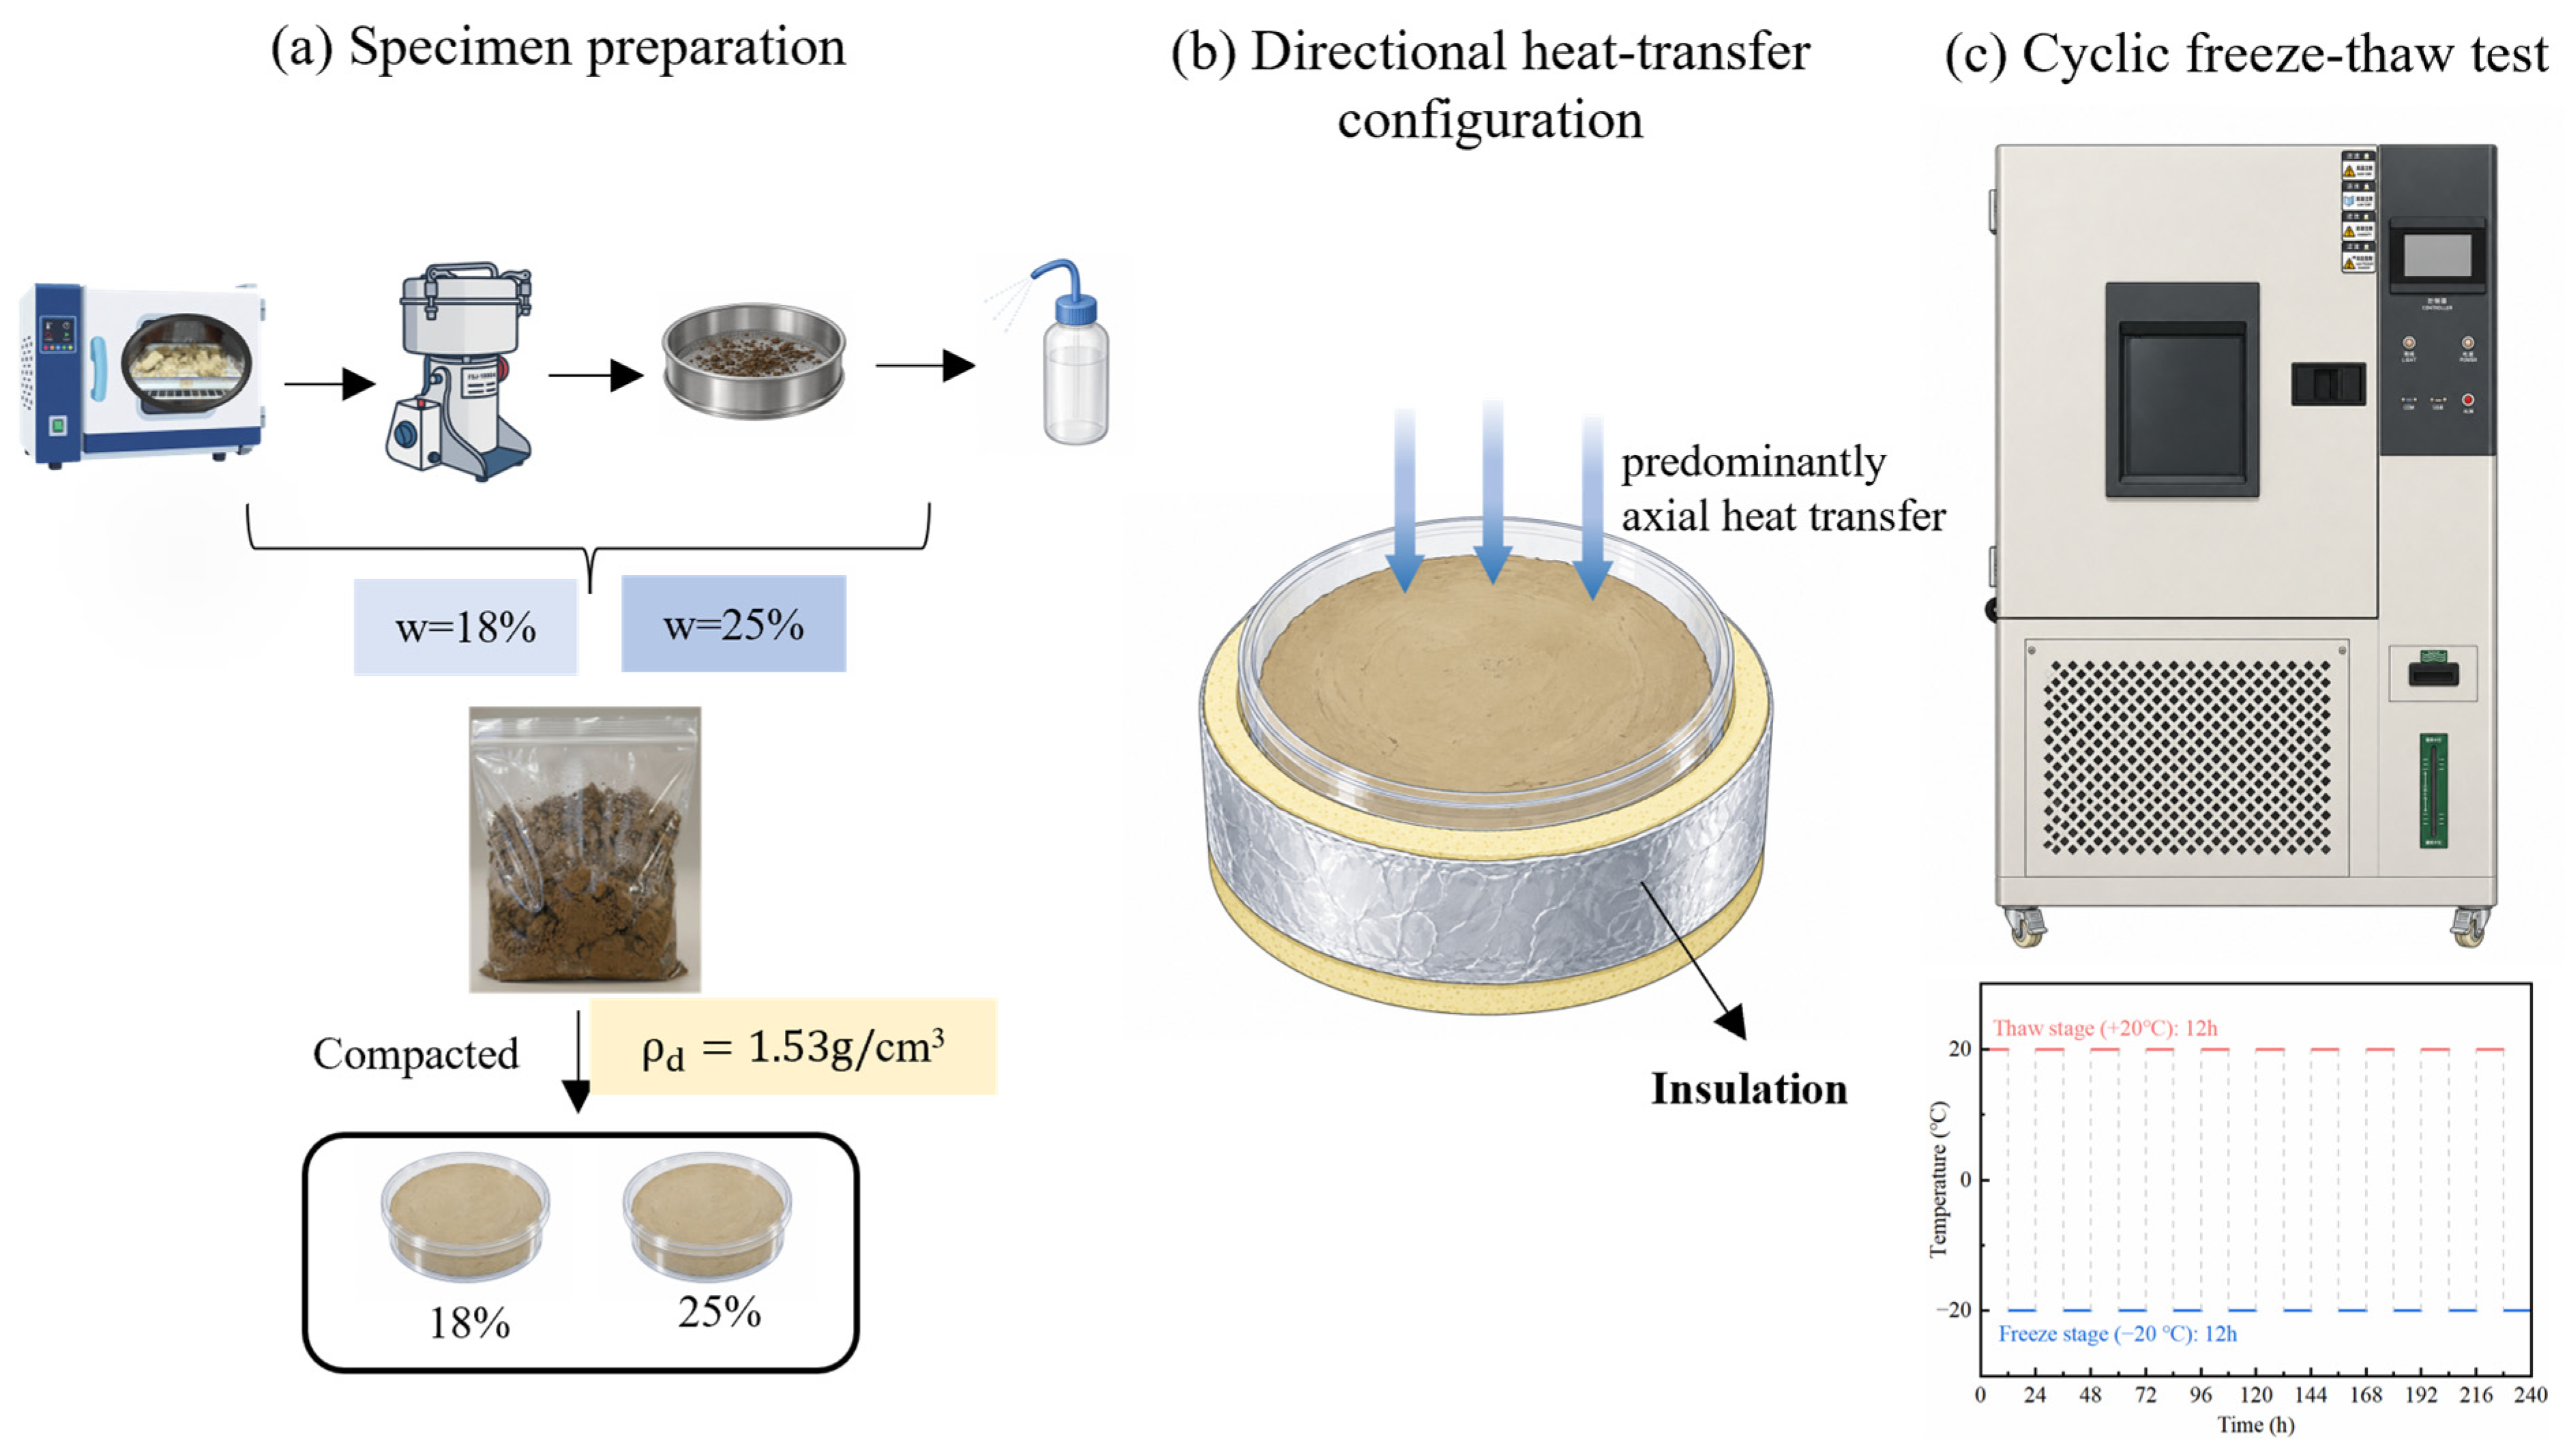
Figure 1. Experimental workflow: (a) specimen preparation; (b) directional heat-transfer configuration; and (c) imposed temperature cycle.
Applsci 16 09281 g001
Figure 2. Schematic of crack image processing procedures.
Applsci 16 09281 g002
Figure 3. CT image processing and threshold-sensitivity analysis: (a) pore-structure reconstruction and connectivity characterization; (b) sensitivity of CT-derived parameters to segmentation-threshold perturbation.
Applsci 16 09281 g003
Figure 4. Surface morphology of expansive soil specimens: (a) 18% water content at the post-thaw stage; (b) 25% water content at the intermediate freezing stage after 4 h of freezing; and (c) 25% water content at the post-thaw stage. White arrows indicate the directions of crack opening during freezing and crack closure during thawing
Applsci 16 09281 g004
Figure 5. Evolution of surface crack parameters during the freezing and post-thaw stages: (a) surface crack ratio; (b) total crack length; and (c) average crack width.
Applsci 16 09281 g005
Figure 6. Relative reductions in surface crack parameters from the freezing stage to the post-thaw stage.
Applsci 16 09281 g006
Figure 7. Evolution of CT-derived pore-structure parameters with freeze–thaw cycles: (a) CT-resolvable porosity and connected porosity; (b) three-dimensional fractal dimension.
Applsci 16 09281 g007
Figure 8. Pore radius distribution of 18% water content specimens after different numbers of FT cycles: (a) N F T = 0 ; (b) N F T = 1 ; (c) N F T = 4 ; (d) N F T = 7 ; (e) N F T = 10 ; and (f) comparison of pore radius distribution curves. The different shades of red in Figure 8 are used only for visual distinction among the pore-radius intervals and do not represent additional classifications.
Applsci 16 09281 g008
Figure 9. Enlarged pore radius distributions of 18% water content specimens in the large-pore range of 1.0–1.5 mm: (a) N F T = 0 ; (b) N F T = 1 ; (c) N F T = 4 ; (d) N F T = 7 ; and (e) N F T = 10 .
Applsci 16 09281 g009
Figure 10. Conceptual mechanism of water-content-dependent multiscale structural evolution of expansive soil under FT cycles: (ac) initial, freezing, and post-thaw states at 25% water content; and (df) corresponding states at 18% water content. Red arrows indicate the directions of crack opening during freezing and crack closure during thawing.
Applsci 16 09281 g010
Table 1. Basic physical properties of the test soil.
G S (-) ω o p t (%) ρ d , m a x L l (%) P l (%) δ e f (%)
2.73181.676220.276
G S —specific gravity (-); ω o p t —optimal moisture content (%); ρ d , m a x —the maximum dry density (g/cm3); L l —liquid limit (%); P l —Plastic limit (%); δ e f —free swelling ratio (%).
Disclaimer/Publisher’s Note: The statements, opinions and data contained in all publications are solely those of the individual author(s) and contributor(s) and not of MDPI and/or the editor(s). MDPI and/or the editor(s) disclaim responsibility for any injury to people or property resulting from any ideas, methods, instructions or products referred to in the content.