Article

A Comparative Study of Fracture Evolution and Failure Characteristics of Coal Specimens Under Different Mining-Induced Stress Paths Using True Triaxial Tests and Acoustic Emission Monitoring


1
State Key Laboratory for Fine Exploration and Intelligent Development of Coal Resources, China University of Mining and Technology, Xuzhou 221116, China
2
School of Mines, China University of Mining and Technology, Xuzhou 221116, China
3
Yunlong Lake Laboratory of Deep Underground Science and Engineering, Xuzhou 221116, China
*
Author to whom correspondence should be addressed.
Appl. Sci. 2026, 16(18), 9252; https://doi.org/10.3390/app16189252 (registering DOI)
Submission received: 11 July 2026 / Revised: 13 August 2026 / Accepted: 14 September 2026 / Published: 17 September 2026
(This article belongs to the Topic Advances in Mining and Geotechnical Engineering)

Abstract

To investigate the fracture evolution and failure mechanisms of coal specimens under different mining-induced stress paths, true triaxial tests were conducted along six paths grouped into three categories: bidirectional loading–unloading, unidirectional double-face unloading, and unidirectional single-face unloading. Acoustic emission (AE) monitoring was used to analyze specimen failure and the corresponding AE responses. The results show that brittle shear failure dominated under the σ1–σ2 loading–unloading path, whereas ductile failure was more pronounced under the σ1–σ3 loading–unloading path. Under unidirectional double-face unloading of σ2 or σ3, tensile–shear cracking became more pronounced, and the failure mode shifted from shear-dominated failure to tensile–shear composite failure. Under unidirectional single-face unloading, the specimens unloaded along σ2 exhibited better stability than those unloaded along σ3. Fractures were mainly concentrated in the half region adjacent to the unloading face and were dominated by tensile cracks and their associated secondary fractures. AE activity under all testing conditions showed clear stage-dependent characteristics. In particular, high-intensity AE activity appeared earlier and was more pronounced when σ2 was unloaded. The RA–AF distributions indicate the coexistence of tensile- and shear-type cracking. This interpretation is consistent with the macroscopic failure patterns associated with the intermediate principal stress effect. These findings provide a reference for early warning and stability control of surrounding rock in underground coal mining engineering.

1. Introduction

According to the Statistical Communiqué of the People’s Republic of China on the 2025 National Economic and Social Development released by the National Bureau of Statistics of China [1], China remains the world’s largest producer and consumer of coal. In 2025, raw coal production reached 4.85 billion tons, and coal accounted for 51.4% of total energy consumption, indicating that coal still occupies a dominant position in China’s energy structure. Underground coal mining systems involve a large number of excavated coal roadways. Excavation-induced unloading disturbs the initial stress equilibrium of the rock mass, causing the surrounding rock to undergo single-face or double-face unloading and transforming the stress state from triaxial compression to biaxial or even uniaxial compression. Compared with conventional loading conditions, rocks exhibit significantly different mechanical responses under unloading conditions. In high-stress environments, such stress release may trigger geological hazards such as rockbursts, collapses, and roof falls, thereby seriously threatening engineering safety [2,3,4]. Excavation-induced unloading is spatially nonuniform, and different surrounding-rock zones may follow distinct stress paths, leading to variable fracturing, anisotropy, and strain-energy redistribution or release [5,6,7].
To investigate the triaxial stress redistribution induced by underground excavation, researchers have extensively employed true triaxial mechanical tests to examine the mechanical response and failure mechanisms of coal and rock masses under complex stress conditions. Previous studies have progressed from the early recognition of the intermediate principal stress effect to broader investigations involving loading–unloading paths, unloading modes, cyclic disturbance, and energy-damage evolution [8,9,10]. Mogi [11,12] was among the first to conduct true triaxial compression tests on marble using a self-developed apparatus, revealing the significant influence of the intermediate principal stress on rock fracture and flow behavior and laying the foundation for true triaxial rock mechanics. Zhang et al. [13] reported a new mechanism of dilatancy-induced fracture in hard rock under true triaxial stress conditions. Gao et al. [14], Dong et al. [15], and Duan et al. [16] analyzed the effects of stress path on rock strength, deformation, damage evolution, and energy dissipation from the perspectives of loading–unloading rate, cyclic loading, and cyclic disturbance in coal, respectively. Under excavation-induced unloading conditions, Li et al. [17], Zhu et al. [18], Feng et al. [19], and Zhou et al. [20], and Liu and Chen [21] investigated the mechanical behavior and instability characteristics of rocks under different unloading paths, unloading directions, and intermediate principal stress levels. Wang et al. [22], Li et al. [23], Browning et al. [24], Wang et al. [25], and Zhang et al. [26] further discussed the controlling roles of minimum principal stress unloading, specimen size, crack evolution, and cyclic stress paths in peak strength, fracture propagation, and macroscopic failure modes. In rocks with discontinuities, these paths may further alter crack initiation, propagation, and macroscopic failure [27] Although these studies have substantially advanced the understanding of rock behavior under true triaxial conditions, targeted investigations into the loading–unloading failure characteristics of coal specimens under different mining-induced stress paths remain limited, particularly regarding the relationship between macroscopic failure morphology and the intermediate principal stress effect.
To capture the mesoscopic evolution of crack initiation, propagation, and coalescence inside coal and rock masses, AE technology has been widely used for real-time monitoring of elastic wave signals released during fracture. AE studies have developed from early analyses based on event counts and energy statistics to more comprehensive approaches incorporating source location, time–frequency characteristics, b-values, fractal dimensions, and entropy-related parameters [28,29,30,31]. Lockner [32] noted that AE is a typical response to rapid microcrack propagation during brittle rock failure, and that event counting, source location, and waveform analysis can effectively reveal microcrack evolution and damage accumulation. Ali et al. [33], Xia et al. [34], and Shan et al. [35,36] investigated crack propagation and AE response characteristics in coal and rock masses under the effects of water, external constraints, wetting–drying cycles, and acidic or alkaline environments, showing that external environments and stress conditions can strongly affect crack growth paths, energy release behavior, and precursory instability information. Belikov and Ryvkin [37], Yang et al. [38], Chen and Chen [39], and Dong et al. [40] further showed that integrated analyses based on amplitude–frequency spectra, spatial localization, and source-mechanism parameters can effectively identify the progressive evolution of cracks from dispersed nucleation and local aggregation to macroscopic coalescence. AE has become an important tool for linking mesoscopic crack evolution with macroscopic instability in coal and rock masses. Even so, the AE activity characteristics of coal specimens under different mining-induced stress paths under true triaxial conditions, and their correspondence with macroscopic failure features, have not yet been sufficiently clarified.
True triaxial testing combined with acoustic emission (AE) monitoring has been widely used to investigate failure in rocks and coal. However, the combined effects of unloading boundary mode, unloading direction, and principal-stress reordering have received less systematic attention. In particular, differences between unloading the intermediate and minimum principal stresses under various boundary configurations remain insufficiently understood. To address this issue, six loading–unloading paths were designed within three categories: bidirectional loading–unloading, unidirectional double-face unloading, and unidirectional single-face unloading. These paired paths enabled controlled comparisons of unloading direction and principal-stress reordering within a unified experimental framework. The objective was to examine their effects on deformation, macroscopic fracture development, AE evolution, and failure localization, with particular emphasis on the intermediate principal stress. Accordingly, the contribution of this study lies in its comparative assessment of path-dependent failure rather than merely in the use of true triaxial testing or AE monitoring. The findings may improve the understanding of excavation-induced surrounding-rock instability and provide experimental insights relevant to hazard warning and stability control.

2. Materials and Methods

2.1. Materials

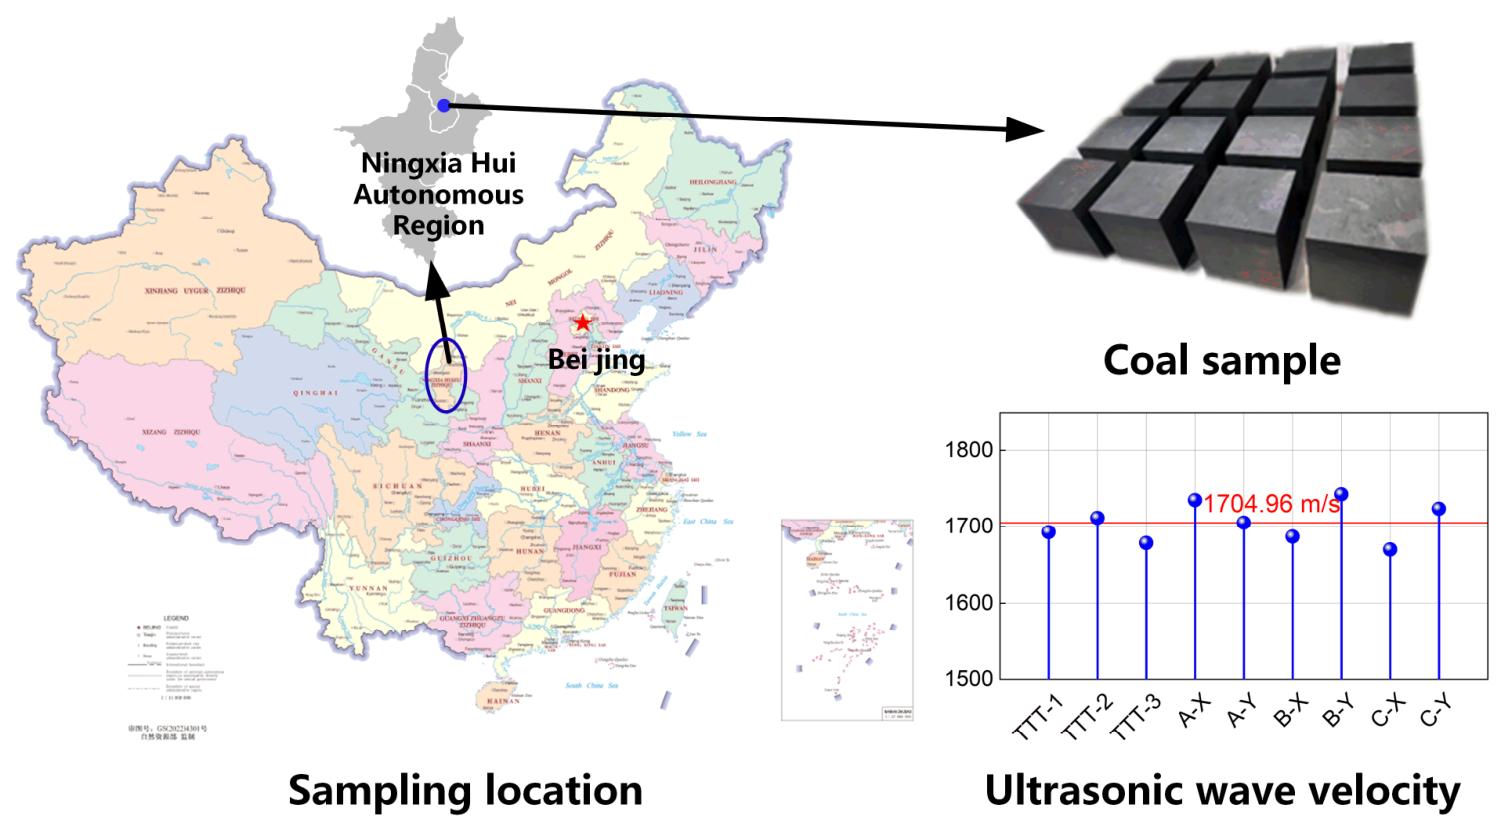
The coal specimens used in this study were collected from the No. 15 coal seam of the Lingxin Coal Mine in the Ningdong mining area, Ningxia Hui Autonomous Region, China. The coal seam is 3–4 m thick, with medium- to fine-grained sandstone in the roof and siltstone in the floor. It is characterized by a relatively simple geological structure, a compact texture, and comparatively hard coal. The mine uses longwall mining along the strike, and the roadways are arranged within the No. 15 coal seam. Section coal pillars are left between adjacent working faces.
To minimize disturbance to the internal structure of the coal during sampling and transportation and thereby preserve the original characteristics of the specimens, intact large blocks of raw coal were selected from the same area. Each block was marked in situ with its sample number and original occurrence state. During underground transportation, the samples were packed in foam-buffered boxes. After being brought to the surface, they were immediately sealed with plastic wrap and then transported to the processing plant using shock-absorbing packaging. During machining, the original occurrence characteristics of the coal seam were fully considered, and the bedding planes were kept approximately parallel to the top and bottom surfaces of the specimens.
All specimens were machined into standard cubes with dimensions of 100 mm × 100 mm × 100 mm. The specimen surfaces were smooth and flat, and the unevenness of each of the six faces was controlled within 0.05 mm. To reduce the influence of specimen heterogeneity on the test results, all specimens were screened using a rock ultrasonic velocity tester (RSM-SY6, Wuhan Zhongyan Technology Co., Ltd., Wuhan, China), and specimens with large wave-velocity differences were excluded to ensure good internal consistency. The selected specimens exhibited ultrasonic velocities ranging from 1600 to 1800 m/s, with an average value of 1704.96 m/s. For the six loading–unloading specimens, the mean mass and density were 1369.35 ± 9.70 g and 1368.98 ± 9.56 kg·m−3, respectively, and the coefficient of variation in density was 0.70%. The dimensional deviation was less than ±1‰, indicating satisfactory machining accuracy. Nine coal specimens were used in this study. Three specimens (TTT-1–TTT-3) were subjected to conventional true-triaxial loading tests to determine the peak strength under the specified confining-pressure condition. The remaining six specimens were assigned to six loading–unloading paths (A-X, A-Y, B-X, B-Y, C-X, and C-Y), with one specimen tested along each path. Therefore, this study focuses primarily on the trends in coal failure and fracture evolution under different stress paths, rather than on establishing statistically robust relationships. The basic physical and mechanical parameters of the specimens are listed in Table 1, and some representative specimens are shown in Figure 1.

2.2. Experimental Equipment

2.2.1. True Triaxial Rock Mechanics Testing System

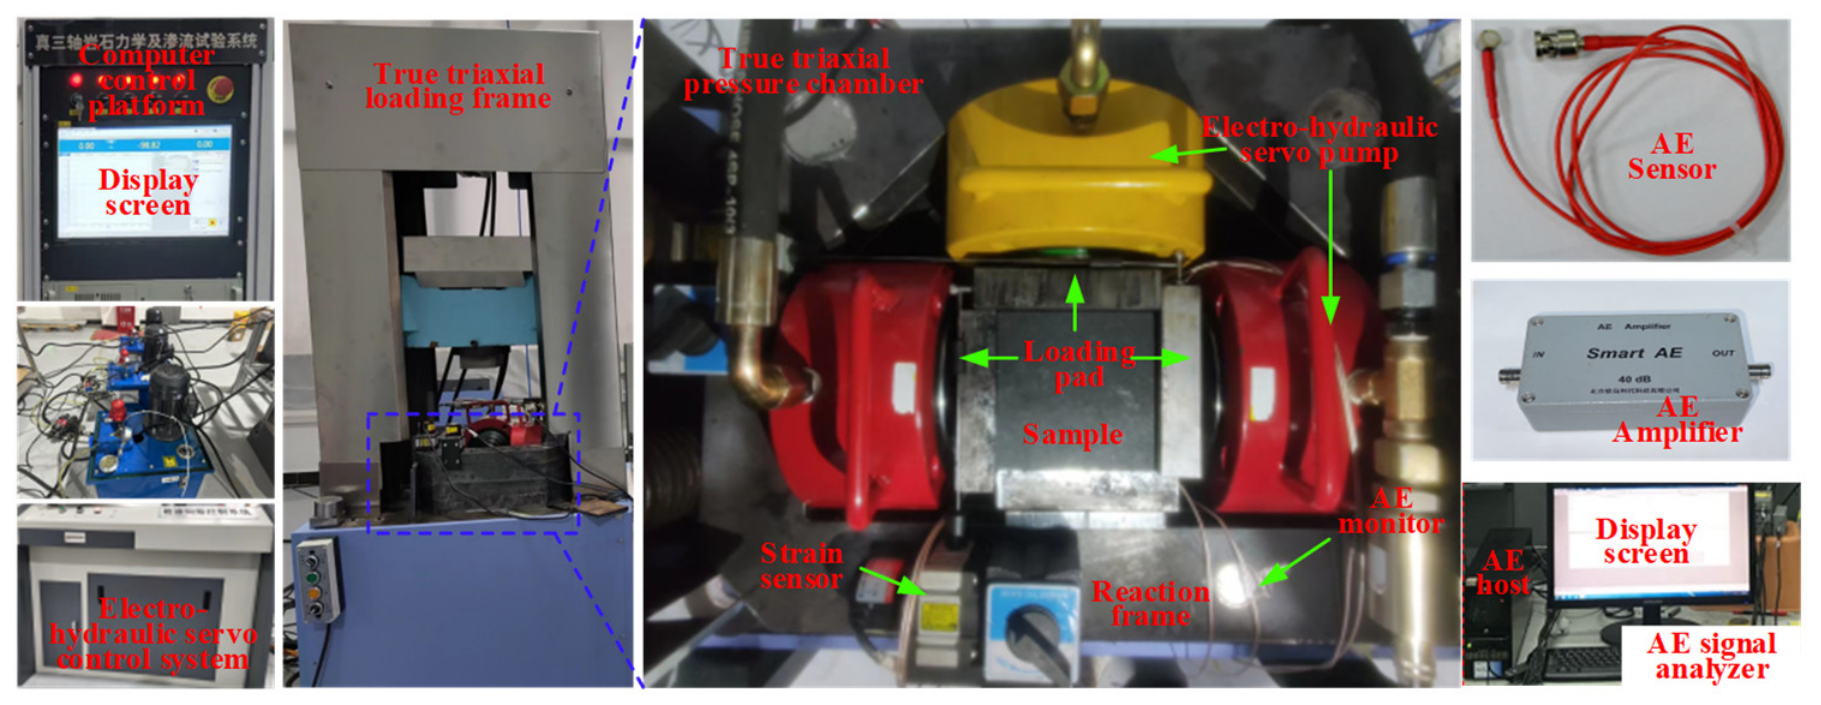
The experiments were conducted using a true triaxial rock mechanics and permeability testing system developed by our research team. As shown in Figure 2, the apparatus mainly consists of a three-directional electro-hydraulic servo loading system, a true triaxial loading frame with a pressure chamber, a data acquisition and control system, and an operating platform. The maximum loading capacities in the three principal directions are 2000 kN, 500 kN, and 500 kN, respectively. The load-control and data-acquisition accuracy is 1‰, and the acquisition frequency is 50 Hz. The maximum applicable specimen size is 150 mm × 150 mm × 150 mm. Specimens of different sizes can also be tested by replacing the loading pads with different specifications.
The automatic acquisition and control system is based on a TZT3827EN dynamic and static signal testing and analysis system (Jiangsu Test Electronic Equipment Manufacturing Co., Ltd., Jingjiang, China). The controller is equipped with interfaces for pressure monitoring, flow control, displacement monitoring, and data transmission, enabling servo control of the loading system, acquisition of pressure and displacement data, data transmission, and command execution. Data are transmitted to the computer-based operating platform through the data transmission interface. The operating platform consists of EVO-TEST software (version 1.0)and a TMC-100 driver. The software enables displacement control and stress loading–unloading control of the testing machine. For complex testing procedures, control programs can be written through the graphical user interface. Figure 2 shows the acquisition and control system and the operating platform.
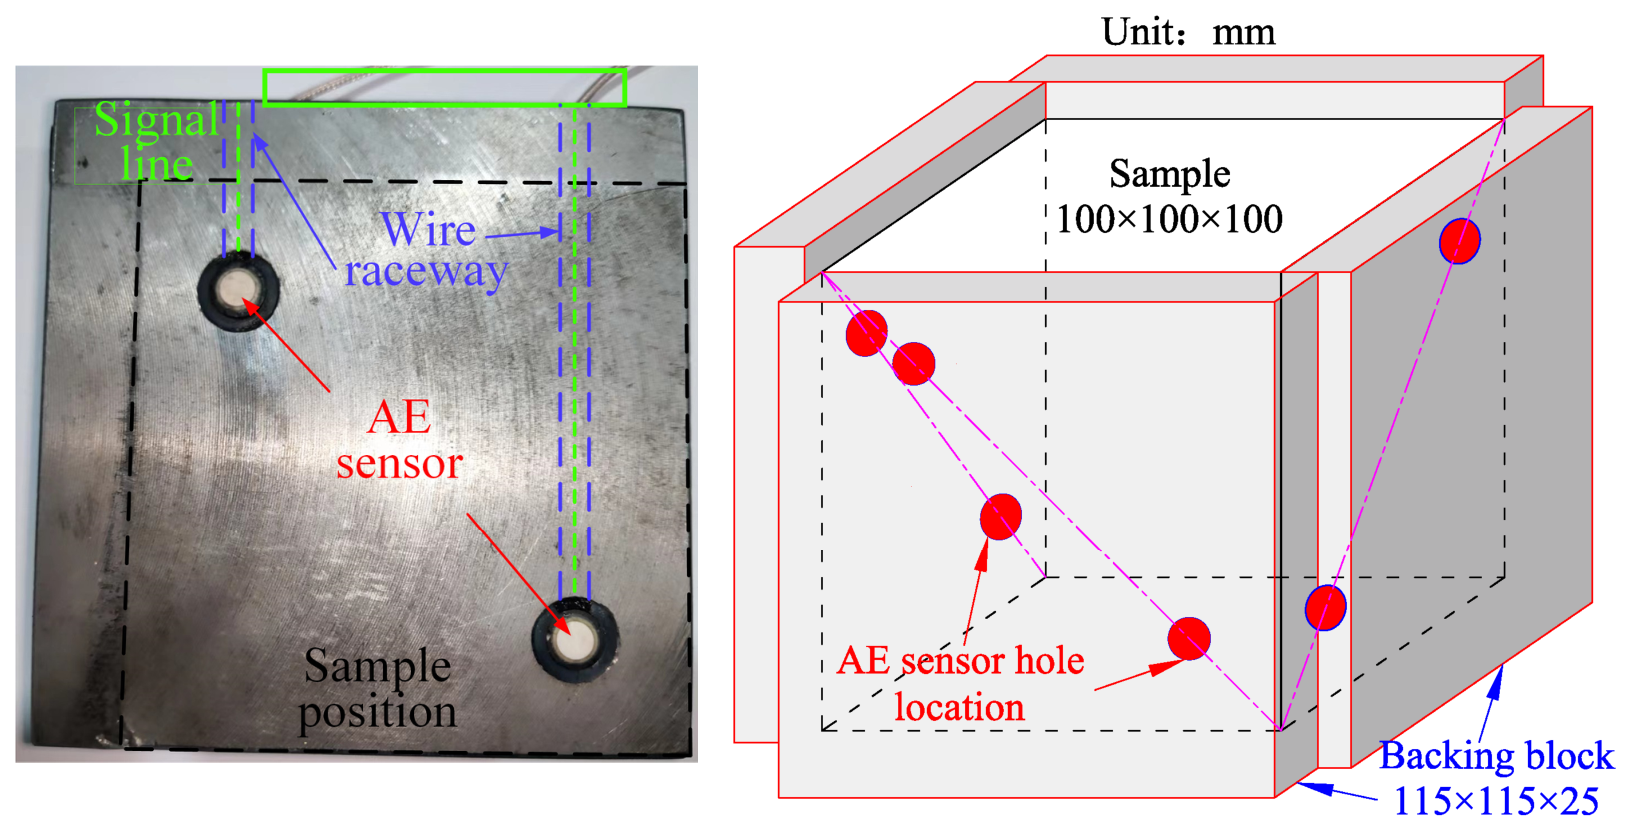
The true triaxial loading frame and pressure chamber constitute the core area for specimen loading–unloading and other coupled tests. The loading frame is a vertically oriented loading unit composed of a high-rigidity metal frame, an electro-hydraulic servo actuator, reaction screw rods, and a pressure chamber platform. During testing, the pressure chamber is fixed on the platform, while stress loading and unloading in the horizontal directions are achieved by the lateral servo pump system. Since rigid loading is adopted, rotating staggered loading pads were specially designed to ensure full contact between the specimen and the pads and to reduce stress concentration at the edges and corners. This design guarantees continuous close contact between the specimen surfaces and the loading pads throughout the test. In addition, holes and grooves were machined on the pad surfaces to reserve installation positions for the AE sensors, as shown in Figure 3.

2.2.2. AE Acquisition System

An AE monitoring system (PCI-2, Physical Acoustics Corporation, Princeton, NJ, USA) was employed to acquire characteristic AE parameters during the loading process of the coal specimens, including AE counts, energy, amplitude, duration, and rise time. The monitoring system is equipped with eight selectable parametric channels, each with an 18-bit analog-to-digital converter, and has an operating frequency range of 1 kHz to 3 MHz. Under software control, four high-pass filters and six low-pass filter ranges can be selected. Six AE sensors (NANO-30, Physical Acoustics Corporation, Princeton, NJ, USA) were attached to the specimen surfaces using a dedicated coupling agent to ensure good contact between the sensors and the specimens. Each sensor was positioned 25 mm from both the upper and lower end surfaces of the specimen, thereby forming a three-dimensional monitoring network covering the specimen surface (see Figure 3). The main technical parameter settings of the AE monitoring system are listed in Table 2.
Three-dimensional AE source localization was performed using a homogeneous and isotropic P-wave velocity model. A constant P-wave velocity of 1704.96 m/s, obtained from the average pre-test ultrasonic velocity of the selected specimens, was applied in all three spatial directions and throughout the loading–unloading process. The bedding planes were approximately parallel to the top and bottom surfaces of the specimens.

2.3. Stress Path Design and Testing Procedure

During mining, coal pillars are subjected to combined stress disturbances induced by overburden loading, working-face extraction, and stress redistribution in adjacent panels. Therefore, the actual stress environment of coal pillars should be considered in the experimental design. Based on their mining conditions and functions, coal pillars can be classified as section pillars or boundary pillars. Section pillars are affected by repeated mining on both sides, resulting in horizontal double-face unloading and vertical loading or unloading caused by overburden movement. Boundary pillars are mainly subjected to horizontal single-face unloading induced by extraction on one side, together with overburden loading and unloading disturbances.
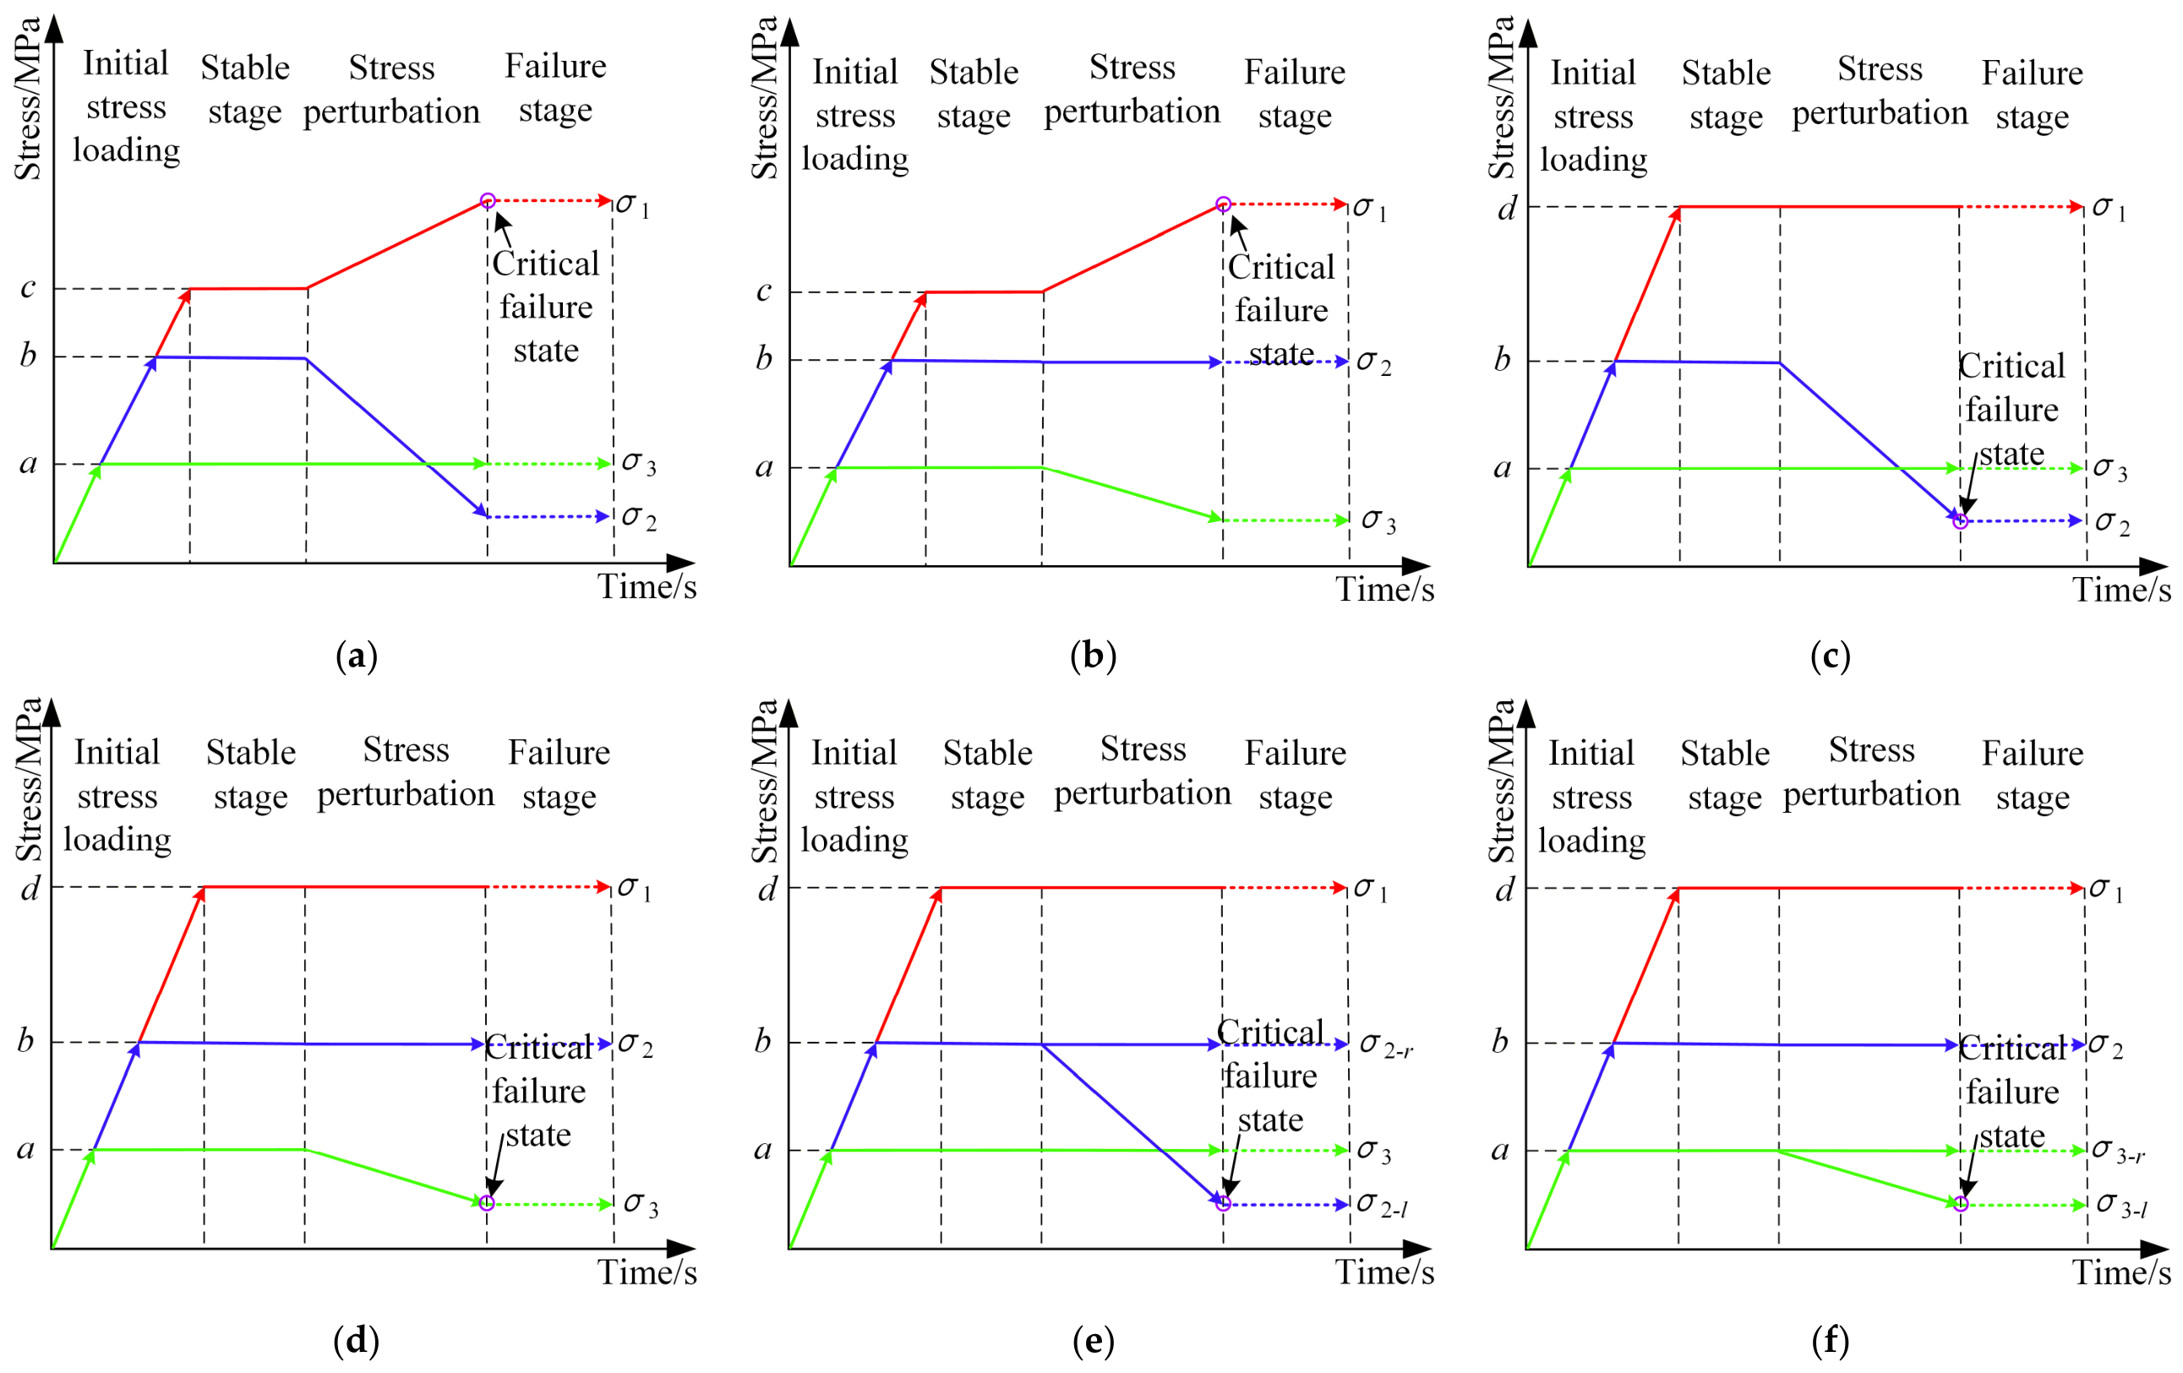
To simulate these conditions, six true triaxial stress paths were designed in three categories: bidirectional loading–unloading, double-face unloading, and single-face unloading. The schematic diagrams of the stress paths are shown in Figure 4, and the corresponding initial stress states and loading schemes are listed in Table 3. In all tests, the minimum principal stress and intermediate principal stress were set to 9 MPa and 12 MPa, respectively. For the unloading tests, the initial value of σ1 was set to 42 MPa, corresponding to 80% of the peak strength obtained from conventional true triaxial loading tests, to ensure specimen failure during unloading. Because single-face loading–unloading would require a relatively high initial vertical load to balance the lateral pressure after unloading on one face, only single-face unloading tests were considered for this condition.
The test procedure comprised four stages: initial stress loading, stress stabilization, stress perturbation, and failure. The tests were performed with reference to the methods recommended by the International Society for Rock Mechanics (ISRM) [41].
(1)
Initial stress loading stage: AE sensors were mounted on the loading pads, and the specimen was placed in the true triaxial pressure chamber. A clamping force of 2 kN was first applied to each face. The three principal stresses were then synchronously increased to the target initial stress state at a rate of 0.05 MPa/s.
(2)
Stable stage: After the target initial stress state was reached, all principal stresses were kept constant for 5 min.
(3)
Stress perturbation stage: For the bidirectional loading–unloading tests, σ2 (or σ3) was kept constant, while σ1 was increased and σ3 (or σ2) was unloaded simultaneously until failure. For the double-face unloading tests, σ1 and σ2 (or σ3) were kept constant, while σ2 (or σ3) was unloaded until failure. For the single-face unloading tests, the stresses on both σ1 faces, both σ2 (or σ3) faces, and one σ3 (or σ2) face were kept constant, while the stress on the other face in the σ2 (or σ3) direction was unloaded. This stage was stress-controlled, with both loading and unloading conducted at a rate of 0.1 MPa/s.
(4)
AE monitoring: The AE monitoring system was activated at the beginning of the stress perturbation stage to continuously record the AE signals generated during crack initiation, propagation, and failure. The test was terminated after specimen failure.
The volumetric strain, εv, was calculated as the sum of the three principal strains:
εv = ε1 + ε2 + ε3
where ε1, ε2, and ε3 denote the normal strains in the σ1, σ2, and σ3 directions, respectively. Compressive strain was defined as positive, whereas extensional strain was defined as negative. Accordingly, positive εv represents volumetric contraction, while negative εv represents volumetric dilation.

3. Macromechanical Behavior and Failure Modes of Coal Specimens Under True Triaxial Loading–Unloading Paths

3.1. Stress–Strain–Time Characteristics of Coal Specimens Under Bidirectional Loading–Unloading Paths

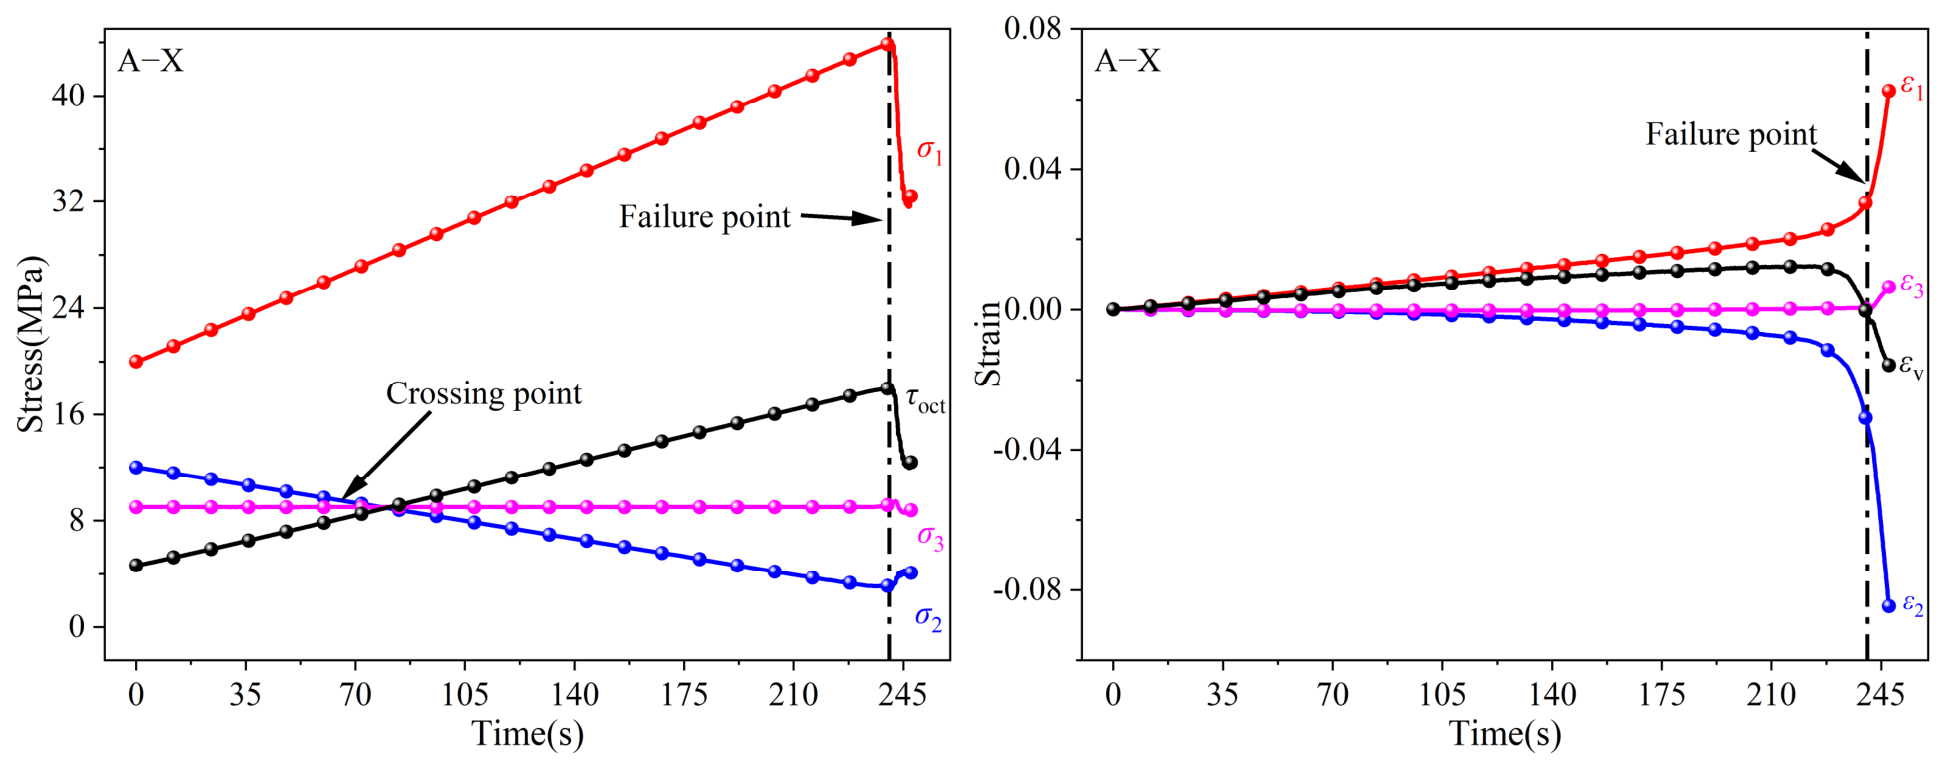
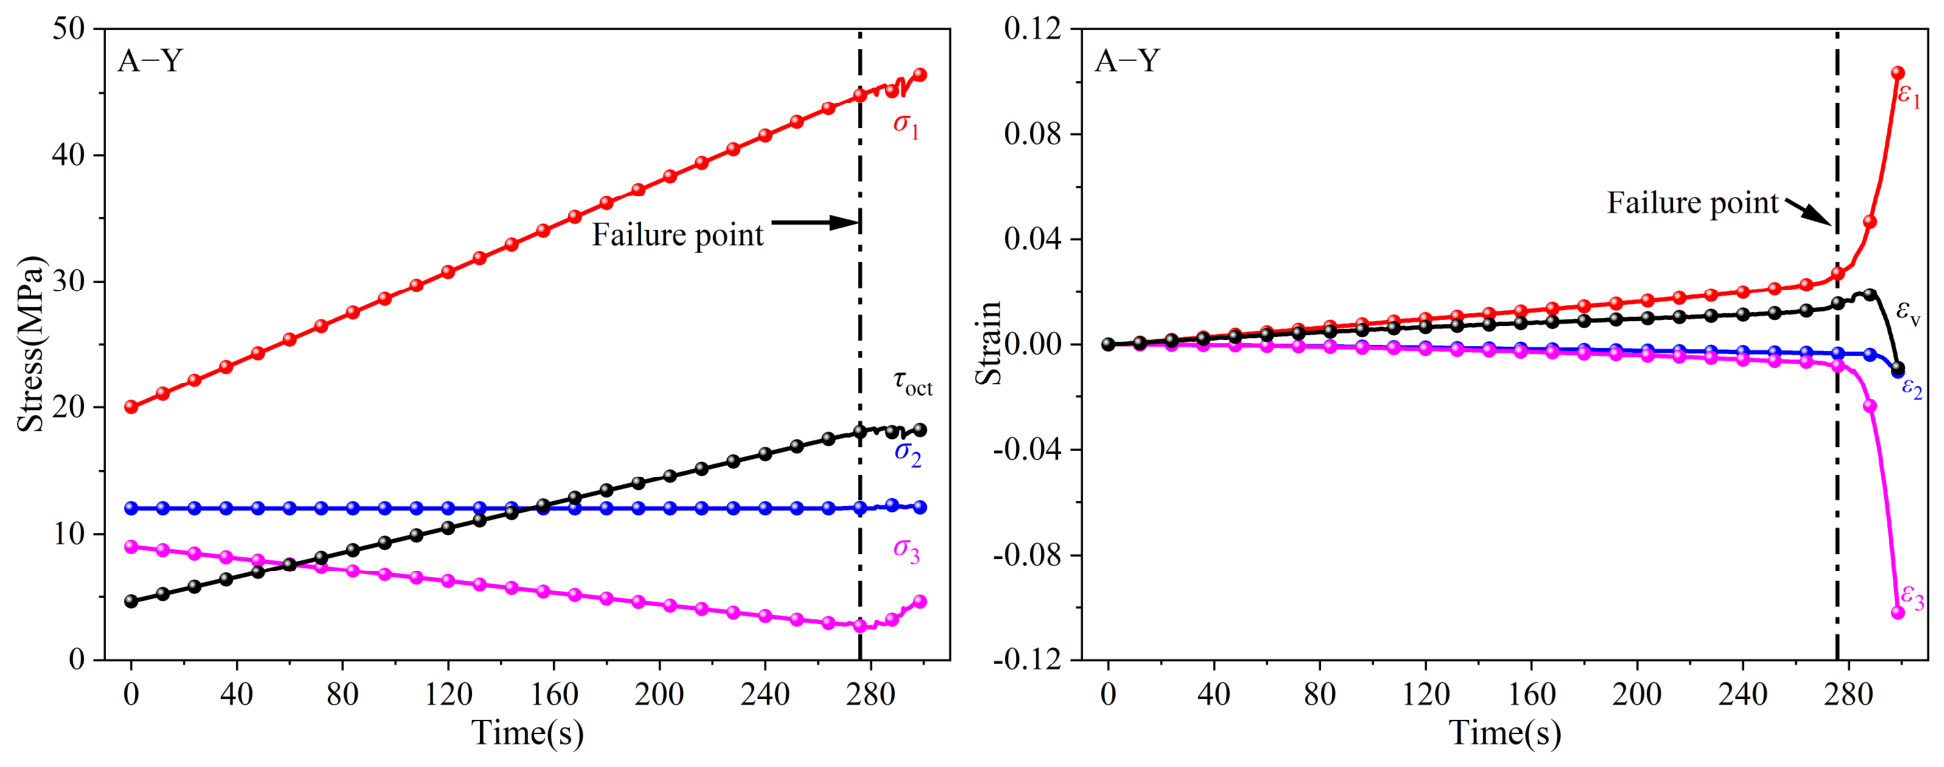
Figure 5 and Figure 6 present the stress–time and strain–time responses of coal specimens under the A-X and A-Y paths during bidirectional loading–unloading. In both tests, data acquisition began at the start of unloading. The recorded response comprised two successive stages: stress perturbation and unstable failure. The stress evolution in both paths was consistent with the prescribed loading–unloading scheme. Along the A-X path, σ1 increased continuously, σ2 decreased progressively, and σ3 remained nearly constant, whereas along the A-Y path, σ1 increased continuously, σ3 decreased progressively, and σ2 remained nearly constant. In both cases, τoct increased steadily until failure. For the A-X path, σ2 crossed σ3 at approximately 78 s, and failure occurred when σ1 reached 43.92 MPa and σ2 dropped to 3.08 MPa. For the A-Y path, failure occurred later, with σ1 reaching 44.80 MPa and σ3 decreasing to 2.67 MPa. After failure, both paths showed stress fluctuations, characterized by a rapid drop in the loading-direction stress and a synchronous decrease in τoct. The strain responses also showed clear stage-dependent characteristics. Before failure, the principal strains changed gradually, whereas abrupt variations appeared as failure approached. In the A-X path, ε1 increased continuously, ε2 decreased progressively, and ε3 remained relatively small; near failure, ε2 exhibited a pronounced increase in absolute value. In the A-Y path, ε1 increased gradually and accelerated before failure, while ε3 showed a sharper abrupt change than ε2 in the A-X path. Overall, both paths exhibited gradual pre-failure deformation followed by accelerated strain evolution near failure, but differed in failure time, peak stress, and unloading-direction strain response. Compared with the A-X path, the A-Y path showed a longer stable evolution stage, a higher peak σ1, and a stronger unloading-direction strain response.

3.2. Stress–Strain–Time Characteristics Under Unidirectional Double-Face Unloading

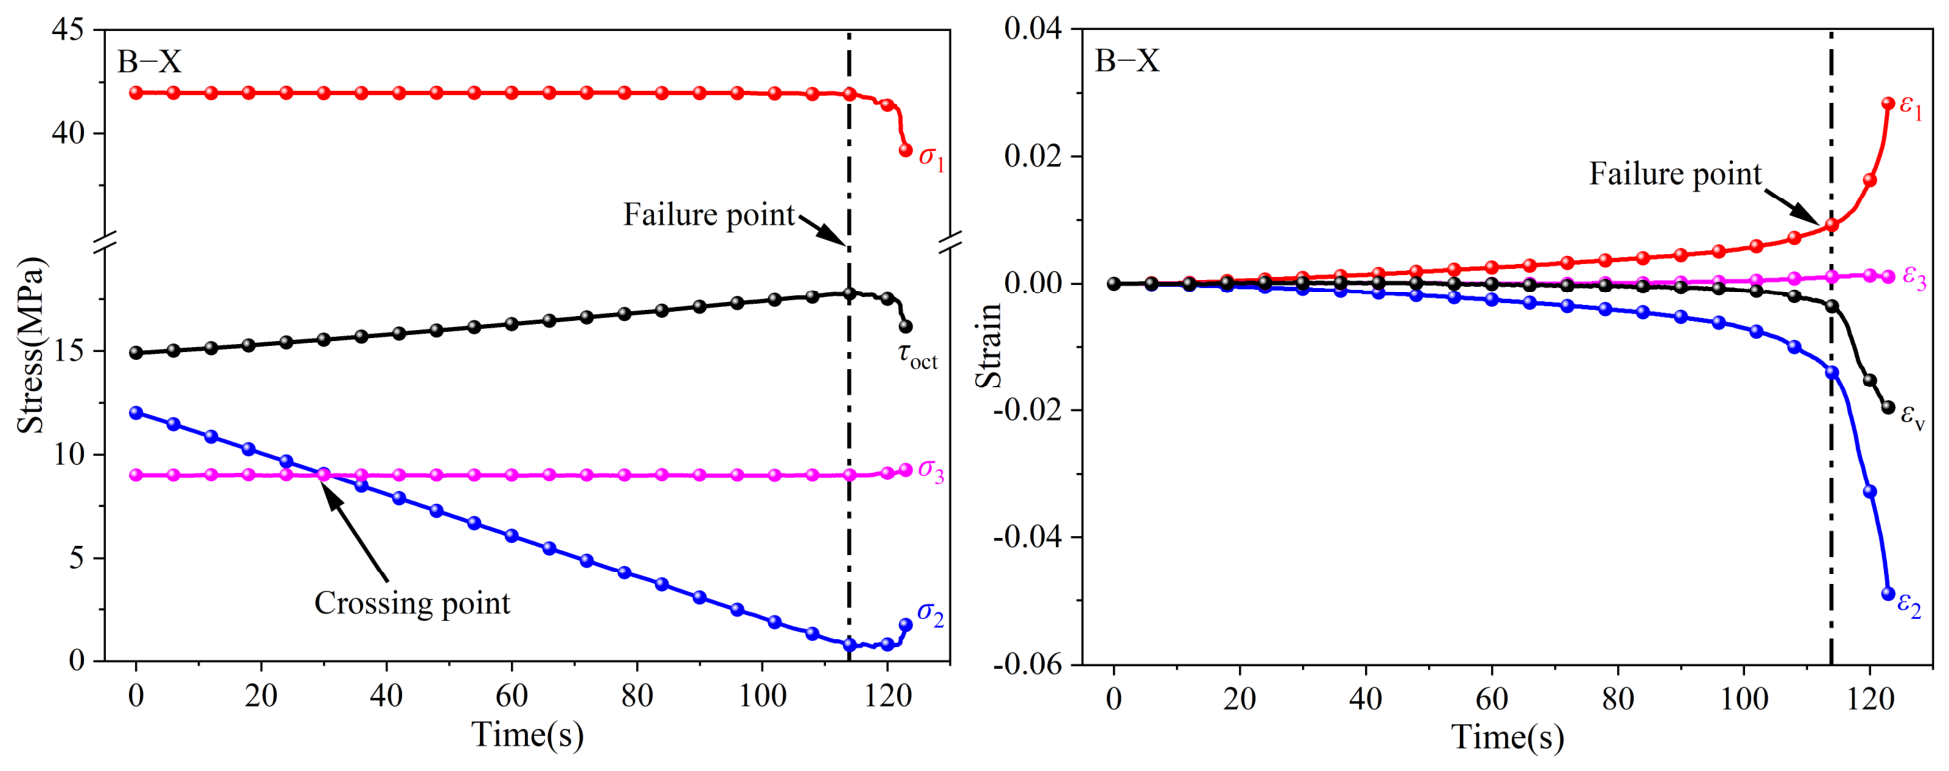
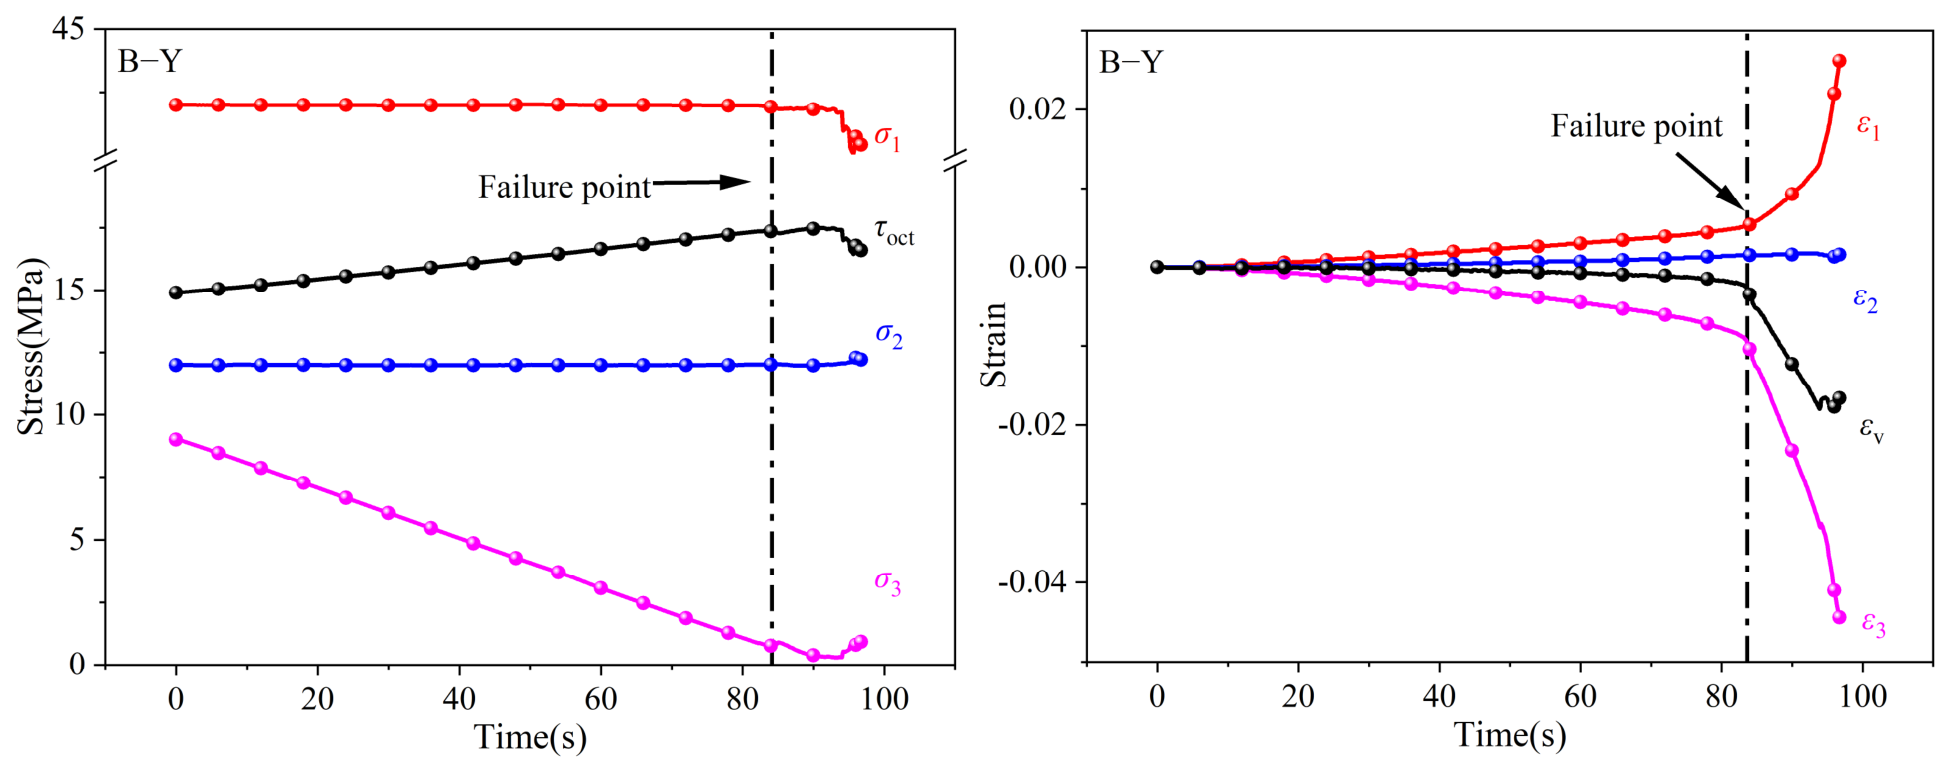
Figure 7 and Figure 8 present the stress–time and strain–time responses of coal specimens under the B-X and B-Y paths during unidirectional double-face unloading. When the initial maximum principal stress, σ1, was set to approximately 80% of the peak strength obtained from the conventional true triaxial loading tests, both specimens underwent unstable failure as σ2 or σ3 was progressively unloaded. In both paths, the stress evolution followed the prescribed loading path, and τoct increased continuously until failure. Along the B-X path, σ1 remained constant, σ2 decreased progressively, and σ3 remained nearly constant; σ2 crossed σ3 during unloading and dropped to approximately 0.32 MPa at failure. Along the B-Y path, σ1 remained constant, σ3 decreased continuously, and σ2 remained nearly constant, with σ3 decreasing to approximately 0.63 MPa near failure. After failure, both paths exhibited stress fluctuations, characterized by a slight reduction in σ1, a minor rebound in the unloading-direction stress, and a synchronous decrease in τoct. The strain responses also showed clear stage-dependent characteristics. Before failure, the principal strains evolved gradually, whereas abrupt acceleration occurred as failure approached. Along the B-X path, ε1 increased slowly, ε2 decreased continuously, and ε3 showed only limited variation, with ε2 exhibiting the largest increase in absolute magnitude near failure. Along the B-Y path, ε1 also increased progressively, whereas ε3 displayed a more pronounced abrupt change around failure. Overall, both paths exhibited gradual pre-failure evolution, accelerated strain development near failure, and rapid post-failure instability. Differences were mainly reflected in the failure timing and the unloading-direction strain response: the B-Y path failed earlier and showed a stronger abrupt strain response, whereas the B-X path was characterized by the crossover of σ2 and σ3 and a relatively delayed failure.

3.3. Stress–Strain–Time Characteristics Under Unidirectional Single-Face Unloading

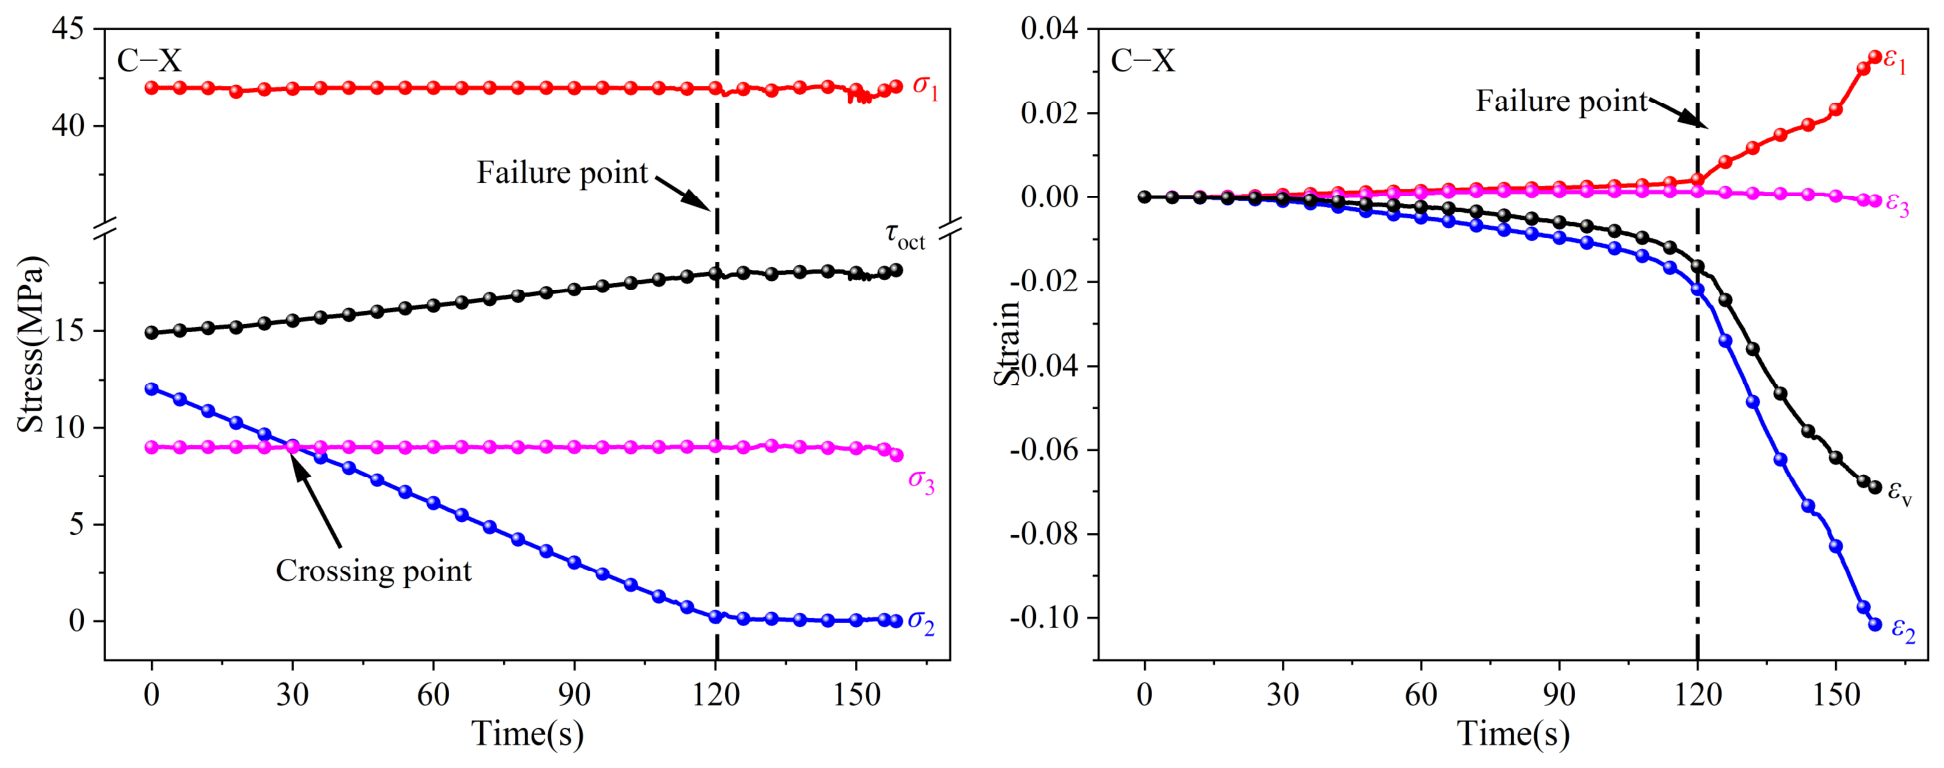
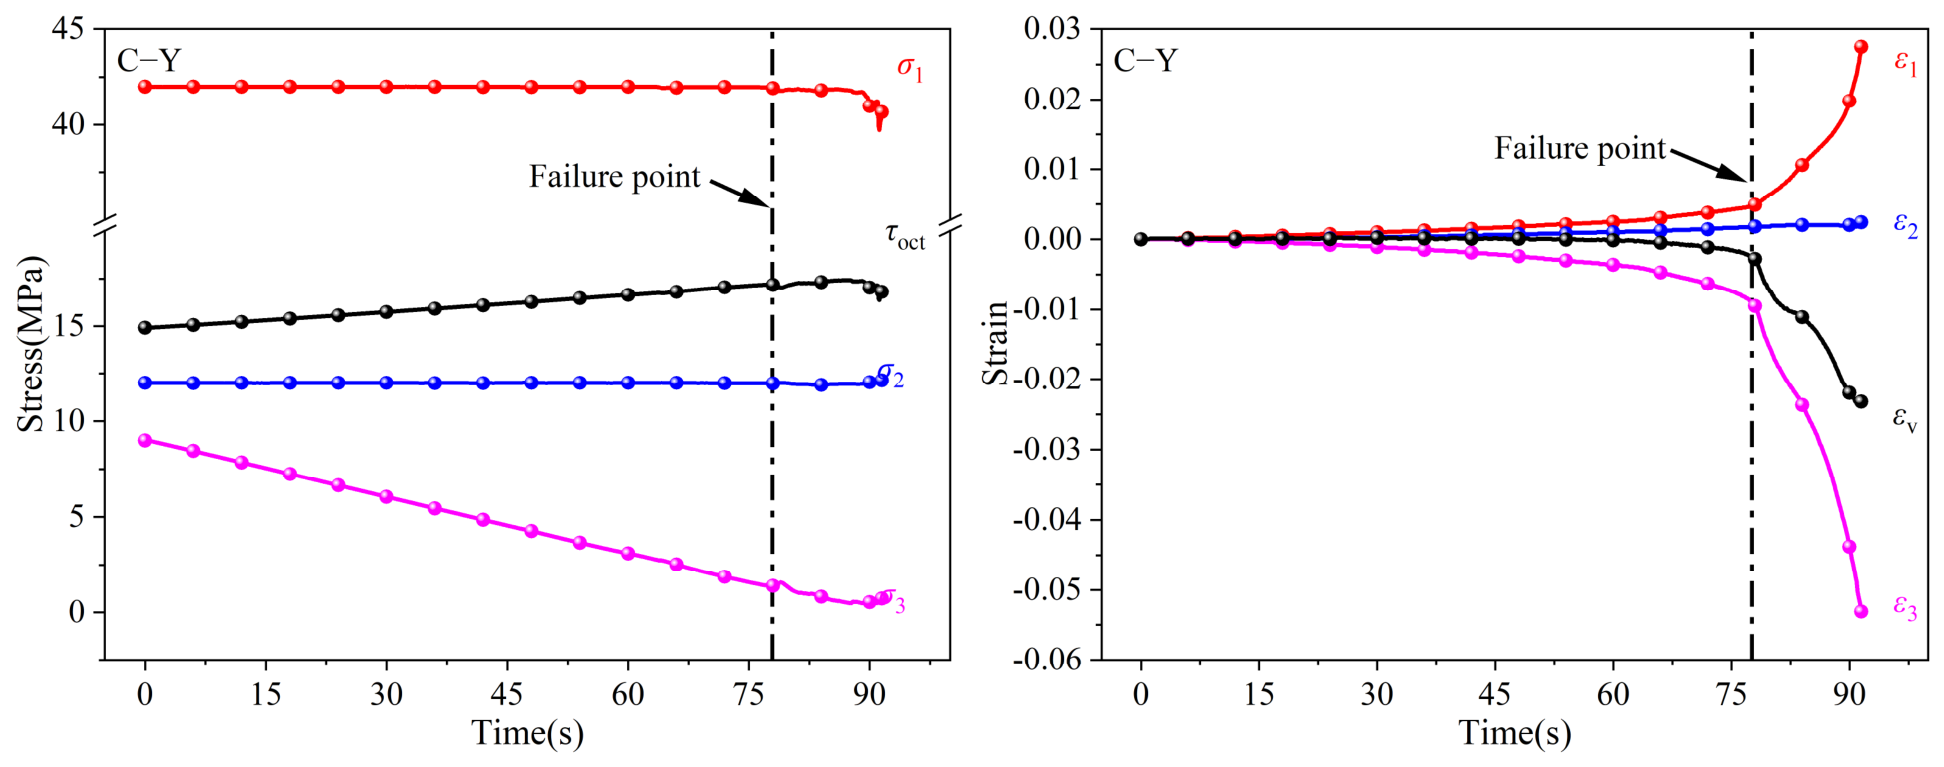
Figure 9 and Figure 10 present the stress–time and strain–time responses of coal specimens under the C-X and C-Y paths during single-sided unloading. In both paths, the principal stresses evolved steadily along the prescribed paths before failure, and τoct increased continuously until failure occurred. Along the C-X path, σ1 remained nearly constant, σ2 decreased progressively, and σ3 remained nearly constant; σ2 crossed σ3 during unloading and approached zero near failure. Along the C-Y path, σ1 remained nearly constant, σ3 decreased continuously, and σ2 remained nearly constant; failure occurred when σ3 decreased to approximately 1.40 MPa, earlier than under the C-X path. After failure, both paths exhibited stress fluctuations, characterized by a decrease in the loading-direction stress, a transition of the unloading-direction stress from continuous decline to slight fluctuation or minor rebound, and a synchronous decrease in τoct. The strain responses also showed clear stage-dependent characteristics. Before failure, the principal strains changed gradually, whereas accelerated abrupt changes appeared near failure. Along the C-X path, ε1 increased slowly, ε2 decreased continuously, and ε3 changed only slightly; after failure, ε2 decreased rapidly, finally reaching about −0.102. Along the C-Y path, ε1 also increased progressively, while ε3 decreased rapidly near failure and continued to develop after failure, finally reaching about −0.053, whereas ε2 changed only slightly. Overall, both paths exhibited unstable failure under continuous reduction of the unloading-direction stress, and the unloading-direction strain showed the most pronounced post-failure response. Compared with the C-X path, the C-Y path failed earlier and showed faster post-failure stress adjustment, whereas the C-X path exhibited a larger absolute unloading-direction strain.

3.4. Macroscopic Fracture Characteristics and Fractal Characterization

3.4.1. Macroscopic Fracture Morphology

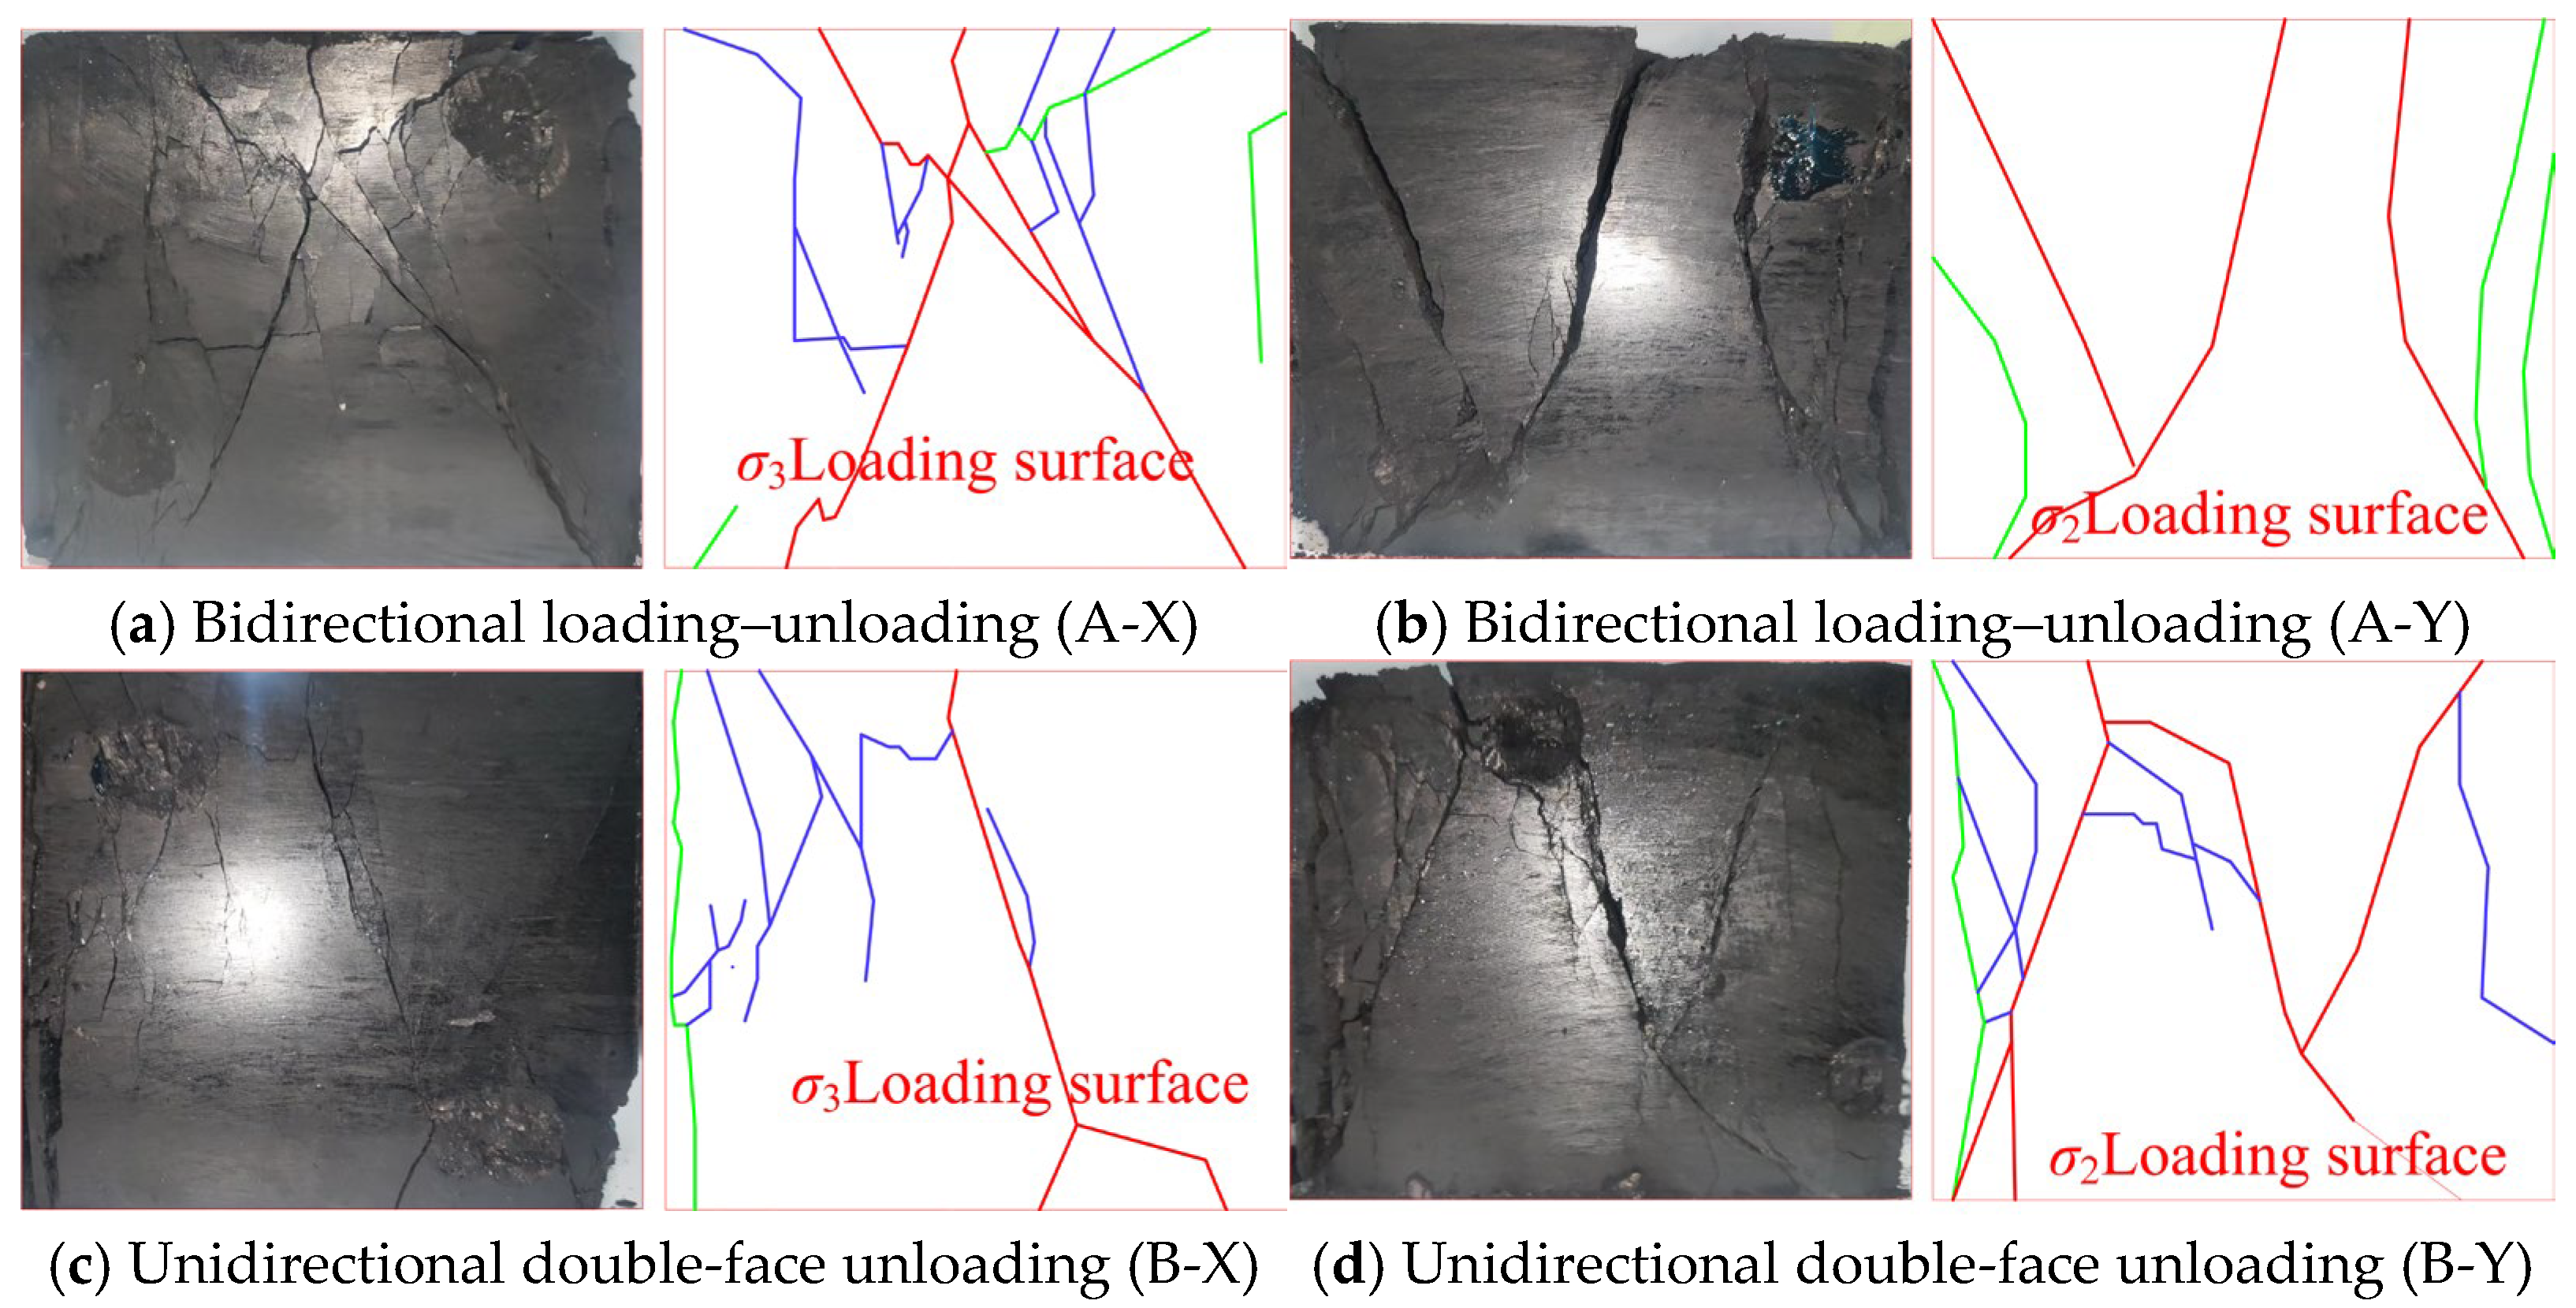
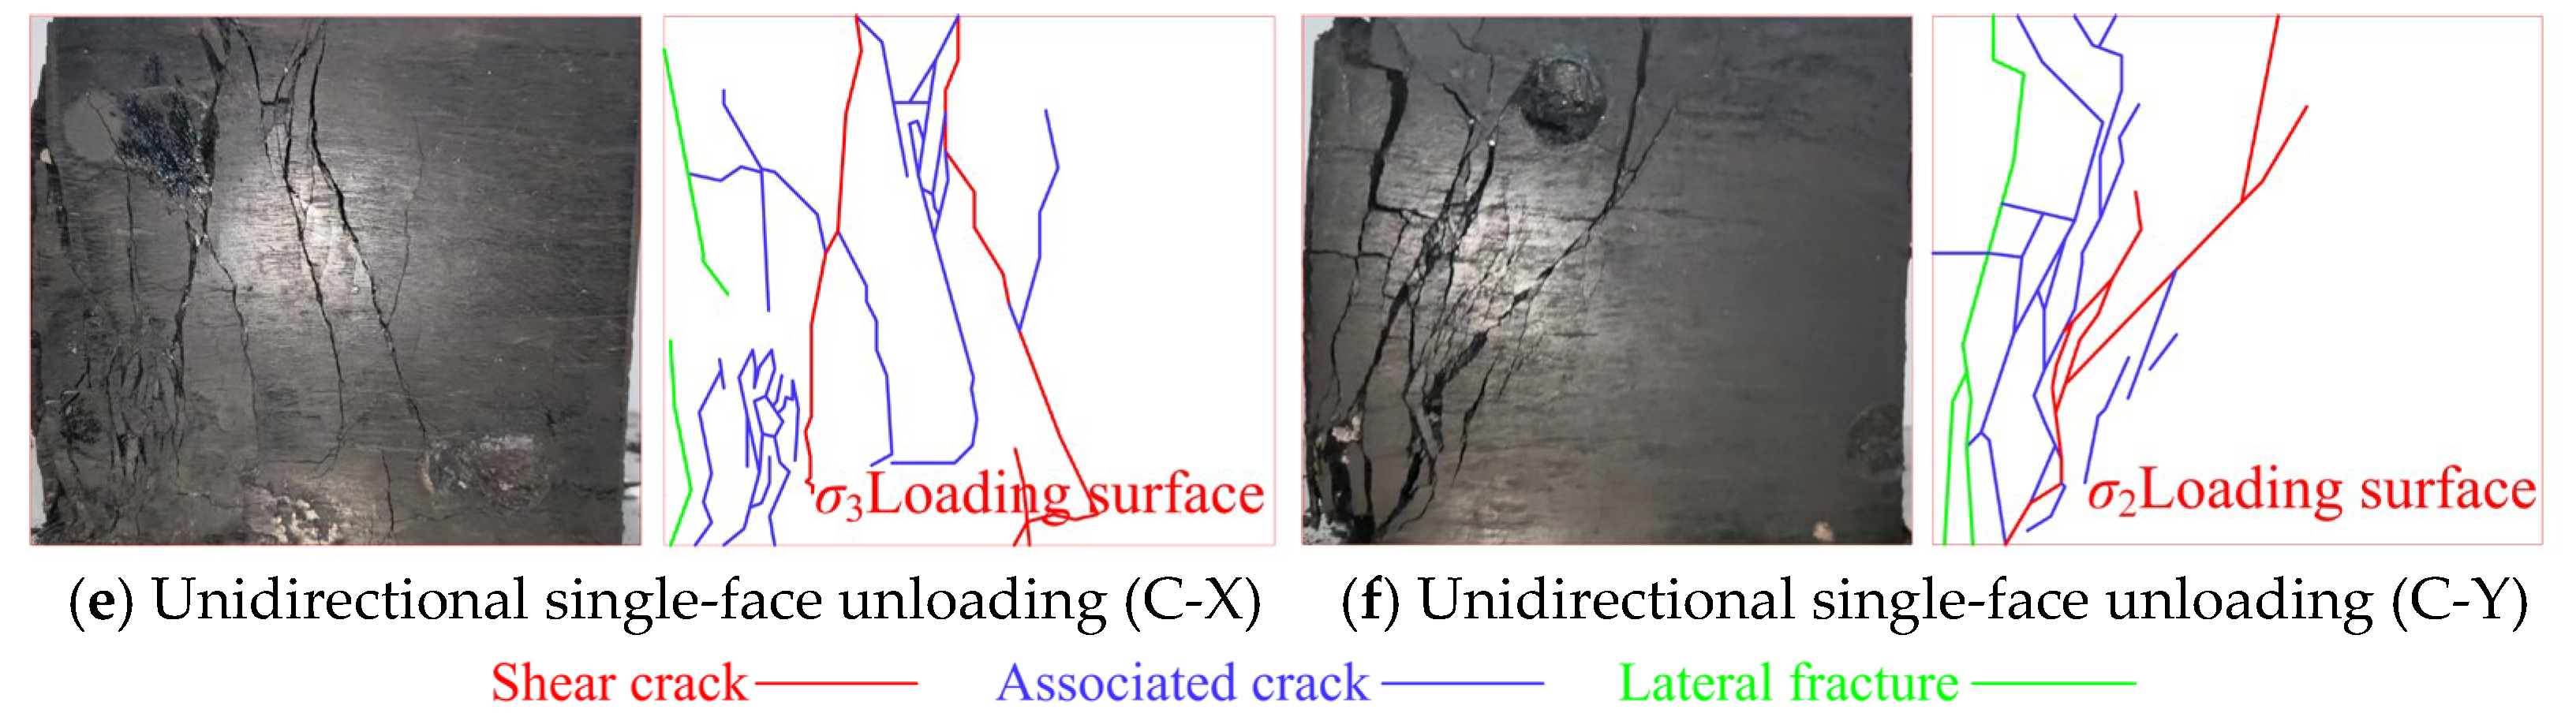
Macroscopic surface fractures provide visible evidence of internal crack propagation and coalescence. Their distribution also helps identify deformation localization and instability mechanisms. The macroscopic failure patterns of the coal specimens under the six stress paths are shown in Figure 11.
The macroscopic failure patterns of the bidirectional loading–unloading tests are shown in Figure 11a,b. Overall, the specimens exhibited predominantly shear failure, with distinct oblique principal fractures developing on their surfaces, locally exhibiting “V”-shaped or nearly “X”-shaped through-going characteristics. Compared with the A-Y path, the A-X path produced more secondary cracks and a more dispersed fracture distribution, whereas the opening of the principal fracture was smaller, indicating that failure under unloading of σ2 was more abrupt. In contrast, the A-Y path was characterized by more pronounced opening of the principal fracture and a more concentrated fracture zone, suggesting that unloading of σ3 more readily promoted the formation of directionally propagated dominant fractures. Figure 11c,d, shows the failure patterns under the unidirectional double-face unloading condition. The coal specimens were still dominated by shear failure; however, the opening of the principal fractures was smaller than that under bidirectional loading–unloading, while the number of secondary cracks between adjacent fractures increased markedly, indicating that the failure mode shifted from single shear failure to tensile-shear composite failure. A comparison between B-X and B-Y shows that fracture branching and intersection were more developed in the B-Y path, resulting in a more complex surface fracture network. By contrast, the B-X path exhibited fewer fractures and a smaller fracture distribution range, indicating a lower degree of macroscopic damage. Figure 11e,f, presents the results for the unidirectional single-face unloading paths. No typical through-going brittle shear plane was observed on the specimen surface. Instead, fractures were mainly concentrated in a local region adjacent to the unloading face, accounting for approximately one-half of the loaded surface, and were dominated by tensile cracks and associated secondary cracks. Under the C-X path, more secondary cracks were generated and local fracture branching was more obvious. Under the C-Y path, the principal fracture was more concentrated and showed a larger opening, indicating more pronounced local tensile failure.
Under different loading–unloading paths, the surface fracture distribution of the coal specimens exhibited clear directionality, and the fracture propagation direction was closely related to the lateral unloading direction. For all six stress paths, volumetric expansion at failure was more pronounced in the unloading direction, and the macroscopic fractures mainly propagated along the laterally constant-loaded surfaces. When σ2 was unloaded laterally, the macroscopic fracture planes were generally parallel to the σ3 direction and gradually penetrated the two end faces subjected to σ3. When σ3 was unloaded, a corresponding reorientation of the fracture pattern was observed. Combined with the three-dimensional stress evolution paths, these results indicate that surface fracture propagation under unloading conditions was jointly controlled by the unloading direction and the direction of minimum constraint.

3.4.2. Quantitative Characterization of Macroscopic Fracture Parameters

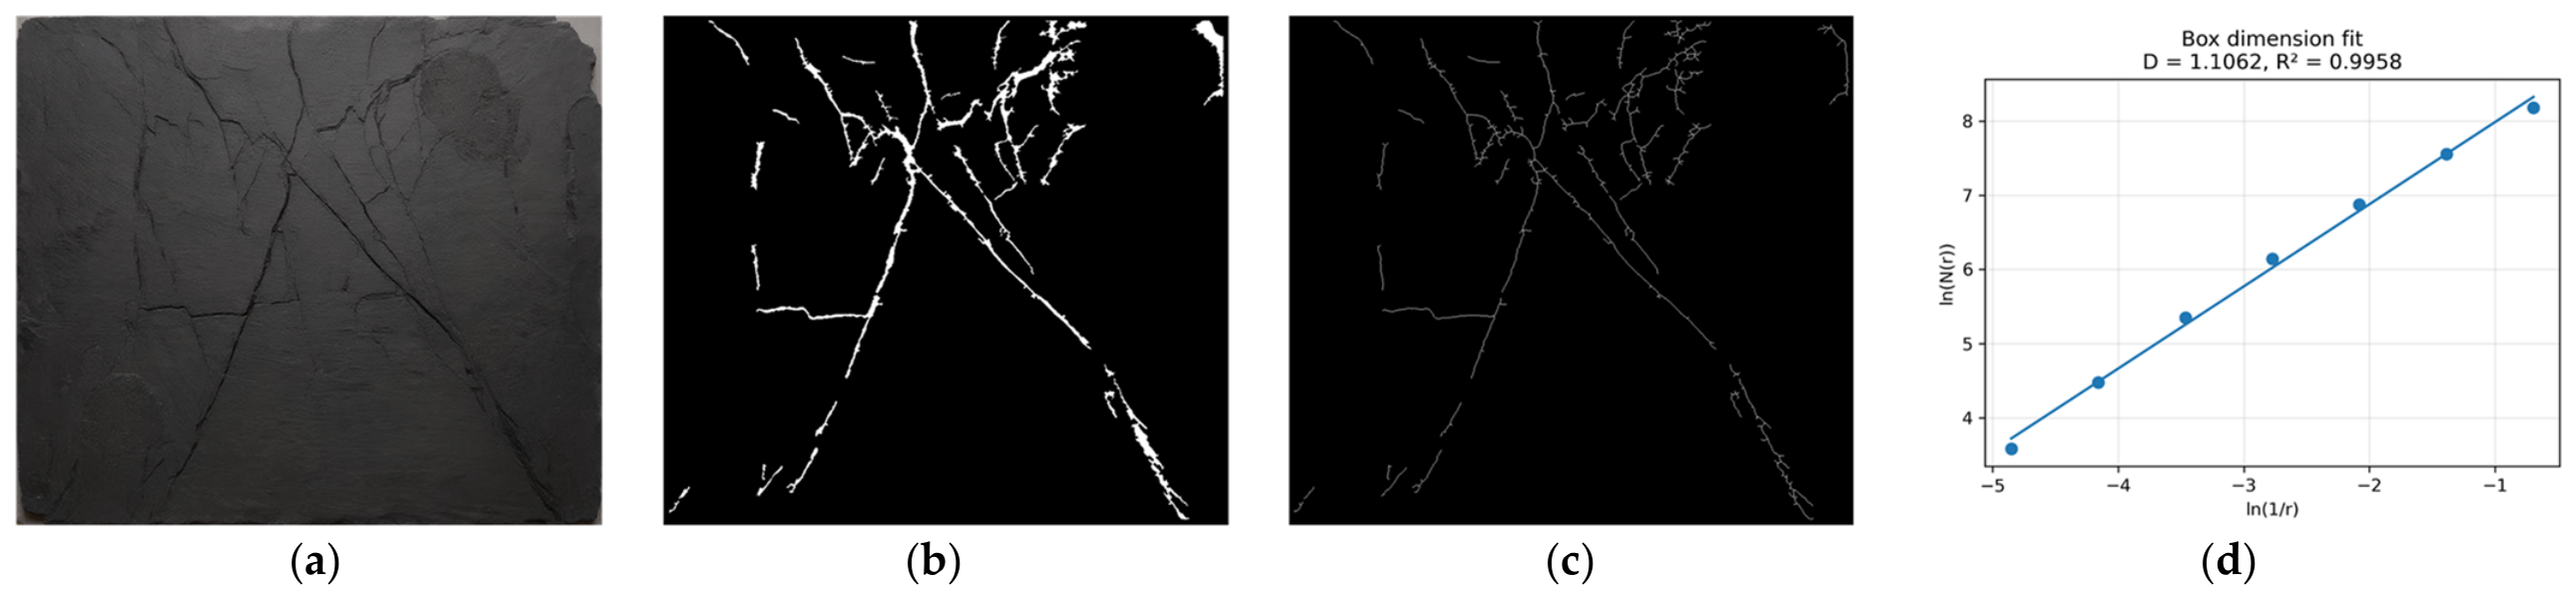
Three parameters were used to quantify the geometry of the macroscopic surface-fracture networks under different loading–unloading paths: fractal dimension D, fracture area ratio Ra, and equivalent fracture width We. These three parameters were all obtained through statistical analysis based on image recognition techniques. The images were first preprocessed to remove specular highlights caused by flash illumination. They were then binarized, and the fracture regions were skeletonized. This procedure produced the three image types used for fracture characterization. An example of the processing procedure is shown in Figure 12.
The box-counting method was employed to characterize the fractal features of the fracture skeleton images [42]. Specifically, square grids with a side length of r were superimposed on the fracture skeleton image, and the number of grids containing fracture pixels, N(r), was counted. As the box size r varies, the fractal dimension D reflects the geometric complexity of the fracture network. A larger D indicates a more developed fracture branching pattern and a more complex spatial distribution. The relationship between N(r) and r follows a power-law form:
N ( r ) r D
Taking the logarithm of both sides yields:
l o g N ( r ) = D l o g r + C
where D is the fractal dimension of the fractures and C is a constant. A linear fitting was performed between logr and logr, and the absolute value of the fitted slope was taken as the fractal dimension D.
Based on the binary fracture images, the fracture pixel area and the total area of the unified analysis region were statistically calculated. The fracture area ratio (Ra) is defined as the ratio of the fracture pixel area to the total area of the unified analysis region. This parameter reflects the extent of fracture coverage on the specimen surface; a larger value indicates a greater surface damage range. The calculation formula is as follows:
R a = A f A t × 100 %
where Af is the total pixel area of the fracture region, and At is the total pixel area of the analysis region.
The equivalent fracture width We was used to characterize the overall opening degree of the fractures. This parameter essentially represents the average opening level of the fracture network; a larger value indicates a more pronounced opening of the dominant fractures and a stronger concentration of local damage. In the calculation, the binary fracture image was first skeletonized to obtain the total fracture skeleton length, Ls. The equivalent fracture width We was then defined as the ratio of the total fracture area to the total skeleton length, i.e.,
W e = A f L s
where We is the equivalent fracture width, Af is the total pixel area of the fracture region, and Ls is the total length of the fracture skeleton.
Because the original surface photographs contained regions affected by specular reflection, the images were first preprocessed using the Crack Image Analysis System module in MATDEM (version 5.0). Subsequent fracture segmentation and quantitative analysis were performed using Python (version 3.10.20), OpenCV (version 4.10.0), and scikit-image (version 0.25.2).For the A-X, B-X, B-Y, C-X, and C-Y images, dark fracture features were enhanced using Gaussian background subtraction. The normalized fracture response was calculated as
R ( x , y ) = N o r m G σ I ( x , y ) I ( x , y )
where I(x,y) is the grayscale image and Gσ denotes Gaussian filtering. Pixels satisfying R(x,y) > T were identified as fracture pixels. The selected threshold values were 27, 29, 34, 31, and 31 for A-X, B-X, B-Y, C-X, and C-Y, respectively.
For the A-Y image, the specimen mask was determined using Otsu’s method. After glare correction and contrast-limited adaptive histogram equalization, fracture features were enhanced by combining multi-oriented top-hat responses with a local dark-feature response. The segmentation threshold was defined as the 89th percentile of the enhanced response within the valid specimen region. The resulting binary images were processed using morphological opening and closing, small-hole removal, connected-component filtering, and one-pixel-wide skeletonization.
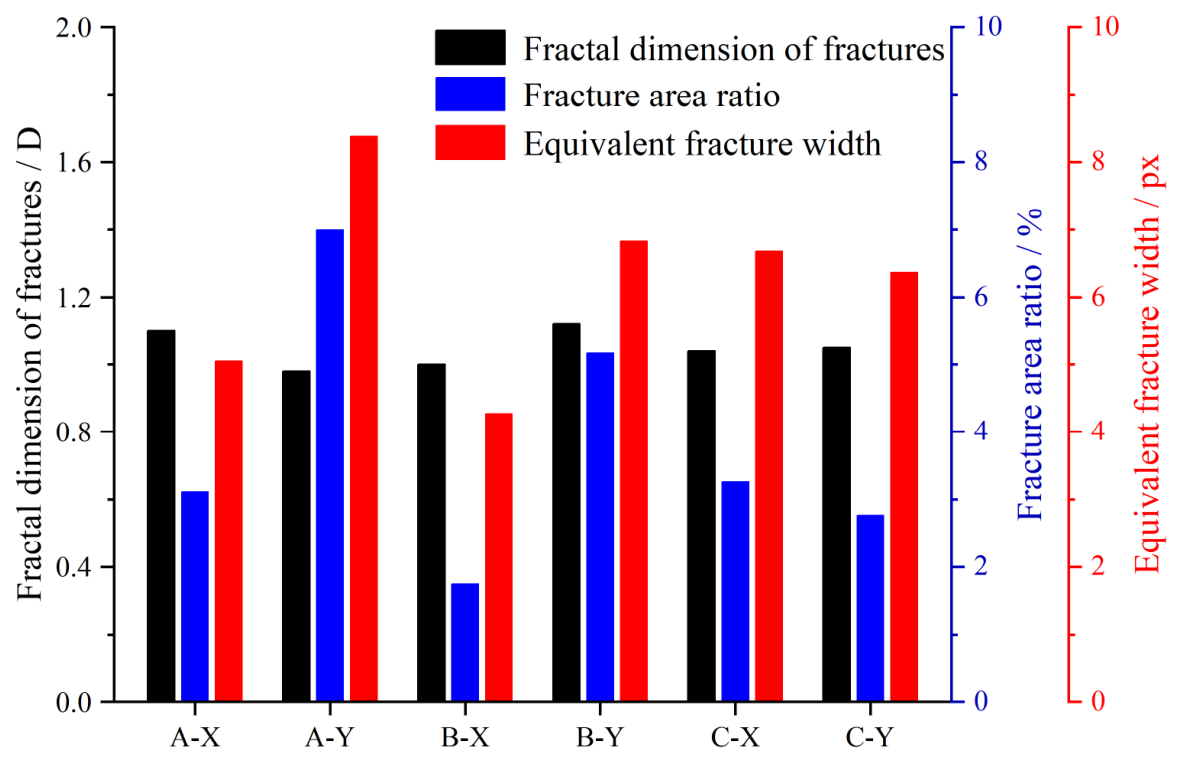
As shown in Figure 13, the fractal dimension D, fracture area ratio Ra, and equivalent fracture width We of the macroscopic surface fractures of the coal specimens differ significantly among the six stress paths, indicating that different paths exert different effects on fracture complexity, surface damage extent, and the opening degree of dominant fractures.
The fractal analysis results show that the B-Y path has the highest fractal dimension, indicating that fracture branching, deflection, and intersection are more developed and that the fracture network exhibits the greatest geometric complexity. The A-Y path shows the largest fracture area ratio and equivalent fracture width, suggesting that dominant fractures propagate and open more fully under this path, resulting in the most pronounced surface damage. In contrast, the B-X path exhibits relatively low values for all three parameters, indicating a limited degree of macroscopic fracture development and a relatively small surface damage range. The A-X path has a higher fractal dimension than A-Y, but lower fracture area ratio and equivalent fracture width, indicating that although its fracture morphology is more complex, the opening degree of dominant fractures and the overall damage extent are relatively constrained. The C-X and C-Y paths both exhibit intermediate values of the three parameters, reflecting a transitional failure pattern characterized by both fracture complexity and fracture opening.
Overall, the A-Y path corresponds to a concentrated failure mode dominated by dominant-fracture opening, whereas the B-Y path corresponds to an extensive failure mode dominated by increasing fracture-network complexity. By contrast, the B-X path exhibits relatively weak macroscopic damage. These results indicate that the evolution of surface fractures in coal specimens under different stress paths is controlled not only by the propagation of dominant fractures but also by fracture branching and network development. Together, fractal dimension, fracture area ratio, and equivalent fracture width provide complementary descriptions of macroscopic failure behavior.

4. Damage and Destruction of Coal Samples and Characteristics of AE Response

4.1. AE Response Characteristics of Coal Samples Under Unloading and Loading Stress Paths

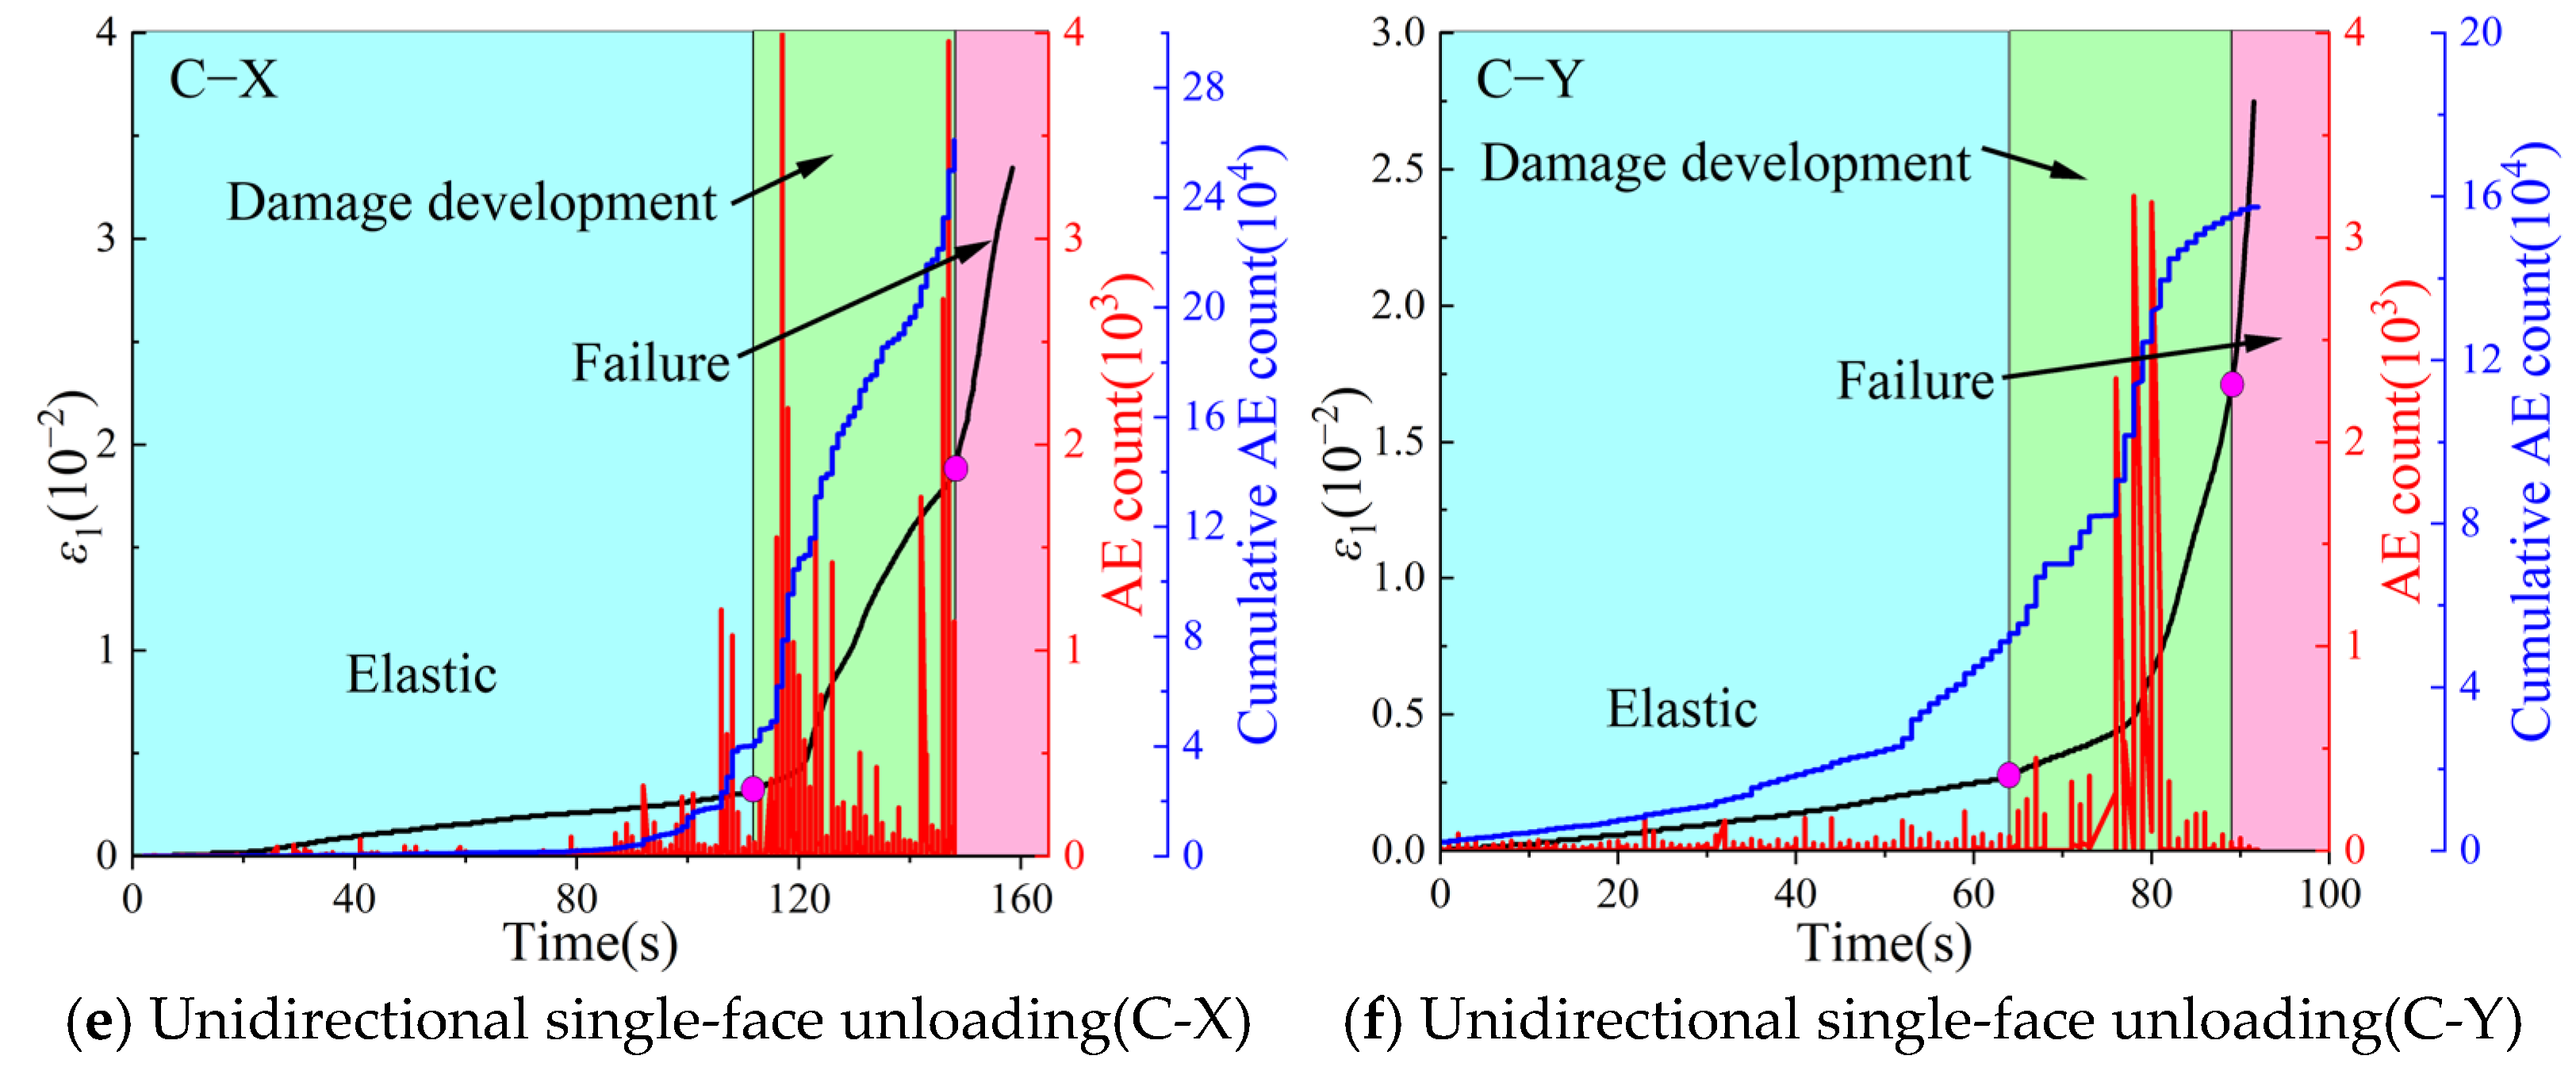
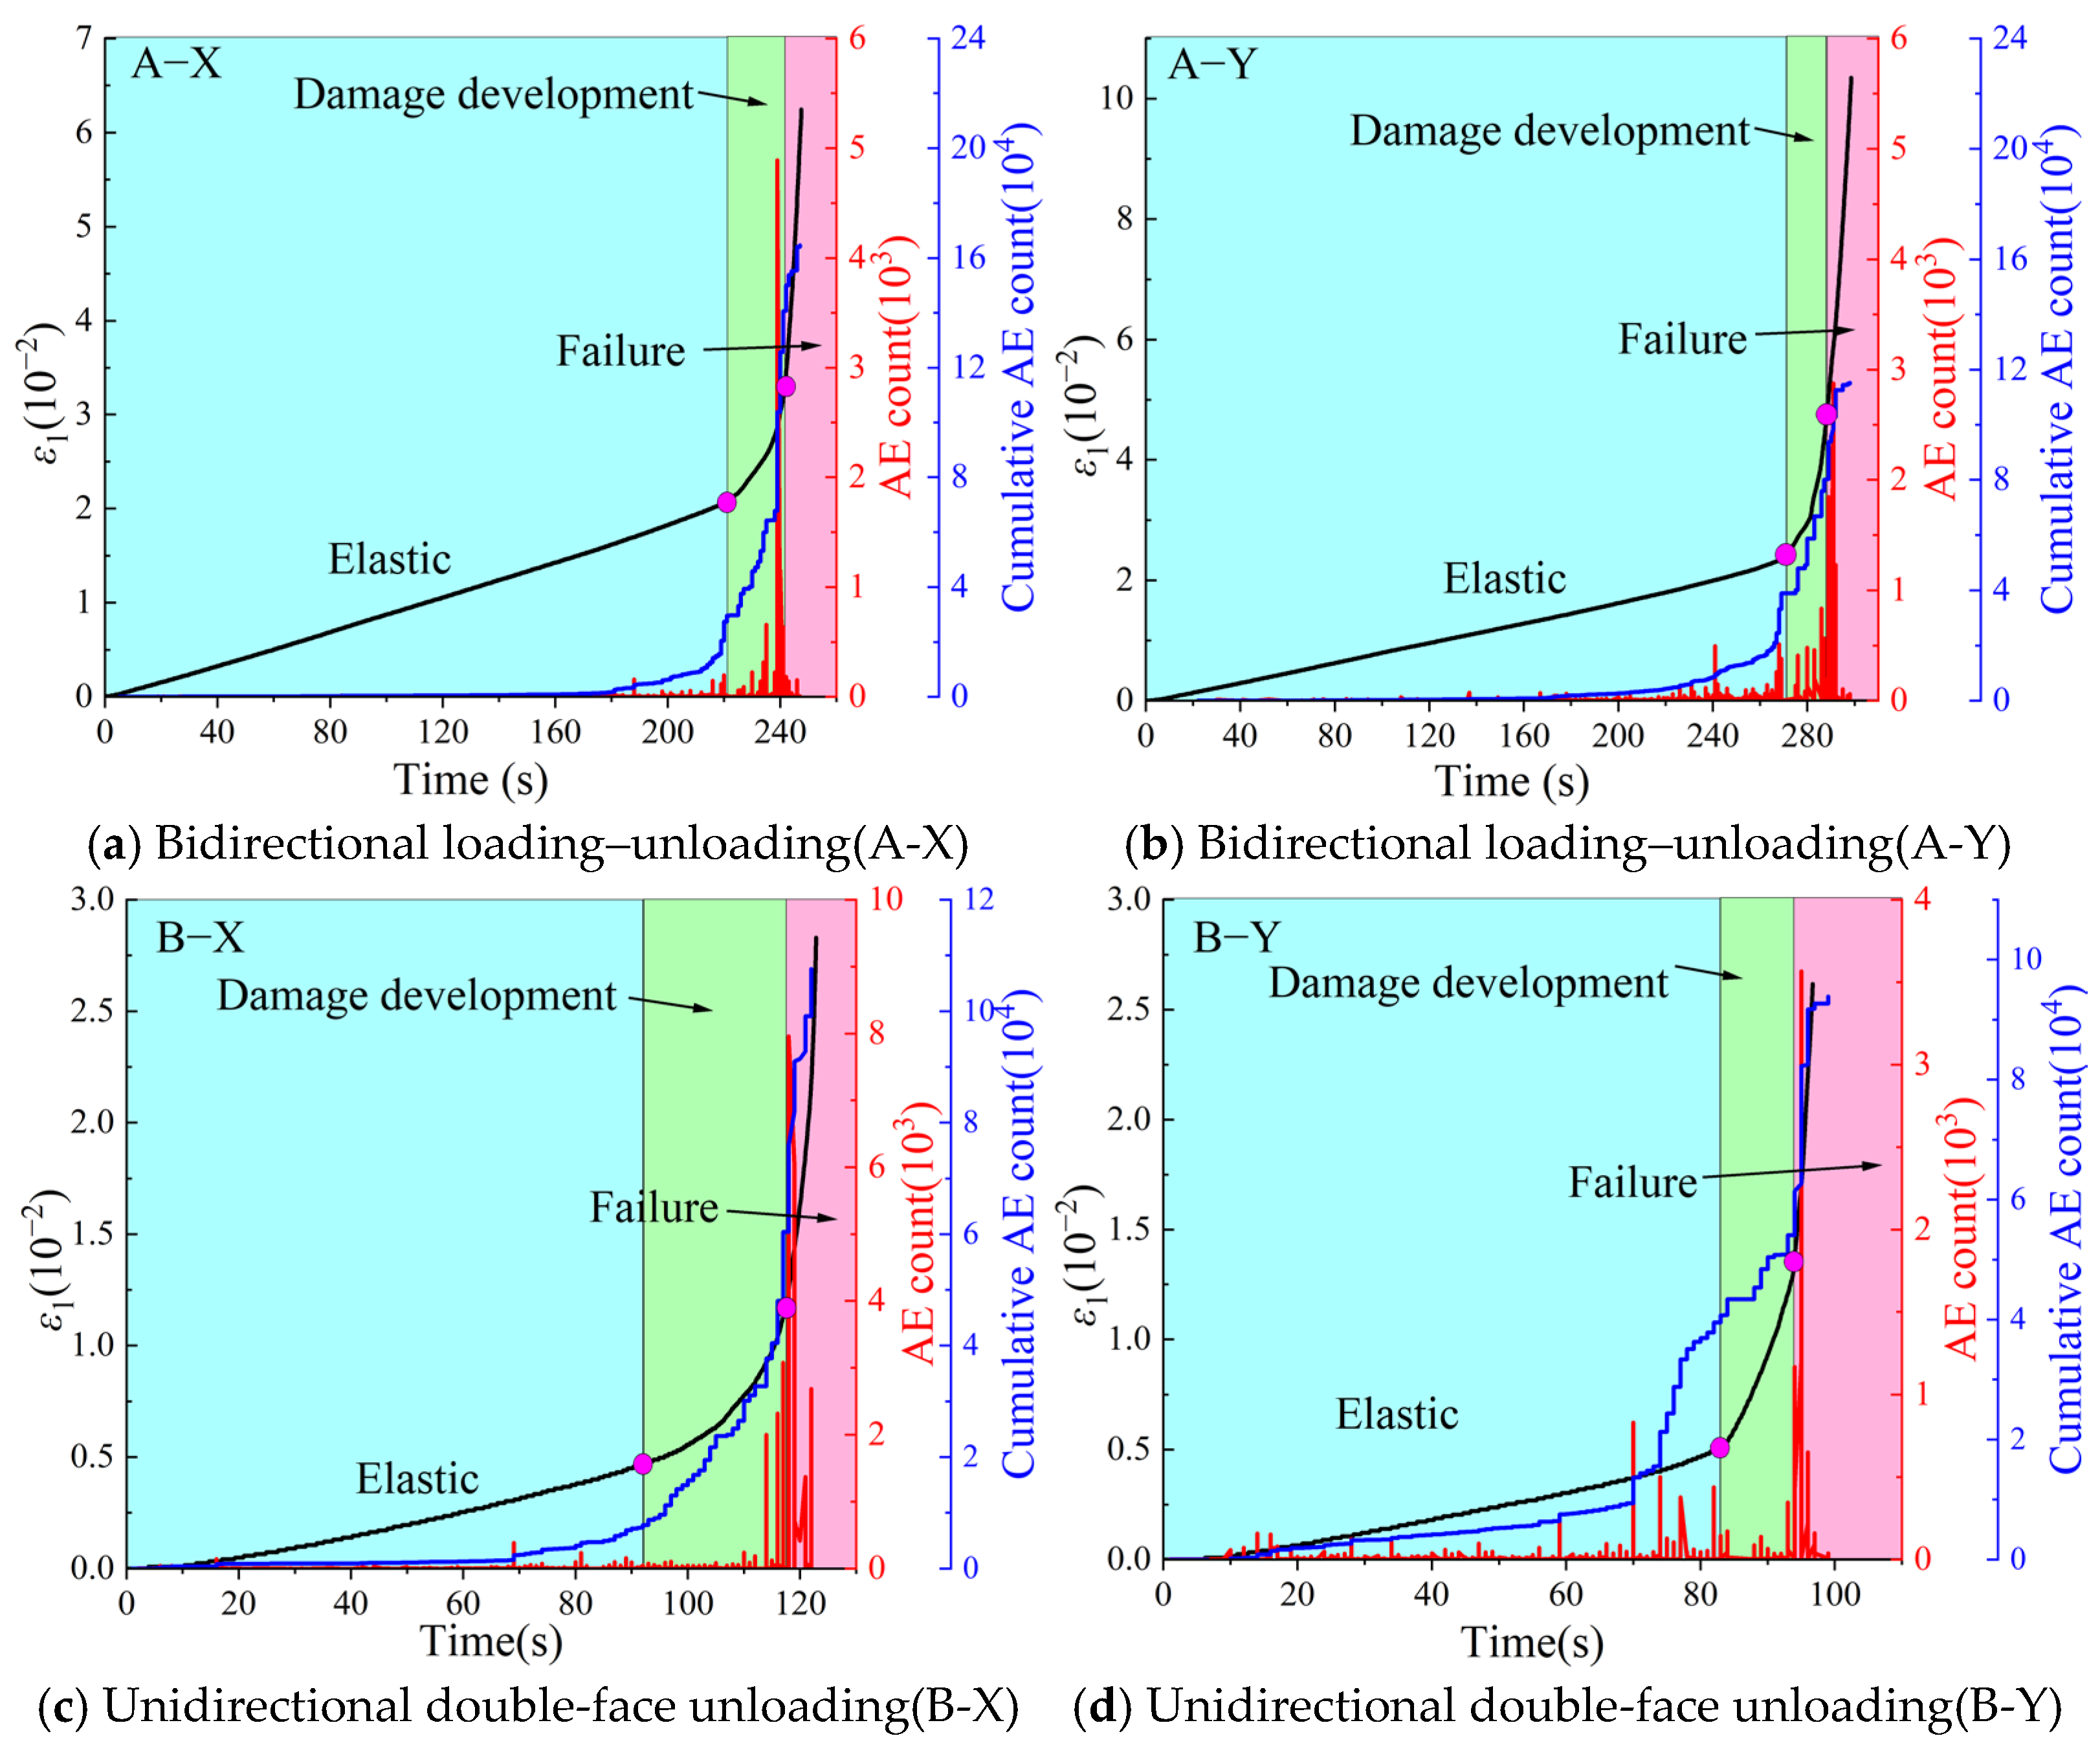
AE parameters can reflect the damage evolution associated with crack initiation, propagation, and coalescence within coal specimens. Based on the time-dependent variations in ε1, AE count, and cumulative AE count shown in Figure 14, the damage accumulation and instability failure characteristics of coal specimens under different stress paths were analyzed.
The AE responses of the bidirectional loading–unloading paths (A-X and A-Y) are shown in Figure 14a,b. Overall, AE activity was characterized by a relatively quiescent early stage followed by a concentrated burst immediately prior to failure. For both paths, AE counts remained low during the elastic stage, and cumulative AE counts increased slowly over a long period, with pronounced peaks appearing only near failure, indicating that damage activity was mainly concentrated within a short interval before and after instability. Compared with the A-X path, AE activity in the A-Y path was activated slightly earlier, and the cumulative AE count entered the rapid-growth stage sooner, indicating that damage response occurred earlier under unloading of σ3. In contrast, AE release in the A-X path was more concentrated in the final failure stage, showing stronger abruptness.
The AE responses of the unidirectional double-face unloading paths (B-X and B-Y) are shown in Figure 14c,d. Their stage-dependent enhancement characteristics were more pronounced. In the B-X path, AE activity remained weak during the elastic stage; however, once the damage development stage began, the cumulative AE count increased rapidly, and a prominent peak in instantaneous AE count appeared during the instability stage, indicating strong stage concentration. By contrast, continuous low-amplitude AE activity appeared in the late elastic stage of the B-Y path, and the cumulative AE count began to increase earlier than in the B-X path, indicating that internal damage was activated earlier when o was unloaded. Overall, the cumulative AE counts of the B-type paths were lower than those of the A-type and C-type paths, whereas the B-X path exhibited a higher instantaneous AE peak, suggesting that its failure was more concentrated within a short instability stage.
The AE responses of the unidirectional single-face unloading paths (C-X and C-Y) are shown in Figure 14e,f. These paths exhibited the most pronounced early activation of AE activity. Continuous AE activity appeared from the middle to late elastic stage in both paths, and the cumulative AE count entered the rapid-growth stage much earlier than in the A-type and B-type paths, indicating that single-face unloading more readily promoted sustained crack development before peak failure. Among them, the C-X path showed the most active AE response and the highest cumulative AE count, indicating that it experienced more sufficient crack initiation, propagation, and coalescence before instability. The C-Y path also showed early AE activation, but both its growth rate and final cumulative AE count were lower than those of the C-X path.
For all six stress paths, the AE response could generally be divided into three stages: (1) the elastic stage, in which ε1 increased slowly with time, AE activity remained weak, and cumulative AE counts increased gradually; (2) the damage development stage, in which ε1 began to increase nonlinearly, AE counts increased markedly, and the slope of the cumulative AE count rose accordingly; and (3) the failure stage, in which ε1 increased abruptly, AE signals burst intensively, and cumulative AE counts rose sharply. In addition, the AE response differences were mainly reflected in three aspects. First, the onset time of AE activity showed clear path dependence: it appeared earliest in the unidirectional single-face unloading paths, followed by the unidirectional double-face unloading paths, and latest in the bidirectional loading–unloading paths; for corresponding path pairs, the paths involving unloading of σ3 generally showed earlier AE activity than those involving unloading of σ2. Second, the AE release pattern changed with path type: A-type paths were dominated by concentrated bursts immediately before and after critical instability, B-type paths exhibited stage-dependent enhancement, and C-type paths showed sustained accumulation over a relatively long period. Third, cumulative AE count was not fully consistent with the peak instantaneous AE count. The C-X path had the highest cumulative AE count, indicating the most sufficient damage accumulation, whereas the B-X path, despite its relatively low cumulative AE count, exhibited a pronounced instantaneous AE peak, reflecting a more abrupt and concentrated AE release. These results indicate that true triaxial loading–unloading stress paths significantly affect the timing of crack initiation, the damage accumulation process, and the instability release mode of coal specimens, and that AE responses are highly sensitive to stress path evolution.

4.2. AE-Based Analysis of Crack Modes in Coal Specimens

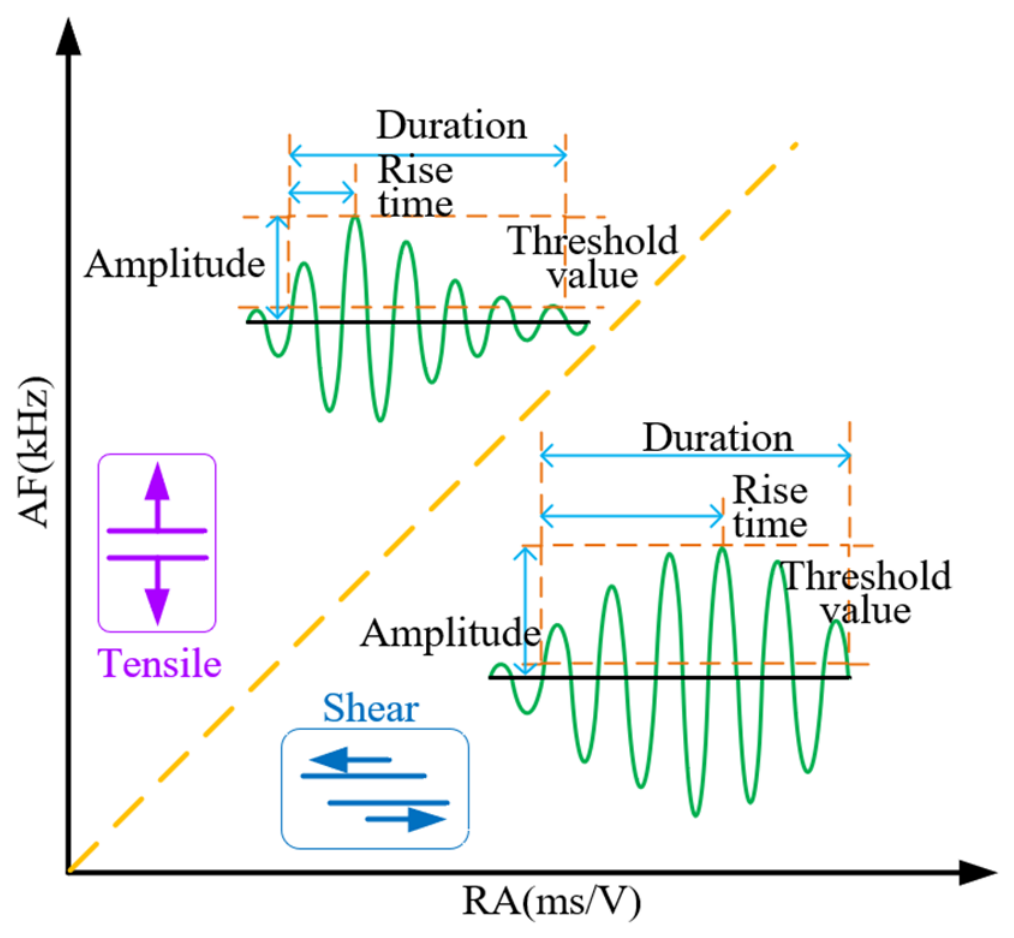
During the loading–unloading process, different types of AE signals are generated in coal specimens, and the differences in waveform parameters can reflect the crack initiation mode and propagation characteristics. To distinguish the AE responses associated with tensile and shear cracks, the RA-AF criterion was introduced in this study. The correspondence between fracture types and typical AE waveform characteristics is illustrated in Figure 15. To identify the failure modes of internal cracks in coal specimens under different stress paths, AE signals were characterized using the RA-AF parameters, where RA is defined as the ratio of rise time to amplitude, and AF is defined as the ratio of ring-down count to duration. In general, tensile cracks correspond to relatively low RA and high AF values, whereas shear cracks correspond to relatively high RA and low AF values [43]. Based on this criterion, the relative proportions and evolution characteristics of tensile and shear failure during the loading-induced disturbance process of coal specimens can be analyzed.
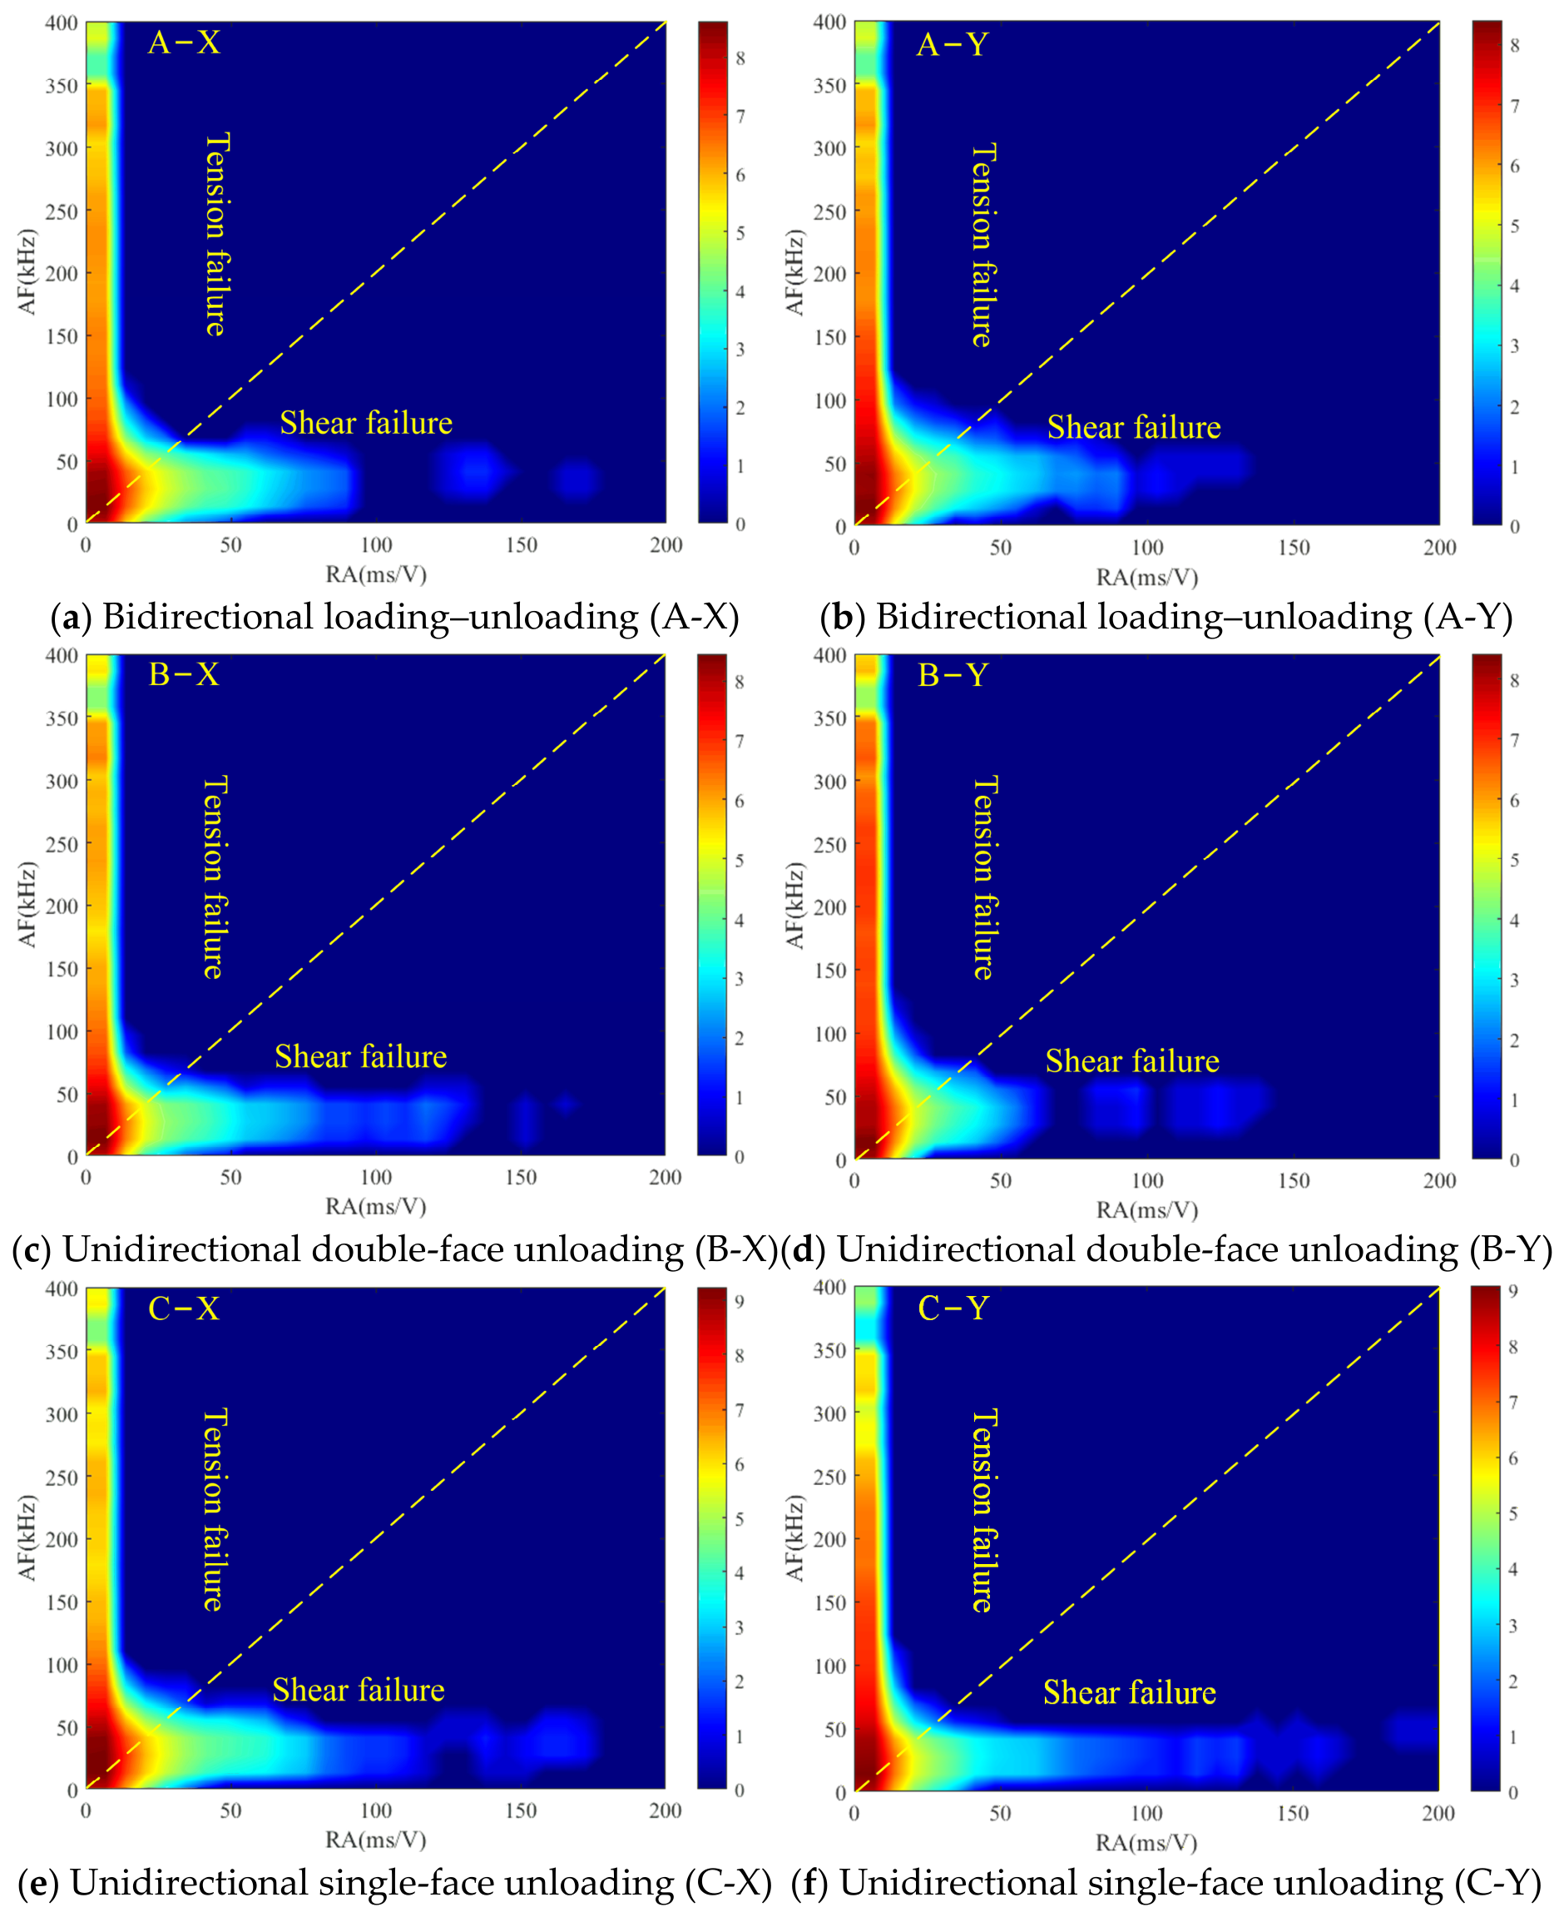
Following the RA–AF crack-classification framework adopted by Dong et al. [40], The RA–AF dividing line used in this study is expressed as AF = K × RA, where K = 2 under the units adopted in Figure 15 and Figure 16. AE events above the line were interpreted as tensile-type signals, whereas those below the line were interpreted as shear-type signals. The same threshold was applied consistently to all specimens to facilitate relative comparisons among the different stress paths.
It should be noted that K is an empirical, unit-dependent parameter and was not independently calibrated for the present coal using pure tensile and pure shear tests. Therefore, the RA–AF results are used as qualitative or semi-quantitative indicators of the relative crack-mode composition rather than as definitive identification of individual microcracks. The interpretations were qualitatively compared with the observed macroscopic fracture morphology: specimens exhibiting more pronounced open and splitting fractures generally showed a larger tensile-type AE component, whereas specimens with localized slip and composite failure showed a stronger shear-type component.
As shown in Figure 16, the AE signals under different stress paths are mainly concentrated in the low-RA and low-AF region, indicating that a large number of AE events generated during the loading–unloading process were dominated by low-amplitude and short-duration signals. This pattern is consistent with distributed low-intensity cracking during the early disturbance stage. In terms of distribution pattern, the data clouds for all six stress paths cover both the tensile-dominated and shear-dominated regions, indicating that the failure of coal specimens was not controlled by a single crack type, but rather by a composite failure process involving both tensile and shear cracks. Consistent with the macroscopic fracture morphology, shear-related signals were mainly concentrated in the low-AF banded region, whereas tensile-related signals extended from the low-RA region toward the high-AF region, reflecting the evolution of cracks from local shear slip and compression–shear deformation to tensile propagation and coalescence.
Under the bidirectional loading–unloading paths, the RA-AF distributions of both A-X and A-Y show the coexistence of tensile and shear cracking, although clear differences are still observed between the two paths. The A-X path exhibits a slightly wider distribution in the shear-dominated region, indicating that, in addition to tensile cracking, a certain number of shear-slip events also occurred within the coal specimen under unloading of σ2. In contrast, the A-Y path shows a higher data density in the tensile-dominated region, with a more concentrated distribution in the low-RA and high-AF area, indicating that tensile cracks were more likely to dominate when σ3 was unloaded. This is consistent with the earlier observations that the A-Y path showed more pronounced opening of dominant fractures and a more concentrated fracture zone, further suggesting that unloading in the direction of the minimum principal stress is more favorable for crack opening and propagation.
Under the unidirectional double-face unloading paths, the RA-AF distributions of the B-X and B-Y specimens are more convergent than those under bidirectional loading–unloading and are mainly concentrated near the low-RA and low-AF region. However, the aggregation degree in the tensile-dominated region is still higher for the B-Y path than for the B-X path, indicating that tensile crack activity was more active when σ3 was unloaded. The B-X path shows a relatively more pronounced distribution in the shear-dominated region, suggesting that when σ2 was unloaded while maintaining a relatively high σ1, the coal specimen still retained certain compression-shear failure characteristics. Combined with the macroscopic failure morphology and fractal statistical results, the B-Y path exhibits a more complex fracture network, whereas the B-X path shows relatively weaker surface damage, indicating that tensile cracks and secondary branching cracks were more likely to develop and interconnect under the B-Y path.
Under the unidirectional single-face unloading paths, the RA-AF data distributions of C-X and C-Y are the most concentrated and are mainly clustered near the left side of the tensile discrimination line, indicating that internal failure under single-face unloading was dominated by tensile cracks, with a relatively weaker shear component. The C-X path shows a slightly wider distribution range in the tensile-dominated region, suggesting that crack propagation lasted longer when σ2 was unloaded and that local associated cracks and branching cracks were more developed. By contrast, the C-Y path is characterized by a highly concentrated distribution in the tensile-dominated region, indicating that unloading of σ3 more readily induced local tensile cracking and rapid coalescence. This feature is consistent with the macroscopic observation that, under unidirectional single-face unloading, fractures were mainly concentrated near the unloading face and were dominated by tensile cracks.
A comprehensive comparison of the six stress paths indicates that the differences in RA–AF distributions are mainly reflected in two aspects. First, the paths involving unloading of σ3 show an overall tendency toward the tensile-dominated region, indicating that unloading in the direction of the minimum principal stress is more favorable for crack opening and the development of tensile failure. Second, the paths involving unloading of σ2 retain tensile characteristics while exhibiting a more pronounced shear component, suggesting that unloading in the direction of the intermediate principal stress results in a stronger composite failure feature in the internal crack activity of coal specimens. These results demonstrate that different stress paths not only alter the macroscopic failure morphology of coal specimens, but also significantly affect the failure modes of microcracks. The RA–AF parameters can effectively reveal the differences in failure response of coal specimens under true triaxial loading–unloading conditions, from shear slip and tensile propagation to final coalescence and instability.

4.3. AE Source-Localization Characteristics of Damage in Coal Specimens

The spatial localization results of AE events can reflect the spatial organization of crack initiation, propagation, and coalescence within coal specimens, and they provide an important basis for revealing the formation process of the principal failure zone and the directional characteristics of fracture development. Compared with AE counts and RA–AF parameters, spatial localization information places greater emphasis on the distribution position, clustering degree, and evolution range of crack activity within the specimen.
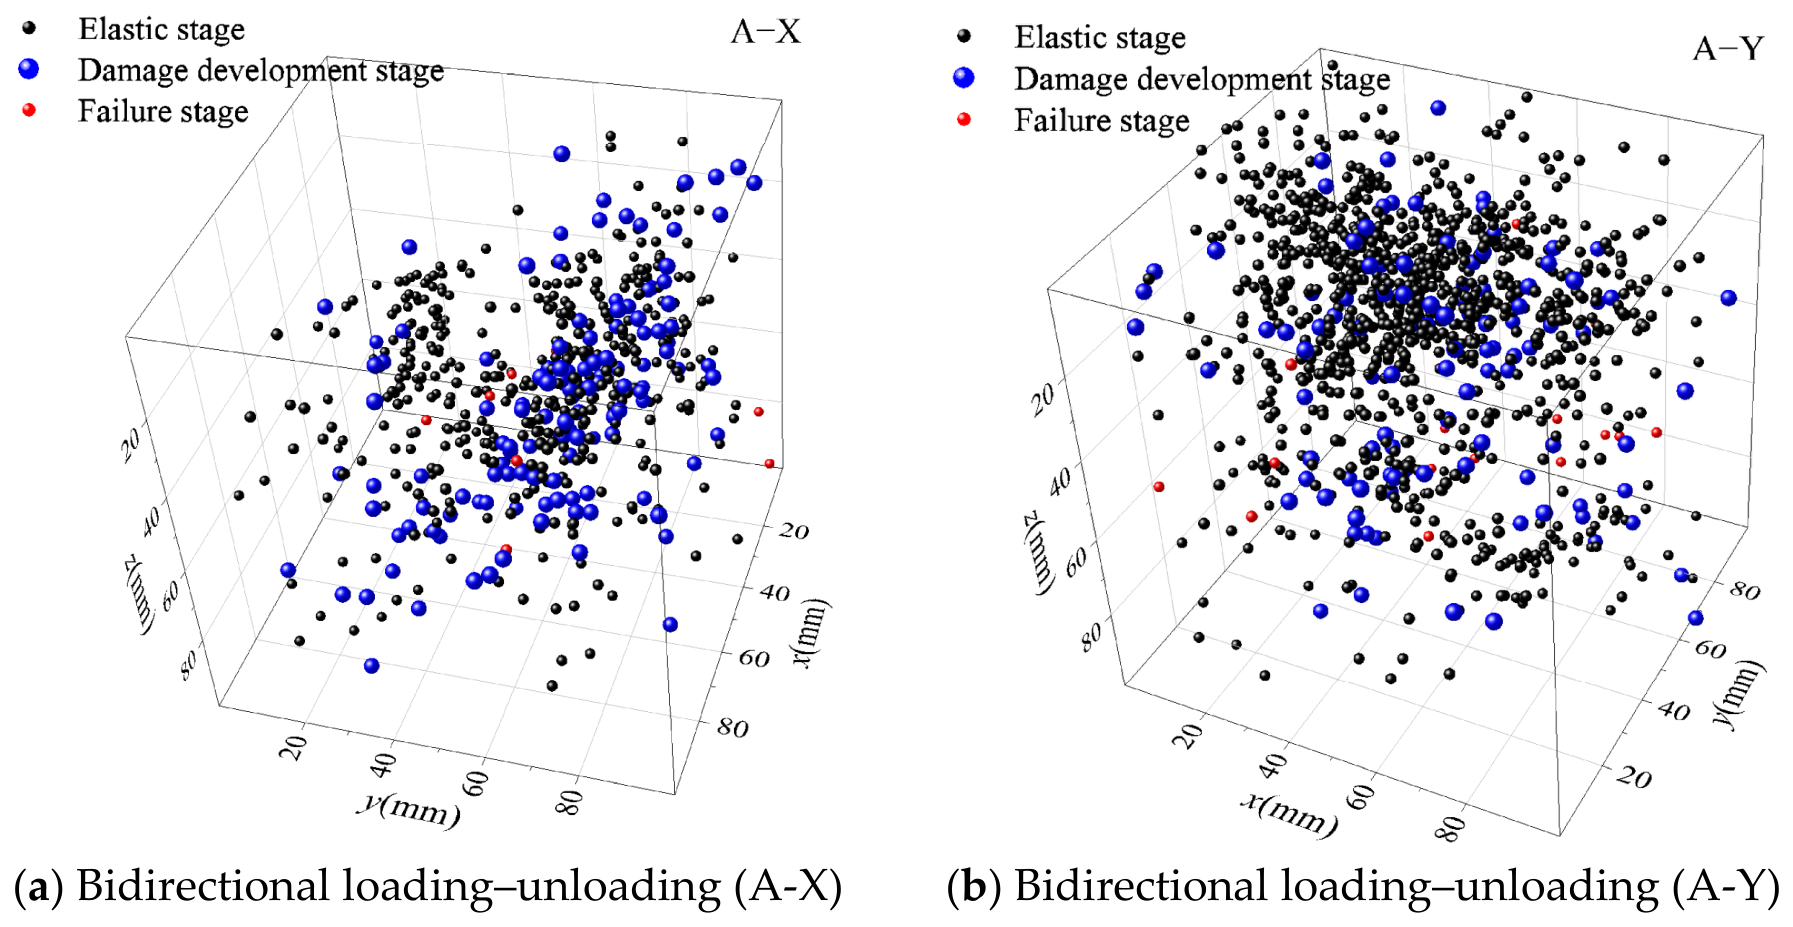
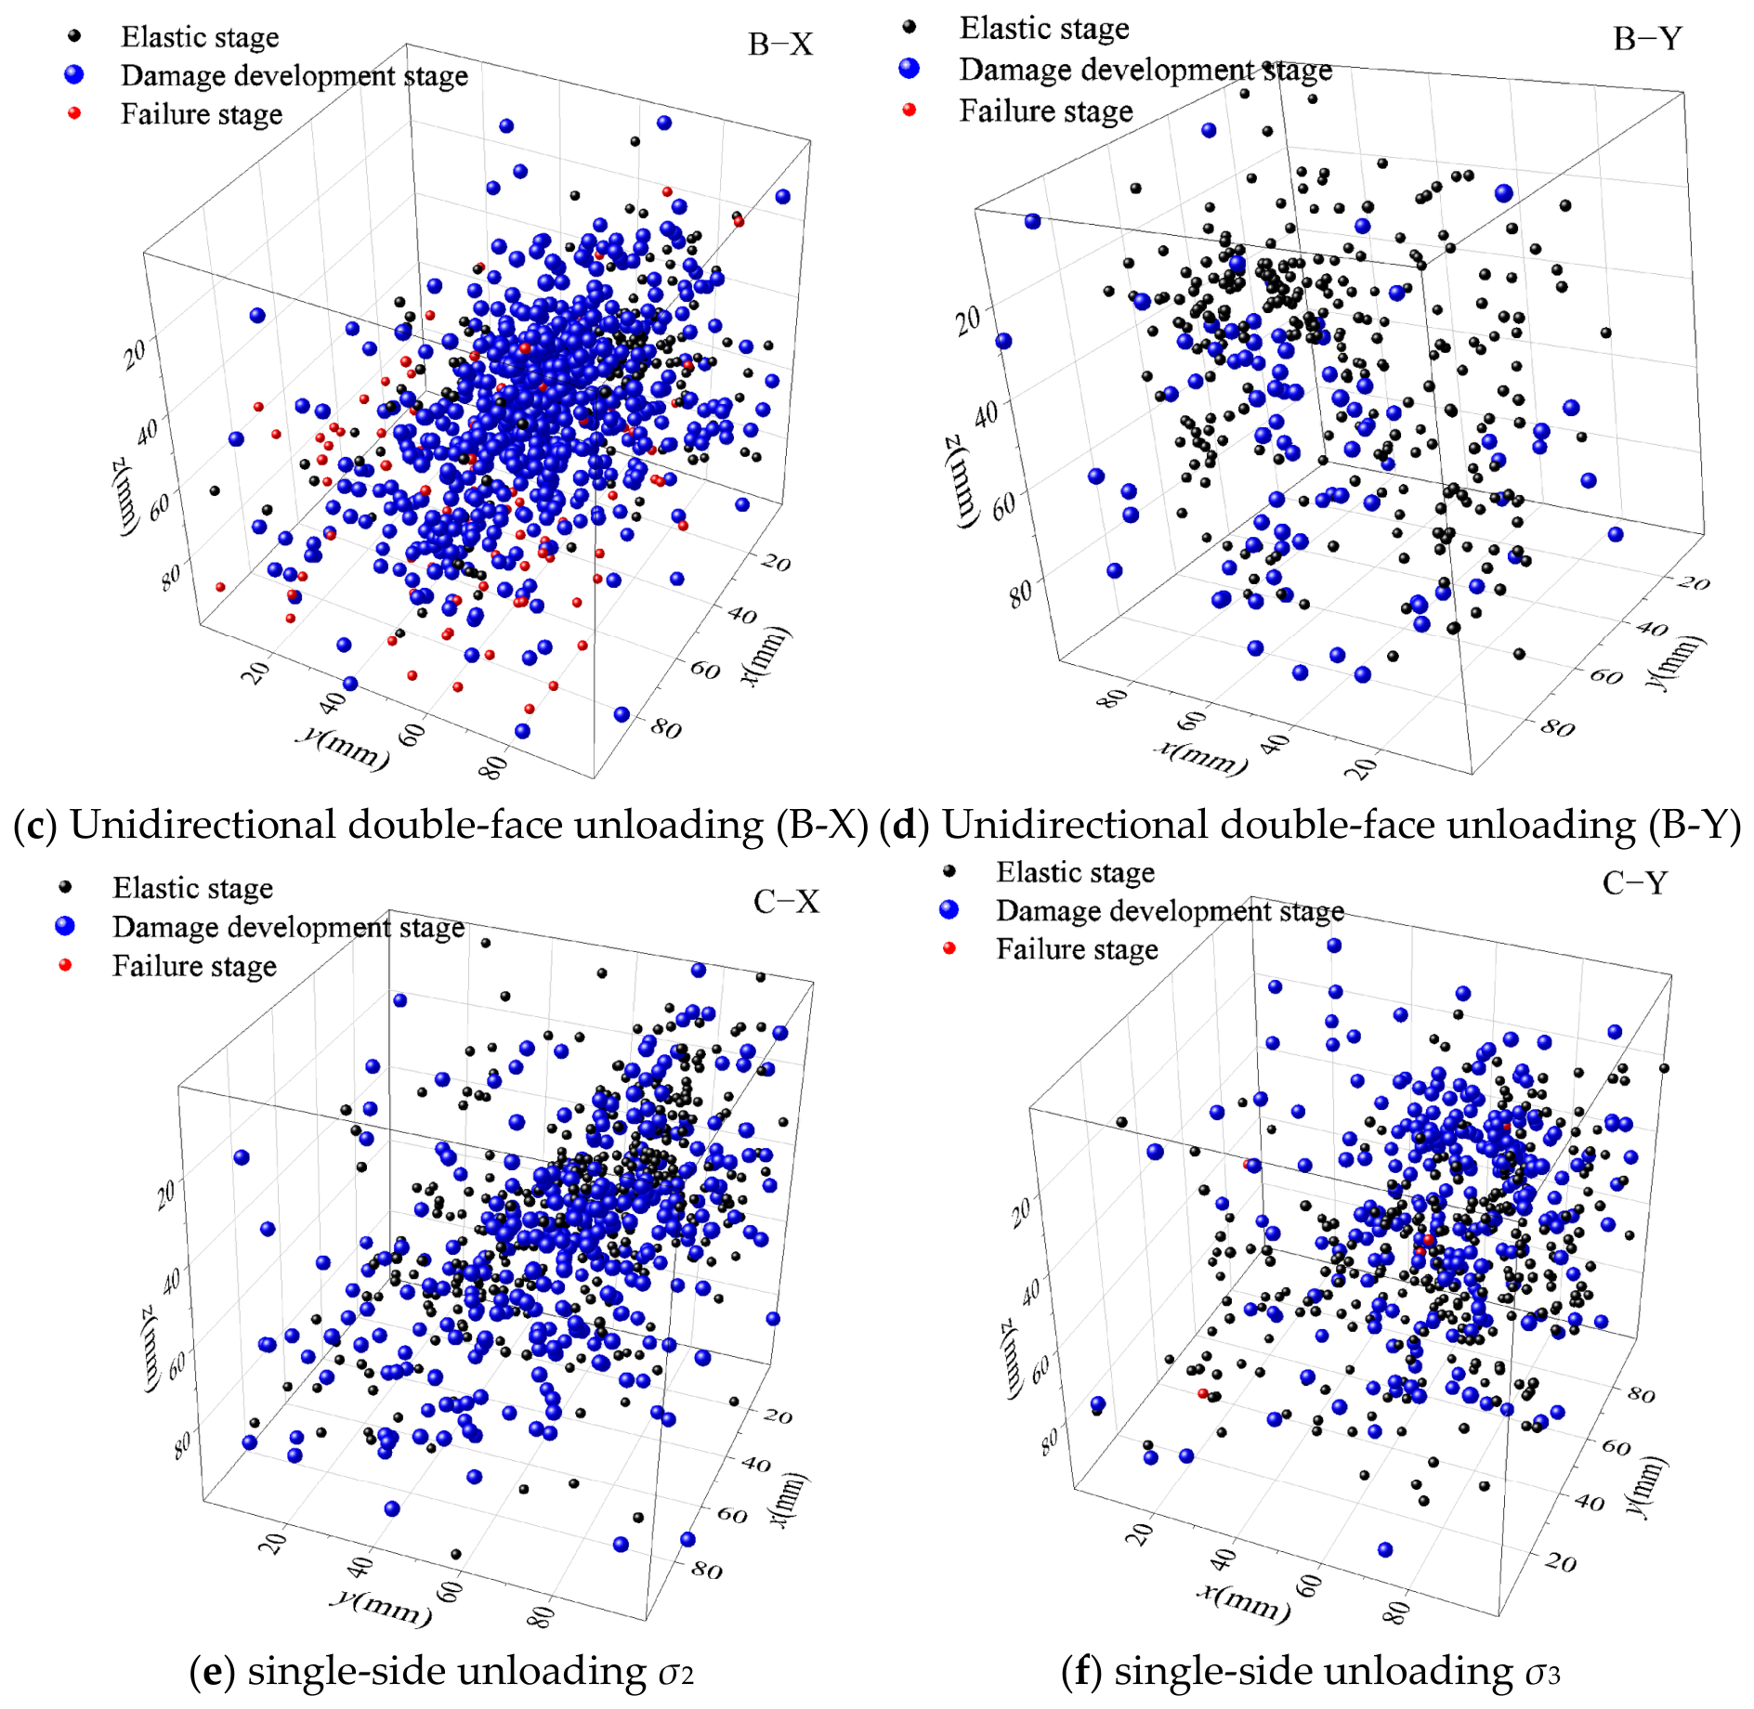
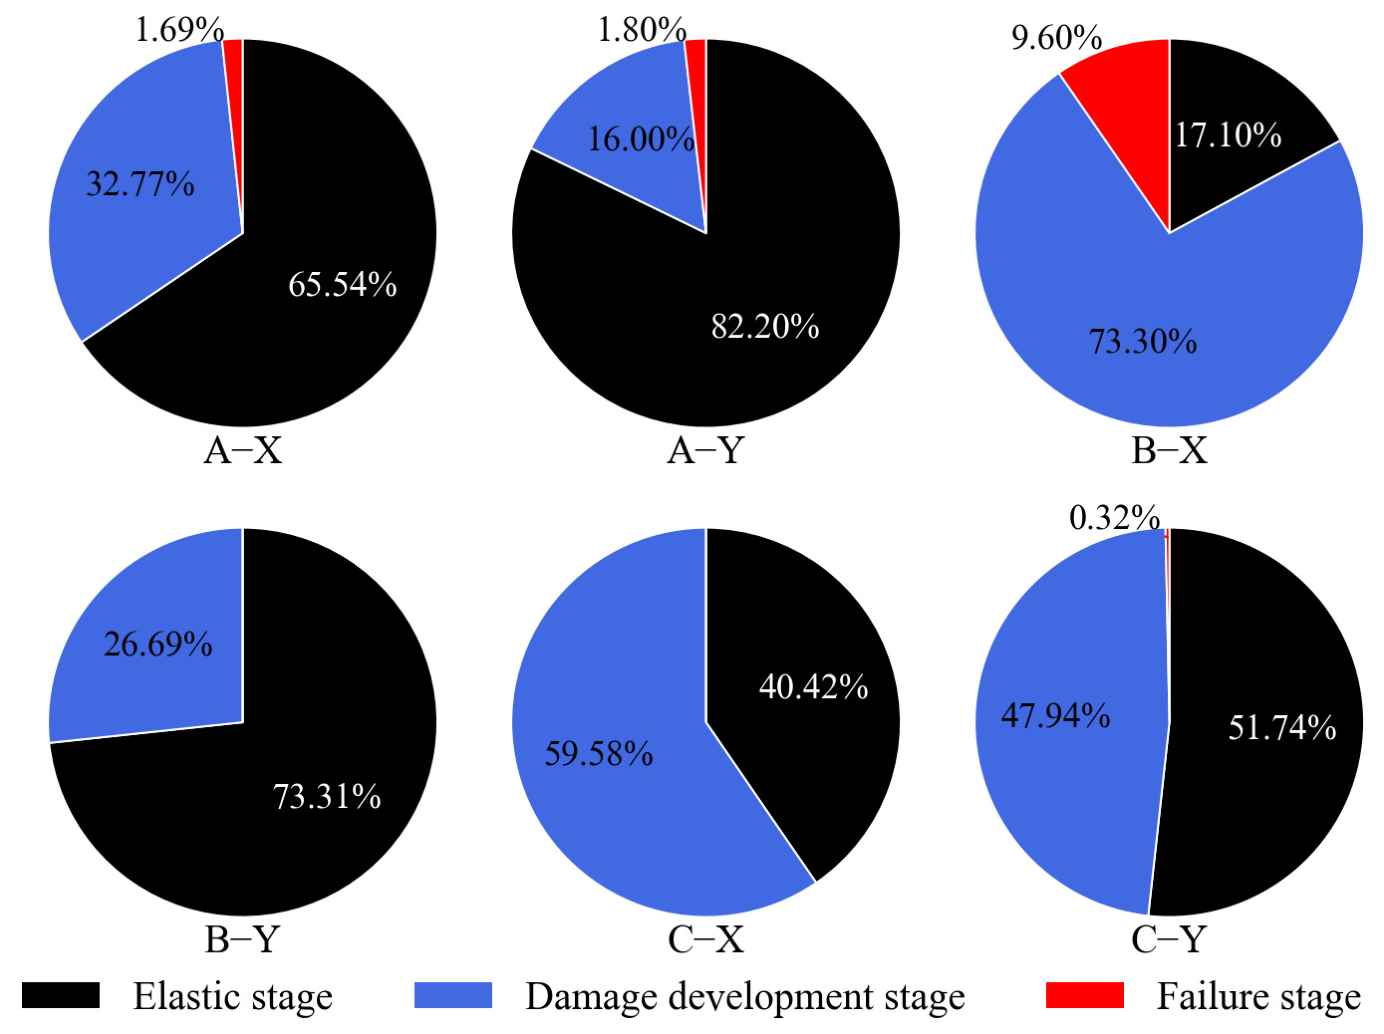
As shown in Figure 17 and Figure 18, the spatial localization characteristics of AE events in the coal specimens differ significantly under different stress paths. Under the bidirectional loading–unloading paths, the total number of located events in the A-X and A-Y specimens was relatively small, and both paths were characterized by a high proportion of events occurring during the elastic stage. Specifically, the elastic-stage proportions for A-X and A-Y were 65.54% and 82.20%, respectively, whereas the damage-development-stage proportions were 32.77% and 16.00%, respectively, and the failure-stage proportions were 1.69% and 1.80%. For both paths, the located events became concentrated near the principal fractures during the failure stage; however, the A-X path exhibited more pronounced local clustering and a certain banded extension feature, indicating that cracks under unloading of σ2 were more likely to propagate in a concentrated manner near instability. In contrast, the located events in the A-Y path were relatively more dispersed, suggesting that damage activity mainly accumulated during the earlier stage.
Under the unidirectional double-face unloading paths, the spatial distributions of B-X and B-Y differed more markedly. In the B-X path, the proportions of AE events in the elastic, damage-development, and failure stages were 17.10%, 73.30%, and 9.60%, respectively. The located events formed a high-density clustered zone within the specimen, showing a strong localized instability feature. By comparison, the B-Y path had an elastic-stage proportion of 73.31% and a damage-development-stage proportion of 26.69%, and its located events were overall more dispersed, indicating that damage activity was activated earlier in this path but with a weaker degree of spatial concentration.
Under the unidirectional single-face unloading paths, the located events of C-X and C-Y both showed strong directionality and were mainly concentrated in local regions near the unloading face, which is consistent with the macroscopic observation that fractures were concentrated near the unloading surface. In the C-X path, the proportions of events in the elastic and damage-development stages were 40.42% and 59.58%, respectively, and the located events were continuously distributed along the local principal failure zone, indicating that under unloading of σ2, cracks had already developed sufficiently before peak failure and further coalesced during the instability stage. In the C-Y path, the proportions of events in the elastic, damage-development, and failure stages were 51.74%, 47.94%, and 0.32%, respectively, which are relatively close, while the located events were more concentrated within a narrow local region, indicating that crack activity under unloading of σ3 exhibited a stronger directional clustering feature.
Overall, the A-type paths were characterized by a relatively high proportion of elastic-stage events and local clustering during the failure stage, whereas the B-X and C-X paths were characterized by a relatively high proportion of failure-stage events and more pronounced event concentration. The C-Y path, by contrast, showed a stronger local directional feature. These results indicate that true triaxial loading–unloading stress paths not only alter the stage at which damage is activated in coal specimens, but also affect the spatial organization of crack propagation and the formation process of the final principal failure zone.
The analysis of the six different stress paths indicates that the differences in the spatial localization characteristics of AE events are mainly reflected in two aspects. First, the extent to which the located events transformed from a dispersed distribution to a clustered distribution varied among the paths, with B-X, C-X, and C-Y showing more pronounced localization characteristics. Second, the proportions of events in different stages varied among the paths differed significantly: the A-type paths were characterized by a relatively high proportion of events in the elastic stage, whereas the B-X and C-X paths were characterized by a higher proportion of events in the failure stage, while the proportions in the two stages were relatively close for the C-Y path. These results indicate that true triaxial loading–unloading stress paths not only alter the stage at which damage is initiated in coal specimens, but also influence the spatial organization of crack propagation and the formation process of the principal failure zone. Because bedding-induced velocity anisotropy and damage-related velocity degradation were not incorporated into the localization model, the absolute event coordinates may contain systematic uncertainty. Therefore, the interpretation focuses on broad clustering patterns and their spatial correspondence with the observed macroscopic failure zones.

5. Discussion

5.1. Effect of Intermediate Principal Stress Transformation on Failure of Coal Specimens

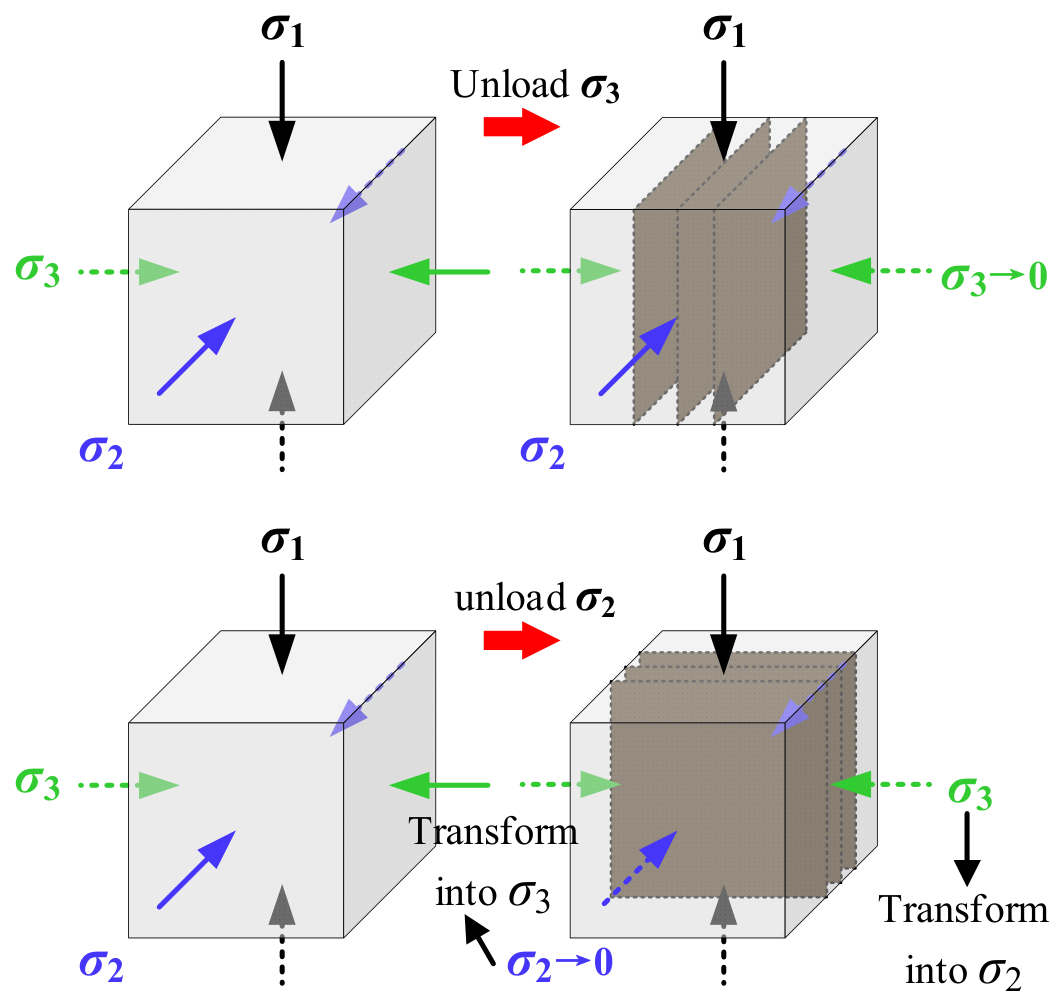
To explain the differences in failure mode, fracture distribution, and AE response of coal specimens under different unloading paths, it is necessary to analyze the underlying mechanism from the perspective of principal stress evolution. As shown in Figure 19, when σ3 is unloaded, the specimen consistently maintains the principal stress order of σ1 > σ2 > σ3. The essence of this process is the continuous reduction of the minimum principal stress, accompanied by progressive weakening of lateral confinement, which facilitates crack opening and propagation along the direction of minimum constraint. In contrast, when σ2 is unloaded, once σ2 decreases below σ3, the principal stress order within the specimen changes from σ1 > σ2 > σ3 to σ1 > σ3 > σ2, meaning that the original intermediate principal stress is transformed into the minimum principal stress. This process not only changes the lateral confinement condition, but also alters the preferential crack propagation direction, thereby providing an important mechanical basis for the differences in failure behavior under different stress paths. This phenomenon is broadly consistent with previous studies on the role of intermediate principal stress in rock failure characteristics, suggesting that the intermediate principal stress governs, to some extent, the macroscopic failure morphology of rock under unloading conditions [44,45].
Combined with the results of macroscopic fracture morphology, AE count, RA–AF distribution, and AE event spatial localization, it can be seen that the transformation of the intermediate principal stress appears to influence coal-specimen failure. When σ2 is unloaded, the reordering of principal stresses and the abrupt change in lateral confinement cause corresponding adjustments in crack propagation direction and local stress concentration zones, making the specimen more likely to exhibit abrupt strain increase, concentrated AE activity, and rapid clustering of located events, which are manifested as strong localization and sudden instability. By contrast, when σ3 is unloaded, the principal stress order remains unchanged, and crack propagation is mainly governed by the continuous reduction of the minimum principal stress, which more readily promotes tensile cracking and opening of dominant fractures along the unloading direction. Although the specific manifestations vary among different test types, unloading of σ2 generally tends to induce rapid local instability, whereas unloading of σ3 is more conducive to fracture opening, branching, and directional coalescence.
In the present study, the intersection of σ2, and σ3 denotes the instant at which the two recorded lateral stresses become equal and their subsequent ordering is reversed. This intersection is used as a marker of stress-path transformation rather than as a quantitatively calibrated instability threshold. During non-proportional true triaxial unloading, the transverse strain contains coupled contributions from elastic deformation, lateral unloading, material anisotropy, and progressive cracking. Therefore, a single strain ratio calculated during this stage cannot be interpreted as an intrinsic Poisson’s ratio. Moreover, the AE stages represent qualitative divisions based on concurrent changes in the stress–strain response, AE activity, and cumulative AE trend, rather than universal numerical thresholds. The observed temporal correspondence therefore suggests that principal-stress reordering may promote localized instability, but it does not establish stress reordering as the sole causal mechanism.
To place the observed intermediate principal stress effect in the context of conventional strength models, the present results were discussed in relation to the Mohr–Coulomb, Drucker–Prager, and Mogi–Coulomb criteria. The Mohr–Coulomb criterion is principally expressed in terms of the maximum and minimum principal stresses and therefore cannot explicitly distinguish failure states that differ mainly in the intermediate principal stress. The Drucker–Prager criterion incorporates all three principal stresses through stress invariants, but its symmetric representation provides a limited description of principal-stress reordering and the associated directional fracture response. By contrast, the Mogi–Coulomb criterion relates the octahedral shear stress to the effective mean normal stress and incorporates the intermediate principal stress through τoct. Therefore, it is more consistent with the observed differences between unloading of σ2 and unloading of σ3. In particular, the reordering of the principal stresses after the nominal σ2 decreased below σ3 altered the octahedral shear-stress state, which provides a strength-criterion interpretation of the abrupt localization observed under the corresponding paths. Nevertheless, because the present tests involve path-dependent unloading, asymmetric boundary conditions, and a limited number of specimens, this comparison is intended as a mechanistic interpretation rather than a comprehensive calibration or validation of a strength criterion.
From an engineering perspective, the instability risk of coal pillars under mining-induced disturbance depends not only on the stress magnitude, but also on whether the intermediate principal stress is transformed during unloading. When the intermediate principal stress is reduced to become the minimum principal stress, the coal specimen is more likely to experience abrupt damage acceleration and localized failure. In contrast, when the minimum principal stress is continuously unloaded, the specimen is more likely to develop directional failure dominated by tensile cracking. This understanding helps explain the differences in coal pillar failure modes at different mining locations and provides a useful reference for identifying different types of instability response in surrounding rock hazard warning.

5.2. Limitations and Prospects

This study has several limitations that define the scope within which the results should be interpreted. These limitations do not invalidate the observed responses under the tested conditions but restrict the statistical generalizability and quantitative interpretation of the findings.
First, only one specimen was tested under each loading–unloading path, while bedding orientation, initial porosity, pre-existing microcracks, maceral distribution, and mineralogical composition were not independently characterized. For coal, pores, cleats, bedding planes, maceral boundaries, and organic–mineral interfaces may act as mechanically weak regions and preferential sites for crack initiation. These features may influence crack propagation, failure morphology, and AE activity. Consequently, some differences among the specimens may reflect the combined effects of stress path and initial structural heterogeneity. The present findings should therefore be interpreted as qualitative comparisons under the tested conditions. Future studies should combine repeated mechanical tests with pre-test and post-test micro-CT scanning, SEM observation, and mineralogical characterization to investigate fracture evolution across different scales.
Second, the image-derived parameters D, Ra, and We describe only the projected geometry of fractures visible on the specimen surfaces. They do not capture crack depth, out-of-plane tortuosity, surface roughness, or the internal connectivity of the three-dimensional fracture network. Illumination, surface reflection, image preprocessing, and threshold selection may also introduce segmentation uncertainty, particularly for fine fractures. Although the processing procedures and parameters were recorded to improve reproducibility, these metrics are interpreted only as comparative descriptors of visible surface-fracture patterns.
Third, the AE analyses involve uncertainties associated with source localization and crack-mode classification. AE source coordinates were calculated using a constant, homogeneous, and isotropic P-wave velocity model, without considering bedding-induced anisotropy or damage-related velocity degradation. This simplification may reduce localization accuracy during the later damage and failure stages. Accordingly, the localization results were interpreted qualitatively based on relative event clustering and correspondence with macroscopic fracture zones. In addition, the RA–AF dividing line is an empirical criterion that may depend on lithology, sensor characteristics, acquisition settings, and parameter units. Because independent calibration tests were not conducted, the resulting tensile-type and shear-type classifications should be regarded as qualitative or semi-quantitative interpretations. Future studies should adopt direction-dependent and damage-dependent velocity models, calibrate the RA–AF threshold using controlled failure tests, and verify source mechanisms through moment-tensor inversion or complementary monitoring methods.

6. Conclusions

To investigate the mechanical response and failure mechanisms of coal specimens under different mining-induced stress paths, true triaxial tests involving bidirectional loading–unloading, unidirectional double-face unloading, and unidirectional single-face unloading were conducted, and the macroscopic failure patterns together with acoustic emission responses were analyzed. The main conclusions are as follows:
(1)
Under the tested conditions, failure generally occurred while σ1 remained relatively high and the lateral stress σ2 or σ3 was reduced to a low level. Across the three test categories, the results suggest that unloading of σ3 is more favorable for dominant-fracture opening and tensile crack propagation, whereas unloading of σ2 is more likely to induce localized deformation and abrupt instability.
(2)
As the stress path evolves from bidirectional loading–unloading and unidirectional double-face unloading to unidirectional single-face unloading, the macroscopic failure mode of the coal specimens generally changes from shear-dominated failure to tensile-dominated failure. Under the same test category, the tensile failure component is more pronounced under unloading of σ3 than under unloading of σ2.
(3)
The observed failure behavior suggests an intermediate principal stress effect. When σ2 is unloaded, the intersection of σ2 and σ3 causes a reordering of the principal stresses, which more readily leads to abrupt strain increase, concentrated AE activity, and localized failure. When σ3 is unloaded, the principal stress order remains unchanged, and tensile cracking together with greater opening of dominant fractures is more likely to develop along the unloading direction.
(4)
Under different stress paths, the AE responses of coal specimens can be divided into three stages: the elastic stage, the damage development stage, and the failure stage. The bidirectional loading–unloading paths are characterized by concentrated AE release near instability, the unidirectional double-face unloading paths show stage-dependent enhancement, and the unidirectional single-face unloading paths are more likely to exhibit sustained pre-peak accumulation. RA–AF analysis indicates that both tensile and shear cracks participate in the failure process, with a more pronounced tensile component under unloading of σ3 and a stronger composite failure feature under unloading of σ2.

Author Contributions

X.S.: Experimental investigation, Analysis, Methodology, Writing—original draft. Z.X.: Writing—review and editing, Supervision, Data curation. X.L. (Xuehua Li): Conceptualization, Methodology. X.L. (Xiaozhao Li): Writing—review and editing. All authors have read and agreed to the published version of the manuscript.

Funding

This work was supported by Yunlong Lake Laboratory of Deep Underground Science and Engineering Project (104024003), the National Natural Science Foundation of China (52404153, 52504157), the Natural Science Foundation of Jiangsu Provincial Basic Research Program (BK20220024, BK20241649).

Institutional Review Board Statement

Not applicable.

Informed Consent Statement

Not applicable.

Data Availability Statement

The original contributions presented in this study are included in the article. Further inquiries can be directed to the corresponding author.

Acknowledgments

We would like to express our gratitude to Gang Huang and Ning Chao for their contributions in the review and formatting correction of the manuscript.

Conflicts of Interest

The authors declare no conflicts of interest.

References

  1. National Bureau of Statistics of China. Statistical Communiqué of the People’s Republic of China on the 2025 National Economic and Social Development. 28 February 2026. Available online: https://www.stats.gov.cn/english/PressRelease/202602/t20260228_1962661.html (accessed on 8 April 2026).
  2. Liu, Z.; Zhao, G.; Meng, X.; Gu, Q. Effect of True Triaxial Principal Stress Unloading Rate on Strain Energy Density of Sandstone. Sci. Rep. 2024, 14, 15172. [Google Scholar] [CrossRef] [Scilit] [PubMed]
  3. Jiang, C.; Wang, L.; Ding, K.; Wang, S.; Ren, B.; Guo, J. Experimental Study on Mechanical and Damage Evolution Characteristics of Coal during True Triaxial Cyclic Loading and Unloading. Materials 2023, 16, 2384. [Google Scholar] [CrossRef] [Scilit] [PubMed]
  4. Liang, Y.; Ran, Q.; Zou, Q.; Zhang, B.; Hong, Y. Experimental Study of Mechanical Behaviors and Failure Characteristics of Coal Under True Triaxial Cyclic Loading and Unloading and Stress Rotation. Nat. Resour. Res. 2022, 31, 971–991. [Google Scholar] [CrossRef] [Scilit]
  5. Gu, L.; Feng, X.-T.; Kong, R.; Yang, C.; Han, Q.; Xia, Y. Excavation Stress Path Induced Fracturing Mechanism of Hard Rock in Deep Tunnel. Rock Mech. Rock Eng. 2023, 56, 1779–1806. [Google Scholar] [CrossRef] [Scilit]
  6. Li, D.; Sun, Z.; Xie, T.; Li, X.; Ranjith, P.G. Energy Evolution Characteristics of Hard Rock during Triaxial Failure with Different Loading and Unloading Paths. Eng. Geol. 2017, 228, 271–281. [Google Scholar] [CrossRef] [Scilit]
  7. Gu, L.; Zhu, G.-Q.; Li, S.; Yu, S.; Zhou, Y.; Zhang, Y. Strain Energy Calculation and Differential Evolution in Deep Hard Rocks under Different True Triaxial Unloading Paths with Cyclic Loading. Int. J. Rock Mech. Min. Sci. 2026, 197, 106343. [Google Scholar] [CrossRef] [Scilit]
  8. Wang, S.; Wang, L.; Tian, J.; Fan, H.; Jiang, C.; Ding, K. An Experimental Study on the Effects of True Triaxial Loading and Unloading Stress Paths on the Mechanical Properties of Red Sandstone. Minerals 2022, 12, 204. [Google Scholar] [CrossRef] [Scilit]
  9. Liu, C.; Zhao, G.; Xu, W.; Meng, X.; Liu, Z.; Cheng, X.; Lin, G. Experimental Study on Failure Characteristics of Single-Sided Unloading Rock under Different Intermediate Principal Stress Conditions. Int. J. Min. Sci. Technol. 2023, 33, 275–287. [Google Scholar] [CrossRef] [Scilit]
  10. Gao, Y.; Wang, Z. Experimental Study on the Damage Process of Marble under True Triaxial Pre-Peak Unloading Conditions. Int. J. Damage Mech. 2021, 30, 1542–1557. [Google Scholar] [CrossRef] [Scilit]
  11. Mogi, K. Effect of the Triaxial Stress System on Fracture and Flow of Rocks. Phys. Earth Planet. Inter. 1972, 5, 318–324. [Google Scholar] [CrossRef] [Scilit]
  12. Mogi, K. Fracture and Flow of Rocks under High Triaxial Compression. J. Geophys. Res. 1971, 76, 1255–1269. [Google Scholar] [CrossRef] [Scilit]
  13. Zhang, Y.; Wang, Z.; Xu, D.; Gao, Y.; Zhou, Y.; Gu, L. True Triaxial Stresses Mobilizing Dilatant Fracturing and Engineering Failure of Hard Rocks. Eng. Fail. Anal. 2023, 154, 1076552. [Google Scholar] [CrossRef] [Scilit]
  14. Gao, H.; Xie, H.; Zhang, R.; Zhang, Z.; Gao, M.; Lu, J.; Wu, M.; Li, Y.; Xie, H. Effect of True Triaxial Loading and Unloading Rates on the Mechanical Properties of Deep Rock. Rock Mech. Rock Eng. 2025, 58, 9047–9071. [Google Scholar] [CrossRef] [Scilit]
  15. Dong, C.; Fan, C.; Lu, X.; Zhao, G.; Qi, M.; Qin, R. Mechanical and Energy Evolution Characteristics of Sandstone under True Triaxial Cyclic Loading. Appl. Sci. 2023, 13, 7230. [Google Scholar] [CrossRef] [Scilit]
  16. Duan, M.; Jiang, C.; Yin, W.; Yang, K.; Li, J.; Liu, Q. Experimental Study on Mechanical and Damage Characteristics of Coal under True Triaxial Cyclic Disturbance. Eng. Geol. 2021, 295, 106445. [Google Scholar] [CrossRef] [Scilit]
  17. Li, Q.; Li, J.; Kou, Y.; Song, W. Experimental Study on the True Triaxial Unloading Mechanical Properties of Cement Tailings Backfill under Different Intermediate Principal Stresses. Minerals 2025, 15, 1227. [Google Scholar] [CrossRef] [Scilit]
  18. Zhu, G.; Dou, L.; Wang, C.; Ding, Z.; Feng, Z.; Xue, F. Experimental Study of Rock Burst in Coal Samples under Overstress and True-Triaxial Unloading through Passive Velocity Tomography. Saf. Sci. 2019, 117, 388–403. [Google Scholar] [CrossRef] [Scilit]
  19. Feng, X.-T.; Kong, R.; Zhang, X.; Yang, C. Experimental Study of Failure Differences in Hard Rock under True Triaxial Compression. Rock Mech. Rock Eng. 2019, 52, 2109–2122. [Google Scholar] [CrossRef] [Scilit]
  20. Zhou, X.; You, Z.; Yao, W.; Ye, J.; Fu, E. Symmetry and Coupled Effects of Intermediate Principal Stress and Unloading Kinetics on Energy Dissipation and Fracture Behavior of Sandstone. Symmetry 2025, 17, 2100. [Google Scholar] [CrossRef] [Scilit]
  21. Liu, Z.; Chen, M. Mechanisms of Deformation and Failure of Single-Sided Unloading Surrounding Rock and Stability Control of Roadways. Appl. Sci. 2026, 16, 1119. [Google Scholar] [CrossRef] [Scilit]
  22. Wang, S.; Xu, W.; Yan, L.; Feng, X.-T.; Xie, W.-C.; Chen, H. Experimental Investigation and Failure Mechanism Analysis for Dacite under True Triaxial Unloading Conditions. Eng. Geol. 2020, 264, 105407. [Google Scholar] [CrossRef] [Scilit]
  23. Li, X.; Feng, F.; Li, D.; Du, K.; Ranjith, P.G.; Rostami, J. Failure Characteristics of Granite Influenced by Sample Height-to-Width Ratios and Intermediate Principal Stress under True-Triaxial Unloading Conditions. Rock Mech. Rock Eng. 2018, 51, 1321–1345. [Google Scholar] [CrossRef] [Scilit]
  24. Browning, J.; Meredith, P.G.; Stuart, C.E.; Healy, D.; Harland, S.; Mitchell, T.M. Acoustic Characterization of Crack Damage Evolution in Sandstone Deformed under Conventional and True Triaxial Loading. J. Geophys. Res. Solid Earth 2017, 122, 4395–4412. [Google Scholar] [CrossRef] [Scilit]
  25. Wang, Y.; Du, W.; Zhang, D.; Yu, B. Effect of Loading and Unloading Rates on Sandstone Deformation and Dilatancy under True Triaxial Condition. Sustainability 2023, 15, 5105. [Google Scholar] [CrossRef] [Scilit]
  26. Zhang, Q.; Meng, X.; Zhao, G. Energy Evolution and Fractal Characteristics of Sandstones under True Triaxial Cyclic Loading and Unloading. Fractal Fract. 2024, 8, 714. [Google Scholar] [CrossRef] [Scilit]
  27. Feng, F.; Zhang, T.; Chen, S.; Peng, S.; Xie, Z.; Zhao, Y. Analysis of Failure Properties of Red Sandstone with Structural Plane Subjected to True Triaxial Stress Paths. Eng. Fract. Mech. 2024, 310, 110490. [Google Scholar] [CrossRef] [Scilit]
  28. Dong, L.; Zhang, L.; Liu, H.; Du, K.; Liu, X. Acoustic Emission b Value Characteristics of Granite under True Triaxial Stress. Mathematics 2022, 10, 451. [Google Scholar] [CrossRef] [Scilit]
  29. Bian, K.; Liu, J.; Zhang, W.; Zheng, X.; Ni, S.; Liu, Z. Mechanical Behavior and Damage Constitutive Model of Rock Subjected to Water-Weakening Effect and Uniaxial Loading. Rock Mech. Rock Eng. 2019, 52, 97–106. [Google Scholar] [CrossRef] [Scilit]
  30. Li, X.; Si, G.; Cao, A.; Wang, C.; Oh, J.; Zhang, Z.; Canbulat, I. Rock Anisotropic Damage Characterisation and Its Evolution Model by Integrating Acoustic Emission Tomography and Ultrasonic Monitoring. Int. J. Rock Mech. Min. Sci. 2024, 180, 105817. [Google Scholar] [CrossRef] [Scilit]
  31. Sun, B.; Yan, Y.; Wang, S.; Qi, C.; Yang, H.; Zeng, S. Self-Organized Criticality and b-Value Characteristics of Acoustic Emission of Rocks under Different Stress Paths. Rock Mech. Rock Eng. 2025, 58, 851–866. [Google Scholar] [CrossRef] [Scilit]
  32. Lockner, D. The Role of Acoustic Emission in the Study of Rock Fracture. Int. J. Rock Mech. Min. Sci. Geomech. Abstr. 1993, 30, 883–899. [Google Scholar] [CrossRef] [Scilit]
  33. Ali, M.; Wang, E.; Li, Z.; Wang, X.; Khan, N.M.; Zang, Z.; Alarifi, S.S.; Fissha, Y. Analytical Damage Model for Predicting Coal Failure Stresses by Utilizing Acoustic Emission. Sustainability 2023, 15, 1236. [Google Scholar] [CrossRef] [Scilit]
  34. Xia, Z.; Yao, Q.; Li, X.; Yu, L.; Li, Y.; Shan, C.; Yan, L. Acoustic Emission Responses and Damage Estimation of Coal with Carbon Fi Ber-Reinforced Polymer Confinement under Uniaxial Compression. J. Rock Mech. Geotech. Eng. 2024, 16, 5077–5094. [Google Scholar] [CrossRef] [Scilit]
  35. Shan, C.; Yao, Q.; Cao, S.; Zheng, C.; Xu, Q.; Xia, Z.; Shang, X.; Huang, G. Analysis of Cracks Development and Damage Evolution in Red Sandstone under Dry-Wet Cycles Based on Temporal and Frequency Characteristics of Acoustic Emission. J. Build. Eng. 2024, 94, 109849. [Google Scholar] [CrossRef] [Scilit]
  36. Shan, C.; Yao, Q.; Cao, S.; Xie, H.; Xu, Q.; Zheng, C.; Chen, X. Measurement of Fracture Development Evolution of Coal Samples under Acid-Alkaline by Three-Dimensional Reconstruction and AE Time-Frequency Characteristic Analysis. Measurement 2023, 217, 112944. [Google Scholar] [CrossRef] [Scilit]
  37. Belikov, V.T.; Ryvkin, D.G. A Study of Fracture Scenarios on the Basis of Acoustic Emission Data. Phys. Mesomech. 2018, 21, 508–514. [Google Scholar] [CrossRef] [Scilit]
  38. Yang, J.; Liu, G.-J.; Mu, Z.; Tian, W.; Sun, B. Experimental and Numerical Simulation Study on Mechanical Behavior and Microscopic Damage Characteristics of Sandstone under Triaxial Compression. Geomech. Geophys. Geo-Energy Geo-Resour. 2025, 11, 27–48. [Google Scholar] [CrossRef] [Scilit]
  39. Chen, C.; Chen, X. Experimental Study of Fracture Damage Characteristics in Steel Slag Porous Concrete Based on Acoustic Emission Technique. Constr. Build. Mater. 2024, 456, 139127. [Google Scholar] [CrossRef] [Scilit]
  40. Dong, L.; Zhang, Y.; Ma, J. Micro-Crack Mechanism in the Fracture Evolution of Saturated Granite and Enlightenment to the Precursors of Instability. Sensors 2020, 20, 4595. [Google Scholar] [CrossRef] [Scilit] [PubMed]
  41. Feng, X.-T.; Haimson, B.; Li, X.; Chang, C.; Ma, X.; Zhang, X.; Ingraham, M.; Suzuki, K. ISRM Suggested Method: Determining Deformation and Failure Characteristics of Rocks Subjected to True Triaxial Compression. Rock Mech. Rock Eng. 2019, 52, 2011–2020. [Google Scholar] [CrossRef] [Scilit]
  42. Liang, Y. Rock Fracture Skeleton Tracing by Image Processing and Quantitative Analysis by Geometry Features. J. Geophys. Eng. 2016, 13, 273–284. [Google Scholar] [CrossRef] [Scilit]
  43. Yue, J.G.; Kunnath, S.K.; Xiao, Y. Uniaxial Concrete Tension Damage Evolution Using Acoustic Emission Monitoring. Constr. Build. Mater. 2020, 232, 117281. [Google Scholar] [CrossRef] [Scilit]
  44. Li, Z.; Wang, L.; Wang, L.; Fan, H.; Ren, B.; Ding, K. Study on the Evolution of Rock Fracture under True Triaxial Intermediate Principal Stress. Int. J. Geomech. 2024, 24, 04023254. [Google Scholar] [CrossRef] [Scilit]
  45. Ma, Z.; Liao, H.; Dang, F. Effect of Intermediate Principal Stress on Strength of Soft Rock under Complex Stress States. J. Cent. South Univ. 2014, 21, 1583–1593. [Google Scholar] [CrossRef] [Scilit]
Figure 1. Sampling location and photographs of representative coal specimens.
Applsci 16 09252 g001
Figure 2. Experimental setup for true-triaxial rock testing and acoustic emission monitoring.
Applsci 16 09252 g002
Figure 3. Rotating staggered loading pads and AE sensors.
Applsci 16 09252 g003
Figure 4. Schematic diagrams of the six true triaxial loading–unloading stress paths: (a) bidirectional loading–unloading A-X, (b) bidirectional loading–unloading A-Y, (c) unidirectional double-face unloading B-X, (d) unidirectional double-face unloading B-Y, (e) unidirectional single-face unloading C-X, and (f) unidirectional single-face unloading C-Y.
Applsci 16 09252 g004
Figure 5. Stress–strain–time relationships of coal specimens under bidirectional loading–unloading paths (A-X).
Applsci 16 09252 g005
Figure 6. Stress–strain–time relationships of coal specimens under bidirectional loading–unloading paths (A-Y).
Applsci 16 09252 g006
Figure 7. Stress–strain–time relationships of coal specimens under unidirectional double-face unloading path (B-X).
Applsci 16 09252 g007
Figure 8. Stress–strain–time relationships of coal specimens under unidirectional double-face unloading path (B-Y).
Applsci 16 09252 g008
Figure 9. Stress–strain–time relationships of coal specimens under unidirectional single-face unloading conditions (C-X).
Applsci 16 09252 g009
Figure 10. Stress–strain–time relationships of coal specimens under unidirectional single-face unloading conditions (C-Y).
Applsci 16 09252 g010
Figure 11. Macroscopic failure patterns and fracture distribution characteristics of coal specimens under different stress paths.
Applsci 16 09252 g011aApplsci 16 09252 g011b
Figure 12. Example of macroscopic fracture image processing for a failed coal specimen (A-X as an example): (a) Preprocessed image; (b) binary fracture image; (c) fracture skeleton image; (d) double-logarithmic fitting curve for box-counting dimension.
Applsci 16 09252 g012
Figure 13. Comparison of macroscopic fracture characteristic parameters of coal specimens under different stress paths.
Applsci 16 09252 g013
Figure 14. Evolution of AE responses of coal specimens under different true triaxial loading–unloading stress paths.
Applsci 16 09252 g014aApplsci 16 09252 g014b
Figure 15. Relationship between fracture types and AE waveform characteristics in rock.
Applsci 16 09252 g015
Figure 16. RA-AF distribution characteristics of damage evolution in coal specimens under different stress paths.
Applsci 16 09252 g016
Figure 17. Spatial localization characteristics of AE events in coal specimens under different loading–unloading paths.
Applsci 16 09252 g017aApplsci 16 09252 g017b
Figure 18. Proportions of AE events at different stages under different stress paths.
Applsci 16 09252 g018
Figure 19. Schematic illustration of principal stress transformation and fracture orientation under different unloading paths.
Applsci 16 09252 g019
Table 1. Specimen IDs and basic physical properties.
Specimen IDSpecimen Size (L × W × H, mm)Mass/m (g)Density/ρ (kg·m−3)Peak Strength/σ1 (MPa)
TTT-199.97 × 100.02 × 100.051356.961356.4249.38 (σ2 = 12, σ3 = 9)
TTT-2100.04 × 99.96 × 99.881373.231374.8855.48 (σ2 = 12, σ3 = 9)
TTT-3100.06 × 100.02 × 99.951361.761361.3542.64 (σ2 = 12, σ3 = 9)
A-X99.98 × 100.01 × 100.021379.401379.26σ1/σ23 (43.92, 3.08, 9.00)
A-Y100.05 × 99.98 × 100.071369.941368.57σ1/σ23 (44.80, 12.00, 2.67)
B-X100.00 × 100.03 × 99.971352.941352.94σ1/σ23 (42.00, 0.32, 9.00)
B-Y99.92 × 100.05 × 100.021370.891371.03σ1/σ23 (42.00, 12.00, 0.63)
C-X100.00 × 100.03 × 99.981364.831364.69σ1/σ23 (42.00, 0.22, 9.00)
C-Y100.06 × 99.94 × 100.051378.101377.41σ1/σ23 (42.00, 12.00, 1.40)
Note: TTT-1–TTT-3 were used to obtain the reference peak strength. One specimen was assigned to each of the six loading–unloading paths; the replicate number was n = 1 for each path.
Table 2. Technical settings of the AE monitoring system.
Resonant Frequency (f0)/MHzThreshold
Value (Th)/dB
Gain (G)/dBSampling Frequency (fs)/MHzPDTHDTHLT
1404040150200300
Table 3. Initial stress states and loading schemes of the true triaxial stress paths.
Path TypeSpecimen CodeInitial Stress State (MPa)Loading Scheme
Bidirectional loading–unloadingA-X(σ1, σ2, σ3) = (20, 12, 9)After reaching the initial stress state, σ3 was kept constant, while σ1 was increased and σ2 was unloaded until failure.
A-Y(σ1, σ2, σ3) = (20, 12, 9)After reaching the initial stress state, σ2 was kept constant, while σ1 was increased and σ3 was unloaded until failure.
Unidirectional double-face unloadingB-X(σ1, σ2, σ3) = (42, 12, 9)After reaching the initial stress state, σ1 and σ3 were kept constant, while σ2 was unloaded until failure.
B-Y(σ1, σ2, σ3) = (42, 12, 9)After reaching the initial stress state, σ1 and σ2 were kept constant, while σ3 was unloaded until failure.
Unidirectional single-face unloadingC-X(σ1, σ2, σ3) = (42, 12, 9)After reaching the initial stress state, σ1 and σ3 were kept constant, while σ2 was unloaded on one face until failure.
C-Y(σ1, σ2, σ3) = (42, 12, 9)After reaching the initial stress state, σ1 and σ2 were kept constant, while σ3 was unloaded on one face until failure.
Note: X and Y denote unloading along the σ2 and σ3 directions, respectively.
Disclaimer/Publisher’s Note: The statements, opinions and data contained in all publications are solely those of the individual author(s) and contributor(s) and not of MDPI and/or the editor(s). MDPI and/or the editor(s) disclaim responsibility for any injury to people or property resulting from any ideas, methods, instructions or products referred to in the content.